february 2020 dear investor,
TRANSCRIPT

1
February 2020 Dear Investor, This is the second annual letter to owners of the Fundsmith Sustainable Equity Fund (‘Fund’). The table below shows performance figures for the last calendar year and the cumulative and annualised performance since inception on 1st November 2017 and various comparators. % Total Return 1st Jan to Inception to 31st Dec 2019 Sharpe Sortino
31st Dec 2019 Cumulative Annualised ratio5 ratio5
Fundsmith Sustainable Equity Fund1 +23.4 +29.9 +12.9 0.79 0.71 Equities2 +22.7 +21.0 +9.2 0.43 0.39 UK Bonds3 +3.8 +6.1 +2.8 n/a n/a Cash4 +0.8 +1.6 +0.7 n/a n/a 1 I Class Acc shares, net of fees, priced at noon UK time, source: Fundsmith LLP 2 MSCI World Index, £ net, priced at US market close, source: Bloomberg 3 Bloomberg/Barclays Bond Indices UK Gov. 5–10 yr., source: Bloomberg 4 3 Month £ LIBOR Interest Rate, source: Bloomberg 5 Sharpe & Sortino ratios are since inception on 1.11.17 to 31.12.19, source: Financial Express Analytics The table shows the performance of the I Class Accumulation shares which rose by +23.4% in 2019 and compares with a rise of +22.7% for the MSCI World Index in sterling with dividends reinvested. However, I realise that many or indeed most of our investors do not use these as the natural comparator for their investments. Those of you who are based in the UK may look to the FTSE 100 Index (‘FTSE 100’) as the yardstick for measuring your investments and may hold funds which are benchmarked to this index and often hug it. The FTSE 100 delivered a total return of +17.3% in 2019 so our Fund outperformed this by a margin of 6.1 percentage points. For the year the top five contributors to the Fund’s performance were: Estée Lauder +2.2% Microsoft +2.2% Marriott Intl. +1.6% Intuit +1.6% Visa +1.5%

2
Microsoft and Visa both appeared in this list last year and have been consistently amongst the best performing stocks since inception of the strategy. Someone once said that no one ever got poor by taking profits. This may be true but I doubt they got very rich by this approach either. The bottom five were: Church & Dwight -0.7% 3M -0.3% Colgate-Palmolive 0.0% Clorox 0.0% Reckitt Benckiser +0.3% We switched the holding in Church & Dwight into another American consumer products company – Clorox – which produces a higher return on capital. We sold our stakes in 3M and Colgate Palmolive during the year. With 3M we were acting on growing doubts about the current management’s capital allocation decisions, and in the case of Colgate Palmolive we grew tired of waiting for an effective growth strategy to emerge. This year we have included the Sharpe and Sortino ratios for our Fund and the Index in the performance table on p.1. I realise that for those of you who are not investment professionals what I say next may well seem to be gobbledegook. However, whilst the returns which our Fund provides are very important so is the amount of risk assumed in producing those returns. These ratios attempt to measure that. The Sharpe ratio takes the return on the Fund, subtracts a so-called risk-free return (basically the return on government bonds) to get the excess return over the risk-free rate, and divides the resulting number by the variation in that excess return (measured by its standard deviation — I warned you it was gobbledegook). The result tells you what unit of return you get for a unit of risk and our Fund has a Sharpe ratio of 0.79 since inception against 0.43 for the MSCI World Index — it is producing about twice the amount of return that the Index produces for each unit of risk. The Sortino ratio is an adaption of the Sharpe ratio, and in my view an improvement. Whereas the Sharpe ratio estimates risk by the variability of returns, the Sortino ratio takes into account only downside variability as it is not clear why we should be concerned about upside volatility (i.e. when our Fund goes up a lot) which mostly seems to be a cause for celebration. The result for our Fund since inception is a Sortino ratio of 0.71 but the MSCI World Index Sortino ratio is lower than its Sharpe ratio at 0.39. Our Fund is producing

3
almost twice the return that the Index produces for each unit of downside volatility. As you hopefully know by now, we have a simple four step investment strategy: • Buy good companies • ESG screen • Don’t overpay • Do nothing I will review how we are doing against each of those in turn. As usual we seek to give some insight into the first of those — whether we own good companies — by giving you the following table which shows what Fundsmith would be like if instead of being a fund it was a company and accounted for the stakes which it owns in the portfolio on a ‘look through’ basis, and compares this with the market, in this case the FTSE 100 Index and the S&P 500 Index (‘S&P 500’). We not only show you how the portfolio compares with the major indices but also how it has evolved over time. Year ended
Fundsmith Sustainable Equity Fund S&P 500 FTSE 100
2017 2018 2019 2019 2019
ROCE 28% 30% 29% 17% 17% Gross margin 63% 65% 65% 45% 39% Operating margin 26% 28% 26% 15% 17% Cash conversion 102% 95% 99% 84% 86% Leverage 37% 47% 22% 53% 41% Interest cover 17x 17x 17x 7x 10x
Source: Fundsmith LLP/Bloomberg. ROCE, Gross Margin, Operating Profit Margin and Cash Conversion are the weighted mean of the underlying companies invested in by the Fundsmith Sustainable Equity Fund and mean for the FTSE 100 and S&P 500 Indices. The FTSE 100 and S&P 500 numbers exclude financial stocks. The Leverage and Interest Cover numbers are both median. All ratios are based on last reported fiscal year accounts as at 31st December and as defined by Bloomberg. Cash Conversion compares Free Cash Flow per Share with Net Income per Share. As you can see, not much has changed, which is how we like it. Our portfolio companies remain superior to those in the main indices on any of the financial measures of returns, profitability, cash flow, or balance sheet strength. As we indicated last year, we are going to remove the leverage calculation from the table in future as it can be close to meaningless. As you can see, we are not planning to remove it just because it looks bad. On the contrary, this year it is at 22% for our Fund’s portfolio versus 53% for the S&P 500 and 41% for the FTSE 100. But it gives a sense of how little meaning it has that the values for the companies

4
that comprise the median number are 18% and 26%. Nor is a mean (average) number much better as seven stocks in the portfolio have net cash on their balance sheets. The average year of foundation of our portfolio companies at the year end was 1933. Consistently high returns on capital are one sign we look for when seeking companies to invest in. Another is a source of growth — high returns are not much use if the business is not able to grow and deploy more capital at these high rates. So how did our companies fare in that respect in 2019? The weighted average free cash flow (the cash the companies generate after paying for everything except the dividend, and our preferred measure) grew by 9% in 2019. The second leg of our strategy is to employ both negative Environmental Social and Governance (‘ESG’) screening (not investing in high ESG risk sectors such as aerospace and defence, brewers, distillers and vintners, casinos and gaming, gas and electric utilities, metals and mining, oil, gas and consumable fuels, pornography and tobacco) and screening for sustainability in the widest sense, taking account not only the companies handling of ESG policies and practices but also their policies and practices on research and development, new product innovation, dividend payments and the adequacy and productivity of capital investment. One of the key metrics we use to assess ESG risk is RepRisk data which provides a measure of the current reputational risk for each company based on ESG factors and current “hot topics”. At the end of December 2019, the weighted average RepRisk indicator for our portfolio was 21.9, slightly higher than it was at the start of the year but substantially below the S&P 500 index score of 29.3. At the end of 2019 the four companies with the highest RepRisk Indicator scores were: 1. Johnson & Johnson 58 2. Microsoft 57 3. Unilever 46 4. Marriott International 41 Marriott International dropped from 2nd to 4th following no further significant negative news after the data leak at Starwood in December 2018. Microsoft replaced PepsiCo in the list and its RepRisk indicator score rose due to issues surrounding tax planning by technology businesses and using its strong market position against smaller competitors, both negative impacts we don’t assign much weight to as these are part of what makes it a good investment. Johnson &

5
Johnson, which we talk about later, has still the highest score despite falling from 65 at the end of 2018 to 58 at the end of 2019. To some extent, reputational risk comes with the territory of medical equipment and pharmaceuticals, especially in the litigious US market but the only way of avoiding it altogether would be to hold no investment in this area, which strikes us as a counsel of despair given the major benefits which the sector can produce. In 2019, we also sold our position in 3M, which has faced numerous negligence lawsuits in recent years over whether it supressed information about the health risks associated with the chemicals (PFAS) used in its firefighting foam for military bases and manufacturing facilities. Reportedly, PFAs have contaminated drinking and groundwater for over 1.9m Americans, posing risks of cancers and immune system failure in children. At the end of 2019, the four companies with the lowest RepRisk indicator scores, which all have a score of zero, were: 1. ADP 0 2. IDEXX 0 3. Intuit 0 4. Sage 0 This looks similar to the list at the end of 2018, with ADP and Intuit replacing Intertek and Waters. Intertek and Waters’ RepRisk Indicator increased to 16 and 18 respectively. Intertek’s score increased due to questionable criticism from the Clean Clothes Campaign for not promoting workers safety enough, while Waters’ increase was due to an article in Korea reporting that some scientific instrument sellers were fined for bid rigging in government contracts that Waters was mentioned in despite not receiving a fine. Both of these are good examples to show that the RepRisk Indicator, whilst generally a good proxy for negative impacts, can be misleading in some situations. As such, we didn’t give either of these score increases much weight in our investment view of the companies. Those of you with a keen attention for detail and who read our monthly ESG factsheet each month, will have noticed that we changed the Environmental statistics to means rather than medians from March this year. This places more weight on companies that have large negative impacts. The number of companies reporting basic environmental stats is still very poor. On average only 35% of S&P 500 companies report the amount of waste, water and energy they use or the amount of CO2 they emit compared to 68% for the Fundsmith Sustainable Equity Fund investable universe. We suspect this is because the companies we invest in tend to have a lower negative impact on the world and therefore are more likely to disclose environmental statistics.

6
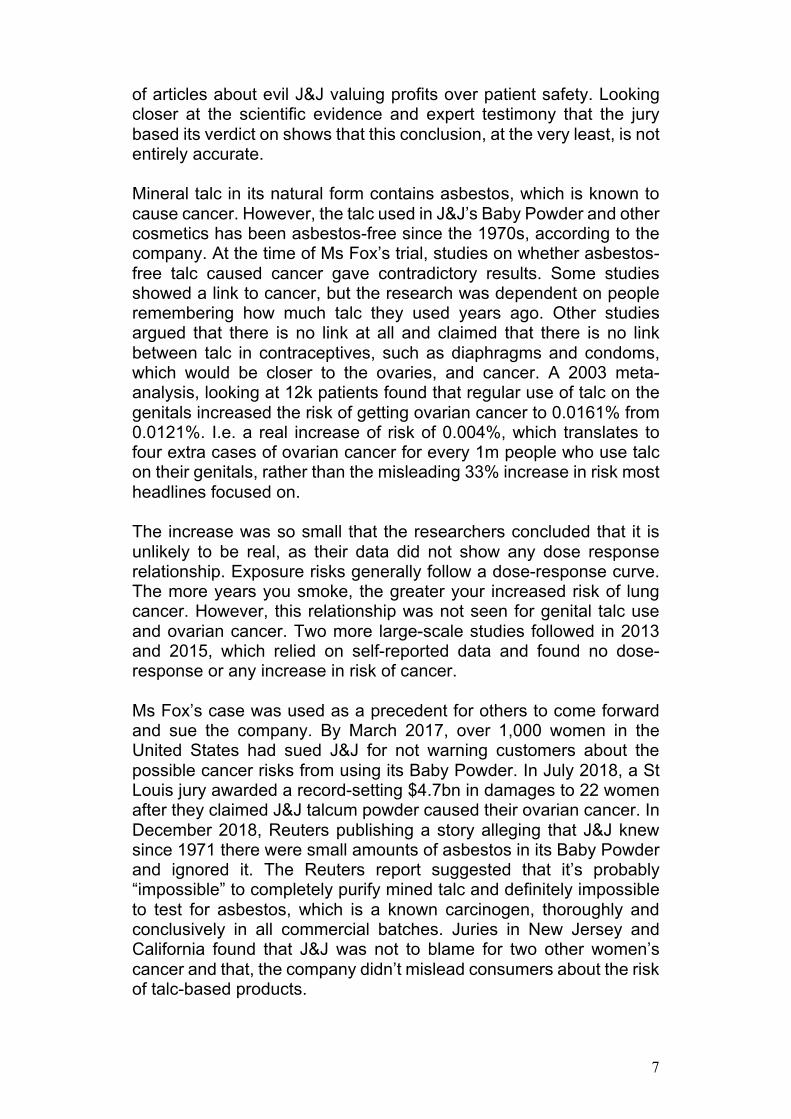
For the companies in our investable universe that don’t report environmental stats, we have always estimated them by looking at the average per £m of assets for the company’s respective subsector for each environmental stat we report and then scaling that number up for the assets of the individual company. From March, we also started doing this for the S&P 500 environmental stats to give a more accurate comparison for our portfolio. Johnson & Johnson (J&J) has consistently had the highest RepRisk indicator (RRI) of any company in the portfolio since we launched the Fundsmith Sustainable Equity Fund. It started the year with an RRI of 66 and finished it with a slightly lower score of 58. The majority of that score comes from the risk associated with the safety of their products, whether J&J accurately represented those risks and publicity from US court cases and settlements. When a company has a high RRI it can be, but isn’t always, an indicator that the company has a large negative impact on the environment or society. However, it can also indicate there has been a lot of media coverage around a specific story where the headlines and the details tell different stories. J&J’s lawsuits, which are the main driver of its high RRI score, mainly relate to whether it misrepresented the safety of its products in its marketing. The biggest of these in the past few years, in terms of number of news stories tracked by RepRisk, has been whether its talcum powder causes cancer and whether the company knew this. (The other lawsuits J&J has faced are around criticism it has received for its role in selling opioid painkillers and the safety of its mesh products). The Baby Powder talc lawsuits started in 2016, when J&J was ordered to pay $72m in damages by a court in Missouri to the family of Jacqueline Fox, a 62 year-old woman, who died from ovarian cancer in 2015. She had used the product for decades on her genitals and her family argued that J&J knew of the risks and failed to warn users. This was the first time damages were awarded by a US jury over talc claims. J&J appealed the verdict, which they later won, but it set a precedent for others to follow suit to claim damages against J&J for their ovarian cancer. The result of this trial would appear to show that J&J was responsible for miss-selling and irresponsibly sold a product that they knew contained asbestos and would cause the death of patients. Cue plenty
% of Companies Reporting Waste Water Energy GHG/CO2 FSEF IU 55% 68% 75% 75% S&P 500 27% 35% 37% 41%
7
of articles about evil J&J valuing profits over patient safety. Looking closer at the scientific evidence and expert testimony that the jury based its verdict on shows that this conclusion, at the very least, is not entirely accurate. Mineral talc in its natural form contains asbestos, which is known to cause cancer. However, the talc used in J&J’s Baby Powder and other cosmetics has been asbestos-free since the 1970s, according to the company. At the time of Ms Fox’s trial, studies on whether asbestos-free talc caused cancer gave contradictory results. Some studies showed a link to cancer, but the research was dependent on people remembering how much talc they used years ago. Other studies argued that there is no link at all and claimed that there is no link between talc in contraceptives, such as diaphragms and condoms, which would be closer to the ovaries, and cancer. A 2003 meta-analysis, looking at 12k patients found that regular use of talc on the genitals increased the risk of getting ovarian cancer to 0.0161% from 0.0121%. I.e. a real increase of risk of 0.004%, which translates to four extra cases of ovarian cancer for every 1m people who use talc on their genitals, rather than the misleading 33% increase in risk most headlines focused on. The increase was so small that the researchers concluded that it is unlikely to be real, as their data did not show any dose response relationship. Exposure risks generally follow a dose-response curve. The more years you smoke, the greater your increased risk of lung cancer. However, this relationship was not seen for genital talc use and ovarian cancer. Two more large-scale studies followed in 2013 and 2015, which relied on self-reported data and found no dose-response or any increase in risk of cancer. Ms Fox’s case was used as a precedent for others to come forward and sue the company. By March 2017, over 1,000 women in the United States had sued J&J for not warning customers about the possible cancer risks from using its Baby Powder. In July 2018, a St Louis jury awarded a record-setting $4.7bn in damages to 22 women after they claimed J&J talcum powder caused their ovarian cancer. In December 2018, Reuters publishing a story alleging that J&J knew since 1971 there were small amounts of asbestos in its Baby Powder and ignored it. The Reuters report suggested that it’s probably “impossible” to completely purify mined talc and definitely impossible to test for asbestos, which is a known carcinogen, thoroughly and conclusively in all commercial batches. Juries in New Jersey and California found that J&J was not to blame for two other women’s cancer and that, the company didn’t mislead consumers about the risk of talc-based products.

8
By the middle of 2019 J&J was in the midst of 11,000 lawsuits alleging that Baby Powder usage caused cancer, primarily ovarian and mesothelioma. This led the House Oversight Committee’s Subcommittee on Economic and Consumer Policy in the United States to focus its first meeting of the year on Baby Powder and whether it needed stricter federal regulation. J&J continued to insist that its products are safe and asbestos-free and that tests done by the US Food and Drug Administration (FDA) had not found any asbestos. In December, J&J commissioned 155 tests by two different third-party labs using four different testing methods on samples from the same bottle tested by an FDA contracted lab earlier in the year. This FDA contracted lab had found asbestos in the sample earlier in 2019 and this led to J&J voluntarily recalling the production lot of Baby Powder the sample came from. The tests conducted by J&J found that there was no asbestos in any of the samples, supporting the findings of a smaller number of independent tests done in October. In the last few weeks of the year, researchers from the National Institute of Environmental Health Sciences in North Carolina published a paper analysing data from 253,000 women (a much larger sample than the 2003 study) to assess whether using talcum powder on one’s genitals increases the risk of developing ovarian cancer. Of these women, 2,168 (0.9%) went on to develop ovarian cancer. Researchers found that the rate of ovarian cancer was not significantly different between those who did and did not use talcum powder. The study concluded that the rate of ovarian cancer amongst those who used talcum powder was 61 cases per 100,000 people per year, compared to 55 cases for those who have never used it. Therefore, the current scientific evidence would imply that J&J did not falsely advertise the safety of its Baby Powder, as there is no evidence of asbestos in its talcum powder and talcum powder itself has not been found to cause cancer. An important lesson from this example is that negative impacts are never clear-cut and the devil is in the detail. This is especially true when assessing the extent of a company’s responsibility for a negative impact. The headlines can sometimes give the wrong impression of a company’s guilt or exaggerate the degree of control a company has. This is why we don’t automatically exclude any company that has a RepRisk Indicator score above a certain level and why any assessment of a company with a high RRI needs to look at the details. This example also raises the question that if talcum powder did cause cancer, as investors, what should our stance be toward corporate responsibility in the face of questionable scientific evidence? Clearly, corporations should follow regulations. They should do due diligence in ensuring their products are safe and effective. They should have transparency and not hide possible risks of their products. However,

9
nothing is risk free. At what point are risks so low that they are negligible? What is the responsibility of corporations to disclose possible, but not proven, tiny risks? If they do, this can lead to “alarm fatigue,” where consumers learn to ignore warnings because they are everywhere. These questions become especially relevant to medical device makers or personal care products, which don’t go through as much (or any) of the rigorous testing that the FDA requires for drug manufacturers. How much testing should or can be done on a product before it is released and at what point has a company done all it can to identify and assess these risks before they are no longer held responsible is an open question. RepRisk also doesn’t look at any positive impacts, which are particularly relevant for a company like J&J which has the large positive impacts that are too often ignored. We believe that when assessing the impacts a company has it should be done on a net basis, as a company will get a lot of publicity when things go wrong but significantly less for the good things it does every day. In 2018, J&J provided 39,000 people with access to tuberculosis treatment and 52,000 people access to HIV treatment, trained 105,000 health workers in 67 countries and invested $11bn in R&D to develop new treatments that help patients live better and longer lives. Turning to the third step of our strategy, the weighted average free cash flow (‘FCF’) yield (the free cash flow generated by the companies divided by their market value) of the portfolio at the outset of the year was 3.9% and ended it at 3.3%, so they became more highly rated. Whilst this is a good thing from the viewpoint of the performance of their shares and the Fund, it makes us nervous as changes in valuation are finite and reversible, although it is hard to see the most likely source of such a reversal — a rise in interest rates — in the near future. The year-end median FCF yield on the S&P 500 was 4.2%. The year-end median FCF yield on the FTSE 100 was 5.5%. Our portfolio consists of companies that are valued more highly than the average FTSE 100 company and a bit higher than the average S&P 500 company but with significantly higher quality. It is wise to bear in mind that despite the rather sloppy shorthand used by many commentators, highly rated does not equate to expensive any more than lowly rated equates to cheap. Turning to the fourth leg of our strategy, which we succinctly describe as ‘Do nothing’, minimising portfolio turnover remains one of our objectives and this was again achieved with a negative portfolio turnover during the period. It is perhaps more helpful to know that we
10
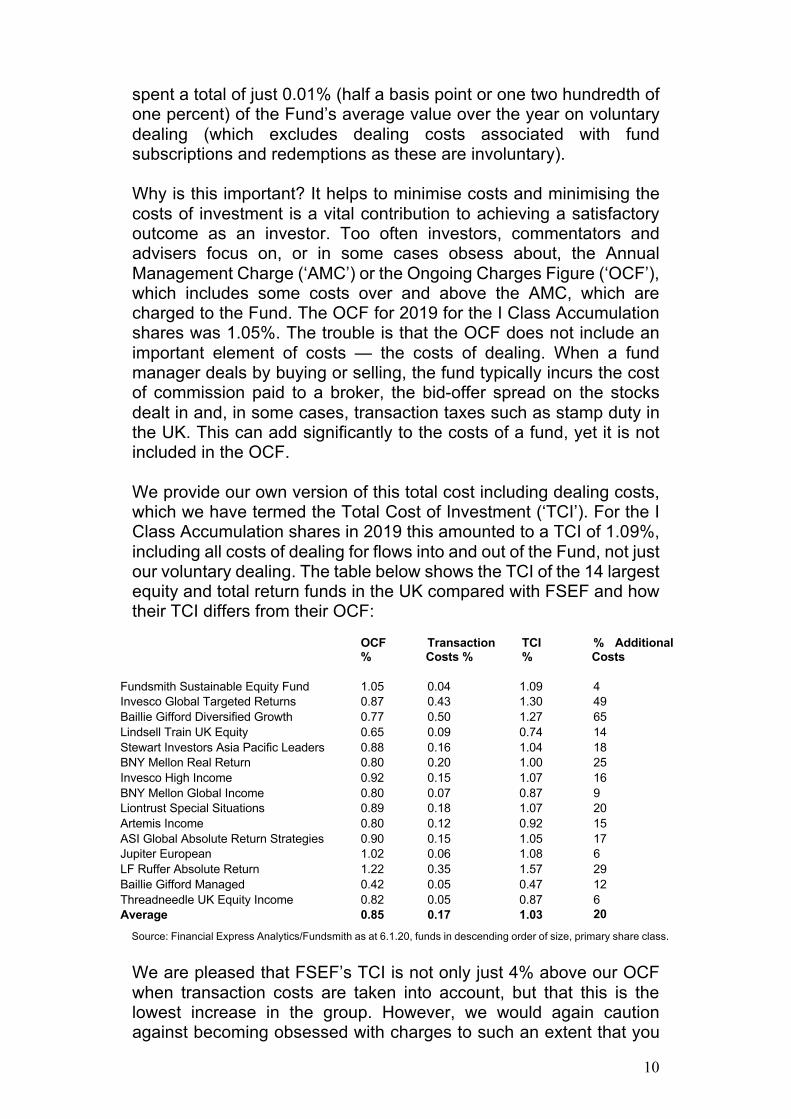
spent a total of just 0.01% (half a basis point or one two hundredth of one percent) of the Fund’s average value over the year on voluntary dealing (which excludes dealing costs associated with fund subscriptions and redemptions as these are involuntary). Why is this important? It helps to minimise costs and minimising the costs of investment is a vital contribution to achieving a satisfactory outcome as an investor. Too often investors, commentators and advisers focus on, or in some cases obsess about, the Annual Management Charge (‘AMC’) or the Ongoing Charges Figure (‘OCF’), which includes some costs over and above the AMC, which are charged to the Fund. The OCF for 2019 for the I Class Accumulation shares was 1.05%. The trouble is that the OCF does not include an important element of costs — the costs of dealing. When a fund manager deals by buying or selling, the fund typically incurs the cost of commission paid to a broker, the bid-offer spread on the stocks dealt in and, in some cases, transaction taxes such as stamp duty in the UK. This can add significantly to the costs of a fund, yet it is not included in the OCF. We provide our own version of this total cost including dealing costs, which we have termed the Total Cost of Investment (‘TCI’). For the I Class Accumulation shares in 2019 this amounted to a TCI of 1.09%, including all costs of dealing for flows into and out of the Fund, not just our voluntary dealing. The table below shows the TCI of the 14 largest equity and total return funds in the UK compared with FSEF and how their TCI differs from their OCF:
OCF %
Transaction Costs %
TCI %
% Additional Costs
Fundsmith Sustainable Equity Fund 1.05 0.04 1.09 4 Invesco Global Targeted Returns 0.87 0.43 1.30 49 Baillie Gifford Diversified Growth 0.77 0.50 1.27 65 Lindsell Train UK Equity 0.65 0.09 0.74 14 Stewart Investors Asia Pacific Leaders 0.88 0.16 1.04 18 BNY Mellon Real Return 0.80 0.20 1.00 25 Invesco High Income 0.92 0.15 1.07 16 BNY Mellon Global Income 0.80 0.07 0.87 9 Liontrust Special Situations 0.89 0.18 1.07 20 Artemis Income 0.80 0.12 0.92 15 ASI Global Absolute Return Strategies 0.90 0.15 1.05 17 Jupiter European 1.02 0.06 1.08 6 LF Ruffer Absolute Return 1.22 0.35 1.57 29 Baillie Gifford Managed 0.42 0.05 0.47 12 Threadneedle UK Equity Income 0.82 0.05 0.87 6 Average 0.85 0.17 1.03 20
Source: Financial Express Analytics/Fundsmith as at 6.1.20, funds in descending order of size, primary share class.
We are pleased that FSEF’s TCI is not only just 4% above our OCF when transaction costs are taken into account, but that this is the lowest increase in the group. However, we would again caution against becoming obsessed with charges to such an extent that you

11
lose focus on the performance of funds. It is worth pointing out that the performance of our Fund tabled at the beginning of this letter is after charging all fees which should surely be the main focus.
I think the above table speaks for itself in terms of the relative performance of our Fund so that you can look not just at the fees and costs but what you get in return — performance. The Fund’s performance for the year was adversely affected by a couple of poor months in September and October which cost the Fund about 6%. This was caused by two factors: 1) a rally in the sterling exchange rate from the recent lows which it had plumbed after the Brexit referendum result in 2016 and on subsequent hard Brexit fears; and 2) a ‘rotation’ from the high quality and relatively highly rated stocks of the sort which our Fund owns into lower quality and more lowly rated ‘value’ stocks. If you read the breathless commentary on this in much of the press without knowing the actual performance of our Fund you might be surprised to find that, notwithstanding these events, it ended the year up by 23.4% which was our best year since inception and outperformed the MSCI World Index by 0.7%. Taking each of these factors in turn, currency movements clearly have some effect on our portfolio. Over 58% of our portfolio is invested in companies listed in the United States. The actual exposure to the US dollar and therefore the pound/dollar exchange rate is better gauged by the c.40% of our portfolio companies’ revenues which are in the USA. However, currency movements are not something we believe we can predict — they seem to have about the same predictability as a game of Snakes & Ladders — or hedge. I would suggest looking at the matter this way: imagine we were in a discussion with some of the companies which have produced great returns for us over the last nine years, or which might do so over the next nine, and we asked them to name the top three factors in their success. What do you think the chances are that they would say ‘currency exposure and exchange rates’? I would suggest they might name product innovation and R&D, strong brands, control of distribution, market share, customer relationships, installed bases of equipment or software, management, successful capital expenditure and acquisitions as far more important. So, we think it’s best to ignore the Snakes & Ladders of currency movements. Turning to the second point — the so-called rotation into value stocks, I am not much of a gardener but I believe this is becoming what gardeners term a hardy perennial as it crops up every year. To quote from Investment Adviser ‘Looking at PE ratios there is evidence in

12
abundance that shows that from a relative perspective quality stocks may today be considered expensive.’ The interesting point about that assertion is that it was published on 13th August 2012. A lot of superior returns have been had from those allegedly expensive stocks in the subsequent seven years. The argument might be encapsulated thus: stocks of the sort which our Fund owns have had a good run of outperformance as has the Fund but this is all about to end, or even has already ended, and so-called ‘value investing’ — buying stocks mainly based upon their supposed under valuation by the market — is making a comeback and funds which pursue that strategy are about to outperform us. Value investing has its flaws as a strategy. Markets are not perfect but they are not totally inefficient either and most of the stocks which have valuations which attract value investors have them for good reason — they are not good businesses. This means that the value investor who buys one of these companies which are indeed lowly rated but which rarely or never make an adequate return on capital is facing a headwind. The intrinsic value of the company does not grow (except for any new capital that its hapless investors allow it to retain or subscribe for in some form of share issue), or even erodes over time, whilst the value investor is waiting for the lowly valuation to be recognised and the share price to rise to reflect this. Moreover, even when the value investor gets it right and this happens, they then need to sell the stock which has achieved this and find another undervalued stock and start again. This activity obviously incurs dealing costs but value investing is not something which can be pursued with a ‘buy and hold’ strategy. In investment you ‘become what you eat’ insofar as over the long term the returns on any portfolio which has such an approach will tend to gravitate to the returns generated by the companies themselves, which are low for most value stocks. As Charlie Munger, Warren Buffett’s business partner, said: ‘Over the long term, it’s hard for a stock to earn a much better return than the business which underlies it earns. If the business earns six percent on capital over forty years and you hold it for that forty years, you’re not going to make much different than a six percent return — even if you originally buy it at a huge discount. Conversely, if a business earns eighteen percent on capital over twenty or thirty years, even if you pay an expensive looking price, you’ll end up with one hell of a result.’ Our emphasis added. Mr Munger is not offering a theory or an opinion — what he is saying is a mathematical certainty. The only uncertainty concerns our ability to forecast returns far ahead, which is why we prefer to invest in relatively predictable businesses.

13
The biggest flaw in value investing is that is does not seek to take advantage of a unique characteristic of equities. Equities are the only asset in which a portion of your return is automatically reinvested for you. The retained earnings (or free cash flow if you prefer that measure, as we do) after payment of the dividend are reinvested in the business. This does not happen with real estate — you receive rent not a further investment in buildings, or with bonds — you get paid interest but no more bonds. This retention of earnings which are reinvested in the business can be a powerful mechanism for compounding gains. Some 80% of the gains in the S&P 500 over the 20th century came not from changes in valuation but from the companies’ earnings and reinvestment of retained capital. If you were a great (and long-lived) value investor who bought the S&P 500 at its low in valuation terms, which was in 1917 when America entered world war one and it was on a P/E of 5.3x, and sold it at its high in valuation terms in 1999 when it was on a P/E of 34x, your annual return during that period would have been 11.6% with dividends reinvested, but only 2.3% p.a. came from the massive increase in P/E and 9.3% (80% of 11.6%) came from the companies’ earnings and reinvesting their retained earnings. The S&P example is for 500 average large companies. This proportion of your return from the companies’ reinvestment activities is even more extreme when you invest in a good company with a high return on retained capital than in an average company. All of this was much more succinctly encapsulated by Warren Buffett when he said: ‘It's far better to buy a wonderful company at a fair price, than a fair company at a wonderful price.’ He made the transition from being a traditional value investor based upon studying under Benjamin Graham (author of “The Intelligent Investor” and “Security Analysis”) into a quality investor looking for companies which could compound in value based upon the teachings of Philip Fisher (author of Common Stocks and Uncommon Profits) and the influence of Charlie Munger. Here’s how Buffett explained this change in his 1989 letter to Berkshire Hathaway shareholders: ‘The original 'bargain' price probably will not turn out to be such a steal after all. In a difficult business, no sooner is one problem solved than another surfaces — never is there just one cockroach in the kitchen. [Plus], any initial advantage you secure will be quickly eroded by the low return that the business earns. For example, if you buy a business for $8 million that can be sold or liquidated for $10 million and promptly take either course, you can realize a high return. But the investment

14
will disappoint if the business is sold for $10 million in ten years and in the interim has annually earned and distributed only a few percent on cost. Time is the friend of the wonderful business, the enemy of the mediocre.’ The problems of waiting for value investment to pay off can be seen in the performance of the MSCI World Value Index (USD) which hit 6570 at the end of October 2007 and was lower than this at the end of February 2016. At 31st December 2019 it stood at 9812, just 49% higher than its 2007 peak value. Compare and contrast the S&P 500 (USD) which peaked on 9th October 2007 but had regained its 2007 high by 2013 and at 31st December 2019 stood 189% higher. Ah, but I can hear the siren song of the value investors who will take this data as confirmation that the resurgence of value investment which they have long predicted is about to commence. As an old saying goes ‘To a man with a hammer, everything looks like a nail’. The longer the strategy underperforms the market and the more money it costs investors the louder the siren song becomes. And sooner or later they will be right. But a) they have no idea when that will be (note the reference above to Investment Adviser’s comment in 2012); b) if you had followed their advice to date it would require a gargantuan reversal of performance to make up the gains forgone; and c) that may continue to be the case for some time to come. Lastly, there are some commentators who say that one way to address this is to have a portion of your portfolio invested in both strategies — some in quality growth and some in value. I think the assertion that there is no harm in this diversification approach has been disproved rather comprehensively by Warren Buffett, but what does he know? Perhaps we should look at the value investment versus quality and growth strategy debate this way: would you rather side with a) a large section of the UK financial press and rent-a-quote investment advisers; or b) Warren Buffett, Charlie Munger (Berkshire Hathaway), Bill Gates (Microsoft), the Bettencourt family (L’Oréal), the Brown family (Brown-Forman), the Walton family (Walmart) and Bernard Arnault (LVMH)? The latter all seem to have become extraordinarily rich by concentrating their investment in a single high quality business and not trading regardless of valuation. So much for it not doing any harm to diversify across strategies. It seems impossible to comment upon developments in equity investing in the UK in 2019 without mentioning the word Woodford. The demise of Woodford Investment Management following the ‘gating’ of its main LF Woodford Equity Income Fund was undoubtedly the main news in the industry last year.

15
We have no desire to engage in a general commentary on this matter or to engage in an unseemly exercise in schadenfreude. We had long identified the problems which were brewing at Woodford but we kept our own counsel on the matter. The only comments you will find from us mentioning Woodford were in answer to direct questions concerning Woodford from our investors at our Annual Meeting. We regard it as a lack of professional courtesy to comment upon our competitors except when we are asked to do so by our investors. We only wish others in the industry would maintain the same stance. However, we now feel freer to comment on Woodford since it is hard to see how it can now exacerbate the situation, and I feel that we need to as the Woodford debacle has raised important questions about the industry, some of which have been directed at us and I feel that our investors should know our response. The most obvious problem at Woodford was the lethal combination of a daily-dealing open-ended fund with significant holdings in unquoted companies and large percentage stakes in small quoted companies which had very limited liquidity. Whilst this was clearly a very bad idea, Woodford is not the only fund to have encountered this problem. A large swathe of UK property funds was gated after the Brexit Referendum for the same reason, and more recently so was the M&G Property Fund. An open-ended daily-dealing fund is clearly not an appropriate vehicle through which to hold such assets. The daily-dealing and open-ended structure give investors the illusion of liquidity but when a large number of them try to exercise it at once the effect is similar to shouting ‘Fire!’ in a crowded theatre. Amongst the causes which commentators seem to have failed to realise is the effect which the rise of investment platforms has had on this, and indeed other areas of the fund management industry. It is now the case that no one can expect to effectively market an open-ended fund on any of the major investment platforms which retail investors and wealth managers use to manage their investments unless it is a daily-dealing fund. As none of these platforms will admit an open-ended fund, unless it allows daily-dealing, that is what fund managers will use even for strategies for which this structure is wholly inappropriate. Where does the Fundsmith Sustainable Equity Fund stand on this? We have always regarded liquidity as an important issue. As evidence of this, we have published a liquidity measure on our Fund factsheet since inception. Equally we only invest in large companies. At 31st December 2019 the average market capitalisation of the companies in our Fund was £107bn and we estimate we could liquidate 100% of the Fund in seven days.

16
The reality is that the only type of fund which can guarantee 100% liquidity on demand is a cash fund, and I presume that is not what you wish us to invest in. But I suspect you will find it hard to find more liquid equity funds than ours. It tells you much about its liquidity that some of the least liquid stocks we hold are the FTSE 100 companies, Intertek and Sage. Another question which arises from the Woodford incident is the question mark over so-called ‘star’ fund managers, a label the press seems obsessed by. I can’t say I like the term, it strikes me as equally inappropriate as the term ‘beauty parade’ which is used when selecting professional advisers, many of whom do not seem to me to have obvious photogenic qualities. I think this concern is focused on the wrong issue. I think it makes no more sense to avoid funds run by ‘star’ fund managers any more than it does to avoid supporting sporting teams because they have star players. The trouble arises not because teams have star players but if the star tries to play a different game to the one which delivered their stellar performance. Would Juventus do as well if Cristiano Ronaldo played as goalkeeper? How is Usain Bolt’s second career as a soccer player going? Neil Woodford made his name as a fund manager at Invesco Perpetual with his successful Income Fund. In the course of this he took two high profile negative positions on sectors. In the run up to the dotcom bust in 2000 he seems to have seen what was coming and avoided investments in technology, media and telecommunications stocks which was a major success. He also paired this with taking positions in some of the old economy neglected stocks which had become de-rated during the dotcom mania. Similarly, in the run up to the Credit Crisis he decided not to hold bank stocks. However, when he opened his own fund management business he took positions in a wide range of companies — AA, AstraZeneca, Capita, Imperial Brands, Provident Financial and Stobart are some examples. There is no common theme that I can detect to those companies, other than the fact that they all subsequently fared badly. This was supplemented by a raft of unquoted investments in start-ups and biotech. My suggestion is that what went wrong is that Neil Woodford changed his investment strategy. In the technical jargon of the industry, he engaged in ‘style drift’. The problem wasn’t that he was regarded as a star but that he changed his game. This style drift actually started when he was still at Invesco Perpetual in that his Income Fund began to accumulate large stakes in small illiquid companies and unquoteds, but this was taken further once he had his own firm.

17
Is there any chance of style drift or a similar change of strategy at Fundsmith? I think not. We published an Owner’s Manual for Fundsmith Equity Fund at the outset which describes our investment strategy, write to you in these annual letters analysing how we are faring in implementing our strategy and are the only mutual fund in the UK which holds an annual meeting at which our investors can question us and see their questions answered publicly. So, it would be extraordinary if we were able to effect a change in our investment strategy without you noticing. Moreover, we have no desire to change our strategy. We are convinced that it can deliver superior returns over the long term. I would pose a different question which links the discussion of the Woodford affair with the earlier discussion of the ‘rotation’ from quality stocks into value stocks. If you expect such a ‘rotation’ to occur at some point and for value stocks to enjoy a period in the sun would you rather we tried to anticipate that and switched into a value investment approach of buying stocks based mainly or solely on the basis of their valuation or would you rather we stuck to our existing approach of buying and holding high quality businesses? I would suggest the latter approach might be better, and it is what we are doing. There will be no style drift at Fundsmith. Finally, I wish you a happy New Year and thank you for your continued support for our Fund. Yours sincerely,
Terry Smith, CEO, Fundsmith LLP Disclaimer: A Key Investor Information Document and an English language prospectus for the Fundsmith Sustainable Equity Fund are available via the Fundsmith website or on request and investors should consult these documents before purchasing shares in the fund. Past performance is not necessarily a guide to future performance. The value of investments and the income from them may fall as well as rise and be affected by changes in exchange rates, and you may not get back the amount of your original investment. Fundsmith LLP does not offer investment advice or make any recommendations regarding the suitability of its product. This document is communicated by Fundsmith LLP which is authorised and regulated by the Financial Conduct Authority. Sources: Fundsmith LLP & Bloomberg unless otherwise stated. Portfolio turnover has been calculated in accordance with the methodology laid down by the FCA. This compares the total share purchases and sales less total creations and liquidations with the average net asset value of the fund. P/E ratios and Free Cash Flow Yields are based on trailing twelve month data and as at 31st December 2019 unless otherwise stated. Fund liquidity is based on 30% of average trailing 20 day volume.

18
MSCI World Index is the exclusive property of MSCI Inc. MSCI makes no express or implied warranties or representations and shall have no liability whatsoever with respect to any MSCI data contained herein. The MSCI data may not be further redistributed or used as a basis for other indices or any securities or final products. This report is not approved, reviewed or produced by MSCI. The Global Industry Classification Standard (GICS) was developed by and is the exclusive property of MSCI and Standard & Poor’s and “GICS®” is a service mark of MSCI and Standard & Poor’s.