global quantitative and derivatives strategy vol stocks 4.3 em stocks 3.1 gold 1.1 ... low vol...
TRANSCRIPT
Macro Quantitative Outlook
January 2017
See the end pages of this presentation for analyst certification and important disclosures, including non-US analyst disclosures. J.P. Morgan does and seeks to do business with companies covered in its research reports. As a result, investors should be aware that the firm may have a conflict of interest that could affect the objectivity of this report. Investors should consider this report as only a single factor in making their investment decision. In the United States, this information is available only to persons who have received the proper option risk disclosure documents. Please contact your J.P. Morgan representative or visit http://www.optionsclearing.com/publications/risks/riskstoc.pdf.
Marko Kolanovic, PhD AC
Head, Global Quantitative and Derivatives [email protected]. Morgan Securities LLC
Global Quantitative and Derivatives Strategy
Completed 09 Jan 2017 12:31 PM ESTDisseminated 09 Jan 2017 12:31 PM EST
J.P.
MO
RG
AN
1
Overview
• Outlook for Equities• What are the Risks?• Reflation, Style Rotation
• Growth in Quant Investing• Risk Premia Cycle, Crowding• Changes in Marketplace: Macro• Changes in Marketplace: Stocks• Timing vs. Passive Risk Premia• Indexation of Assets• Indexation of Information• Big data
J.P.
MO
RG
AN
2
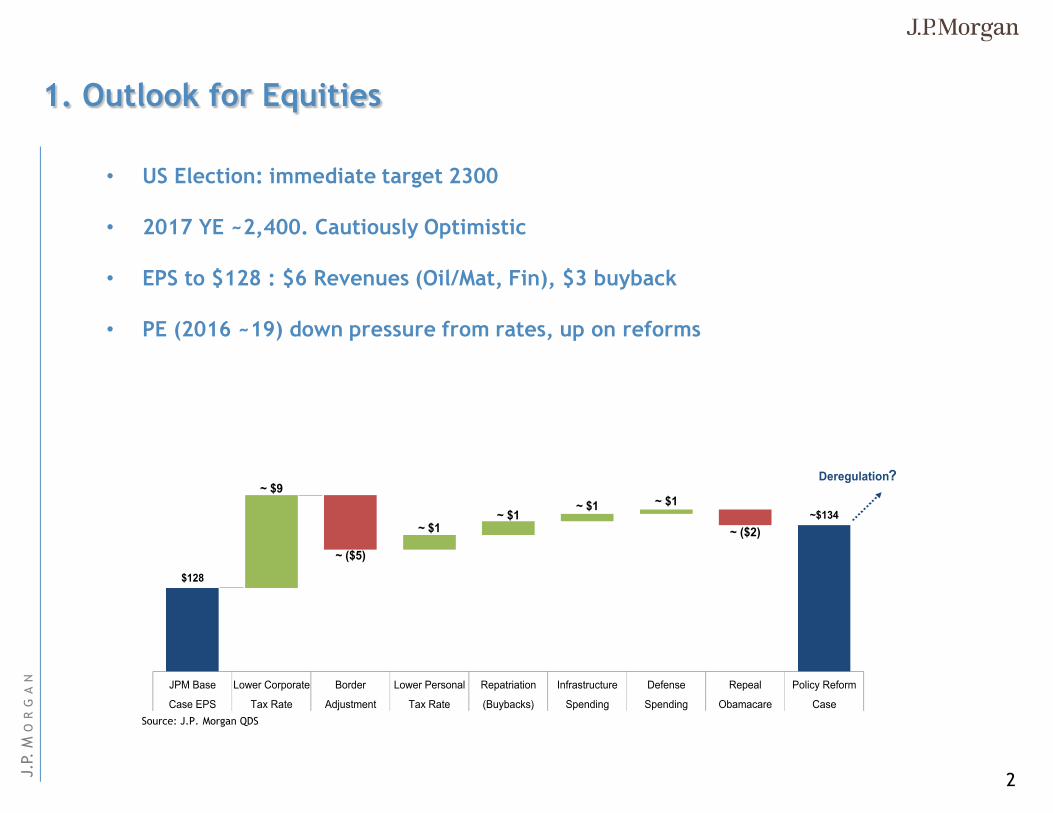
1. Outlook for Equities
• US Election: immediate target 2300
• 2017 YE ~2,400. Cautiously Optimistic
• EPS to $128 : $6 Revenues (Oil/Mat, Fin), $3 buyback
• PE (2016 ~19) down pressure from rates, up on reforms
$128
~$134
~ $9
~ ($5)
~ $1~ $1
~ $1 ~ $1
~ ($2)
JPM Base Lower Corporate Border Lower Personal Repatriation Infrastructure Defense Repeal Policy Reform
Case EPS Tax Rate Adjustment Tax Rate (Buybacks) Spending Spending Obamacare Case
Deregulation?
Source: J.P. Morgan QDS
J.P.
MO
RG
AN
3
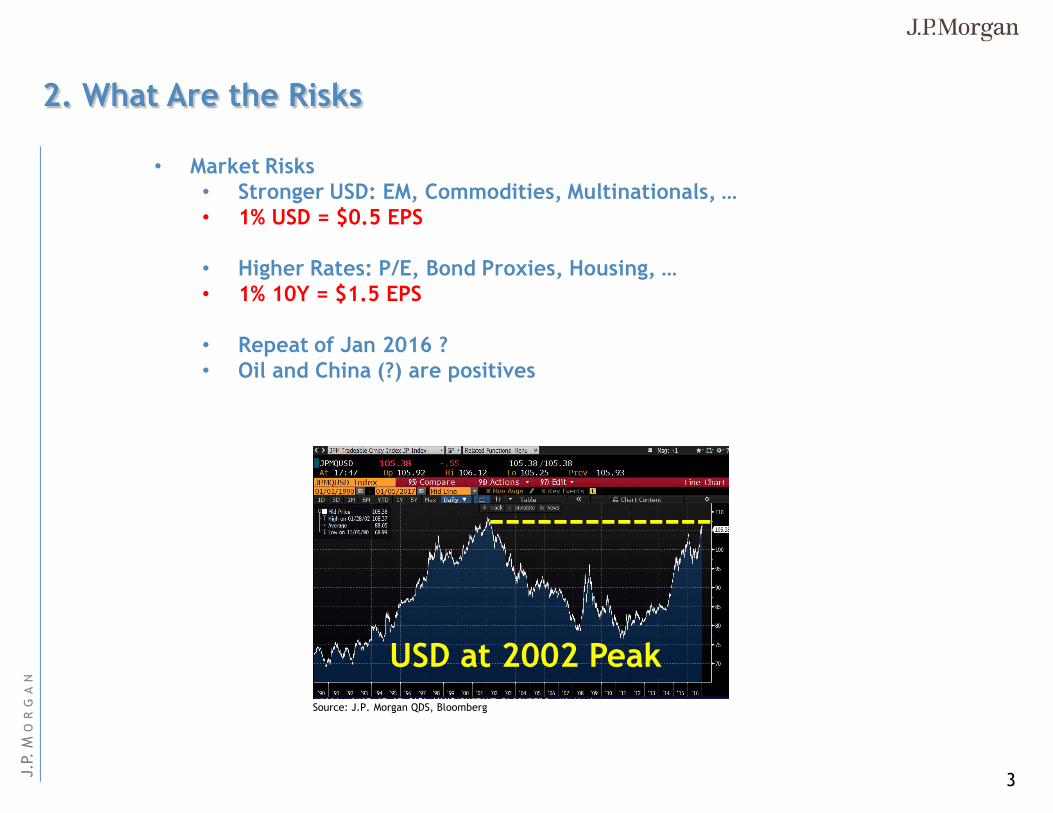
2. What Are the Risks
• Market Risks• Stronger USD: EM, Commodities, Multinationals, …• 1% USD = $0.5 EPS
• Higher Rates: P/E, Bond Proxies, Housing, …• 1% 10Y = $1.5 EPS
• Repeat of Jan 2016 ?• Oil and China (?) are positives
USD at 2002 Peak
Source: J.P. Morgan QDS, Bloomberg
J.P.
MO
RG
AN
4
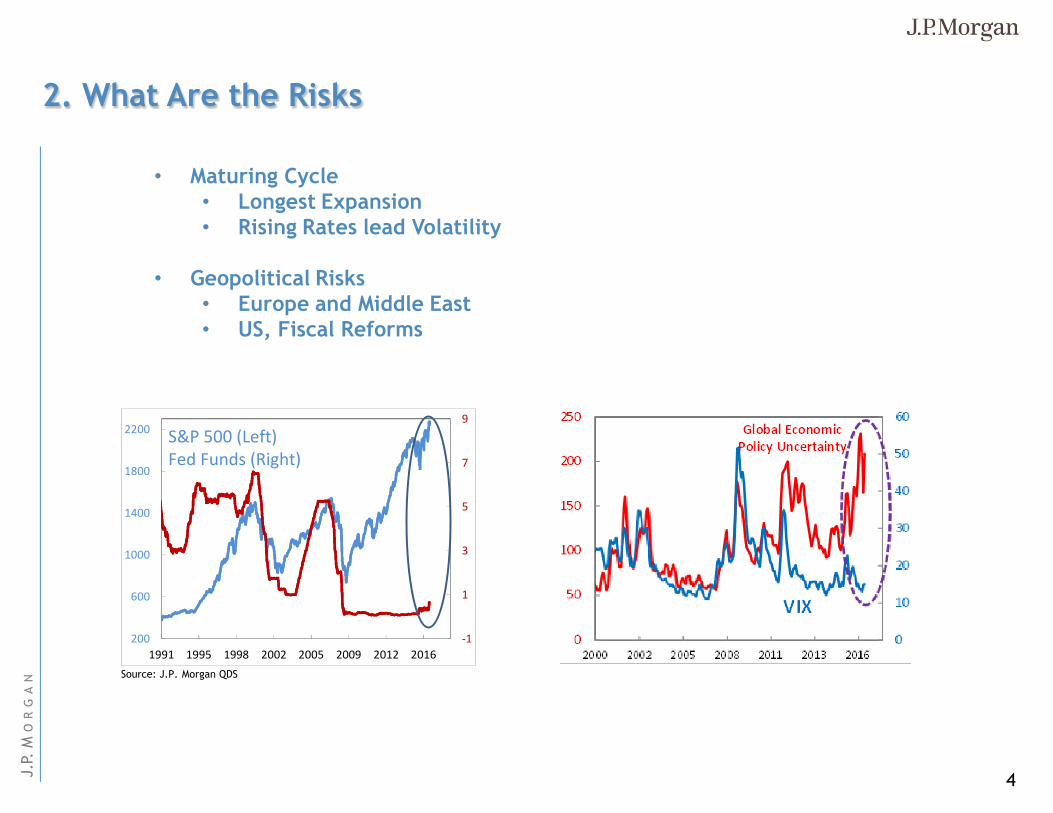
2. What Are the Risks
• Maturing Cycle• Longest Expansion• Rising Rates lead Volatility
• Geopolitical Risks• Europe and Middle East• US, Fiscal Reforms
-1
1
3
5
7
9
200
600
1000
1400
1800
2200
1991 1995 1998 2002 2005 2009 2012 2016
S&P 500 (Left)Fed Funds (Right)
Source: J.P. Morgan QDS
J.P.
MO
RG
AN
5
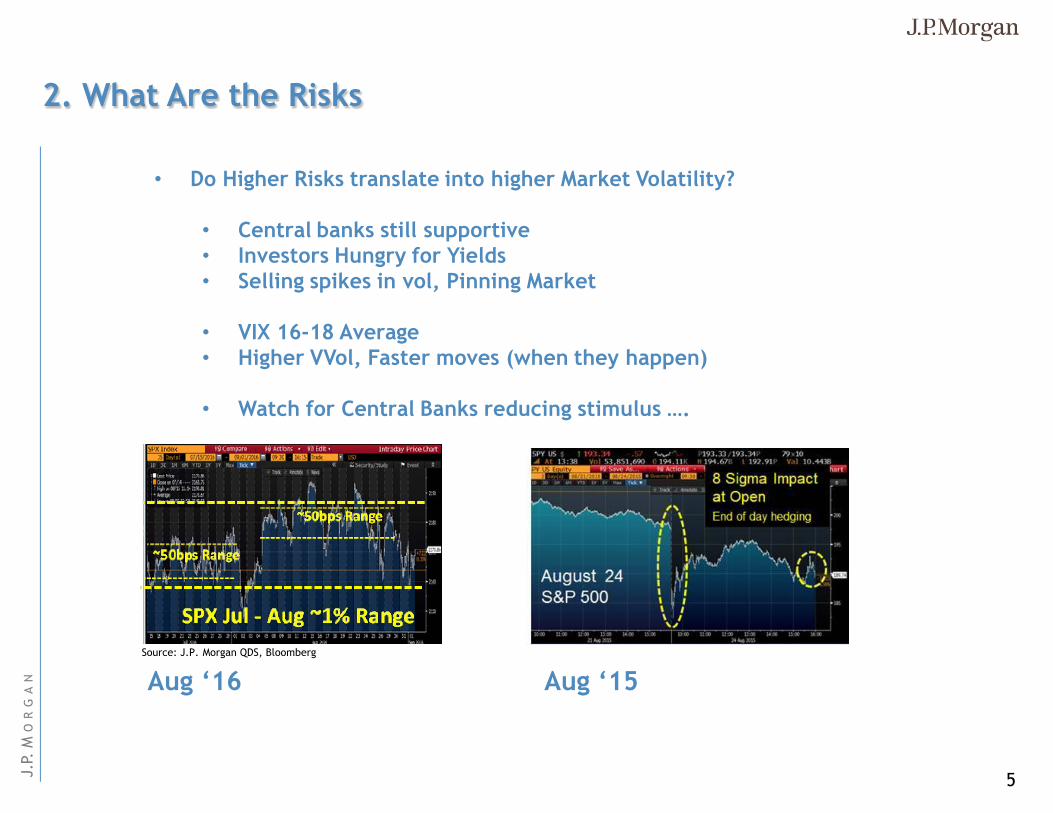
2. What Are the Risks
• Do Higher Risks translate into higher Market Volatility?
• Central banks still supportive• Investors Hungry for Yields • Selling spikes in vol, Pinning Market
• VIX 16-18 Average• Higher VVol, Faster moves (when they happen)
• Watch for Central Banks reducing stimulus ….
Aug ‘16 Aug ‘15
Source: J.P. Morgan QDS, Bloomberg
J.P.
MO
RG
AN
6
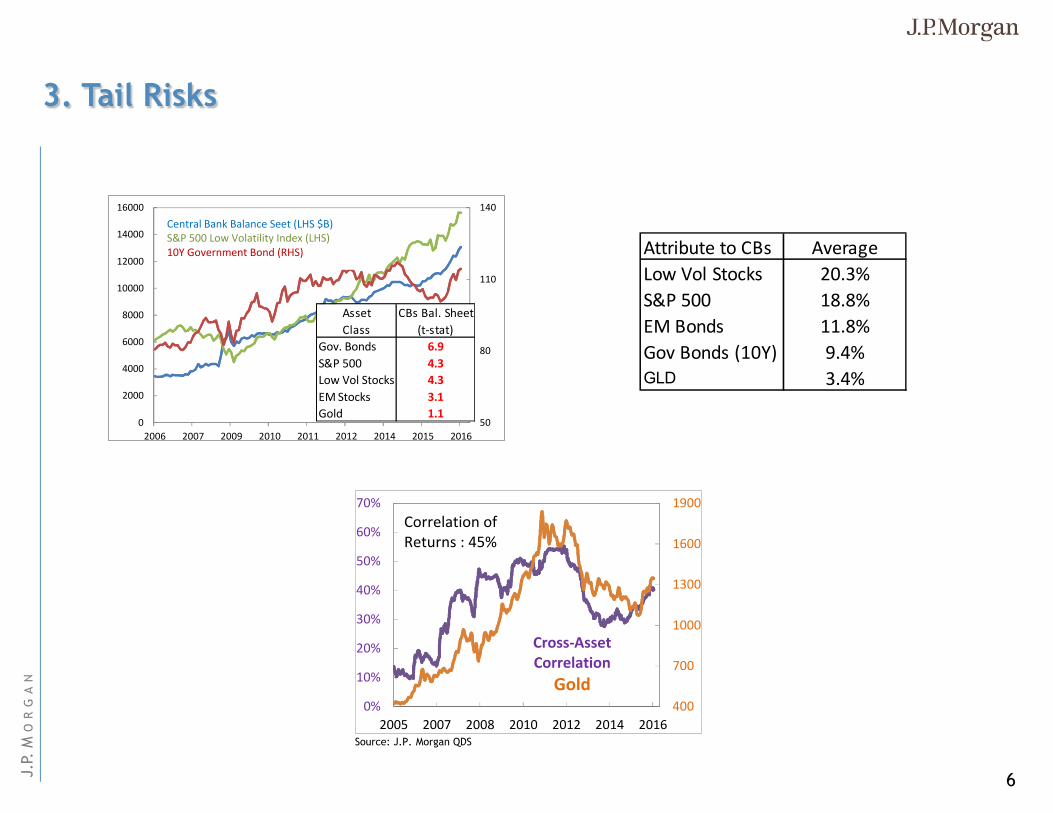
3. Tail Risks
50
80
110
140
0
2000
4000
6000
8000
10000
12000
14000
16000
2006 2007 2009 2010 2011 2012 2014 2015 2016
Asset CBs Bal. Sheet
Class (t-stat)
Gov. Bonds 6.9
S&P 500 4.3
Low Vol Stocks 4.3
EM Stocks 3.1
Gold 1.1
Central Bank Balance Seet (LHS $B)S&P 500 Low Volatility Index (LHS)10Y Government Bond (RHS)
400
700
1000
1300
1600
1900
0%
10%
20%
30%
40%
50%
60%
70%
2005 2007 2008 2010 2012 2014 2016
Correlation ofReturns : 45%
Cross-AssetCorrelation
Gold
Attribute to CBs Average
Low Vol Stocks 20.3%
S&P 500 18.8%
EM Bonds 11.8%
Gov Bonds (10Y) 9.4%GLD 3.4%
Source: J.P. Morgan QDS
J.P.
MO
RG
AN
7
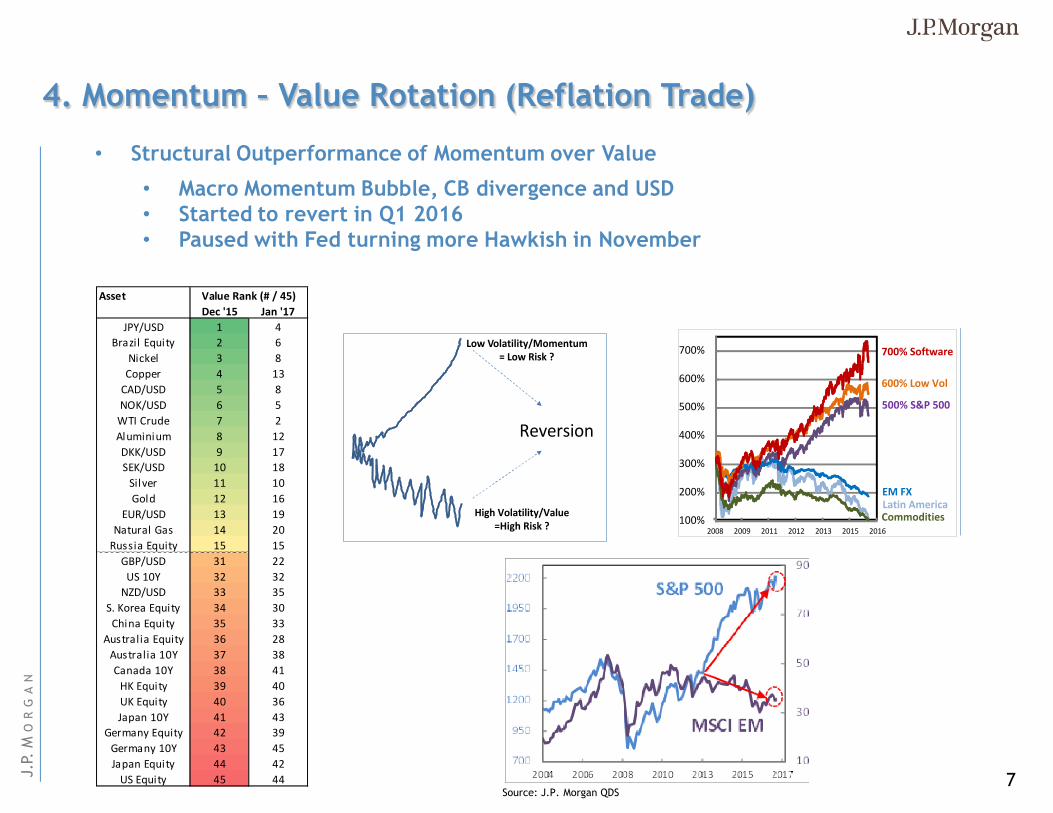
4. Momentum – Value Rotation (Reflation Trade)
100%
200%
300%
400%
500%
600%
700%
2008 2009 2011 2012 2013 2015 2016
EM FX
700% Software
600% Low Vol
500% S&P 500
Latin AmericaCommodities
Asset
Dec '15 Jan '17
JPY/USD 1 4
Brazil Equity 2 6
Nickel 3 8
Copper 4 13
CAD/USD 5 8
NOK/USD 6 5
WTI Crude 7 2
Aluminium 8 12
DKK/USD 9 17
SEK/USD 10 18
Silver 11 10
Gold 12 16
EUR/USD 13 19
Natural Gas 14 20
Russia Equity 15 15
GBP/USD 31 22
US 10Y 32 32
NZD/USD 33 35
S. Korea Equity 34 30
China Equity 35 33
Australia Equity 36 28
Australia 10Y 37 38
Canada 10Y 38 41
HK Equity 39 40
UK Equity 40 36
Japan 10Y 41 43
Germany Equity 42 39
Germany 10Y 43 45
Japan Equity 44 42
US Equity 45 44
Value Rank (# / 45)
Low Volatility/Momentum = Low Risk ?
High Volatility/Value=High Risk ?
Reversion
• Structural Outperformance of Momentum over Value
• Macro Momentum Bubble, CB divergence and USD• Started to revert in Q1 2016• Paused with Fed turning more Hawkish in November
Source: J.P. Morgan QDS
J.P.
MO
RG
AN
8
5. Growth in Quant
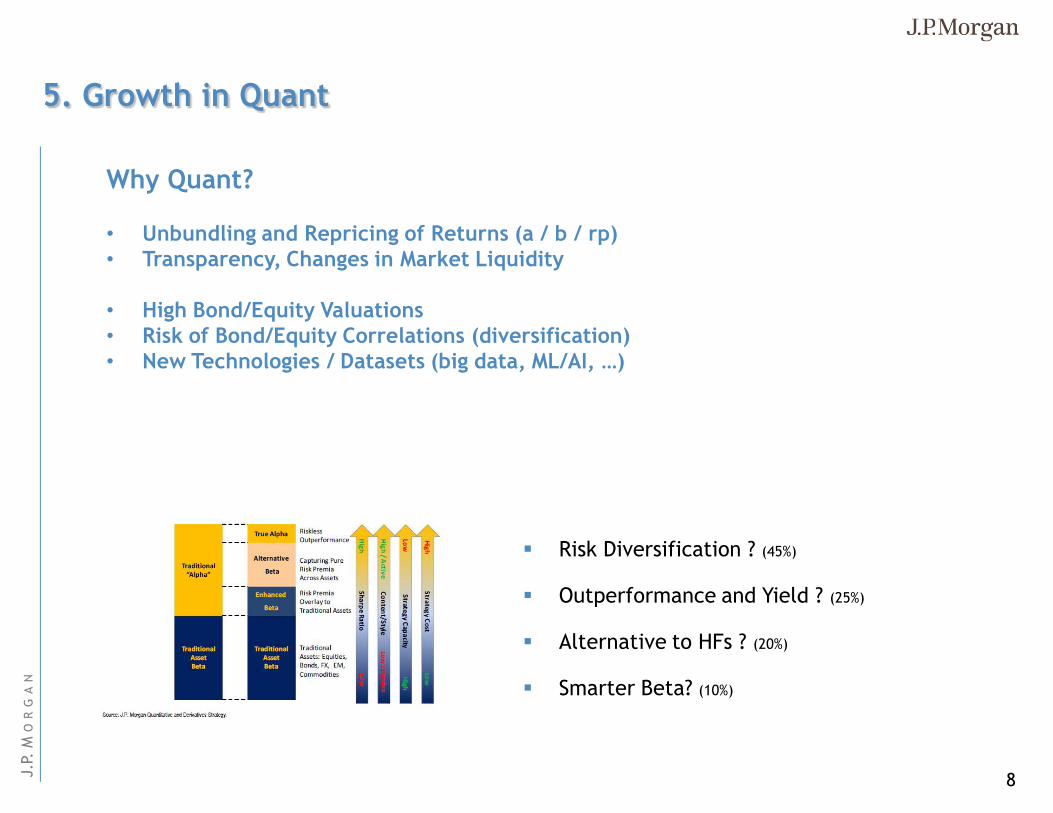
Why Quant?
• Unbundling and Repricing of Returns (a / b / rp)• Transparency, Changes in Market Liquidity
• High Bond/Equity Valuations• Risk of Bond/Equity Correlations (diversification)• New Technologies / Datasets (big data, ML/AI, …)
Risk Diversification ? (45%)
Outperformance and Yield ? (25%)
Alternative to HFs ? (20%)
Smarter Beta? (10%)
J.P.
MO
RG
AN
9
6. Where Are We In Risk Premia Cycle?
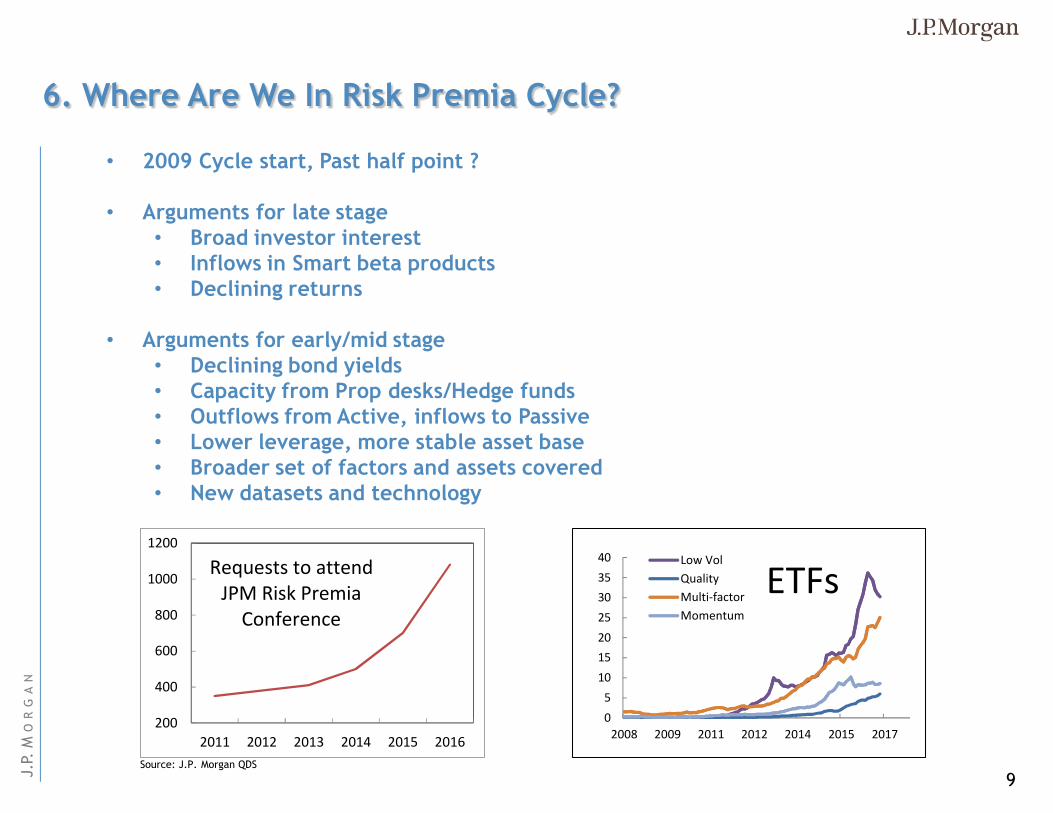
• 2009 Cycle start, Past half point ?
• Arguments for late stage• Broad investor interest• Inflows in Smart beta products• Declining returns
• Arguments for early/mid stage• Declining bond yields• Capacity from Prop desks/Hedge funds• Outflows from Active, inflows to Passive• Lower leverage, more stable asset base• Broader set of factors and assets covered• New datasets and technology
200
400
600
800
1000
1200
2011 2012 2013 2014 2015 2016
Requests to attend JPM Risk Premia
Conference
0
5
10
15
20
25
30
35
40
2008 2009 2011 2012 2014 2015 2017
Low Vol
Quality
Multi-factor
Momentum
ETFs
Source: J.P. Morgan QDS
J.P.
MO
RG
AN
10
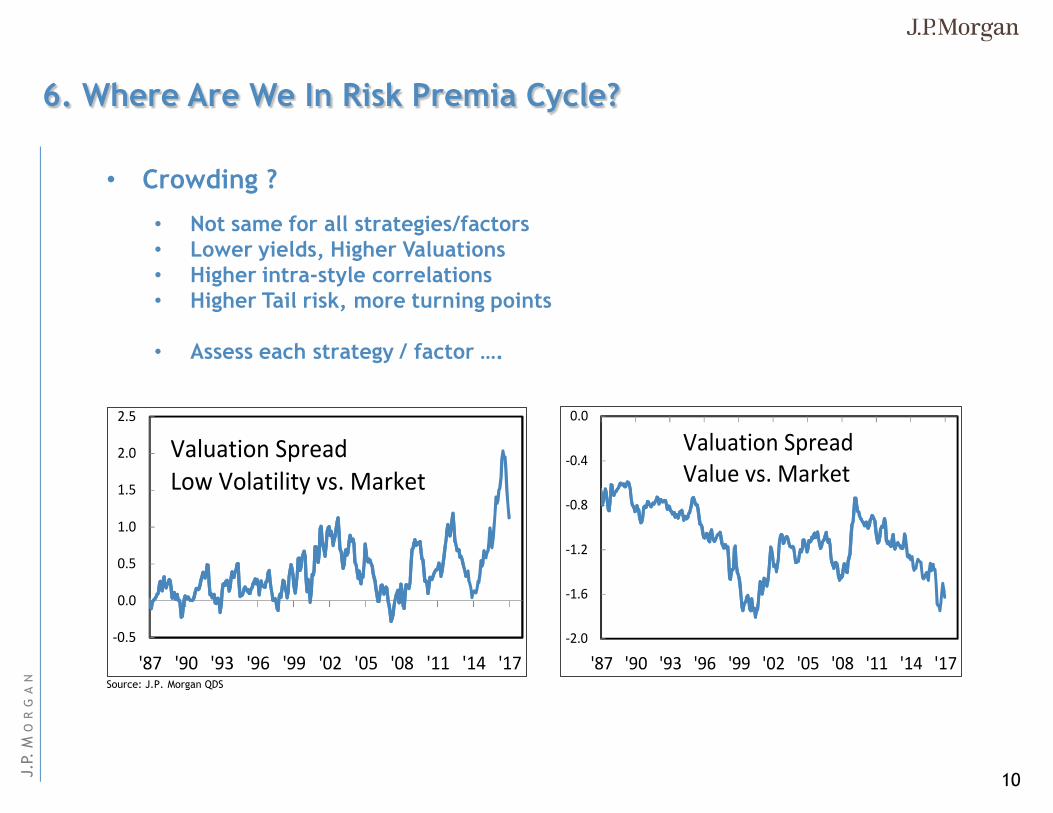
• Crowding ?
• Not same for all strategies/factors• Lower yields, Higher Valuations• Higher intra-style correlations• Higher Tail risk, more turning points
• Assess each strategy / factor ….
6. Where Are We In Risk Premia Cycle?
-0.5
0.0
0.5
1.0
1.5
2.0
2.5
'87 '90 '93 '96 '99 '02 '05 '08 '11 '14 '17
Valuation SpreadLow Volatility vs. Market
-2.0
-1.6
-1.2
-0.8
-0.4
0.0
'87 '90 '93 '96 '99 '02 '05 '08 '11 '14 '17
Valuation SpreadValue vs. Market
Source: J.P. Morgan QDS

J.P.
MO
RG
AN
11
7. Timing vs. Passive Approach
• Right approach likely a mix (e.g. 70/30)• Most relevant late cycle• Crowding, Valuations, Turning points• 2009 interest (when least needed)• Currently ~85% vs. ~15%
• Assessing Turning points• Importance of Macro and Fundamental
Source: J.P. Morgan QDS
J.P.
MO
RG
AN
12
8. Changes in Marketplace: Macro
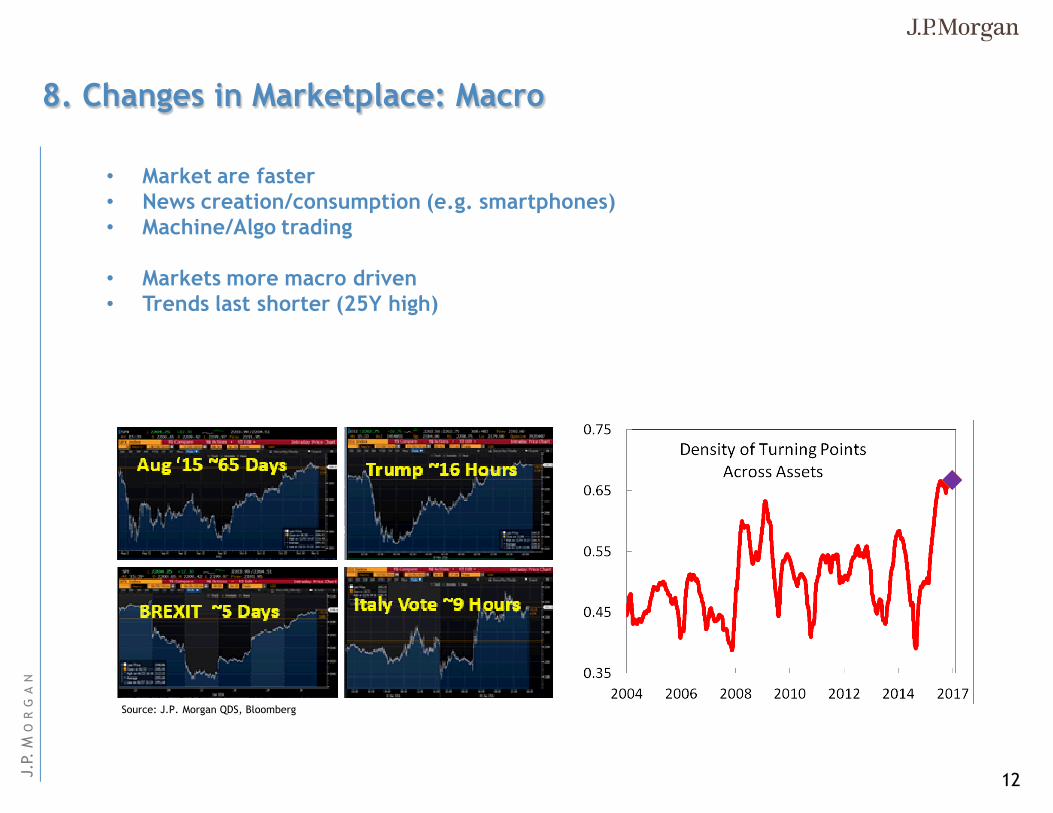
• Market are faster• News creation/consumption (e.g. smartphones) • Machine/Algo trading
• Markets more macro driven• Trends last shorter (25Y high)
Source: J.P. Morgan QDS, Bloomberg
J.P.
MO
RG
AN
13
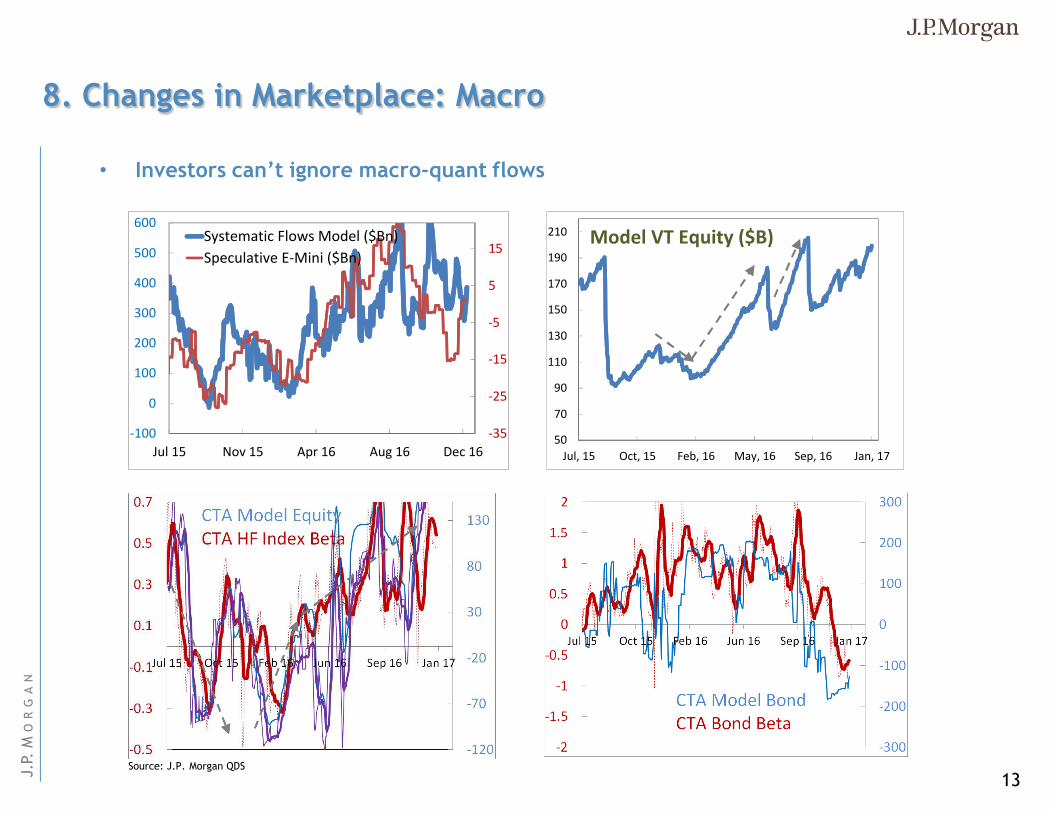
8. Changes in Marketplace: Macro
• Investors can’t ignore macro-quant flows
50
70
90
110
130
150
170
190
210
Jul, 15 Oct, 15 Feb, 16 May, 16 Sep, 16 Jan, 17
Model VT Equity ($B)
-35
-25
-15
-5
5
15
-100
0
100
200
300
400
500
600
Jul 15 Nov 15 Apr 16 Aug 16 Dec 16
Systematic Flows Model ($Bn)
Speculative E-Mini ($Bn)
Source: J.P. Morgan QDS
J.P.
MO
RG
AN
14
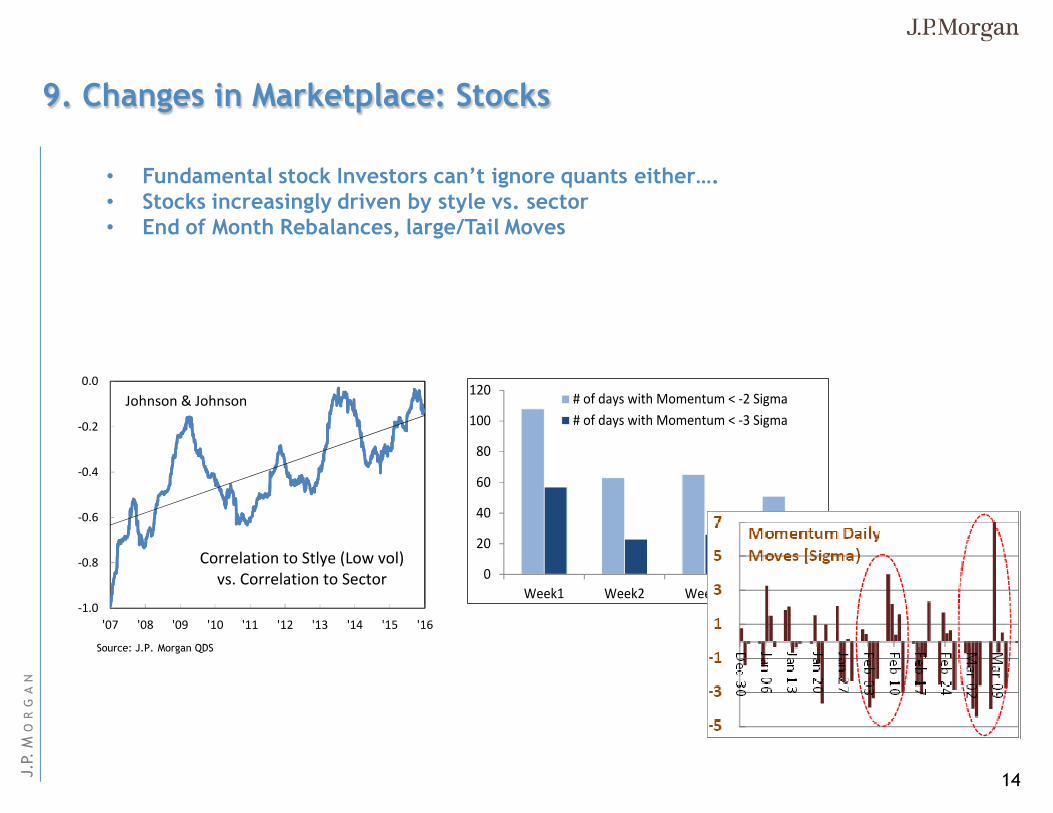
9. Changes in Marketplace: Stocks
• Fundamental stock Investors can’t ignore quants either….• Stocks increasingly driven by style vs. sector• End of Month Rebalances, large/Tail Moves
-1.0
-0.8
-0.6
-0.4
-0.2
0.0
'07 '08 '09 '10 '11 '12 '13 '14 '15 '16
Johnson & Johnson
Correlation to Stlye (Low vol) vs. Correlation to Sector 0
20
40
60
80
100
120
Week1 Week2 Week3 Week4
# of days with Momentum < -2 Sigma
# of days with Momentum < -3 Sigma
Source: J.P. Morgan QDS
J.P.
MO
RG
AN
15
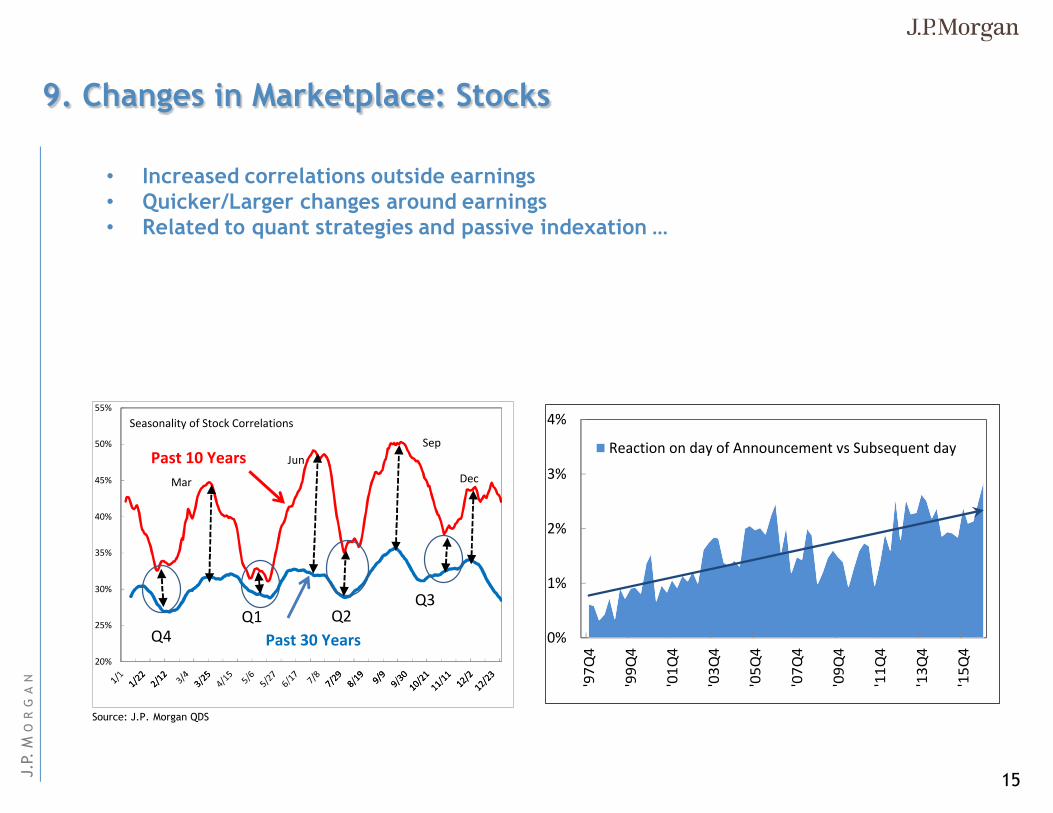
9. Changes in Marketplace: Stocks
• Increased correlations outside earnings• Quicker/Larger changes around earnings• Related to quant strategies and passive indexation …
20%
25%
30%
35%
40%
45%
50%
55%
Q4
Q3Q2Q1
Mar
Jun
Sep
Dec
Seasonality of Stock Correlations
Past 10 Years
Past 30 Years 0%
1%
2%
3%
4%
'97
Q4
'99
Q4
'01
Q4
'03
Q4
'05
Q4
'07
Q4
'09
Q4
'11
Q4
'13
Q4
'15
Q4
Reaction on day of Announcement vs Subsequent day
Source: J.P. Morgan QDS
J.P.
MO
RG
AN
16
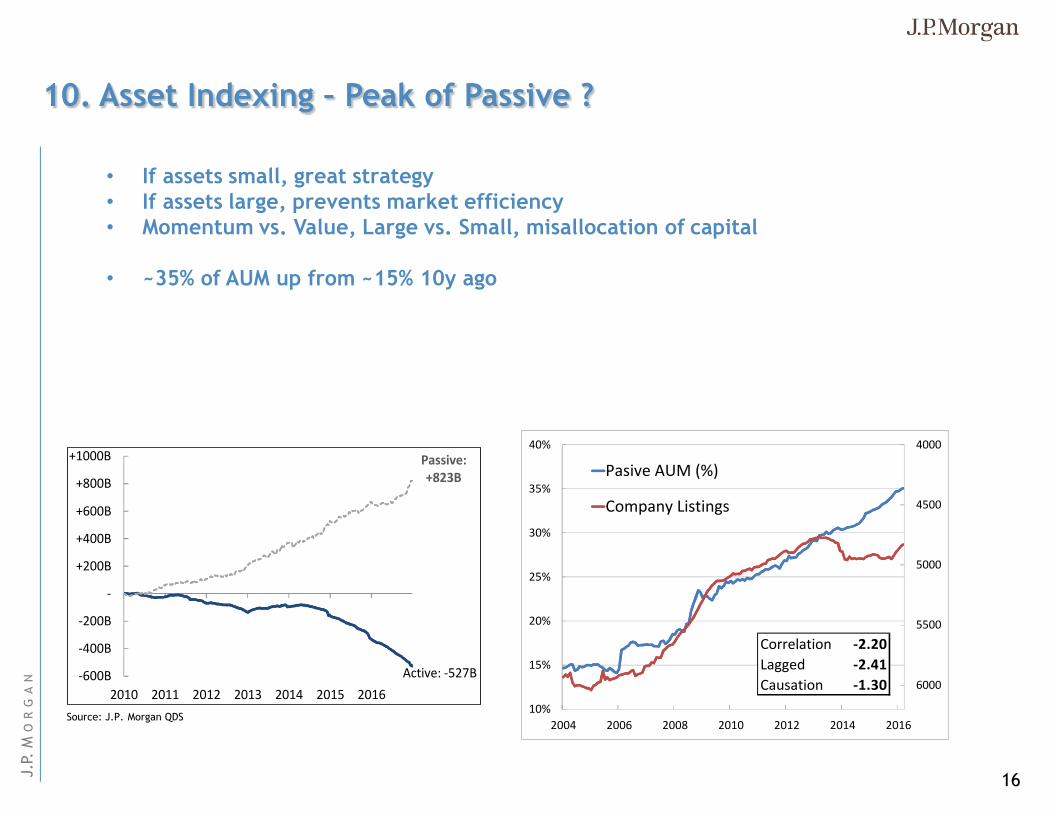
10. Asset Indexing – Peak of Passive ?
• If assets small, great strategy• If assets large, prevents market efficiency• Momentum vs. Value, Large vs. Small, misallocation of capital
• ~35% of AUM up from ~15% 10y ago
4000
4500
5000
5500
6000
10%
15%
20%
25%
30%
35%
40%
2004 2006 2008 2010 2012 2014 2016
Pasive AUM (%)
Company Listings
Correlation -2.20
Lagged -2.41
Causation -1.30Active: -527B
Passive: +823B
-600B
-400B
-200B
-
+200B
+400B
+600B
+800B
+1000B
2010 2011 2012 2013 2014 2015 2016
Source: J.P. Morgan QDS
J.P.
MO
RG
AN
17
11. Information Indexing
• Information Indexing• Can lead to Incorrect Consensus
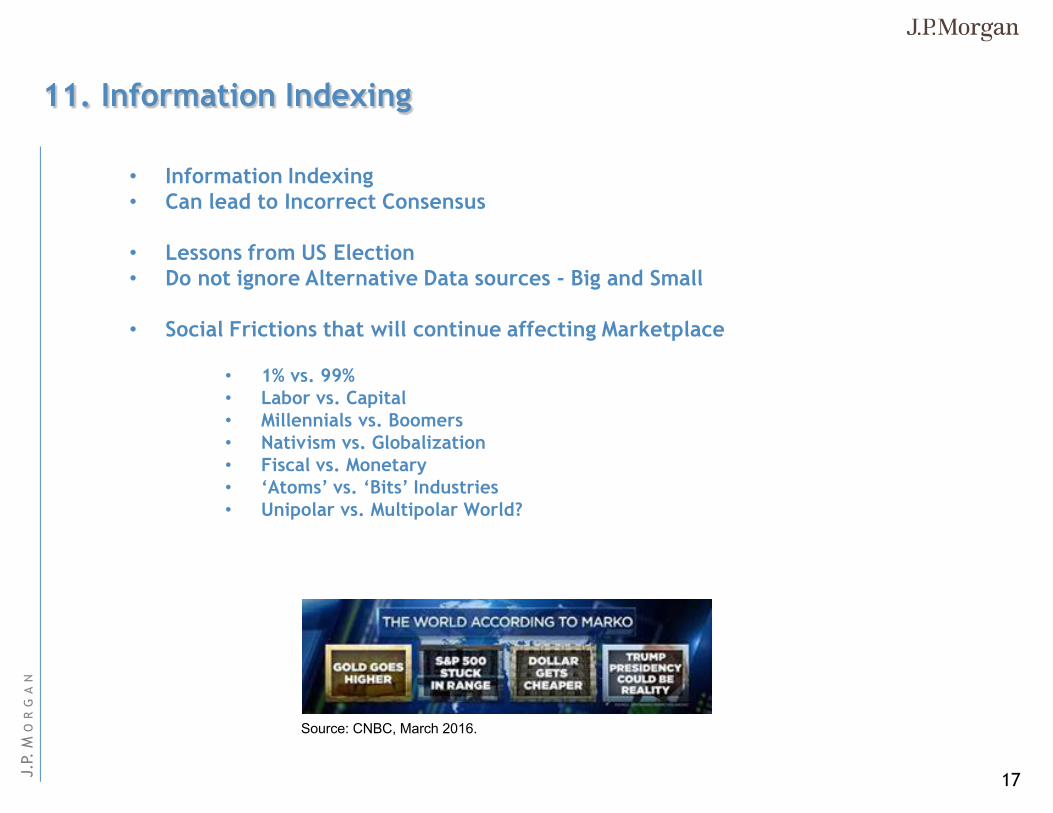
• Lessons from US Election• Do not ignore Alternative Data sources - Big and Small
• Social Frictions that will continue affecting Marketplace
• 1% vs. 99%• Labor vs. Capital• Millennials vs. Boomers• Nativism vs. Globalization• Fiscal vs. Monetary• ‘Atoms’ vs. ‘Bits’ Industries• Unipolar vs. Multipolar World?
Source: CNBC, March 2016.
J.P.
MO
RG
AN
18
12. Big Data
• Big / Alternative Data• Human Generated (social media, internet search, etc.)• Process Generated (credit card data, e-receipts, order book, etc.)• Machine Generated (geolocation, satellite imaging, foot traffic, etc.)
• Vast amount data generated• Computing power, storage, new algorithms• Calibration to tradeable signals
• How much alpha is there ?• Who gets data and what is priced in ?
• Will machine make us redundant?• Winograd’s test
• The instrument doesn’t fit into the suitcase because it’s too small
• The city councilmen refused the demonstrators a permit because they feared violence
J.P.
MO
RG
AN
19
12. Big Data
• Computers excel in steady state (e.g. market making, statistical arbitrage), quickly solving defined problems (e.g. comparing earnings releases)
• Not good in regime changes (turning points) or long time horizons. Macro involves: politicians, central bankers, terrorist, investors, and insights into their thinking process (Winograd’s test).
• Computers will dominate short term, humans will be needed to identify problems, calibrate, think macro and assess regime changes.
J.P.
MO
RG
AN
20
Risks of Common Option StrategiesRisks to Strategies: Not all option strategies are suitable for investors; certain strategies may expose investors to significant potential losses. We have summarized the risks of selected derivative strategies. For additional risk information, please call your sales representative for a copy of “Characteristics and Risks of Standardized Options.” We advise investors to consult their tax advisors and legal counsel about the tax implications of these strategies. Please also refer to option risk disclosure documents.
Put Sale. Investors who sell put options will own the underlying asset if the asset’s price falls below the strike price of the put option. Investors, therefore, will be exposed to any decline in the underlying asset’s price below the strike potentially to zero, and they will not participate in any price appreciation in the underlying asset if the option expires unexercised.
Call Sale. Investors who sell uncovered call options have exposure on the upside that is theoretically unlimited.
Call Overwrite or Buywrite. Investors who sell call options against a long position in the underlying asset give up any appreciation in the underlying asset’s price above the strike price of the call option, and they remain exposed to the downside of the underlying asset in the return for the receipt of the option premium.
Booster. In a sell-off, the maximum realized downside potential of a double-up booster is the net premium paid. In a rally, option losses are potentially unlimited as the investor is net short a call. When overlaid onto a long position in the underlying asset, upside losses are capped (as for a covered call), but downside losses are not.
Collar. Locks in the amount that can be realized at maturity to a range defined by the put and call strike. If the collar is not costless, investors risk losing 100% of the premium paid. Since investors are selling a call option, they give up any price appreciation in the underlying asset above the strike price of the call option.
Call Purchase. Options are a decaying asset, and investors risk losing 100% of the premium paid if the underlying asset’s price is below the strike price of the call option.
Put Purchase. Options are a decaying asset, and investors risk losing 100% of the premium paid if the underlying asset’s price is above the strike price of the put option.
Straddle or Strangle. The seller of a straddle or strangle is exposed to increases in the underlying asset’s price above the call strike and declines in the underlying asset’s price below the put strike. Since exposure on the upside is theoretically unlimited, investors who also own the underlying asset would have limited losses should the underlying asset rally. Covered writers are exposed to declines in the underlying asset position as well as any additional exposure should the underlying asset decline below the strike price of the put option. Having sold a covered call option, the investor gives up all appreciation in the underlying asset above the strike price of the call option.
Put Spread. The buyer of a put spread risks losing 100% of the premium paid. The buyer of higher-ratio put spread has unlimited downside below the lower strike (down to zero), dependent on the number of lower-struck puts sold. The maximum gain is limited to the spread between the two put strikes, when the underlying is at the lower strike. Investors who own the underlying asset will have downside protection between the higher-strike put and the lower-strike put. However, should the underlying asset’s price fall below the strike price of the lower-strike put, investors regain exposure to the underlying asset, and this exposure is multiplied by the number of puts sold.
Call Spread. The buyer risks losing 100% of the premium paid. The gain is limited to the spread between the two strike prices. The seller of a call spread risks losing an amount equal to the spread between the two call strikes less the net premium received. By selling a covered call spread, the investor remains exposed to the downside of the underlying asset and gives up the spread between the two call strikes should the underlying asset rally.
Butterfly Spread. A butterfly spread consists of two spreads established simultaneously – one a bull spread and the other a bear spread. The resulting position is neutral, that is, the investor will profit if the underlying is stable. Butterfly spreads are established at a net debit. The maximum profit will occur at the middle strike price; the maximum loss is the net debit.
Pricing Is Illustrative Only: Prices quoted in the above trade ideas are our estimate of current market levels, and are not indicative trading levels
J.P.
MO
RG
AN
21
DisclosuresThis report is a product of the research department's Global Equity Derivatives and Quantitative Strategy group. Views expressed may differ from the views of the research analysts covering stocks or sectors mentioned in this report. Structured securities, options, futures and other derivatives are complex instruments, may involve a high degree of risk, and may be appropriate investments only for sophisticated investors who are capable of understanding and assuming the risks involved. Because of the importance of tax considerations to many option transactions, the investor considering options should consult with his/her tax advisor as to how taxes affect the outcome of contemplated option transactions.
Analyst Certification: The research analyst(s) denoted by an “AC” on the cover of this report certifies (or, where multiple research analysts are primarily responsible for this report, the research analyst denoted by an “AC” on the cover or within the document individually certifies, with respect to each security or issuer that the research analyst covers in this research) that: (1) all of the views expressed in this report accurately reflect his or her personal views about any and all of the subject securities or issuers; and (2) no part of any of the research analyst's compensation was, is, or will be directly or indirectly related to the specific recommendations or views expressed by the research analyst(s) in this report. For all Korea-based research analysts listed on the front cover, they also certify, as per KOFIA requirements, that their analysis was made in good faith and that the views reflect their own opinion, without undue influence or intervention.
Important Disclosures
Company-Specific Disclosures: Important disclosures, including price charts and credit opinion history tables, are available for compendium reports and all J.P. Morgan–covered companies by visiting https://jpmm.com/research/disclosures, calling 1-800-477-0406, or e-mailing [email protected] with your request. J.P. Morgan’s Strategy, Technical, and Quantitative Research teams may screen companies not covered by J.P. Morgan. For important disclosures for these companies, please call 1-800-477-0406 or e-mail [email protected].
Explanation of Equity Research Ratings, Designations and Analyst(s) Coverage Universe: J.P. Morgan uses the following rating system: Overweight [Over the next six to twelve months, we expect this stock will outperform the average total return of the stocks in the analyst’s (or the analyst’s team’s) coverage universe.] Neutral [Over the next six to twelve months, we expect this stock will perform in line with the average total return of the stocks in the analyst’s (or the analyst’s team’s) coverage universe.] Underweight [Over the next six to twelve months, we expect this stock will underperform the average total return of the stocks in the analyst’s (or the analyst’s team’s) coverage universe.] Not Rated (NR): J.P. Morgan has removed the rating and, if applicable, the price target, for this stock because of either a lack of a sufficient fundamental basis or for legal, regulatory or policy reasons. The previous rating and, if applicable, the price target, no longer should be relied upon. An NR designation is not a recommendation or a rating. In our Asia (ex-Australia) and U.K. small- and mid-cap equity research, each stock’s expected total return is compared to the expected total return of a benchmark country market index, not to those analysts’ coverage universe. If it does not appear in the Important Disclosures section of this report, the certifying analyst’s coverage universe can be found on J.P. Morgan’s research website, www.jpmorganmarkets.com.
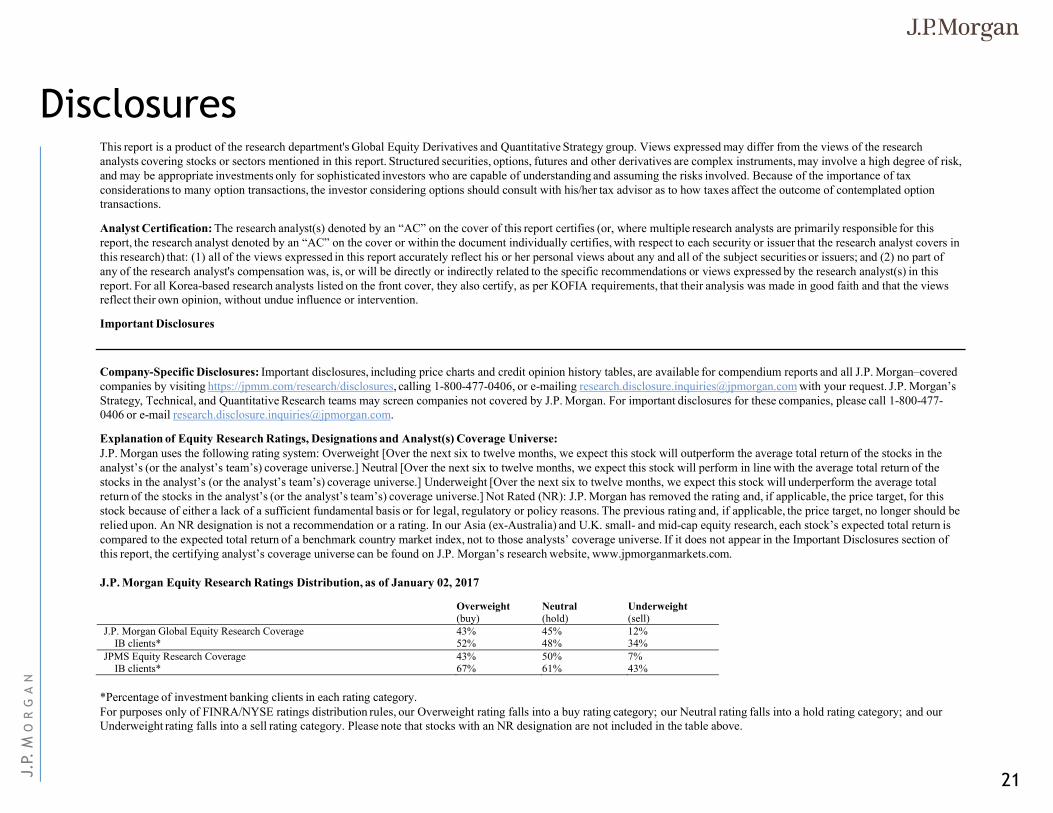
J.P. Morgan Equity Research Ratings Distribution, as of January 02, 2017
*Percentage of investment banking clients in each rating category.For purposes only of FINRA/NYSE ratings distribution rules, our Overweight rating falls into a buy rating category; our Neutral rating falls into a hold rating category; and our Underweight rating falls into a sell rating category. Please note that stocks with an NR designation are not included in the table above.
Overweight(buy)
Neutral(hold)
Underweight(sell)
J.P. Morgan Global Equity Research Coverage 43% 45% 12% IB clients* 52% 48% 34%JPMS Equity Research Coverage 43% 50% 7% IB clients* 67% 61% 43%
J.P.
MO
RG
AN
22
DisclosuresEquity Valuation and Risks: For valuation methodology and risks associated with covered companies or price targets for covered companies, please see the most recent company-specific research report at http://www.jpmorganmarkets.com, contact the primary analyst or your J.P. Morgan representative, or email [email protected].
Equity Analysts' Compensation: The equity research analysts responsible for the preparation of this report receive compensation based upon various factors, including the quality and accuracy of research, client feedback, competitive factors, and overall firm revenues.
Other Disclosures
J.P. Morgan ("JPM") is the global brand name for J.P. Morgan Securities LLC ("JPMS") and its affiliates worldwide. J.P. Morgan Cazenove is a marketing name for the U.K. investment banking businesses and EMEA cash equities and equity research businesses of JPMorgan Chase & Co. and its subsidiaries.
All research reports made available to clients are simultaneously available on our client website, J.P. Morgan Markets. Not all research content is redistributed, e-mailed or made available to third-party aggregators. For all research reports available on a particular stock, please contact your sales representative.
Options related research: If the information contained herein regards options related research, such information is available only to persons who have received the proper option risk disclosure documents. For a copy of the Option Clearing Corporation's Characteristics and Risks of Standardized Options, please contact your J.P. Morgan Representative or visit the OCC's website at http://www.optionsclearing.com/publications/risks/riskstoc.pdf
Legal Entities Disclosures U.S.: JPMS is a member of NYSE, FINRA, SIPC and the NFA. JPMorgan Chase Bank, N.A. is a member of FDIC. U.K.: JPMorgan Chase N.A., London Branch, is authorised by the Prudential Regulation Authority and is subject to regulation by the Financial Conduct Authority and to limited regulation by the Prudential Regulation Authority. Details about the extent of our regulation by the Prudential Regulation Authority are available from J.P. Morgan on request. J.P. Morgan Securities plc (JPMS plc) is a member of the London Stock Exchange and is authorised by the Prudential Regulation Authority and regulated by the Financial Conduct Authority and the Prudential Regulation Authority. Registered in England & Wales No. 2711006. Registered Office 25 Bank Street, London, E14 5JP. South Africa: J.P. Morgan Equities South Africa Proprietary Limited is a member of the Johannesburg Securities Exchange and is regulated by the Financial Services Board. Hong Kong: J.P. Morgan Securities (Asia Pacific) Limited (CE number AAJ321) is regulated by the Hong Kong Monetary Authority and the Securities and Futures Commission in Hong Kong and/or J.P. Morgan Broking (Hong Kong) Limited (CE number AAB027) is regulated by the Securities and Futures Commission in Hong Kong. Korea: This material is issued and distributed in Korea by or through J.P. Morgan Securities (Far East) Limited, Seoul Branch, which is a member of the Korea Exchange(KRX) and is regulated by the Financial Services Commission (FSC) and the Financial Supervisory Service (FSS). Australia: J.P. Morgan Australia Limited (JPMAL) (ABN 52 002 888 011/AFS Licence No: 238188) is regulated by ASIC and J.P. Morgan Securities Australia Limited (JPMSAL) (ABN 61 003 245 234/AFS Licence No: 238066) is regulated by ASIC and is a Market, Clearing and Settlement Participant of ASX Limited and CHI-X. Taiwan: J.P.Morgan Securities (Taiwan) Limited is a participant of the Taiwan Stock Exchange (company-type) and regulated by the Taiwan Securities and Futures Bureau. India: J.P. Morgan India Private Limited (Corporate Identity Number - U67120MH1992FTC068724), having its registered office at J.P. Morgan Tower, Off. C.S.T. Road, Kalina, Santacruz - East, Mumbai – 400098, is registered with Securities andExchange Board of India (SEBI) as a ‘Research Analyst’ having registration number INH000001873. J.P. Morgan India Private Limited is also registered with SEBI as a member of the National Stock Exchange of India Limited (SEBI Registration Number - INB 230675231/INF 230675231/INE 230675231) and Bombay Stock Exchange Limited (SEBI Registration Number - INB 010675237/INF 010675237). Telephone: 91-22-6157 3000, Facsimile: 91-22-6157 3990 and Website: www.jpmipl.com. For non local research reports, this material is not distributed in India by J.P. Morgan India Private Limited. Thailand: This material is issued and distributed in Thailand by JPMorgan Securities (Thailand) Ltd., which is a member of the Stock Exchange of Thailand and is regulated by the Ministry of Finance and the Securities and Exchange Commission and its registered address is 3rd Floor, 20 North Sathorn Road, Silom, Bangrak, Bangkok 10500. Indonesia: PT J.P. Morgan Securities Indonesia is a member of the Indonesia Stock Exchange and is regulated by the OJK a.k.a. BAPEPAM LK. Philippines: J.P. Morgan Securities Philippines Inc. is a Trading Participant of the Philippine Stock Exchange and a member of the Securities Clearing Corporation of the Philippines and the Securities Investor Protection Fund. It is regulated by the Securities and Exchange Commission. Brazil: Banco J.P. Morgan S.A. is regulated by the Comissao de Valores Mobiliarios (CVM) and by the Central Bank of Brazil. Mexico: J.P. Morgan Casa de Bolsa, S.A. de C.V., J.P. Morgan GrupoFinanciero is a member of the Mexican Stock Exchange and authorized to act as a broker dealer by the National Banking and Securities Exchange Commission. Singapore: This material is issued and distributed in Singapore by or through J.P. Morgan Securities Singapore Private Limited (JPMSS) [MCI (P) 193/03/2016 and Co. Reg. No.: 199405335R], which is a member of the Singapore Exchange Securities Trading Limited and/or JPMorgan Chase Bank, N.A., Singapore branch (JPMCB Singapore) [MCI (P) 089/09/2016], both of which are regulated by the Monetary Authority of Singapore. Thismaterial is issued and distributed in Singapore only to accredited investors, expert investors and institutional investors, as defined in Section 4A of the Securities and Futures Act, Cap. 289 (SFA). This material is not intended to be issued or distributed to any retail investors or any other investors that do not fall into the classes of “accredited investors,” “expert investors” or “institutional investors,” asdefined under Section 4A of the SFA. Recipients of this document are to contact JPMSS or JPMCB Singapore in respect of any matters arising from, or in connection with, the document. Japan: JPMorgan Securities Japan Co., Ltd. and JPMorgan Chase Bank, N.A., Tokyo Branch are regulated by the Financial Services Agency in Japan. Malaysia: This material is issued and distributed in
J.P.
MO
RG
AN
23
DisclosuresMalaysia by JPMorgan Securities (Malaysia) Sdn Bhd (18146-X) which is a Participating Organization of Bursa Malaysia Berhad and a holder of Capital Markets Services License issued by the Securities Commission in Malaysia. Pakistan: J. P. Morgan Pakistan Broking (Pvt.) Ltd is a member of the Karachi Stock Exchange and regulated by the Securities and Exchange Commission of Pakistan. Saudi Arabia: J.P. Morgan Saudi Arabia Ltd. is authorized by the Capital Market Authority of the Kingdom of Saudi Arabia (CMA) to carry out dealing as an agent, arranging, advising and custody, with respect to securities business under licence number 35-07079 and its registered address is at 8th Floor, Al-Faisaliyah Tower, King Fahad Road, P.O. Box 51907, Riyadh 11553, Kingdom of Saudi Arabia. Dubai: JPMorgan Chase Bank, N.A., Dubai Branch is regulated by the Dubai Financial Services Authority (DFSA) and its registered address is Dubai International Financial Centre -Building 3, Level 7, PO Box 506551, Dubai, UAE.
Country and Region Specific Disclosures U.K. and European Economic Area (EEA): Unless specified to the contrary, issued and approved for distribution in the U.K. and the EEA by JPMS plc. Investment research issued by JPMS plc has been prepared in accordance with JPMS plc's policies for managing conflicts of interest arising as a result of publication and distribution of investment research. Many European regulators require a firm to establish, implement and maintain such a policy. Further information about J.P. Morgan's conflict of interest policy and a description of the effective internal organisations and administrative arrangements set up for the prevention and avoidance of conflicts of interest is set out at the following link https://www.jpmorgan.com/jpmpdf/1320678075935.pdf. This report has been issued in the U.K. only to persons of a kind described in Article 19 (5), 38, 47 and 49 of the Financial Services and Markets Act 2000 (Financial Promotion) Order 2005 (all such persons being referred to as "relevant persons"). This document must not be acted on or relied on by persons who are not relevant persons. Any investment or investment activity to which this document relates is only available to relevant persons and will be engaged in only with relevant persons. In other EEA countries, the report has been issued to persons regarded as professional investors (or equivalent) in their home jurisdiction. Australia: This material is issued and distributed by JPMSAL in Australia to "wholesale clients" only. This material does not take into account the specific investment objectives, financial situation or particular needs of the recipient. The recipient of this material must not distribute it to any third party or outside Australia without the prior written consent of JPMSAL. For the purposes of this paragraph the term "wholesale client" has the meaning given in section 761G of the Corporations Act 2001. Germany: This material is distributed in Germany by J.P. Morgan Securities plc, Frankfurt Branch which is regulated by the Bundesanstalt für Finanzdienstleistungsaufsicht. Hong Kong: The 1% ownership disclosure as of the previous month end satisfies the requirements under Paragraph 16.5(a) of the Hong Kong Code of Conduct for Persons Licensed by or Registered with the Securities and Futures Commission. (For research published within the first ten days of the month, the disclosure may be based on the month end data from two months prior.) J.P. Morgan Broking (Hong Kong) Limited is the liquidity provider/market maker for derivative warrants, callable bull bear contracts and stock options listed on the Stock Exchange of Hong Kong Limited. An updated list can be found on HKEx website: http://www.hkex.com.hk. Japan: There is a risk that a loss may occur due to a change in the price of the shares in the case of share trading, and that a loss may occur due to the exchange rate in the case of foreign share trading. In the case of share trading, JPMorgan Securities Japan Co., Ltd., will be receiving a brokerage fee and consumption tax (shouhizei) calculated by multiplying the executed price by the commission rate which was individually agreed between JPMorgan Securities Japan Co., Ltd., and the customer in advance. Financial Instruments Firms: JPMorgan Securities Japan Co., Ltd., Kanto Local Finance Bureau (kinsho) No. 82 Participating Association / Japan Securities Dealers Association, The Financial Futures Association of Japan, Type II Financial Instruments Firms Association and Japan Investment Advisers Association. Korea: This report may have been edited or contributed to from time to time by affiliates of J.P. Morgan Securities (Far East) Limited, Seoul Branch. Singapore: As at the date of this report, JPMSS is a designated market maker for certain structured warrants listed on the Singapore Exchange where the underlying securities may be the securities discussed in this report. Arising from its role as designated market maker for such structured warrants, JPMSS may conduct hedging activities in respect of such underlying securities and hold or have an interest in such underlying securities as a result. The updated list of structured warrants for which JPMSS acts as designated market maker may be found on the website of the Singapore Exchange Limited: http://www.sgx.com.sg. In addition, JPMSS and/or its affiliates may also have an interest or holding in any of the securities discussed in this report – please see the Important Disclosures section above. For securities where the holding is 1% or greater, the holding may be found in the Important Disclosures section above. For all other securities mentioned in this report, JPMSS and/or its affiliates may have a holding of less than 1% in such securities and may trade them in ways different from those discussed in this report. Employees of JPMSS and/or its affiliates not involved in the preparation of this report may have investments in the securities (or derivatives of such securities) mentioned in this report and may trade them in ways different from those discussed in this report. Taiwan: This material is issued and distributed in Taiwan by J.P. Morgan Securities (Taiwan) Limited. According to Paragraph 2, Article 7-1 of Operational Regulations Governing Securities Firms Recommending Trades in Securities to Customers (as amended or supplemented) and/or other applicable laws or regulations, please note that the recipient of this material is not permitted to engage in any activities in connection with the material which may give rise to conflicts of interests, unless otherwise disclosed in the “Important Disclosures” in this material. India: For private circulation only, not for sale. Pakistan: For private circulation only, not for sale. New Zealand: This material is issued and distributed by JPMSAL in New Zealand only to persons whose principal business is the investment of money or who, in the course of and for the purposes of their business, habitually invest money. JPMSAL does not issue or distribute this material to members of "the public" as determined in accordance with section 3 of the Securities Act 1978. The recipient of this material must not distribute it to any third party or outside New Zealand without the prior written consent of JPMSAL. Canada: The information contained herein is not, and under no circumstances is to be construed as, a prospectus, an advertisement, a public offering, an offer to sell securities described herein, or solicitation of an offer to buy securities described herein, in Canada or any province or territory thereof. Any offer or sale of the securities described herein in Canada will be made only under an exemption from the requirements to file a prospectus with the relevant Canadian securities regulators and only by a dealer properly registered under applicable securities laws or, alternatively, pursuant to an exemption from the dealer registration requirement in the relevant province or territory of Canada in which such offer or sale is made. The information contained herein is under no circumstances to be construed as investment advice in any province or territory of
J.P.
MO
RG
AN
24
DisclosuresCanada and is not tailored to the needs of the recipient. To the extent that the information contained herein references securities of an issuer incorporated, formed or created under the laws of Canada or a province or territory of Canada, any trades in such securities must be conducted through a dealer registered in Canada. No securities commission or similar regulatory authority in Canada has reviewed or in any way passed judgment upon these materials, the information contained herein or the merits of the securities described herein, and any representation to the contrary is an offence. Dubai: This report has been issued to persons regarded as professional clients as defined under the DFSA rules. Brazil: Ombudsman J.P. Morgan: 0800-7700847 / [email protected].
General: Additional information is available upon request. Information has been obtained from sources believed to be reliable but JPMorgan Chase & Co. or its affiliates and/or subsidiaries (collectively J.P. Morgan) do not warrant its completeness or accuracy except with respect to any disclosures relative to JPMS and/or its affiliates and the analyst's involvement with the issuer that is the subject of the research. All pricing is indicative as of the close of market for the securities discussed, unless otherwise stated. Opinions and estimates constitute our judgment as of the date of this material and are subject to change without notice. Past performance is not indicative of future results. This material is not intended as an offer or solicitation for the purchase or sale of any financial instrument. The opinions and recommendations herein do not take into account individual client circumstances, objectives, or needs and are not intended as recommendations of particular securities, financial instruments or strategies to particular clients. The recipient of this report must make its own independent decisions regarding any securities or financial instruments mentioned herein. JPMS distributes in the U.S. research published by non-U.S. affiliates and accepts responsibility for its contents. Periodic updates may be provided on companies/industries based on company specific developments or announcements, market conditions or any other publicly available information. Clients should contact analysts and execute transactions through a J.P. Morgan subsidiary or affiliate in their home jurisdiction unless governing law permits otherwise.
"Other Disclosures" last revised January 07, 2017.
Copyright 2017 JPMorgan Chase & Co. All rights reserved. This report or any portion hereof may not be reprinted, sold or redistributed without the written consent of J.P. Morgan. #$J&098$#*P