dairy development in kenya - fao.org · dairy reports dairy development in kenya h.g. muriuki food...
TRANSCRIPT
DAIRYREPORTS
DAIRY DEVELOPMENT IN KENYA

DAIRYREPORTS
DAIRY DEVELOPMENT IN KENYA
H.G. Muriuki
FOOD AND AGRICULTURE ORGANIZATION OF THE UNITED NATIONS Rome, 2011
The designations employed and the presentation of material in this information product do not imply the expression of any opinion whatsoever on the part of the Food and Agriculture Organization of the United Nations (FAO) concerning the legal or development status of any country, territory, city or area or of its authorities, or concerning the delimitation of its frontiers or boundaries. The mention of specific companies or products of manufacturers, whether or not these have been patented, does not imply that these have been endorsed or recommended by FAO in preference to others of a similar nature that are not mentioned.
The views expressed in this information product are those of the author(s) and do not necessarily reflect the views of FAO.
All rights reserved. FAO encourages the reproduction and dissemination of material in this information product. Non-commercial uses will be authorized free of charge, upon request. Reproduction for resale or other commercial purposes, including educational purposes, may incur fees. Applications for permission to reproduce or disseminate FAO copyright materials, and all queries concerning rights and licences, should be addressed by e-mail to [email protected] or to the Chief,Publishing Policy and Support BranchOffice of Knowledge Exchange, Research and ExtensionFAOViale delle Terme di Caracalla,00153 RomeItaly
© FAO, 2011
AuthorHG Muriuki is an agricultural economist and dairy development and policy expert with over thirty years of working experience in the Kenyan livestock and dairy sector. He has also worked in other countries of the East African region.
Recommended CitationFAO. 2011. Dairy development in Kenya, by H.G. Muriuki. Rome.
KeywordsProduction systems, Dairy value chain, Dairy institutions, Product safety, Livelihoods, Employment
i
DAIRYREPORTS
Contents
Preface iiiExecutive Summary ivAcronyms vCurrency equivalent, weight and measures vi
1. INTRODUCTION 1
2. INDUSTRY PLAYERS 2
3. POLICY AND REGULATORY ENVIRONMENT 4
4. CHARACTERIZATION OF THE MILK PRODUCTION SYSTEM 54.1 Population and distribution 54.2 Milk production systems 74.3 Dairy cattle breeding 74.4 Genetic diversity of the dairy herd 74.5 Dairy cattle feeding 94.6 Milk utilization and losses at the farm level 94.7 Demand and preferences for milk and dairy products 11
5. ANALYSIS OF THE DAIRY VALUE CHAIN 135.1 Collection, bulking and transportation 135.2 Unprocessed milk trade 145.3 Formal milk trade 145.4 Milk distribution and retailing 155.5 Milk and dairy productsexports and imports 16
6. SAFETY OF MILK AND DAIRY PRODUCTS 19
7. DAIRY PRODUCTION AND THE ENVIRONMENT 207.1 Environmental concern in the dairy industry 20
8. EMPLOYMENT IN THE DAIRY SECTOR 21
9. DAIRY INSTITUTIONS 22
10. CHALLENGES/PROBLEMS AND RECOMMENDATIONS 24
11. DISCUSSION AND CONCLUSIONS 25
References 26
Annexes1. Agro-climatic zones in Kenya 282. Dairy Animal population - 2001 to 2007 (in thousands) 293. AI services Data - 1948 to 2006 (in thousands) and price of whole milk
at farm level (1996-2007) 314. Milk production and home consumption/retention by district (litres per capita, 1981/2) 335. Milk intake in the formal markets 34

DAIRYREPORTS
ii Dairy development in Kenya
6. Milk safety related legislatyion and standards 367. Milk value chain actors 41
TABLES1: Numbers of dairy cooperative societies and membership (2000 to 2006) 32: Population of milk animals (2007) 53: Population of milk animals and percentage contributions to annual milk production (2007). 54: Dairy cattle population, by province (1998 to 2007, thousands) 65: Numbers of dairy cattle and average milk yields (2008) 96: Production trend for livestock feeds (1991 to 2006, tonnes) 107: Price elasticity of raw and pasteurized milk, by income group 118: Milk intakes for various processed products (1996 to 2006) 179: Proportions of unacceptable milk samples from raw milk traders 19
FIGURES1: Proportions of milk intake by different processors (2008) 22: Dairy cattle distribution and density 63: Distribution of the dairy cattle population by province (1998 to 2007) 74: AI of dairy cattle since 1988 85: Nominal price of whole milk (1996 to 2007, K Sh/litre) 86: Livestock and cattle feed production (thousand tonnes) 107: Milk production and consumption per capita (1981/1982, litres) 118: Average consumption of dairy products per household, per month, by income group 129: Production to consumption milk marketing channels 1310: Summary of KDB licences issued, by type of operator 1411: Milk intake by type of licence (2007 and 2008) 1512: Milk handled in the formal sector (1984 to 2008). 1613: Dairy imports and exports (2001 to 2005) 1714: Value of dairy imports and exports (2003 to 2006, million K Sh) 18
iii
DAIRYREPORTS
Preface
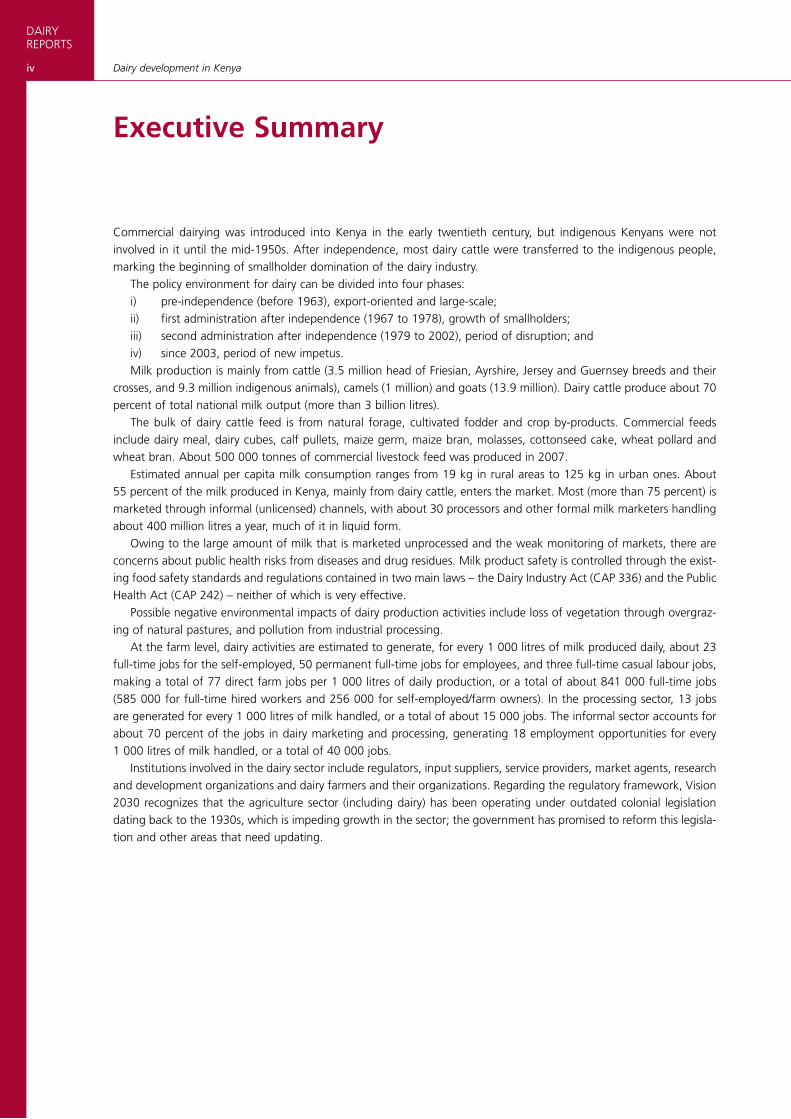
Over the last five decades the global dairy sector has seen substantive changes with major intensification, scaling-up and efficiency of production driven by demand from a growing human population and disposal incomes. This growth was achievable through the developments in animal breeding, nutrition, feed efficiency, animal health, housing and automation and supporting policies, strategies and organizations. Such changes are not however reflected across the whole dairy sector and while some developing countries have seen a major expansion in small-scale milk production, small-scale dairying in other countries has largely stagnated.
Dairying contributes positively to human wellbeing in a variety of different ways: nutrition through quality food products, income and employment, organic fertilizer as well as assets and savings. There are however negative aspects associated with dairying including its contribution to Green House Gases, pollution and waste disposal, food safety and human health, use of grains for feed, animal welfare and erosion of biodiversity. In order to inform the public and to make rational policy and investment decisions related to the dairy sector, it is essential to fully understand these complex interactions and their consequences.
This paper provides a review of these issues for the dairy sector of Kenya. We hope this paper will provide accurate and useful information to its readers and any feedback is welcome by the author and the Livestock Production Systems Branch (AGAS)1 or to the Rural Infrastructure and Agro-Industries Division (AGS)2 of the Food and Agriculture Organi-zation of the United Nations (FAO).
1 For more information visit the website of the FAO Animal Production and Health Division at: http://www.fao.org/ag/aga.html or contact Olaf
Thieme – Livestock Development Officer – Email: [email protected] For more information visit the website of the FAO Rural Infrastructure and Agro-Industries Division at: http://www.fao.org/ag/ags/ or contact
Anthony Bennett – Livestock Value Chains and Infrastructure Officer – Email: [email protected]
Food and Agriculture Organization Viale delle Terme di Caracalla 00153 Rome, Italy
DAIRYREPORTS
iv Dairy development in Kenya
Executive Summary
Commercial dairying was introduced into Kenya in the early twentieth century, but indigenous Kenyans were not involved in it until the mid-1950s. After independence, most dairy cattle were transferred to the indigenous people, marking the beginning of smallholder domination of the dairy industry.
The policy environment for dairy can be divided into four phases:i) pre-independence (before 1963), export-oriented and large-scale;ii) first administration after independence (1967 to 1978), growth of smallholders;iii) second administration after independence (1979 to 2002), period of disruption; andiv) since 2003, period of new impetus.Milk production is mainly from cattle (3.5 million head of Friesian, Ayrshire, Jersey and Guernsey breeds and their
crosses, and 9.3 million indigenous animals), camels (1 million) and goats (13.9 million). Dairy cattle produce about 70 percent of total national milk output (more than 3 billion litres).
The bulk of dairy cattle feed is from natural forage, cultivated fodder and crop by-products. Commercial feeds include dairy meal, dairy cubes, calf pullets, maize germ, maize bran, molasses, cottonseed cake, wheat pollard and wheat bran. About 500 000 tonnes of commercial livestock feed was produced in 2007.
Estimated annual per capita milk consumption ranges from 19 kg in rural areas to 125 kg in urban ones. About 55 percent of the milk produced in Kenya, mainly from dairy cattle, enters the market. Most (more than 75 percent) is marketed through informal (unlicensed) channels, with about 30 processors and other formal milk marketers handling about 400 million litres a year, much of it in liquid form.
Owing to the large amount of milk that is marketed unprocessed and the weak monitoring of markets, there are concerns about public health risks from diseases and drug residues. Milk product safety is controlled through the exist-ing food safety standards and regulations contained in two main laws – the Dairy Industry Act (CAP 336) and the Public Health Act (CAP 242) – neither of which is very effective.
Possible negative environmental impacts of dairy production activities include loss of vegetation through overgraz-ing of natural pastures, and pollution from industrial processing.
At the farm level, dairy activities are estimated to generate, for every 1 000 litres of milk produced daily, about 23 full-time jobs for the self-employed, 50 permanent full-time jobs for employees, and three full-time casual labour jobs, making a total of 77 direct farm jobs per 1 000 litres of daily production, or a total of about 841 000 full-time jobs (585 000 for full-time hired workers and 256 000 for self-employed/farm owners). In the processing sector, 13 jobs are generated for every 1 000 litres of milk handled, or a total of about 15 000 jobs. The informal sector accounts for about 70 percent of the jobs in dairy marketing and processing, generating 18 employment opportunities for every 1 000 litres of milk handled, or a total of 40 000 jobs.
Institutions involved in the dairy sector include regulators, input suppliers, service providers, market agents, research and development organizations and dairy farmers and their organizations. Regarding the regulatory framework, Vision 2030 recognizes that the agriculture sector (including dairy) has been operating under outdated colonial legislation dating back to the 1930s, which is impeding growth in the sector; the government has promised to reform this legisla-tion and other areas that need updating.
v
DAIRYREPORTS
Acronyms
ADC Agricultural Development CorporationAFC Agricultural Finance CorporationAI artificial inseminationASAL arid and semi-arid landCBO community-based organizationDFID Department for International Development (United Kingdom)DANIDA Danish International Development AgencyFAO Food and Agriculture Organization of United NationsGDP gross domestic productGHG greenhouse gasHSUS Humane Society of the United StatesIFAD International Fund for Agricultural Development ILRI International Livestock Research InstituteKARI Kenya Agricultural Research InstituteKNAIS Kenya National Artificial Insemination ServicesKCC Kenya Cooperative CreameriesKDB Kenya Dairy BoardKDMP Kenya Dairy Master Plan KEBS Kenya Bureau of StandardsK Sh Kenya shillingLME Liquid Milk EquivalentMOA Ministry of Agriculture MOCD Ministry of Cooperative DevelopmentMOH Ministry of HealthMOLD Ministry of Livestock DevelopmentNCC National Consultative CommitteeNDTI Naivasha Dairy Training InstituteNGO non-governmental organizationPCPB Pest Control Products BoardSDP Smallholder Dairy (Research and Development) ProjectSHG self-help groupSITE SITE Enterprise PromotionSME small and medium enterpriseSNV Netherlands Development OrganizationSOW-AnGR State of the World’s Animal Genetic Resources for Food and AgricultureTB tuberculosisUHT ultra-high temperature USAID United States Agency for International DevelopmentUSDA United States Department of AgricultureVVPC Veterinary Vaccine Production Centre

DAIRYREPORTS
vi Dairy development in Kenya
Currency equivalent, weights and measures
Currency Equivalent - April 2009Currency Unit - Kenya Shillings (KES)USD 1.00 - KES 79.9KES 100.00 - USD 1.25
Weights and Measures1 kilogramme (kg) - 2 204 lb.1,000 kg - 1 metric ton (mt)1 kilometre (km) - 0.62 mile1 metre (m) - 1.09 yards1 square metre (m2) - 10.76 square feet1 acre (ac) - 0.405 hectare (ha)1 hectare (ha) - 2.47 acres
1
DAIRYREPORTS
Chapter 1
Introduction
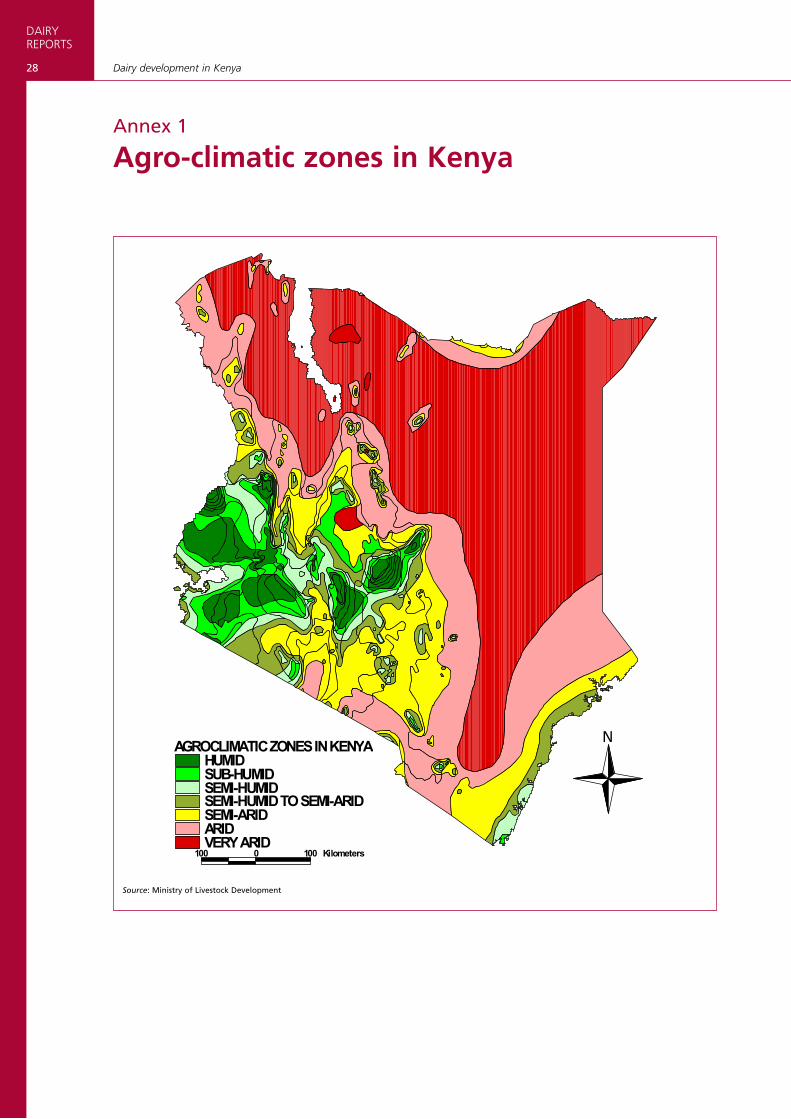
Kenya has a land area of 582 646 km2, most (80 percent) of which is arid and semi-arid land (ASAL) with very low potential. It has a population of more than 37 million people with 3 percent annual growth. The country has a varied climate ranging from warm and humid in the coastal area to cool temperatures in the highlands. Productivity potential can be divided into three categories: high potential, with annual rainfall of more than 858 mm; medium potential, with annual rainfall of between 735 and 858 mm; and low potential, with annual rainfall of less than 612 mm (Annex 1). Recently, rainfall has been erratic in most parts of the country, with frequent prolonged dry periods and occasional flooding.
Agriculture and forestry contribute more than 20 percent of gross domestic product (GDP), down from 27 percent in the 1990s and 22.7 percent in 2007. Livestock contributes 10 percent of total and 30 percent of agricultural GDP. Dairy products (excluding live animals) contribute 30 percent of livestock GDP and more than 22 percent of livestock gross marketed products.
Dairy’s main role in Kenya’s economy is its contribution to the livelihoods of the many people engaged throughout the value chain and to the nutritional well-being of many rural communities. Dairy has the potential to contribute more to national development goals, and a review of its development to date will shed light on and provide understanding of the sector’s growth needs, helping to make informed decisions.
DAIRYREPORTS
2 Dairy development in Kenya
Chapter 2
Industry Players
There are many players in the dairy sector: those offering services and inputs; industry facilitators and development partners; and the users of services/inputs.
Smallholder dairy farmers dominate the industry at the production level. There are more than 1 million smallholder dairy farmers, according to surveys done by the Smallholder Dairy (Research and Development) Project (SDP), contribut-ing more than 70 percent of gross marketed production from farms. In general, smallholders each have 3 to 5 acres (1.2 to 2.0 ha) of land – although some have slightly more than 20 acres (8 ha) and others less than 0.5 acre (0.2 ha) – and about two to five head of cattle yielding about 5 kg of milk per cow per day. Milk sales are low, at less than 10 kg per day. The use of inputs is low, but varies depending on community traditions and the level of market orientation.
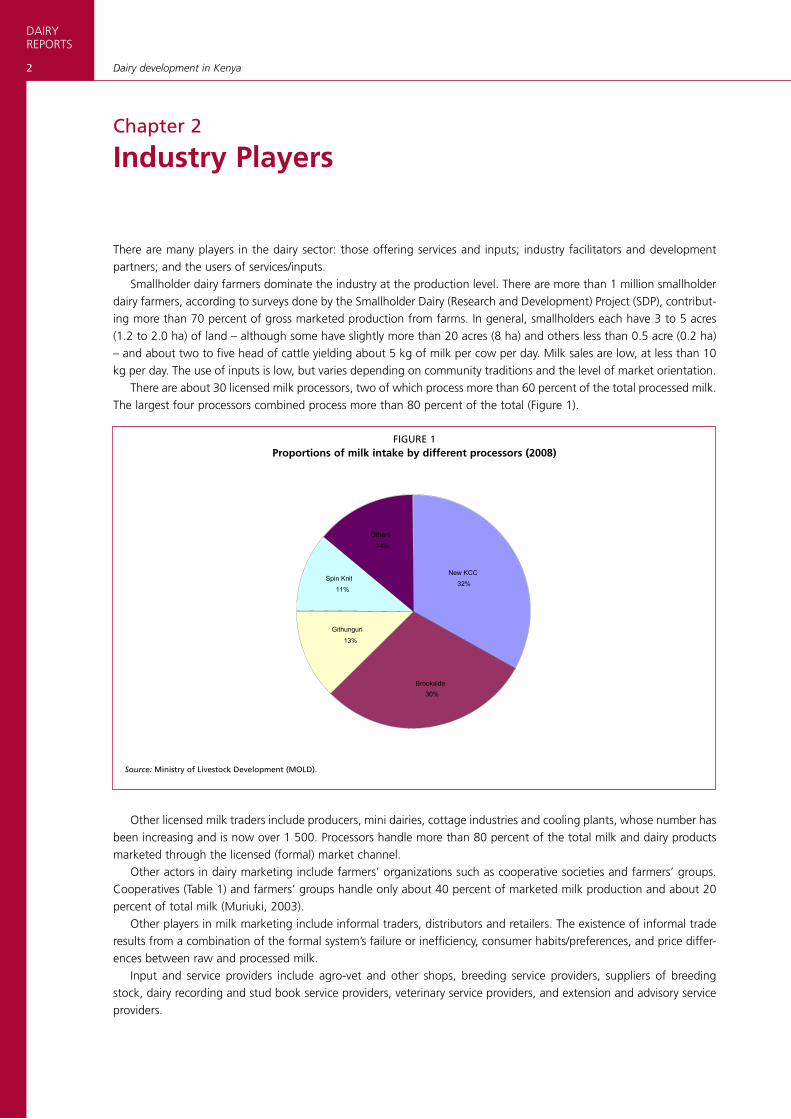
There are about 30 licensed milk processors, two of which process more than 60 percent of the total processed milk. The largest four processors combined process more than 80 percent of the total (Figure 1).
Other licensed milk traders include producers, mini dairies, cottage industries and cooling plants, whose number has been increasing and is now over 1 500. Processors handle more than 80 percent of the total milk and dairy products marketed through the licensed (formal) market channel.
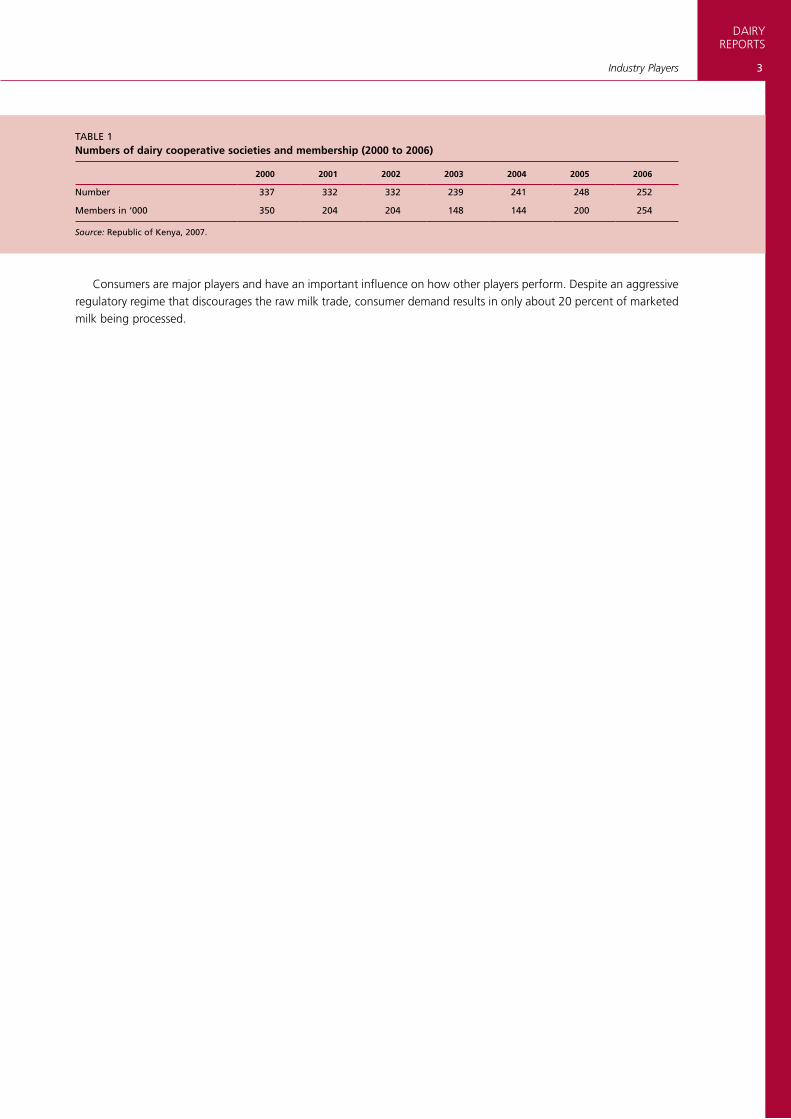
Other actors in dairy marketing include farmers’ organizations such as cooperative societies and farmers’ groups. Cooperatives (Table 1) and farmers’ groups handle only about 40 percent of marketed milk production and about 20 percent of total milk (Muriuki, 2003).
Other players in milk marketing include informal traders, distributors and retailers. The existence of informal trade results from a combination of the formal system’s failure or inefficiency, consumer habits/preferences, and price differ-ences between raw and processed milk.
Input and service providers include agro-vet and other shops, breeding service providers, suppliers of breeding stock, dairy recording and stud book service providers, veterinary service providers, and extension and advisory service providers.
FIGUrE 1Proportions of milk intake by different processors (2008)
Source: Ministry of Livestock Development (MOLD).
Githunguri 13%
Brookside 30%
Spin Knit 11%
Others 14%
New KCC 32%
3
DAIRYREPORTS
Industry Players
TABLE 1Numbers of dairy cooperative societies and membership (2000 to 2006)
2000 2001 2002 2003 2004 2005 2006
Number 337 332 332 239 241 248 252
Members in ‘000 350 204 204 148 144 200 254
Source: republic of Kenya, 2007.
Consumers are major players and have an important influence on how other players perform. Despite an aggressive regulatory regime that discourages the raw milk trade, consumer demand results in only about 20 percent of marketed milk being processed.
DAIRYREPORTS
4 Dairy development in Kenya
Chapter 3
Policy and Regulatory Environment
The policy environment that has influenced dairying in Kenya can be divided into four phases: pre-independence (before 1963); the first administration after independence (1967 to 1978); the second administration after independ-ence (1979 to 2002); and the period since 2003.
Before independence, dairy was a preserve of large-scale settler farmers and was export-oriented. After independ-ence, policy focused mainly on including indigenous Kenyans in commercial agriculture (including market-oriented dairy). The government intervened directly in the market and with subsidized services.
The policy environment during the second post-independence administration became more haphazard, with reactionary periods intermingling with poor judgement and corruption. During this period, cooperative societies were invaded by politically powerful individuals who used them for political gain, mismanaging and stealing from them to render cooperatives very unpopular.
The current administration (since 2003) has focused on economic revival and correction of perceived failures from the previous administrations. These efforts have yielded some positive results, with the formal dairy sector almost tri-pling the amount of milk it handles, from about 144 million litres in 2002 to 423 million litres in 2007.
Continuing policy challenges are the ambiguity of dairy policies, the minimal stakeholder consultation in formulating the policy and legal framework, and inconsistencies between the policies/legal framework and the prevailing situation.
5
DAIRYREPORTS
Chapter 4
Characterization of the Milk Production System
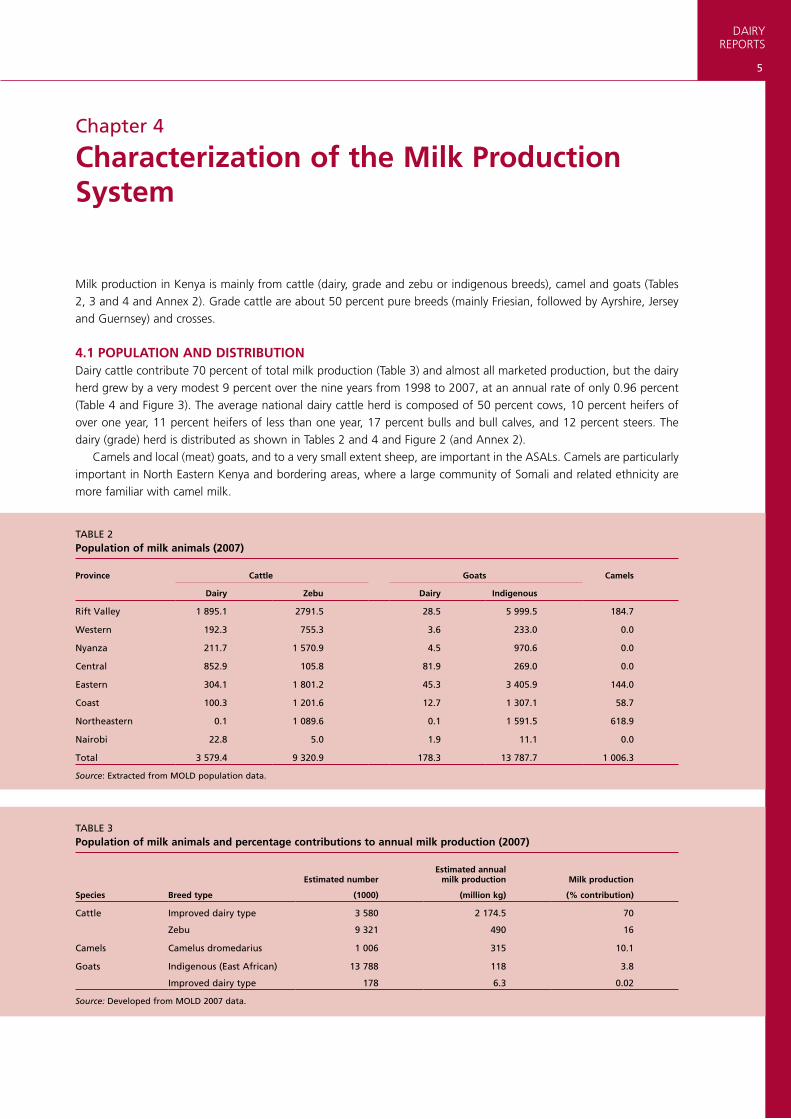
Milk production in Kenya is mainly from cattle (dairy, grade and zebu or indigenous breeds), camel and goats (Tables 2, 3 and 4 and Annex 2). Grade cattle are about 50 percent pure breeds (mainly Friesian, followed by Ayrshire, Jersey and Guernsey) and crosses.
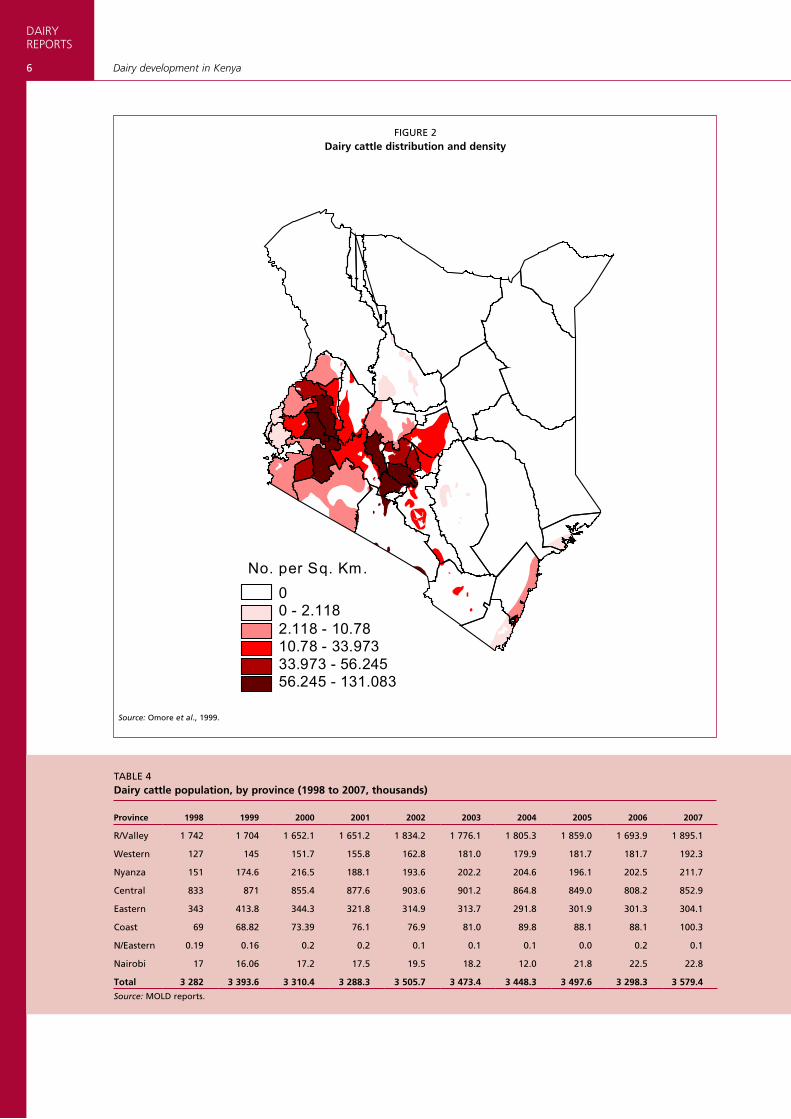
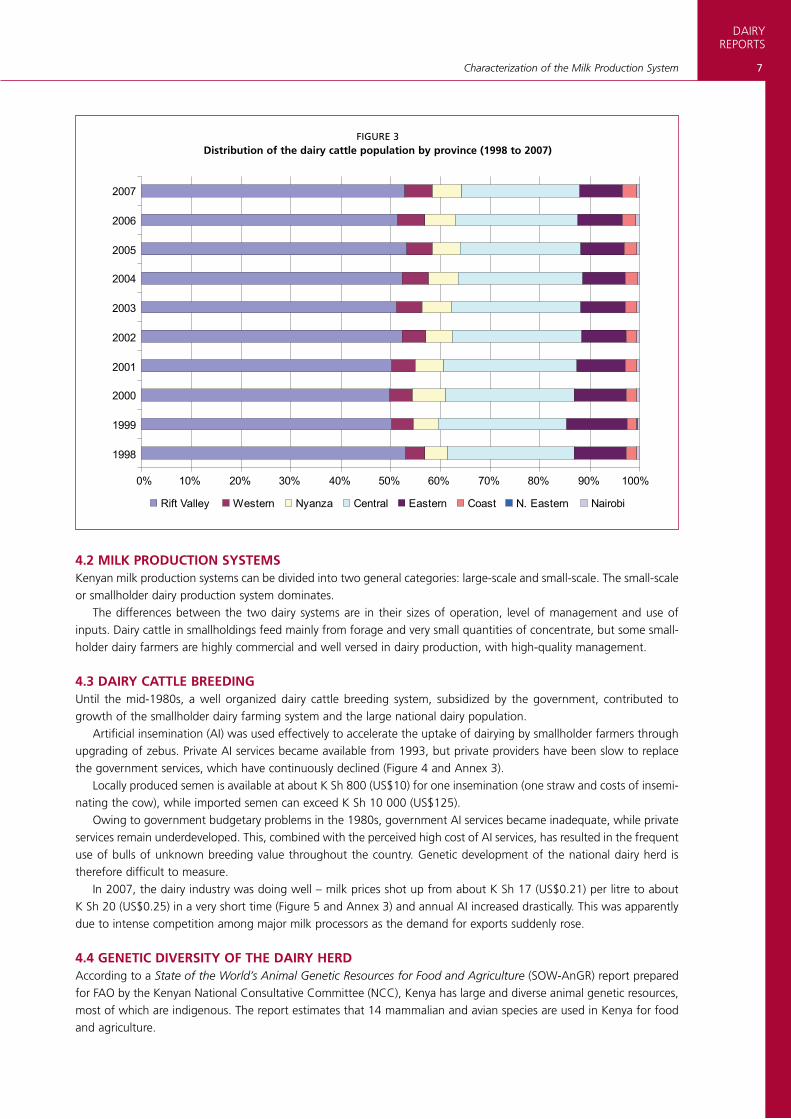
4.1 POPULATION AND DISTRIBUTIONDairy cattle contribute 70 percent of total milk production (Table 3) and almost all marketed production, but the dairy herd grew by a very modest 9 percent over the nine years from 1998 to 2007, at an annual rate of only 0.96 percent (Table 4 and Figure 3). The average national dairy cattle herd is composed of 50 percent cows, 10 percent heifers of over one year, 11 percent heifers of less than one year, 17 percent bulls and bull calves, and 12 percent steers. The dairy (grade) herd is distributed as shown in Tables 2 and 4 and Figure 2 (and Annex 2).
Camels and local (meat) goats, and to a very small extent sheep, are important in the ASALs. Camels are particularly important in North Eastern Kenya and bordering areas, where a large community of Somali and related ethnicity are more familiar with camel milk.
TABLE 2Population of milk animals (2007)
Province Cattle Goats Camels
Dairy Zebu Dairy Indigenous
rift Valley 1 895.1 2791.5 28.5 5 999.5 184.7
Western 192.3 755.3 3.6 233.0 0.0
Nyanza 211.7 1 570.9 4.5 970.6 0.0
Central 852.9 105.8 81.9 269.0 0.0
Eastern 304.1 1 801.2 45.3 3 405.9 144.0
Coast 100.3 1 201.6 12.7 1 307.1 58.7
Northeastern 0.1 1 089.6 0.1 1 591.5 618.9
Nairobi 22.8 5.0 1.9 11.1 0.0
Total 3 579.4 9 320.9 178.3 13 787.7 1 006.3
Source: Extracted from MOLD population data.
TABLE 3Population of milk animals and percentage contributions to annual milk production (2007)
Species Breed type
Estimated number
(1000)
Estimated annual milk production
(million kg)
Milk production
(% contribution)
Cattle Improved dairy type
Zebu
3 580
9 321
2 174.5
490
70
16
Camels Camelus dromedarius 1 006 315 10.1
Goats Indigenous (East African)
Improved dairy type
13 788
178
118
6.3
3.8
0.02
Source: Developed from MOLD 2007 data.
DAIRYREPORTS
6 Dairy development in Kenya
FIGUrE 2Dairy cattle distribution and density
Source: Omore et al., 1999.
0 0 - 2 . 1 1 8 2 . 1 1 8 - 1 0 . 7 8 1 0 . 7 8 - 3 3 . 9 7 3 3 3 . 9 7 3 - 5 6 . 2 4 5 5 6 . 2 4 5 - 1 3 1 . 0 8 3
N o . p e r S q . K m .
TABLE 4Dairy cattle population, by province (1998 to 2007, thousands)
Province 1998 1999 2000 2001 2002 2003 2004 2005 2006 2007
r/Valley 1 742 1 704 1 652.1 1 651.2 1 834.2 1 776.1 1 805.3 1 859.0 1 693.9 1 895.1
Western 127 145 151.7 155.8 162.8 181.0 179.9 181.7 181.7 192.3
Nyanza 151 174.6 216.5 188.1 193.6 202.2 204.6 196.1 202.5 211.7
Central 833 871 855.4 877.6 903.6 901.2 864.8 849.0 808.2 852.9
Eastern 343 413.8 344.3 321.8 314.9 313.7 291.8 301.9 301.3 304.1
Coast 69 68.82 73.39 76.1 76.9 81.0 89.8 88.1 88.1 100.3
N/Eastern 0.19 0.16 0.2 0.2 0.1 0.1 0.1 0.0 0.2 0.1
Nairobi 17 16.06 17.2 17.5 19.5 18.2 12.0 21.8 22.5 22.8
Total 3 282 3 393.6 3 310.4 3 288.3 3 505.7 3 473.4 3 448.3 3 497.6 3 298.3 3 579.4
Source: MOLD reports.
7
DAIRYREPORTS
Characterization of the Milk Production System
4.2 MILK PRODUCTION SYSTEMSKenyan milk production systems can be divided into two general categories: large-scale and small-scale. The small-scale or smallholder dairy production system dominates.
The differences between the two dairy systems are in their sizes of operation, level of management and use of inputs. Dairy cattle in smallholdings feed mainly from forage and very small quantities of concentrate, but some small-holder dairy farmers are highly commercial and well versed in dairy production, with high-quality management.
4.3 DAIRY CATTLE BREEDINGUntil the mid-1980s, a well organized dairy cattle breeding system, subsidized by the government, contributed to growth of the smallholder dairy farming system and the large national dairy population.
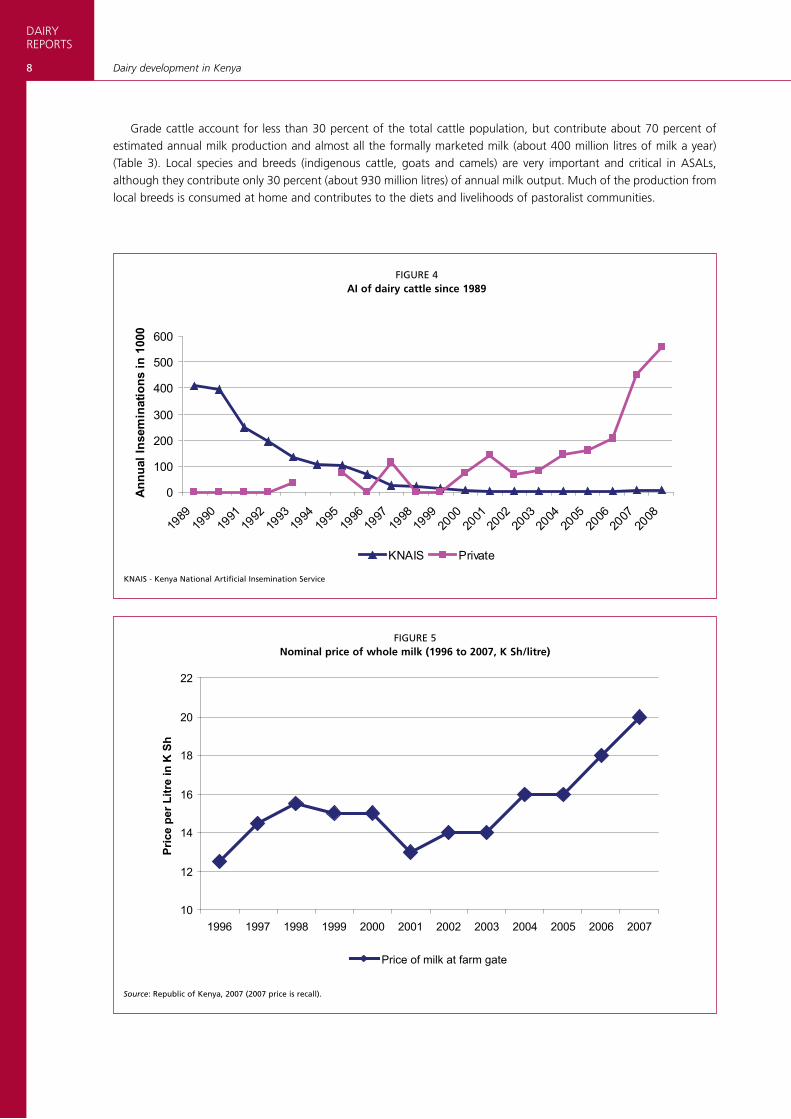
Artificial insemination (AI) was used effectively to accelerate the uptake of dairying by smallholder farmers through upgrading of zebus. Private AI services became available from 1993, but private providers have been slow to replace the government services, which have continuously declined (Figure 4 and Annex 3).
Locally produced semen is available at about K Sh 800 (US$10) for one insemination (one straw and costs of insemi-nating the cow), while imported semen can exceed K Sh 10 000 (US$125).
Owing to government budgetary problems in the 1980s, government AI services became inadequate, while private services remain underdeveloped. This, combined with the perceived high cost of AI services, has resulted in the frequent use of bulls of unknown breeding value throughout the country. Genetic development of the national dairy herd is therefore difficult to measure.
In 2007, the dairy industry was doing well – milk prices shot up from about K Sh 17 (US$0.21) per litre to about K Sh 20 (US$0.25) in a very short time (Figure 5 and Annex 3) and annual AI increased drastically. This was apparently due to intense competition among major milk processors as the demand for exports suddenly rose.
4.4 GENETIC DIVERSITY OF THE DAIRY HERD According to a State of the World’s Animal Genetic Resources for Food and Agriculture (SOW-AnGR) report prepared for FAO by the Kenyan National Consultative Committee (NCC), Kenya has large and diverse animal genetic resources, most of which are indigenous. The report estimates that 14 mammalian and avian species are used in Kenya for food and agriculture.
FIGUrE 3Distribution of the dairy cattle population by province (1998 to 2007)
0% 10% 20% 30% 40% 50% 60% 70% 80% 90% 100%
1998
1999
2000
2001
2002
2003
2004
2005
2006
2007
Rift Valley Western Nyanza Central Eastern Coast N. Eastern Nairobi
DAIRYREPORTS
8 Dairy development in Kenya
Grade cattle account for less than 30 percent of the total cattle population, but contribute about 70 percent of estimated annual milk production and almost all the formally marketed milk (about 400 million litres of milk a year) (Table 3). Local species and breeds (indigenous cattle, goats and camels) are very important and critical in ASALs, although they contribute only 30 percent (about 930 million litres) of annual milk output. Much of the production from local breeds is consumed at home and contributes to the diets and livelihoods of pastoralist communities.
FIGUrE 4AI of dairy cattle since 1989
FIGUrE 5Nominal price of whole milk (1996 to 2007, K Sh/litre)
0
100
200
300
400
500
600
1989
1990
1991
1992
1993
1994
1995
1996
1997
1998
1999
2000
2001
2002
2003
2004
2005
2006
2007
2008
Annu
al In
sem
inat
ions
in 1
000
KNAIS Private
10
12
14
16
18
20
22
1996 1997 1998 1999 2000 2001 2002 2003 2004 2005 2006 2007
Pric
e pe
r Litr
e in
K S
h
Price of milk at farm gate
Source: republic of Kenya, 2007 (2007 price is recall).
KNAIS - Kenya National Artificial Insemination Service
9
DAIRYREPORTS
Characterization of the Milk Production System
4.5 DAIRY CATTLE FEEDINGThe bulk of dairy cattle feed is natural forage, cultivated fodder and crop by-products. Napier grass is the cultivated fodder most frequently used for dairy cattle, especially in the central Kenya highlands.
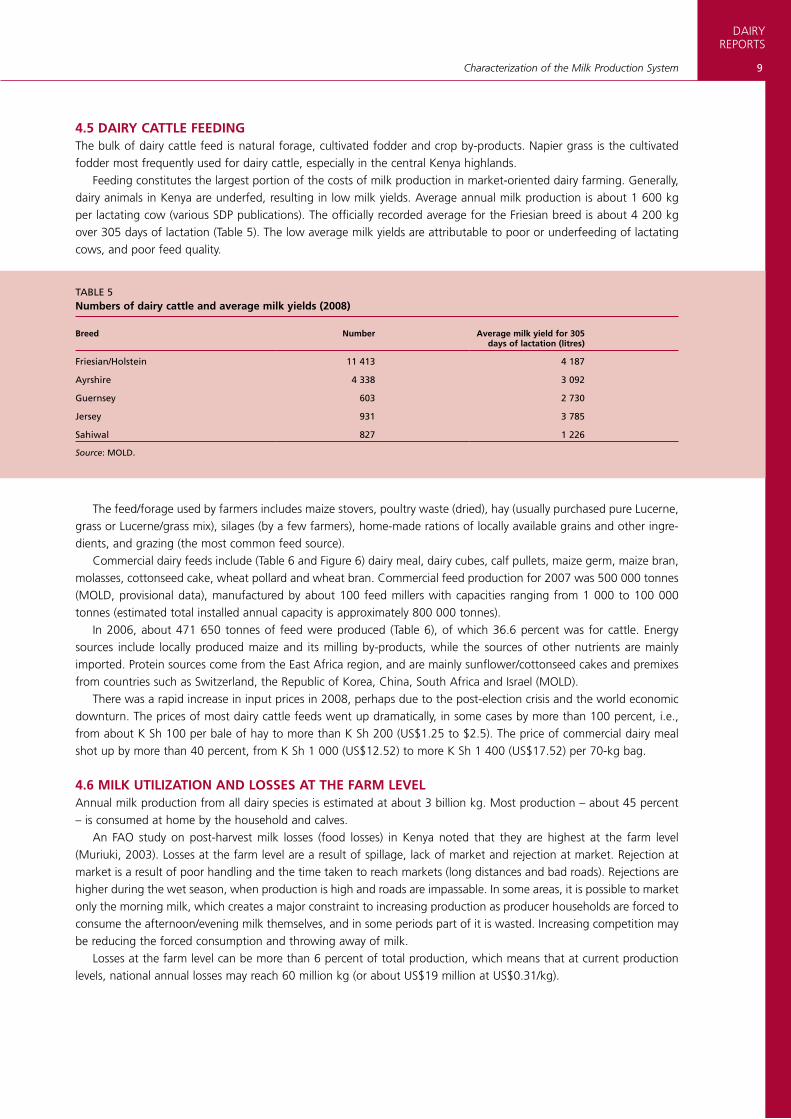
Feeding constitutes the largest portion of the costs of milk production in market-oriented dairy farming. Generally, dairy animals in Kenya are underfed, resulting in low milk yields. Average annual milk production is about 1 600 kg per lactating cow (various SDP publications). The officially recorded average for the Friesian breed is about 4 200 kg over 305 days of lactation (Table 5). The low average milk yields are attributable to poor or underfeeding of lactating cows, and poor feed quality.
TABLE 5Numbers of dairy cattle and average milk yields (2008)
Breed Number Average milk yield for 305 days of lactation (litres)
Friesian/Holstein 11 413 4 187
Ayrshire 4 338 3 092
Guernsey 603 2 730
Jersey 931 3 785
Sahiwal 827 1 226
Source: MOLD.
The feed/forage used by farmers includes maize stovers, poultry waste (dried), hay (usually purchased pure Lucerne, grass or Lucerne/grass mix), silages (by a few farmers), home-made rations of locally available grains and other ingre-dients, and grazing (the most common feed source).
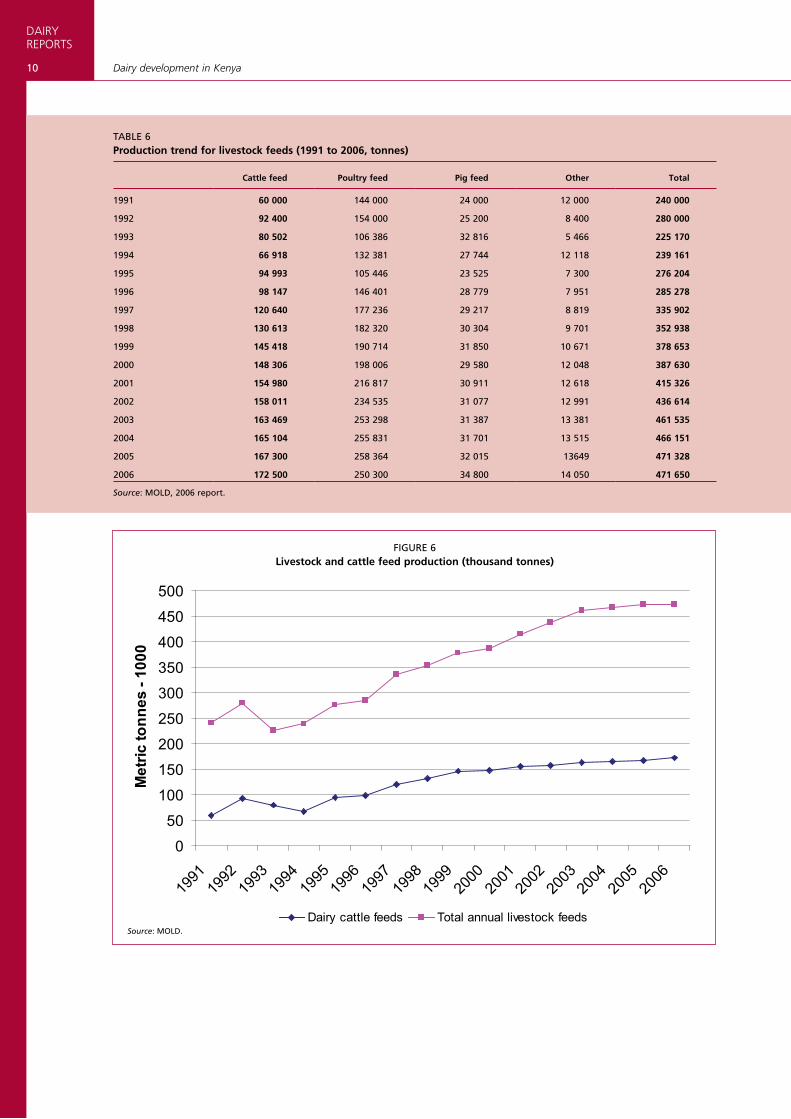
Commercial dairy feeds include (Table 6 and Figure 6) dairy meal, dairy cubes, calf pullets, maize germ, maize bran, molasses, cottonseed cake, wheat pollard and wheat bran. Commercial feed production for 2007 was 500 000 tonnes (MOLD, provisional data), manufactured by about 100 feed millers with capacities ranging from 1 000 to 100 000 tonnes (estimated total installed annual capacity is approximately 800 000 tonnes).
In 2006, about 471 650 tonnes of feed were produced (Table 6), of which 36.6 percent was for cattle. Energy sources include locally produced maize and its milling by-products, while the sources of other nutrients are mainly imported. Protein sources come from the East Africa region, and are mainly sunflower/cottonseed cakes and premixes from countries such as Switzerland, the Republic of Korea, China, South Africa and Israel (MOLD).
There was a rapid increase in input prices in 2008, perhaps due to the post-election crisis and the world economic downturn. The prices of most dairy cattle feeds went up dramatically, in some cases by more than 100 percent, i.e., from about K Sh 100 per bale of hay to more than K Sh 200 (US$1.25 to $2.5). The price of commercial dairy meal shot up by more than 40 percent, from K Sh 1 000 (US$12.52) to more K Sh 1 400 (US$17.52) per 70-kg bag.
4.6 MILK UTILIZATION AND LOSSES AT THE FARM LEVELAnnual milk production from all dairy species is estimated at about 3 billion kg. Most production – about 45 percent – is consumed at home by the household and calves.
An FAO study on post-harvest milk losses (food losses) in Kenya noted that they are highest at the farm level (Muriuki, 2003). Losses at the farm level are a result of spillage, lack of market and rejection at market. Rejection at market is a result of poor handling and the time taken to reach markets (long distances and bad roads). Rejections are higher during the wet season, when production is high and roads are impassable. In some areas, it is possible to market only the morning milk, which creates a major constraint to increasing production as producer households are forced to consume the afternoon/evening milk themselves, and in some periods part of it is wasted. Increasing competition may be reducing the forced consumption and throwing away of milk.
Losses at the farm level can be more than 6 percent of total production, which means that at current production levels, national annual losses may reach 60 million kg (or about US$19 million at US$0.31/kg).
DAIRYREPORTS
10 Dairy development in Kenya
TABLE 6Production trend for livestock feeds (1991 to 2006, tonnes)
Cattle feed Poultry feed Pig feed Other Total
1991 60 000 144 000 24 000 12 000 240 000
1992 92 400 154 000 25 200 8 400 280 000
1993 80 502 106 386 32 816 5 466 225 170
1994 66 918 132 381 27 744 12 118 239 161
1995 94 993 105 446 23 525 7 300 276 204
1996 98 147 146 401 28 779 7 951 285 278
1997 120 640 177 236 29 217 8 819 335 902
1998 130 613 182 320 30 304 9 701 352 938
1999 145 418 190 714 31 850 10 671 378 653
2000 148 306 198 006 29 580 12 048 387 630
2001 154 980 216 817 30 911 12 618 415 326
2002 158 011 234 535 31 077 12 991 436 614
2003 163 469 253 298 31 387 13 381 461 535
2004 165 104 255 831 31 701 13 515 466 151
2005 167 300 258 364 32 015 13649 471 328
2006 172 500 250 300 34 800 14 050 471 650
Source: MOLD, 2006 report.
FIGUrE 6Livestock and cattle feed production (thousand tonnes)
Source: MOLD.
0
50
100
150
200
250
300
350
400
450
500
1991
1992
1993
1994
1995
1996
1997
1998
1999
2000
2001
2002
2003
2004
2005
2006
Met
ric to
nnes
- 10
00
Dairy cattle feeds Total annual livestock feeds
11
DAIRYREPORTS
Characterization of the Milk Production System
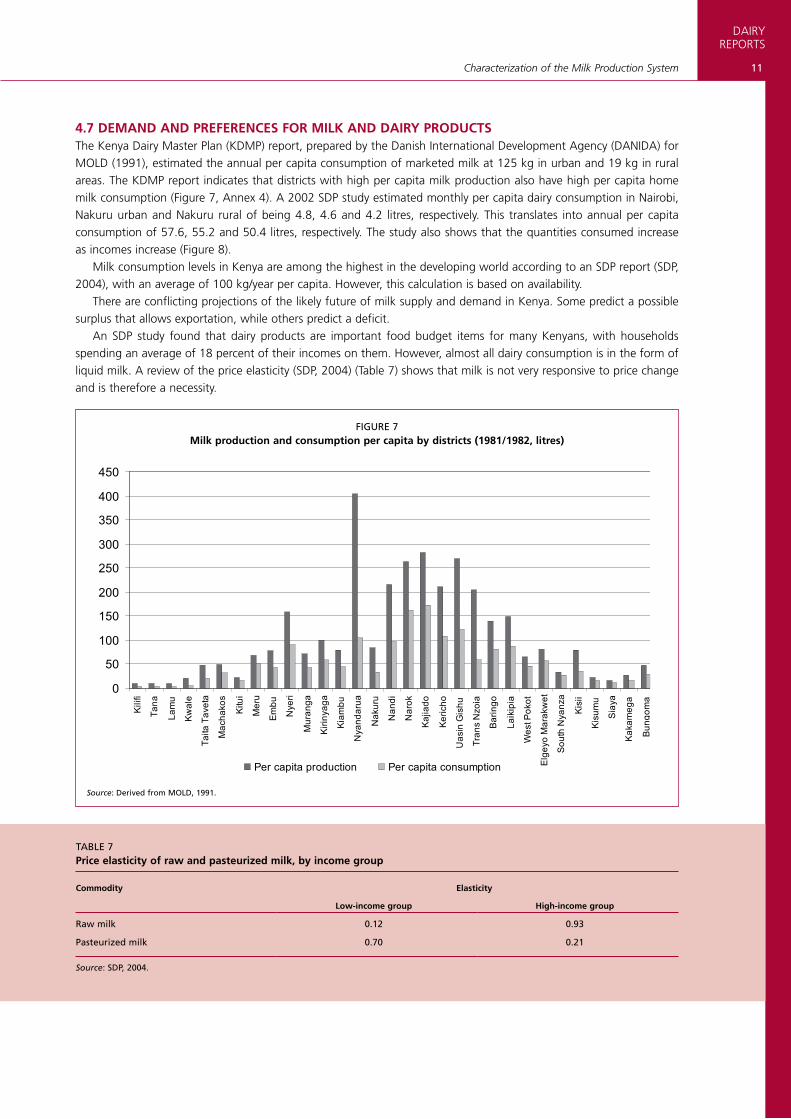
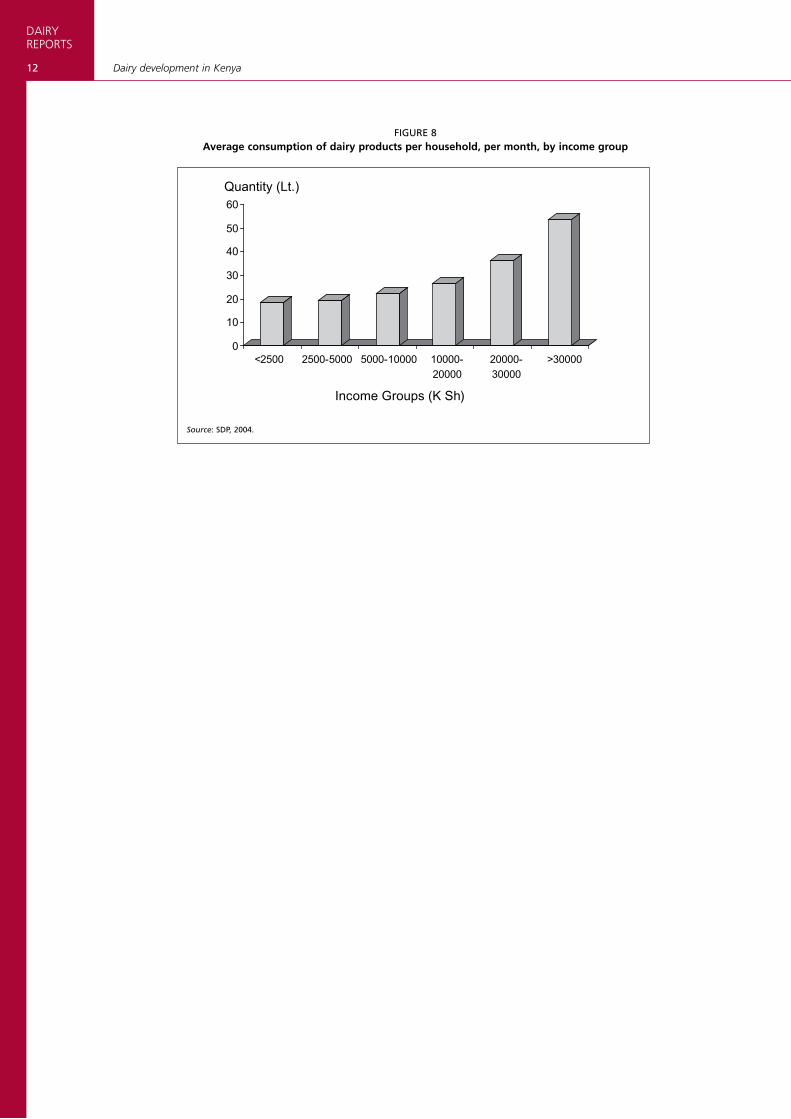
4.7 DEMAND AND PREFERENCES FOR MILK AND DAIRY PRODUCTSThe Kenya Dairy Master Plan (KDMP) report, prepared by the Danish International Development Agency (DANIDA) for MOLD (1991), estimated the annual per capita consumption of marketed milk at 125 kg in urban and 19 kg in rural areas. The KDMP report indicates that districts with high per capita milk production also have high per capita home milk consumption (Figure 7, Annex 4). A 2002 SDP study estimated monthly per capita dairy consumption in Nairobi, Nakuru urban and Nakuru rural of being 4.8, 4.6 and 4.2 litres, respectively. This translates into annual per capita consumption of 57.6, 55.2 and 50.4 litres, respectively. The study also shows that the quantities consumed increase as incomes increase (Figure 8).
Milk consumption levels in Kenya are among the highest in the developing world according to an SDP report (SDP, 2004), with an average of 100 kg/year per capita. However, this calculation is based on availability.
There are conflicting projections of the likely future of milk supply and demand in Kenya. Some predict a possible surplus that allows exportation, while others predict a deficit.
An SDP study found that dairy products are important food budget items for many Kenyans, with households spending an average of 18 percent of their incomes on them. However, almost all dairy consumption is in the form of liquid milk. A review of the price elasticity (SDP, 2004) (Table 7) shows that milk is not very responsive to price change and is therefore a necessity.
FIGUrE 7Milk production and consumption per capita by districts (1981/1982, litres)
Source: Derived from MOLD, 1991.
0
50
100
150
200
250
300
350
400
450
Kili
fi
Tana
Lam
u
Kw
ale
Taita
Tav
eta
Mac
hako
s
Kitu
i
Mer
u
Em
bu
Nye
ri
Mur
anga
Kiri
nyag
a
Kia
mbu
Nya
ndar
ua
Nak
uru
Nan
di
Nar
ok
Kaj
iado
Ker
icho
Uas
in G
ishu
Tran
s N
zoia
Bar
ingo
Laik
ipia
Wes
t Pok
ot
Elg
eyo
Mar
akw
et
Sou
th N
yanz
a
Kis
ii
Kis
umu
Sia
ya
Kak
ameg
a
Bun
gom
a
Bus
ia
Per capita production Per capita consumption
TABLE 7Price elasticity of raw and pasteurized milk, by income group
Commodity Elasticity
Low-income group High-income group
raw milk 0.12 0.93
Pasteurized milk 0.70 0.21
Source: SDP, 2004.
DAIRYREPORTS
12 Dairy development in Kenya
FIGUrE 8Average consumption of dairy products per household, per month, by income group
Source: SDP, 2004.
0
10
20
30
40
50
60Quantity (Lt.)
<2500 2500-5000 5000-10000 10000-20000
20000-30000
>30000
Income Groups (K Sh)
13
DAIRYREPORTS
Chapter 5
Analysis of the dairy value chain
Before liberalization of the dairy industry, Kenya Cooperative Creameries (KCC) was the dominant player in formal milk marketing. Informal trade was minimal, and trade in unprocessed milk was limited mainly to farmers’ immediate neighbourhoods.
5.1 COLLECTION, BULKING AND TRANSPORTATION Before market liberalization in the early 1990s, there was an organized milk collection and bulking system in the formal market, with two types of milk delivery to KCC facilities: by individual dairy farmers; or by dairy cooperative societies.
With liberalization and the collapse of KCC, the collection and bulking system also collapsed. At present, collection and bulking is a complex of different systems depending on processors, intermediaries, the road network, milk sheds and many other factors.
The transportation of milk depends on the amount and the buyer. Major processors have their own collection, bulking and transportation systems. Stainless steel (seamless) cans, and occasionally plastic cans, are used for bulking milk from individual suppliers and delivering it to processors’ collection, bulking and cooling centres, from where it is transported in cans or by refrigerated tanks to the main processing plants.
In some areas, powerful milk intermediaries (traders) have positioned themselves between the market and the milk producers. Their presence complicates the traceability of milk and brings a risk of cross-contamination and microbial overload.
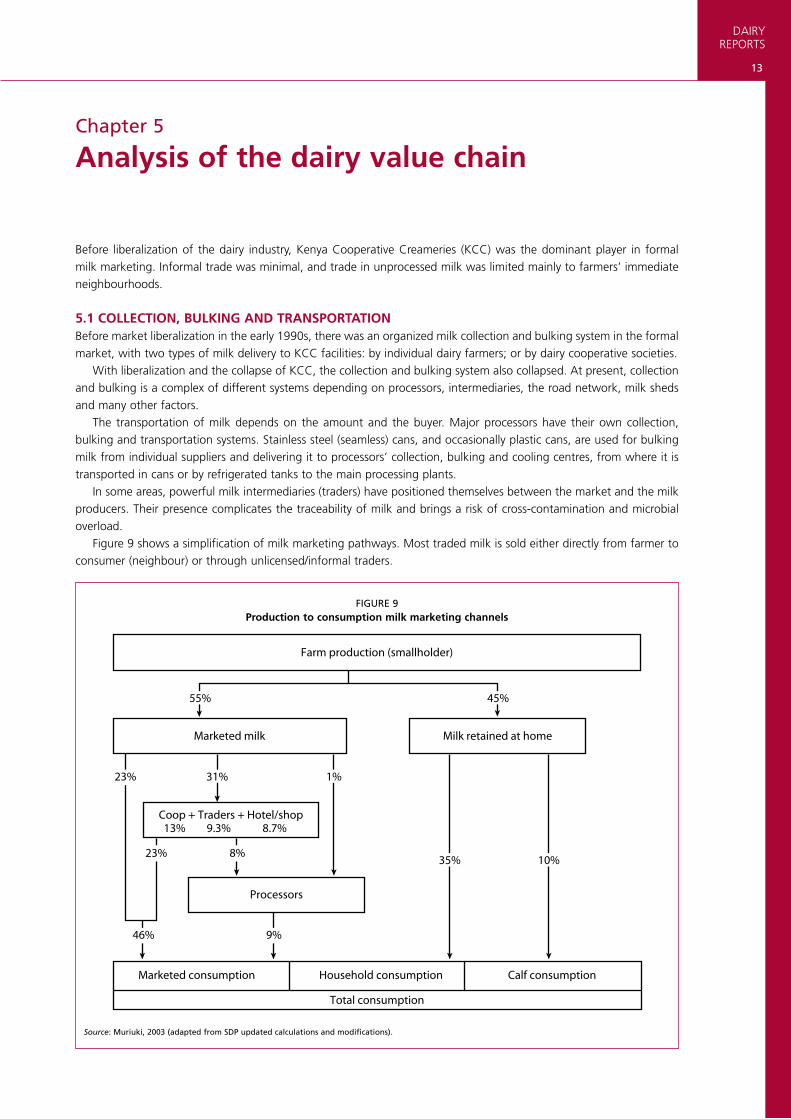
Figure 9 shows a simplification of milk marketing pathways. Most traded milk is sold either directly from farmer to consumer (neighbour) or through unlicensed/informal traders.
FIGUrE 9Production to consumption milk marketing channels
Source: Muriuki, 2003 (adapted from SDP updated calculations and modifications).
Processors
Farm production (smallholder)
Total consumption
Marketed consumption Household consumption Calf consumption
Marketed milk Milk retained at home
45%55%
31%
46% 9%
23%
Coop + Traders + Hotel/shop13% 9.3% 8.7%
1%
35% 10%8%23%
DAIRYREPORTS
14 Dairy development in Kenya
5.2 UNPROCESSED MILK TRADEKenyans appear to prefer raw milk. Estimates from various studies indicate that about 85 percent of marketed milk is sold raw. Recently, the Kenya Dairy Board (KDB) and others in the formal milk trade have claimed that the proportion of processed milk has increased to more than 20 percent. An SDP brief provides the following as reasons for unprocessed milk being preferred:
• It is 20 to 50 percent cheaper than processed milk.• Many people prefer the taste and high butterfat content of unprocessed milk.• Unprocessed milk is sold in variable quantities, depending on how much money the customer has to spend.• It is widely accessible and within the reach of many people.• Most consumers are accustomed to consuming unprocessed milk.The selling of milk through the unprocessed channel is of concern because of the perceived health risk, particularly
owing to its microbial load by the time it reaches the consumer.
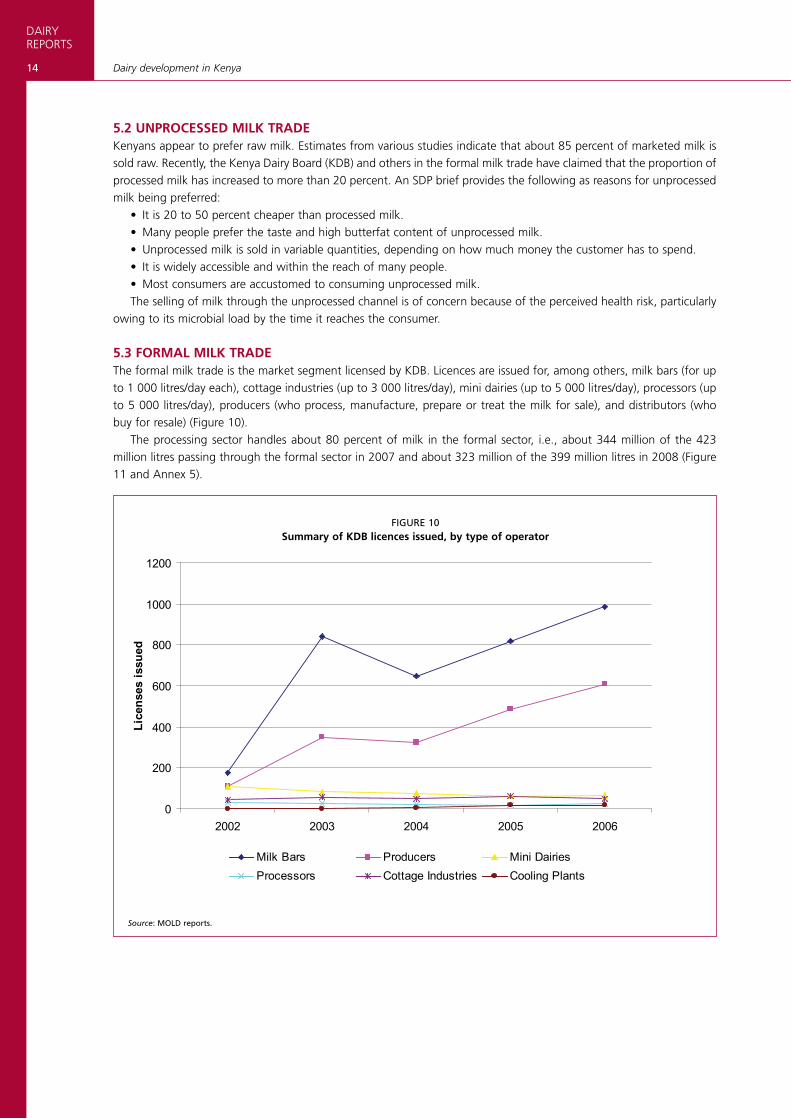
5.3 FORMAL MILK TRADEThe formal milk trade is the market segment licensed by KDB. Licences are issued for, among others, milk bars (for up to 1 000 litres/day each), cottage industries (up to 3 000 litres/day), mini dairies (up to 5 000 litres/day), processors (up to 5 000 litres/day), producers (who process, manufacture, prepare or treat the milk for sale), and distributors (who buy for resale) (Figure 10).
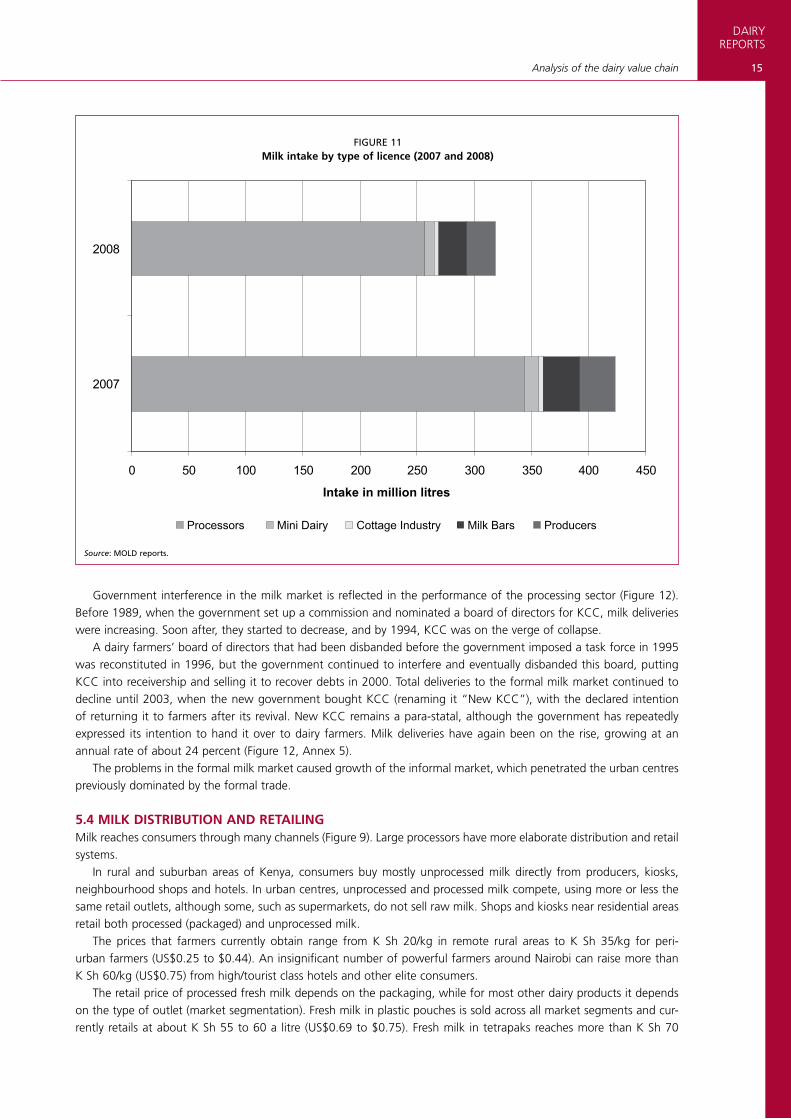
The processing sector handles about 80 percent of milk in the formal sector, i.e., about 344 million of the 423 million litres passing through the formal sector in 2007 and about 323 million of the 399 million litres in 2008 (Figure 11 and Annex 5).
FIGUrE 10Summary of KDB licences issued, by type of operator
Source: MOLD reports.
0
200
400
600
800
1000
1200
2002 2003 2004 2005 2006
Lice
nses
issu
ed
Milk Bars Producers Mini DairiesProcessors Cottage Industries Cooling Plants
15
DAIRYREPORTS
Analysis of the dairy value chain
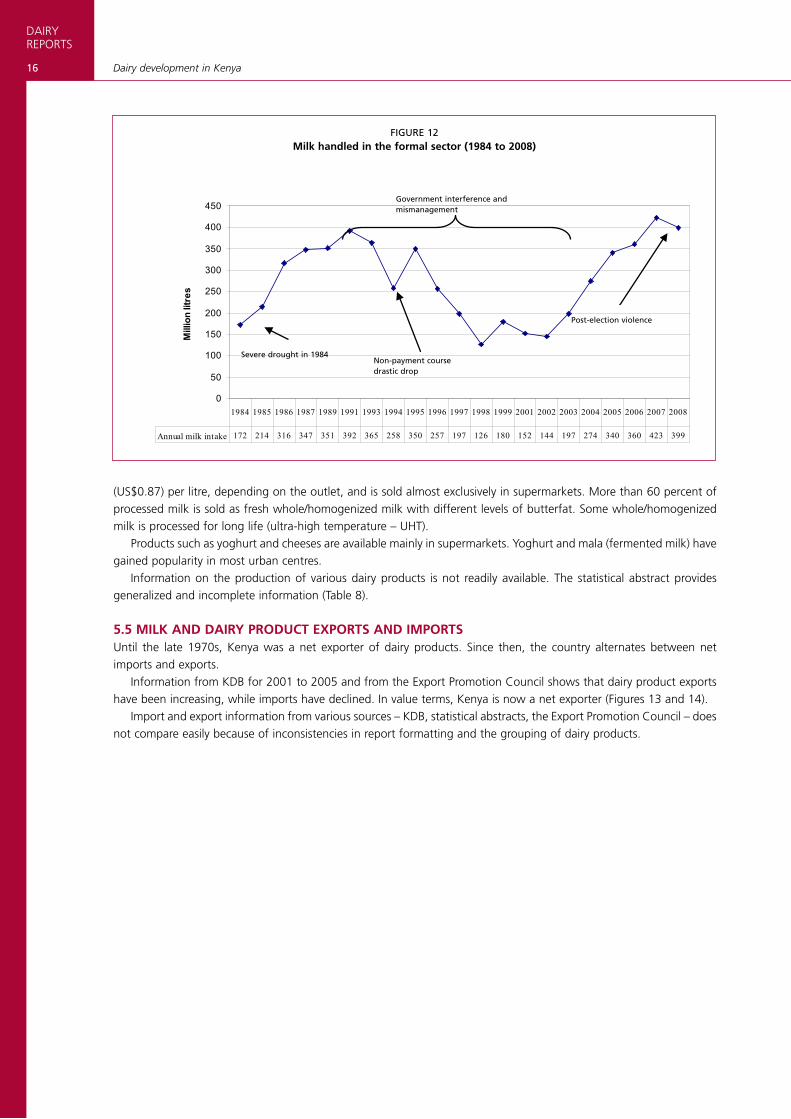
Government interference in the milk market is reflected in the performance of the processing sector (Figure 12). Before 1989, when the government set up a commission and nominated a board of directors for KCC, milk deliveries were increasing. Soon after, they started to decrease, and by 1994, KCC was on the verge of collapse.
A dairy farmers’ board of directors that had been disbanded before the government imposed a task force in 1995 was reconstituted in 1996, but the government continued to interfere and eventually disbanded this board, putting KCC into receivership and selling it to recover debts in 2000. Total deliveries to the formal milk market continued to decline until 2003, when the new government bought KCC (renaming it “New KCC”), with the declared intention of returning it to farmers after its revival. New KCC remains a para-statal, although the government has repeatedly expressed its intention to hand it over to dairy farmers. Milk deliveries have again been on the rise, growing at an annual rate of about 24 percent (Figure 12, Annex 5).
The problems in the formal milk market caused growth of the informal market, which penetrated the urban centres previously dominated by the formal trade.
5.4 MILK DISTRIBUTION AND RETAILINGMilk reaches consumers through many channels (Figure 9). Large processors have more elaborate distribution and retail systems.
In rural and suburban areas of Kenya, consumers buy mostly unprocessed milk directly from producers, kiosks, neighbourhood shops and hotels. In urban centres, unprocessed and processed milk compete, using more or less the same retail outlets, although some, such as supermarkets, do not sell raw milk. Shops and kiosks near residential areas retail both processed (packaged) and unprocessed milk.
The prices that farmers currently obtain range from K Sh 20/kg in remote rural areas to K Sh 35/kg for peri-urban farmers (US$0.25 to $0.44). An insignificant number of powerful farmers around Nairobi can raise more than K Sh 60/kg (US$0.75) from high/tourist class hotels and other elite consumers.
The retail price of processed fresh milk depends on the packaging, while for most other dairy products it depends on the type of outlet (market segmentation). Fresh milk in plastic pouches is sold across all market segments and cur-rently retails at about K Sh 55 to 60 a litre (US$0.69 to $0.75). Fresh milk in tetrapaks reaches more than K Sh 70
FIGUrE 11Milk intake by type of licence (2007 and 2008)
Source: MOLD reports.
0 50 100 150 200 250 300 350 400 450
2007
2008
Intake in million litres
Processors Mini Dairy Cottage Industry Milk Bars Producers
DAIRYREPORTS
16 Dairy development in Kenya
(US$0.87) per litre, depending on the outlet, and is sold almost exclusively in supermarkets. More than 60 percent of processed milk is sold as fresh whole/homogenized milk with different levels of butterfat. Some whole/homogenized milk is processed for long life (ultra-high temperature – UHT).
Products such as yoghurt and cheeses are available mainly in supermarkets. Yoghurt and mala (fermented milk) have gained popularity in most urban centres.
Information on the production of various dairy products is not readily available. The statistical abstract provides generalized and incomplete information (Table 8).
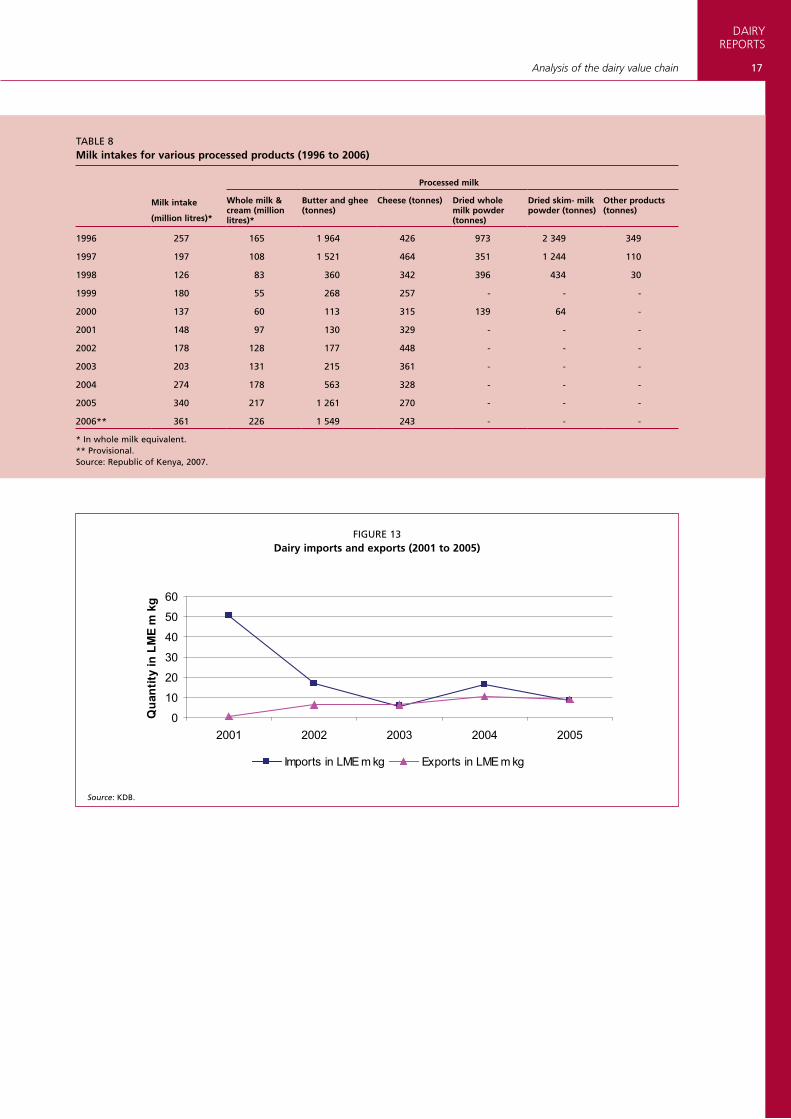
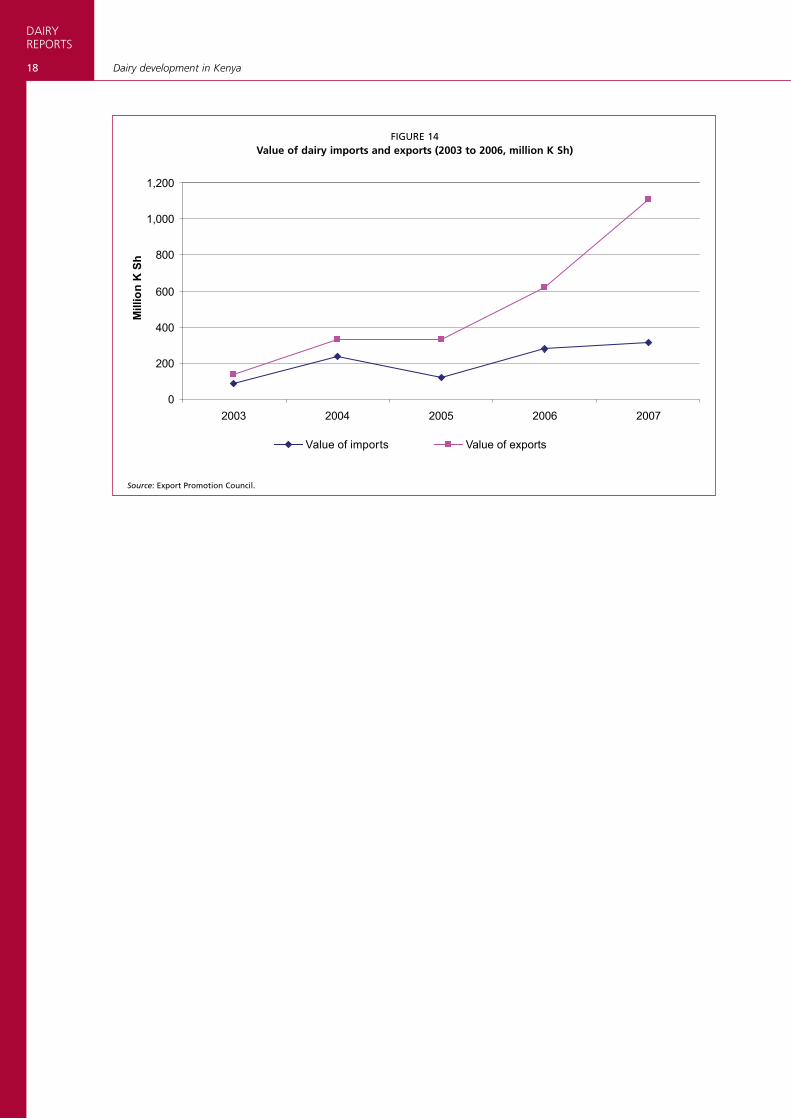
5.5 MILK AND DAIRY PRODUCT ExPORTS AND IMPORTSUntil the late 1970s, Kenya was a net exporter of dairy products. Since then, the country alternates between net imports and exports.
Information from KDB for 2001 to 2005 and from the Export Promotion Council shows that dairy product exports have been increasing, while imports have declined. In value terms, Kenya is now a net exporter (Figures 13 and 14).
Import and export information from various sources – KDB, statistical abstracts, the Export Promotion Council – does not compare easily because of inconsistencies in report formatting and the grouping of dairy products.
FIGUrE 12Milk handled in the formal sector (1984 to 2008)
0
50
100
150
200
250
300
350
400
450
Mill
ion
litre
s
Annual milk intake 172 214 316 347 351 392 365 258 350 257 197 126 180 152 144 197 274 340 360 423 399
1984 1985 1986 1987 1989 1991 1993 1994 1995 1996 1997 1998 1999 2001 2002 2003 2004 2005 2006 2007 2008
Government interference and mismanagement
Non-payment course drastic drop
Post-election violence
Severe drought in 1984
17
DAIRYREPORTS
Analysis of the dairy value chain
TABLE 8Milk intakes for various processed products (1996 to 2006)
Milk intake
(million litres)*
Processed milk
Whole milk & cream (million litres)*
Butter and ghee (tonnes)
Cheese (tonnes) Dried whole milk powder (tonnes)
Dried skim- milk powder (tonnes)
Other products (tonnes)
1996 257 165 1 964 426 973 2 349 349
1997 197 108 1 521 464 351 1 244 110
1998 126 83 360 342 396 434 30
1999 180 55 268 257 - - -
2000 137 60 113 315 139 64 -
2001 148 97 130 329 - - -
2002 178 128 177 448 - - -
2003 203 131 215 361 - - -
2004 274 178 563 328 - - -
2005 340 217 1 261 270 - - -
2006** 361 226 1 549 243 - - -
* In whole milk equivalent. ** Provisional. Source: republic of Kenya, 2007.
FIGUrE 13Dairy imports and exports (2001 to 2005)
Source: KDB.
0
10
20
30
40
50
60
2001 2002 2003 2004 2005
Qua
ntity
in L
ME
m k
g
Imports in LME m kg Exports in LME m kg
DAIRYREPORTS
18 Dairy development in Kenya
FIGUrE 14Value of dairy imports and exports (2003 to 2006, million K Sh)
Source: Export Promotion Council.
0
200
400
600
800
1,000
1,200
2003 2004 2005 2006 2007
Mill
ion
K S
h
Value of imports Value of exports
19
DAIRYREPORTS
Chapter 6
Safety of Milk And Dairy Products
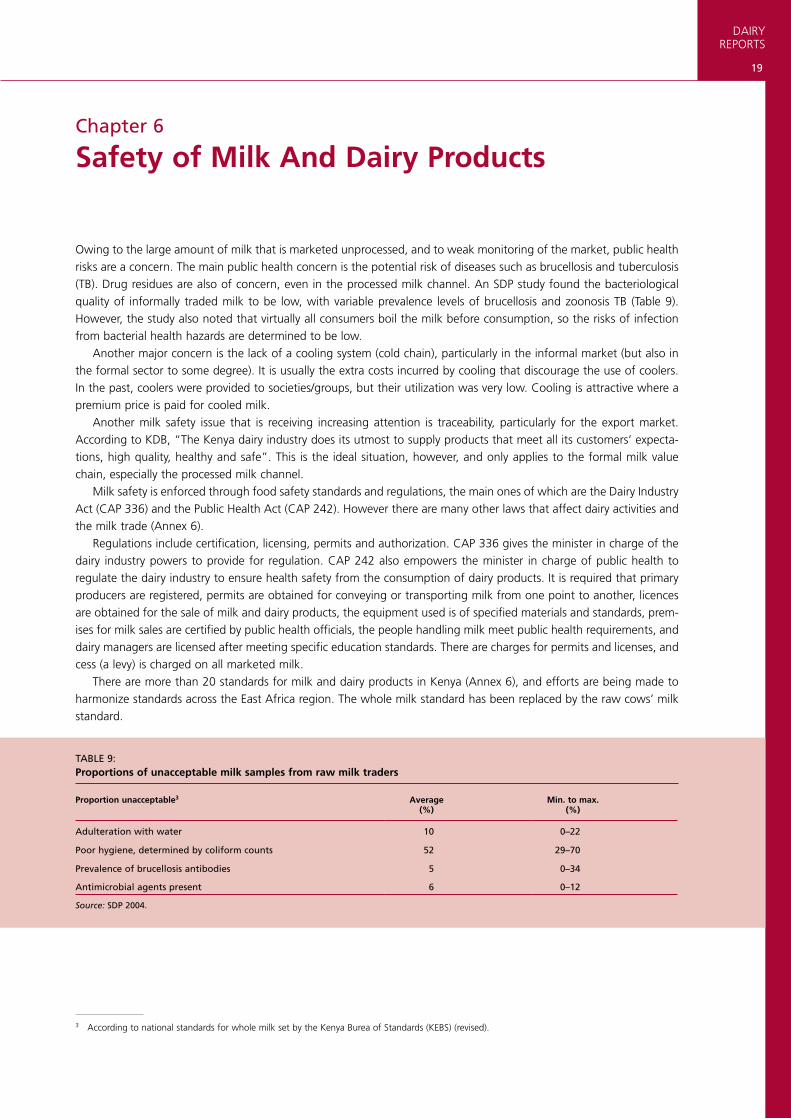
Owing to the large amount of milk that is marketed unprocessed, and to weak monitoring of the market, public health risks are a concern. The main public health concern is the potential risk of diseases such as brucellosis and tuberculosis (TB). Drug residues are also of concern, even in the processed milk channel. An SDP study found the bacteriological quality of informally traded milk to be low, with variable prevalence levels of brucellosis and zoonosis TB (Table 9). However, the study also noted that virtually all consumers boil the milk before consumption, so the risks of infection from bacterial health hazards are determined to be low.
Another major concern is the lack of a cooling system (cold chain), particularly in the informal market (but also in the formal sector to some degree). It is usually the extra costs incurred by cooling that discourage the use of coolers. In the past, coolers were provided to societies/groups, but their utilization was very low. Cooling is attractive where a premium price is paid for cooled milk.
Another milk safety issue that is receiving increasing attention is traceability, particularly for the export market. According to KDB, “The Kenya dairy industry does its utmost to supply products that meet all its customers’ expecta-tions, high quality, healthy and safe”. This is the ideal situation, however, and only applies to the formal milk value chain, especially the processed milk channel.
Milk safety is enforced through food safety standards and regulations, the main ones of which are the Dairy Industry Act (CAP 336) and the Public Health Act (CAP 242). However there are many other laws that affect dairy activities and the milk trade (Annex 6).
Regulations include certification, licensing, permits and authorization. CAP 336 gives the minister in charge of the dairy industry powers to provide for regulation. CAP 242 also empowers the minister in charge of public health to regulate the dairy industry to ensure health safety from the consumption of dairy products. It is required that primary producers are registered, permits are obtained for conveying or transporting milk from one point to another, licences are obtained for the sale of milk and dairy products, the equipment used is of specified materials and standards, prem-ises for milk sales are certified by public health officials, the people handling milk meet public health requirements, and dairy managers are licensed after meeting specific education standards. There are charges for permits and licenses, and cess (a levy) is charged on all marketed milk.
There are more than 20 standards for milk and dairy products in Kenya (Annex 6), and efforts are being made to harmonize standards across the East Africa region. The whole milk standard has been replaced by the raw cows’ milk standard.
TABLE 9:Proportions of unacceptable milk samples from raw milk traders
Proportion unacceptable3 Average (%)
Min. to max. (%)
Adulteration with water 10 0–22
Poor hygiene, determined by coliform counts 52 29–70
Prevalence of brucellosis antibodies 5 0–34
Antimicrobial agents present 6 0–12
Source: SDP 2004.
3 According to national standards for whole milk set by the Kenya Burea of Standards (KEBS) (revised).
DAIRYREPORTS
20 Dairy development in Kenya
Chapter 7
Dairy Production and the Environment
Many actors in the dairy industry are not aware of the relationship between their dairy activities and the environment. Most of the smallholder farmers and informal traders who dominate the dairy industry have little awareness of envi-ronmental issues.
A general awareness of environmental issues is being built through the national education system. According to an environmental profile of Kenya (JICA, 2002), environmental education is taught in elementary and high schools and at universities.
7.1 ENVIRONMENTAL CONCERNS IN THE DAIRY INDUSTRYGlobally, environmental concerns about dairy production include the impacts on air, climate, land, soil, water and biodi-versity. Information on the impacts of dairy production on these factors is more likely to apply to developed countries. Information from developing countries is scarce and usually based on generalizations of hypothetical outcomes.
In Kenya, environmental concerns include floods and droughts; human, livestock, crop and forest diseases; soil ero-sion, degradation and infertility and desertification; and human activities that create or exacerbate problems such as pollution, encroachment into other land uses leading to deforestation, and negative impacts on wildlife and pastoral-ism.
The possible negative environmental impacts of dairy production in Kenya are loss of vegetation through overgraz-ing of natural pastures, and pollution from industrial processing. The issue of overgrazing was raised as early as 1991 (MOLD, 1991), when concerns were expressed that Kenya could not hold any more dairy cattle than the approximately 2.5 million head that were already in place. Today there are more than 3.5 million head. Concern about the optimal dairy cattle herd size is based on the possible pressure on land that results from larger herds.
Another concern is the possibility of environmental degradation in marginal areas as population increases push people to migrate from high-potential areas, leading to overgrazing.
The United States Department of Agriculture (USDA) points out that “[greenhouse gas] GHG emissions from live-stock are inherently tied to livestock population sizes because the livestock are either directly or indirectly the source for the emissions” (HSUS Report). Population density is also of importance.
GHGs (CO2, CH4 and N2O) from dairy cattle waste, milk transportation, cooling and processing in Kenya are an issue, but their magnitude and significance for the climate are debatable. The debate is based on participants’ feelings and assumptions, as credible information on the issue is lacking.
At the market level, some quantities of GHGs are produced by the transportation, cooling and processing of milk. Although dairy production in central Kenya is intensive, the use of commercial feeds is minimal. There is sufficient
demand for manure as crop fertilizer to utilize all the manure produced, without creating disposal problems. The establishment of milk coolers and processing plants, as for other plants, must conform to the Environmental
Management and Coordination Act (1999), the Waste Management Regulations (2006) and other regulations such as those for water quality. The Environmental Management and Coordination Act address environmental protection, impact assessment, monitoring and restoration. The waste management regulations aim to streamline the handling, transportation and disposal of various types of waste so as to protect human health and the environment.
One issue that has not received adequate attention is the reckless use and disposal of plastic materials for packaging milk. This inadequate attention may be due to the overwhelming use of plastics in Kenya, a lack of information about the extent to which plastics are used, or a lack of capacity to deal with the issue.
21
DAIRYREPORTS
Chapter 8
Employment in the Dairy Industry
In collaboration with MOLD, the Kenya Agricultural Research Institute (KARI) and the International Livestock Research Institute (ILRI), FAO and SDP estimated the employment created by the dairy industry. At the farm level, for every 1 000 litres of milk produced daily, dairy activities generate an estimated 23 full-time jobs for the self-employed, 50 per-manent full-time jobs for employees, and three full-time casual labour jobs, making a total of 77 direct farm jobs per 1 000 litres of daily milk production. This translates into a total of about 841 000 full-time jobs generated by dairying at the farm level (Staal, Pratt and Jabbar, 2008).
These estimates are based on a total of about 2 million dairy farm households and a dairy herd of 5 million head (SDP estimates); other sources give different estimates, such as MOLD’s for 600 000 to 800 000 farm households and a herd of about 3.5 million head. The SDP estimates are based on random surveys carried out in dairy producing areas between 1999 and 2000, followed by ground-trusting surveys and complete census of selected locations (Staal, Pratt and Jabbar, 2008), so are regarded as the most reliable.
Based on SDP surveys, it is estimated that the dairy processing sector creates an average of 13 jobs (12 direct and one indirect) for every 1 000 litres of milk handled. This calculation is based on the assumption that the formal market segment handles about 1.6 million litres of milk a day, which is slightly higher than the 1.1 million litres reported by KDB. About 15 000 jobs are created in the formal market.
The informal sector creates far more employment than the formal, accounting for about 70 percent of total jobs in dairy marketing and processing, because it handles the bulk of traded milk. It is estimated that about 18 employment opportunities are created for every 1 000 litres of milk a day handled through this channel. Added to the SDP estimate for the formal sector, this creates a total of about 40 000 jobs.
DAIRYREPORTS
22 Dairy development in Kenya
Chapter 9
Dairy Institutions
Institutions involved in the Kenyan dairy sector include regulators, input suppliers, service providers, market agents, research and development organizations, farmers and their groups/organizations, non-governmental organizations (NGOs), community-based organizations (CBOs), and development partners.
Regulatory institutions include KDB, which plays the lead role, government ministries such as MOLD, the Ministry of Agriculture (MOA), the Ministry of Health (MOH, through the Public Health Department), the Ministry of Trade, the Ministry of Industry (through KEBS), the Ministry of Cooperative Development (MOCD), the police, KARI, the Veterinary Vaccine Production Centre (VVPC) and the Pest Control Products Board (PCPB).
KDB was established in 1958 under the Dairy Industry Act (CAP 336), to organize, regulate and develop the dairy industry in Kenya, mainly for settler farmers. Its main role was to ensure efficient production, marketing, distribution and supply of milk and dairy products, including by ensuring stable prices, improving the quality of dairy produce, and promoting market research and private enterprise in the production, processing and marketing of dairy produce. It regulates the industry through: i) regulating milk handling practices to safeguard public health; ii) issuing licenses for domestic and export trade; iii) advising government on the orderly development of the sector; and iv) levying cess4 from dairy producers to finance its operations.
With the liberalization and decontrol of milk prices, KDB’s role in the dairy industry was re-evaluated to focus more on dairy development and promotional activities, but it still regulates. According to KDB officials, the board is mandated to develop, promote and regulate the dairy industry efficiently and sustainably and to create an enabling environment for increased private sector enterprise in milk production, processing and marketing. However, these new tasks are not backed by legislation (CAP 336), which has not been amended since liberalization and the re-evaluation of KDB’s role.
KEBS sets and enforces standards for all products and services, including those in the dairy subsector. The Public Health Division, operating within both MOH and local authorities, ensures/controls the maintenance of hygiene in milk handling activities and premises.
Regulatory institutions are better known for their enthusiast collection of fees and enforcement of regulations than for their promotional activities, which are constrained by lack of personnel, equipment and other resources, although improvements have been made.
Other than government extension officers and farmers’ groups, most input and service providers are motivated mainly by potential profits. There are a lot of unresolved issues in input and service provision, especially regarding qual-ity, particularly of feeds, AI and veterinary services.
There has been concern that agricultural research (including dairy research) does not receive adequate resources, as expressed in Vision 2030. Because of this, research on dairy-related issues is weak, particularly for sector policy and productivity at the production, processing and marketing levels.
Extension services have been inadequate, especially since the World Bank/government reforms (structural adjust-ments) of the late 1980s and early 1990s. The extensionist to farmer ratio is low, and government budgetary provisions for extension services have dwindled. Private extension is also inadequate.
In the past, dairy cooperatives contributed significantly to the development of smallholder milk marketing and provided farm inputs and services at relatively low cost (Omiti and Muma, 2000). However, cooperatives have lost out since liberalization, owing to many factors that include competition, inability to adapt to change, poor payouts, the loss of large sums of money owed by KCC (in some cases), poor management and corruption. There have been efforts to revive cooperatives and make them more relevant to members’ needs.
Soon after liberalization, the number of processors rose from three (KCC, Meru Dairy and Kitinda Dairy) to 45, but has since stabilized at about 30.
4 A local tax of K Sh 0.20 (US$0.0025) per kilogram of milk.
23
DAIRYREPORTS
Dairy Institutions
There are few agricultural credit institutions, the main one being the Agricultural Finance Corporation (AFC), which is not the most popular. Other sources of credit include commercial banks, whose credit is usually unsuitable for farming, and micro-finance institutions, which are more popular with small and medium enterprises (SMEs), including smallholder dairy farmers. Smallholder farmers’ low use of credit is due less to the unavailability of credit than to the conditions and cost of credit, collateral requirements and inadequate grace periods, among other factors.
Other relevant institutions are NGOs such as Land O’Lake, Heifer Project International, TechnoServe, SITE, Action Aid and church-based organizations. Land O’Lake, Heifer Project International and TechnoServe have become very active in dairy development in East Africa.
Development partner institutions such as FAO, DANIDA, the United States Agency for International Development (USAID), the United Kingdom’s Department for International Development (DFID), the International Fund for Agricul-tural Development (IFAD) and the Netherlands Development Organization (SNV) are also relevant in dairy development, as sources of innovations and funds.
Vision 2030 recognizes that the agriculture sector has been operating under outdated colonial legislation dating back to the 1930s, which is impeding growth of the sector. The government has therefore promised to reform this legislation and other areas that need updating.
The institutions that dairy farmers require most are farmer-based ones such as dairy self-help groups (SHGs), cooper-ative societies and functional service providers/institutions for AI, veterinary services and input supplies. Good functional farmers’ organizations can provide appropriate services by responding directly to farmers’ needs. Such institutions can also contribute to quality and safety assurance and self-regulation of the industry.
DAIRYREPORTS
24 Dairy development in Kenya
Chapter 10
Challenges/Problems and Recommendations
Major and commonly cited challenges/constraints in the dairy industry are: • the small size of dairy enterprises/operations, which cannot take advantage of economies of scale;• smallholders’ lack of dairy production/management skills;• dairy farmers’ failure to adopt a collective approach or organize themselves, resulting in inadequate and inef-
ficient dairy cooperatives, groups and marketing organizations;• the lack of influence in market, policy and legislation decisions for many industry players;• lack of adequately trained and qualified staff at all levels of the dairy value chain;• inefficient input supply and other service delivery to dairy farmers;• poor-quality feeds on the market, and poor feeding regimes;• inadequate access to breeding/AI services due to costs and poor infrastructure, leading to the widespread use
of bulls of unknown genetic value;• poor genetic makeup of the dairy herd, leading to low productivity, particularly in smallholder dairy farms;• inadequate and high-cost animal health care;• fluctuations in milk supply, due to reliance on fluctuating seasonal forage availability because of high depen-
dence on rainfed agriculture;• high consumption of unprocessed milk, even in urban centres;• relatively high consumption of liquid milk compared with value-added processed dairy products;• the large number of processors for the total quantity of milk produced, and lack of organization among these
processors;• inadequate enforcement of regulations on livestock movement, leading to spread of cattle diseases;• poor rural infrastructure, inefficient transportation of raw milk and poor access to dairy markets;• lack of quality up-to-date information/data on dairy and the poor quality of what is available; • an unpredictable dairy policy and legal environment.
The small size of many dairy enterprises/farms prevents economies of scale, and is best overcome by building farm-ers’ collective capacity. There is a general shortage of well-trained and updated personnel in the whole value chain. This can be addressed by establishing new or strengthening existing dairy institutions, such as Naivasha Dairy Training Institute (NDTI), to focus on capacity building in the dairy industry.
At the farm level, longstanding issues include the poor quality and high cost of inputs and services, poor terms of trade and hence low prices for milk, and poor access to information and markets.
At the market level, challenges include the quality and safety of milk, owing to the high proportion of raw milk channelled through the market; the cost of milk collection, transportation and distribution, due to poor infrastructure; and under-utilization of processors’ capacity, owing to the higher demand for liquid milk than for high-value products.
All of these issues should be addressed through a combination of training, information dissemination and policy that creates an enabling environment for honest trade and robust regulations.
The quality and availability of dairy information continue to be challenges. The need for clearer policy and legal instruments is also unsatisfied, despite the many years and capital invested in developing and formulating these instru-ments and the government’s declared commitment to reforming the regulatory environment.
Most of the challenges in the dairy industry need to be addressed – first and foremost – through a clear and ena-bling policy and legal environment developed through an effective consultative process. Industry stakeholders should be properly consulted and own the resulting consultative outputs.
25
DAIRYREPORTS
Chapter 11
Discussion and Conclusions
Kenya’s dairy industry requires a new approach to development. The challenges have remained, despite efforts to resolve them.
Before the crises of 2008, the dairy industry, particularly the formal sector, was growing, as shown in Figure 12. The main challenges remain improvement of quality, reduction of wastage and costs along the value chain, and obtaining access to the export market. The terms of trade have remained bad for dairy farmers, and worsened after the crisis, when the costs of inputs, particularly feeds and veterinary services, increased while the price of milk rose by only a small margin.
The feeding of dairy cattle has been poor for a long time. The dairy feeds available on the market are of low qual-ity, and this, combined with their high prices, makes feed exorbitant. The feed market has no effective mechanism for ensuring quality.
Most farm inputs and services for smallholders are also of low quality, but sold at the prices for high quality. Poor AI services in most areas, combined with low conception rates, genetic regression due to the use of bulls of unknown value and production losses resulting from long calving intervals, make breeding expensive.
Owing to market failure after liberalization of the dairy industry, milk marketing now requires more attention. Pro-duction also needs attention, to improve the whole value chain.
The quality of dairy industry information remains a challenge. It is not only the availability of information, but the whole information system – generation, collection, transmission, consolidation, analysis, storage, accessibility and dis-semination – that needs attention. Information may exist but is unavailable. Quality information is essential for new investors and the future development of the industry.
The reliability of available information such as cattle population is also doubtful. An SDP survey in 2003 and 2004 found that the government’s cattle population statistics were largely underestimated, and that the actual population may be three times as large. Livestock census is likely to be included in the human census of 2009, but it may not be necessary to carry out a costly livestock census because properly designed scientific surveys can provide reliable information.
Although New KCC claims to lead the milk market, it is still a para-statal six years after the government first prom-ised to hand it back to dairy farmers. It is important that New KCC is returned to the farmers.
There is need for policies that create an enabling environment for farmer-owned institutions to function efficiently and thrive and that allow efficient input and service provision. An inclusive and consultative industry-driven policy for-mulation process, and government commitment to implementation are essential.
In spite of the efforts made, there have been very few technological breakthroughs in dairy production and market-ing. In the 1980s, a major breakthrough at the production level was the introduction of bulk fodder production and cut-and-carry feeding systems (zero grazing) to smallholder dairy farms.
It takes a long time for milk from smallholder farms to reach the market, and when it arrives part of it is already on the threshold of accepted microbial loads. Market players have used a wide range of methods, both legal and illegal, to ensure that milk is delivered to the next market level. It is known, for example, that hydrogen peroxide is often used for this. Nevertheless, there has been much resistance to the official acceptance of preservation methods other than the cold chain, which many consider too costly. The lactoperoxidase system has been resisted, mainly because the Codex Alimentarius Commission has barred milk treated with lactoperoxidase from international trade.
Despite the problems in the dairy industry, it remains one of the economic subsectors with good potential for increasing income and creating employment in rural areas. Milk production can be increased through better manage-ment, without necessarily increasing the dairy herd size. As well as generating income and employment, dairy also contributes to the nutritional well-being of many Kenyans as the most available source of animal protein.
DAIRYREPORTS
26 Dairy development in Kenya
References
Bebe, B.O. 2003. Herd dynamics of smallholder dairy in the Kenya highlands. Wageningen University, the Netherlands. ISBN:
90-5808-788-3. (Ph.D. thesis)
Ekbom, A. 2002. Kenya – Environmental Policy Brief. Point of departure for a discussion of poverty and environmentally
sustainable development. EME/Gbg University
FAO. 1993. Kenya Dairy Development Project preparation report. Report 34/93 CP–KEN 33. Rome.
FAO. 2007. The State of the World’s Animal Genetic Resources for Food and Agriculture – in brief, edited by D. Pilling and
B. Rischkowsky. Rome.
Government of the Republic of Kenya. 2007. Vision 2030 by the Ministry of Planning and National Development and the
National Economic and Social Council (NESC), Office of the President. Nairobi.
JICA. 2002. JICA country profile on environment – Kenya.Nairobi, Japanese International Cooperation Agency, Planning and
Evaluation Department.
Kenya Bureau of Standards. 2000. Kenya Standard Code of Hygienic Practice for Production, Handling and Distribution of
Milk and Milk Products. KS. 67. 020. Nairobi.
Kenya Dairy Board. Various publications.
Lekasi, J.K., Tanner, J.C., Kimani, S.K. & Harris, P.J.C. 1998. Manure management in the Kenya highlands: Practices and
potential. Brainsdale, Victoria, Australia, Henry Doubleday Research Association. 35 pp.
Minae, S. 1981. Evaluation of the performance of the Marketing Board: The small farmer milk marketing system in Kenya.
Ithaca, New York, Cornell University. (Ph.D. dissertation)
MOLD. 1991. Kenya Dairy Master Plan. Report prepared by DANIDA. Nairobi.
MOLD. Various. Animal production annual reports, statistics and other publications.
Muriuki, H.G. 1991. Liquid milk supply and demand in the formal (KCC) market in Kenya: A government price fixed market.
Illinois, USA, University of Illinois at Urbana-Champaign. (M.Sc. thesis)
Muriuki, H.G. 2003. Assessment of the level, type and value of post harvest milk losses in Kenya. Results of a rapid appraisal
for a national sub-sector assessment for FAO.
Muriuki, H.G. 2007. Institutional development and future challenges of National dairy regulatory authorities in developing
countries – A case study for the Kenya Dairy Board. Prepared for FAO.
Neumann, C. & Harris, D.M. 1999. Contribution of animal source foods in improving diet quality for children in the
developing world. Paper prepared for the World Bank.
Omiti, J. 2002. Impacts of liberalization in Kenya’s dairy sector. Proceedings of a South–South workshop held at NDDB,
Anand, India, 13–16 March 2001. Anand, India, National Dairy Development Board (NDDB), and Nairobi, ILRI. (multi-
document CD-rom).
Omiti, J. & Muma, M. 2000. Policy and institutional strategies to commercialise the dairy sector in Kenya. IPAR Occasional
Paper No. 006/2000. Nairobi, Institute of Policy Analysis and Research (IPAR).
Omore, A., Muriuki, H., Kenyanjui, M., Owango, M. & Staal, S.J. 1999. The Kenya dairy sub-sector; A rapid appraisal.
Smallholder Dairy (Research and Development) Project Report. Nairobi. 51 pp.
Omore, A., Arimi, S., Kangethe, E., McDermott, J., Staal, S., Ouma, E., Odhiambo, J., Mwangi, A., Aboge, G., Koroti,
E. & Koech, R. 2001 a. Assessing and managing milk-borne health risks for the benefit of consumers in Kenya.
MOA/KARI/ILRI/UON/KEMRI Collaborative Research Report, Smallholder Dairy (Research & Development) Project. Nairobi.
Omore, A., Cheng’ole Mulindo, J., Fakhrul Islam, S.M., Nurah, G., Khan, M.I., Staal, S.J. & Dugdill, B.T. 2001 b.
Employment generation through small-scale dairy marketing and processing: Experiences from Kenya, Bangladesh and
Ghana. A joint study by the ILRI Market-oriented Smallholder Dairy Project and the FAO Animal Production and Health
Division. (draft)
Ouma, E., Staal, S.J., Omore, A., Njoroge, L., Kang’ethe, E.K.. Arimi, S.M. & Njubi, D. 2000. Consumption patterns of
dairy products in Kenya. A Smallholder Dairy (Research and Development) Project report. Nairobi.
Rege, J.E.O. & Gibson, J.P. (no date). Animal genetic resources and economic development: issues in relation to economic
valuation. Nairobi, ILRI.
Republic of Kenya. 1958. The Dairy Industry Act, Chapter 336 of the Laws of Kenya. 1984 Revised Edition. Nairobi.
27
DAIRYREPORTS
References
Republic of Kenya. 1999. The Environmental Management and Co-ordination Act, 1999. Nairobi.
Republic of Kenya. 2007: Delivering development to all Kenyans. Nairobi.
Republic of Kenya. 2007. Statistical Abstract, 2007. Prepared by Kenya Bureau of Statistics, Ministry of Planning and National
Development. Nairobi.
Republic of Kenya. 2008: Economic Survey, 2008. Prepared by Kenya Bureau of Statistics, Ministry of Planning and National
Development. Nairobi.
Republic of Kenya. 2008: Kenya Facts and Figures, 2008. Prepared by Kenya Bureau of Statistics, Ministry of Planning and
National Development. Nairobi.
SDP. 2004. A series of policy briefs (Demand for dairy products in Kenya; Employment generation in the Kenya dairy industry;
Competitiveness of the smallholder dairy enterprise in Kenya; Public health issues in Kenyan milk markets; Improved child
nutrition through cattle ownership in Kenya; and Uncertainty of cattle numbers in Kenya) for the Dairy Industry Policy
Reform Forum held at Grand Regency Hotel, Nairobi, in April 2004.
Staal, S., Waithaka, M., Njoroge, L., Mwangi, D.M., Njubi, D. & Wokabi, A. 2003. Costs of milk production in Kenya.
MoA/ KARI/ILRI Collaborative Research Report. Smallholder Dairy (Research and Development) Project. Nairobi.
Staal, S.J., Pratt, A.N. & Jabbar, M. 2008. Dairy development for the resource poor Part 2: Kenya and Ethiopia dairy devel-
opment case studies. PPLPI Working Paper No. 44-2. Nairobi, ILRI/FAO.
Steinfeld, H., Gerber, P., Wassenaar, T., Castel, V., Rosales, M. & de Han, C. 2006. Livestock long shadow, environmental
issue and options. Rome, FAO.
Thornton, P.K., van de Steeg, J., Notenbaert, A. & Herrero, M. 2008. The livestock–climate–poverty nexus. A discussion
paper on ILRI research in relation to climate change. Discussion Paper No. 11. Nairobi, ILRI.
DAIRYREPORTS
28 Dairy development in Kenya
Annex 1
Agro-climatic zones in Kenya
1 0 0 0 1 0 0 K i l o m e t e r s
A G R O C L I M A T I C Z O N E S I N K E N Y A H U M I D S U B - H U M I D S E M I - H U M I D S E M I - H U M I D T O S E M I - A R I D S E M I - A R I D A R I D V E R Y A R I D
N
Source: Ministry of Livestock Development
29
DAIRYREPORTS
Annexes
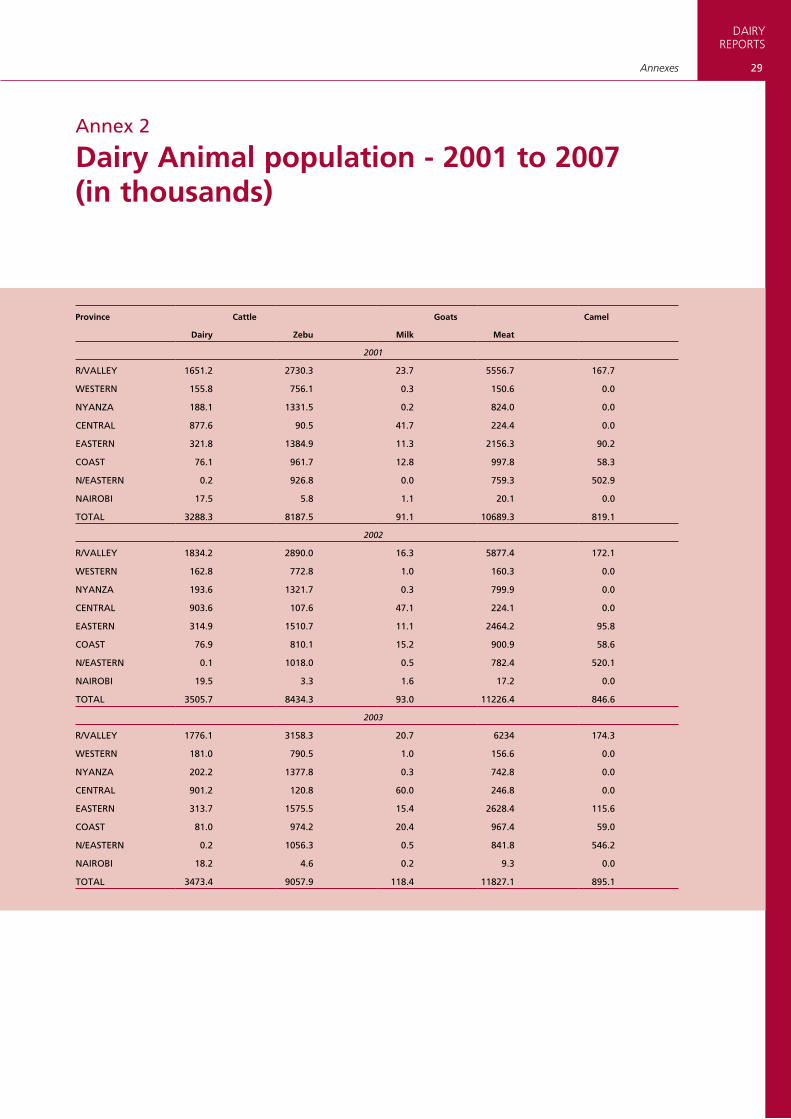
Annex 2
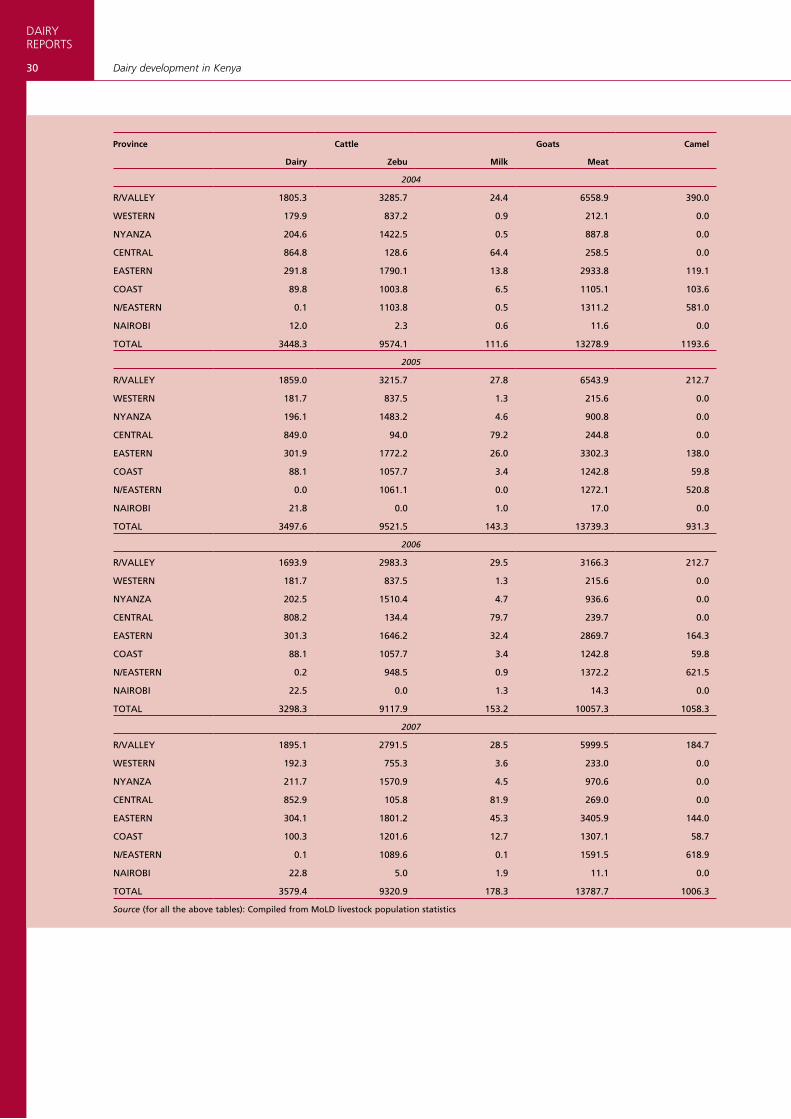
Dairy Animal population - 2001 to 2007 (in thousands)
Province Cattle Goats Camel
Dairy Zebu Milk Meat
2001
r/VALLEY 1651.2 2730.3 23.7 5556.7 167.7
WESTErN 155.8 756.1 0.3 150.6 0.0
NYANZA 188.1 1331.5 0.2 824.0 0.0
CENTrAL 877.6 90.5 41.7 224.4 0.0
EASTErN 321.8 1384.9 11.3 2156.3 90.2
COAST 76.1 961.7 12.8 997.8 58.3
N/EASTErN 0.2 926.8 0.0 759.3 502.9
NAIrOBI 17.5 5.8 1.1 20.1 0.0
TOTAL 3288.3 8187.5 91.1 10689.3 819.1
2002
r/VALLEY 1834.2 2890.0 16.3 5877.4 172.1
WESTErN 162.8 772.8 1.0 160.3 0.0
NYANZA 193.6 1321.7 0.3 799.9 0.0
CENTrAL 903.6 107.6 47.1 224.1 0.0
EASTErN 314.9 1510.7 11.1 2464.2 95.8
COAST 76.9 810.1 15.2 900.9 58.6
N/EASTErN 0.1 1018.0 0.5 782.4 520.1
NAIrOBI 19.5 3.3 1.6 17.2 0.0
TOTAL 3505.7 8434.3 93.0 11226.4 846.6
2003
r/VALLEY 1776.1 3158.3 20.7 6234 174.3
WESTErN 181.0 790.5 1.0 156.6 0.0
NYANZA 202.2 1377.8 0.3 742.8 0.0
CENTrAL 901.2 120.8 60.0 246.8 0.0
EASTErN 313.7 1575.5 15.4 2628.4 115.6
COAST 81.0 974.2 20.4 967.4 59.0
N/EASTErN 0.2 1056.3 0.5 841.8 546.2
NAIrOBI 18.2 4.6 0.2 9.3 0.0
TOTAL 3473.4 9057.9 118.4 11827.1 895.1
DAIRYREPORTS
30 Dairy development in Kenya
Province Cattle Goats Camel
Dairy Zebu Milk Meat
2004
r/VALLEY 1805.3 3285.7 24.4 6558.9 390.0
WESTErN 179.9 837.2 0.9 212.1 0.0
NYANZA 204.6 1422.5 0.5 887.8 0.0
CENTrAL 864.8 128.6 64.4 258.5 0.0
EASTErN 291.8 1790.1 13.8 2933.8 119.1
COAST 89.8 1003.8 6.5 1105.1 103.6
N/EASTErN 0.1 1103.8 0.5 1311.2 581.0
NAIrOBI 12.0 2.3 0.6 11.6 0.0
TOTAL 3448.3 9574.1 111.6 13278.9 1193.6
2005
r/VALLEY 1859.0 3215.7 27.8 6543.9 212.7
WESTErN 181.7 837.5 1.3 215.6 0.0
NYANZA 196.1 1483.2 4.6 900.8 0.0
CENTrAL 849.0 94.0 79.2 244.8 0.0
EASTErN 301.9 1772.2 26.0 3302.3 138.0
COAST 88.1 1057.7 3.4 1242.8 59.8
N/EASTErN 0.0 1061.1 0.0 1272.1 520.8
NAIrOBI 21.8 0.0 1.0 17.0 0.0
TOTAL 3497.6 9521.5 143.3 13739.3 931.3
2006
r/VALLEY 1693.9 2983.3 29.5 3166.3 212.7
WESTErN 181.7 837.5 1.3 215.6 0.0
NYANZA 202.5 1510.4 4.7 936.6 0.0
CENTrAL 808.2 134.4 79.7 239.7 0.0
EASTErN 301.3 1646.2 32.4 2869.7 164.3
COAST 88.1 1057.7 3.4 1242.8 59.8
N/EASTErN 0.2 948.5 0.9 1372.2 621.5
NAIrOBI 22.5 0.0 1.3 14.3 0.0
TOTAL 3298.3 9117.9 153.2 10057.3 1058.3
2007
r/VALLEY 1895.1 2791.5 28.5 5999.5 184.7
WESTErN 192.3 755.3 3.6 233.0 0.0
NYANZA 211.7 1570.9 4.5 970.6 0.0
CENTrAL 852.9 105.8 81.9 269.0 0.0
EASTErN 304.1 1801.2 45.3 3405.9 144.0
COAST 100.3 1201.6 12.7 1307.1 58.7
N/EASTErN 0.1 1089.6 0.1 1591.5 618.9
NAIrOBI 22.8 5.0 1.9 11.1 0.0
TOTAL 3579.4 9320.9 178.3 13787.7 1006.3
Source (for all the above tables): Compiled from MoLD livestock population statistics
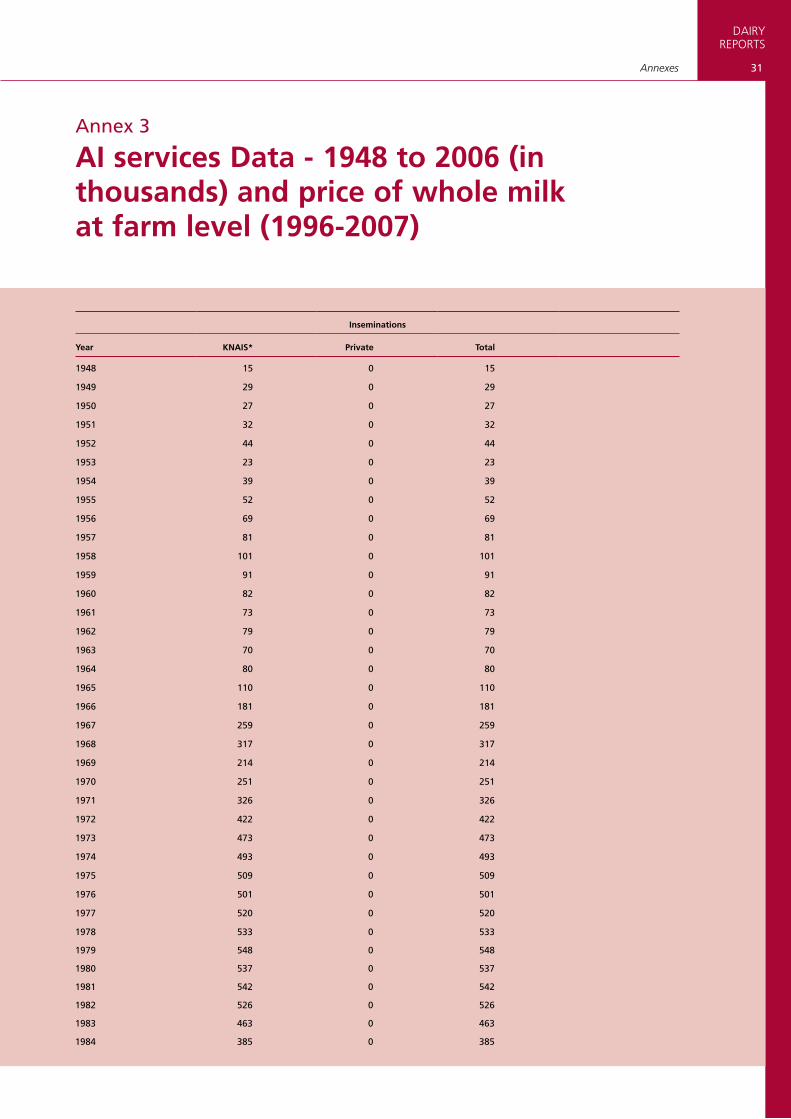
31
DAIRYREPORTS
Annexes
Annex 3
AI services Data - 1948 to 2006 (in thousands) and price of whole milk at farm level (1996-2007)
Inseminations
Year KNAIS* Private Total
1948 15 0 15
1949 29 0 29
1950 27 0 27
1951 32 0 32
1952 44 0 44
1953 23 0 23
1954 39 0 39
1955 52 0 52
1956 69 0 69
1957 81 0 81
1958 101 0 101
1959 91 0 91
1960 82 0 82
1961 73 0 73
1962 79 0 79
1963 70 0 70
1964 80 0 80
1965 110 0 110
1966 181 0 181
1967 259 0 259
1968 317 0 317
1969 214 0 214
1970 251 0 251
1971 326 0 326
1972 422 0 422
1973 473 0 473
1974 493 0 493
1975 509 0 509
1976 501 0 501
1977 520 0 520
1978 533 0 533
1979 548 0 548
1980 537 0 537
1981 542 0 542
1982 526 0 526
1983 463 0 463
1984 385 0 385
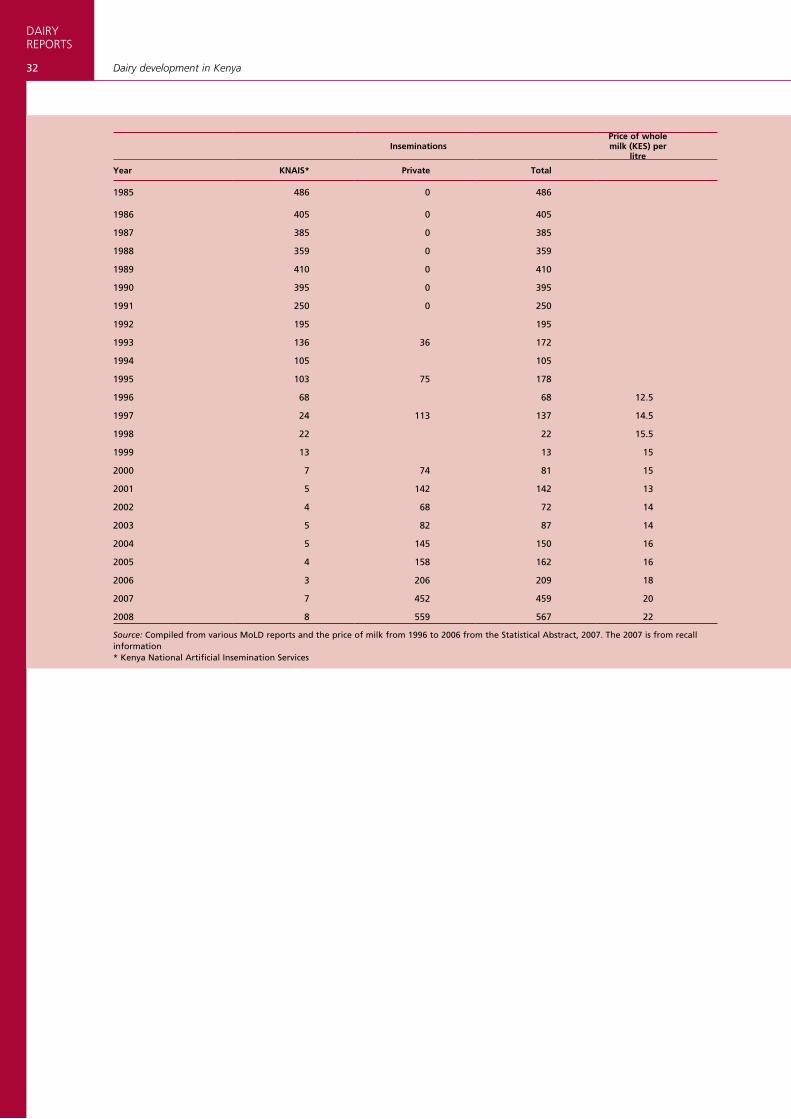
DAIRYREPORTS
32 Dairy development in Kenya
InseminationsPrice of whole milk (KES) per
litre
Year KNAIS* Private Total
1985 486 0 486
1986 405 0 405
1987 385 0 385
1988 359 0 359
1989 410 0 410
1990 395 0 395
1991 250 0 250
1992 195 195
1993 136 36 172
1994 105 105
1995 103 75 178
1996 68 68 12.5
1997 24 113 137 14.5
1998 22 22 15.5
1999 13 13 15
2000 7 74 81 15
2001 5 142 142 13
2002 4 68 72 14
2003 5 82 87 14
2004 5 145 150 16
2005 4 158 162 16
2006 3 206 209 18
2007 7 452 459 20
2008 8 559 567 22
Source: Compiled from various MoLD reports and the price of milk from 1996 to 2006 from the Statistical Abstract, 2007. The 2007 is from recall information* Kenya National Artificial Insemination Services
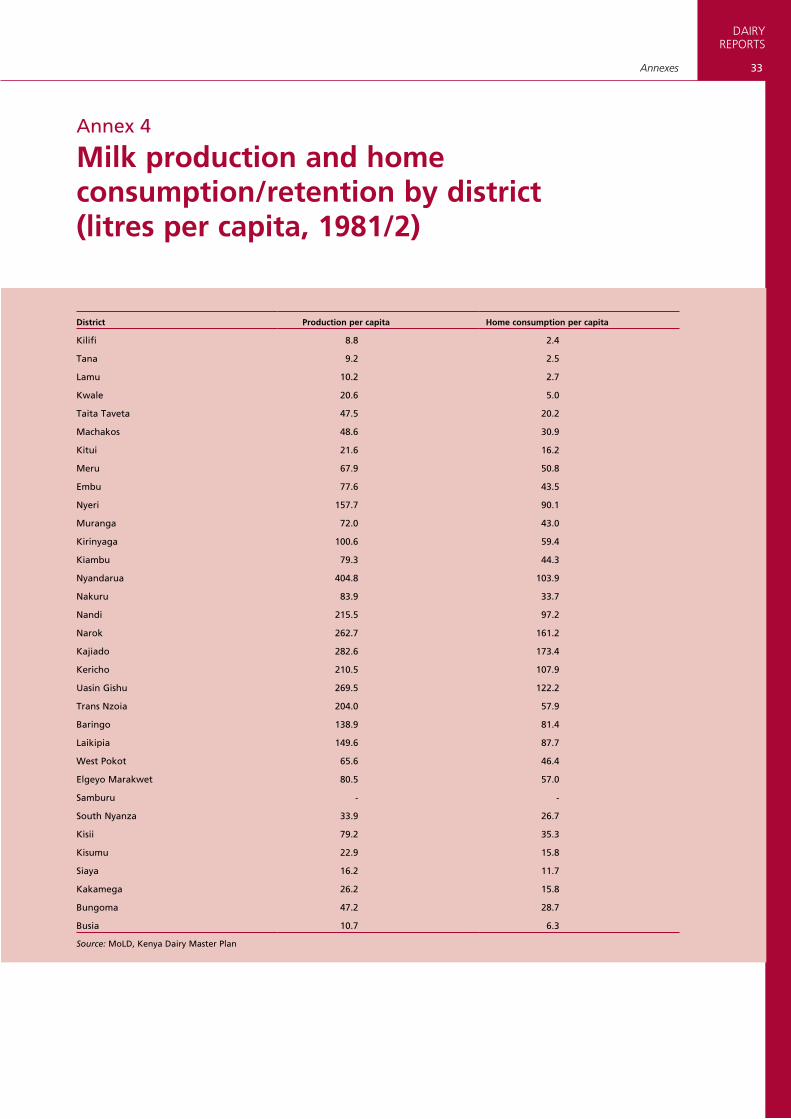
33
DAIRYREPORTS
Annexes
Annex 4
Milk production and home consumption/retention by district (litres per capita, 1981/2)
District Production per capita Home consumption per capita
Kilifi 8.8 2.4
Tana 9.2 2.5
Lamu 10.2 2.7
Kwale 20.6 5.0
Taita Taveta 47.5 20.2
Machakos 48.6 30.9
Kitui 21.6 16.2
Meru 67.9 50.8
Embu 77.6 43.5
Nyeri 157.7 90.1
Muranga 72.0 43.0
Kirinyaga 100.6 59.4
Kiambu 79.3 44.3
Nyandarua 404.8 103.9
Nakuru 83.9 33.7
Nandi 215.5 97.2
Narok 262.7 161.2
Kajiado 282.6 173.4
Kericho 210.5 107.9
Uasin Gishu 269.5 122.2
Trans Nzoia 204.0 57.9
Baringo 138.9 81.4
Laikipia 149.6 87.7
West Pokot 65.6 46.4
Elgeyo Marakwet 80.5 57.0
Samburu - -
South Nyanza 33.9 26.7
Kisii 79.2 35.3
Kisumu 22.9 15.8
Siaya 16.2 11.7
Kakamega 26.2 15.8
Bungoma 47.2 28.7
Busia 10.7 6.3
Source: MoLD, Kenya Dairy Master Plan
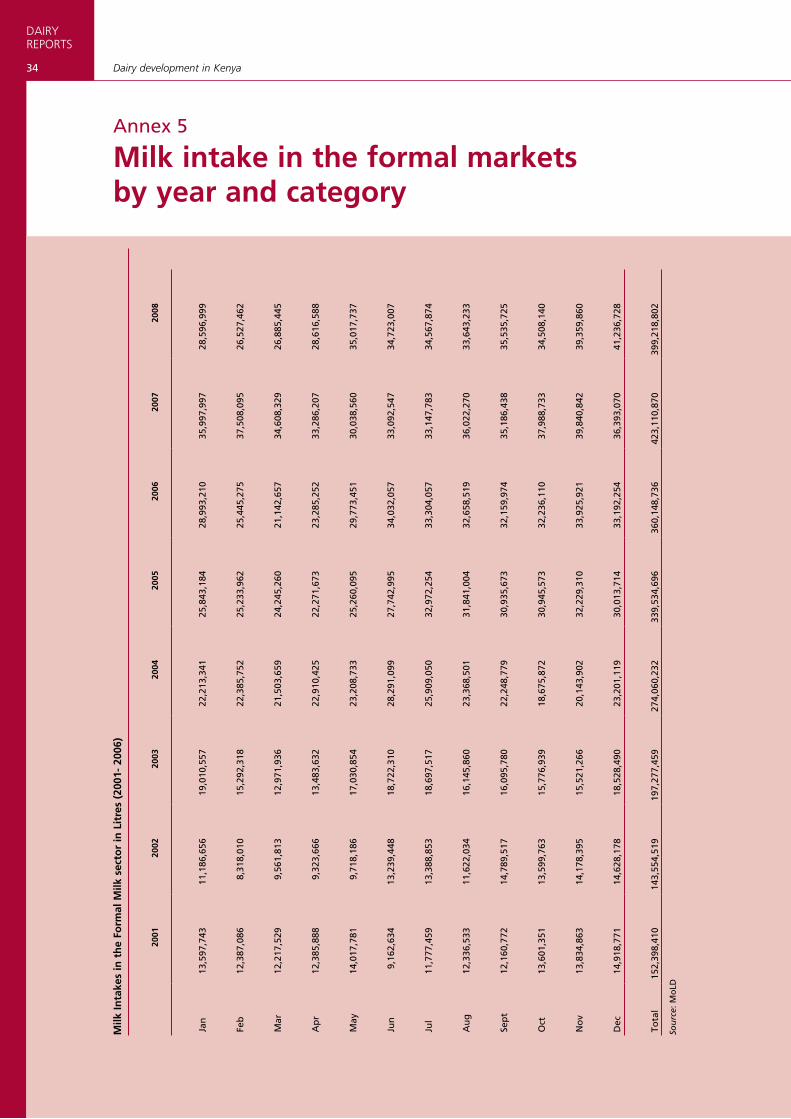
DAIRYREPORTS
34 Dairy development in Kenya
Annex 5
Milk intake in the formal markets by year and category
Milk
Inta
kes
in t
he
Form
al M
ilk s
ecto
r in
Lit
res
(200
1- 2
006)
20
0120
0220
0320
0420
0520
0620
0720
08
Jan
1
3,59
7,74
3 1
1,18
6,65
6 1
9,01
0,55
7 2
2,21
3,34
1 2
5,84
3,18
4 2
8,99
3,21
0 3
5,99
7,99
7 2
8,59
6,99
9
Feb
1
2,38
7,08
6 8
,318
,010
1
5,29
2,31
8 2
2,38
5,75
2 2
5,23
3,96
2 2
5,44
5,27
5 3
7,50
8,09
5 2
6,52
7,46
2
Mar
1
2,21
7,52
9 9
,561
,813
1
2,97
1,93
6 2
1,50
3,65
9 2
4,24
5,26
0 2
1,14
2,65
7 3
4,60
8,32
9 2
6,88
5,44
5
Ap
r 1
2,38
5,88
8 9
,323
,666
1
3,48
3,63
2 2
2,91
0,42
5 2
2,27
1,67
3 2
3,28
5,25
2 3
3,28
6,20
7 2
8,61
6,58
8
May
1
4,01
7,78
1 9
,718
,186
1
7,03
0,85
4 2
3,20
8,73
3 2
5,26
0,09
5 2
9,77
3,45
1 3
0,03
8,56
0 3
5,01
7,73
7
Ju
n
9,1
62,6
34
13,
239,
448
18,
722,
310
28,
291,
099
27,
742,
995
34,
032,
057
33,
092,
547
34,
723,
007
Ju
l 1
1,77
7,45
9 1
3,38
8,85
3 1
8,69
7,51
7 2
5,90
9,05
0 3
2,97
2,25
4 3
3,30
4,05
7 3
3,14
7,78
3 3
4,56
7,87
4
Au
g
12,
336,
533
11,
622,
034
16,
145,
860
23,
368,
501
31,
841,
004
32,
658,
519
36,
022,
270
33,
643,
233
Sep
t 1
2,16
0,77
2 1
4,78
9,51
7 1
6,09
5,78
0 2
2,24
8,77
9 3
0,93
5,67
3 3
2,15
9,97
4 3
5,18
6,43
8 3
5,53
5,72
5
Oct
1
3,60
1,35
1 1
3,59
9,76
3 1
5,77
6,93
9 1
8,67
5,87
2 3
0,94
5,57
3 3
2,23
6,11
0 3
7,98
8,73
3 3
4,50
8,14
0
No
v 1
3,83
4,86
3 1
4,17
8,39
5 1
5,52
1,26
6 2
0,14
3,90
2 3
2,22
9,31
0 3
3,92
5,92
1 3
9,84
0,84
2 3
9,35
9,86
0
Dec
1
4,91
8,77
1 1
4,62
8,17
8 1
8,52
8,49
0 2
3,20
1,11
9 3
0,01
3,71
4 3
3,19
2,25
4 3
6,39
3,07
0 41
,236
,728
To
tal
152
,398
,410
1
43,5
54,5
19
197
,277
,459
2
74,0
60,2
32
339
,534
,696
3
60,1
48,7
36
423
,110
,870
39
9,21
8,80
2
Sou
rce:
Mo
LD
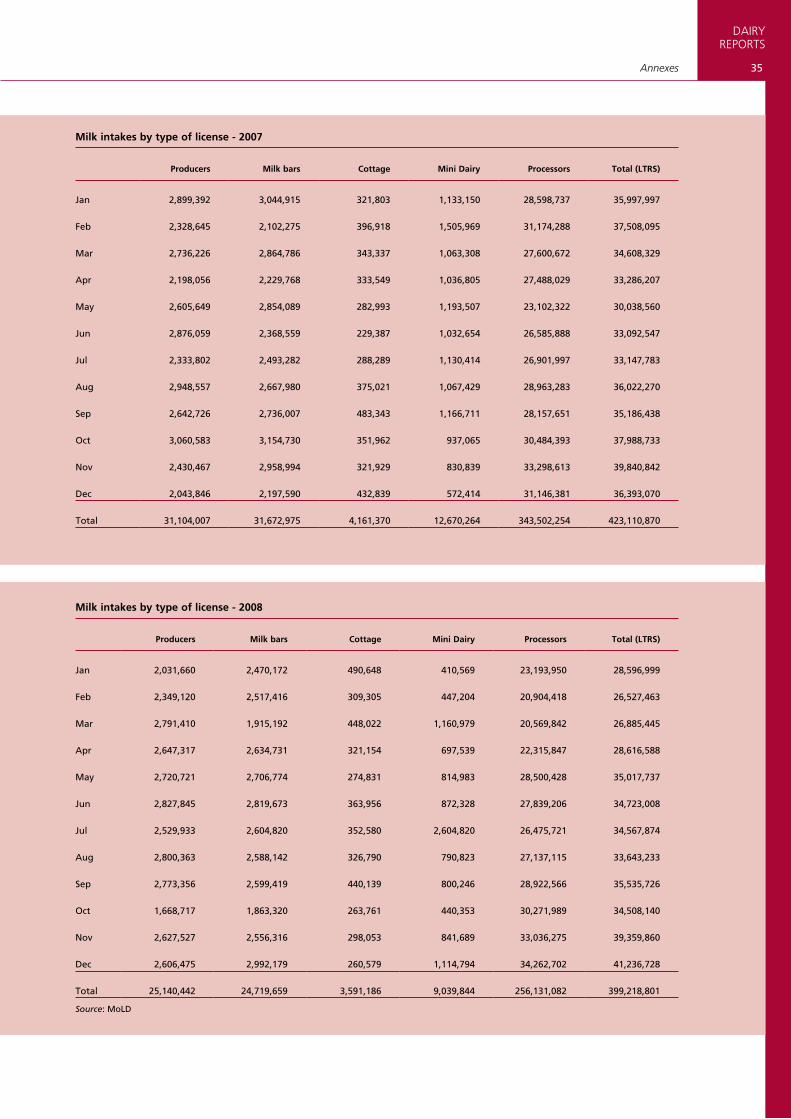
35
DAIRYREPORTS
Annexes
Milk intakes by type of license - 2007
Producers Milk bars Cottage Mini Dairy Processors Total (LTRS)
Jan 2,899,392 3,044,915 321,803 1,133,150 28,598,737 35,997,997
Feb 2,328,645 2,102,275 396,918 1,505,969 31,174,288 37,508,095
Mar 2,736,226 2,864,786 343,337 1,063,308 27,600,672 34,608,329
Apr 2,198,056 2,229,768 333,549 1,036,805 27,488,029 33,286,207
May 2,605,649 2,854,089 282,993 1,193,507 23,102,322 30,038,560
Jun 2,876,059 2,368,559 229,387 1,032,654 26,585,888 33,092,547
Jul 2,333,802 2,493,282 288,289 1,130,414 26,901,997 33,147,783
Aug 2,948,557 2,667,980 375,021 1,067,429 28,963,283 36,022,270
Sep 2,642,726 2,736,007 483,343 1,166,711 28,157,651 35,186,438
Oct 3,060,583 3,154,730 351,962 937,065 30,484,393 37,988,733
Nov 2,430,467 2,958,994 321,929 830,839 33,298,613 39,840,842
Dec 2,043,846 2,197,590 432,839 572,414 31,146,381 36,393,070
Total 31,104,007 31,672,975 4,161,370 12,670,264 343,502,254 423,110,870
Milk intakes by type of license - 2008
Producers Milk bars Cottage Mini Dairy Processors Total (LTRS)
Jan 2,031,660 2,470,172 490,648 410,569 23,193,950 28,596,999
Feb 2,349,120 2,517,416 309,305 447,204 20,904,418 26,527,463
Mar 2,791,410 1,915,192 448,022 1,160,979 20,569,842 26,885,445
Apr 2,647,317 2,634,731 321,154 697,539 22,315,847 28,616,588
May 2,720,721 2,706,774 274,831 814,983 28,500,428 35,017,737
Jun 2,827,845 2,819,673 363,956 872,328 27,839,206 34,723,008
Jul 2,529,933 2,604,820 352,580 2,604,820 26,475,721 34,567,874
Aug 2,800,363 2,588,142 326,790 790,823 27,137,115 33,643,233
Sep 2,773,356 2,599,419 440,139 800,246 28,922,566 35,535,726
Oct 1,668,717 1,863,320 263,761 440,353 30,271,989 34,508,140
Nov 2,627,527 2,556,316 298,053 841,689 33,036,275 39,359,860
Dec 2,606,475 2,992,179 260,579 1,114,794 34,262,702 41,236,728
Total 25,140,442 24,719,659 3,591,186 9,039,844 256,131,082 399,218,801
Source: MoLD
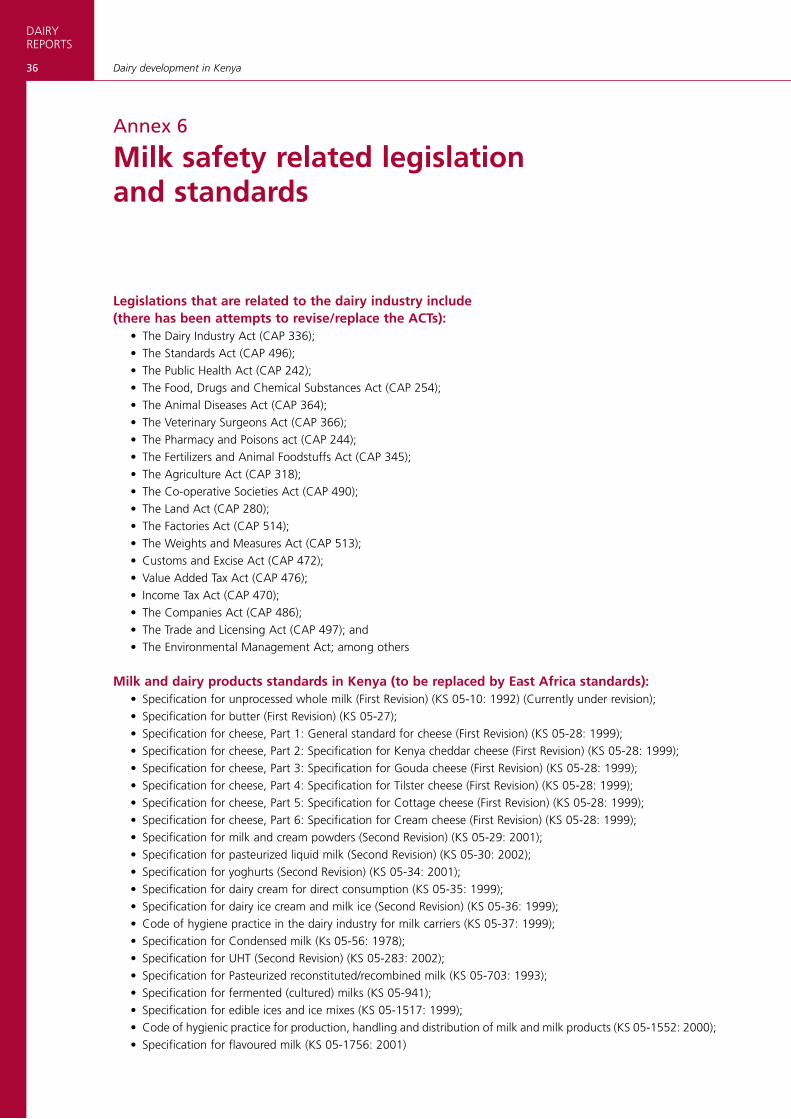
DAIRYREPORTS
36 Dairy development in Kenya
Annex 6
Milk safety related legislation and standards
Legislations that are related to the dairy industry include (there has been attempts to revise/replace the ACTs):
• The Dairy Industry Act (CAP 336);• The Standards Act (CAP 496);• The Public Health Act (CAP 242);• The Food, Drugs and Chemical Substances Act (CAP 254);• The Animal Diseases Act (CAP 364);• The Veterinary Surgeons Act (CAP 366);• The Pharmacy and Poisons act (CAP 244);• The Fertilizers and Animal Foodstuffs Act (CAP 345);• The Agriculture Act (CAP 318);• The Co-operative Societies Act (CAP 490);• The Land Act (CAP 280);• The Factories Act (CAP 514);• The Weights and Measures Act (CAP 513);• Customs and Excise Act (CAP 472);• Value Added Tax Act (CAP 476);• Income Tax Act (CAP 470);• The Companies Act (CAP 486);• The Trade and Licensing Act (CAP 497); and • The Environmental Management Act; among others
Milk and dairy products standards in Kenya (to be replaced by East Africa standards):• Specification for unprocessed whole milk (First Revision) (KS 05-10: 1992) (Currently under revision);• Specification for butter (First Revision) (KS 05-27);• Specification for cheese, Part 1: General standard for cheese (First Revision) (KS 05-28: 1999);• Specification for cheese, Part 2: Specification for Kenya cheddar cheese (First Revision) (KS 05-28: 1999);• Specification for cheese, Part 3: Specification for Gouda cheese (First Revision) (KS 05-28: 1999);• Specification for cheese, Part 4: Specification for Tilster cheese (First Revision) (KS 05-28: 1999);• Specification for cheese, Part 5: Specification for Cottage cheese (First Revision) (KS 05-28: 1999);• Specification for cheese, Part 6: Specification for Cream cheese (First Revision) (KS 05-28: 1999);• Specification for milk and cream powders (Second Revision) (KS 05-29: 2001);• Specification for pasteurized liquid milk (Second Revision) (KS 05-30: 2002);• Specification for yoghurts (Second Revision) (KS 05-34: 2001);• Specification for dairy cream for direct consumption (KS 05-35: 1999);• Specification for dairy ice cream and milk ice (Second Revision) (KS 05-36: 1999);• Code of hygiene practice in the dairy industry for milk carriers (KS 05-37: 1999);• Specification for Condensed milk (Ks 05-56: 1978);• Specification for UHT (Second Revision) (KS 05-283: 2002);• Specification for Pasteurized reconstituted/recombined milk (KS 05-703: 1993);• Specification for fermented (cultured) milks (KS 05-941);• Specification for edible ices and ice mixes (KS 05-1517: 1999);• Code of hygienic practice for production, handling and distribution of milk and milk products (KS 05-1552: 2000);• Specification for flavoured milk (KS 05-1756: 2001)
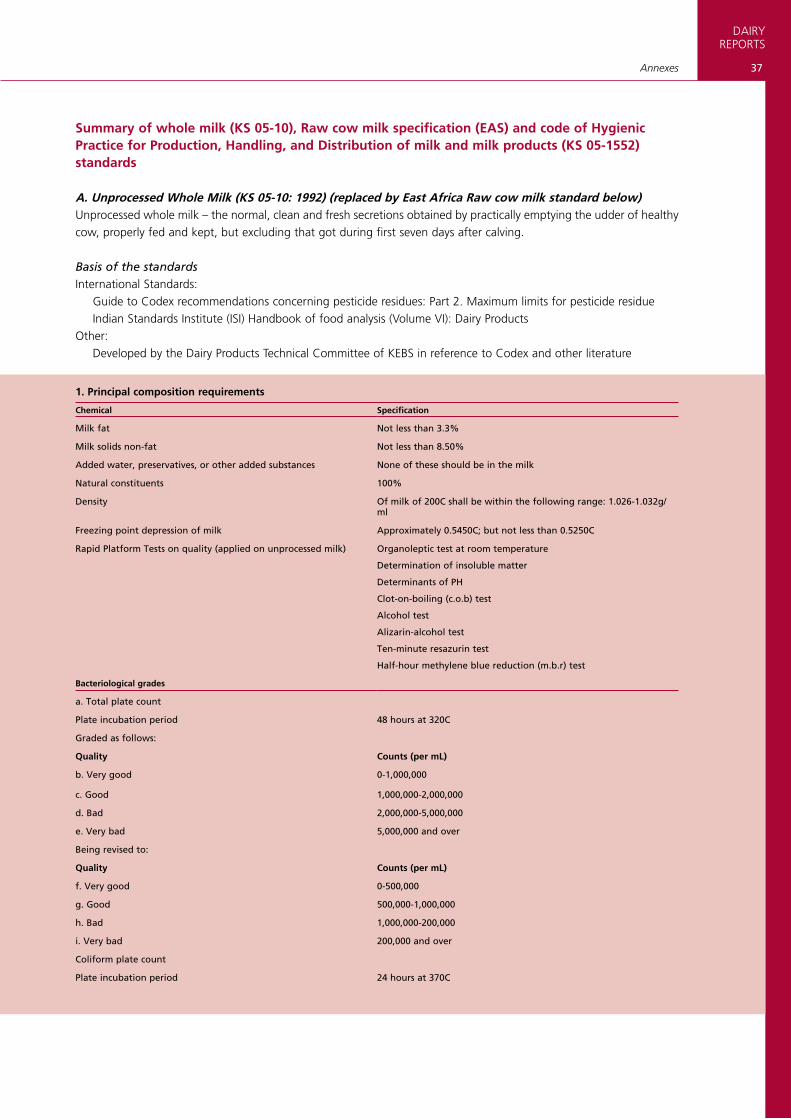
37
DAIRYREPORTS
Annexes
Summary of whole milk (KS 05-10), Raw cow milk specification (EAS) and code of Hygienic Practice for Production, Handling, and Distribution of milk and milk products (KS 05-1552) standards
A. Unprocessed Whole Milk (KS 05-10: 1992) (replaced by East Africa Raw cow milk standard below)Unprocessed whole milk – the normal, clean and fresh secretions obtained by practically emptying the udder of healthy cow, properly fed and kept, but excluding that got during first seven days after calving.
Basis of the standardsInternational Standards:
Guide to Codex recommendations concerning pesticide residues: Part 2. Maximum limits for pesticide residueIndian Standards Institute (ISI) Handbook of food analysis (Volume VI): Dairy Products
Other:Developed by the Dairy Products Technical Committee of KEBS in reference to Codex and other literature
1. Principal composition requirements
Chemical Specification
Milk fat Not less than 3.3%
Milk solids non-fat Not less than 8.50%
Added water, preservatives, or other added substances None of these should be in the milk
Natural constituents 100%
Density Of milk of 200C shall be within the following range: 1.026-1.032g/ml
Freezing point depression of milk Approximately 0.5450C; but not less than 0.5250C
rapid Platform Tests on quality (applied on unprocessed milk) Organoleptic test at room temperature
Determination of insoluble matter
Determinants of PH
Clot-on-boiling (c.o.b) test
Alcohol test
Alizarin-alcohol test
Ten-minute resazurin test
Half-hour methylene blue reduction (m.b.r) test
Bacteriological grades
a. Total plate count
Plate incubation period 48 hours at 320C
Graded as follows:
Quality Counts (per mL)
b. Very good 0-1,000,000
c. Good 1,000,000-2,000,000
d. Bad 2,000,000-5,000,000
e. Very bad 5,000,000 and over
Being revised to:
Quality Counts (per mL)
f. Very good 0-500,000
g. Good 500,000-1,000,000
h. Bad 1,000,000-200,000
i. Very bad 200,000 and over
Coliform plate count
Plate incubation period 24 hours at 370C
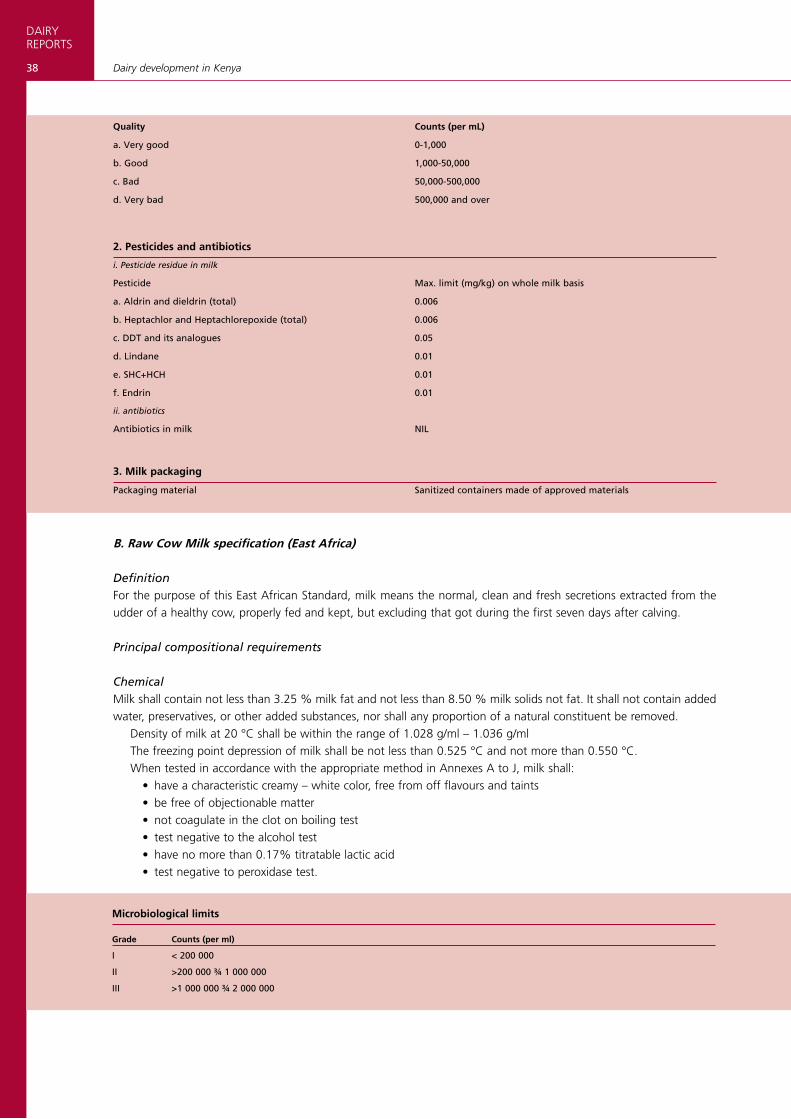
DAIRYREPORTS
38 Dairy development in Kenya
Quality Counts (per mL)
a. Very good 0-1,000
b. Good 1,000-50,000
c. Bad 50,000-500,000
d. Very bad 500,000 and over
2. Pesticides and antibiotics
i. Pesticide residue in milk
Pesticide Max. limit (mg/kg) on whole milk basis
a. Aldrin and dieldrin (total) 0.006
b. Heptachlor and Heptachlorepoxide (total) 0.006
c. DDT and its analogues 0.05
d. Lindane 0.01
e. SHC+HCH 0.01
f. Endrin 0.01
ii. antibiotics
Antibiotics in milk NIL
3. Milk packaging
Packaging material Sanitized containers made of approved materials
B. Raw Cow Milk specification (East Africa)
DefinitionFor the purpose of this East African Standard, milk means the normal, clean and fresh secretions extracted from the udder of a healthy cow, properly fed and kept, but excluding that got during the first seven days after calving.
Principal compositional requirements
ChemicalMilk shall contain not less than 3.25 % milk fat and not less than 8.50 % milk solids not fat. It shall not contain added water, preservatives, or other added substances, nor shall any proportion of a natural constituent be removed.
Density of milk at 20 °C shall be within the range of 1.028 g/ml – 1.036 g/mlThe freezing point depression of milk shall be not less than 0.525 °C and not more than 0.550 °C.When tested in accordance with the appropriate method in Annexes A to J, milk shall:
• have a characteristic creamy – white color, free from off flavours and taints• be free of objectionable matter• not coagulate in the clot on boiling test• test negative to the alcohol test• have no more than 0.17% titratable lactic acid• test negative to peroxidase test.
Microbiological limits
Grade Counts (per ml)
I < 200 000
II >200 000 ¾ 1 000 000
III >1 000 000 ¾ 2 000 000
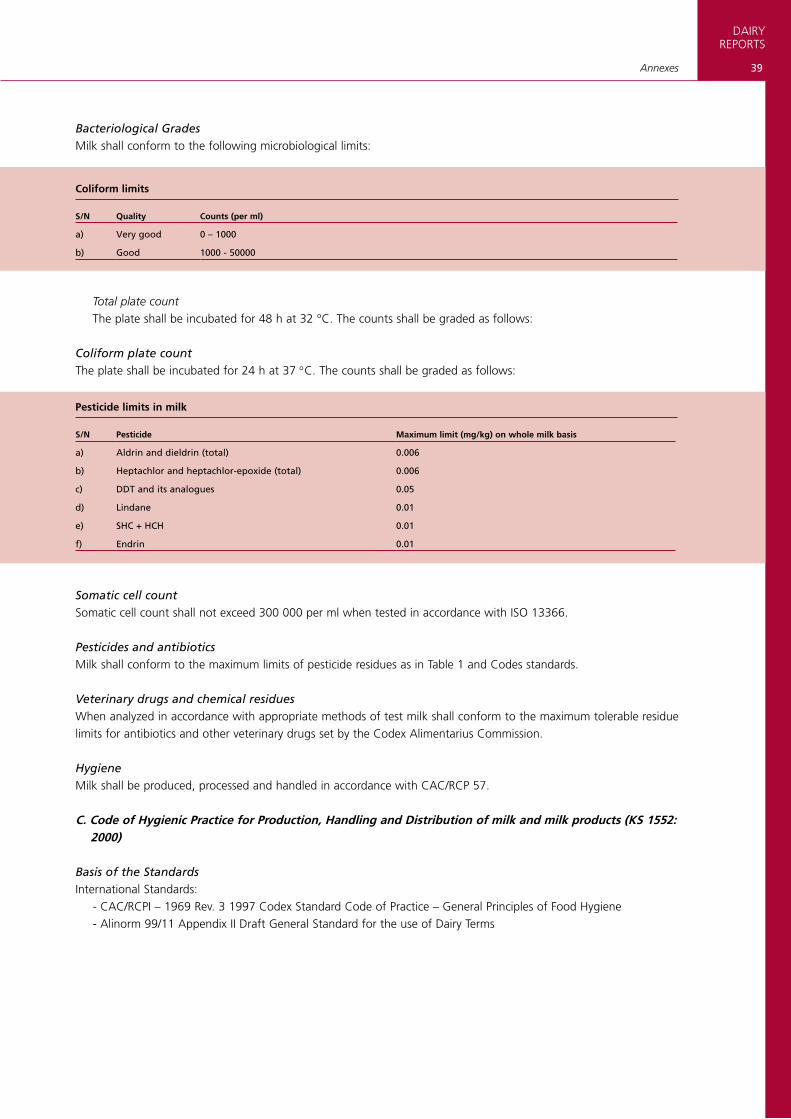
39
DAIRYREPORTS
Annexes
Bacteriological GradesMilk shall conform to the following microbiological limits:
Coliform limits
S/N Quality Counts (per ml)
a) Very good 0 – 1000
b) Good 1000 - 50000
Total plate count The plate shall be incubated for 48 h at 32 °C. The counts shall be graded as follows:
Coliform plate countThe plate shall be incubated for 24 h at 37 °C. The counts shall be graded as follows:
Pesticide limits in milk
S/N Pesticide Maximum limit (mg/kg) on whole milk basis
a) Aldrin and dieldrin (total) 0.006
b) Heptachlor and heptachlor-epoxide (total) 0.006
c) DDT and its analogues 0.05
d) Lindane 0.01
e) SHC + HCH 0.01
f) Endrin 0.01
Somatic cell count Somatic cell count shall not exceed 300 000 per ml when tested in accordance with ISO 13366.
Pesticides and antibioticsMilk shall conform to the maximum limits of pesticide residues as in Table 1 and Codes standards.
Veterinary drugs and chemical residuesWhen analyzed in accordance with appropriate methods of test milk shall conform to the maximum tolerable residue limits for antibiotics and other veterinary drugs set by the Codex Alimentarius Commission.
HygieneMilk shall be produced, processed and handled in accordance with CAC/RCP 57.
C. Code of Hygienic Practice for Production, Handling and Distribution of milk and milk products (KS 1552: 2000)
Basis of the StandardsInternational Standards:
- CAC/RCPI – 1969 Rev. 3 1997 Codex Standard Code of Practice – General Principles of Food Hygiene- Alinorm 99/11 Appendix II Draft General Standard for the use of Dairy Terms
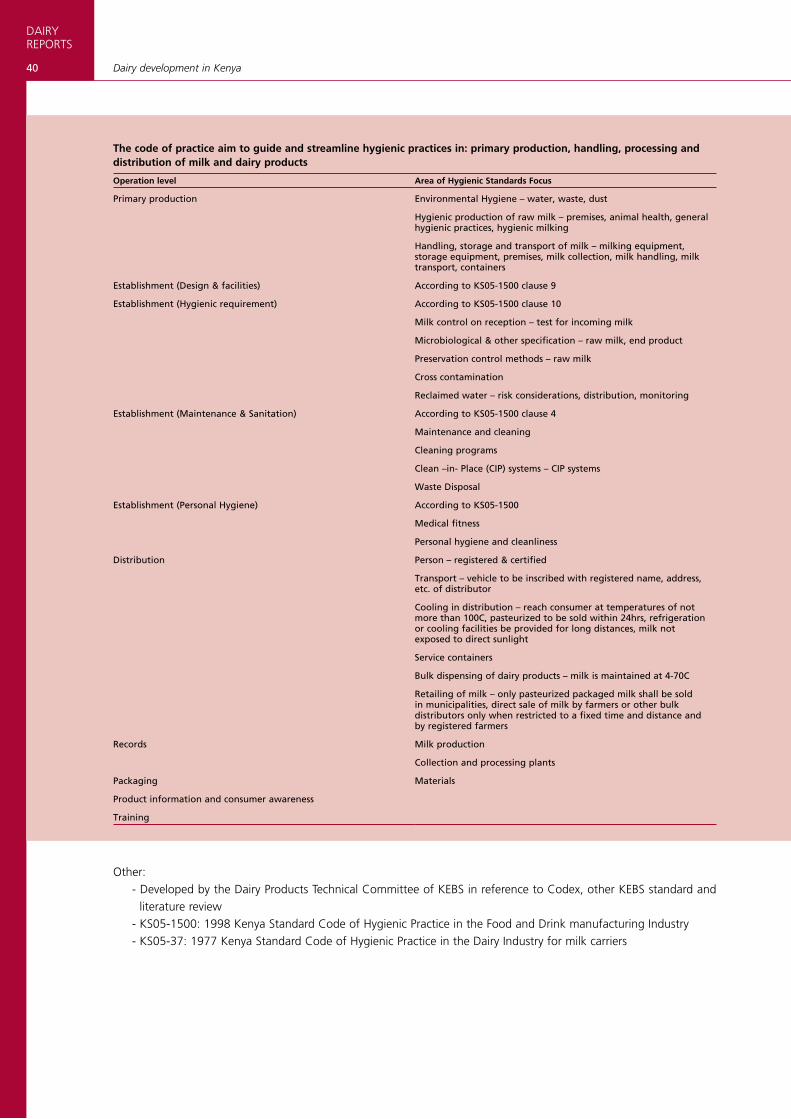
DAIRYREPORTS
40 Dairy development in Kenya
Other:- Developed by the Dairy Products Technical Committee of KEBS in reference to Codex, other KEBS standard and
literature review- KS05-1500: 1998 Kenya Standard Code of Hygienic Practice in the Food and Drink manufacturing Industry- KS05-37: 1977 Kenya Standard Code of Hygienic Practice in the Dairy Industry for milk carriers
The code of practice aim to guide and streamline hygienic practices in: primary production, handling, processing and distribution of milk and dairy products
Operation level Area of Hygienic Standards Focus
Primary production Environmental Hygiene – water, waste, dust
Hygienic production of raw milk – premises, animal health, general hygienic practices, hygienic milking
Handling, storage and transport of milk – milking equipment, storage equipment, premises, milk collection, milk handling, milk transport, containers
Establishment (Design & facilities) According to KS05-1500 clause 9
Establishment (Hygienic requirement) According to KS05-1500 clause 10
Milk control on reception – test for incoming milk
Microbiological & other specification – raw milk, end product
Preservation control methods – raw milk
Cross contamination
reclaimed water – risk considerations, distribution, monitoring
Establishment (Maintenance & Sanitation) According to KS05-1500 clause 4
Maintenance and cleaning
Cleaning programs
Clean –in- Place (CIP) systems – CIP systems
Waste Disposal
Establishment (Personal Hygiene) According to KS05-1500
Medical fitness
Personal hygiene and cleanliness
Distribution Person – registered & certified
Transport – vehicle to be inscribed with registered name, address, etc. of distributor
Cooling in distribution – reach consumer at temperatures of not more than 100C, pasteurized to be sold within 24hrs, refrigeration or cooling facilities be provided for long distances, milk not exposed to direct sunlight
Service containers
Bulk dispensing of dairy products – milk is maintained at 4-70C
retailing of milk – only pasteurized packaged milk shall be sold in municipalities, direct sale of milk by farmers or other bulk distributors only when restricted to a fixed time and distance and by registered farmers
records Milk production
Collection and processing plants
Packaging Materials
Product information and consumer awareness
Training
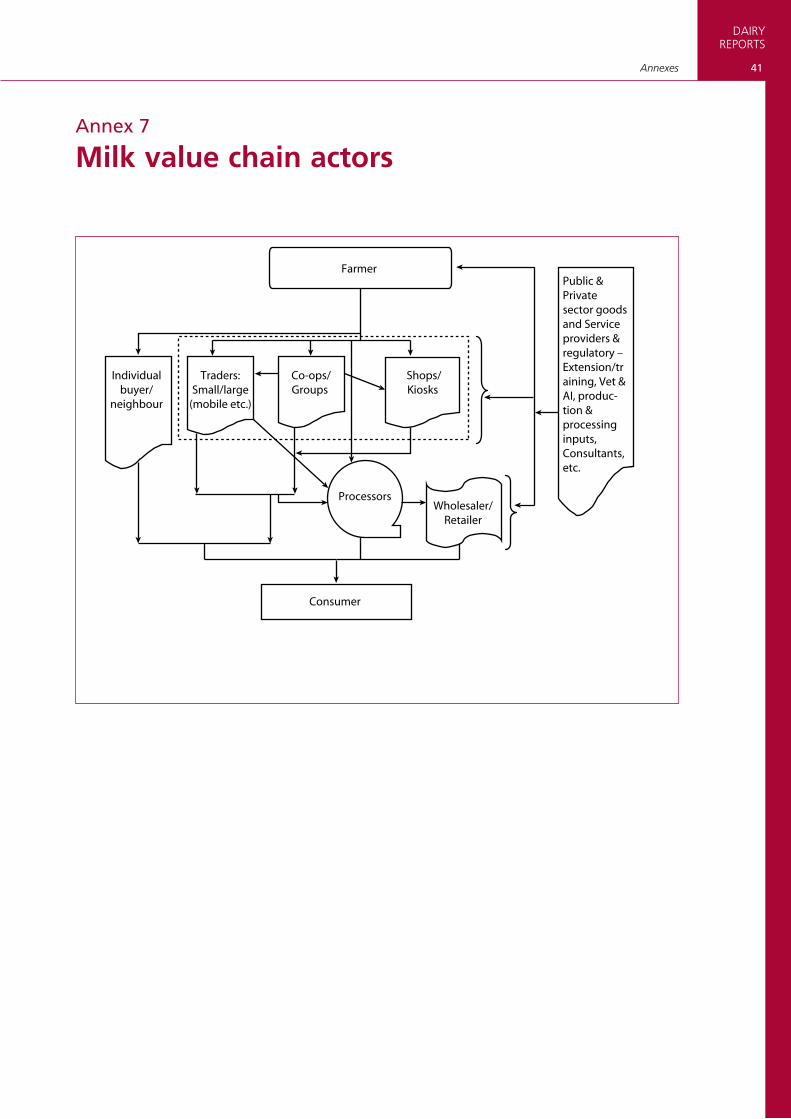
41
DAIRYREPORTS
Annexes
Annex 7
Milk value chain actors
Co-ops/Groups
Traders:Small/large
(mobile etc.)
Shops/Kiosks
Individualbuyer/
neighbour
ProcessorsWholesaler/
Retailer
Farmer
Consumer
Public & Private sector goods and Service providers & regulatory – Extension/training, Vet & AI, produc-tion & processing inputs, Consultants, etc.
