current status of solar thermal application worldwide
TRANSCRIPT

Werner Weiss
Current Status of Solar Thermal Application Worldwide
AEE - Institute for Sustainable TechnologiesA-8200 Gleisdorf, Feldgasse 2AUSTRIA

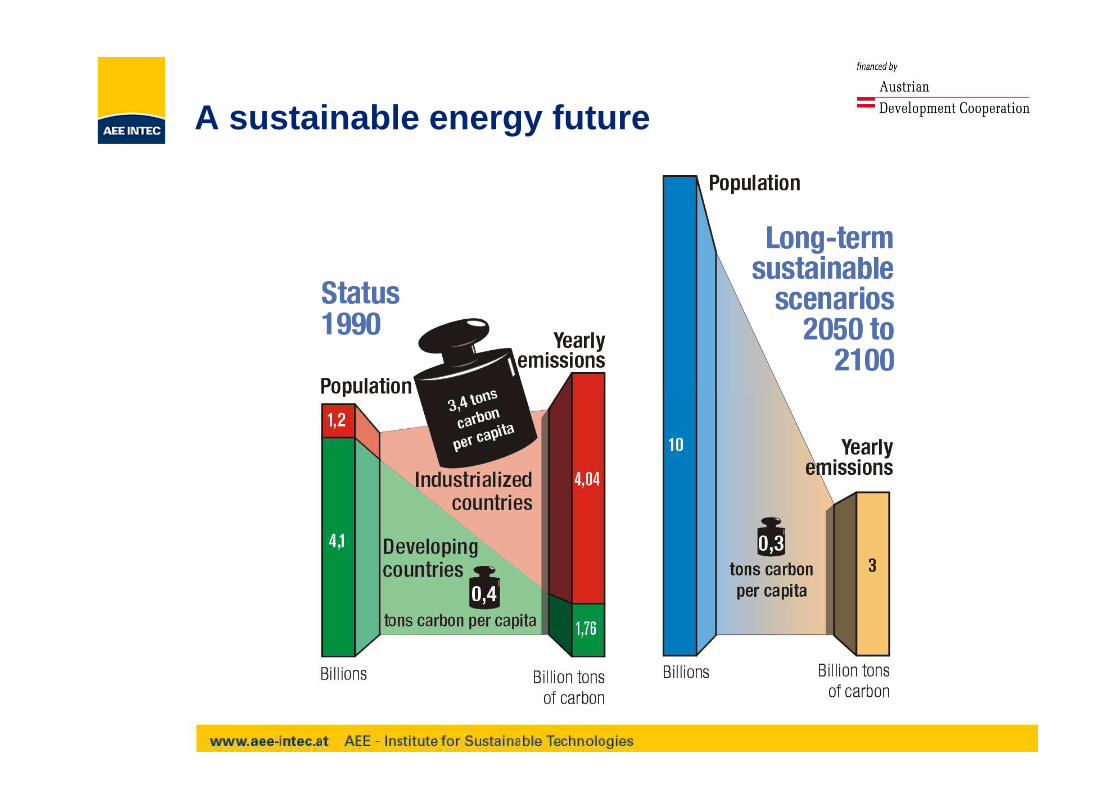
A sustainable energy future
Source: NASA / NOAA
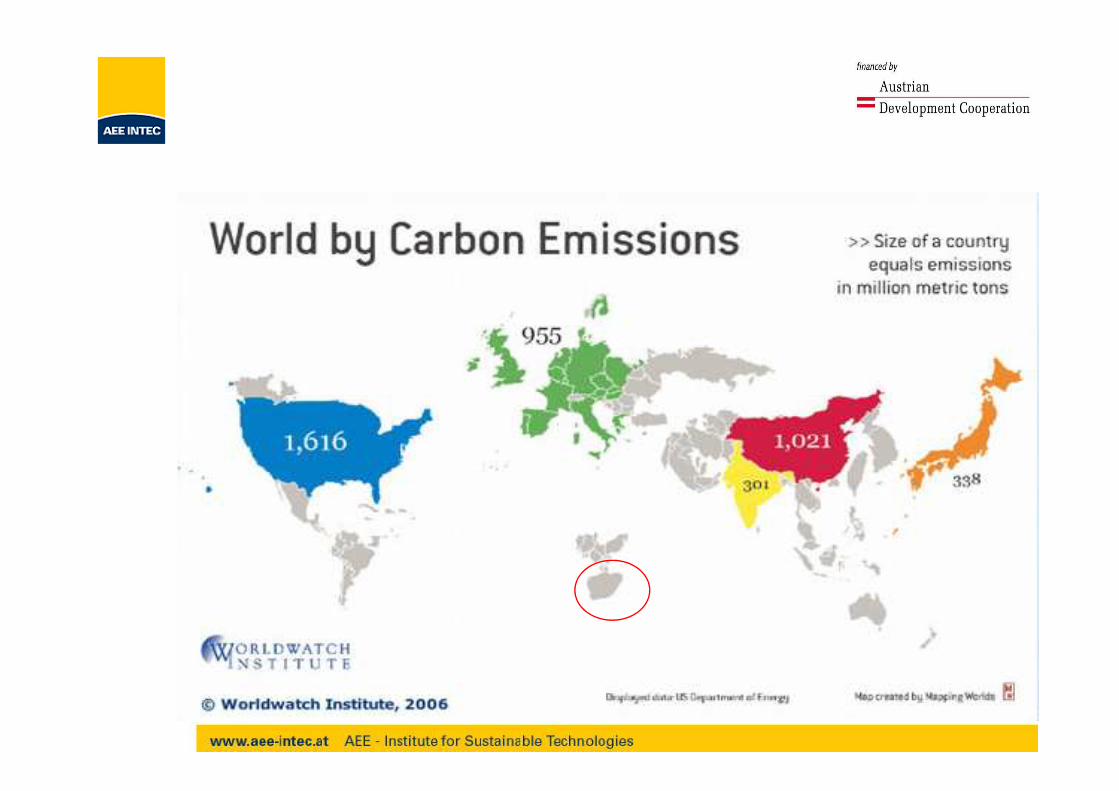
A sustainable energy future


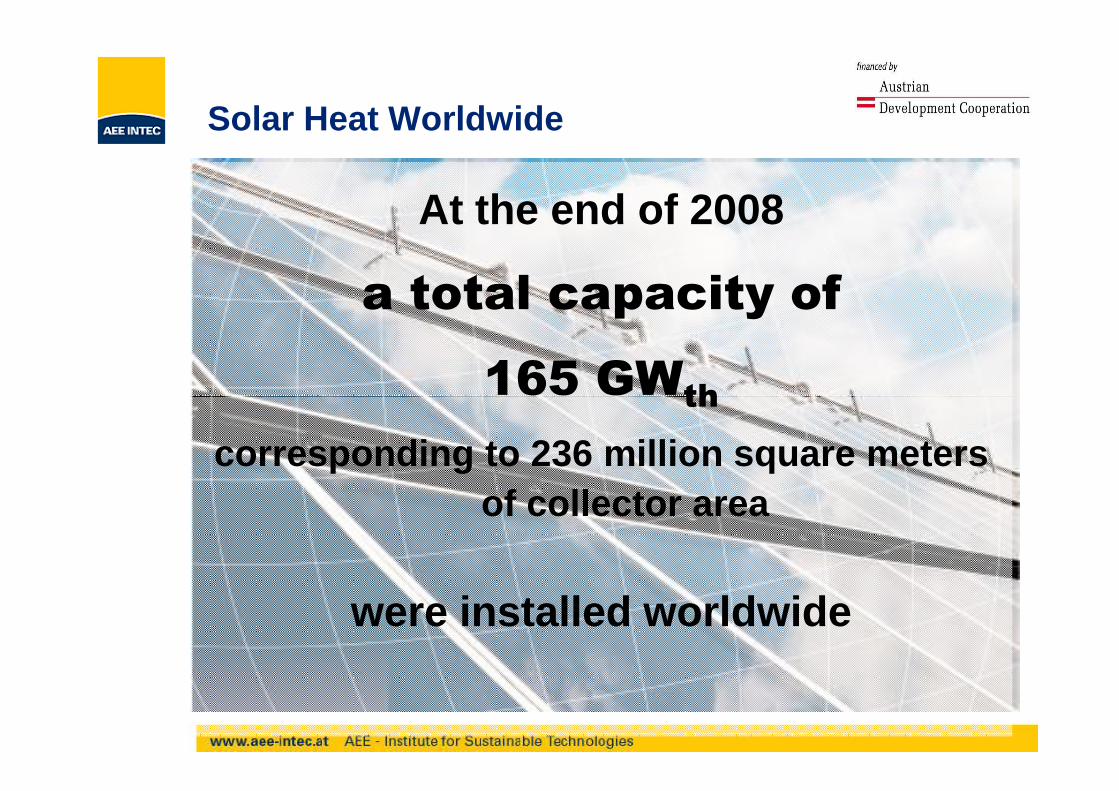
At the end of 2008
a total capacity of
165 GWth
Solar Heat Worldwide
165 GWth
corresponding to 236 million square meters of collector area
were installed worldwide

Solar Heat Worldwide

Achievements - 2007
147
190
150
200
Total Capacity in Operation [GW ], [GW ] and Produced el th Energy [TWh ], [TWh ], 2007el th
heat power
Total capacity in operation [GW] 2007
Produced Energy [TWh] 2007
10 9.40.6 0.4
58
101.5 0.6
94
89
0
50
100
Solar ThermalHeat
Wind Power GeothermalPower
Photovoltaic Solar ThermalPower
Ocean TidalPower
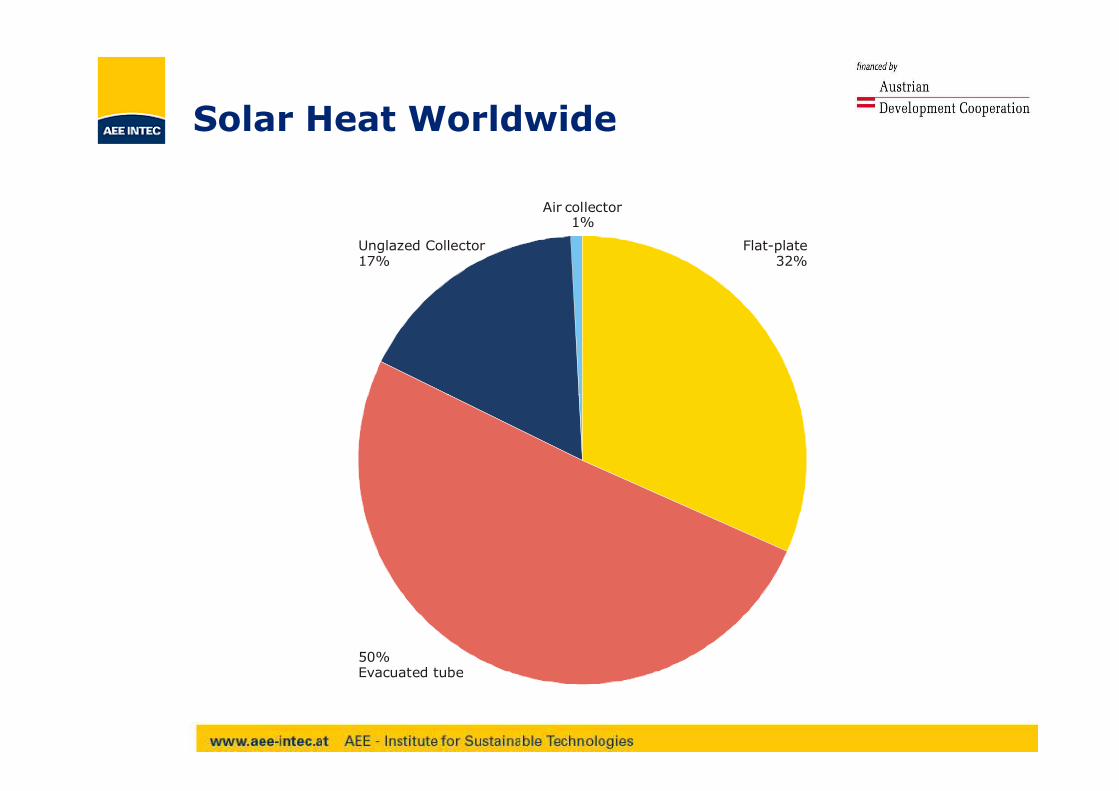
Solar Heat Worldwide
Unglazed Collector 17%
Air collector1%
Flat-plate32%
50%Evacuated tube
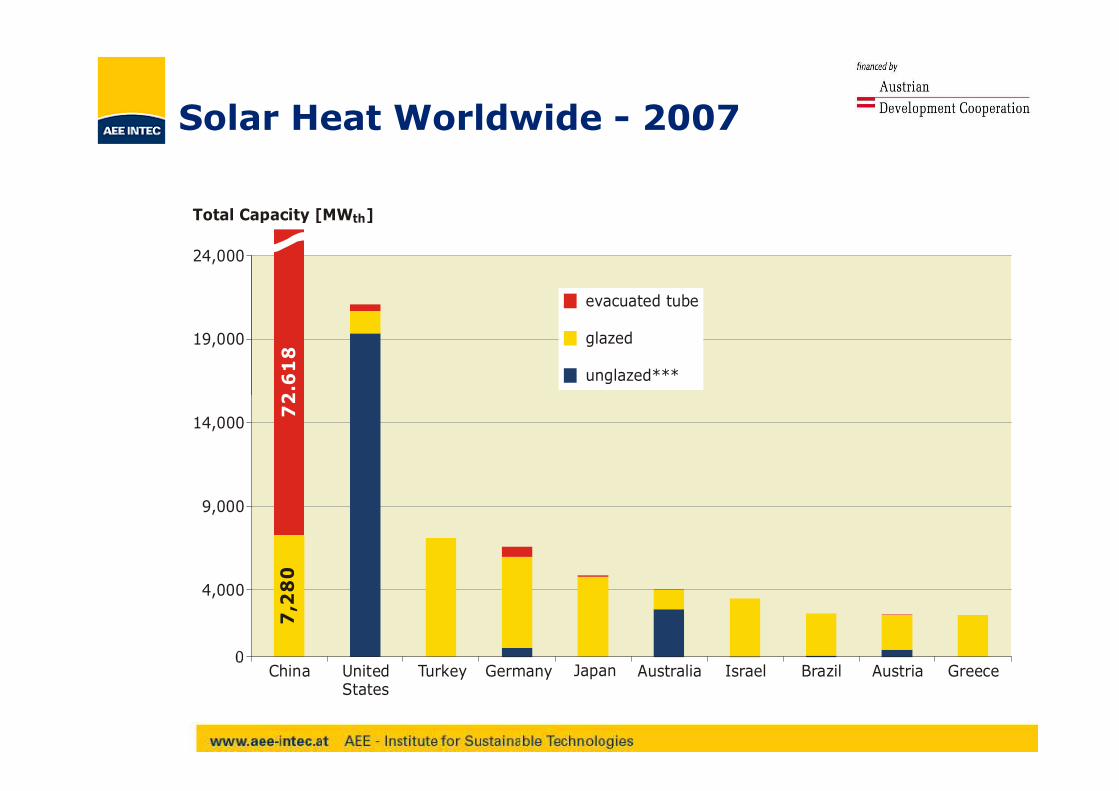
Solar Heat Worldwide - 2007
19,000
24,000
Total Capacity [MW ]th
72.6
18
evacuated tube
glazed
unglazed***
7,2
80
4,000
9,000
14,000
China UnitedStates
Turkey Germany Japan Australia Israel Brazil Austria Greece
72
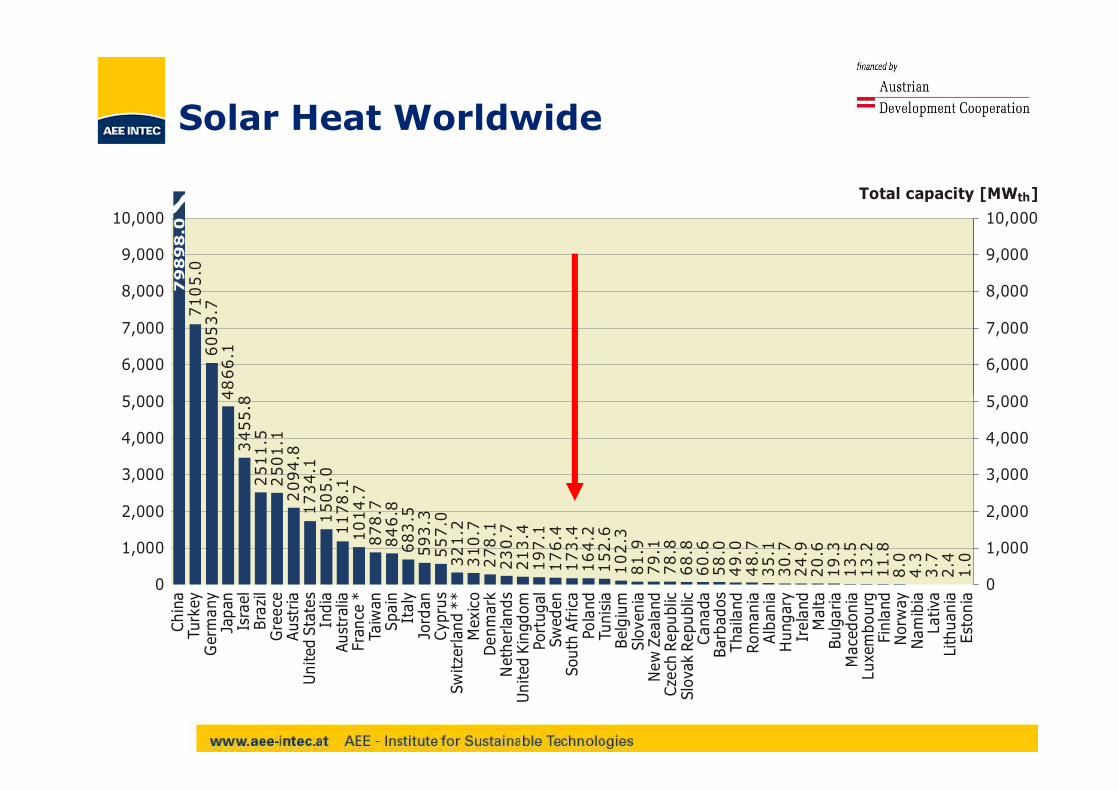
Solar Heat Worldwide
6053.7
4866.1
.8
7105.0
5,000 5,000
6,000 6,000
7,000 7,000
8,000 8,000
9,000 9,000
10,000 10,000
Total capacity [MW ]th
43455.8
2511.5
2501.1
2094.8
1734.1
1505.0
1178.1
1014.7
878.7
846.8
683.5
593.3
557.0
321.2
310.7
278.1
230.7
213.4
197.1
176.4
173.4
164.2
152.6
102.3
81.9
79.1
78.8
68.8
60.6
58.0
49.0
48.7
35.1
30.7
24.9
20.6
19.3
13.5
13.2
11.8
8.0
4.3
3.7
2.4
1.0
0 0
1,000 1,000
2,000 2,000
3,000 3,000
4,000 4,000
5,000 5,000
China
Turkey
Germany
Japan
Israel
Brazil
Greece
Austria
United States
India
Australia
France *
Taiwan
Spain
Italy
Jordan
Cyprus
Switzerland **
Mexico
Denmark
Netherlands
United Kingdom
Portugal
Sweden
South Africa
Poland
Tunisia
Belgium
Slovenia
New Zealand
Czech Republic
Slovak Republic
Canada
Barbados
Thailand
Romania
Albania
Hungary
Ireland
Malta
Bulgaria
Macedonia
Luxembourg
Finland
Norway
Namibia
Lativa
Lithuania
Estonia

Solar Heat Worldwide
251.9
224.4
197.1
200 200
250 250
300 300
Total capacity per 1.000 inhabitants [kW ]th
100.1
94.9
73.3
60.1
56.8
51.1
50.5
42.9
40.9
38.9
38.0
28.3
19.3
19.1
18.9
18.6
16.0
14.8
14.0
13.1
12.8
11.6
11.0
9.8
7.7
6.6
5.8
5.7
4.3
3.6
3.5
3.1
2.9
2.5
2.3
2.2
2.1
1.8
1.7
1.6
1.3
0.8
0.8
0.7
0 0
50 50
100 100
150 150
Cyprus
Israel
Austria
Greece
Barbados
Jordan
Turkey
Germany
China
Australia
Denmark
Malta
Switzerland **
Slovenia
Taiwan
Japan
Luxembourg
Sweden
Spain
New Zealand
Portugal
France *
Tunisia
Netherlands
Brazil
Slovak Republic
Italy
Albania
Belgium
Czech Republic
Macedonia
Ireland
United States
Poland
South Africa
United Kingdom
Hungary
Mexico
Bulgaria
Romania
Finland
Namibia
Canada
Norway
Lativa
India
Estonia
Thailand
Lithuania

Market Development 1999 Market Development 1999 -- 20072007
8
10
12
Installed capacity per 1,000 inhabitants [kWth/a]
China + Taiwan
Europe
Others
Australia + New Zealand
Japan
United States+Canada
0
2
4
6
8
1999 2000 2001 2002 2003 2004 2005 2006 2007

Diversification of the Global Market - 2007
Australia + New Zealand
United States +Canada

Based on data collected from detailed country reports,
EmploymentEmployment
Based on data collected from detailed country reports, the jobs created by the production, installation and maintenance of solar thermal plants is estimated to
be 200,000 worldwide
Increase compared to 2005 = 50.000 jobs!!!

Share of Renewables 2005 and target 2020
Share of Renewable Energies in 2005 and 2020
40,00%
50,00%
60,00%
Share of Renewable Energies 2005
Goal for Renewable Energies 2020
0,00%
10,00%
20,00%
30,00%
Austri
aBel
gium
Bulga
riaCyp
rus
Czech
Rep
ublic
Denm
arkEst
onia
Finlan
dFra
nce
Ger
man
yG
reece
Hunga
ryIre
land
Italy
Latv
iaLi
thua
nia
Luxe
mbu
rg
Mal
taNet
herla
nds
Polan
dPor
tuga
lRom
ania
Slova
kiaSlo
venia
Spain
Sweden
United
Kin
gdom
Contribution of Solar Thermal to the EU 20% RES TargetEU 20% RES Target
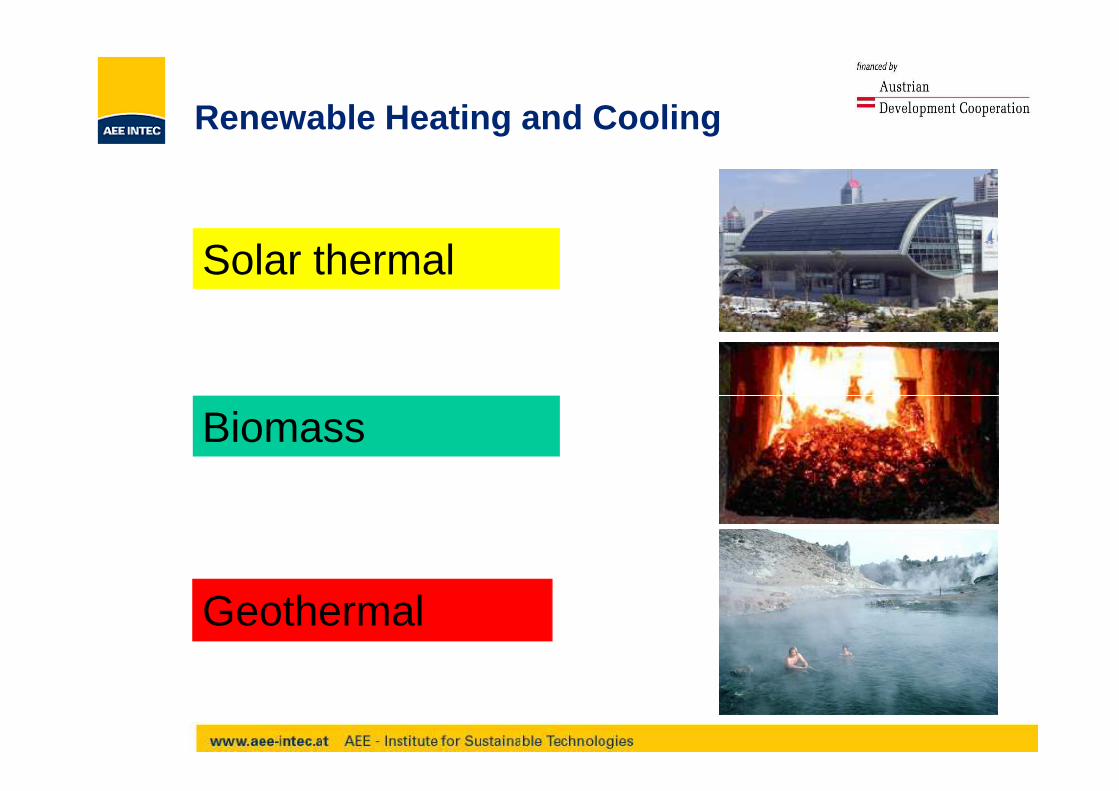
Solar thermal
Renewable Heating and Cooling
Biomass
Geothermal

Solar Thermal Potential EU27
3500,00
4000,00
4500,00
5000,00
Contribution of Solar Thermal to the EU 27 Heating and Cooling Demand by Sector
Industrial Heat - Low Temp.
Air conditioning Service
Space Heating Service
Air conditioning Residential
Water Heating Residential - MFH
Space Heating Residential - MFH
Water Heating Residential - SFH
Space Heating Residential - SFH
0,00
500,00
1000,00
1500,00
2000,00
2500,00
3000,00
3500,00
[TWh]
Heating/CoolingDemand EU 27 -
2006
Solar Thermal2006
Heat Demand2020 -9%
Solar Thermal2020
Heat Demand 2030 -20%
Solar Thermal2030
Heat Demand2050 -31%
Solar Thermal2050
0,2%3,6%
15%
47%

Solar Thermal Potential Spain
250,00
300,00
Contribution of Solar Thermal to the Spanish Heatin g and Cooling Demand by Sector Industrial Heat - Low Temp.
Air conditioning Service
Space Heating Service
Air conditioning Residential
Water Heating Residential - MFH
Space Heating Residential - MFH
Water Heating Residential - SFH
Space Heating Residential - SFH
Combisystems
for space heating, cooling and hot water
0,00
50,00
100,00
150,00
200,00
[TWh]
Heating/CoolingDemand ES -
2006
Solar Thermal2006
Heat Demand ES- 2020 -1%
Solar Thermal2020
Heat Demand ES- 2030 -4.4%
Solar Thermal2030
Heat Demand ES- 2050 -12%
Solar Thermal2050
63%
29%
5%0,22%
Cooling and Heat

Solar Thermal Potential Spain
200
250Market Development 2005 - 2050 according to 3 Szenarios - Spain
Business as usual Advanced market deployment Full R&D and Policy Scenario
2005 2010 2015 2020 2025 2030 2035 2040 2045 20500
50
100
150
GW
th

Sola water heaters for multi family houses
Small solar water heaters
Market Development
TimeResearch &Development
Eary Market Mass market
Solar cooling
Industrial applications
Sea water desalination
Facade integrated systems
Solar space heating
District heating

Established Established Applications

Gravity driven systems
Solar Water Heating Systems
fsol = 70 – 90%
700 – 1000 kWh/kW th

Solar Water Heating Systems

Further Developments:
- Compactness- Building integration- Medium sized systems
Solar Water Heating Systems

CHINACHINA
Solar Water Heating Systems

Solar Water Heating Systems
Three different types of evacuated tube collectors:
all-glass U-tube heat-pipe

12
1
Pumped SWH Systems
8
6
4
3
2
711
510
9

Small-scale Systems for Hot Water Preparation
fsol = 50 – 70%
500 – 650 kWh/kW th

Solar Water Heating for Hotels
Source: TiSun

Combined Pool Heating and SWH
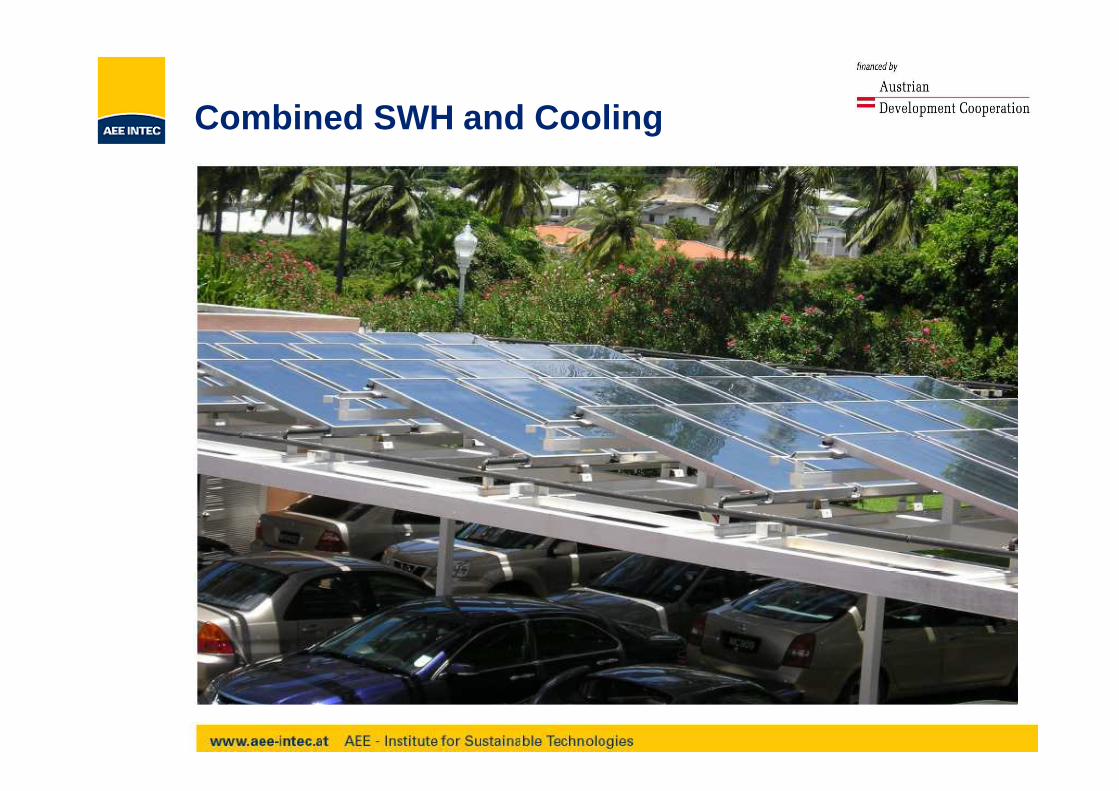
Combined SWH and Cooling

Solar Air Conditioning and Cooling
Source : Fraunhofer ISE, Solarnext
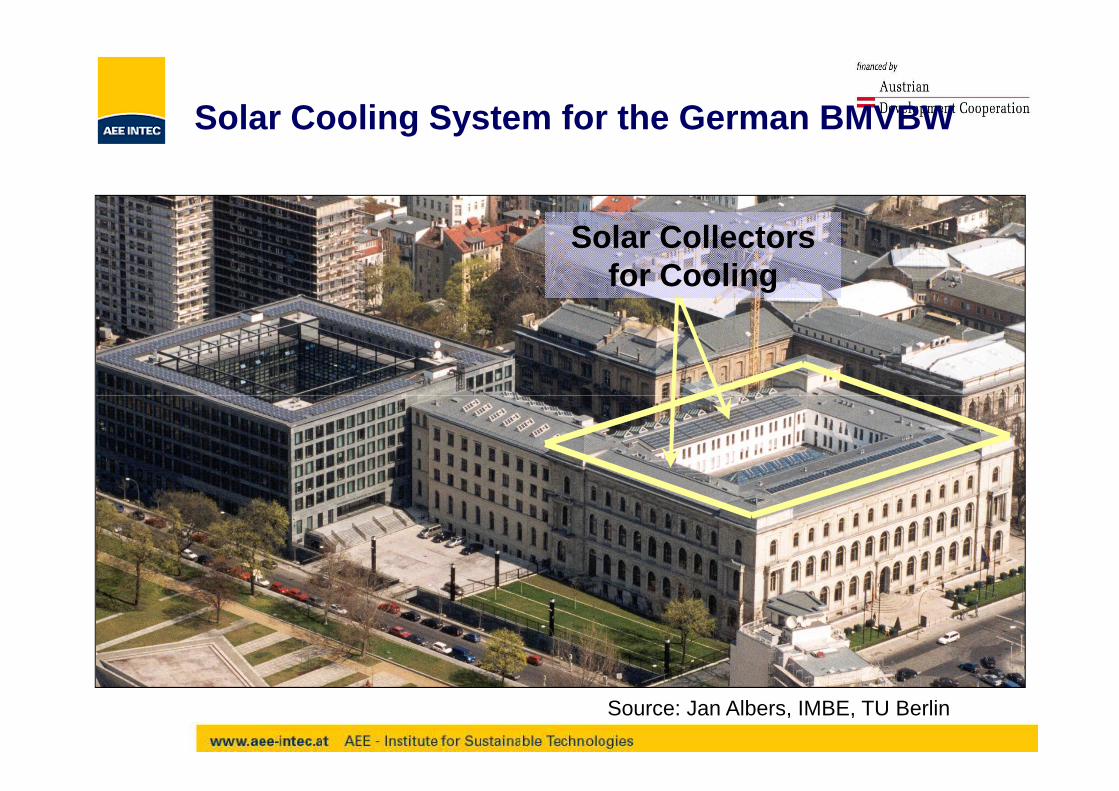
Solar Collectors for Cooling
Solar Cooling System for the German BMVBW
Source: Jan Albers, IMBE, TU Berlin

fsol = 20 – 50%
450 – 550 kWh/kWth
Solar Combi Systems for SFH


Large-scale solar heating systems

System with short-term storage – Müllheim, D

System with seasonal storage, SE
Project -Size
Project
Heat Storage Collector
area (m²)
Storage Volume
(m³)
fsol
(%)
Nb. of Flats
Anneberg-Danderyd seasonal 2.400 m² 60.000 m³ 70% 5 0


Large-scale Plants in Europe
8
10
12
14
No of plants
Closed (12)
OTH (14)
ES (13)
AT (14)
CH (7)
GR (14)
DE (18)
Source: Jan-Olof Dalenbäck, 2008
0
2
4
6
8
1979
1980
1981
1982
1983
1984
1985
1986
1987
1988
1989
1990
1991
1992
1993
1994
1995
1996
1997
1998
1999
2000
2001
2002
2003
2004
2005
2006
2007
DE (18)
NL (8)
DK (10)
SE (22)

Local District Heating – Hamburg, Germany
Source: ITW, University Stuttgart

District Heating – 3MW th, AEVG, Graz, Austria
Source: S.O.L.I.D.

Solar District Heating
Solar yields: 400 – 460 kWh/m².a
Marstal, Denmark 12.8 MW th (18.365m2)


INDUSTRIAL APPLICATIONS
Final Energy Use of the EU - Industry share of heat and electricity
Electricity
Heat67%
Electricity33%
18,6 % of the total final energy use in the EU
Source: GREEN PAPER – TOWARDS A EUROPEAN STRATEGY FOR THE SECURITY OF ENERGY SUPPLY, Brussels, 2001

Space Heating of Factory Buildings
Source: Solution

LARGE-SCALE INDUSTRIAL APPLICATIONS

Tyras Dairy, Trikala, Greece

Textile Industry Hangzhou China 13000 ㎡㎡㎡㎡ (9 MWth)

Solar Drying in Guatemala
Source: CONA

Pilot System Spain, CIEMAT, INETI252 CPC AO SOL (499 m²)
SEA WATER DESALINATION

Fraunhofer ISE, Germany
Seawater Desalination – Gran Canaria, Spain

The Solar Ressource in Africa

Thank you for your attention