current monitoring for cml: goals and principles monitoring webinar with dr. jorge cortes.pdf ·...
TRANSCRIPT
Current Monitoring for CML: Goals and
Principles Principles
Jorge Cortes, MDChief, CML & AML SectionDepartment of Leukemia
MD Anderson Cancer Center

Survival in Early Chronic Phase CML
MDACC 2009

Chromosome 9Chromosome 22
BCR
5’
1b
1a
a2
a3
5’
3’
e1
e1’e2’
b1
b5
m-bcr
M-bcr
The Philadelphia Chromosome
ABL5’
3’
a3
a11
b5
e19µµµµ -bcr
e1a2
b2a2
b3a2
e19a2
p190bcr-abl
p210bcr-abl
p230bcr-abl
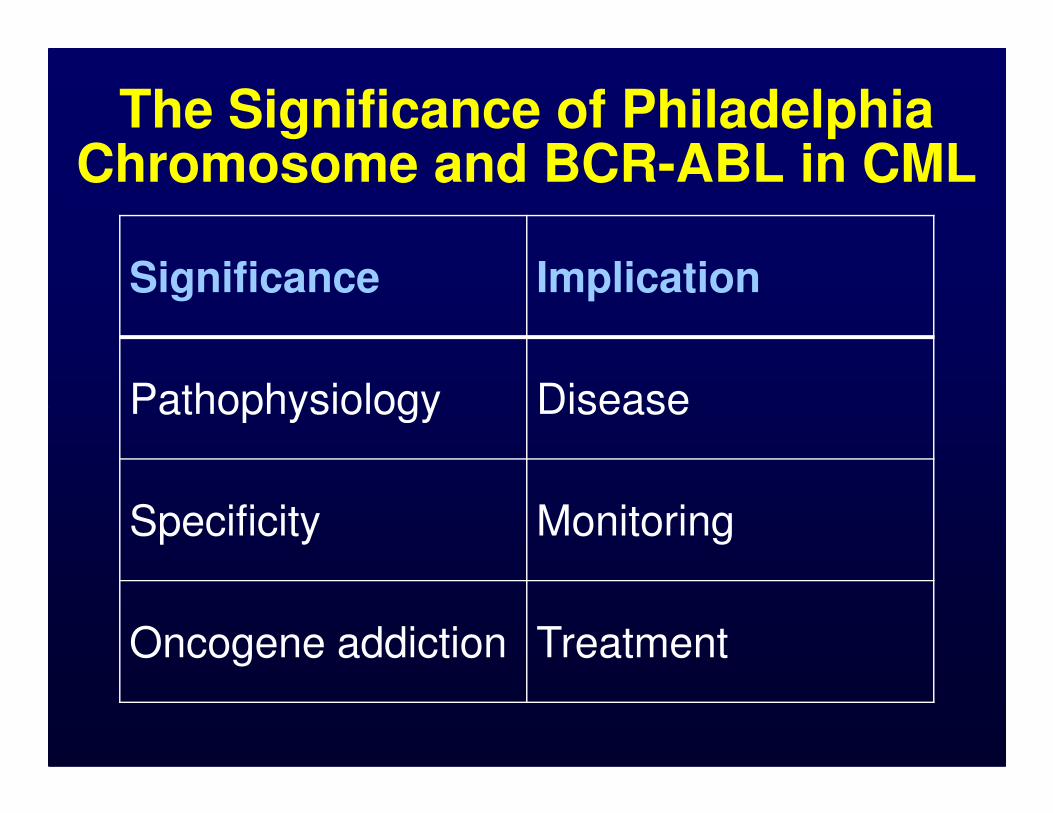
The Significance of Philadelphia Chromosome and BCR-ABL in CML
Significance Implication
Pathophysiology Disease Pathophysiology Disease
Specificity Monitoring
Oncogene addiction Treatment
Nu
mb
er
of
leu
ke
mic
ce
lls
Nu
mb
er
of
leu
ke
mic
ce
lls
1012
108
1010
CMLCML
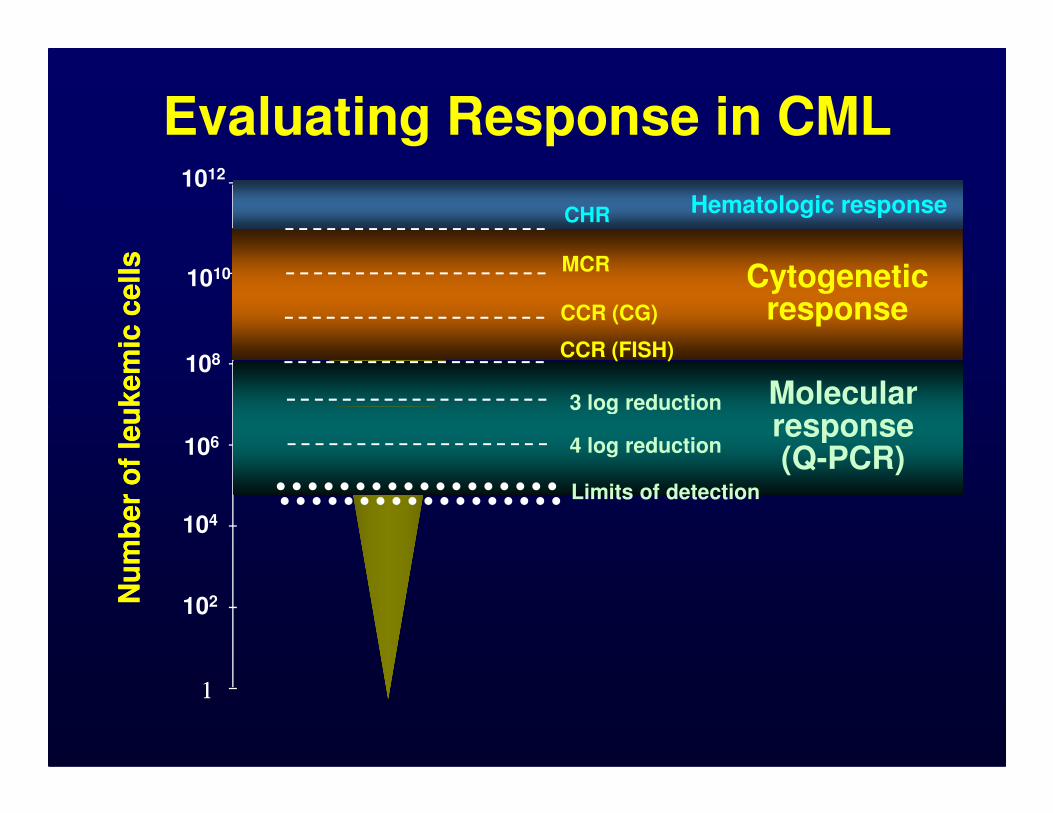
Evaluating Response in CML
3 log reduction Molecular response
CCR (CG)
MCRCytogenetic
responseCCR (FISH)
CHR Hematologic response
11
Nu
mb
er
of
leu
ke
mic
ce
lls
Nu
mb
er
of
leu
ke
mic
ce
lls
106
102
104
CMLCML 3 log reduction
Limits of detection
4 log reduction
Molecular response (Q-PCR)
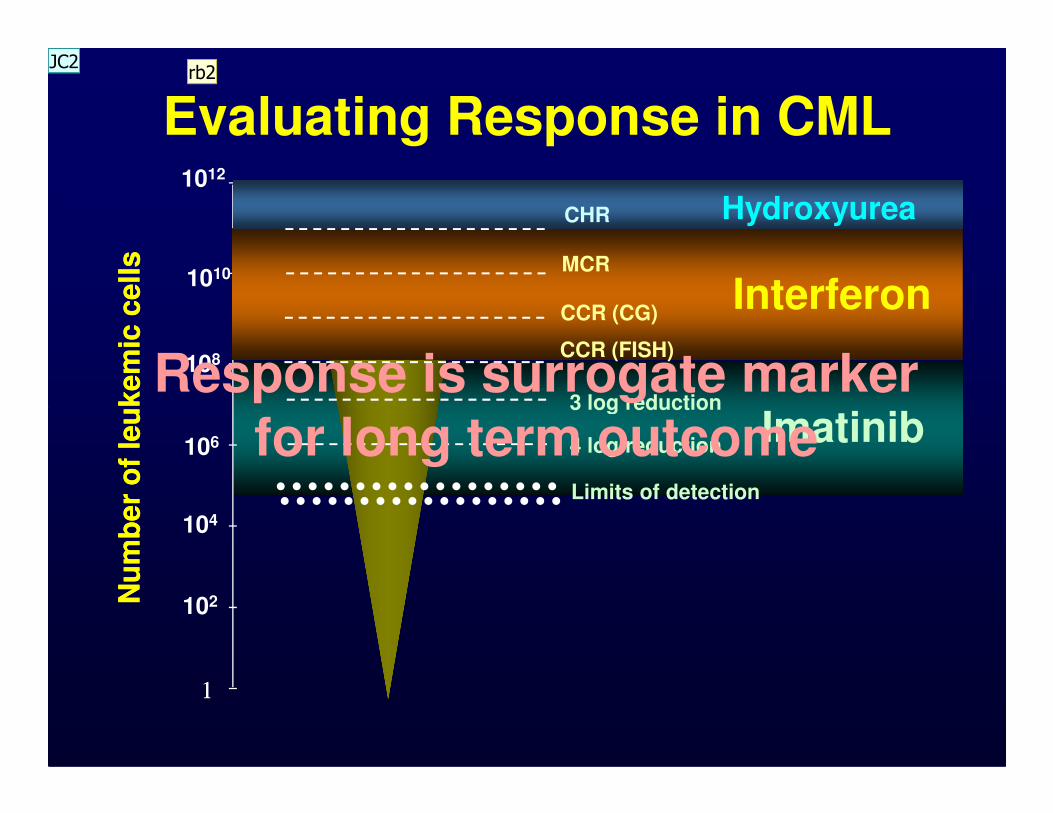
Evaluating Response in CMLN
um
be
r o
f le
uk
em
ic c
ell
sN
um
be
r o
f le
uk
em
ic c
ell
s
1012
108
1010
3 log reduction
Imatinib
CCR (CG)
MCR
InterferonCCR (FISH)
CHR Hydroxyurea
Response is surrogate marker
11
Nu
mb
er
of
leu
ke
mic
ce
lls
Nu
mb
er
of
leu
ke
mic
ce
lls
106
102
104
3 log reduction
Limits of detection
4 log reductionImatinibfor long term outcome
rb2JC2

Slide 6
rb2 Suggested to change imatinib to TKIs by one reviewer. (However, log reduction was defined by imatinib.) Please comment. rbloechlinger, 2/28/2011
JC2 This is a historical perspective and these levels were established with imatinib so I prefer to keep as is.jecortes, 2/28/2011

Definitions of Cytogenetic Response
Response Criteria
CHR
WBC <10 x 109/LPlatelets <450 x 109/L
PB myelo + metamyelo <5% No PB blasts + promyelo
PB basophils <20% No extramedullary No extramedullary
involvement
Cytogenetic* % Ph+ Metaphases
Complete 0Major
Partial 1-35
Minor 36-95*Based on standard karyotype, 20 metaphases (not FISH)

Molecular Response in CML
•Real time PCR = BCR-ABL/control x 100
•Major molecular response (MMR)
−BCR-ABL/control <0.1% (IS)
−3 log reduction (from standardized baseline)
−Using reduction from individual baseline
8
−Using reduction from individual baseline not validated
•Complete molecular response (CMR) = PCR negative, sensitivity 4- to 5-log
−CMR4, CMR4.5, CMR5
−BCR-ABL/control ≤0.0032% (IS)
−Undetectable

IRIS Study in Chronic Phase CML• 553 pts randomized to imatinib 400 mg/D; 8-yr
follow up
• Annual transformation rate to AP/BP (yrs 4-8): 0.9%, 0.5%, 0%, 0%, 0.4%
• Only 15 pts in CCyR (3%) progressed to AP/BP
• No pts in MMR at 12 mos progressed to AP/BP
• Outcome at 8 yrs Percent• Outcome at 8 yrs Percent
On study 55
CCyR 83
MMR 86
EFS 81
PFS 92
OS (CML deaths only) 85 (93)
Deininger et al; Blood 2009; 114: Abst# 1126

Monitoring Procedures in CML• CG: looks at all chromosomes; but:
tedious; needs metaphases; only 20 cells counted (95% CI CCyR 15%); painful BM
• FISH: faster; 200 cells; PB; but: false (+) up to 5-10%; no information on other
10
up to 5-10%; no information on other chromosomes
• PCR: most sensitive; PB; evaluable in CCyR; predicts for relapse; but: not standardized; no information on other chromosomes; variability up to 0.5 log; use 1 source (PB) and 1 reliable lab

IFNαααα in CMLSurvival by CG Response
PR
OP
OR
TIO
N A
LIV
E
0.6
0.7
0.8
0.9
1.078 %
39 %
MONTHS (LANDMARK AT 12 MONTHS)
PR
OP
OR
TIO
N A
LIV
E
0.0
0.1
0.2
0.3
0.4
0.5
0 24 48 72 96 120 144 168 192
Total Dead
140 38 CR
72 40 PR
110 86 Minor
180 138 Others
(P < 0.0001)
39 %
25 %
Kantarjian et al. Cancer 2003; 97: 1033

Ma
rro
w% Ph+
100
80
60
Peripheral Blood FISH: Excellent Correlation With Bone Marrow FISH
Le Gouill et al. J Clin Oncol. 2000;18:1533.
Peripheral blood
Ma
rro
w
40
20
020 40 60 80 100
% Ph+
r=0.97
0

Correlation Between iFISH and Cytogenetics in CML
ResponsePercentage FISH +
<1% 1-5% >5%
CCyR 83 13 4
PCyR 9 42 49
CCyR & MMR 92 7 2
Testoni et al, Blood 2009; 114: 4939-43; Testoni et al, ASH 2006, abst #4779
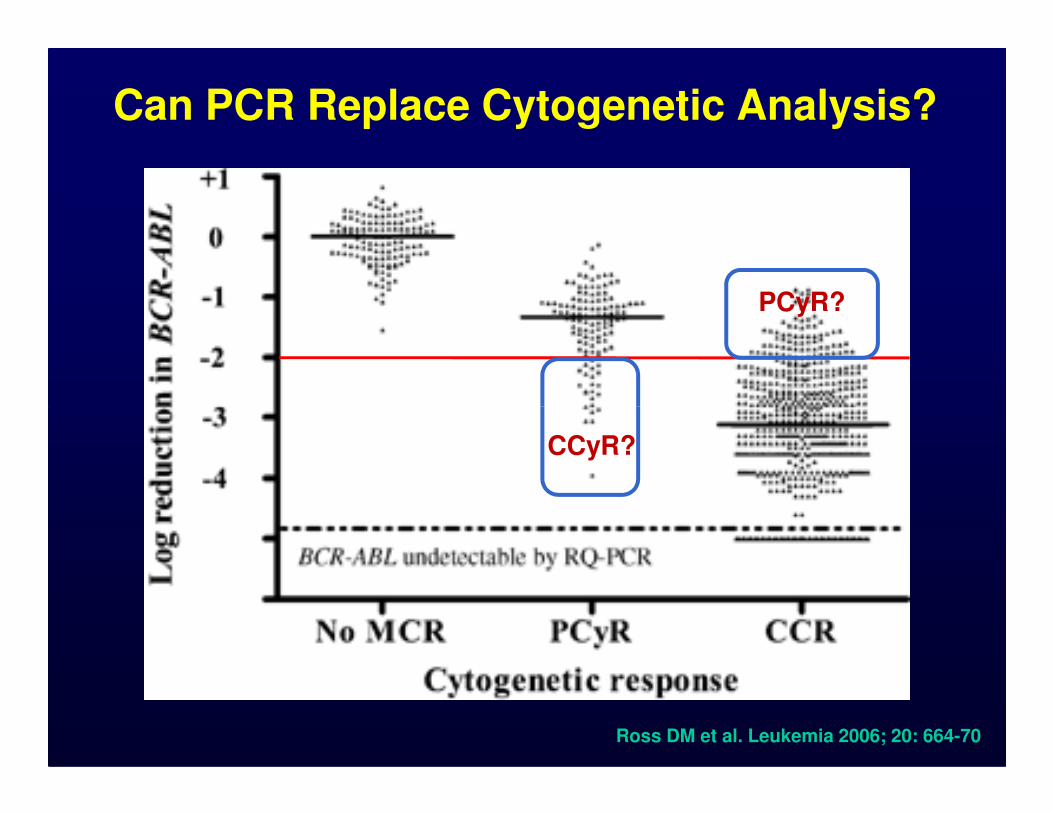
Can PCR Replace Cytogenetic Analysis?
PCyR?
Ross DM et al. Leukemia 2006; 20: 664-70
CCyR?
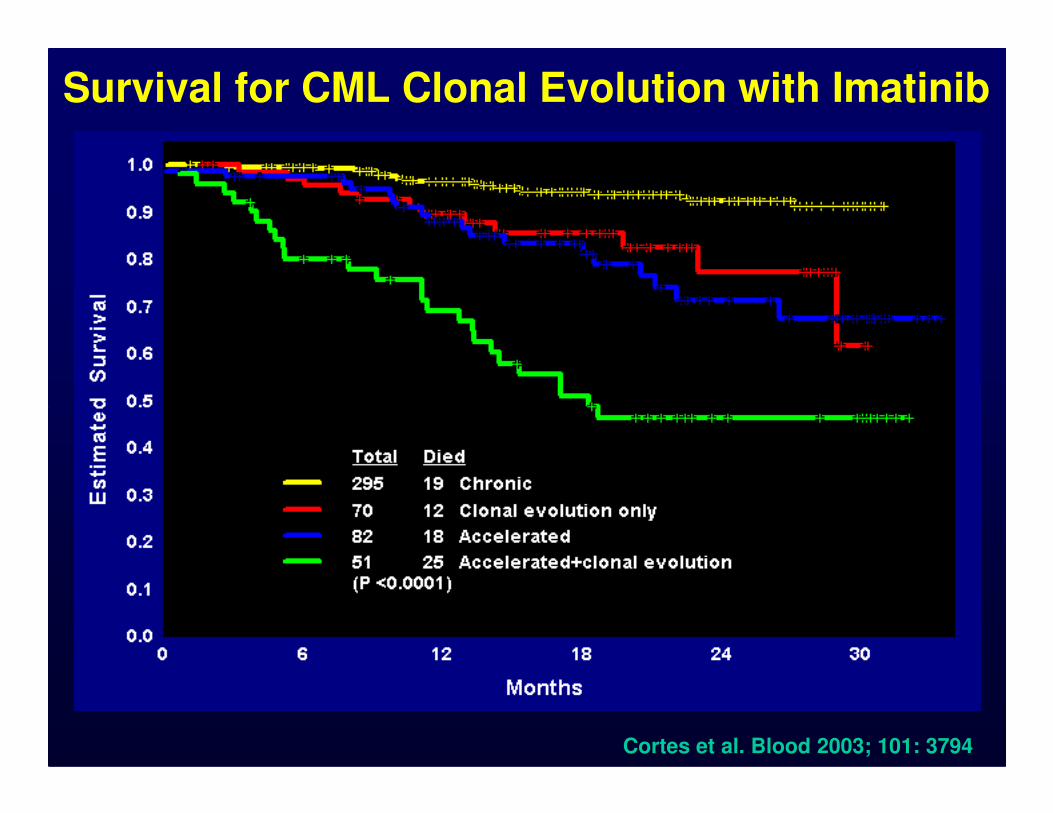
Survival for CML Clonal Evolution with Imatinib
Cortes et al. Blood 2003; 101: 3794

CG Abnormalities in Ph(-) Cells
•41 of 261 pts (16%) treated with imatinib
–+8 (n=8); -5/-7 (n=11); 20q- (n=4); other (n=18)
•Transient in 29/41 (71%)
•36/41 remain in CG response •36/41 remain in CG response
–Major 31, Minor 5
–1/41 developed AP CML
•3 developed MDS⇒⇒⇒⇒AML (-7 in 2, 5q- in 1)
–20/41 (49%) G≥3 myelosuppressionMedina et al. Cancer 2003; 98: 1905-11Kantarjian et al. Blood 2004; 104: 1979

CG Abnormalities in Ph-negative Metaphases with IM Frontline Therapy
Overall Survival Progression-Free Survival
• 21/258 (9%) patients developed CG abnormalities in Ph-metaphases after median 36 mo
• Most common abnormalities: -Y (n=9; 43%), +8 (n=9; 43%), -7 (n=5; 17%)
• 1 (5%; 0.4% overall) developed AML [-7]
Jabbour et al. Blood 2007; 110: 2991-5
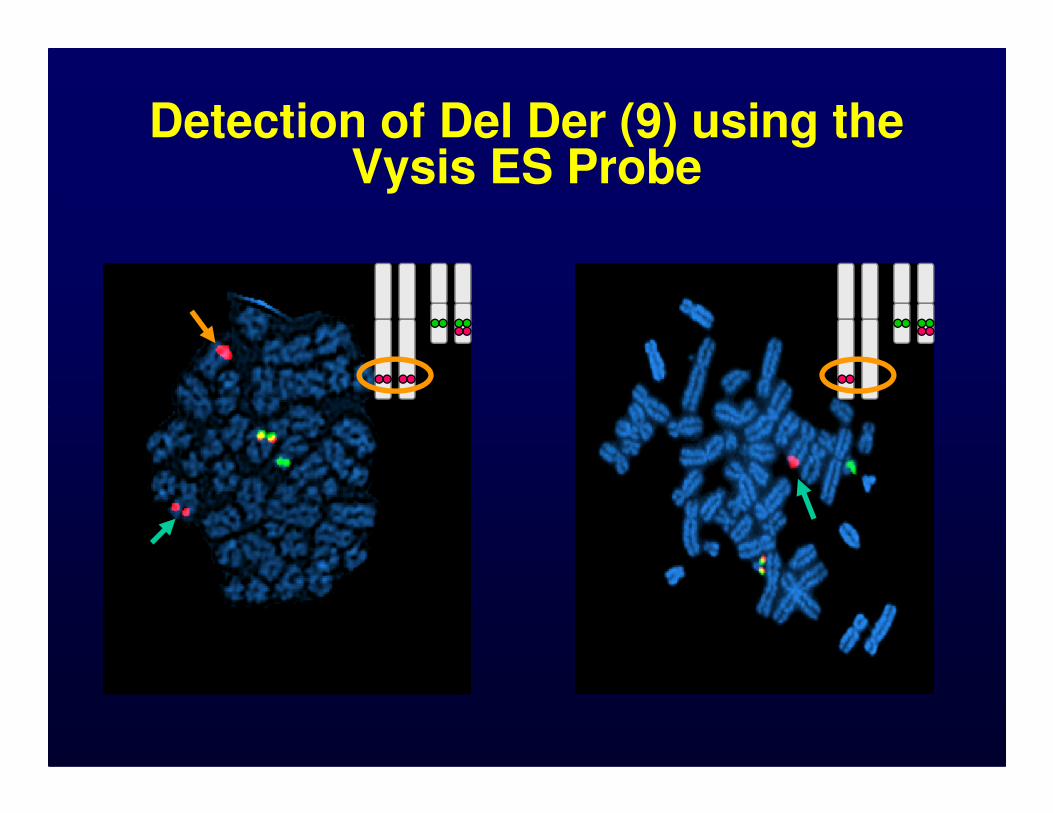
Detection of Del Der (9) using the Vysis ES Probe

Prognostic Significance of Deletion of der(9) in CML Patients Treated with Imatinib
• Huntly et al1 (n=397)
– Deletion der(9) in 59 (15%)
– Inferior response rate to imatinib
– More rapid disease progression
– Trend for inferior survival
• Quintas-Cardama et al2 (n=352)• Quintas-Cardama et al (n=352)
– Deletion der(9) in 33 (9%)
– No impact on response, remission duration or survival by MVA
• Castagnetti et al3 (n=521)
– Deletion der(9) in 60 (12%)
– 12 month CCyR rates were 82%/85% and MMR 69%/65%, respectively (with/without del der(9))1Huntly et al. Blood 2003; 102: 2205-2212; 2Quintas-Cardama et al. Blood 2005; 105: 2281-6
3Castagneti et al. JCO 2010; 28; 2748-54

Spectral Karyotyping (SKY)
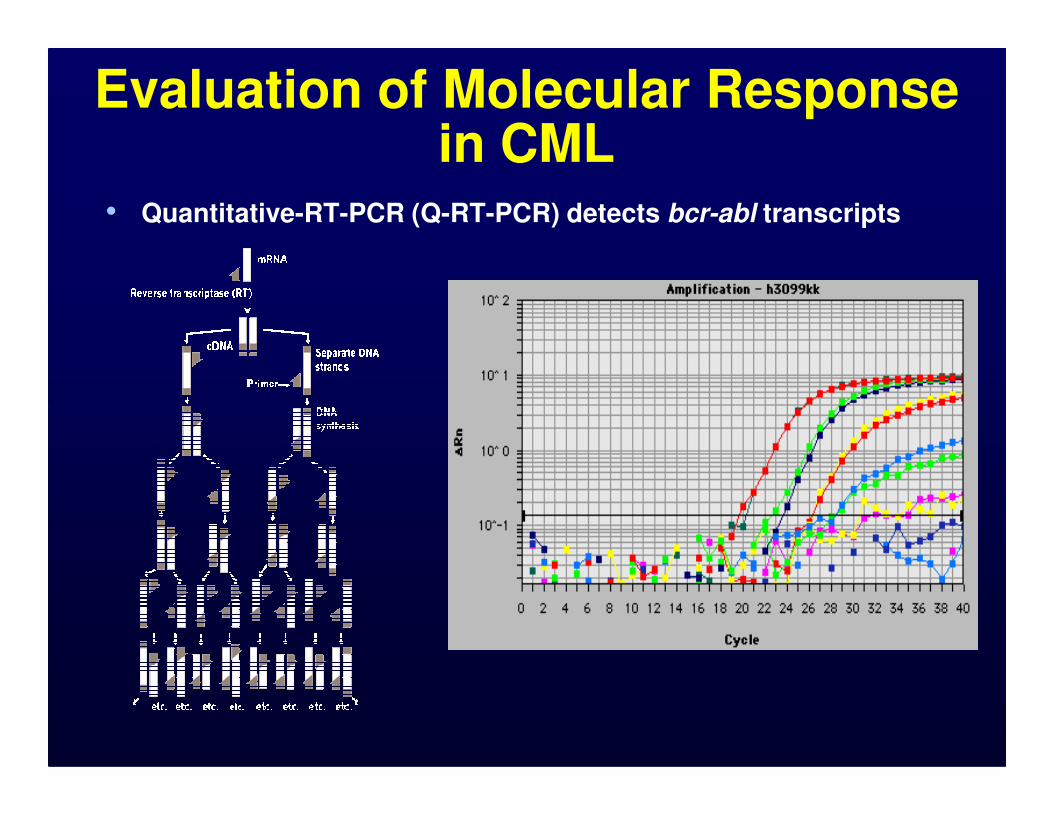
Evaluation of Molecular Response in CML
• Quantitative-RT-PCR (Q-RT-PCR) detects bcr-abl transcripts
% w
ith
ou
t p
rog
ressio
n
50
60
70
80
90
100
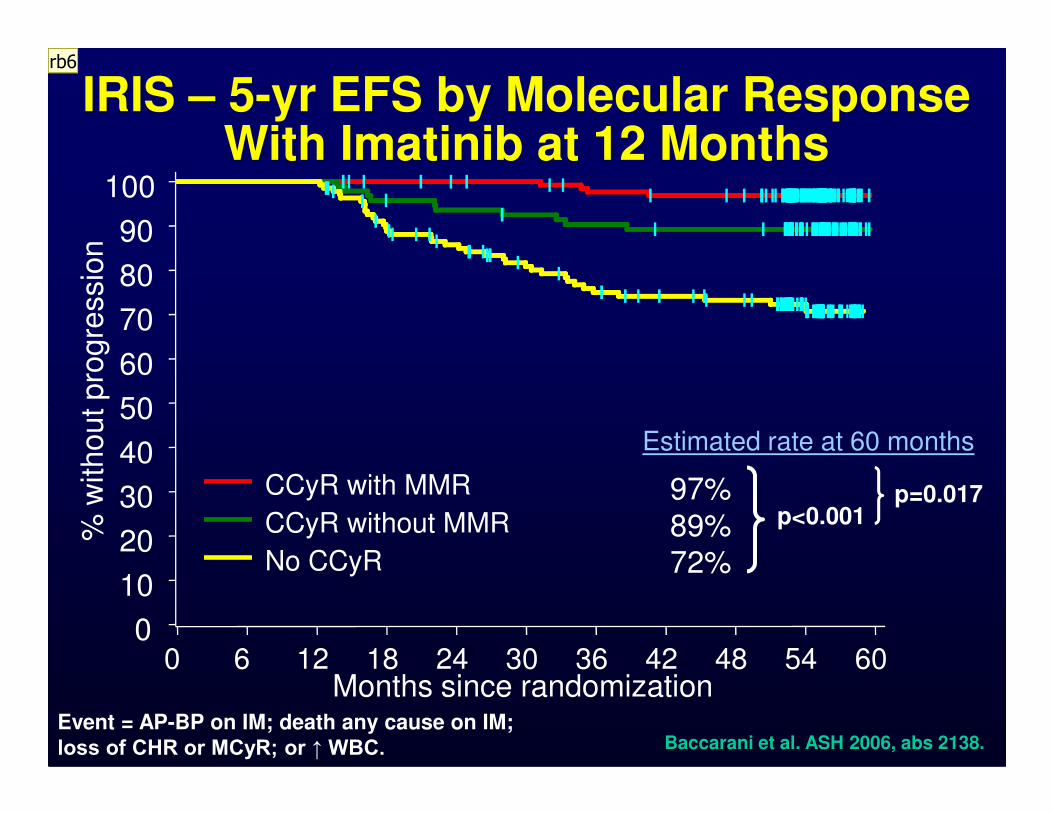
IRIS – 5-yr EFS by Molecular Response With Imatinib at 12 Months
CCyR with MMR
CCyR without MMR
No CCyR
% w
ith
ou
t p
rog
ressio
n
0
10
20
30
40
50
Months since randomization0 6 12 18 24 30 36 42 48 54 60
97% 89% 72%
Estimated rate at 60 months
p<0.001p=0.017
Baccarani et al. ASH 2006, abs 2138.Event = AP-BP on IM; death any cause on IM; loss of CHR or MCyR; or ↑ WBC.
rb6

Slide 22
rb6 Please add definition of EFS to slidesrbloechlinger, 2/28/2011

IRIS – 7-yr EFS by Molecular Response With Imatinib at 12 Months
% W
ithout E
vent
50
60
70
80
90
10092%91%
64%
53%
P = .25
BCR-ABL % (IS)
<=0.01%>0.1-1%>1-10%>10%
% W
ithout E
vent
0
10
20
30
40
50
Months Since Start of Treatment
0 12 24 36 48 60 72 84
53%
≤ 0.1% (n = 153)
>0.1-1% (n = 90)
>1-10% (n = 36)
>10% (n = 22)
(n=301)
≅≅≅≅ CCyR
Hughes T, et al. Blood 2010; 116: 3758-65Event = AP-BP on IM; death any cause on IM; loss of CHR or MCyR; or ↑ WBC.
% W
ithout E
vent
50
60
70
80
90
100
86%
95%
62%58%
P = .01
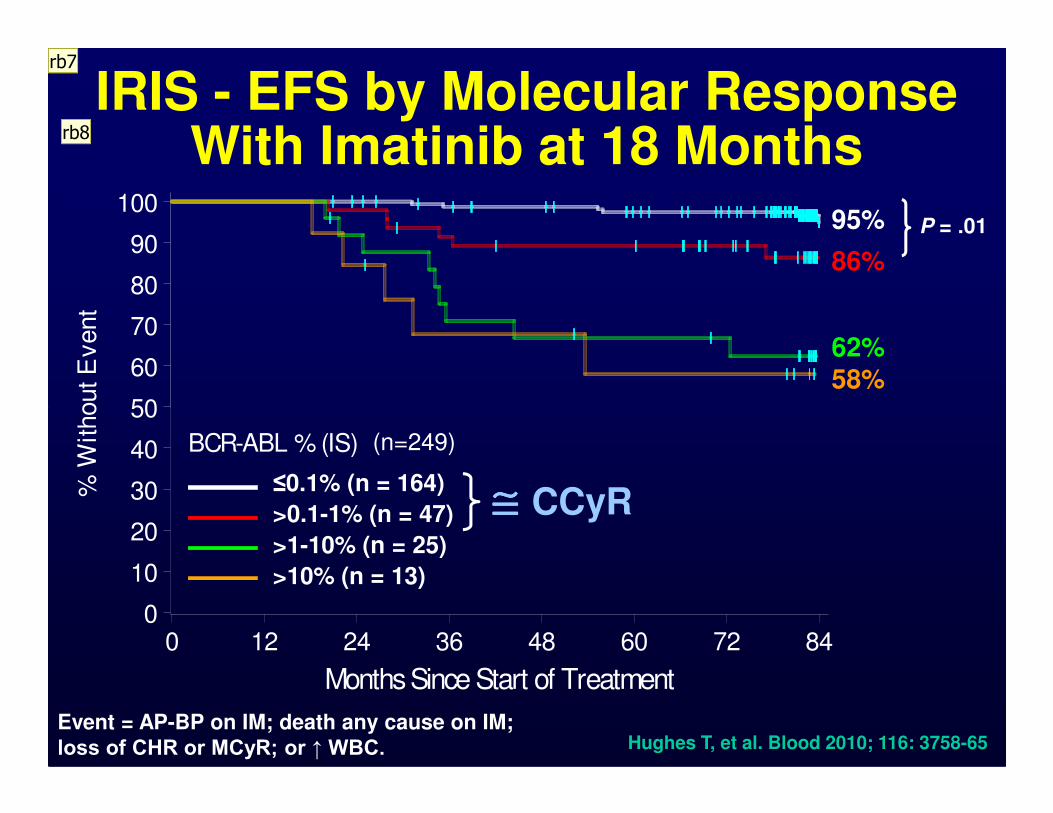
IRIS - EFS by Molecular Response With Imatinib at 18 Months
BCR-ABL % (IS)
<=0.01%>0.1-1%>1-10%>10%
% W
ithout E
vent
0
10
20
30
40
50
Months Since Start of Treatment
0 12 24 36 48 60 72 84
≤0.1% (n = 164)
>0.1-1% (n = 47)
>1-10% (n = 25)
>10% (n = 13)
(n=249)
≅≅≅≅ CCyR
Hughes T, et al. Blood 2010; 116: 3758-65Event = AP-BP on IM; death any cause on IM; loss of CHR or MCyR; or ↑ WBC.
rb7
rb8
Slide 24
rb7 Add definition of EFS. Original definition of IRIS does not include loss of CCyR.rbloechlinger, 2/28/2011
rb8 Loss of CCyR is now considered and important event, while it was not included in the original definition of EFS. When loss of CCyR isn included them MMR becomes important and signicrbloechlinger, 2/28/2011

7-Year Outcome by Molecular Response – All Patients
LandmarkPercentage
MMR No MMR
6 mo
EFS 85 84
TFS 96 93
OS 90 89OS 90 89
12 mo
EFS 91 79
TFS 99 90
OS 93 89
18 mo
EFS 95 75
TFS 99 90
OS 95 90
Hughes T, et al. Blood 2010; 116: 3758-65

7-Year Outcome by Molecular Response – Only Patients with CCyR
LandmarkPercentage
MMR No MMR
6 mo
EFS 85 93
TFS 96 98
OS 90 93OS 90 93
12 mo
EFS 91 92
TFS 99 96
OS 93 97
18 mo
EFS 95 86
TFS 99 96
OS 95 96
Hughes T, et al. Blood 2010; 116: 3758-65
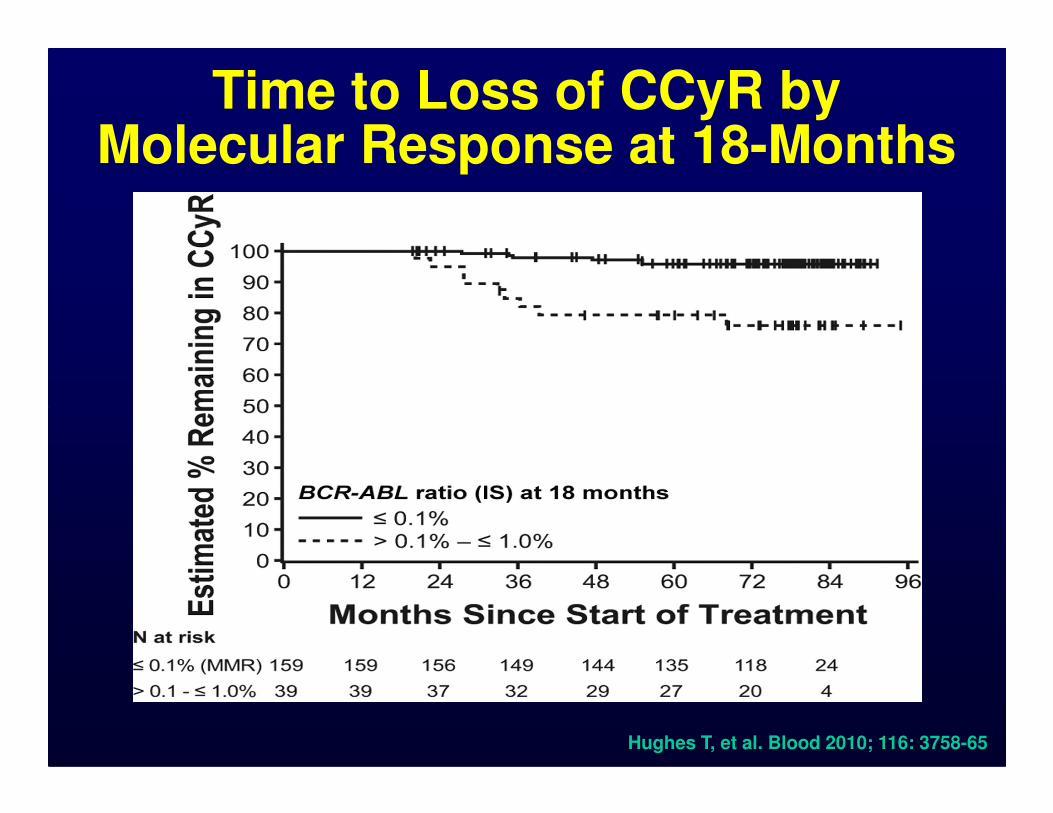
Time to Loss of CCyR by Molecular Response at 18-Months
Hughes T, et al. Blood 2010; 116: 3758-65

60
80
100
60
80
100
Significance of CMR in CML After Imatinib Therapy
CMR (n=28)CMR (n=21)
18-month landmark
free s
urv
ival (%
)
free s
urv
ival (%
)
Overall 18-month Landmark
0
20
40
60
0 10 20 30 40 50
0
20
40
60
0 10 20 30 40 50
CMR = complete molecular response.
MMR = major molecular response
MMR, not CMR (n=48)
P=0.0052
Months after MMR
MMR, not CMR (n=29)
P=0.0080
Months after MMR
Rela
pse-f
ree s
urv
ival (%
)
Rela
pse-f
ree s
urv
ival (%
)
Press et al. Clin Cancer Res 2007; 13: 6136-43

Significance of Sustained CMR in CML• 261 pts treated with frontline imatinib • Sustained CMR in 32% [undetectable (sensitivity ≥4.5-log)
in ≥ 2 consecutive assays over ≥6 mo]• Median time to sustained CMR 30 mo (6-84 mo)
Event-Free Survival Transformation-Free Survival
Verma et al. Blood 2009; 114; Abst# 505
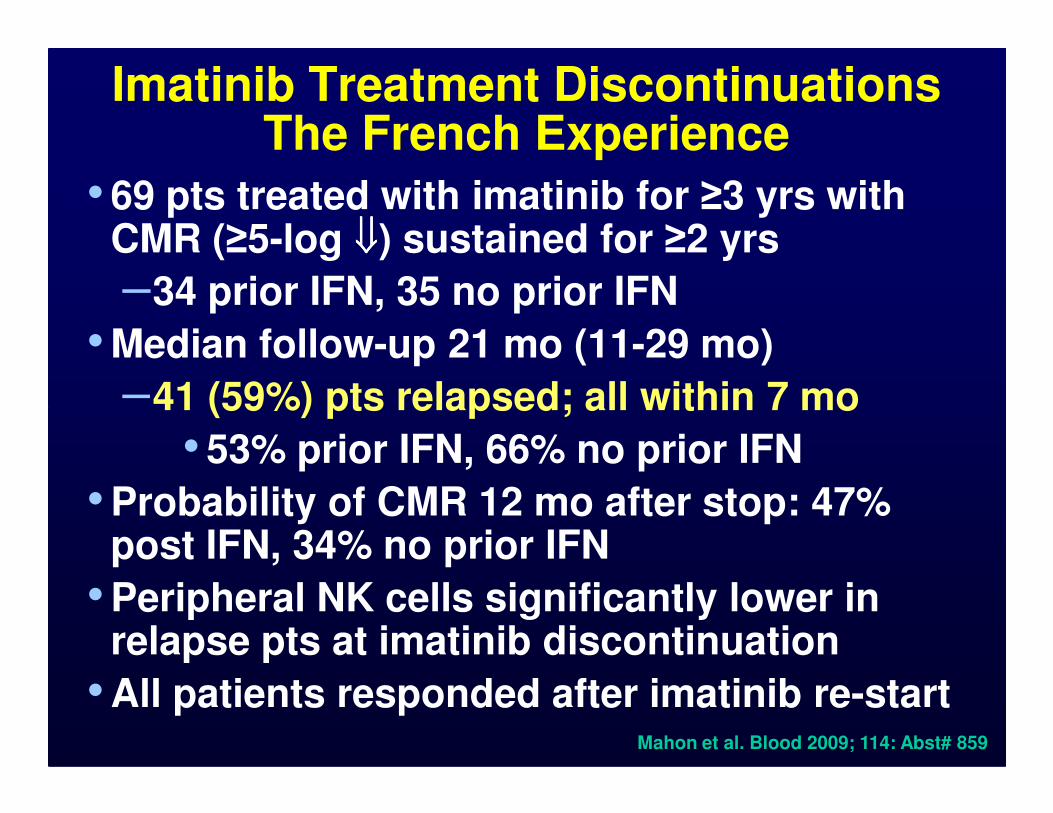
Imatinib Treatment DiscontinuationsThe French Experience
• 69 pts treated with imatinib for ≥3 yrs with CMR (≥5-log ⇓⇓⇓⇓) sustained for ≥2 yrs
–34 prior IFN, 35 no prior IFN
• Median follow-up 21 mo (11-29 mo)
–41 (59%) pts relapsed; all within 7 mo–41 (59%) pts relapsed; all within 7 mo
• 53% prior IFN, 66% no prior IFN
• Probability of CMR 12 mo after stop: 47% post IFN, 34% no prior IFN
• Peripheral NK cells significantly lower in relapse pts at imatinib discontinuation
• All patients responded after imatinib re-startMahon et al. Blood 2009; 114: Abst# 859

Patterns of Transcript Levels After Imatinib
10
1
0.1
100
AB
L/A
BL
rati
o (
%)
Cytogenetic relapse
In plateau
CCyR
12 18 24 30 36 6
0.01
0.001
0.0001
BC
R-A
BL
/AB
L r
ati
o (
%)
Months from start of imatinib
Continuing to decline
Marin et al. Leukemia 2005; 19: 507-12
•Plateau = log10 of most recent BCR–ABL/ABL ratio was no more than 0.25 'lower' than the log10 of the mean BCR–ABL/ABL ratios measured after 18 months from the start of imatinib

Increasing Transcript Levels in CML
40
50
60
70
80
90
No
. P
ati
en
ts“We conclude that a rise in BCR-ABL of more than 2-fold can be used as a
primary indicator to test patients for
0
10
20
30
40
No
. P
ati
en
ts
<0.1 >0.1 <0.1 >0.1
>2x increase Stable or decrease
Mutation No Mutation
Branford et al. Blood 2004; 104: 2926-32
primary indicator to test patients for BCR-ABL kinase domain mutations.”

Loss of CG CR by ⇑⇑⇑⇑ in Transcript Levels
4
6
8
10
12
14
16
18
No. patie
nts
CGCR lost
CGCR not lost
0
2
4
MMR No MMR MMR No MMR MMR No MMR
<1-log 1-2-log >2log
Log increase by lowest transcript level
No. Best Mol Resp No. lost CG CR (%) p
37 MMR 1 (3)0.0006
24 No MMR 9 (38)Cortes et al. Clin Cancer Res 2005; 11: 3425-32

Half-log Increase in Transcript Levels Predicts relapse in CML
Press et al, Clin Cancer Res 2007; 13: 6136-43

Receiver Operating Characteristic Analysis To Define The Optimal qPCR Trigger
Press et al. Blood 2009; 114: 2598-605

Significance of Rising MRD in CGCR on Imatinib
• 116 pts in durable CGCR on imatinib ≥18 mos had ↑↑↑↑QPCR ≥0.5 log
• 11/116 (9%) had CML progression
• 10/44 (23%) progression if : loss of MMR or not in MMR and ↑↑↑↑ QPCR ↑↑↑↑ > 1 log
• ↑↑↑↑•Status ↑↑↑↑QPCR No. CML progression
MMR Any 28 0
Loss of MMR 0.5-1
>1
12
36
0
6
Not in MMR <1
>1
32
8
1
4
Kantarjian et al. JCO 2009; 27: 3642-9

Criteria for Failure and Suboptimal Response to Imatinib
Time (mo)Response
Failure Suboptimal Optimal
3 No CHRNo CG
Response<65% Ph+
6No CHR
>95% Ph+≥35% Ph+ ≤35% Ph+Lack or loss of
molecular 6
>95% Ph+≥35% Ph+ ≤35% Ph+
12 ≥35% Ph+ 1-35% Ph+ 0% Ph+
18 ≥5% Ph+ No MMR MMR
Any
Loss of CHRLoss of CCgR
MutationCE
Loss of MMRMutation
Stable or improving
MMR
Baccarani et al. JCO 2009; 27: 6041-51
molecular response is not a criterion for
failure
rb10JC4

Slide 37
rb10 Suggest to indiecate MMR is part of the ELN Optimal Response Criteriarbloechlinger, 2/28/2011
JC4 That is not my side of the argument for this debate.jecortes, 2/28/2011

What is Not Failure to Therapy in CML
• FISH 1-10%
• No MMR at 12 months
• PCR still positive• PCR still positive
• Increasing transcript levels
• Chromosomal abnormalities in Ph-negative metaphases
The Simple Interpretation of Molecular Results
• If it is going down, it is good
• If it is stable, it is OK
• If it is going up, monitor more frequentlyfrequently
–Not a failure by itself
• First, optimize therapy; then:
–Consider low-risk strategies (eg, vaccines)
–Dasatinib, nilotinib?Whitehead AN & Ruyssell B. Principia Mathematica. Cambridge Uniuversity Press. 1910.

Reproducibility of CCyR and MMR Across CML Frontline Trial
Median (range) 67 (59-74) 27 (15-39)
Mean (95% CI) 67 (63-71) 28 (21-35)
Adapted from Baccarani et al. Blood 2010; abst #668

BCRBCR--ABLABLISIS after Conversionafter ConversionBCRBCR--ABL prior to ConversionABL prior to Conversion
1010
3 exchanges of patient samples May 05, April 06, Aug 06 3 exchanges of patient samples May 05, April 06, Aug 06
AB
L%
AB
L%
IS
IS
100100
Ref LabRef Lab
Lab 5 Lab 5
CF 1.25CF 1.25
CF 0.239CF 0.239
-- BCRBCR
-- ABLABL
Branford, 2006, Blood, 108, abstract 737Branford, 2006, Blood, 108, abstract 737
Ref Lab Lab 5
median 0.97%median 0.72% P=0.9
38 Patient Samples38 Patient Samples0.0010.001
0.10.1
1.01.0
0.010.01
BC
RB
CR
--AB
L%
AB
L%
Ref Lab Lab 5
median 0.78%median 3.10%P<0.0001

Important Considerations Regarding Molecular Monitoring in CML
• Maintain same source
• Maintain same lab
–IS to minimize this problem–IS to minimize this problem
• Consider variability of test
• Uniform reporting
• Needs: standardization, speed, access

So What Do We Get?
Response Translates into:
CCyRSignificantly improved survival
Improvement in EFS, Molecular Response is a
MMRImprovement in EFS, possible longer duration CCyR
CMRPossibility of consideringtreatment discontinuation (clinical trials only)
Molecular Response is a Measure of Success, Not a
Measure of Failure

Mechanisms of Resistance to Imatinib
• Bcr-Abl-Dependent
–Amplification/overexpression
–Mutations in Abl
–Remigration of Bcr-Abl to cytoplasm
• Bcr-Abl-Independent• Bcr-Abl-Independent
–Increased MDR expression
–Increased alpha-1 acid glycoprotein
–Overexpression of Src-related kinases
• Quiescent stem cells (Persistence)LeCoutre Blood 95: 1758, 2000.Weisberg Blood 95: 3498, 2000
Mahon Blood 96: 1070, 2000. JNCI 92:1641, 2000. Vigneri Nature Medicine 7: 228, 2001

Incidence of BCR-ABL Mutations after Imatinib Failure
Apperley J. Lancet Oncology 2007; 8: 1018-29
p = P-loop, b = imatinib binding, c = catalitic domain, a = activation loop
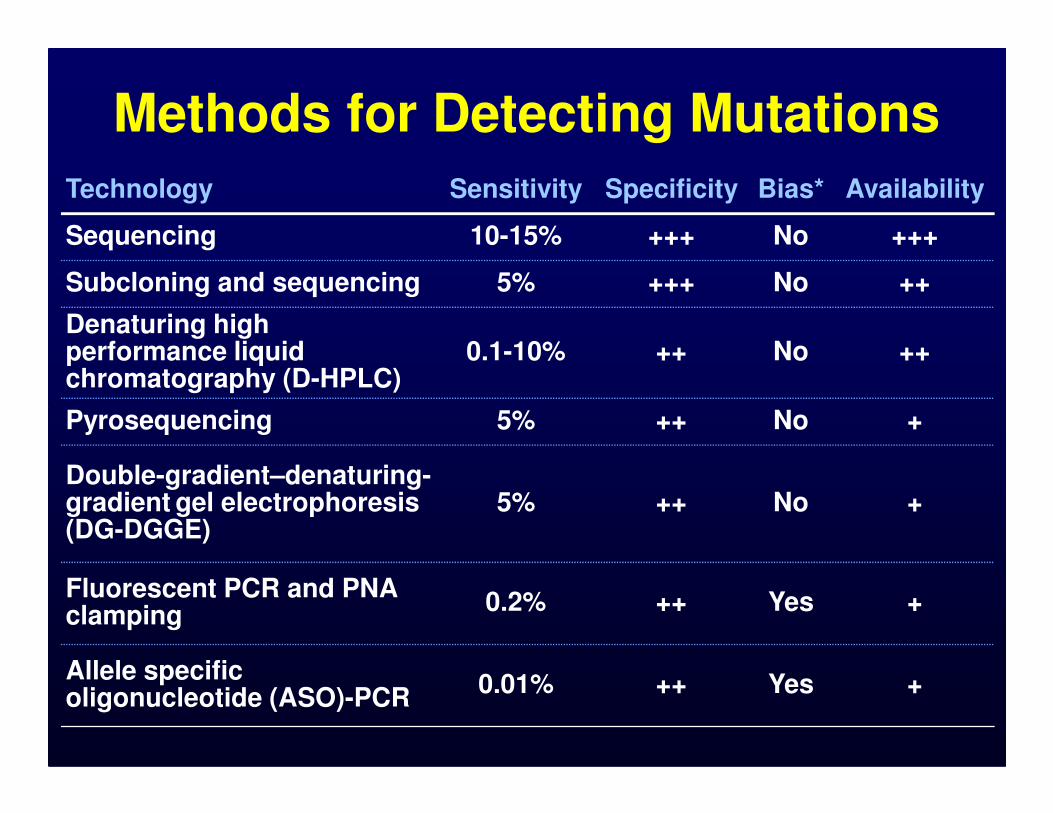
Technology Sensitivity Specificity Bias* Availability
Sequencing 10-15% +++ No +++
Subcloning and sequencing 5% +++ No ++
Denaturing high performance liquid chromatography (D-HPLC)
0.1-10% ++ No ++
Pyrosequencing 5% ++ No +
Methods for Detecting Mutations
Pyrosequencing 5% ++ No +
Double-gradient–denaturing-gradient gel electrophoresis (DG-DGGE)
5% ++ No +
Fluorescent PCR and PNA clamping
0.2% ++ Yes +
Allele specific oligonucleotide (ASO)-PCR
0.01% ++ Yes +
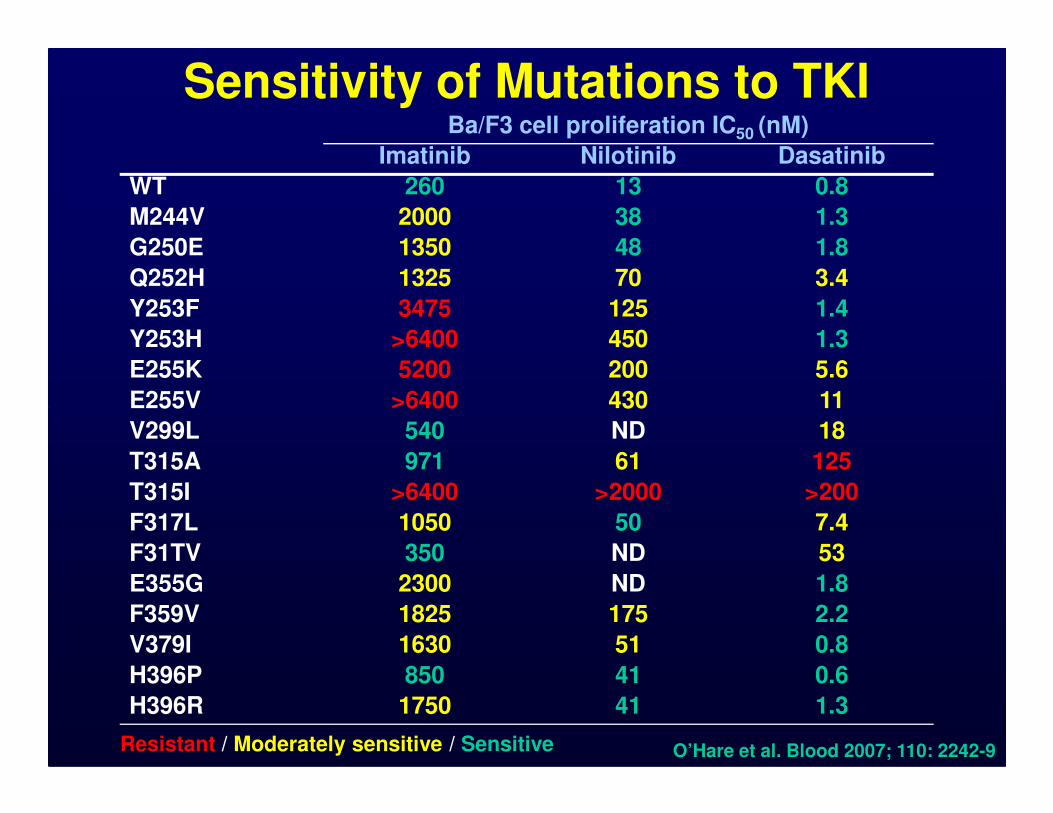
Sensitivity of Mutations to TKIBa/F3 cell proliferation IC50 (nM)
Imatinib Nilotinib Dasatinib
WT 260 13 0.8
M244V 2000 38 1.3
G250E 1350 48 1.8
Q252H 1325 70 3.4
Y253F 3475 125 1.4
Y253H >6400 450 1.3
E255K 5200 200 5.6
E255V >6400 430 11E255V >6400 430 11
V299L 540 ND 18
T315A 971 61 125
T315I >6400 >2000 >200
F317L 1050 50 7.4
F31TV 350 ND 53
E355G 2300 ND 1.8
F359V 1825 175 2.2
V379I 1630 51 0.8
H396P 850 41 0.6
H396R 1750 41 1.3
O’Hare et al. Blood 2007; 110: 2242-9Resistant / Moderately sensitive / Sensitive

CCyR by Mutations in CML Treated with 2nd
Generation TKI after IM Failure• 86/169 (51%) pts treated had mutation
• CP 30/59 (51%), AP 41/71 (58%), BP 15/39 (38%)
• IC50 for dasatinib, nilotinib predictive for response in CP and AP
Chronic Phase Accelerated Phase
Jabbour et al, Blood 2009; 114: 2037-43

Inducible Mutations in Mutagenesis Studies with AMN and BMS
• Mutants induced by saturation, selection, or induced (ENU)
• Mutations: imatinib 20, nilotinib 10, dasatinib 9
DrugConcentration
DrugLow Intermediate
AMN L248V, G250E, F359C, L384M, L387F
Y253H, E255K/(V), T315I
BMS L248V, Q252H, E255K/V, V299L
T315I, F317C/L/V
Bradeen et al. Blood. 2006; 108: 2332-8; Ray et al. Blood. 2007; epub ahead of print; von Bubnoff et al. Blood. 2006; 108: 1328-33. Burgess et al. PNAS. 2005; 102: 3395-400.

Spectrum and frequency of BCR-ABL KD mutations recovered after TKI therapy
10
15
20
%
Imatinib
Dasatinib
Nilotinib
• T315I and F359V recovered after treatment with SKI-606
0
5
10
G250E Y253F/H E255G/K V299L F311I/L T315I F317L/V M351T E355G/A F359C/V H396P/R
BCR/ABL Mutation
Cortes et al. Blood 2007; 110: 4005-11

Outcome by Presence of Mutation Prior to Imatinib Exposure
Event-free Survival Overall Survival
• ASO-PCR for Q252H, Y253F, Y253H, E255K, E255V, T315I, M351T, and F359V in 66 pts
• Mutations in 14 (21%): 10/27 (37%) AP, 5/19 (26%), 0/20 CP
Willis et al. Blood 2005; 106: 2128-37
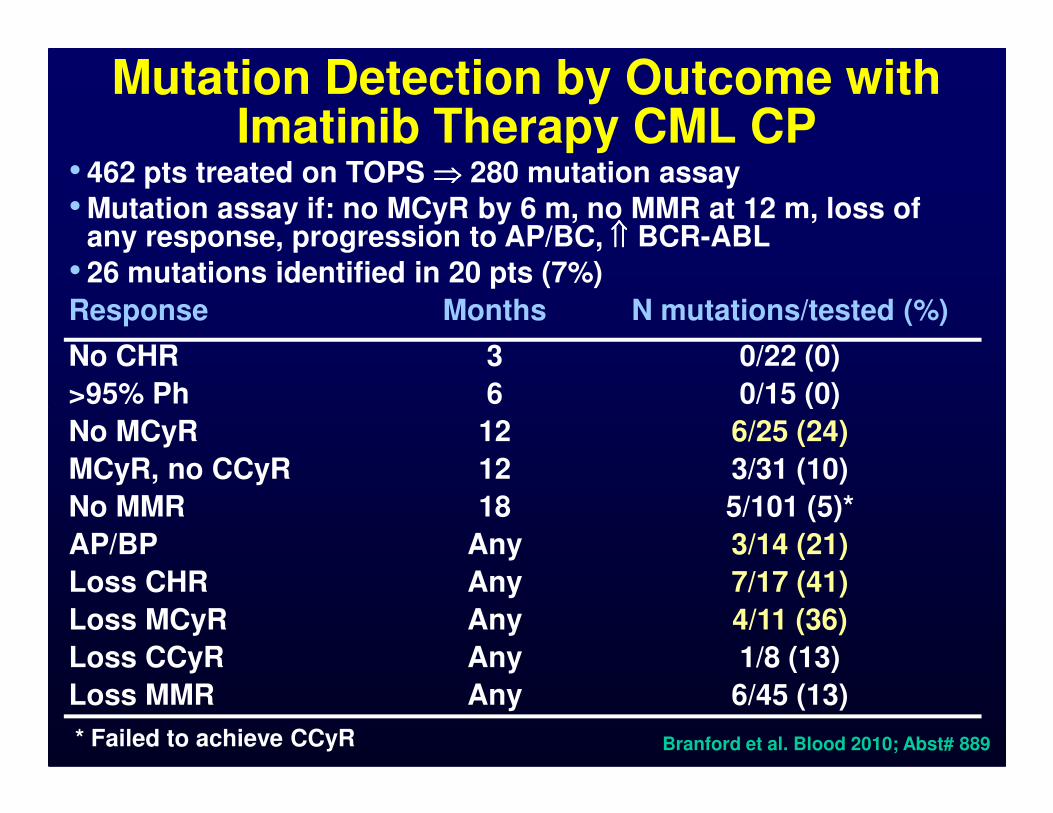
Mutation Detection by Outcome with Imatinib Therapy CML CP
• 462 pts treated on TOPS ⇒⇒⇒⇒ 280 mutation assay
• Mutation assay if: no MCyR by 6 m, no MMR at 12 m, loss of any response, progression to AP/BC, ⇑⇑⇑⇑ BCR-ABL
• 26 mutations identified in 20 pts (7%)
Response Months N mutations/tested (%)
No CHR 3 0/22 (0)
>95% Ph 6 0/15 (0)>95% Ph 6 0/15 (0)
No MCyR 12 6/25 (24)
MCyR, no CCyR 12 3/31 (10)
No MMR 18 5/101 (5)*
AP/BP Any 3/14 (21)
Loss CHR Any 7/17 (41)
Loss MCyR Any 4/11 (36)
Loss CCyR Any 1/8 (13)
Loss MMR Any 6/45 (13)
* Failed to achieve CCyR Branford et al. Blood 2010; Abst# 889
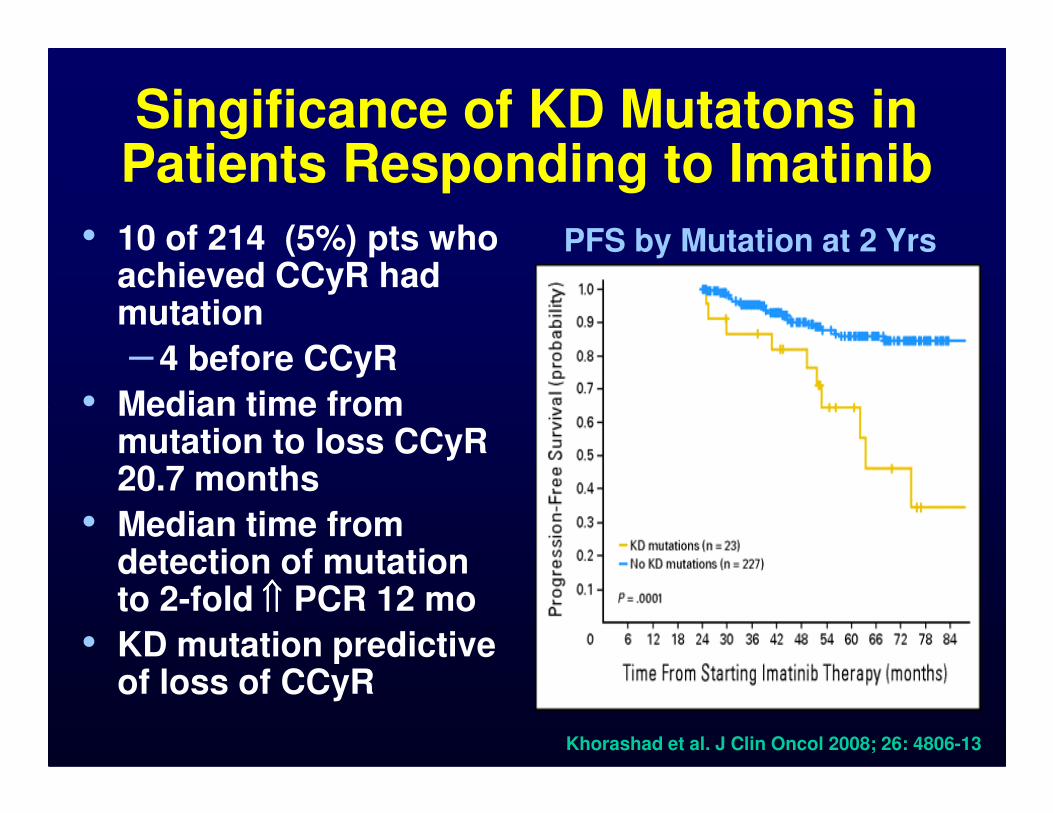
Singificance of KD Mutatons in Patients Responding to Imatinib
• 10 of 214 (5%) pts who achieved CCyR had mutation
– 4 before CCyR
• Median time from
PFS by Mutation at 2 Yrs
• Median time from mutation to loss CCyR 20.7 months
• Median time from detection of mutation to 2-fold ⇑⇑⇑⇑ PCR 12 mo
• KD mutation predictive of loss of CCyR
Khorashad et al. J Clin Oncol 2008; 26: 4806-13

Analysis of Mutations in CML• Over emphasized; results produce more false
therapeutic leads than benefits
• No role for mutation studies pre-Rx or in imatinib responding patients
• If CG or hematologic relapse, mutations studies may help
–T315I: no role for new TKIs; allo SCT or –T315I: no role for new TKIs; allo SCT or others (HU, ara-C, HHT, “T315I inhibitors”)
–Nilotinib IC50>150nM (e.g. Y253H, E255V, F359V) ⇒⇒⇒⇒ Dasatinib
–Dasatinib IC50>3nM (e.g. F317L, V299L) ⇒⇒⇒⇒Nilotinib
• But: ~50% have no mutations, and no difference or no information for most

Monitoring Recommendations for CML According to the ELN 2009
Objective Recommended frequency
Hematologic•Every 2 wk until CHR, then at least every 3
mo or as required
•At diagnosis, 3 mo, 6 mo and every 6 mo until confirmed CCyR, then every 12 mo if
Cytogeneticuntil confirmed CCyR, then every 12 mo if molecular monitoring not assured
•At failure or unexplained myelosuppression
Molecular•Every 3 mo until MMR confirmed, then every
6 mo
Mutations• In case of failure or suboptimal response, or
before change to 2nd TKI
Baccarani et al. JCO 2009; 27: 6041-51

Approaches to Monitoring in CML• The conservative approach
– CG every 6 mo until CCyR, then every 6-12 mo• The FISHer approach
– No CG– Use FISH to evaluate “molecular” response
• The molecular enthusiast approach– PCR only, every 3 months
•– PCR only, every 3 months
• The “I-don’t-care-about-any-such-studies” approach– CBC only
• The hybrid approach– Baseline CG (+FISH? +PCR?)– BM (CG) every 6-12 mo until CCyR, then every 1-2 yrs– FISH every 3mo until “negative”– PCR every 3 mo during 1st yr, then every 6 mo
• Mutations when clinical failure
Kantarjian et al. Blood 2008; 111: 1774-80

Not everything that counts can be counted, and not everything that can be
counted counts.counted counts.
Albert Einstein (1879-1955)
(Sign hanging in Einstein's office at
Princeton)