cumbria county council and cheshire county council ... · in 2005/6 household waste arisings in...
TRANSCRIPT

Cumbria County Council and Cheshire County Council
Analysis of BVPI 84a Final Report
April 2007
C r e a t i n g t h e e n v i r o n m e n t f o r b u s i n e s s
© Entec UK Limited
Doc Reg No. 20002 Page ii
April 2007
Copyright and Non-Disclosure Notice The contents and layout of this report are subject to copyright owned by Entec (© Entec UK Limited 2007) save to the extent that copyright has been legally assigned by us to another party or is used by Entec under licence. To the extent that we own the copyright in this report, it may not be copied or used without our prior written agreement for any purpose other than the purpose indicated in this report. The methodology (if any) contained in this report is provided to you in confidence and must not be disclosed or copied to third parties without the prior written agreement of Entec. Disclosure of that information may constitute an actionable breach of confidence or may otherwise prejudice our commercial interests. Any third party who obtains access to this report by any means will, in any event, be subject to the Third Party Disclaimer set out below.
Third-Party Disclaimer Any disclosure of this report to a third-party is subject to this disclaimer. The report was prepared by Entec at the instruction of, and for use by, our client named on the front of the report. It does not in any way constitute advice to any third-party who is able to access it by any means. Entec excludes to the fullest extent lawfully permitted all liability whatsoever for any loss or damage howsoever arising from reliance on the contents of this report. We do not however exclude our liability (if any) for personal injury or death resulting from our negligence, for fraud or any other matter in relation to which we cannot legally exclude liability.

C r e a t i n g t h e e n v i r o n m e n t f o r b u s i n e s s
© Entec UK Limited
Doc Reg No. 20002 Page iv
April 2007
Executive Summary
Purpose of this Report This report has been produced to enable a better understanding of why the County Council’s of Cheshire and Cumbria produce higher than average quantities of household waste (measured by their performance in the Best Value Performance Indicator 84a). Data included within this report have been obtained from a variety of sources including WasteDataFlow, the Office of National Statistics, the Audit Commission and various local authority officers. Any conclusions reached in this report are based on the assumption that all the information provided to or sourced by Entec in connection with the preparation of this report are accurate, complete and not misleading.
In 2005/6 household waste arisings in Cheshire and Cumbria were reported at 620 kg/person/year and 636 kg/person/year respectively. This compares with the average County Council arising of 530 kg/person/year. The best performing County Council in England in 2005/6 was Oxfordshire which reported a household waste arisings of 480 kg/person/year.
Entec were commissioned by Cumbria and Cheshire County Council’s to undertake a desk based study to highlight potential causes of high household waste arisings and propose suitable recommendations on how to reduce arisings in the future. A review of existing literature was undertaken to establish a number of factors known to affect household waste arisings. While the various literature reviewed identified a number of consistent factors thought to affect waste generation (namely household size, provision of garden waste collections) the reports contradicted each other with regards to the effect that certain other factors had on waste generation, such as rural/urban nature of an authority, socio-demographics and affluence.
A ‘Nearest Neighbour’ analysis was conducted for both Cumbria and Cheshire to identify authorities with similar characteristics to enable comparisons of waste management policies and practises to be carried out. A total of six authorities were selected as comparators for both Cheshire and Cumbria (3 good performing authorities and 3 poor performing authorities were selected).
Waste arisings data was downloaded from WasteDataFlow for all authorities identified in the ‘Nearest Neighbour’ analysis. Data was converted into a ‘kilograms of waste per person per year’ (kg/person/yr) unit to allow a direct comparison between authorities and to breakdown the BVPI 84a figure into its constituent elements. The process of comparing downloaded WasteDataFlow data and reported BVPI 84a data highlighted the issue of accurate data management and reporting as there were a number of data discrepancies for a high proportion of the authorities selected. Calculation of the Cheshire BVPI 84a using WasteDataFlow data and the appropriate methodology resulted in the figure reducing from the reported 620 kg/person/year to a calculated 589 kg/person/year.
Analysis of data from WasteDataFlow suggested that waste arisings at a waste collection authority (WCA) level for Cheshire were of a level comparable with authorities selected as similar to Cheshire. This suggested that the high household waste arising in Cheshire could in part be due to policies at the Household Waste and Recycling Centres

C r e a t i n g t h e e n v i r o n m e n t f o r b u s i n e s s
© Entec UK Limited
Doc Reg No. 20002 Page v
April 2007
(HWRCs) located within the County. While HWRC arisings were also higher than average in Cumbria, waste arisings at the WCA level were also significantly higher than comparative authorities.
Over 40 local authority representatives were contacted and interviewed as a part of this study. An understanding of the various waste management policies and their effectiveness on waste prevention and minimisation has been gained from these interviews and the results and findings are presented within this report.
Sections 4 to 9 of this report describe the methodologies used in compiling this study and findings are presented in a variety of charts and tables. A brief summary of statistical methods used in this report is provided in Appendix A.
Section 10 presents a summary of the key findings for both Cheshire and Cumbria, and Section 11 provides a list of recommendations for further work to assist in the reduction of household waste arisings.
C r e a t i n g t h e e n v i r o n m e n t f o r b u s i n e s s
© Entec UK Limited
Doc Reg No. 20002 Page vi
April 2007

C r e a t i n g t h e e n v i r o n m e n t f o r b u s i n e s s
© Entec UK Limited
Doc Reg No. 20002 Page vii
April 2007
Contents
1. Introduction 1
1.1 Project Appreciation 1 1.2 Best Value Performance Indicators 1 1.3 Background Information 1 1.4 Cumbria County Council 2 1.5 Cheshire 3 1.6 Definition of Household Waste and Municipal Waste 5 1.7 BVPI 84a 6 1.7.1 Definition 6 1.7.2 Waste Collection Authorities 6 1.7.3 Waste Disposal Authorities 7
2. Literature Review 9
2.1 Factors Affecting Household Waste Arisings 9 2.1.1 Introduction 9 2.1.2 WRAP Report 9 2.1.3 Welsh Assembly 10 2.1.4 Entec Experience and Anecdotal Evidence 11
3. Comparator Authority Selection 13
3.1 Introduction 13 3.2 What is a ‘Nearest Neighbour’ Analysis? 13
4. Data Analysis 17
4.1 Cumbria and Cheshire BVPI 84a 17 4.1.1 Comparing WDA Figures 17 4.1.2 Waste Collection Authority Arisings 20 4.1.3 Data Management Issues 22 4.2 Historical Trends and Improving Authorities 24
5. Factors Affecting Waste Generation 29
5.1 Deprivation 29 5.2 Household Size, Composition and Type 30

C r e a t i n g t h e e n v i r o n m e n t f o r b u s i n e s s
© Entec UK Limited
Doc Reg No. 20002 Page viii
April 2007
5.2.1 Demographics – Urban/Rural Locations 35 5.2.2 Street Cleaning and Gully Emptying 36 5.3 Summary of Relationship between Area Demographics and Waste Generation 38
6. Kerbside Collection Policies 41
6.1 Introduction 41 6.2 Residual Waste Collection 41 6.3 Garden Waste Collections 43 6.4 Free Versus Charged Schemes 43 6.5 Blaby District Council Case-Study 44 6.6 Provision of a Garden Waste Collection 45 6.6.1 Containment and Yield – Suffolk Coastal District Council Case-Study 48
7. Trade Waste 51
7.1 Introduction 51 7.2 Where Can Trade Waste Go? 51 7.3 Local Authority Survey 51 7.3.1 Survey Summary Results 52 7.4 Estimating Trade Waste Volumes 53 7.4.1 Charging Method 57 7.4.2 Schools 57 7.4.3 Bed and Breakfast (B&B) Properties 58 7.4.4 Farms 58 7.4.5 Commercial Waste Composition 58
8. Tourism 61
8.1 Introduction 61 8.2 Literature Review 61 8.3 How Much Waste Do Tourists In Cumbria Generate? 62 8.4 Increases In Waste Arisings Over Time - Is It Due To Tourism? 67
9. HWRC Arisings 71
9.1 Introduction 71 9.2 Effect of Levels of Deprivation on CA Waste Arisings 72 9.3 Effect of Urban or Rural Location on HWRC Waste Arisings 74 9.4 Effect of Car Ownership Levels on HWRC Waste Arisings 75

C r e a t i n g t h e e n v i r o n m e n t f o r b u s i n e s s
© Entec UK Limited
Doc Reg No. 20002 Page ix
April 2007
9.5 Effect of HWRC Density on HWRC Waste Arisings 76 9.5.1 Effect of Kerbside Residual Waste Containment Method and HWRC Waste Arisings 77 9.5.2 Effect of ‘Other Factors’ on HWRC Arisings 78 9.5.3 Effect of Cross-Border Usage and Access Restrictions on HWRC Waste Arisings 79 9.5.4 Trade Waste Abuse 81 9.5.5 Summary of HWRC Policies and Provision for Cheshire and Nearest Neighbour Authorities 81 9.5.6 Cheshire Permit Scheme 83 9.5.7 Summary of HWRC Policies and Provision for Cumbria and Nearest Neighbour Authorities 85
10. Summary and Conclusions 88
10.1 Introduction 88 10.2 Cheshire 88 10.3 Cumbria 89
11. Recommendations 92
Table 1.1 BVPI 84a Performance for Cumbria, Cheshire and Lancashire (2004 /05 and 2005 / 06) 2 Table 1.2 WCA BVPI 84a Categories 7 Table 1.3 WDA BVPI 84a Categories 8 Table 3.1 Nearest Neighbour Parameters 14 Table 3.2 Results of Cheshire Nearest Neighbour Analysis 14 Table 3.3 Results of Cumbria Nearest Neighbour Analysis 15 Table 3.4 Cheshire and Cumbria Nearest Neighbour Selected Authorities 16 Table 4.1 Nearest Neighbour Waste Disposal Authorities BVPI 84a Calculations (kg/person/year) 19 Table 4.2 Cumbria Waste Collection Authorities BVPI 84a (kg/person/year) 20 Table 4.3 Cheshire Waste Collection Authorities BVPI 84a (kg/person/year) 21 Table 4.4 Kilograms per Person per Year of Question 23 Non-BVPI 84a categories (WCA) 23 Table 4.5 Historical BVPI 84a Figures for Cheshire, Cumbria and Selected ‘Improving’ Authorities 25 Table 4.6 Bedfordshire’s Waste Arisings - 2002/3 and 2005/6 26 Table 5.1 Street Cleaning Waste Composition for Town Centres, Rural and Housing Areas 37 Table 6.1 Cheshire and Nearest Neighbour Authorities Level of Garden Waste Provision and Household Waste Arisings (BVPI
84a - 2005/6) 46 Table 6.2 Cheshire and Nearest Neighbour Authorities Level of Garden Waste Provision and Household Waste Arisings (BVPI
84a - 2005/6) 47 Table 7.1 Examples of Standard Bin Weight Conversion Factors 53 Table 7.2 Effect of Different Trade Waste Calculation Methodologies on BVPI 84a - Cumbria 55 Table 7.3 Recalculation of BVPI 84a (2005/6) Using Different Standard Weight - Cumbria 55 Table 7.4 Effect of Different Trade Waste Calculation Methodologies on BVPI 84a - Cheshire 56 Table 7.5 Recalculation of BVPI 84a (2005/6) Using Different Standard Weight - Cheshire 56 Table 8.1 Tourism Statistics for Cumbria 2000 - 2005 68 Table 9.1 Factors Affecting CA Site Arisings 71 Table 9.2 Cheshire and ‘Nearest Neighbour’ Authorities - HWRC Policies and Statistics 82 Table 9.3 Cumbria and ‘Nearest Neighbour’ Authorities - HWRC Policies and Statistics 86
Figure 1.1 District Councils in Cumbria 3 Figure 1.2 District Councils in Cheshire 4 Figure 1.3 Household Waste Sources 5 Figure 4.1 Historical BVPI 84a Figures for Cheshire, Cumbria and Selected ‘Improving’ Authorities 25 Figure 5.1 County Council Deprivation and BVPI 84a (2005/6) 29

C r e a t i n g t h e e n v i r o n m e n t f o r b u s i n e s s
© Entec UK Limited
Doc Reg No. 20002 Page x
April 2007
Figure 5.2 District Council BVPI 84a and Deprivation 30 Figure 5.3 Average Household Size Plotted against BVPI 84a (2005/6) for all County Councils in England 31 Figure 5.4 Cheshire Nearest Neighbour Counties and Household Size 32 Figure 5.5 Cumbria Nearest Neighbour Counties and Household Size 32 Figure 5.6 Cheshire Nearest Neighbour - Households Residents 33 Figure 5.7 Cumbria Nearest Neighbour - Households Residents 34 Figure 5.8 Cheshire and Nearest Neighbour’s - Household Type 34 Figure 5.9 Cumbria and Nearest Neighbour’s - Household Type 35 Figure 5.10 Household Waste Generation and Authority Demographic (Urban, Accessible Rural and Remote Rural) 36 Figure 6.1 BVPI 84a and Residual Waste Containment Method 42 Figure 6.2 BVPI 84a, Residual Waste Containment Method and Authority Classification 43 Figure 6.3 Level of Garden Waste Collection Provision and Total Household Waste Arisings (BVPI 84a) for WCA’s In Cheshire,
Cumbria and Their Respective nearest Neighbour Authorities. 45 Figure 6.4 Cheshire and Nearest Neighbour Authorities Level of Garden Waste Provision and Household Waste Arisings (BVPI
84a - 2005/6) 47 Figure 6.5 Cumbria and Nearest Neighbour Authorities Level of Garden Waste Provision and Household Waste Arisings (BVPI
84a - 2005/6) 48 Figure 8.1 Relationship between Tourist Bednights per Head of Resident Population and BVPI 84a (Cumbria, Cheshire,
Lancashire and Devon WCA’s) 64 Figure 8.2 Relationship between Tourist Bednights per Head of Resident Population and BVPI 84a (Lancashire WCA’s) 64 Figure 8.3 Relationship between Tourist Bednights per Head of Resident Population and BVPI 84a (Devon WCA’s) 65 Figure 8.4 Relationship between Tourist Bednights per Head of Resident Population and BVPI 84a (Gloucestershire WCA’s) 66 Figure 8.5 Relationship between Tourist Bednights per Head of Resident Population and BVPI 84a (Cumbria WCA’s) 67 Figure 8.6 Levels of Tourism in Cumbria and BVPI 84a (2000 to 2005) 69 Figure 9.1 CA Site Arising and Deprivation for Cheshire and Nearest Neighbour Authorities 73 Figure 9.2 CA Site Arising as a Percentage of Total Household Arisings and Deprivation for Cheshire and Nearest Neighbour
Authorities 74 Figure 9.3 Level of Car Ownership and HWRC Arisings 75 Figure 9.4 HWRC Density (Residents per Site) and HWRC Arisings 76 Figure 9.5 HWRC Geographical Density (Hectares per Site) and HWRC Arisings 77 Figure 9.6 Distribution of HWRCs in Cheshire and Neighbouring Authorities 80 Figure 9.7 Effect of the Cheshire HWRC Permit Scheme 84
Appendix A Regression Analysis Definitions

C r e a t i n g t h e e n v i r o n m e n t f o r b u s i n e s s
© Entec UK Limited
Doc Reg No. 20002 Page 1
April 2007
1. Introduction
1.1 Project Appreciation Cumbria Strategic Waste Partnership (CSWP) and Cheshire County Council (CCC) secured funding from DEFRA’s Regional fund to undertake a project to identify the underlying causes relating to why the two County Council’s have the highest (worst) Best Value Performance Indicator (BVPI) for ‘household waste per head of population’ (BVPI 84a).
1.2 Best Value Performance Indicators Best Value Performance Indicators (BVPIs) are a set of 90 indicators developed by Government Departments to measure the performance of Local Authorities. The data is collected from the local authorities and audited annually by the Audit Commission. BVPI 84a refers to the kilograms of household waste collected per head of population. This indicator emphasises the importance of waste minimisation as opposed to any form of diversion from landfill.
1.3 Background Information The North West has some of the highest household waste arisings per head of all regions in England. In turn, Cheshire and Cumbria respectively have the highest waste arisings per head of all Local Authorities in England.
CSWP and CCC have both produced reports investigating BVPI 84a, namely the CSWP Report into BVPI 84a for Cumbrian Districts and the ‘Reducing Waste’ Report compiled by CCC. However, despite the findings of the reports and the sustained efforts to improve performance, both Authorities continue to produce substantially higher amounts of total household waste per head than for instance, the neighbouring authority of Lancashire.
Cheshire’s low performance on total household waste arisings is second only to CCC. However, Lancashire CC, which is adjacent to both Cheshire and Cumbria, performs much better in this BVPI. Table 1.1 presents the BVPI 84a figures for Cumbria, Cheshire and Lancashire for 2004/05 and 2005/06. All three counties successfully reduced their arisings between 2004/5 and 2005/6, however further improvement is required by Cheshire and Cumbria if they are to lift themselves off the bottom of the performance ranking for this best value indicator. To put the performance of Cheshire and Cumbria into perspective, the best performing County Council in England in 2005/6 was Oxfordshire which reported a BVPI 84a of 480 kg/person/year. The average BVPI 84a for all County Councils in England in 2005/6 was 530 kg/person/year. Cheshire and Cumbria reported figures of 620 kg/person/year and 636 kg/person/year respectively.

C r e a t i n g t h e e n v i r o n m e n t f o r b u s i n e s s
© Entec UK Limited
Doc Reg No. 20002 Page 2
April 2007
Table 1.1 BVPI 84a Performance for Cumbria, Cheshire and Lancashire (2004 /05 and 2005 / 06)
Waste Disposal Authority BVPI 84a 2004/5 BVPI 84a 2005-2006
Cumbria 649.1 635.9
Cheshire 647.0 620.0
Lancashire 518.7 496.3
Average for all County Councils 545.3 530.0
1.4 Cumbria County Council There are six District Councils in Cumbria as shown in Figure 1.1 and list below:
• Allerdale;
• Barrow-in-Furness;
• Carlisle;
• Copeland;
• Eden; and
• South Lakeland.
Each District Council has its own arrangements for residual and recyclable household waste collection and they also have different levels of service provision for bring sites and Household Waste and Recycling Centres (HWRC). The socio-demographic profile, geographic distribution and levels of deprivation in each district across Cumbria vary widely.

C r e a t i n g t h e e n v i r o n m e n t f o r b u s i n e s s
© Entec UK Limited
Doc Reg No. 20002 Page 3
April 2007
Figure 1.1 District Councils in Cumbria
Reported data suggests that recycling and composting performance in Districts across Cumbria has improved significantly in recent years. However, these gains have been offset by growth in total household waste arisings.
The Strategic Waste Partnership in Cumbria has proposed stretch targets for 2007/08 for recycling and composting (37%) and for household waste per head of population (574kg/head). In 2005 / 06 Cumbria achieved 30% recycling and composting and a reported BVPI 84a of 635.9 kg/head total household waste. Commercial waste was identified as a significant contribution to total household waste in Cumbria. Accordingly, a project is in place to introduce a permit scheme for the use of HWRC sites in the County. Furthermore, WRAP funding was awarded in August 2006, for a project to bring about ‘behavioural change’ in order to promote recycling, particularly amongst the ‘hard to reach’ sector of the population.
1.5 Cheshire Cheshire is made up of six borough councils as shown in Figure 1.2 and listed below:
• Chester;
• Congleton;
• Crewe & Nantwich;
• Ellesmere Port & Neston;
• Macclesfield; and

C r e a t i n g t h e e n v i r o n m e n t f o r b u s i n e s s
© Entec UK Limited
Doc Reg No. 20002 Page 4
April 2007
• Vale Royal.
Figure 1.2 District Councils in Cheshire
As with Cumbria, each Borough Council in Cheshire has its own arrangements for residual and recyclable household waste collection and they also have different levels of service provision for bring sites and HWRCs. The socio-demographic profile, geographic distribution and levels of deprivation in each district also vary.
Cheshire’s recycling and composting rates have increased in recent years, rising from 19.5% in 2003/04 to 24.9% in 2004/05 and to 29.5% in 2005/06. Although the BVPI 84a has dropped by 27 kg/head over the last two years from 647 kg/head of population for household waste collected to 620 kg/head, the County still has one of the highest levels of household waste per head of population in England.
Cheshire CC recently produced a report looking at total household waste collected per head of population1. The report notes that for the last three years Cheshire CC has been the lowest performing County Council in England with regard BVPI 84. In 2003/04 for example, there was a variance of 176 kg/head between Cheshire (the bottom performing authority at 659 kg/head of population) and Cambridgeshire (the top performing authority at 483 kg/head of population). Key findings from the Cheshire Report were as follows:
• A survey of County Councils found that two different methodologies for BVPI 84 were being applied; Cheshire is the only County Council following the exact definition (‘Total Waste Arising’ figure), whereas all the other Councils use a ‘Total Household Waste Arising’ figure;
1 The Performance Improvement Service (April 2006) Reducing Waste: A review of Cheshire County Council’s performance in BVPI 84

C r e a t i n g t h e e n v i r o n m e n t f o r b u s i n e s s
© Entec UK Limited
Doc Reg No. 20002 Page 5
April 2007
• Cheshire, unlike most other authorities, includes commercial waste as well as fly tipped waste and rubble when reporting BVPI 84; if these were excluded Cheshire’s BVPI would potentially reduce from 659 kg to 586 kg/person (based on 2003/4 BVPI data);
• Cheshire has the highest kg/person of waste collected through HWRCs of all County Councils nationally; 221.5 kg/head in Cheshire against a national average of 131.6 kg/head (based on 2003/4 BVPI data);
• Apart from HWRCs and other sources, 65% of Cheshire’s municipal waste is collected direct from households and businesses by the District Councils.
1.6 Definition of Household Waste and Municipal Waste Local authorities have a statutory responsibility for managing household waste under the Environmental Protection Act 1990 Section 45(1), and have to meet Best Value Recycling and Composting Targets for household waste. Household waste is comprised of a number of waste streams (See Figure 1.3 below).
Figure 1.3 Household Waste Sources
“Municipal Waste” is all waste collected by Waste Collection Authorities (WCA’s) under Section 45(1) of the Environmental Protection Act 1990, plus all waste arisings from Household Waste Recycling Centres (for Waste Disposal Authority’s Unitary Authorities; HWRC’s are not included in WCA tonnages) and waste collected by

C r e a t i n g t h e e n v i r o n m e n t f o r b u s i n e s s
© Entec UK Limited
Doc Reg No. 20002 Page 6
April 2007
third parties for which collection or disposal recycling credits are paid under Section 52 of the Environmental Protection Act 1990.”
Household waste, which constitutes approximately 90% of total municipal waste in England, is the focus of this report. Household waste includes waste collected directly from households (whether this is residual waste, segregated recyclables waste or bulky collections) in addition to waste from other household sources, such as litter bins, street sweeping, education establishments, and materials taken by householders to HWRCs and bring sites.
An anomaly within the household waste definition used is that building rubble taken to HWRCs for recycling has been excluded. This is partly because for some authorities the quantities collected exceed all other recycling and composting collections combined and it is likely that much originates from semi-commercial sources. Abandoned vehicles and waste from fly-tipping incidents have also been excluded from the household waste definition. All of these exclusions contribute to non-household municipal wastes along with any other materials that local authorities collect, or arrange to collect, from commercial and industrial sources2.
Municipal waste in England consists of more than just ‘dustbin’ waste (that collected, usually from the kerbside, by regular refuse collection vehicles). Municipal Solid Waste (MSW) includes all household waste, plus commercial waste and recycling that is managed by the council, parks and gardens waste, non-household clinical waste, cleared fly tips and a number of other minor categories of waste managed by the council. It does not include commercial waste and recycling collected through arrangements with private contractors.
1.7 BVPI 84a
1.7.1 Definition
BVPI 84a is one of a number of waste related Best Value Performance Indicators and it relates specifically to the quantity of waste collected (‘disposed of’) per capita (person) per year, in kilograms.
1.7.2 Waste Collection Authorities
The calculation used for BVPI 84a figures for all waste collection authorities is;
Total tonnage of household waste arisings
Population in authority area
2 WRAP, Parfitt J (2002) Analysis of Household Waste Composition and Factors Driving Waste Increases
1000

C r e a t i n g t h e e n v i r o n m e n t f o r b u s i n e s s
© Entec UK Limited
Doc Reg No. 20002 Page 7
April 2007
‘Total tonnage of household waste arisings’ being classified as the total tonnage of ‘those types of waste which are to be treated as household waste for the purposes of part II of the Environmental Protection Act 1990 by reason of the provisions of the Controlled Waste Regulations 1992’ in the Audit Commission’s BVPI 2005/06 Guidance Document. Table 1.2 lists the waste categories that are and are not included in BVPI 84a.
Table 1.2 WCA BVPI 84a Categories
WCA included in BVPI 84a WCA Not included in BVPI 84a
• Waste collection rounds (Refuse, Recycling and Garden)
• Waste collections by voluntary organisations
• Bulky waste collections
• Street cleaning
• Gully emptying
• Separately collected household healthcare waste
• Recyclables collected at bring sites (both by the WCA and any voluntary organisations)
• Other composting/recycling (including Municipal Park/Grounds waste, waste collected in community skips and other)
• Street recycling bins
• Other collected waste
• Asbestos waste
• Beach cleansing
• Collected commercial and industrial waste
• Collected construction and demolition waste
• Collected non-household grounds waste
• Collected highways waste
• Other collected non-household waste
• Flytipped waste
1.7.3 Waste Disposal Authorities
The calculation method used for BVPI 84a figures for all waste disposal authorities is;
Total tonnage of household waste arisings
Population in authority area
There are certain waste streams that are included in WDA calculations and not in WCA calculations. The waste categories included (and not included) in BVPI 84a are presented in Table 1.3.
1000

C r e a t i n g t h e e n v i r o n m e n t f o r b u s i n e s s
© Entec UK Limited
Doc Reg No. 20002 Page 8
April 2007
Table 1.3 WDA BVPI 84a Categories
WDA included in BVPI 84a WDA Not included in BVPI 84a
• Total tonnage of their waste collection authorities waste collection rounds (Refuse, Recycling and Garden)
• Total tonnage of their waste collection authorities waste collections by voluntary organisations
• Total tonnage of their waste collection authorities bulky waste collections
• Total tonnage of their waste collection authorities street cleaning
• Total tonnage of their waste collection authorities gully emptying
• Total tonnage of their waste collection authorities separately collected household healthcare waste
• Total tonnage of their waste collection authorities recyclables collected at bring sites (both by the WCA and any voluntary organisations)
• Total tonnage of their waste collection authorities other composting/recycling (including Municipal Park/Grounds waste, waste collected in community skips and other)
• Total tonnage of their waste collection authorities street recycling bins
• Total tonnage of their waste collection authorities other collected waste
• Total tonnage of all household waste recycling centres collected recyclables waste
• Total tonnage of all household waste recycling centres collected compostable waste
• Total tonnage of all household waste recycling centres collected non-recyclable and non-compostable waste
• Asbestos waste
• Beach cleansing
• Collected commercial and industrial waste
• Collected construction and demolition waste
• Collected non-household grounds waste
• Collected highways waste
• Other collected non-household waste
• Flytipped waste
Population figures to be used in the BVPI 84a calculations are derived from the Office of National Statistics (ONS) and uses the mid year estimates. The ONS defines the ‘resident population’ as:
‘The estimated resident population of an area includes all people who usually live there, whatever their nationality. Members of UK and non-UK armed forces stationed in the UK are included in their respective Countries and UK forces stationed outside the UK are excluded. Students are taken to be resident at their term time address.
The methodology used to update mid-year estimates includes an estimate of the population change due to flows of International migrants. These flows are based on estimates of long-term International migrants (where stays of over twelve months only are counted) therefore this does not include flows of short-term International migrants.’
Therefore, the ‘resident population’ estimates do not include tourists visiting an area or individuals with second homes or holiday homes.

C r e a t i n g t h e e n v i r o n m e n t f o r b u s i n e s s
© Entec UK Limited
Doc Reg No. 20002 Page 9
April 2007
2. Literature Review
2.1 Factors Affecting Household Waste Arisings
2.1.1 Introduction
This chapter reviews a number of studies and various literature relating to household waste arisings and the underlying causes of variation between quantities of waste produced by individual households. To date a number of UK studies have been published which examine factors influencing household waste arisings. The following text refers to findings taken from selected reports and also draws on Entec's own experience.
2.1.2 WRAP Report
In 2002 WRAP published a report examining household waste composition and arisings in England3. The Report proposed a number of factors which might cause an increase in total annual household waste arisings. The factors included:
1) Demographics (particularly the declining average household size and the growth in the rate of new household formation);
2) Increased consumer spending leading to more goods consumed and more waste created;
3) Behavioural change in relation to waste producing activities (food wastage, attitudes towards garden waste, DIY activity etc.);
4) Transfers of waste from other sectors, rather than true increases: for example, the transfer of material from commercial sources following the introduction of the Landfill Tax in 1996 (this is mostly associated with trade waste arising at HWRC’s, but may also involve wastes from small businesses deposited in the household waste stream);
5) Changes to waste management services, such as the provision by local authorities of 240 litre wheeled bins to householders in place of plastic sack and standard dustbin collections; and
6) The introduction of statutory weight-based recycling targets that are not material-specific (for example, a tonne of aluminium cans sent for reprocessing and a tonne of compost used as landfill cover material represent an equal achievement).
In summary the Report found that the targeting of garden waste for centralised composting schemes and the further encroachment of 240 litre wheeled bins across the country were both significant contributory factors to the year-on-
3 WRAP, Parfitt J (2002)

C r e a t i n g t h e e n v i r o n m e n t f o r b u s i n e s s
© Entec UK Limited
Doc Reg No. 20002 Page 10
April 2007
year household waste increases. As a counter measure, the Report suggested that home composting activity could have a significant measurable impact through waste reduction.
2.1.3 Welsh Assembly
In 2002 the Welsh Assembly published its waste strategy ‘Wise about Waste’. As part of the development of the strategy, the Welsh Assembly Government identified the need for data on the composition of municipal waste, and the factors that determine the amounts and composition. Consequently, they commissioned a programme of work to address the issue and serve a baseline for future work. The study analysed a total of 174 tonnes of waste from 9 of the 22 local authorities in Wales. The study produced a report the Welsh Assembly Government in 20034. The main findings relating to waste generation from the Study can be summarised as follows:
1) A strong seasonal variation in garden arisings exits;
2) There is a strong relationship between quantity of waste generated per household and number of individuals occupying the household;
3) Variations in arisings exist for some components according to the age profile of household occupants;
4) There was no evidence of variations between the different types of waste collection (wheeled bin, plastic sack or no method) and the arisings of either household collected waste or waste taken to civic amenity (CA) sites / household waste recycling centre (HWRCs);
5) There was no evidence of differences between urban or rural authorities in either arisings of household collected waste or waste taken to HWRCs.
6) The study found that there was strong evidence that, after allowing for household size, households reporting pet ownership had an average of 2.3 kg per week more waste than households without pets.
7) The use of socio-demographic factors to predict waste generation was based on the assumption that the amount of waste produced is related to purchasing habits, and that this is related to socio-economic profile; i.e. more affluent households produce more waste. However, for example, all households need to purchase food, and as most food is packaged, there is probably little difference in the weight of packaging between ‘value’ food and more expensively packaged food products. Some recent surveys have shown that households in the lower socio-demographic profile areas are now producing more waste (in terms of waste collected from households) than those in higher socio-demographic profile areas, and this study showed that whilst there was variations between sample areas within an authority, there was no identifiable relationship between socio-economic profile and either the amount of waste produced.
8) The study also investigated the effectiveness of home composting bins and waste arisings. Although 30% of households stated that they were currently using home composting bins, there was no
4 Welsh Assembly Government, AEA Technology (2003) The Composition of Municipal Waste in Wales

C r e a t i n g t h e e n v i r o n m e n t f o r b u s i n e s s
© Entec UK Limited
Doc Reg No. 20002 Page 11
April 2007
evidence of a difference between the average arisings of kitchen waste or garden waste in households who stated that they were home composting.
In summary the Welsh Study confirmed that the number and age profile of a household influences the amount of waste produced. However, unlike the earlier WRAP Report, the Welsh Study did not identify any significant relationship between waste generation and socio-economic profile or method of waste collection. For example, the Welsh Study indicated that although wheeled bins may result in a greater quantity of kerbside collected waste (than bags), this was offset by a reduced quantity collected at HWRCs. The Welsh Study also noted that a household’s lifestyle or purchasing habits are unlikely to be influenced by the receptacle provided for the collection of their waste.
2.1.4 Entec Experience and Anecdotal Evidence
Entec have significant experience in the area of waste management and have conducted numerous qualitative and quantitative studies surrounding waste composition and generation. In the course of this work, Entec have noted a number of factors which can influence household waste arisings. These include:
1) Seasonality: Seasonality primarily affects growth rates of organic garden waste, but also consumption patterns (for example, Christmas, holidays, types of food eaten and leisure activities). Weather has similar effects but creates fluctuations within the overall pattern of seasonality. Climate has a similar but larger baseline level effect within each geographic area;
2) Demographics - The age, profession and educational structure of the population have been shown to be correlated with different levels of waste arisings and composition, however trends have varied between regions and no clear trends have been established;
3) Culture - Culture can influence activities individuals undertake as well as their consumer habits and attitudes to waste;
4) Housing type and activity- The presence of gardens, numbers living in the household as well as residential versus business use (for example rented, holiday home) or associated activity (for example farming5 and / or bed and breakfast) are noted to have effects on both composition and arisings;
5) Socio-Economic factors - The level of wealth influences consumption and disposal patterns at a fundamental level, but can also be correlated to other factors such as recycling rates; and
6) Types of waste and recycling services provided - The types of collection containers, materials collected for recycling and frequency of collection can influence arisings of materials (for example green waste) in the household waste stream.
5 Since 2006 agricultural waste is now controlled in the same way as other commercial and industrial wastes, which means, for example, that farm dumps and open burning of waste are no longer allowed.

C r e a t i n g t h e e n v i r o n m e n t f o r b u s i n e s s
© Entec UK Limited
Doc Reg No. 20002 Page 12
April 2007
The remainder of this report attempts to quantify the statements made in the reference literature with data gathered from and relating to Cheshire and Cumbria County Councils.

C r e a t i n g t h e e n v i r o n m e n t f o r b u s i n e s s
© Entec UK Limited
Doc Reg No. 20002 Page 13
April 2007
3. Comparator Authority Selection
3.1 Introduction Various literature has linked lifestyle, geography and demographics to waste composition and generation. For this reason, a ‘nearest neighbour’ analysis was conducted for Cheshire and Cumbria to identify which County Councils were most similar, according to a set of defined parameters. By using authorities that are of similar demographics to Cheshire and Cumbria, any factors that are causing high household waste arisings should be more readily identifiable. The use of ‘nearest neighbour’ comparative authorities should eliminate a number of variables that could potentially affect household waste arisings and should allow a direct comparison of authorities on a ‘like for like’ basis.
3.2 What is a ‘Nearest Neighbour’ Analysis? The ‘nearest neighbour’ model, created by IPF, the management support services company of the Chartered Institute of Public Finance and Accountancy (CIPFA), provides comparative analyses between ‘subjects’ (in this case local authorities) which can be drawn by means of a number of data reduction techniques.
A ‘nearest neighbour’ analysis follows a traditional ‘distance' approach. The model is run by selecting a number of variables dependant on the type of analysis required; in this case, socio-demographic and geographic parameters that may relate to waste generation and collection activities. An analysis between all possible pairs of local authorities is conducted and a ‘statistical distance’ between each authority is produced. The authorities with the smallest distance between them are statistically the most similar relating to the parameters selected.
Table 3.1 lists the parameters that were selected for the nearest neighbour analysis. The parameters were selected based on their assumed relationship with waste composition and generation, as suggested in the literature review in Section 2.

C r e a t i n g t h e e n v i r o n m e n t f o r b u s i n e s s
© Entec UK Limited
Doc Reg No. 20002 Page 14
April 2007
Table 3.1 Nearest Neighbour Parameters
Parameters for Nearest Neighbour Analysis
Population % of population aged 0 to 17 % of population aged 18 to 64 % of population aged 65 to 74 % of population aged 75 to 84 % of population aged 85 plus % of population of working age Enumeration district based density Enumeration district based scarcity Tax base per head of population % unemployment % daytime net inflow % foreign visitor nights
% domestic visitor nights % day visitors Offices per 1,000 population Restaurants per 1,000 population Shops per 1,000 population Housing benefit caseload (weighted) % of people in households with > 1 person per room % of households with < 4 rooms % of households in purpose-built flats rented from LA or HA % of persons in lower socio-economic classification % of properties in Bands A to D % of properties in Bands E to H
Tables 3.2 and 3.3 list the respective ‘nearest neighbour’ authorities for Cheshire and Cumbria. The tables include the statistical distance from the selected authorities (output from the nearest neighbour model) and the respective BVPI 84a figures for each authority (using 2005/6 data).
Table 3.2 Results of Cheshire Nearest Neighbour Analysis
Nearest Neighbour Position
Nearest Neighbour Authorities Statistical Distance from Cheshire
Nearest Neighbour BVPI 84a (2005/6)
1 Warwickshire County Council 0.0543 549
2 Worcestershire County Council 0.1083 527
3 Gloucestershire County Council 0.1264 503
4 Derbyshire County Council 0.1905 484
5 Staffordshire County Council 0.1941 534
6 Leicestershire County Council 0.1996 545
7 Northamptonshire County Council 0.2022 518
8 Wiltshire County Council 0.2080 506
9 Bedfordshire County Council 0.2296 512
10 Suffolk County Council 0.2419 539
C r e a t i n g t h e e n v i r o n m e n t f o r b u s i n e s s
© Entec UK Limited
Doc Reg No. 20002 Page 15
April 2007
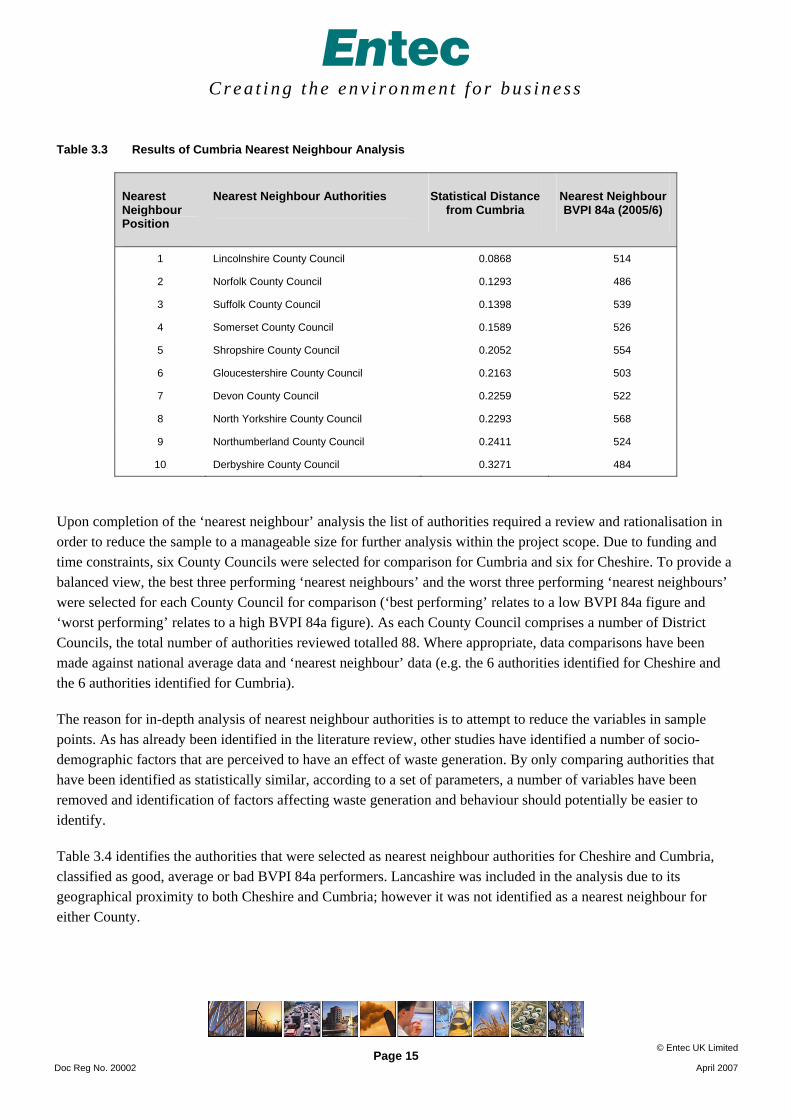
Table 3.3 Results of Cumbria Nearest Neighbour Analysis
Nearest Neighbour Position
Nearest Neighbour Authorities Statistical Distance from Cumbria
Nearest Neighbour BVPI 84a (2005/6)
1 Lincolnshire County Council 0.0868 514
2 Norfolk County Council 0.1293 486
3 Suffolk County Council 0.1398 539
4 Somerset County Council 0.1589 526
5 Shropshire County Council 0.2052 554
6 Gloucestershire County Council 0.2163 503
7 Devon County Council 0.2259 522
8 North Yorkshire County Council 0.2293 568
9 Northumberland County Council 0.2411 524
10 Derbyshire County Council 0.3271 484
Upon completion of the ‘nearest neighbour’ analysis the list of authorities required a review and rationalisation in order to reduce the sample to a manageable size for further analysis within the project scope. Due to funding and time constraints, six County Councils were selected for comparison for Cumbria and six for Cheshire. To provide a balanced view, the best three performing ‘nearest neighbours’ and the worst three performing ‘nearest neighbours’ were selected for each County Council for comparison (‘best performing’ relates to a low BVPI 84a figure and ‘worst performing’ relates to a high BVPI 84a figure). As each County Council comprises a number of District Councils, the total number of authorities reviewed totalled 88. Where appropriate, data comparisons have been made against national average data and ‘nearest neighbour’ data (e.g. the 6 authorities identified for Cheshire and the 6 authorities identified for Cumbria).
The reason for in-depth analysis of nearest neighbour authorities is to attempt to reduce the variables in sample points. As has already been identified in the literature review, other studies have identified a number of socio-demographic factors that are perceived to have an effect of waste generation. By only comparing authorities that have been identified as statistically similar, according to a set of parameters, a number of variables have been removed and identification of factors affecting waste generation and behaviour should potentially be easier to identify.
Table 3.4 identifies the authorities that were selected as nearest neighbour authorities for Cheshire and Cumbria, classified as good, average or bad BVPI 84a performers. Lancashire was included in the analysis due to its geographical proximity to both Cheshire and Cumbria; however it was not identified as a nearest neighbour for either County.

C r e a t i n g t h e e n v i r o n m e n t f o r b u s i n e s s
© Entec UK Limited
Doc Reg No. 20002 Page 16
April 2007
Table 3.4 Cheshire and Cumbria Nearest Neighbour Selected Authorities
Nearest Neighbour Authorities BVPI 84a (2005/6)
Performance
BVPI 84a (2005/6)
Derbyshire County Council Good 484
Gloucestershire County Council Good 503
Wiltshire County Council Good 506
Suffolk County Council Poor 539
Leicestershire County Council Poor 545
Cheshire County Council Nearest Neighbours
Warwickshire County Council Poor 549
Norfolk County Council Good 486
Gloucestershire County Council Good 503
Devon County Council Average 522
Suffolk County Council Poor 539
Shropshire County Council Poor 554
Cumbria County Council Nearest Neighbours
North Yorkshire County Council Poor 568
On request Lancashire County Councils Good 496

C r e a t i n g t h e e n v i r o n m e n t f o r b u s i n e s s
© Entec UK Limited
Doc Reg No. 20002 Page 17
April 2007
4. Data Analysis
Data entered into the WasteDataFlow database for the period 2005/06 was downloaded for Cumbria, Cheshire, 10 nearest neighbour authorities and (on the request of Cheshire and Cumbria Councils) Lancashire. The data was filtered and the WasteDataFlow questions relevant to BVPI 84a were separated and analysed for each authority. In total the BVPI 84a figures from 13 waste disposal authorities and the corresponding 88 waste collection authorities were calculated from the WasteDataFlow for analysis.
The calculated BVPI 84a figures were compared with those reported by the individual authorities. A number of authorities reported BVPI 84a figures which differed from the figures calculated using the downloaded WasteDataFlow data.
4.1 Cumbria and Cheshire BVPI 84a
4.1.1 Comparing WDA Figures
The data downloaded from the WasteDataFlow allowed a breakdown of the waste streams to be clearly identified and the BVPI 84a calculations to be made. The BVPI 84a data for each nearest neighbour county council is displayed in Table 4.1. In the following text, ‘average’ refers to the average figure for WDA’s downloaded from WasteDataFlow.
Quantities of kerbside collected dry recyclables (based on kg per person per year figures) for both Cumbria County Council and Cheshire County Council are below the comparator WDA average of 56.3 kg/person/year, with Cumbria reporting 44.0 kg/person/year and Cheshire 54.6 kg/person/year).
The average quantity of kerbside collected refuse for Cumbrian districts is 330.1 kg/person/year. This is considerably higher than the average for comparative WDA’s of 282.4 kg/person/year. Cheshire have a below average figure of 260.0 kg/person/year.
The comparator WDA average for kerbside collected organic arisings is 51.0. Both Cumbria and Cheshire produce higher than average arisings reporting 57.1 kg/person/year and 64.2 kg/person/year respectively.
The quantity of recyclables collected from bring sites in Cumbria is greatly above the average of 15.6 kg/person/year at 27.2 kg/person/year. In contrast Cheshire has below average arisings of 12.0 kg/person/year.
The source of waste which appears to contribute most heavily to both authorities for BVPI 84a is that from household waste recycling centres (HWRCs). Cumbria County Council and Cheshire County Council have the largest quantities of HWRC refuse waste of all the nearest neighbour authorities with 99.6 kg/person/year and 122.0 kg/person/year respectively. Cheshire reports over twice as much HWRC residual waste per person per year

C r e a t i n g t h e e n v i r o n m e n t f o r b u s i n e s s
© Entec UK Limited
Doc Reg No. 20002 Page 18
April 2007
as the average, 59.0 kg/person/year. HWRC organic waste for both authorities is also above the average of 25.5 kg/person/year, with Cumbria reporting 27.1 kg/person/year and Cheshire reporting 34.3 kg/person/year. The quantity of recyclables collected at HWRCs in Cumbria was reported to be 33.8 kg/person/year in 2005/6. This is higher than the average of ‘nearest neighbour’ authorities who reported 30.4 kg/person/year. HWRCs in Cheshire report below average recyclables arisings with 21.1 kg/person/year.
Analysis of data in Table 4.2 shows that there are a number of discrepancies in the data submitted by local authorities to the Audit Commission for the calculation of BVPI’s and the data entered into WasteDataFlow. In compiling this report Entec have analysed data downloaded from WasteDataFlow and compared it with data provided to us from relevant local authorities. Where possible we have cross referenced both data sources and, where possible rationalised inconsistencies with data. However, attention should be brought to the importance of data management and, more specifically, accurate calculation of BVPI’s.

C r e a t i n g t h e e n v i r o n m e n t f o r b u s i n e s s
© Entec UK Limited
Doc Reg No. 20002 Page 19
April 2007
Table 4.1 Nearest Neighbour Waste Disposal Authorities BVPI 84a Calculations (kg/person/year)
Category
Cum
bria
kg
/per
son/
yr
Che
shire
kg
/per
son/
yr
Der
bysh
ire
kg/p
erso
n/yr
Dev
on
kg/p
erso
n/yr
Glo
uces
ters
hire
kg
/per
son/
yr
Lanc
ashi
re
kg/p
erso
n/yr
Leic
este
rshi
re
kg/p
erso
n/yr
Nor
folk
kg
/per
son/
yr
Nor
th Y
orks
hire
kg
/per
son/
yr
Shro
pshi
re
kg/p
erso
n/yr
Suffo
lk
kg/p
erso
n/yr
War
wic
kshi
re
kg/p
erso
n/yr
Wilt
shire
kg
/per
son/
yr
Collected Recyclables 44.0 54.6 53.9 63.6 55.9 52.7 76.9 72.7 41.1 47.0 80.3 46.4 43.2 Collected Refuse 330.1 260.0 303.0 263.4 320.3 248.2 229.2 288.6 314.7 264.4 238.6 310.3 300.6 Collected Organics 57.1 64.2 36.8 43.9 31.8 51.8 68.3 19.2 51.2 79.7 74.0 64.3 20.3 Bulky 2.3 0.0 3.1 1.7 0.0 8.4 0.0 0.0 0.0 16.4 0.2 0.0 1.6 Street Cleaning 13.0 25.3 18.2 13.4 0.0 24.7 10.5 0.0 0.0 21.8 15.6 12.7 2.6 Gully Emptyings 0.2 0.0 2.3 0.0 0.0 0.0 0.0 0.0 0.0 0.0 0.0 0.0 0.0 Other 0.0 0.0 0.0 2.5 0.0 0.0 0.0 0.0 0.0 0.6 0.1 0.0 0.5 Separately collected healthcare 0.1 0.0 0.6 1.1 0.0 0.2 0.1 0.0 0.9 1.2 0.0 0.2 0.0 Other composting/recycling 7.6 0.0 4.0 2.1 0.0 0.8 0.1 3.8 0.0 1.4 0.9 0.7 2.7 Street Recycling Bins 0.0 0.0 0.0 0.0 0.0 0.0 0.0 0.0 0.0 0.0 0.0 0.0 0.0 Bring Sites Recycling 24.7 12.0 15.2 17.7 7.7 6.5 6.7 26.0 18.5 16.2 23.4 6.6 18.5 CA Refuse 99.6 122.0 15.1 51.1 23.0 44.4 32.8 24.5 29.4 22.2 28.2 27.2 42.1 CA Green Waste 27.1 34.3 25.7 43.7 32.9 42.0 79.6 35.0 70.3 57.7 56.6 60.5 41.2 CA Site Recycling 33.8 21.1 10.5 36.8 20.7 13.1 42.4 33.8 24.0 15.7 24.8 17.4 31.3 Calculated BVPI 84a 639.5 589.8 488.4 541.0 492.3 492.8 546.6 503.5 550.1 544.0 542.9 546.2 504.6 Reported BVPI 84a 635.9 620.0 484.3 522.0 503.1 496.3 545.1 486.3 568.0 554.0 539.0 549.0 506.3
Data included in this table has been downloaded from WasteDataFlow. Figure for Cumbria and Cheshire have been amended (where applicable) by comparison with data gathered from local authority officers.

C r e a t i n g t h e e n v i r o n m e n t f o r b u s i n e s s
© Entec UK Limited
Doc Reg No. 20002 Page 20
April 2007
4.1.2 Waste Collection Authority Arisings
Table 4.2 presents the breakdown of household waste arisings for WCA in Cumbria.
Table 4.2 Cumbria Waste Collection Authorities BVPI 84a (kg/person/year)
Category Allerdale Barrow-in-Furness
Carlisle Copeland Eden South Lakeland
Cumbria County Council
Collected Recyclables 56.0 34.6 44.5 46.8 33.7 42.0 44.0
Collected Residual 345.5 372.4 314.5 334.8 311.9 308.6 330.1
Collected Organics 69.9 43.8 62.2 62.3 69.1 39.4 57.1
Bulky 0.0 0.0 8.0 0.0 0.0 3.0 2.3
Street Cleaning 0.0 0.0 12.5 0.0 0.0 49.8 13.0
Gully Emptyings 0.0 0.0 1.0 0.0 0.0 0.0 0.2
Other 0.0 0.0 0.0 0.0 0.0 0.0 0.0
Healthcare 0.0 0.0 0.0 0.0 0.0 0.0 0.0
Other composting/recycling 0.0 0.0 11.7 0.0 7.9 20.9 7.6
Street Recycling Bins 0.0 0.0 0.0 0.0 0.0 0.0 0.0
CA Site Recycling 0.0 0.0 0.0 0.0 0.0 0.0 33.8
Bring Sites 17.4 7.1 16.8 19.0 66.2 29.9 24.7
CA Refuse 0.0 0.0 0.0 0.0 0.0 0.0 99.6
CA Green Waste 0.0 0.0 0.0 0.0 0.0 0.0 27.1
Calculated from WDF BVPI 84a - kg/person/year
488.7 457.8 471.2 462.9 488.8 493.7 639.5
Reported BVPI 84a 489.3 456.4 472.6 458.4 484.6 494.7 635.9
The BVPI figures for the Cumbrian WCA’s range from 456.4 kg/person/year in Barrow to 494.7 kg/person/year in South Lakeland. The average BVPI 84a figure for the nearest neighbour waste collection authorities is 420.9 kg/person/year. All authorities in Cumbria produce significantly more waste than this figure. All the Cumbrian authorities have below the calculated ‘nearest neighbour’ average (57.5 kg/person/year) quantity of kerbside collected dry recyclables. The average quantity of collected refuse waste from the Cumbrian authorities is 331.3 kg/person/year which is 55.8 kg/person/year above the nearest neighbour average of 275.5 kg/person/year.

C r e a t i n g t h e e n v i r o n m e n t f o r b u s i n e s s
© Entec UK Limited
Doc Reg No. 20002 Page 21
April 2007
Table 4.3 Cheshire Waste Collection Authorities BVPI 84a (kg/person/year)
Chester City Council
Congleton Borough Council
Crewe and Nantwich Borough Council
Ellesmere Port and Neston Borough Council
Macclesfield Borough Council
Vale Royal Borough Council
Cheshire County Council
Collected Recyclables 47.4 49.0 46.4 75.3 49.3 65.9 54.6
Collected Refuse 274.1 289.0 285.0 196.7 262.0 240.9 260.0
Collected Organics 62.5 96.6 41.6 61.2 37.7 96.3 64.2
Bulky 0.0 0.0 0.0 1.1 0.0 0.0 0.1
Street Cleaning 32.8 20.1 21.7 36.8 22.6 0.0 25.3
Gully Emptyings 0.0 0.0 0.0 0.0 0.0 0.0 0.0
Separately Collected Healthcare
0.0 0.0 0.0 0.0 0.0 0.0 0.0
Street Recycling Bins 0.0 0.0 0.0 0.0 0.0 0.0 0.0
CA Site Recycling 0.0 0.0 0.0 0.0 0.0 0.0 21.1
Bring Sites Recycling 10.8 11.0 15.5 5.3 14.8 9.5 12.0
CA Refuse 0.0 0.0 0.0 0.0 0.0 0.0 122.0
CA Green Waste 0.0 0.0 0.0 0.0 0.0 0.0 34.3
Calculated from WDF BVPI 84a - kg/person/year
428 466 410 377 386 413 589.8
Reported BVPI 84a 420 465 408 406 387 415 620.0
A shaded box represents where a significant data anomaly exists
There are three visible discrepancies between the downloaded data and the reported BVPI figures for Cheshire WCA’s. These can be summarised as follows:
• The calculated BVPI 84a figure downloaded from WasteDataFlow for Chester is 428 kg/person/year as opposed to the official reported BVPI 84a figure of 420. No explanation can be offered for this so it is recommended a more thorough analysis of data is carried out.
• The tonnage of kerbside collected refuse for Ellesmere Port and Neston entered into WasteDataFlow is 15,912 tonnes for 2005/6. This is the same tonnage as reported by the County Council. Using this tonnage gives a BVPI 84a of 377 kg/person/year, nearly 30 kg/person/year less than the reported official BVPI 84a figure of 406 kg/person/year. When the tonnage of collected commercial waste, 2,344 tonnes, for the same period is added to the downloaded data, the calculated BVPI 84a figure is 406 kg/person/year, which matches the official reported figure. It is recommended that a more

C r e a t i n g t h e e n v i r o n m e n t f o r b u s i n e s s
© Entec UK Limited
Doc Reg No. 20002 Page 22
April 2007
thorough audit of data and reported tonnage is carried out to ascertain whether an error occurred during the management of this data.
• The total BVPI 84a calculations for Cheshire has been calculated by down loading data from WasteDataFlow for the County and by summing the individual District totals with the inclusion of waste arising at civic amenity sites. The calculated BVPI 84a figure for Cheshire is 589.8 kg/person/year compared to 620 kg/person/year as reported officially for BVPI 84a. The ‘Reducing Waste’ document produced by Cheshire County Council suggests that the county has included waste streams such as fly tipping and civic amenity site rubble in the waste arisings figures. If civic amenity site rubble is included in the downloaded WasteDataFlow calculations (in addition to the earlier error assumed in the Ellesmere Port and Neston calculations), a figure of 620 kg/person/week is achieved, therefore suggesting that rubble has been incorrectly included in the calculation.
The kg/person/year in the Cheshire waste collection authorities ranges from 380.4 kg/person/year in Ellesmere Port and Neston to 508.1 kg/person/year in Congleton. The average household waste arisings for the Cheshire WCA’s is 413 kg/person/year (or 417 kg/person/year using the downloaded WasteDataFlow data) which is slightly less than the ‘nearest neighbour’ WCA average of 423.8 kg/person/year. The fact that the Cheshire collection authority’s average is comparable to that of the nearest neighbour authorities suggests that the HWRCs could be a large contributing factor for the high reported BVPI 84a figures.
Four of the Cheshire authorities have below the nearest neighbour average (57.5 kg/person/year) quantity of kerbside collected dry recyclables. Ellesmere Port & Neston and Vale Royal both report approximately 10 and 20 kg/person/year greater quantities than the nearest neighbour average. The average quantity of collected refuse waste from the Cheshire authorities is 260.0 kg/person/year which is 16.1 kg/person/year below the nearest neighbour average of 275.5 kg/person/year. This again suggests that HWRCs could be responsible for Cheshire’s high BVPI 84a figures.
4.1.3 Data Management Issues
It has been identified that some authorities may be calculating their BVPI 84a figures incorrectly before submitting them to the Audit Commission. Inconsistencies in the collected material tonnages included in the calculations for BVPI 84a are clearly visible in the WDF downloaded data and conversations with a number of authorities have also confirmed that certain tonnages are unknown due to co-collection with other waste streams, some of which are potentially non-household streams. The absence of tonnage figures from some authorities (both WCA’s and WDA’s) for categories such as collected non-household commercial waste, fly tipping waste, asbestos waste, beach cleansing waste, collected non-household highways waste, collected non-household grounds waste indicate that either data hasn’t been entered correctly or is simply included in other categories due to the unknown tonnages collected in co-mingled collections. This may significantly increase the BVPI figures. Using the data collected for Cumbria, Cheshire and the nearest neighbour authorities a number of average tonnages for waste categories that shouldn’t be included in the BVPI 84a calculations have been made. The average tonnage and the range for each of the categories that are likely to have been included in a BVPI 84a category where no data is available are presented in Table 4.4.

C r e a t i n g t h e e n v i r o n m e n t f o r b u s i n e s s
© Entec UK Limited
Doc Reg No. 20002 Page 23
April 2007
Table 4.4 Kilograms per Person per Year of Question 23 Non-BVPI 84a categories (WCA)
Category Authority No of Authorities Submitting Tonnages
Minimum Average Maximum
WDA 8 0.0 0.3 0.5 Asbestos Waste collected separately
WCA 23 0.0 0.0 0.1
Beach Cleansing WDA 2 0.3 0.4 0.6
WCA 6 0.0 0.5 2.3
Collected non-household: Commercial & Industrial
WDA 10 11.6 27.3 59.1
WCA 59 0.3 10.3 37.7
Collected non-household: Construction & Demolition
WDA 3 1.3 2.6 4.2
WCA 7 0.0 0.8 2.0
Collected non-household: Grounds Waste
WDA 1 0.6 0.6 0.6
WCA 10 0.0 1.0 5.4
Collected non-household: Highways Waste
WDA 1 3.2 3.2 3.2
WCA 7 0.3 2.2 6.9
Collected non-household: Other
WDA 2 0.0 2.9 5.7
WCA 3 0.0 0.9 2.1
Waste arising from clearance of Flytipped Materials
WDA 8 0.0 0.7 2.2
WCA 44 0.0 1.0 7.8
Total WDA 38.0
Total WCA 16.7
Note: Average is calculated from those authorities which submitted tonnage details. The number of authorities submitting tonnages for each category are in column 3 – Number of Authorities
While the tonnages for individual waste streams identified in Table 4.4 above may be relatively small, there is a significant cumulative effect. The table suggests that for an authority which fails to separately collect and weigh or accurately calculate estimated tonnages from co-collections and deduct them from their residual waste arisings, a considerable quantity of waste could be classified as part of their BVPI 84a calculation that should not be. The average quantity of waste arising from the categories detailed in the table is 16.7 kg/person/year for waste collection authorities and 38.0 kg/person/year for waste disposal authorities. Fly tipping in the districts within Cumbria and Cheshire appears to be an area with little accurate reporting, with only 5 of the 12 authorities reporting tonnages on their waste data flow returns 2005/06.

C r e a t i n g t h e e n v i r o n m e n t f o r b u s i n e s s
© Entec UK Limited
Doc Reg No. 20002 Page 24
April 2007
A short questionnaire was issued to the waste collection authorities in Cumbria and Cheshire to ascertain whether these authorities have accurate figures for these waste streams and to understand whether any non-household waste has ended up being included in the household waste calculations, therefore inadvertently increasing the BVPI 84a figure for either Cheshire or Cumbria. A number of the authorities highlighted the use of co-collections for various household and non-household waste streams, e.g. co-collections of ‘beach cleaning’ (non-household waste) with ‘street cleaning’ (household waste), which again has the effect of over-estimating the household element of municipal waste.
Commercial waste collections were also identified as tonnages that could be impacting significantly on the BVPI 84a figures. Using the waste data flow figures, data provided by Cumbria County Council and information collected through telephone interviews and questionnaires it was possible to establish that a number of authorities could be miscalculating their arisings of commercial waste and/or inputting data into waste data flow incorrectly with regard to commercial waste. Differences in the collection methods, the tonnage calculation methods for co-mingled trade/household refuse collections, the properties classified as commercial and the reporting style mean that errors are likely to be occurring in a number of authorities which have co-mingled collections. Cumbria and Cheshire admit that trade waste is a particular problem, calculation methods are used to estimate the total tonnages collected for some authorities but in Cumbria these methods differ across the county. The effect of trade waste on arisings is discussed further in Section 5.
As detailed in the ‘Reducing Waste’ Document produced by Cheshire County Council, Cheshire County Council included Commercial waste in their calculation of BVPI 84a. This is a category which should not be included in the BVPI 84a calculations and its removal is likely to significantly reduce the BVPI 84a for each of the districts and the county. Assessing the data submitted to waste data flow and the reported figure it is evident that this is likely to be the case, with a reported 2005/06 figure of 620 kg/person/year and a WDF calculated figure of 604 kg/person/year. This correlates well with the reported commercial tonnage of 12,288 tonnes, equating to 18 kg/person/year.
4.2 Historical Trends and Improving Authorities Waste arisings in Cheshire and Cumbria are both currently high, with the two authorities occupying the two lowest performing positions in terms of BVPI 84a. However, by looking at the 5 year trend for BVPI 84a it is clear that the two authorities have reached their current position in very different ways. Table 4.5 and Figure 4.1 show the reported BVPI 84a figures for Cheshire and Cumbria and selected other County Councils for the period 2001/02 to 2005/06. Waste arisings in Cheshire have remained relatively consistent over the 5 year period, increasing slightly from 628.7 kg/person/year in 2001/02 to 647 kg/person/year in 2005/6. However, analysis of data for Cumbria shows that there have been significant increases during the same period, with reported arisings increasing from 518.0 in 2001/02 to 649.1 kg/person/year in 2005/06. This increase in arisings over time suggests that certain changes have taken place over this period that has caused increases in waste arisings.

C r e a t i n g t h e e n v i r o n m e n t f o r b u s i n e s s
© Entec UK Limited
Doc Reg No. 20002 Page 25
April 2007
Bedfordshire County Council, Devon County Council, Norfolk County Council and Somerset County Council were identified as authorities that had improved their BVPI 84a figures in recent years. Table 4.5 presents the BVPI 84a figures for each of the ‘improving’ authorities, with Cheshire and Cumbria for the period 2001/02 to 2005/06.
Table 4.5 Historical BVPI 84a Figures for Cheshire, Cumbria and Selected ‘Improving’ Authorities
BVPI 84a (kg/person/year) Authority
2000/1 2001/02 2002/3 2003/4 2004/5 2005/6
Cheshire 628.7 643.0 666.0 659.0 647.0 620
Cumbria 518.0 527.0 572.8 592.0 649.1 635.9
Bedfordshire 572.9 561.3 540.3 533.6 527.0 512.4
Somerset 565.0 604.0 620.0 591.7 543.7 526.3
Devon 530.2 535.0 556.0 530.0 524.0 522.0
Norfolk 394.9 436.8 540.6 524.5 503.3 486.3
Figure 4.1 Historical BVPI 84a Figures for Cheshire, Cumbria and Selected ‘Improving’ Authorities
350
400
450
500
550
600
650
700
2000/1 2001/02 2002/3 2003/4 2004/5 2005/6
BVPI
84a
(kg/
pers
on/y
ear)
Cheshire CC Cumbria CCBedfordshire CC Somerset CCDevon Norfolk CC
Data was downloaded from WasteDataFlow for a number of authorities identified as having improved their BVPI 84a during recent years. Of the authorities identified as having improved BVPI 84a arisings over recent years, Bedfordshire was identified as the only authority to have achieved year on year consistent waste reduction. Bedfordshire’s waste arisings, displayed in kg/person/year for 2002/03 and 2005/6 are presented in Table 4.6.

C r e a t i n g t h e e n v i r o n m e n t f o r b u s i n e s s
© Entec UK Limited
Doc Reg No. 20002 Page 26
April 2007
Table 4.6 Bedfordshire’s Waste Arisings - 2002/3 and 2005/6
Waste Arisings (kg/person/year) Waste Stream
2002/03 2005/06
Kerbside Collected Recyclables 7.0 64.7
Kerbside Collected Refuse 360.5 275.4
Kerbside Collected Organics 2.0 51.9
Bulky Collections 0.0 11.8
Street Cleaning 0.0 19.3
Other 67.7 0.0
Separately collected healthcare 0.0 0.3
CA Site Recycling 31.4 26.3
CA Refuse 81.2 34.9
CA Green Waste 0.0 15.1
Bring Sites 4.7 14.0
Total (BVPI 84a equivalent) 554.5 513.8
Table 4.6 shows Bedfordshire’s waste arisings for 2002/03 and 2005/06. It can be seen from the table that the largest reduction of all waste streams is found in the kerbside collected refuse, with a reduction from 360.5 kg/person/year in 2002/03 to 275.4 kg/person/year in 2005/06. This can in part be explained by a significant increase in kerbside collected recyclables and composting, increasing from a combined total of 9.0 kg/person/year to 116.6 kg/person/year (although there is an argument to say that the introduction of a kerbside collection of garden waste introduced new material into the household waste stream). The other significant reduction in arisings is in the HWRC waste stream, with HWRC residual waste reducing from 81.2 kg/person/year to 34.9 kg/person/year. A large amount of waste was classified as ‘other’ in 2002/03 does not appear in the 2005/06 figures and an explanation for what this waste type is cannot be found, however its omission from the 2005/6 figures is significant. The classification of waste and the terminology used for waste streams can vary between authorities, making direct comparisons difficult. The use of waste categories such as ‘other’ highlights the issue of data management and the importance of clear classifications for analytical purposes.
To compliment the data analysis, telephone calls were made to a number of authorities (including Bedfordshire) in an attempt to understand what different authorities are doing to reduce their BVPI 84a figure.
Conversations with the local authority officers highlighted the importance of increased vigilance towards trade waste abusers at HWRCs in the reduction of BVPI 84a figures (this was mentioned by all authorities contacted). Incentivisation schemes for contractors running HWRCs, CCTV installation on sites, automatic number plate recognition systems and the use of compliance officers to monitor sites were all noted as ways of reducing the quantity of illegal trade waste deposited.
C r e a t i n g t h e e n v i r o n m e n t f o r b u s i n e s s
© Entec UK Limited
Doc Reg No. 20002 Page 27
April 2007
Moving to separate commercial collections in a number of the collection authorities (namely Devon and Somerset) was also noted as a contributing factor to reduced BVPI 84a figures. Both Devon and Somerset have reduced the quantity of waste collected from trade properties.
Doorstepping teams and the local and national media in recent years were reported to have a positive affect on the awareness of the waste issue and it is thought that this may have had a positive affect on waste reduction in some cases. Bedfordshire in particular noted the presence of a large number of landfills in the area making residents more conscious of the need to reduce waste.
Manchester City Council, although not identified as a direct comparison to either Cumbria or Cheshire, was identified as being particularly successful having reduced its BVPI 84a from 642.0 kg/person/year in 2002/03 to 441.0 kg/person/year in 2005/06. Over this period the council introduced a number of waste minimisation initiatives, in addition to implementing a robust data management system. The council established a vehicle tracking system to ensure that all vehicles whether council owned or contract hired could be fully accounted for. The data management system raised an automatically alert if it was suspected that data had been entered into the system incorrectly, and a manual review of inputted data was then required. The tare weights of vehicles were also measured at more regular intervals to ensure that only the waste was affecting the reported tonnage and not inaccuracies caused by weighing mechanisms. The City council have highlighted data management as an important factor in the reduction of the BVPI 84a figure.

C r e a t i n g t h e e n v i r o n m e n t f o r b u s i n e s s
© Entec UK Limited
Doc Reg No. 20002 Page 28
April 2007
C r e a t i n g t h e e n v i r o n m e n t f o r b u s i n e s s
© Entec UK Limited
Doc Reg No. 20002 Page 29
April 2007
y = 1.4035x + 508.38R2 = 0.0381
450
500
550
600
650
5 10 15 20 25 30
Index of Multiple Deprivation Score
BVPI
84a
(200
5/6)
All County Council's in England Cheshire
Cumbria Linear (All County Council's in England)
5. Factors Affecting Waste Generation
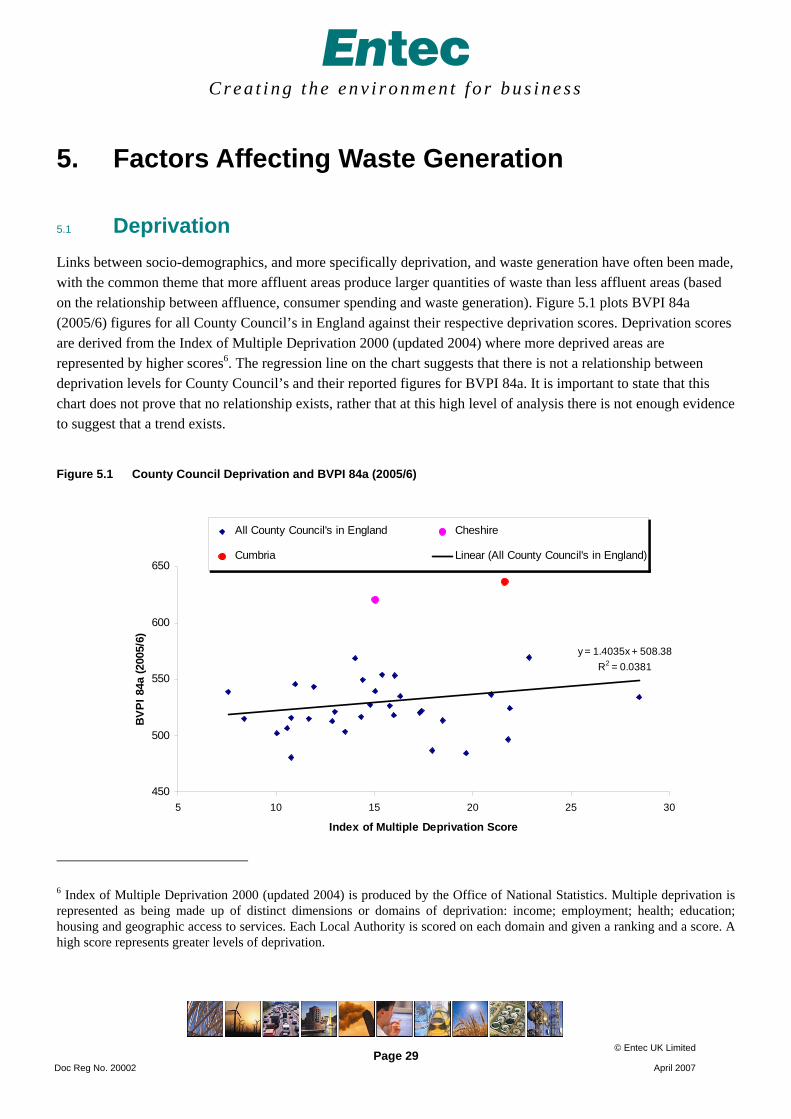
5.1 Deprivation Links between socio-demographics, and more specifically deprivation, and waste generation have often been made, with the common theme that more affluent areas produce larger quantities of waste than less affluent areas (based on the relationship between affluence, consumer spending and waste generation). Figure 5.1 plots BVPI 84a (2005/6) figures for all County Council’s in England against their respective deprivation scores. Deprivation scores are derived from the Index of Multiple Deprivation 2000 (updated 2004) where more deprived areas are represented by higher scores6. The regression line on the chart suggests that there is not a relationship between deprivation levels for County Council’s and their reported figures for BVPI 84a. It is important to state that this chart does not prove that no relationship exists, rather that at this high level of analysis there is not enough evidence to suggest that a trend exists.
Figure 5.1 County Council Deprivation and BVPI 84a (2005/6)
6 Index of Multiple Deprivation 2000 (updated 2004) is produced by the Office of National Statistics. Multiple deprivation is represented as being made up of distinct dimensions or domains of deprivation: income; employment; health; education; housing and geographic access to services. Each Local Authority is scored on each domain and given a ranking and a score. A high score represents greater levels of deprivation.

C r e a t i n g t h e e n v i r o n m e n t f o r b u s i n e s s
© Entec UK Limited
Doc Reg No. 20002 Page 30
April 2007
y = 0.8567x + 397.25R2 = 0.0178
250
300
350
400
450
500
550
0 5 10 15 20 25 30 35 40 45
Index of Multiple Deprivation Score
BVP
I 84a
(200
5/6)
All District Council's in England Cheshire Districts
Cumbria Districts Linear (All District Council's in England)
Figure 5.1 shows that both Cheshire and Cumbria have significantly higher BVPI 84a figures than the remaining County Councils in the Country.
Figure 5.2 plots the deprivation scores of each District Council in England against their respective reported BVPI 84a figure. As with Figure 5.1, Figure 5.2 suggests that there is no relationship between District Council waste airings (in terms of BVPI 84a) and deprivation.
Figure 5.2 District Council BVPI 84a and Deprivation
It is interesting to note that all districts in Cumbria are positioned well above the regression line implying that they all have BVPI 84a figures well above the average for authorities of similar deprivation. By contrast, the collection authorities in Cheshire are all (with the exception of Congleton) located on or below the regression line, suggesting that the Cheshire WCA’s report ‘average’ figures for this indicator.
5.2 Household Size, Composition and Type A series of charts have been produced with the aim of identifying trend relating socio-demographic characteristics, including household size, composition and type, with waste generation (measured with reported 2005/6 BVPI 84a figures). The socio-demographic information has been obtained from the ‘Neighbourhoods’ section of the Office of National Statistics website.

C r e a t i n g t h e e n v i r o n m e n t f o r b u s i n e s s
© Entec UK Limited
Doc Reg No. 20002 Page 31
April 2007
y = -80.372x + 718.39R2 = 0.0199
400
450
500
550
600
650
700
2.20 2.25 2.30 2.35 2.40 2.45 2.50 2.55
Average Household Size (people per household)
BV
PI 8
4a (2
005/
6)The Welsh Assembly waste composition report found that as the number of people living in a household increases, so does the amount of waste that the household generates. However, at an individual level (e.g. waste generate per person), waste generation decreases as the number of people living in a household increases. Figure 5.3 plots the average household size (people per household) against BVPI 84a for all County Council’s in England. The chart shows that no relationship can be drawn between household size and waste arisings.
Currently there is a national trend that household sizes are decreasing. There are more single person and two person households now than ever before and this is often cited as one of the major influences for growth in national waste arisings. A single person household will produce much the same waste as a household with multiple occupants, and a household of two people will generally not produce twice as much waste as a single person household. The reasons are that a single person household will still require certain commodities and produce certain wastes irrespective of the number of people residing in a household. For example, a single person may buy a daily newspaper. A family of four would also probably buy a newspaper. It is doubtful that the family of four would buy four newspapers (e.g. one for each member of the family, equating to the equivalent of the single person household. The same is true for junk mail that is sent to a household, and packaging for new household items (televisions etc). While literature suggests that larger household sizes produce more waste, on a per person basis, smaller households can produce larger quantities.
Figure 5.3 Average Household Size Plotted against BVPI 84a (2005/6) for all County Councils in England
Figures 5.4 and 5.5 show the proportion of households (as a % of all households) with varying numbers of permanent residents per household for the Cheshire and Cumbria nearest neighbour authorities.

C r e a t i n g t h e e n v i r o n m e n t f o r b u s i n e s s
© Entec UK Limited
Doc Reg No. 20002 Page 32
April 2007
0%
5%
10%
15%
20%
25%
30%
35%
40%
45%
1 personhousehold
2 peoplehousehold
3 peoplehousehold
4 peoplehousehold
5 or more peoplehousehold
Household Size (people per household)
Perc
enta
ge o
f Pop
ulat
ion
in H
ouse
hold
Siz
e
CumbriaNorth YorkshireShropshireSuffolkDevonGloucestershireLancasterNorfolk
0%
5%
10%
15%
20%
25%
30%
35%
40%
1 personhousehold
2 peoplehousehold
3 peoplehousehold
4 peoplehousehold
5 or more peoplehousehold
Household Size (people per household)
Perc
enta
ge o
f Pop
ulat
ion
in H
ouse
hold
Siz
e
CheshireWarwickshireLeicestershireSuffolkWiltshireGloucestershireLancashireDerbyshire
Figure 5.4 Cheshire Nearest Neighbour Counties and Household Size
Figure 5.5 Cumbria Nearest Neighbour Counties and Household Size

C r e a t i n g t h e e n v i r o n m e n t f o r b u s i n e s s
© Entec UK Limited
Doc Reg No. 20002 Page 33
April 2007
0%
5%
10%
15%
20%
25%
30%
35%
40%
45%
Couple withdependantchild(ren)
Couple with nodependantchildren
Single adult withchild(ren)
Single personhousehold
Multiple personhousehold
Household Composition
% o
f Hou
seho
lds
with
in C
ount
y
Cheshire Warwickshire LeicestershireSuffolk Wiltshire GloucestershireLancashire Derbyshire
The bars representing household size for County Councils in Figure 5.4 and 5.5 have been arranged from left to right in order of decreasing BVPI 84a (e.g. Cumbria, which has the highest BVPI 84a figure is represented by the blue bar in figure 5.5 which is positioned furthest left on the chart, whereas Norfolk who report the lowest BVPI 84a figure is positioned on the furthest right of the chart). This arrangement allow interpretation of data to be made to see if a relationship exists between household size and those authorities with high BVPI 84a figures (Cheshire, Cumbria and those authorities represented by bars on the left of Figures 5.4 and 5.5) and those authorities with low BVPI 84a figures (those authorities represented by bars on the right in the Figures 5.4 and 5.5). Analysis of Figures 5.4 and 5.5 suggest that a relationship could not be established at this level of interpretation between household size and waste arisings. This does not mean that a relationship does not exist, rather that it was not seen as a contributing factor in why Cumbria and Cheshire have high arisings and why, for example Derbyshire and Norfolk report low waste arisings.
In addition to the household size, the type of residents living in a household could also potentially affect waste arisings. A number of studies have suggested that different household demographics produce different waste, for example families with children of nappy wearing age may produce larger volumes of waste due to the disposal of nappies. Figure 5.6 and 5.7 show the composition of households in Cheshire and Cumbria. As with Figure 5.4 and 5.5, the bars in the charts have been arranged with the authorities with high BVPI 84a figures on the left and low BVPI 84a figure on the right.
Figure 5.6 Cheshire Nearest Neighbour - Households Residents

C r e a t i n g t h e e n v i r o n m e n t f o r b u s i n e s s
© Entec UK Limited
Doc Reg No. 20002 Page 34
April 2007
0%
5%
10%
15%
20%
25%
30%
35%
40%
45%
Couple withdependantchild(ren)
Couple with nodependant
children
Single adult withchild(ren)
Single personhousehold
Multiple personhousehold
Household Composition
% o
f Hou
seho
lds
with
in C
ount
y
Cumbria North Yorkshire Shropshire Suffolk Devon GloucestershireLancashire Norfolk
0%
10%
20%
30%
40%
50%
60%
70%
80%
90%
Detached / Semi detached Terraced Flat / Maisonette / Apartment/ Other
Household Type
% o
f Hou
seho
lds
with
in C
ount
y
Cheshire Warwickshire
Leicestershire Suffolk
Wiltshire Gloucestershire
Lancashire Derbyshire
Figure 5.7 Cumbria Nearest Neighbour - Households Residents
Figure 5.6 and 5.7 shows that there are a number of authorities with very similar household composition to both Cheshire and Cumbria but report significantly lower BVPI 84a figures. This therefore suggests that household composition is not a significant contributing factor for high BVPI 84a figures in Cheshire and Cumbria.
Figure 5.8 and 5.9 shows the proportion of different household types in Cheshire, Cumbria and their ‘nearest neighbour’ authorities. The breakdown of household types can be used to make assumptions as to the number of households that are likely to have gardens and therefore produce significant quantities of garden waste.
Figure 5.8 Cheshire and Nearest Neighbour’s - Household Type

C r e a t i n g t h e e n v i r o n m e n t f o r b u s i n e s s
© Entec UK Limited
Doc Reg No. 20002 Page 35
April 2007
0%
10%
20%
30%
40%
50%
60%
70%
80%
Detached / Semi detached Terraced Flat / Maisonette / Apartment /Other
Household Type
% o
f Hou
seho
lds
with
in C
ount
y
Cumbria North Yorkshire
Shropshire Suffolk
Devon Gloucestershire
Lancashire Norfolk
Figure 5.9 Cumbria and Nearest Neighbour’s - Household Type
Figures 5.8 and 5.9 suggest that, within the group of authorities selected as nearest neighbours, there is little relationship between household type and waste generation. However, it is important to stress that these authorities have been carefully selected as a ‘study group’ because they have similar characteristics. Therefore it is expected that they comprise of similar types of households. What this does show is that there are authorities with similar housing types to Cheshire and Cumbria that report low arisings and that the reported high arisings in Cheshire and Cumbria is not necessarily due to the type of housing in the Counties. However, what is interesting is that the authority with the most similar breakdown of housing types to Cumbria is Lancashire, even though the ‘nearest neighbour’ model did not select Lancashire as a comparable authority.
5.2.1 Demographics – Urban/Rural Locations
One of the factors thought to influence waste arisings significantly is the degree to which an authority is classified as rural or urban, with common thinking that rural authorities produce more waste than urban authorities. It has been postulated that rural areas produce more garden waste and therefore have higher waste arisings than urban areas. This section attempts to assess this hypothesis. Each Local Authority has been divided up into demographic categories to allow comparisons between different authority types to be made. These categories are derived from the 'New Policy Institute and Joseph Rowntree Foundation Website' (www.poverty.org.uk) which provides a list of all authorities in England and Wales and their classification as remote rural, accessible rural or urban.
Figure 5.10 shows the mean value, upper and lower quartile figures for BVPI 84a for all County Councils in England. The authorities have been classified as remote rural, accessible rural and urban as defined by the Joseph Rowntree Foundation. Cumbria is classified as remote rural while Cheshire is classified as accessible rural. Both Cheshire and Cumbria report significantly higher arisings than their respective authorities with similar

C r e a t i n g t h e e n v i r o n m e n t f o r b u s i n e s s
© Entec UK Limited
Doc Reg No. 20002 Page 36
April 2007
470
480
490
500
510
520
530
540
550
560
570
580
Remote Rural Accessible Rural Urban
County Council Demographic
BVP
I 84a
(200
5/6)
classifications, however there does appear to be a relationship between rurality and waste. The more rural the area the more waste produced.
Figure 5.10 Household Waste Generation and Authority Demographic (Urban, Accessible Rural and Remote Rural)
5.2.2 Street Cleaning and Gully Emptying
Cumbria and Cheshire were interested in the influence of street cleaning and gully emptying on BVPI 84a. Data was extracted from WasteDataFlow for reported 2005/6 arisings for the Cheshire WCA’s, Cumbria WCA’s and all WCA’s from the County Councils identified as ‘nearest neighbours’. Of the 88 WCA’s who’s data was downloaded, 66 had separately reported figures for street cleaning, and 22 returned a zero for this waste stream. It has been assumed that those reporting a zero include their street cleaning waste within another waste stream.
The highest quantities of street cleaning waste were reported in West Lancashire (60.4 kg/person/year), Preston City Council (56.5 kg/person/year), Scarborough (53.0 kg/person/year) and South Lakeland (49.8 kg/person/year). Twenty two of the authorities analysed did not submit figures but of those that did the lowest figures were received from Great Yarmouth (2.6 kg/person/year), Mid Suffolk (3.0 kg/person/year) and Charnwood (4.2 kg/person/year).
Various waste compositional analysis have been conducted on street cleaning waste and comparisons have been made between street cleaning waste arising from rural areas and urban areas. One such study is the ‘Surrey County Council Street Sweeping and Litter Bin Waste Composition Analysis’ (2003) carried out by M.E.L Research and Development. The study looked at waste composition of street cleaning from rural areas, housing estates and town centres. It was found that in all areas, material classified as ‘fines’ made up the largest proportion of street cleaning waste. Fines consist of material smaller than a given diameter (generally either 10mm or 20mm) and in the case of

C r e a t i n g t h e e n v i r o n m e n t f o r b u s i n e s s
© Entec UK Limited
Doc Reg No. 20002 Page 37
April 2007
street cleaning waste, will more than likely be grit, mud and dirt. From the samples collected in the Surrey study, the rural areas reported an average of 56% of the sample as ‘fines’. This compares with 32% and 40% for fines in housing areas and town centres respectively. The second most dominant material category found in street cleaning waste was putrescible waste, predominantly leaves. The proportion of putrescible waste present in the Surrey samples were 26%, 25% and 22% respectively for rural areas, housing areas and town centres. Housing areas and town centres were found to have larger quantities of paper and card than rural areas (14.7% and 15.8% compared with 3.8%). Table 5.1 presents the waste composition for the street cleaning waste samples analysed in Surrey.
Table 5.1 Street Cleaning Waste Composition for Town Centres, Rural and Housing Areas
Source: MEL Surrey Waste Composition (2003)
It can be interpreted from Table 5.1 that street cleaning waste in rural areas has significantly different characteristics to that generated in town centres and housing areas. Street cleaning waste generated in ‘rural areas’ comprises a significant amount (over 80%) of fines (predominantly dirt, grit and mud) and putrescible material (predominantly leaves). While ‘housing areas’ and ‘town centres’ also have large proportions of fines and putrescibles, the levels are lower than in rural areas and other materials, such as paper and card are found in large quantities. The materials found in the ‘town centre’ street sweeping samples (e.g. paper and card, glass, metals) are most likely diverted away from other household waste streams (e.g. if these materials were not in the street sweepings they would be included in another household waste category such as litter bins or domestic refuse). However, the street sweepings collected in rural areas are predominantly additional materials entering the waste stream such as leaves and grit. The level of service provided by the council will have a large effect on the arisings, for example an authority that keeps its streets clean (offering a very good service) will report higher arisings of street sweepings.
The classification of waste arising on streets is a potential issue that could affect BVPI 84a. The reason for this is because waste collected and classified as ‘street sweepings’ should be included in BVPI 84a, while waste classified

C r e a t i n g t h e e n v i r o n m e n t f o r b u s i n e s s
© Entec UK Limited
Doc Reg No. 20002 Page 38
April 2007
as ‘highways maintenance’ is included in municipal waste but not household waste. If waste is removed from roads for health and safety reasons it is classified as highways maintenance, whereas waste collected as an amenity service (e.g. for aesthetics) is classified as street sweepings, and therefore household waste. The classification of these two waste streams by individual authorities could significantly affect BVPI 84a.
Carlisle City Council and South Lakeland District Council are the only two waste collection authorities in Cumbria which supplied figures for street cleaning. The average quantity of street sweepings for the nearest neighbour authorities was 18.4 kg/person/year. Carlisle, which is predominantly urban in nature, reported below average arisings of street sweepings with 12.5 kg/person/year. South Lakeland however, which is classified as remote rural, produced significantly higher arisings with 49.8 kg/person/year.
Given the rural nature of much of Allerdale, Copeland, Eden and South Lakeland, and their unique geography with numerous winding country roads, it is likely that street sweepings, comprising grit, dirt, mud and leaves, are likely to be higher than average. South Lakeland did report very high arisings of street sweepings (presumably for the reasons given above) and it is one of the conclusions of this report that this waste stream is a contributing factor in high levels of BVPI 84a. A number of Cumbrian WCA’s did not submit street sweepings data due to the methodology employed in collecting and reporting the various waste streams. This situation has now changed and a number of the WCA’s are now recording the quantity of street sweepings collected. An analysis of more recent data which includes separate street sweepings data would allow a further, more detailed analysis of the impacts of street sweepings on BVPI 84a.
All the authorities in Cheshire, with the exception of Vale Royal, supplied street cleaning tonnages. These figures range from 36.8 kg/person/year in Ellesmere Port and Neston to 20.1 kg/person/year in Congleton. These figures are above the average for the ‘nearest neighbour’ authorities. This is again presumably due to the relative rural nature of Cheshire.
Only twelve waste collection authorities reported tonnages for gully emptyings. The highest quantities of gully emptyings were reported in Waveney (7.4 kg/person/year) and Derbyshire Dales (6.2 kg/person/year). Of those authorities which submitted tonnages, Carlisle reported the lowest quantity of gully emptyings with 1.2 kg/person/year.
Gully Emptyings data was only present for Carlisle City Council in Cumbria, where 1.0 kg/person/year is collected. No data was presented for any of the Cheshire waste collection authorities.
5.3 Summary of Relationship between Area Demographics and Waste Generation
This chapter has attempted to investigate the relationship of socio-demographics and waste generation by using reported data for BVPI 84a and a number of indicators of socio-demographics and deprivation. The analysis has been conducted at a high level and, while the charts used have failed to identify trends between waste generation and household type or deprivation, a link was found between waste generation and the classification of authorities
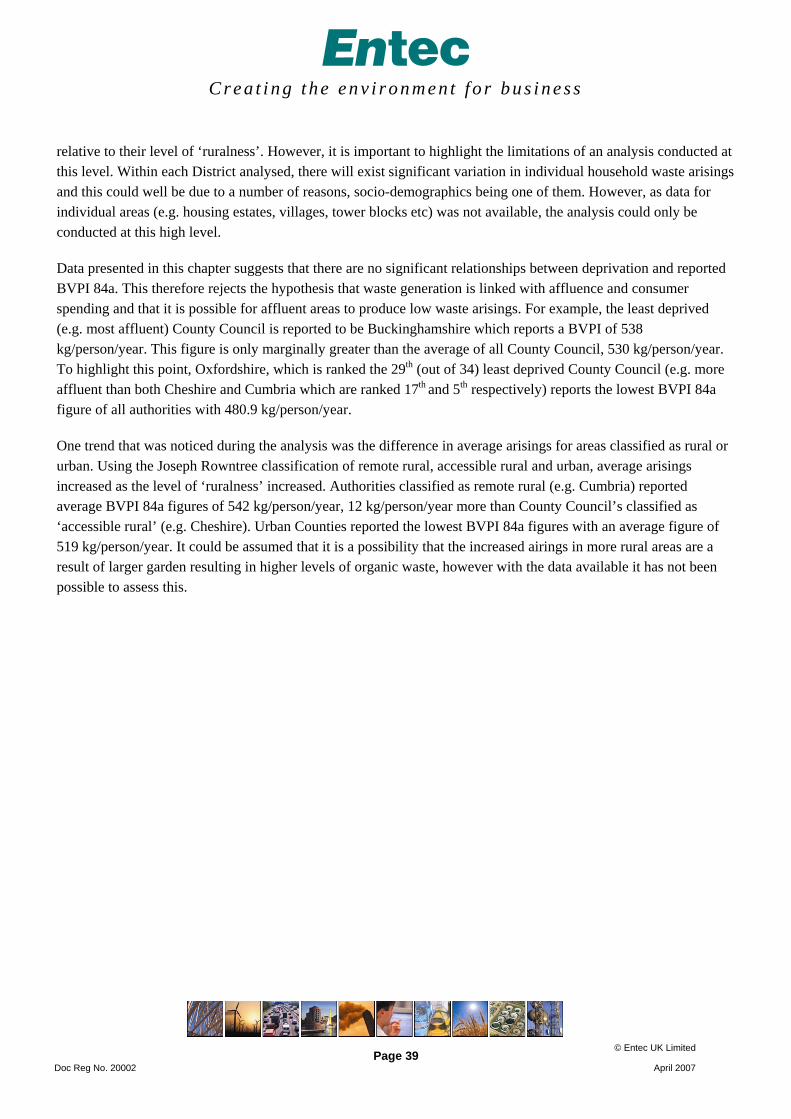
C r e a t i n g t h e e n v i r o n m e n t f o r b u s i n e s s
© Entec UK Limited
Doc Reg No. 20002 Page 39
April 2007
relative to their level of ‘ruralness’. However, it is important to highlight the limitations of an analysis conducted at this level. Within each District analysed, there will exist significant variation in individual household waste arisings and this could well be due to a number of reasons, socio-demographics being one of them. However, as data for individual areas (e.g. housing estates, villages, tower blocks etc) was not available, the analysis could only be conducted at this high level.
Data presented in this chapter suggests that there are no significant relationships between deprivation and reported BVPI 84a. This therefore rejects the hypothesis that waste generation is linked with affluence and consumer spending and that it is possible for affluent areas to produce low waste arisings. For example, the least deprived (e.g. most affluent) County Council is reported to be Buckinghamshire which reports a BVPI of 538 kg/person/year. This figure is only marginally greater than the average of all County Council, 530 kg/person/year. To highlight this point, Oxfordshire, which is ranked the 29th (out of 34) least deprived County Council (e.g. more affluent than both Cheshire and Cumbria which are ranked 17th and 5th respectively) reports the lowest BVPI 84a figure of all authorities with 480.9 kg/person/year.
One trend that was noticed during the analysis was the difference in average arisings for areas classified as rural or urban. Using the Joseph Rowntree classification of remote rural, accessible rural and urban, average arisings increased as the level of ‘ruralness’ increased. Authorities classified as remote rural (e.g. Cumbria) reported average BVPI 84a figures of 542 kg/person/year, 12 kg/person/year more than County Council’s classified as ‘accessible rural’ (e.g. Cheshire). Urban Counties reported the lowest BVPI 84a figures with an average figure of 519 kg/person/year. It could be assumed that it is a possibility that the increased airings in more rural areas are a result of larger garden resulting in higher levels of organic waste, however with the data available it has not been possible to assess this.

C r e a t i n g t h e e n v i r o n m e n t f o r b u s i n e s s
© Entec UK Limited
Doc Reg No. 20002 Page 40
April 2007

C r e a t i n g t h e e n v i r o n m e n t f o r b u s i n e s s
© Entec UK Limited
Doc Reg No. 20002 Page 41
April 2007
6. Kerbside Collection Policies
6.1 Introduction The scheme configuration and policies an authority implements with regard to kerbside collected waste will have far reaching effects on all streams of household waste. Kerbside collections have changed dramatically over the last 5 to 10 years with ever mounting pressure on local authorities to divert increasing amounts of recyclable material out of the ‘residual’ waste stream. Kerbside collections have become more complex than ever before with some authorities providing up to 4 wheeled bins per household and various recyclables boxes and bags. As a result, a large number of WCA’s across the UK have moved (or are considering moving) to alternate weekly collections (AWC) of residual waste and recyclable/compostable materials as a means of delivering improved recycling performance.
Evidence suggests that the introduction of AWC collections (or the reduction in the volume of receptacles) forces householders to utilise recyclables containers to divert waste out of the residual waste stream. There is also a knock on effect that, with a limited volume for household waste, residents are forced to consider waste minimisation as a means of not overfilling their bins Therefore, for collection authorities wanting to encourage participants to recycle more or minimise their waste, a smaller sized bin for residual waste (supported by enforcement of a strict no side waste policy) promotes the use of recycling facilities and waste minimisation. The literature review conducted as a part of this study has already suggested that a move from plastic sack collections to a wheeled bin collection can increase waste arisings (Parfitt, 2002). The same author states that the introduction garden waste collections for centralised composting can also increase waste arisings. The remainder of this chapter attempts to identify any trends (or not) between kerbside collection schemes and household waste arisings7.
6.2 Residual Waste Collection Figure 6.1 shows the mean, lower quartile and upper quartile values for BVPI 84a for Cheshire and Cumbria nearest neighbour authorities who’s primary method of kerbside residual waste collection is either a weekly wheeled bin collection, a weekly plastic sack collection or an alternate weekly (fortnightly) collection (predominantly wheeled bins).
7 The analysis undertaken in this chapter attempts to identify trends between kerbside collection schemes and waste arisings, however, waste arisings data has been taken from reported BVPI 84a data and data downloaded from WasteDataFlow for the period 2005/6 (e.g. April 2005 to March 2006). During this period a number of authorities will have changed their collection systems as schemes are continually evolving and developing overtime. As a part of this research a comprehensive internet search, followed by local authority interviews was conducted to establish waste collection scheme characteristics for various authorities identified as ‘nearest neighbours’ to Cumbria and Cheshire. It is recognised that the scheme information presented in this report will change over time and may not exactly represent the scheme as it was for the period in question (2005/6).

C r e a t i n g t h e e n v i r o n m e n t f o r b u s i n e s s
© Entec UK Limited
Doc Reg No. 20002 Page 42
April 2007
Figure 6.1 BVPI 84a and Residual Waste Containment Method
300
320
340
360
380
400
420
440
460
480
Weekly Bin Weekly Sacks AWC
Kerbside Collection Scheme
BVP
I b4a
(200
5/6)
Figure 6.1 shows that the mean BVPI 84a value is highest for those collection authorities offering a weekly wheeled bin collection for residual waste. The upper and lower quartiles show that the distribution of this data set is relatively compact. Those authorities that receive either a weekly sack collection or an alternate weekly collection have a mean value significantly lower than those receiving a weekly wheeled bin collection, suggesting that restriction on receptacle volume can influence waste disposal behaviour. Interestingly the lower and upper quartile figures for weekly sacks suggest that there is a large variance of data points within this group. It is assumed that this is because some authorities offering a sack collection will limit the number of sacks a householder can put out for collection (encouraging lower arisings), while some authorities will allow residents to put out unlimited numbers of sacks.
Figure 6.2 presents the same data as figure 6.1 however the groups have been sub-divided into their authority demographics with reference to remote rural, accessible rural and urban classifications.

C r e a t i n g t h e e n v i r o n m e n t f o r b u s i n e s s
© Entec UK Limited
Doc Reg No. 20002 Page 43
April 2007
Figure 6.2 BVPI 84a, Residual Waste Containment Method and Authority Classification
300
320
340
360
380
400
420
440
460
480
500
Weekly Bin'Remote Rural'
Weekly Bin'Accessible
Rural'
Weekly Sack'Remote Rural'
Weekly Sack'Accessible
Rural'
WeeklySack/Bin
Urban
AWC 'RemoteRural'
AWCAccessible
Rural
AWC Urban
Kerbside Collection Scheme and Local Authority Demographic
BVP
I 84a
(200
5/6)
Figure 6.2 shows that there is a large variance in BVPI 84a between the worst performing group (authorities classified as remote rural who receive a weekly wheeled bin collection) and the best performing groups (those authorities classified as urban who receive an alternate weekly collection).
6.3 Garden Waste Collections Green garden waste is the most commonly targeted organic waste collected separately at the kerbside. Given its relatively high bulk density (when including grass) and its proportion of the municipal waste stream it represents a high profile material for Councils seeking to maximise recycling levels. Set against this, anecdotal evidence suggests that green waste collections can result in increased waste arisings at the kerbside (BVPI 84a), especially where restrictions on the placing of green waste for collection with residual waste have been actively enforced. The potential exists for green waste collection schemes to conflict with home composting initiatives depending on the type of scheme introduced.
6.4 Free Versus Charged Schemes Local Authorities have taken different approaches to the option of charging for the collection of green garden waste. Whilst the obvious benefit of charging is increased revenue to help fund waste collection services, participation levels on charged schemes are unlikely to be as high as those experienced on a free collection service. This is an important factor to consider when specifying an organic scheme, as Councils may wish to use a charge to limit the uptake of the service to a manageable level, whilst implementing the necessary infrastructure and

C r e a t i n g t h e e n v i r o n m e n t f o r b u s i n e s s
© Entec UK Limited
Doc Reg No. 20002 Page 44
April 2007
monitoring success. Chargeable schemes represent an application of the ‘polluter pays’ principle over and above that embraced within the current system of levying local authority waste management services through the Council Tax.
The level of uptake and yield on chargeable schemes will be dependent upon the nature of the property and ability to pay, Council policy on acceptance of green waste in the residual waste stream and the availability of alternative management options for the householder (e.g. subsidised home composting, proximity to Civic Amenity sites). Conversely, a Council wishing to greatly increase levels of diversion from landfill may introduce an authority-wide free of charge scheme in order to maximise material capture rates (although this may have the effect of increasing ‘total household waste arisings’ by introducing additional material into the waste stream that may have found alternative disposal routes, e.g. home composting).
The cost and operations performance of any chargeable green waste scheme from the authority’s perspective will be dependent upon the level of uptake against pricing and promotion, the geographical spread of participating households, vehicle choice/reliability and outlet location/gate fees. The costs of administering chargeable schemes should not be overlooked as outlets for purchased sacks or mechanisms for tracking subscription payments will need to be put in place. As with any new service there will also be a need to promote the service, e.g. through leaflets and the Council’s web pages.
Logistically, chargeable ‘opt-in’ schemes can be inefficient where all properties are passed by dedicated green waste vehicles but participation and set out rates are low. Some authorities, where this is the case, have addressed the issue of mileage inefficiency by effectively operating call-out schemes. Examples of such schemes have been operated by Ealing and Hounslow Councils where residents on a ‘pay per sack’ scheme make telephone requests for a green waste collection against which rounds are scheduled (in much the same way as many ‘bulky’ collection services are operated). Hounslow’s call up service operates between November – March requiring households to request a collection at least 2 days before the usual collection day.
6.5 Blaby District Council Case-Study Blaby District Council (Blaby DC) in Leicestershire has introduced an ‘opt-in’ garden waste scheme to residents based on two different options with ‘variable charging’ mechanisms across its 37,500 households.
Alongside a weekly refuse (140l wheeled bin) and fortnightly dry recycling (140l wheeled bin) collection, Blaby DC offer residents the opportunity to purchase a 240l garden waste wheeled bin which costs the householder £19.20 per year. For this fee, the householder can place their bin for collection fortnightly throughout the year and have the material taken away.
The second option available to residents is the purchase of biodegradable sacks from the Council. These sacks cost £1.50 for three and can be bought from retail outlets across the district. Residents can buy any number of the sacks and place garden waste material out for collection on the appropriate day. This option is ideal for residents with less space for storing a wheeled bin, or for those who produce very little garden waste in the year and do not want to

C r e a t i n g t h e e n v i r o n m e n t f o r b u s i n e s s
© Entec UK Limited
Doc Reg No. 20002 Page 45
April 2007
y = 0.2426x - 36.63R2 = 0.1042
0
20
40
60
80
100
250 300 350 400 450 500 550
BVPI 84a (2005/6)
Perc
enta
ge o
f Dis
tric
t with
Gar
den
Was
te
Col
lect
ion
have to purchase a bin. During 2004/05 Blaby DC sold 150,000 biodegradable sacks, raising £75,000 of revenue. Over the same period, Blaby DC collected 5,000 tonnes of green waste material with approximately 20% of households participating in the scheme.
6.6 Provision of a Garden Waste Collection Housing type and area demographics (urban versus rural) can have large implications for the quantity of garden waste produced. Both Cheshire and Cumbria are classified as rural areas and as such, garden waste comprises a large portion of the household waste stream. However, there are various disposal routes for this garden waste and the level of service provision offered by each Council can have large implications on best value performance indicators.
Figure 6.3 plots the percentage of households in each District Council (all District Council’s in Cheshire, Cumbria and their respective nearest neighbour districts) that receives a garden waste service and the total reported BVPI 84a (2005/6). The chart shows a positive correlation between BVPI 84a and the provision of garden waste collection, suggesting that total household waste arisings are higher in Districts that have greater roll-out of garden waste collections (caution must be taken when interpreting the results as the R² value is low, suggesting that any correlation is weak, Appendix 1 provides further information about the interpretation of Regression analysis). The reasons for this could be two fold; Districts that are predominantly urban and are likely to produce small quantities of garden waste may feel it is not financially viable to offer the garden waste scheme to all households and therefore ‘positively’ select a proportion of households to roll a scheme out to. Alternatively, by introducing a garden waste scheme, additional material may be entering the household waste stream that may have found alternative disposal routes.
Figure 6.3 Level of Garden Waste Collection Provision and Total Household Waste Arisings (BVPI 84a) for WCA’s In Cheshire, Cumbria and Their Respective nearest Neighbour Authorities.

C r e a t i n g t h e e n v i r o n m e n t f o r b u s i n e s s
© Entec UK Limited
Doc Reg No. 20002 Page 46
April 2007
Tables 6.1 and 6.2, and Figures 6.4 and 6.5 present the level of garden waste provision in Cheshire, Cumbria and their ‘nearest neighbour’ waste disposal authorities. Cheshire and Cumbria ‘nearest neighbour’ authorities that have been identified as ‘good’ performers for BVPI 84a8 (namely Derbyshire, Norfolk, Gloucestershire and Wiltshire) all provide garden waste collections to less than 52% of households. The majority of authorities that perform ‘average’ or ‘poorly’ in BVPI 84a provide a garden waste collection to a larger proportion of households with Cheshire, Leicestershire, Suffolk and Shropshire providing a collection to over 80% of households. Norfolk has been identified as having a very low BVPI 84a figure (486 kg/person/year) and provides a garden waste collection to only 14% of households within the County.
Table 6.1 Cheshire and Nearest Neighbour Authorities Level of Garden Waste Provision and Household Waste Arisings (BVPI 84a - 2005/6)
Cheshire Nearest Neighbour County Councils
Number of Households
Number of Households Receiving
Garden Waste Collected
Percentage of Households Receiving a
Garden Waste Collection
BVPI 84a BVPI 84a ‘Performer’
Cheshire 287,000 242,923 84.6% 620 Poor
Warwickshire 218,000 110,230 50.6% 549 Poor
Leicestershire 255,000 244,385 95.8% 545 Poor
Suffolk 289,000 235,747 81.6% 539 Poor
Wiltshire 181,000 72,008 39.8% 506 Good
Gloucestershire 241,000 123,500 51.2% 503 Good
Derbyshire 314,000 154,373 49.2% 484 Good
8 ‘Good’ performers are classified as those in the top quartile of County Councils, e.g. with BVPI 84a figures of less than 514 kg/person/year

C r e a t i n g t h e e n v i r o n m e n t f o r b u s i n e s s
© Entec UK Limited
Doc Reg No. 20002 Page 47
April 2007
Figure 6.4 Cheshire and Nearest Neighbour Authorities Level of Garden Waste Provision and Household Waste Arisings (BVPI 84a - 2005/6)
y = 118.15x + 452.63R2 = 0.3118
450
500
550
600
650
0% 10% 20% 30% 40% 50% 60% 70% 80% 90% 100%
Percentage of Households offered a Garden Waste Collection
BVP
I 84a
(200
5/6)
Table 6.2 Cheshire and Nearest Neighbour Authorities Level of Garden Waste Provision and Household Waste Arisings (BVPI 84a - 2005/6)
Cumbria Nearest Neighbour County Councils
Number of Households
Number of Households Receiving
Garden Waste Collected
Percentage of Households Receiving a
Garden Waste Collection
BVPI 84a BVPI 84a ‘Performer’
Cumbria 213,000 140,923 66.2% 635 Poor
North Yorkshire 242,000 142,059 58.7% 568 Poor
Shropshire 121,000 114,876 94.9% 554 Poor
Suffolk 289,000 235,747 81.6% 539 Poor
Devon 310,000 223,827 72.2% 522 Average
Gloucestershire 241,000 123,500 51.2% 503 Good
Norfolk 350,000 488,66 14.0% 486 Good
Derbyshire 314,000 154,373 49.2% 484 Good

C r e a t i n g t h e e n v i r o n m e n t f o r b u s i n e s s
© Entec UK Limited
Doc Reg No. 20002 Page 48
April 2007
Figure 6.5 Cumbria and Nearest Neighbour Authorities Level of Garden Waste Provision and Household Waste Arisings (BVPI 84a - 2005/6)
y = 101.15x + 474.88R2 = 0.2409
450
500
550
600
650
0% 10% 20% 30% 40% 50% 60% 70% 80% 90% 100%
Percentage of Households offered a Garden Waste Collection
BVPI
84a
(200
5/6)
Tables 6.1 and 6.2, and Figures 6.4 and 6.5 suggest that there is a relationship between the level of garden waste collection provision and BVPI 84a (e.g. higher BVPI 84a figures are found in authorities with higher level of garden waste collections).
6.6.1 Containment and Yield – Suffolk Coastal District Council Case-Study
Research undertaken by Suffolk Coastal District Council (SCDC) during 2000/019 demonstrated that organic material yields are typically higher where wheeled bins are used compared with degradable sacks. The pilot scheme targeted the fortnightly collection of garden and selected kitchen waste (omitting meat) from 1,446 households via 140 litre wheeled bins and 2,356 households through the provision of a roll of 15 clear ‘degradable’ PE sacks. All homes across the trial areas were supplied with 7l pre-sort (kitchen caddie) bins for organic waste. The following factors were tested: participation rates, weight of organic waste collected, composition of the organic material collected, effect of organic collection on the residual waste arisings and collection crew experiences.
The pilot was operated over a 12-month period from July 2001 from what were claimed to be similar areas. Headline findings from the pilot are as follows:
9 Davis et. al. (2004). A Comparative Study of Wheeled Bins versus Degradable Polymer Sacks for the Kerbside Collection of Organic Wastes. CIWM Scientific and Technical review, May 2004, pp. 18-30.

C r e a t i n g t h e e n v i r o n m e n t f o r b u s i n e s s
© Entec UK Limited
Doc Reg No. 20002 Page 49
April 2007
• Average organic material yield from those on wheeled bins was 10.81kg/hh/collection (5.4 kg/hh/week) compared with 5.8kg/hh/collection (2.9 kg/hh/week) from those on sacks;
• On sacks collections, the average reduction in residual waste was 1.26kg/hh/week (reduction from 12.85kg/hh/week to 11.59kg/hh/week) with a similar approximate decrease in the wheeled bin area (14.06kg/hh/week to 12.15kg/hh/week). The initial difference in arising levels between the two areas is notable. There was an overall increase in arisings seen with wheeled bins (indicating that more green waste was managed via the kerbside), but not with sacks;
• Participation rates were considerably higher with wheeled bins (circa 60%) compared with sacks (circa 30%);
• There was evidence to suggest that the degradable sacks were effective in capturing a higher proportion of kitchen waste than green waste. This possibly occurred as a result of being able to have the sacks in the kitchen and the inherent practical limitations of storing and moving garden waste in degradable sacks.
The Suffolk Coastal District Council case study confirms the finding of this report and the WRAP report (Parfitt 2002) that the provision of garden waste collections can increase household waste arisings, and therefore BVPI 84a.

C r e a t i n g t h e e n v i r o n m e n t f o r b u s i n e s s
© Entec UK Limited
Doc Reg No. 20002 Page 50
April 2007

C r e a t i n g t h e e n v i r o n m e n t f o r b u s i n e s s
© Entec UK Limited
Doc Reg No. 20002 Page 51
April 2007
7. Trade Waste
7.1 Introduction The Environmental Protection Act (EPA) 1990 defines Commercial/Trade Waste as 'Waste from premises used for a trade or business or for the purposes of sport, recreation or entertainment'. Waste collection authorities have a duty under the EPA to provide a collection of commercial waste if requested to do so. Under the Act, business owners have a duty of care to ensure that their trade waste is disposed of through appropriate routes and to maintain correct documentary evidence.
Trade waste collections are generally provided on a chargeable basis regardless of whether the service is provided by the local authority or by third party contractors (private companies). Any business producing trade waste can choose whether to utilise whatever council services are available (whether operated by the council themselves or by their appointed contractor) or to use another private collection company.
Trade, commercial and industrial waste fall outside of the definition of ‘Household Waste Arisings’ and as such should not be included in the calculation of BVPI 84a. This statement in itself has caused confusion between authorities, and some of the district councils within Cheshire have, until recently, included trade and commercial waste in the calculation of their BVPI 84a figure.
7.2 Where Can Trade Waste Go? Assuming trade waste should not be included in the ‘Total Household Waste Arisings’ figure, it can still significantly affect the calculated BVPI 84a figures. There are various ways in which trade waste arisings can skew household waste arisings figures and hence the BVPI 84a figures. They are:
1) Trade waste can be collected by an authority believing it to be household waste (e.g. in the case of bed and breakfast type accommodation);
2) Trade waste that is co-collected with household waste is not accurately measured, leading to incorrectly reported household and trade waste figures; and
3) Waste delivered to household waste recycling centres (civic amenity sites) illegally by trade waste users.
7.3 Local Authority Survey Identifying that authorities throughout the country have a variety of policies relating to trade waste collection and reporting, a survey of WCA’s in Cheshire, Cumbria and their ‘nearest neighbour’ authorities was carried out. They were all asked the following questions;

C r e a t i n g t h e e n v i r o n m e n t f o r b u s i n e s s
© Entec UK Limited
Doc Reg No. 20002 Page 52
April 2007
• What is the number of trade waste properties the council collects waste from;
• What is the breakdown of properties types collected from (e.g. hotels, shops etc);
• How is the trade waste collected (e.g. is it co-collected with domestic or dedicated trade waste vehicle);
• How is the tonnage of trade waste calculated (e.g. is using a co-collected trade and domestic collection, what standard weight do they use to calculate the trade waste portion);
• Pricing mechanism used (e.g. charge by weight, by the number of bins collected or flat rate annual fee);
• What is the impact of tourism on (trade) waste arisings (e.g. how waste from B&Bs, guest houses etc. is accounted for); and
• The impact of the recent ban on burning and burying of waste on farms.
7.3.1 Survey Summary Results
Of the 63 local authorities (District Councils) contacted, 37 responses were received. Summary details for the authorities contacted are as follows:
• Combined collection of household and trade waste can offer economies in terms of logistics and general operations. This is especially true in more rural areas where trade properties tend to be more dispersed. In urban areas, where there is a greater density of trade properties, dedicated collection of trade waste often becomes more attractive. Of the 37 District responses, 14 authorities collect trade waste in dedicated vehicles only, 15 authorities collect trade waste co-mingled with another waste stream (predominantly domestic collections), and 8 authorities do not offer trade waste collections.
• The extent of trade waste collection varied widely. The average council collected from around 1200 properties. Wyre District Council had the largest number of trade waste properties (around 3600); Copeland Borough Council had the smallest number of properties (around 370).
• Most of the councils collect from a varied mix of trade properties (for example, shops, schools, offices, industrial units etc.). A small number of councils noted that tourism generated much of the trade waste collected (for example, North Norfolk District Council, St. Edmundsbury Borough Council, Suffolk Coastal District Council and North Devon District Council, in addition to the Cumbrian Districts).
• When there is dedicated collection of trade waste, tonnage is assessed from weighbridge data at the transfer station and / or landfill. With combined household and trade collection, estimating the exact quantity of trade waste becomes more complicated, and the council must come up with a formula or method for estimating the quantity of trade waste.

C r e a t i n g t h e e n v i r o n m e n t f o r b u s i n e s s
© Entec UK Limited
Doc Reg No. 20002 Page 53
April 2007
7.4 Estimating Trade Waste Volumes It has been identified through the Local Authority survey and the data gathering exercise that the method used for the calculation of the trade waste element of co-collected trade waste and domestic waste varies significantly between authorities. As a result, the different ways of calculating trade waste volumes can have an adverse effect on the calculation of BVPI 84a. Guidance from Defra regarding how to estimate the proportion of waste collected from trade/commercial properties and domestic properties is as follows:
‘ I f a n a u t h o r i t y d o e s n o t s e p a r a t e c o - c o l l e c t e d w a s t e i n t o h o u s e h o l d
a n d c o m m e r c i a l w a s t e , f i g u r e s m u s t b e b a s e d o n a d o c u m e n t e d
s t u d y / s u r v e y t o a s c e r t a i n t h e p r o p o r t i o n a t e c o n t e n t o f t h e w a s t e . I t
i s a d v i s a b l e t o a g r e e t h e s a m p l i n g m e t h o d o l o g y w i t h a n e x t e r n a l
a u d i t o r i n a d v a n c e t o e n s u r e a g r e e m e n t o n t h e a d e q u a c y o f
s a m p l i n g . ’
Table 7.1 presents details of waste conversion factors used by Cumbria, Cheshire and two nearest neighbour authorities. The conversion factor is the bulk density of waste used to calculate the weight of trade waste collected when trade waste and domestic waste are co-collected. Authorities count the number, lift frequency and volume of containers collected from trade waste properties and multiply this by the conversion factor (conversion factors are recorded as the bulk density of waste reported in kilograms per litre - kg/l) to give a weight for a given volume.
Table 7.1 Examples of Standard Bin Weight Conversion Factors
Cumbria South Lakeland
(Mixed Hermitage)
Cheshire North Norfolk Suffolk Coastal District
Conversion Factor 0.061 kg/l - 0.06 kg/l 0.091 kg/l 0.07 kg/l
Standard Bin Weights (kg)
Sack (90 litres) 5.7 - 3.5 8.2 6.3
240 litre wheeled bin 17.1 - 16.1 21.8 16.8
360 litre wheeled bin 22.0 10.6 21.4 32.8 25.2
660 litre wheeled bin 41.0 29.6 38.8 60.1 46.2
770 litre wheeled bin 47.0 - 45.1 70.1 53.9
1000 litre wheeled bin 61.0 - 48.1 91.0 70.0
1100 litre wheeled bin 68.0 56.6 62.0 100.1 77.0

C r e a t i n g t h e e n v i r o n m e n t f o r b u s i n e s s
© Entec UK Limited
Doc Reg No. 20002 Page 54
April 2007
Suffolk Coastal District Council applies a conversion factor of 0.07 kg/litre for un-compacted trade waste. This factor is applied to bins according to bin size. The factor was agreed by Suffolk County Council and the respective District Councils in October 1991 and has not been updated since then (it is assumed therefore that all district councils in Suffolk use this formula, however of the Suffolk authorities who responded to this study, Suffolk Coastal is the only district with a commingled collection, with St Edmundsbury and Waveney both operating dedicated trade collections).
A number of other authorities apply a slightly less scientific method for the calculation of trade waste tonnages for co-collected waste. Mid Devon District Council, who collects trade waste from between 950 and 1000 properties, operate a single dedicated trade collection round (a single RCV for urban areas) and three combined trade/domestic household collection rounds (for rural areas). They estimate that approximately 5% of the co-collected waste is trade however, a small amount of household waste is collected in the ‘dedicated’ trade collection in the urban areas, so it is estimated that this balances with the small amount of trade collected with household in rural areas. Of the six Devon Districts that replied to this study, three do not offer trade waste collections, two have dedicated trade waste only collections and one (Suffolk Coastal) collects only a very small proportion of its waste mixed with domestic.
There were a total of five authorities contacted who collect trade waste and domestic waste together and apply a ‘standard weight formula’ who preferred not to divulge the conversion factor used when calculating the ratio of trade waste and domestic waste.
Although information from comparative authorities on trade waste conversion factors was difficult to obtain, the information received suggests that both Cumbria and Cheshire are using a standard bin weight that is lower than other authorities. This has the effect of under estimating the commercial element of the co-collected waste, therefore over estimating the domestic element, and hence artificially increasing the reported BVPI 84a figure.
A paper recently written for the Cumbria Strategic Waste Partnership investigated the use of standard bin weights in Cumbrian Authorities. It details a number of weighing exercises undertaken by Allerdale, South Lakeland, Eden and Copeland. A variety of different ‘standard’ bin weights were calculated, all of which were significantly greater than the currently used 0.061 kg/litre. The studies calculated conversion factors ranging from 0.083 kg/litre to 0.180 kg/litre. Further work undertaken by Eden Borough Council has used average figures from their own study and those undertaken by Copeland, Allerdale and South Lakeland. Three ‘average’ figures were calculated;
• 0.081 kg/litre (average of Allerdale, Copeland and Eden surveys);
• 0.106 kg/litre (average of South Lakeland, Allerdale, Copeland and Eden surveys); and
• 0.118 kg/litre (average of South Lakeland, Allerdale and Copeland surveys)
The CSWP have decided to adopt a conversion factor of 0.106 kg/litre for the calculation of the trade waste element of co-collected trade and domestic waste. Table 7.2 illustrates the ‘recalculated’ tonnage of trade waste for 2005/6 for each of the Cumbria WCA’s and the County as a whole, using the new ‘conversion factor’ of 0.106

C r e a t i n g t h e e n v i r o n m e n t f o r b u s i n e s s
© Entec UK Limited
Doc Reg No. 20002 Page 55
April 2007
kg/litre. Table 7.3 details the effect that the recalculation of trade waste tonnages would have on the 2005/6 BVPI 84a figures.
Table 7.2 Effect of Different Trade Waste Calculation Methodologies on BVPI 84a - Cumbria
Authority Population
(2005 Mid Year)
2005/6 Commercial Waste Tonnage (based on Conversion
Factor of 0.061 kg/l)
Recalculated 2005/6 Commercial Waste Tonnage (based on a Conversion
Factor of 0.106 kg/l)
Allerdale 95,300 7,464 12,971
Barrow 70,500 N/A N/A
Carlisle 103,500 N/A N/A
Copeland 70,600 1,708 2,967
Eden 52,000 2,412 4,367
SLDC 102,900 2,822 4,904
Cumbria 494,800 14,406 25,209
Table 7.3 Recalculation of BVPI 84a (2005/6) Using Different Standard Weight - Cumbria
2005/6 Reported BVPI 84a
(kg/person/year)
Recalculated 2005/6 BVPI 84a Based on a Conversion Factor of
0.106 kg/l
(kg/person/year)
Reduction in BVPI 84a Based on a Conversion Factor of 0.106 kg/l
(%)
Allerdale 489 431.5 11.8%
Barrow 456 Barrow use dedicated vehicle so recalculation not applicable
Carlisle 473 Carlisle use dedicated vehicle so recalculation not applicable
Copeland 458 440.6 3.8%
Eden 487 447.0 7.8%
SLDC 495 474.5 4.1%
Cumbria 636 614.2 3.4%
Tables 7.3 and 7.4 suggests that if those Cumbrian authorities currently using the standard weights of 0.061 kg/litre for co-collected trade and domestic waste were to recalculate their 2005/6 arisings with a new conversion factor as indicated in the weighing exercises undertaken by Cumbrian authorities, the reported BVPI 84a figure would be significantly reduced10. Using reported 2005/6 trade waste arisings data, and the conversion factor of 0.106 kg/litre
10 Data presented here is based 2005/6 waste arisings which is the most recently published dataset. It is known that Allerdale no longer use the 0.061 kg/l conversion factor but it is believed that for the calculation of the 2005/6 data, this conversion factor was used.

C r e a t i n g t h e e n v i r o n m e n t f o r b u s i n e s s
© Entec UK Limited
Doc Reg No. 20002 Page 56
April 2007
was adopted, the effect on the WCA’s BVPI 84a would be a reduction of between 3.9% (Copeland) and 11.8% (Allerdale). The total effect on BVPI 84a for the County would be a reduction of approximately 3.4% (based on 2005/6 figures).
Cheshire have not undertaken any weighing exercises in recent years to determine a conversion factor for the calculation of the trade waste element in co-collected trade waste and domestic waste collections. Therefore, for the purpose of this study, the three ‘average’ standard weights calculated by the Cumbrian authorities have been applied to Cheshire data to give an approximation of the potential for trade waste tonnage calculations.
Table 7.4 illustrates the ‘recalculated’ tonnage of trade waste for 2005/6 for each of the Cheshire WCA’s and the County as a whole, using the three ‘conversion factors’ derived from the Cumbrian studies. Table 7.5 details the effect that the recalculation of trade waste tonnages would have on the 2005/6 BVPI 84a figures.
Table 7.4 Effect of Different Trade Waste Calculation Methodologies on BVPI 84a - Cheshire
2005/6 Commercial
Waste Tonnage
Effect of Different Conversion Factor on BVPI 84a (kg/person/year)
Conversion Factor
Population
0.060 kg/l 0.081 kg/l 0.106 kg/l 0.118 kg/l
Chester 119,000 N/A N/A N/A N/A
Congleton 91,800 4,476 1,567 3,432 4,327
Crewe and Nantwich 113,400 6,649 2,327 5,097 6,427
Ellesmere Port & Neston 80,900 4,855 1,699 3,723 4,694
Macclesfield 150,400 4,933 1,726 3,782 4,768
Vale Royal 124,500 N/A N/A N/A N/A
Cheshire 680,000 20,913 7,319 16,033 20,216
Table 7.5 Recalculation of BVPI 84a (2005/6) Using Different Standard Weight - Cheshire
Recalculated 2005/6 BVPI 84a Based on Range of Conversion Factors
(kg/person/year)
Reduction in BVPI 84a Based on a Range of Conversion Factors (%)
Conversion Factor
2005/6 Reported BVPI 84a
(kg/person/year)
0.081 kg/l 0.106 kg/l 0.118 kg/l 0.081 kg/l 0.106 kg/l 0.118 kg/l
Chester 420 N/A N/A N/A N/A N/A N/A
Congleton 465 447.9 427.6 417.9 3.7% 8.0% 10.1%
Crewe and Nantwich 408 387.5 363.1 351.3 5.0% 11.0% 13.9%
Ellesmere Port & Neston 406 385.0 360.0 348.0 5.2% 11.3% 14.3%
Macclesfield 387 375.5 361.9 355.3 3.0% 6.5% 8.2%
Vale Royal 415 N/A N/A N/A N/A N/A N/A
Cheshire 589* 578.2 565.4 559.3 1.8% 4.0% 5.0%

C r e a t i n g t h e e n v i r o n m e n t f o r b u s i n e s s
© Entec UK Limited
Doc Reg No. 20002 Page 57
April 2007
*Table Note: The figure of 589 kg/person/year has been used for Cheshire County Council’s 2005/6 BVPI 84a for reasons detailed in Section 4.1.2.
Tables 7.4 and 7.5 suggests that if those Cheshire authorities that currently use the existing standard weights for co-collected trade and domestic waste (currently 0.06 kg/litre for Cheshire authorities) were to recalculate their BVPI 84a with a different conversion factor (as indicated in the weighing exercises undertaken by the Cumbrian authorities) the reported BVPI 84a figure would be significantly reduced. If the lowest of the three ‘average’ standard weights was adopted, the effect on the WCA’s BVPI 84a (based on 2005/6 trade waste arisings) would be a reduction of between 3.0% (Macclesfield) and 5.2% (Ellesmere Port and Neston). If the highest of the ‘average’ standard weights was adopted, the effect on BVPI 84a would be a reduction of between 8.2% (Macclesfield) and 14.3% (Ellesmere Port and Neston). Neither Vale Royal nor Chester collects trade waste. Based on these calculations, the use of new higher standard weights for the trade waste element of co-collected trade and domestic waste could result in a reduction for BVPI 84a for the whole of Cheshire of between 1.8% and 5.0%.
It is the conclusion of this study that both Cheshire and Cumbria use a conversion factor that is too low for the calculation of the trade waste element of co-collected trade and domestic waste. By using this low conversion factor, the quantity of ‘household waste’ is over estimated and therefore the reported BVPI 84a is unrealistically high. Cumbria have carried out a number of weighing exercises and have established a higher, more realistic standard weight for trade bins. This should help reduce the BVPI 84a significantly. It is suggested that Cheshire conduct similar weighing exercises to establish a more reliable and robust standard weight.
7.4.1 Charging Method
Most of the councils consulted charge for trade waste collection based on the bin size and number, and lift frequency at each premises. Suffolk Coastal District Council has a tiered pricing structure: charities, schools etc. are charged for collection only. Many councils also sell sacks; the price of which incorporates the cost of collection. Sacks are popular with premises who have limited available space (for example in town centres) or who generate an infrequent or small quantity of trade waste. Councils tend to arrange contracts with businesses for regular collection of trade waste (for example x number of bins per week) at a set price. Any additional waste collected waste collected incurs an added cost to the business.
7.4.2 Schools
Schools waste and waste arising from education establishments should be classified as domestic waste, although a charge can be made for its collection. Of the councils consulted for this survey, the majority classified collected ‘schools’ waste as trade waste. Most of the authorities in Cheshire and Cumbria incorrectly classified schools waste as trade waste. This will artificially reduce the reported BVPI 84a and increase the trade waste element. Further work is required in this area to determine the impact this incorrect classification will have on BVPI 84a, however this is beyond the scope of this study.

C r e a t i n g t h e e n v i r o n m e n t f o r b u s i n e s s
© Entec UK Limited
Doc Reg No. 20002 Page 58
April 2007
7.4.3 Bed and Breakfast (B&B) Properties
Of the councils consulted, it appears that most collect waste from B&Bs and guest houses as a mixture of domestic waste and trade waste. Bed and breakfasts present a number of issues for waste collection authorities as part of the waste arising from B&B’s will be classified as domestic waste (as there will be permanent residents in the property) and an element will be trade waste (produced by the guests. However, attempting to distinguish which portion of the waste is domestic and which is trade is very difficult.
The Council Tax Regulations (England) state that;
• For a property used for tourist accommodation for less than 26 weeks per year, the owner may choose for its waste to be collected as household / domestic or trade. For this reason most owners choose household status.
• A B&B with less than 6 beds does not have to register as a business or pay for trade waste collection.
For the above reasons it can prove difficult to identify B&Bs and guest houses or charge for trade waste collection. Tourism is discussed in more detail in Section 8.
7.4.4 Farms
New Regulations came into force in May 2006 banning the burning or burying of agricultural waste on farms11. It might have been anticipated that as a result farmers are placing some of this waste material into their domestic bin or requesting a separate trade waste collection. However, most of the councils who responded (11 out of 19) did not notice any change in waste arisings or waste service requests from farms or their households. In Suffolk and Devon some farmers have requested trade waste collection.
7.4.5 Commercial Waste Composition
The Welsh Assembly waste composition study carried out a thorough analysis of waste arising from a variety of commercial premises types. The results of the study show that the waste composition (and hence quantity) vary significantly between type of establishment. For example, establishments classified as SIC Code 55 (hotels and restaurants) were found to contain 42.8% (by weight) kitchen waste, 11% cardboard boxes and containers and 9.4% other paper. Retail establishments (SIC Code 52) were found to produce only 12.2% kitchen waste and 42.3% various card and paper materials. Given the various bulk densities of waste types, by applying a county wide formula for the calculation of trade waste could give rise to inconsistencies in tonnage estimates. This is especially true for Cumbria as a large proportion of trade properties are associated with the tourist industry and would fall under SIC Code 55, therefore producing large quantities of potentially dense waste. While Cumbrian authorities
11 Defra website (http://www.defra.gov.uk/ENVIRONMENT/WASTE/topics/agwaste.htm) The Waste Management (England and Wales) Regulations 2006 (known as the Agricultural Waste Regulations)

C r e a t i n g t h e e n v i r o n m e n t f o r b u s i n e s s
© Entec UK Limited
Doc Reg No. 20002 Page 59
April 2007
have recently conducted investigations into standard bin weights from commercial properties, it is advisable to carry out regular checks at various times of the year and from a variety of establishments in order to build up a comprehensive database of tonnage data.

C r e a t i n g t h e e n v i r o n m e n t f o r b u s i n e s s
© Entec UK Limited
Doc Reg No. 20002 Page 60
April 2007

C r e a t i n g t h e e n v i r o n m e n t f o r b u s i n e s s
© Entec UK Limited
Doc Reg No. 20002 Page 61
April 2007
8. Tourism
8.1 Introduction Waste generated by the tourist industry can end up in a number of different centres or locations, for example: accommodation (camping and caravan sites, hotels, bed and breakfasts and holiday homes) restaurants, pubs, visitor attractions, public spaces, water ways, beaches, streets and bridleways. Locations vary from rural to urban. The density of tourists and their waste generating activities will also vary from location to location.
Tourism in itself tends to be seasonal, with peak numbers in the summer and troughs during the winter. Tourists vary in terms of age, group size (individuals, couples and groups) and socio-demographic origin. Along with the waste that tourists generate themselves, a seasonal labour force will also contribute to waste generation.
Waste generated by tourists and the tourist industry may come under household or commercial waste depending on how and where it arises. This can and does cause difficulties when estimating/calculating the amount of household waste generated by an Authority. Given the variables discussed above, assessing waste generated from tourism is a difficult task. There are few relevant studies in the area. As part of this Report a literature review was carried out.
8.2 Literature Review In recent years, the UK has seen a big rise in domestic tourism. In 2002, the British took 101.7 million holidays in the UK12. Tourism continues to grow on a yearly basis and can be demanding on and destructive to the environment.
A recent survey by Visit Britain found that 92% of accommodation providers in the UK are ‘very small’. This can interpreted as meaning bed and breakfast businesses that are predominantly run from people’s homes. Most of these businesses don’t have formal trade waste collection contracts and the extra waste produced during the peak season is disposed of through the household waste stream. Although this waste is generated by a business, it’s closely related to household waste in its composition.
An estimated 90,000 tonnes of hospitality waste are sent to landfill sites across the UK each year13. The largest and most common waste stream is the ‘mixed waste’ stream. In almost all cases this waste type is disposed to landfill14. Implementation of programmes to reduce the volume of disposable products, to recycle (basic materials such as glass and paper) and compost vegetable matter can significantly reduce the amount of waste sent to landfill.
12 Women’s Environmental Network , Sustainable Tourism 13 Oxford Brookes University , A Handbook for Accommodation Operators 14 BRASS, Waste Management and the Tourism and Leisure Industry

C r e a t i n g t h e e n v i r o n m e n t f o r b u s i n e s s
© Entec UK Limited
Doc Reg No. 20002 Page 62
April 2007
A study in the South West of England calculated the quantity of waste generated by tourists based on the assumption that an average tourist in Europe generates approximately 1.2 kg of waste per bednight15. By multiplying this figure by the number of bednights spent by tourists in the South West, it was estimated that tourists generated 119,977 tonnes of waste in 2001. Another source suggests 1.3 kilograms of waste per guest per night as a benchmark16.
One international study found that tourists generate approximately twice the amount of solid waste that the resident population generate. Unlike the resident population however, tourists are typically only present on a seasonal (and not year round) basis17.
8.3 How Much Waste Do Tourists In Cumbria Generate? Tourism plays a huge part in the Cumbrian economy. In 2005 there were over 15 million visitors to Cumbria generating over £1,100 million pounds18. While tourism undoubtedly benefits Cumbria in many ways, it also puts additional pressures on local services, not least waste management and street services. A review of relevant literature suggests that the average tourist generates approximately 1.2 to 1.3 kg of waste per day. Therefore the tourists that stayed in overnight accommodation in Cumbria in 2005/6 would have generated in the region of 37,000 tonnes of waste (this figure is likely to be underestimated as there will be significant number of tourist that remain unaccounted for, e.g. those staying in unofficial bed and breakfasts and ‘second homes’).
The waste generated by tourists will have a number of routes for disposal, namely;
• Waste generated at the place of tourist accommodation, collected by a contracted commercial waste collection, reported as commercial waste and therefore falling outside of municipal solid waste stream;
• Waste generated at the place of tourist accommodation, collected by the council’s commercial waste collection, reported as commercial waste and included in municipal solid waste steam (but not household waste);
• Waste generated at the place of tourist accommodation, collected by the council’s domestic waste collection (e.g. bed and breakfast accommodation where proprietors included commercial waste in the domestic collection);
• Waste collected as street sweepings, gully emptying and litter bins
15 Web location: http://www.steppingforward.org.uk/tour/waste.htm 16 Oxford Brookes University , A Handbook for Accommodation Operators 17 Web location: http://www.bath.ac.uk/cpe/workingpapers/economic-instruments-taylor-fredotovic-povh_Markandya.pdf 18 STEAM (Scarborough Tourism Economic Activity Monitor)

C r e a t i n g t h e e n v i r o n m e n t f o r b u s i n e s s
© Entec UK Limited
Doc Reg No. 20002 Page 63
April 2007
• Waste generated through the food and drinks sector, collected by a contracted commercial waste collection. Tonnage reported as commercial waste but falling outside of municipal solid waste stream; and
• Waste generated through the food and drinks sector, collected by the council’s commercial waste collection and reported as commercial waste. Therefore, tonnage included in municipal solid waste stream.
The possible routes for tourist waste identified above illustrates the difficulties faced when trying to estimate the quantity of waste generated by tourists and the effects this may (or may not) have on ‘household waste arisings’ and therefore BVPI 84a. However, there are clearly routes in which waste generated by tourists can enter the household waste stream and therefore adversely affect the BVPI calculations. The routes that have been identified as the most likely and significant for Cumbria are:
• Second homes - approximately 3% of ‘households’ in Cumbria are classified as ‘second homes’ (2001 Census, Office of National Statistics). While these households will not have a resident population, they will be occupied for a large proportion of the year (in 2006 occupancy rates for self catering accommodation in Cumbria ranged from 27% in January to 90% in August19). A proportion of this waste is more than likely collected as domestic waste, however as there are no permanent residents living at the address, when the BVPI 84a calculations are made, the total household waste arisings are divided by the total ‘resident’ population, and those living in ‘second’ homes are not included in this population figure.
• Bed and breakfast accommodation - for an establishment offering bed and breakfast type accommodation to be classified as a commercial property (and therefore the waste classified as ‘trade’) it must be let out for more than 26 weeks per year and must offer accommodation to more than 6 people. Therefore, waste collected from properties that do not meet this criterion is classified as household waste, even though proportions of it will have arisen from non Cumbrian residents.
• The policy of a number of authorities for the collection of waste from bed and breakfasts is to collect one receptacle of waste from each property as household waste (e.g. having arisen from the permanent residents) and any additional waste classified and collected as trade. However, it is likely that the domestic ‘bin’ will be filled with domestic and trade waste, and proprietors may well take excess trade waste to the local HWRC, therefore disposing of all additional ‘trade’ waste via household disposal routes
Figure 8.1 presents the reported BVPI 84a figure (2005/6) for the WCA’s in Cheshire, Cumbria, Devon, Lancashire and Gloucestershire plotted against the number of bednights per head of resident population. The chart shows no
19 Source: ‘Self Catering Occupancy Survey, Cumbria Tourism

C r e a t i n g t h e e n v i r o n m e n t f o r b u s i n e s s
© Entec UK Limited
Doc Reg No. 20002 Page 64
April 2007
y = 1.0347x - 298.22R2 = 0.1018
0
50
100
150
200
250
300
350
400
450
300 320 340 360 380 400 420 440 460 480 500
BVPI 84a (2005/6)
Tour
ist B
edni
ghts
per
hea
d of
Res
iden
t Po
pula
tion
Lancashire WCA'sLinear (Lancashire WCA's)
correlation between household waste arisings and tourist bednights per head of population from these WCA’s. The R² value of 0.0877 indicates that there is no significant correlation. However, when each of the individual WCA’s within the County Councils are presented separately, a positive correlation can be seen in all cases except Cheshire.
Figure 8.1 Relationship between Tourist Bednights per Head of Resident Population and BVPI 84a (Cumbria, Cheshire, Lancashire and Devon WCA’s)
y = 0.0795x + 18.11R2 = 0.0016
0
50
100
150
200
250
300
350
400
450
300 350 400 450 500 550
BVPI 84a (2005/6)
Tour
ist B
edni
ghts
per
hea
d of
Res
iden
t P
opul
atio
n
Cumbria, Cheshire, Lancashire,Gloucestershire and Devon WCA's
Linear (Cumbria, Cheshire, Lancashire,Gloucestershire and Devon WCA's)
Figure 8.2 Relationship between Tourist Bednights per Head of Resident Population and BVPI 84a (Lancashire WCA’s)

C r e a t i n g t h e e n v i r o n m e n t f o r b u s i n e s s
© Entec UK Limited
Doc Reg No. 20002 Page 65
April 2007
y = 0.3379x - 102.72R2 = 0.3879
0
10
20
30
40
50
60
70
80
300 350 400 450 500
BVPI 84a (2005/6)
Tour
ist B
edni
ghts
per
hea
d of
Res
iden
t P
opul
atio
n
Devon WCA'sLinear (Devon WCA's)
Figure 8.2 presents the BVPI 84a figures for WCA’s in Lancashire against the number of bednights per head of resident population. A positive correlation can be seen with increasing BVPI 84a in authorities that have higher levels of tourist bednights per head of resident population. However, the R² value of 0.1018 suggests the correlation is very weak. Figure 8.3 shows the relationship between the number of tourist Bednights per head of resident population and BVPI 84a for WCA’s in Devon.
Figure 8.3 Relationship between Tourist Bednights per Head of Resident Population and BVPI 84a (Devon WCA’s)
Figure 8.3 suggests that there is a positive relationship between the level of tourist activity (measured in the number of tourist bednights per head of resident population) and household waste generation. It should be noted that Devon has been identified as displaying the most similar characteristics to Cumbria in terms of the type and number of tourist. Both authorities have large number of tourists staying in ‘un-serviced’ accommodation (which includes campsites and holiday/second homes).
Figure 8.4 shows the relationship between the number of tourist Bednights per head of resident population and BVPI 84a for WCA’s in Gloucestershire.

C r e a t i n g t h e e n v i r o n m e n t f o r b u s i n e s s
© Entec UK Limited
Doc Reg No. 20002 Page 66
April 2007
Figure 8.4 Relationship between Tourist Bednights per Head of Resident Population and BVPI 84a (Gloucestershire WCA’s)
y = 0.0498x - 14.467R2 = 0.3182
0
2
4
6
8
10
12
14
16
330 360 390 420 450 480
BVPI 84a (2005/6)
Tour
ist B
edni
ghts
per
hea
d of
Res
iden
t Pop
ulat
ion
Gloucestershire WCA's
Linear (Gloucestershire WCA's)
The data presented in Figure 8.4 suggests that there may be a positive relationship between household waste arisings and the level of tourist activity for the WCA’s within Gloucestershire.
Figure 8.5 shows the relationship between the number of tourist Bednights per head of resident population and BVPI 84a for WCA’s in Cumbria.

C r e a t i n g t h e e n v i r o n m e n t f o r b u s i n e s s
© Entec UK Limited
Doc Reg No. 20002 Page 67
April 2007
Figure 8.5 Relationship between Tourist Bednights per Head of Resident Population and BVPI 84a (Cumbria WCA’s)
y = 1.9222x - 881.59R2 = 0.8054
0
10
20
30
40
50
60
70
80
90
450 460 470 480 490 500
BVPI 84a (2005/6)
Tour
ist B
edni
ghts
per
hea
d of
Res
iden
t Po
pula
tion
Cumbria WCA's
Linear (Cumbria WCA's)
Figure 8.5 suggests that there is a strong correlation between the number of tourist bednights and BVPI 84a for the WCA’s within Cumbria. The relationship between tourist bednights per head of resident population and BVPI 84a is strongest and most prominent in Cumbria compared with comparative authorities.
As this and a number of other reports have suggested, there are many reasons why different authorities produce different quantities of household waste per head of population, not least due to reporting and accounting methodologies. Figures 8.2 to 8.5 suggest that for authorities that report and calculate arisings figures in similar ways (e.g. WCA’s within a County Council) and have similar geographic locations, a relationship exists between levels of tourism and household waste arisings. This is especially true for the Cumbrian authorities. The authority identified as most similar to Cumbria for the levels of tourism and the composition of tourist accommodation (high proportion of ‘non-serviced’ accommodation) is Devon. Both Devon and Cumbria show a strong positive correlation between tourist bednights and household waste arisings, suggesting that waste generated by tourists is somehow entering the household waste steam.
8.4 Increases In Waste Arisings Over Time - Is It Due To Tourism?
Section 4 of this report shows how BVPI 84a has steadily increased year on year for Cumbria for the past 5 years. This contrasts with most other authorities who have seen less predictable annual trends. Cheshire’s BVPI 84a, while currently at a similar level to that of Cumbria has remained at a consistent level for the past 5 years with little variation. Therefore, it seems unlikely that socio-demographics, housing profile, resident consumer habits, or even

C r e a t i n g t h e e n v i r o n m e n t f o r b u s i n e s s
© Entec UK Limited
Doc Reg No. 20002 Page 68
April 2007
council waste policies are responsible for the above average increases in waste arisings over time in Cumbria. It has already been suggested in this report that tourism may be having an effect on household waste arisings, therefore increases in tourism over the last 5 years may have adversely affected the BVPI 84a. Table 8.1 shows the level of tourist activity in Cumbria for the period 2000 to 2005.
Table 8.1 Tourism Statistics for Cumbria 2000 - 2005
Year Cumbria Tourist Visitor Numbers (millions)
Cumbria Tourist Visitor Days (millions)
Cumbria Economic Impact of Tourism (£million)
2000 14.27 26.52 966.7
2001 13.78 24.80 931.1
2002 15.09 27.79 1084.9
2003 15.46 28.86 1132.4
2004 15.77 29.49 1154.5
2005 15.54 28.58 1129.3
Source: STEAM (Scarborough Tourism Economic Activity Monitor)
Table 8.1 shows a steady increase in tourist activity for the period 2000 to 2005 (the lower figures in 2001 are related to the impacts on tourism of the ‘foot and mouth’ outbreak). Figure 8.6 plots the number of tourist visitor days in Cumbria for the period 2000 to 2005 and the reported BVPI 84a figures for the same period.

C r e a t i n g t h e e n v i r o n m e n t f o r b u s i n e s s
© Entec UK Limited
Doc Reg No. 20002 Page 69
April 2007
Figure 8.6 Levels of Tourism in Cumbria and BVPI 84a (2000 to 2005)
300
350
400
450
500
550
600
650
700
2000/1 2001/02 2002/3 2003/4 2004/5 2005/6
BVPI
84a
(kg/
pers
on/y
ear)
18
20
22
24
26
28
30
32
Annn
ual T
ouris
t Vis
itor D
ays
(mill
ions
)
BVPI 84a Tourist Visitor Days (millions)
Figure 8.6 shows that the reported BVPI 84a figures closely track the level of tourists visiting Cumbria for the period 2000-2005. The chart shows that as tourism increases over time, so does the amount of household waste collected. The two lines show a strong relationship suggesting that a proportion of waste generated by tourists is getting into the household waste stream and could therefore be a significant contributing factor in explaining why Cumbria reports unusually high figures for household waste arisings.

C r e a t i n g t h e e n v i r o n m e n t f o r b u s i n e s s
© Entec UK Limited
Doc Reg No. 20002 Page 70
April 2007

C r e a t i n g t h e e n v i r o n m e n t f o r b u s i n e s s
© Entec UK Limited
Doc Reg No. 20002 Page 71
April 2007
9. HWRC Arisings
9.1 Introduction Data collected and analysed in earlier sections of this report suggest that while collected household waste arisings in Cheshire are comparable with national the average and its ‘nearest neighbour’ authorities, the quantity of waste deposited at HWRCs is considerably higher in Cheshire than other authorities (this is also true for Cumbria, however kerbside collected waste is also significantly higher in Cumbria than other authorities).This chapter aims to investigate the reasons why waste arisings vary between HWRCs and to look into the reasons why arisings are high at facilities within Cheshire (Cumbria is also investigated with respect to HWRCs but not to the extent of Cheshire as it is deemed more of an issue for Cheshire).
Various studies have identified factors that have a significant affect on HWRC arisings. A summary of these factors (extracted from the National Assessment of Civic Amenity Sites survey, 2004, Network Recycling and Future West) is presented in Table 9.1.
Table 9.1 Factors Affecting CA Site Arisings
Factors Affecting CA Site Arisings
• level of deprivation
• urban or rural location
• household size
• car ownership levels
• seasonal changes in site usage
• CA site density
• method of kerbside residual waste containment
• kerbside residual waste collection policies (e.g. closed lid or no side waste policies)
• frequency of kerbside residual waste collections
• level of kerbside dry recycling provision
• level of kerbside organics recycling provision
• level of bring site provision
• level of bulky waste collection provision
• cross-border usage and access restrictions
• degree to which CA site service is publicised
• factors affecting overall household waste increases (i.e. GDP growth)
• trade abuse (and policies to control trade waste input)
• improvements in CA site recycling facilities
• other factors, possibly including the effect of TV ‘make-over shows’

C r e a t i n g t h e e n v i r o n m e n t f o r b u s i n e s s
© Entec UK Limited
Doc Reg No. 20002 Page 72
April 2007
Potential influencing factors for the level of HWRC arisings in Cheshire were investigated and are reported in this section. Where possible, HWRC waste arisings are quantified in terms of kg of HWRC waste produced per person per year e.g. the same units as the reporting methodology for BVPI 84a (a ‘person’ represents the resident population of the County, not an individual using the HWRC). The average total County waste arisings for HWRCs in Cheshire, Cumbria and their ‘nearest neighbours’ for 2005/6 was 114.7 kg/person/year (excluding rubble). Both Cheshire and Cumbria report HWRC arisings significantly higher than the average, with 2005/6 figures of 177.0 kg/person/year and 156.7 kg/person/year respectively.
9.2 Effect of Levels of Deprivation on CA Waste Arisings Various studies have suggested that HWRC waste arisings (as with other household waste arisings) are likely to be affected by levels of deprivation, as it is assumed that more affluent people tend to be greater consumers, therefore producing larger quantities of waste (although this was found not to be the case for household waste arisings earlier in this report). Consumer spending habits, along with higher levels of car ownership among the more affluent sectors of the community may result in a higher proportion of inhabitants using HWRCs, in comparison with more deprived areas. Moreover, wealthier areas often have larger gardens, resulting in higher green waste arisings and - in many cases - more visits to HWRCs. The correlation between levels of deprivation and HWRC waste arisings per inhabitant is demonstrated in Figure 9.1 for Cheshire and it’s ‘nearest neighbours’. The chart plots HWRC waste arisings in kg/person/week against the Index of Multiple Deprivation Score, where a high score represents a more deprived area.
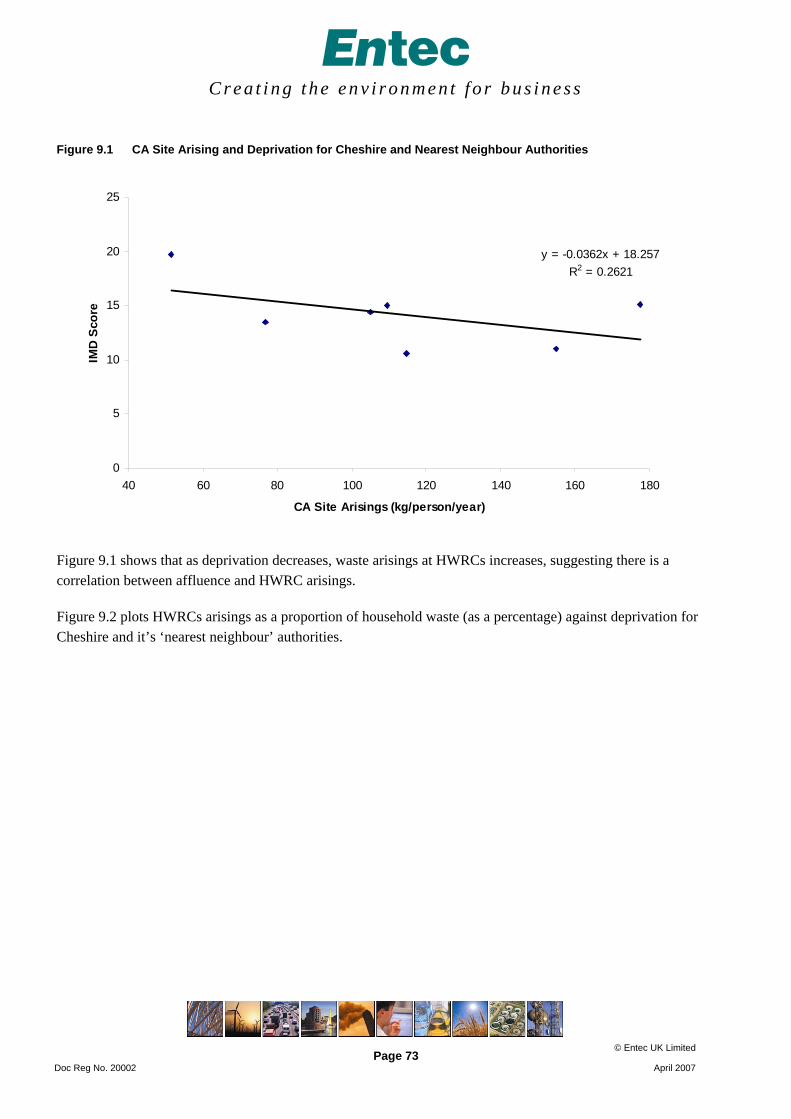
C r e a t i n g t h e e n v i r o n m e n t f o r b u s i n e s s
© Entec UK Limited
Doc Reg No. 20002 Page 73
April 2007
Figure 9.1 CA Site Arising and Deprivation for Cheshire and Nearest Neighbour Authorities
y = -0.0362x + 18.257R2 = 0.2621
0
5
10
15
20
25
40 60 80 100 120 140 160 180
CA Site Arisings (kg/person/year)
IMD
Scor
e
Figure 9.1 shows that as deprivation decreases, waste arisings at HWRCs increases, suggesting there is a correlation between affluence and HWRC arisings.
Figure 9.2 plots HWRCs arisings as a proportion of household waste (as a percentage) against deprivation for Cheshire and it’s ‘nearest neighbour’ authorities.

C r e a t i n g t h e e n v i r o n m e n t f o r b u s i n e s s
© Entec UK Limited
Doc Reg No. 20002 Page 74
April 2007
Figure 9.2 CA Site Arising as a Percentage of Total Household Arisings and Deprivation for Cheshire and Nearest Neighbour Authorities
y = -29.635x + 20.313R2 = 0.412
0
5
10
15
20
25
10% 12% 14% 16% 18% 20% 22% 24% 26% 28% 30%
CA Site Arisings as % of BVPI 84a
IMD
Sco
re
Figure 9.2 shows a similar trend to Figure 9.1, suggesting that more affluent authorities dispose of more waste at HWRCs, both in real terms (e.g. kg/person/year) and relative terms as a percentage of overall household waste, than less affluent households. It should be noted that analysis of waste arisings in previous sections of this report suggest that total household waste arisings are not affected by household deprivation. Therefore, it could be proposed that while affluence does not affect total household waste generation, it may have an influence on the disposal route selected by an individual household, for example more affluent households may choose to use their HWRC more regularly than less affluent households. There could be a number of reasons for this such as; access to suitable transport to get to the HWRC, the type of waste generated by more affluent households (e.g. more regular home improvements), the size of gardens (more affluent households have larger garden so transport more garden waste to HWRCs). However, this study is a desk based data analysis study and it is beyond the scope of this study to investigate this issue further. Of course there will be many other interrelated factors that will affect the disposal route such as kerbside collection policies or number, location and density of HWRCs.
9.3 Effect of Urban or Rural Location on HWRC Waste Arisings Analysis of data from the National Assessment of Civic Amenity Sites (NACAS) Survey shows that average HWRC waste arisings are higher for rural authorities than urban authorities:
• Rural authorities: average CA waste arisings = 156 kilos per inhabitant per year

C r e a t i n g t h e e n v i r o n m e n t f o r b u s i n e s s
© Entec UK Limited
Doc Reg No. 20002 Page 75
April 2007
• Urban authorities: average CA waste arisings = 120 kilos per inhabitant per year
(Data from 117 England waste disposal or unitary authorities, CIPFA Statistics 2001/2)
The degree to which an authority is classified as rural or urban could be closely linked with affluence as more rural areas tend to be more affluent. The composition of waste in rural areas will also differ from urban areas with the quantity of organic garden waste potentially higher in rural authorities. Dependant on the kerbside collection scheme in place, the HWRC may provide a suitable point of disposal for this additional waste, and therefore could be a reason why rural authorities have higher HWRC arisings.
9.4 Effect of Car Ownership Levels on HWRC Waste Arisings Most HWRCs are designed for access by motor vehicles. Therefore it could be assumed that higher levels of car ownership could result in higher usage of HWRCs. Figure 9.3 shows the average number of cars per household for each of the Cheshire and Cumbria ‘nearest neighbour’ authorities plotted against the 2005/6 total HWRC arisings (in kg/person/year). The chart clearly shows that there is no relationship between the level of car ownership and HWRC waste arisings. It should be noted that the authorities in this Chart have been selected as they represent authorities that are most similar to Cheshire and Cumbria, therefore it can be assumed that the level of car ownership will be similar between the authorities (this can be seen by the narrow range of average car ownership).
Figure 9.3 Level of Car Ownership and HWRC Arisings
y = 2E-05x + 1.1512R2 = 0.0001
1.0
1.1
1.1
1.2
1.2
1.3
0.0 50.0 100.0 150.0 200.0 250.0
HWRC Waste Arisings 2005/6 (kg/person/year)
Aver
age
Num
ber o
f Car
s pe
r H
ouse
hold
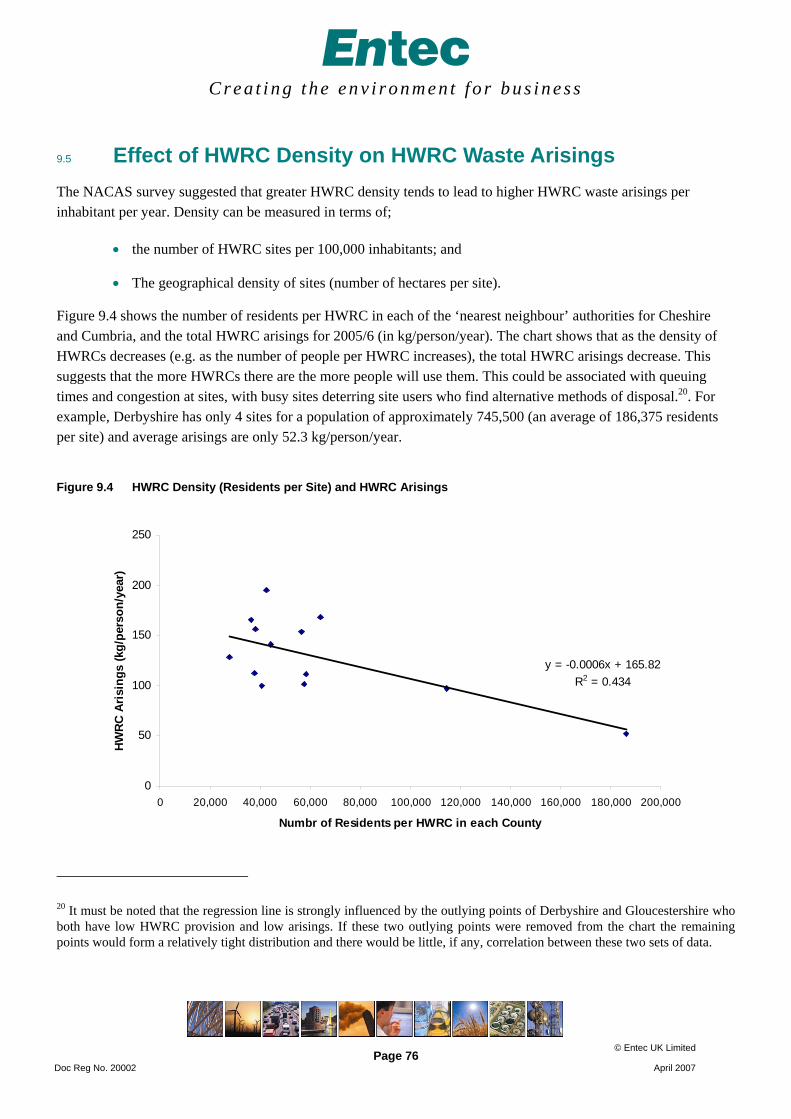
C r e a t i n g t h e e n v i r o n m e n t f o r b u s i n e s s
© Entec UK Limited
Doc Reg No. 20002 Page 76
April 2007
9.5 Effect of HWRC Density on HWRC Waste Arisings The NACAS survey suggested that greater HWRC density tends to lead to higher HWRC waste arisings per inhabitant per year. Density can be measured in terms of;
• the number of HWRC sites per 100,000 inhabitants; and
• The geographical density of sites (number of hectares per site).
Figure 9.4 shows the number of residents per HWRC in each of the ‘nearest neighbour’ authorities for Cheshire and Cumbria, and the total HWRC arisings for 2005/6 (in kg/person/year). The chart shows that as the density of HWRCs decreases (e.g. as the number of people per HWRC increases), the total HWRC arisings decrease. This suggests that the more HWRCs there are the more people will use them. This could be associated with queuing times and congestion at sites, with busy sites deterring site users who find alternative methods of disposal.20. For example, Derbyshire has only 4 sites for a population of approximately 745,500 (an average of 186,375 residents per site) and average arisings are only 52.3 kg/person/year.
Figure 9.4 HWRC Density (Residents per Site) and HWRC Arisings
20 It must be noted that the regression line is strongly influenced by the outlying points of Derbyshire and Gloucestershire who both have low HWRC provision and low arisings. If these two outlying points were removed from the chart the remaining points would form a relatively tight distribution and there would be little, if any, correlation between these two sets of data.
y = -0.0006x + 165.82R2 = 0.434
0
50
100
150
200
250
0 20,000 40,000 60,000 80,000 100,000 120,000 140,000 160,000 180,000 200,000
Numbr of Residents per HWRC in each County
HWRC
Aris
ings
(kg/
pers
on/y
ear)

C r e a t i n g t h e e n v i r o n m e n t f o r b u s i n e s s
© Entec UK Limited
Doc Reg No. 20002 Page 77
April 2007
Figure 9.5 shows the geographical density of HWRC (average number of hectares per HWRC) plotted against total HWRC arisings for Cheshire, Cumbria and their ‘nearest neighbour’ authorities. The chart shows a similar trend to Figure 9.4 and suggests that those authorities with more densely located HWRCs achieve higher levels of HWRC arisings.
Figure 9.5 HWRC Geographical Density (Hectares per Site) and HWRC Arisings
Figure 9.4 and 9.5 suggest that more densely located HWRCs will generate higher HWRC arisings. There is a greater correlation between HWRC arisings and geographical density than with population density, however a relationship can be established for both influencing factors.
9.5.1 Effect of Kerbside Residual Waste Containment Method and HWRC Waste Arisings
There is evidence that the provision of wheeled bins (as opposed to plastic sacks) to contain kerbside residual waste can drive increases in overall household waste, but that this will be counteracted to some extent by lower HWRC waste arisings in the relevant locality:
“Provision of 240 litre wheeled bins can lead to greater quantities of collection round waste, but this is offset by reduced quantities of waste taken to HWRC.”21
21 WRAP, Analysis of Household Waste Composition and Factors Driving Waste Increases
y = -0.0011x + 154.85R2 = 0.343
0
20
40
60
80
100
120
140
160
180
200
0 10,000 20,000 30,000 40,000 50,000 60,000 70,000
HWRC Geographical Density (hectares of land per site)
HWRC
Aris
ings
(kg/
pers
on/y
ear)

C r e a t i n g t h e e n v i r o n m e n t f o r b u s i n e s s
© Entec UK Limited
Doc Reg No. 20002 Page 78
April 2007
The study by WRAP, quoted above, uses national tonnage statistics to prove this supposition. The NACAS survey used from the CIPFA Waste Collection and Disposal Statistics 2001/02 and found that:
• Authorities with no households provided with wheeled bins have an average HWRC waste arising of 146 kilos per inhabitant per year.
• Authorities with 50% or more households provided with wheeled bins have an average HWRC waste arising of 131 kilos per inhabitant per year.
(Based on data from 81 England waste disposal or unitary authorities. Sources: CIPFA Waste Collection and Disposal Statistics 2001/02; NACAS)
Therefore, the provision of wheeled bins, particularly those of larger capacity (i.e. around 240 litres) can to lead lower HWRC arisings. Householders provided with wheeled bins may be using them to dispose of some items that they might otherwise have taken to their local HWRC. However, anecdotal evidence suggests that the introduction of alternate week collections (where a fortnightly collection of residual waste is collected on alternating weeks with recyclable material) can also influence the disposal behaviour of householders. By introducing a fortnightly collection of residual waste (or similarly reducing the bin size), a local authority is effectively trying to encourage householders to increase segregation of materials by removing them from the residual bin and placing them in an appropriate recyclables container. However, interviews with various authorities and results from a number of HWRC questionnaire surveys suggest that some householders are still producing too much refuse for the size and frequency of bin provided and require disposal facilities located at HWRC.
Areas where a policy of non-collection of kerbside residual side waste is enforced may notice higher HWRC waste arisings, since householders are then forced to find alternative disposal options for their ‘excess’ kerbside residual waste. The local HWRC may often be a logical disposal option for these householders.
It should be noted at this stage that 3 of the 6 WCA’s in Cheshire operate alternate weekly collections (fortnightly residual waste) and 1 of the remaining 3 WCA’s operates a black sack collection (Chester). Congleton, who produce significantly more waste that is collected at the kerbside, operate a weekly wheeled bin collection.
9.5.2 Effect of ‘Other Factors’ on HWRC Arisings
Some additional factors are thought to be causing increases in waste arisings at HWRCs, including the possibility of the current popularity of DIY, decorating and gardening ‘TV make-over shows’. It is possible that the lifestyles of Cheshire and/or Cumbrian residents are more akin to follow these trends and there could perhaps be a higher proportion of home improvements being undertaken in Cheshire compared with other parts of the country. However, there is no evidence in this report to support or dismiss this hypothesis and further work, including CA site surveys (questionnaires and compositional surveys) would be required to substantiate this claim (data gathered and analysed in this report suggest that there is no link between affluence and HWRC arisings).
C r e a t i n g t h e e n v i r o n m e n t f o r b u s i n e s s
© Entec UK Limited
Doc Reg No. 20002 Page 79
April 2007
So far the factors listed above could offer some explanation as to why HWRC arisings are high in Cheshire and Cumbria. However, many of the factors listed do not explain why Cheshire has high total household waste arisings but merely high HWRC arisings. For example, the relationship between kerbside collection policy and HWRC arisings seems logical (e.g. by decreasing the frequency of which a kerbside residual bin is collected, restricting the size of bin provided, ensuring the lid is fully closed or not accepting side waste, may encourage some to transport excess waste to their local HWRC, therefore increasing site arisings). However, if this scenario is taking place, it does not explain why total household waste arising are high, as an increase in HWRC arisings would be matched with a decrease in kerbside collected arisings. Data in this report suggest that kerbside arisings are average in Cheshire and high in Cumbria, therefore, one can assume that there must be a reason (or number of reasons) why resident of Cheshire produce more waste per person than comparative authorities. There are two ways in which household waste arisings may be increased as a result of HWRC external influences. These are cross-boundary usage and trade waste abuse.Amenity
9.5.3 Effect of Cross-Border Usage and Access Restrictions on HWRC Waste Arisings
The usage of HWRCs by residents of neighbouring authorities can increase waste inputs. Of course, all cross-border traffic can be viewed in two ways: as a net decrease to one authority whose residents ‘export’ waste to sites in neighbouring authorities, or as a net increase to the other authority which is effectively ‘importing’ waste. However, it stands to reason that if an authority has a large number of sites within its boundary, and they are located close to the boundary, such as Cheshire, it will be more likely a net importer than exporter. A desk based study such as this cannot measure the level of cross boundary usage, however, analysis of the location and density of sites in Cheshire and its neighbours suggests that there is potential for cross boundary waste movements and importation of waste into Cheshire. Cheshire has a very comprehensive network of HWRCs with a site density significantly better than its neighbouring authorities. There are also a number of sites within Cheshire that are located close to the county boundary, offering the opportunity for cross-boundary usage. To investigate further, field surveys are required. Figure 9.6 shows the location of HWRCs in Cheshire and its neighbouring authorities.

C r e a t i n g t h e e n v i r o n m e n t f o r b u s i n e s s
© Entec UK Limited
Doc Reg No. 20002 Page 80
April 2007
Figure 9.6 Distribution of HWRCs in Cheshire and Neighbouring Authorities

C r e a t i n g t h e e n v i r o n m e n t f o r b u s i n e s s
© Entec UK Limited
Doc Reg No. 20002 Page 81
April 2007
9.5.4 Trade Waste Abuse
The use of HWRCs for the illegal deposit of trade waste is a common cause of high HWRC arisings. Many authorities across the country have implemented restrictions on site users in an attempt to limit the amount of trade waste illegally dumped at sites. Trade waste is not classified as ‘household waste’ and therefore any trade waste that is deposited at HWRCs and is not declared as trade waste will result in its incorrect classification as ‘household waste’. This will adversely affect the household waste tonnage figures and hence the BVPI 84a figure.
It is notoriously difficult to identify and eliminate all trade waste abuse at HWRCs, and it is overly optimistic to assume that any authority can completely eliminate trade waste from entering the household waste stream via this route. However, many authorities have made concerted efforts in this area and the clamping down of trade waste abuse has been highlighted by a number of authorities contacted in this study as a means of lowering BVPI 84a.
9.5.5 Summary of HWRC Policies and Provision for Cheshire and Nearest Neighbour Authorities
Table 9.2 presents a summary of HWRC policies and provision for Cheshire and it’s ‘nearest neighbour’ authorities.

C r e a t i n g t h e e n v i r o n m e n t f o r b u s i n e s s
© Entec UK Limited
Doc Reg No. 20002 Page 82
April 2007
Table 9.2 Cheshire and ‘Nearest Neighbour’ Authorities - HWRC Policies and Statistics
WDA IMD Score
BVPI 84a Performer
BVPI 84a
CA site arisings (excl. rubble)
BVPI 84a excluding CA site arisings
CA site arisings as % of BVPI 84a
Number of sites
Residents per site (‘000’s)
Geographic area covered by each site (‘000’s hectares)
Site User Restrictions
Summer Opening Hours
Cheshire 15.1 Poor 620 177 443 29% 16 42.5 13.0 None during 2005/6* 20.00
Warwickshire 14.4 Poor 549 101 448 18% 9 58.4 21.9 Y (all vans banned) 16.30 – 18.30
Leicestershire 11.0 Poor 545 154 392 28% 11 56.7 18.9 Y (permit needed for vans and restrictions on quantity of waste)
20.00
Suffolk 15.0 Poor 539 110 429 20% 18 38.0 21.1 Y (height and quantity restrictions) 18.00
Wiltshire 10.6 Good 506 102 404 20% 10 44.5 32.6 N 19.00
Gloucestershire 13.5 Good 503 74 429 15% 5 114.6 53.0 Y (height) 19.45
Lancashire22 21.8 Good 496 125 371 25% 18 64.0 16.1 Y (size/permits) 19.00
Derbyshire 19.7 Good 484 52 432 11% 4 186.4 63.7 Y (size) 18.00
*This table is, where practical, based on the situation in 2005/6 to match the data period. It is accepted that Cheshire has now implemented a permit scheme for vehicles of a certain size.
22 Lancashire is not a ‘Nearest Neighbour’ of Cheshire but is included in all comparative analysis due to its geographical proximity to both Cheshire and Cumbria

C r e a t i n g t h e e n v i r o n m e n t f o r b u s i n e s s
© Entec UK Limited
Doc Reg No. 20002 Page 83
April 2007
Table 9.2 shows that there is a great variety of HWRC provision between authorities, with Cheshire providing a very good service. The two authorities with the lowest HWRC arisings, Derbyshire and Gloucestershire (who in turn have low BVPI 84a figures) have significantly less HWRCs than Cheshire. This is true in absolute terms (e.g. the number of sites in the county) and relative terms when compared with geographical and population density.
Warwickshire was identified as the most similar to Cheshire in the nearest neighbour analysis. Kerbside collected waste arisings are very similar between Warwickshire and Cheshire; however there is a significant variation in the amount of waste generated at the HWRCs. Analysis of HWRC policies shows that the two counties employ significantly different approaches to access and site user restrictions. Opening hours of sites in Warwickshire are very restricted with some sites closing at 16.30 all year round and only 4 of the 9 sits opening until 18.30 in the summer months. This contrasts significantly with the sites in Cheshire which operate until 20.00 in the summer. A number of traffic surveys at HWRCs carried out by Entec have suggested that extending opening hours in the evening can significantly increase the number of people using the site. Additionally, by opening longer during the week, this relieves congestion at weekends and makes the site more attractive, therefore also helping to increase usage at weekends for people who would not usually use the site. The provision of sites, both in terms of the number of sites compared with the number of residents, and the number of sites for the geographical size of the County, is significantly better in Cheshire than Warwickshire. This is also seen as a significant contributing factor to higher HWRC arisings in Cheshire than Warwickshire.
9.5.6 Cheshire Permit Scheme
The data analysis has been undertaken using 2005/6 tonnage data (the most recent audited and complete data set available). During this period (2005/6), Cheshire HWRCs did not have any restrictions on vehicles entering the site. As a result, it could be assumed that a higher than average quantity of trade waste was entering the sites. By contrast, since December 1999 household waste delivered in vans, pick-ups or large trailers have not been accepted free of charge at Warwickshire County Councils HWRCs. In fact, the majority of Cheshire’s ‘nearest neighbours’ (all counties except one) employed some form of enforcement policy at HWRCs. These schemes have been proven to dramatically reduce trade waste abuse (which is believed to be a problem at HWRCs in Cheshire) and help to limit cross boundary usage.
Cheshire has recently introduced a vehicle restriction and permit scheme similar to the one used in Warwickshire. Figure 9.7 shows the total tonnage of waste deposited at HWRCs in Cheshire for April to May in 2005 and 2006. The permit scheme was introduced in July 2006. It is clear to see that since the introduction of the permit scheme, arisings at HWRCs have decreased from the previous years figures. Initial figures for the period July 2006 to January 2007 suggest a 19% reduction in tonnages for the same period the previous year (before the introduction of the permit scheme). It is suggested that a more detailed analysis with the completed 2006/7 audited data should be undertaken to provide a more robust and detailed account of the success of the permit scheme. The reduction of waste arisings at HWRCs due to restrictions on vehicles can be attributed primarily to reductions in trade waste abuse.

C r e a t i n g t h e e n v i r o n m e n t f o r b u s i n e s s
© Entec UK Limited
Doc Reg No. 20002 Page 84
April 2007
Figure 9.7 Effect of the Cheshire HWRC Permit Scheme
In summary, waste arisings at HWRCs are unusually high in Cheshire. The combination of affluence (refer to Figures 9.1 and 9.2), high HWRC density, and a lack of control measures at sites leading to trade waste abuse and potential cross-boundary usage have contributed to high arisings. The use of alternate week collections in a number of Cheshire WCA’s and black sack collections in Chester may be a factor in the larger than average quantities of waste at the HWRCs (restrictions in kerbside collection policy can divert waste into HWRCs). The introduction of a HWRC permit scheme seems to have reduced the level of trade waste abuse at HWRCs, however further analysis of data is required (as it becomes available) to fully measure the success of the scheme.
9.5.7 Summary of HWRC Policies and Provision for Cumbria and Nearest Neighbour Authorities
As with Cheshire, Cumbria also exhibit higher than average arisings at HWRCs. A summary of their policies is presented in Table 9.3.

C r e a t i n g t h e e n v i r o n m e n t f o r b u s i n e s s
© Entec UK Limited
Doc Reg No. 20002 Page 85
April 2007
Table 9.3 Cumbria and ‘Nearest Neighbour’ Authorities - HWRC Policies and Statistics
WDA IMD Score
BVPI 84a Performer
BVPI 84a
CA site arisings (excl. rubble)
BVPI 84a excluding CA site arisings
CA site arisings as % of BVPI 84a
Number of sites
Residents per site (‘000’s)
Geographic area covered by each site (‘000’s hectares)
Site User Restrictions
Summer Opening Hours
Cumbria 21.6 Poor 635 157 479 25% 13 38.0 52.1 None during 2005/6 16.00 to18.00 (some sites part time)
North Yorkshire 14.0 Poor 568 120 448 21% 21 27.6 38.3 Disclaimer forms only 17.00 to 19.00
Shropshire 15.4 Poor 554 87 467 16% 5 57.6 63.9 Y (CCTV, Disclaimer forms and restrictions on quantities per visit)
16.00 to 20.00
Suffolk 15.0 Poor 539 110 429 20% 18 38.0 21.1 Y (height and quantity restrictions) 18.00
Devon 17.4 Average 522 135 387 26% 20 36.2 32.8 Y (12 bags of rubble a year, disclaimer forms and entrance checks)
18.00
Gloucestershire 13.5 Good 503 74 429 15% 5 114.6 53.0 Y (height) 19.45
Norfolk 17.9 Good 486 97 390 20% 20 27.6 26.9 Y (CCTV, Disclaimer forms and restrictions on quantities per visit)
16.00 to 20.00
Derbyshire 19.7 Good 484 52 432 11% 4 186.4 63.7 Y (size) 18.00

C r e a t i n g t h e e n v i r o n m e n t f o r b u s i n e s s
© Entec UK Limited
Doc Reg No. 20002 Page 86
April 2007
During the period for which the data in this analysis is valid (2005/6), Cumbria did not enforce any vehicle restrictions at any of their HWRCs. This contrasts with many of the ‘nearest neighbour’ authorities who implement a variety of control measures such as vehicle size/height restrictions or disclaimer forms.
The three authorities with the lowest HWRC arisings (Gloucestershire, Derbyshire and Shropshire) have the least sites (5, 4 and 5 respectively) and the most residents per site.
Cumbria have recently introduced a vehicle permit scheme at HWRCs for vans and van like vehicles in an attempt to limit the quantity of illegally dumped trade waste at the sites. Data was not available to allow analysis of the effectiveness of the permit scheme for this study, however, it is suggested that an analysis is carried out when the data becomes available. It is anticipated that the introduction of the permit scheme will reduce the HWRC arisings, and therefore have a positive effect on the County BVPI 84a.

C r e a t i n g t h e e n v i r o n m e n t f o r b u s i n e s s
© Entec UK Limited
Doc Reg No. 20002 Page 87
April 2007
10. Summary and Conclusions
10.1 Introduction This section provides a brief summary of the conclusions of this report for both Cheshire and Cumbria. This study was designed to identify authorities of a similar nature to both Cheshire and Cumbria and to identify reasons why some authorities are performing well and why Cheshire and Cumbria are performing poorly in BVPI 84a.
10.2 Cheshire • Affluence and housing type in itself was not seen as a reason for high arisings as there are a number of
counties that are deemed more affluent (or ‘less deprived’) than Cheshire who report significantly lower household waste arisings;
• The management of data and BVPI calculations has been identified as a contributing factor in inaccuracies of data. From the data available it seems that Cheshire included HWRC rubble in their 2005/6 BVPI 84a calculation, artificially increasing it by approximately 18 kg/person/year. In addition, Ellesmere Port and Neston have included commercial waste in their domestic figures, increasing their BVPI 84a by 31 kg/person/year. Therefore, by recalculating the figure using the data entered into WasteDataFlow and the correct methodology, the 2005/6 BVPI 84a figure for Cheshire would be reduced from the reported figure of 620 kg/person/year to 589 kg/person/year;
• The quantity of waste collected by the Cheshire WCA’s was comparable with other collection authorities, with only Congleton reporting above average BVPI 84a figures. Analysis of kerbside collection containers suggests that those authorities offering a weekly collection of waste in a wheeled bin (such as Congleton) have the highest arisings. Those authorities with sack collections or alternate week collections (most other authorities in Cheshire) report lower waste arisings;
• The roll-out of kerbside garden waste collections was seen as a contributing factor in high BVPI 84a figures. The four nearest neighbour authorities with the lowest BVPI 84a figures for 2005/6 offer garden waste collections to less than 50% of households. This contrasts with a roll out of over 85% for the Cheshire Authorities. This suggests confirmation of a number of studies that have found the provision of a centralised garden waste collection can increase household waste arisings;
• Four of the six Cheshire WCA’s co-collect trade waste and domestic waste in the same vehicles. A standard weight of 0.06 kg/l is then applied to the number, volume and lift frequency of collected trade waste to estimate trade waste figures. Comparison with standard weights used by other authorities and weighing trials undertaken by Cumbrian authorities suggest that the standard weight used by Cheshire is too low, therefore over estimating the proportion of domestic refuse in the co-collected waste. By applying a different standard weight to the quantity of trade waste collected in the Cheshire authorities in 2005/6, the effect on individual authorities BVPI 84a figure varied between a reduction of 11.5 kg/person/year and 58.0 kg/person/year (dependant on the authority and the standard weight applied). A reduction of up to 5% on the reported county BVPI 84a could be achieved by applying a different standard weight for trade waste tonnage calculations;

C r e a t i n g t h e e n v i r o n m e n t f o r b u s i n e s s
© Entec UK Limited
Doc Reg No. 20002 Page 88
April 2007
• The level of HWRC waste in Cheshire (177 kg/person/year) is significantly higher than the average for comparative authorities (114 kg/person/year). Reasons for high HWRC arisings are the high number of and density of sites, and the lack of trade waste and cross-boundary usage restriction (using 2005/6 data). More recent data relating to HWRC arisings after the introduction of the permit scheme suggest that HWRC arisings have fallen by approximately 13%. Further work is required once a complete year’s dataset has been gathered in order to assess the full effect of the permit scheme.
10.3 Cumbria • Analysis of data contained within this report suggests that ‘Remote Rural’ authorities, such as
Cumbria, produce more waste than either ‘Accessible Rural’ or ‘Urban’ authorities;
• The management of data is a key issue for all local authorities and efficient management and reporting can deliver improvements and help to identify trends in service provision. Although some work has been done by the Cumbrian authorities in the area of data management and reporting, this report has identified the need to more accurately report waste data by specific waste streams;
• It is a conclusion of this study that the effect of tourism is potentially a significant contributing factor for high household waste arisings. Waste arising from tourist activity can enter the household waste stream via a number of routes however the most likely are waste arising from B&B’s (which can be classified as domestic waste) and the high number of ‘second homes’ in the county (second homes/holiday homes account for 3% of all properties in Cumbria). The steady year on year growth in household waste arisings in Cumbria from 2000 to 2005 shows a very similar trend to the increases in tourism over the same period, suggesting a relationship between tourism and household waste arisings;
• In 2005/6 authorities in Cumbria used a conversion factor of 0.061 kg/l for the calculation of the trade element of co-collected trade and domestic waste across the county. Analysis of comparative authorities and the results of weighing exercises undertaken by Cumbrian authorities suggest that this standard weight is low, therefore overestimating the domestic portion of the waste stream. By applying a different standard weight to the reported 2005/6 trade waste tonnages it can be seen that the effect on BVPI 84a is significant. If the standard weight of 0.106 kg/l had been used in 2005/6, the effect on BVPI 84a would have been a reduction of between 17.8 kg/person/year (3.8%) in Copeland and 57.8 kg/person/year (11.8%) in Allerdale. This equates to a reduction of approximately 3.4% (based on 2005/6 figures) in the county’s BVPI 84a;
• A number of studies have suggested that the introduction of centralised composting supported by garden waste collections can increase household waste arisings. Analysis of waste arisings and garden waste collection provision for Cumbria and its ‘nearest neighbours’ suggests that those authorities performing ‘very well’ in BVPI 84a do not offer the same level of service for garden waste collections. The analysis suggests that authorities with a high coverage and roll-out of a garden waste collection can adversely affect BVPI 84a performance. During 2005/6, garden waste collections were offered to approximately 66.2% of households in Cumbria. This compares with Gloucestershire, Norfolk and Derbyshire (the three best performing ‘nearest neighbours’ for BVPI 84a) who have garden waste scheme roll-outs of 51.2%, 14.0% and 49.2% respectively;

C r e a t i n g t h e e n v i r o n m e n t f o r b u s i n e s s
© Entec UK Limited
Doc Reg No. 20002 Page 89
April 2007
• The density and provision of HWRCs seems to be a large factor in household waste arisings. Relationships have been identified between the number of sites per 100,000 people, and per hectare of land with HWRC arisings;
• The lack of restrictions and control policies at HWRCs in Cumbria could be attracting a disproportionately high level of trade waste abuse and cross boundary usage. Cumbria has recently introduced a permit scheme to reduce illegal site usage.

C r e a t i n g t h e e n v i r o n m e n t f o r b u s i n e s s
© Entec UK Limited
Doc Reg No. 20002 Page 90
April 2007
C r e a t i n g t h e e n v i r o n m e n t f o r b u s i n e s s
© Entec UK Limited
Doc Reg No. 20002 Page 91
April 2007
11. Recommendations
This desk based study has given an insight into possible reasons why Cumbria and Cheshire have high BVPI 84a figures. Data analysis has been conducted on the most recent complete data set (2005/6 waste arisings) reported to WasteDataFlow. A short list of recommendations has been made.
• Reporting of data and entry into WasteDataFlow should be reviewed in the light of the apparent discrepancies identified within this study;
• This analysis has been carried out at a high level, analysing district and county waste arisings. An analysis of waste tonnage data by specific geographic areas or on a round by round basis may identify the areas where arisings are high and further, in-depth analysis could be carried out. Analysis of arisings at a county and district level is broad and relationships between socio-demographics and waste generation may be blurred by the size of the sample and geographic differences across districts;
• Cumbria has recently completed a series of weighing exercises to determine the ‘standard weight’ of trade waste in co-collected trade and domestic collections. It is advisable for Cheshire to conduct a similar exercise and to update their standard bin weight. The use of a low standard weight for trade waste collections is having a significant detrimental effect on BVPI 84a performance for both Cheshire and Cumbria;
• Regular recalibration exercises should be carried out to ensure that the standard weights used for the calculation of trade waste tonnages are accurate. These weighing exercises should capture differences in waste arisings from different establishments and during different times of the year. This will become more acute as trade customers are encouraged to minimise their waste for disposal following the escalation of the landfill tax;
• The County should investigate the possibility of ‘on-board’ vehicle weighing systems for accurate calculation of trade waste tonnages;
• Household waste and recycling centres were identified as areas where both Cheshire and Cumbria report higher than average arisings. During 2005/6 (the period for which this data was applicable) neither Cumbria nor Cheshire enforced HWRC control policies. However, since then both authorities have introduced control measures at HWRCs and reductions in HWRC tonnages have been reported. Further work and data analysis is required to fully capture and understand the effect of control measures at HWRCs and the effect this has had on BVPI 84a.

C r e a t i n g t h e e n v i r o n m e n t f o r b u s i n e s s
© Entec UK Limited
Doc Reg No. 20002 Page 92
April 2007

C r e a t i n g t h e e n v i r o n m e n t f o r b u s i n e s s
Doc Reg No. 20002
Appendix A 1 of 4 April 2007
Appendix A Regression Analysis Definitions
C r e a t i n g t h e e n v i r o n m e n t f o r b u s i n e s s
Doc Reg No. 20002
Appendix A 2 of 4 April 2007
C r e a t i n g t h e e n v i r o n m e n t f o r b u s i n e s s
Doc Reg No. 20002
Appendix A 3 of 4 April 2007
Use of Statistics This report has used a number of charts to display data and attempt to identify trends in that data. This section provides a summary and definitions of the type of regression analysis as used in a number of charts within this report.
The Regression Equation. A line in a two dimensional or two-variable space is defined by the equation Y=a+b*X; in full text: the Y variable can be expressed in terms of a constant (a) and a slope (b) times the X variable. The constant is also referred to as the intercept, and the slope as the regression coefficient or B coefficient.
Residual Variance and R-square. The smaller the variability of the residual values around the regression line relative to the overall variability, the better is a prediction. For example, if there is no relationship between the X and Y variables, then the ratio of the residual variability of the Y variable to the original variance is equal to 1.0. If X and Y are perfectly related then there is no residual variance and the ratio of variance would be 0.0. In most cases, the ratio would fall somewhere between these extremes, that is, between 0.0 and 1.0. 1.0 minus this ratio is referred to as R-square or the coefficient of determination. This value is immediately interpretable in the following manner. If we have an R-square of 0.4 then we know that the variability of the Y values around the regression line is 1-0.4 times the original variance; in other words we have explained 40% of the original variability, and are left with 60% residual variability. Ideally, we would like to explain most if not all of the original variability. The R-square value is an indicator of how well the model fits the data (e.g., an R-square close to 1.0 indicates that we have accounted for almost all of the variability with the variables specified in the model).
Interpreting the Correlation Coefficient R. Customarily, the degree to which two or more predictors (independent or X variables) are related to the dependent (Y) variable is expressed in the correlation coefficient R, which is the square root of R-square. In multiple regression, R can assume values between 0 and 1. To interpret the direction of the relationship between variables, one looks at the signs (plus or minus) of the regression or B coefficients. If a B coefficient is positive, then the relationship of this variable with the dependent variable is positive (e.g., the greater the IQ the better the grade point average); if the B coefficient is negative then the relationship is negative (e.g., the lower the class size the better the average test scores). Of course, if the B coefficient is equal to 0 then there is no relationship between the variables.
The Importance of Residual Analysis. Even though most assumptions of multiple regression cannot be tested explicitly, gross violations can be detected and should be dealt with appropriately. In particular outliers (i.e., extreme cases) can seriously bias the results by "pulling" or "pushing" the regression line in a particular direction, thereby leading to biased regression coefficients. Often, excluding just a single extreme case can yield a completely different set of results.

C r e a t i n g t h e e n v i r o n m e n t f o r b u s i n e s s
Doc Reg No. 20002
Appendix A 4 of 4 April 2007