culture as a consequence: a multi-level multivariate meta
TRANSCRIPT
Culture as a consequence: A multi-level multivariate meta-analysis of the effects of individual and
country characteristics on work-related cultural values
By: Piers Steel, and Vasyl Taras
Taras, V. & P. Steel. (2010). Culture as a Consequence: A Multilevel Multivariate Meta-Analysis of the Effects
of Individual and Country Characteristics on Work-Related Cultural Values. Journal of International
Management. 16(3): 211-233.
Made available courtesy of Elsevier: http://www.elsevier.com
***Reprinted with permission. No further reproduction is authorized without written permission from
Elsevier. This version of the document is not the version of record. Figures and/or pictures may be
missing from this format of the document.***
Abstract:
Culture as a consequence is a neglected topic. Addressing this, we explore what factors are related to and
potentially shape culture, what explains cultural variations within countries, and what the relationship is
between cultural values at the individual and national levels. To answer these questions, we use a multi-level
multivariate meta-analysis of 508 studies. The findings indicate that national and individual cultural values may
be determined by the micro characteristics of age, gender, education, and socio-economic status as well as the
macro characteristics of wealth and freedom. This provides a basis for explaining cultural change, both at the
individual and national levels. Also, up to 90% of the variance in cultural values is found to reside within
countries, stressing that national averages poorly represent specific individuals.
Keywords: Culture, Explaining culture, Cultural change, Meta-analysis, HLM
Article:
Over the last several decades, culture's consequences have received an explosion of interest in fields ranging
from psychology and education to accounting and marketing. Culture has been shown to affect virtually every
aspect of social and organizational life (e.g., Gelfand et al., 2007; Kirkman et al., 2006; Taras et al., 2010; Tsui
et al., 2007; Werner, 2002). Unfortunately, with the prime focus on culture's consequences, culture as a
consequence has not been given much attention. Following Hofstede's (1980) paradigm, it has become
traditional to view culture as a cause, but rarely as an effect. Cultural values at both the national and individual
levels have typically been assumed to be extremely stable and thus studying factors shaping culture have been
deemed unjustifiable. It has been the dominant view that national cultures have been formed over centuries and
the between-country differences in cultural values are beyond the scope of cross-cultural studies and may only
be explained, if explainable at all, through a comprehensive historical analysis (Hofstede, 2001). Although
substantial within-country variations and changes in cultures have been well documented, these issues have
been rarely, and usually indirectly, addressed in mainstream comparative studies.
The purpose of the present study is to explain the causes and nature of within and between-country variations in
culture, and so we shift the focus from culture's consequence to culture as a consequence. Based on the results
of a multi-level multivariate meta-analysis, we show that personal cultural values and national cultures are
likely to be shaped by a variety of individual and country level factors. We also show that the strength and
direction of some of the relationships are moderated by country characteristics. Our findings provide a basis for
an analysis of cultural change and highlight yet again the problem of assuming the extreme stability of national
cultures and the limitations of relying on geographical boundaries when studying cultures. We also discuss
implications of our findings and offer directions for future cross-cultural research.
1. Where are we now in cross-cultural studies?
The beginning of the cross-cultural era in social sciences can be traced back to Hofstede's (1980) ―Culture's
Consequences.‖ Although models of value structure had been offered earlier (e.g., England, 1967; Kluckhohn
and Strodtbeck, 1961; Rokeach, 1973), Hofstede was the first one to conduct value comparison across countries
using a large international sample. The resulting set of quantitative indices described and ranked countries along
several cultural dimensions making it easy to operationalize culture and include it as a variable in various
analyses and offering a way for direct cross-national cultural comparisons. Following Hofstede's (1980) IBM
study, several teams of scholars conducted their own large-scale culture comparison studies (e.g., House et al.,
2004; Maznevski and DiStefano, 1995; Schwartz, 1994a; Trompenaars, 1993). As in the case with Hofstede's
IBM study, the main outcome of these subsequent studies was a set of national scores and mean-based rankings
of countries along cultural dimensions with the prime focus on the national ―average‖ cultural values.
The impact of Hofstede's ―Culture's Consequences‖ is indisputable. According to the Web of Science, the book
has been cited almost five thousand times, and the figures are twice that based on Google Scholar, with
hundreds of citations annually even decades after the book was first published. Despite frequent concerns, by
and large, the field of cross-cultural studies has been developing under the ―Hofstedean‖ paradigm that is based
on the following four assumptions: i) Culture is the cause, not the effect, ii) Geographic boundaries are
appropriate for clustering cultures, iii) Matched samples should be used to study cultural differences, and iv)
The ecological fallacy consistently prevents cross-level inference. Each of these assumptions is questioned in
turn.
1. 1. Culture is the cause, not the effect
As evident from numerous reviews of cross-cultural studies (Gelfand et al., 2007; Kirkman et al., 2006; Ricks et
al., 1990; Schaffer and Riordan, 2003; Sondergaard, 1994; Taras et al., 2010; Tsui et al., 2007; Werner, 2002),
culture as a cause has been the almost exclusive focus of cross-cultural scholars. Recent comprehensive reviews
by Kirkman et al. (2006) and by Tsui et al. (2007) reflect this general trend of viewing culture exclusively as a
cause and never as an effect very well. Each review classified cross-cultural studies into Type I and Type II,
with Type I being studies that investigated the main effect of culture on various outcomes and Type II being
studies that explored the moderating effect of culture. Studies that explored the predictors of culture were so
few or non-existent that they were not even mentioned in either of the reviews.
Although numerous studies have shown a strong relationship between wealth and cultural values, at both
individual and national levels, in terms of causality, it has been traditionally assumed that culture is the root of
economic performance and not vice versa (e.g., Franke et al., 1991; Hofstede, 1980; Offermann and Hellmann,
1997; Sebhatu, 1994). Because it has been generally taken for granted that culture is extremely stable, cultural
determinism has dominated cross-cultural research (Ricks et al., 1990). These views are largely rooted in
Hofstede's work. As predicted by Hofstede (2001), national cultures should not change substantially ―until at
least 2100‖ (p. 36). Similarly, the common assumption that individual cultural values are formed in early
childhood and remain unchanged throughout one's life echoes Hofstede et al.'s (1990) suggestion that ―by the
time a child is ten, most of his or her basic values are probably programmed into his or her mind‖ (p. 312).
Under the cultural stability paradigm, economic, political and social phenomena, as well as individual attitudes,
beliefs and behaviors are believed to be culturally determined. However, considerable empirical evidence
clearly indicates that cultures do change much more often and rapidly than previously thought (Adams, 2005;
Inglehart and Welzel, 2005; Taras and Steel, 2006). This leaves many previous correlations with culture open to
debate regarding causation. The causal arrow may be reversed in direction or, as Erez and Gati (2004) suggest,
bi-directional. Furthermore, there are a variety of theories that indicate how cultures may be caused.
As with any other process or state, cultural patterns necessarily have their underlying causes, even though the
links may not be obvious. If two societies' cultural patterns are unlike, this divergence must be caused by some
factor(s) that exists in different degrees between these two populations. For example, Asians tend to value
family ties more than North Americans and this indicates family-related values hinge on a mechanism that is
more prevalent in Asia than in North America. What is the nature of these causal factors? These cultural
patterns can be either transmitted or evoked. Culture transmission usually occurs via instruction or imitation
(Fessler, 2006), though there has also been some controversial research into the genetic basis of transmission of
behavioral and perceptual patterns (e.g., Roy, 1995; Turkheimer, 2000). Alternatively, cultural behaviors and
attitudes could be evoked by the macro and micro environment in which individuals function. Such macro-
environmental characteristics as economy, political system, climate, or availability of natural resources and
micro-environmental factors as socio-economic and marital status, education level, or important individual
experiences can be the underlying reasons for certain cultural patterns. While we usually see transmission and
evoking as mutually exclusive mechanisms explaining existence of certain cultural patterns, Heine and
Norenzayan (2006) point out the two represent a continuum rather than a dichotomy. That is, cultural patterns
may differ in degree to which they were transmitted versus evoked, being entirely innately prepared and passed
on from generation to generation on one extreme versus entirely evoked by environment and events on the other
extreme. In most cases, it is probably a combination of the two.
The transmitted-versus-evoked culture pattern typology is similar to the permanent trait versus temporary state
typology of psychological and physiological characteristics. However, transmitted cultural patterns are not
necessarily permanent as they can mute or disappear in response to changes in environment or individual
characteristics. For example, cultural practices and beliefs learned in the years of childhood and youth are often
abandoned following immigration (Taras, 2008). Similarly, evoked cultural elements may be remarkably
enduring even long after the underlying causes have been removed. For instance, the tradition of honor in the
U.S. South, formed in the turbulent centuries when the region was predominantly settled by Scotch Irish herders
who had to rely on being tough and aggressive to survive in circumstances when wealth (herd) could be easily
stolen, still flourishes in this now industrialized region (Nisbett and Cohen, 1996).
The model of evoked versus transmitted culture patterns, popular in social psychology, relates to the theories of
cultural ―Divergence‖ versus ―Convergence‖ that are popular in sociology and business literature and can be
traced back as far as Marx's ―Das Kapital‖ (Marx, 1867). The Divergence theory assumes that culture is
remarkably immutable and thus it predicts that cultural differences formed in ancients times will endure
regardless of economic and political changes and globalization. In contrast, the Convergence paradigm (aka
Modernization theory), suggests that as industrial, economic, and political sectors ―modernize,‖ there will be
convergence around a set of universal values and practices. Essentially, the Divergence view is similar to the
notion of transmitted culture, while the Convergence view is based on the notion of evoked cultural changes.
Most cultural differences are probably a result of the interplay of the two forces. Ralston et al. (1997) labels
such partial convergence ―crossvergence.‖ Although the considerable heterogeneity among societal cultures
supports the Divergence view, a rapidly growing body of literature provides support for the Modernization/
Convergence theory, both theoretically (e.g., Bell, 1973; Eisenstadt, 1973; Kerr et al., 1960; Webber, 1969) and
empirically (e.g., Adams, 2005; Inglehart and Baker, 2000; Inglehart and Welzel, 2005; Ralston et al., 1997).
Differences in environment and experiences are the foundation of the evoked culture view. Cultural behaviors
and values grow within physical and social niches. A variety of cultural patterns develops either because
different environments select different representatives with certain cultural traits, or because given cultural
patterns are expressed dissimilarly in different environments (Cohen, 2001). For example, if historically
foraging or hunting success is limited or varies substantially (i.e., feast and famine), societies likely evolve
egalitarian with in-group norms for sharing food and other resources, while this is not the case in societies
where food supply is relatively stable (Tooby and Cosmides, 1992).
The role of environment in cultural pattern development has been also confirmed in experimental studies. For
example, people from Western individualist cultures have been shown to lean towards an analytical way of
thinking, (i.e., focusing on the objects) while people from Asian collectivist cultures tend to perceive the world
holistically (i.e., focus primarily on context and the relationship between objects; Masuda and Nisbett, 2001).
Miyamoto et al. (2006) suggested that the difference can be evoked by differences in environments. In a series
of experiments they showed that priming with Japanese versus American environmental images evokes holistic
versus analytical perceptual thinking providing support for the argument that differences in surroundings
prompt culturally specific patterns of attention.

Given that cultures have been observed to change and that there is a supporting explanatory framework, a solid
foundation for exploring culture as a consequence has been laid. What remains is to determine what causes of
culture has been activated to account for the changes already observed.
1.2. Geographic boundaries are appropriate for clustering cultures
Hofstede (1993) defined culture as ―the collective programming of the mind that distinguished one group or
category of people from another‖ (p. 89). In his work, the groups or categories were countries and their cultures
were described by national averages. The result of almost all subsequent cross-cultural comparison studies has
also been a set of national cultural indices and rankings.
Still, many scholars recognized substantial within-country variation in cultural values, likely influenced by
factors other than geography, such as demographic, language, and ethnicity (e.g., Au, 1999; Huo and Randall,
1991; P. B. Smith and Bond, 1999). However, the issue has been usually addressed by refining geographic
borders only and offering separate scores for different geographic regions within countries (e.g., House et al.,
2004; Huo and Randall, 1991; Maznevski and DiStefano, 1995; Ralston et al., 1996; Vandello and Cohen,
1999). Typically, the way the issue has been taken by the mainstream comparative research can be illustrated by
Hofstede's (2002) response to McSweeney's (2002) criticism: ―[nations] are usually the only kind of units
available for comparison and better than nothing‖ (p. 2).
Furthermore, the dominance of the geography-based clustering of cultures has led to some potential misuse. At
the individual level, assumptions about one's cultural values have been frequently made based on one's country
of origin. For example, based on a review of 210 cross-cultural studies published between 1995 and 200 1,
Schaffer and Riordan (2003) found that in 79% of the cases nationality or country of residence was used as a
proxy for culture. When working on this meta-analysis, we also found numerous instances when one's
nationality is equated to one's cultural values, represented by such phrases as: ―cultural background was
measured by the current citizenship (passport status) of each of the managers‖ (Offermann and Hellmann, 1997,
p. 346); ―individualism–collectivism was operationalized by the respondent's native culture‖ (Trubisky et al.,
1991, p. 73); ―participants were divided into high and low power distance groups by county-of-origin‖ (Eylon
and Au, 1999, p. 378); ―on the basis of their Hofstede country index, the subjects were divided into high and
low PD [power distance] and IND [individualism] groups‖ (Bochner and Hesketh, 1994, p. 233). Consequently,
as Oyserman et al. (2002) conclude, ―Lack of empirical support for these assumptions [assuming national
cultural averages represents the individual] makes this approach vulnerable to criticism‖ (p. 7). Certainly, if the
focus of the study is on how well national culture alone can predict, this is an acceptable methodology.
Unfortunately, this is typically not the case and thus the degree that national culture can represent the individual
should be more closely examined.
1.3. Matched samples should be used to study cultural differences
Matched samples are an implicit recognition that individual characteristics can affect culture and not the other
way around. It is done by ensuring that key demographic variables remain constant from country to country. For
example, it would be inadvisable to contrast national cultures by comparing samples of wealthy people from
one country to a sample of relatively poor people from another country, as it would be difficult to determine
whether the differences in cultural values are due to national or socio-economic differences (Hofstede, 2001,
2002; Kolman et al., 2003).
Still, the use of matched samples does not entirely eliminate the problem of individual characteristics. Often we
want to generalize our national level data to the nation at large. We might do this when we correlate national
culture with other truly representative national data, such as GDP per capita. Unfortunately, matched sampling
may lead to poor generalizability and provide results that are meaningless for many cross-national comparisons.
For example, as noted by Schwartz (1994a), highly educated well-paid IBM employees' ability to represent the
general population likely differs from country to country, with the discrepancy probably being ―greater, for
example, in the Third World nations (e.g., El Salvador, Pakistan) than in industrialized Western nations (e.g.,
Switzerland, United States)‖ (p. 91).
Similarly, Oyserman et al. (2002) investigated whether sample characteristics were a moderator during a very
comprehensive investigation of individualism. Indeed, they found that ―using undergraduates clearly limits
generalizability to other segments of society‖ (p. 6). Unfortunately, their ability to investigate much further was
limited by ―the paucity of research‖ (p. 41). Consequently, if we want national cultural averages to represent the
entire nation, we need to investigate more closely how sample characteristics generalize to the populations they
represent and affect cultural scores.
1.4. Cross-level inference is inappropriate as it leads to ecological fallacy
The ecological fallacy is the inappropriate generalization of relationships observed at the group level to that of
the individual and has long been the ―hobgoblin‖ of national-level research, particularly since Robinson's
(1950) scathing critique, despite earlier work (e.g., Thorndike, 1939). Similarly, Hofstede (2001) warns about
the reversed ecological fallacy, also called the atomistic or individualistic fallacy (Diez-Roux, 1998), which is
explaining group-level phenomena using findings from the individual level of analysis. The fear of committing
these fallacies has almost precluded any attempts at ecological inference, that is bridging levels of analysis in
cross-cultural studies (Jargowsky, 2004; Schwartz, 1994b).
Fortunately, our understanding of the ecological fallacy has advanced considerably since Robinson (1950). As
Jargowsky's (2004) reviews, ―the ‗ecological fallacy‘ has lost some of its sting, and should not cause
researchers to abandon aggregate data‖ (p. 721). Ironically, for example, the deviation between individual and
group-level results in Robinson's own examples were later shown by Hanushek et al. (1974) to be simply due to
model misspecification. Here we review two promising avenues that permit ecological inference.
To begin with, Hierarchical Linear Modeling (HLM) provides a formal way of achieving ecological inference,
provided you have data at multiple levels of analysis. Essentially, it allows us to statistically determine how
variance is accounted for at micro (individual), meso (group or organization), and macro (nation) levels as well
as interactions between levels (Raudenbush and Bryk, 2002). HLM is already a staple in the study of health and
disease (Blakely & Woodward, 2000) and is becoming increasingly popular for cross-cultural research (e.g.,
Cheung and Au, 2005; Fischer et al., 2005). Unfortunately, cross-cultural data is often available only at the
macro level, limiting the use of this powerful technique.
Alternatively, Jargowsky (2004) mathematically establishes under what circumstances ecological inference is
possible with group-level data. Given a properly specified model, the ecological fallacy should not occur if the
grouping is based on random sampling or based on a predictor (e.g., if you are investigating the effects of sex
and create two groups exclusively of either men or women). For example, we do this regularly when we
conduct t-tests, one of the most basic of statistical procedures. Using group-level summary statistics, means and
standard deviations, we draw conclusions about average differences between individuals within these groups.
Unfortunately, at a national level, we are grouping by geography, which does make ecological inferences
problematic. As Hofstede (2001) contends, institutions, in particular ―the family, educational systems, political
systems, and legislation‖ (p. 11) are the primary cause of cultural stability. Consequently, cultural averages are
a combination of individual effects plus national effects, which creates a potential problem. The addition of
national effects may obscure individual effects, possibly enhancing, erasing or reversing it. Again, it is
important to not overstate the phenomenon—it is only a threat to validity, not a necessary or perhaps even
common confound.
Ecological inference looks much more promising with meso data, which is group level but within nation. For
example, this would include college students or employees of an organization. There are two advantages. First,
if most group effects occur at the national level, as typically contended (e.g., Hofstede, 2001), then we can
control for that by examining groups within nations. By definition, national-level culture is constant within a
nation and does not affect within-nation comparisons. Second, if grouping protocols within a nation do
substantively affect scores (e.g., by assessing strong subcultures), typically it will only add random error to
ecological inference. Random error is the default assumption in scientific investigation (i.e., it is the null
hypothesis), which indicates that the effects of grouping should be inconsistent. Furthermore, this is
increasingly likely if the groups are created by a broad variety of independent researchers, not as part of a
systematic research program. Given its unsystematic nature, each grouping protocol will have a random effect.
Consequently, using meso data should closely replicate individual level relationships. They may be reduced in
strength, but there is not a cogent plausible argument why spurious ones would be created. This is consistent
with Steel and Ones' (2002) review, who report that analysis of the individual and the group typically provides
substantially similar results (e.g., Jones and James, 1979).
Finally, it should be emphasized that model specification is desired for both individual and group-level
estimation. To the extent we typically specify individual level relationships, we should also specify group level,
but unless we are biased in our preference for individual level analysis, we need not exceed such specification.
Furthermore, it has often been noted that group-level analysis can solve specification problems. For example,
―as a result of the grouping operation, one may have controlled for the effects of other variables, making the
ecological estimate less biased than the individual estimate‖ (Schwartz, 1994b, pp. 819–820). Also, ―aggregate
data may be better than individual data for testing hypotheses, even if those hypotheses are about individual
behaviour‖ (Jargowsky, 2004, p. 721). Consequently, we should be careful not to give a blanket condemnation
of ecological inference, and we should be aware that its validity can be equivalent to an individual level analysis
or even superior.
2. The study
Despite prior criticism, these four assumptions have dominated the field of cross-cultural studies for decades.
Our study further challenges them and offers alternative viewpoints and methodologies. First of all, we confront
the ―culture's consequences‖ paradigm and approach culture as an effect, not as a cause. Although our study,
being cross-sectional in nature, does not allow for a proper test of causality, it sheds some light on the factors
that likely shape individual and national cultural values. We take a similar approach as Roberts et al. (2006)
when they meta-analytically studied personality mean scores. As they note, ―one distinct advantage of a meta-
analytic approach is the opportunity to test potential moderators of changes in personality traits‖ (p. 4), such as
the effects of sex and cohort (i.e., year when person was born) on personality means.
Second, our meta-analytic sample allows for integration of variables representing different levels of
measurement in a single multi-level model. Using HLM, we simultaneously assess the relationships of country
characteristics (i.e., macro level) and sample characteristics (i.e., meso level) with national culture and sample
cultural values. As previously argued, ecological inference is allowable under these conditions, permitting us to
extend the meso-level findings down to the micro-level; that is, from sample characteristics down to the
individual level. This is consistent with Roberts et al.'s (2006) methodology, who generalized from the group to
the individual both in terms of hypothesis generation and in the interpretation of their results.
Third, we do not seek matched samples representing different national-level units (countries). On the contrary,
considerable variance in characteristics of respondents (independent variables) is a necessary condition in HLM
for assessment of the effects of these characteristics on individual cultural values (dependent variables).
Our analyses are conducted along the four original value dimensions of culture introduced by Hofstede (1980),
though it should be acknowledged that this is not the definitive model of culture. Culture is a multi-level
construct with values representing the core level and behaviors, traditions, and artifacts representing the outer
levels (e.g., House et al., 2004; Maznevski and DiStefano, 1995; Schwartz, 1994a; Trompenaars, 1993). Still,
values are the focus of most models of culture, as values are believed to govern individual behavior. Also,
Hofstede's model of culture has been extremely popular and his Value Survey Module and its variations have
been used in numerous subsequent studies providing a great pool of data for a meta-analysis. Although
Hofstede's IBM study has been criticized for its research design, sample and, recently, the age of the data
(Baskerville, 2003; Goodstein, 1981; McSweeney, 2002), the model has generally been well-validated by
numerous subsequent studies.

Because the cultural dimensions have been defined rather broadly in Hofstede's (1980, 2001) own work and the
terminology has been used quite inconsistently by subsequent scholars, to avoid confusion we provide our
working definitions of the cultural dimensions.
Power distance is the extent to which [people] in a society accept inequality in power and consider it as normal
(Hofstede, 1986, p. 307). Alternatively, it is the extent to which subordinates are not expected to express
disagreement with their supervisors and the supervisors are not expected to consult with their subordinates in
the decision-making process (Hofstede, 1980, 2001).
Individualism is the degree to which people in a country prefer to act as individuals rather than as members of
groups (Hofstede, 1994, p. 6). Individualist cultures assume that any person looks primarily after his/her own
interest and the interest of his/her immediate family (husband, wife, and children). Collectivist cultures assume
that any person belongs to one or more tight ―in-groups,‖ from which he/she cannot detach him/herself. The in-
group (whether extended family, clan, or organization) protects the interest of its members, but in turn expects
their permanent loyalty (Hofstede, 1986, p. 307).
Masculinity and its opposite femininity are defined as the degree to which masculine values such as
advancement, earnings, training, up-to-datedness and such feminine values as friendly atmosphere, position
security, physical conditions, [and] cooperation are valued (Hofstede, 2001, p. 281) and as the degree to which
values like assertiveness, performance, success and competition [ ... ] prevail over values like the quality of life,
maintaining warm personal relationships, service, care for the weak, and solidarity (Hofstede, 1994, p. 6).
Uncertainty avoidance defines the extent to which people are made nervous by situations which they perceive as
unstructured, unclear, or unpredictable. These are situations that they try to avoid by maintaining strict codes of
behavior and a belief in absolute truth (Hofstede, 1986, p. 308). Uncertainty avoidance should not be confused
with risk-avoidance (Hofstede, 2001, p. 145). It does not describe one's willingness to take or avoid risk, but
rather is associated with preferences for clear rules and guidance (Hofstede, 2001, p. 149).
3. The model and hypotheses
Because culture is a shared construct by definition, it is normally analyzed in relation to groups. Nevertheless, it
is the individuals who are carriers of culture. A group (organizational, national) culture is essentially a
derivative of individual cultural patterns. Normally, group cultures are described as values prevailing among
individuals comprising the group, with group averages along cultural dimensions being the most popular
quantitative method of measuring group cultures. As typically assessed, culture is a bottom-up phenomenon
where values of individuals in the group form a group culture. Thus, to understand national culture, individuals'
values should be considered first.
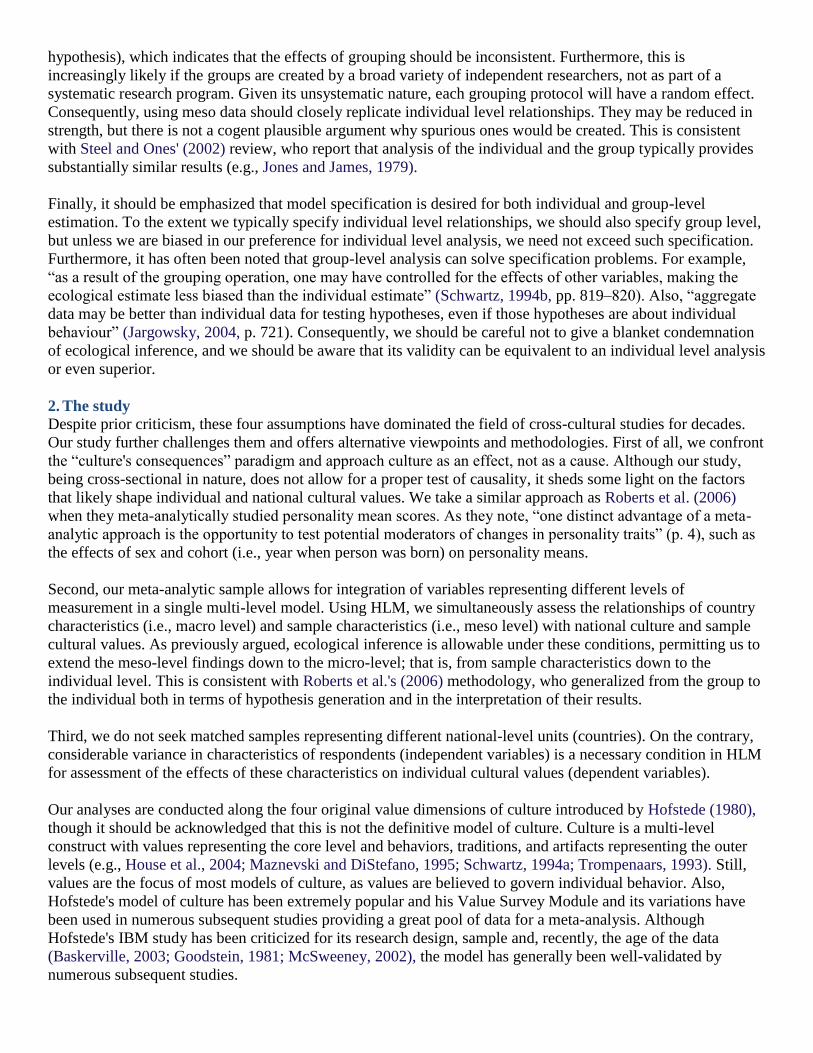
The key feature of our model of culture is its hierarchical structure and culture as the outcome variable. As per
Fig. 1, the model differentiates between individual cultural values and national cultures. Cultural values at both
the individual and country levels are determined by a set of factors that also represent different levels. At the
individual level, the factors are individual characteristics such as gender, age, generation, education level, and
socio-economic status (SES). At the country level, country characteristics such as GDP per capita, economic,
political and civil freedom are hypothesized to affect cultural values.
The arrows on the diagram represent our general research hypotheses. A substantial variation in cultures within
and between countries is a precondition for testing our hypotheses (H0). Our first two general hypotheses state
that individual cultural values are affected by one's individual characteristics (H1) and by the characteristics of
the environment (country) one resides in (H2). It is also hypothesized that national cultures are affected by
country characteristics (H3). Finally, we suggest that the effect of personal characteristics on individual cultural
values is moderated by country characteristics (H4). We do not ask whether and how national culture is related to
individual cultural values. Since national cultural indices are derived by averaging individual scores within a
country, the question is not revealing as inevitably the two will be related.
3.1. Hypothesized effects of individual characteristics (H1)
We consider the effects of socio-economic status, generation, and age on cultural values. Of particular
importance, support for individual level hypotheses further indicates that any relationship between culture and
sample characteristic is due to micro-level processes.
3.1.1. Socio-economic status (SES): (H1a)
Many scholars have hypothesized SES to influence cultural values (e.g., Shah, 2007; Takano and Osaka, 1999).
People closer to the top of societal and organizational hierarchies are more likely to be involved in the decision-
making process and are used to taking initiative. Because their everyday tasks often go beyond simple routines,
they are more habituated to ambiguity and uncertainty. Also, their higher level of income offers them relative
independence and security. On the other hand, people in lower positions are often expected to follow a set of
strict rules and are more likely to be anxious about making a mistake. They can exercise power usually only as a
collective. Due to their lower income level and possible economic insecurity, they depend more on their
superiors and have to rely on their in-groups (relatives, close friends) for survival. The propositions about the
effects of SES on individual values are already supported by some strong empirical evidence. To name a few,
Chen et al. (1997) as well as Lam and Zane (2004) found a positive relationship between SES and individualism
and masculinity. Similarly, Birnbaum-More et al. (1995) and Hofstede (1980) found that higher-status
occupations tend to be associated with lower power distance values and higher uncertainty avoidance.
H1a. Higher socio-economic status will be associated with lower power distance and uncertainty avoidance as
well as higher individualism and masculinity.
3.1.2. Generation: (H1b)
Generation is our next predictor. It is conceptually different from age. Generation indicates when the respondent
was growing up, that is the cohort. Our hypotheses for the generation effects stem from the Modernization (aka
Convergence) theory (Eisenstadt, 1973; Inglehart, 1997; Leung et al., 2005; Webber, 1969) that suggests that as
societies experience industrialization, modernization, and economic growth, they move towards a set of values
typical to industrialized (Western) countries, away from a traditional emphasis on family, respect for authority
and older people, need for security, and other customs and rituals developed over the ages. The empirical
support for this proposition is readily available (e.g., Egri and Ralston, 2004; Heuer et al., 1999; Inglehart and
Baker, 2000; Ralston et al., 1997; Rokeach and Ball-Rokeach, 1989; Strauss and Howe, 1991). As Boehnke et
al. (2002) review, ―value change in Western publics is more or less an automatic consequence of increased
socio-economic prosperity‖ (p. 29).
To this end, a number of studies have shown that people representing later generations tend to score lower on
power distance and uncertainty avoidance and higher on individualism and masculinity (Fernandez et al., 1997;
Huh-Kim, 1999; Hui-Chun and Miller, 2003; Mishra, 1994; Ralston et al., 2006; Thau and Heflin, 1997; Yu and
Miller, 2003).
H1b. Compared to people representing earlier generations, those born in later years will display cultural values
associated with lower power distance, higher individualism and masculinity and lower uncertainty avoidance.
3.1.3. Age: (H1c)
Our hypothesis for age is based on the argument that the young, after being closely overseen by their parents in
their childhood and adolescence, typically value independence and look forward to autonomous lives. However,
as they settle down and become part of a family or group of colleagues, this individualism diminishes. This
proposition has been supported by numerous studies that have found a negative relationship between
individualism and age (Birnbaum-More et al., 1995; Feather, 1975; Mishra, 1994; Steensma et al., 2000;
Thomas and Pekerti, 2003; Yamaguchi, 1994).
H1c. Age will be negatively related to individualism.
3.2. Hypothesized effects of country characteristics
When linking national cultures to country characteristics, Hofstede (1980, 2001) considered a number of factors
such as wealth, geographic latitude and climate, population size and density, and political system. However, his
reasoning mainly revolved around the strong association of wealth and freedom with cultural values, with the
former ones seen as an effect of culture, while the correlations with the rest of the country characteristics are
mediated by these two prime factors. This is also consistent with subsequent research (e.g., Diener and Diener,
1995; House et al., 2004). Hence, we limit our focus to these two main variables. Unfortunately, the high
correlation of.91 between freedom and wealth in our sample, consistent with other research (e.g., Johnson and
Lenartowicz, 1998), is likely to cause multicollinearity, making interpretation of the results difficult. Therefore,
each of our models will contain only one of these predictors, depending on which is the most theoretically
relevant, although each of them is likely to show significant effects if added separately to the regression model.
Consistent with our model (Fig. 1), level 2 hypotheses refer to the relationship that country freedom and wealth
has on the individual cultural values. Level 3 hypotheses refer to the country level relationships between
freedom, wealth, and culture.
3.2. 1. Freedom and culture: (H2a; H3a)
Johnson and Lenartowicz (1998) argue that freedom is most closely related to uncertainty avoidance and
masculinity. High uncertainty avoidance reduces freedom as countries try to introduce measures to increase
their security. This tradeoff between liberty and security is timeless (Rehnquist, 2000), more recently
exemplified by the debate over the PatriotAct in the United States (Waldron, 2003). Similarly, they argue that
feminine societies, with the greater concern for others, would enact more social spending and protective
legislation while masculine societies, with their emphasis on competition, would adopt more libertarian notions
and less regulation. Within the United States, this observation has become a cliché, with the liberal Democrats
referred to as the ―Mommy Party‖ while the conservative Republicans are the ―Daddy‖ (e.g., Leibovich, 2007).
There is mixed support for uncertainty avoidance's and masculinity's relationship with freedom. Focusing on
economic freedom, Johnson and Lenartowicz (1998) themselves only found the relationship with uncertainty
avoidance, though masculinity was trending in the expected direction. Similarly, Hofstede (2001) reports both
cultural dimensions significantly correlating with freedom, but only for wealthy countries. Using the Human
Development Index, which includes as one of its components personal, political and societal freedom, several
studies find freedom is negatively associated with uncertainty avoidance and positively associated with
masculinity (Basabe et al., 2002; Gouveia and Ros, 2000; House et al., 2004).
In addition, power distance and freedom have long been linked, ever since Adam Smith (1937) in the Wealth of
Nations espoused that functioning countries need both equality and freedom. Consistent with this position, high
power distance was negatively associated with the Human Development Index (Basabe et al., 2002; Gouveia
and Ros, 2000; House et al., 2004) as well as the Civil Liberties Index (Steel and Peloza, 2006). Similarly,
Hofstede (2001) reports that the students in high power distance countries tend to indicate that they are ―not
being free to make one's own decisions‖ (p. 93).

H2a. In countries characterized by high freedom, individuals will score low on power distance and uncertainty
avoidance, and high on masculinity.
H3a. Countries characterized by high freedom will have low power distance, low uncertainty avoidance, and
high masculinity national cultures.
3.2.2. Wealth and culture: (H2b; H3b)
The one cultural dimension that clearly is best understood in terms of wealth rather than freedom is
individualism. Hofstede (2001) describes the relationship between the two as ―really remarkable‖ (p. 251) and
goes so far as to posit wealth as a cause of culture rather than as a consequence. He argues that with wealth,
reliance on others reduces, allowing people to ―do their own thing‖ (p. 253), a position he shares with Triandis
(1995). In other words, wealth diminishes one's dependence on the group for survival. Numerous studies tested
the effects of wealth, usually measured by GPD per capita, finding a strong positive relationship with
individualism (e.g., Gouveia and Ros, 2000; Hofstede, 1980; House et al., 2004; Sungkhawan, 2000).
H2b. Wealthy countries will have more individualistic citizens.
H3b. Wealthy countries will be more individualistic.
3.3. Moderation hypotheses
In his book, Hofstede (1980) analyzed the relationships between cultural values, gender, and education.
However, as he states ―gender and occupation are highly interdependent‖ (p. 90). Similarly with age, the
relationships are actually mediated by occupational status. Because in most societies, men and people with more
education are likely to assume higher positions, they are likely to have cultural values similar to those of people
with higher SES. Likely once the effect of SES status is controlled, the effect of gender and education on
cultural values will be minimal. Therefore, we do not hypothesize any general fixed effects for these variables.
However, we believe that interaction effects may be present. That is, the strength and direction of gender on
individual values will be moderated by country characteristics.
3.3. 1. Gender and gender equality: (H4a)
Gender has long been recognized as an important variable for a multitude of investigations (Stewart and
McDermott, 2004). Accordingly, numerous studies have tested whether there is a difference in value scores
between male and female respondents (e.g., Hofstede, 1980; Kashima et al., 1995; Lyons et al., 2005; Stedham
and Yamamura, 2004; Watkins et al., 1998). The results of these studies have been rather mixed for all
dimensions; while some studies found an effect of gender on cultural values along various dimensions, others
found none.
The contradictions can be reconciled by a moderator analysis. One culturally relevant line of inquiry explores
how societal structure creates this gender differentiation. Stedham and Yamamura (2004) argued that when
―economic and societal changes have affected men and women to different degrees, cultural perceptions may
differ for men and women‖ (p. 234). Thus, the effect of gender on culture should be moderated by gender
equality, particularly in the form of education, gender equity legislation, and workforce participation.
Comparing Japan and the United States, two countries with different levels of gender equality, they found
gender differences for power distance only in Japan, which has a shorter history of gender equality.
Similar findings have been obtained in other studies. For example, Simeon et al. (2001) examined when
achievement orientation differed between men and women for three countries of varying gender equality:
China, Japan, and the United States. As expected, China, with the least equality, had the largest differences,
while the United States, with the most equality, had the smallest differences. Birnbaum-More et al. (1995)
found a much stronger relationship between gender and values along all four of Hofstede's (1980) cultural
dimensions in China (a country with distinct gender roles and comparatively lower gender equality), as
compared to Hong Kong (a country with comparatively higher gender equality). A similar moderating effect of
gender role differentiation on the relationship between gender and values has been found in other studies (e.g.,
Chang, 1999; Gibbons et al., 2006).
H4a. The effect of gender on all four types of cultural values will be stronger in the societies characterized by
high gender inequality and will be negligible in the societies characterized by high gender equality.
3.3.2. Education: (H4b)
Hofstede (2001) considers education as one of the institutions that perpetuate culture. As people pass through
the educational system, they are indoctrinated in the existing cultural values, such as through daily pledges of
allegiance (see also Heyneman, 2003; Massialas, 1977; Schein, 1967). As Cheng (1998) states, ―the process of
borrowing educational practices from another society implies an acceptance of cultural values embedded in the
particular practices‖ (p. 14). Consequently, we theorize that more years of formal education will be associated
with a stronger preference for cultural values typical for the society in which the individual has been educated.
For example, we expect that in free societies that tend to promote a low power distance orientation, individuals
with more education are likely to have lower scores on power distance. On the other hand, in countries
characterized by low freedom, more education will be associated with higher power distance orientation, which
is a typical cultural orientation for these countries.
Empirical support for this proposition has been provided in a number of studies. Conway and Nuttgens (2006)
reported a positive effect of education on individualism in the US (individualistic society) and a negative effect
in Japan (collectivistic society). Findings of Schaubroeck et al. (2000) were similar when comparing the US and
Hong Kong. Finally, Birnbaum-More et al. (1995) found empirical support for the moderation model along
power distance, masculinity, and uncertainty avoidance dimensions, though their findings for individualism
were insignificant.
This tendency also explains a finding that Hofstede (1980, 2001) referred to as a ―paradox.‖ At the national
level, Hofstede found a negative correlation between education level and power distance as well as uncertainty
avoidance. That is, countries with greater levels of advanced education, as in Western developed countries,
tended to score lower on power distance and uncertainty avoidance while in countries where education is
typically limited to a few years of basic schooling, such those of Africa or South-East Asia, power distance and
uncertainty avoidance tend to be high. In other words, more education is leads to lower power distance and
uncertainty avoidance. On the other hand, at the individual level, Hofstede found the reverse trend. IBM sample
employees from developing countries were often more educated than their counterparts from IBM offices in
developed countries. However, the higher education level of employees from developing counties did not seem
to lead to lower power distance scores, as one would expect based on general trends for the association between
education and power distance and uncertainty avoidance. The data suggests just the opposite: more educated
IBM employees from developing countries had scores substantially higher on power distance and uncertainty
avoidance than their less educated counterparts from developed countries. Hofstede attributed the paradox to
that ―poorer countries [often have educational systems that offer] extensive but impractical formal schooling‖
(Hofstede, 2001, p. 88) ―with a considerable amount of rote learning‖ (Hofstede, 1980, p. 111). Possibly, but
these findings are also consistent with the proposition that formal education systems are designed to promote
values valued in their societies. If the society stands on the principles of, for example, high power distance and
uncertainty avoidance, the extensive and rote schooling there would lead to only one outcome—further
indoctrination of high power distance and uncertainly avoidance orientation.
H4b. More years of formal education will be associated with a stronger preference for the cultural values typical
for the society the individual lives in.
3.4. Causality
Our previous hypotheses, as does our title ―Culture as a Consequence,‖ indicate causal relationships where
culture is the dependent variable. Though we critiqued the Hofstedian paradigm as insisting that culture is
always the cause, we must also reflect on our own contention, that culture is caused. To show causality, direct
experimental manipulation is preferred, though there are many cases where such manipulation is impossible or
unethical (Chow and Chow, 1992; Lykken, 1991). Culture is one of these cases as the ubiquitous cross-sectional
research design makes it more difficult to establish the direction of causality. Fortunately, three of our variables
– gender, age, and generation – cannot be manipulated, meaning they can't be an effect and can only be a cause.
Culture can't determine, for example, whether you are a man or a woman. The causal status of the remaining
variables can also be buttressed, aside from the explanation provided when we reviewed the relevant hypotheses
(e.g., Hofstede himself concluded that wealth affects individualism). By examining what could theoretically
affect culture, we can determine if these variables have the requisite characteristics.
Building on the typology described by Heine and Norenzayan (2006), culture pattern roots can be temporally
distal or proximal. Examples of distal roots leading to culturally stable patterns are archaic historic events and
conditions, climate, availability of natural resources, or geographic location. Examples of proximal factors are
current economic and political conditions, individual experiences with the world, knowledge, or socio-
economic status. Given that proximal factors can change rather rapidly, usually in a matter of years and
sometimes months or even days, it is reasonable to assume that it is the proximal environmental characteristics
that affect culture, and not vice versa. Consider the recent economic growth and reported cultural changes in
Asia (Shah, 2007). While the two processes may interplay and affect each other, the dominant direction should
be that the changing economy affects culture and not vice-versa.
The constructs considered in our hypotheses (e.g., national wealth and freedom, individual education level and
socio-economic status) are all proximal as they relate to most recent events and relatively fast changing
conditions. For example, most countries in our sample have experienced substantial economic and political
changes within the past few decades. Similarly, individual education level and socio-economic status are also
changing in a matter of years. So, while additional research with longitudinal or experimental design may be
necessary to definitively establish the direction of the causality among these constructs included in our
hypotheses, there is a fairly strong theoretical base that supports our ―culture as a consequence‖ model.
4. Method
4. 1. Literature search for data
The hypotheses were tested using a meta-analytic sample. Studies that used Hofstede's model and contained
original data describing the cultural values of their participants were included. All available sources were
searched for relevant studies. First, a computer search was done through the EBSCO, PsycINFO, ERIC,
ProQuest, and ProQuest Digital Dissertations electronic databases. Second, searches of all relevant journals for
the 1980–2006 period (or since the journal was introduced) were conducted. Third, major books on cross-
cultural studies (e.g. Hofstede, 2001; Hui, 1984; Kim et al., 1994; Triandis, 1995) and reviews of Hofstede's
work (e.g., Bond, 2002; Dorfman and Howell, 1988; Fernandez et al., 1997; Harvey, 1997; Sondergaard, 1994;
Williamson, 2002) were examined for links to studies containing data that could be used for the meta-analysis.
Fourth, the reference sections of each article being coded were reviewed for links to publications potentially
containing data for the meta-analysis. Fifth, requests for links to more studies were sent out through mailing list
servers of the Academy of International Business and the International Management Division of the Academy
of Management.
Review of the papers revealed that some of the studies were based on survey instruments similar to that of
Hofstede's but no codable data was reported in the papers. Therefore, 58 authors of 47 papers were contacted
and asked for additional data. Forty nine authors replied, though only 37 of them provided the requested data.
Finally, all scholars who were authors or co-authors of three or more papers in our database were identified as
leaders in the field and were contacted with a request for links to more published or unpublished studies. The
pool included 33 researchers from all around the world, 28 of whom replied and provided additional references.
The final pool contained 508 empirical articles, master's and doctoral theses, conference proceedings and
unpublished studies.
4.2. Inclusion criteria
A common challenge in meta-analysis is that we rarely are summarizing identical papers. Studies are usually
different in terms of sample, methodology, or metric. If the studies are substantively different, aggregation
becomes questionable as it leads to results that, as Hunter and Schmidt (1990) put it, ―are difficult or impossible
to interpret‖ (p. 481). This is known as the commensurability or ―apples and oranges‖ problem (e.g., Sharpe,
1997), as differences in method may unduly account for any observed variation in the results (Kenny and
Zautra, 2001). At the same time, an exclusion of a study that is only slightly different from the original
instrument is inappropriate. Minor modifications are unlikely to lead to a substantial alteration of the construct
or its psychometric properties.
A meta-analysis of Hofstede's dimensions does provide some challenges regarding commensurability
(Oyserman et al., 2002), though relatively minor when compared to the analogous field of personality (Hogan et
al., 1996; Hurtz and Donovan, 2000). Hofstede's Value Survey Module (VSM) has been routinely modified and
several versions exist under a variety of names. In general, the versions of the VSM and the scales that were
developed based on Hofstede's original instrument are fairly similar in terms of their content and psychometric
properties. However, certain differences exist between the instruments that include differences in scale length
(e.g., 1 to 5 or 1 to 9), change in the sequence of the questions, as well as adding or dropping individual items.
To prevent an inclusion of studies that used survey instruments inconsistent with Hofstede's framework and to
ensure we were not excluding any relevant study, we conducted a thorough analysis of the items of every
instrument that appeared relevant. Every instrument was compared against Hofstede's original definitions of the
cultural dimensions and the items in the VSM-82 and VSM-94 versions of his instrument. The definitions
provided earlier in the paper were used to make the inclusion decisions.
More than fifty instruments have been considered for inclusion in the meta-analysis, but only some of them
qualified. Some were excluded despite having identical nomenclature. For example, studies that measured
individualism-collectivism with the instruments developed by Earley (1993, 1994) or by Wagner and Moch
(1986) were excluded from the meta-analysis. An inspection of the items in the instruments revealed that they
were designed to measure attitudes to and preferences for teamwork, which is not the same type of
individualism that is measured by Hofstede's VSM. Similarly, items in the instrument developed by Chew
(1996) dealt primarily with willingness to take risk, not uncertainty avoidance in Hofstede's sense and,
therefore, studies that utilized this instrument were excluded from the meta-analysis.
On the other hand, some instruments were included even though they were nominally different, that is they
measured very similar or identical constructs to those in Hofstede's model but were named differently. For
example, a review of the items in the measures of independent and interdependent self-construals developed by
Singelis (1994) revealed that they were closely related to Hofstede's definition of individualism–collectivism
(e.g., ―Being able to take care of myself is a primary concern for me;‖ ―I will sacrifice my self-interest for the
benefit of the group I am in;‖ ―If my brother or sister fails, I feel responsible‖). Some cases were even more
complicated. For example, it initially appears that the measure of vertical collectivism in the instrument
developed by Singelis et al. (1995) is related to Hofstede's collectivism. However, an inspection of the items
showed that their focus was actually on achievement orientation and attitudes to competition, which are salient
elements in Hofstede's construct of masculinity.
4.3. Coding and common metric
The key variables coded for the meta-analysis were the sample means along the four cultural dimensions,
sample size, characteristics of the individuals comprising the samples and characteristics of the countries they
represented. All studies were double coded and any inconsistencies were resolved through additional
comparison with the original papers.
At the individual level, the sample average cultural score was the dependent variable. It is different from the
conventional meta-analytic correlation-based effect-size, but it is virtually identical to the d-scores that are also
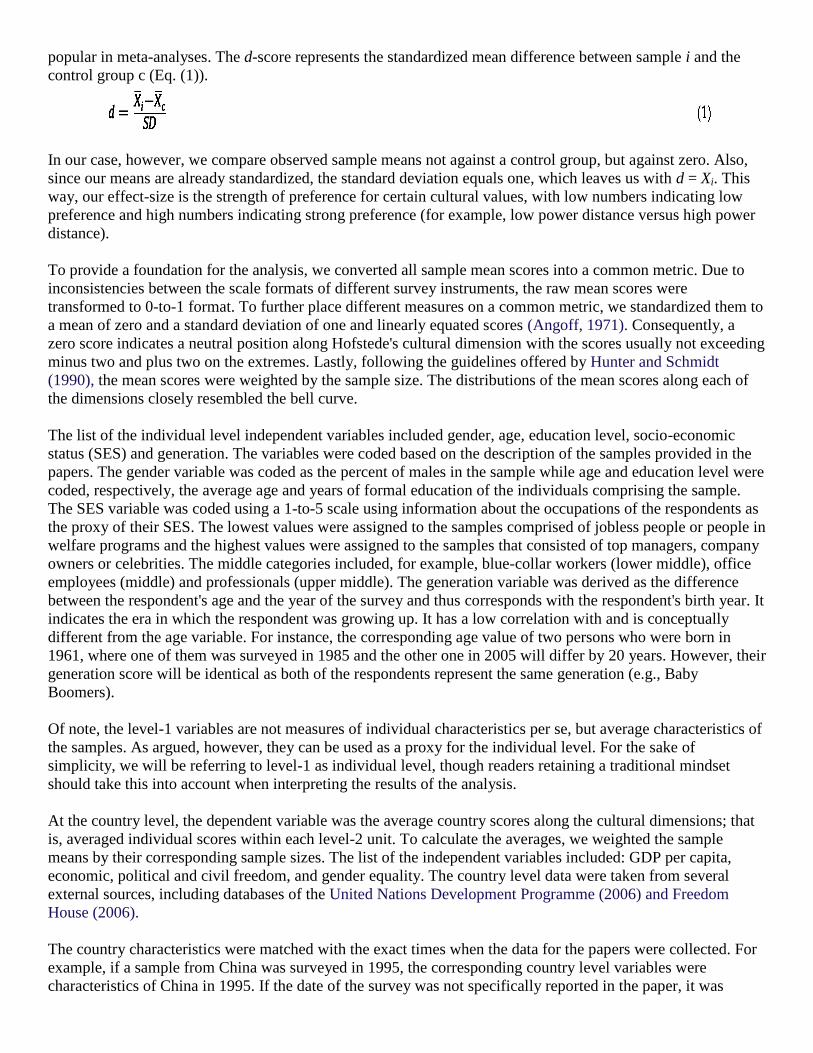
popular in meta-analyses. The d-score represents the standardized mean difference between sample i and the
control group c (Eq. (1)).
In our case, however, we compare observed sample means not against a control group, but against zero. Also,
since our means are already standardized, the standard deviation equals one, which leaves us with d = Xi. This
way, our effect-size is the strength of preference for certain cultural values, with low numbers indicating low
preference and high numbers indicating strong preference (for example, low power distance versus high power
distance).
To provide a foundation for the analysis, we converted all sample mean scores into a common metric. Due to
inconsistencies between the scale formats of different survey instruments, the raw mean scores were
transformed to 0-to-1 format. To further place different measures on a common metric, we standardized them to
a mean of zero and a standard deviation of one and linearly equated scores (Angoff, 1971). Consequently, a
zero score indicates a neutral position along Hofstede's cultural dimension with the scores usually not exceeding
minus two and plus two on the extremes. Lastly, following the guidelines offered by Hunter and Schmidt
(1990), the mean scores were weighted by the sample size. The distributions of the mean scores along each of
the dimensions closely resembled the bell curve.
The list of the individual level independent variables included gender, age, education level, socio-economic
status (SES) and generation. The variables were coded based on the description of the samples provided in the
papers. The gender variable was coded as the percent of males in the sample while age and education level were
coded, respectively, the average age and years of formal education of the individuals comprising the sample.
The SES variable was coded using a 1-to-5 scale using information about the occupations of the respondents as
the proxy of their SES. The lowest values were assigned to the samples comprised of jobless people or people in
welfare programs and the highest values were assigned to the samples that consisted of top managers, company
owners or celebrities. The middle categories included, for example, blue-collar workers (lower middle), office
employees (middle) and professionals (upper middle). The generation variable was derived as the difference
between the respondent's age and the year of the survey and thus corresponds with the respondent's birth year. It
indicates the era in which the respondent was growing up. It has a low correlation with and is conceptually
different from the age variable. For instance, the corresponding age value of two persons who were born in
1961, where one of them was surveyed in 1985 and the other one in 2005 will differ by 20 years. However, their
generation score will be identical as both of the respondents represent the same generation (e.g., Baby
Boomers).
Of note, the level-1 variables are not measures of individual characteristics per se, but average characteristics of
the samples. As argued, however, they can be used as a proxy for the individual level. For the sake of
simplicity, we will be referring to level-1 as individual level, though readers retaining a traditional mindset
should take this into account when interpreting the results of the analysis.
At the country level, the dependent variable was the average country scores along the cultural dimensions; that
is, averaged individual scores within each level-2 unit. To calculate the averages, we weighted the sample
means by their corresponding sample sizes. The list of the independent variables included: GDP per capita,
economic, political and civil freedom, and gender equality. The country level data were taken from several
external sources, including databases of the United Nations Development Programme (2006) and Freedom
House (2006).
The country characteristics were matched with the exact times when the data for the papers were collected. For
example, if a sample from China was surveyed in 1995, the corresponding country level variables were
characteristics of China in 1995. If the date of the survey was not specifically reported in the paper, it was

assumed that the data were gathered 6 months prior to the first submission of the paper. If the data of the first
submission was not reported, the data was estimated to have been collected 21 months prior to the publication
date (based on the average revision time of 15 months for the sample, plus the 6 months).
The GDP per capita was measured in US dollars adjusted for inflation with the year 2000 as a base. Due to
extremely high correlations between economic, political, and societal freedom (0.87 to 0.95), the variables were
consolidated and a single composite score converted to the 1 -to- 100 format was used to represent the freedom
variable. Women's participation in country politics (the percentages of women in country parliaments or
analogous institutions) was used as a measure of gender equality.
4.4. HLM sample structure
There is always a number of ways to structure an HLM dataset. Some of the challenges we had to deal with
were limited data availability and the longitudinal nature of our sample creating a problem similar to that of
autocorrelation in time-series analysis. After a thorough consideration of several 2- and 3-level alternatives and
consultations with external HLM experts, we decided that a two-level structure with individuals (samples) at
level-1 nested within countries at level-2 would be optimal.
To make reliable estimation possible, multi-level analysis requires that each level-2 unit (country) is represented
by a substantial number of level-1 observations (samples). As noted by Hofmann (1997), it is difficult to
provide specific guidelines on sample size requirements because estimation of different parameters in HLM is
sensitive to different factors, such as the total number of level-1 observations, the number of level-2 units, or the
number of level-1 observations within each level-2 unit. In terms of specific numbers, Hofmann (1997) cites
Bassiri (1988) and Van Der Leeden and Busing (1994) who concluded that, in general, at least 30 units with 30
observations in each are required. However, there is a tradeoff between within- and between-unit observations
(i.e., with an increase in the number of level-2 units, the required number of observations per unit decreases).
Because the number of samples representing some countries was quite low in our meta-analytic dataset, these
countries were grouped by cultural regions. Most of these regions were originally introduced in Hofstede's IBM
study (e.g., West Africa, East Africa, Arab countries), but since then a few new regions have come into
existence and we added these, namely: former Asian (e.g., Kazakhstan), East European (e.g., Ukraine) and
Baltic (e.g., Estonia) republics of the USSR. In this case, the level-2 variables describing the regions were
obtained by averaging characteristics of the countries included in the region.
All of the countries in our dataset were represented by multiple samples surveyed in different years. Even
though the country characteristics gathered across these years were different, we could not treat them as
separate level-2 units because these scores were not independent. On the other hand, we could not average
characteristics of the countries across the 35-year period covered by our dataset because of the dramatic changes
most of the countries experienced over this time. After considering several alternatives, we averaged the
country characteristics within decades. This way we did not have to use the less meaningful 35-year averages,
yet a substantial change in country characteristics over 10 years allowed us to address the issue of
autocorrelation. Thus, our level-2 units represented countries in specific decades.
5. Results
5.1. Sample description
After excluding papers that were not compatible with Hofstede's model or did not contain original quantitative
data, the final pool contained 508 studies yielding 2115 samples comprising about 500,000 individuals from 66
countries. Depending on the dimension, the number of samples ranged from 684 to 2063 and the total sample
size ranged from 192,463 to 496,912. Across all dimensions, the average sample size was 355 ranging from 1 to
11,386. Of note, the small minimum sample size of 1 reflects that quite a few studies involved surveying
members of international teams. Overall, these teams were frequently large in size, but the cultural scores were
reported separately for representatives from each country, including at times a single representative. Each of
these groups of representatives is treated as a separate sample for the purpose of the meta-analysis. Due to space

limitations, the complete list of papers used for the meta-analysis is not provided in the paper. The reference list
can be obtained from the authors upon request.
While for some countries the number of samples was also quite small, bigger countries tended to be well
represented. For example, there were 704 samples from the US, 101 samples from Canada, 84 samples from
China, and 75 samples from Hong Kong, all with approximately 355 respondents per sample. After the
countries were grouped in cultural regions and the multi-level dataset was constructed, the number of level-2
units ranged from 37 to 51 with 20 to 41 observations (samples) per unit depending on the dimension Table 1.
Examination of the studies included in the meta-analysis revealed that all of the data were gathered through
self-report questionnaire forms. No significant correlation between countries and response rates was found.
Most samples were represented by people of working age (average age of 35.5 years) and were fairly well
educated (average years of schooling was 15.8).
5.2. Regressions results
For each dimension, Hypotheses 1, 2, and 3 (dependent variable being individual cultural values) were tested
using a set of four HLM regressions and Hypothesis 4 (dependent variable being national culture) was tested
using Weighted Least Squares (WLS) regression. In each case, the cultural mean scores were weighted by their
corresponding sample sizes and the results were estimated with robust standard errors. The analyses were
conducted for each of the four dimensions separately. HLM has been chosen because the technique has been
specifically developed for analysis of multi-level nested data and allows for simultaneous evaluation of the
effects of variables representing different levels of analysis (Hofmann, 1997). Because HLM does not allow for
a level-2 variable to be a dependent variable, WLS was used to test the effect of country characteristics.
All independent variables except for gender were centered on their grand means. This way, the intercepts
represent estimated values for a woman (sample consisting of women) whose value on Xi is equal to the grand
mean (Raudenbush and Bryk, 2002). We analyze power distance first, providing detailed equations. Following
this, we provide a summary of analogous analyses for individualism, masculinity, and uncertainty avoidance.
The findings for power distance (PD) are summarized in Table 2. Our hypotheses predict that both individual
and country characteristics would be significantly related to personal cultural values. In order for these
hypotheses to be supported, there has to be a significant between-country variance in cultural values (H0). The
first model (Eq. (2)), which essentially is a one-way ANOVA with random effects, tests whether the intercepts
vary significantly across countries. β0 is the intercept and r is the variance component at level-1 and γ00 and u0
are the intercept and the variance component at the country level. The error terms are assumed to be normally
distributed with means of zero and variances σ2 and τ00 respectively.
The results show that the estimated value of the variance component τ00 is significantly greater than zero
indicating a significant variation in mean PD scores across countries. Using the data in the output, we can
calculate the Intraclass Correlation Coefficient (ICC), which in this case, represents the proportion of variance
in power distance residing between countries (Eq. (3)).
The estimated value of ICC is 0.12 indicating that 12% of the total variance in PD is residing between countries
and 88% of the variance is within countries.
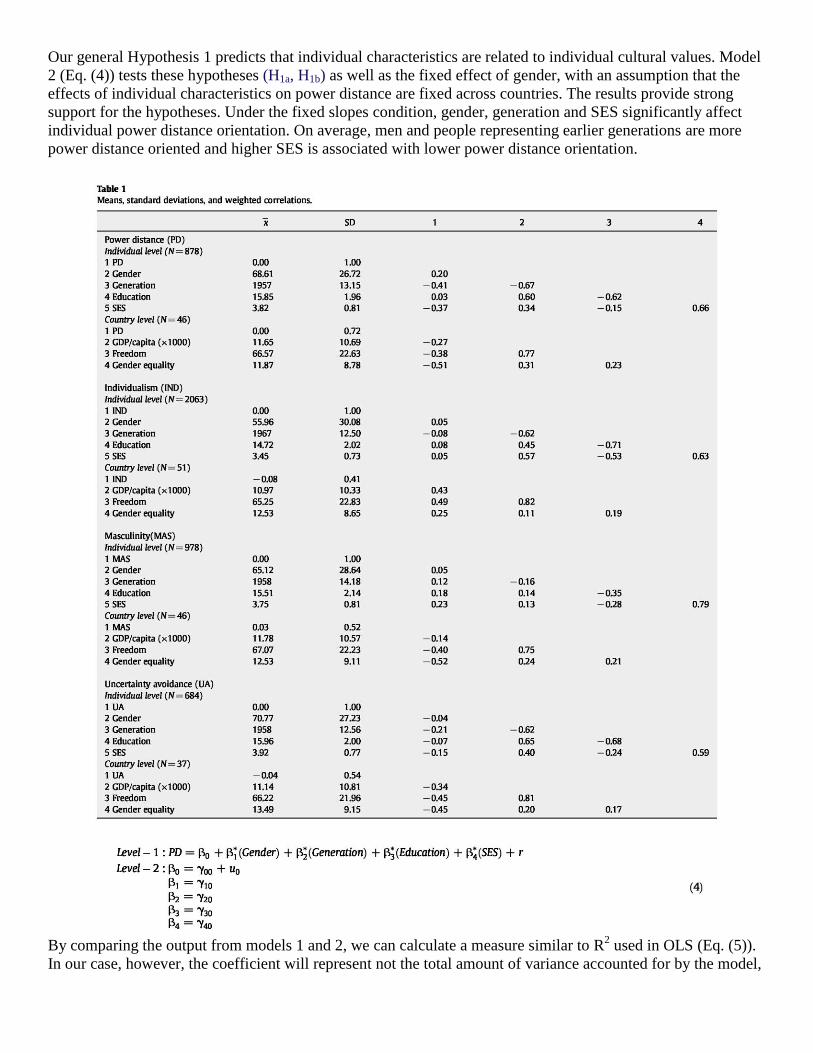
Our general Hypothesis 1 predicts that individual characteristics are related to individual cultural values. Model
2 (Eq. (4)) tests these hypotheses (H1a, H1b) as well as the fixed effect of gender, with an assumption that the
effects of individual characteristics on power distance are fixed across countries. The results provide strong
support for the hypotheses. Under the fixed slopes condition, gender, generation and SES significantly affect
individual power distance orientation. On average, men and people representing earlier generations are more
power distance oriented and higher SES is associated with lower power distance orientation.
By comparing the output from models 1 and 2, we can calculate a measure similar to R
2 used in OLS (Eq. (5)).
In our case, however, the coefficient will represent not the total amount of variance accounted for by the model,
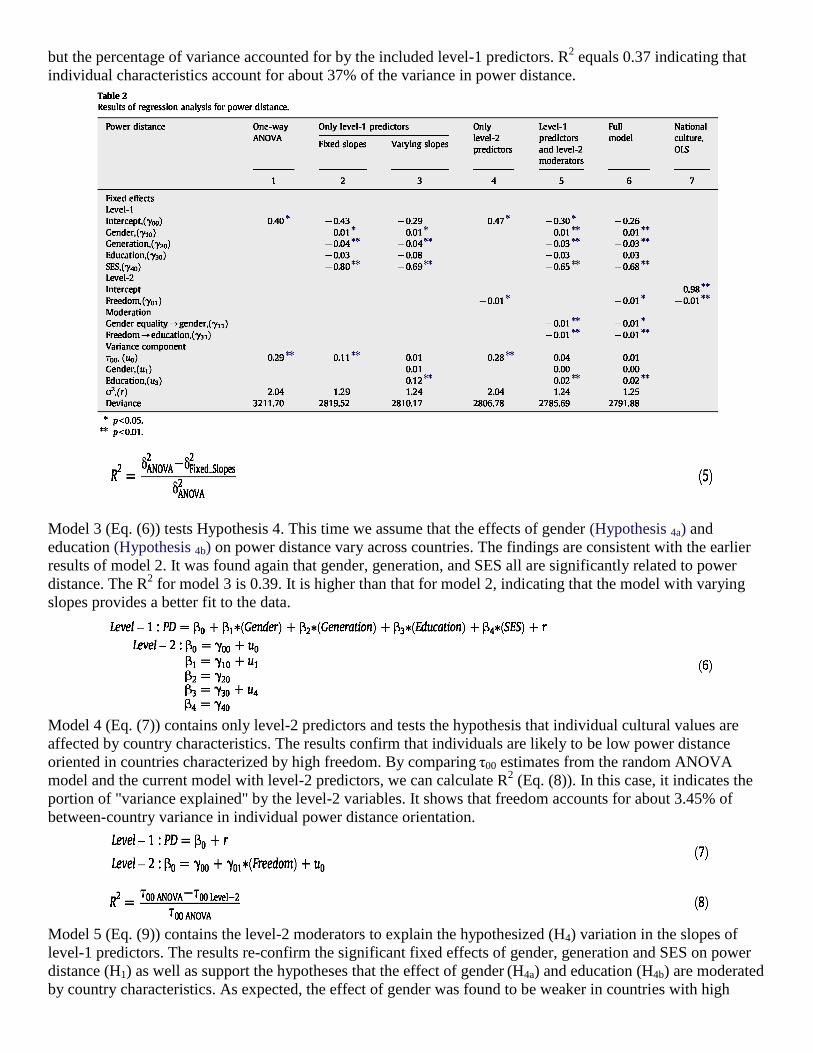
but the percentage of variance accounted for by the included level-1 predictors. R2 equals 0.37 indicating that
individual characteristics account for about 37% of the variance in power distance.
Model 3 (Eq. (6)) tests Hypothesis 4. This time we assume that the effects of gender (Hypothesis 4a) and
education (Hypothesis 4b) on power distance vary across countries. The findings are consistent with the earlier
results of model 2. It was found again that gender, generation, and SES all are significantly related to power
distance. The R2 for model 3 is 0.39. It is higher than that for model 2, indicating that the model with varying
slopes provides a better fit to the data.
Model 4 (Eq. (7)) contains only level-2 predictors and tests the hypothesis that individual cultural values are
affected by country characteristics. The results confirm that individuals are likely to be low power distance
oriented in countries characterized by high freedom. By comparing τ00 estimates from the random ANOVA
model and the current model with level-2 predictors, we can calculate R2 (Eq. (8)). In this case, it indicates the
portion of "variance explained" by the level-2 variables. It shows that freedom accounts for about 3.45% of
between-country variance in individual power distance orientation.
Model 5 (Eq. (9)) contains the level-2 moderators to explain the hypothesized (H4) variation in the slopes of
level-1 predictors. The results re-confirm the significant fixed effects of gender, generation and SES on power
distance (H1) as well as support the hypotheses that the effect of gender (H4a) and education (H4b) are moderated
by country characteristics. As expected, the effect of gender was found to be weaker in countries with high
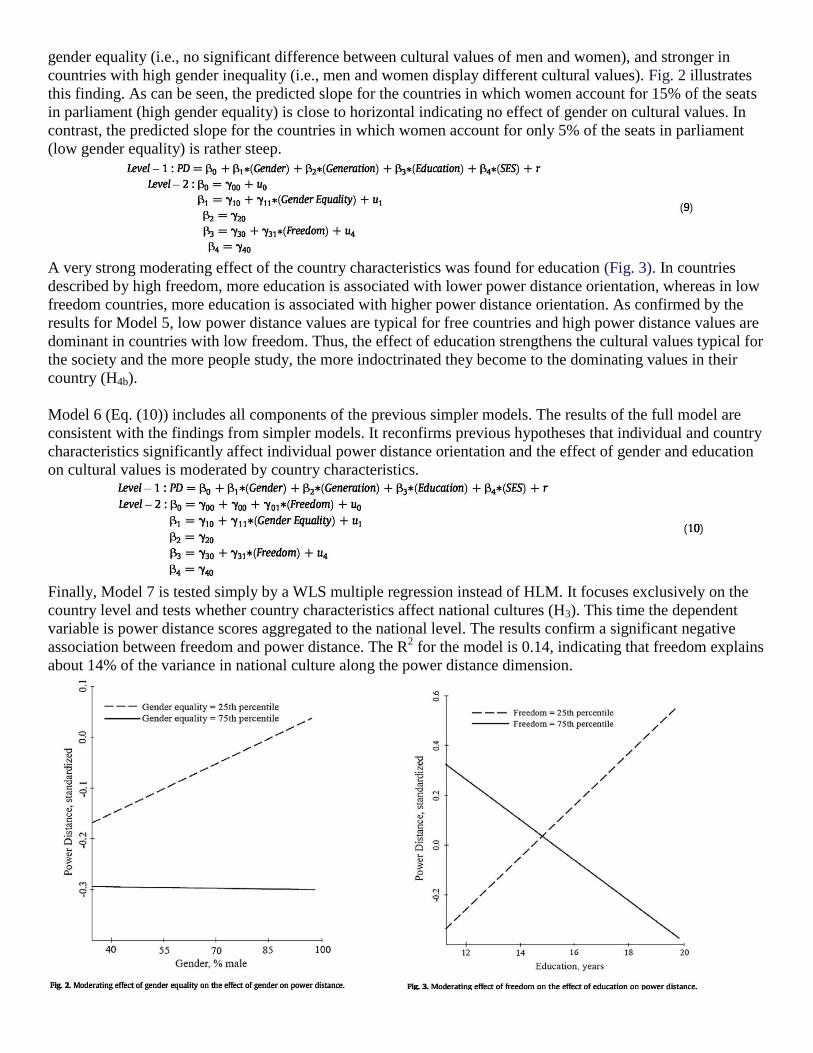
gender equality (i.e., no significant difference between cultural values of men and women), and stronger in
countries with high gender inequality (i.e., men and women display different cultural values). Fig. 2 illustrates
this finding. As can be seen, the predicted slope for the countries in which women account for 15% of the seats
in parliament (high gender equality) is close to horizontal indicating no effect of gender on cultural values. In
contrast, the predicted slope for the countries in which women account for only 5% of the seats in parliament
(low gender equality) is rather steep.
A very strong moderating effect of the country characteristics was found for education (Fig. 3). In countries
described by high freedom, more education is associated with lower power distance orientation, whereas in low
freedom countries, more education is associated with higher power distance orientation. As confirmed by the
results for Model 5, low power distance values are typical for free countries and high power distance values are
dominant in countries with low freedom. Thus, the effect of education strengthens the cultural values typical for
the society and the more people study, the more indoctrinated they become to the dominating values in their
country (H4b).
Model 6 (Eq. (10)) includes all components of the previous simpler models. The results of the full model are
consistent with the findings from simpler models. It reconfirms previous hypotheses that individual and country
characteristics significantly affect individual power distance orientation and the effect of gender and education
on cultural values is moderated by country characteristics.
Finally, Model 7 is tested simply by a WLS multiple regression instead of HLM. It focuses exclusively on the
country level and tests whether country characteristics affect national cultures (H3). This time the dependent
variable is power distance scores aggregated to the national level. The results confirm a significant negative
association between freedom and power distance. The R2 for the model is 0.14, indicating that freedom explains
about 14% of the variance in national culture along the power distance dimension.
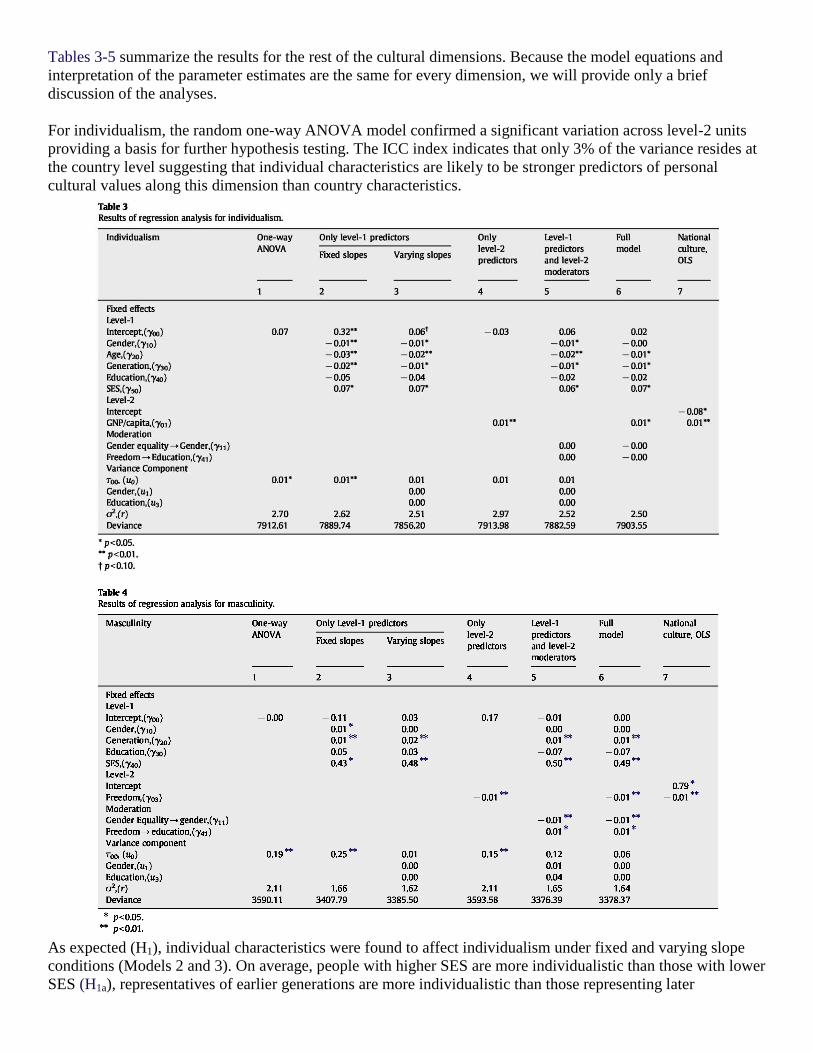
Tables 3-5 summarize the results for the rest of the cultural dimensions. Because the model equations and
interpretation of the parameter estimates are the same for every dimension, we will provide only a brief
discussion of the analyses.
For individualism, the random one-way ANOVA model confirmed a significant variation across level-2 units
providing a basis for further hypothesis testing. The ICC index indicates that only 3% of the variance resides at
the country level suggesting that individual characteristics are likely to be stronger predictors of personal
cultural values along this dimension than country characteristics.
As expected (H1), individual characteristics were found to affect individualism under fixed and varying slope
conditions (Models 2 and 3). On average, people with higher SES are more individualistic than those with lower
SES (H1a), representatives of earlier generations are more individualistic than those representing later

generations (H1b), and older people are less individualistic than younger people (H1c). In addition, men were
found to be significantly less individualistic than women. The ―variance explained‖ index R2 is 0.03 and 0.07
for models 2 and 3 respectively, indicating that individual characteristics account for up to 7% of the variance in
individualism, depending on the model specification.
In accordance with our hypothesis (H2b), GDP per capita was positively related to personal individualism
orientation, as per Model 4. Support for the moderation hypothesis (Model 5) was not found for individualism,
indicating that the effects of gender and education on individualism are not moderated by country
characteristics. The results of the full model reconfirmed the earlier findings—individual and country
characteristics have a significant effect on personal cultural values along the individualism dimension and the
effects of personal characteristics are not significantly moderated by country characteristics. In terms of national
culture, Model 7 confirmed the hypothesis that wealthy countries tend to have individualistic cultures.
The results for masculinity supported all the hypotheses for this cultural dimension. Based on the ICC for the
ANOVA (Model 1), 8% of the variance in masculinity resides between countries. All models that included
level-1 predictors consistently confirmed the hypothesis that individual characteristics affect personal cultural
values. It was found that people with higher SES (H1a) and those representing earlier generations (H1b) are likely
to score significantly higher on masculinity. The individual characteristics accounted for 21% to 23% of the
―explained variance,‖ based on the R2 for the models with fixed and varying slopes respectively.
The effect of freedom on masculinity (H2a, H3a) was significant at both the individual and national levels
(Models 4 and 7) and accounted for 21% and 16% of ―explained variance‖ respectively. However, the direction
of the effect was unexpectedly negative meaning that freedom is actually associated with feminine values. The
moderator analysis (Models 4 and 6) helps to reconcile these results. As expected, more education was found to
be associated with higher masculinity in free countries and higher femininity in countries with low freedom. In
other words, as hypothesized (H4b), education strengthens cultural values emphasized in the society—
achievement and success seeking (masculine values) in Western countries and personal relationships and
harmony (feminine values) in Eastern countries. The moderating effect of gender equality on the effect of
gender on cultural values was also found to be highly significant. As hypothesized (H4a), cultural differences
between men and women are much smaller in countries with high gender equality.
The findings for uncertainty avoidance (Table 5) were similar to those for individualism. As hypothesized, the
results for all models confirmed significant effects of individual and country characteristics on personal cultural
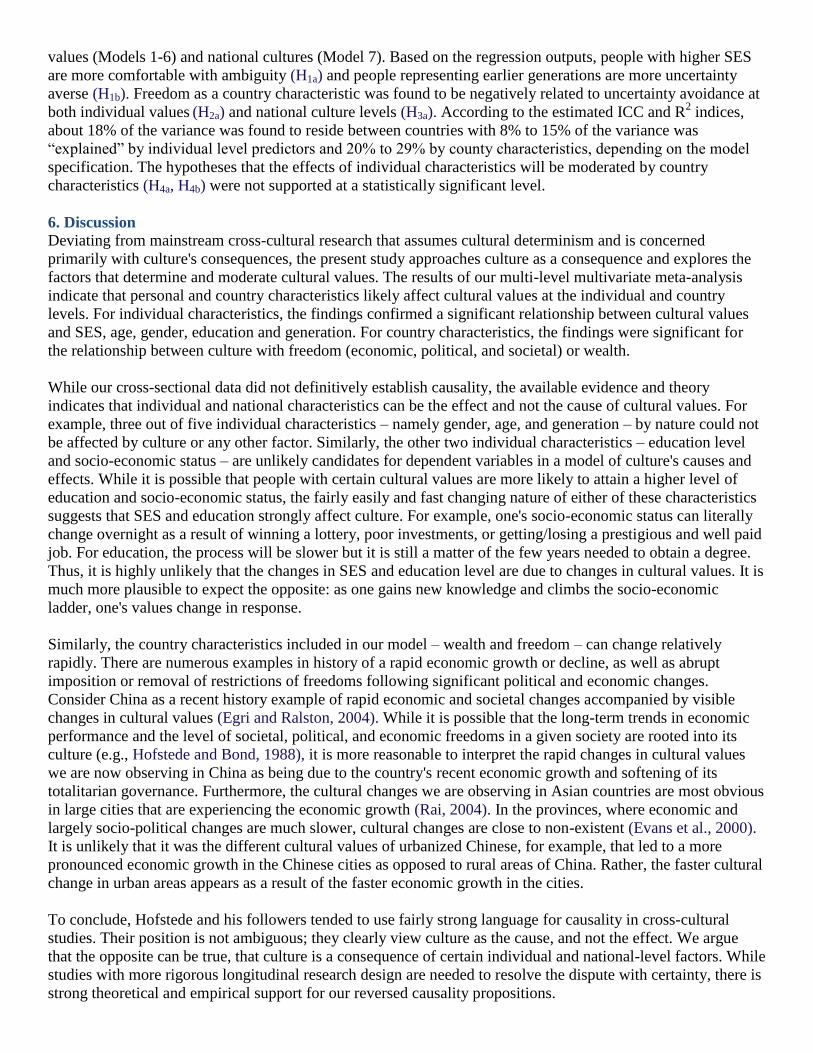
values (Models 1-6) and national cultures (Model 7). Based on the regression outputs, people with higher SES
are more comfortable with ambiguity (H1a) and people representing earlier generations are more uncertainty
averse (H1b). Freedom as a country characteristic was found to be negatively related to uncertainty avoidance at
both individual values (H2a) and national culture levels (H3a). According to the estimated ICC and R2 indices,
about 18% of the variance was found to reside between countries with 8% to 15% of the variance was
―explained‖ by individual level predictors and 20% to 29% by county characteristics, depending on the model
specification. The hypotheses that the effects of individual characteristics will be moderated by country
characteristics (H4a, H4b) were not supported at a statistically significant level.
6. Discussion
Deviating from mainstream cross-cultural research that assumes cultural determinism and is concerned
primarily with culture's consequences, the present study approaches culture as a consequence and explores the
factors that determine and moderate cultural values. The results of our multi-level multivariate meta-analysis
indicate that personal and country characteristics likely affect cultural values at the individual and country
levels. For individual characteristics, the findings confirmed a significant relationship between cultural values
and SES, age, gender, education and generation. For country characteristics, the findings were significant for
the relationship between culture with freedom (economic, political, and societal) or wealth.
While our cross-sectional data did not definitively establish causality, the available evidence and theory
indicates that individual and national characteristics can be the effect and not the cause of cultural values. For
example, three out of five individual characteristics – namely gender, age, and generation – by nature could not
be affected by culture or any other factor. Similarly, the other two individual characteristics – education level
and socio-economic status – are unlikely candidates for dependent variables in a model of culture's causes and
effects. While it is possible that people with certain cultural values are more likely to attain a higher level of
education and socio-economic status, the fairly easily and fast changing nature of either of these characteristics
suggests that SES and education strongly affect culture. For example, one's socio-economic status can literally
change overnight as a result of winning a lottery, poor investments, or getting/losing a prestigious and well paid
job. For education, the process will be slower but it is still a matter of the few years needed to obtain a degree.
Thus, it is highly unlikely that the changes in SES and education level are due to changes in cultural values. It is
much more plausible to expect the opposite: as one gains new knowledge and climbs the socio-economic
ladder, one's values change in response.
Similarly, the country characteristics included in our model – wealth and freedom – can change relatively
rapidly. There are numerous examples in history of a rapid economic growth or decline, as well as abrupt
imposition or removal of restrictions of freedoms following significant political and economic changes.
Consider China as a recent history example of rapid economic and societal changes accompanied by visible
changes in cultural values (Egri and Ralston, 2004). While it is possible that the long-term trends in economic
performance and the level of societal, political, and economic freedoms in a given society are rooted into its
culture (e.g., Hofstede and Bond, 1988), it is more reasonable to interpret the rapid changes in cultural values
we are now observing in China as being due to the country's recent economic growth and softening of its
totalitarian governance. Furthermore, the cultural changes we are observing in Asian countries are most obvious
in large cities that are experiencing the economic growth (Rai, 2004). In the provinces, where economic and
largely socio-political changes are much slower, cultural changes are close to non-existent (Evans et al., 2000).
It is unlikely that it was the different cultural values of urbanized Chinese, for example, that led to a more
pronounced economic growth in the Chinese cities as opposed to rural areas of China. Rather, the faster cultural
change in urban areas appears as a result of the faster economic growth in the cities.
To conclude, Hofstede and his followers tended to use fairly strong language for causality in cross-cultural
studies. Their position is not ambiguous; they clearly view culture as the cause, and not the effect. We argue
that the opposite can be true, that culture is a consequence of certain individual and national-level factors. While
studies with more rigorous longitudinal research design are needed to resolve the dispute with certainty, there is
strong theoretical and empirical support for our reversed causality propositions.
We also found empirical support for our hypothesized moderator effects. Specifically, the effects of personal
characteristics, such as age and education, on cultural values were moderated by country characteristics. That is,
depending on characteristics of environment, effects of certain individual characteristic may vary in strength as
even direction. Generally, the effect of gender was found to be significantly stronger in countries with high
gender inequality and negligible in countries where men and women enjoy equal rights and opportunities. The
effect of education on cultural values seems to be present in all countries. However, its direction depends on
country characteristics. More education is associated with lower power distance and higher masculinity in free
countries and is associated with higher power distance and feminine cultural values in countries characterized
by low freedom. A comparison of these results with the findings for the effect of country characteristics on
culture shows an indoctrination effect. That is, more education is associated with stronger preference for the
cultural values common in the society.
The results provide a basis for explaining variations in cultural values within and between countries. Significant
effects of external factors on cultural values support the convergence theory suggesting that cultures are
determined by a set of individual and country level factors and are likely to change in response to a change in
the culture-determining factors. At the national level, we can expect countries to develop values typical of
Western industrial societies if they maintain steady economic growth and adopt democratic ideals, such as more
political and civil freedom. Similarly, individual characteristics appear to largely determine one's cultural
values. As one matures, gains more education, and moves up the corporate ladder, one's cultural values will
likely change in response.
According to our results, only about 3% to 18% of the variance in cultural values resides between countries,
with 82% to 92% being within countries, depending on the cultural dimension. This highlights the danger of
using national averages to make assumptions about individual cultural values. For example, an elderly Kansas
farmer and a young Manhattan lawyer are likely to have very different sets of work-related cultural values,
despite both being Americans. Comparatively, the Manhattan lawyer is more likely to have cultural values
similar to those of a young Shanghai lawyer, even though they have grown up on different continents.
6. 1. Future research directions and limitations
The results of the meta-analysis have several implications for future research. First, our findings support the
idea that cultures can change in response to changes in their economic, political and societal systems. On the
other hand, no cultural change may be occurring in societies with stable economic and political environments.
Therefore, national indices and rankings from older studies (e.g., Hofstede, 1980) may be becoming
increasingly misleading because their accuracy diminishes as characteristics of countries are changing over
time. New sets of national culture indices and ranking that take into account recent changes in country
characteristics may be needed to provide a viable foundation for contemporary cross-cultural research.
Second, more attention should be devoted to the individual level of analysis. Countries and geographic regions
as a unit of analysis are losing their meaning in cross-cultural research. At the group level, such entities as
professional communities, socio-economic classes, age groups and generation cohorts are becoming more
meaningful in terms of their ability to group individuals in cultural clusters. Though we acknowledge that
geography may remain a valid predictor of cultural values for some time, considerably more variance could be
accounted for if we included the individual level during analysis (i.e., employ multi-level research design and
data analysis).
Our exploration of factors shaping cultural values has been very general. A number of potentially relevant
variables have not been included in our analysis. For example, country characteristics such as the equality
wealth distribution, economic growth rate, population size and density, and percent living in urban areas as well
as individual characteristics such as marital status, number of siblings, race or religion all could have significant
effects on cultural values.
Also, our quasi-longitudinal research design does not allow for a precise estimation of the effect sizes and
calculation of the lag between the change in environment and personal characteristics and cultural changes at
the national and individual level. A number of variables may also moderate the lag. While the focus of this
study was on predicting cultural values, future research may choose to study the predictors of cultural
heterogeneity.
Further, while we focused on cultural means, future research may explore factors that affect the degree of
cultural value heterogeneity within countries. We can hypothesize that some factors can lead to a greater variety
of within-group cultural values, while others can cause cultural homogeneity. Gelfand et al.'s (2006) construct
of cultural looseness-tightness may be relevant in this context as we can expect to see less deviation from the
"mainstream" in culturally tight societies and more in loose cultures. To test this hypothesis, the analyses must
be rerun with measures of dispersion, such as standard deviation of means, as a dependent variable. That this
remains to be done reflects the enormity of the work that still remains, which is far larger than any single article
can address. Explicating culture as consequence is an endeavor that can be expected to span decades of work
and dozens of publications.
The results of our meta-analysis are subject to some limitations. First of all, it should be noted that we attempted
to replicate Hofstede's original approach to studying culture as much as possible. Therefore, our study is subject
to some of the same limitations in which Hofstede's IBM research has been criticized. For example, we adopted
Hofstede's model of cultural differences despite some concerns that the five dimensions do not adequately
capture all aspects of culture and the existence of alternative models of cross-cultural differences (House et al.,
2004; Maznevski and DiStefano, 1995; Schwartz, 1994a; Trompenaars, 1993). Similarly, some scholars have
suggested that individualism–collectivism may not be the extremes of a single continuum as suggested by
Hofstede, but rather are independent dimensions (for a review of the issue see Oyserman et al., 2002). The issue
is interesting and important but unfortunately it is beyond the scope of the present study as well as the available
data. To avoid construct contamination, we strived to stick as closely with Hofstede's original framework as
possible. More importantly, most studies in our sample did not differentiate between individualism and
collectivism and provided a single score for the construct, precluding analyzing them separately.
Another limitation of our research project, as with most meta-analyses, is the issue of commensurability. Not all
studies aggregated were conceptually identical. While it is relatively easy to address differences in the sample
size or in the number of points on the scale, it is much more difficult to deal with the differences in composition
and wording of actual items in different instruments. Even in Hofstede's own works, the definition of
masculinity–femininity has been altered from publication to publication (compare Hofstede, 1980, 1993, 2001)
and it cannot be expected that different authors defined and presented the concepts identically. However, we
minimize the problem by inspecting scales at the item level to ensure their consistency with Hofstede's
definitions of the cultural dimensions and his original Value Survey Module. Only the instruments that were
found to be closely related to Hofstede's framework were included in the meta-analysis.
Finally, we analyzed individual characteristics using sample level data. As mentioned, this may be the preferred
level of analysis, as such aggregation can help with specification problems and there is little reason to believe
that ecological fallacy is operating in this instance. Still, it would still be advantageous to conduct this study, at
least in part, with individual level data. Though a threat to validity may be unlikely, it is always useful to rule it
out entirely.
References
Adams, M., 2005. American Backlash: the Untold Story of Social Change in the United States. The Penguin
Group, New York.
Angoff, W.H., 1971. Norms, scales, and equivalent scores, In: Thorndike, R.L. (Ed.), Educational
Measurement, 2nd ed. American Council of Education, Washington, DC,pp.508–560.
Au, K.Y., 1999. Intra-cultural variation: evidence and implications for international business. Journal of
International Business Studies 30 (4), 799–812.
Basabe, N., Paez, D., Valencia, J., 2002. Cultural dimensions, socioeconomic development, climate, and
emotional hedonic level. Cognition and Emotion 16 (1), 103–125.
Baskerville, R.F., 2003. Hofstede never studied culture. Accounting, Organizations and Society 28 (1), 1–14.
Bassiri, D. (1988). Large and small sample properties of maximum likelihood estimates for the hierarchical
linear model. Unpublished doctoral dissertation, Department of Counseling, Educational Psychology, and
Special Education, Michigan State University.
Bell, D., 1973. The Coming of Post-Industrial Society. Basic Books, New York, NY.
Birnbaum-More, P.H., Wong, G.Y., Olve, N.-G., 1995. Acquisition of managerial values in the People's
Republic of China and Hong Kong. Journal of Cross-Cultural Psychology 26 (3), 255–275.
Blakely, T.A., Woodward, A.J., 2000. Ecological effects in multi-level studies. Journal of Epidemiology and
Community Health 54, 367–374.
Bochner, S., Hesketh, B., 1994. Power distance, individualism/collectivism, and job-related attitudes in a
culturally diverse work group. Journal of Cross-Cultural Psychology 25, 233–257.
Boehnke, C., Ittel, A., Baier, D., 2002. Value transmission and ‗zeitgeist‘: an underresearched relationship.
Sociale Wetenschappen 45, 28–43.
Bond, M.H., 2002. Reclaiming the individual from Hofstede's ecological analysis—a 20-year odyssey:
Comment on Oyserman et al. (2002). Psychological Bulletin 128 (1),73–77.
Chang, L., 1999. Gender role egalitarian attitudes in Beijing, Hong Kong, Florida, and Michigan. Journal of
Cross-Cultural Psychology 30 (6), 722–741.
Chen, C.C., Meindl, J.R., Hunt, R.G., 1997. Testing the effects of vertical and horizontal collectivism: a study
of reward allocation preferences in China. Journal of Cross-Cultural Psychology 28 (1), 44–70.
Cheng, K., 1998. Can education values be borrowed? Looking into cultural differences. Peabody Journal of
Education 73 (2), 11–30.
Cheung, M.W.L., Au, K., 2005. Applications of multilevel structural equation modeling to cross-cultural
research. Structural Equation Modeling 12 (4), 598–619. Chew, K. H. (1996). Beyond individualism–
collectivism: Additional constructs to consider. Unpublished doctoral dissertation, University of Oregon,
Eugene, WA, US.
Chow, S., Chow, S.L., 1992. Acceptance of a theory: justification or rhetoric? Journal for the Theory of Social
Behaviour 22 (4), 447–474. Cohen, D., 2001. Cultural variation: considerations and implications. Psychological
Bulletin 127 (4), 451–471.
Conway, N., Nuttgens, A., 2006. Innovation across cultures: the relationship between uncertainty avoidance and
innovation in Japan and the UK. Paper presented at the Academy of International Business, Beijing, China.
Diener, E., Diener, M., 1995. Cross-cultural correlates of life satisfaction and self-esteem. Journal of Personality
and Social Psychology 68 (4), 653–663. Diez-Roux, A.V., 1998. Bringing context back into epidemiology:
variables and fallacies in multilevel analysis. American Journal of Public Health 88 (2), 216–222. Dorfman, P.,
Howell, J.P., 1988. Dimensions of national culture and effective leadership patterns: Hofstede revisited. In:
Farmer, R.N., McGoun, E.G. (Eds.), Advances
in International Comparative Management. JAI Press, London, UK, pp. 127–150.
Earley, P.C., 1993. East meets West meets Mideast: further explorations of collectivistic and individualistic
work groups. Academy of Management Journal 36 (2), 319–348.
Earley, P.C., 1994. Self or group? Cultural effects of training on self-efficacy and performance. Administrative
Science Quarterly 39 (1), 89–117.
Egri, C.P., Ralston, D.A., 2004. Generation cohorts and personal values: a comparison of China and the United
States. Organization Science 15 (2), 210–220. Eisenstadt, S.N., 1973. Tradition, Change and Modernity. John
Wiley & Sons, New York.
England, G.W., 1967. Personal value systems of American Managers. Academy of Management Journal 10,
53–68.
Erez, M., Gati, E., 2004. A dynamic, multi-level model of culture: from the micro level of the individual to the
macro level of a global culture. Applied Psychology: An International Review 53 (4), 583–598.
Evans, G., Hutton, C., Kuah, K.E., 2000. Where China meets Southeast Asia: social & cultural change in the
border regions. Institute of Southeast Asian Studies, Singapore.

Eylon, D., Au, K.Y., 1999. Exploring empowerment: cross-cultural differences along the power distance
dimension. International Journal of Intercultural Relations 23 (3), 373–385.
Feather, N.T., 1975. Value systems and delinquency: parental and generational discrepancies in value systems
and delinquent and non-delinquent boys. British Journal of Social and Clinical Psychology 14 (2), 117–129.
Fernandez, D.R., Carlson, D.S., Stepina, L.P., Nicholson, J.D., 1997. Hofstede's country classification 25 years
later. Journal of Social Psychology 137 (1 ), 43–54. Fessler, D., 2006. Steps toward an evolutionary psychology
of a culture dependent species. In: Carruthers, P., Laurence, S., Stich, S. (Eds.), Innateness and the Structure of
the Mind, vol. II. Oxford University Press, Oxford, England.
Fischer, R., Ferreira, M.C., Assmar, E.M.L., Redford, P., Harb, C., 2005. Organizational behaviour across
cultures: theoretical and methodological issues for developing multi-level frameworks involving culture.
International Journal of Cross Cultural Management 5 (1), 27–48.
Franke, R.H., Hofstede, G., Bond, M.H., 1991. Cultural roots of economic performance: a research note.
Strategic Management Journal 12 (1), 165–173. Freedom_House, 2006. Freedom in the World. . Retrieved June
10, from http://www.freedomhouse.org/template.cfm?page=15.
Gelfand, M.J., Nishii, L.H., Raver, J.L., 2006. On the nature and importance of cultural tightness–looseness.
Journal of Applied Psychology 91 (6), 1225–1244. Gelfand, M.J., Erez, M., Aycan, Z., 2007. Cross-cultural
organizational behavior. Annual Review of Psychology 58 (20),1–35.
Gibbons, J.L., Wilson, S.L., Rufener, C.A., 2006. Gender attitudes mediate gender differences in attitudes
toward adoption in Guatemala. Sex Roles 54 (1), 139–145. Goodstein, L.D., 1981. Do American theories apply
abroad? American business values and cultural imperialism. Organizational Dynamics 10 (1), 49–55.
Gouveia, V.V., Ros, M., 2000. Hofstede and Schwartz's models for classifying individualism at the cultural
level: Their relation to macro-social and macro-economic variables. Psicothema 12, 25–33.
Hanushek, E.A., Jackson, J.E., Kain, J.F., 1974. Model specification, use of aggregate data, and the ecological
correlation fallacy. Political Methodology 1, 89–107. Harvey, F., 1997. National cultural differences in theory
and practice: evaluating Hofstede's national cultural framework. Information Technology & People 10 (2), 132–
147.
Heine, S.J., Norenzayan, A., 2006. Toward a psychological science for a cultural species. Perspectives on
Psychological Science 1 (3), 251–269.
Heuer, M., Cummings, J.L., Hutabarat, W., 1999. Cultural stability or change among managers in Indonesia?
Journal of International Business Studies 30 (3), 599. Heyneman, S.P., 2003. Education, social cohesion, and
the future role of international organizations. Peabody Journal of Education 78 (3), 25–38.
Hofmann, D.A., 1997. An overview of the logic and rationale of hierarchical linear models. Journal of
Management 23 (6), 723–744.
Hofstede, G., 1980. Culture's Consequences: International Differences in Work-Related Values. Sage
Publications, Beverly Hills, CA.
Hofstede, G., 1986. Cultural differences in teaching and learning. International Journal of Intercultural
Relations 10 (3), 301–320.
Hofstede, G., 1993. Cultural constraints in management theories. Academy of Management Executive 7 (1),
81–94.
Hofstede, G., 1994. Management scientists are human. Management Science 40 (1), 4–14.
Hofstede, G., 2001. Culture's Consequences: Comparing Values, Behaviors, Institutions, and Organizations
Across Nations, 2 ed. Sage Publications, London. Hofstede, G., 2002. Dimensions do not exist: a reply to
Brendan McSweeney. Human Relations 55 (11), 11355–11361.
Hofstede, G., Bond, M.H., 1988. The Confucian connection: from cultural roots to economic growth.
Organization Dynamics 16, 4–21.
Hofstede, G., Neuijen, B., Ohayv, D.D., Sanders, G., 1990. Measuring organizational cultures: a qualitative and
quantitative study across twenty cases. Administrative Science Quarterly 35 (2), 286–316.
Hogan, R., Hogan, J., Roberts, B.W., 1996. Personality measurement and employment decisions: questions and
answers. American Psychologist 51 (5), 469–477. House, R.J., Hanges, P.J., Javidan, M., Dorfman, P.W.,
Gupta, V. (Eds.), 2004. Culture, Leadership, and Organizations: The GLOBE Study of 62 Societies. Sage
Publications, Thousand Oaks, CA.
Huh-Kim, J. (1999). A cross-generational study of value differences among Korean-American youth and their
mothers: The relationship between individualism, collectivism, and hierarchical decision-making on family
conflict and psychological distress. Unpublished doctoral dissertation, University of California, Santa Barbara,
CA.
Hui, C. H. (1984). Individualism–collectivism: Theory, measurement and its relationships to reward allocation.
Unpublished doctoral dissertation, University of Illinois, Urbana-Champaign, IL.
Hui-Chun, Y., Miller, P., 2003. The generation gap and cultural influence: a Taiwan empirical investigation.
Cross Cultural Management 10 (3), 23. Hunter, J.E., Schmidt, F.L., 1990. Methods of meta-analysis: correcting
error and bias in research findings. Sage Publications, Newbury Park, CA.
Huo, Y.P., Randall, D.M., 1991. Exploring subcultural differences in Hofstede's value survey: the case of the
Chinese. Asia Pacific Journal of Management 8 (2), 159–173.
Hurtz, G.M., Donovan, J.J., 2000. Personality and job performance: the Big Five revisited. Journal of Applied
Psychology 85 (6), 869–879.
Inglehart, R., 1997. Modernization and Postmodernization: Cultural, Economic, and Political Change in 43
Societies. Princeton University Press, Princeton, NJ. Inglehart, R., Baker, W.E., 2000. Modernization, cultural
change, and the persistence of traditional values. American Sociological Review 65 (1), 19–51. Inglehart, R.,
Welzel, C., 2005. Modernization, Cultural Change and Democracy: the Human Development Sequence.
Cambridge University Press, NewYork. Jargowsky, P.A., 2004. The Ecological Fallacy. In: Kempf-Leonard, K.
(Ed.), The Encyclopedia of Social Measurement, vol. 1. Academic Press, San Diego, CA, pp. 715–722.
Johnson, J.P., Lenartowicz, T., 1998. Culture, freedom and economic growth: do cultural values explain
economic growth? Journal of World Business 33 (4), 332–354.
Jones, A.P., James, L.R., 1979. Psychological climate: dimensions and relationships of individual and
aggregated work environment perceptions. Organizational Behavior and Human Performance 23 (2), 201–250.
Kashima, Y., Yamaguchi, S., Kim, U., Choi, S.-C., 1995. Culture, gender, and self: a perspective from
individualism–collectivism research. Journal of Personality and Social Psychology 69 (5), 925–937.
Kenny, D.A., Zautra, A., 2001. Trait-state models for longitudinal data. In: Collins, L.M., Sayer, A.G. (Eds.),
New Methods for the Analysis of Change: Decade of Behavior. American Psychological Association,
Washington, DC, pp. 243–263.
Kerr, C., Dunlop, J.T., Harbison, F.H., Myers, C.A., 1960. Industrialism and Industrial Man: the Problems of
Labor and Management in Economic Growth. Heinemann, London.
Kim, U., Triandis, H.C., Kagitcibasi, C., Choi, S.C., Yoon, G. (Eds.), 1994. Individualism and Collectivism:
Theory, Method, and Applications. Sage Publications, Thousand Oaks, CA.
Kirkman, B.L., Lowe, K.B., Gibson, C.B., 2006. A quarter century of culture's consequences: a review of
empirical research incorporating Hofstede's cultural values framework. Journal of International Business
Studies 37 (3), 285–320.
Kluckhohn, F.R., Strodtbeck, F.L., 1961. Variations in Value Orientations. Row, Peterson, Evanston, IL.
Kolman, L., Noorderhaven, N.G., Hofstede, G., Dienes, E., 2003. Cross-cultural differences in Central Europe.
Journal of Managerial Psychology 18 (1/2), 76–88. Lam, A.G., Zane, N.W., 2004. Ethnic differences in coping
with interpersonal stressors: a test of self-construals as cultural mediators. Journal of Cross-Cultural Psychology
35 (4), 446–459.
Leibovich, M. (2007, Feb 18). Leftward, ho?. New York Times.
Leung, K., Bhagat, R.S., Buchan, N.R., Erez, M., Gibson, C.B., 2005. Culture and international business: recent
advances and their implications for future research. Journal of International Business Studies 36, 357–378.
Lykken, D.T., 1991. What's wrong with psychology anyway? In: Chiccetti, D., Grove, W. (Eds.), Thinking
Clearly about Psychology, vol. 1. University of Minnesota Press, Minneapolis, MN, pp. 3–39.
Lyons, S., Duxbury, L., Higgins, C., 2005. Are gender differences in basic human values a generational
phenomenon? Sex Roles: A Journal of Research 53 (9/10), 763–775.
Marx, K., 1867. Das Kapital: Kritik der politischen Oekonomie. O. Meissner, Hamburg, Germany.
Massialas, B.G., 1977. Education and political development. Comparative Education Review 21 (2/3), 274–295.
Masuda, T., Nisbett, R.E., 2001. Attending holistically versus analytically: comparing the context sensitivity of
Japanese and Americans. Journal of Personality and Social Psychology 81 (5), 922–934.
Maznevski, M.L., DiStefano, J.J., 1995. Measuring culture in international management: the Cultural
Perspectives Questionnaire. The University of Western Ontario Working Paper Series, pp. 95–110.
McSweeney, B., 2002. Hofstede's model of national cultural differences and their consequences: a triumph of
faith–a failure of analysis. Human Relations 55 (1), 89–118.
Mishra, R.C., 1994. Individualist and collectivist orientation across generations. In: Kim, U., Triandis, H.C.,
Kagitcibasi, C., Choi, S.C., Yoon, G. (Eds.), Individualism and Collectivism: Theory, Method, and
Applications. Sage Publications, Thousand Oaks, CA, pp. 225–238.
Miyamoto, Y., Nisbett, R.E., Masuda, T., 2006. Culture and the physical environment: holistic versus analytic
perceptual affordances. Psychological Science 17 (2), 113–119.
Nisbett, R.E., Cohen, D., 1996. Culture of Honor: The Psychology of Violence in the South. Westview Press,
Boulder, CO.
Offermann, L.R., Hellmann, P.S., 1997. Culture's consequences for leadership behavior: national values in
action. Journal of Cross-Cultural Psychology 28 (3), 342–351. Oyserman, D., Coon, H.M., Kemmelmeier, M.,
2002. Rethinking individualism and collectivism: evaluation of theoretical assumptions and meta-analyses.
Psychological Bulletin 128 (1), 3–72.
Rai, S. (2004, Feb. 22). US payrolls change lives in Bangalore. The New York Times, p. 6.
Ralston, D.A., Kai-Cheng, Y., Wang, X., Terpstra, R.H., Wei, W., 1996. The cosmopolitan Chinese manager:
findings of a study on managerial values across the six regions of China. Journal of International Management 2
(2), 79–109.
Ralston, D.A., Holt, D.H., Terpstra, R.H., Kai-Cheng, Y., 1997. The impact of national culture and economic
ideology on managerial work values: a study of the United States, Russia, Japan, and China. Journal of
International Business Studies 28 (1), 177–207.
Ralston, D.A., Pounder, J., Lo, C.W.H., Wong, Y.-Y., Egri, C.P., 2006. Stability and change in managerial
work values: a longitudinal study of China, Hong Kong, and the U.S. Management and Organization Review 2
(1), 61–97.
Raudenbush, S.W., Bryk, A.S., 2002. Hierarchical Linear Models: Applications and Data Analysis Methods, 2
ed. Sage Publications, Thousand Oaks, CA. Rehnquist, W.H., 2000. All the Laws But One: Civil Liberties in
Wartime. Random House Inc., New York.
Ricks, D.A., Toyne, B., Martinez, Z., 1990. Recent developments in international management research. Journal
of Management 16 (2), 219–254.
Roberts, B.W., Walton, K.E., Viechtbauer, W., 2006. Patterns of mean-level change in personality traits across
the course: a meta-analysis of longitudinal Studies. Psychological Bulletin 132,1–25.
Robinson, W., 1950. Ecological correlations and the behavior of individuals. American Sociological Review 75,
351–357.
Rokeach, M., 1973. The Nature of Human Values. Free Press, New York.
Rokeach, M., Ball-Rokeach, S.J., 1989. Stability and change in American value priorities. American
Psychologist 44, 775–784.
Roy, M.A., 1995. The genetic epidemiology of self-esteem. The British Journal of Psychiatry 166 (6), 813–820.
Schaffer, B.S., Riordan, C.M., 2003. A review of cross-cultural methodologies for organizational research: a
best-practices approach. Organizational Research Methods 6 (2), 169–215.
Schaubroeck, J., Lam, S.S., Xie, J.L., 2000. Collective efficacy versus self-efficacy in coping responses to
stressors and control: a cross-cultural study. Journal of Applied Psychology 85 (4), 512–525.
Schein, E.H., 1967. Attitude change during management education. Administrative Science Quarterly 11 (4),
601–628.
Schwartz, S.H., 1994a. Beyond individualism/collectivism: new cultural dimensions of values. In: Kim, U.,
Triandis, H.C., Kagitcibasi, C., Choi, S.C., Yoon, G. (Eds.), Individualism and Collectivism: Theory, Methods
and Applications. Sage Publications, London, pp. 85–119.
Schwartz, S.H., 1994b. The fallacy of the ecological fallacy: the potential misuse of a concept and the
consequences. American Journal of Public Health 84 (5), 819–824.
Sebhatu, P. (1994). Culture's consequences on business leaders in the Middle East with a focus on Saudi Arabia.
Unpublished dissertation, United States International University, San Diego.
Shah, G., 2007. Rising individualism: the impact of economic globalization on the family, firm, and state in
India. Paper presented at the Academy of International Business Annual Meeting, Indianapolis, IN.
Sharpe, D., 1997. Of apples and oranges, file drawers and garbage: why validity issues in meta-analysis will not
go away. Clinical Psychology Review 17 (8), 881–901.
Simeon, R., Nicholson, J.D., Wong, Y.Y., 2001. Comparisons of Asian and US workplace gender roles. Cross
Cultural Management 8 (2), 47–59. Singelis, T.M., 1994. The measurement of independent and interdependent
self-construals. Personality & Social Psychology Bulletin 20 (5), 580–591.
Singelis, T.M., Triandis, H.C., Bhawuk, D.P.S., Gelfand, M.J., 1995. Horizontal and vertical dimensions of
individualism and collectivism: a theoretical and
measurement refinement. Cross-Cultural Research: the Journal of Comparative Social Science 29 (3), 240–275.
Smith, A., 1937. An Inquiry into the Nature and Causes the Wealth of Nations (1776). Reprinted by Random
House, New York.
Smith, P.B., Bond, M.H., 1999. Social psychology across cultures, 2 ed. Allyn and Bacon, Boston, MA.
Sondergaard, M., 1994. Research note: Hofstede's consequences: a study of reviews, citations and replications.
Organizational Studies 15 (3), 447–456. Stedham, Y.E., Yamamura, J.H., 2004. Measuring national culture:
does gender matter? Women in Management Review 19 (5), 233–243.
Steel, P., Ones, D.S., 2002. Personality and happiness: a national-level analysis. Journal of Personality & Social
Psychology 83 (3), 767–781.
Steel, P., Peloza, J., 2006. Hitting the sweet spot: balancing equity and equality to maximize wealth and
happiness. Paper presented at the Academy of Management Annual Meeting, Altanta, GA.
Steensma, H.K., Marino, L., Weaver, K.M., 2000. Attitudes toward cooperative strategies: a cross-cultural
analysis of entrepreneurs. Journal of International Business Studies 31 (4), 591–609.
Stewart, A.J., McDermott, C., 2004. Gender in psychology. Annual Review of Psychology 55 (1), 519–544.
Strauss, W., Howe, N., 1991. Generations: the History of America's Future: 1584 to 2069. William Morrow,
New York, NY.
Sungkhawan, J. (2000). A study of relationships between cultural values and economic variables in thirteen
countries in Asia and Asia Pacific. Unpublished doctoral dissertation, Nova Southeastern University.
Takano, Y., Osaka, E., 1999. An unsupported common view: comparing Japan and the U.S. on
individualism/collectivism. Asian Journal of Social Psychology 2 (3 ), 3 11 –341 . Taras, V. (2008). Work-
related acculturation: change in individual work-related cultural values following immigration. Unpublished
doctoral dissertation, University of Calgary, Canada.
Taras, V., Steel, P., 2006. Improving cultural indices and rankings based on a meta-analysis of Hofstede's
taxonomy. Paper presented at the Academy of International Business Annual Meeting, Beijing, China.
Taras, V., Kirkman, B.L., Steel, P., 2010. Examining the impact of culture‘s consequences: a three-decade,
multi-level, meta-analytic review of Hofstede‘s cultural value dimensions. Journal of Applied Psychology 95
(3), 405–439.
Thau, R.D., Heflin, J.S., 1997. Generations Apart: Xers Versus Boomers Versus the Elderly. Prometheus
Books, Amherst, NY.
Thomas, D.C., Pekerti, A.A., 2003. Effect of culture on situational determinants of exchange behaviour in
organizations: a comparison on New Zealand and Indonesia. Journal of Cross-Cultural Psychology 34 (3), 269–
28 1.
Thorndike, E., 1939. On the fallacy of imputing the correlations found for groups to the individuals or smaller
groups composing them. American Journal of Psychology 52 (1), 122–124.
Tooby, J., Cosmides, L., 1992. The psychological foundations of culture. In: Barkow, J.H., Cosmides, L.,
Tooby, J. (Eds.), The Adapted Mind: Evolutionary Psychology and the Generation of Culture. Oxford
University Press, New York, pp. 19–136.
Triandis, H.C., 1995. Individualism and Collectivism. Westview Press, Boulder, CO.
Trompenaars, F., 1993. Riding the Waves of Culture: Understanding Diversity in Global Business. Irwin
Professional Publishing, Chicago, IL.
Trubisky, P., Ting-Toomey, S., Lin, S.-L., 1991. The influence of individualism-collectivism and self-
monitoring on conflict styles. International Journal of Intercultural Relations 15, 65–84.
Tsui, A.S., Nifadkar, S.S., Ou, A.Y., 2007. Cross-national, cross-cultural organizational behavior research:
advances, gaps, and recommendations. Journal of Management 33 (3), 426–478.
Turkheimer, E., 2000. Three laws of behavior genetics and what they mean. Current Directions in Psychological
Science 9 (5), 160–164.
UNDP, 2006. United Nations Development Programme: Human Development Data. . Retrieved June 10, from
http://hdr.undp.org/hdr2006/statistics/.
Van Der Leeden, R., Busing, F.M.T.A., 1994. First iteration versus igls/rigls estimates in two-level models: a
Monte Carlo study with ML3. Reprint PRM 94-03.
Psychometrics and Research Methodology, Leiden, Netherlands.
Vandello, J.A., Cohen, D., 1999. Patterns of individualism and collectivism across the United States. Journal of
Personality and Social Psychology 77 (2), 279–292. Wagner, J.A., Moch, M.K., 1986. Individualism–
collectivism: concept and measure. Group & Organization Studies 11 (3), 280–303.
Waldron, J., 2003. Security and liberty: the image of balance. Journal of Political Philosophy 11 (2), 191–210.
Watkins, D., Akande, A., Fleming, J., Ismail, M., Lefner, K., Regmi, M., Watson, S., Yu, J., Adair, J., Cheng,
C., Gerong, A., McInerney, D., Mpofu, E., Singh-Sengupta, S., Wondimu, H., 1998. Cultural dimensions,
gender, and the nature of self-concept: a fourteen-country study. International Journal of Psychology 33 (1 ),
17–31. Webber, R.A., 1969. Convergence or divergence? Columbia Journal of World Business 4 (3), 75–84.
Werner, S., 2002. Recent developments in international management research: a review of 20 top management
journals. Journal of Management 28 (3), 277–306. Williamson, D., 2002. Forward from a critique of Hofstede's
model of national culture. Human Relations 55 (11), 1373–1395.
Yamaguchi, S., 1994. Collectivism among the Japanese. In: Kim, U., Triandis, H.C., Kagitcibasi, C., Choi, S.C.,
Yoon, G. (Eds.), Individualism and Collectivism: Theory, Method, and Applications. Sage Publications,
Thousand Oaks, CA, pp. 175–188.
Yu, H.C., Miller, P., 2003. The generation gap and cultural influence: a Taiwan empirical investigation. Cross-
Cultural Management 10 (3), 23–41.