csx q4_2006
TRANSCRIPT

11
Fourth Quarter 2006Earnings Presentation
Fourth Quarter 2006Earnings Presentation
22
Forward Looking DisclosureThis presentation and other statements by the company contain forward-looking statements within the meaning of the Private Securities Litigation Reform Act with respect to, among other items: projections and estimates of earnings, revenues, cost-savings, expenses, or other financial items; statements of management’s plans, strategies and objectives for future operation, and management’s expectations as to future performance and operations and the time by which objectives will be achieved; statements concerning proposed new products and services; and statements regarding future economic, industry or market conditions or performance. Forward-looking statements are typically identified by words or phrases such as “believe,” “expect,” “anticipate,” “project,” and similar expressions. Forward-looking statements speak only as of the date they are made, and the company undertakes no obligation to update or revise any forward-looking statement. If the company does update any forward-looking statement, no inference should be drawn that the company will make additional updates with respect to that statement or any other forward-looking statements.
Forward-looking statements are subject to a number of risks and uncertainties, and actual performance or results could differ materially from that anticipated by these forward-looking statements. Factors that may cause actual results to differ materially from those contemplated by these forward-looking statements include, among others: (i) the company’s success in implementing its financial and operational initiatives, (ii) changes in domestic or international economic or business conditions, including those affecting the rail industry (such as the impact of industry competition, conditions, performance and consolidation); (iii) legislative or regulatory changes; (iv) the inherent business risks associated with safety and security; and (v) the outcome of claims and litigation involving or affecting the company. Other important assumptions and factors that could cause actual results to differ materially from those in the forward-looking statements are specified in the company’s SEC reports, accessible on the SEC’s website at www.sec.gov and the company’s website at www.csx.com.
33
Executive Summary
Michael WardChairman, President andChief Executive Officer
44
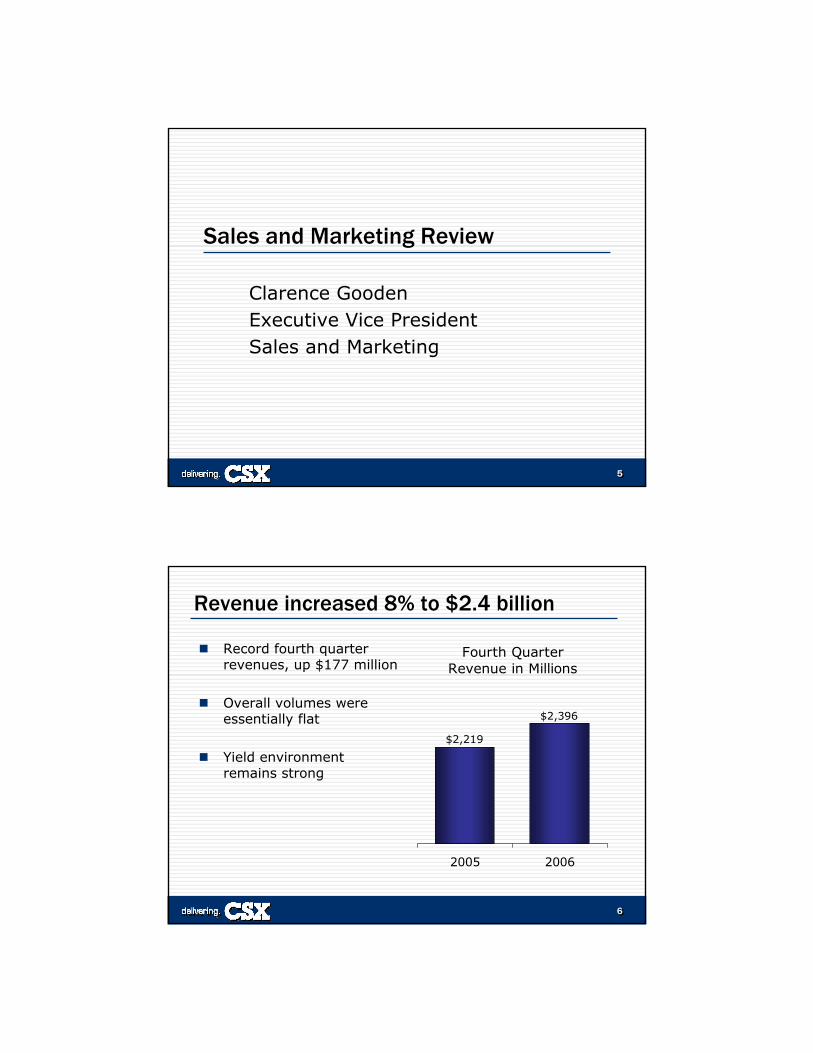
Fourth quarter overview . . .
Surface Transportation produced record results
Yield environment remains strong
Operations building strong service momentum
Economic environment remains positive
Note: Comparable 2006 earnings per share exclude insurance recoveries, a Conrail property gain and income tax benefits
Fourth Quarter Earnings Per Share
$0.52 $0.52
$0.75
$0.57
Reported Comparable
2005 2006
55
Sales and Marketing Review
Clarence GoodenExecutive Vice PresidentSales and Marketing
66
Revenue increased 8% to $2.4 billion
Fourth QuarterRevenue in Millions
2005 2006
$2,219
$2,396
Record fourth quarter revenues, up $177 million
Overall volumes were essentially flat
Yield environment remains strong

77
Revenue per unit increased 8%
Fourth Quarter Revenue Per Unit2006 versus 2005
8%
(2%)
4%
11%
11%
Surface Transportation
Intermodal
Automotive
Coal
Merchandise
88
Price continues to drive RPU growth
Year-Over-Year Change
6.6%6.7%6.8%6.2%6.3%5.6%6.0%4.8%
8.6%9.6% 9.0%
11.0% 11.7%12.6%
11.8%
8.4%
Q12005
Q22005
Q32005
Q42005
Q12006
Q22006
Q32006
Q42006
Price Increase on 'Same Store Sales' Total Revenue per Unit
Note: Price increases on a ‘Same Store Sales’ basis excludes fuel surchargeand mix impacts

99
Merchandise revenue increased 9%
Fourth Quarter2006 versus 2005
9%
(3%)
11%
Revenue Volume RPU
19th consecutive quarter of revenue growth
Pricing environment remains strong
Volumes soft in several markets, partially offset by Agricultural growth
1010
Coal revenue increased 16%
Fourth Quarter2006 versus 2005
16%
5%
11%
Revenue Volume RPU
Strong demand continues in certain markets
Utility inventories are at target levels
Continued favorable pricing environment

1111
Automotive revenue decreased 7%
Fourth Quarter2006 versus 2005
(7%)
(10%)
4%
Revenue Volume RPU
Volume down on production declines
New Domestics continue to gain market share
Pricing opportunities continue
1212
Intermodal revenue decreased 2%
Fourth Quarter2006 versus 2005
(2%)
0%
(2%)
Revenue Volume RPU
Overall volume flat; international growth offset domestic declines
Mix impacted overall revenue-per-unit; pricing environment still favorable
Operating Income— Declined in Q4— Improved for full year— 2007 outlook positive

1313
First quarter revenue outlook positive
AutomotiveEmerging Markets
Food & Consumer
Forest Products
Agricultural Products
Chemicals
Coal, Coke & Iron Ore
Intermodal
Metals
Phosphate & Fertilizer
UnfavorableNeutralFavorable
1414
Looking forward . . .
Economic Forecast2007-2008
2.3%
3.2%
1.8%2.1%
2007 2008
GDP Industrial Production
GDP and IDP forecasted at about 2% to 3%
Continued strong pricing environment
Short-term volume weakness; long-term strength
Service and capacity improvements will support growth
1515
Operations Review
Tony IngramExecutive Vice PresidentChief Operating Officer
1616
Leadership, discipline and execution
Safety performance improving
Positive operating trends continue
Asset utilization improving
SafetySafety
ProductivityProductivity
ServiceService
LeadershipLeadership
DisciplineDiscipline
ExecutionExecution
ReliablePerformance
ReliablePerformance
1717
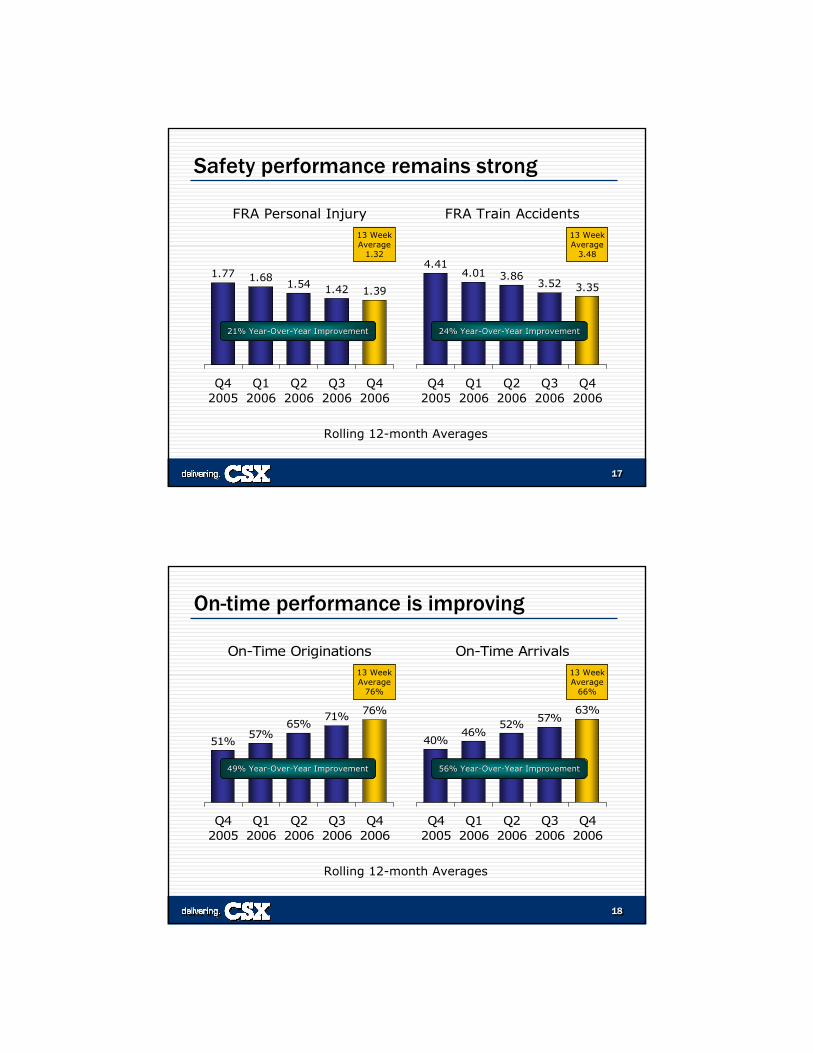
Safety performance remains strong
Rolling 12-month Averages
FRA Personal Injury
1.77 1.681.54 1.42 1.39
Q42005
Q12006
Q22006
Q32006
Q42006
FRA Train Accidents
4.414.01 3.86
3.52 3.35
Q42005
Q12006
Q22006
Q32006
Q42006
13 WeekAverage
1.32
13 WeekAverage
3.48
21% Year21% Year--OverOver--Year ImprovementYear Improvement 24% Year24% Year--OverOver--Year ImprovementYear Improvement
1818
On-time performance is improving
Rolling 12-month Averages
On-Time Originations
51%57%
65%71% 76%
Q42005
Q12006
Q22006
Q32006
Q42006
On-Time Arrivals
40%46%
52%57%
63%
Q42005
Q12006
Q22006
Q32006
Q42006
13 WeekAverage
76%
13 WeekAverage
66%
49% Year49% Year--OverOver--Year ImprovementYear Improvement 56% Year56% Year--OverOver--Year ImprovementYear Improvement
1919
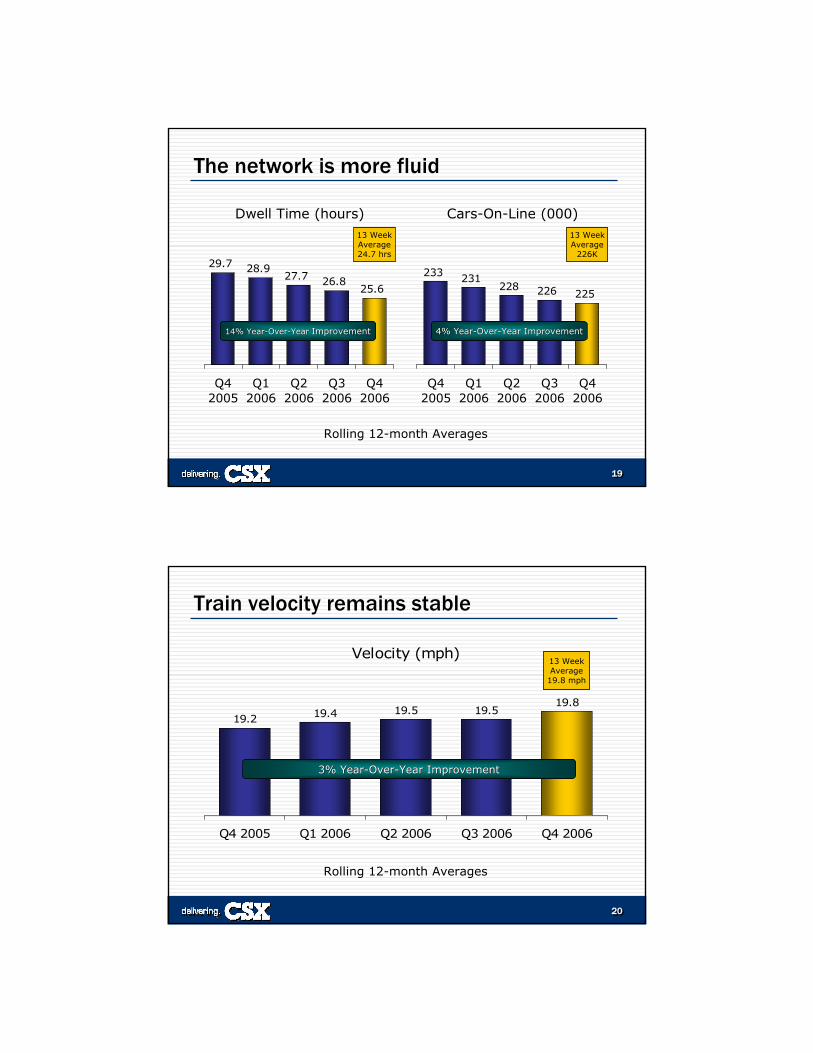
The network is more fluid
Rolling 12-month Averages
Cars-On-Line (000)
233 231228 226 225
Q42005
Q12006
Q22006
Q32006
Q42006
Dwell Time (hours)
29.7 28.927.7 26.8
25.6
Q42005
Q12006
Q22006
Q32006
Q42006
13 WeekAverage24.7 hrs
13 WeekAverage
226K
14% Year14% Year--OverOver--Year Year ImprovementImprovement 4% Year4% Year--OverOver--Year ImprovementYear Improvement
2020
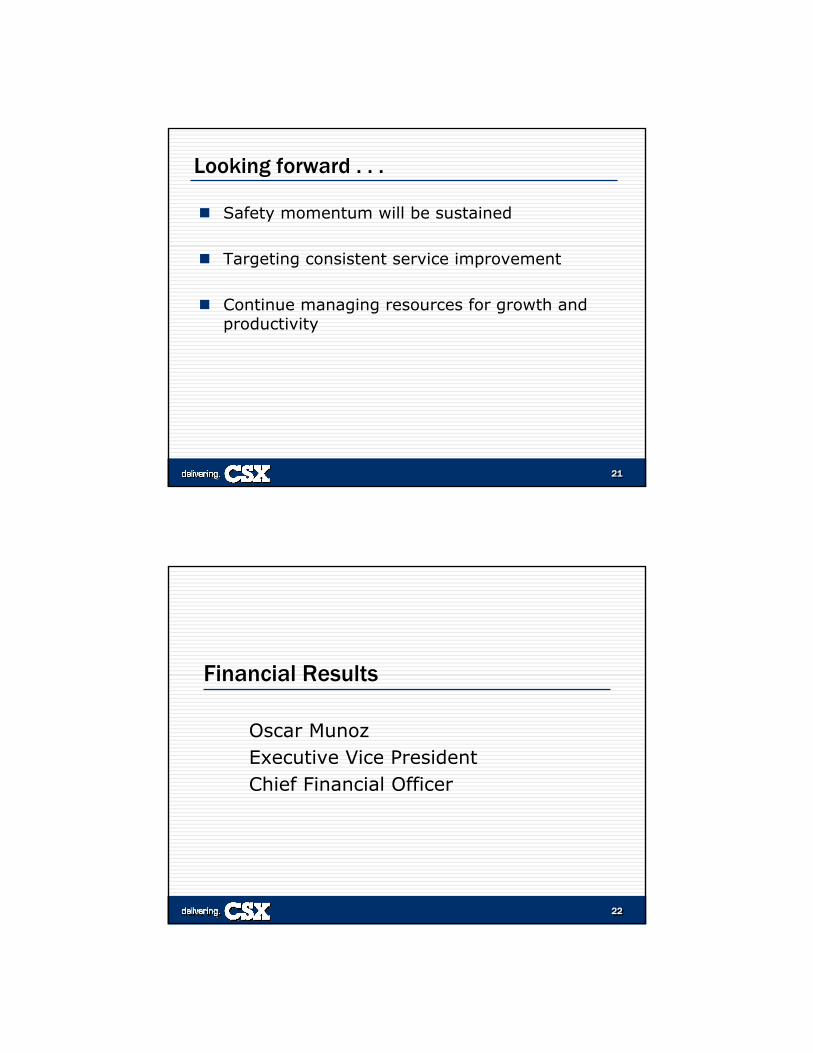
Train velocity remains stable
Velocity (mph)
19.2 19.4 19.5 19.519.8
Q4 2005 Q1 2006 Q2 2006 Q3 2006 Q4 2006
13 WeekAverage
19.8 mph
3% Year3% Year--OverOver--Year ImprovementYear Improvement
Rolling 12-month Averages
2121
Looking forward . . .
Safety momentum will be sustained
Targeting consistent service improvement
Continue managing resources for growth and productivity
2222
Financial Results
Oscar MunozExecutive Vice PresidentChief Financial Officer
2323
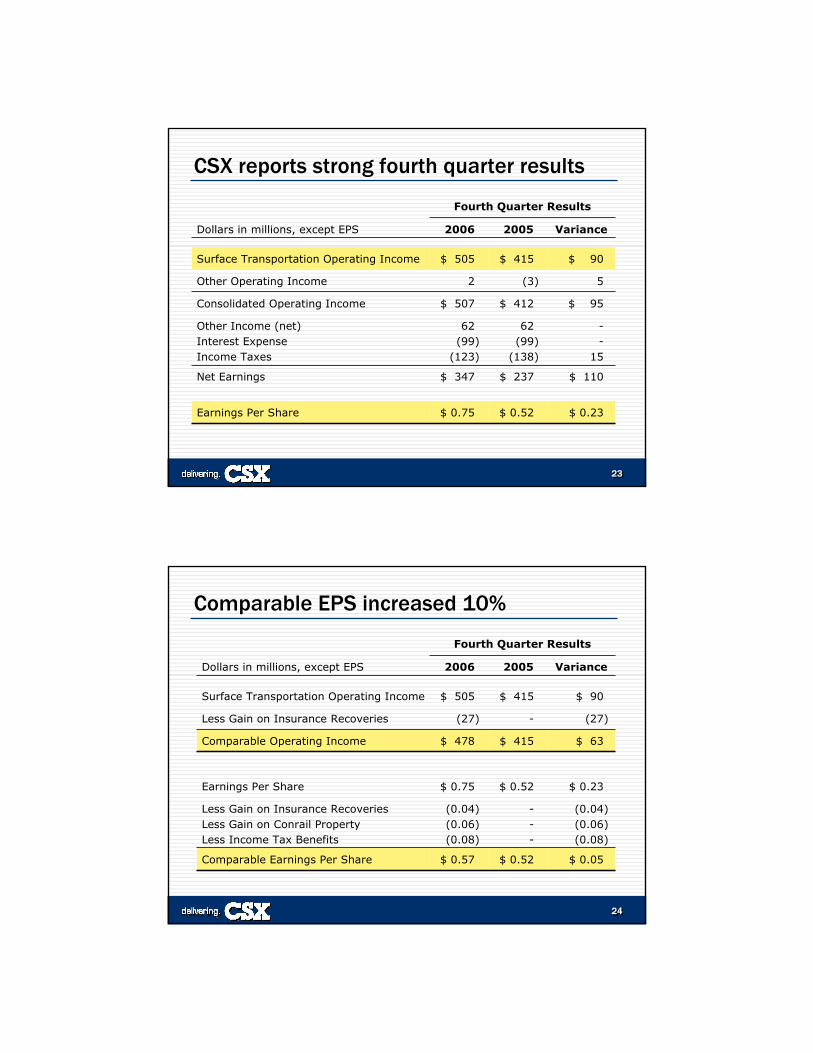
CSX reports strong fourth quarter results
$ 110$ 237$ 347Net Earnings
$ 0.23$ 0.52$ 0.75Earnings Per Share
--
15))
62(99
(138))
62(99
(123
Other Income (net)Interest ExpenseIncome Taxes
$ 95$ 412$ 507Consolidated Operating Income
5)(32Other Operating Income
$ 90$ 415$ 505Surface Transportation Operating Income
Variance20052006Dollars in millions, except EPS
Fourth Quarter Results
2424
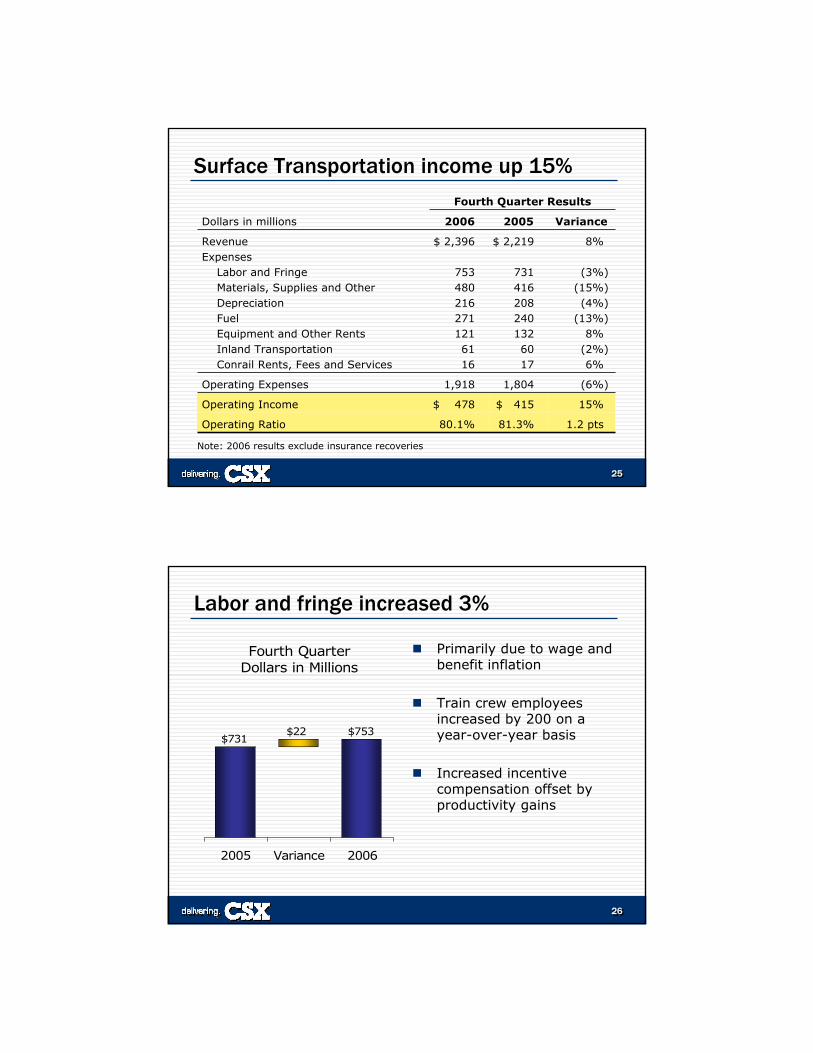
Comparable EPS increased 10%
)))
(0.04(0.06(0.08
---
)))
(0.04(0.06(0.08
Less Gain on Insurance RecoveriesLess Gain on Conrail PropertyLess Income Tax Benefits
$ 0.05$ 0.52$ 0.57Comparable Earnings Per Share
$ 0.23$ 0.52$ 0.75Earnings Per Share
$ 63$ 415$ 478Comparable Operating Income
)(27-)(27Less Gain on Insurance Recoveries
$ 90$ 415$ 505Surface Transportation Operating Income
Variance20052006Dollars in millions, except EPS
Fourth Quarter Results
2525
Surface Transportation income up 15%
15%$ 415 $ 478Operating Income
1.2 pts81.3%80.1%Operating Ratio
)(6%1,8041,918Operating Expenses
))))
)
8%
(3%(15%(4%
(13%8%
(2%6%
$ 2,219
7314162082401326017
$ 2,396
7534802162711216116
RevenueExpenses
Labor and FringeMaterials, Supplies and OtherDepreciationFuelEquipment and Other RentsInland TransportationConrail Rents, Fees and Services
Variance20052006Dollars in millions
Fourth Quarter Results
Note: 2006 results exclude insurance recoveries
2626
Labor and fringe increased 3%
Primarily due to wage and benefit inflation
Train crew employees increased by 200 on a year-over-year basis
Increased incentive compensation offset by productivity gains
Fourth QuarterDollars in Millions
$753$731
$22
2005 Variance 2006

2727
MS&O increased 15%
Consistent with third quarter 2006 expense
Cycling prior year favorability in casualty and other reserves
Driven by higher than historical inflation levels
Fourth QuarterDollars in Millions
$480
$416
$64
2005 Variance 2006
2828
Fuel increased 13%
Fourth QuarterDollars in Millions
$271$240
$31
2005 Variance 2006
Consumed 150 million gallons at average gross price of $1.81
Comparison impacted by $58 million in lower hedge

2929
Rents decreased 8%
Fourth QuarterDollars in Millions
$121$132 ($11)
2005 Variance 2006
Lower Automotive and Merchandise volumes
Asset utilization driven by improved operations
3030
All other expenses increased 3%
Fourth QuarterDollars in Millions
$208 $216
$60 $61
$8
2005 Variance 2006
$285 $293
Depreciation Inland Transportation Conrail Fees
$17 $16

3131
Comparable full year EPS increased 31%
))))
(0.22(0.06(0.16(0.27
)
--
(0.160.27
)))
(0.22 (0.06(0.32
-
Less Gain on Insurance RecoveriesLess Gain on Conrail PropertyLess Income Tax BenefitsPlus Debt Repurchase Expense
$ 0.52$ 1.70$ 2.22Comparable Earnings Per Share
$ 1.23$ 1.59$ 2.82Earnings Per Share
$ 409$ 1,549$ 1,958Comparable Operating Income
)(168-)(168Less Gain on Insurance Recoveries
$ 577$ 1,549$ 2,126Surface Transportation Operating Income
Variance20052006Dollars in millions, except EPS
Full Year Results
3232
Record 2006 Surface Transportation results
Comparable Surface Transportation Operating Income in Millions
$902$1,064
$1,549
$1,958
2003 2004 2005 2006Note: Results for 2003, 2004 and 2006 exclude provisions for casualty claims,
restructuring charges and insurance recoveries

3333
Building momentum to the mid-70’s
Comparable Surface TransportationOperating Ratio
87.9%86.8%
82.0%
79.5%
2003 2004 2005 2006Note: Results for 2003, 2004 and 2006 exclude provisions for casualty claims,
restructuring charges and insurance recoveries
3434
Growing cash supports steady investment
Free Cash FlowDollars in Millions
$281
$500
$361
2006 2007
12%
12%
58%
18%
2007 Capital Spending$1.4 Billion
Infrastructure New Capacity
Locomotive Cars & OtherInsurance Recoveries
Note: Insurance recoveries reflect current estimate

3535
Financial wrap-up . . .
Record results for Surface Transportation
Strong momentum in operating ratio
Improving 2007 cash flows with steady investment in the business
Reaffirm 2010 long-range financial targets
3636
Concluding Remarks
Michael WardChairman, President andChief Executive Officer

3737
Looking forward . . .
Producing strong results for shareholders
Industry positioned to continue its renaissance
Leveraging better service for profitable growth
Targeting greatest success in our 180th year
Demand forDemand forTransportationTransportationRemains HighRemains High
SupplySupplyChains areChains areExtendingExtending
TruckingTruckingRemainsRemains
ChallengedChallenged
3838
Fourth Quarter 2006Earnings Presentation
Fourth Quarter 2006Earnings Presentation