csdms.colorado.edu · web viewpredicted effects of future dams and levees on flood hydrology,...
TRANSCRIPT

Predicted Effects of Future Dams and Levees on Flood Hydrology, Sediment Fluxes, and Deltas: Implications for Sustainable River Management
G. Robert Brakenridge, Ph.D., Fluvial processes and remote sensingAlbert Kettner, Ph.D., Modeling of river discharge and sediment load
Irina Overeem, Ph.D., Modeling of rivers, deltas and overbankingJames Syvitski, Ph.D., Delta processes and coupled model development
All at:Community Surface Dynamics Modeling System (CSDMS)
University of ColoradoCampus Box 450
Boulder, CO 80309-545 USA
Chris Sneddon, Ph.D, Water PolicyColeen Fox, Ph.D., Water Policy
Dept. of GeographyDartmouth College
Hanover, NH 03755 USA
ContentsSynopsis...........................................................................................................................................2
Introduction......................................................................................................................................3
Methods...........................................................................................................................................3
Observational Data..........................................................................................................................3
Modeling..........................................................................................................................................3
Plan of Work....................................................................................................................................3
Budget..............................................................................................................................................3
References Cited..............................................................................................................................3
Synopsis
LOI ID: L02118070. Structure-based river engineering has transformed drainage networks in the developed nations
and continues to rapidly transform them in many other nations. Levees increasingly confine flood discharges within channels, including on deltas where diverging flow formerly occurred. We are an interdisciplinary team including expertise in fluvial processes, modeling of discharge and sediment yield, delta processes, remote sensing, and international water resources policy and treaties. Our team has identified a preliminary set of 36 large river basins for which major dams and levee systems are still

planned or under construction and which include, downstream, large human populations who will be affected by such modifications. Even while such structures are under construction, however, the design lives of many US dams and reservoirs have been exceeded, and restoration of pre-existing flow regimes and riverine ecosystems is underway (dams and levees are being removed). Improved knowledge concerning the services provided by natural floodplains is motivating this change. Although major water projects have cumulative and extra-local effects, commonly across international borders, relevant surface water data are not freely shared: this has constrained independent scientific evaluation of the their aggregate effects. To address this issue, members of our team have previously employed advanced modeling techniques on global watersheds, and also produced remote sensing data that can parameterize and validate such models. These data, commencing in year 2000, offer critical advantages over in situ measurements, including consistency across trans-boundary watersheds, better spatial and temporal sampling, non-interruption during floods, and unique observations of flood inundation extent. Accurate prediction of the future human-induced changes to river basin hydrology that will occur from structural modifications can now be achieved: by a combination of advanced modeling and the new hydrological data. Our project will evaluate the cumulative effects of river engineering on flood discharge regime, on net flood hazard, and on the fluxes of sediment from upstream catchment areas to the river mouths. The focus is on the several dozen basins where numerous dams are under construction or being planned, and where large downstream populations along coastlines, deltas, and inland deltas will be affected.
IntroductionStructure-based river engineering has transformed drainage networks in the developed nations
and continues to rapidly transform them in most other nations (1). Levees increasingly confine flood discharges within channels, including on deltas where diverging flow formerly occurred. There are 46 large river basins for which major dams were planned or under construction, as of 2003 (1). Meanwhile, the design lives of many US dams and reservoirs are currently being exceeded, and, instead of rebuilding, restoration of pre-existing flow regimes and riverine ecosystems is locally underway. This has resulted from improvements in scientific knowledge, which better quantify the beneficial role of natural floodplains within integrated basin management (2). In many developing nations, however, and in response to increasing needs for effective national control over freshwater, major dam and levee projects are still being planned or built, even as their potential long term effects are incompletely understood and even as such projects increase international tensions (e.g. China and Vietnam, Mekong; Nepal, India and Bangladesh, Ganges; Turkey, Syria, and Iraq, Euphrates).
Although major water projects have cumulative and extra-local effects, surface water data relating to them are not freely shared. This constrains independent scientific evaluation of the combined surface process effects of river control projects. For levees, these effects may include the downstream export of flood hazard (increased magnitude and frequency of flooding), increased frequency of erosive bank-full flows, increased volume of runoff from storm events, faster stream velocities, increased exports of excess nutrients and pollutants, and reductions in local water recharge and suspended load sedimentation. For dams, the effects may include major reductions in downstream sediment concentration, reservoir bed sedimentation and increased sedimentation along adjacent upstream floodplains, changed flow regime, fragmentation of aquatic habitats, and, when local agricultural projects are included, decreased downstream water export and water quality. We consider that quantification of such human-induced changes to river basin hydrology can now be improved by a combination of advanced modeling and new, remote sensing-based methods of obtaining the hydrological data which are fundamental to model calibration and validation. It has thereby become

possible to evaluate the cumulative effects of river engineering on flood discharge regime, on changes in net flood hazard, and on the fluxes of sediment from upstream catchment areas to the river mouths.
Significant efforts have been made to improve the availability of river discharge data (ref). However, new measurement technologies are also available, and include microwave and optical sensors. Remote sensing data sets already available can now make a significant contribution to consistent characterization of river discharge and including major flood events (3, 4). Such measurements provide critical advantages over those obtained by in situ stations, including: a) consistent discharge data are retrieved across trans-boundary watersheds (5) , b) they can be obtained even where in situ data are sparse due to access or infrastructure support problems (6), c) measurements occur without interruption during floods, which quite commonly destroy the ground stations, and d) observations of floodplain inundation extent can be obtained (7). This last capability offers hydrologists the opportunity to observe inundation (overbank flow and storage) changes along 100s of km of floodplain length, at frequent time intervals, during the waxing and waning stages of normal, seasonal flooding, as well as during rare events.
This project will address an urgent and specific challenge in sustainable river management. Understanding how, in aggregate, human modifications affect floods and flood-mediated fluxes of sediment is important not only for predicting coastal zone stability and natural hazards (e.g. flooding and delta subsidence; (8)) but also for evaluating long term trends where inland deltas and wetlands support critical agricultural economies and ecosystems (e.g. the San Joaquin/Sacramento watersheds of California; Ganges/Brahmaputra in Bangladesh, many other locations). At least 46 river basins will soon experience significant modification by large dams (as many as 49 dams per basin) and associated control structures (1, 9), and, as noted, it is now possible to predict their effects. There are additional river basins, as well, wherein planned or under-way modifications are not quite as extensive, but where downstream effects will intersect with very large human populations; these should be included as well in our study. We have designed work which will, first, identify those basins most urgently in need of study, and then provide numerical predictions concerning the effects of the planned structures on watershed hydrology, including downstream flow regime, aggregate flood hazard and sediment fluxes and delivery.
The work flow includes the following specific tasks: 1) identification of the urgent study basins, 2) production of basin development “blueprints” detailing dam and control structures planned or under construction, including location, size, and assessment of their probable operations and sediment trapping efficiencies; 3) compilation of available in situ discharge and sediment concentration data and also the remote sensing-based discharge data, 4) translation of floodplain inundation information, for the time period 2000-2010, into basin-wide maps and area values, 5) enhancement of flow routing models to accommodate areas of divergent flow, 6) parameterization, initialization, and calibration, of the enhanced flow and sediment routing models, 7) comparison of model runs with and without the control structures, 8) final assessment and publication of the model results predicting future alteration of downstream flow regime, sediment fluxes, flood hazard, and delta stability and in the context of each basin’s international water treaty and other management policy aspects.
Identification of the Urgent Study BasinsWe use as two criteria: a) the number and size of the planned structural modifications and b) the
size of the populations which will be affected. Prior compilations provide a guide to where many large future structures will be built (9) .Table 1 is a tentative list of 21 basins from such work, which will be updated and finalized at the start of this project. In particular, large dams are being planned for several

African basins and where large populations inhabit the associated deltas, but are not yet listed here. We have excluded river basins where many structures are planned, but where population the river mouth is less than 1 million. Figure 1 shows the river mouths and any associated deltas;
water and sediment from a total of km2 of the Earth’s land area is routed to these river mouths, so from about x%.
The 21 top river basins highlighted here include all those basins that have 6 or more large dams planned or underconstruction as of 2003. In addition, there are 6 basinswhich have four or five large dams planned or underconstruction. These include the Orinoco and Magdalenabasins in South America, the Sittong in Myanmar, theRed River in China and Vietnam, the Dez Karun in Iranand the Ceyhan in Turkey.Additionally, there are river basins with two or three largedams planned or under construction, including the Nilein northeast Africa, the Acheloos and Axios-Vardarbasins in Greece and the Balkans, the Göksu in Turkey,the Narmada in India and the Rio Colorado in Argentina.Finally, there are many basins with at least one largedam planned or under construction. The remainingdams are located in small coastal basins for which abasin boundary with sufficient detail was not available.These are represented in the global and regional mapsas approximate point locations (blue triangles).As the impacts of dams are site-specific, it is difficult tomake clear assessments of the basin wide impactswithout a detailed examination of each project, whichwas beyond the scope of this study. However, from theexperience of existing dams, it is clear that thecumulative impacts of a succession of dams are aparticular problem. These impacts are likely to be worsewhere there is a large number of new dams in arelatively small basin, in particular one that is relativelyunaffected. In this light the plans for 16 dams in the
Salween basin are of particular
Basin Basin Size Number of Large DamsYangtze 1722 46La Plata 2880 27Tigris and Euphrates 766 26Salween 272 16KizilirmakGangesTocantinsAmazon

MekongBrahmaputraZhu Jiang (Pearl)DanubeHwang He (Yellow)Kura-AraksYesilirimakBuyuk MenderesCoruhSusurlukEbroIndusQezel Owzan
Figure 1. Location of river mouths for basins with highest number of large dams planned and under construction (dams > 60 m and > 100MW).
Basin Development Blueprints

Compilation of Discharge and Sediment Concentration Data
Flood Inundation Information, 2000-2010
Model Enhancement to Accommodate Divergent Flow
Basin Model Initializations
Comparison of Model Runs With and Without Control Structures
Final Assessment and Publication of Model Results and Predicted Effects
Understanding how, in aggregate, human modifications affect floods and flood-mediated fluxes of sediment is important not only for predicting coastal zone stability and natural hazards (e.g. flooding and delta subsidence; (8)) but also for evaluating long term trends where inland deltas and wetlands support critical agricultural economies and ecosystems (e.g. the San Joaquin/Sacramento watersheds of California; Ganges/Brahmaputra in Bangladesh).

Existing community surface process models, including…. now provide powerful tools for understanding water cycle modifications caused by river control structures and other watershed modifications (10). The modeling approach exploration of important questions such as: 1) what is the expected sediment delivery to a delta, or to tributary river mouths, from major flood events, with and without upstream levees and dams? 2) How are flood waves within a watershed modified with and without such structures? And 3) How important are flood events in determining seasonal and yearly fluxes of water and sediment, and how does that significance vary among basins? Such information is necessary in order to evaluate the importance of individual project effects, and to compare the contributions made to trunk stream fluxes from different contributing watersheds.
Our team will incorporate two new sets of hydrologically-relevant measurements: 1) a very large global archive (hundreds of mapped floods, with multiple time steps for each) of GIS data providing flood inundation limits determined by orbital satellite sensors, and 2) the results of Dartmouth’s microwave sensor-based “River Watch” processor, which provides daily discharge estimates at ~2500 sites, again distributed globally. These estimates are not as precise as that from in situ stations, but previous work has demonstrated that especially flood hydrographs are well-characterized (11),and the existing array and period of record (2000-present), together with inundation mapping, provides an unusual opportunity to characterize in detail major flood events and in tandem with modeling of these same events.
Research Questions
concern.
Recent (past 10 years) major floods along critical US and international rivers provide the focus of our research. We consider that, on a global scale, major flood events occur each year and should inform our science. They result in enormous dollar damage losses, severe environmental/ecological effects, and significant loss of human life. These events are directly relevant to consideration of new water control structures, and to the possible implementation, instead, of non-structural approaches to flow regulation (12). Modeling and measurements of actual events also provides a clear path towards near-future predictive capability: these events actually occurred, they will likely occur again, and our work can highlight the capabilities that human intervention has to affect their outcomes.
To select flood events and river basins for study, we examined the Dartmouth Flood Observatory (http://www.dartmouth.edu/~floods/) online archive, which extends from 1985- present, and retrieved the 50 largest events (on the Dartmouth magnitude scale) that occurred in the past 10 years. These floods occurred in China, India, Australia, Africa, the USA, and South America. In order to avoid the need for new data collection, we then obtained a subset of those events, whose associated inundation extents have already been extensively mapped, with GIS data resident in the Dartmouth archives. In addition, to ensure representation of rivers and watersheds where major water control structures are being planned, or where flood and water supply issues are in contention, we chose additional, already-mapped flood events for: the Rio Grande (USA/Mexico), the Sacramento/San Joaquin (USA), the Magdalena

(Columbia), the Helmand (Afghanistan and Iran), the Euphrates (Turkey, Syria, and Iraq), the Kosi (Nepal/India), the Irrawaddy (Burma/Myanmar), the Mekong (China, Cambodia, Thailand and Viet Nam), and the Danube. No floods involving storm surges along coastlines are included With these selection criteria, major flood events along 32 important rivers are available for study. Discharge hydrographs for these events have been measured and discharge and sediment fluxes will be modeled, from headwaters to the mouths.
Table 1. List of selected river basins and flood events for study
River(s) Nation(s) Flood (Start Date)
Rio Grande USA, Mexico
Sacramento/San Joaquin USA
Lower Ohio, Mississippi USA March 17, 2008
Magdalena Columbia
Grijalva, Puxcatan, Carrizal Mexico October 28, 2007
Panuco, Motaqua Mexico September 6, 2007
Mamore, Guapore Bolivia, Paraguay December, 2007
Rio Grande, Pilcomayo, San Juan Boliva January 10, 2007
Helmond Afghanistan, Iran
Euphrates Turkey, Syria, Iraq
Nile Many July 3, 2007
Zambezi, Buze, Pungue, Save Zimbawe, Mozambique December 11, 2007, January 3, 2007
Logone Chad August 25, 2007
Okok, Okere Kenya and Uganda August 15, 2007
Shabelle, Juba Ethiopia, Somalia October 27, 2006
Niger and Benue Nigeria August 4, 2007
Ganges Nepal, India July 3, 2007
Mahanadi India August 1, 2006
Irrawaddy Burma
Mekong , Tonle Sap Many
Danube Many
Queensland rivers Australia January 14, 2008

Our analysis will make use both of advanced modeling techniques, and new and highly relevant measurements that have not previously been available. We will:
Our strategy is to compare, on a reach by reach basis, model results and observational data concerning flood wave attenuation, local water recharge, flood runoff volumes, and routing of suspended load sediment and organic material, and then examine how, basin-wide, the effects of particular large flood events were ameliorated or intensified.
Recent research on floodplains includes attempts to provide numerical or monetary estimates of the various services provided by floodplain ecosystems (for example, N removals during overbank flooding constitute a service whose monetary value can be assessed) (2). Our team will develop geophysical measurements of the hydrological behavior of unregulated floodplains during large floods: for example, measures of reduced flood water volume exiting a reach, and flood wave attenuation and retardation. However, the beneficial effects on surface processes provided by floodplains, within particular economies and among varied physiographic regions, are not best characterized by geophysical statistics in isolation (N removals may not be economically or ecologically valuable at all in some situations). Instead, such information is best recast as appropriate to local circumstances, economies, and societal needs. Our team includes two human geographers specializing in water resources policy problems and issues. As part of our work, they will incorporate the observational and modeling results into numerical value estimates allowing comparison of
For example, along the Mississippi, an extensive but incomplete levee and lock system along major tributaries such as the Illinois and Iowa rivers protect local agriculture and facilitate navigation, whereas some unregulated reaches help retard flood waves.
for at To better understand the synoptic scale-tradeoffs between permitting overbank flow during floods, and, instead, confining flow to river channels via major structure approaches, more knowledge is needed of watershed mass balances and fluxes of sediment and water during large floods. As applied at the river basin scale, new observational technologies (remote sensing of flood discharge and overbank flow), combined with modeling, can constrain the uncertainties. By comparing simulations and remote- sensing-measured responses, we can evaluate the net effects of confined flow along different river systems, even where little in-situ station data are available
The concept of “sustainable development” poses an ideal: that local economic development and prosperity can benefit by thoughtful analysis of long term regional societal costs associated with different development trajectories. A common example is planning for large dams and reservoirs that will clearly have some positive local benefits, but whose perceived utility may suffer if long term and regional effects are also considered. Assisted by numerical modeling, hydrological scientists can predict the effects of watershed landuse on river runoff, flood regime, and sediment transport, and of river “training”, via levees and dams, on downstream sediment and water transport, and overbank flooding. Thus, in the short term and on a local spatial scale, river engineering projects provide greater human control over the water cycle and provide economic benefits. In the longer term, however, watersheds are connected landscapes; like the atmosphere, changes in one location affect others, and some changes, slowly accumulating over time, can set the stage for catastrophic events.

For example, after the Great Flood of the Upper Mississippi Valley, in 1993, and again in the wake of hurricane Katrina in 2005, attention turned to the role of human modifications in making the effects of these extreme events even more intense. The effects of dams and levees in the Upper Mississippi basin were dramatically illustrated during the flood when predicted crests did not materialize (due to upstream levee failures). Post-flood controversy included supporters of the traditional structural approaches to flood control (many levees did protect cities during this event; most levees which failed were not built to high standards) as well as proponents of returning the mainly agricultural flooded lands “to the river” (the engineering works which protect them should be removed in order to attenuate downstream flood waves). After Katrina, controversy similarly raged over the effects of the various engineering works (notably the Mississippi River Gulf Outlet) on accentuating the storm surge, and also on the possibility that the location of New Orleans itself is unsustainable given progressive delta subsidence and sea level rise, and the necessary levee-protected confinement of an aggrading Mississippi channel.
According to new modeling and field observations by a team from Louisiana State University, the Mississippi River Gulf Outlet (MRGO), a 200-meter-wide (660-foot-wide) canal designed to provide a shortcut from New Orleans to the Gulf of Mexico, helped provide a funnel for the storm surge, making it 20% higher and 100%-200% faster as it crashed into the city. St. Bernard Parish, one of the more devastated areas, lies just south of the MRGO. The Army Corps of Engineers disputes this causality and maintains Katrina would have overwhelmed the levees with or without the contributing effect of the MRGO.[132] The water flowing west from the storm surge was perpendicular to MRGO, and thus the canal had a negligible effect.
On April 5, 2006, months after independent investigators had demonstrated that levee failures were not caused by natural forces beyond intended design strength, Lieutenant General Carl Strock testified before the United States Senate Subcommittee on Energy and Water that "We have now concluded we had problems with the design of the structure."[133] He also testified that the U.S. Army Corps of Engineers did not know of this mechanism of failure prior to August 29, 2005. The claim of ignorance is refuted, however, by the National Science Foundation investigators hired by the Army Corps of Engineers, who point to a 1986 study by the Corps itself that such separations were possible in the I-wall design.
(2) replacement costs of wetlands
Many Scandinavian studies put their focus on the nutrient load to the Baltic sea and then analysedifferent pollution abatement strategies. These include on the one hand, investments in wetlandconstruction or restoration as well as investments in sewage treatment plants and, on the other hand toagricultural measures such as reductions in fertiliser input (and related reduced revenues). ThusByström (1998, 2000) estimates the benefit of wetlands in the catchment area of the Baltic Sea withregard to a defined reduction goal (e.g. 50%) by comparing the cost effectiveness of two differentpolitical scenarios (with and without wetland) for the reduction on the non-point nitrogen pollutionfrom agricultural areas. The replacement value is defined as the savings in total abatement costs thatare made possible by using wetlands as an abatement measure in cost-effective reduction of nitrogenload to the Baltic Sea. (Byström 2000:347). However, in this study the wetlands consideredencompass only areas permanently influenced by water and whose restoration enhances the nutrientretention during the subsurface water transport to the stream; a process which takes place anyway.This approach is comparable to the method which is pursued in the context of other studies concerning

the Baltic Sea which aimed to obtain the value of wetlands by estimating the marginal cost of two
In summary regarding the ecological service ‚improvement of water quality‘, the replacement costmethod seems to be the most common approach and, despite still existing methodological problems,the most appropriate. Hence, if specific ecosystem functions can alternatively be achieved by atechnical substitute, then the cost of this substitute to replace this function can be regarded as theeconomic value of the wetland’s service (see also Gren et al. 1994; Byström 2000; Mitch, Gosselink2000). As a reference condition, usually an environmental standard e.g. a defined water quality, isconsidered. If the ecosystem service to maintain this water quality standard is lost, then suitablealternative measures have to be considered and the related costs, e.g. investments in sewage treatmentplants, can be taken into account when evaluating the (lost) ecosystem service
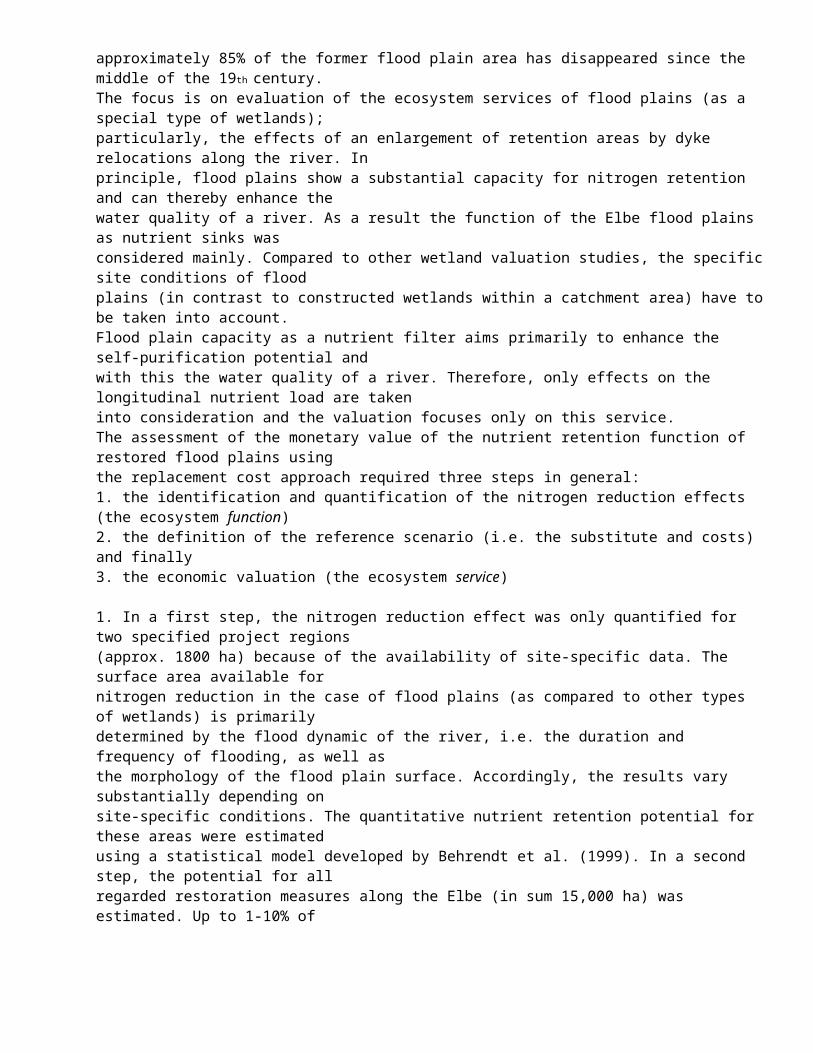
Within the project ‘Monetary valuation of a sustainable development along the river Elbe’, themonetary value of changes in ecological services due to restoration measures is assessed. Due to floodprotection measures, requirements of navigation and agricultural use of river banks along the Elbe,approximately 85% of the former flood plain area has disappeared since the middle of the 19th century.The focus is on evaluation of the ecosystem services of flood plains (as a special type of wetlands);particularly, the effects of an enlargement of retention areas by dyke relocations along the river. Inprinciple, flood plains show a substantial capacity for nitrogen retention and can thereby enhance thewater quality of a river. As a result the function of the Elbe flood plains as nutrient sinks wasconsidered mainly. Compared to other wetland valuation studies, the specific site conditions of floodplains (in contrast to constructed wetlands within a catchment area) have to be taken into account.Flood plain capacity as a nutrient filter aims primarily to enhance the self-purification potential andwith this the water quality of a river. Therefore, only effects on the longitudinal nutrient load are takeninto consideration and the valuation focuses only on this service.The assessment of the monetary value of the nutrient retention function of restored flood plains usingthe replacement cost approach required three steps in general:1. the identification and quantification of the nitrogen reduction effects (the ecosystem function)2. the definition of the reference scenario (i.e. the substitute and costs) and finally3. the economic valuation (the ecosystem service)
1. In a first step, the nitrogen reduction effect was only quantified for two specified project regions(approx. 1800 ha) because of the availability of site-specific data. The surface area available fornitrogen reduction in the case of flood plains (as compared to other types of wetlands) is primarilydetermined by the flood dynamic of the river, i.e. the duration and frequency of flooding, as well asthe morphology of the flood plain surface. Accordingly, the results vary substantially depending onsite-specific conditions. The quantitative nutrient retention potential for these areas were estimatedusing a statistical model developed by Behrendt et al. (1999). In a second step, the potential for allregarded restoration measures along the Elbe (in sum 15,000 ha) was estimated. Up to 1-10% ofannual reduction effects in nitrogen load for the Elbe could be obtained by dyke relocation measures.However the maximum reduction can only be achieved with optimal conditions, i.e. a long floodduration and very high denitrification rates. As the denitrification process is highly dependent on watertemperature, the most limiting factor for the Elbe is that the usual flooding time is during the winterand the spring. High denitrification rates occur only in summer time. Thus, for further monetaryvaluation, a conservative value of an entire nitrogen reduction of 3,000 tons per year is assumed;reached with an average retention rate of 200 kg nitrogen per hectare and year.2. For assessing the replacement cost value of the ecological service ‘nitrogen retention
The assessment of the monetary value of the nutrient retention function of restored flood plains usingthe replacement cost approach required three steps in general:1. the identification and quantification of the nitrogen reduction effects (the ecosystem function)2. the definition of the reference scenario (i.e. the substitute and costs) and finally3. the economic valuation (the ecosystem service)

1. In a first step, the nitrogen reduction effect was only quantified for two specified project regions(approx. 1800 ha) because of the availability of site-specific data. The surface area available fornitrogen reduction in the case of flood plains (as compared to other types of wetlands) is primarilydetermined by the flood dynamic of the river, i.e. the duration and frequency of flooding, as well asthe morphology of the flood plain surface. Accordingly, the results vary substantially depending onsite-specific conditions. The quantitative nutrient retention potential for these areas were estimatedusing a statistical model developed by Behrendt et al. (1999). In a second step, the potential for allregarded restoration measures along the Elbe (in sum 15,000 ha) was estimated. Up to 1-10% ofannual reduction effects in nitrogen load for the Elbe could be obtained by dyke relocation measures.However the maximum reduction can only be achieved with optimal conditions, i.e. a long floodduration and very high denitrification rates. As the denitrification process is highly dependent on watertemperature, the most limiting factor for the Elbe is that the usual flooding time is during the winterand the spring. High denitrification rates occur only in summer time. Thus, for further monetaryvaluation, a conservative value of an entire nitrogen reduction of 3,000 tons per year is assumed;reached with an average retention rate of 200 kg nitrogen per hectare and year.2. For assessing the replacement cost value of the ecological service ‘nitrogen retention’, the next steprequires identification of a technical substitute and quantification of the costs necessary to provide anequivalent service. The benefit of the flood plains only refers to their nitrogen retention potentialduring a flooding event. Therefore no differentiation is made between the sources of nutrient loads.The nutrient reduction in flood plains is independent from the source of the nutrient load, i.e. non-5 -point source nutrient loads are included as well as point source pollution. When considering theequivalent technical substitute, it has to be taken into account that sewage treatment plants only reducenitrogen loads from point sources and political strategies such as agricultural measures only includenon-point source pollution. Thus, when considering the cost of alternative measures for nitrogenreduction, the focus is on different functional processes in detail. The final effect (improvement ofwater quality) is the same, however. On a closer look, the process equivalent to the nitrogen retentionfunction in the flood plains is the denitrification process in sewage treatment plants. Therefore, themarginal cost of denitrification seem to be a suitable reference for benefit assessment.3. The replacement value of the restored flood plains is assessed on the basis of different scenarios thatprovide the same service: (a) marginal costs of waste water treatment in sewage treatment plants (5-8€1/kg N, Grünebaum 1993), (b) the marginal costs of avoidance of nitrogen loads by agriculturalmeasures (mean 2,5 €/kg N). The results considerably differ according to the site-specific conditionsmentioned above. Thus, the replacement value varies for the two specific project regions (each approx.850 ha) depending on the scenario between annually 99,000 € (sc. b) and 290,000 € (sc. a) for adversesite conditions and 1,740,000 € (sc. b) and 5,140,000 € (sc. a) for appropriate site conditions. For thetotal Elbe, (about 15,000 ha additional flood plain area) a value of between 6.9 mill. € (sc. b) and 20.5mill. € (sc. a) is achievable annually. With regard to the range of variation in monetary benefits, theseresults are comparable to the valuation studies discussed above.
Abstract(10)A global scale approach involving data assimilation schemes (e.g. Distributed Oceanographic Data System) is designed to simulate the discharge of sediment to the coastal ocean at the dynamic level (daily). The result is either a realtime, hindcast or forecast picture of coastal hydrology optimized to estimate sediment loads of rivers. The approach links a compendium of global and regional web-based databases into a GIS system. Relational and spatial methods (i.e. RiverTools®, HYDRO1k, ArcInfo®) facilitate the process of data acquisition useful to sediment discharge models (i.e. HydroTrend). As a climate-driven hydrological model, HydroTrend incorporates drainage basin properties (river networks, hypsometry, relief, lakes or reservoirs, distributary channels) through high-resolution digital elevation models, along with other biophysical parameters (basin-average temperature, precipitation, evapo-transpiration, canopy, soil depth, hydraulic conductivity, ice fields). The schema is designed to provide important boundary conditions for marine sediment-dispersal models, concomitant with ocean data (wind, wave, currents). Considering that <4% of world-rivers are monitored for their sediment loads, the approach provides a unique means to predict the sediment flux across an entire coastline at a high-resolution temporal scale. Model comparison to long-

term (1950-1994) observations from the Lanyang River (Hsi), Taiwan is shown to capture average conditions and inter- and intra-annual variability of water discharge, sediment concentration and loads.
HydroTrend v.3.0 is a climate-driven hydrological water balance and transport model that simulates water discharge and sediment load at a river outlet, by incorporating drainage basin properties (river networks, hypsometry, relief, reservoirs) together with biophysical parameters (temperature, precipitation, evapo-transpiration, and glacier characteristics). HydroTrend generates daily discharge values through: snow accumulation and melt, glacier growth and ablation, surface runoff, and groundwater evaporation, retention and recharge. The long-term sediment load is predicted either by the ART-QRT module based on drainage area, discharge, relief, and temperature, or the BQART module that also incorporates basin-average lithology and anthropogenic influences on soil erosion. Sediment trapping efficiency of reservoirs is based on reservoir location in the river network and its volume that determines the residence time of water within the reservoir. Glacial influence is based on the extent of ice cover, equilibrium altitude, and freezing line mobility. HydroTrend v.3.0 captures the inter- and intra-annual variability of sediment flux by using either high-resolution climate observations or a stochastic climate generator for simulations over longer geological intervals. A distributary channel module simulates the flow conditions and transport capacity across a multiple deltaic channel system. Simulations of the Metauro and the Po rivers, in Italy, are used as case studies to demonstrate the applicability of the new model.
Overeem
Models of sediment supply to the Arctic coastal zones predict pronounced increase of sediment influx as a result of a warming climate. Yet estimates are still uncertain, because: 1) the numerical climate-sedimentary models do not model rare high-energy events; 2) lateral changes in the fluvial transporting system, i.e., higher discharges due to climatic warming inducing channel switches and increased floodplain sedimentation, have previously not been modeled. It is expected that these model limitations have the most important implications for drainage basins with relatively gentle topography, for example, rivers draining a hinterland land-ice cap. This project proposes to advance the climate-driven hydrological model, HydroTrend, to incorporate low-frequency high-magnitude events, such as glacial lake outbursts. Simulated high-resolution discharge and sediment load series, which is output from HydroTrend, can directly be fed into our three-dimensional sedimentary model, SedFlux3D. Previous theoretical experiments show that increased sediment supply is a dominant factor in causing channel switches and of significant importance for progradation rates of fluvio-deltaic systems into the offshore. These two concepts will be tested against field data of Clyde River, East Baffin Island, which drains the Barnes Ice Cap. Regional hydrological and meteorological data from weather stations in combination with aerial photograph and satellite image interpretation yields the required input for HydroTrend. Field measurements of grain size trends, floodplain sedimentation, and channel dimensions of the Clyde River will be compared with output of SedFlux3D.
Intellectual merit and broader impact. The response of Arctic river systems to climate change is a largely unknown component of climate change scenarios. The improved models will allow systematic testing of the impact of high-energy events, which is otherwise hard to quantify, because of the relatively short measurement records in the High Arctic. Furthermore, the model will enhance predictions of sediment flux into the ocean. In a wider perspective, the project opens up new horizons to the integration of glaciological models and three dimensional sedimentary models. At the NSF sponsored meeting on 'A Strategy for a Community Sediment Model', the link between glaciological and sedimentary models was recognized as one of the areas where important scientific progress can and shall be made. The Clyde River forms a unique present-day setting, but is a representative 'type-location' for the entire U.S. east margin under glacial conditions. The present offshore stratigraphic architecture depends heavily on the sedimentary processes during the last glacial period. Improved models of the stratigraphic architecture of the shallow coastal zone will facilitate coastal management
ABSTRACT:
/AB Characterizing the dynamics of fluvial sediment sources over space and time is often critical in identifying human impacts on fluvial systems.

Upland interfluve and subsoil sources of suspended sediment at Loco Bayou, Texas, were distinguished using super(226)Ra/ super(232)Th, super(226)Ra/ super(230)Th and, super(228)Ra/ super(232)Th. Source contributions were apportioned at three stations during within-bank and flood flows. super(137)Cs and super(210)Pb sub(xs) (excess super(210)Pb) were used to determine floodplain sedimentation; suspended sediment super(210)Pb
sub(xs)/ super(137)Cs data mirrored results of Ra/Th, showing dominance of
subsoil sources during within-bank flows, changing to interfluve sources during flood. This trend corresponds spatially to influx of sediment from ephemeral tributaries, reflecting mobilization of stored interfluvial sediments during flood stage. Upper basin sedimentation was similar but
markedly less at the lowermost station. These results indicate (1) modified
ephemeral tributaries store sediment derived from sheet wash, discharging them during flood, and (2) southernmost Loco Bayou is episodically
reduction scenarios (Gren 1993, Gren et al. 1994).
Small watersheds in urbanizing and suburbanizing regions are an increasingly important element of the flood hazard problem in the United States and abroad. This paper presents a methodology to estimate flood response in urban watersheds, with the goal of assessing the performance of systems of small flood control reservoirs for extreme floods. The setting of this study is the Brandywine Creek watershed in Chester County, Pa. A number of flood control structures were built within the basin, and the availability of data from U.S. Geological Survey (USGS) stream gauging stations and rainfall estimates from National Weather Service weather radars provides the opportunity to study the performance of a small watershed flood control system. In this paper, the flood response to rainfall from Hurricane Floyd, which produced record flooding in Brandywine Creek
on September 16, 1999, is examined. A distributed hydrologic model was developed and used to estimate flood discharges both with and without the existing flood control structures. The model was calibrated using observed discharge data from the USGS gauging stations, and model simulations were then performed with the flood control structures removed to estimate their impact on the watershed response to the storm. Results from the model showed that the flood control structures mitigated flood hazards to a greater degree than had been expected by the studies completed prior to construction. This paper shows how the USGS streamflow measurement program can be augmented with hydrologic modeling and WSR-88D weather radars to provide useful hydrologic information for analysis of extreme floods.
Equations for predicting of downstream flood wave motion in channel include (13, 14)
Examples of attenuation by floodplains and wetlands
“The estimated peak of the resulting flood wave was 15 m3 s−1,but was dampened to 6% as it passed through a 90ha wetland, thus demonstrating “the importance of taking wetland storage into account when conducting hydrologic studies on watersheds that contain sizeable areas of wetlands” . (15)
Equations for predicting of downstream flood wave motion in channel and floodplain (16)
Interaction of overbank flows and floodplain forest (17)
Examples of structural control Yangtze..operation of multiple dams, real time operation application of fuzzy optimal model, etc. (18)

Non-structural methods.. (19) workshop1975 ACE study (12)
Value of Unregulated Floodplains:
reduced magnitude and frequency of severe floodsreduced frequency of erosive bankfull floodsreduction in annual volume of surface runoffslower stream velocitiesincrease in dry weather baseflow on streamstream channel narrowing and aggradation*decreased streambank erosionmaintenance of pool\riffle structure
decreased runoff/washoff of pollutantsdecreased organic carbon loadslower toxic levels, trace metals, hydrocarbonsdecreased water temperaturesincreased diversity of aquatic insects, amphibians, fish, reptiles, mammals, and birds* destruction of wetlands, riparian buffers, and springs* reduce flood velocities* reduce flood peaks* reduce erosion potential and impacts* stabilize soils* accommodate stream meander* provide a broad area for streams to spread out andfor temporary storage of floodwater* reduce sediment loads and amount of sediments* filter nutrients and impurities* process organic and chemical wastes* moderate water temperature* protect the physical, biological, and chemical integrityof waterMaintain Groundwater Supply and Balance* promote infiltration and aquifer recharge* reduce frequency and duration of low flow by increasing\enhancing base flow* maintain high biological productivity of floodplain andwetland vegetation* maintain productivity of natural forests* maintain natural crops* maintain natural genetic diversity* maintain breeding and feeding grounds* create and enhance waterfowl habitat* protect rare and endangered species habitat* maintain natural genetic diversity* create and enhance agricultural lands* provide areas for cultivation of fish and shellfish* protect and enhance silvaculture* provide harvest for fur resources* provide areas for active and consumptive uses* provide areas for passive activities* provide open space values* provide aesthetic values* provide opportunities for ecological studies* provide historical and archaeological sites* increase tourist activity
* stimulate natural-resource businesses* improve property values
Floodplain management http://www.floodsnewapproaches.com/
Natural and Beneficial Functions of Floodplains
The Task Force on the Natural and Beneficial Functions of Floodplains was established by Congress to help identify the natural functions and benefits of floodplains, and determine how the nation can reduce flood losses through floodplain restoration and protection. In this publication, the Task Force explores the valuable functions of pristine or restored floodplains and their contributions to flood reduction and prevention
ArticleThe flood pulse advantage and the restoration of river-floodplain systemsPeter B. BayleyIllinois Natural History Survey, 607 East Peabody Drive, Champaign, Illinois 61820, U.S.A.
KEYWORDSFish yield • Production • Hydrology • Wetlands • Flooding • Inundation • Dewatering • Drawdown • Waterfowl • Mississippi
ABSTRACTThe flood pulse advantage is the amount by which fish yield per unit mean water area is increased by a natural, predictable flood pulse. Evidence for this increase is presented from tropical and temperate fisheries. It is argued that increasing multispecies fish yield by restoring the natural hydrological regime is consistent with increasing production of other trophic levels and with restoration from ecological and aesthetic viewpoints. When applied to a river-floodplain system, this restoration would provide a large, self-sustaining potential for recreation, commercial exploitation, and flood control. An interim natural flood pulse restoration approach is proposed for systems modified for navigation. This approach approximates the natural hydrological regime in a river reach and is intended as a first step in the long process of restoring the watershed.ProjectIn 2003, Jeff Opperman, then apostdoctoral researcher at the Centerfor Integrated Watershed Scienceand Management at UC Davis,was awarded a CALFED ScienceFellowship to:lowship to:(1) Review the principles of floodplaingeomorphology, hydrology and ecologyin the Central Valley. His whitepaper examined the historical extentof loss of floodplains, describedrestoration approaches in the valley,and discussed potential implicationsof climate change;ip to:(2) Participate in field studies at theConsumes River Preserve and itsfloodplains to study fish habitats forjuvenile chinook salmon created byflooding; andllowship to:(3) Assist environmental consultantsin developing a model to identifyareas frequently flooded for a weekor more, which are also associatedwith ecological benefits, such asphytoplankton production.FindingsThe field experiments conducted

in collaboration with Carson Jeffres,a graduate student at UCDavis, showed that floodplains ofthe Cosumnes River, which areunder water for weeks to monthsin the spring, are highly productivehabitat for chinook salmon, as wellas other fish. Juvenile chinook wereobserved to grow faster in floodplainhabitats than in the river itself, probablydue to the greater availabilityof food.The results from modeling studiesshowed that in the SacramentoSalmon from field experiment. The larger fishwere reared on a floodplain, the smaller onesin a river. Photo: J. OppermanValley, the Yolo Bypass, an engineeredfloodplain beside the SacramentoRiver, was the primary areaaffected by long-duration, frequentfloods. The researchers attributedthe minimal flooding of other areasto levees, channel simplification,water flow regulation and diversion,and channels cut below dams. Inshort, dams and other man-madestructures were shown—not surprisingly—to disconnect rivers from theirnatural floodplains.ImplicationsFlooding drives change in thesurface features of a floodplain,creating topographic and ecologicaldiversity, Opperman said. Frequent,long-duration flooding in the springprovides spawning and rearinghabitat for native fish and promoteshigh biological productivity, whichcan enrich rivers and downstreamecosystems.There is very little area in theSacramento River Valley, however,that is available for the type of floodingthat provides these ecologicalRiparian river bank in theSacramento Valley bioregion.Photo: © Marc HoshovskyCalifornia Sea Grant College ProgramRussell A. Moll, Director • Paul Olin, Extension Director • Marsha Gear, Communications DirectorUniversity of California, San Diego, 9500 Gilman Drive, La Jolla, CA 92093-0232Phone: (858) 534-4440 Fax: (858) 453-2948 Web site: http://www.csgc.ucsd.eduThe CALFED Bay-Delta Program is a collaborative effort of more than 20 state and federal agencies with management or regulatory responsibilities for the SanFrancisco Bay-Delta system. The CALFED Science Fellows Program has been established to bring world-class science to all program elements to help achieveoverall CALFED goals. California Sea Grant administers CALFED research projects towards those ends.This document is available in PDF on the California Sea Grant Web site: www.csgc.ucsd.edu.August 2006For more information:Jeff OppermanThe Nature Conservancy

Tel.: (530) 400-4847Email: [email protected] Opperman. Photo: Paola BernazzaniNATIONAL OCEANICANDATMOSPHERICADMINISTRATIONUS DEPARTMENTOFCOMMERCE
CollaboratorsUC Davis Center for WatershedSciencesPhilip Williams & Associates, Ltd.,Sacramento (an environmentalconsulting company)Presentations and PostersOpperman, J.J., C. Jeffres, and P.B.Moyle. Reconnecting Central Valleyrivers and their floodplains: ecologicalbenefits. Society of EcologicalRestoration–California (SERCAL),Bass Lake, California, October 2005.Opperman, J.J. and P.B. Moyle. Restorationof Central Valley floodplains.State of the Estuary Conference.Oakland, California, October 2005(poster).benefits. If managers want to restorefloodplains, they may need to reengineerareas to allow for naturalflooding. This re-engineering couldinclude setting levees back, notchingweirs, changing the topography,and regulating flows from upstreamreservoirs. The model that Oppermanhelped develop can assist inidentifying strategic areas for suchrestoration activity.
In the summer of 2006
Natural and Beneficial Floodplain Functions:Floodplain Management—More than Flood Loss ReductionThis is a position paper prepared by the Association of State Floodplain Managers,(ASFPM), a non-profit professional organization dedicated to reducing flood lossesand protecting floodplain functions and resources in the United States.BackgroundWith the passage of the National Environmental Policy Act over three decades ago, the United Statesestablished a foundation for protecting the environment amidst human development. In Section 101 of theAct, Congress declared that. . . it is the continuing policy of the Federal Government, in cooperation with State and localgovernments, and other concerned public and private organizations, to use all practicablemeans and measures, including financial and technical assistance, in a manner calculated tofoster and promote the general welfare, to create and maintain conditions under which manand nature can exist in productive harmony, and fulfill the social, economic, and otherrequirements of present and future generations of Americans.However, the reality is that we seldom achieve this “productive harmony” with regard to our rivers,

streams, wetlands, and coastal lowlands. As we move into the new century, we face hard choices aboutour riverine and coastal floodplains1. Relatively unfettered economic development, with only a tokenallowance made for floodplain functions and resources, cannot continue as the status quo. Instead, weneed to strike a balance between development and the benefits that would be realized if we were toprotect the natural functions of floodplains and coastal areas.Current floodplain management in this country has twin goals: (1) flood loss reduction, and (2) theconservation and protection of the natural and beneficial functions of our water resources. Althoughconsiderable effort has been expended on the first goal (with mixed success), the second has received onlyminor consideration. Until recently, activities that protected or improved the natural and beneficial uses offloodplains usually were only planned or executed as afterthoughts, or were included in a project onlybecause of a regulatory requirement to mitigate the environmental impacts of another project. Therestoration or rehabilitation of a waterway, coastline, or its related resources was rarely considered aproject worthy of funding or of being undertaken on its own merits.1 We use “floodplain” to mean the total area, which may or may not have a direct hydrological connection to awatercourse, that will be inundated with water during high flows. For regulatory purposes, the floodplain is defined by thearea inundated during the 1% probability flood event (100-year flood) and greater, but this may or may not correspond tothe area needed for the watercourse or shoreline to maintain its natural biologic, geomorphic, hydrologic, and otherfunctions, nor is it an area that defines the limit of flood damage or lossesAdopted by ASFPM Board 09/16/08 Page 2 of 8 Floodplain Management-More than Flood Loss ReductionAmid significant alteration of our major waterways to optimize commercial benefits and in the nameof flood “control,” flood losses have continued to rise each year. At the same time, environmentaldegradation, particularly of water-related resources, has increased, and anticipated changes in climatebring the potential for significant alteration of existing coastal areas, flood regimes, and already fragileecosystems. The Association of State Floodplain Managers (ASFPM) believes that we are now at acritical juncture in how we approach flood hazard management. We need to marshal unprecedented forcesto preserve and improve the natural functionality of our floodplains and coastal areas and protect theresources they provide. In doing so, we will also mitigate damage and losses that floods bring to society.This need is urgent. In the next 20 years the U.S. population is predicted to increase by 80-90 millionpeople, a huge increase over the current 300 million. The added population will increase pressure tocontinue to allow development adjacent to the nation’s water resources. Paradoxically, that populationwill still expect the nation’s flood risk to be minimized and will demand additional open spaces andnatural areas. We need to remember that we have a choice not to occupy our river floodplains and coastalareas and that, if we choose to do so, there is a very real cost associated with the degradation of thesewater resources—a degradation that is the inevitable byproduct of our occupation of these areas.Natural Functions and Resources in Riverine and Coastal Floodplains:Understanding the IssuesManagement of floodprone areas has for too long been development-centered. The typical strategyhas been to confine the waterway or water body to a predefined size and capacity that maximizes theextent of developable or agricultural land and also keeps the flood water away from people and theirproperty. Under such a framework, the floodplain served a singular, human-centered role as a conveyancenetwork to pass the “excess” water as quickly as possible, with no consideration of the loss of ecologicalfunction, the potential damage to downstream property owners, or the cultural, economic, orenvironmental effects of that strategy. Further, floodplains have been viewed as suitable sites for humandevelopment; the concern, if any, has been to ensure that structures built there are elevated above someminimal flood level, so they are considered “safe,” and also to insure them. In coastal areas, the typicalapproach has been to place development, especially residences, as close to the water as possible and then, ifnecessary, to use structural measures to prevent the beach from migrating away.In many cases, the communities responsible for these decisions about growth, development, and floodprotection possess a minimal understanding of the natural processes that take place in riverine and coastalareas and lack adequate tools to deal with the flooding issues they face. Floodplain management decisionsoften are made outside of the context of regional or watershed-level planning and without appreciation of

the complexities of the water-based ecosystem. Hence, as recent flood disasters and their aftermath haveindicated, communities often respond to such disasters by applying more of the same techniques thatcaused or exacerbated the problem in the first place.Increasing flood losses and environmental degradation have made it clear that the floodplain cannotbe viewed simply as a conveyance channel to keep water away from people. Nor can we continue toimplement flood damage reduction measures without considering impacts to riparian and coastalecosystems.Flooding as a Natural ProcessFlooding is a natural process that forms and maintains floodplains and coastal zones. Periodic flowsof water that overtop the banks of a river and that encroach upon coastal areas are the lifeblood of theriparian corridors, marshes, beaches, and other natural areas. The seasonal variability of flow, incessantwave action, and intermittent extreme events all combine to determine both the physical structure and thebiological diversity of floodprone areas.Adopted by ASFPM Board 09/16/08 Page 3 of 8 Floodplain Management-More than Flood Loss ReductionFinding the delicate balance between human needs and environmental sustainability is a difficultundertaking. Successful, sustainable flood hazard reduction solutions need to be based on the forces atwork in floodplains and coastal zones and also on the resources that these floodprone areas provide. Theseprocesses and attributes can be categorized as (1) hydrologic and hydraulic processes, (2) geomorphicprocesses, and (3) biologic processes. These processes have interrelated functions, which in their naturalstate provide numerous resources and benefits to society.Flooding from hurricanes and storms is the key process in providing such tangible benefits asincreased soil fertility, wetland creation, rejuvenation of spawning gravel, creation of barrier islands,promotion of aquatic habitat, transportation of large woody material that provides fish habitat and bankstability, promotion of plant establishment, and the evolution of channels and shoreline features such asdunes. These resources are described in detail in numerous documents, notably A Unified Program forFloodplain Management (Federal Interagency Floodplain Management Task Force, 1994) and TheNatural & Beneficial Functions of Floodplains (Task Force on the Natural and Beneficial Functions ofthe Floodplain, 2002).Hydrologic and Hydraulic ProcessesBoth river and coastal ecosystems are shaped and nurtured by the characteristics of the water,including where it originates as well as its flow and levels. The seasonal and storm-generated variations inwater flow, including periodic flooding, are part of the normal function of the floodplain zone. Thesevariations mold streambanks, keep erosion and accretion in equilibrium, replenish soils, rechargegroundwater, and filter impurities. In coastal areas, water differences are based on tides, currents, waveaction, and storm surges—all of which form shorelines, coastal wetlands, dunes, barrier islands, andestuaries. High flows are critical to maintaining vegetation because they transport sediment and nutrientsfrom the river, ocean, or lake to the connecting floodplain.Geomorphic ProcessesThe dimensions and configuration of a stream channel or coastline are determined by ongoinggeomorphic processes. For example, the natural transport of sand and sediment dictates the migration ofchannels, shorelines, dunes, and barriers. This process, in turn, is influenced by the geologicalcomposition of the landforms; the caliber, rate, and volume of sediment movement; and the presence orabsence of vegetation. Although the geomorphology of waterways and shorelines is constantly changing,in their unaltered state they exist in dynamic equilibrium, which cannot be disturbed withoutconsequences.Biologic ProcessesFloodplain and coastal vegetation helps to stabilize the shoreline and river banks, provide habitat forterrestrial and aquatic wildlife, control erosion and sedimentation, and improve water quality by filteringpollutants. Healthy riparian corridors often provide the highest concentrations of plant and animalcommunities in a watershed, providing a stable source of biodiversity.

The variable flows of water in riparian and coastal areas have resulted in uniquely adapted species ofaquatic and terrestrial organisms—they depend on the variation in water conditions for spawning, seeddispersal, elimination of competing vegetation, and nursery areas for their young.The ecological integrity of floodplain vegetation depends on the supply of water, sediment, andnutrients; the dynamic stability of the system; the methods of plant colonization; rates of growth anddecay; and the contribution of organic matter to the water body.Adopted by ASFPM Board 09/16/08 Page 4 of 8 Floodplain Management-More than Flood Loss ReductionInterruption of Natural ProcessesNaturally functioning riparian and coastal areas are the product of a tightly interconnected system ofall of the processes described above. The ecosystems sustain themselves by means of these ongoingprocesses. Human activity, especially urbanization and alteration of the flooding process as a means ofcontrolling and/or storing water, interrupts these natural processes and thus disturbs the functions andoverall health of the ecosystem.A stark example of the long-term effect of such interruption can be found in the tragedy thatHurricane Katrina brought to New Orleans. The complex interaction between the coastal wetlands and theMississippi River had not been understood in earlier decades. Long-term projects to increase navigationefficiency and flood protection along the Mississippi River employed extensive use of levees. Theselevees cut off the supply of sediment to the coastal wetlands, which then began to shrink. The shrinkagewas exacerbated by extensive dredging through the wetlands for a range of development and navigationpurposes. The absence of their energy-absorbing capacity increased the impact of storm surges andhurricanes to New Orleans and the Gulf Coast. The extent of damage from Katrina was increased becausethese natural buffers had been lost.In our attempts to transport runoff and flood waters efficiently through the watershed, we have usedstructural interventions (such as concrete lining, revetments, floodwalls, jetties, diversions, and dams andreservoirs) that interrupt or modify natural hydrologic, hydraulic, geomorphic, and biologic processes.The ground surface and natural vegetation are disturbed during construction. The structures change thenatural movement of water in one or more ways such as altering the speed, restricting movement acrossthe floodplain, and changing sediment loads. Floodwalls and levees increase flow discharge and elevationwhen they constrict high flows into a narrow path. Land use policies that allow encroachment into thefloodplain can cause dramatic channel migration downstream. Changing the frequency of floodplaininundation can encourage invasive species to supplant the native vegetation. Most riparian and coastalanimal species are specifically adapted to the flow patterns and other characteristics of their nativehabitat. This makes them vulnerable to disruptions in the flow and water levels.Expanding in-stream storage to minimize flooding can result in reduced downstream flows. Thisreduction can, in turn, cause severe channel aggradation as the floodway fills with sediment. The resultcan be a cascade of impacts as tributary channels begin to fill in with sediment. In fact, the naturalchannel can be buried, reducing habitat diversity and eventually result in increased flood elevations assediment accumulates and the channel’s capacity is diminished.If human activity for development or flood protection constricts or expands the channel, nearshorearea, or floodplain, the sediment transport dynamics are altered. This can cause sediment to accumulate inunanticipated places, or the bed or offshore zone can be scoured. In either case, the channel bed and bankscan be destabilized rapidly both up- and downstream. For example, a new home may be constructed on alarge meander with bank stabilization to protect it from erosion. In future years, increased lateralmigration of the channel caused by that stabilization causes problems for existing structures downstream.The owners of those structures then take similar action to stabilize those streambanks, and so on. Suchchannel alterations march downstream, with individual homeowners exhibiting little understanding of—orhaving been given little guidance on—the overall impacts of their actions on channel dynamics or on thewatershed. This results in the slow and almost imperceptible destabilization of a watershed, and loss ofnatural function—death by a thousand tiny impacts.All of these activities in pursuit of development, urbanization, and flood protection have yielded

specific, usually localized economic and social benefits, but the long-term impacts have placed bothhumans and nature at higher risk. Further, they have proved counterproductive, resulting in a system of“reactive” engineering through which the symptoms of the problem are treated at great expense while theunderlying causes are not addressed and flood losses continue to rise.Adopted by ASFPM Board 09/16/08 Page 5 of 8 Floodplain Management-More than Flood Loss ReductionAfter decades of using these approaches and failing to acknowledge the natural and beneficialfunctions and values of floodplains, we have destroyed a large proportion of our wetlands, deprived ourriver deltas of sediments needed to maintain marshes, prevented nutrient-rich flood water from reachingadjacent lands to replenish the soils, interrupted the protective functions of coastal barriers, andcontributed to declines in water quality. We now realize that those wetlands, soils, marshes, unspoiledwaterways, and related resources and their functions are crucial components of ecosystems vital to humanlife but which we had been taking for granted.Solutions and RecommendationsAs pressures mount to utilize floodplains and coastal areas, it is imperative that we eliminate theattitude that it is acceptable to obtain short-term reductions in flood risk and/or short-term economic gainsby shifting those costs to future generations or causing adverse environmental impacts. We need toreplace this thought process with a new focus on ensuring the long-term environmental and economicsustainability of our floodplain ecosystems. In this context, the ASFPM presents below some suggestionsfor overall policy change, followed by more specific recommendations.To begin, we need to modify the widespread view of floods as destructive forces of nature. Floods donot cause damage or suffering. Our decisions about where to live, work, and play are the cause. Byanticipating the flooding process and planning our development accordingly, we can begin to effectchange. Instead of controlling the water, we should control how and where we allow human activities toadversely affect it. The recommendations below reflect this paradigm for managing our nation’sfloodplains and flood risk.A Call for Renewed DirectionIn order to regain the sustainability of our water-based ecosystems and resources, we must adopt anew approach to floodplain management. The ASFPM sees this as a five-pronged strategy.(1) Set a policy that the natural functions and resources of floodprone areas are worthy of protectionand should not be sacrificed for human development.(2) Prevent new development from encroaching on floodprone and environmentally sensitive areas.(3) Remove existing development from floodprone and environmentally sensitive areas wheneverpossible.(4) Rehabilitate and restore degraded riparian and coastal resources.(5) Incorporate into all public and private activities at all levels a respect for and understanding of thefunctions and resources of floodprone areas along our coasts and waterways.National PolicyA national vision and policy for floodplain management should be enacted that would establishunequivocally the inherent value of these resources and of their role in minimizing flood losses. It wouldincorporate both a national floodplain management policy and a national riparian and coastal areas policy,with a goal of the sustainability of those ecosystems. It could use the National Environmental Policy Act asboth a foundation and springboard for a coordinated flood and coastal hazard management strategy. Astandard model for comprehensive watershed planning and management could be produced that woulddelineate the roles and responsibilities for the federal, state, and local governments and the private sector.It should set out goals and criteria that could be tailored to the specific needs of different watersheds tomaintain environmental sustainability and reduce flood risk.Adopted by ASFPM Board 09/16/08 Page 6 of 8 Floodplain Management-More than Flood Loss Reduction Existing regulatory programs that emphasize damage reduction or floodplain constructionstandards over floodplain protection or impact avoidance should be identified, and then revamped.These types of regulations assume that floodplain development is going to occur and then proceed

to guide the design and construction of it—the opposite of the preferred approach. Examples ofsuch misguided regulations include the identification of a floodway fringe defined by a specifieddegree of assumed fill impacts or other encroachments. The rules for reviewing proposals for hazard mitigation projects must be revised to account for theenvironmental benefits of a project, just as the costs of environmental compliance are included.Mitigation projects whose aim is to restore the natural and beneficial functions of floodplains willthen be able to compete on a fair basis with other proposed projects. A federal water resource coordinating mechanism should be established to suggest and oversee anational floodplain management policy task force. Watershed planning commissions should beformed, based on major riverine, lacustrine, and coastal watersheds, to coordinate flood reductionefforts and resource protection at the federal, state, tribal, regional, and local levels. Guidance or criteria should be enacted (e.g., no adverse impact accompanied by environmentalmitigation or enhancements) that would direct communities and government activities within ornear floodplains and coastal zones to undertake actions that will reduce the need for flood control,and to educate their residents to expect less flood control and more living with the naturalfluctuations of the river or coastline. The goal would be to provide strict guidance so activitieswould not increase the perceived need for government attention to flood control. The restrictionwould also apply to state, regional, and local governments if they were using federal funding orparticipating in the National Flood Insurance Program (NFIP).Avoidance of Floodprone Areas in the FutureStarting now, future development should avoid high-hazard and ecologically sensitive areas. State andlocal governments should guide development away from these areas by applying land use planning andmanagement techniques. This is the most effective way to minimize cumulative losses and degradation ofour water resources.Voluntary Retreat from Floodprone AreasStarting now, we need to begin a collective pattern of gradual relocation of existing residences andbusinesses away from high-hazard and ecologically sensitive areas. We need to begin a strategic retreatalong our coasts and rivers.Restoration of Floodplain and Coastal ResourcesIt should become a national priority to reclaim those riparian and coastal resources that we have lost.Rehabilitation work should commence to restore the natural buffers that those resources once provided.We should work to recognize and create an understanding of the short-term and long-term environmentalimpacts of existing flood and coastal protection measures and how those impacts can be mitigated.Awareness of and Accounting for Natural Functions and ResourcesThe natural and beneficial functions of our coastal and river corridors must be incorporated intoprograms and implemented throughout all federal, state, and local flood mitigation programs. Allprograms should be required to promote the environmental preservation and protection of riparian andcoastal functions, whether the activity involves navigable waters, new infrastructures or buildings, floodmanagement structures, coastal protection structures, or any other activity that could have an impact onany watershed or coastline.Adopted by ASFPM Board 09/16/08 Page 7 of 8 Floodplain Management-More than Flood Loss ReductionMulti-objective management criteria need to be established that strike a balance between social,economic, and environmental issues and also promote the long-term sustainability of our society.Programs also should be required to work within the framework of a watershed master plan, if one exists.If no plan exists, a program should apply criteria to assure long-term sustainability within the watershed.Nationwide initiatives should be undertaken to Improve communication and recognize the interests of private landowners in determining the bestenvironmentally and economically sustainable flood hazard reduction alternatives. Facilitate the gathering and storage of scientific data and water resource information, provide avenue for determining data needs for research and development, and disseminate the collected

information back to the watersheds. Determine and quantify the actual short-term and long-term economic and other benefits that arederived from the preservation of the natural and beneficial functions of coastal areas and riverinefloodplains. The benefits of natural functions should also be taken into account during themodeling and calculation of benefit/cost ratios. Promote a multidisciplinary approach to floodplain and coastal hazard management by integratingland use planning, hydrology, hydraulics, geomorphology, biology, botany, stream ecology, andother fields for a holistic understanding of floodplain and coastal functions and processes. Develop comprehensive plans for all inland and coastal watersheds that provide guidance toconsider all short- and long-term watershed-wide impacts (including cumulative impacts) for allprojects, whether large or small. Include the natural and beneficial functions of riparian and coastal areas among the attributes thatcommunities protected from adverse impacts when making decisions about proposeddevelopment. That is, in addition to prohibiting increases in flood flows, velocities, erosion, andother hazard-related aspects of flooding, a standard of no adverse impact should also be applied tofunctions and resources such as groundwater recharge, habitat, carbon sequestration, barriermovement, storm buffering, etc.Local, state, and federal governments and other public and private entities should Assign more weight to environmental management and sustainability when considering floodmanagement projects for any watershed. Attach a higher priority to mapping (or re-mapping) the flood hazard areas of communities withcoastal and riverine systems that are rapidly developing or have urgent environmental concerns.Communities should consider what environmental changes may take place in their watersheds inthe future due to climate change or intensified urbanization, and map and manage accordingly. Encourage the collection, scientific study, and use of the biologic, geomorphic, and other dataneeded to make flood management decisions based on sound science and ensure that thesedecisions consider the impacts from a watershed-wide perspective. Support the development and implementation of watershed planning at all levels of government. Propose legislation that makes cost sharing for sustainable floodplain management moreattractive, particularly for fast-growing communities. Increase the emphasis on ecosystem sustainability in pre- and post-disaster mitigation. Requireenvironmental mitigation as a condition of receiving federal financial assistance after a flood,instead of requiring reconstruction to pre-flood conditions without consideration of mitigation orenvironmental restoration.Adopted by ASFPM Board 09/16/08 Page 8 of 8 Floodplain Management-More than Flood Loss Reduction Change the site-selection criteria for levees to provide for a mechanism to include the impacts onthe hydraulic, biologic, and geomorphic processes of the affected stream or river in the planningand design phase of levee construction.The ASFPM should Work to increase the knowledge base of Certified Floodplain Managers and others on thebiological, ecological, and geomorphologic functions of riverine and coastal areas. Provide tools and guidance through the NAI Toolkit for communities to work together, on awatershed basis, to prevent adverse impacts to natural and beneficial functions of their riverineand coastal areas.ResourcesASFPM Foundation, 2008. Floodplain Management 2050: A Report of the Second Assembly of the Gilbert F.White National Flood Policy Forum. Madison, WI: ASFPM Foundation.Association of State Floodplain Managers, 2007. National Flood Programs and Policies in Review 2007.Madison, WI: ASFPMAssociation of State Floodplain Managers, 2003. No Adverse Impact: A Toolkit for Common Sense Floodplain
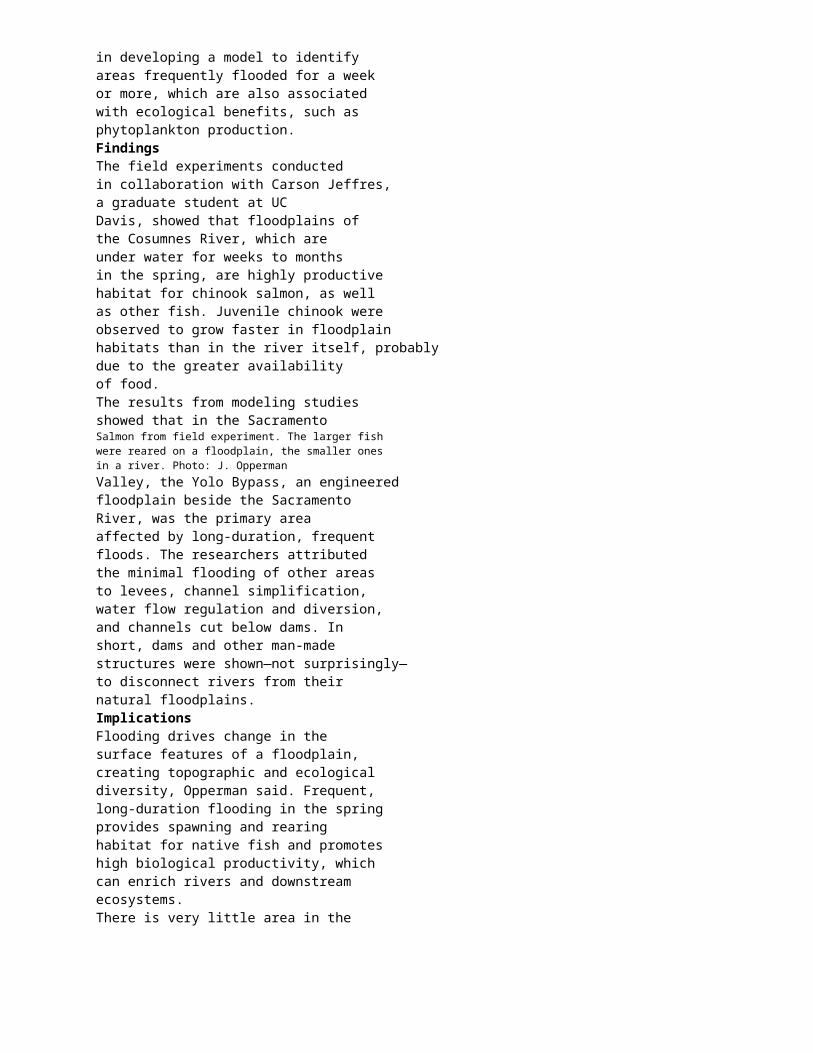
Management. Madison, WI: ASFPM.Executive Order No. 11988, “Floodplain Management,” 42 Federal Register 26951 (May 24, 1977).Executive Order No. 11990, “Protection of Wetlands,” 42 Federal Register 26961 (May 24, 1977).Federal Interagency Floodplain Management Task Force, 1994. A Unified National Program for FloodplainManagement. Washington, D.C.: Federal Emergency Management Agency.The National Environmental Policy Act, 42 U.S.C. 4321 et seq. (1969).Task Force on the Natural and Beneficial Functions of the Floodplain, 2002. The Natural &BeneficialFunctions of Floodplains: Reducing Flood Losses by Protecting and Restoring the Floodplain
Environment. A Report for Congress. FEMA 409. Washington, D.C.:
Flood Wave Attenuation Due to Channel and Floodplain Storage and Effects on Flood Frequency Archer, DRFloods: Hydrological, Sedimentological and Geomorphological Implications. John Wiley & Sons New York. 1989. p 37-46. 5 fig, 8 ref.
Flood attenuation and the transformation of flood frequency over a common period were investigated over a reach of the River Tees in northeast England. Variations in shape and slope of flood frequency distributions could be accounted for by the characteristics of channel and flood plain storage. Above bankfull, increasing storage on the floodplain and associated delays due to frictional resistance suppress flood growth at the downstream station. However, mean annual flood is virtually unaffected by overbank flow which does not commence until flow exceeds 350 cu m/s. The effects of channel storage are seen below bankfull. As flood peak and volume increase, attenuation decreases and downstream flood growth becomes steeper. The resulting flood frequency has a break of slope at bankfull discharge. It seems likely that transformation in the reach would give the observed form of downstream distribution for a range of upstream distributions. The transformation has important implications for flood estimation at ungaged sites. Floodplain storage and attenuation is a common phenomenon and it is suggested that suppression of flood growth may be similarly widespread. The effect, however, may be obscured in less ideal reaches where there is a larger lateral inflow contribution, and this could cause difficulties in extrapolation to other sites. Classifying basins into homogeneous groups using cluster analysis or interactive search techniques to optimize the grouping efficiency offer the best opportunity for the inclusion of floodplain and channel effects, but this has not yet been done. There are also practical consequences of confinement of flood flows within flood banks through the reach. The effects of reduced attenuation and shorter flood travel time on property at risk downstream of the protected reach need evaluation. (See also W90-02963) (Mertz-PTT)
Channel and floodplain restoration can enhance the ability of a channelized or incised reach to temporarily store the flow and dissipate the energy of passing flood waves. Elements of restoration design that can enhance flood wave attenuation include the introduction of meanders, which reduces channel slope and increases channel length, restoring channel-floodplain connectivity, and re-vegetating banks and the floodplain. We examined the efficacy of stream restoration to attenuate floods given its scale and the general magnitude of channel change it brings about by quantifying flood wave attenuation on models of field based restored reaches and synthetic reaches representing median values of stream restoration projects in North Carolina. We used a dynamic flood routing model (UNET in HEC-RAS) to route floods in impaired and restored reach models. Floods routed through field based reach models either exhibited very small augmentation to attenuation, largely due to assumed increases in floodplain roughness, or a decrease in attenuation. Modeled sensitivity results indicated that decreases to slope and increases to channel and floodplain roughness demonstrated the highest relative impact to attenuation. Floods of intermediate magnitude (between 2 and 5 yr recurrence interval) were impacted most by restoration, especially those confined to the channel under the impaired morphology but able to access the floodplain under the restored morphology

The influence of man on the hydrological regime with special reference to representative andexperimental basins — L'influence de l'homme sur le régime hydrologique avec référenceparticulière aux études sur les bassins représentatifs et expérimentaux (Proceedings of the HelsinkiSymposium, June 1980; Actes du Colloque d'Helsinki, juin 1980): IAHS-AISH Publ. no. 130.Flood wave 'restoration'PETRU SERBAN and ION PASOI The Institute of Meteorology and Hydrology,Bucharest, RomaniaAbstract The paper presents the 'restoration' methodology for flood waves. It is based on thedetermination of the effects on flood waves of storage reservoirs, dams, etc. An example of theflood waves reconstruction in a basin with hydraulic works is also given.Reconstitution des ondes de cruesRésumé. On présente dans cette communication la méthodologie de reconstitution des ondesde crues. Cette méthodologie est fondée sur la détermination des effets modificateurs sur les ondesde crues, provoqués par les bassins de retenue, endiguements, etc. On présente à la fin de cettecommunication un exemple de reconstitution des ondes de crues pour un bassin comportant desaménagements hydrauliques.INTRODUCTIONFlood waves undergo modification when crossing hydraulic systems so the measureddischarge no longer reflects the natural potential for flood wave occurrence. The useof such maximum discharges in a statistical study, together with those from a naturalregime, has no physical meaning.Generally, flood wave restoration can be effected in two ways: (1) by extendingthe data from natural representative basins to basins with modified hydrologicalregimes; and (2) by eliminating the modifying influence(s) on the flood waves. Nowadays,the second method is more desirable because: (1) most water resources systemsdispose of hydraulic data; and (2) rules for extrapolating hydrometric data from asmall natural representative basin to a larger basin influenced by man's activity arelittle known.Any water resources system, no matter how complex it is, consists of the followingbasic elements: storage reservoirs, dams, intakes and channels. Obviously, reference ismade only to those elements which have a significant influence on the maximumdischarges.Natural flood waves passing down a system with free level undergo modificationsdue to two phenomena: attenuation and translation. These phenomena overlap,occurring separately only in certain isolated cases. Attenuation prevails in the case ofstorage reservoirs and translation in the case of channels.FLOOD ROUTING THROUGH A RESERVOIRFor the computation of flood routing in a storage reservoir, the Puis procedure ispresented, assuming for simplification that the water level of the reservoir surface ishorizontal and the instantaneous routing of the flood wave hydrograph across thereservoir. The method is based on the continuity equation:dWQa-Qd = TZ (1)229230 Petru §erban and Ion Pasoiwhich, using finite differences acquires the following form:2 2 ATwhere goe- and Qai+1 are inflows to the lake at the beginning and end of the intervalAT; Qdt and Qat+i are outflows from the lake at the beginning and end of the intervalAT; Wj and Wi+1 are the amounts of water stored;/+1 and /being two successivemoments corresponding to time, Ti+i =Tt + AT.To compute the flood wave through a reservoir, equation (2) is used in the form:AT AT ATWi+1 + &S+1 y = Wt + (Qa, + Qai + Ù ~ - Qdi ~ (3)To compute the flood wave routing in a storage reservoir using relation (3), thefollowing elements are required: the inflow hydrograph of the flood wave Qa =f(T)in the form of a series of values at time intervals AT; the depth—volume curve of thereservoir W = f{H); and the rating curves of the weir Qd = f{H) which depend both onthe level of water in the reservoir and the operation of the weir.The calculations start by computing the expression E:
ATE=W + Qd-jfor various water levels in the reservoir, corresponding to certain weir operations.The computation of the outflow hydrograph is performed in steps by determiningthe values of the right-hand terms of relation (3) on the basis of the elements given atthe beginning of each interval. Using this value, the level His derived from the graphwhich gives the relation E for a particular weir operation. The values Qdi+i and Wi+1
from the rating curves of the weir can be determined for this level as well as the curveof lake capacity, which are then taken as initial values for the following computationstep.The computation of the inflow hydrograph to a storage reservoir uses the relationQai+1 = Qai + Qdf + i + ' - Qai (4)ATderived from equation (1).Here the following elements are required: the hydrograph of the wave released fromthe reservoir Qd =f(T), as a series of values at time intervals AT; the curve of reservoircapacity W = / ( / / ) ; and variation of the level in the reservoir H = f(T).To avoid errors in determining the inflow hydrograph to a reservoir using relation(4), we give equation (1) the form below:/ AW \
a = M1+^r) <5)The accuracy of Qa depends on the measuring accuracy of Qd (which generally doesnot exceed + 5 per cent); on the value of AW/(Qd AT);and on the calculation error ofAW.Table 1 shows the maximum permitted errors in A W (Diaconu, 1979) for values ofthe function AW/(Qd AT) so that the calculated Qa is within the limits of the maximumpossible deviation +15 per cent.TABLE 1.Flood wave 'restoration' 231AWQd±TMaximumpermittederrors in calculatedAW<0.025 0.025^0.05±100% ±70%0.05-0.1±55%0 . 1 -0.2±36%0.2-0.3±25%0 . 3 -0.4±18%0.4-0.5±13%0 . 5 -0.6±10%0.6- 0.7-0.7 0.8±7.5% ±6%>0.8±5%FLOOD ROUTING THROUGH NATURAL AND DAMMED RIVER CHANNELSFor flood routing through a river the Muskingum method with variable parameters is

used. Based on this method, the discharge released from one river section is given byQdi + 1 = Q> Qai +1 + Ci Q„i + C2 Qdi (6)whereKx-0.5AT Kx+0.5AT° K(l-x) + 0.5AT' ' K(l-x) + 0.5AT'K(l-x)-0.5ATc s_l 1 (7)K(\-x)^5ATwhere Qai and Qai+i are inflows into a river reach at time i and i +1 respectively; Qdi
and Qdi+i are outflows from a river reach at time i and i +1 respectively;^ is therouting time for the flood wave along the river reach;* a weighted coefficient; AT,the time interval; Q, Q and C2 are coefficients satisfyingC0 + Ci + C2 = 1 (8)To perform the flood wave routing in a river section using equation (6), the followingelements are required: inflow hydrograph in the computation section Q, =f(T);lateral inflow Qo/ =f(T); and parameters K and x of the Muskingum equation.An important aspect of the computation procedure is the choice of the time (AT)and space (AiSs) steps (or the number N of river sections). Providing the coefficientsof relation (7) are positive, then2Kx 2K(l-x)<JV« (9)AT ATGenerally, the river sections selected are of the same length to facilitate computation.They may also be of various lengths, depending on the configuration of thehydrographie network.Determination of lateral inflowThe lateral inflow can be determined by making use of the synthetic unit hydrograph.For a gauged basin the unit hydrograph is given by the equation below (Nash, 1957)kY{n)where T(ri) is the gamma function, while n and k are parameters which can be determinedby using nonlinear programming (Serban, 1976a).232 Petru Çerban and Ion PafoiThe unit hydrograph for ungauged basins can be derived by means of syntheticrelations of the following type:rcr = M « - i ) = / i H = (ii)kr(n)where Tcr is the rising time of the unit hydrograph; QM the maximum discharge ofthe unit hydrograph; F, the surface area of the basin; B, the average width of the basin;L, the length of the river;4,the average slope of the basin; and Ir, the slope of theriver.Determination of Muskingum equation parametersThe Muskingum equation has two parameters x and K which must be determined forthe river sections (or channels) between which the wave is routed from A (upstream)to B (downstream). Depending on the type of section and the amount and quality ofthe available hydrometric data, K may be computed in three ways:(1 ) For river sections with data of satisfactory accuracy and an insignificant lateralcontribution, K is obtained by differentiating (in time units) between the characteristicmoments (points of maximum, minimum, inflexion, etc.) of the inflow andoutflow hydrographs. Representing graphically the values of K as a function of theinflow into the section, we find the relation K = K(QA ).(2) For river sections having sufficient high quality data and a significant lateralcontribution to the discharge,^ is computed fromASK=— (12)Vp
where AS is the length of the section between A and B; and Vp, the speed of the floodwave between A and B. Based on stations A and B, correlation Vp = / ( ô ^ ) is established,

and relation K = f(QA)^ determined according to formula (12).(3) For river sections lacking hydrometric data,iT is computed according to (12).In this case the routing speed is computed in several characteristic profiles for thesection by means of Chezy's formula. In practice, this case is frequently met in computingparameter K in a dammed regime, if this regime has not undergone a severeflood worth being measured.The variation of parameter K with inflow discharge into the section thereforedepends on the morphometric and vegetation (roughness) parameters in the givensection. Depending on the type of river reach, K varies with the discharge in two ways:(1) for river sections with well developed flood plains K decreases as the dischargeincreases (Fig. 1, solid curve) until the flooding discharge Qin is reached ; after thisK increases with the flow increases;(2) for river sections with small flood plains, if increases with increased discharges(Fig. 1, dashed curve).In the case of an embanked river section, without cutting off meanders and noriverbed calibration, the variation of K with discharge is shown by the dashed curvein Fig. 1. Note that in this case, the variation of K with QA is the same for QA < Oin,both in the natural and the dammed regime. In the case where meanders are cut byFlood wave 'restoration' 233KA-BMNatural regimeDammed regime without~^'C~~y\ rmrbtd calibration (- ;C . _ ,£__(_ crwittcaliAraticn_af it (-——jTO m IX 200 éO 300 3S0 400 ÏÏTfa'/s)
FIGURE 1. Muskingum parameters for section A-B on river R.embankments and the runoff conditions are improved (by diminishing the roughness),the variation of K with QA is given in Fig. 1 as the dash-dot curve.Parameter x is the attenuation coefficient of the flood wave for the section understudy. Depending on the morphometric characteristics of the section, it has thefollowing values: 0.01—0.2 for sections with well developed flood plains; 0.2—0.4 forsections with less well developed flood plains; 0.4—0.45 for sections with insignificantflood plains or dammed river sections.Parameter x generally has less weight than parameter K in the flood wave computation.This is because the 'charges' of parameter* (in attenuation) are undertaken byparameter K (in translation); it is common knowledge that an increase in parameter Kmeans a smaller routing speed (i.e. a longer stagnation of water in the river reach) andconsequently larger attenuation, and vice versa.The values of K and x determined by the above method should be checked onsome typical flood waves. A check on parameter K is primarily required when thelateral contribution to a section is larger than the routing wave (cases (2) and (3)).The PROPAGARE program (§erban, 1976b) determines the optimum values of xand K by trial-and-error and the Rosenbrock method.FLOOD WAVE 'RESTORATION' CONSIDERING COMPLEX ROUTINGPHENOMENA THROUGH CHANNELS, RIVERS AND RESERVOIRSThe flood wave 'restoration' methods will be demonstrated first by a study of a riverreach having the typical elements of a water resources system. Consider, for example,the section between the hydrometric stations A and B presented in Fig. 2. In this case,the flood waves measured at the stations A and B, will be influenced by the reservoirA, the channel D, and the embankment between sections 4 and 5, and the routing ofthe flood wave of the natural regime may be obtained as follows:(1) The wave measured in section A (recorded at the hydrometric station A, orcomputed from the data recorded at hydropower station A) is unrouted according tothe method presented in the first section, resulting in the inflow wave into reservoir A.The discharges flowing in channel D are added to this, giving the restored wave forsection A. In the case of reservoirs with storage larger than the inflow hydrograph,the restored wave in section A will involve errors, and the inflow wave can best beobtained by routing from upstream using the Muskingum method.(2) The restored wave for section A is routed through the section A—B by meansof the Muskingum method resulting in the restored wave for section B.
The Muskingum parameters must be determined from data for the natural regime,as described in the second section, likewise for the river section between A and B.When the runoff conditions in the river section between A and B did not change,234 Petru Çerban and Ion PasoiReservoir AA/rer * S.H.A.F= 4000 kmz
20 kmTributary P1-700 km* AS.H.C.Legend:© Node-£*- Inlet having a hydrometricstationavailable-* Storage reservoir-**^ Intake.=-r Bam20 km20 kmRest basin A~BF=m km2
§20 km
ï)River f? S.H.B.F=S094km*Reservoir 8
FIGURE 2. Computation sketch for the flood wave on section A-B of river R.parameters K and x can be determined, provided the outflow from reservoir A and theinflow into reservoir B are known.A complex water resources system consists of a series of sections similar to the onepresented in Fig. 2. Therefore, to reconstruct flood waves for the natural regime aprocedure analogous to that for Fig. 2 must be followed for each component of thecomplex water resources system.AN EXAMPLE OF FLOOD WAVE RESTORATIONIn order to present an example of flood wave restoration we shall analyse the complexsystem of the river R shown in Fig. 3. It consists of: five storage reservoirs, amongwhich four (B, C, D and J having total storage capacity less than 10 x 106 m3 ) aredaily regulating and another (A, with capacity equal to 1230 x 106 m3) is compensating;10 hydropower stations of which nine have low head (B—J) and one (A) has aconsiderable head; and a channel E—I.Legend: UW> blorage reservoirQ Hydropower stationHydrometric station^ - A ^ Hydrometric stationout of work
FIGURE 3. Sketch of the basin of river R with hydraulic constructions.Flood wave 'restoration' 235During the construction of the system the hydrometric stations 7,14 and 21 wereabandoned. Thus, computations of the routing of flood waves in the natural regimein the sections where these stations used to operate would extend the time series ofmaximum discharges existing before the hydraulic construction began.The greatest influence on flood wave routing in river R is exerted by reservoirs A,B and J due to both discharge retention and flood wave attenuation and by the canalsE—I and the intake for the power station A because the flood waves do not undergoattenuation and the routing speeds of the discharges along the channel and intakesare higher than in the main river.F=2816 km2
l e g e n d : (J) Node.$ - i i ^ . S u b b a a i a n o . 8 h a v i n g a 110 km s u r f a c e (noh y d r o m e t r i c s t a t i o n a v a i l a b l e)Subbasin no.10 having a 100 km2 s u r f a ce( w i t h h y d r o m e t r i c s t a t i o n a v a i l a b l e)Hydrometric s t a t i o n out of workS t o r a g e r e s e r v o ir
FIGURE 4.F»6490 km2 21
Restoration sketch for the flood waves.Tcr[h] .aM[»-3-yh]
hFIGURE 5. Correlation between the characteristic elements of the unit hydrograph givenby a 1-h rainfall and the morphometric parameters of the basins: (a) rising limb of the unit

hydrograph; (b) maximum discharge of the unit hydrograph.Considering the elements shown in Fig. 4, the flood wave restoration is presented.The flood wave hydrograph determination for uncontrolled tributaries is by meansof the synthetic unit hydrograph. This is computed making use of the synthesisrelations shown in Fig. 5, established from data from hydrometric stations in theregion.The determination of the Muskingum parameters for each section was performedby the PROPAGARE program as follows:(1) For the section 1—3 data recorded at stations 1 and 7 before the water resourcessystem was built were used. This procedure was used because the inflow wave into236 Petru Çerban and Ion Pa§oireservoir A could not be determined with sufficient accuracy from the outflow hydrographdue to the high capacity of reservoir A.(2) For section 3—4 the outflows from reservoir A were used (an exception beingmade for the discharges routed through the channel A) and the inflows to reserver Bbased on the outflows from B.(3) For section 4-5 the outflow hydrographs from reservoirs B and D were used.(4) For section 5—7 the outflows from the storage reservoir D were used, togetherwith the inflows to J (minus the discharges routed along channel E—I). The inflowsto reservoir J were determined from the outflow waves.Note that the outflows from the hydropower stations were determined by summingthe turbine discharges, weired, and released by bottom water outlets (Diaconu et al,1979).KMdMD* = 0.20Q(mffi(Km»/»)200 400 600 500 1000
FIGURE 6. Muskingum parameters for the selected computation sections.The Muskingum parameters for these sections are presented in Fig. 6. The followingsteps are then taken to restore the flood wave:(1) Average precipitation, discharge and runoff coefficients are determined at thehydrometric stations in the region;(2) For the uncontrolled tributaries the average precipitation in the basin and theeffective rainfall are computed adopting a runoff coefficient similar to that of ananalogous basin.(3) The hydrograph of the discharge is drawn (for uncontrolled tributaries) usingthe synthetic unit hydrograph method. To this the base discharge is added (derivedfrom an analogous basin). The hydrographs are checked (by routing) for river sectionsbetween storage reservoirs, using hydrometric data from the modified regime (the outletwave from the reservoir upstream and the inlet wave to the reservoir downstream).(4) The flood wave of the natural regime recorded at station 1 is routed througheach section by the Muskingum method. At the nodes of the network the routedFlood wave 'restoration' 237«(*!«VI 29VI 30VI 1V1I 2VII 3VII «VI! 5VII19782BVI 29V! 30VI 1 VIS 2VI 3VII 4-VII 5V11978, O(mVs), TBVI 29VI 30VI 1V1I 2VII 3V!I 4V« 5VII197828V1 29Vr 30VI (Vil 2V1I 3VII 4VII 5VII1978
FIGURE 7. Recorded wave ( ) and restored wave ( ) at stations 7, 11,14 and 21.wave in each section is added to the tributary discharge. In this way the flood wavesfor stations 7,11,14 and 21 were restored. Figure 7 presents flood waves for theperiod 28 June—5 July 1978, recorded and restored in these sections.CONCLUSIONFlood wave restoration may be effected by a model taking into account both thehydrometric data available in natural basins and the data of developed systems.To increase the accuracy of flood wave restoration it is necessary that: storage

reservoirs have adequate hydrometric facilities; volumetric curves of the storagereservoirs are maintained (particularly for low flows) to increase the accuracy ofwater volume determination and therefore of the inflows to the storage reservoirs;main tributaries are hydrometrically controËed; river sections downstream of thestorage reservoirs, especially at the confluence with a tributary or a very large storage
reservoir, are hydrometrically controlled.
The effect of floodplain storage is to delay and attenuate a flood wave as it passesdown the river network. This is thought to explain in part why many flood growthcurves in Ireland are mildly graded. The remit of Work Package 3.3 is to explore andanalyse floodplain attenuation effects. The research aims to increase understanding ofthe influence that floodplain storage has on flood flows and how this can beeffectively accounted for in flood risk estimation.There is a growing appetite to combine hydrological and hydraulic models in amanner that reflects the structure of a catchment: including the arrangement oftributaries and the location of major floodplains. Intended to provide a more detailed,and spatially coherent, representation of flood risk, this “river modelling” approachwill become more widely used in Ireland once the Flood Studies Update deliversflood estimation methods based on digital catchment data.Embedding flood estimation methods within such river models is, however,problematic. WP3.3 will address one of these difficulties: the potential to doubleaccountfor the attenuating effect of floodplain storage. This occurs when the effect isrepresented explicitly in the hydraulic modelling when it is already representedimplicitly in the flood frequency estimation. The double accounting can arise throughuse of a local gauged record (i.e. data transfer) or more generally through poolingflood data from stations that are influenced by floodplain storage effects.The output from Work Package 3.3 will be a Final Report, which details
methodologies and includes all aspects of the methodologies developed, describing
For the purpose of estimating sediment production, important processes can be roughly divided into three categories of sheet and rill erosion, gully and channel erosion, and mass wasting processes. The relative magnitudes of each category depend on the soils, geomorphic, hydrologic and land use characteristics of the basin. The Natural Resource Conservation Service and U.S. Geological Survey are excellent sources for information.
Sediment Yield and Transport Sediment yield, is the amount of sediment passing a specified channel location and is influenced by a number of geomorphic processes. It may be substantially less than the amount actually eroded in the basin. Sediment yield is typically expressed as the total sediment volume delivered to a specified location in the basin, divided by the effective drainage area above that location for a specified period of time. Yield typically has the units of cubic meters/square kilometer/year or acre-ft/square mile/year or metric tons or English tons per year. However, it is also necessary to estimate yield from a watershed from individual storm events of specified frequency (e.g., 5-, 25-, 50-, or 100-year events. Individual event yields are reported as metric tons or cubic meters per event. In some watersheds, single event sediment yields often exceed average annual values by several orders of magnitude.
Spatial and temporal variations in physical and biological features of the watershed make estimation of sediment yield an extremely difficult and imprecise task. Important variables include soils and geology, relief, climate, vegetation, soil moisture, precipitation, drainage density channel morphology, and human influences. Dominant processes within a watershed may be entirely different between physiographic or ecological provinces, and may change with time. The problem becomes even more complex when grain size distributions and sediment yield for particular events must be estimated for input to sedimentation transport simulation
models. There is no widely accepted procedure for computing basin sediment yield and grain size distribution directly from watershed characteristics without measured information.
Sediment transport is influenced primarily by the action of wind and water, and deposition occurs in a number of locations where energy for transport becomes insufficient to carry eroded sediments. Colluvial deposits, floodplain, and valley deposits, channel aggradation, lateral channel accretion, and lake and reservoir deposits are examples of typical geomorphic deposition processes. The stability and longevity of sediment deposits vary. Lake and reservoir deposits tend to be long-term, whereas some channel and floodplain deposits may be remobilized by the next large scale flood event, only to be deposited downstream. The spatial and temporal variability of sediment production, transport and deposition greatly complicates the task of estimating sediment yield from a watershed.
Measuring flood output from 110 coastal watersheds in California with field measurements and SeaWiFS Leal A.K. Mertes*,1 and Jonathan A. Warrick*,2
1 Department of Geography and Institute for Computational Earth System Science, University of California, Santa Barbara, California 93106, USA2 Marine Science Program and Institute for Computational Earth System Science, University of California, Santa Barbara, California 93106, USA
The 1300-km-long California coast receives output from watersheds that range from 10 km2 within the coastal mountain ranges to 120 000 km2 for the drainage basins of the Sacramento and San Joaquin Rivers. Results from a combination of field and remote-sensing data, modeling, and digital techniques show that during the El Niño winter of 1998, the impact of sediment and water transport on nearshore waters from coastal watersheds was spatially extensive, varied with depth, and was comparable to the impact of output from large rivers. The mass of sediment estimated from SeaWiFS data for 25 discrete and coalesced buoyant river plumes emanating from 110 watersheds was 2.2 x 10⁶ t. Although the mass of all of the plumes represents only 1%–2% of the total sediment output from the rivers, the plumes covered an area of 29 500 km2 of coastal waters. An important cautionary note is that the surface plumes visible in the remote-sensing data (even though nearly coincident with flooding) do not represent mass output from the rivers
Sedimentation in reservoirs can lead to loss of water storagecapacity, impairment of navigability, loss of downstream floodcontrolbenefits, increased flooding upstream because ofstreambed aggradation in the deltaic region, and sedimententrainment in hydropower equipment (Fan and Morris, 1992).One aspect of reservoir sedimentation that has received littleattention is deposition above the normal pool elevation, asshallow overbank flows during high flow periods spread acrossthe alluvial surface of the sediment deposit. While thisdeposition does not directly result in storage capacity loss it hasthe potential to have a wide range of effects. Deposition withinthe reservoir (below normal-pool elevation), reservoir trapefficiency, and the sediment response to dam removal are all

likely to be affected by above normal-pool deposition. The goalof this study is to use a combination of numerical modeling andfield work to understand the magnitude of above-normal pooldeposition relative to all reservoir sedimentation, as well the keydrivers for the spatial variability of above normal-pooldeposition. Our research site is Searsville Reservoir, locatedwithin Jasper Ridge Biological Preserve on the Stanford
University campus in California, U.S.A..
Impact of Stream Restoration on Flood Waves
Abstract
Restoration of channelized or incised streams has the potential to reduce downstream flooding via storing and dissipating the energy of flood waves. Restoration design elements such as restoring meanders, reducing slope, restoring floodplain connectivity, re-introducing in-channel woody debris, and re-vegetating banks and the floodplain have the capacity to attenuate flood waves via energy dissipation and channel and floodplain storage. Flood discharge hydrographs measured up and downstream of several restored reaches of varying stream order and located in both urban and rural catchments are coupled with direct measurements of stream roughness at various stages to directly measure changes to peak discharge, flood wave celerity, and dispersion. A one-dimensional unsteady flow routing model, HEC-RAS, is calibrated and used to compare attenuation characteristics between pre and post restoration conditions. Modeled sensitivity results indicate that a restoration project placed on a smaller order stream demonstrates the highest relative reduction in peak discharge of routed flood waves compared to one of equal length on a higher order stream. Reductions in bed slope, extensions in channel length, and increases in channel and floodplain roughness follow restoration placement with the watershed in relative importance. By better understanding how design, scale, and location of restored reaches within a catchment hydraulically impact flood flows, this study contributes both to restoration design and site decision making. It also quantifies the effect of reach scale stream restoration on flood wave attenuation.
http://books.google.com/books?id=ZNpihO_GAQ4C&pg=PA71&lpg=PA71&dq=flood+wave+attenuation&source=bl&ots=XcKYdip5Tq&sig=T2fRt042OAJUckLtsi9fLU6_zdY&hl=en&ei=urC6S8uiOYPCsgOf7fmaBQ&sa=X&oi=book_result&ct=result&resnum=9&ved=0CB8Q6AEwCDhG#v=onepage&q=flood%20wave%20attenuation&f=false

Project Components
Imaging of Flood Flows and Floodplain Definition
NASA/JAXA’s AMSR-E mission is now providing the capability to measure changing river discharge from orbit [1]. Floods can be measured in a manner familiar to hydrologists: as a time series of discharge at a fixed measurement site. This capability has already been transferred into operational uses: as the “Global Flood Detection System” (GFDS) portion of the European Commission-supported “Global Disaster Alert and Dissemination System” (GDACS) [2-3] and, at the Dartmouth Flood Observatory, as “River Watch”, a global river discharge and runoff measurement system: http://www.dartmouth.edu/~floods/AMSR-E%20Gaging%20Reaches/IndexMap.htm.
The technique is based on the exceptional sensitivity of certain microwave frequency/polarization configurations to the relative coverage of water and land within a pixel. As rivers rise over a 5 km measurement reach, surface water areal extent within this defined area increases monotonically, and a wide area, frequent repeat, low spatial resolution sensor can detect and consistently measure this change (figures 1-2). AMSR-E, a microwave radiometer, provides daily coverage over California: this temporal sampling is adequate for measuring many aspects of at-a-site river hydrology, including the arrival times, amplitudes, and duration of river flood waves.
Translate mapped flood extents into flood hazard information useful to government water and international development agencies as well as to the for-profit sector, and as a supplement to flood modeling based on sparse in situ data. Map information such as illustrated in figure 16 clearly bears on the issue of individual land parcel risk of future flooding. At the same time, a large literature underlies the long-standing paradigm of “hydrologic stationarity” and the use of hydraulic models or shorthand engineering equations, river channel bathymetry (cross section characteristics), floodplain roughness (manning’s n) evaluation, regional gaging station records, meteorological data, and a variety of statistical techniques and assumptions to determine flood risk. The issue of how to evaluate flood risk in developing nations is now becoming urgent as both public and private organizations become pro-actively involved in attempting to reduce societal vulnerability of extreme flood events [18, 46, 47]. The link to these social concerns is a critical component of this IDS proposal, and some discussion is required as to how orbital remote sensing of flooding can improve prevailing paradigms of flood risk assessment. The hydrologic assumption of stationarity implies that the sampled time interval is representative of a population of flood peaks from a homogenous population whose recurrence intervals are not changing systematically over time. However, floods along any given river are, very commonly, composed of events caused by different meteorological circumstances [41] [48]. Also, an abundant literature attests to the importance of long term landuse changes in runoff hydrology and flood 22

regime, and especially for upland watersheds of moderate size and with significant local relief [49]. For larger rivers, the effects of upstream land-use change enter into international relations and also upset the stationarity assumption. For example, flooding along the Mekong River in Southeast Asia causes extensive crop and other societal damage, raising the question among downstream nations as to what degree such flooding can be attributed to upstream, cross-border changes, such as deforestation in China. In fact, analyses of individual river flow series has often demonstrated that the assumption of stationarity is rarely fulfilled: many stream flow series exhibit long term trends, and including changes in the frequency and magnitude of floods [50, 51]. Some of these trends may be related to global warming or to other climate changes [33-35, 38-40, 52-55], others may be due to watershed land cover modification. Recent analyses using both precipitation data and modeling indicate that global precipitation has, in recent decades, increased, and will continue to increase [56, 57], and this in turn may cause, at least in some regions, an increase in flooding [58]. There is no question that floods have also caused increased fatalities and various types of economic losses since global record-keeping began in the 1960s [59]. The implication for flood risk assessment and insurance mechanisms is that application of standard statistical methodologies for determining flood frequency and magnitude do not necessarily provide an accurate assessment of flood risk [36]. Clearly, while not denying the need for analysis of long period environmental records, the recent (last decade) actual history of floodplain inundation should be a critical adjunct to risk assessment: this recent past may be a better guide to the immediate future than stationarity-based statistical analyses. In regard to global flood insurance: several technologies are now being applied to further develop index-based flood insurance. These include: 1) GIS and related information-processing technologies, 2) flood modeling (here the term includes both runoff modeling, which predicts the size and duration of flood discharge from meteorological information, and hydraulic or hydrodynamic modeling, which predicts the heights and durations reached by flood waves of known size traveling along the floodplain), and 3) orbital remote sensing of actual flooding. In regard to these technologies, remote sensing is a vital operational tool for loss assessments, as it enables the detection of actual flooded areas. If farmers are enrolled for insurance within a GIS-linked database, rapid detection of the location, areal extent, and duration of flooded fields becomes a possibility given an adequate quantity of applicable remote sensing data. Direct observation can, therefore, help construct a simplified indexed flood insurance product, where agreed payouts are matched to damage expected from specific flooding events. In regard to estimating flood risk, the U.S. and many other nations have developed standard techniques or handbooks so that flood discharge and frequency are estimated in a uniform (“accountable”) manner, and even though standardization alone does not, necessarily, accomplish the also-desired goal of accuracy and reliability. Within the U.S., the US Geological Survey developed regional regression equations to estimate the flood frequency and magnitude at ungauged locations of a watershed. These equations are based on flood frequency and magnitude from gauged watersheds and on an agreed-upon standard probability distribution (commonly, the Log Pearson 23
Type III). Regression equations transfer flood characteristics from gauged sites to ungauged sites through the use of topographic, physical, and climatic characteristics of the ungauged watershed. The search for more effective and economical methods of assessing flood hazard in developing nations is motivated by the difficulties in applying the traditional approaches where long term instrumental data are sparse and where channel cross sectional data are lacking. There is also a pressing need to identify lands flooded more frequently than every century. Although watershed land use or river channel changes may affect the size of the 100 yr event to some degree, their most powerful effect is on more frequent flooding. In this regard, orbital remote sensing technology now provides globally consistent geographic coverage of flood inundation as it occurs, and this record can be preserved, just as streamflow records are preserved. Through this approach, flood hazard assessments can, in principle, be accomplished without ingesting and manipulating any meteorological or river discharge data. Instead, the direct observable is the history and location of actual flood inundation. Gauging station-based flood risk approaches, and the associated statistical and modeling infrastructure, all evolved before the advent of orbital remote sensing, and the possibility of routine mapping of flood events. In the absence of the latter, flood modeling is the only feasible approach for many regions, but, if remote sensing is available, developing an observational record may be more accurate and also more cost-effective than modeling. Remote sensing can delineate those land areas where flooding is in fact a contemporary hazard, rather than where extrapolated and interpolated discharge data, channel bathymetry, channel slope, hydraulic theory, topographic data, the stationarity assumption, and modeling indicate where flooding could occur. An entirely different approach in flood risk assessment is possible, given the new technologies.
Our team will test this new approach, on a region by region basis, with input from end users, and as it adds to the data in the global Surface Water Data Record (figure 16 is an example of a Record; figure 17 provides the locations of all records). Over the past 10 years, hundreds of flood events have been imaged and mapped, and many regions include abundant GIS data holdings. In consultation unfunded project collaborators (A. Lotsch at the World Bank and J. Mehlhorn at Swiss Re), we plan extensive reformatting, and enhancements designed to make the flood inundation information understandable and of direct use for risk assessment in general. We will link the NASA MODIS data to the NASA AMSR-E data (River Watch) and use the 7+ yr long time series of the last to place estimated exceedance probabilities on the inundation limits defined in the first. For example, in some locations the mapped flooding is known, from local River Watch time series, to have been the largest since mid-2002 (so Log Pearson III analyses place a relative low exceedance probability); in other locations inundation so far mapped is recording relatively frequent discharges, close to the mean annual flood. Where possible, we plan to use the archived MODIS data to capture in map form and as part of the Data Records both the limits of the mean annual flood and the flood-of-record, 1999 to present.
Modeling and Analysis of Divergent Sediment and Water Flow
Divergence Flow of Water and Sediment in Lowland Coastal Settings
James P.M. Syvitski, G. Robert Brakenridge, Albert J. KettnerCSDMS Integration Facility
INSTAAR, University of Colorado — BoulderCampus Box 545, Boulder, Colorado, 80309-0545
Voice: (303) 735-5482; Fax: (303) 735-8180Email: [email protected]
http://csdms.colorado.edu/

Executive Summary
This planning letter outlines the workflow that was completed for a type coastal zone, the Niger Delta. The workflow consists of daily discharge estimated, flow grid development, water-balance modeling, flow diversions through distributary channels, and sediment flux modeling. During that exercise a number of problems were identified related to flow grids in flat coastal zones, parameterizations of sub-pixel features (e.g. levees, canopy), and overbank flow dynamics. This PL defines these problems offering an approach to develop a more robust workflow that provides solutions to each of these problems. The new approach also employs state-of-the-art methods for remotely sensed discharge across a delta plain (AMSR-E). While the problem will initially be focused on the Niger Delta to take advantage of past efforts, aspects of the new approaches will be exercised in a series of other flat lowland coastal zones.
Background
Recent work for ONR, related to the hydrological assessment of the fluxes of water and sediment to the shorelines of the Niger Delta, Nigeria, has raised a number of modeling issues. A work flow was established in the project, including:
1) Obtain daily discharge of the main trunk river flowing into a deltaic setting. This can be from: i) gauged records, if available from a national archive such as from the USGS in the United States — a number of countries have such information available through the web, most do not; ii) modeled estimates, from an appropriate water balance (e.g. HydroTrend) or flow routing (e.g. TopoFlow) model; and 3) satellite estimates — the Dartmouth Flood Observatory employs the Advanced Scanning Microradiometer (AMSR-E) at 36.5 Ghz to estimate the daily variations in river discharge (http://www.dartmouth.edu/~floods/AMSR-E%20Gaging%20Reaches/technical.html ). In the Niger Project we obtained daily discharge records from the Global Runoff Data Center.
2) Obtain a flow grid of the coastal environment with an appropriate Digital Elevation Model (DEM). This DEM exercise will also automatically map out the sub-basins boundaries. There are a number of global DEMs available for this exercise (see http://csdms.colorado.edu/wiki/Topography_data including Hydro1K, SRTM, ASTER, GLOBE, GTOPO30, NGDC Coastal Relief Model). There are a number of tools to generate the flow grids based on the DEM, including RiverTools® and ArcGIS®. In the Niger Project we obtained a 30 m pixel resolution DEM from NGA-SRTM data. No DEM elevation correction was made regarding jungle canopy.
3) Verify the flow grid with remotely sensed river channel information (satellite imagery, areal photography). The flow grid determined from step 2) is a numerical approximation of how water will be routed off the coastal landscape. The grid must be verified and corrected where necessary. In the Niger Project we employed the SRTM Water Body Data Set produced by NGA to locate all river and tidal channels that exceeded 183 m in width. Smaller channels are located with 30 m resolution LANDSAT imagery.
4) Determine the runoff from rainfall within each sub-basin. A complete water balance – flow routing model must be run to accomplish this exercise. This exercise involves obtaining i) precipitation data (e.g. TRMM based precipitation estimates, every 3 hours; 0.25° x 0.25° grid), ii) evapo-transpiration (EV) estimates (e.g. MODIS ET (MOD16) algorithm every 8 days; 0.05° x 0.05° grid), iii) soil moisture conditions (e.g. Advanced Very High Resolution Radiometer (AVHRR; the Special Sensor Microwave Imager (SSM/I); AMSR-E and TMI). The Niger Delta project included all available TRMM and MOD16 data and assumed saturated soil conditions — the later a simplification that would affect low-discharge, non-monsoonal conditions only. We employed the model

TopoFlow to tranfer TRMM, EV and soil moisture data through a suite of hydrologic processes to evolve discharge in time (hourly to daily).
5) Determine the flow segmentation through the various distributary channels and combine with the modeled flow routing from in situ precipitation (step 4). In the Niger Project we measured the channel width for every join and split derived from the SRTM Water Body Data Set and LANDSAT imagery in the distributary channel pattern. Over 450 widths of distributary channels (post splits or rejoins) across the Niger Delta were measured. Widths are then used as a proxy of proportioning discharge and runoff across the delta surface, and diversions from one sub-basin to another. Twenty-five Niger sub-basins were modeled in terms of their in-situ plus channelized runoff.
6) Couple the discharge estimates to a sediment model to provide estimates of sediment flux across the various coastal sub-basins. In the Niger Delta project we estimated the sediment flux to within a factor of 2 using the sediment routine from the HydroTrend model.
Problems
Today flow grids (step 2 above) are based on flow convergence with present numerical tools. This is appropriate for much of the terrestrial surface, however in the low gradient coastal zone, flow divergence is more common, where channelized flow splits into distributary channels. Commercial tools like ArcGIS® and RiverTools®, are not capable of producing these divergent flow grids. For example HydroSHEDS (Hydrological data based on SHuttle Elevation Derivatives at multiple Scales) is a mapping product that provides hydrographic information for regional and global-scale applications in a consistent format. It offers a suite of geo-referenced data sets (vector and raster) at various scales, including river networks, watershed boundaries, drainage directions, and flow accumulations.
In the left image above, HydroSheds flow grid of the Orinoco Delta has the distributary channels (see box) disconnected from the main trunk channel. The atlas map to the right has the distributary channels correctly connected to the main trunk channel. The HydroShed grid mistake is standard for modern flow grid generators, rendering flow grids for coastal systems as suspect or in error, except for those corrected by hand.
The second problem is that the original DEM does not take into account the channel depth. For example the Amazon has water depths greater than 30 m. SRTM only provides the top of the river surface. Thus a schema must be included for adding channel depth (and channel shape) into the DEM before water is routed through the coastal zone.
The third problem is that modern flow routing models do not parameterize the reality of stop banks in terms of levee height. The models separate discharge into flow velocity, flow height and channel width, based on the

resolution of the original DEM. Sub-pixel features such as stop banks are ignored.
The fourth problem is that if overbanking occurs the routing of this water is not based on height of the water surface, rather it is based on the original elevation provided by the DEM that the water is being routed over. This does not take into account flow away from the river channel, down the river levee, and driven by the hydraulic head and momentum (i.e. using the shallow water equation). Instead the original flow grid has the water re-routed back into the original river channel.
The fifth problem is to develop a work around for correcting the DEM for the jungle canopy and its impact on developing the original flow grid.
The sixth problem is to employ a coastal floodplain Exner equation that has both erosion and deposition built into it. The surprising feature of the Niger Delta project was the dynamics across the floodplain. Runoff from monsoonal rains was enormous creating giant rivers in days generating flows that may last for only weeks. These short-term flows would be extremely erosive for the initial phase of the flood, and highly depositional for the waning stages of the flood.
Objectives and Approach
1) Develop a robust set of fixes to these flow routing problems, based on theory, on available global approaches to remotely sensed data, and on published observations of delta-plain dynamics. The result should be a workflow that is portable to areas of interest to ONR. Given the work that has already been completed on the Niger Delta, we would initially continue to push the limits of this environment. We would employ a variety of canopy corrections and river channel depth corrections to the SRTM data. We would alter the flow algorithms of TopoFlow to parameterize stop bank levees. We would develop a new TopoFlow component based on flow heights using the shallow water equation, and we would have the component take into account levee breaches.
2) Employ new observational methods for mapping river discharge through clouds to better constrain the flow routing models. One of the investigators of this project, Dr. Brakenridge, is Director of the Dartmouth Flood Observatory, who has pioneered the use of the Advanced Scanning Microradiometer to estimate the daily variations in river discharge spatially. This approach would be extended to work on estimating the flow of water across distributary channels in a large flood plain, such as the Niger Delta.
3) Develop a method for Flow Routing Tools to recognize low gradient broad flat coastal settings, such as deltas, to map flow networks in these regions not as zones of flow convergence, rather as zones of flow divergence where distributary channels are recognized. This new algorithm would be tested out in a variety of coastal settings (Niger, Orinoco, Mahanadi, Brahmani, Mekong, Irrawaddy).
Estimated Project Costs
We are estimating the cost of this project to be approximately $150K/y, with project completion in two years. The PI would draw no salary, and his work effort would be underwritten by CU salary support for research via their contribution to the CSDMS project. This ONR proposal is expected to have great community impact, and as such the CSDMS project would be fully supportive of this activity — the PI is the CSDMS Executive Director.

Each of the Co-PIs would require one month of salary per year. The remainder and bulk of the costs would be for a full time postdoctoral student. Aaron Bever, presently at VIMS has expressed interest in working at CSDMS and his background in model use and development, principally with ROMS, would be perfect to complete this workflow exercise. A small amount of computer support and travel would round out the budget.
JAMES P M SYVITSKI, CSDMS University of Colorado, Boulder CO USA; G ROBERT BRAKENRIDGE, CSDMS University of Colorado, Boulder CO USA; ALBERT J KETTNER, CSDMS University of Colorado,
Boulder CO USA<br><br></b></font><font face='Arial' size='3' color='#000000'>A typical workflow for routing water and sediment through lowland coastal settings would involve six important steps. 1) Obtain daily discharge of the main trunk river flowing into a deltaic setting. 2) Develop an appropriate Digital Elevation Model (DEM) of the lowland coastal setting. 3) Classify the coastal sedimentary environments
including zones that receive episodic floodwaters. 4) Develop a flow grid (channel network) of the coastal environment, including both river and tidal channels. 5) Verify the flow grid with remotely sensed river channel information (satellite imagery, areal photography). 6) Delineate the sub-catchments across the coastal setting. 7) Alter the flow grid to allow for splits and joins and flow segmentation through the various distributary channels. 8) Proportion the discharge of the main trunk river through the flow segmentation. 9) Acquire the hydrological conditions for each sub-basin. 10) Model the water discharge through each sub-basin. 11) Model the sediment
discharge through each sub-basin. A series of problems with this workflow need further study: 1) Flow grids are now based on convergent flow at odds with most coastal settings. 2) Flow grid DEMs do not take into account
channel depth needed for water routing through the coastal zone. 3) Modern flow routing models do not parameterize the reality of stop banks in terms of levee height. Sub-pixel features such as stop banks are ignored. 4) These flow routing models used in the coastal zone should be based on height of the water surface, and thus the
hydraulic head and momentum of the channel flow. 5) DEMs and their flow grids need to be corrected for the jungle canopy.
<br><br></font><font face='Arial' size='3' color='#333333'><b>SS-11 Recent advances in numerical model on morphodynamics...

Methods
Observational Data
Modeling
Plan of Work
Budget
References Cited
"Successful proposals are expected to study water
systems in their entirety and to enable a new interdisciplinary paradigm
in water research...
Successful proposals are expected to broadly integrate
across the biosciences, geosciences, social sciences, and engineering
enabling a new interdisciplinary paradigm in water research using a
systems science and engineering approach...
Proposals that do not broadly integrate across the

biological sciences, engineering, geosciences, and social sciences may
be returned without review...
Principal Investigators should carefully identify within
the proposal the innovative aspects that are the focus of their project.
They should also provide clear explanation and justification of the
importance (within the context of the water system science and
engineering) of the predictive understanding that will be generated by
their project...
...proponents are encouraged, where appropriate, to
build upon existing observational and engineering infrastructure (e.g.
NSF-funded LTER sites, CZOs, WATERS Network Test Beds,
Cyberinfrastructure for Environmental Observatories: Prototypes(CEO-Ps)
sites or facilities operated by other agencies such as USEPA,USGS, USDA
or NOAA).
Additional Review Criteria:
*Proposals that are interdisciplinary and broadly
integrate across the biological sciences, geosciences, social sciences,
and engineering.
This breadth of interdisciplinary research is
expected to be reflected in the Principal Investigators involved in this
project. Proposals that do not satisfy this review criterion may be
returned without review..."

As a consequence, it is important that your "team" be well defined in
the text, and as cover-page PIs, coPIs, senior personnel or named
subawardees. These categories (your team) should include biosketchs. A
separate budget should be provided for each subawardee along with a
description of the work to be performed and a subaward budget
explanation.
Additionally, there are limitations on the types of institutions and
number of institutions as well as the number of proposals in which a PI
may participate:
"An individual may appear as Principal Investigator
(PI), co-PI, other senior personnel or investigator on only one
category 2 or category 3 proposal submitted in FY 2010 in response to
this solicitation. In addition, that individual may participate in only
one category 1 proposal."
Noncompliance may result in elimination of BOTH proposals.
ADDITIONAL NOTES FOR PIs
1. The solicitation provides answers to many questions.
2. Please use your LOI identifier number as the first "word" in
your project summary.
3. If post docs are to be part of the project, a post doc mentoring
plan must be submitted.
4. All proposals including collaborative proposals must include a

completed 'Facilities and Equipment and Resources' page; it cannot be a
blank form.
5. Compliance with respect to GPG proposal guidelines will be
enforced.
6. If your project is asking for funds to collect new data (any
type), it is by definition NOT a category 3 proposal.
We look forward to a successful round of proposals through this
solicitation. Thank you for your participation.
Enriqueta C. Barrera, Program Director, Division of Earth Sciences,
telephone: (703) 292-8551, email: [email protected]
Paul Bishop, Program Director, Division of Chemical, Bioengineering,
Environmental, and Transport Systems, telephone:(703) 292-2161, email:
Cheryl Eavey, Program Director, Division of Social and Economic
Sciences, telephone: (703) 292-7269, email:[email protected]
Bruce Hamilton, Program Director, Division of Chemical, Bioengineering,
Environmental, and Transport Systems, telephone:(703) 292-8320, email:

Robert O'Connor, Program Director, Division of Social and Economic
Sciences, telephone: (703) 292-7263, email:[email protected]
Thomas Torgersen, Program Director, Division of Earth Sciences,
telephone: (703) 292-8549, email: [email protected]
Todd Crowl, Program Director, Division of Environmental Biology,
telephone: (703) 292-7870, email: [email protected]
Kathleen Weathers, Program Director, Division of Environmental Biology,
telephone: (703) 292-8227, email:[email protected]
For questions related to the use of FastLane, contact:
FastLane Help Desk, telephone: 1-800-673-6188; e-mail: [email protected].
Biographical Sketch: JAMES P. M. SYVITSKI
CSDMS: Community Surface Dynamics Modeling System, Email: [email protected] Campus Box 545 or 3100 Marine Street, Phone: 303-735-5482University of Colorado, Boulder CO, 80309-0545 Fax: 303-735-8180http://csdms.colorado.edu/
Professional PreparationB.Sc. Lakehead University 1974 Geology and MathematicsH.B.Sc. Lakehead University 1975 Geochemistry
Honors Thesis Advisor: Professor J.D. Mothersill, Lakehead University, Canada, 1972-75Ph. D. U. British Columbia 1978 Oceanography and Geological Sciences
Graduate Thesis Advisor: Professor J.W. Murray, U. British Columbia, Canada, 1975-78

Appointments2009— Professor (Applied Math) University of Colorado at Boulder2007— Professor (Oceanography) University of Colorado at Boulder2007— Executive Director, CSDMS University of Colorado at Boulder2001— Professor (Hydrological Sciences) University of Colorado at Boulder1997— Professor (Geophysics) University of Colorado at Boulder1995— Professor (Geological Sciences) University of Colorado at Boulder1995-07 Director (INSTAAR) University of Colorado at Boulder1993-97 Adj. Professor (Earth Sciences) Dalhousie University1992-95 Adj. Prof. (Ocean Sciences) Memorial University of Newfoundland1989-95 Adj. Professor (Oceanography) INRS-oceanologie1989-95 Adj. Professor (Geology) Laval University1982-85 Head Sediment Dynamics Group Bedford Inst. of Oceanography1981-95 Senior Research Scientist Geological Survey of Canada-Atlantic1978-81 Asst. Professor (Geol. & Geophys.) University of Calgary
123 peer-reviewed journal pubs; 54 peer-reviewed books & book chapters; 41 peer-reviewed conference proceedings; 56 peer-reviewed government reports, 212 publ. conference abstracts, editor of 9 special journal volumes
Some Relevant Publications. Khan SM,, Imran, J, Bradford, JS, and Syvitski, JPM, 2005, Numerical modeling of a hyperpycnal plume. Marine Geology
222-223: 193-211.Kraft, BJ, Overeem, I, Holland, CW, Pratson, LF, Syvitski, JPM, and Mayer, LM, 2006, Stratigraphic model predictions of
geoacoustic properties. IEEE Journal of Ocean Engineering 31(2): 266-283.Pratson, LF, Hutton, EWH Hutton, AJ Kettner, JPM Syvitski, PS Hill, Douglas AG, TG Milligan, 2007, The Impact of floods
and storms on the acoustic reflectivity of the inner continental shelf: A modeling assessment. Continental Shelf Research 27: 542–559.
Syvitski, JPM & Milliman, JD, 2007, Geology, geography and humans battle for dominance over the delivery of sediment to the coastal ocean. J. Geology 115: 1-19.
Syvitski, JPM & Saito, Y, 2007, Morphodynamics of Deltas under the Influence of Humans. Global and Planetary Changes 57: 261-282.
Syvitski, JPM Pratson, LF, Wiberg, PL, Steckler, MS, Garcia, MH, Geyer, WR, Harris, CK, Hutton, EWH, Imran, J, Lee, HJ, Morehead, MD, and Parker, G, 2007. Prediction of margin stratigraphy. In: CA Nittrouer, et al (Eds.) Continental-Margin Sedimentation: From Sediment Transport to Sequence Stratigraphy. IAS Spec. Publ. No. 37: 459-530.
Syvitski, JPM, AJ Kettner, MT. Hannon, EWH. Hutton, I Overeem, GR Brakenridge, J Day, C Vörösmarty, Y Saito, L Giosan, RJ Nicholls in press, Sinking Deltas. Nature Geoscience 2: 681-689.
Syvitski, JPM, Harvey, N, Wollanski, E, Burnett, WC. Perillo, GME & Gornitz, V 2005. Dynamics of the Coastal Zone. In: CJ Crossland, et al (Eds.) Global Fluxes in the Anthropocene. Springer, Berlin, pp. 39-94.
Syvitski, JPM. Vörösmarty C, Kettner, AJ, Green, P. 2005, Impact of humans on the flux of terrestrial sediment to the global coastal ocean. Science 308: 376-380.
Syvitski, JPM., RL Slingerland, P Burgess, E Meiburg, AB Murray, P Wiberg, G Tucker, AA Voinov, 2010, Morphodynamic Models: An Overview. In: Vionnet et al. (eds) River, Coastal and Estuarine Morphodynamics: RCEM 2009, Taylor & Francis Group, London, ISBN 978-0-415-55426-8 CRC Press, p. 3-20.
Synergistic Activities (examples)1982 – present: Journal Editor, Guest Editor, Assoc. Editor, and Editorial Board Member of Sedimentary Geology; Journal
Sedimentary Research; Oceanography; Arctic, Antarctic & Alpine Research; Marine Geology; Computers & Geoscience; Global & Planetary Change; Chinese J of Oceanology & Limnology
1985 – present: Consultant to the U.S. Office of Naval Research on science issues related to naval operations on continental margins and the coastal zone, e.g. Environmental Complexity for the operational Navy; High Frequency Acoustics; Geoclutter; Mine Burial

1995 – 2005: ONR Program Co-leader: STRATAFORM (Strata Formation on Continental Margins) 35 PIs; EuroSTRATAFORM 100 PIs
1995 – present: Scientific Advisor to the National Science Foundation: e.g. NSF/ONR SCICEX US Nuclear Submarine Science; NSF RAISE Land-Shelf Interaction Program; NSF Margins: Source to Sink Program; NSF Community Sediment Model Initiative; NSF Geology/Paleontology Futures; NSF-ONR Data Management for Marine Geology & Geophysics
1995– 2007, Director of INSTAAR, a CU research Institute with 300 employees: 95 at the Ph.D. level and faculty from 6 academic departments. INSTAAR is an Earth and Environmental Systems Institute.
1995-98 ARCUS (Arctic Research Consortium of the US) Board of Directors, representing 30 US universities/institutes; Secretary of Board of Directors (1997-98)
1998-04, Science Steering Committee, IGBP Land Ocean Interactions in the Coastal Zone (LOICZ)2001-3, Convener (Special Editor of Global and Planetary Change), IGBP-LOICZ-PAGES-BAHC Workshop on Supply and
flux of sediment along hydrological pathways2003-09, SCOR/LOICZ Co-Chair on Sediment Retention in Estuaries
Recent Awards2009: Royal Society of Canada, Huntsman Medal for Outstanding Achievements in Marine Science, Halifax Canada2010: Fellow, American Geophysical Union
Collaborators NA onlyChuck Nittrouer, (U. Washington); Carl Friedrichs (VIMS), Charles Vorosmarty (CUNY), Gary Parker (U. Illinois-Urbana Champagne), Rudy Slingerland (Penn. State), Pat Wiberg (U. Virginia), Brad Murray (Duke), Greg Tucker (CIRES), Eckart Meiburg (UCSB), Wilfred Wollheim (UNH), Sybil Seitzinger (Rutgers), Balazs Fekete (CUNY), John Milliman (VIMS)
Graduate - Supervision1995-99 Mark D. Morehead Ph.D. CU-Boulder1996-01 Damian B. O’Grady Ph.D. CU-Boulder1999-02 David Mixon M.Sc. CU-Boulder1999-03 David Kinner Ph.D. CU-Boulder2000-05 Gita Dunhill Ph.D. CU-Boulder2001-07 Eric W.H. Hutton Ph.D. CU-Boulder2003-04 David Pyles Ph.D. CU-Boulder
2004-07 Alex Sinclair M.Sc. CU-Boulder2004-07 Albert J. Kettner Ph.D. Delft U Tech2007— Mark T. Hannon Ph.D. CU-Boulder2008-09 Scott Bachman Ph.D. CU-Boulder2010— Fei Xing Ph.D. CU-Boulder2010— Ben Hudson Ph.D. CU-Boulder
Post-graduate Supervision1987-89 Jay Stravers PDF Bedford Inst Ocgy1993-95 Azetsu Scott PDF Bedford Inst Ocgy1994-95 Thierry Mulder PDF Bedford Inst Ocgy 1995-96 Hee Jun Lee PDF CU-Boulder 1996-98 David Bahr PDF CU-Boulder1999-00 Scott Peckham PDF CU-Boulder2001-02 Damian O’Grady PDF CU-Boulder
2001-03 J. Scott Stewart PDF CU-Boulder2002-04 Irina Overeem PDF CU-Boulder2002-05 Yu’suke Kubo PDF CU-Boulder2007-10 Albert J. Kettner PDF CU-Boulder2009— Jisamma Kallumadikal CS CU-Boulder2009— Maureen Berlin PDF CU-Boulder2009— Beichuan Yan PDF CU-Boulder
der
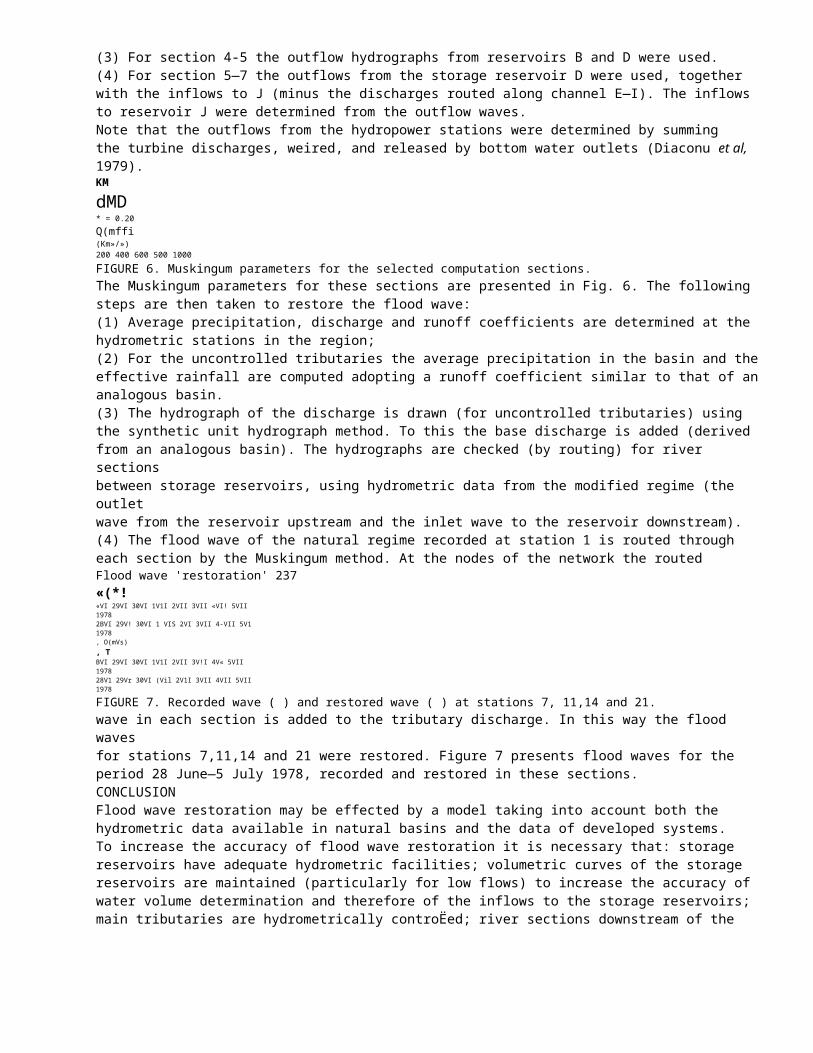
Facilities and Equipment
CU’s Environmental and Computation and Imaging (ECI) Facility, and the Community Surface Dynamics Modeling System (CSDMS) Integration Facility http://csdms.colorado.edu/, are both under the direction of Prof. James Syvitski. The Facilities provide large model and data capacity, rapid algorithm testing and development, sensitivity and Monte Carlo studies, and parallel processing. High Performance Computers are required to complete the proposal model runs. The ECI and CSDMS Facilities support the following computer hardware and software.
1. There are fifteen modern fully loaded, multicore, desktop computers and or workstations, supporting a variety of I/O systems and interfaces. The computers offer 50GB RAM and 10TB of native storage.
2. CSDMS High Performance Computing Cluster (HPCC) System is an SGI Altix XE 1300 with integrated 512 x 3.0GHz -12M -1600MHz - 80W E5472 processors, using non-blocking Infiniband Interconnect with 1.152TB of memory (RAM), under one head node and 28 compute nodes, plus 4 compute nodes with heavy memory, and associated infrastructure including 72TB/7200RPM/SATA Raid storage, and a web server 4 x 2.33GHz/8GB RAM E5420 processor. The system provides +6Tflop/s peak performance.
3. Syvitski is one of five Principal Investigators on a Tier 3, 16000 core (>100 Tflop/s) Dell HPCC The total raw storage capacity is 650 TB. The HPCC is part of the Front Range Computational Consortium and should be operation by the fall of 2009.
4. ECI & CSDMS Security: Physical Access is restricted out of formal hours, holidays and weekends. The Facilities electronic locking system is managed by CU Access Services. The user list is controlled and kept up-to-date. The OS is RedHat Enterprise with up-to-date patches. For remote login, clear-text protocols (i.e. FTP, Telnet) are blocked; SSH connections apply. Login from peripheral PC’s and Mac’s is via SSH and requires username / password. The ECI benefits from technical advices and alerts given across the campus network by the central Colorado University ITS contractor. The ECI is within the CU domain protected by a firewall.
1. C. Nilsson, C. A. Reidy, M. Dynesius, C. Revenga, Science 308, 405 (2005).2. A. Dehnhardt, (2000).3. G. R. Brakenridge, E. Anderson, S. V. Nghiem, S. Caquard, T. Shabaneh, in Proceedings of the
30th International Symposium on Remote Sensing of the Environment. (Honolulu, 2003) pp. 4.4. G. R. Brakenridge, E. Anderson, S. V. Nghiem, S. Chien, EOS, Transactions of the American
Geophysical Union 86 (2005).5. D. Alsdorf, D., Lettenmaier, C. J. Vorosmarty, AGU Eos Transactions 84, 274 (2003).6. A. I. Shiklomanov, R. B. Lammers, C. J. Vorosmarty, AGU Eos Transactions 83, 16 (2002).7. G. R. Brakenridge, E. Anderson, paper presented at the Transboundary Floods, Proc. of NATO
Advanced Research Workshop, Baile Felix – Oradea, Romania 2005.8. J. P. M. Syvitski et al., Naure Geoscience, in press (2009).9. W. W. F. f. Nature, Rivers at Risk: Dams and the future of freshwater ecosystems (World Wide
Fund for Nature, Godalming, UK, 2004), pp.10. J. Syvitski, V. C, A. Kettner, P. Green, Science 308, 376 (2005).

11. G. R. Brakenridge, S. V. Nghiem, E. Anderson, R. Mic, Water Resources Research 43 (2007).12. W. D. Carson, U. S. A. C. o. E. H. E. Center, Ed. ( , 1975) pp. 126.13. P. Lamberti, P. Stefano, Meccanica 25, 107 (1990).14. V. M. Ponce, A. Taher-shamsi, A. V. Shetty, JOURNAL OF HYDRAULIC ENGINEERING 129, 777
(2003).15. G. R. Hillman, Wetlands 18, 21 (2009).16. T. Tingsanchali, K. L. Narendra, Journal of Hydraulic Research 26, 585 (1988).17. H. Piegay, Global Ecology and Biogeography Letters 6, 187 (1997).18. C. Chuntian, Hydrological Sciences Journal 44, 573 (1999).19. S. P. Simonovic, paper presented at the Proceedings of the International Workshop, London,
Ontario, Canada, 18 – 20 October 2001 2001.