cs m146 discussion: week 4 logistic regression & linear
TRANSCRIPT
Junheng HaoFriday, 01/29/2021
CS M146 Discussion: Week 4Logistic Regression & Linear Regression
Roadmap
● Announcement
● Logistic Regression
● Linear Regression
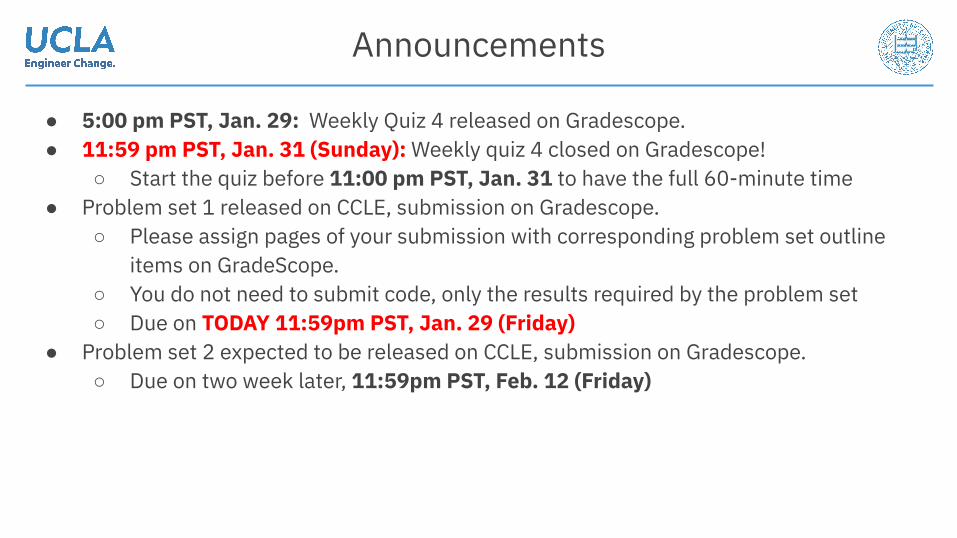
Announcements
● 5:00 pm PST, Jan. 29: Weekly Quiz 4 released on Gradescope.● 11:59 pm PST, Jan. 31 (Sunday): Weekly quiz 4 closed on Gradescope!
○ Start the quiz before 11:00 pm PST, Jan. 31 to have the full 60-minute time● Problem set 1 released on CCLE, submission on Gradescope.
○ Please assign pages of your submission with corresponding problem set outline items on GradeScope.
○ You do not need to submit code, only the results required by the problem set○ Due on TODAY 11:59pm PST, Jan. 29 (Friday)
● Problem set 2 expected to be released on CCLE, submission on Gradescope.○ Due on two week later, 11:59pm PST, Feb. 12 (Friday)

About Quiz 4
● Quiz release date and time: Jan 29, 2021 (Friday) 05:00 PM PST● Quiz due/close date and time: Jan 31, 2021 (Sunday) 11:59 PM PST● You will have up to 60 minutes to take this exam. → Start before 11:00 PM Sunday● You can find the exam entry named "Week 4 Quiz" on GradeScope. ● Topics: Logistic Regression, Linear Regression, Gradient Descent● Question Types
○ True/false, multiple choices● Some light calculations are expected. Some scratch paper and one scientific calculator
(physical or online) are recommended for preparation.

Today’s topic
Linear combination / weighted sum of features
Sigmoid Function→ Probability of Y
Predicted Value Y
Classification(Discrete Labels)
Regression(Continuous)
Logistic Regression
Linear Regression
Maximum Likelihood
Least Square
GradientDescent

Logistic Regression: Example Question
We are given a data set consisting of the following experiment. Well, the dataset is a little bit small. (O_o)
The height and weight of 3 people were recorded at the beginning of each person’s 65th birthday. At exactly one year after each person’s 65th birthday the vital status was recorded to be either alive or deceased.
Our end goal is to use logistic regression to predict the probability that a person’s life expectancy is at least 66 years given their age of 65, initial vital status of alive, height, and weight (but we won’t go that far here).
The data is given in the following table on the right.
Height(inches)
Weight(lbs)
Vital Status
60 155 Deceased
64 135 Alive
73 170 Alive

Logistic Regression: Example Question
Step 1: State the log-likelihood function.
Height(inches)
Weight(lbs)
Vital Status
60 155 Deceased
64 135 Alive
73 170 Alive

Logistic Regression: Example Question
Step 1: State the log-likelihood function.
Answer:
Height(inches)
Weight(lbs)
Vital Status
60 155 Deceased
64 135 Alive
73 170 Alive
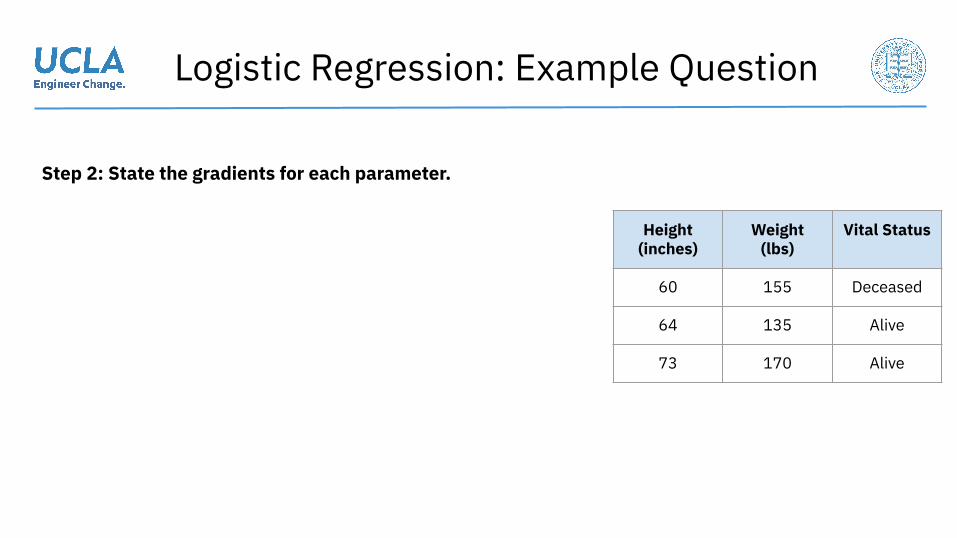
Logistic Regression: Example Question
Step 2: State the gradients for each parameter.
Height(inches)
Weight(lbs)
Vital Status
60 155 Deceased
64 135 Alive
73 170 Alive
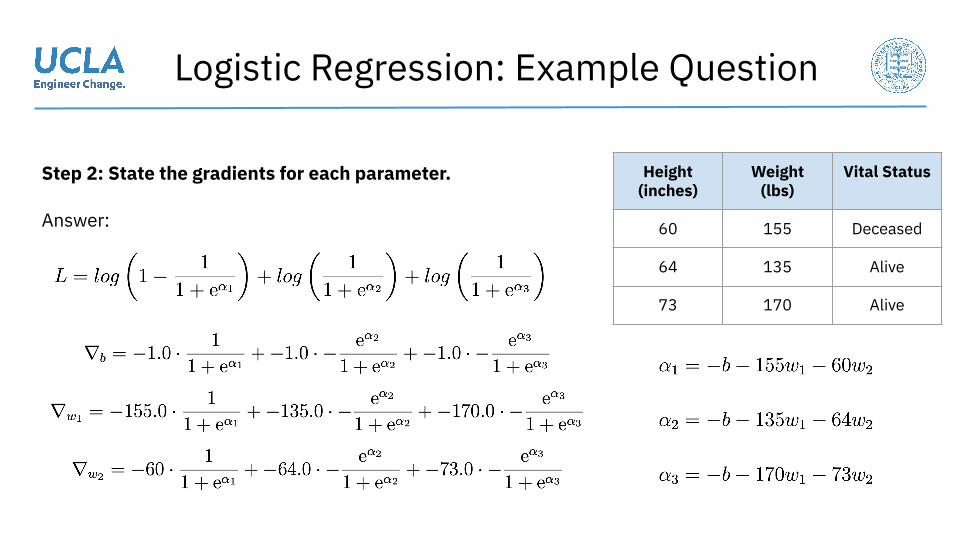
Logistic Regression: Example Question
Step 2: State the gradients for each parameter.
Answer:
Height(inches)
Weight(lbs)
Vital Status
60 155 Deceased
64 135 Alive
73 170 Alive
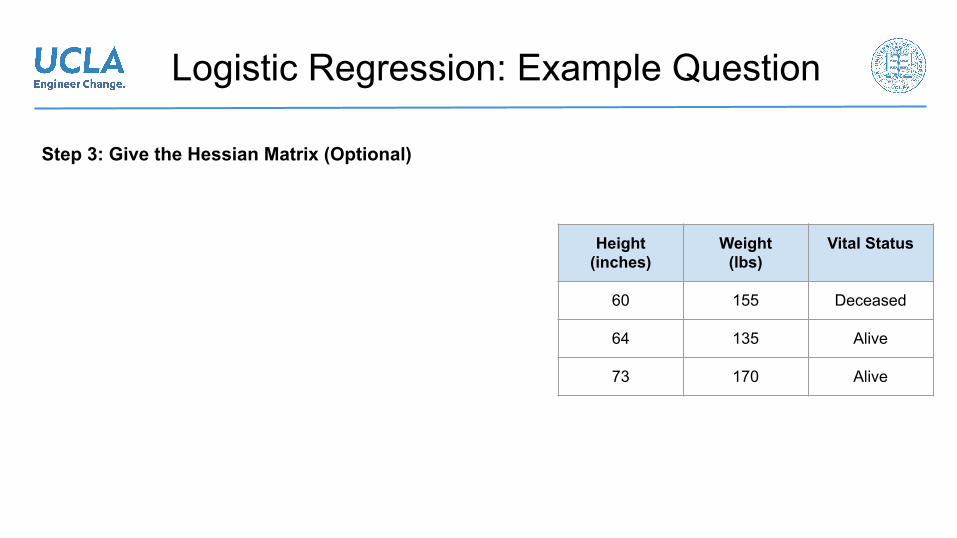
Logistic Regression: Example Question
Step 3: Give the Hessian Matrix (Optional)
Height(inches)
Weight(lbs)
Vital Status
60 155 Deceased
64 135 Alive
73 170 Alive
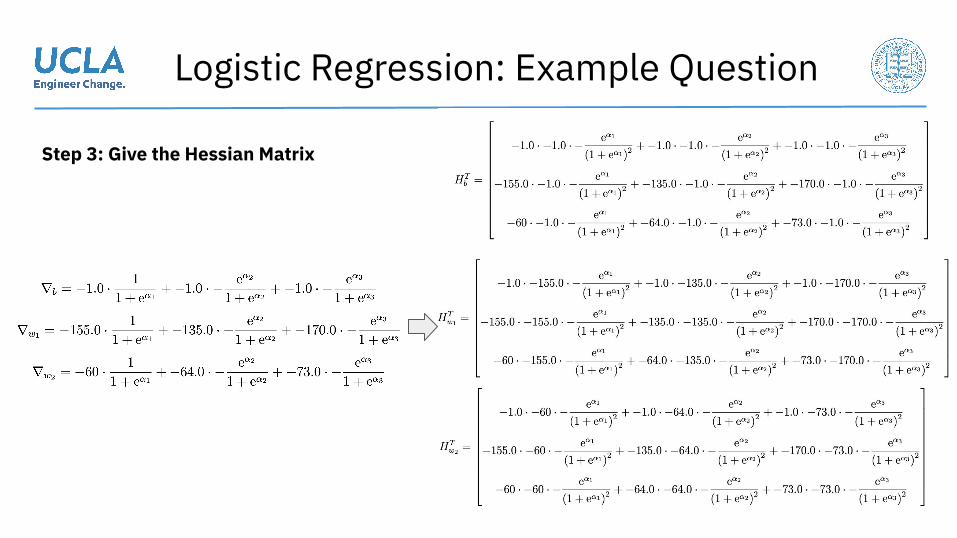
Logistic Regression: Example Question
Step 3: Give the Hessian Matrix
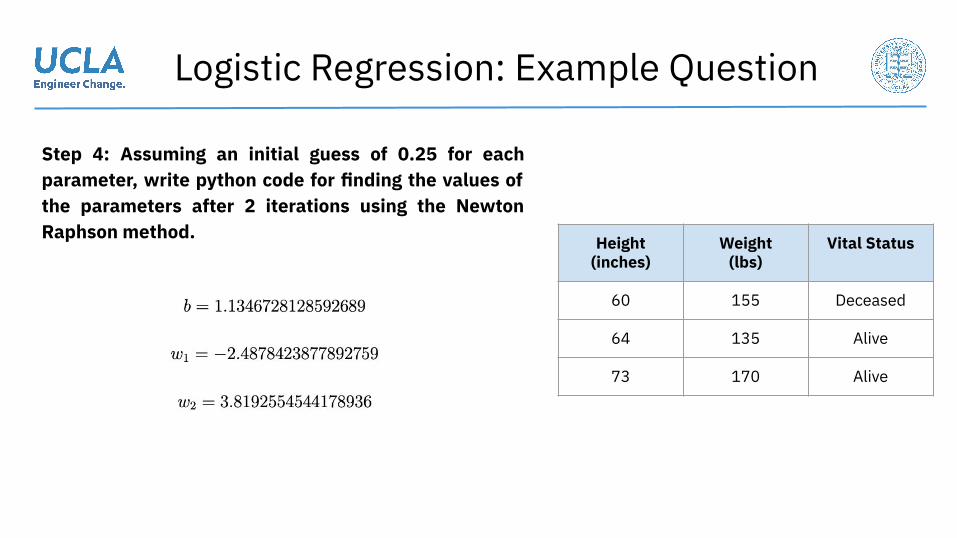
Logistic Regression: Example Question
Step 4: Assuming an initial guess of 0.25 for each parameter, write python code for finding the values of the parameters after 2 iterations using the Newton Raphson method. Height
(inches)Weight
(lbs)Vital Status
60 155 Deceased
64 135 Alive
73 170 Alive

Closed form: LR + Regularization
● Model
● Original Objective
● L2-Regularized Objective
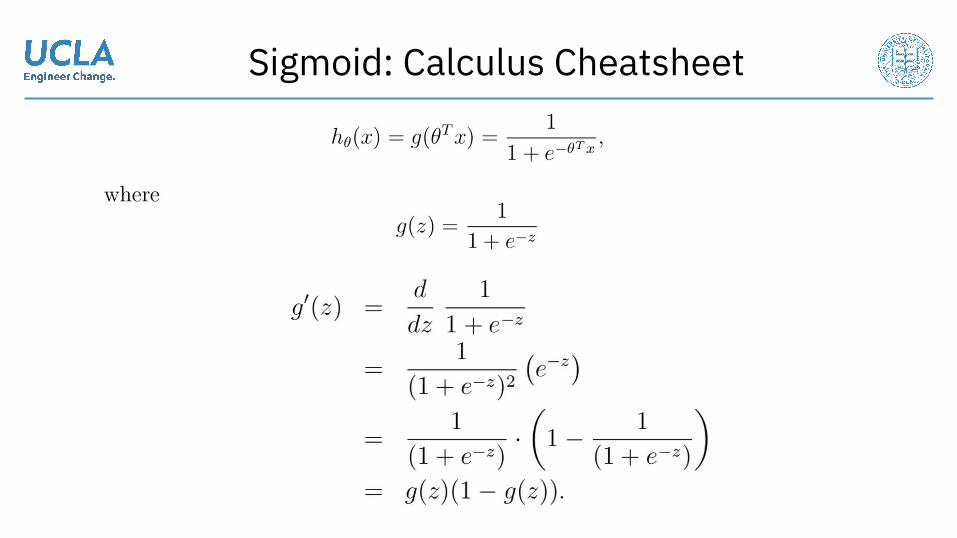
Sigmoid: Calculus Cheatsheet
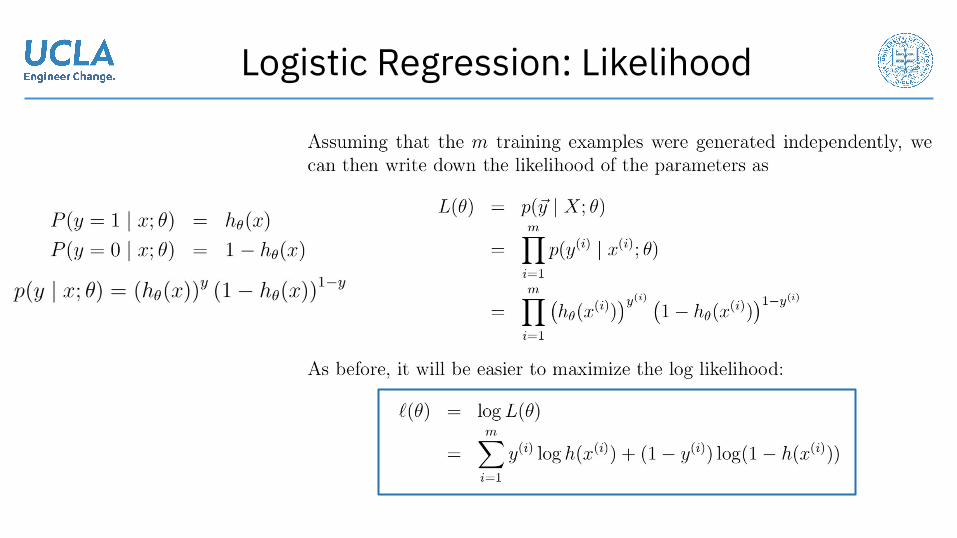
Logistic Regression: Likelihood

Logistic Regression: Multiclass Case*
Logistic Regression
Model 1
Input Features
Logistic Regression
Model 2
Logistic Regression
Model 3
Logistic Regression
Model 4
Model Collection
Data
Predictions
Label (truth)
P1 P2 P3 P4
L1 L2 L3 L4
Cross-entropy Loss
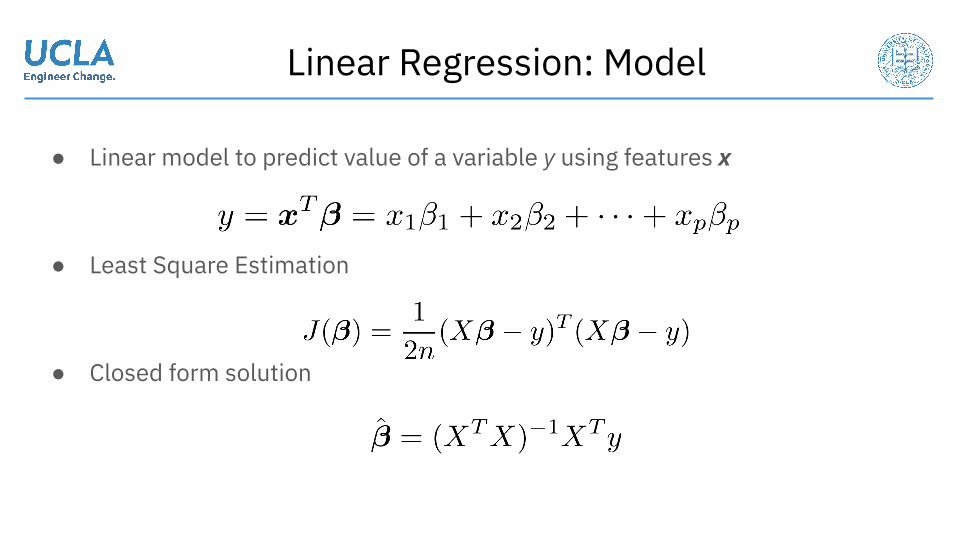
Linear Regression: Model
● Linear model to predict value of a variable y using features x
● Least Square Estimation
● Closed form solution
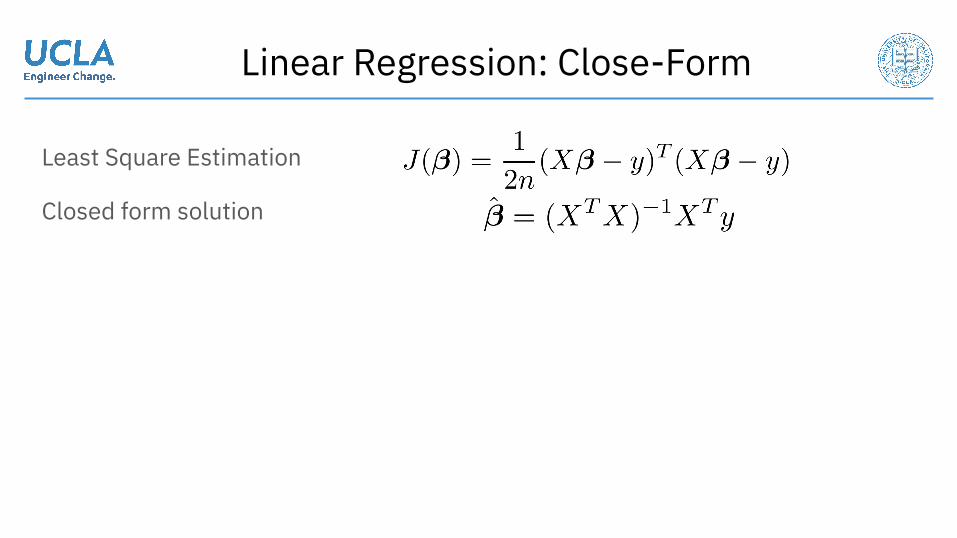
Linear Regression: Close-Form
Least Square Estimation
Closed form solution
Linear Regression: Example
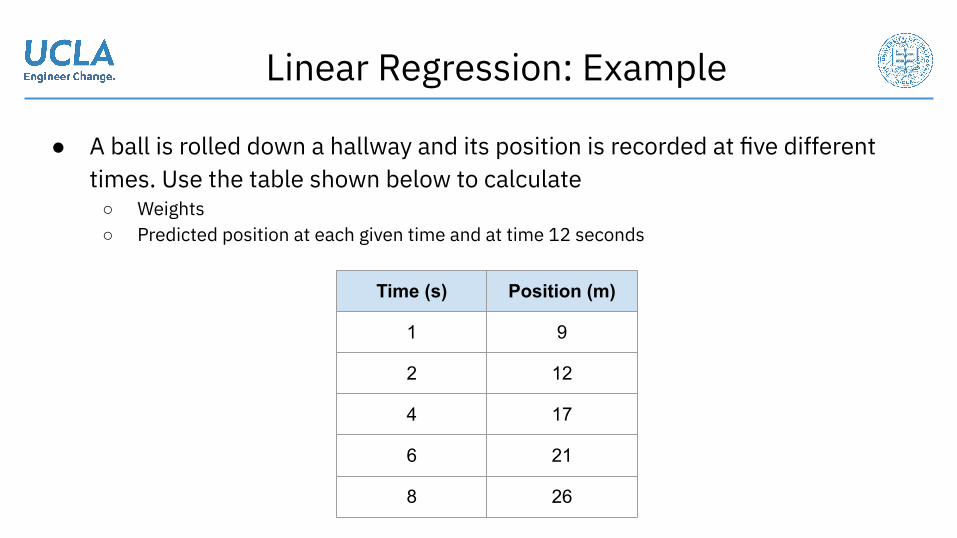
● A ball is rolled down a hallway and its position is recorded at five different times. Use the table shown below to calculate
○ Weights○ Predicted position at each given time and at time 12 seconds
Time (s) Position (m)
1 9
2 12
4 17
6 21
8 26

Linear Regression: Example
Step 1: Question
● What are X and Y variables?
● What are the parameters for our problem?
● Calculating parameters
Time (s) Position (m)
1 9
2 12
4 17
6 21
8 26
Linear Regression: Example
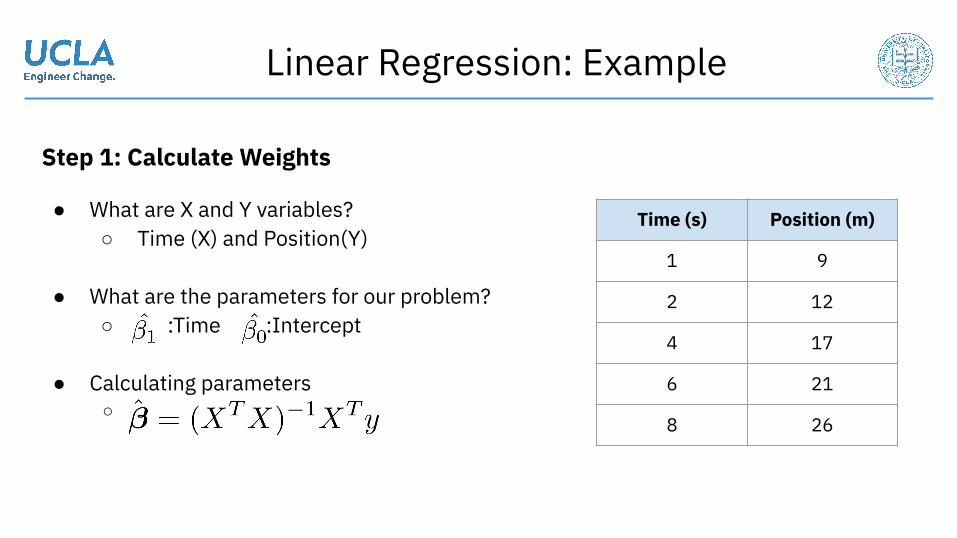
Step 1: Calculate Weights
● What are X and Y variables?○ Time (X) and Position(Y)
● What are the parameters for our problem?○ :Time :Intercept
● Calculating parameters○
Time (s) Position (m)
1 9
2 12
4 17
6 21
8 26

Linear Regression: Example
Let’s calculate on BOARD!
Time (s) Position (m)
1 9
2 12
4 17
6 21
8 26
Linear Regression: Example
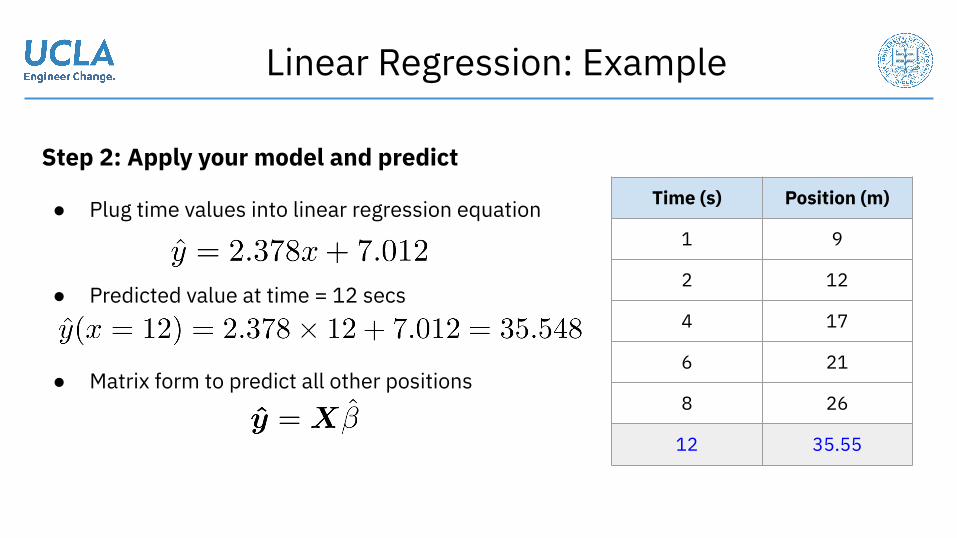
Step 2: Apply your model and predict
● Plug time values into linear regression equation
● Predicted value at time = 12 secs
● Matrix form to predict all other positions
Time (s) Position (m)
1 9
2 12
4 17
6 21
8 26
12 35.55

Linear Regression: Example
Plot: Check your model
Time (s) Position (m)
1 9
2 12
4 17
6 21
8 26

Linear Regression: Example
Plot: Check your model
Time (s) Position (m)
1 9
2 12
4 17
6 21
8 26
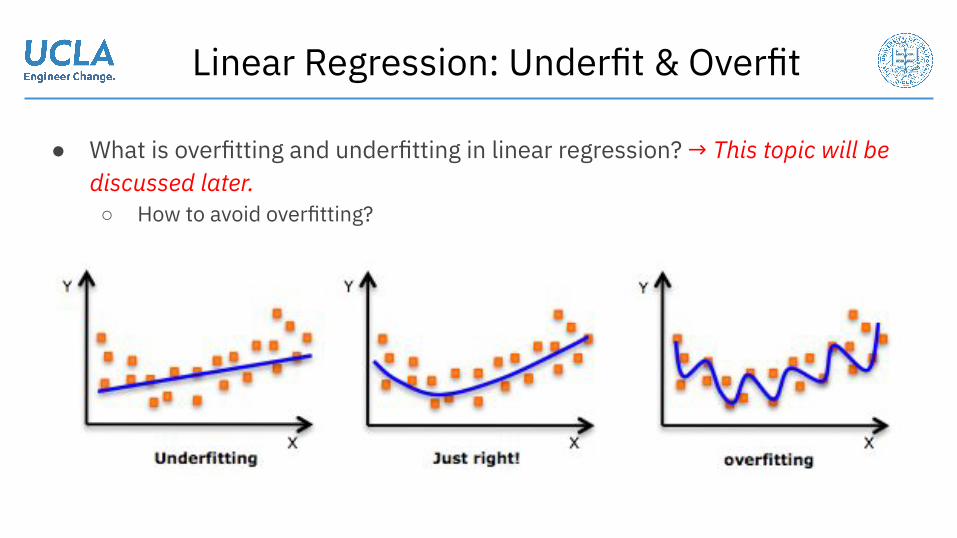
Linear Regression: Underfit & Overfit
● What is overfitting and underfitting in linear regression? → This topic will be discussed later.○ How to avoid overfitting?
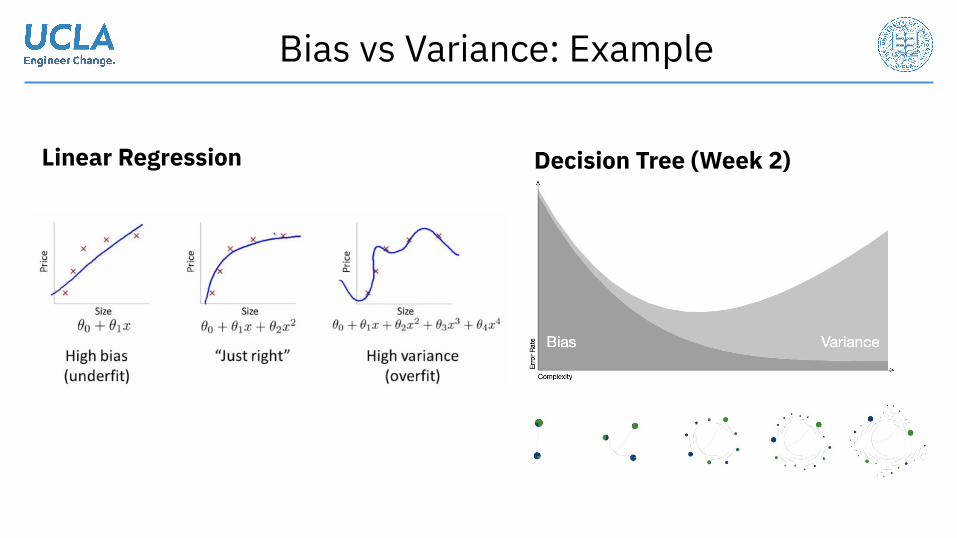
Bias vs Variance: Example
Linear Regression Decision Tree (Week 2)

Bias vs Variance: Example

Closed form: LR + Regularization
● Model
● Original Objective
● L2-Regularized Objective

Closed form: LR + Regularization

Linear Regression: Probabilistic Interpretation
MLE = Least Square Error!
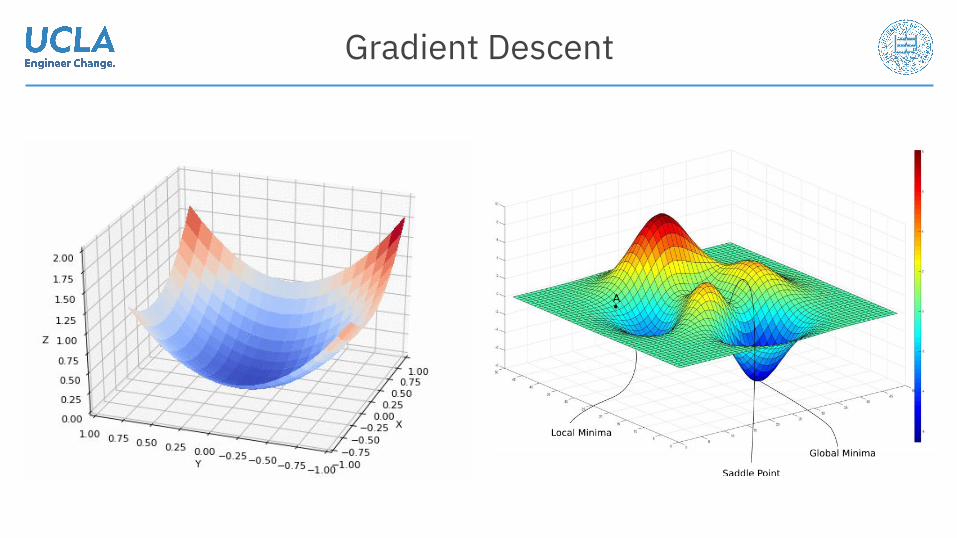
Gradient Descent
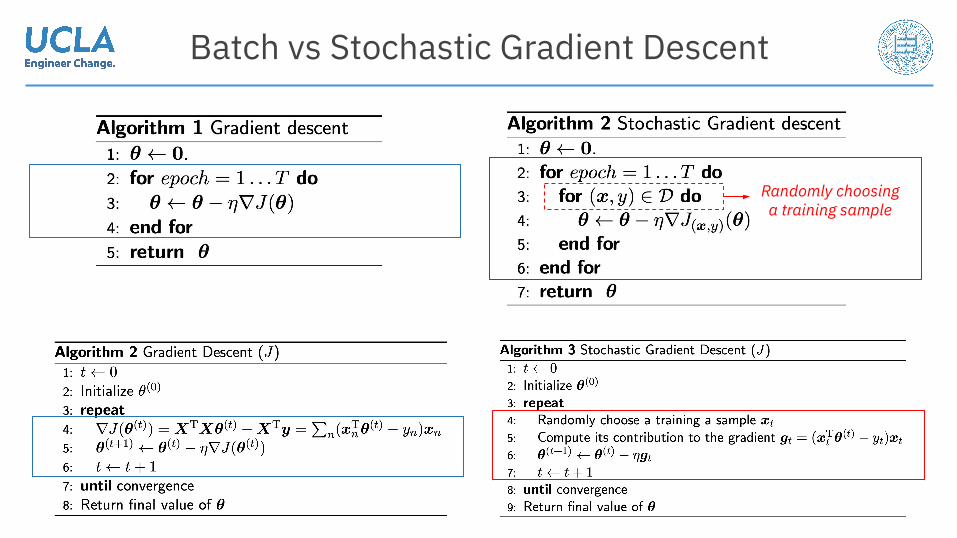
Batch vs Stochastic Gradient Descent
Randomly choosing a training sample
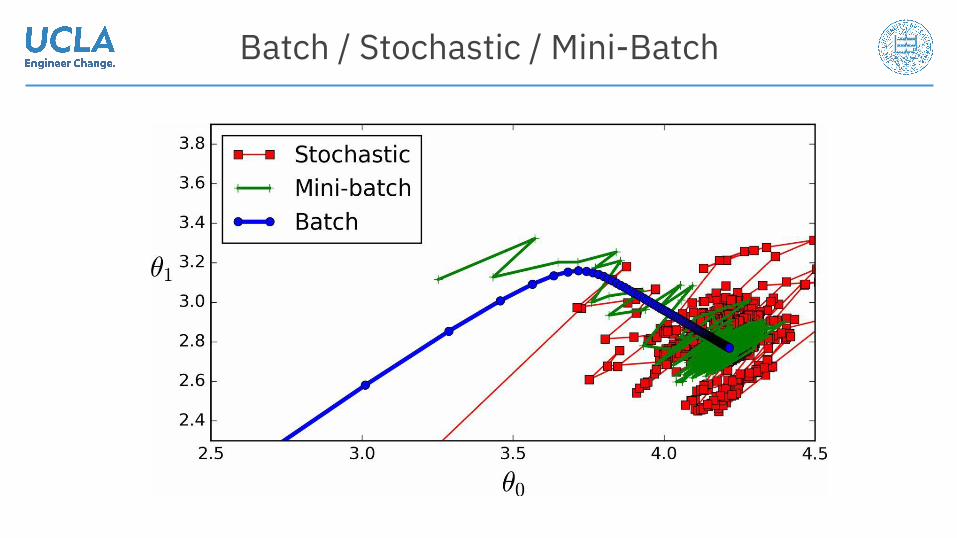
Batch / Stochastic / Mini-Batch
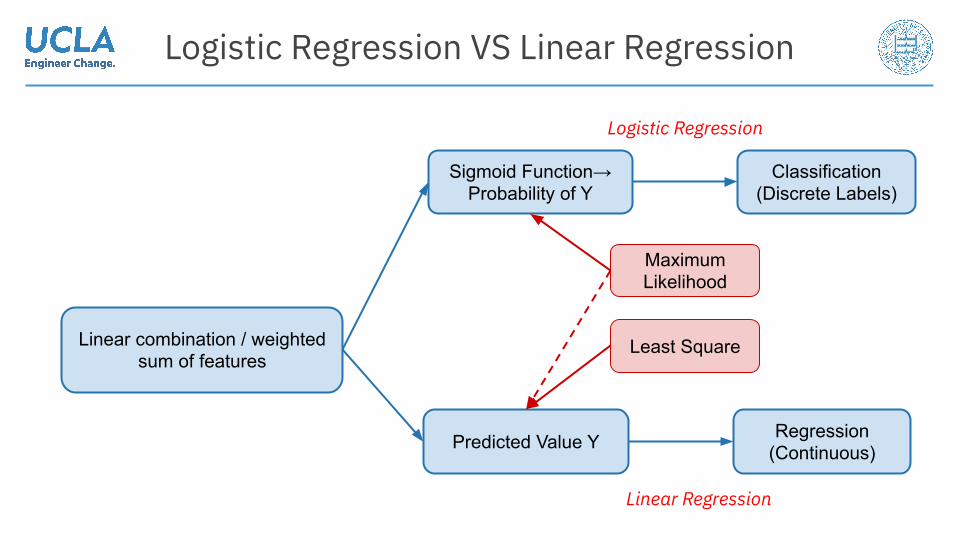
Logistic Regression VS Linear Regression
Linear combination / weighted sum of features
Sigmoid Function→ Probability of Y
Predicted Value Y
Classification(Discrete Labels)
Regression(Continuous)
Logistic Regression
Linear Regression
Maximum Likelihood
Least Square

* Logistic Regression: Convergence?
● True/False: Logistic regression cannot converge on a linearly separable dataset.

Thank you!Q & A