creation of mineral log - laramie, wyoming · creation of mineral log peigui yin & shaochang...
TRANSCRIPT
C REATION OF MINERAL LOG
Peigui Yin & Shaochang Wo
Enhanced Oil Recovery Institute

1. Detailed stratigraphic correlation for reservoir simulation.2. Calculation of mineral volumes for EOR design.
C reation of mineral logs using traditional well logs, point- counting data, and radial-basis function network for:
Objectives

Well Logs Used to C reate Lithology Logs
1. Density log: measure bulk density, since 1950s.
2. Sonic log: measure interval transit time, since 1950s.
3. Neutron log: measure porosity, after World War II.
4. Photoelectric absorption log (Pe): since late 1970s, measure matrix density.
5. Pulsed neutron spectroscopy log: elemental analysis.

Techniques Used to Estimate Lithologies
• Graphical Methods:– Overlay of porosity logs.– Porosity log crossplot.– M-N plot.
• Numerical Methods:– Matrix identification.
• C omputer software:– Halliburton: GeoGraphix.
• Important inputs:– Pe values.– Elemental analysis.

Schlumberger, 11/11/2002Tensleep, East Salt C reek
Schlumberger, 1/7/2002Tensleep, Teapot Dome

Minnelusa Well Logs for Mineral Identification
• Sonic log available in most wells.
• C ombination of Sonic, density, and neutron logs are available from late 1970s.
• Pe log in some wells after 1978.
• No pulsed neutron spectroscopy has been seen in Minnelusa wells.
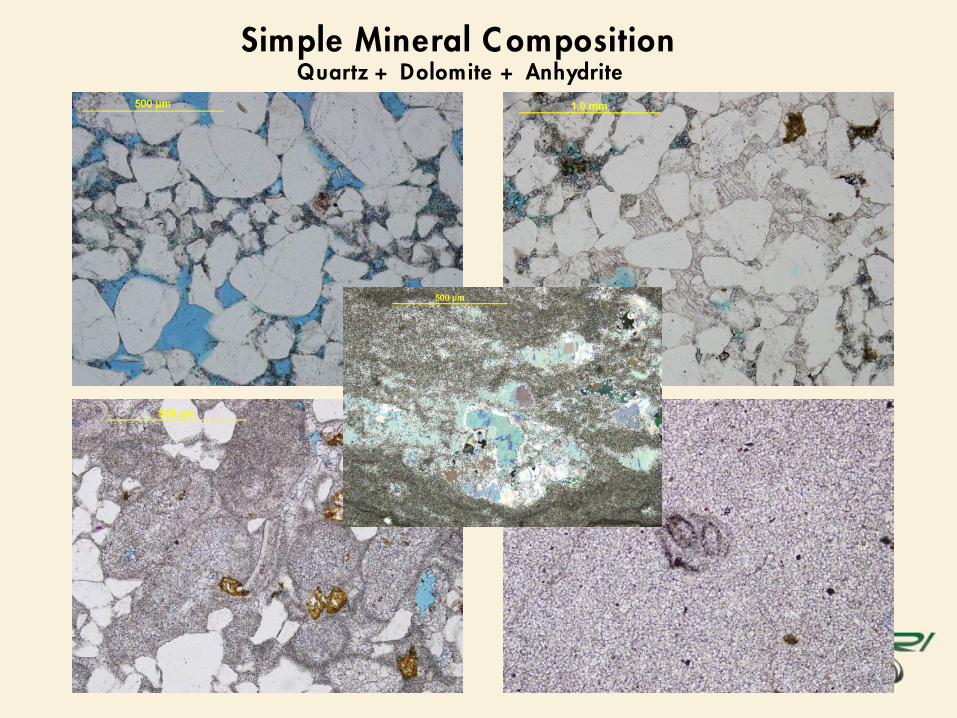
Simple Mineral CompositionQuartz + Dolomite + Anhydrite
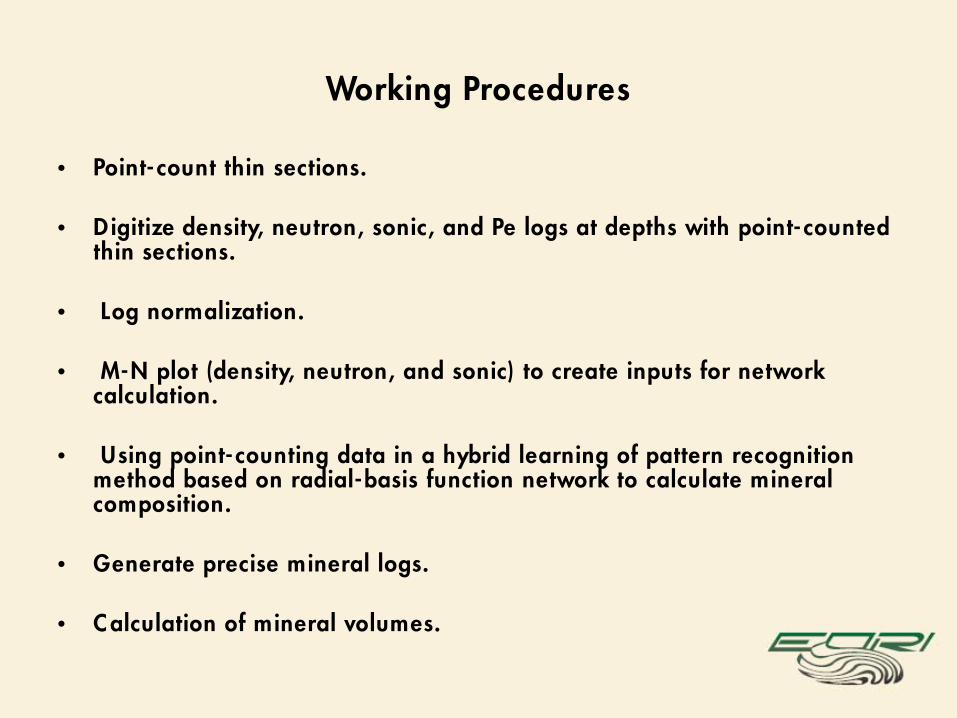
Working Procedures
• Point- count thin sections.
• Digitize density, neutron, sonic, and Pe logs at depths with point- counted thin sections.
• Log normalization.
• M-N plot (density, neutron, and sonic) to create inputs for network calculation.
• Using point- counting data in a hybrid learning of pattern recognition method based on radial-basis function network to calculate mineral composition.
• Generate precise mineral logs.
• C alculation of mineral volumes.

Log Normalization
• Logging errors– Environmental effects:
• Borehole rugosity.• Mudcake thickness.• Formation invasion by mud filtrate.
– Tool malfunctions.– Operation errors.
• Normalization– Use calibration units:
• Anhydrite as reference.• Tight carbonates more consistent.
– Crossplot for wells with simple mineralogies (clean sandstone, pure limestone, and dolomites), such as M-N plot.
– Standardize porosity scale (limestone, sandstone, dolomite, or matrix density).
– Comparison with core analysis.

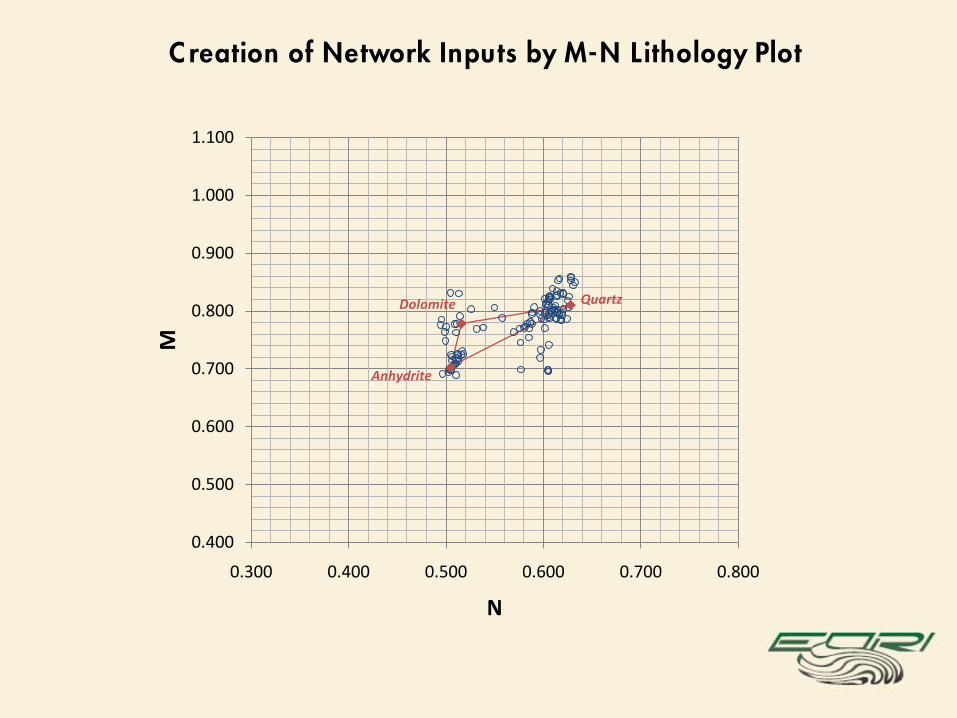
Anhydrite
Dolomite Quartz
0.400
0.500
0.600
0.700
0.800
0.900
1.000
1.100
0.300 0.400 0.500 0.600 0.700 0.800
M
N
M-N Lithology Plotfor Log Normalization
Single Well
Single Well
Multi-wells

0
10
20
30
40
50
60
70
80
90
100
0 20 40 60 80 100
Esti
mat
ed D
olom
ite
in M
atri
x fr
om
MN
Plo
t, %
Observed Dolomite in Matrix, %
0
10
20
30
40
50
60
70
80
90
100
0 50 100
Esti
mat
ed A
nhyd
rite
in M
atri
x fr
om
MN
Plo
t, %
Observed Anhydrite in Matrix, %
0
10
20
30
40
50
60
70
80
90
100
0 20 40 60 80 100
Esti
mat
ed Q
uart
z in
Mat
rix
from
MN
Pl
ot, %
Observed Quartz in Matrix, %
Comparison of Point- counted Mineral Content with Estimated Based on M-N Plot

Dresser Atlas
Schlumberger
Porosity Scale Standardization

Porosity Scale Standardization
Neutron Porosity

0 20 40 60 80 100
7249725272557258726172647267727072737276728072837286728972927295729873017304730773107313731673197322732573287331733473377340
WM-2
Qtz
Dolo
Anhy
Poro
Qtz
Dep
th (
ft)
%
Point- counting Data
Limitation:1. Sample size.2. C ore availability.3. C ore- log depth-match.

-20
0
20
40
60
80
100
-5 0 5 10 15 20 25
y = 43.222 + 1.1417x R= 0.21542
Qu
artz
(%
)
Neutron Porosity (%)
0
20
40
60
80
100
2 2.2 2.4 2.6 2.8 3
y = 415.79 - 141.35x R= 0.72773 Q
uar
tz (
%)
Density (G/C3)
0
20
40
60
80
100
40 60 80 100 120 140
y = -59.414 + 1.8478x R= 0.57916
Qu
artz
(%
)
Transit Time (us/f)
Correlation of Quartz Content with Log Parameters

0
20
40
60
80
100
2 2.2 2.4 2.6 2.8 3
y = -334.08 + 141.2x R= 0.65738 D
olo
mit
e (%
)
Desity (G/C3)
0
20
40
60
80
100
40 60 80 100 120 140
y = 178.54 - 2.3415x R= 0.65932
Do
lom
ite
(%)
Transit Time (us/f)
0
20
40
60
80
100
0 5 10 15 20 25
y = 31.337 - 0.35029x R= 0.058954
Do
lom
ite
(%)
Neutron Porosity (%)
Correlation of Dolomite Content with Log Parameters

0
20
40
60
80
100
2 2.2 2.4 2.6 2.8 3
y = -67.902 + 29.658x R= 0.27465
An
hyd
rite
(%
)
Density (G/C3)
0
20
40
60
80
100
0 5 10 15 20 25
y = 23.371 - 1.4261x R= 0.42464
An
hyd
rite
(%
)
Neutron Porosity (%)
0
20
40
60
80
100
40 60 80 100 120 140
y = 23.4 - 0.23748x R= 0.13581
An
hyd
rite
(%
)
Transit Time (us/f)
Correlation of Anhydrite Content with Log Parameters
Anhydrite
Dolomite Quartz
0.400
0.500
0.600
0.700
0.800
0.900
1.000
1.100
0.300 0.400 0.500 0.600 0.700 0.800
M
N
Creation of Network Inputs by M-N Lithology Plot

Work Plan
1. Point- counting representative Minnelusa samples with density, neutron, and sonic logs available, especially samples with different percentages of anhydrite.
2. D igitize density, neutron, sonic, and Pe logs.
3. Normalize well logs.
4. C alculate mineral compositions using point- counting data, traditional plot, and radial-basis function network.
5. C reation mineral logs using our new methodologies.
6. C alculate mineral volumes in interested stratigraphic intervals.
7. If successful, we can also work on Tensleep and other formations.