cpuc psps event analysis report
TRANSCRIPT

STATE OF CALIFORNIA GAVIN NEWSOM, Governor PUBLIC UTILITIES COMMISSION 505 VAN NESS AVENUE SAN FRANCISCO, CA 94102-3298 July 9, 2021 To Whom It May Concern: In late 2019, the Safety and Enforcement Division of the California Public Utilities Commission’s engaged a consultant, Technosylva Inc., to analyze the capabilities of certain new advanced wildfire risk analysis modeling. Pursuant to the engagement Technosylva has prepared a report regarding the new wildfire modeling software capabilities. This report is attached. The Safety and Enforcement Division did not independently validate the findings of this report by Technosylva. The issuance of this report by the Safety and Enforcement Division should not be interpreted as an endorsement by the Commission of any aspect of this report. If you have any questions regarding the report, please contact Anthony Noll at (916) 928-3315 or at [email protected].
CPUC – PSPS 2019 Event Wildfire Risk Analysis 2
California Public Utilities Commission 2019 PSPS Event –Wildfire Analysis Report
Event Date: October 9 - 12, 2019
IOU: Pacific Gas & Electric
Prepared by:
Technosylva Inc. (La Jolla, CA)
CPUC – PSPS 2019 Event Wildfire Risk Analysis 3
California Public Utilities Commission
2019 PSPS Event Wildfire Risk Analysis Report PREFACE ............................................................................................................. 5
1. INTRODUCTION ............................................................................................... 7
2. OVERVIEW OF PSPS EVENT .............................................................................. 8
3. ANALYSIS OF WEATHER CONDITIONS ............................................................ 10
3.1 Overview ............................................................................................................................... 10
3.2 Observed Weather Versus Modeled Conditions ...................................................................... 10
4. SUMMARY OF DAMAGE INCIDENTS .............................................................. 11
4.1 Data Collection Methods ........................................................................................................ 11
4.2 Description of Damage Incidents ............................................................................................. 11
5. SUMMARY OF ANALYSIS RESULTS ................................................................. 15
5.1 Methods Used ........................................................................................................................ 15 5.1.1 Fire Behavior Modeling ............................................................................................................................. 15
5.2 Using Deterministic and Probabilistic Fire Simulations ............................................................. 16
5.3 Defining Ignition Parameters .................................................................................................. 17 5.3.1 Ignition Location ........................................................................................................................................ 17 5.3.2 Time of Ignition ......................................................................................................................................... 17 5.3.3 Probability of Ignition from Damage ......................................................................................................... 18
5.4 Summary of All Damage Incidents ........................................................................................... 18
5.5 Criteria for Selecting Significant Incidents ............................................................................... 19
5.6 Summary of Significant Incidents ............................................................................................ 20
6. SUMMARY OF ACTIVE WILDFIRES DURING THE PSPS EVENT ......................... 24
7. CONCLUSIONS ............................................................................................... 25
7.1 Findings ................................................................................................................................. 25
7.2 Recommendations and Opportunities for Improvement .......................................................... 27
APPENDIX A: DETAILED WEATHER ANALYSIS .................................................... 28
Synoptic Scale Weather Analysis .................................................................................................. 29
Surface Analysis ........................................................................................................................... 30
APPENDIX B: ANALYSIS OUTPUTS FOR SIGNIFICANT DAMAGE INCIDENTS ........ 33
APPENDIX C: HISTORICAL FIRE SUMMARY ........................................................ 74
Fire History .................................................................................................................................. 74
Impacts Caused by Wildfires ......................................................................................................... 75

CPUC – PSPS 2019 Event Wildfire Risk Analysis 4
Tubbs Fire (October 2017) ............................................................................................................ 75
Kincade Fire (October 2019) ......................................................................................................... 78

CPUC – PSPS 2019 Event Wildfire Risk Analysis 5
Public Safety Power Shutoffs (PSPS) Event Wildfire Risk Analysis Summary Report
October 9-12th, 2019
Pacific Gas & Electric
PREFACE
In the wake of the unprecedented 2017 and 2018 wildfire seasons in California, and amid the increasing frequency of extreme weather events resulting from climate change, the practice of electric utilities preemptively de-energizing powerlines in response to weather and environmental conditions commensurate with rapid fire spread and related destruction has grown in use and prevalence. This practice is commonly referred to as “public safety power shutoffs” or “PSPS” by California’s investor-owned electric utilities.
From a policy perspective, while subject to consideration by the California Public Utilities Commission (CPUC) since 2008, PSPS policy is still nascent. PSPS as a wildfire risk mitigation measure wasn’t first utilized until October 2013, and even then, it was only implemented by San Diego Gas & Electric, occurred seldomly, and had relatively limited customer impacts. Since that time, as the utilization of PSPS as a wildfire risk mitigation measure has grown in practice and prevalence, thus occurring more frequently and impacting more Californians, the need for evolution and refinement in the CPUC’s assessment of this policy and practice has become evident. To this end, the CPUC has engaged Technosylva to conduct this project and present an example of the type of refined analysis that can be conducted and reported, on a per-event basis, to provide a more sophisticated assessment of PSPS events.1
While this study propels the CPUC’s analytical assessment of electric utility PSPS events, it should be noted that additional analyses are required to obtain a complete picture of the true impacts of such events. The fire spread simulations, based on the location and type of damages sustained to de-energized portions of powerlines during a PSPS event, provide a glimpse into “what may have been” by simulating the potential fire spread from a utility-caused ignition and quantifying the associated impacts on people, buildings, and the landscape. However, this analysis does not assess “what actually was,” in terms of the realized impacts on Californians as a result of the PSPS event. Although the instant analysis quantifies the potential wildfire related impacts avoided as a result of proactively de-energizing powerlines, it is evident from the historic execution of these events that power outages can also profoundly disrupt Californian’s daily lives, create or exacerbate emergency situations, and strain economic progress. Accordingly, further analysis of these realized impacts must also be conducted and compared to provide a robust and complete assessment of the effectiveness of PSPS implementation as a wildfire risk mitigation measure. The assessment of realized impacts is not within the scope of this report.
Moreover, it should be noted that not only does this analysis rely upon the simulation of potential utility-caused ignitions related to utility-reported damage sustained during a PSPS event, but also relies upon utility determination of whether the nature and conditions of the damage would have
1 The three large investor-owned electric utilities in California (i.e. PG&E, SCE, and SDG&E) all have access to the same Technosylva software used to conduct this analysis.
CPUC – PSPS 2019 Event Wildfire Risk Analysis 6
likely resulted in arcing or emission of sparks. Only damage incidents identified by utilities as resulting in arcing or emission of sparks were simulated as potential utility-caused fire ignitions. However, further study and analysis of the relationship between various damage conditions and the probability of a resultant utility-caused ignition is required, as this probability is also dependent on the fuel type, density, and conditions at the damage location. Having a deeper understanding of the probability that damage sustained during a PSPS event could result in an ignition would enhance the precision and accuracy of these wildfire simulations.
Lastly, considering the nascent, developing, and evolving nature of PSPS as a utility wildfire risk mitigation strategy, it should be noted that refined clarity, standardization, and data are needed to ensure consistency and comparability from event to event. For example, a single “PSPS event” may span several days or even weeks and would likely include the de-energization of various circuits, and some circuits potentially numerous times. As such, cross-utility comparisons at the event-level are of little use, especially if there are consecutive extreme fire weather events resulting in successive PSPS events being initiated.
CPUC – PSPS 2019 Event Wildfire Risk Analysis 7
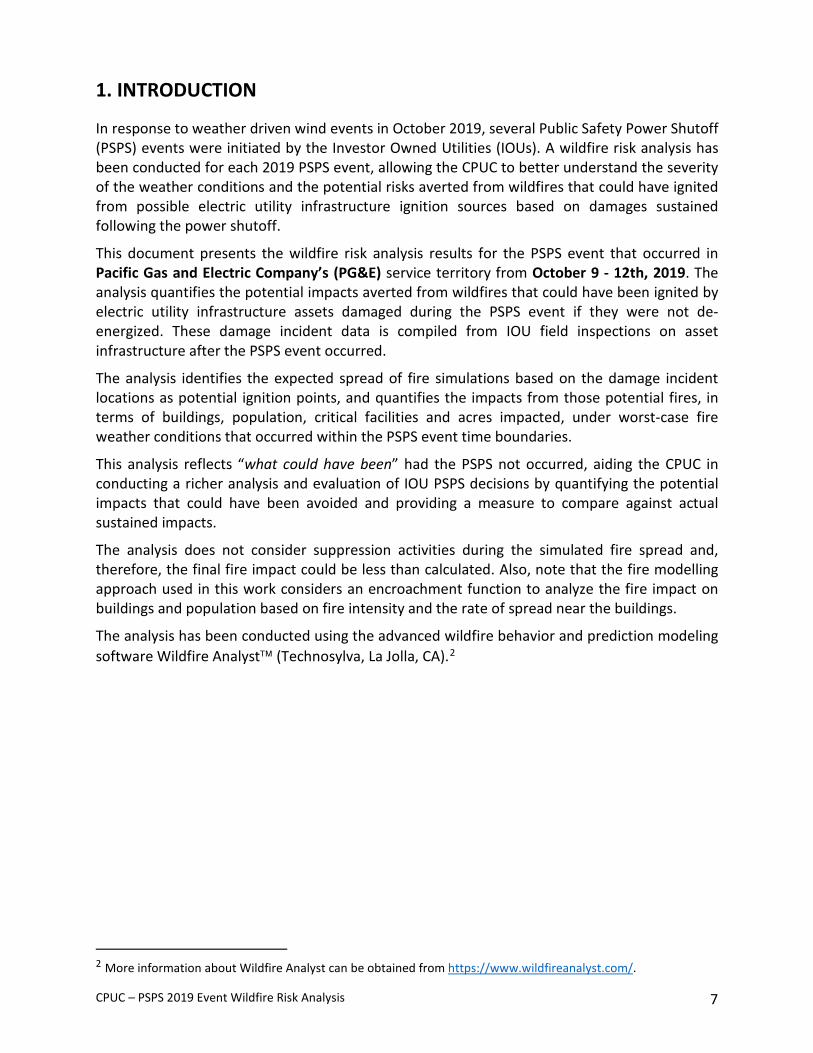
1. INTRODUCTION
In response to weather driven wind events in October 2019, several Public Safety Power Shutoff (PSPS) events were initiated by the Investor Owned Utilities (IOUs). A wildfire risk analysis has been conducted for each 2019 PSPS event, allowing the CPUC to better understand the severity of the weather conditions and the potential risks averted from wildfires that could have ignited from possible electric utility infrastructure ignition sources based on damages sustained following the power shutoff.
This document presents the wildfire risk analysis results for the PSPS event that occurred in Pacific Gas and Electric Company’s (PG&E) service territory from October 9 - 12th, 2019. The analysis quantifies the potential impacts averted from wildfires that could have been ignited by electric utility infrastructure assets damaged during the PSPS event if they were not de-energized. These damage incident data is compiled from IOU field inspections on asset infrastructure after the PSPS event occurred.
The analysis identifies the expected spread of fire simulations based on the damage incident locations as potential ignition points, and quantifies the impacts from those potential fires, in terms of buildings, population, critical facilities and acres impacted, under worst-case fire weather conditions that occurred within the PSPS event time boundaries.
This analysis reflects “what could have been” had the PSPS not occurred, aiding the CPUC in conducting a richer analysis and evaluation of IOU PSPS decisions by quantifying the potential impacts that could have been avoided and providing a measure to compare against actual sustained impacts.
The analysis does not consider suppression activities during the simulated fire spread and, therefore, the final fire impact could be less than calculated. Also, note that the fire modelling approach used in this work considers an encroachment function to analyze the fire impact on buildings and population based on fire intensity and the rate of spread near the buildings.
The analysis has been conducted using the advanced wildfire behavior and prediction modeling software Wildfire Analyst (Technosylva, La Jolla, CA).2
2 More information about Wildfire Analyst can be obtained from https://www.wildfireanalyst.com/.
CPUC – PSPS 2019 Event Wildfire Risk Analysis 8
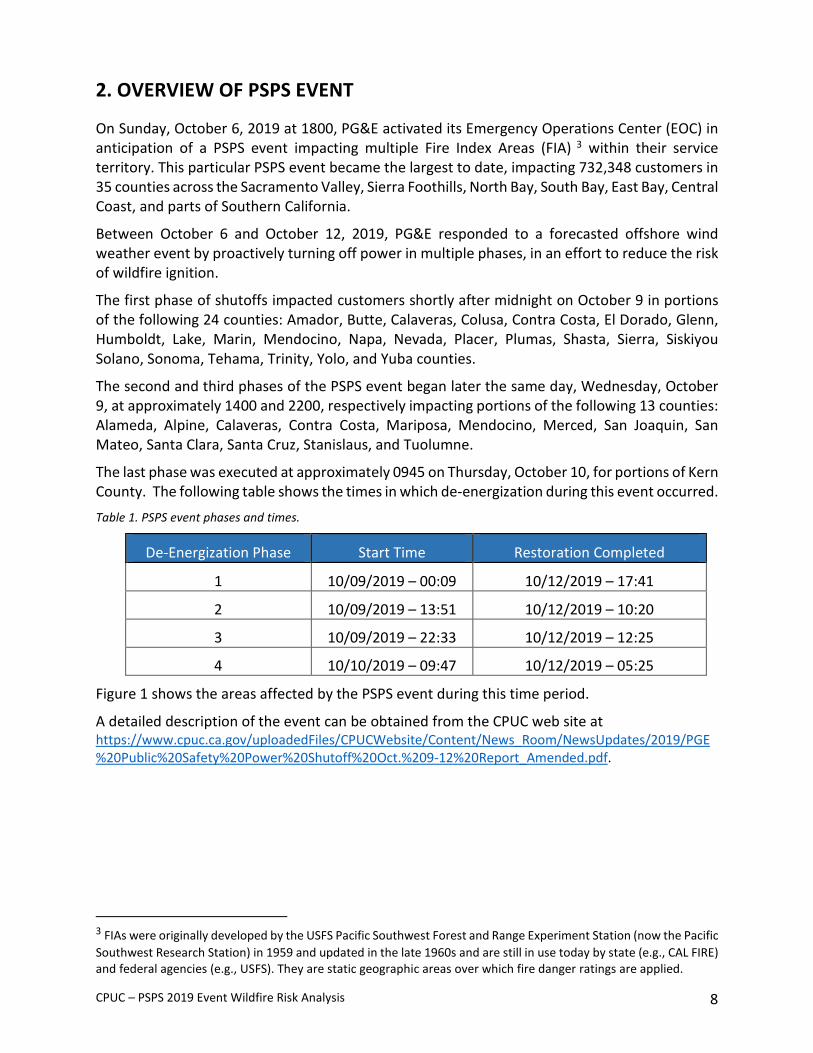
2. OVERVIEW OF PSPS EVENT On Sunday, October 6, 2019 at 1800, PG&E activated its Emergency Operations Center (EOC) in anticipation of a PSPS event impacting multiple Fire Index Areas (FIA) 3 within their service territory. This particular PSPS event became the largest to date, impacting 732,348 customers in 35 counties across the Sacramento Valley, Sierra Foothills, North Bay, South Bay, East Bay, Central Coast, and parts of Southern California.
Between October 6 and October 12, 2019, PG&E responded to a forecasted offshore wind weather event by proactively turning off power in multiple phases, in an effort to reduce the risk of wildfire ignition.
The first phase of shutoffs impacted customers shortly after midnight on October 9 in portions of the following 24 counties: Amador, Butte, Calaveras, Colusa, Contra Costa, El Dorado, Glenn, Humboldt, Lake, Marin, Mendocino, Napa, Nevada, Placer, Plumas, Shasta, Sierra, Siskiyou Solano, Sonoma, Tehama, Trinity, Yolo, and Yuba counties.
The second and third phases of the PSPS event began later the same day, Wednesday, October 9, at approximately 1400 and 2200, respectively impacting portions of the following 13 counties: Alameda, Alpine, Calaveras, Contra Costa, Mariposa, Mendocino, Merced, San Joaquin, San Mateo, Santa Clara, Santa Cruz, Stanislaus, and Tuolumne.
The last phase was executed at approximately 0945 on Thursday, October 10, for portions of Kern County. The following table shows the times in which de-energization during this event occurred. Table 1. PSPS event phases and times.
De-Energization Phase Start Time Restoration Completed
1 10/09/2019 – 00:09 10/12/2019 – 17:41
2 10/09/2019 – 13:51 10/12/2019 – 10:20
3 10/09/2019 – 22:33 10/12/2019 – 12:25
4 10/10/2019 – 09:47 10/12/2019 – 05:25
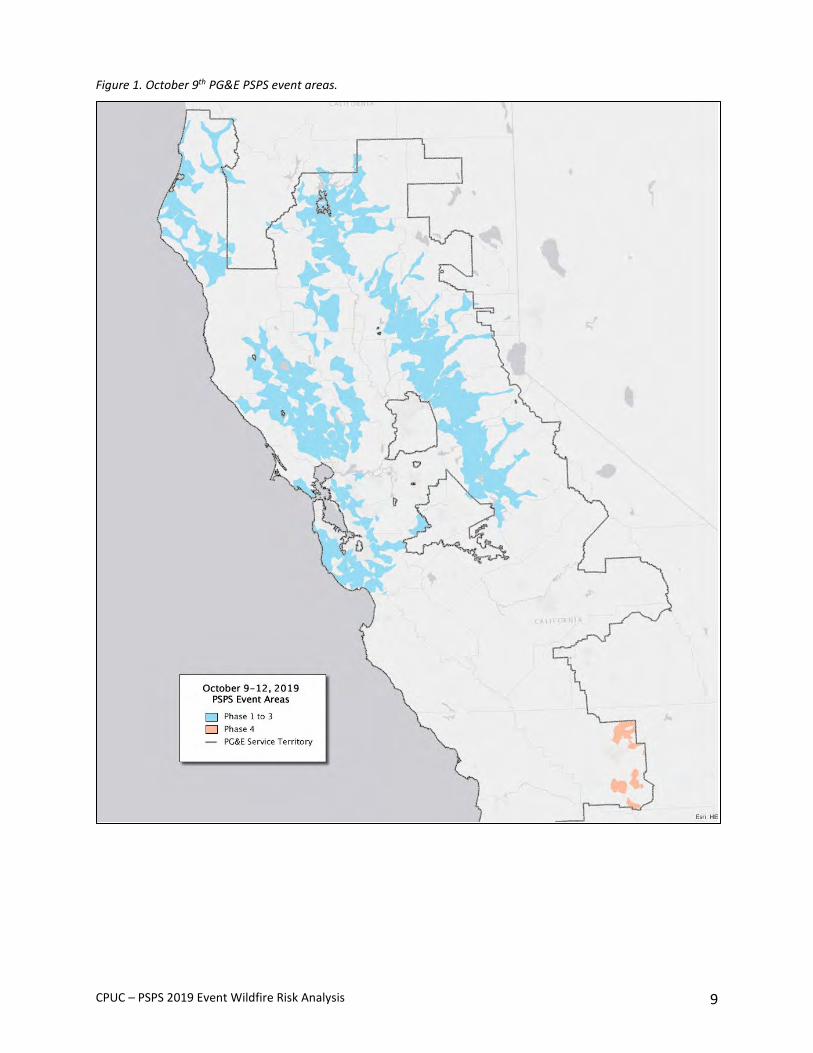
Figure 1 shows the areas affected by the PSPS event during this time period.
A detailed description of the event can be obtained from the CPUC web site at https://www.cpuc.ca.gov/uploadedFiles/CPUCWebsite/Content/News_Room/NewsUpdates/2019/PGE%20Public%20Safety%20Power%20Shutoff%20Oct.%209-12%20Report_Amended.pdf.
3 FIAs were originally developed by the USFS Pacific Southwest Forest and Range Experiment Station (now the Pacific Southwest Research Station) in 1959 and updated in the late 1960s and are still in use today by state (e.g., CAL FIRE) and federal agencies (e.g., USFS). They are static geographic areas over which fire danger ratings are applied.
CPUC – PSPS 2019 Event Wildfire Risk Analysis 9
Figure 1. October 9th PG&E PSPS event areas.
CPUC – PSPS 2019 Event Wildfire Risk Analysis 10
3. ANALYSIS OF WEATHER CONDITIONS
3.1 Overview This section provides a summary of the analysis of the weather conditions that occurred during this PSPS event. The overall weather pattern for the PSPS event was dominated by an amplified upper-level trough that advanced over California and the western US on October 9th, 2019.4 This trough had a jet streak that stationed itself directly over the Great Basin.5 Large-scale atmospheric subsidence below this jet streak developed a surface high pressure system over the Great Basin bringing cooler and drier air to the region. Over California, an inverted surface trough developed.6 These meteorological features resulted in a strong surface pressure gradient along the crest of the Sierra Nevada which are known to develop strong downslope windstorms in Northern California.
Strong surface winds were observed to be widespread over northern California with sustained winds of 20-25 knots (23-29 mph) at all the incident damage locations identified. The highest wind measurements were recorded in Sonoma County and were associated with gusts of over 60 knots (69 mph). The low atmospheric moisture associated with this event provides further evidence that downslope winds may have occurred. The minimum relative humidity observed by the surface weather stations analyzed ranged from 7 to 11%.
The significance of the event in California is highlighted by: • The upper-level trough transported an incredibly dry airmass over California. • A strong pressure gradient over the region produced strong downslope winds. • Widespread surface wind measurements of 20-25 knots (23-29 mph) sustained and gusts
over 60 knots (69 mph).
A detailed review of the weather conditions is described in Appendix A.
3.2 Observed Weather Versus Modeled Conditions Observed and modeled weather conditions (especially, wind speed and direction) were analyzed and compared for all PSPS damage incidents. Both modelled weather prediction data provided by PG&E, and weather station observations data, were used to conduct the analysis. A comparison between weather data from the nearest weather station to each damage incident and the modeled weather data at both the damage incident ignition point and the modeled weather conditions is provided. Appendix B provides summary weather analysis results for each significant damage incident through two different charts. The first chart shows the comparison between the weather station values and the simulation modeled values at the ignition point. The second chart shows the comparison between the weather station values and the modeled weather values at the station coordinates.
Modeled wind direction data is for the most part consistent with weather station at the same geographical point (modeled wind) and ignition point (simulation wind) in almost all damage
4 A trough is an elongated region of relatively low atmospheric pressure often associated with weather fronts. 5 A jet streak (or stream) is a fast flowing, narrow air current. 6 An inverted surface trough is an atmospheric trough which is oriented opposite to most troughs of the mid-latitudes.
CPUC – PSPS 2019 Event Wildfire Risk Analysis 11
incident simulations, reflecting that this input is consistent to model potential fire behavior and progression. However, interestingly, we have found differences between modeled wind speed data, simulation and the nearest weather station. Some simulations have higher modeled wind speed than in the nearest weather station (see Appendix B). Also, simulation winds are usually higher than station winds. Our analysis has found that it is not surprising for weather station data to deviate from modeled and observed wind conditions at the damage incident locations.
4. SUMMARY OF DAMAGE INCIDENTS
4.1 Data Collection Methods The analysis relied upon PG&E’s assessment of damage incidents for ignition potential. Data on the damages were obtained from patrols conducted by PG&E field personnel subsequent to reenergization. All damage identified from these PG&E field inspections was documented with standard forms including GPS recorded location, photographs and a description of the damage. The documentation was then submitted to a team of PG&E analysts who evaluated the data to determine whether the damage reflected a potential ignition. Quality assurance was then conducted by PG&E Electric Operations personnel who have extensive field experience to make a final determination of whether the damage event would cause a potential ignition. This assessment, provided by PG&E, is the sole information used to identify possible ignitions and is the basis for the analysis provided in this report. The analysis assumes all damage incidents likely to cause arcing would result in an ignition. In general, damage incidents where arcing would likely occur were identified when:
1. Non-insulated conductors were in contact directly or indirectly (e.g. a tree branch laying across two or more conductors).
2. A non-insulated conductor or conductors were in contact with the ground directly or indirectly (e.g. a tree failure where the tree was leaning against the line without causing the line to fall to the ground)
4.2 Description of Damage Incidents According to the detailed report received from PG&E and their field inspections, a total of 193 damage incidents were reported for the October 9 PSPS event, including location and estimated time of damage. Only 116 of those damage incidents were identified by PG&E as having the potential to ignite a wildfire through electric arcing. Of the 116 possible ignition points, two were located in non-burnable areas where a fire would not ignite and was unlikely to ignite as no burnable fuels were nearby. Accordingly, the remaining 114 damage incidents were used as ignition points to conduct fire spread simulations.
Figure 2 presents the locations of the damage incidents relative to the PSPS event areas. A unique identification number is provided for each damage incident. The numbering of the incidents reflects the ranking of impacts on population derived from the fire spread simulations. For example, the number 1 incident contains the most amount of potential impacts while incident 114 contains the least amount of potential impacts. Impacts are measured in terms of buildings impacted, population impacted and acres burned. Please refer to Section 5 for a detailed description of the analysis methods.

CPUC – PSPS 2019 Event Wildfire Risk Analysis 12
Dashed lines highlight four areas where a cluster of incidents occur. These are presented in Figures 3 and 4. The PSPS event boundary is shown in blue. Note map scale varies for each map. In addition, some incident labels do not appear due to clustering. These are shown in Figure 3 and 4. Figure 2.Damage incidents relative to PSPS event areas.

CPUC – PSPS 2019 Event Wildfire Risk Analysis 13
Figure 3. Maps 1 and 2 of incident clusters.
Cluster area 1
Cluster area 2

CPUC – PSPS 2019 Event Wildfire Risk Analysis 14
Figure 4. Maps 3 and 4 of incident clusters.
Cluster area 3
Cluster area 4
CPUC – PSPS 2019 Event Wildfire Risk Analysis 15
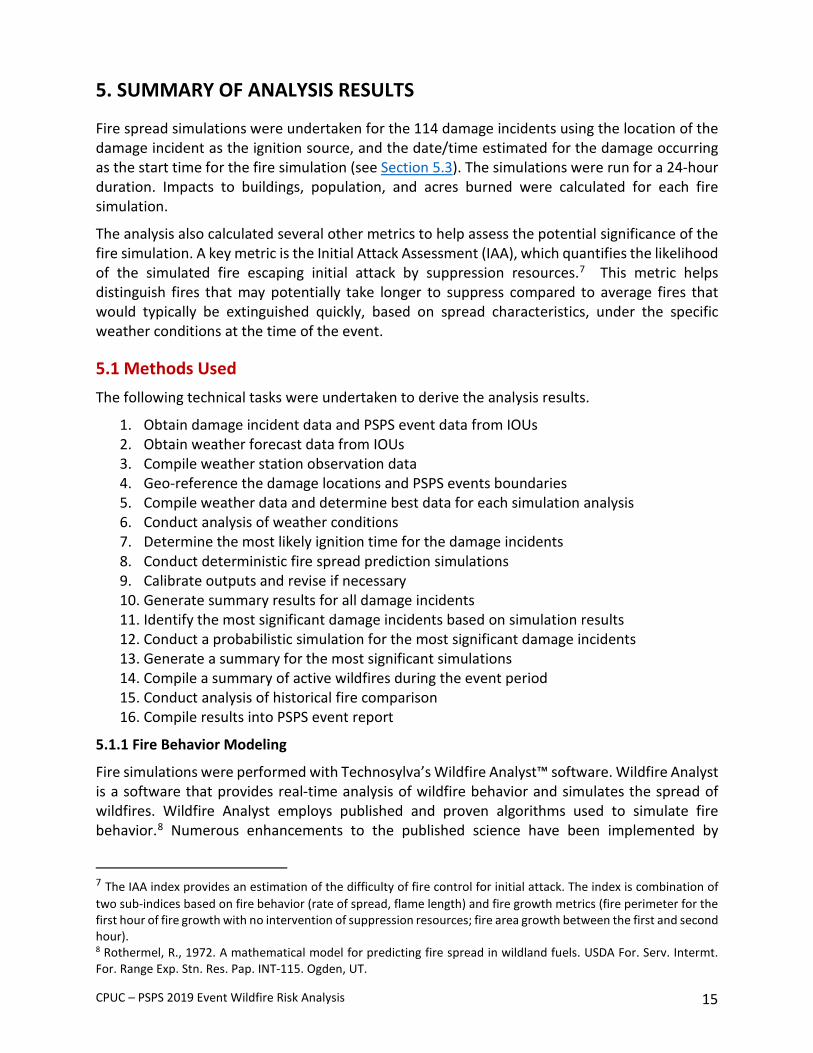
5. SUMMARY OF ANALYSIS RESULTS
Fire spread simulations were undertaken for the 114 damage incidents using the location of the damage incident as the ignition source, and the date/time estimated for the damage occurring as the start time for the fire simulation (see Section 5.3). The simulations were run for a 24-hour duration. Impacts to buildings, population, and acres burned were calculated for each fire simulation.
The analysis also calculated several other metrics to help assess the potential significance of the fire simulation. A key metric is the Initial Attack Assessment (IAA), which quantifies the likelihood of the simulated fire escaping initial attack by suppression resources.7 This metric helps distinguish fires that may potentially take longer to suppress compared to average fires that would typically be extinguished quickly, based on spread characteristics, under the specific weather conditions at the time of the event.
5.1 Methods Used The following technical tasks were undertaken to derive the analysis results.
1. Obtain damage incident data and PSPS event data from IOUs 2. Obtain weather forecast data from IOUs 3. Compile weather station observation data 4. Geo-reference the damage locations and PSPS events boundaries 5. Compile weather data and determine best data for each simulation analysis 6. Conduct analysis of weather conditions 7. Determine the most likely ignition time for the damage incidents 8. Conduct deterministic fire spread prediction simulations 9. Calibrate outputs and revise if necessary 10. Generate summary results for all damage incidents 11. Identify the most significant damage incidents based on simulation results 12. Conduct a probabilistic simulation for the most significant damage incidents 13. Generate a summary for the most significant simulations 14. Compile a summary of active wildfires during the event period 15. Conduct analysis of historical fire comparison 16. Compile results into PSPS event report
5.1.1 Fire Behavior Modeling
Fire simulations were performed with Technosylva’s Wildfire Analyst™ software. Wildfire Analyst is a software that provides real-time analysis of wildfire behavior and simulates the spread of wildfires. Wildfire Analyst employs published and proven algorithms used to simulate fire behavior.8 Numerous enhancements to the published science have been implemented by
7 The IAA index provides an estimation of the difficulty of fire control for initial attack. The index is combination of two sub-indices based on fire behavior (rate of spread, flame length) and fire growth metrics (fire perimeter for the first hour of fire growth with no intervention of suppression resources; fire area growth between the first and second hour). 8 Rothermel, R., 1972. A mathematical model for predicting fire spread in wildland fuels. USDA For. Serv. Intermt. For. Range Exp. Stn. Res. Pap. INT-115. Ogden, UT.
CPUC – PSPS 2019 Event Wildfire Risk Analysis 16
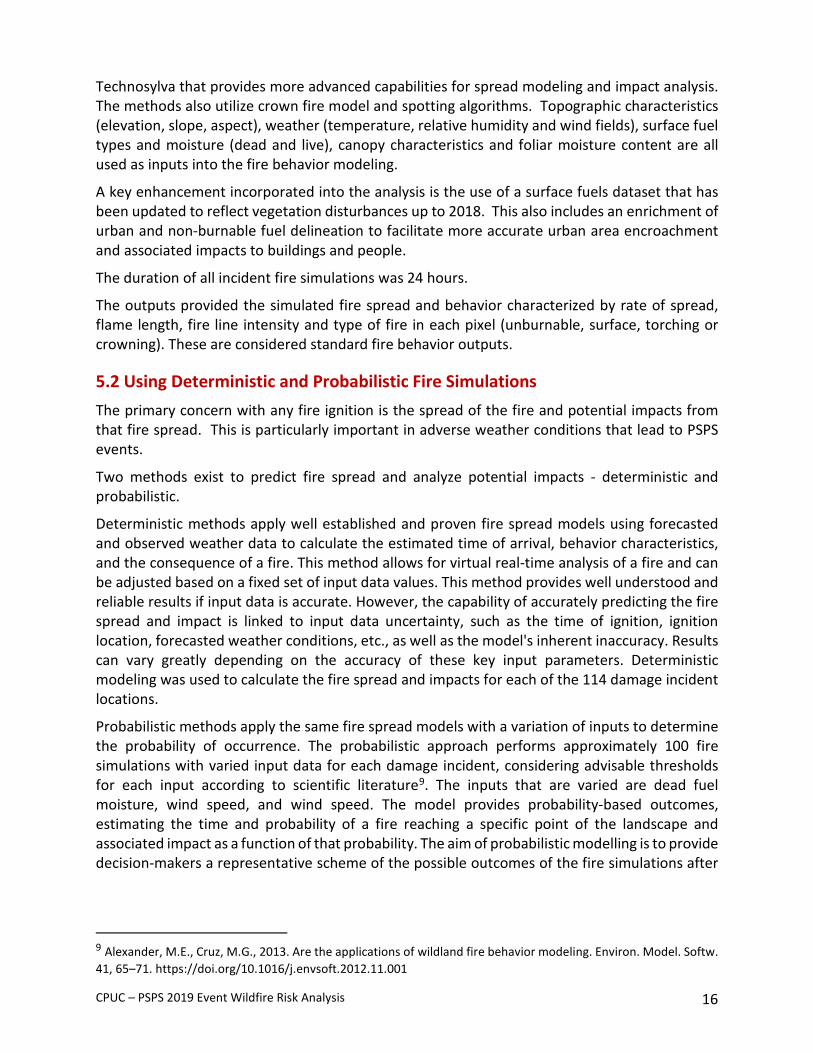
Technosylva that provides more advanced capabilities for spread modeling and impact analysis. The methods also utilize crown fire model and spotting algorithms. Topographic characteristics (elevation, slope, aspect), weather (temperature, relative humidity and wind fields), surface fuel types and moisture (dead and live), canopy characteristics and foliar moisture content are all used as inputs into the fire behavior modeling.
A key enhancement incorporated into the analysis is the use of a surface fuels dataset that has been updated to reflect vegetation disturbances up to 2018. This also includes an enrichment of urban and non-burnable fuel delineation to facilitate more accurate urban area encroachment and associated impacts to buildings and people.
The duration of all incident fire simulations was 24 hours.
The outputs provided the simulated fire spread and behavior characterized by rate of spread, flame length, fire line intensity and type of fire in each pixel (unburnable, surface, torching or crowning). These are considered standard fire behavior outputs.
5.2 Using Deterministic and Probabilistic Fire Simulations The primary concern with any fire ignition is the spread of the fire and potential impacts from that fire spread. This is particularly important in adverse weather conditions that lead to PSPS events.
Two methods exist to predict fire spread and analyze potential impacts - deterministic and probabilistic.
Deterministic methods apply well established and proven fire spread models using forecasted and observed weather data to calculate the estimated time of arrival, behavior characteristics, and the consequence of a fire. This method allows for virtual real-time analysis of a fire and can be adjusted based on a fixed set of input data values. This method provides well understood and reliable results if input data is accurate. However, the capability of accurately predicting the fire spread and impact is linked to input data uncertainty, such as the time of ignition, ignition location, forecasted weather conditions, etc., as well as the model's inherent inaccuracy. Results can vary greatly depending on the accuracy of these key input parameters. Deterministic modeling was used to calculate the fire spread and impacts for each of the 114 damage incident locations.
Probabilistic methods apply the same fire spread models with a variation of inputs to determine the probability of occurrence. The probabilistic approach performs approximately 100 fire simulations with varied input data for each damage incident, considering advisable thresholds for each input according to scientific literature9. The inputs that are varied are dead fuel moisture, wind speed, and wind speed. The model provides probability-based outcomes, estimating the time and probability of a fire reaching a specific point of the landscape and associated impact as a function of that probability. The aim of probabilistic modelling is to provide decision-makers a representative scheme of the possible outcomes of the fire simulations after
9 Alexander, M.E., Cruz, M.G., 2013. Are the applications of wildland fire behavior modeling. Environ. Model. Softw. 41, 65–71. https://doi.org/10.1016/j.envsoft.2012.11.001
CPUC – PSPS 2019 Event Wildfire Risk Analysis 17
analyzing the nature of the uncertainties in the fire incident10. This analysis may be helpful in structuring the problems, integrating knowledge, visualizing the results11 as well as easing the work of decision-makers by supporting consistent and justifiable decisions12. For this analysis, 100 fire simulations were performed for each probabilistic assessment.
Since some of the inputs for the damage incidents could vary, probabilistic methods were used for those most significant fire simulations identified through deterministic methods. This accounts for possible variation in key input data providing an enhanced analysis of possible spread and consequence. Please refer to Sections 5.5, Section 5.6 and Appendix B for a description of this approach.
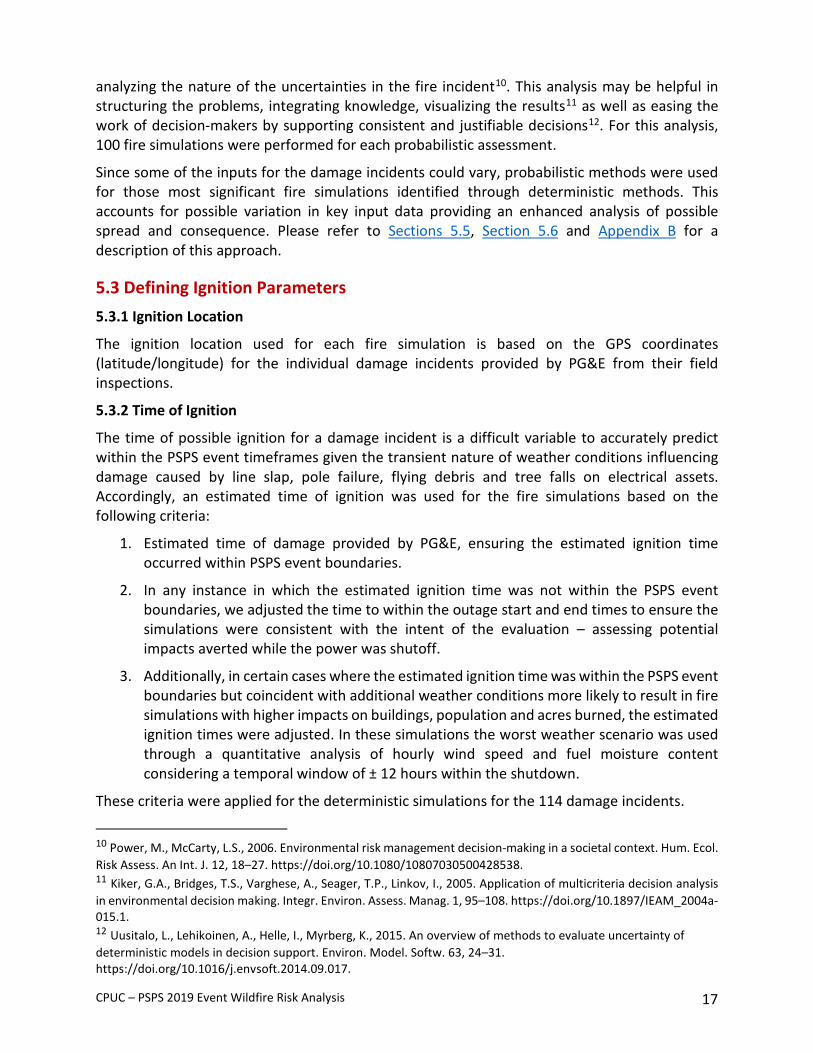
5.3 Defining Ignition Parameters 5.3.1 Ignition Location
The ignition location used for each fire simulation is based on the GPS coordinates (latitude/longitude) for the individual damage incidents provided by PG&E from their field inspections.
5.3.2 Time of Ignition
The time of possible ignition for a damage incident is a difficult variable to accurately predict within the PSPS event timeframes given the transient nature of weather conditions influencing damage caused by line slap, pole failure, flying debris and tree falls on electrical assets. Accordingly, an estimated time of ignition was used for the fire simulations based on the following criteria:
1. Estimated time of damage provided by PG&E, ensuring the estimated ignition time occurred within PSPS event boundaries.
2. In any instance in which the estimated ignition time was not within the PSPS event boundaries, we adjusted the time to within the outage start and end times to ensure the simulations were consistent with the intent of the evaluation – assessing potential impacts averted while the power was shutoff.
3. Additionally, in certain cases where the estimated ignition time was within the PSPS event boundaries but coincident with additional weather conditions more likely to result in fire simulations with higher impacts on buildings, population and acres burned, the estimated ignition times were adjusted. In these simulations the worst weather scenario was used through a quantitative analysis of hourly wind speed and fuel moisture content considering a temporal window of ± 12 hours within the shutdown.
These criteria were applied for the deterministic simulations for the 114 damage incidents.
10 Power, M., McCarty, L.S., 2006. Environmental risk management decision-making in a societal context. Hum. Ecol. Risk Assess. An Int. J. 12, 18–27. https://doi.org/10.1080/10807030500428538. 11 Kiker, G.A., Bridges, T.S., Varghese, A., Seager, T.P., Linkov, I., 2005. Application of multicriteria decision analysis in environmental decision making. Integr. Environ. Assess. Manag. 1, 95–108. https://doi.org/10.1897/IEAM_2004a-015.1. 12 Uusitalo, L., Lehikoinen, A., Helle, I., Myrberg, K., 2015. An overview of methods to evaluate uncertainty of deterministic models in decision support. Environ. Model. Softw. 63, 24–31. https://doi.org/10.1016/j.envsoft.2014.09.017.
CPUC – PSPS 2019 Event Wildfire Risk Analysis 18
For the most significant damage incidents, the probabilistic simulations inherently accommodate for input data uncertainty and, indirectly, with the issues related to the time of ignition since the model considers varying input data (especially fuel moisture content and wind speed).
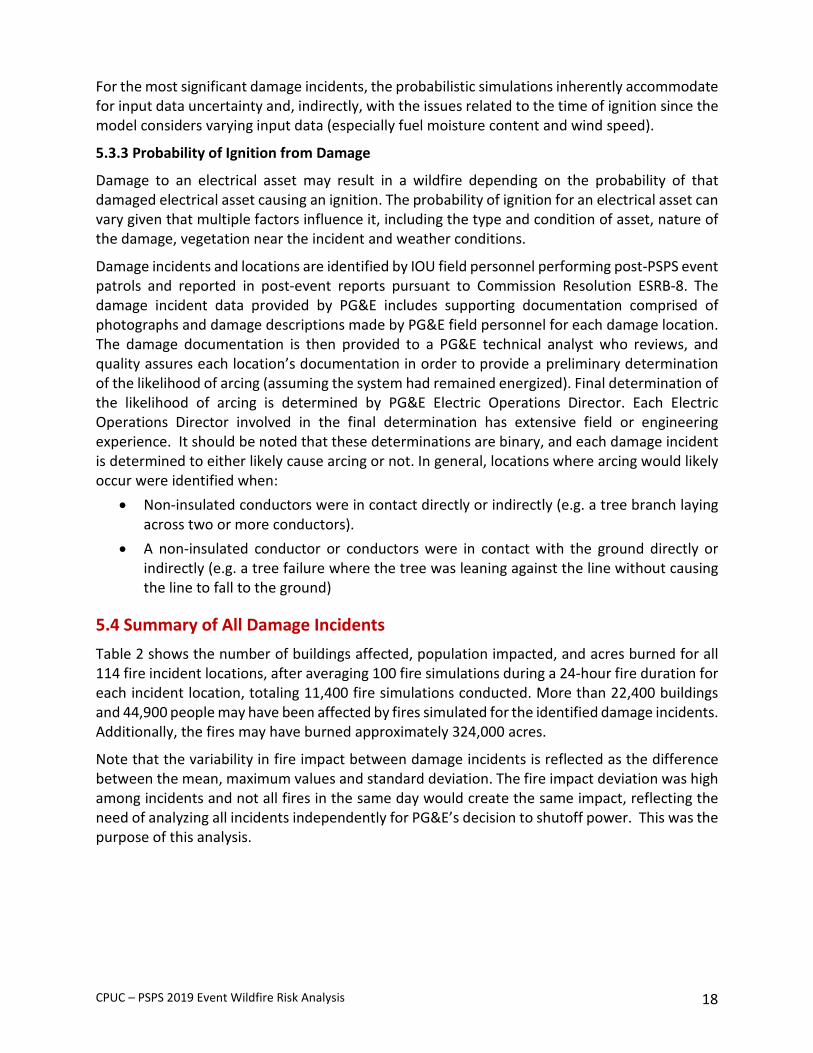
5.3.3 Probability of Ignition from Damage
Damage to an electrical asset may result in a wildfire depending on the probability of that damaged electrical asset causing an ignition. The probability of ignition for an electrical asset can vary given that multiple factors influence it, including the type and condition of asset, nature of the damage, vegetation near the incident and weather conditions.
Damage incidents and locations are identified by IOU field personnel performing post-PSPS event patrols and reported in post-event reports pursuant to Commission Resolution ESRB-8. The damage incident data provided by PG&E includes supporting documentation comprised of photographs and damage descriptions made by PG&E field personnel for each damage location. The damage documentation is then provided to a PG&E technical analyst who reviews, and quality assures each location’s documentation in order to provide a preliminary determination of the likelihood of arcing (assuming the system had remained energized). Final determination of the likelihood of arcing is determined by PG&E Electric Operations Director. Each Electric Operations Director involved in the final determination has extensive field or engineering experience. It should be noted that these determinations are binary, and each damage incident is determined to either likely cause arcing or not. In general, locations where arcing would likely occur were identified when:
• Non-insulated conductors were in contact directly or indirectly (e.g. a tree branch laying across two or more conductors).
• A non-insulated conductor or conductors were in contact with the ground directly or indirectly (e.g. a tree failure where the tree was leaning against the line without causing the line to fall to the ground)
5.4 Summary of All Damage Incidents Table 2 shows the number of buildings affected, population impacted, and acres burned for all 114 fire incident locations, after averaging 100 fire simulations during a 24-hour fire duration for each incident location, totaling 11,400 fire simulations conducted. More than 22,400 buildings and 44,900 people may have been affected by fires simulated for the identified damage incidents. Additionally, the fires may have burned approximately 324,000 acres.
Note that the variability in fire impact between damage incidents is reflected as the difference between the mean, maximum values and standard deviation. The fire impact deviation was high among incidents and not all fires in the same day would create the same impact, reflecting the need of analyzing all incidents independently for PG&E’s decision to shutoff power. This was the purpose of this analysis.

CPUC – PSPS 2019 Event Wildfire Risk Analysis 19
Table 2. Total expected impact, mean and maximum per fire simulation for all 114 damage incident predictions.
Impact Type Total Mean Maximum Standard deviation
Population 36,015 316 3,366 548
Buildings 18,819 165 2,173 326
Acres Burned (ac) 274,977 2,412 46,437 5,721
5.5 Criteria for Selecting Significant Incidents Once the fire spread prediction analysis was completed for all 114 damage incidents, specific criteria was applied to identify the most significant incidents. Worst cases were identified considering the following criteria. This was not specific to thresholds or distributions.
1. Total population impacted, using the LandScan 2016 population count data.13 This data provides an accurate definition of population count for the USA. It is ideal for identifying population for wildland, Wildland Urban Interface (WUI), and urban areas. LandScan data has become the de facto standard for quantifying impacts to population for wildfire risk assessments conducted across the nation. Data is synchronized with the most recent Census update to accurately reflect population totals for geo-administrative areas.
2. Total buildings impacted. Original source is the Microsoft US Building Footprints dataset 2018.14 Building footprints enhanced by Technosylva to include missing data areas and misclassification for California.
3. Size of the fire, given that large fires typically result in high costs for suppression and restoration in addition to greater population and building impacts.
4. Initial Attack Assessment index rating – identifies those fires that would likely escape initial attack suppression and would spread quickly.15
13 LandScan 2016 data was used as the source for population analysis. More information can be found at https://landscan.ornl.gov/. 14 More information about the US Building Footprints data released by Microsoft can be found at https://github.com/microsoft/USBuildingFootprints. 15 IAA is a metric developed by Technosylva in concert with experienced fire professionals to define the likelihood of a fire to escape initial attack suppression. It is based solely on fire behavior and fire growth characteristics. It is used to help distinguish fires that are likely to spread quickly and become large fires.
CPUC – PSPS 2019 Event Wildfire Risk Analysis 20
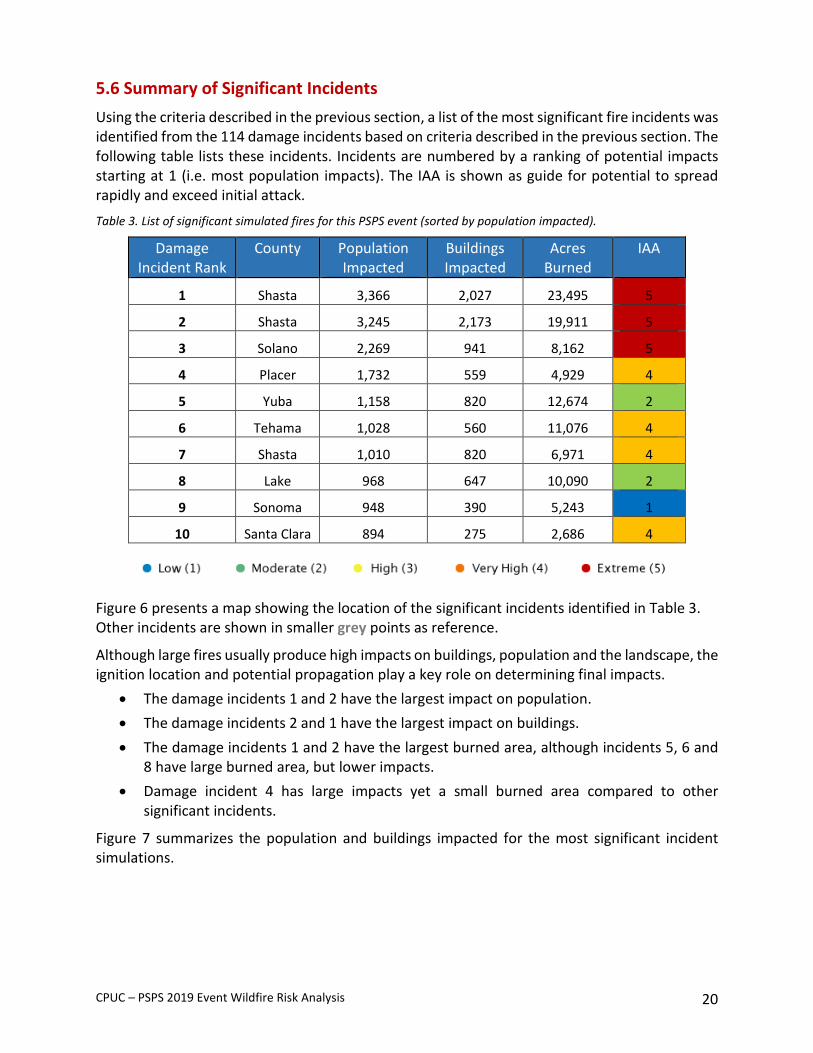
5.6 Summary of Significant Incidents Using the criteria described in the previous section, a list of the most significant fire incidents was identified from the 114 damage incidents based on criteria described in the previous section. The following table lists these incidents. Incidents are numbered by a ranking of potential impacts starting at 1 (i.e. most population impacts). The IAA is shown as guide for potential to spread rapidly and exceed initial attack. Table 3. List of significant simulated fires for this PSPS event (sorted by population impacted).
Damage Incident Rank
County Population Impacted
Buildings Impacted
Acres Burned
IAA
1 Shasta 3,366 2,027 23,495 5
2 Shasta 3,245 2,173 19,911 5
3 Solano 2,269 941 8,162 5
4 Placer 1,732 559 4,929 4
5 Yuba 1,158 820 12,674 2
6 Tehama 1,028 560 11,076 4
7 Shasta 1,010 820 6,971 4
8 Lake 968 647 10,090 2
9 Sonoma 948 390 5,243 1
10 Santa Clara 894 275 2,686 4
Figure 6 presents a map showing the location of the significant incidents identified in Table 3. Other incidents are shown in smaller grey points as reference.
Although large fires usually produce high impacts on buildings, population and the landscape, the ignition location and potential propagation play a key role on determining final impacts.
• The damage incidents 1 and 2 have the largest impact on population. • The damage incidents 2 and 1 have the largest impact on buildings. • The damage incidents 1 and 2 have the largest burned area, although incidents 5, 6 and
8 have large burned area, but lower impacts. • Damage incident 4 has large impacts yet a small burned area compared to other
significant incidents.
Figure 7 summarizes the population and buildings impacted for the most significant incident simulations.

CPUC – PSPS 2019 Event Wildfire Risk Analysis 21
Figure 5. Map of the significant damage ignition locations.

CPUC – PSPS 2019 Event Wildfire Risk Analysis 22
Although large fires, in terms of acres burned, usually correlate to higher impacts for buildings and population impacted, the analysis reveals that small fires can also result in large impacts due to their specific location and proximity to buildings and people.
Fire simulations with an intense fire behavior (high flame length and high rate of spread) typically result in an Initial Attack Assessment Index (IAA) value of high (4) or extreme (5), and have the largest burned areas based on a 24-hour fire simulations. Fire behavior is related to fuel types, complex topography and adverse weather conditions (i.e. low fuel moisture and high wind speed). The IAA index is intended to be used to analyze the fire simulation and the initial attack difficulty, not to analyze potential impacts in terms of buildings of population. As such, some fires with low-moderate IAA values also had high impacts. Figure 6. Summary of population and buildings impacted for the significant incidents.
Figure 8 presents the population impacts of each fire simulation as a function of size (acres burned). Fires are color coded by IAA. This chart shows that fire simulations with high IAA index values consistently have large impacts. These fire simulations are significant from the start and are likely to escape initial attack.
0
5,000
10,000
15,000
20,000
25,000
0
500
1,000
1,500
2,000
2,500
3,000
3,500
4,000
1 2 3 4 5 6 7 8 9 10
Acre
s Bur
ned
(24
hour
s)
Tota
l Im
pact
s
Damage Incident Number (Rank)
Population & Buildings Impacted - Significant Damage IncidentsOctober 9th, 2019 - PG&E PSPS Event
Population Buildings Acres Burned
CPUC – PSPS 2019 Event Wildfire Risk Analysis 23
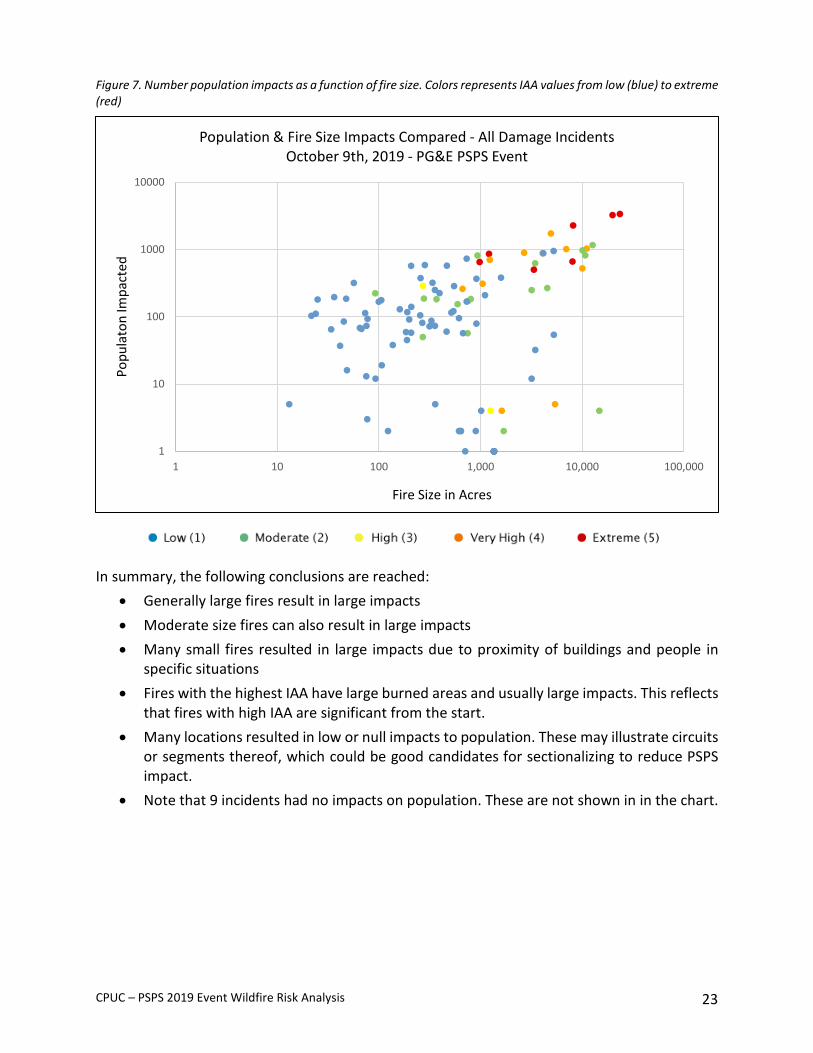
Figure 7. Number population impacts as a function of fire size. Colors represents IAA values from low (blue) to extreme (red)
In summary, the following conclusions are reached:
• Generally large fires result in large impacts • Moderate size fires can also result in large impacts • Many small fires resulted in large impacts due to proximity of buildings and people in
specific situations • Fires with the highest IAA have large burned areas and usually large impacts. This reflects
that fires with high IAA are significant from the start. • Many locations resulted in low or null impacts to population. These may illustrate circuits
or segments thereof, which could be good candidates for sectionalizing to reduce PSPS impact.
• Note that 9 incidents had no impacts on population. These are not shown in in the chart.
1
10
100
1000
10000
1 10 100 1,000 10,000 100,000
Popu
lato
n Im
pact
ed
Fire Size in Acres
Population & Fire Size Impacts Compared - All Damage IncidentsOctober 9th, 2019 - PG&E PSPS Event

CPUC – PSPS 2019 Event Wildfire Risk Analysis 24
6. SUMMARY OF ACTIVE WILDFIRES DURING THE PSPS EVENT
This section summarizes the active wildfires that occurred during the PSPS event timelines in California. Ninety nine fire incidents were recorded in the Integrated Reporting of Wildland-Fire Information (IRWIN) system from October 9 to 12, 2019.16 Twenty-eight (28) of the fires are located in the PSPS event areas. Figure 8 shows the location of these wildfires. Figure 8. Wildfires occurring during the PSPS event.
Appendix C provides a summary of historical fires for the PSPS event area.
16 The IRWIN system records wildfires in California through integration with CAL FIRE, all federal agencies and LA County. Wildfires in other local responsibility areas are not recorded in IRWIN or shown on this map.
CPUC – PSPS 2019 Event Wildfire Risk Analysis 25
7. CONCLUSIONS
7.1 Findings • Damages sustained to de-energized PG&E facilities during the October 9, 2019 PSPS
events could have impacted more than 18,800 buildings, 36,000 people and burned approximately 275,000 acres, in total. However, a small number of the damage incidents resulted in the majority of the impacts, i.e. the top 20 incidents account for 67% of population impacted.
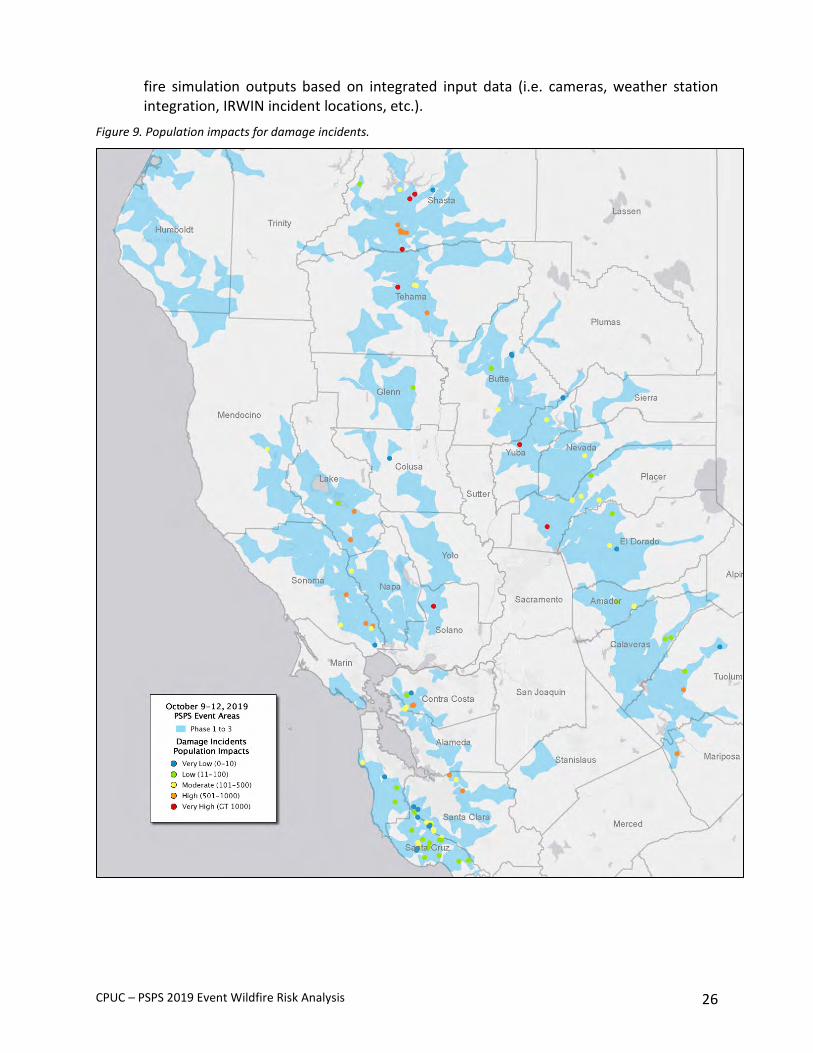
• 54 of 114 incidents (47%) resulted in impacts to less than 100 people. 25 of 114 incidents (22%) resulted in impacts to less than 10 people. This indicates that some areas may not be worthwhile for shutoff, as wildfires beginning in these areas have relatively limited impacts on the population. Figure 10 presents a map showing the damage incidents classified by population impacts. PSPS event boundaries are shown in blue.
• Fire would have spread quickly (greater than 50 chains/hour) in several damage incidents due to high wind speed, low fuel moisture content and grass-shrub fuel types.17
• The fire activity reflected by IRWIN incidents (99 active wildfires during the PSPS event) when combined with the potential fires from damage incidents could have substantially increased the number of simultaneous fires, decreasing the availability and effectiveness of suppression resources.
• The fire impact of each incident depends on specific environmental conditions (i.e., fuels, weather, topography, etc.) and the exposure of assets (buildings, population) near the incident ignition location. The fire impact deviation was very high among simulations and not all fires in the same day would create the same impact, reflecting the need of analyzing all incidents independently to properly assess PG&E’s decision to shutoff power.
• The weather observations recorded by weather stations near the damage incidents show a difference between forecasted data for those locations. This is reflected in the wind charts shown in Appendix B. Local winds are difficult to predict accurately, and weather stations are often too far away from the damage incidents to be representative of localized conditions. Despite these differences the forecasted weather data was used as it affords a consistent comparison for simulations across all damage incidents. In addition, the forecasted data provides spatial and temporal variation in wind direction and speed, something not available from the weather station observed data. Accordingly, it is important to consider probabilistic fire simulation approaches to estimate the potential impact of fires and account for this variability between modeled and observed wind data. Probabilistic methods were applied for the most significant fires and are included in Appendix B.
• The custom weather and fuel types provided in Technosylva’s Wildfire Analyst™ software module allow users to modify input data based on real observations. The analysis conducted highlights the importance of these capabilities to improve and calibrate the
17 Chains per hour is the accepted standard for describing wildfire rate of spread within forestry and wildfire management agencies and science. A chain is equivalent to 66 feet.
CPUC – PSPS 2019 Event Wildfire Risk Analysis 26
fire simulation outputs based on integrated input data (i.e. cameras, weather station integration, IRWIN incident locations, etc.).
Figure 9. Population impacts for damage incidents.

CPUC – PSPS 2019 Event Wildfire Risk Analysis 27
7.2 Recommendations and Opportunities for Improvement • This work includes the potential impact of damage incidents on population, buildings, and
the landscape if ignitions were to occur from the damage incurred to de-energized utility facilities during a PSPS event. The incidents need to be analyzed with caution due to the uncertainty of input data used during the analysis. Specifically, in the future, the probability of ignition may be evaluated more granularly than the binary yes/no assessments used for this analysis to facilitate more detailed future analysis for specific events.
• The data and techniques applied in this analysis provide outputs that quantify the potential impact of fires ignited from the damage incidents. This provides a retrospective view of the PSPS decision to de-energize. The results identify where large impacts may have been avoided, as well as other areas where minimal impacts may have occurred.
• Additionally, the fire modelling techniques applied in this analysis, using Technosylva’s Wildfire Analyst software, can be used for decision-making before the PSPS event leveraging PG&E’s forecasted weather data. With this preemptive data in hand, de-energizing decisions can be evaluated both temporally and spatially in advance.
• Specific standards for damage incident data collection should be employed in the future to facilitate this kind of analysis as a standard method to evaluate PSPS decisions. This will afford an objective method that will quantify potential impacts consistently for all IOUs and PSPS events.
• The on-going research of IOUs and Technosylva on wildfire modelling methods and data will increase the opportunities for improvement of future analysis. This includes better data collection and modeling of surface and canopy fuels, live fuel moistures, and enrichment of urban area delineation for encroachment analysis. These methods will enhance the accuracy of impact analysis and consequence modeling consistent with risk management industry approaches.
CPUC – PSPS 2019 Event Wildfire Risk Analysis 28
APPENDIX A: DETAILED WEATHER ANALYSIS
This appendix presents a detailed weather analysis for the PSPS event.
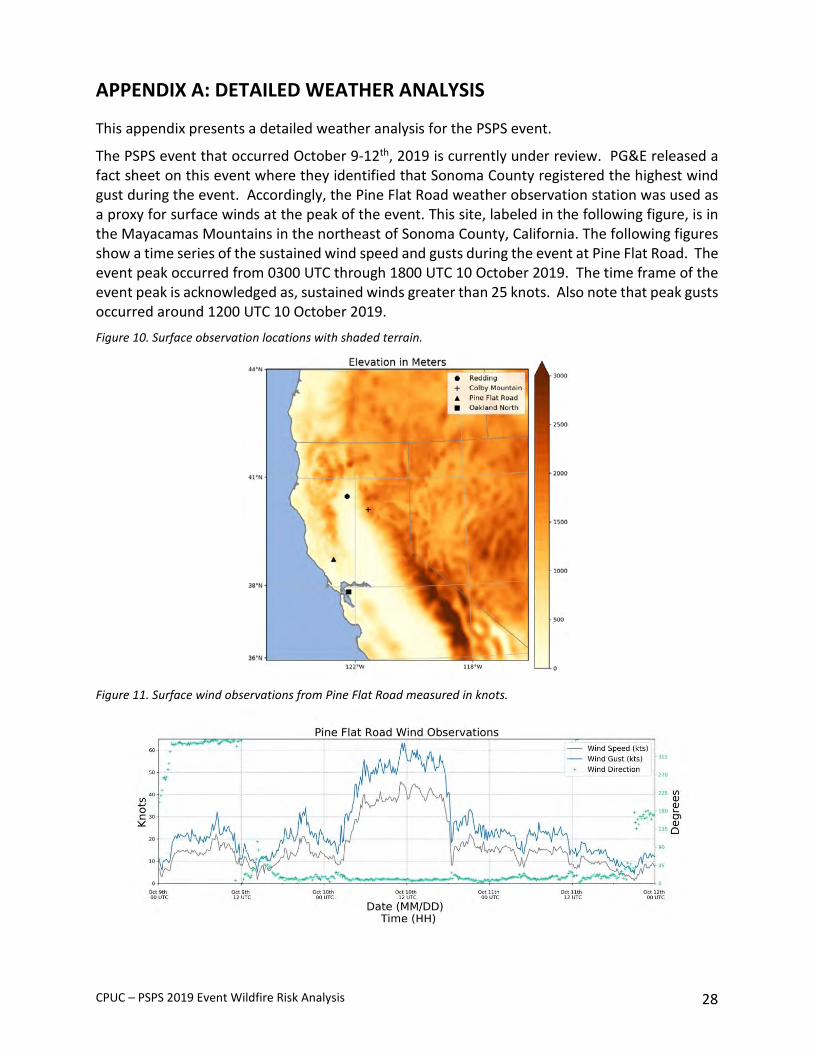
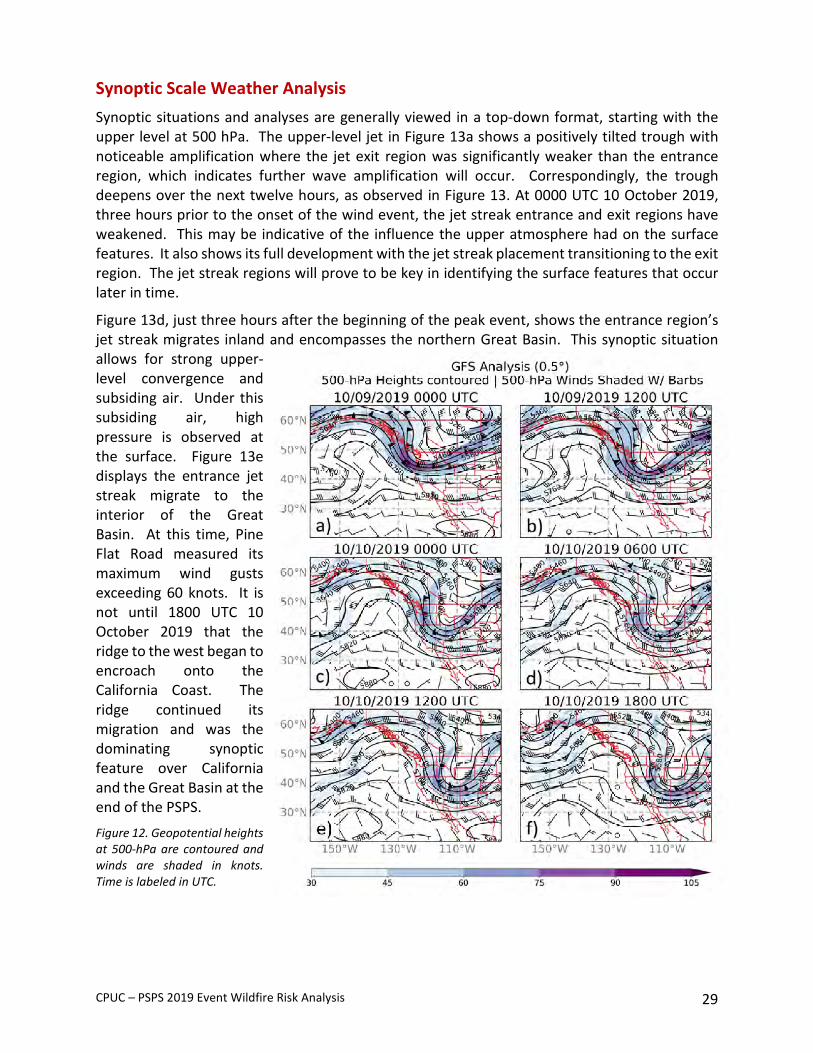
The PSPS event that occurred October 9-12th, 2019 is currently under review. PG&E released a fact sheet on this event where they identified that Sonoma County registered the highest wind gust during the event. Accordingly, the Pine Flat Road weather observation station was used as a proxy for surface winds at the peak of the event. This site, labeled in the following figure, is in the Mayacamas Mountains in the northeast of Sonoma County, California. The following figures show a time series of the sustained wind speed and gusts during the event at Pine Flat Road. The event peak occurred from 0300 UTC through 1800 UTC 10 October 2019. The time frame of the event peak is acknowledged as, sustained winds greater than 25 knots. Also note that peak gusts occurred around 1200 UTC 10 October 2019. Figure 10. Surface observation locations with shaded terrain.
Figure 11. Surface wind observations from Pine Flat Road measured in knots.
CPUC – PSPS 2019 Event Wildfire Risk Analysis 29
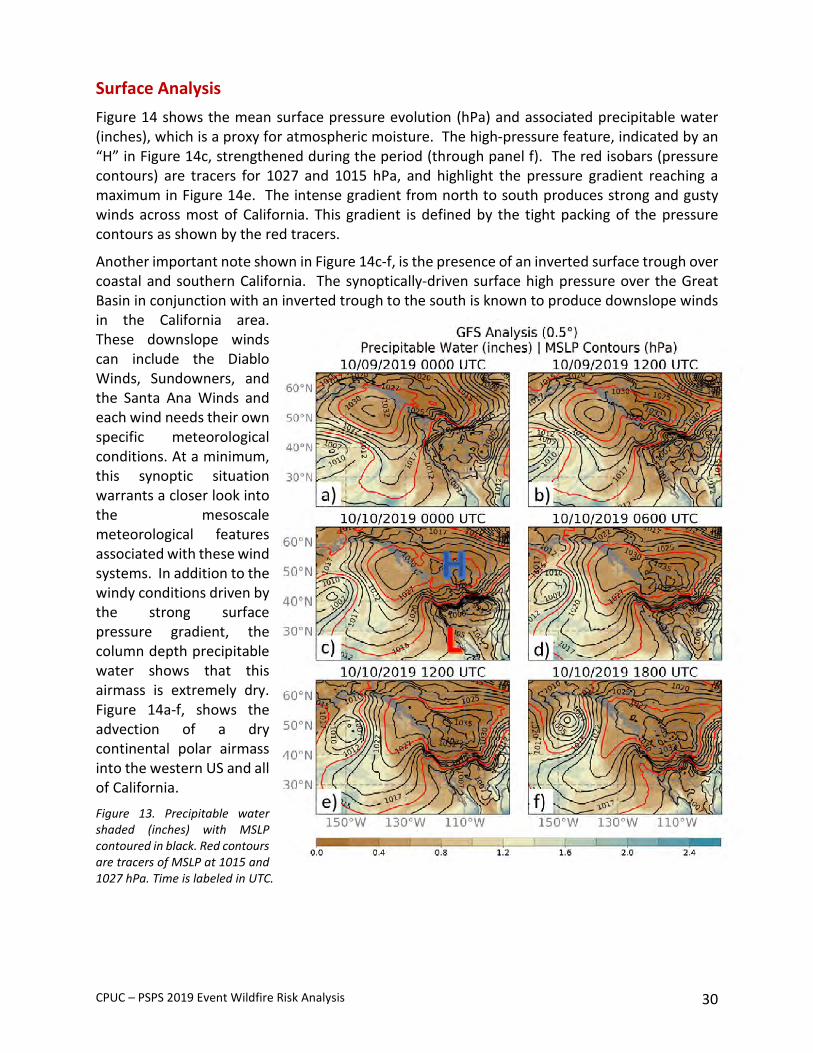
Synoptic Scale Weather Analysis Synoptic situations and analyses are generally viewed in a top-down format, starting with the upper level at 500 hPa. The upper-level jet in Figure 13a shows a positively tilted trough with noticeable amplification where the jet exit region was significantly weaker than the entrance region, which indicates further wave amplification will occur. Correspondingly, the trough deepens over the next twelve hours, as observed in Figure 13. At 0000 UTC 10 October 2019, three hours prior to the onset of the wind event, the jet streak entrance and exit regions have weakened. This may be indicative of the influence the upper atmosphere had on the surface features. It also shows its full development with the jet streak placement transitioning to the exit region. The jet streak regions will prove to be key in identifying the surface features that occur later in time.
Figure 13d, just three hours after the beginning of the peak event, shows the entrance region’s jet streak migrates inland and encompasses the northern Great Basin. This synoptic situation allows for strong upper-level convergence and subsiding air. Under this subsiding air, high pressure is observed at the surface. Figure 13e displays the entrance jet streak migrate to the interior of the Great Basin. At this time, Pine Flat Road measured its maximum wind gusts exceeding 60 knots. It is not until 1800 UTC 10 October 2019 that the ridge to the west began to encroach onto the California Coast. The ridge continued its migration and was the dominating synoptic feature over California and the Great Basin at the end of the PSPS. Figure 12. Geopotential heights at 500-hPa are contoured and winds are shaded in knots. Time is labeled in UTC.
CPUC – PSPS 2019 Event Wildfire Risk Analysis 30
Surface Analysis Figure 14 shows the mean surface pressure evolution (hPa) and associated precipitable water (inches), which is a proxy for atmospheric moisture. The high-pressure feature, indicated by an “H” in Figure 14c, strengthened during the period (through panel f). The red isobars (pressure contours) are tracers for 1027 and 1015 hPa, and highlight the pressure gradient reaching a maximum in Figure 14e. The intense gradient from north to south produces strong and gusty winds across most of California. This gradient is defined by the tight packing of the pressure contours as shown by the red tracers.
Another important note shown in Figure 14c-f, is the presence of an inverted surface trough over coastal and southern California. The synoptically-driven surface high pressure over the Great Basin in conjunction with an inverted trough to the south is known to produce downslope winds in the California area. These downslope winds can include the Diablo Winds, Sundowners, and the Santa Ana Winds and each wind needs their own specific meteorological conditions. At a minimum, this synoptic situation warrants a closer look into the mesoscale meteorological features associated with these wind systems. In addition to the windy conditions driven by the strong surface pressure gradient, the column depth precipitable water shows that this airmass is extremely dry. Figure 14a-f, shows the advection of a dry continental polar airmass into the western US and all of California. Figure 13. Precipitable water shaded (inches) with MSLP contoured in black. Red contours are tracers of MSLP at 1015 and 1027 hPa. Time is labeled in UTC.

CPUC – PSPS 2019 Event Wildfire Risk Analysis 31
A closer look at the dry air and pressure gradient of this event is shown in Figure 15. The 2-m dew point temperatures were consistently below 0 °C across all northern California. Sonoma County was exceptionally dry during this period. This is potential evidence of strong downslope winds mixing down the drier air from aloft. The red tracers,1027 and 1015-hPa contours respectively, separate the high- and low-pressure features that are annotated in Figure 15c. Synoptic-scale meteorological conditions showed some of the components that are needed for downslope winds to occur in the area of interest such as a strong surface pressure gradient along the Sierra Nevada crest. To further determine the development and structure of downslope windstorms that may have occurred, additional analyses of mesoscale meteorology including atmospheric profiles of wind and moisture are needed. Figure 14. Dew points at two meters are shaded (Celsius) with black contours of MSLP and red tracers at 1015 and 1027 hPa. Time is labeled in UTC.
CPUC – PSPS 2019 Event Wildfire Risk Analysis 32
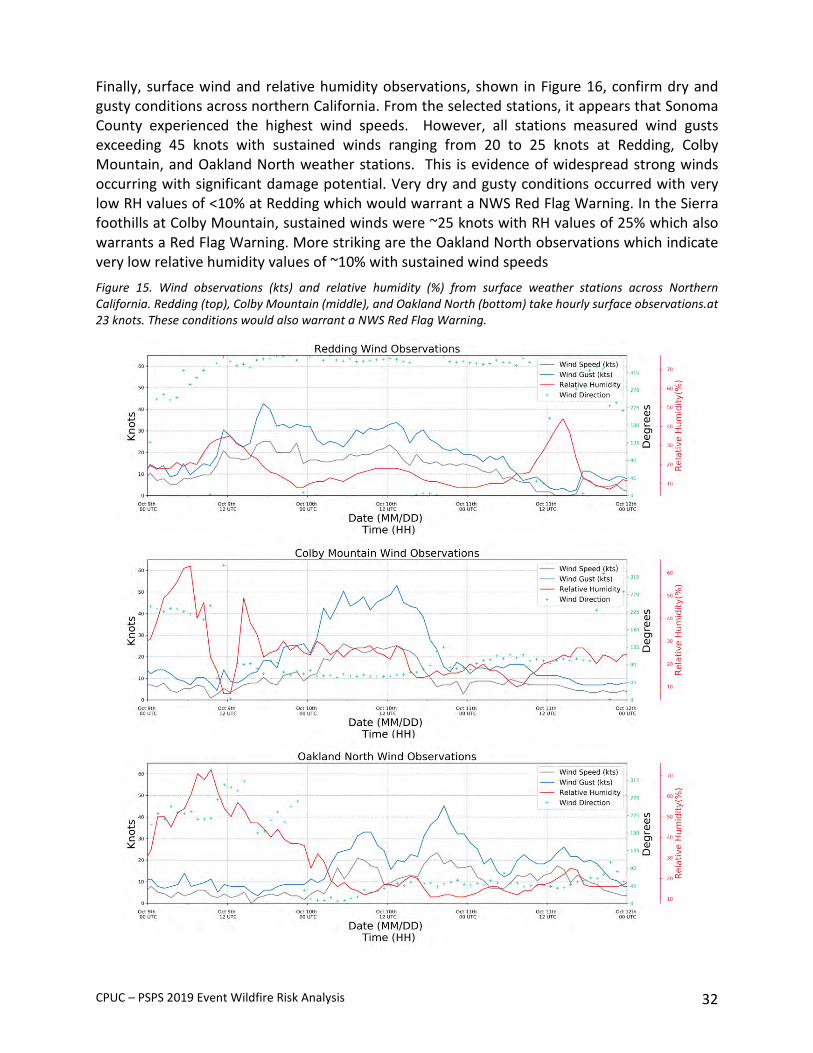
Finally, surface wind and relative humidity observations, shown in Figure 16, confirm dry and gusty conditions across northern California. From the selected stations, it appears that Sonoma County experienced the highest wind speeds. However, all stations measured wind gusts exceeding 45 knots with sustained winds ranging from 20 to 25 knots at Redding, Colby Mountain, and Oakland North weather stations. This is evidence of widespread strong winds occurring with significant damage potential. Very dry and gusty conditions occurred with very low RH values of <10% at Redding which would warrant a NWS Red Flag Warning. In the Sierra foothills at Colby Mountain, sustained winds were ~25 knots with RH values of 25% which also warrants a Red Flag Warning. More striking are the Oakland North observations which indicate very low relative humidity values of ~10% with sustained wind speeds Figure 15. Wind observations (kts) and relative humidity (%) from surface weather stations across Northern California. Redding (top), Colby Mountain (middle), and Oakland North (bottom) take hourly surface observations.at 23 knots. These conditions would also warrant a NWS Red Flag Warning.
CPUC – PSPS 2019 Event Wildfire Risk Analysis 33
APPENDIX B: ANALYSIS OUTPUTS FOR SIGNIFICANT DAMAGE INCIDENTS
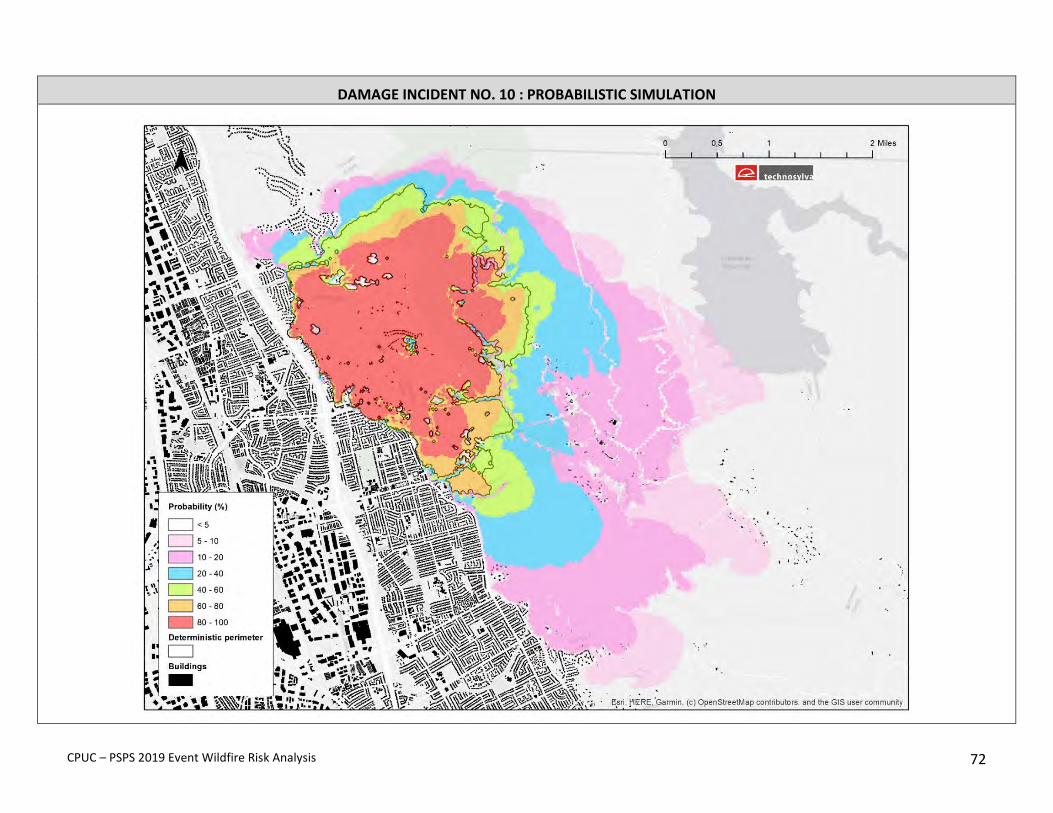
This appendix provides a description of the fire spread prediction and impact analysis outputs for the most significant damage incidents matching those summarized in Section 5. Maps are provided for both the deterministic and probabilistic simulations. Building footprints are shown in both maps as reference. In addition, the deterministic boundary is also shown in each probabilistic map as reference. Map scale varies across the maps as they are sized to match simulation extent. Each simulation represents a 24-hour duration.
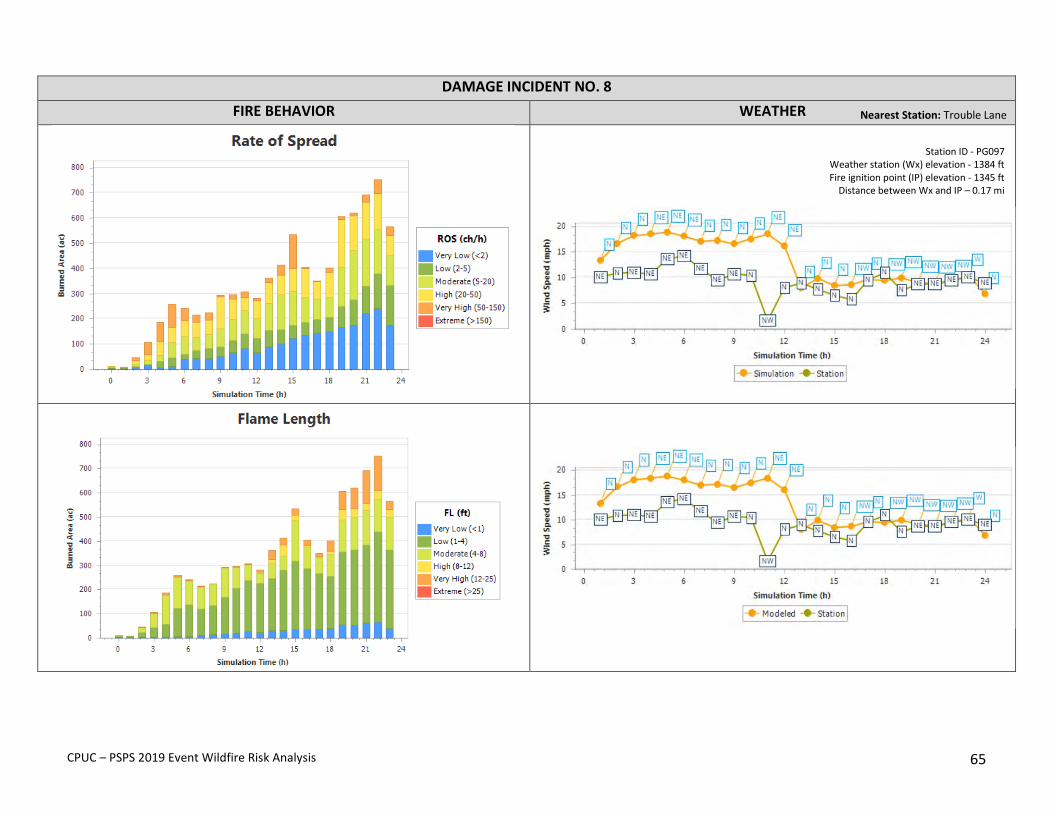
For each incident, critical input data such as wind speed and direction are analyzed, including fire behavior and impact metrics shown through tables and figures.
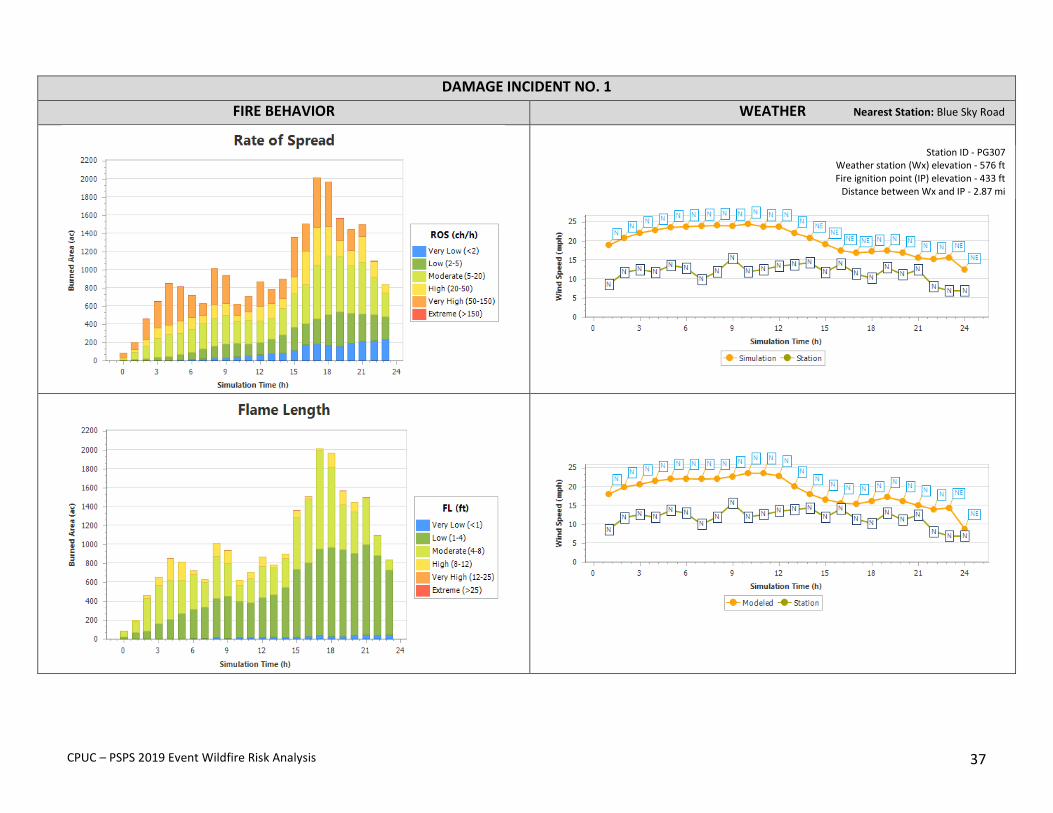
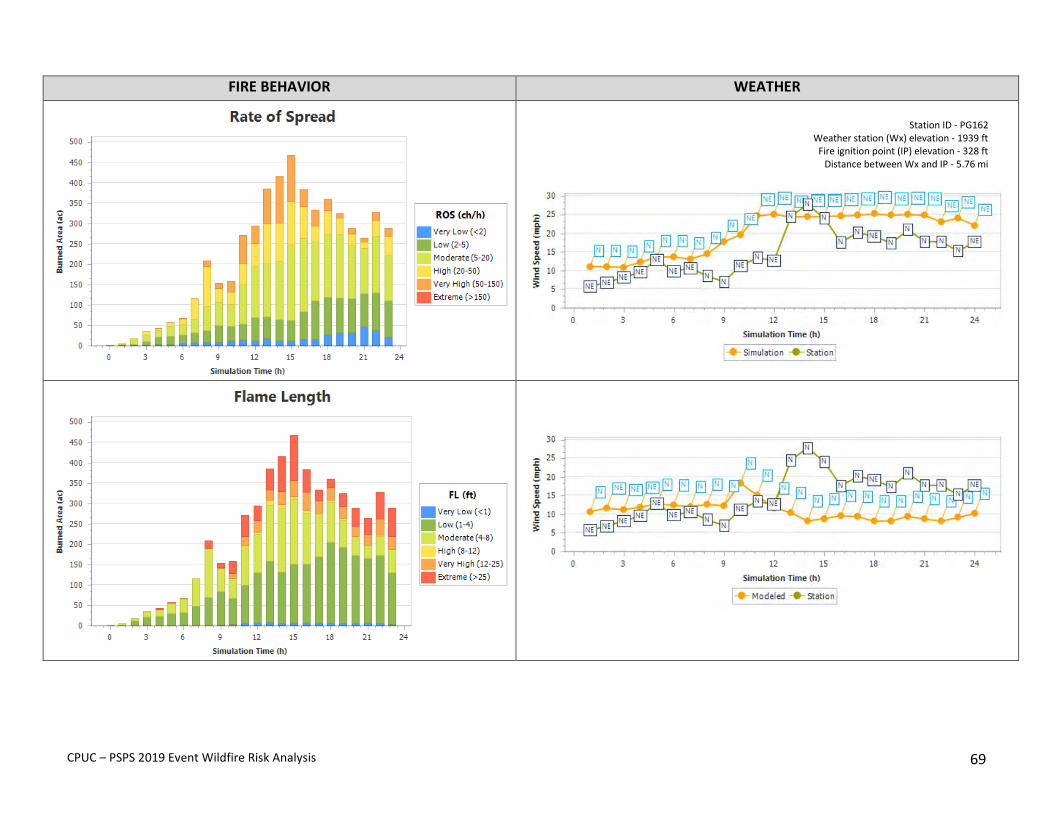
Two weather charts are included for each fire simulation, representing hourly wind direction and speed throughout the incident (i.e. 24 hours) for the nearest weather station and modeled winds for the weather station location point and the ignition location of the incident. In this sense, wind data uncertainty is shown both spatially and temporally.
Two charts on fire behavior are included in each simulation to show the rate of spread and flame length (i.e. fire intensity) throughout the fire duration with well-known variable thresholds established in fire science.
CPUC – PSPS 2019 Event Wildfire Risk Analysis 34
DAMAGE INCIDENT – 1
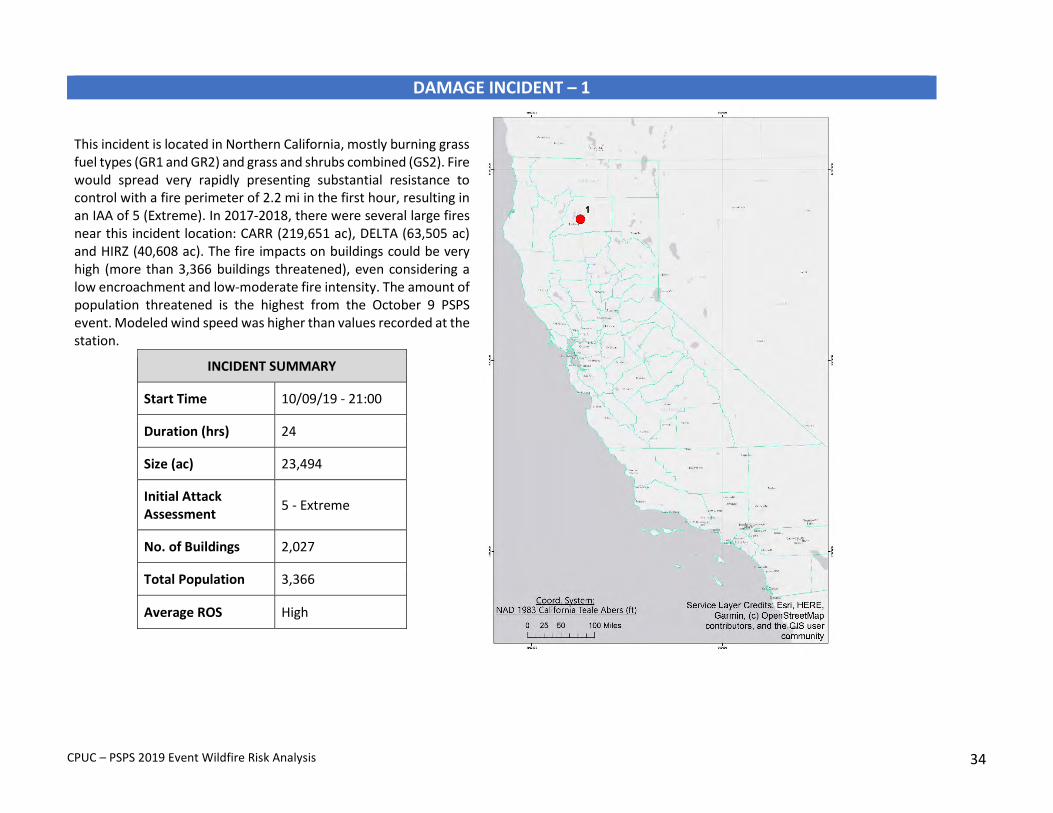
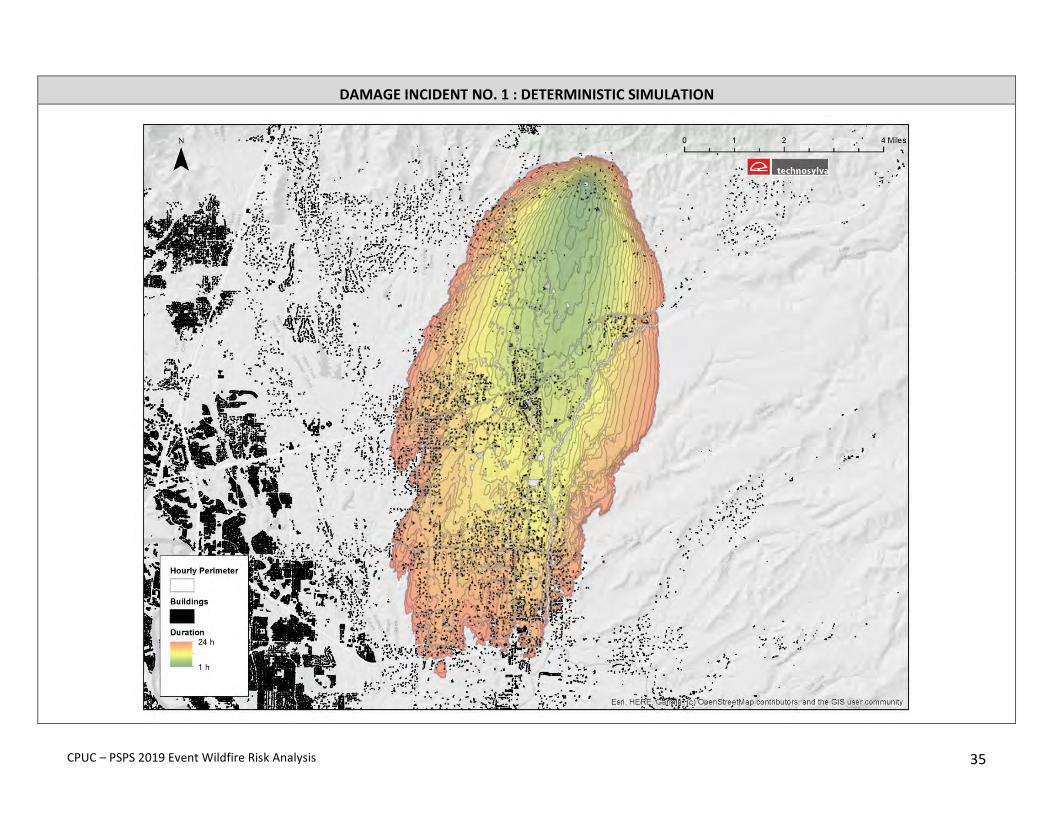
This incident is located in Northern California, mostly burning grass fuel types (GR1 and GR2) and grass and shrubs combined (GS2). Fire would spread very rapidly presenting substantial resistance to control with a fire perimeter of 2.2 mi in the first hour, resulting in an IAA of 5 (Extreme). In 2017-2018, there were several large fires near this incident location: CARR (219,651 ac), DELTA (63,505 ac) and HIRZ (40,608 ac). The fire impacts on buildings could be very high (more than 3,366 buildings threatened), even considering a low encroachment and low-moderate fire intensity. The amount of population threatened is the highest from the October 9 PSPS event. Modeled wind speed was higher than values recorded at the station.
INCIDENT SUMMARY
Start Time 10/09/19 - 21:00
Duration (hrs) 24
Size (ac) 23,494
Initial Attack Assessment 5 - Extreme
No. of Buildings 2,027
Total Population 3,366
Average ROS High
CPUC – PSPS 2019 Event Wildfire Risk Analysis 35
DAMAGE INCIDENT NO. 1 : DETERMINISTIC SIMULATION

CPUC – PSPS 2019 Event Wildfire Risk Analysis 36
DAMAGE INCIDENT NO. 1 : PROBABILISTIC SIMULATION
CPUC – PSPS 2019 Event Wildfire Risk Analysis 37
DAMAGE INCIDENT NO. 1 FIRE BEHAVIOR WEATHER
Nearest Station: Blue Sky Road
Station ID - PG307 Weather station (Wx) elevation - 576 ft Fire ignition point (IP) elevation - 433 ft
Distance between Wx and IP - 2.87 mi
CPUC – PSPS 2019 Event Wildfire Risk Analysis 38
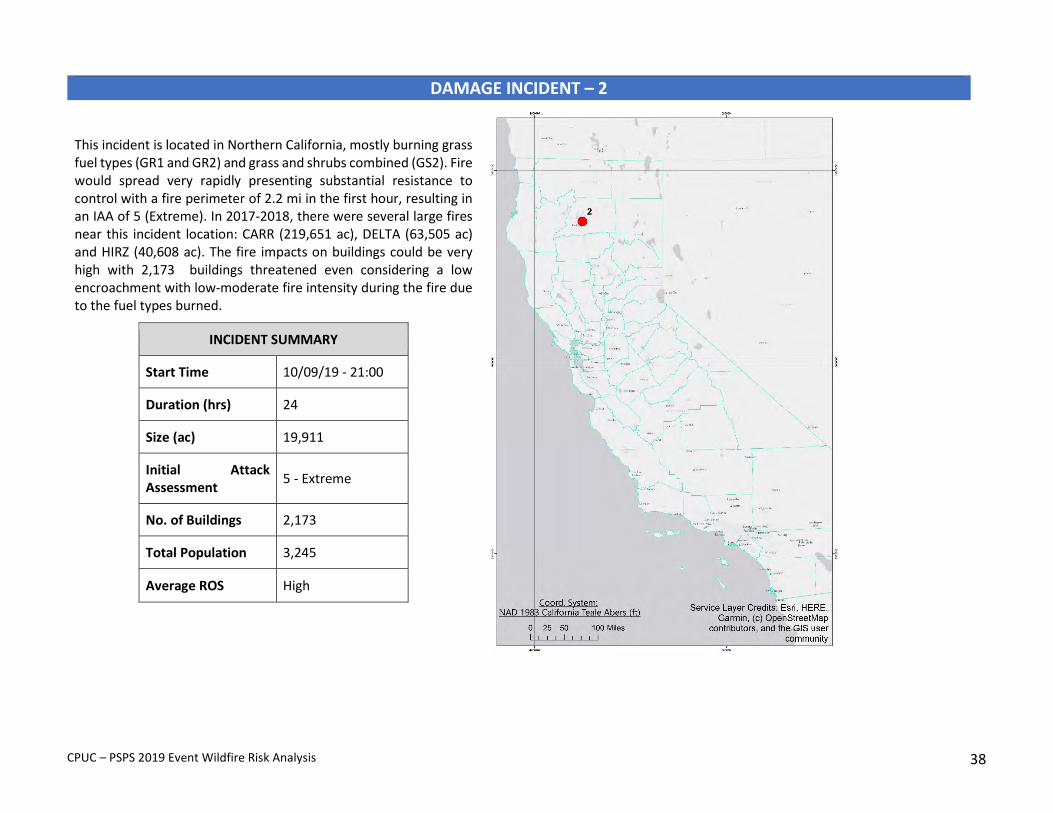
DAMAGE INCIDENT – 2
This incident is located in Northern California, mostly burning grass fuel types (GR1 and GR2) and grass and shrubs combined (GS2). Fire would spread very rapidly presenting substantial resistance to control with a fire perimeter of 2.2 mi in the first hour, resulting in an IAA of 5 (Extreme). In 2017-2018, there were several large fires near this incident location: CARR (219,651 ac), DELTA (63,505 ac) and HIRZ (40,608 ac). The fire impacts on buildings could be very high with 2,173 buildings threatened even considering a low encroachment with low-moderate fire intensity during the fire due to the fuel types burned.
INCIDENT SUMMARY
Start Time 10/09/19 - 21:00
Duration (hrs) 24
Size (ac) 19,911
Initial Attack Assessment 5 - Extreme
No. of Buildings 2,173
Total Population 3,245
Average ROS High
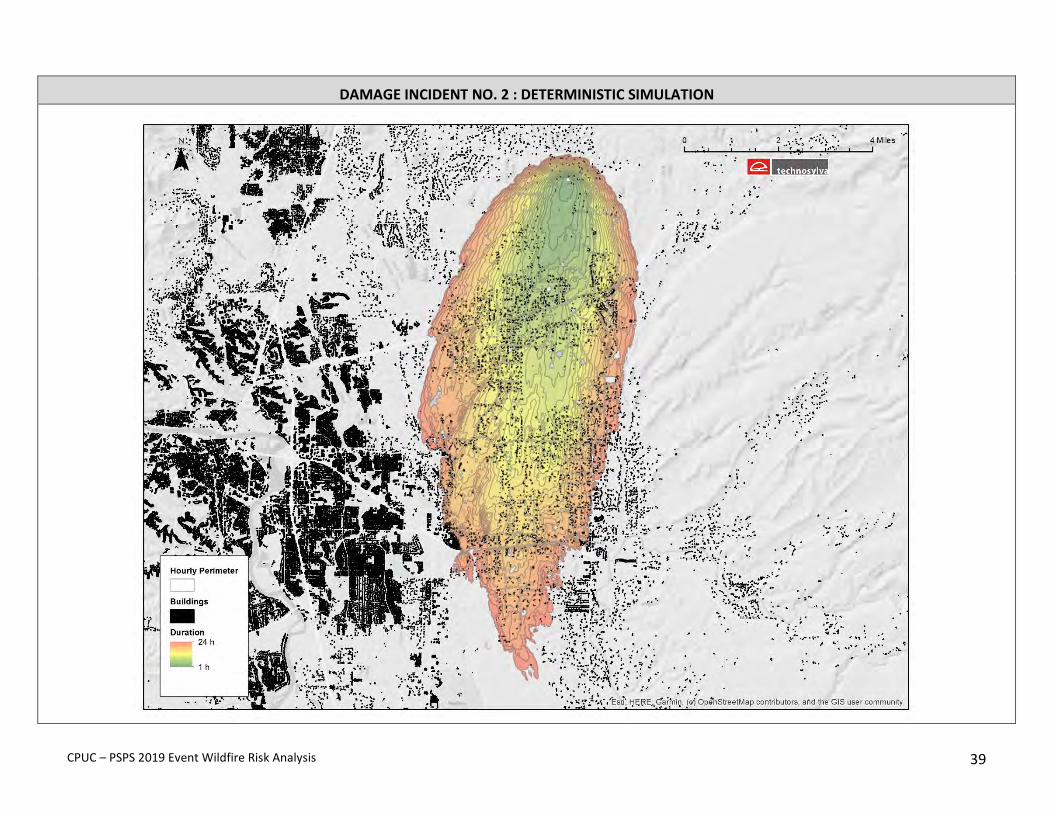
CPUC – PSPS 2019 Event Wildfire Risk Analysis 39
DAMAGE INCIDENT NO. 2 : DETERMINISTIC SIMULATION

CPUC – PSPS 2019 Event Wildfire Risk Analysis 40
DAMAGE INCIDENT NO. 2 : PROBABILISTIC SIMULATION
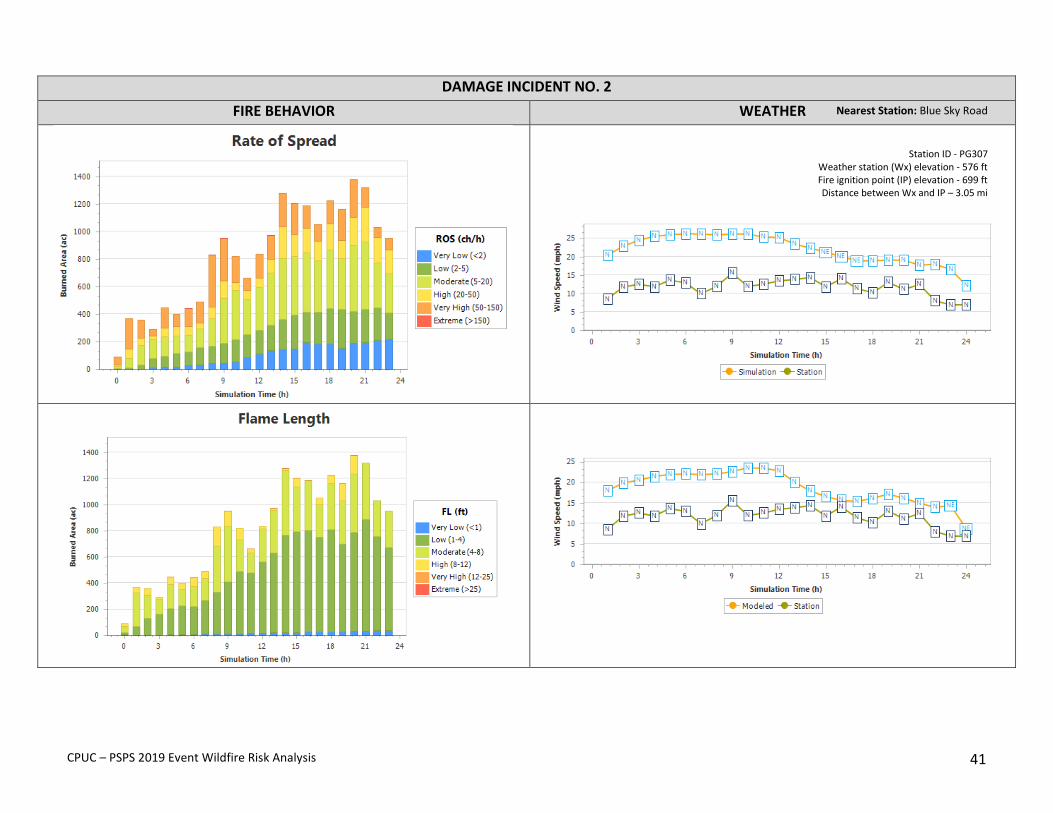
CPUC – PSPS 2019 Event Wildfire Risk Analysis 41
DAMAGE INCIDENT NO. 2 FIRE BEHAVIOR WEATHER
Nearest Station: Blue Sky Road
Station ID - PG307 Weather station (Wx) elevation - 576 ft Fire ignition point (IP) elevation - 699 ft Distance between Wx and IP – 3.05 mi
CPUC – PSPS 2019 Event Wildfire Risk Analysis 42
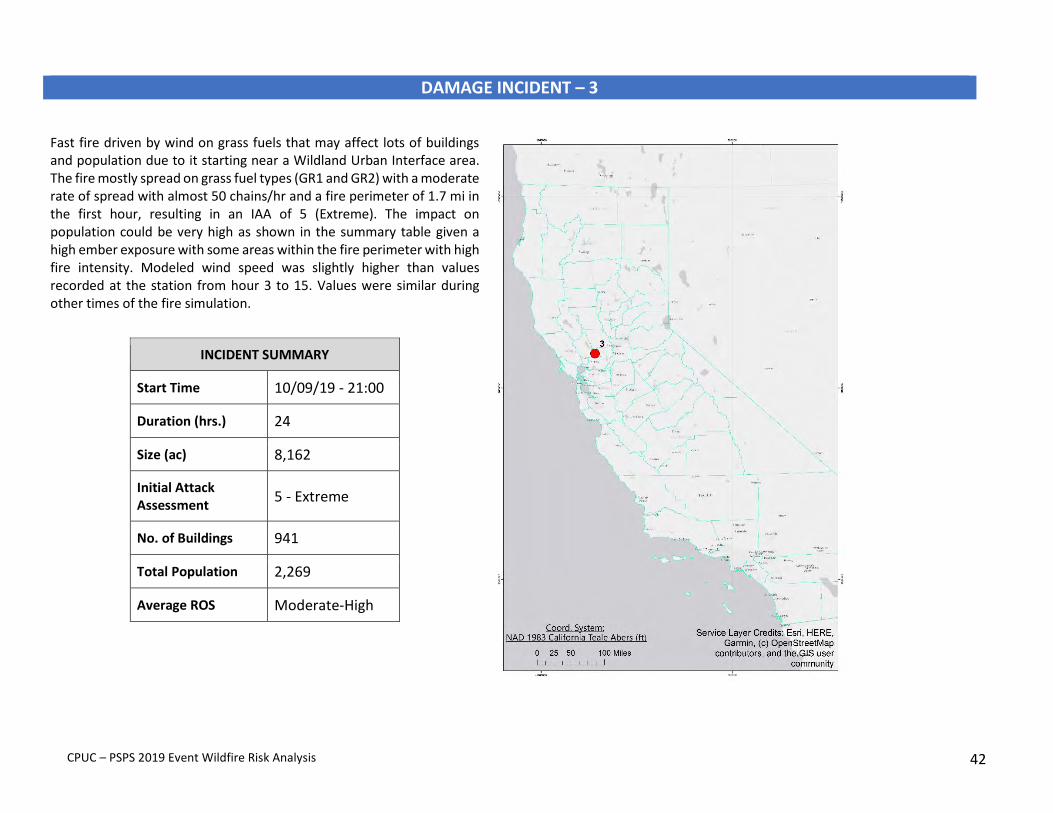
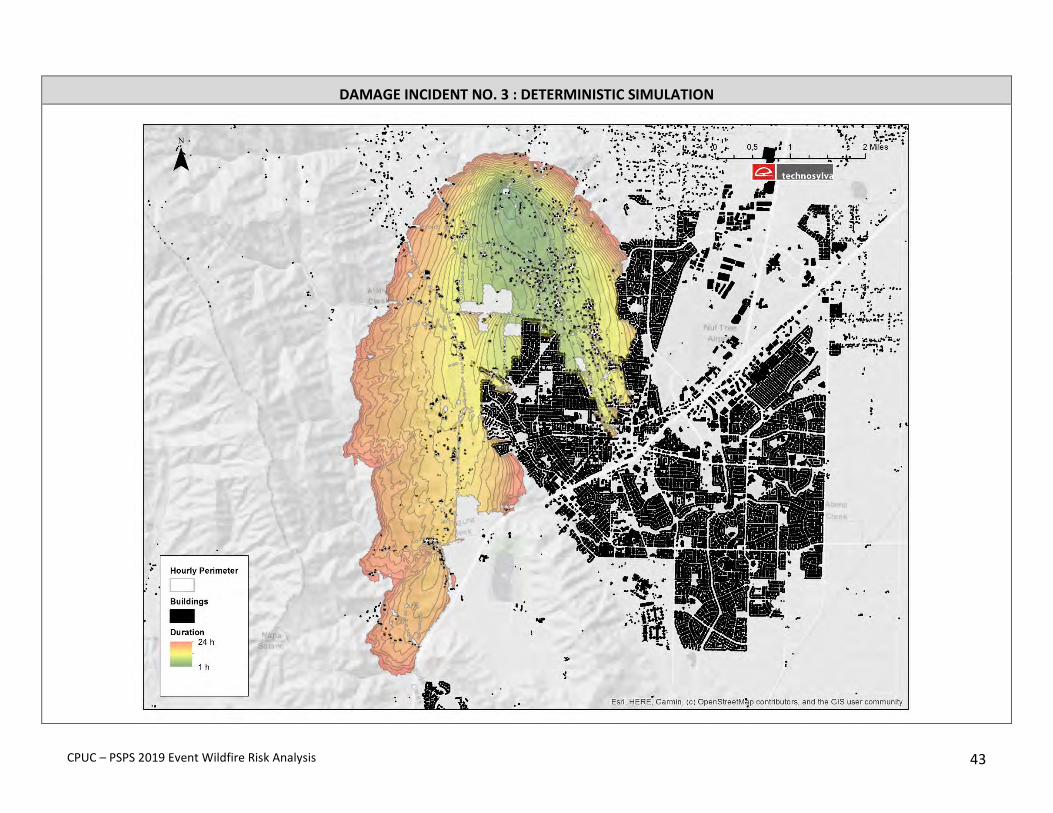
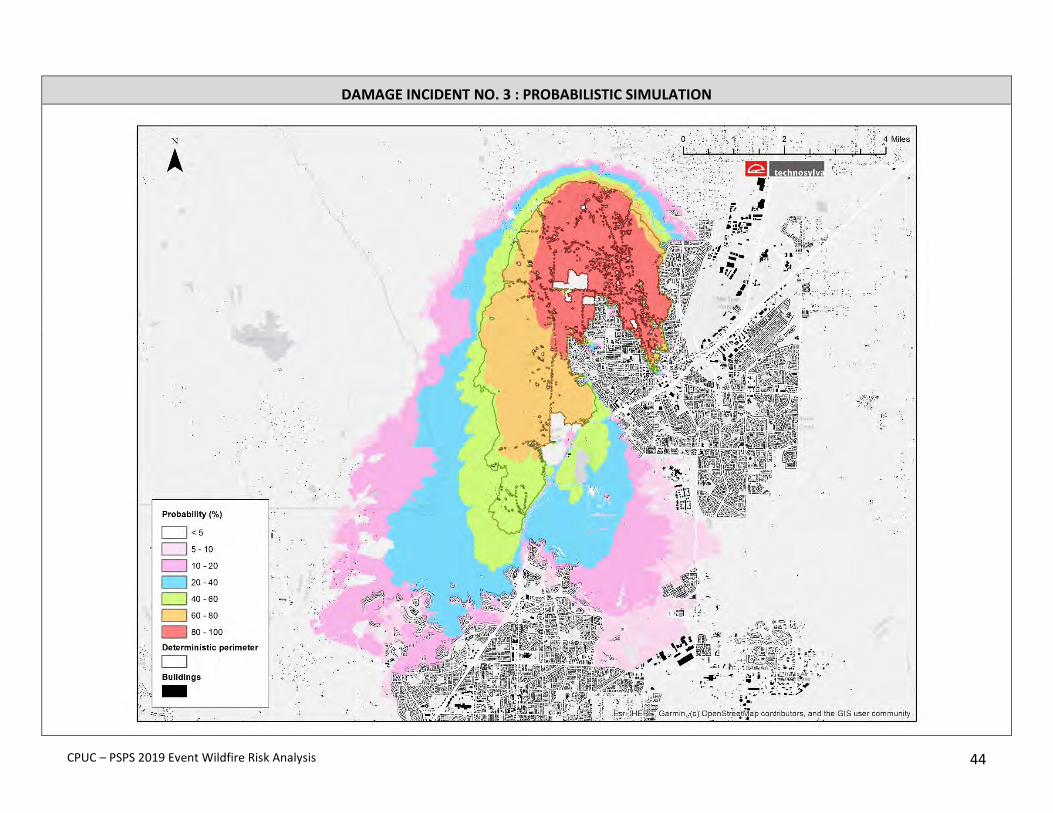
DAMAGE INCIDENT – 3
Fast fire driven by wind on grass fuels that may affect lots of buildings and population due to it starting near a Wildland Urban Interface area. The fire mostly spread on grass fuel types (GR1 and GR2) with a moderate rate of spread with almost 50 chains/hr and a fire perimeter of 1.7 mi in the first hour, resulting in an IAA of 5 (Extreme). The impact on population could be very high as shown in the summary table given a high ember exposure with some areas within the fire perimeter with high fire intensity. Modeled wind speed was slightly higher than values recorded at the station from hour 3 to 15. Values were similar during other times of the fire simulation.
INCIDENT SUMMARY
Start Time 10/09/19 - 21:00
Duration (hrs.) 24
Size (ac) 8,162
Initial Attack Assessment 5 - Extreme
No. of Buildings 941
Total Population 2,269
Average ROS Moderate-High
CPUC – PSPS 2019 Event Wildfire Risk Analysis 43
DAMAGE INCIDENT NO. 3 : DETERMINISTIC SIMULATION
CPUC – PSPS 2019 Event Wildfire Risk Analysis 44
DAMAGE INCIDENT NO. 3 : PROBABILISTIC SIMULATION

CPUC – PSPS 2019 Event Wildfire Risk Analysis 45
DAMAGE INCIDENT NO. 3 FIRE BEHAVIOR WEATHER
Nearest Station: Cantelow Road
Station ID – PG431 Weather station (Wx) elevation - 618 ft Fire ignition point (IP) elevation - 433 ft Distance between Wx and IP – 1.84 mi
CPUC – PSPS 2019 Event Wildfire Risk Analysis 46
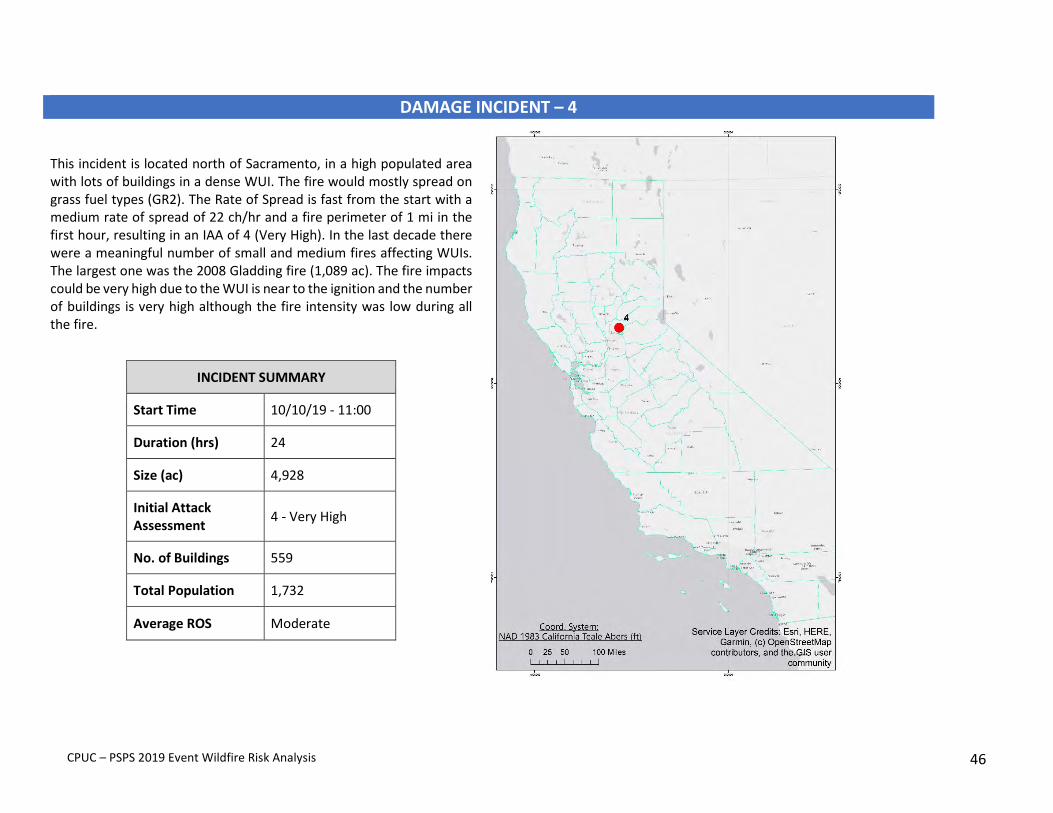
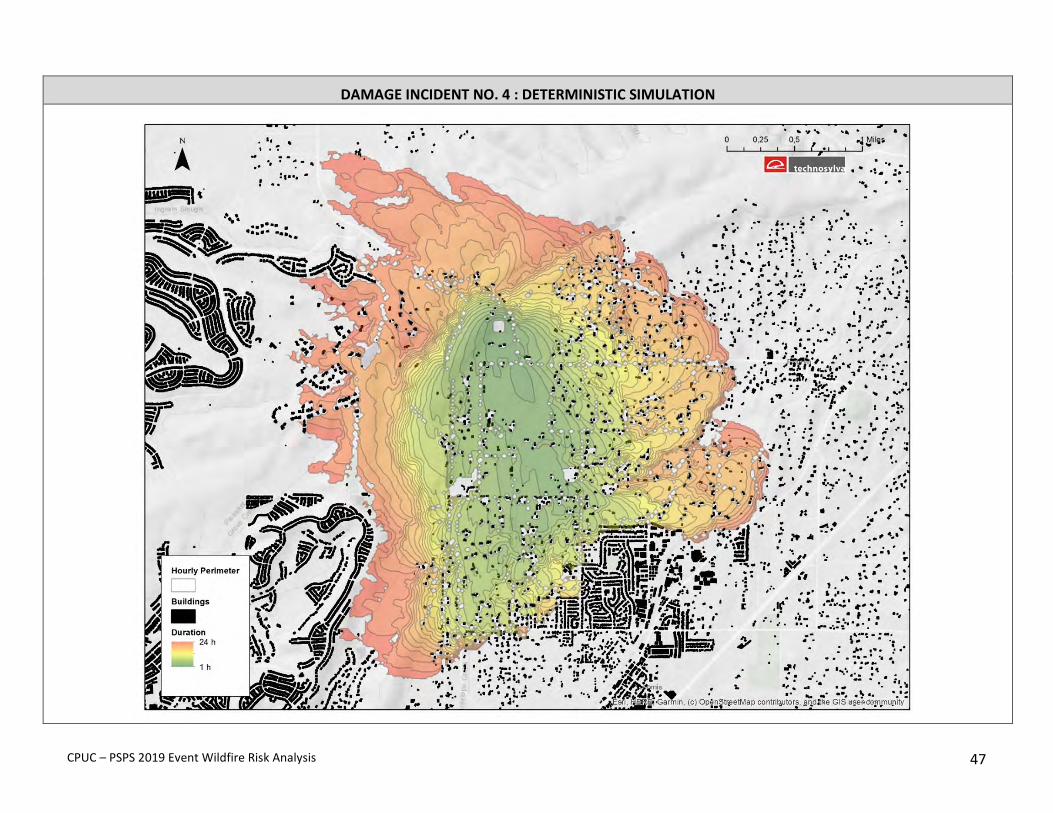
DAMAGE INCIDENT – 4
This incident is located north of Sacramento, in a high populated area with lots of buildings in a dense WUI. The fire would mostly spread on grass fuel types (GR2). The Rate of Spread is fast from the start with a medium rate of spread of 22 ch/hr and a fire perimeter of 1 mi in the first hour, resulting in an IAA of 4 (Very High). In the last decade there were a meaningful number of small and medium fires affecting WUIs. The largest one was the 2008 Gladding fire (1,089 ac). The fire impacts could be very high due to the WUI is near to the ignition and the number of buildings is very high although the fire intensity was low during all the fire.
INCIDENT SUMMARY
Start Time 10/10/19 - 11:00
Duration (hrs) 24
Size (ac) 4,928
Initial Attack Assessment 4 - Very High
No. of Buildings 559
Total Population 1,732
Average ROS Moderate
CPUC – PSPS 2019 Event Wildfire Risk Analysis 47
DAMAGE INCIDENT NO. 4 : DETERMINISTIC SIMULATION
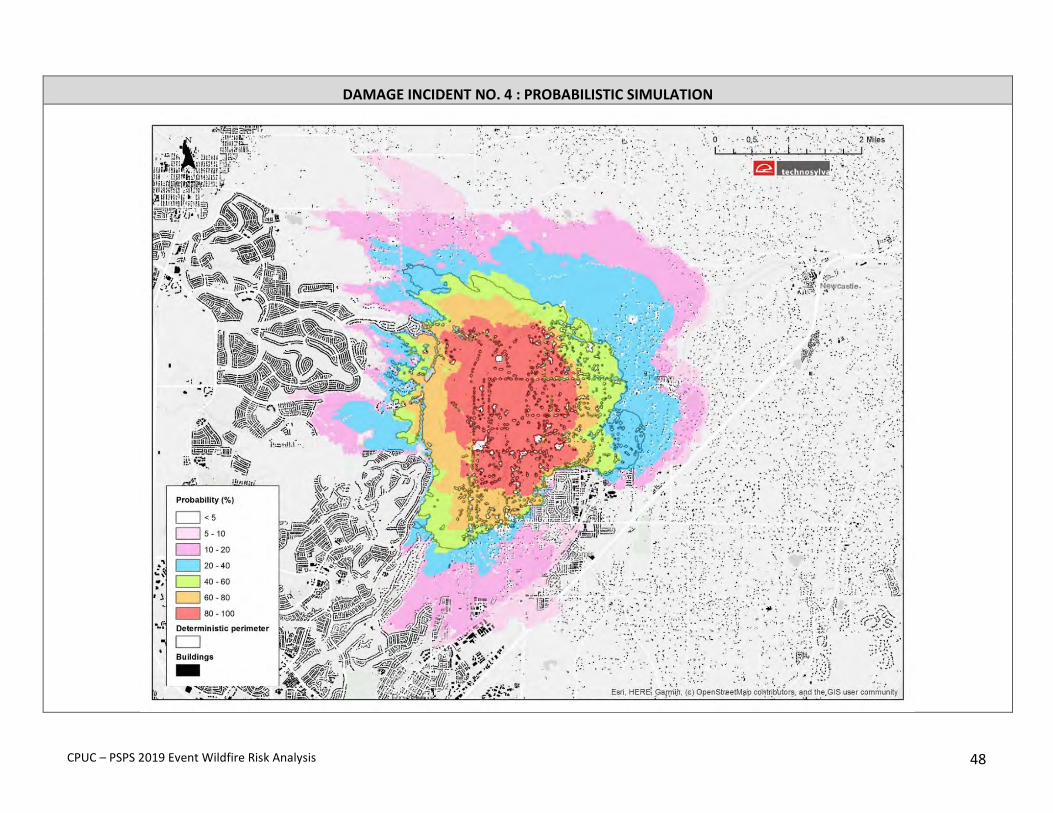
CPUC – PSPS 2019 Event Wildfire Risk Analysis 48
DAMAGE INCIDENT NO. 4 : PROBABILISTIC SIMULATION

CPUC – PSPS 2019 Event Wildfire Risk Analysis 49
DAMAGE INCIDENT NO. 4 FIRE BEHAVIOR WEATHER
Nearest Station: Gallagher Road
Station ID - PG366 Weather station (Wx) elevation - 1436 ft
Fire ignition point (IP) elevation - 518 ft Distance between Wx and IP - 9.43 mi
CPUC – PSPS 2019 Event Wildfire Risk Analysis 50
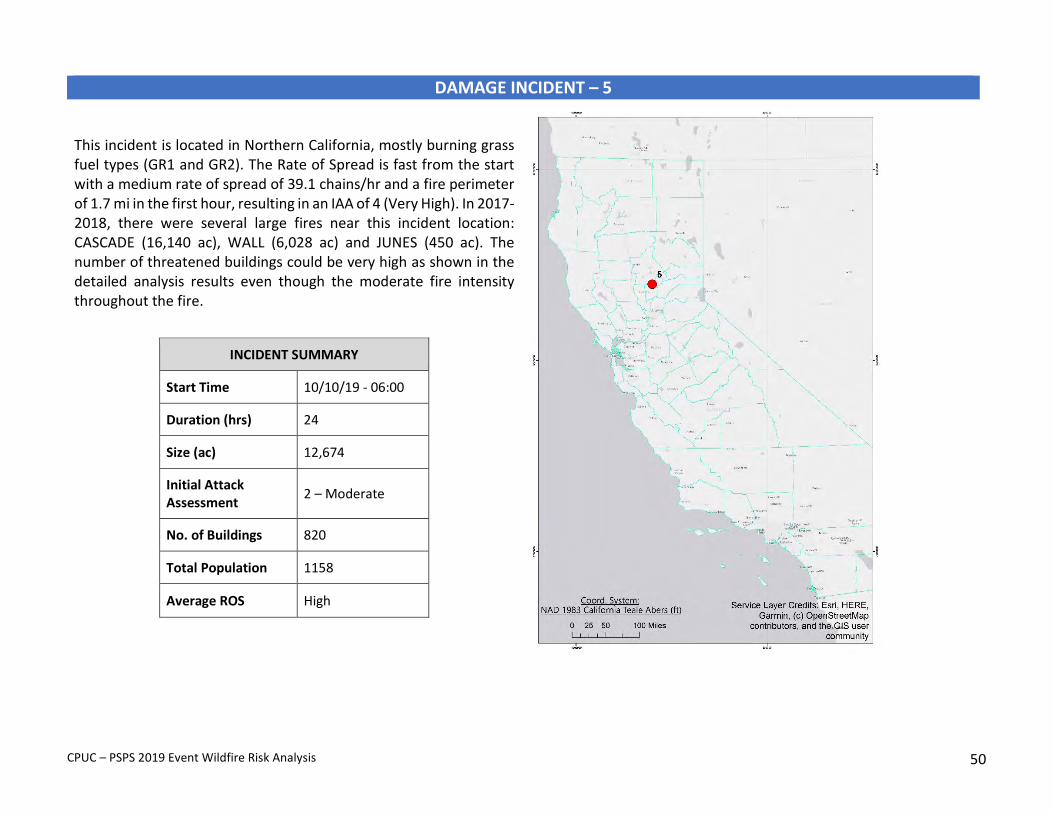
DAMAGE INCIDENT – 5
This incident is located in Northern California, mostly burning grass fuel types (GR1 and GR2). The Rate of Spread is fast from the start with a medium rate of spread of 39.1 chains/hr and a fire perimeter of 1.7 mi in the first hour, resulting in an IAA of 4 (Very High). In 2017-2018, there were several large fires near this incident location: CASCADE (16,140 ac), WALL (6,028 ac) and JUNES (450 ac). The number of threatened buildings could be very high as shown in the detailed analysis results even though the moderate fire intensity throughout the fire.
INCIDENT SUMMARY
Start Time 10/10/19 - 06:00
Duration (hrs) 24
Size (ac) 12,674
Initial Attack Assessment 2 – Moderate
No. of Buildings 820
Total Population 1158
Average ROS High

CPUC – PSPS 2019 Event Wildfire Risk Analysis 51
DAMAGE INCIDENT NO. 5 : DETERMINISTIC SIMULATION
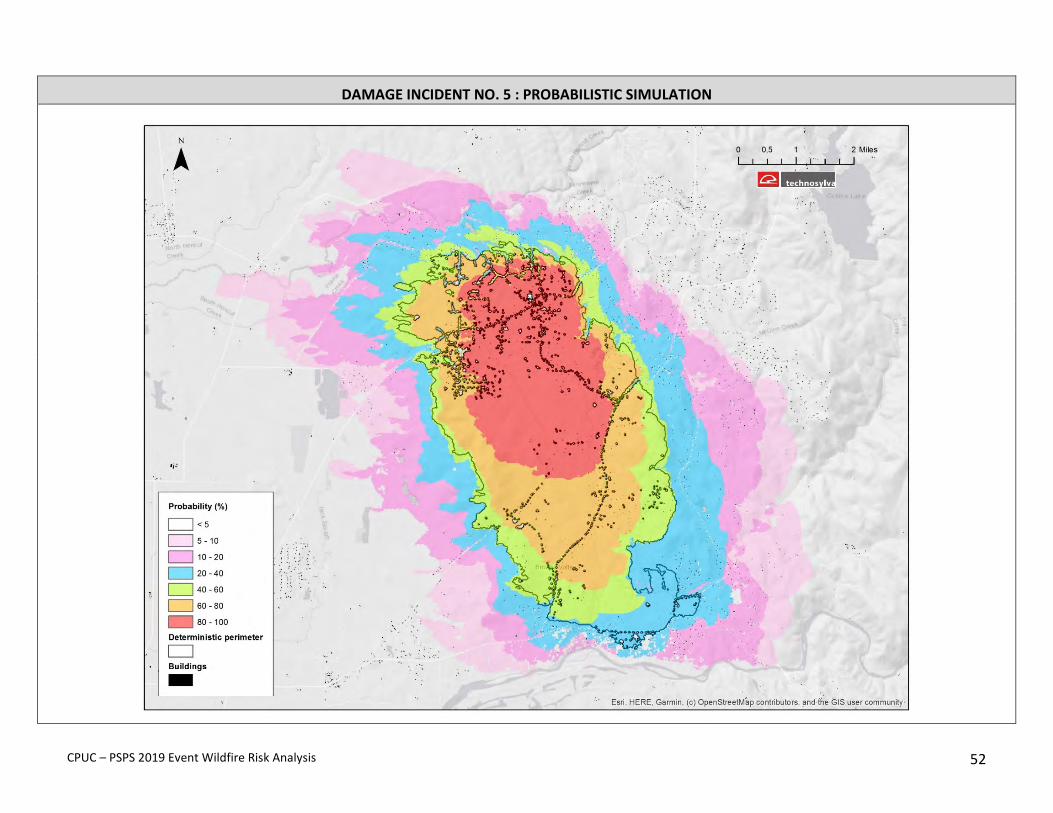
CPUC – PSPS 2019 Event Wildfire Risk Analysis 52
DAMAGE INCIDENT NO. 5 : PROBABILISTIC SIMULATION
CPUC – PSPS 2019 Event Wildfire Risk Analysis 53
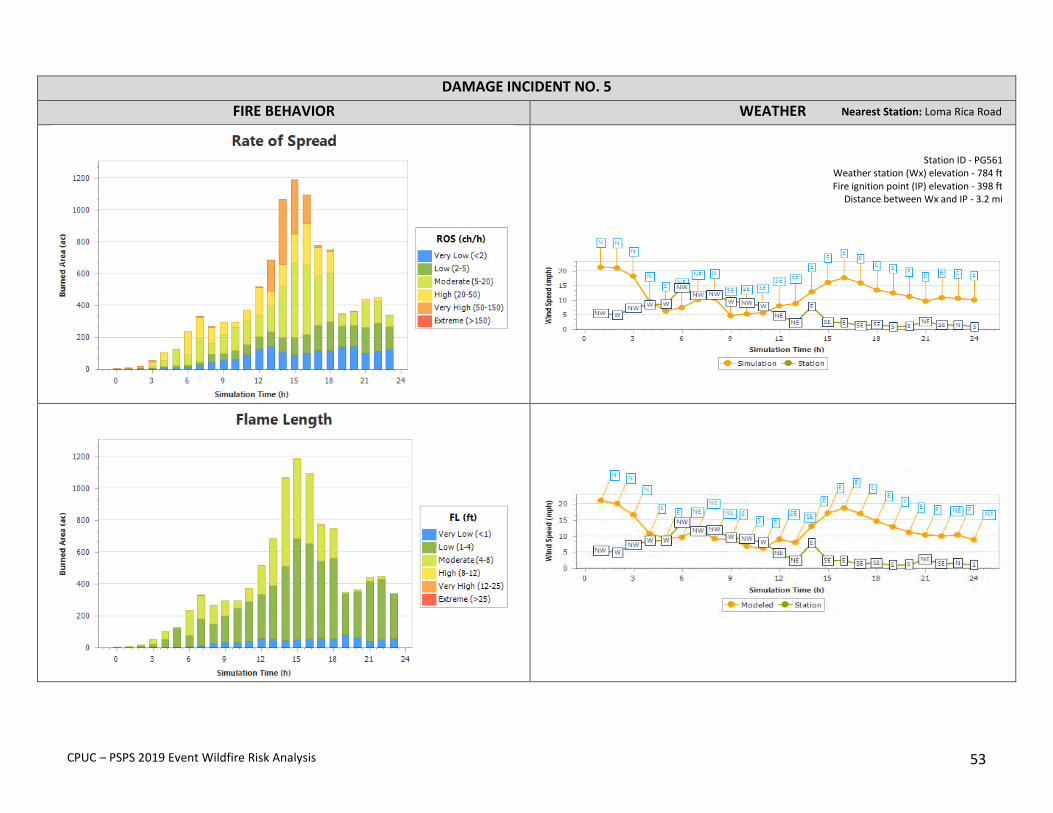
DAMAGE INCIDENT NO. 5 FIRE BEHAVIOR WEATHER
Nearest Station: Loma Rica Road
Station ID - PG561 Weather station (Wx) elevation - 784 ft Fire ignition point (IP) elevation - 398 ft
Distance between Wx and IP - 3.2 mi
CPUC – PSPS 2019 Event Wildfire Risk Analysis 54
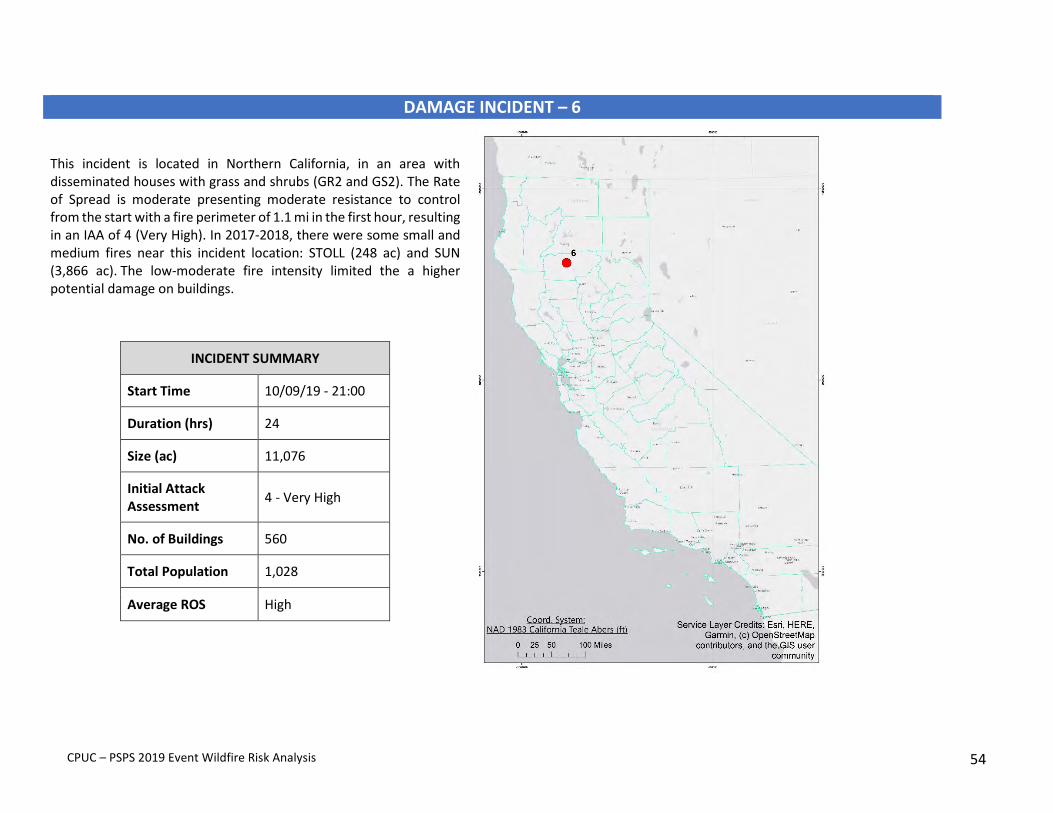
DAMAGE INCIDENT – 6
This incident is located in Northern California, in an area with disseminated houses with grass and shrubs (GR2 and GS2). The Rate of Spread is moderate presenting moderate resistance to control from the start with a fire perimeter of 1.1 mi in the first hour, resulting in an IAA of 4 (Very High). In 2017-2018, there were some small and medium fires near this incident location: STOLL (248 ac) and SUN (3,866 ac). The low-moderate fire intensity limited the a higher potential damage on buildings.
INCIDENT SUMMARY
Start Time 10/09/19 - 21:00
Duration (hrs) 24
Size (ac) 11,076
Initial Attack Assessment 4 - Very High
No. of Buildings 560
Total Population 1,028
Average ROS High

CPUC – PSPS 2019 Event Wildfire Risk Analysis 55
DAMAGE INCIDENT NO. 6 : DETERMINISTIC SIMULATION
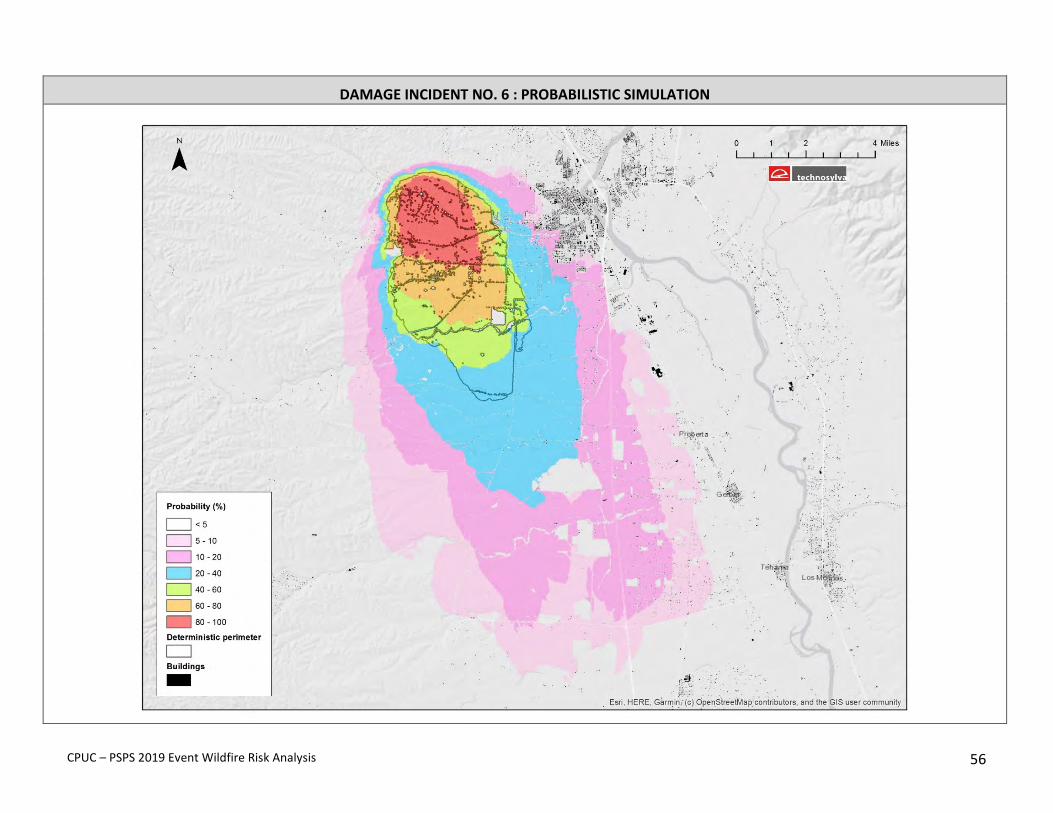
CPUC – PSPS 2019 Event Wildfire Risk Analysis 56
DAMAGE INCIDENT NO. 6 : PROBABILISTIC SIMULATION
CPUC – PSPS 2019 Event Wildfire Risk Analysis 57
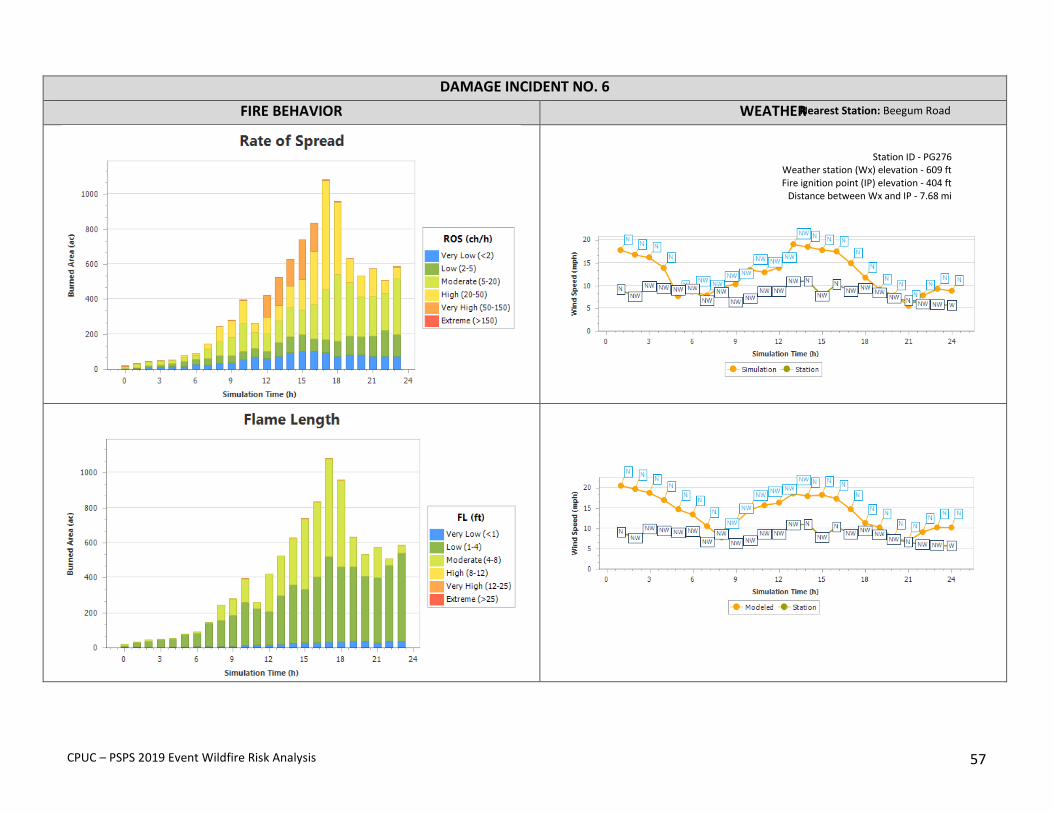
DAMAGE INCIDENT NO. 6 FIRE BEHAVIOR WEATHER
Nearest Station: Beegum Road
Station ID - PG276 Weather station (Wx) elevation - 609 ft Fire ignition point (IP) elevation - 404 ft
Distance between Wx and IP - 7.68 mi
CPUC – PSPS 2019 Event Wildfire Risk Analysis 58
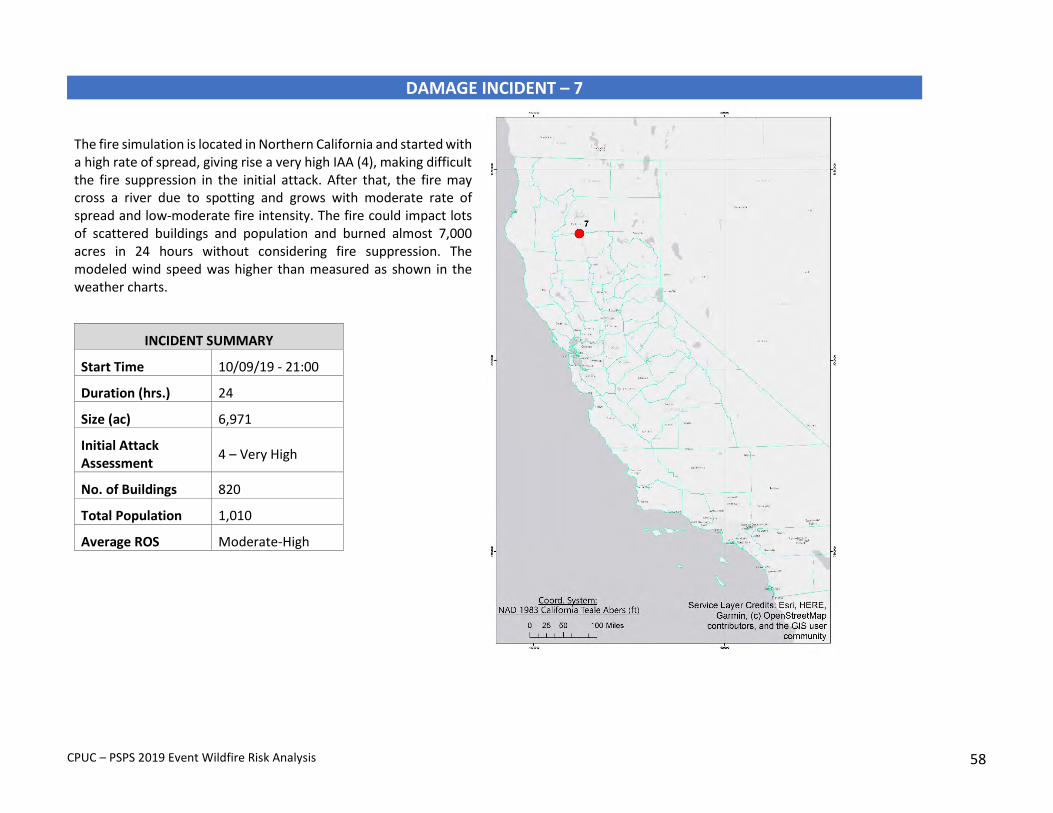
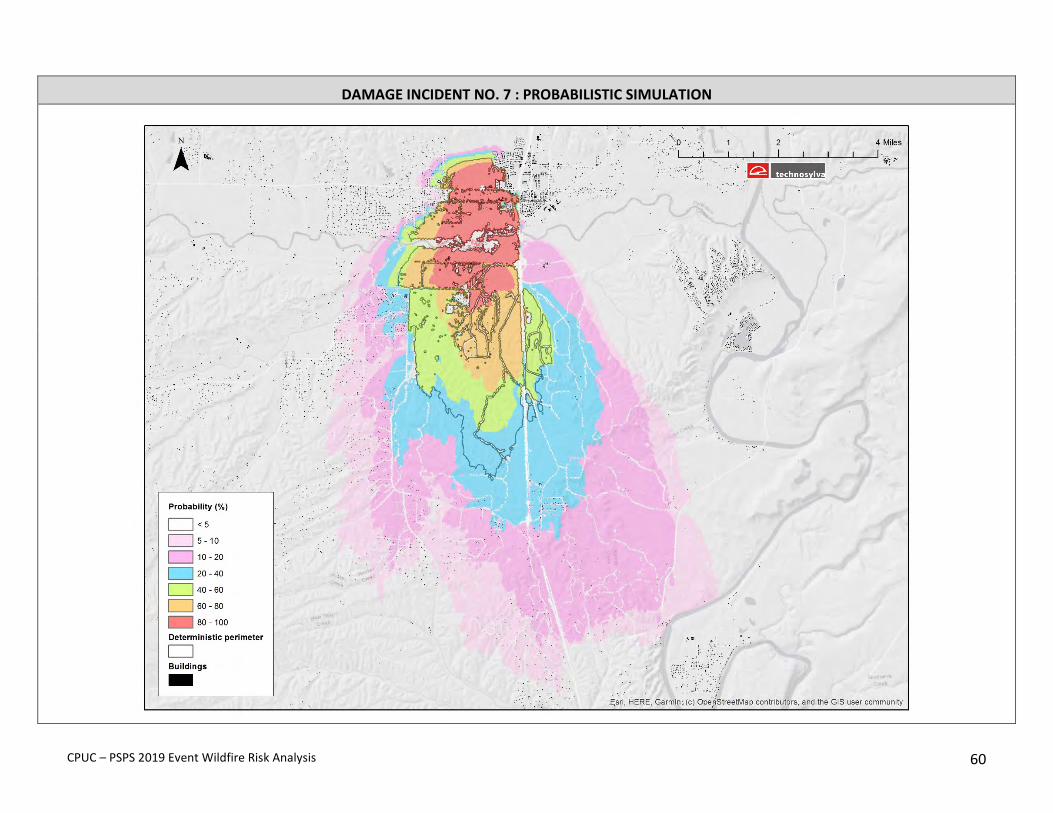
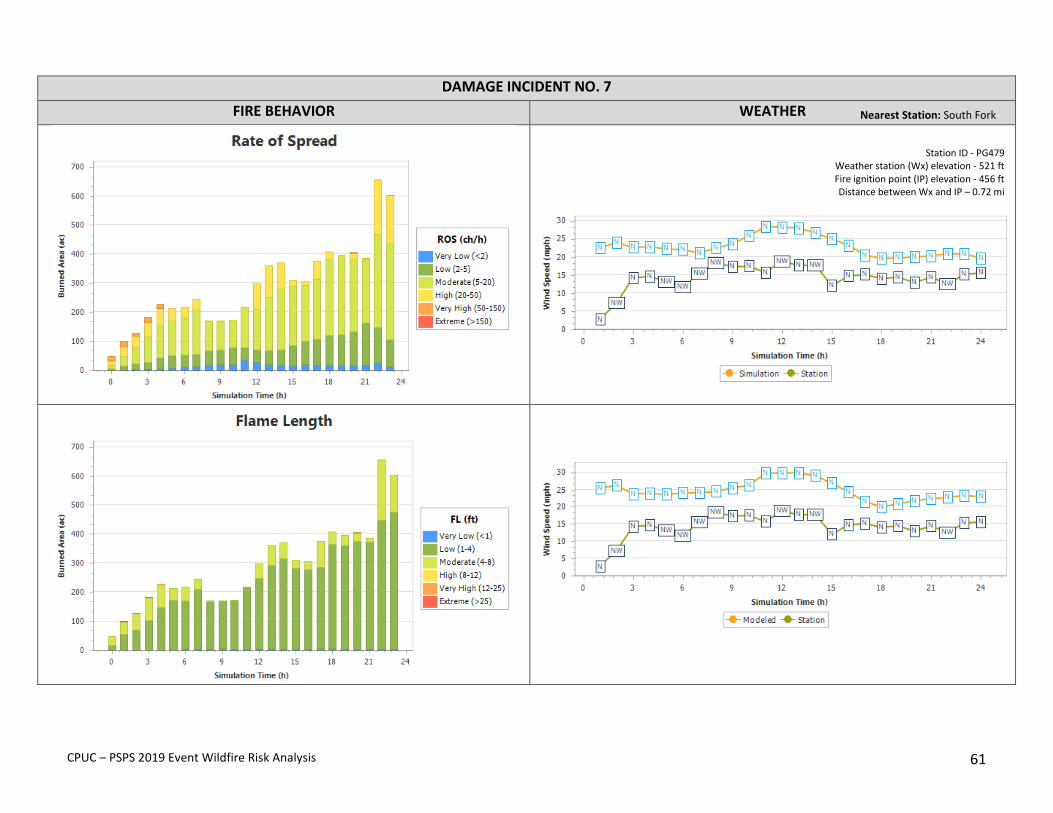
DAMAGE INCIDENT – 7
The fire simulation is located in Northern California and started with a high rate of spread, giving rise a very high IAA (4), making difficult the fire suppression in the initial attack. After that, the fire may cross a river due to spotting and grows with moderate rate of spread and low-moderate fire intensity. The fire could impact lots of scattered buildings and population and burned almost 7,000 acres in 24 hours without considering fire suppression. The modeled wind speed was higher than measured as shown in the weather charts.
INCIDENT SUMMARY
Start Time 10/09/19 - 21:00
Duration (hrs.) 24
Size (ac) 6,971
Initial Attack Assessment 4 – Very High
No. of Buildings 820
Total Population 1,010
Average ROS Moderate-High
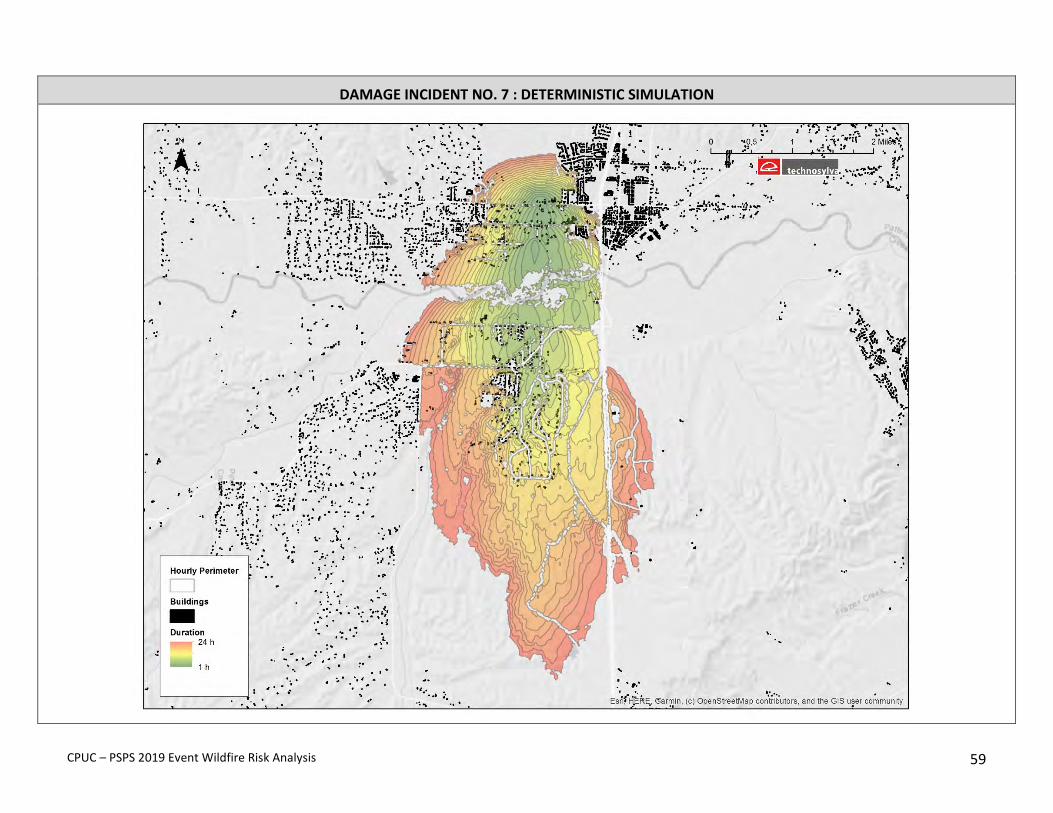
CPUC – PSPS 2019 Event Wildfire Risk Analysis 59
DAMAGE INCIDENT NO. 7 : DETERMINISTIC SIMULATION
CPUC – PSPS 2019 Event Wildfire Risk Analysis 60
DAMAGE INCIDENT NO. 7 : PROBABILISTIC SIMULATION
CPUC – PSPS 2019 Event Wildfire Risk Analysis 61
DAMAGE INCIDENT NO. 7 FIRE BEHAVIOR WEATHER
Nearest Station: South Fork
Station ID - PG479 Weather station (Wx) elevation - 521 ft Fire ignition point (IP) elevation - 456 ft Distance between Wx and IP – 0.72 mi
CPUC – PSPS 2019 Event Wildfire Risk Analysis 62
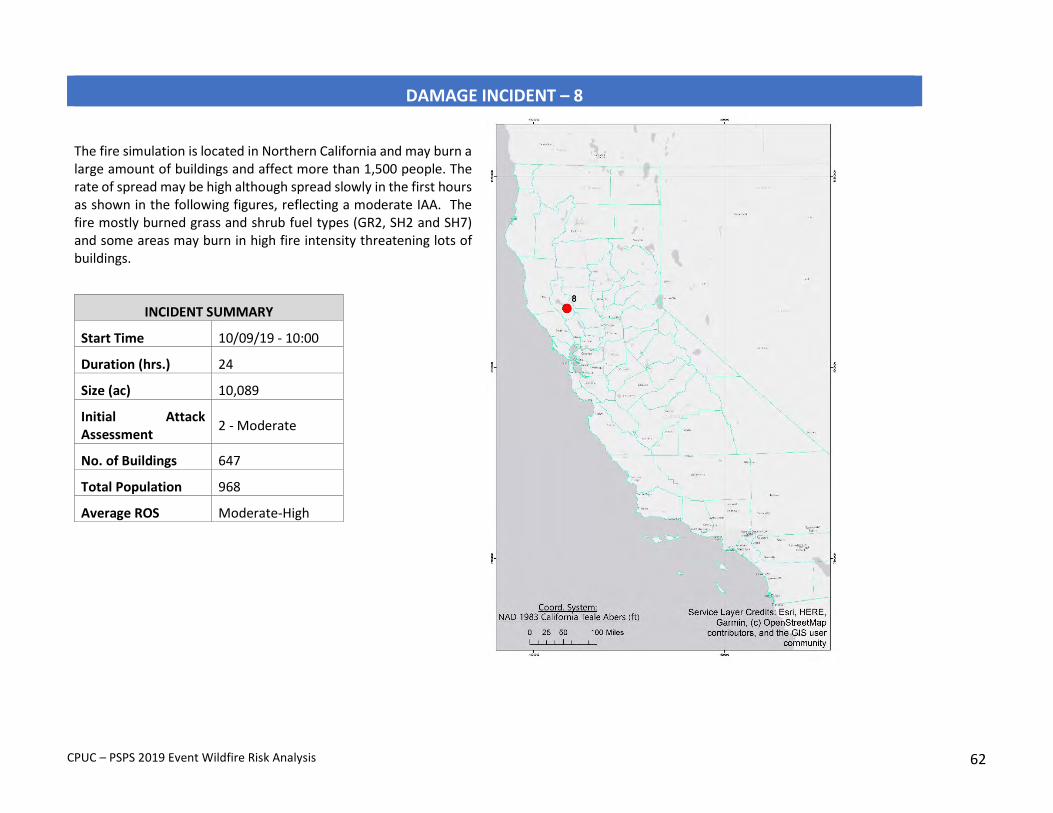
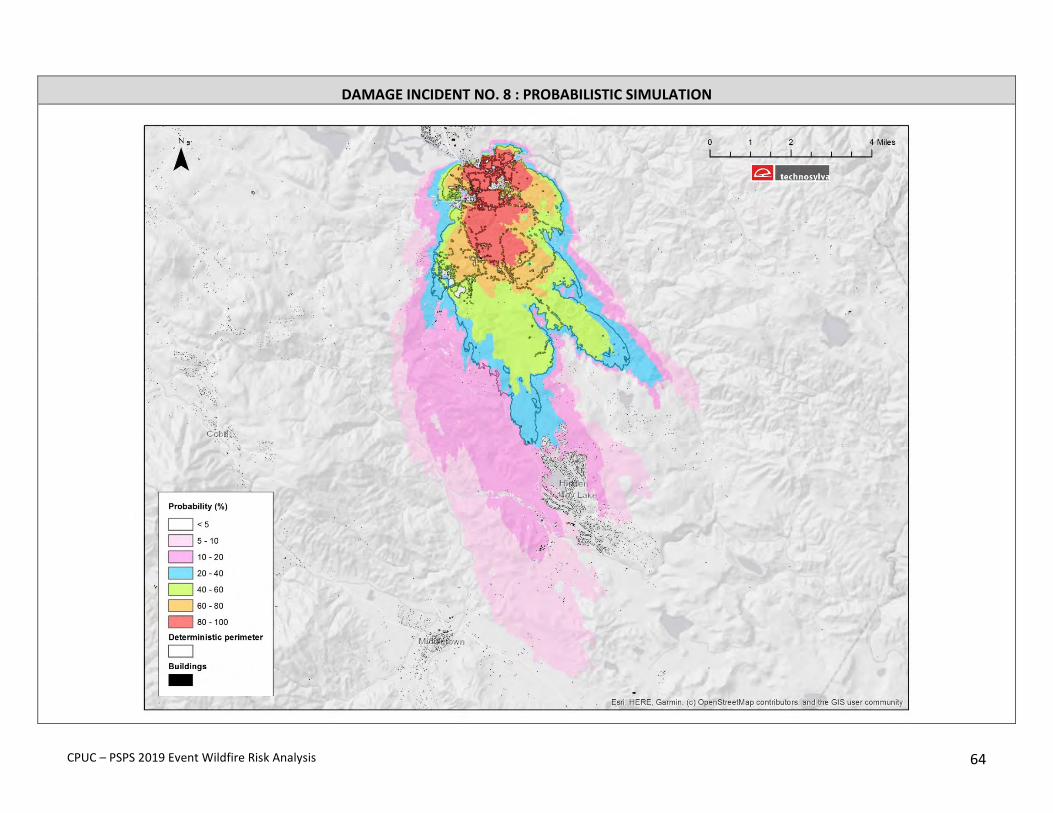
DAMAGE INCIDENT – 8
The fire simulation is located in Northern California and may burn a large amount of buildings and affect more than 1,500 people. The rate of spread may be high although spread slowly in the first hours as shown in the following figures, reflecting a moderate IAA. The fire mostly burned grass and shrub fuel types (GR2, SH2 and SH7) and some areas may burn in high fire intensity threatening lots of buildings.
INCIDENT SUMMARY
Start Time 10/09/19 - 10:00
Duration (hrs.) 24
Size (ac) 10,089
Initial Attack Assessment 2 - Moderate
No. of Buildings 647
Total Population 968
Average ROS Moderate-High
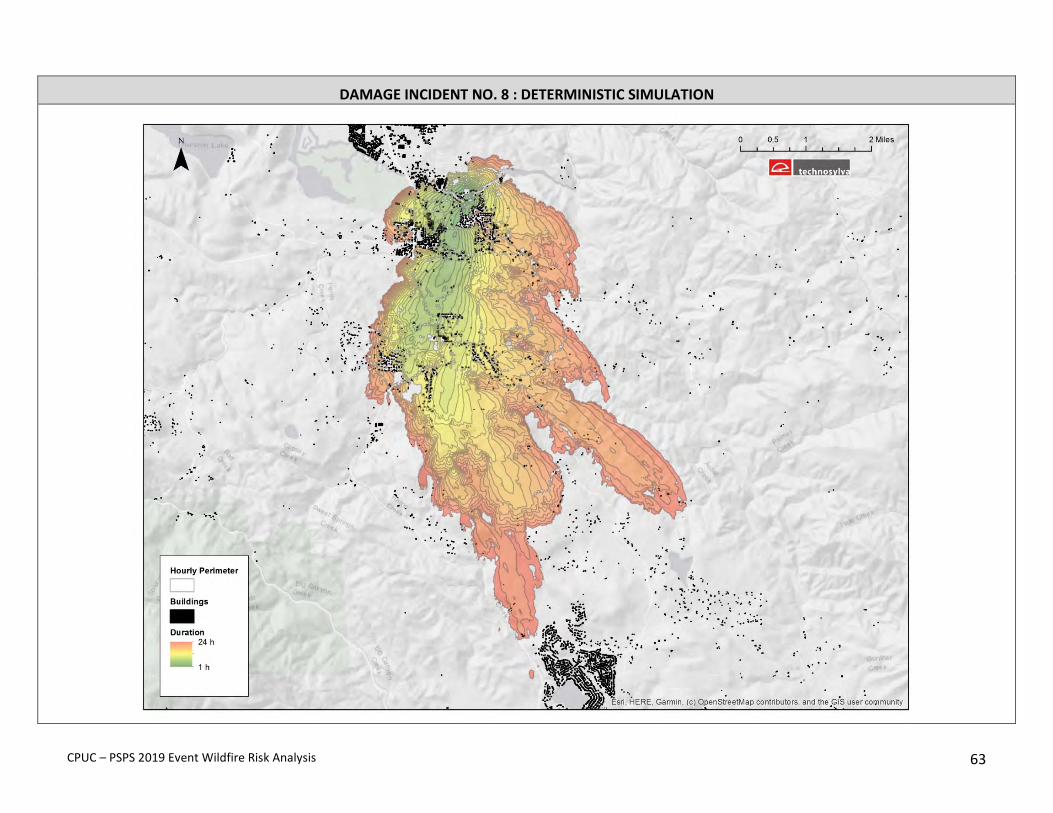
CPUC – PSPS 2019 Event Wildfire Risk Analysis 63
DAMAGE INCIDENT NO. 8 : DETERMINISTIC SIMULATION
CPUC – PSPS 2019 Event Wildfire Risk Analysis 64
DAMAGE INCIDENT NO. 8 : PROBABILISTIC SIMULATION
CPUC – PSPS 2019 Event Wildfire Risk Analysis 65
DAMAGE INCIDENT NO. 8 FIRE BEHAVIOR WEATHER
Nearest Station: Trouble Lane
Station ID - PG097 Weather station (Wx) elevation - 1384 ft Fire ignition point (IP) elevation - 1345 ft
Distance between Wx and IP – 0.17 mi

CPUC – PSPS 2019 Event Wildfire Risk Analysis 66
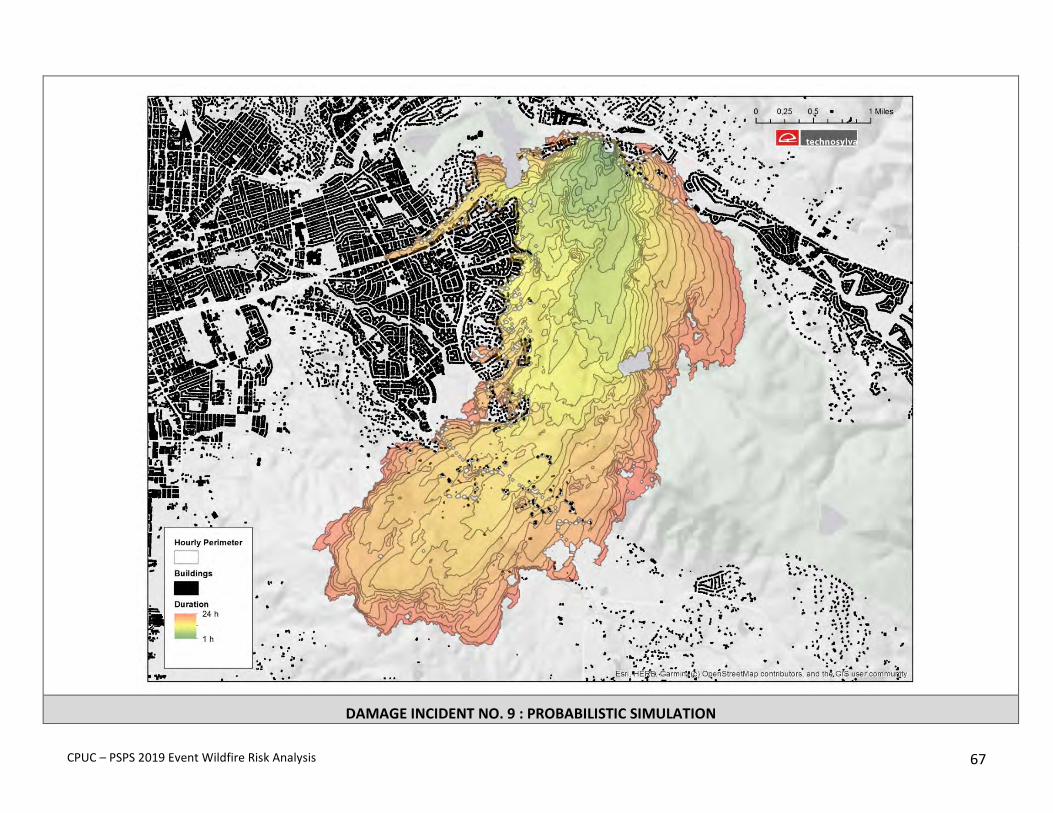
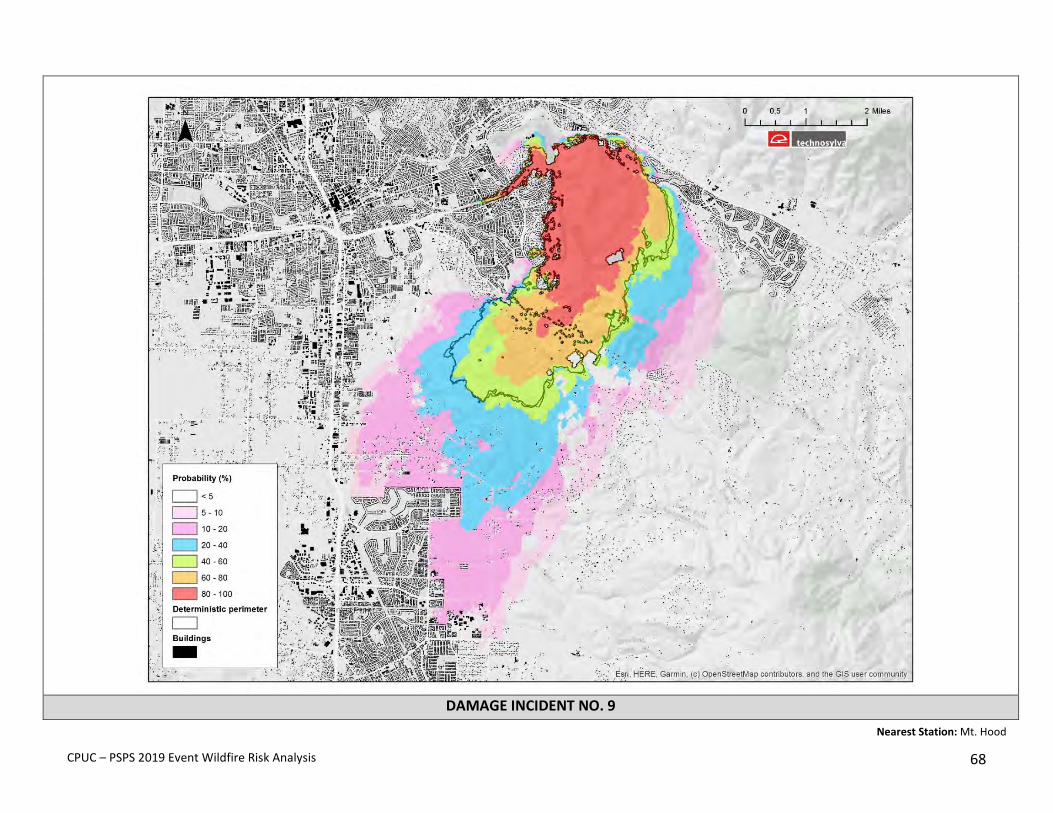
DAMAGE INCIDENT – 9
The fire started burning slowly in the first hours resulting in a low IAA (1). However, the fire may increase the rate of spread significantly in the next hours very high rate of spread in some areas of the fire (50-150 ch/h). The fire started near a Wildland Urban Interface Area and may affect almost 1,000 people.
INCIDENT SUMMARY
Start Time 10/09/19 - 11:00
Duration (hrs) 24
Size (ac) 5,242
Initial Attack Assessment
1 -Low
No. of Buildings 390
Total Population 948
Average ROS Moderate-High
DAMAGE INCIDENT NO. 9 : DETERMINISTIC SIMULATION
CPUC – PSPS 2019 Event Wildfire Risk Analysis 67
DAMAGE INCIDENT NO. 9 : PROBABILISTIC SIMULATION
CPUC – PSPS 2019 Event Wildfire Risk Analysis 68
DAMAGE INCIDENT NO. 9
Nearest Station: Mt. Hood
CPUC – PSPS 2019 Event Wildfire Risk Analysis 69
FIRE BEHAVIOR WEATHER
Station ID - PG162 Weather station (Wx) elevation - 1939 ft
Fire ignition point (IP) elevation - 328 ft Distance between Wx and IP - 5.76 mi

CPUC – PSPS 2019 Event Wildfire Risk Analysis 70
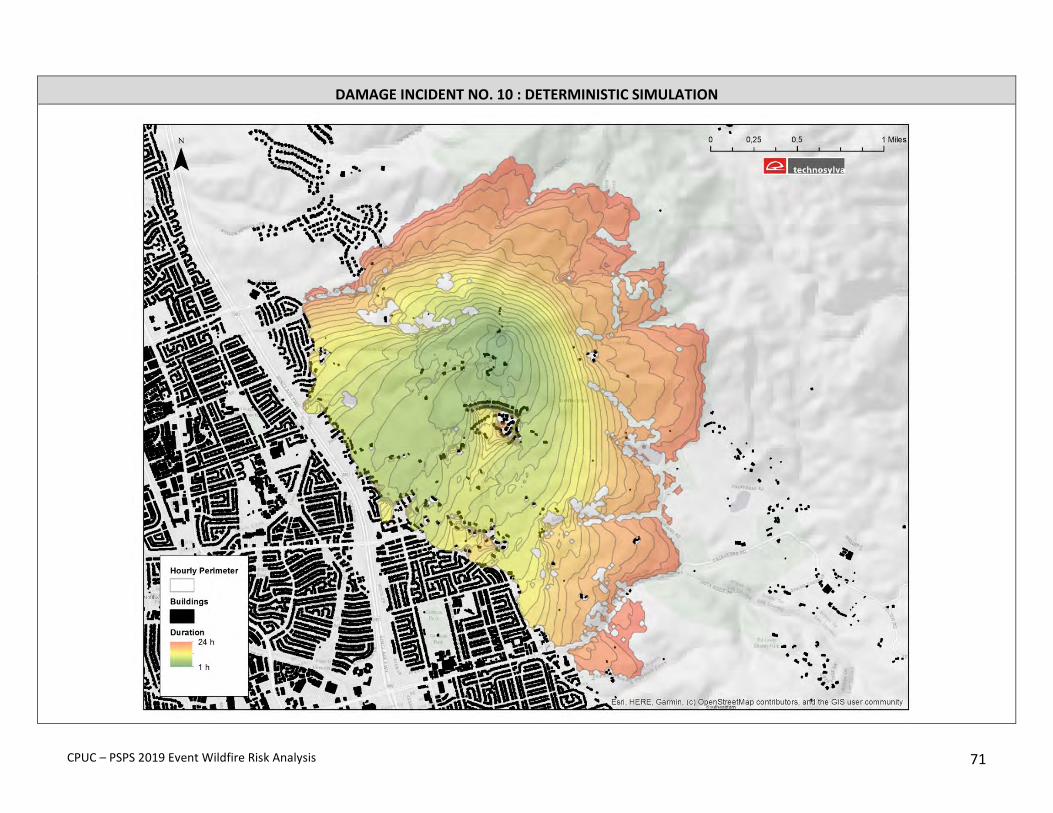
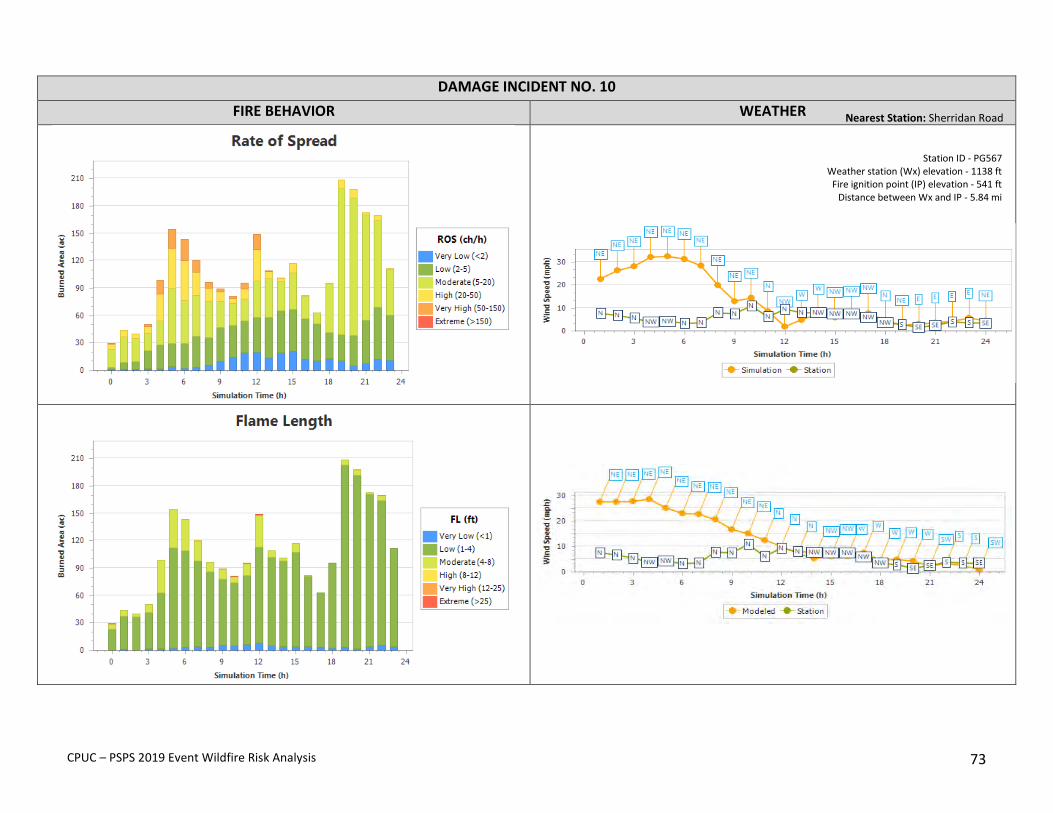
DAMAGE INCIDENT – 10
This incident is located in south of the San Francisco Bay area near San Jose, mostly burning grass fuel types (GR1 and GR2). Fire spreads rapidly presenting moderate resistance to control with a medium rate of spread of 18 chains/hr and a fire perimeter of 0.7 mi in the first hour, resulting in an IAA of 4 (Very High). In 2017-2018, there were two medium fires near this incident location: COUNTY (321 ac) and LARIAT (102 ac). The fire impacts could be very high due to the high amount of buildings near the ignition location although the fire intensity would be generally low.
INCIDENT SUMMARY
Start Time 10/10/19 -03:00
Duration (hrs) 24
Size (ac) 2,686
Initial Attack Assessment 4 - Very High
No. of Buildings 275
Total Population 894
Average ROS Moderate
CPUC – PSPS 2019 Event Wildfire Risk Analysis 71
DAMAGE INCIDENT NO. 10 : DETERMINISTIC SIMULATION
CPUC – PSPS 2019 Event Wildfire Risk Analysis 72
DAMAGE INCIDENT NO. 10 : PROBABILISTIC SIMULATION
CPUC – PSPS 2019 Event Wildfire Risk Analysis 73
DAMAGE INCIDENT NO. 10 FIRE BEHAVIOR WEATHER
Nearest Station: Sherridan Road
Station ID - PG567 Weather station (Wx) elevation - 1138 ft
Fire ignition point (IP) elevation - 541 ft Distance between Wx and IP - 5.84 mi
CPUC – PSPS 2019 Event Wildfire Risk Analysis 74
APPENDIX C: HISTORICAL FIRE SUMMARY
A review of historical fires is provided.
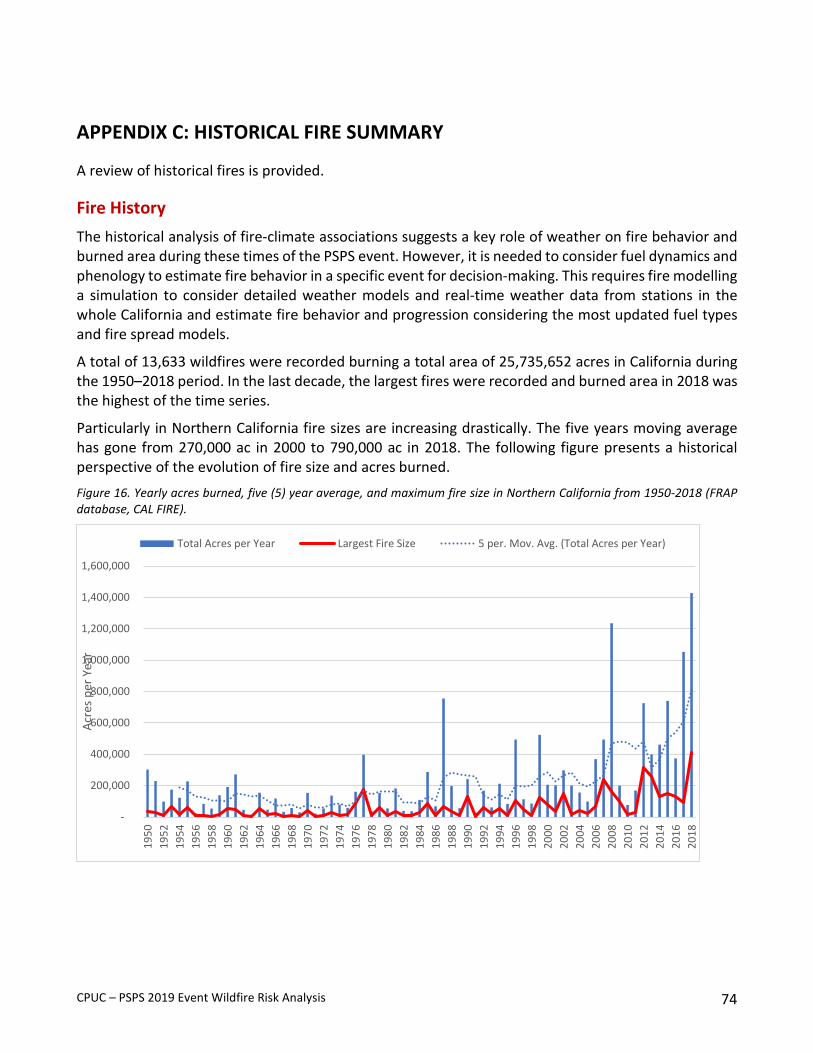
Fire History The historical analysis of fire-climate associations suggests a key role of weather on fire behavior and burned area during these times of the PSPS event. However, it is needed to consider fuel dynamics and phenology to estimate fire behavior in a specific event for decision-making. This requires fire modelling a simulation to consider detailed weather models and real-time weather data from stations in the whole California and estimate fire behavior and progression considering the most updated fuel types and fire spread models.
A total of 13,633 wildfires were recorded burning a total area of 25,735,652 acres in California during the 1950–2018 period. In the last decade, the largest fires were recorded and burned area in 2018 was the highest of the time series.
Particularly in Northern California fire sizes are increasing drastically. The five years moving average has gone from 270,000 ac in 2000 to 790,000 ac in 2018. The following figure presents a historical perspective of the evolution of fire size and acres burned. Figure 16. Yearly acres burned, five (5) year average, and maximum fire size in Northern California from 1950-2018 (FRAP database, CAL FIRE).
-
200,000
400,000
600,000
800,000
1,000,000
1,200,000
1,400,000
1,600,000
1950
1952
1954
1956
1958
1960
1962
1964
1966
1968
1970
1972
1974
1976
1978
1980
1982
1984
1986
1988
1990
1992
1994
1996
1998
2000
2002
2004
2006
2008
2010
2012
2014
2016
2018
Acre
s per
Yea
r
Total Acres per Year Largest Fire Size 5 per. Mov. Avg. (Total Acres per Year)
CPUC – PSPS 2019 Event Wildfire Risk Analysis 75
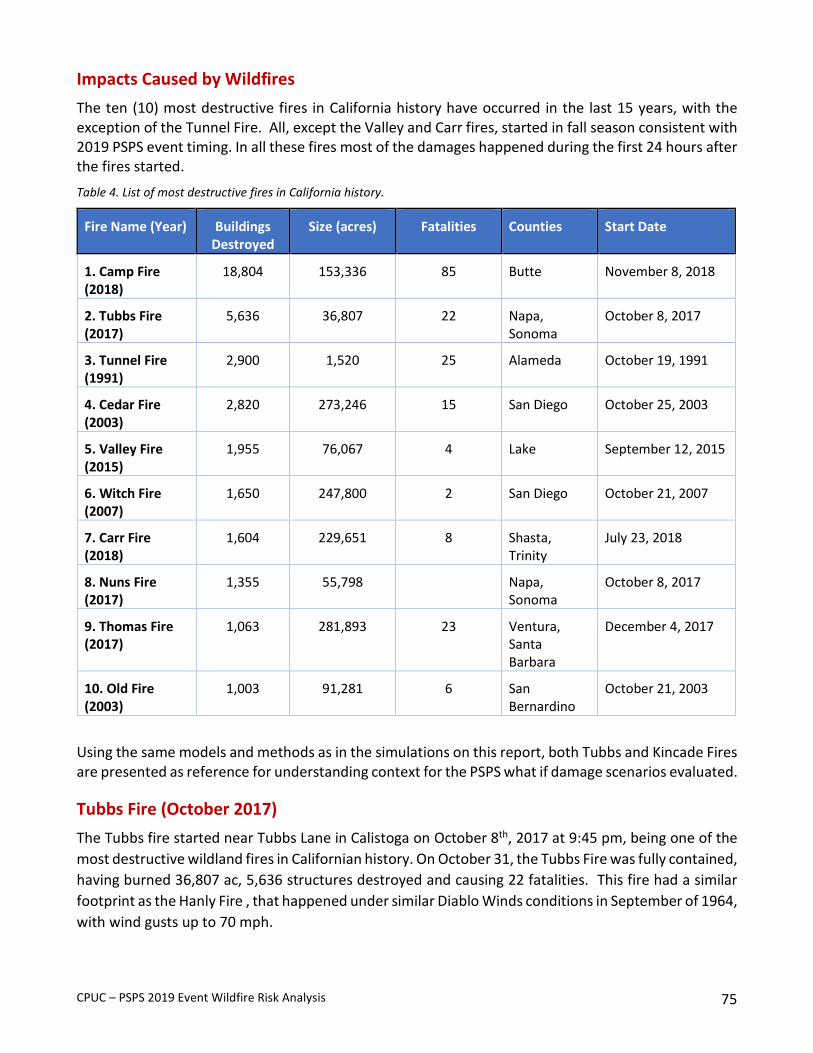
Impacts Caused by Wildfires The ten (10) most destructive fires in California history have occurred in the last 15 years, with the exception of the Tunnel Fire. All, except the Valley and Carr fires, started in fall season consistent with 2019 PSPS event timing. In all these fires most of the damages happened during the first 24 hours after the fires started. Table 4. List of most destructive fires in California history.
Fire Name (Year) Buildings Destroyed
Size (acres) Fatalities Counties Start Date
1. Camp Fire (2018)
18,804 153,336 85 Butte November 8, 2018
2. Tubbs Fire (2017)
5,636 36,807 22 Napa, Sonoma
October 8, 2017
3. Tunnel Fire (1991)
2,900 1,520 25 Alameda October 19, 1991
4. Cedar Fire (2003)
2,820 273,246 15 San Diego October 25, 2003
5. Valley Fire (2015)
1,955 76,067 4 Lake September 12, 2015
6. Witch Fire (2007)
1,650 247,800 2 San Diego October 21, 2007
7. Carr Fire (2018)
1,604 229,651 8 Shasta, Trinity
July 23, 2018
8. Nuns Fire (2017)
1,355 55,798 Napa, Sonoma
October 8, 2017
9. Thomas Fire (2017)
1,063 281,893 23 Ventura, Santa Barbara
December 4, 2017
10. Old Fire (2003)
1,003 91,281 6 San Bernardino
October 21, 2003
Using the same models and methods as in the simulations on this report, both Tubbs and Kincade Fires are presented as reference for understanding context for the PSPS what if damage scenarios evaluated.
Tubbs Fire (October 2017) The Tubbs fire started near Tubbs Lane in Calistoga on October 8th, 2017 at 9:45 pm, being one of the most destructive wildland fires in Californian history. On October 31, the Tubbs Fire was fully contained, having burned 36,807 ac, 5,636 structures destroyed and causing 22 fatalities. This fire had a similar footprint as the Hanly Fire , that happened under similar Diablo Winds conditions in September of 1964, with wind gusts up to 70 mph.

CPUC – PSPS 2019 Event Wildfire Risk Analysis 76
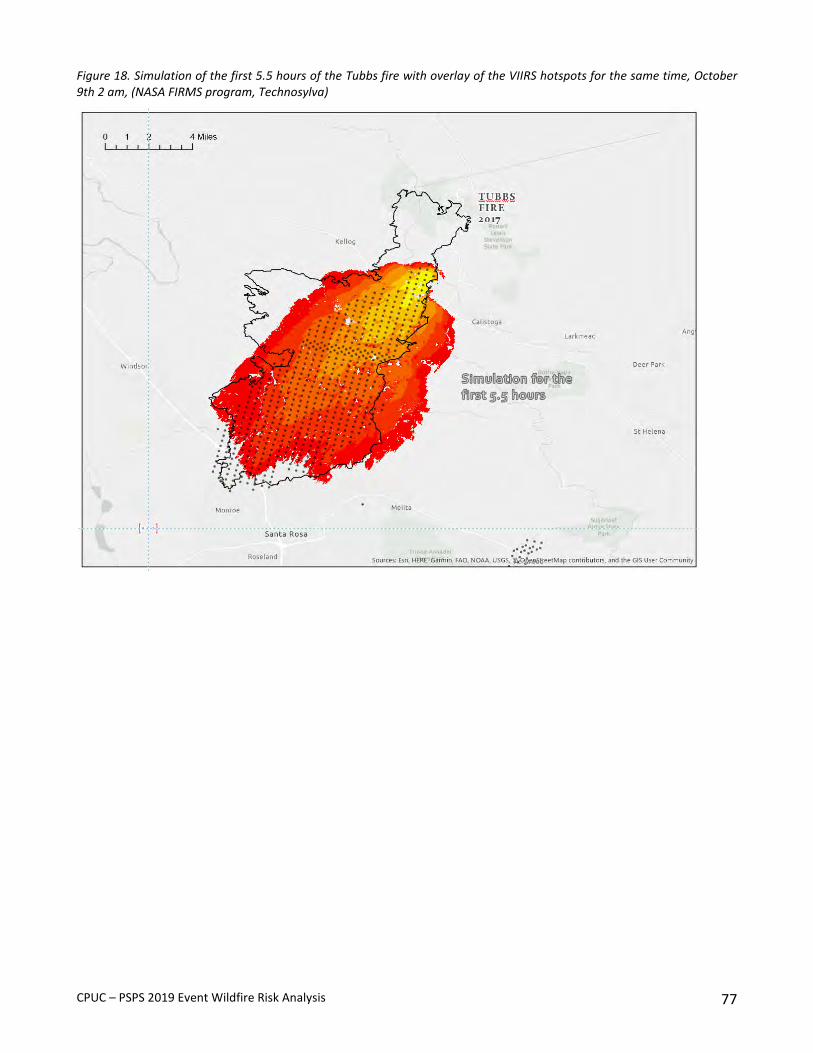
Figure 17. Tubbs (2017) and Hanly (1964) Fires, North East from Santa Rosa (FRAP database; CAL FIRE
The Tubbs fire lasted several days although most of the burned area occurred in the first hours (see Figure 18). The fire spread was simulated during 5.5 hrs from the fire start time up to its impact with the edge of the WUI of Santa Rosa, where the fire started destroying houses and infrastructure. Strong winds from the northeast supported very high rates of fire spread at the beginning of the fire with peak wind gusts of 56 mph. Low fuel moisture also influenced extreme fire behavior with a 1h dead fuel moisture content of 4.4%. The fire did a 11 mile run during those 5.5 hours, and the simulation with Wildfire Analyst shows a similar progression for the same period of time.
CPUC – PSPS 2019 Event Wildfire Risk Analysis 77
Figure 18. Simulation of the first 5.5 hours of the Tubbs fire with overlay of the VIIRS hotspots for the same time, October 9th 2 am, (NASA FIRMS program, Technosylva)
CPUC – PSPS 2019 Event Wildfire Risk Analysis 78
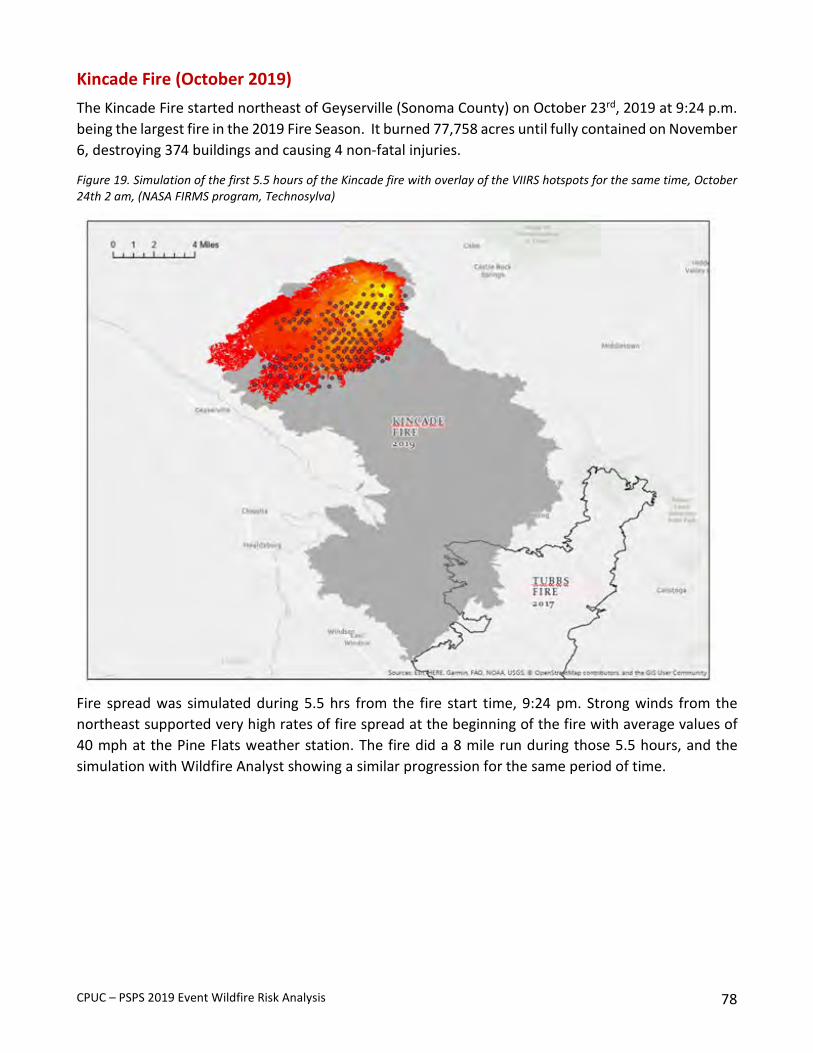
Kincade Fire (October 2019) The Kincade Fire started northeast of Geyserville (Sonoma County) on October 23rd, 2019 at 9:24 p.m. being the largest fire in the 2019 Fire Season. It burned 77,758 acres until fully contained on November 6, destroying 374 buildings and causing 4 non-fatal injuries.
Figure 19. Simulation of the first 5.5 hours of the Kincade fire with overlay of the VIIRS hotspots for the same time, October 24th 2 am, (NASA FIRMS program, Technosylva)
Fire spread was simulated during 5.5 hrs from the fire start time, 9:24 pm. Strong winds from the northeast supported very high rates of fire spread at the beginning of the fire with average values of 40 mph at the Pine Flats weather station. The fire did a 8 mile run during those 5.5 hours, and the simulation with Wildfire Analyst showing a similar progression for the same period of time.