county of san joaquin audit report june 30, 2011
TRANSCRIPT

COUNTY OF SAN JOAQUIN
AUDIT REPORT
JUNE 30, 2011

COUNTY OF SAN JOAQUIN AUDIT REPORT JUNE 30, 2011
Table of Contents
Page FINANCIAL SECTION Independent Auditor’s Report ............................................................................................................ 1 Management’s Discussion and Analysis (Required Supplementary Information) ................... 3 Basic Financial Statements: Government-wide Financial Statements: Statement of Net Assets .............................................................................................................. 13 Statement of Activities ................................................................................................................. 14 Fund Financial Statements: Governmental Funds: Balance Sheet .......................................................................................................................... 16 Reconciliation of the Governmental Funds Balance Sheet to the Government-Wide Statement of Net Assets – Governmental Activities ................................ 18 Statement of Revenues, Expenditures, and Changes in Fund Balances ................................ 19 Reconciliation of the Statement of Revenues, Expenditures, and Changes in Fund Balances of Governmental Funds to the Government-Wide Statement of Activities – Governmental Activities .................................................................. 21 Proprietary Funds: Statement of Fund Net Assets ................................................................................................. 22 Statement of Revenues, Expenses, and Changes in Fund Net Assets ................................... 24 Statement of Cash Flows ......................................................................................................... 25 Fiduciary Funds: Statement of Fiduciary Net Assets ........................................................................................... 27 Statement of Changes in Net Assets ....................................................................................... 28 Notes to the Basic Financial Statements ........................................................................................ 29 Required Supplementary Information (other than MD&A): Schedule of Funding Progress: Pension Benefit Plan ................................................................................................................... 76 Postemployment Healthcare – Sick Leave Bank Program ......................................................... 77 Postemployment Healthcare – Implicit Subsidy .......................................................................... 78 Budgetary Comparison Schedules: General Fund ............................................................................................................................... 79 Mental Health and Substance Abuse Fund ................................................................................. 81 First Five Program Fund .............................................................................................................. 83 Note to Required Supplementary Information: Budgetary Basis of Accounting .................................................................................................... 84 Supplementary Information: General Fund Accounts: Combining Balance Sheet ........................................................................................................... 85 Combining Statement of Revenues, Expenditures, and Changes in Fund Balances ....................................................................................................... 86 Combining Balance Sheet – All General Fund Special Accounts ............................................... 87 Combining Statement of Revenues, Expenditures, and Changes in Fund Balances – All General Fund Special Accounts ............................................................... 91

Page Supplementary Information (continued): Nonmajor Governmental Funds: Combining Balance Sheet ........................................................................................................... 95 Combining Statement of Revenues, Expenditures, and Changes in Fund Balances ....................................................................................................... 96 Special Revenue Funds: Combining Balance Sheet ........................................................................................................... 97 Combining Statement of Revenues, Expenditures, and Changes in Fund Balances ....................................................................................................... 103 Combining Balance Sheet – Nonmajor Special Districts Governed by the Board of Supervisors ..................................................................................... 109 Combining Statement of Revenues, Expenditures, and Changes in Fund Balances – Nonmajor Special Districts Governed by the Board of Supervisors ....................... 112 Debt Service Funds: Combining Balance Sheet ........................................................................................................... 115 Combining Statement of Revenues, Expenditures, and Changes in Fund Balances ....................................................................................................... 116 Capital Projects Funds: Combining Balance Sheet ........................................................................................................... 117 Combining Statement of Revenues, Expenditures, and Changes in Fund Balances ....................................................................................................... 119 Combining Balance Sheet – Nonmajor Special Districts Governed by the Board of Supervisors ...................................................................................................... 121 Combining Statement of Revenues, Expenditures, and Changes in Fund Balances – Nonmajor Special Districts Governed by the Board of Supervisors ....................... 123 Internal Service Funds: Combining Statement of Fund Net Assets .................................................................................. 125 Combining Statement of Revenues, Expenses, and Changes in Fund Net Assets ..................................................................................................... 128 Combining Statement of Cash Flows .......................................................................................... 131 Private Purpose Trust Funds: Combining Statement of Fiduciary Net Assets ............................................................................ 137 Combining Statement of Changes in Fiduciary Net Assets ........................................................ 138 Agency Funds: Statement of Changes in Assets and Liabilities Arising from Cash Transactions ................................................................................................ 139 Component Unit Financial Statements: County Service Area No. 31 – Flag City: Government-Wide Financial Statements: Statement of Net Assets ....................................................................................................... 140 Statement of Activities .......................................................................................................... 141 Fund Financial Statements: Governmental Funds: Combining Balance Sheet ................................................................................................. 142 Combining Statement of Revenues, Expenditures, and Changes in Fund Balances ............................................................................................. 143 Reconciliation of the Statement of Revenues, Expenditures, and Changes in Fund Balances of Governmental Funds to the Government-Wide Statement of Activities – Governmental Activities ............................ 144

Page STATISTICAL SECTION Financial Statistics for the Last Eight Years:
Changes in Net Assets .................................................................................................................... 145 Fund Balances – Governmental Funds ........................................................................................... 149 Legal Debt Margin Information ........................................................................................................ 151 Ratios of Outstanding Debt by Type ............................................................................................... 153 Changes in Fund Balances – Governmental Funds ....................................................................... 156 Net Assets by Component ............................................................................................................... 158

1
INDEPENDENT AUDITOR’S REPORT
Honorable Grand Jury and Board of Supervisors County of San Joaquin, California We have audited the accompanying financial statements of the governmental activities, the business-type activities, the discretely presented component units, each major fund, and the aggregate remaining fund information of the County of San Joaquin, California (the County), as of and for the year ended June 30, 2011, which collectively comprise the County’s basic financial statements as listed in the table of contents. These financial statements are the responsibility of County management. Our responsibility is to express opinions on these statements based on our audit. We did not audit the financial statements of Head Start Child Development Council, Inc., San Joaquin County Economic Development Association, Local Agency Formation Commission, or Health Plan of San Joaquin, which collectively represent 100 percent of the assets and revenues of the discretely presented component units. Those financial statements were audited by other auditors whose reports thereon have been furnished to us. Our opinion, insofar as it relates to the amounts included for the discretely presented component units are based on the reports of other auditors. We conducted our audit in accordance with auditing standards generally accepted in the United States of America and Government Auditing Standards, issued by the Comptroller General of the United States. Those standards require that we plan and perform the audit to obtain reasonable assurance about whether the financial statements are free of material misstatement. An audit includes examining, on a test basis, evidence supporting the amounts and disclosures in the financial statements. An audit also includes assessing the accounting principles used and significant estimates made by management, as well as evaluating the overall financial statement presentation. We believe that our audit and the reports of other auditors provide a reasonable basis for our opinions. In our opinion, based on our audit and the reports of other auditors, the financial statements referred to above present fairly, in all material respects, the financial position of the governmental activities, the business-type activities, the discretely presented component units, each major fund, and the aggregate remaining fund information of the County of San Joaquin, California, as of June 30, 2011, and the respective changes in financial position and cash flows, where applicable, thereof for the year then ended, in conformity with accounting principles generally accepted in the United States of America. In accordance with Government Auditing Standards, we have also issued, under separate cover, our report dated January 19, 2012, on our consideration of the County’s internal control over financial reporting and on our tests of its compliance with certain provisions of laws, regulations, contracts, and grant agreements and other matters. The purpose of that report is to describe the scope of our testing of internal control over financial reporting and compliance and the results of that testing, and not to provide an opinion on the internal control over financial reporting or on compliance. That report is an integral part of an audit performed in accordance with Government Auditing Standards and should be considered in assessing the results of our audit.

2
Accounting principles generally accepted in the United States of America require that the management’s discussion and analysis on pages 3 through 12, schedule of funding progress on pages 76 through 78, and budgetary comparison information on pages 79 through 84 be presented to supplement the basic financial statements. Such information, although not a part of the basic financial statements, is required by the Governmental Accounting Standards Board, who considers it to be an essential part of financial reporting for placing the basic financial statements in an appropriate operational, economic, or historical context. We have applied certain limited procedures to the required supplementary information in accordance with auditing standards generally accepted in the United States of America, which consisted of inquiries of management about the methods of preparing the information and comparing the information for consistency with management’s responses to our inquiries, the basic financial statements, and other knowledge we obtained during our audit of the basic financial statements. We do not express an opinion or provide any assurance on the information because the limited procedures do not provide us with sufficient evidence to express an opinion or provide any assurance. Our audit was conducted for the purpose of forming opinions on the financial statements that collectively comprise the County’s financial statements as a whole. The combining and individual nonmajor fund financial statements and statistical section are presented for purposes of additional analysis and are not a required part of the financial statements. The combining and individual nonmajor fund financial statements are the responsibility of management and were derived from and relate directly to the underlying accounting and other records used to prepare the financial statements. The information has been subjected to the auditing procedures applied in the audit of the financial statements and certain additional procedures, including comparing and reconciling such information directly to the underlying accounting and other records used to prepare the financial statements or to the financial statements themselves, and other additional procedures in accordance with auditing standards generally accepted in the United States of America. In our opinion, the information is fairly stated in all material respects in relation to the financial statements as a whole. The statistical section has not been subjected to the auditing procedures applied in the audit of the basic financial statements and, accordingly, we do not express an opinion or provide any assurance on it. BROWN ARMSTRONG ACCOUNTANCY CORPORATION Bakersfield, California January 19, 2012

MANAGEMENT’S DISCUSSION AND ANALYSIS

3
COUNTY OF SAN JOAQUIN MANAGEMENT’S DISCUSSION AND ANALYSIS
JUNE 30, 2011
This section of the County of San Joaquin’s (County) annual financial report represents a discussion and analysis of the County’s financial performance during the fiscal year ended June 30, 2011. Please read it in conjunction with the County’s basic financial statements following this section. FINANCIAL HIGHLIGHTS The assets of the County exceeded its liabilities at the close of the 2010-11 fiscal year by $988.1
million, which is referred to as net assets. Of this amount, $147.5 million is considered unrestricted net assets, which may be used to meet ongoing obligations to citizens and creditors. $356.8 million is restricted net assets and limited to specific purposes and $483.8 million, is invested in capital assets, net of related debt.
The County’s total net assets increased by $66.6 million during the year. Governmental activities
increased the County’s net assets by $28.9 million and business-type activities increased the County’s net assets by $37.7 million.
As of June 30, 2011, the County governmental funds reported combined fund balances of $372.7
million, which is an increase of $30.6 million from last year’s fund balance. Of the combined fund balances, $222.5 million is nonspendable or restricted funds, while $150.2 million is unrestricted funds that may be used to meet the County’s current and future needs (committed, assigned and unassigned fund balances).
As of June 30, 2011, the unrestricted fund balance for the general fund was $84.2 million, or
approximately 13.6% of the total general fund operating expenditures. The County’s total long-term debt that is due beyond one year at June 30, 2011 was $324.1 million,
$5.9 million lower than the prior year, primarily due to regularly scheduled debt payments and a $14.0 million reduction in the current fiscal year’s Teeter note offset by an increase of $10.5 million in the County’s OPEB liability.
OVERVIEW OF THE FINANCIAL STATEMENTS This discussion and analysis is intended to serve as an introduction to the County’s basic financial statements. The County’s basic financial statements comprise three components 1) Government-wide financial statements; 2) Fund financial statements and 3) Notes to the basic financial statements. Required Supplementary Information is included in addition to the basic financial statements. Government-wide Financial Statements are designed to provide readers with a broad overview of County finances, in a manner similar to a private-sector business. Therefore, the statements are reported using the accrual basis of accounting. Please refer to Note 1, section (c) for further information on the accrual basis of accounting. The statement of net assets presents information on all County assets and liabilities, with the difference between the two reported as net assets. Over time, increases or decreases in net assets may serve as a useful indicator of whether the financial position of the County is improving or deteriorating.

4
COUNTY OF SAN JOAQUIN MANAGEMENT’S DISCUSSION AND ANALYSIS
JUNE 30, 2011
The statement of activities presents information showing how net assets changed during the most recent fiscal year. All changes in net assets are reported as soon as the underlying event giving rise to the change occurs, regardless of the timing of related cash flows. Thus, revenues and expenses are reported in this statement for some items that may result in cash flows in future fiscal periods. Both of these government-wide financial statements distinguish functions of the County that are principally supported by intergovernmental revenues and property and sales taxes (governmental activities) from other functions that are intended to recover all or in part a portion of their costs through user fees and charges (business-type activities). The governmental activities of the County include general government; public protection; public ways and facilities; health and sanitation; public assistance; education and culture and recreation. The business-type activities of the County are the San Joaquin County General Hospital (Hospital), the San Joaquin County Airport (Airport), and the San Joaquin County Solid Waste Enterprise (Landfill). Component units that are discretely presented in the County’s basic financial statements consist of legally separate entities for which the County is financially accountable or whose nature and significant relationship with the County are such that exclusion would cause the County’s financial statements to be misleading or incomplete. Examples are the Head Start Child Development Council, Health Plan of San Joaquin, Local Agency Formation Commission, and San Joaquin County Economic Development Association. The government-wide financial statements can be found on pages 13-15 of this report. Fund Financial Statements are groupings of related accounts that are used to maintain control over resources that have been segregated for specific activities or objectives. The County, like other state and local governments, uses fund accounting to ensure and demonstrate finance-related legal compliance. All of the funds of the County can be divided into three categories: governmental funds, proprietary funds and fiduciary funds. Governmental funds are used to account for essentially the same functions reported as governmental activities in the government-wide financial statements. However, unlike the government-wide financial statements, governmental funds financial statements focus on near-term inflows and outflows of spendable resources, as well as on balances of spendable resources available at the end of the fiscal year. Such information may be useful in evaluating a county’s near-term financing requirements. Because the focus of governmental funds is narrower than that of the government-wide financial statements, it is useful to compare the information presented for governmental funds with similar information presented for governmental activities in the government-wide financial statements. By doing so, readers may better understand the long-term impact of the government’s near-term financing decisions. Both the governmental funds balance sheet and the governmental funds statement of revenues, expenditures and changes in fund balances provide a reconciliation to facilitate this comparison between governmental funds and governmental activities. The County reports four major individual governmental funds. Information is presented separately in the governmental funds balance sheet and in the governmental funds statement of revenues, expenditures and changes in fund balance. Data from the nonmajor governmental funds, including the debt service funds, are combined into a single, aggregated presentation. Individual fund data for each of these nonmajor governmental funds is provided in the form of combining statements elsewhere in this report. The County adopted an annual appropriated budget for all of its major governmental funds. Budgetary comparison schedules have been provided for the General Fund and the major special revenue funds to demonstrate compliance with this budget and are included in the required supplemental section of this report. The governmental funds financial statements can be found on pages 16-21 of this report.

5
COUNTY OF SAN JOAQUIN MANAGEMENT’S DISCUSSION AND ANALYSIS
JUNE 30, 2011
Proprietary funds are reported in two ways: enterprise funds and internal service funds. Enterprise funds are used to report the same functions presented as business-type activities in the government-wide financial statements. The County uses enterprise funds to account for the Hospital, the Airport, and the Landfill whose revenues are from external user fees. Internal services funds are used to accumulate and allocate costs internally among the County’s various functions. The County uses internal service funds to account for its insurance programs, fleet maintenance, telephone and radio communication programs, office automation equipment replacement program, and general office supply and services programs. Because these services predominately benefit governmental rather than business-type functions, they have been included within governmental activities in the government-wide financial statements. Proprietary funds provide the same type of information as the government-wide financial statements, only in more detail with the inclusion of cash flow statements. The County considers all of its enterprise funds as major funds to the County. The internal service funds are combined into a single, aggregated presentation in the proprietary funds financial statements. Individual fund data for the internal services is provided in the form of combining statements elsewhere in this report. The proprietary funds financial statements can be found on pages 22-26 of this report. Fiduciary funds are used to account for resources held for the benefit of parties outside the government. Fiduciary funds are not reflected in the government-wide financial statements because the resources of those funds are not available to support the County’s own programs. The accounting used for fiduciary funds is much like that used for proprietary funds except for Agency Funds. Agency funds are accounted for on the modified accounting basis. The fiduciary fund financial statements can be found on pages 27-28 of this report. Notes to the Basic Financial Statements provide additional information that is essential to a full understanding of the data provided in the government-wide and fund financial statements. The notes can be found on pages 29-75 of this report. Required Supplementary Information provides the comparison of the budgetary information with the actual budget results for the General Fund, the Mental Health and Substance Abuse Fund, and the First 5 Program Fund. As mentioned earlier, the Board of Supervisors revises the budget throughout the year as it attempts to deal with unexpected changes in revenues and expenditures. The final amendment to the budget was actually adopted at year-end, which is not prohibited by state law. Other Supplementary Information provides the combining and individual fund statements and schedules referred to earlier for nonmajor governmental funds, internal service and fiduciary funds immediately following the required supplementary information. It also contains certain financial statistics for the past ten years and the combined financial statements for the County Service Area No. 31 (Flag City). GOVERNMENT-WIDE FINANCIAL ANALYSIS As noted earlier, net assets may serve over time as a useful indicator of a government’s financial position. In the case of the County, assets exceeded liabilities by $988.1 million at the close of the fiscal year 2010-11.

6
COUNTY OF SAN JOAQUIN MANAGEMENT’S DISCUSSION AND ANALYSIS
JUNE 30, 2011
Condensed Statement of Net Assets (in 000’s)
Governmental Activities Business-Type Activities Total2010-11 2009-10 2010-11 2009-10 2010-11 2009-10
Assets:Current and other assets 662,700$ 647,590$ 100,548$ 68,524$ 763,248$ 716,114$ Capital assets 569,640 567,950 113,726 114,210 683,366 682,160
Total assets 1,232,340$ 1,215,540$ 214,274$ 182,734$ 1,446,614$ 1,398,274$
Liabilities:Current and other liabilities 57,329$ 114,384$ 19,114$ 18,169$ 76,443$ 132,553$ Long-term liabilities 276,316 231,324 105,722 112,887 382,038 344,211
Total liabilities 333,645 345,708 124,836 131,056 458,481 476,764
Net Assets:Invested in capital assets, net of related debt 447,107 442,095 36,708 40,322 483,815 482,417 Restricted 354,891 366,389 1,914 1,785 356,805 368,174 Unrestricted 96,697 61,348 50,816 9,571 147,513 70,919
Total net assets 898,695 869,832 89,438 51,678 988,133 921,510 Total liabilities and net assets 1,232,340$ 1,215,540$ 214,274$ 182,734$ 1,446,614$ 1,398,274$
The largest portion of the County’s net assets in the amount of $483.8 million, approximately 49.0% of the total, represents its investment in capital assets (e.g. land, land improvements, buildings, equipment, infrastructure and construction in progress), less any related debt used to acquire those assets that is still outstanding. The County uses these capital assets to provide services to citizens and to internal county departments. Consequently, these assets are not available for future spending. Although the County’s investment in its capital assets is reported net of related debt, it should be noted that the resources needed to repay this debt must be provided from other sources, since the capital assets themselves cannot be used to liquidate these liabilities. A significant portion of the County’s net assets of $356.8 million, or 36.1%, represents resources that are subject to external restrictions on how they may be used. The remaining balance of the County’s net assets is unrestricted net assets in the amount of $147.5 million, or 14.9%, which may be used to meet the County’s on-going obligations to citizens and creditors. At the end of the current fiscal year, the County reported positive balances in all three categories of net assets for the County as a whole. As shown below, the County’s net assets were increased by $66.6 million during the current fiscal year. That increase is comprised of a combination of a $53.5 million increase in revenues and a $33.5 million decrease in expenditures from the prior year.

7
COUNTY OF SAN JOAQUIN MANAGEMENT’S DISCUSSION AND ANALYSIS
JUNE 30, 2011
The following table indicates the changes in net assets for governmental and business-type activities. Changes in Net Assets (in $000’s)
Governmental Activities Business-Type Activities Total2010-11 2009-10 2010-11 2009-10 2010-11 2009-10
Revenues:Program Revenues:
Charges for services 112,253$ 116,075$ 239,951$ 190,163$ 352,204$ 306,238$ Operating grants and contributions 531,236 524,927 5,476 788 536,712 525,715 Capital grants and contributions 11,549 17,920 - - 11,549 17,920
General Revenues:Property taxes 195,484 194,019 412 495 195,896 194,514 Property transfer taxes 2,104 2,190 - - 2,104 2,190 Sales taxes 21,922 21,314 - - 21,922 21,314 Motor vehicle and other in-lieu taxes 4,209 2,743 - - 4,209 2,743 Transient occupancy tax 280 290 - - 280 290 Franchise and others 2,478 2,470 - - 2,478 2,470 Tobacco settlement proceeds 5,973 5,709 - - 5,973 5,709 Investment earnings 3,240 4,632 576 590 3,816 5,222 Miscellaneous 854 81 - - 854 81
Total Revenues 891,582 892,370 246,415 192,036 1,137,997 1,084,406
Expenses:General government 45,812 31,745 - - 45,812 31,745 Public protection 268,702 297,253 - - 268,702 297,253 Public ways and facilities 41,930 45,259 - - 41,930 45,259 Community infrastructure program 118,299 123,196 - 118,299 123,196 Health and sanitation 349,337 355,702 - - 349,337 355,702 Children and families act program 5,706 5,921 - 5,706 5,921 Public assistance 6,988 9,957 - - 6,988 9,957 Education 7,506 7,312 - - 7,506 7,312 Culture and recreation - - - - - - Interest on long-term debt - - - - - - Solid waste - - 16,374 19,749 16,374 19,749 Hospital - - 206,416 204,731 206,416 204,731 Airport - - 4,304 4,025 4,304 4,025
Total Expenses 844,280 876,345 227,094 228,505 1,071,374 1,104,850
Excess (deficiency) before transfers 47,302 16,025 19,321 (36,469) 66,623 (20,444) Transfers (18,439) (31,218) 18,439 31,218 - - Change in net assets 28,863 (15,193) 37,760 (5,251) 66,623 (20,444)
Net assets, beginning of year, restated 869,832 885,025 51,678 56,926 921,510 941,951 Net assets, end of the year 898,695$ 869,832$ 89,438$ 51,675$ 988,133$ 921,507$
Governmental activities. Governmental activities increased the County’s net assets by $28.9 million, accounting for 43.3% of the total increase in net assets of the County.
8
COUNTY OF SAN JOAQUIN MANAGEMENT’S DISCUSSION AND ANALYSIS
JUNE 30, 2011
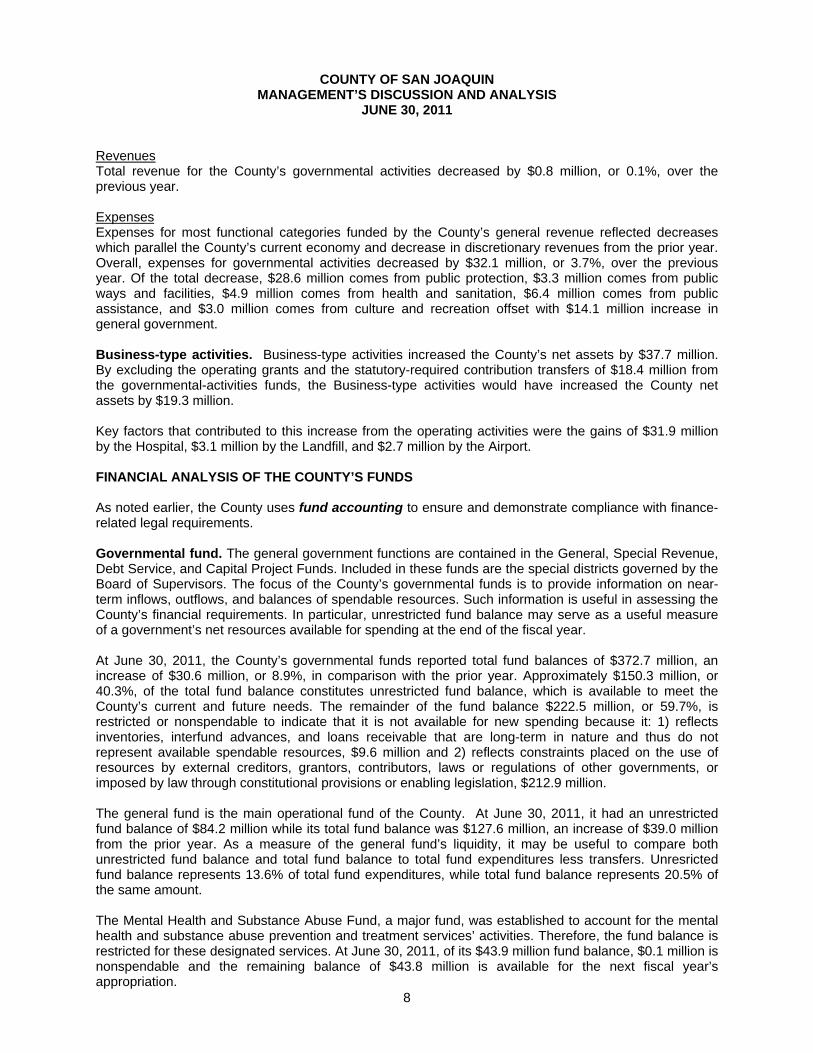
Revenues Total revenue for the County’s governmental activities decreased by $0.8 million, or 0.1%, over the previous year. Expenses Expenses for most functional categories funded by the County’s general revenue reflected decreases which parallel the County’s current economy and decrease in discretionary revenues from the prior year. Overall, expenses for governmental activities decreased by $32.1 million, or 3.7%, over the previous year. Of the total decrease, $28.6 million comes from public protection, $3.3 million comes from public ways and facilities, $4.9 million comes from health and sanitation, $6.4 million comes from public assistance, and $3.0 million comes from culture and recreation offset with $14.1 million increase in general government. Business-type activities. Business-type activities increased the County’s net assets by $37.7 million. By excluding the operating grants and the statutory-required contribution transfers of $18.4 million from the governmental-activities funds, the Business-type activities would have increased the County net assets by $19.3 million. Key factors that contributed to this increase from the operating activities were the gains of $31.9 million by the Hospital, $3.1 million by the Landfill, and $2.7 million by the Airport. FINANCIAL ANALYSIS OF THE COUNTY’S FUNDS As noted earlier, the County uses fund accounting to ensure and demonstrate compliance with finance-related legal requirements. Governmental fund. The general government functions are contained in the General, Special Revenue, Debt Service, and Capital Project Funds. Included in these funds are the special districts governed by the Board of Supervisors. The focus of the County’s governmental funds is to provide information on near-term inflows, outflows, and balances of spendable resources. Such information is useful in assessing the County’s financial requirements. In particular, unrestricted fund balance may serve as a useful measure of a government’s net resources available for spending at the end of the fiscal year. At June 30, 2011, the County’s governmental funds reported total fund balances of $372.7 million, an increase of $30.6 million, or 8.9%, in comparison with the prior year. Approximately $150.3 million, or 40.3%, of the total fund balance constitutes unrestricted fund balance, which is available to meet the County’s current and future needs. The remainder of the fund balance $222.5 million, or 59.7%, is restricted or nonspendable to indicate that it is not available for new spending because it: 1) reflects inventories, interfund advances, and loans receivable that are long-term in nature and thus do not represent available spendable resources, $9.6 million and 2) reflects constraints placed on the use of resources by external creditors, grantors, contributors, laws or regulations of other governments, or imposed by law through constitutional provisions or enabling legislation, $212.9 million. The general fund is the main operational fund of the County. At June 30, 2011, it had an unrestricted fund balance of $84.2 million while its total fund balance was $127.6 million, an increase of $39.0 million from the prior year. As a measure of the general fund’s liquidity, it may be useful to compare both unrestricted fund balance and total fund balance to total fund expenditures less transfers. Unresricted fund balance represents 13.6% of total fund expenditures, while total fund balance represents 20.5% of the same amount. The Mental Health and Substance Abuse Fund, a major fund, was established to account for the mental health and substance abuse prevention and treatment services’ activities. Therefore, the fund balance is restricted for these designated services. At June 30, 2011, of its $43.9 million fund balance, $0.1 million is nonspendable and the remaining balance of $43.8 million is available for the next fiscal year’s appropriation.

9
COUNTY OF SAN JOAQUIN MANAGEMENT’S DISCUSSION AND ANALYSIS
JUNE 30, 2011
The First Five Program, a major fund, was created following voter approval of the Children and Families Act of 1998 (Proposition 10) for the purposes of promoting and improving the early development of children from the prenatal stage to five years of age. The fund balance is, therefore, restricted for this program. At June 30, 2011, of its $5.5 million fund balance, $5.5 million is available for the next fiscal year’s appropriation. The County Capital Outlay Fund was created to account for the expenditures related to the new acquisition, construction, major maintenance and/or additions and renovations of the County’s facilities. Completion time for a capital project is often longer than a single fiscal year, depending on complexity and magnitude. Funds for projects still in progress at the end of a fiscal year are encumbered and carried forward in order to complete the work. At June 30, 2011, it had a fund balance of $42.8 million. Revenues for governmental functions totaled $891.6 million in fiscal year 2010-11, which represents a $0.8 million or 0.1% decrease from fiscal year 2009-10. The largest decreases in revenues were tax revenues $14.0 million, which is attributable to reductions in the assessed value of real estate and fines, forfeitures, and penalties $3.9 million, due to a decrease in collections of fines, forfeitures and penalties. The largest increase in revenues was charges for services $2.2 million, due to an increase in election services in an election year. Expenditures for government functions totaled $844.3 million in fiscal year 2010-11, which represents a decrease of $32.1 million or 3.7% from the prior year. The largest increase occurred in general government $14.1 million; while the largest decreases occurred in public safety $28.6 million, public assistance $6.4 million, health and sanitation $4.9 million, culture and recreation $3.0 million, and public ways and facilities $3.3 million. Proprietary funds. The County’s proprietary funds provide similar information found in the governmental-wide financial statements, but in more detail. The Solid Waste Enterprise had $3.0 million in net assets at June 30, 2011, the Airport Enterprise had $15.6 million, and the Hospital Enterprise had $70.8 million. The unrestricted net assets amounted to $4.6 million, $0.7 million, and $51.4 million, respectively, of the total proprietary funds’ net assets. The internal service funds had $83.4 million in net assets at June 30 2011 with $72.5 million as unrestricted. Of the unrestricted net assets, $55.2 million is designated for future claims under the County’s self-insurance programs. GENERAL FUND BUDGETARY HIGHLIGHTS Differences between the 2010-11 fiscal year’s original budget and the final amended budget resulted in a $18.8 million net increase to appropriations. The major increases in the final amended budget can be briefly summarized as follows:
The public protection budget increased by $4.2 million due to additional funding provided by various Federal and State government grants.
The reserve for contingency budget increased by $8.5 million as a result of first quarter budget
adjustments and excess prior year general fund balance.

10
COUNTY OF SAN JOAQUIN MANAGEMENT’S DISCUSSION AND ANALYSIS
JUNE 30, 2011
The health and sanitation budget increased by $2.4 million to reflect the additional funding provided by various Federal and the State government programs.
The transfers-out budget increased by $3.1 million as a result of mid-year budget adjustments for
prior year fund balances and to provide an increased subsidy to governmental departments..
During the year, actual revenues were less than budgetary estimates by $20.3 million. The net decrease reflects the combination of increases and decreases of various revenue sources. The major decreases are $18.6 million in Aid from Other Governmental Agencies for the public assistance area, $26.6 million in transfers-in; while the major increase was $21.6 million in net property and sales tax. Actual expenditures were less than final amended budgetary estimates by $91.5 million. A majority of the difference is attributable to below budget expenditures in public protection ($7.6 million), health and sanitation ($4.1 million), public assistance ($39.2 million) and general government ($17.4 million). The County also appropriated $19.1 million for contingencies as part of the County reserve policy. The net effect of under-realization of revenues and under-utilization of appropriations resulted in a favorable variance of $71.3 million, thus eliminating the need to draw upon existing fund balance. CAPITAL ASSETS AND DEBT ADMINISTRATION Capital assets The County’s investment in capital assets, net of related debt, for its governmental and business-type activities as of June 30, 2011, amounted to $483.8 million. This investment in capital assets includes infrastructure, infrastructure in progress, land, buildings and improvements, equipment and construction in progress. The total increase in the County’s investment in capital assets for the current period was 0.3%. Major capital asset events during the current fiscal year included the following:
Infrastructure increased by $18.0 million due to completion of various bridges and roads projects. All depreciable assets, except infrastructure, were depreciated from the mid-month of the
acquisition month to the end of the current fiscal year. Infrastructures acquired since 1985 were depreciated, using the composite method, over the life of 25 years.
Capital assets, net of accumulated depreciation, for the governmental and business-type activities are presented below to illustrate changes from the prior year (in $000’s):
Governmental Activities Business-Type Activities Total2010-11 2009-10 2010-11 2009-10 2010-11 2009-10
Infrastructure 214,505$ 208,994$ -$ -$ 214,505$ 208,994$ Land 14,551 13,935 4,663 4,663 19,214 18,598 Structure and improvements 296,145 301,506 81,282 82,808 377,427 384,314 Furniture and equipment 29,628 33,778 18,403 19,778 48,031 53,556 Construction in progress 11,177 5,963 7,019 6,961 18,196 12,924 Capital leases 3,634 3,774 2,359 - 5,993 3,774
Total 569,640$ 567,950$ 113,726$ 114,210$ 683,366$ 682,160$
For additional information related to capital assets, see note 5 on pages 56-57.

11
COUNTY OF SAN JOAQUIN MANAGEMENT’S DISCUSSION AND ANALYSIS
JUNE 30, 2011
Long-term debt At June 30, 2011, the County had total long-term outstanding debt of $324.1 million, excluding the amount due within one year ($57.9 million). This amount was comprised of $198.2 million of certificates of participation, $11.0 million in landfill closure/postclosure, $3.0 million in capital lease obligations, $2.0 million in notes payable, $6.2 million in earned compensated absences, $55.2 million for estimated self-insurance claims liability and $48.5 million for the County’s unfunded portion of OPEB. For additional information related to long-term debt, see notes 6, 7 and 8 on pages 57-64.
ECONOMIC FACTORS AND NEXT YEAR’S BUDGET AND RATES
The Great Recession continues to have a negative impact on revenues at both the State and local levels; however, there have been mixed signs of gradual economic recovery. While local property taxes continue to decline, albeit at a more modest level as compared to two years ago, revenues derived from sales tax appear to be improving steadily. The County’s 2011-12 budget represents a third consecutive cutback budget and contains funding reductions in most programs and services with two exceptions. These are: 1) increases in San Joaquin General Hospital primarily reflect the start-up costs for two new federal initiatives, which expand health care coverage for the underserved population, and 2) cost increases in the Human Services Agency to meet the workload demand and caseload growth of various public assistance programs.
The 2011-12 County budget also includes the deletion of an additional 200 full-time positions. Over the last four years, almost 900 positions have been eliminated in order to more closely align expenses with revenues. This represents a 14.5% reduction of the County’s full-time workforce. The adopted budget continues to restrict acquisition of fixed assets and capital expenses; limits employee job-related travel/training to mandated requirement or critical to the department’s operation; and maximizes/leverages non-County resources to preserve vital public services/programs.
Approximately 50% of the County’s budget is funded by State and Federal resources. As such,
the State’s economic condition and financial situation have a significant impact on the County’s budget and programs. The constitutional amendment (Proposition 1A) approved by California voters in November 2004 protects, to some extent, local government revenues from reductions by the State. However, State funding for programs and services administered by the County on behalf of the State continues to be at risk. Programs that are most susceptible to State budget reductions include public safety grants, and health and human services programs.
In August 2011, the Governor signed the 2011-12 State budget which (1) includes a major State-
Local Realignment program shifting $5.6 billion of existing State program responsibilities to local governments primarily in public safety, mental health, and social services programs; (2) incorporates 8% cuts in welfare assistance grants and reduces State-subsidized child care services for welfare recipients; (3) transitions children currently enrolled in the Healthy Families program into Medi-Cal; and (4) imposes an administration fee on the Medi-Cal Managed Care Intergovernmental Transfer Program. In addition, the State budget includes $2.5 billion midyear “trigger cuts”. These cuts are divided into two tiers. Tier 1, totaling $601 million, will be triggered when the State General Fund revenues are below $1 billion from the budget estimates. Tier 2, totaling $1.8 billion, when the State General Fund revenues are below $2 billion from the budget estimates. Trigger cuts that will have direct impacts on County programs/services are all under Tier 1.

12
COUNTY OF SAN JOAQUIN MANAGEMENT’S DISCUSSION AND ANALYSIS
JUNE 30, 2011
All of these factors were considered in preparing the County’s budget for fiscal 2011-12, approximately $1.214 billion (including the business-like activities). REQUEST FOR INFORMATION This financial report is designed to provide a general overview of the County’s finances for all those with an interest in the government’s finances. Questions concerning any of the information provided in this report or to request additional financial information should be addressed to the Auditor-Controller’s Office, 44 N. San Joaquin Street, Suite 550, Stockton, CA 95202.

BASIC FINANCIAL STATEMENTS GOVERNMENT-WIDE FINANCIAL STATEMENTS
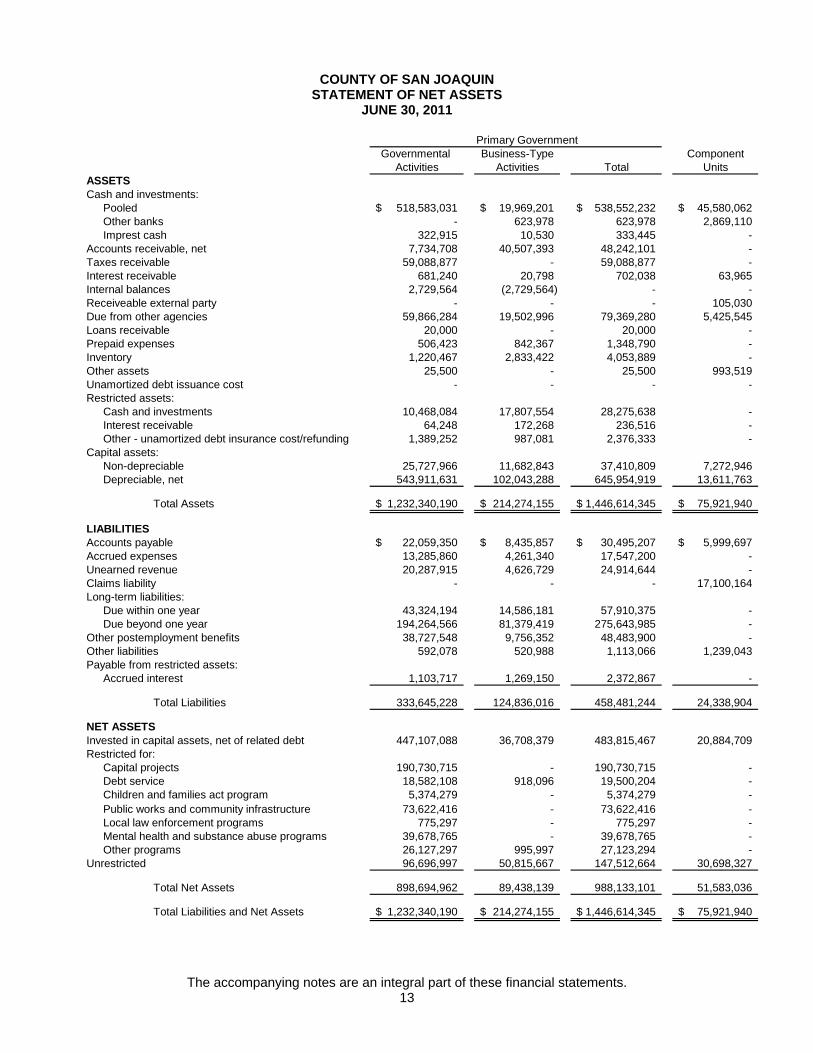
The accompanying notes are an integral part of these financial statements. 13
COUNTY OF SAN JOAQUIN STATEMENT OF NET ASSETS
JUNE 30, 2011
Primary GovernmentGovernmental Business-Type Component
Activities Activities Total UnitsASSETSCash and investments:
Pooled 518,583,031$ 19,969,201$ 538,552,232$ 45,580,062$ Other banks - 623,978 623,978 2,869,110 Imprest cash 322,915 10,530 333,445 -
Accounts receivable, net 7,734,708 40,507,393 48,242,101 - Taxes receivable 59,088,877 - 59,088,877 - Interest receivable 681,240 20,798 702,038 63,965 Internal balances 2,729,564 (2,729,564) - - Receiveable external party - - - 105,030 Due from other agencies 59,866,284 19,502,996 79,369,280 5,425,545 Loans receivable 20,000 - 20,000 - Prepaid expenses 506,423 842,367 1,348,790 - Inventory 1,220,467 2,833,422 4,053,889 - Other assets 25,500 - 25,500 993,519 Unamortized debt issuance cost - - - - Restricted assets:
Cash and investments 10,468,084 17,807,554 28,275,638 - Interest receivable 64,248 172,268 236,516 - Other - unamortized debt insurance cost/refunding 1,389,252 987,081 2,376,333 -
Capital assets:Non-depreciable 25,727,966 11,682,843 37,410,809 7,272,946 Depreciable, net 543,911,631 102,043,288 645,954,919 13,611,763
Total Assets 1,232,340,190$ 214,274,155$ 1,446,614,345$ 75,921,940$
LIABILITIESAccounts payable 22,059,350$ 8,435,857$ 30,495,207$ 5,999,697$ Accrued expenses 13,285,860 4,261,340 17,547,200 - Unearned revenue 20,287,915 4,626,729 24,914,644 - Claims liability - - - 17,100,164 Long-term liabilities:
Due within one year 43,324,194 14,586,181 57,910,375 - Due beyond one year 194,264,566 81,379,419 275,643,985 -
Other postemployment benefits 38,727,548 9,756,352 48,483,900 - Other liabilities 592,078 520,988 1,113,066 1,239,043 Payable from restricted assets:
Accrued interest 1,103,717 1,269,150 2,372,867 -
Total Liabilities 333,645,228 124,836,016 458,481,244 24,338,904
NET ASSETSInvested in capital assets, net of related debt 447,107,088 36,708,379 483,815,467 20,884,709 Restricted for:
Capital projects 190,730,715 - 190,730,715 - Debt service 18,582,108 918,096 19,500,204 - Children and families act program 5,374,279 - 5,374,279 - Public works and community infrastructure 73,622,416 - 73,622,416 - Local law enforcement programs 775,297 - 775,297 - Mental health and substance abuse programs 39,678,765 - 39,678,765 - Other programs 26,127,297 995,997 27,123,294 -
Unrestricted 96,696,997 50,815,667 147,512,664 30,698,327
Total Net Assets 898,694,962 89,438,139 988,133,101 51,583,036
Total Liabilities and Net Assets 1,232,340,190$ 214,274,155$ 1,446,614,345$ 75,921,940$

The accompanying notes are an integral part of these financial statements. 14
COUNTY OF SAN JOAQUIN STATEMENT OF ACTIVITIES
FOR THE YEAR ENDED JUNE 30, 2011
Indirect Operating CapitalExpense Charges for Grants and Grants and
Functions/Programs Expenses Allocation Services Contributions ContributionsPrimary Government:Governmental Activities:
General government 45,812,067$ (18,512,186)$ 17,166,522$ 598,916$ 429,398$ Public protection 268,702,066 10,896,047 42,841,343 84,676,957 - Public ways and facilities 39,439,736 1,172,939 11,088,079 16,519,495 11,119,358 Community infrastructure program 2,490,210 - 1,194,635 - - Health and sanitation 110,041,331 2,003,088 36,338,946 91,301,773 - Children and families act program 8,257,405 29,836 975 8,248,178 - Public assistance 349,336,742 1,994,405 1,152,025 329,891,224 - Education 5,706,505 348,889 250,865 - - Recreation and cultural services 6,987,870 2,066,982 2,219,648 - - Interest on long-term debt 7,506,293 - - - -
Total Governmental Activities 844,280,225 - 112,253,038 531,236,543 11,548,756
Business-Type Activities:Hospital 206,416,196 - 219,637,752 - - Airport 4,304,072 - 1,853,720 4,946,752 - Solid Waste 16,373,498 - 18,459,508 528,870 -
Total Business-Type Activities: 227,093,766 - 239,950,980 5,475,622 -
Total Primary Government 1,071,373,991$ -$ 352,204,018$ 536,712,165$ 11,548,756$
Component Units:Head Start Child Development 36,654,407$ -$ 2,275,485$ 34,824,115$ -$ Health Plan of San Joaquin 155,255,672 - 1,271,474 160,569,078 - San Joaquin Economic Development 673,441 - 1,054,155 165,557 - Local Agency Formation Commission 632,197 - 1,805 715,170 -
Total Component Units 193,215,717$ -$ 4,602,919$ 196,273,920$ -$
General Revenues:Taxes:
Property taxesProperty transfer taxesSales and use taxTransient occupancy taxesFranchise and otherOther in-lieu taxesUnrestricted interest and investment earningsTobacco settlement proceedsMiscellaneous
Transfers
Total General Revenues and Transfers
Change in Net Assets
Net Assets - Beginning
Net Assets - Ending
Program Revenues

The accompanying notes are an integral part of these financial statements. 15
Governmental Business-Type Component Activities Activities Total Units
(9,105,045)$ -$ (9,105,045)$ -$ (152,079,813) - (152,079,813) -
(1,885,743) - (1,885,743) - (1,295,575) - (1,295,575) - 15,596,300 - 15,596,300 -
(38,088) - (38,088) - (20,287,898) - (20,287,898) - (5,804,529) - (5,804,529) - (6,835,204) - (6,835,204) - (7,506,293) - (7,506,293) -
(189,241,888) - (189,241,888) -
- 13,221,556 13,221,556 - - 2,496,400 2,496,400 - - 2,614,880 2,614,880 -
- 18,332,836 18,332,836 -
(189,241,888) 18,332,836 (170,909,052) -
- - - 445,193 - - - 6,584,880 - - - 546,271 - - - 84,778
- - - 7,661,122
195,484,227 412,356 195,896,583 - 2,104,524 - 2,104,524 -
21,922,222 - 21,922,222 - 279,672 - 279,672 -
2,477,535 - 2,477,535 - 4,209,020 - 4,209,020 - 3,240,049 576,172 3,816,221 291,715 5,972,551 - 5,972,551 -
854,293 - 854,293 - (18,439,088) 18,439,088 - -
218,105,005 19,427,616 237,532,621 291,715
28,863,117 37,760,452 66,623,569 7,952,837
869,831,845 51,677,687 921,509,532 43,630,199
898,694,962$ 89,438,139$ 988,133,101$ 51,583,036$
Primary Government
Net (Expense) Revenue and
Changes in Net Assets

BASIC FINANCIAL STATEMENTS FUND FINANCIAL STATEMENTS

The accompanying notes are an integral part of these financial statements. 16
COUNTY OF SAN JOAQUIN BALANCE SHEET
GOVERNMENTAL FUNDS JUNE 30, 2011
Mental HealthGeneral and Substance First Five
Fund Abuse Fund Program FundASSETSCash and investments:
Pooled 140,162,090$ 45,198,522$ 5,470,449$ Imprest cash 249,775 39,450 -
Accounts receivable 2,743,208 2,460,088 - Taxes receivable 57,178,859 - - Interest receivable 94,479 60,767 8,540 Due from other agencies 53,220,784 2,231,108 1,354,165 Due from other funds 568,933 - - Advances 8,049,229 - - Loans receivable 20,000 - - Inventory - 159,796 - Other assets 25,500 - - Restricted assets:
Restricted cash and investments - - - Receivables - - -
Total Assets 262,312,857$ 50,149,731$ 6,833,154$
LIABILITIESAccounts payable 4,346,689$ 2,554,610$ 1,268,937$ Due to other funds 970,629 79,658 22,235 Accrued salaries 10,243,113 1,546,572 26,000 Deferred revenues 104,064,542 2,032,532 - Advances from other funds - - - Teeter note 14,500,000 - - Accrued interest 44,054 - - Other liabilities 592,078 - -
Total Liabilities 134,761,105 6,213,372 1,317,172
FUND BALANCES Non-spendable 8,094,729 159,796 - Restricted 35,245,339 43,776,563 5,515,982 Committed 10,006,276 - - Assigned 29,889,700 - - Unassigned 44,315,708 - -
Total Fund Balances 127,551,752 43,936,359 5,515,982
Total Liabilities and Fund Balances 262,312,857$ 50,149,731$ 6,833,154$

The accompanying notes are an integral part of these financial statements. 17
County Other Capital Governmental
Outlay Fund Funds Total
42,225,212$ 149,466,631$ 382,522,904$ - 33,650 322,875 - 660,263 5,863,559 - 1,910,019 59,088,878
112,313 202,296 478,395 - 3,060,227 59,866,284
649,415 51,620 1,269,968 276,134 664,892 8,990,255
- - 20,000 - 357,982 517,778
32,272 - 57,772
- 10,468,083 10,468,083 - 64,248 64,248
43,295,346$ 166,939,911$ 529,530,999$
535,620$ 4,039,402$ 12,745,258$ 3,409 313,089 1,389,020
- 1,342,545 13,158,230 - 1,909,897 108,006,971 - 6,374,625 6,374,625 - - 14,500,000 - - 44,054 - - 592,078
539,029 13,979,558 156,810,236
308,406 1,022,874 9,585,805 - 128,340,443 212,878,327 - - 10,006,276
42,447,911 26,689,076 99,026,687 - (3,092,040) 41,223,668
42,756,317 152,960,353 372,720,763
43,295,346$ 166,939,911$ 529,530,999$

The accompanying notes are an integral part of these financial statements. 18
COUNTY OF SAN JOAQUIN RECONCILIATION OF THE GOVERNMENTAL FUNDS
BALANCE SHEET TO THE GOVERNMENT-WIDE STATEMENT OF NET ASSETS – GOVERNMENTAL ACTIVITIES
JUNE 30, 2011
Fund Balance - Total Governmental Funds 372,720,763$
Amounts reported for governmental activities in the statementof net assets are different because:
Capital assets used in governmental activities are not financial resources and, therefore, are not reported in the governmental funds. 555,798,531
Internal service funds are used by management to charge the costs to individual funds. These assets and liabilities of the internal service funds are included in governmental activities in the statement of net assets. 83,371,485
Other long-term assets are not available to pay for current-period expendituresand, therefore, are deferred in the governmental funds. 87,719,055
Prepaid items
Long-term liabilities, including bonds payable, are not due and payablein the current period and, therefore, are not reported in the governmental funds.
Certificates of participation (132,179,848)$ Capital leases (181,040) Notes payable (385,371) Other postemployment benefits liability (38,334,388) Compensated absences (30,244,515) Unamortized issuance costs 1,389,251 Accrued interest payable (978,961) (200,914,872)
Net Assets of Governmental Activities 898,694,962$

The accompanying notes are an integral part of these financial statements. 19
COUNTY OF SAN JOAQUIN STATEMENT OF REVENUES, EXPENDITURES, AND
CHANGES IN FUND BALANCES GOVERNMENTAL FUNDS
FOR THE YEAR ENDED JUNE 30, 2011
Mental HealthGeneral and Substance First Five
Fund Abuse Fund Program FundRevenues:
Taxes 200,807,678$ -$ -$ Licenses and permits 5,036,563 - - Fines, forfeitures, and penalties 9,191,361 360,421 - Use of money and property 1,220,622 207,789 28,909 Aid from other governmental agencies 403,257,470 51,786,718 8,248,178 Charges for services 48,200,244 27,012,992 - Other revenues 12,830,067 542,307 975
Total Revenues 680,544,005 79,910,227 8,278,062
Expenditures:Current:
General government 41,583,865 - - Public protection 235,150,322 - - Public ways and facilities 4,813 - - Community infrastructure program - - - Health and sanitation 31,144,414 75,537,187 8,243,154 Public assistance 304,812,263 - - Education 274,431 - - Recreation and culture 5,636,071 - -
Capital outlay 1,097,569 36,441 - Debt service:
Principal retirement 776,304 - - Interest and debt issuance costs 278,796 - -
Total Expenditures 620,758,848 75,573,628 8,243,154
Excess (Deficiency) of Revenues Over(Under) Expenditures 59,785,157 4,336,599 34,908
Other Financing Sources (Uses)Loan proceeds 180,026 - - Transfers in 18,323,030 8,480,181 1,010,750 Transfers out (39,274,263) (1,253,469) (1,138,882)
Total Other Financing Sources (Uses) (20,771,207) 7,226,712 (128,132)
Net Change in Fund Balances 39,013,950 11,563,311 (93,224) Fund Balances - Beginning 88,537,802 32,373,048 5,609,206
Fund Balances - Ending 127,551,752$ 43,936,359$ 5,515,982$

The accompanying notes are an integral part of these financial statements. 20
County Other Capital Governmental
Outlay Fund Funds Total
-$ 18,816,364$ 219,624,042$ - 246,716 5,283,279 - 1,036,290 10,588,072
642,960 709,673 2,809,953 1,091,877 84,032,465 548,416,708
- 18,886,464 94,099,700 1,205,100 1,302,539 15,880,988
2,939,937 125,030,511 896,702,742
108,622 532 41,693,019 42,317 27,139,568 262,332,207
- 27,320,436 27,325,249 - 2,490,201 2,490,201
6,811 597,797 115,529,363 172,994 40,735,836 345,721,093
- 5,389,036 5,663,467 32,336 249,386 5,917,793
7,038,251 21,889,260 30,061,521
- 2,373,935 3,150,239 - 6,655,128 6,933,924
7,401,331 134,841,115 846,818,076
(4,461,394) (9,810,604) 49,884,666
- - 180,026 - 11,076,995 38,890,956
(10,071,761) (6,607,474) (58,345,849)
(10,071,761) 4,469,521 (19,274,867)
(14,533,155) (5,341,083) 30,609,799
57,289,472 158,301,436 342,110,964
42,756,317$ 152,960,353$ 372,720,763$

The accompanying notes are an integral part of these financial statements. 21
COUNTY OF SAN JOAQUIN RECONCILIATION OF THE STATEMENT OF REVENUES,
EXPENDITURES, AND CHANGES IN FUND BALANCES OF GOVERNMENTAL FUNDS TO THE GOVERNMENT-WIDE STATEMENT OF
ACTIVITIES – GOVERNMENTAL ACTIVITIES FOR THE YEAR ENDED JUNE 30, 2011
Net Change in Fund Balances - Total Governmental Funds 30,609,799$
Amounts reported for governmental activities in the statement of activities are different because:
Governmental funds report capital outlay as expenditures. However,in the statement of activities, the cost of those assets is allocated over their estimated useful lives and reported as depreciationexpense.
Expenditures for general capital assets, infrastructure, and other related capital assets adjustments 30,061,521$ Less current year depreciation (26,654,204) 3,407,317
Revenues in the statement of activities that do not provide current financialresources are not reported as revenues in the governmental funds.
Decrease in accrued property tax revenues (3,189,326) Decrease in accrued grant revenues 449,214 (2,740,112)
Repayment of debt principal is an expenditure in the governmentalfunds, but the repayment reduced long-term liabilities in the statement of net assets.
Principal repayments:Certificates of participation 2,355,400 Notes payable 733,036 Capital leases 61,803 Less amortization of discount on certificates of participation (328,658) 2,821,581
Long-term debt proceeds are a financial resource in the governmental funds, but they have no impact on the statement of activities since they increases the long-term liabilities in the statement of net assets. Also, governmental funds report the effect of issuance costs, premiums, discounts, and similar items when debt is first issued;whereas, these amounts are deferred and amortized in the statement of activities.
Other long-term notes (180,026) (180,026)
Some expenses reported in the statement of activities do notrequire the use of current financial resources and, therefore, arenot reported as expenditures in the governmental funds.
Change in accrued interest payable 12,820 Change in other postemployment benefits liability (7,051,456) (7,038,636)
Capital assets transferred to external funds are recorded as reduction of net assets, but they do not provide any addition to current financial resources and, therefore, are not reported asrevenues in the governmental funds. 91,229
Internal service funds are used by management to charge the costsof certain activities to individual funds. The net expense ofcertain activities of the internal service funds is reported withgovernmental activities. 1,891,965
Change in Net Assets of Governmental Activities 28,863,117$

The accompanying notes are an integral part of these financial statements. 22
COUNTY OF SAN JOAQUIN STATEMENT OF FUND NET ASSETS
PROPRIETARY FUNDS JUNE 30, 2011
Governmental Activities
Stockton Solid Internal General Metropolitan Waste Service Hospital Airport Disposal Total Funds
Assets
Current Assets:Cash and investments 3,308,985$ 907,502$ 8,639,777$ 12,856,264$ 136,060,126$ Imprest cash 2,580 250 7,700 10,530 40 Prepaid expenses 842,367 - - 842,367 506,423 Accounts receivable, net 39,291,110 114,278 1,245,015 40,650,403 193,007 Interest receivable - 2,077 18,721 20,798 202,844 Due from other funds 75,163 50,924 6,065 132,152 1,203,473 Due from other agencies 19,461,691 3,167 38,138 19,502,996 1,678,141 Inventories 2,810,898 - 22,524 2,833,422 702,688
Total Current Assets 65,792,794 1,078,198 9,977,940 76,848,932 140,546,742
Noncurrent Assets:Restricted assets:
Cash and investments 16,853,038 - 8,691,431 25,544,469 - Interest receivable 172,268 - - 172,268 - Other 650,671 - 336,410 987,081 -
Total Restricted Assets 17,675,977 - 9,027,841 26,703,818 -
Capital Assets:Non-depreciable 6,984,854 1,352,204 3,345,785 11,682,843 17,481 Depreciable, net 68,892,471 17,278,629 15,872,188 102,043,288 13,823,586
Total Capital Assets 75,877,325 18,630,833 19,217,973 113,726,131 13,841,067
Total Noncurrent Assets 93,553,302 18,630,833 28,245,814 140,429,949 13,841,067
Total Assets 159,346,096$ 19,709,031$ 38,223,754$ 217,278,881$ 154,387,809$ Continued
Business-Type Activities - Enterprise Funds

The accompanying notes are an integral part of these financial statements. 23
COUNTY OF SAN JOAQUIN STATEMENT OF FUND NET ASSETS (Continued)
PROPRIETARY FUNDS JUNE 30, 2011
Governmental Activities
Stockton Solid Internal General Metropolitan Waste Service Hospital Airport Disposal Total Funds
Liabilities and Net Assets
Current Liabilities:Accounts payable 7,527,356$ 59,569$ 991,940$ 8,578,865$ 9,310,640$ Accrued payroll 4,028,307 27,907 205,126 4,261,340 131,081 Due to other funds 60,578 454,483 7,161 522,222 694,351 Other current liabilities - 63,463 457,525 520,988 - Payable from restricted assets:
Interest payable 1,036,613 - 232,537 1,269,150 80,702 Current portion:
Certificates of participation (COP) 5,010,000 - 2,925,000 7,935,000 - Notes payable - 6,070 - 6,070 59,368 Capital leases 548,935 - 278,174 827,109 1,122,724 Compensated absences 5,226,614 57,644 533,744 5,818,002 238,072
Total Current Liabilities 23,438,403 669,136 5,631,207 29,738,746 11,636,938
Long-Term Liabilities:Unearned revenue 3,620,002 1,006,727 - 4,626,729 - Advances from other funds - 2,339,496 - 2,339,496 276,134 Certificates of participation, net 51,800,547 - 16,768,812 68,569,359 - Notes payable - 59,583 - 59,583 1,632,434 Capital leases 49,772 - 988,983 1,038,755 1,894,214 Compensated absences 607,192 (569) 108,049 714,672 16,980 Claims liability - - - - 55,166,463 Liability for closure/
postclosure costs - - 10,997,050 10,997,050 - Other postemployment benefits liability 8,980,379 83,867 692,106 9,756,352 393,159
Total Long-Term Liabilities 65,057,892 3,489,104 29,555,000 98,101,996 59,379,384
Total Liabilities 88,496,295 4,158,240 35,186,207 127,840,742 71,016,322
Net Assets:Invested in capital assets, net of
related debt 18,468,071 14,838,958 3,401,350 36,708,379 10,824,129 Restricted for:
Debt service - - 918,096 918,096 - Other 995,997 - - 995,997 - Landfill site closure and postclosure - - (5,848,043) (5,848,043) -
Unrestricted, net 51,385,733 711,833 4,566,144 56,663,710 72,547,358
Total Net Assets 70,849,801 15,550,791 3,037,547 89,438,139 83,371,487
Total Liabilities and Net Assets 159,346,096$ 19,709,031$ 38,223,754$ 217,278,881$ 154,387,809$
Business-Type Activities - Enterprise Funds

The accompanying notes are an integral part of these financial statements. 24
COUNTY OF SAN JOAQUIN STATEMENT OF REVENUES, EXPENSES, AND
CHANGES IN FUND NET ASSETS PROPRIETARY FUNDS
FOR THE YEAR ENDED JUNE 30, 2011
GovernmentalActivities
Stockton Solid Internal General Metropolitan Waste Service Hospital Airport Disposal Total Funds
Operating Revenues:Charges for services 184,522,170$ 272,873$ 8,343,853$ 193,138,896$ 94,818,895$ Concessions and rentals - 1,524,734 9,096,604 10,621,338 - Miscellaneous 35,115,582 56,113 - 35,171,695 1,070,261 Property tax - 412,356 - 412,356 - Aid from other agencies - 135 1,019,051 1,019,186 -
Total Operating Revenues 219,637,752 2,266,211 18,459,508 240,363,471 95,889,156
Operating Expenses:Salaries and benefits 113,166,391 961,936 6,954,871 121,083,198 4,087,332 Services and supplies 81,943,365 1,254,690 7,975,404 91,173,459 24,801,804 Liability claims and loss adjustments - 230,040 - 230,040 63,063,366 Insurance - - 413,356 413,356 - Landfill closure and postclosure expense - - (3,189,491) (3,189,491) - Depreciation and amortization 7,222,847 1,674,732 3,139,515 12,037,094 3,522,119 Miscellaneous - 960 12,531 13,491 19,819
Total Operating Expenses 202,332,603 4,122,358 15,306,186 221,761,147 95,494,440
Operating Income (Loss) 17,305,149 (1,856,147) 3,153,322 18,602,324 394,716
Non-Operating Revenues (Expenses):Gain (loss) on sale of asset - - (15,738) (15,738) 16,370 Interest income 503,482 8,705 63,985 576,172 664,265 Aid from other governmental agencies - 4,946,617 528,870 5,475,487 - Other (806,977) - - (806,977) 71,812 Interest expense (3,276,616) (181,714) (1,051,574) (4,509,904) (271,001)
Total Non-Operating Revenues (Expenses) (3,580,111) 4,773,608 (474,457) 719,040 481,446
Net Income (Loss) Before Transfers 13,725,038 2,917,461 2,678,865 19,321,364 876,162
Transfers:Transfers in 18,196,778 242,310 - 18,439,088 1,015,805
Change in Net Assets 31,921,816 3,159,771 2,678,865 37,760,452 1,891,967
Net Assets - Beginning of Year 38,927,985 12,391,020 358,682 51,677,687 81,479,520
Net Assets - End of Year 70,849,801$ 15,550,791$ 3,037,547$ 89,438,139$ 83,371,487$
Business-Type Activities - Enterprise Funds

The accompanying notes are an integral part of these financial statements. 25
COUNTY OF SAN JOAQUIN STATEMENT OF CASH FLOWS
PROPRIETARY FUNDS FOR THE YEAR ENDED JUNE 30, 2011
GovernmentalActivities
Stockton Solid Internal General Metropolitan Waste Service Hospital Airport Disposal Total Funds
Cash Flows from Operating Activities:Cash received from customers 212,724,671$ 2,279,916$ 19,235,719$ 234,240,306$ 93,090,077$ Cash payments to suppliers for goods and services (36,782,713) (1,517,401) (8,042,902) (46,343,016) (83,053,679) Cash payments to other departments for goods and services (7,697,660) (34,611) (922,444) (8,654,715) (3,674,660) Cash payments to employees for services (143,235,723) (963,751) (6,887,322) (151,086,796) (4,050,773)
Net Cash Provided (Used) by Operating Activities 25,008,575 (235,847) 3,383,051 28,155,779 2,310,965
Cash Flows from Noncapital Financing Activities:Transfers in (out) 18,196,778 242,310 - 18,439,088 1,014,652 State and Federal grant receipts - - 528,870 528,870 - Loan repayment or borrowing - (179,394) - (179,394) - Other non-operating receipts (payments) (22,640,764) (43,107) - (22,683,871) -
Net Cash Provided (Used) by Noncapital Financing Activities (4,443,986) 19,809 528,870 (3,895,307) 1,014,652
Cash Flows from Capital and Related Financing Activities:Capital contribution grants - 4,946,616 - 4,946,616 - Acquisition and construction of capital assets (3,741,846) (5,331,584) (402,592) (9,476,022) (2,728,274) Insurance recovery - - - - 71,812 Proceeds from sale of property and equipment - - (15,738) (15,738) 16,370 Other postemployment benefits obligation 2,033,083 21,068 153,798 2,207,949 92,699 Principal payment on debts (5,382,953) (5,387) (2,889,239) (8,277,579) (623,709) Interest payments on debts (3,276,616) (181,714) (1,100,950) (4,559,280) (279,393)
Net Cash Provided (Used) by Capital and Related Financing Activities (10,368,332) (551,001) (4,254,721) (15,174,054) (3,450,495)
Cash Flows from Investing Activities:Interest on investment and note receivable 503,482 9,490 96,091 609,063 664,283
Net Cash Provided by Investing Activities 503,482 9,490 96,091 609,063 664,283
Increase (Decrease) in Cash and Cash Equivalents 10,699,739 (757,549) (246,709) 9,695,481 539,405
Cash and Cash Equivalents, Beginning of Year 9,464,864 1,665,301 17,585,617 28,715,782 135,520,761
Cash and Cash Equivalents, End of Year 20,164,603$ 907,752$ 17,338,908$ 38,411,263$ 136,060,166$
Business-Type Activities - Enterprise Funds

The accompanying notes are an integral part of these financial statements. 26
COUNTY OF SAN JOAQUIN STATEMENT OF CASH FLOWS (Continued)
PROPRIETARY FUNDS FOR THE YEAR ENDED JUNE 30, 2011
GovernmentalActivities
Stockton Solid Internal General Metropolitan Waste Service Hospital Airport Disposal Total Funds
Reconciliation of operating income (loss) tonet cash provided (used) by operating activities:
Operating income (loss) 17,305,149$ (1,856,147)$ 3,153,322$ 18,602,324$ 395,869$ Adjustments to reconcile operating income (loss) to netcash provided (used) by operating activities:
Depreciation and amortization 7,222,847 1,674,732 3,139,515 12,037,094 3,522,119 (Increase) decrease in receivables (2,163,972) 10,538 1,053,322 (1,100,112) (119,730) (Increase) decrease in prepaid expenses (158,754) - - (158,754) 126,249 (Increase) decrease in inventories (100,025) - 9,846 (90,179) 73,747 Increase (decrease) in payables 2,929,281 (64,970) (783,464) 2,080,847 992,061 Increase (decrease) in closure/postclosure liability - - (3,189,490) (3,189,490) (2,679,350) Increase (decrease) in unearned revenues (25,951) - - (25,951) -
Net Cash Provided (Used) by Operating Activities 25,008,575$ (235,847)$ 3,383,051$ 28,155,779$ 2,310,965$
Business-Type Activities - Enterprise Funds

The accompanying notes are an integral part of these financial statements. 27
COUNTY OF SAN JOAQUIN STATEMENT OF FIDUCIARY NET ASSETS
FIDUCIARY FUNDS JUNE 30, 2011
December 31, 2010Investment Private Purpose Pension Trust Fund Agency Funds Trust Funds Total Trust Fund
Assets
Cash and investments - pooled 794,137,147$ 33,467,556$ 9,032,660$ 836,637,363$ 749,240$ Cash and investments held by others 1,933,738 5,395,373 - 7,329,111 25 Pension trust investments - - - - 2,025,264,804 Investments sold, funds not received - - - - 26,222,538 Investment income receivables 27,376,135 - 10,239 27,386,374 3,789,779 Loan program investment - - - - - Loans receivable - 26,500,000 34,329,077 60,829,077 - Other receivables - 26,702,980 - 26,702,980 7,898 Pension fund contribution receivable - - - - 4,821,974 Due from other agencies - - 211,131 211,131 - Other assets 354,683 188,373 - 543,056 75,004 Capital assets, net of depreciation - - - - 635,415 Post-employment healthcare fund investments - - - - 17,763,477
Total Assets 823,801,703$ 92,254,282$ 43,583,107$ 959,639,092$ 2,079,330,154$
Liabilities
Accounts payable 28,882,323$ 31,039,981$ 150,096$ 60,072,400$ -$ Accrued liabilities 98,957 - - 98,957 1,300,639 Securities lending - cash collateral - - - - 114,163,721 Securities purchased but not paid - - - - 17,006,281 Deferred Revenue 315,229 - - 315,229 - Loan Payable 23,507,274 20,000 - 23,527,274 - Due to other funds - 26,500,000 - 26,500,000 - Due to other agencies - 34,694,301 - 34,694,301 -
Total Liabilities 52,803,783 92,254,282 150,096 145,208,161 132,470,641
Net Assets
Held in trust for:Employee pension benefits - - - - 1,929,986,551 Employee postemployment health benefits - - - - 16,872,962 Revolving loans - - 42,624,409 42,624,409 - External investment pool participants 770,997,920 - - 770,997,920 - Other purposes - - 751,566 751,566 - Unrealized pool investments market appreciation - - 57,036 57,036 -
Total Net Assets 770,997,920 - 43,433,011 814,430,931 1,946,859,513
Total Liabilities and Net Assets 823,801,703$ 92,254,282$ 43,583,107$ 959,639,092$ 2,079,330,154$
June 30, 2011

The accompanying notes are an integral part of these financial statements. 28
COUNTY OF SAN JOAQUIN STATEMENT OF CHANGES IN NET ASSETS
FIDUCIARY FUNDS FOR THE YEAR ENDED JUNE 30, 2011
December 31, 2010Investment Private Purpose Pension Trust Fund Trust Funds Total Trust Fund
Additions
Employer's contributions -$ -$ -$ 108,813,588$ Employees' contributions - - - 13,098,043 Contributions from investment pool participants 3,930,311,777 - 3,930,311,777 - Capital Contributions from other governments - 3,281,221 3,281,221 - Interest and investment income 3,042,862 489,283 3,532,145 218,382,622 Miscellaneous income - 123,510 123,510 46,407
Total Additions 3,933,354,639 3,894,014 3,937,248,653 340,340,660
Deductions
Benefit payments - 119,009 119,009 125,113,983 Contribution refund - - - 1,250,644 Withdrawals from pooled investments 3,976,521,569 - 3,976,521,569 - Program expenditures - 3,377,016 3,377,016 - Allowance for loan adjustments - 209,399 209,399 - Administration and program expenses - 782,841 782,841 3,681,545
Total Deductions 3,976,521,569 4,488,265 3,981,009,834 130,046,172
Change in Net Assets (43,166,930) (594,251) (43,761,181) 210,294,488
Net Assets - Beginning, Restated 814,164,850 44,027,262 858,192,112 1,736,565,025
Net Assets - Ending 770,997,920$ 43,433,011$ 814,430,931$ 1,946,859,513$
June 30, 2011

BASIC FINANCIAL STATEMENTS NOTES TO THE BASIC FINANCIAL STATEMENTS

29
COUNTY OF SAN JOAQUIN NOTES TO THE BASIC FINANCIAL STATEMENTS
FOR THE YEAR ENDED JUNE 30, 2011
NOTE 1 – SUMMARY OF SIGNIFICANT ACCOUNTING POLICIES A. Reporting Entity
The reporting entity refers to the scope of activities, organizations and functions included in the financial statements. The County of San Joaquin (County) is a political subdivision created by the State of California and, as such, can exercise the powers specified by the Constitution and laws of the State of California. The County operates under the general laws of the State and is governed by an elected five member Board of Supervisors (Board). The governmental reporting entity consists of the County (Primary Government) and its component units. Component units are legally separate organizations for which the Board is financially accountable or other organizations whose nature and significant relationship with the County are such that exclusion would cause the County’s financial statements to be misleading or incomplete. Financial accountability is defined as the appointment of a voting majority of the component unit’s board, and (i) either the County’s ability to impose its will on the organization or (ii) there is potential for the organization to provide a financial benefit to or impose a financial burden on the County. The basic financial statements include both blended and discretely presented component units. The blended component units, although legally separate entities are, in substance, part of the County’s operations and so data from these units are combined with data of the primary government. The discretely presented component units, on the other hand, are reported in a separate column in the government-wide financial statements to emphasize they are legally separate from County government. For financial reporting purposes, the County’s basic financial statements include all financial activities that are controlled by or are dependent upon actions taken by the County’s Board. The financial statements of the individual component units may be obtained by writing to the County of San Joaquin, Auditor-Controller’s Office, 44 N. San Joaquin Street, Suite 550, Stockton, California 95202. Blended Components Special Districts Governed by the Board of Supervisors. The special service districts governed by the Board are established for the purposes of providing special services to various County areas. However, the outstanding special assessment debts and the debt service of these special districts governed by the Board are excluded from these financial statements in accordance with GASB Statement No. 6, described below. The special districts do not issue separate financial statements. The special service districts governed by the Board include a flood control district, 2 water and power authorities, a water works district, 30 lighting districts, 28 maintenance districts, 40 county service areas and 5 improvement districts as follows: San Joaquin County Flood Control Mokelumne River Water and Power Authority Northeastern San Joaquin County Groundwater Banking Authority San Joaquin Water Works #2 Lighting District Maintenance District County Service Areas Ash Street Acampo Number 1 Boggs Tract Burkett Gardens
Almond ParkAshley Drainage
Number 2 Number 3
Burkett Gardens Acres Bear Creek Terrace Number 3A Eastview Bowling Green Estates Number 4 Elkhorn Farmington
Colonial HeightsCorral Hollow
Number 5 Number 8

30
NOTE 1 – SUMMARY OF SIGNIFICANT ACCOUNTING POLICIES (Continued) A. Reporting Entity (Continued)
Blended Components (Continued) Special Districts Governed by the Board of Supervisors (Continued)
Lighting District (Continued) Maintenance District (Continued) County Service Areas (Continued) Linden Country Club Vista Number 11 Lockeford Elkhorn Golf Course Estates Number 12 Mariposa Heights Gala Manor Number 14 Mission Village Lambert Village Number 15 Morada Estates Lincoln Village Number 16 Morada Manor Lockeford Number 17 North Oaks Maurland Manor Number 18 North Wilson Way Mokelumne Acres Number 21 Northeast Stockton Morada Acres Number 23 Oro Street Morada Estates Number 24 Plymouth Village Morada Manor Number 25 Rancho Village Pacific Gardens Number 29 Shasta Avenue Rancho San Joaquin Number 30 Shippee – French Camp Homesite Raymus Village Number 31 Silva Gardens Riviera Cliffs Number 35 South French Camp Shaded Terrace Number 36 Southwest Stockton Spring Creek Estates Number 37 Stockton No. 5 Summer Home Estates Number 41 Tuxedo – Country Club Sunnyside Estates Number 42 Victer Walnut Acres Number 43 West Lane Wilkinson Manor Number 44 West Stockton Number 45 Woodbridge Number 46 Number 47 Number 48 Number 49 Number 50 Number 51 Number 52 Number 53 Number 54 Number 55 Number 56 Improvement Districts
San Joaquin Improvement #47 San Joaquin Improvement #51 San Joaquin Improvement #52 San Joaquin Improvement #54 Industrial Way & Beckman Road

31
NOTE 1 – SUMMARY OF SIGNIFICANT ACCOUNTING POLICIES (Continued) A. Reporting Entity (Continued)
Blended Components (Continued) Special Districts Governed by the Board of Supervisors (Continued) Each district was created to provide services to the residents of certain areas or to undertake a capital improvement project, including the providing or arranging of financing and collecting the assessments to pay any debt incurred to finance the project. The accounting principles established for reporting transactions of special districts are as follows: (1) Governmental Accounting Standards Board (GASB) Statement No. 6 requires transactions of
service-type special districts and of the construction phase related to capital improvements financed by special assessment to be reported within the general, special revenue or capital projects funds, as appropriate. Revenues and expenditures are recognized on the same basis of accounting as described in Note 1 - C. Any capital assets constructed or acquired, other than infrastructure, are reported in the government-wide financial statements on the same accounting principles as described in Note 1.
(2) With the exception of Shaded Terrace Maintenance District and Sunnyside Estate Maintenance
District, all special assessment debts were incurred under the provisions of the Improvement Bond Acts of 1911 and 1915, under which the County is not obligated in any manner for special assessment debts; the County acts as an agent for the property owners in collecting the assessments, forwarding the collections to bondholders, and initiating foreclosure proceedings as appropriate. Transactions affecting debt service are reported in the agency fund and the outstanding assessment debt approximating $677,243 as of June 30, 2011 is not presented in the financial statements. The maintenance districts of Shaded Terrace and Sunnyside Estate obtained, each, a loan from the United States Department of Agriculture to finance certain capital improvements to their water systems. As required by the loan agreement, the Districts established a debt service fund to accumulate funds for loan repayment purposes. These loans are reported in the County’s Statement of Net Assets and the related debt service is also included in the Debt Service Fund.
The San Joaquin General Hospital (the Hospital), organized as an enterprise fund of the County of San Joaquin on July 1, 1975, owns and operates a licensed general acute care hospital within the County. The Hospital provides a full range of acute and intensive care medical service to both inpatients and outpatients. The Hospital is an integral part of the County of San Joaquin reporting entity. The financial statements are available through the Auditor-Controller’s office. The First Five San Joaquin County (previously, the Children and Families Commission) was established under the authority of the California Children and Families First Act of 1998 and sections 130100, et seq. of the Health and Safety Code. The County Board appointed all members of the agency. The Board can remove appointed members at will. The agency is blended within the County’s special revenue fund and reported as a major fund for the fiscal year 2010-11. The financial statements are available through the Auditor-Controller’s office. The In-Home Supportive Services (IHSS) Public Authority maintains a registry and referral system to assist consumers in finding qualified in-home supportive services personnel as well as training of and support for providers and recipients of IHSS. The IHSS Authority is primarily funded by state grants. The County’s Board is the governing body for the IHSS Public Authority. Therefore, this entity has been blended with the primary government. The financial statements are available through the Auditor-Controller’s office.

32
NOTE 1 – SUMMARY OF SIGNIFICANT ACCOUNTING POLICIES (Continued) A. Reporting Entity (Continued)
Blended Components (Continued) Special Districts Governed by the Board of Supervisors (Continued) The San Joaquin County Employees’ Retirement Association (SJCERA) is governed by the Board of Retirement. The Board consists of nine regular members and one alternate. Four are elected by participating members, four are appointed by the Board of Supervisors and one is the County Treasurer. Although it is legally separated from the County, the SJCERA is reported as a fiduciary fund because the sole purpose of the SJCERA is to provide retirement benefits to the employees of the County and certain participating special districts. The System uses the calendar year as its fiscal year; therefore, the financial information related to the Pension Fund represents the year ended December 31, 2010. The financial statements of the Pension Fund are available through SJCERA (see Note 14). The San Joaquin County Public Facilities Financing Corporation is included as part of the primary government. The sole purpose of the Corporation is to finance for the benefit of the County the acquisition and construction of the County’s major capital projects, as described in Note 11 – B. The Corporation has assigned and transferred, without recourse, to the US Bank Trust Corporation for the benefit of the owners of the certificates each and all of its rights under the Site Lease and the Project Lease. With the exception of bonds issued for the North County Landfill Project, the Solid Waste System Project and the San Joaquin General Hospital Expansion Project, debt service and outstanding debts and the related capital projects are reported in the government-wide financial statements. The bonds issued for the North County Landfill Project, the Solid Waste System Project and the General Hospital Project and the related construction are reported in the Solid Waste Disposal Enterprise Fund and General Hospital Enterprise Fund, as applicable. The Corporation’s financial statements are available through the County Administrator’s Office. Discretely Presented Component Units The component units’ column in the basic financial statements includes the financial data of the County’s other component units. They are reported in a separate column to emphasize that they are legally separate from the County. The County has chosen to report all of the discretely presented component units as major component units.
Head Start Child Development Council, Inc., a nonprofit corporation, provides Head Start pre-school
services to low-income families in San Joaquin County. The Council annually receives significant federal grants for providing Head Start services as a subrecipient through the County.
San Joaquin County Economic Development Association, a nonprofit corporation, promotes,
publicizes, encourages and coordinates economic development of San Joaquin County. The Association is governed by a five-member board appointed by the Board of Supervisors and is operationally funded solely by the County.
Local Agency Formation Commission, established pursuant to Government Code Section 56000, is
governed by five commissioners. It approves or disapproves any application proposing annexation or detachment of territory to or from a city or special district. It also develops and determines Spheres of Influence which are projected future service areas of local governmental agencies.
Health Plan of San Joaquin, created by the Board of Supervisors in 1995, provides medical care and
health services to Medi-Cal recipients and other groups of persons pursuant to various statutes specified in the Welfare and Institutions Code.
Separate financial statements of these individual component units have been issued and are available from their respective administration office or the County Auditor-Controller’s office. Condensed financial data is presented in Note 17.
33
NOTE 1 – SUMMARY OF SIGNIFICANT ACCOUNTING POLICIES (Continued) A. Reporting Entity (Continued)
Related Organizations The County’s Board of Supervisors are also responsible for appointing the members of the boards of other organizations, but the County’s accountability for these organizations does not extend beyond making the appointments; therefore, these organizations are not included in these financial statements. These organizations are Tracy Public Cemetery District, Escalon Cemetery District, San Joaquin Regional Transit District, New Mariposa Drainage District, San Joaquin County Housing Authority, and Collegeville Fire District.
Joint Powers Agreement The County has seven Joint Powers Agreements (JPA). (1) San Joaquin Valleywide Air Pollution Study Agency was formed by the County and other counties
in 1990 for the purpose of designing, planning, programming and implementing an ozone and air pollution study in the geographical territory encompassed by the member counties.
(2) San Joaquin Area Flood Control Agency was formed by the County and the City of Stockton in 1995 to study, plan for, develop, finance, acquire, construct, maintain, repair, manage, operate and control water control works and facilities for the protection of the public.
(3) San Joaquin Regional Rail Commission was formed by the County, certain incorporated cities within the County, and the Council of Governments in 1995 to resolve issues relating to the rail passenger services and facilities for the purpose of transporting passengers within and outside their respective boundaries.
(4) Mokelumne River Water and Power Authority was formed by the County and San Joaquin County Flood Control and Water Conservation District in 1990 to finance the acquisition and construction of a dam, reservoir, generating facilities and conveyance facilities in order to benefit the County and the San Joaquin County Flood Control and Water Conservation District.
(5) Northern San Joaquin County Groundwater Banking Authority (previously, East San Joaquin Parties Water Authority) was formed by the County, the San Joaquin County Flood Control and Water Conservation District, cities and other water conservation and irrigation districts in 1996. This JPA was formed to plan, along with other public entities, projects to meet the water deficiencies of Eastern San Joaquin County.
(6) Altamont Commuter Express (ACE) was formed in 1997 by the San Joaquin Regional Rail Commission, a joint powers agency to which the County is a member, the Alameda County Congestion Management Agency and the Santa Clara County Transit District. ACE is formed to combine the parties’ efforts to achieve a viable commuter rail service link over the existing rail line between the cities of the County and San Jose to improve air quality and reduce crippling congestion within the interstate highways.
(7) Council of Governments was formed by the County and incorporated cities within the County in 1983 to manage the area-wide issues requiring multi-jurisdictional cooperation.
With the exception of the responsibilities borne by the participating parties during the JPA start-up period, the County does not retain any on-going financial interest or responsibility in these JPAs, except Mokelumne River Power Authority and Northern San Joaquin County Groundwater Banking Authority, which are either controlled by the Board of Supervisors or fully funded by a County controlled district and therefore blended with the County’s financial statements.

34
NOTE 1 – SUMMARY OF SIGNIFICANT ACCOUNTING POLICIES (Continued) A. Reporting Entity (Continued)
Joint Powers Agreement (Continued) Non-Related Organizations The school districts and special districts governed by local boards are independent and are not in any way related to the County, therefore, only those entities using the services of either the County Treasurer or County Auditor-Controller are included in these financial statements as fiduciary funds. The Lodi Grape Festival and Harvest Fair (Festival) operates fairground facilities located in Lodi, California. It conducts the annual Lodi Grape Festival and the annual Harvest Fair. Although the County has the responsibility to provide certain capital assets and improvements to the Festival, the State Department of Food and Agriculture, through its Division of Fairs and Expositions, supervises and provides funding for the activities of the Festival. Therefore, it is not a component unit of the County. The San Joaquin County Historical Society (Society), in addition to activities customarily associated with a historical society, operates the San Joaquin County Historical Museum for the County. The County provides the Society funds to cover the Museum operating expenses. Since there is no fiscal dependency or financial burden to the County, it is not a component unit of the County.
B. Basis of Financial Presentation
The Governmental Accounting Standards Board (GASB) recently released several new accounting and financial reporting standards. The following new standards may have a significant impact on the County’s financial reporting process. GASB Statement No. 60, Accounting and Financial Reporting for Service Concession Arrangements, is effective in financial statements for periods beginning after December 15, 2011. It establishes accounting and financial reporting requirements for service concession arrangements to reduce various inconsistencies that are currently applied by various governmental entities. GASB Statement No. 61, The Financial Reporting Entity: Omnibus, is effective in financial statements for periods beginning after June 15, 2012. It improves financial reporting for a governmental financial reporting entity. GASB Statement No. 62, Codification of Accounting and Financial Reporting Guidance Contained in Pre-November 30, 1989 FASB and AICPA Pronouncements, is effective in financial statements for periods beginning after December 15, 2011. It establishes accounting and financial reporting standards for the financial statements of state and local governments. GASB Statement No. 63, Financial Reporting of Deferred Outflows of Resources, Deferred Inflows of Resources, and Net Position, is effective for periods beginning after December 15, 2011. It provides guidance for reporting deferred outflows of resources, deferred inflows of resources, and net position in a statement of financial position and related disclosures. GASB Statement No. 64, Derivative Instruments: Application of Hedge Accounting Termination Provisions, is effective for periods beginning after June 15, 2011. It improves financial reporting for state and local governments by clarifying whether an effective hedging relationship continues after the replacement of a swap counterparty or a swap counterparty’s credit support provider.

35
NOTE 1 – SUMMARY OF SIGNIFICANT ACCOUNTING POLICIES (Continued) B. Basis of Financial Presentation (Continued)
Government-Wide Financial Statements Information relating to the primary government (the County) and its components is displayed in the statement of net assets and statement of activities. These statements include the financial activities of the overall government, except for fiduciary activities. Eliminations have been made to minimize the double counting of internal activities. These statements distinguish between the governmental and business-type activities of the County and between the County and its discretely presented component units. Governmental activities, which normally are supported by taxes and intergovernmental revenues, are reported separately from business-type activities, which are primarily supported by fees charged to external parties. The statement of activities presents a comparison between direct and indirect expenses and program revenues for each segment of the business-type activities of the County and for each function of the County’s governmental activities. Direct expenses are those that are specifically associated with a program or a function and; therefore, are clearly identifiable to a particular function. Indirect expenses are those that are allocated to a program or a function from the County’s centralized general service function based on the cost allocation principles established by the Federal Office of Management and Budget (OMB). Program revenues include 1) charges paid by the recipients of goods or services offered by the programs, 2) fines and penalties ordered by the courts, 3) licenses and permits charged by the programs, and 4) grants and contributions that are restricted to meeting the operational or capital requirements of a particular program. Revenues that are not classified as program revenues, including all taxes, are presented instead as general revenues. When both restricted and unrestricted net assets are available, it is County policy to use restricted net assets first, and then use the unrestricted resources as they are needed. Fund Financial Statements The fund financial statements provide information about the County’s funds, including fiduciary funds and blended component units. Separate statements for each fund category-governmental, proprietary and fiduciary-are presented. The emphasis of fund financial statements is on major governmental and enterprise funds, each displayed in a separate column. The County is required to report the General Fund, the General Hospital, and the Solid Waste Disposal as major funds. Although not required to be reported as major funds, the County has also chosen to report the Mental Health Substance Abuse Fund, the First Five Program, the Capital Outlay Fund and the Stockton Metropolitan Airport fund as major funds for consistency reasons. All remaining governmental funds are separately aggregated and reported as nonmajor funds. Proprietary fund operating revenues, such as charges for services, result from exchange transactions associated with the principal activity of the fund. Exchange transactions are those in which each party receives and gives up essentially equal values. Non-operating revenues, such as subsidies and investment earnings, result from nonexchange transactions or ancillary activities. Proprietary fund operating expenses, such as salaries and benefits or services and supplies, result from providing services and producing and delivering goods related to the proprietary fund’s primary operations. Expenses that are not directly related to the proprietary fund’s primary operations are reported as non-operating expenses.

36
NOTE 1 – SUMMARY OF SIGNIFICANT ACCOUNTING POLICIES (Continued) B. Basis of Financial Presentation (Continued)
Fund Financial Statements (Continued) The County reports the following major governmental funds:
General Fund – The General Fund is the general operating fund of the County. It is used to
account for all financial resources and transactions except those required to be accounted for in another fund. It includes certain special accounts that are under the control of various general fund departments and those that are used to accumulate resources for designated purposes.
Mental Health and Substance Abuse Service Fund – The Mental Health and Substance Abuse
Service Fund is used to account for the proceeds of specific sources with its expenditures legally restricted for mental health and substance abuse services.
First Five Program – The Children and Families Program Fund is used to account for the funding
provided through excise taxes collected by the State on tobacco products following voter approval of the Children and Families Act of 1998 (Prop. 10). The purpose of the program is to promote, support, and improve the early development of children from the prenatal stage to five years of age. Monies are expended in accordance with a strategic plan prepared by the San Joaquin County Children and Families Commission.
County Capital Outlay Fund – The County Capital Outlay Fund is used to account for financial
resources to be used for the major maintenance, acquisition and/or construction of major capital facilities, other than those financed by business-type funds.
The County reports all of its enterprise funds as major funds:
The San Joaquin County General Hospital Fund (the Hospital) accounts for hospital operations
involved in providing health services to County residents. Revenues are primarily fees for patient services, payments from Federal and State programs such as Medicare, Med-Cal, realignment revenues and subsidies from the general fund.
The San Joaquin County Airport Enterprise Fund (the Airport) accounts for commercial, corporate
business, and general aviation activities of the County. Revenues are primarily landing fees, rental and concessionary fees generated from the Airport owned facilities, capital grants from the Federal Aviation Administration and unsecured property taxes within the Airport’s boundaries.
The San Joaquin County Solid Waste Enterprise Fund accounts for the County’s solid waste
transfer and disposal activities, acquisition, design, development, and closure and postclosure maintenance of landfill sites, refuse collection franchise management, and other recycling programs. Revenues are primarily the gate fees and franchises.

37
NOTE 1 – SUMMARY OF SIGNIFICANT ACCOUNTING POLICIES (Continued) B. Basis of Financial Presentation (Continued)
Fund Financial Statements (Continued) The County reports the following additional fund types:
Internal Service Funds – Internal Service Funds are used to account for the financing of goods or
services provided by one department to other departments or agencies of the County on a cost recovery basis. These services include the County’s fleet maintenance, telephone and radio communications, office automation, and centrally managed insurance programs – workers compensation, employee medical, dental, and unemployment benefits, and casualty liabilities.
The Pension Trust Fund – This is used to account for the County’s retirement system assets and
changes in net assets. The retirement system is a separate entity and its financial operations are controlled by the Board of Retirement. The financial statements of the retirement system are included as a fiduciary fund. The post-retirement health benefit plan is also included in the Pension Trust Fund, as it is managed by SJCERA.
Investment Trust Fund – This is used to account for the assets of legally separate entities who
participate in the County Treasurer’s investment pool. This fund represents the assets, primarily cash and investments, and the related net assets/fund balance for investment pool participants, such as schools, local fire districts, the San Joaquin County Superior Court, reclamation districts, etc.
Private-purpose Trust Funds – These funds are used to account for the assets held for a minor
pursuant to a liability claim settlement, and revolving loan funds that are funded by the Federal Community Development Block Grant, Home Loan Program, and Economic Development Administration for the benefit of the community as a whole, rather than for the benefit of the County.
Agency Funds – These funds are used to account for the assets and the related liabilities of
clearing accounts, such as payroll withholdings, estate accounts, assets forfeiture accounts, court ordered deposits, and various entities other than those accounted for in the Investment Trust Fund.
C. Basis of Accounting
The government-wide, proprietary, pension, and investment trust fund financial statements are reported using the economic resources measurement focus and the accrual basis of accounting. Revenues are recognized when earned and expenses are recognized when incurred, regardless of when the related cash flows take place. Non-exchange transactions, in which the County gives (or receives) values without directly receiving (or giving) equal value in exchange, include property and sales taxes, grants, entitlements, and donations. On the accrual basis, property tax revenues are recognized in the fiscal year for which the taxes are levied. Sales taxes are recognized when the underlying transactions take place. Revenues from grants, entitlements and donations are recognized in the fiscal year in which all eligible requirements have been satisfied.
For its business-type activities and enterprise funds, the County has elected under GASB Statement No. 20, Accounting and Financial Reporting for Proprietary Funds and Other Governmental Entities That Use Proprietary Fund Accounting, to apply all applicable GASB pronouncements as well as any applicable pronouncements of the Financial Accounting Standards Board, the Accounting Principles Board or any Accounting Research Bulletins issued on or before November 30, 1989, unless those pronouncements conflict with or contradict GASB pronouncements. The GASB periodically updates its codification of the existing Governmental Accounting and Financial Reporting Standards which, along with subsequent GASB pronouncements (Statements and Interpretations), constitutes accounting principles generally accepted in the United States of America for governmental units. The County has elected not to follow subsequent private-sector guidance of the Financial Accounting Standards Board after November 30, 1989.

38
NOTE 1 – SUMMARY OF SIGNIFICANT ACCOUNTING POLICIES (Continued) C. Basis of Accounting (Continued)
Proprietary fund operating revenues, such as charges for services, result from exchange transactions associated with the principal activity of the fund. Exchange transactions are those in which each party receives and gives up essentially equal values. Nonoperating revenues, such as subsidies and investment earnings, result from nonexchange transactions or ancillary activities. Governmental funds are reported using the current financial resources measurement focus and the modified accrual basis of accounting. Under this method, expenditures are recorded when the related liability is incurred except the unmatured interest on long-term debt, and expenses related to compensated absences and claims and judgments are recorded only when payment is due. General capital assets acquisitions are reported as expenditures in governmental funds. Proceeds of general long-term debt and capital leases are reported as other financing sources. Revenues are recorded when they are both measurable and available to finance expenditures during the fiscal period. Property and sales taxes, interest, state and federal grants and charges for services are accrued when their receipt occurs within sixty days after the end of the accounting period so as to be both measurable and available. Revenues earned but not received within sixty days after the end of the accounting period, on the other hand, are recorded as receivables and deferred revenues, in accordance with GASB 34. The financial statements of the component units are maintained on the following basis of accounting:
San Joaquin County Economic Development Association: accrual accounting basis. Head Start Child Development Council, Inc.: modified accrual accounting basis plus accrual of
encumbered expenses. Local Agency Formation Commission: modified accrual accounting basis. Health Plan of San Joaquin: accrual accounting basis.
D. Interfund Transactions
Interfund transactions are reflected as either loans, services provided, reimbursements or transfers.
Loans are reported as receivables and payables as appropriate and are subject to elimination
upon consolidation and are referred to as either “due to/due from other funds” (the short-term interfund loans) or “advance to/from other funds” (the long-term interfund loans). Any residual balances outstanding between the governmental activities and the business-type activities are reported in the government-wide financial statements as “internal balances”. Advances between funds, are reported in the fund financial statements, are offset by a fund balance reserve account in applicable governmental funds to indicate that they are not available for appropriation and are not available financial resources.
Services provided, deemed to be at market or near market rate and are the core business of the
function, are treated as revenues or expenditures/expenses in the funds involved. The related accounts payable and accounts receivable are eliminated upon consolidation and are referred to as “due to/due from other funds” on the fund statements.
Reimbursement transactions are treated as reductions of expenditures/expenses in one fund and
corresponding increases in the other fund. Operating/Capital transfers are reported as recorded as “transfers in” or “transfers out” in the other
financing sources and netted as part of the reconciliation to the government-wide presentation.

39
NOTE 1 – SUMMARY OF SIGNIFICANT ACCOUNTING POLICIES (Continued) E. Cash and Investments
Cash and investments consist of cash held in the bank or on hand and debt and equity securities. All investment securities, such as certificates of deposit, bankers’ acceptances, commercial paper, repurchase agreements, and U.S. Treasury notes, stocks, bonds, etc. are stated at fair value in accordance with GASB Statement 31. The fair value of investments is obtained by using quotations obtained from independent published sources. The commingled funds are valued based on the fair value of the commingled trust’s underlying assets. Interest earnings on the County Treasurer’s investment pool are distributed to all participating funds based on their average daily cash balance within the pool.
F. Inventory and Prepaid Expenses
Inventory of materials and supplies in the enterprise funds, internal service funds, Sheriff’s Commissary Store (a General Fund account), Mental Health & Substance Abuse Fund (a major governmental fund), and Road Fund (a nonmajor governmental fund) are stated at cost as determined by the first-in, first-out method. Materials and supplies purchased by other funds are for current consumption and are recorded as expenditures when consumed. Certain payments to vendors reflect costs applicable to future accounting periods and are recorded as prepaid expenses.
G. Capital Assets
Capital assets (including infrastructure) are recorded at historical costs or at estimated historical cost if actual historical cost is not available. Infrastructures acquired prior to June 30, 1980 are not recorded. The County defines capital assets as assets with an initial, individual cost of more than $1,000 for equipment/furniture and $5,000 for structures and improvements, and an estimated useful life in excess of one year. Capital assets acquired by the governmental funds are accounted for as expenditures of those funds and capitalized and recorded as assets in the government-wide financial statements. Assets constructed through the issuance of Certificates of Participation are capitalized. Material interest and incidental expenses, net of interest revenue earned on proceeds of Certificates of Participation during the construction period, have been capitalized. Major equipment acquired through long-term lease purchase arrangements is capitalized and reported as assets in the government-wide statement of net assets. Contributed fixed assets are valued at their estimated fair market value on the date contributed. Contributed capital assets include public domain (infrastructure) general fixed assets consisting of certain improvements including pavements in progress, bridges and right of way. Maintenance and repairs are charged to operations when incurred. Betterments and major improvements that significantly increase values, change capacities or extend useful lives are capitalized. Upon sale or retirement of fixed assets, the cost and related accumulated depreciation are removed from the respective accounts and any resulting gain or loss is included in the results of operations. Depreciable capital assets of the enterprise funds and internal service funds are depreciated using the straight-line method over estimated useful lives of 10 to 60 years for structures and improvements and 2 to 20 years for equipment, furniture and fixtures. Capital assets used in operations of the governmental funds are depreciated on the government-wide financial statements only, using the straight-line method over estimated lives of 10 to 50 years for structure and improvements and 2 to 5 years for equipment, furniture, and fixtures. Infrastructure (i.e., roads, bridges, water/sewer, drainage system, flood control, etc.) is depreciated using a composite method to depreciate the infrastructure acquired after June 30, 1980 over an estimated weighted average life of 25 years.

40
NOTE 1 – SUMMARY OF SIGNIFICANT ACCOUNTING POLICIES (Continued) H. Capital Lease Obligations
Capital leases consist of lease-purchase obligations stated at the present value of future minimum lease payments.
I. Property Taxes
All jurisdictions within California derive their taxing authority from the State Constitution and various legislative provisions contained in the Government Code and Revenue and Taxation Code. The County is responsible for the assessment, collection and apportionment of property taxes for all jurisdictions including schools and special districts within the County. Property is assessed at 100% of full cash or market value (with some exceptions) pursuant to Article XIII of the California State Constitution and statutory provisions. The total 2010-11 net assessed valuation of the County real property was $54.8 billion. The property tax levy to support general operations of the various jurisdictions is limited to 1% of full cash value and is distributed in accordance with statutory formulas. Amounts needed to finance the annual requirements of voter-approved debt are excluded from this limitation and are separately calculated and levied each fiscal year. The rates are formally adopted by the Board after approval of city councils or the governing boards of special districts where applicable. Property taxes are levied on both real and personal property. Secured property tax payments are levied in two equal installments: the first is generally due November 1 and delinquent with penalties after December 10; the second is due February 1 and delinquent with penalties after April 10. Secured property with unpaid taxes incurs a lien on January 1 preceding the fiscal year for which taxes are levied. Property taxes on the unsecured roll are due on the January 1 lien date and become delinquent if unpaid on August 31. In 1983, the Governor signed Senate Bill 813 which requires county assessors to appraise property and issue an assessment when new construction is completed or a change in ownership occurs. The supplemental assessment will reflect the change in value for the remainder of the property tax year. Tax bills for these new tax liens are issued throughout the fiscal year and contain various payments and delinquent dates, but are generally due within one year. If the new tax liens are lower, the taxpayer receives a tax refund rather than a tax bill. The County’s Property taxes are accounted for in the property tax collection fund (tax resource fund) until apportionments are made and funds are disbursed to taxing jurisdictions. The fund carried a cash balance of approximately $9.3 million as of June 30, 2011. Since fiscal year 1993-94, the County has opted into the alternative tax apportionment method, commonly known as the Teeter Plan. Under this method, the County, along with all other taxing agencies, has been paid 100% of the current secured taxes levied for each year. The fund balance (deficit) of the tax resource fund is consolidated with the General Fund at year-end. To finance the 100% distribution, the County has been choosing the interfund borrowing method every year since 1993-94 and reports the borrowing as the liability of the County General Fund. The County maintains a balance of 2.5% (the legally required minimum balance is 1%) of the annual taxes levied on properties participating in the Teeter Plan in a Tax Loss Reserve Fund. The balance was approximately $15.7 million at June 30, 2011. Penalties and interest collected on delinquent secured taxes are kept in the Tax Resource Fund. Taxes, including unsecured property taxes, earned but not collected within 60 days after June 30, 2011 is recorded as taxes receivable (approximate $71.7 million) and is offset by a deferred revenue liability of $68.1 million on the fund statements. The changes in deferred revenues between prior fiscal year and the current fiscal year, however, are recognized as revenues on the government-wide financial statements. The net taxes receivable was $56.0 million, net of the estimated uncollectible amount of $15.7 million.

41
NOTE 1 – SUMMARY OF SIGNIFICANT ACCOUNTING POLICIES (Continued) J. Compensated Absences
Unused vacation leave may be accumulated up to a specified maximum and is paid at the time of termination from County employment. In accordance with the Memorandum of Understanding (MOU) between the County and the employees’ unions, the County is only obligated to pay for unused sick leave up to a certain percentage at the time of eligible employees’ retirement. Upon retirement, the County converts the non-cash pay out portion to a sick-leave bank to provide the post retirement medical or dental premium coverage for eligible employees. The County accrues as current liabilities the compensated vacation and other leave benefits that are attributable to employees’ services already rendered but not yet paid. A portion of the cash payout of the unused sick leave upon retirement, based on the past three years’ experience, is also accrued as current liabilities.
K. Fund Equity
In the fund financial statements, governmental funds report fund balance as nonspendable, restricted, committed, assigned or unassigned based primarily on the extent to which the County is bound to honor constraints on how specific amounts can be spent.
Nonspendable fund balance – amounts that cannot be spent because they are either (a) not
spendable in form or (b) legally or contractually required to be maintained intact. Restricted fund balance – amounts with constraints placed on their use that are either (a)
externally imposed by creditors, grantors, contributors, or laws or regulations of other governments; or (b) imposed by law through constitutional provisions or enabling legislation.
Committed fund balance – amounts that can only be used for specific purposes determined by formal action of the County’s highest level of decision-making authority (the Board of Supervisors) and that remain binding unless removed in the same manner. The underlying action that imposed the limitation needs to occur no later than the close of the reporting period.
Assigned fund balance – amounts that are constrained by the County’s intent to be used for specific purposes. The intent can be established at either the highest level of decision making, or by a body or an official designated for that purpose. This is also the classification for residual funds in the County’s special revenue funds.
Unassigned fund balance – the residual classification for the County’s General Fund that includes amounts not contained in the other classifications. In other funds, the unassigned classification is used only if expenditures incurred for specific purposes exceed the amounts restricted, committed, or assigned to those purposes.
The Board of Supervisors establishes, modifies or rescinds fund balance commitments and assignments by passage of an ordinance or resolution. This is done through adoption of the budget and subsequent budget amendments that occur throughout the year. When both restricted and unrestricted resources are available for use, it is the County’s policy to use restricted resources first, followed by the unrestricted resources (committed, assigned and unassigned) as they are needed.
L. Bond Issuance Costs and Discounts
In the government-wide financial statements and the proprietary fund types in the fund financial statements, long-term debt and other long-term obligations are reported as liabilities in the applicable government activities, business-type activities, or proprietary fund statement of net assets. Bond discounts and premiums are amortized over the life of the bonds in the same manner as interest expense. Issuance costs, are deferred and amortized over the life of the bonds using the straight-line method. Bonds payable are reported net of the applicable bond discount or premium. Bond issuance costs are reported as deferred charges in the asset section, net of accumulated amortization.

42
NOTE 1 – SUMMARY OF SIGNIFICANT ACCOUNTING POLICIES (Continued) L. Bond Issuance Costs and Discounts (Continued)
In the fund financial statements, government fund types recognize bond discounts, as well as bond issuance costs, during the period paid. Issuance costs, whether or not withheld from the actual debt proceeds received are reported as debt service expenditures.
M. Cash and Cash Equivalents
For purposes of the statements of cash flows of the proprietary funds, cash and cash equivalents are defined as cash pools managed by the County Treasurer and any other short-term, highly liquid investments that are both a) readily convertible to known amounts of cash and b) so near their maturity that they present insignificant risk of changes in value because of changes in interest rates. Changes in fair value of investments are reported as cash flow from investing activities as they meet the definition of cash equivalents.
N. Management Estimates
In preparing basic financial statements, management makes estimates and assumptions that affect the reported amounts of assets and liabilities and disclosures of contingent assets and liabilities at the date of the financial statements, as well as the reported amounts of revenues and expenditures during the reporting period. Accordingly, actual results could differ from those estimates.
O. Postemployment Health Benefits
The County does not provide employees any Other Post Employment Benefits (OPEB) other than the postemployment health benefits under the “sick leave bank” program, as described below. The sick leave bank program is administered by SJCERA (see Note 14 – Employee Retirement Systems for more information). In accordance with GASB Statement No. 43 and No. 45, however, the County has an implicit subsidy liability as the County allows any member or beneficiary receiving a pension benefit to purchase post-retirement health insurance under one of the County’s sponsored plans. In some cases, the purchase of this insurance can result in an implicit subsidy payable by the County. Sick Leave Bank Benefit: The County provides full time employees with 12 days of paid sick leave per year. Unused sick leave is allowed to accumulate. As a result of the settlement of a lawsuit, as explained later, for those regular employees who were hired on or before August 26, 2001 and meet certain requirements, their accumulated unused sick leave, net of their cash-out portion, upon retirement is converted to a sick leave bank at a rate of $27.65 per hour, which is used to pay their postemployment health insurance costs. However, the sick leave bank benefits are not vested in any way and are of a use-or-lose plan. Employees hired after that specified date are not eligible for sick leave cash payout or the sick leave bank benefits. The actuarial accrued liability was $41.8 million with $14.9 million of the actuarial value of the assets in the sick leave bank account at December 31, 2009, the date of the most recent Sick Leave Bank actuarial valuation. The County has committed to provide the annual required contribution (ARC) since fiscal year 2008-09. At December 31, 2009, the total number of the eligible members was comprised of 3,006 active members and 853 retired members.
P. Hospital and Other Program Revenues
Net patient service revenue is revenue is reported at the estimated net realizable amounts from patients, third-party payers, and others for services rendered, including estimated retroactive adjustments for Medicare and Medi-Cal cost report settlements. Medicare and Medi-Cal cost report adjustments are accrued on an estimated basis in the period the related services are rendered and adjusted in future periods as final settlements are determined. Gross patient revenue for year 2010-11 was $639.9 million, estimated adjustments for contractual allowances and bad debts were $534.7 million, resulting in net patient revenue of $105.2 million.

43
NOTE 1 – SUMMARY OF SIGNIFICANT ACCOUNTING POLICIES (Continued) P. Hospital and Other Program Revenues (Continued)
Medicare – Inpatient and outpatient acute care services and defined capital and indirect graduate
medical education costs for services rendered to Medicare beneficiaries are paid at prospectively determined rates. These rates vary according to an inpatient and outpatient classification systems that are based on clinical, diagnostic, and other factors. Direct graduate medical education cost and bad debts are paid based on estimated periodic interim payments and are finalized after the audit of the annual cost report.
Medi-Cal – Services rendered to Medi-Cal program beneficiaries are reimbursed based on a maximum allowance schedule for outpatients and on a cost basis for inpatients under California’s Medi-Cal Hospital Waiver.
SB1100 California’s Medi-Cal Hospital Waiver – In September 2005, the California legislature passed SB100. It put in place a negotiated payment method between the State and the federal government. The Medi-Cal Waiver (Waiver) replaced a 15 year old system, SB855 and SB1255 that governed hospital fee-for-service and disproportionate share hospital payments. Under the Waiver, the non-federal share used to draw down the federal funds is a combination of certified public expenditures and intergovernmental transfers. The initial Waiver covered the period from July 1, 2005 to June 30, 2010. The State requested and was granted an extension of this Waiver to October 31, 2010 by the federal government. The State and the federal government completed negotiations for a new Waiver on November 2, 2010 and is effective from November 1, 2010 to October 31, 2010. The new Waiver is titled “California’s Bridge to Reform Demonstration” and will expand coverage and the Safety Net Care Pool (SNCP). Within the SNCP, a Delivery System Reform Incentive Pool (DSRIP) was made available for the developing a program of activity that supports California’s public hospitals efforts in meaningfully enhancing the quality of care and the health of the patients and families they serve. In 2011 San Joaquin General Hospital received $16.7 million in DSRIP funds.
For other Waiver funding for San Joaquin General Hospital in 2011 included $27.7 million for Disproportionate Share Hospital payments, $6.6 million for SNCP, $3 million for Stabilization and $0.7 million for the Physician SPA
AB 1653 Hospital Fee Program – In 2009 the State created a hospital fee program under AB 1383 which imposed a fee on hospitals to be used to draw down federal matching dollars. These funds were used to increase Medi-Cal payments to hospitals and provide funding for children’s health care coverage. AB 1653 is a follow-up piece of legislation that made changes to the hospital fee program required by the federal government. As a result, San Joaquin General Hospital received $21.1 million in 2011 which covers the period from April 1, 2009 to December 31, 2010.
NOTE 2 – CASH AND INVESTMENTS With the exception of the Pension Fund, Revolving Loan Fund Trusts, and restricted Certificates of Participation proceeds, the San Joaquin County Treasurer-Tax Collector pools cash from various funds for investment purposes. The investment pool includes both voluntary and involuntary participation from external entities. Interest earned on investments is credited to individual funds based on their average daily cash balances and current year secured tax charges and direct assessments where applicable. The Pension Fund, Revolving Loan Fund Trusts, and restricted Certificates of Participation proceeds are invested and managed separately from the pooled cash and investments.
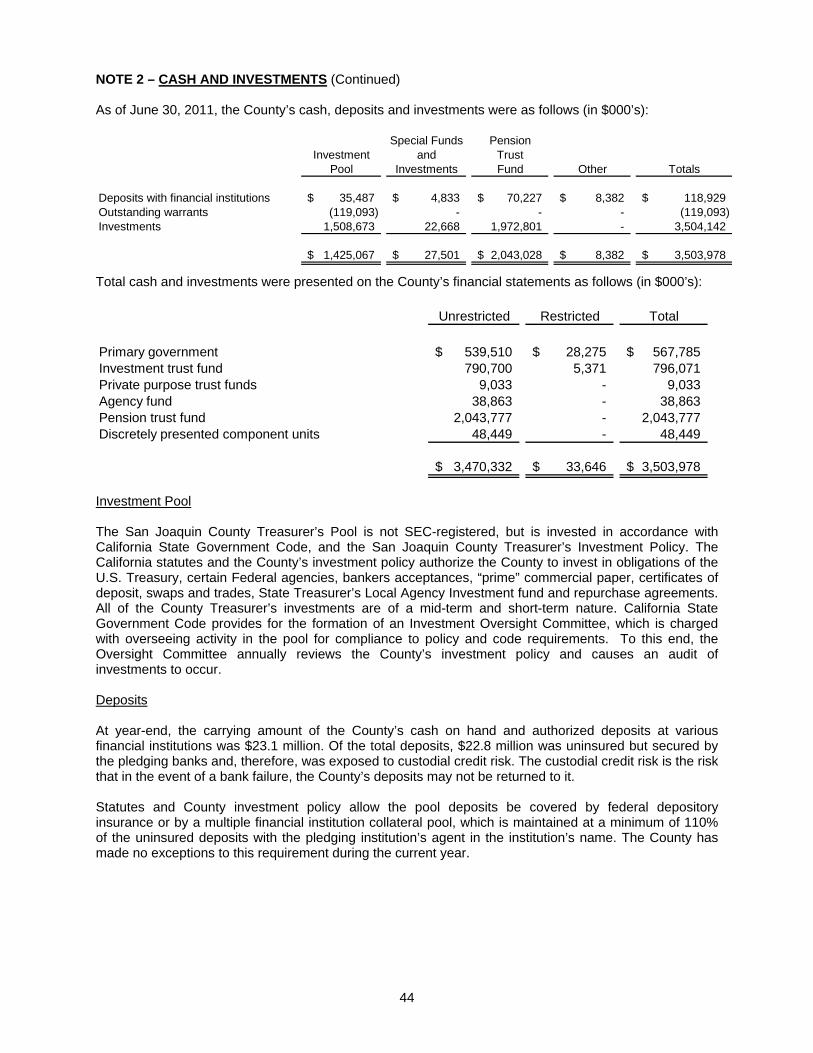
44
NOTE 2 – CASH AND INVESTMENTS (Continued) As of June 30, 2011, the County’s cash, deposits and investments were as follows (in $000’s):
Special Funds PensionInvestment and Trust
Pool Investments Fund Other Totals
Deposits with financial institutions 35,487$ 4,833$ 70,227$ 8,382$ 118,929$ Outstanding warrants (119,093) - - - (119,093) Investments 1,508,673 22,668 1,972,801 - 3,504,142
1,425,067$ 27,501$ 2,043,028$ 8,382$ 3,503,978$
Total cash and investments were presented on the County’s financial statements as follows (in $000’s):
Unrestricted Restricted Total
Primary government 539,510$ 28,275$ 567,785$ Investment trust fund 790,700 5,371 796,071 Private purpose trust funds 9,033 - 9,033 Agency fund 38,863 - 38,863 Pension trust fund 2,043,777 - 2,043,777 Discretely presented component units 48,449 - 48,449
3,470,332$ 33,646$ 3,503,978$
Investment Pool The San Joaquin County Treasurer’s Pool is not SEC-registered, but is invested in accordance with California State Government Code, and the San Joaquin County Treasurer’s Investment Policy. The California statutes and the County’s investment policy authorize the County to invest in obligations of the U.S. Treasury, certain Federal agencies, bankers acceptances, “prime” commercial paper, certificates of deposit, swaps and trades, State Treasurer’s Local Agency Investment fund and repurchase agreements. All of the County Treasurer’s investments are of a mid-term and short-term nature. California State Government Code provides for the formation of an Investment Oversight Committee, which is charged with overseeing activity in the pool for compliance to policy and code requirements. To this end, the Oversight Committee annually reviews the County’s investment policy and causes an audit of investments to occur. Deposits At year-end, the carrying amount of the County’s cash on hand and authorized deposits at various financial institutions was $23.1 million. Of the total deposits, $22.8 million was uninsured but secured by the pledging banks and, therefore, was exposed to custodial credit risk. The custodial credit risk is the risk that in the event of a bank failure, the County’s deposits may not be returned to it. Statutes and County investment policy allow the pool deposits be covered by federal depository insurance or by a multiple financial institution collateral pool, which is maintained at a minimum of 110% of the uninsured deposits with the pledging institution’s agent in the institution’s name. The County has made no exceptions to this requirement during the current year.

45
NOTE 2 – CASH AND INVESTMENTS (Continued) Investments As of June 30, 2011, the County had the following pool investments (in $000’s):
Weighted Fair ValueAverage as % of Credit
Fair Maturities the Pool RatingValue (in days) Investments S&P/MIS
Commercial Papers 159,976$ 19 10.6% A-1+/P-1Money Market Account 50,000 - 3.3% A-1+/P-1Wells Fargo Bank Sweep Account 51,279 - 3.4% A-1+/P-1Federal Farm Credit Bank 64,963 94 4.3% A-1+/P-1Federal Home Loan Bank 327,304 241 21.7% A-1+/P-1Federal Home Loan Mortgage Corporation 408,076 286 27.1% A-1+/P-1Federal National Mortgage Association 397,075 201 26.3% A-1+/P-1State Local Agency Investment Fund (LAIF) 50,000 - 3.3% Not rated
Total 1,508,673$ 189 100.0%
Interest Rate Risk – Interest rate risk is the risk that changes in interest rates will adversely affect the fair value of an investment. In accordance with the County investment policy, the County Treasurer manages the exposure to declines in fair values by limiting the weighted average maturity of the investment portfolio to three years or less. As of June 30, 2011, the weighted average maturity of the pool investments was 189 days. Credit Risk – Credit risk is the risk that an issuer or other counterparty to an investment will not fulfill its obligations. California statutes and the County’s Investment Policy limit the County investments to obligations of the U.S. Treasury, certain Federal agencies, bankers’ acceptances, “prime” commercial paper, certificates of deposit, swaps and trades, State Treasurer’s Local Agency Investment Fund and repurchase agreements. Credit ratings as of June 30, 2011, of the pool investments is presented above. Concentration of Credit Risk – Concentration of credit risk is the loss risk attributed to the magnitude of a government’s investment in a single issuer. The County’s investment policy places certain maximum percentage limitations of investments by investment type and the Treasurer has adhered to this policy with no exception. As of June 30, 2011, the County’s investments by investment type as the percentage of the pool investments are shown above. Investments in the securities of any individual issuer, other than U.S. Treasury securities, mutual funds, and external investment funds that represent 5 percent or more of pooled investments are as follows at June 30, 2011 (in $000’s):
Percent ofIssuer Amount Investments
Federal National Mortgage Association 397,075$ 26.3%Federal Home Loan Bank 327,304 21.7%Federal Home Loan Mortgage Corporation 408,076 27.1%
Custodial Credit Risk – Custodial credit risk is the risk that, in the event of the failure of the counterparty, the County will not be able to recover the value of its investments or collateral securities that are in the possession of an outside party. None of the County’s pooled investments were exposed to custodial credit risk during the fiscal year because all securities were held by the County’s safekeeping agent in the County’s name.

46
NOTE 2 – CASH AND INVESTMENTS (Continued) Investments (Continued) Local Agency Investment Fund (LAIF) – It is an investment pool managed by the California Department of Treasury. The County’s total investment in the LAIF at June 30, 2011, was $50 million which approximates fair value and is the same as the value of the pool shares which is determined on an amortized cost basis. This fund is not registered with the Securities and Exchange Commission as an investment company, but is required to invest according to California Government Code. Participants in the pool include voluntary and involuntary participants, such as special districts and school districts for which there are legal provisions regarding their investments. The Local Investment Advisory Board (Board) has oversight responsibility for LAIF. The Board consists of five members as designated by State Statute. The total amount invested by all public agencies in PMIA on that day was $66.4 billion. Of that amount, 5.01% was invested in structured notes and asset-backed securities with the remaining 94.99% invested in other non-derivative financial products. Statement of Net Assets The following represents condensed statements of net assets and changes in net assets for the Treasurer’s investment pool as of June 30, 2011. The cash and investments of the Revolving Loan Funds and the deposits with other banks are not included in this statement, as they are managed and invested by a trustee bank.
Internal ExternalInvestment Investment
Pool Pool Total
Assets:Cash and investments** 630,930$ 794,137$ 1,425,067$ Investment income receivable 898 1,370 2,268 Pool participants fund deposit receivable 183,532 25,998 209,530 Other assets 44,903 2,292 47,195
860,263 823,797 1,684,060
Liabilities 235,120 52,804 287,924
Net Assets 625,143$ 770,993$ 1,396,136$
Statement of Net Assets (in $000's)
** Not including the cash and investments of the Revolving Loan Fund and the deposits with other banks
that were managed by the trustee banks.

47
NOTE 2 – CASH AND INVESTMENTS (Continued) Statement of Net Assets (Continued)
Internal ExternalInvestment Investment
Pool Pool Total
Additions:Contributions 2,207,707$ 3,934,317$ 6,142,024$ Investment income 2,372 4,364 6,736
Total Additions 2,210,079 3,938,681 6,148,760
Deductions:Distributions 2,136,623 3,981,848 6,118,471
Net Change 73,456 (43,167) 30,289
Net Assets - Beginning 551,687 845,273 1,396,960 Prior Period Adjustment - (31,113) (31,113)
- Net Assets - Ending 625,143$ 770,993$ 1,396,136$
Statement of Changes in Net Assets (in $000's)
Special Funds and Investments In addition to the County Treasurer’s investment pool, certain specific funds and investments are managed by contracted financial institutions and include the Revolving Loan Fund and the restricted Certificates of Participation (COPs) and Revenue Bonds proceeds. The investments of COPs and revenue bonds were reported as restricted cash and investments on the financial statements. The purpose of the restricted cash is to fund future long-term debt payments ($23.9 million) and capital projects ($0.1 million) and to restrict cash for patient gift funds ($995,997). Presented below are those deposits and investments managed by the trustee banks at June 30, 2011 (in $000’s):
Fair ValueRevolving Weighted Credit
Loan Certificates of Average RatingFund Participation Total Maturities (yrs) S&P/MIS
Cash and money market fund deposits 3,510$ 3,680$ 7,190$ Not applicable Not applicableFederal Home Loan Bank - 6,545 6,545 1.1 A-1+/P-1Federal Home Loan Mortgage Corporation - 2,055 2,055 1.7 A-1+/P-1Federal National Mortgage Association - 2,269 2,269 0.5 A-1+/P-1Repurchase Agreements - 8,120 8,120 Not applicable A/AFederal Farm Credit Banks - 1,322 1,322 1.5 A-1+/P-1
3,510$ 23,991$ 27,501$
All of the underlying investments of the fixed income mutual fund were in obligations of the U.S. government and were not subject to credit risk.

48
NOTE 2 – CASH AND INVESTMENTS (Continued) Pension Trust Fund Investments The Pension Trust Fund’s investment activity is governed by the Board of Retirement’s policy. In fiscal year 2010-11, the targeted allocations of the investment portfolio were: 18% in domestic equity investments, 18% in international equities, 34% in fixed income investments, 10% in real estate investments, and 20% in alternative investments. The Pension Fund’s investments, are presented below at fair value in accordance with GASB Statement No. 25, consist of both short term and long term investments (in $000’s):
FairValue
Investments:Domestic equities $ 356,425 Domestic debt securities 344,740 International equities 371,823 Real estate 318,911 Alternative investments 466,738
Sub-Total 1,858,637
Investments Held by Broker-Dealers Under Securities Loans:
Domestic equities 92,190 Domestic debt securities 19,852 International equities and debt securities 2,122
Total Investments Held by Broker-Dealers Under Securities Loans 114,164
Commingled Funds:Short-term investment pool 70,227
Sub-Total 184,391
Total 2,043,028$
All investments owned by the Pension Trust Fund (the Plan) are held for safekeeping by independent master custodians through a “book entry system”. Cash not needed for the Plan’s daily operations is deposited with the Plan master custodian, who pools from their clients all cash pending for permanent investment in their Short Term Investment Fund (STIF) and/or Short-Term Extendable Portfolio (STEP) accounts. The cash in the STIF account is invested in high-grade money market instruments with very short maturities, such as bonds, notes, foreign currency deposits (call deposits) and forward exchange contracts on a short-term basis. The cash in the STEP account is invested in various securities with the purpose of maximizing returns to the extent consistent with minimizing unit value volatility. The STEP investments are marked to market daily. At December 31, 2010, the Plan had $116.0 million, $71.0 million, and $114.1 million in the STIF, the STEP, and the security lending STIF account, respectively.

49
NOTE 2 – CASH AND INVESTMENTS (Continued) Pension Trust Fund Investments (Continued) Security Lending – The security lending STIF account represents the short-term investment of the cash collateral received from the borrower under the security-lending program. The Plan’s master custodian was appointed as the lending fiduciary by the Plan. Under the contract, the master custodian may lend securities of the Plan, other than commingled funds, held by it to certain Plan approved security borrowers. All loans are fully collateralized with cash, securities issued or fully guaranteed by the U.S. Government, or irrevocable bank letters of credit. Initial collateralization is 102% of the market value of the loaned securities. As securities are loaned, collateral is maintained at a minimum of 100% of the market value of the securities plus accrued income. The potential risks involved in the security-lending program include: borrower bankruptcy, collateral deficiencies, and problems with settlements, corporate actions, dividends and interest. Since the security-lending program is operated on a pooled basis, the cash collateral and the market value of non-cash collateral are pro-rated among all participants. The securities lending contracts do not allow the lenders to pledge or sell any non-cash collateral unless the borrower defaults. Cash collateral, on the other hand, is invested by the Plan’s master custodian in a fund created solely for the investment of cash collateral purposes. At year-end, the Plan had no credit risk exposure to borrowers because the amounts the Plan owes the borrowers exceeded the amounts the borrowers owe the Plan. The cash collateral is reported on the financial statement as an asset and as a liability of the Pension Fund while the non-cash collateral is reported neither as an asset or liability in accordance with GASB Statement No. 28. The pension trust fund’s portion of the securities lending program has earned $267,807 and $449,142, in 2010 and 2009 respectively. The table below details the County’s out-on-loan securities, excluding the commingled funds owned by the SJCERA, as of December 31, 2010 (in $000’s):
Cash Non-Cash
Collateral CollateralFair Value Value Value
Domestic equities $ 90,873 $ 92,190 $ 1,012 Domestic debt securities 21,752 19,852 2,344 International equities 2,635 499 2,283 International debt securities 1,560 1,623 -
Total 116,820$ 114,164$ 5,639$

50
NOTE 2 – CASH AND INVESTMENTS (Continued) Pension Trust Fund Investments (Continued) Credit Risk – The Plan’s investments at December 31, 2010 that were exposed to credit risk (in $000’s) and the corresponding credit ratings from Standard & Poor (S&P):
FairValue
Pension S&P credit ratingAAA 25,190$ AA 13,269 A 47,907 BBB 51,184 BB 18,353 B 28,087 CCC 5,600 CC 243 C - D 280 Not rated 45,427 U.S. government and agencies (implicit guarantee, includes FNMA, FHLB, FHLMC, and others) 109,200
Total investments in fixed domestic income securities 344,740$
Custodial Credit Risk – All cash deposits with the pension fund’s independent custodian, Northern Trust (NT), were uninsured and uncollateralized. All investment securities were held by NT and identified by NT’s internal records that the Plan was the owner of the securities, and therefore they were not subject to custodial credit risk. Concentration of Credit Risk – The Plan’s investment policy restricts investment holdings to maximum of 5% of any single issuer within the Plan’s investment portfolio. At December 31, 2010, the investment portfolio contained no concentration of investments in any one entity that represented 5% or more of the Plan net assets. Interest Rate Risk – The Plan manages its exposure to declines in fair values by requiring a minimum quality rating of Baa (Moody’s) or BBB (Standard & Poor’s) for fixed income securities. To manage interest rate risk, the effective duration of the total fixed income portfolio is restricted to 0.5 to 1.5 times certain aggregate bond indexes. At December 31, 2010, the Plan’s investments subject to the interest rate risk are presented below (in $000’s):

51
NOTE 2 – CASH AND INVESTMENTS (Continued) Pension Trust Fund Investments (Continued)
WeightedFair Average
Value Maturity (Years)
Asset backed securities 10,576$ 9.8Bank loans 40,351 4.5Commercial mortgage-backed 4,089 33.9U.S. government bonds 24,257 3.4U.S. government mortgages 108,791 20.1U.S. government agencies 2,270 7.2Corporate and other credit 131,208 4.8Non-government backed CMO's 11,284 28.7Municipal/Revenue bonds 11,914 23.2
Total 344,740$
Derivative Financial Instruments – The Plan uses forward settlement contracts, forward currency contracts, futures and options contracts, and other derivative products within fixed income financial instruments to reduce financial market risks, enhance yields and to participate in all market areas without increasing investment costs. At December 31, 2010, the Plan’s derivative financial instruments had a fair value of $8.1 million. Foreign Currency Risk – The Foreign Currency Risk is the risk that changes in exchange rates will adversely affect the fair value of an investment or deposit. SJCERA’s exposure to Foreign Currency Risk in U.S. dollars as of December 31, 2010 is as follows (in $000’s):
FairCurrency Type Value
Argentine peso 9$ Australian dollar 422 Brazilian real 8,645 British pound sterling 2,231 Canadian dollar (229) Chinese yuan renminbi 884 Columbian peso 677 Euro Currency 1,057 Hong Kong dollar 1,220 Indonesian rupiah 1,380 Japanese yen 1,028 Malaysian ringgit 2,052 Mexican peso 1,298 Norwegian krone 353 Philippine peso 192 Polish zloty 130 Russian ruble 160 Singapore dollar 781 Swedish krona 411 Thailand baht 491 Turkish lira 447
Totals 23,639$

52
NOTE 3 – RECEIVABLES Taxes and accounts receivable balances of the County’s major individual funds and nonmajor and internal service funds in the aggregate, including the applicable allowance for uncollectible accounts are as follows (in $000’s):
Mental Health First Five County Other Internal TotalReceivables - General and Substance Program Capital Governmental Service GovernmentalGovernmental Activities Fund Abuse Fund Fund Outlay Fund Funds Funds Activities
Taxes - gross 71,189$ -$ -$ -$ 509$ -$ 71,698$ Accounts 2,743 2,460 - - 660 193 6,056 Sales tax 1,650 - - - 1,401 - 3,051 Interest 94 61 9 112 202 203 681 Loan receivable 20 - - - - - 20 Due from other agencies 53,221 2,231 1,354 - 3,060 1,678 61,544
Gross receivables 128,917 4,752 1,363 112 5,832 2,074 143,050 Less: allowance for uncollectible (15,659) - - - - - (15,659)
113,258$ 4,752$ 1,363$ 112$ 5,832$ 2,074$ 127,391$
Total
Receivables - Solid Business-TypeBusiness-Type Activities Hospital Airport Waste Activities
Accounts 39,291$ 114$ 1,245$ 40,650$ Interest - 2 19 21 Due from other agencies 19,462 3 38 19,503
Gross receivables 58,753 119 1,302 60,174
58,753$ 119$ 1,302$ 60,174$
Governmental funds report deferred revenues in connection with receivables for revenues not considered available to liquidate liabilities of the current period. Governmental and enterprise funds also defer revenue recognition in connection with resources that have been received, but not yet earned. At June 30, 2011, the various components of deferred revenue and unearned revenue reported were as follows (in $000’s): Governmental Activities: Unavailable Unearned Total
General Fund:Property taxes receivable – secured $ 63,901 $ - $ 63,901 Property taxes receivable – unsecured 4,243 - 4,243 Due from other governmental agencies 14,872 - 14,872 Grants received prior to meeting all eligible requirements - 20,288 20,288 Others 761 - 761
Mental Health and Substance Abuse Fund:Due from other governmental agencies 2,033 - 2,033
Other Governmental Funds and Internal Service Funds:Due from other governmental agencies 21 - 21 Others 1,379 - 1,379 Property taxes receivable - unsecured 509 - 509
87,719$ 20,288$ 108,007$

53
NOTE 3 – RECEIVABLES (Continued) Business-Type Activities: Unavailable Unearned Total
Hospital $ - $ 3,620 $ 3,620 Airport 3 1,007 1,010 Solid Waste - - -
3$ 4,627$ 4,630$
NOTE 4 – INTERFUND TRANSACTIONS AND BALANCES Due to and due from other funds Due to and due from other funds represents short-term borrowing between funds and regular services and supplies provided but not settled at year-end. The composition of interfund balances as of June 30, 2011 is as follows:
Receivable Fund Payable Fund Amount
General Fund Hospital 6,527$ Airport 400,203 Solid Waste 462 Internal Service Funds 28,891 General Fund 56,494 Mental Health and Substance Abuse Fund 16,075 First Five Program Fund 21,638 County Capital Outlay Fund 1,988 Nonmajor Funds 36,655
568,933
County Capital Outlay Fund Internal Service Funds 649,415
649,415
Nonmajor Funds Capital Outlay Fund 183 Nonmajor Funds 51,437
51,620
Governmental Funds 1,269,968

54
NOTE 4 – INTERFUND TRANSACTIONS AND BALANCES (Continued) Due to and due from other funds (Continued)
Receivable Fund Payable Fund Amount
Internal Service Funds Hospital 54,051 Airport 3,356 Solid Waste 6,699 Internal Service Funds 13,806 General Fund 841,190 Mental Health and Substance Abuse Fund 63,583 First Five Program Fund 597 Capital Outlay Fund 1,238 Nonmajor Funds 218,953
Internal Service Funds 1,203,473
Hospital General Fund 72,922 Internal Service Funds 2,241
75,163
Solid Waste General Fund 23 Nonmajor Funds 6,042
6,065
Airport Airport PFC 50,924
Total Enterprise Funds 132,152
2,605,593$
Advances to/from other funds
Receivable Fund Payable Fund Amount
General Fund Other Governmental Funds 5,709,733$ Airport 2,339,496
8,049,229
County Capital Outlay Fund Internal Service Funds 276,134
276,134
Other Governmental Funds Other Governmental Funds 664,892
664,892
8,990,255$

55
NOTE 4 – INTERFUND TRANSACTIONS AND BALANCES (Continued) Fund Transfers During the course of normal operations, the County has numerous transactions between funds as a result of labor negotiations, new funding resources, new projects, debt service payments, etc. Those transfer transactions are summarized below (in $000’s):
Transfer from Transfer to Amount
General Fund Hospital 18,197$ General Fund 2,266 First 5 1,011 Stockton Metropolitan Airport 242 Mental Health and Substance Abuse Fund 8,480 Internal Service Funds 1,015 Other Governmental Funds 8,063
39,274
Mental Health and Substance Abuse Fund General Fund 1,253
1,253
First Five Program Genera Fund 1,139
1,139
County Capital Outlay Fund General Fund 10,072
10,072
Other Governmental Funds General Fund 3,593 Other Governmental Funds 3,014
6,607
58,345$

56
NOTE 5 – CAPITAL ASSETS Capital asset activity for the year ended June 30, 2011, was as follows (in $000’s):
RestatedBalance Transfers and Balance
June 30, 2010 Additions Retirement Adjustments June 30, 2011Governmental ActivitiesCapital assets, not being depreciated:
Land 13,935$ 716$ (100)$ -$ 14,551$ Construction in progress 5,963 5,214 - - 11,177
Total capital assets, not being depreciated 19,898 5,930 (100) - 25,728
Capital assets, being depreciated:Structure and improvements 424,617 4,013 (900) - 427,730 Furniture and equipment 90,049 3,625 (2,734) - 90,940 Capitalized leases 9,280 1,013 (15) - 10,278 Other capitalized assets 8,742 - - - 8,742 Infrastructure 330,599 17,990 - - 348,589
Total capital assets, being depreciated 863,287 26,641 (3,649) - 886,279
Less accumulated depreciation for:Structure and improvements 123,111 8,833 (358) - 131,586 Furniture and equipment 56,271 7,721 (2,681) - 61,311 Capitalized leases 5,506 1,141 (3) - 6,644 Other capitalized assets 8,742 - - - 8,742 Infrastructure 121,605 12,479 - - 134,084
Total accumulated depreciation 315,235 30,174 (3,042) - 342,367
Total capital assets, being depreciated, net 548,052 (3,533) (607) - 543,912
Governmental activities capital assets, net 567,950$ 2,397$ (707)$ -$ 569,640$
Business-Type ActivitiesCapital assets, not being depreciated:
Land 4,663$ -$ -$ -$ 4,663$ Construction in progress 6,961 516 - (458) 7,019
Total capital assets, not being depreciated 11,624 516 - (458) 11,682
Capital assets, being depreciated:Structure and improvements 183,147 5,594 - 21 188,762 Furniture and equipment 73,804 3,382 (878) (2,455) 73,853 Capital leases - 1,455 - 2,892 4,347
Total capital assets, being depreciated 256,951 10,431 (878) 458 266,962
Less accumulated depreciation for:Structure and improvements 100,339 7,141 - - 107,480 Furniture and equipment 54,026 3,784 (862) (1,498) 55,450 Capital leases - 490 - 1,498 1,988
Total accumulated depreciation 154,365 11,415 (862) - 164,918
Total capital assets, being depreciated, net 102,586 (984) (16) 458 102,044
Business-type activities capital assets, net 114,210$ (468)$ (16)$ -$ 113,726$

57
NOTE 5 – CAPITAL ASSETS (Continued) Depreciation expense was charged to governmental functions as follows (in $000’s):
Amount
General government 4,241$ Public protection 5,680 Public ways and facilities 13,010 Health and sanitation 1,080 Social services 1,591 Education 42 Culture and recreation 1,008 Depreciation on capital assets held by the County internal service funds is charged to the various functions based on their usage of the assets 3,522
Total depreciation expense - governmental activities 30,174$
Depreciation expense was charged to business-type functions as follows (in $000’s):
Amount
Airport enterprise 1,675$ Solid Waste enterprise 3,139 General Hospital enterprise 6,601
Total depreciation expense – business-type functions 11,415$
NOTE 6 – LONG-TERM DEBT The following is a schedule of long-term liabilities as of June 30, 2011 (in $000’s): Governmental Activities:
AmountAmounts
Balance Balance Due WithinJune 30, 2010 Additions Deductions June 30, 2011 One Year
Teeter note 28,500$ -$ 14,000$ 14,500$ 14,500$ Certificates of participation 132,825 - 2,350 130,475 2,515 Discount/gain on advance refunding (net) 1,458 - (247) 1,705 - Notes payable 2,835 - 790 2,045 65 Capital leases 3,628 1,003 1,433 3,198 1,186 Other postemployment benefits 30,682 9,663 1,618 38,727 - Compensated absences 31,396 30,500 31,396 30,500 25,058 Estimated claims 57,846 - 2,680 55,166 -
289,170$ 41,166$ 54,020$ 276,316$ 43,324$
Estimated claims are liquidated by the internal service funds. Compensated absences are generally liquidated by the General Fund and related special revenue funds.

58
NOTE 6 – LONG-TERM DEBT (Continued) Business-Type Activities:
AmountAmounts
Balance Balance Due WithinJune 30, 2010 Additions Deductions June 30, 2011 One Year
Certificates of participation 88,165$ -$ 7,465$ 80,700$ 7,935$ Discount/gain on advance refunding (net) (4,716) - (520) (4,196) - Notes payable 71 - 5 66 6 Capital lease 1,222 1,455 811 1,866 827 Landfill closure and postclosure 14,187 - 3,190 10,997 - Other postemployment benefits 7,548 2,612 404 9,756 - Compensated absences 6,410 6,533 6,410 6,533 5,818
112,887$ 10,600$ 17,765$ 105,722$ 14,586$
A. Capital Leases
The County has entered into long-term capital leases agreements under which the related equipment will become the property of the County when all terms of the lease agreements are met. Equipment under capital leases includes the following:
Governmental Business-TypeActivities Activities
Equipment $ 10,277,422 $ 4,346,813 Less: accumulated depreciation 6,643,674 1,987,552
Net Value 3,633,748$ 2,359,261$
The related amortization on the capital leases is as follows:
Year Ended Governmental Business-TypeJune 30 Activities Activities
2011-12 1,318,121$ 880,902$ 2012-13 976,669 353,461 2013-14 645,676 331,833 2014-15 319,540 316,596 2015-16 101,057 97,190
2016 - 2020 108,588 -
Total Requirements 3,469,651 1,979,982 Less Interest 271,673 114,118
Present Value of Remaining Payments 3,197,978$ 1,865,864$

59
NOTE 6 – LONG-TERM DEBT (Continued) B. Certificates of Participation and Notes Payable
Certificates of Participation The County had the following Certificates of Participation (COPs) issues outstanding at June 30, 2011:
Face Value Year-EndProject Name Issuance Date of the COP Balance
1993 Capital Facilities Project (partially refunded by 2007 COP) October 1, 1993 110,740,000$ 7,645,000$
Solid Waste System Facilities Project (including refunding) May 8, 2003 36,830,000 19,460,000
2000 San Joaquin General Hospital Refunding May 1, 2000 108,420,000 61,240,000
2007 County Administration Building May 23, 2007 114,635,000 114,635,000
2007 County Service Area No. 31 December 1, 2007 8,450,000 8,195,000
Total 379,075,000$ 211,175,000$
According to the official statements of the Certificates of Participation, all proceeds from the issuance are held and maintained by a Trustee Bank (Trustee) for the County Treasury. The Trustee invests the proceeds in demand or time deposits of any bank authorized to accept deposits of public funds, and/or in permitted investments as authorized by the County. Interest or profits on such investments received by the Trustee are, prior to the completion of the acquisition, construction and installation of the project, deposited in the Project Fund and thereafter are deposited in the Interest Fund. Costs of the acquisition and construction of the project are paid by the Trustee from the Project Fund, upon the County’s authorization. Once the project is completed, the remaining funds in the Acquisition and Construction Fund, if any, are transferred to the County’s proper funds or to the debt service funds. The 2007 County Service Area No. 31 Project COPs are recorded as the liabilities of the Governmental Activities on the Statement of Net Assets. The debt service transactions and the fund balance of the reserve are recorded in the County’s Debt Service Fund. The portion of the proceeds that is used for the acquisition and construction of certain sanitary sewer improvements is recorded in the County’s Capital Outlay Fund. All related capital assets are also included in the Governmental Activities on the Statement of Net Assets. The 2007 COPs were issued on December 1, 2007 with an average interest rate from 4.10% to 5.8%. The proceeds, after the required deposit to the Reserve Fund and issuance costs and discounts, are deposited in the Improvement Fund to finance the acquisition and construction of certain sanitary sewer improvements. The certificates mature in 2037 with principal payments ranging from $125,000 to $590,000. The 2007 County Administration Building Project COPs are recorded as the liabilities of the Governmental Activities on the Statement of Net Assets. The debt service transactions and the fund balance of the reserve are recorded in the County’s Debt Service Fund. The portion of the proceeds that is used for the construction of the County administration building is recorded in the County’s Capital Outlay Fund. All activities are also included in the Governmental Activities on the Statement of Net Assets.

60
NOTE 6 – LONG-TERM DEBT (Continued) B. Certificates of Participation and Notes Payable (Continued)
Certificates of Participation (Continued) The 2007 COPs were issued on May 23, 2007 with an average interest rate from 4.75% to 5.0%. A portion of the proceeds from the new issuance was deposited in an irrevocable trust ($18,398,857) with an escrow agent to provide for future scheduled debt services on the refunded 1993 COPs. As a result, the refunded portion of the outstanding 1993 COPs are considered to be defeased and the liability for those debts has been removed from the financial statement. The remaining proceeds, after the required deposit to the Reserve Fund and issuance costs and discounts, are deposited in the Improvement Fund for the design and construction of the new County administration building. The final acceptance and occupancy of the new building occurred in August 2009. The certificates mature in 2036 with principal payments ranging from $2,765,000 to $7,985,000. The 2003 Solid Waste System Facilities Projects COPs are recorded in the Solid Waste enterprise fund. The COPs were issued on May 8, 2003 with an average interest rate of 6.5% to advance refund the outstanding Certificates of Participation issued in 1994, current refund the outstanding Certificates of Participation issued in 1991, and provide approximately $17 million to fund various Solid Waste System Facilities projects. These Certificates are repaid from the net revenues of the County’s solid waste system operations in accordance with the COP agreements. The improvement of real property is recognized in the Enterprise Fund’s capital improvements. The certificates mature in 2022 with principal payments ranging from $1,360,000 to $3,155,000. The 1991 Certificates were paid off in May 2003, and the 1994 Certificates were paid off in April 2004. The deferred amount on this refunding (the difference between the net carrying amount of old debt and the amount of funds required to redeem the old debts or to be deposited in escrow fund to refund old debts at the time of refunding) is amortized over the life of the original debt, which is shorter than the new debt. The 1999 San Joaquin General Hospital Refunding COPs are recorded in the San Joaquin General Hospital enterprise fund. The COPs were issued on May 1, 1999 with an average interest rate of 4.9% to advance refund the then outstanding Certificates of Participation issued for the 1993 San Joaquin General Hospital Expansion Project with an average interest rate of 6.48%. The refunded COPs were paid off in September 2003. The refunding COP matures in 2021 with principal payments ranging from $4,370,000 to $6,735,000. The 1993 Capital Facilities Project COPs are recorded as the liabilities of the Governmental Activities on the Statement of Net Assets. The debt services transactions and fund balance of the remaining proceeds are recorded in the County’s Debt Service Fund. The related building structures and improvements are also recorded in the Governmental Activities on the Statement of Net Assets. The 1993 COPs were issued on October 1, 1993 with an average interest rate from 3.86% to 5.16% to advance refund the then outstanding Certificates of Participation with an average interest rate of 6.07% to 7.18%. The then outstanding COPs included the 1989 Human Services Facilities Project COPs, the 1989 Jail and Sheriff’s Operating Center Project, and the 1991 Public Facilities Project. The refunded COPs were paid off in November 2004. On May 23, 2007, the County issued the 2007 COPs. Of the face value of $114,635,000, $18,398,857 was deposited in an escrow fund to pay the scheduled debt service on the Refunded 1993 Certificates of Participation to and including September 4, 2007, and to prepay on September 4, 2007, the refunded 1993 Certificates maturing November 15, 2019, at a prepayment price equal to 100% of the principal represented by the Refunded 1993 Certificates plus accrued interest. The refunded portion of the outstanding 1993 COPs, along with the related original deferred amount on the 1993 Certificates, are considered to be defeased and the liability for those debts have been removed from the financial statement. As of June 30, 2011, the certificates defeased had an outstanding balance of $18,355,000.

61
NOTE 6 – LONG-TERM DEBT (Continued) B. Certificates of Participation and Notes Payable (Continued)
Certificates of Participation (Continued) Repayments made by the County to the Trustee Bank are held in trust by the Trustee Bank in the Interest Fund or the Base Rental Fund for the benefit of the County, but are irrevocably pledged to the trustee for the benefit of the owners of Certificate of Participation. The funds are used for the payment of interest and principal evidenced by the certificates. The unfunded portion of the 1993 COP matures in 2014 with principal payments ranging from $2,220,000 to $2,720,000. Notes Payable In November 2002 the County signed a fixed-price agreement of $5.7 million to purchase an electronic voting system. To finance the purchase and additional related project costs, the County signed a loan agreement with a financial institution in an amount of $3.2 million. The remaining project cost is to be funded by the State, pursuant to the 2002 California Voting Modernization Act (Proposition 41). In addition, the Federal government may also provide additional funding pursuant to Federal Bill House Resolution 3295. The purchase and loan agreements were finalized on July 1, 2003. The electronic voting machines were delivered on July 1, 2003 and the loan carries a term of 10 years with an interest rate of 4.73%. This note payable was paid in full as of June 30, 2011. The County Maintenance Districts of Shaded Terrace and Sunnyside Estates (Special Revenue Funds) had entered into agreements with the United States Department of Agriculture (USDA) for a loan of $300,000 and $100,000, respectively, in 2000-01. The loans, along with the grants received from USDA, are used to finance certain capital improvements to the water system of the Districts. As of June 30, 2011 the outstanding balances on the loans totaled $339,063. In fiscal year 2004-05, the County settled a lawsuit that was filed by H.D. Arnaiz, LTD, a California limited partnership (HDAL). This lawsuit involved the HDAL’s rights to lease certain real property around the Airport area. The settlement requires the County to make an annual payment of $132,115 between August 2005 and August 2029 (Promissory Note). In addition, the County is to make an annual property tax-based payment between September 2005 and September 2029 (Tax-based agreement). The tax-based payment is to be calculated each year and to be paid only if a certain threshold is met. The sum total of the payments under the promissory note payment and the tax-based agreement, in the aggregate is not to exceed $4.0 million prior to 2029. The County reports it as a note liability ($2.0 million) of the Casualty Insurance Fund, an internal service fund, at the present value of the minimum payments. As of June 30, 2011, the outstanding note was approximately $1.7 million. The Airport (Enterprise Fund) has the remaining life of a 12-year note with a third party which financed the 1993-94 purchase of a paint shop. The note had a fixed interest rate of 12%. It carried a balance of $65,653 as of June 30, 2011, and will be paid in full in 2018. Teeter Plan Borrowing Pursuant to Revenue and Taxation Code Section 4701, the County has opted into the “Alternative Method of Property Tax Distribution” method since fiscal year 1993-94. This method is known as the “Teeter Plan”. Under the Teeter Plan, the County and all other taxing agencies received 100% of the current secured tax levy and direct assessments. In 1993-94, all taxing agencies received their share of 95% of all outstanding delinquent taxes and 100% of delinquent assessments. Additionally, Senate Bill 742 (1993) allowed counties converting to the Teeter Plan a one-time property shift reduction for the excess property tax revenues that schools received in 1993-94 due to the conversion.

62
NOTE 6 – LONG-TERM DEBT (Continued) B. Certificates of Participation and Notes Payable (Continued)
Teeter Plan Borrowing (Continued) In order to convert to the Teeter Plan, the County had to buy out the existing unpaid property taxes, which was approximately $14.5 million as of June 30, 2011. The County has been choosing the interfund borrowing method to partially finance the buy-out every year since 1993-94. The County utilizes the delinquent tax penalty collections in 2010-11, and extra amount set aside in the loss reserve fund, and the interfund borrowing of $14.5 million to finance the buy-out and the cumulative interest cost on the borrowing. The interfund borrowing of $14.5 million is collateralized with the uncollected taxes and is recorded in the General Fund. The interfund borrowing note, dated June 28, 2011, is to be repaid in full by July 1, 2012. However, the intention of the borrowing is to refinance the Note every year until such time that the collection of delinquent taxes is sufficient to repay the note. The interest expense of the Teeter-Plan borrowing is computed based on the County Treasury’s investment rate and was reported within the County General Fund. In fiscal year 2010-11, the County recognized $180,026 interest expense on the loan. The County is required by law to maintain a Loss Reserve Fund (classified as the General Fund’s restricted net assets) in an amount equivalent to 1% of the total tax roll for that year. At June 30, 2011, the County set aside 2.5%, instead of 1%. The reserve fund balance was $15.7 million. Schedule of Future Payments The following is a schedule of the future long-term debts payments as of June 30, 2011 (in $000’s): Governmental Activities:
Certificates ofParticipation Notes Payable
Year EndedJune 30 Principal Interest Principal Interest
2012 2,515$ 6,423$ 65$ 91$ 2013 2,690 6,281 67 88 2014 2,870 6,128 70 85 2015 2,925 5,977 74 82 2016 3,070 5,827 77 79
2017-2021 18,110 26,564 437 339 2022-2026 22,855 21,444 542 235 2027-2031 29,195 14,980 537 107 2032-2036 37,115 6,889 79 37 2037-2041 9,130 259 97 16
130,475 100,772 2,045 1,159 Add gain on advance refunding 1,705 - - -
Total Debt 132,180$ 100,772$ 2,045$ 1,159$

63
NOTE 6 – LONG-TERM DEBT (Continued) B. Certificates of Participation and Notes Payable (Continued)
Schedule of Future Payments (Continued) Business-Type Activities:
Certificates ofParticipation Notes Payable
Year EndedJune 30 Principal Interest Principal Interest
2012 7,935$ 3,912$ 6$ 8$ 2013 6,620 3,528 7 7 2014 6,950 3,190 8 6 2015 7,310 2,821 9 5 2016 7,695 2,441 10 4
2017-2021 42,240 6,023 26 3 2022-2026 1,950 98 - -
80,700 22,013 66 33 Less discount on advance refunding (4,196) - - -
Total Debt 76,504$ 22,013$ 66$ 33$
NOTE 7 – LEGAL DEBT MARGIN California Government Code Section 29909, together with Revenue and Taxation Code section 135, limits the County’s ability to raise resources through the issuance of debt to finance acquisitions or construction of County facilities. The computation of the debt limitation and legal debt margin is presented below: Net assessed value fiscal year 2010-11 54,830,715,039$
Legal Debt Limit – 1 1/4% of total assessed value 685,383,938$ Amount of debt applicable to debt limit: -$ Arbitrage The Tax Reform Act of 1986 instituted certain arbitrage restrictions with respect to the issuance of tax-exempt bonds after August 31, 1986. Arbitrage regulations deal with the investment of all tax-exempt bond proceeds at an interest yield greater than the interest yield paid to bondholders. Generally, all interest paid to bondholders can be retroactively rendered taxable if applicable rebates are not reported and paid to the Internal Revenue Service (IRS) at least every five years. During the current year, the County performed calculations of excess investment earnings on various bonds and financings and at June 30, 2011 does not expect to incur a significant liability. Special Assessment Debt Special assessment district transactions are recorded in the Agency Fund as the County acts as an agent for the property owners in collecting assessments bonds and forwarding the collections to the bondholders. However, the County is not obligated in any manner for repayment of these special assessments. As of June 30, 2011, such special assessment debt outstanding totaled approximately $677,243.

64
NOTE 8 – LANDFILL CLOSURE AND POSTCLOSURE LIABILITY State and federal laws and regulations require the County to place a final cover on its landfills when it stops accepting waste and to perform certain maintenance and monitoring functions at the site for thirty years after closure. Although closure and postclosure care costs will be paid only near or after the date that the landfill stops accepting waste, GASB 18, Accounting for Municipal Solid Waste Landfill Closure and Postclosure Care Costs, requires a portion of these closure and postclosure care costs to be recognized as an operating expense in each period of operation, based on landfill capacity used. The County is also required by state and federal laws and regulations to make annual contributions to a trust to finance closure and postclosure care. The County uses the Solid Waste Closure Fund, reported within the Solid Waste Enterprise Fund, to account for the contributions, as well as the landfill closure and postclosure costs. At June 30, 2011, the landfill closure and postclosure care liability ($11.0 million) represents the cumulative amount reported to date based on the cumulative usage of the landfills’ capacity, minus the cash payments made. The remaining estimated cost of closure and postclosure care of $91.5 million will be recognized as the remaining estimated capacities are filled. These amounts are based on what it would cost to perform all closure and postclosure care in 2011. Actual cost may be higher due to inflation, changes in technology, or changes in regulations. Prior year deposits and interest earned exceeds the minimum closure fund balance required by the State, therefore no transfers into the closure fund were made in fiscal year 2010-11. The funds available for landfill closure and post-closure remain at $5.2 million, which leaves approximately $5.8 million to be funded in future years. Two of the county’s four landfills have been closed. The remaining two landfills are Foothill and North County. Foothill received a permit revision which increased the height and capacity of the landfill, thereby extending its operation until 2081. Foothill is at 5.3% of the new capacity. North County will be operative until 2048 and is at 11.6% capacity. NOTE 9 – RISK MANAGEMENT PROGRAMS The County is exposed to various risks of loss related to torts; theft of, damage to, and destruction of assets; errors and omissions; injuries to employees; natural disasters and employees’ health. To effectively manage those risks and control costs, the County established self-insurance programs for casualty (December, 1974), workers compensation (June, 2003), unemployment compensation (January, 1978), medical insurance (June, 1982), and dental insurance (June, 1982). Under these programs, the County provides coverage for up to a $1,000,000 for each general liability and malpractice claim, $25,000 for each property damage claim, $10,000 for each public official performance claim, $350,000 for health insurance coverage and $3,000 for dental insurance coverage per employee per year. The County also joins together with other counties in the State through the California State Association of Counties (CSAC) to obtain general liability and malpractice insurance coverage for claims in excess of the coverage provided by the County up to $25 million and $10 million, respectively. The County also purchases commercial stop loss insurance for the health insurance coverage in excess of the County covered portion. Settled claims have not exceeded the CSAC coverage or the commercial insurance coverage in any of the past three fiscal years. The County, prior to fiscal year 2003-04, obtained the workers’ compensation insurance through CSAC’s Excess Insurance Authority Primary Workers’ Compensation program. The program provided for first dollar coverage for the County on a pooled basis with aggregate stop loss coverage in place to provide a unique “guaranteed cost” feature. Effective FY 2003-04, the County reverted back to the self-insurance program and only secured the excess coverage through the Excess Workers’ Compensation Program of CSAC’s Excess Insurance Authority (EIA). All funds of the County participate in the programs and make payments to the insurance funds based on the actuarial estimates of the amounts needed to pay prior- and current-year claims and to establish a reserve for catastrophic losses.

65
NOTE 9 – RISK MANAGEMENT PROGRAMS (Continued) Based on the most recent actuarial studies (December of 2010) the full value of the County’s unpaid casualty (general liability and malpractice liability) liabilities and the workers compensation program liabilities at June 30, 2011 were estimated at a discounted value of $18.1 million and $30.2 million, respectively, using the discount rate of 4%. These actuarially determined liabilities include the unpaid loss adjustment expenses. In the opinion of management, the total assets in the insurance funds were sufficient to cover the actuarially determined claim liabilities, premium and administration cost as of June 30, 2011, except for the casualty insurance fund. The insurance funds had the following net assets at June 30, 2011 (in $000’s):
Net Assets
Casualty Insurance $ 3,730 Workers’ Compensation Insurance 24,435 Medical Insurance 16,718 Dental Insurance 1,954 Unemployment Insurance 1,719
Total 48,556$
Changes in the insurance funds’ claim liabilities for fiscal years 2009-10 and 2010-11 were (in $000’s):
Workers’ Medical DentalCasualty Compensation Insurance Insurance Unemployment Total
Balance at June 30, 2009 $ 19,525 $ 33,098 $ 6,586 $ 321 $ 294 $ 59,824
Claims and changes in estimates for fiscal year 2009-10 2,882 4,770 49,798 4,495 2,260 64,205
Less: claim payments (4,052) (6,654) (48,973) (4,501) (2,003) (66,183)
Balance at June 30, 2010 18,355 31,214 7,411 315 551 57,846
Claims and changes in estimates for fiscal year 2010-11 6,060 5,973 44,056 4,835 2,139 63,063
Less: claim payments (6,281) (7,762) (44,473) (4,903) (2,324) (65,743)
Balance at June 30, 2011 $ 18,134 $ 29,425 $ 6,994 $ 247 $ 366 $ 55,166

66
NOTE 10 – LONG-TERM OPERATING LEASE AGREEMENTS The County has several long-term operating lease agreements, with original terms ranging from one to ten years, for leased office space for County departments. There are no material restrictions imposed by these agreements. The minimum rental payments required under the operating lease commitments at June 30, 2011 are (in $000’s):
Year Ended PrimaryJune 30 Government
2012 3,366$ 2013 1,711 2014 1,595 2015 1,514 2016 1,349
Thereafter 5,581
15,116$
Total rent expense under operating lease agreements during the year ended June 30, 2011 was approximately $3.9 million. A new lease agreement was entered in October 2003 for the County to lease for the Workforce Investment Act Program an office building, located at 56 South Lincoln Street, Stockton, California, that was under construction by a property developer. The agreement would allow the County to occupy the office building for a minimum of 15 years after the completion of the construction with scheduled rent increases. The County moved into this new building in September 2005. The fiscal year 2010-11 rent payment was $718,351. NOTE 11 – RENTAL INCOME UNDER OPERATING LEASES The following is a schedule by years of minimum future rental income on noncancellable operating leases as of June 30, 2011 (in $000’s). These operating leases, for various real property, contain no material restrictions. All are to be paid to the Airport Enterprise Fund.
Year EndedJune 30 Amount
2012 721$ 2013 567 2014 538 2015 519 2016 540
Thereafter 12,627
15,512$
Total rental income under operating lease agreements during the year ended June 30, 2011 was approximately $834,828. NOTE 12 – NET ASSETS/FUND BALANCES The governmental-wide and business-type activities fund financial statements utilize a net assets presentation. Net assets are categorized as invested in capital assets (net of related debt), restricted and unrestricted.

67
NOTE 12 – NET ASSETS/FUND BALANCES (Continued)
Invested in Capital Assets, Net of Related Debt – this category groups all capital assets, including infrastructure, into one component of net assets. Accumulated depreciation and the outstanding balances of debt that are attributable to the acquisition, construction or improvement of these assets reduce the balance in this category.
Restricted Net Assets – This category presents external restrictions imposed by creditors, grantors, contributors or laws or regulations of other governments and restrictions imposed by law through constitutional provisions or enabling legislation.
Unrestricted Net Assets – This category represents net assets of the County, not restricted for any project or other purpose.
Fund balances are presented in the following categories: nonspendable, restricted, committed, assigned, and unassigned (see Note 1 for a description of these categories). A detailed schedule of fund balances at June 30, 2011 is as follows:
Major
Mental Health First Five CountyGeneral Substance Abuse Program Capital Outlay Other
Fund Fund Fund Fund Funds TotalFund balances: Nonspendable:
Inventory -$ 159,796$ -$ -$ 357,982$ 517,778$ Advances 8,049,229 - - 308,406 664,892 9,022,527 Loans receivable 45,500 - - - - 45,500 Total Nonspendable 8,094,729 159,796 - 308,406 1,022,874 9,585,805 Restricted for: General government services 470,351 - - - 667,358 1,137,709 Public protection services 13,134,678 - - - 889,975 14,024,653 Emergency medical services 3,143,339 - - - - 3,143,339 Agricultural services 1,359,633 - - - - 1,359,633 Community services 4,185,051 - - - 2,975,921 7,160,972 Health and sanitation services 8,856,691 43,776,563 5,515,982 - - 58,149,236 Parks and recreation services 4,095,596 - - - - 4,095,596 Road projects and maintenance - - - - 46,332,731 46,332,731 Fish and game programs - - - - 296,695 296,695 County facilities - - - - 14,225,593 14,225,593 Job Training Partnership Act - - - - 986,596 986,596 Rabies treatment - - - - 48,757 48,757 Library programs - - - - 928,116 928,116 Narcotics enforcement - - - - 52,678 52,678 Recorder's Equipment Automation - - - - 5,439,161 5,439,161 Community Infrastructure - - - - 25,122,300 25,122,300 Lighting district maintenance - - - - 777,747 777,747 Service areas maintenance - - - - 4,721,128 4,721,128 Maintenance district services - - - - 9,253,023 9,253,023 Flood control districts - - - - 6,698,169 6,698,169 Improvement district services - - - - 1,121,648 1,121,648 In-home support services - - - - 307,421 307,421 Courthouse construction - - - - 252,629 252,629 Criminal justice construction - - - - 7,242,797 7,242,797 Total Restricted 35,245,339 43,776,563 5,515,982 - 128,340,443 212,878,327 Committed to:
General reserve - emergencies 10,006,276 - - - - 10,006,276 Total Committed 10,006,276 - - - - 10,006,276 Assigned to:
Budgetary deficit - subsequent year 29,889,700 - - - - 29,889,700 Capital projects - - - 42,447,911 - 42,447,911 Debt service - - - - 17,890,024 17,890,024 Airport projects - - - - 7,685,753 7,685,753 Health and sanitation projects - - - - 1,113,299 1,113,299 Total Assigned 29,889,700 - - 42,447,911 26,689,076 99,026,687 Unassigned: 44,315,708 - - - (3,092,040) 41,223,668 Total Fund Balances 127,551,752$ 43,936,359$ 5,515,982$ 42,756,317$ 152,960,353$ 372,720,763$
Major Special Revenue Funds

68
NOTE 13 – DEFICIT FUND BALANCE/NET ASSETS The following funds had deficit fund balances at June 30, 2011: Substance Abuse and Crime Prevention $ (83,405) (Nonmajor Special Revenue Fund)The deficit resulted from a reduction in Proposition 36 funding.
County Head Start (34,316) (Nonmajor Special Revenue Fund)The deficit resulted from prior year's delay in obtaining Federal and State reimbursements for costs incurred.
Justice Assistance Grant (17,743) (Nonmajor Special Revenue Fund)The deficit resulted from prior year's delay in obtaining Federal and State reimbursements for costs incurred.
Family Support and Incentive Earnings (309,298) (Nonmajor Special Revenue Fund)The deficit resulted from prior year's delay in obtaining Federal and State reimbursements for costs incurred.
Water District (24,236) (Nonmajor Special Revenue Fund)The deficit resulted from an increase in professional services related to water issues.
Northeastern San Joaquin Groundwater Banking Authority (353,122) (Nonmajor Special Revenue Fund)The deficit resulted from prior year's excess expenditures over revenues.
Mokelumne River Water and Power Authority (1,707,918) (Nonmajor Special Revenue Fund)The deficit resulted from an increase in studies and consulting services related to Delta issues.
County Service Areas (562,002) (Nonmajor Capital Projects Fund)The deficit resulted from an increase in wastewater infrastructure expenditures for CSA #44, zones E and G.
(3,092,040)$
Deficits in these funds are expected to be eliminated in future years through future revenues and/or transfers from other funds.

69
NOTE 14 – EMPLOYEE RETIREMENT SYSTEM The County’s pension fund is governed by the Board of Retirement of the San Joaquin County Employees’ Retirement Association (SJCERA). Prior to Fiscal Year 1993-94, the County also participated in the California Public Employees’ Retirement System (PERS) for employees working in the Division of Public Health of the County Health Care Services. Since the 1993-94 fiscal year, all County employees are covered by one single retirement plan, SJCERA. The Public Health employees are covered by SJCERA through reciprocity. Both the County’s and the employees’ cumulative contribution to PERS will remain with PERS. The County also contracted with Hartford to administer a qualified retirement plan under Section 401(a) of the Internal Revenue Code for full-time County physicians in health care services. These physicians are not members of SJCERA. The plan became operative on January 1, 1999. The Health Plan of San Joaquin and Head Start Child Development Council, Inc., discretely presented component units, have a money purchase pension plan, 401(a), or a deferred annuity program on behalf of their employees. The other two discretely presented component units are covered by SJCERA. The San Joaquin County Employees’ Retirement Association (Plan) Plan Description The following description of the San Joaquin County Employees’ Retirement Association (SJCERA) is provided for general information purposes. SJCERA is governed by the Board of Retirement under the 1937 County Employees’ Retirement Law (1937 Act). Members should refer to this Law for more complete information. The SJCERA issues a stand alone financial report and was audited by Brown Armstrong Accountancy Corporation. The report is available by writing to San Joaquin County Employees’ Retirement Association, 6 South El Dorado Street, Suite 400, Stockton, CA 95202 or by calling (209) 468-2163. The data presented within this footnote is obtained from the financial statements that were audited by and reported on by the said Certified Public Accountants on May 31, 2011. General The Plan is a cost sharing multiple employer defined benefit pension plan (covering the County and certain other special districts outside the reporting entity). It provides retirement and disability benefits, annual cost-of-living adjustments, and death benefits to plan members and beneficiaries. It also provides post-employment health benefits (sick leave bank benefits) to certain members who meet certain criteria contained in the Memorandum of Understanding between the County and employees’ unions. The Retirement Board maintains its own accounting records and controls its own assets. The Plan’s net assets, including the postemployment healthcare program-sick leave bank benefit, totaled approximately $1.9 billion at December 31, 2010. The Plan’s financial statements are presented on the accrual basis of accounting. The Plan member and employer contributions that should have been made in the calendar year based on the actuarially determined contribution rates are recognized as revenues of that calendar year. Benefits and refunds are recognized when due and payable in accordance with the terms of the Plan. The Plan’s investments are reported at fair value. All administrative costs of the Plan are paid from the Plan’s investment earnings. Funding Policy Pension: Contribution rates for the employers and employees were determined in accordance with actuarially determined contribution requirements by an actuarial valuation performed as of January 1, 2010.

70
NOTE 14 – EMPLOYEE RETIREMENT SYSTEM (Continued) The San Joaquin County Employees’ Retirement Association (Plan) (Continued) Funding Policy (Continued) Employee contributions are payable over each employee’s future working lifetime. The employer rates reflect the entry age normal funding method. Under this method, the normal cost is being paid over the future working lifetimes of the members. The past service liability is amortized over a rolling 10-year period. In 2010, the employees’ contributions were about $13.1 million, an average of 3.4% of the annual covered payroll. The adopted employers’ 2010 contribution rates, based on the actuarial determined requirements applicable to covered payroll were 49.92% for safety members and 27.79% for general members. The employers’ actual contributions, including the contributions from the Plan’s unapportioned earnings, to the Plan for the years ending December 31, 2010, 2009, 2008, and were $104.5 million, $97.8 million and $94.2 million, respectively, equal to the required contributions for each year. Postemployment Health Benefit Plan – Sick Leave Bank The Board of Retirement, as part of the settlement of the class-action lawsuit brought by the San Joaquin County Deputy Sheriff’s Association, extended the sick leave bank benefit to cover all eligible employees who were on the August 27, 2001 payroll or who deferred prior to August 27, 2001. The actuarially determined sick leave bank benefit liability for eligible members hired from January 28, 1992 through August 27, 2001 has been fully funded. However, the funding for eligible active members who were hired prior to January 28, 1992 was yet to be fully funded. The County has adopted a funding policy, effective fiscal year 2006-07, to make a bi-weekly contribution to the plan based on the annual actuarial valuation of the benefit plan. Based on the December 31, 2010 actuary report, the County has made the annual required contribution of $4,361,915 in calendar year 2010. The employees are not required to contribute to the plan. California Public Employees’ Retirement System (CalPERS) General Description Certain employees of the Health Care Services Department (Public Health) were members of the California Public Employees’ Retirement System (CalPERS), an agent multiple-employer public employee retirement system that acts as a common investment and administrative agent for participating public entities within the State of California. Effective June 28, 1993, those employees became members of the SJCERA through reciprocity. Defined Contribution Pension Plan for the County Full-Time Physicians in Health Care Services The County has an agreement with Hartford to administer a qualified retirement plan, 401(a), for the County’s full-time physicians. Under this plan the County contributes $8,000 annually per qualified physician to the plan. The physicians are also required to contribute a mandatory, tax-deferred match at a rate of 6.0% of their compensation. In fiscal year 2010-11, the County contributed $213,845 to the plan. Pension Plans for the Health Plan of San Joaquin and Headstart Child Development Council, Inc. The Health Plan has a money purchase pension plan, 401(a), for its employees. All full-time, permanent employees are eligible to participate. The Health Plan contributes 5.75% of each participant’s gross pay to the plan. Employees do not make contributions to the plan. In fiscal year 2010-11, the Health Plan contributed $468,556 to the pension plan.

71
NOTE 14 – EMPLOYEE RETIREMENT SYSTEM (Continued) Pension Plans for the Health Plan of San Joaquin and Headstart Child Development Council, Inc. (Continued) The Health Plan approved a defined benefit plan contract between the Health Plan and CalPERS on January 28, 2002. Active CalPERS Plan members are required to contribute 7% of reportable earnings and the Health Plan is required to contribute an actuarially determined rate. The actuarial methods and assumptions used for determining the rate are those adopted by the CalPERS Board of Administration. The Health Plan’s contribution for the period ended June 30, 2011 was $871,317. The Headstart Council maintains a deferred annuity program on behalf of its employees. The employees contribute to the plan on a voluntary basis. The Council contributes to the plan for those employees who meet the eligibility requirements set forth in the plan. For the year ended January 31, 2011, the Council contributed $594,551 to the plan. The Local Agency Formation Commission participates in the County’s Pension Plan and it contributed $34,983 to the plan for the period ended June 30, 2011. NOTE 15 – POSTEMPLOYMENT HEALTH BENEFITS – IMPLICIT SUBSIDY As explained in Note 1-N, the County does not provide employees any Other Post Employment Benefits (OPEB) other than the postemployment health benefits under the “sick leave bank” program, as described in Note 14. The sick leave bank program is administered by the County’s Retirement Association (see Note 14 – Employee Retirement Systems for more information). However, the County allows any member or beneficiary receiving a pension benefit to purchase post-retirement health insurance from one of the County’s sponsored plans. In some cases, the purchase of this insurance can result in an implicit subsidy payable by the County in accordance with GASB Statement No. 43 and No. 45. Funding Policy. Currently, the County pays for these benefits on a pay-as-you-go basis, as opposed to the pre-funded approach that is used in the pension and sick leave bank programs. The “annual required contribution” presented below is based on projected pay-as-you-go financing requirements. For fiscal year 2010-11, the County’s actual contribution amounted to $2.0 million for current premiums. Annual OPEB Cost and Net OPEB Obligation The County’s annual OPEB-Implicit Subsidy cost is calculated based on the annual required contribution of the employer (ARC), an amount actuarially determined in accordance with the parameters of GASB Statement 45. The ARC represents a level of funding that, if paid on an ongoing basis, is projected to cover normal cost each year and amortize any unfunded actuarial liabilities over a period not to exceed 30 years. The following table shows the components of the County’s annual OPEB cost for the year, the amount actually contributed to the plan, and changes in the County’s net OPEB obligation (in $000’s):
Annual Required Contribution 10,929$ Interest on net OPEB-Implicit Subsidy obligation 1,625 Adjustment to annual required contribution (278)
Annual OPEB-Implicit Subsidy cost 12,276
Contribution made 2,022
Increase in obligation 10,254 Net OPEB-Implicit Subsidy obligation - beginning of year 38,230
Net OPEB-Implicit Subsidy obligation - end of year 48,484$

72
NOTE 15 – POSTEMPLOYMENT HEALTH BENEFITS – IMPLICIT SUBSIDY (Continued) The County’s annual OPEB cost, the percentage of annual OPEB cost contributed to the plan, and the net OPEB obligation for fiscal year 2010-11 were as follows ($000’s):
Percentage NetYear Annual Annual of Annual Pension
Ended OPEB-Subsidy Actual Cost ObligationDecember 31, Obligation Contribution Contribution End of Year
2008 17,650$ 3,582$ 20.29% 27,697$ 2009 13,707$ 3,174$ 23.16% 38,230$ 2010 12,276$ 2,022$ 16.47% 48,484$
Funded Status and Funding Progress. As of December 31, 2010, the most recent actuarial valuation date, the plan was not funded, as the County chose to fund the program on the as-pay-as-you-go basis. The actuarial accrued liability and the unfunded actuarial accrued liability (UAAL) for benefits was $108.6 million. The covered payroll was $367.7 million, and the ratio of the UAAL to the covered payroll was 29.5%. Actuarial valuation of an ongoing plan involves estimates of the value of reported amounts and assumptions about the probability of occurrence of events far into the future. Examples include assumptions about future employment, mortality, and the healthcare cost trend. Amounts determined regarding the funded status of the plan and the annual required contributions of the employer are subject to continual revision as actual results are compared with past expectations and new estimates are made about the future. The schedule of funding progress, presented as required supplementary information following the notes to the financial statements, presents all fiscal year information since inception in fiscal year 2007-08 to indicate whether the actuarial value of plan assets is increasing or decreasing over time relative to the actuarial accrued liabilities for benefits. Actuarial Methods and Assumptions. Projections of benefits for financial reporting purposes are based on the substantive plan (the plan as understood by the County and the plan members) and include the types of benefits provided at the time of each valuation and the historical pattern of sharing of benefit costs between the County and plan members to that time. The actuarial methods and assumptions used include techniques that are designed to reduce the effects of short-term volatility in actuarial accrued liabilities and the actuarial value of assets, consistent with the long-term perspective of the calculations. In the December 31, 2010 actuarial valuation, the entry age actuarial cost method was used. The actuarial assumptions included a 4.25% investment rate of return (net of administrative expenses), which is an expected investment return based on the County’s own investments, and an annual healthcare cost trend increment rate of 9.0% initially, reduced by decrements to an ultimate rate of 4.75% after 6 years. Both rates include a 3.5% salary increase assumption. Since the County chose to fund the plan on the basis of a pay-as-you-go method, there is no actuarial value of assets involved in the computation. The UAAL is being amortized as a level dollar amount over a closed period of 30 years. The remaining amortization period at December 31, 2010, was 27 years. NOTE 16 – RETIREE HEALTH REIMBURSEMENT PLAN AND TRUST Purpose The purpose of the retiree health reimbursement plan and trust is to provide qualifying employees with an opportunity to receive reimbursement for certain health care expenses eligible under the plan. It is the intention of the County that the benefits payable under this plan be eligible for exclusion from the gross income of participants as provided by Sections 105(b) and 106 of the Internal Revenue Code (Code). It is also the intention of the County that the plan qualify as a Health Reimbursement Arrangement (“HRA”) under IRS Revenue Ruling 2002-41 (June 26, 2002) and IRS Notice 2002-45 (June 26, 2002). The purposes of the trust are (1) to provide a source of funds to pay benefits under the Plan, and (2) to permit Trust assets to be invested and such earnings be non taxable under Section 501(c)(9) of the Code.

73
NOTE 16 – RETIREE HEALTH REIMBURSEMENT PLAN AND TRUST (Continued) Funding The County shall make a fixed contribution per participant as set forth in the appropriate adoption agreement. The amount of employer contribution, and any restrictions on the use thereof, shall be identified in the adoption agreement and communicated to the participants. The amount of the employer contribution may change from year to year as announced by the adopting employer prior to the plan year start and reflected in the adoption agreement. Unless otherwise stated in the adoption agreement, the employer contribution shall be available for reimbursement as soon as received by the Trustee and placed in the Trust. The total employer contribution for fiscal year 2010-11 was $389,583.. NOTE 17 – COMPONENT UNIT CONDENSED FINANCIAL INFORMATION Condensed financial data for the four discretely presented major component units is presented below: Statement of Net Assets
Head Start San Joaquin LocalChild Economic Agency Health
Development Development Formation Plan ofASSETS Council, Inc. Association Commission San Joaquin Total
Cash and investment – pool -$ -$ 307,426$ 45,272,636$ 45,580,062$ Cash and investments – other 1,682,380 1,186,730 - - 2,869,110 Due from other governments 313,588 - - 5,111,957 5,425,545 Interest receivable - - 511 63,454 63,965 Accounts receivable 105,030 - - - 105,030 Depreciable assets, net 1,267,554 3,333 - 19,613,822 20,884,709 Other assets 146,483 - - 847,036 993,519
Total Assets 3,515,035$ 1,190,063$ 307,937$ 70,908,905$ 75,921,940$
LIABILITIES AND NET ASSETS
LIABILITIESAccounts payable and accrued expenses 2,825,770$ 123,765$ 19,584$ 3,030,578$ 5,999,697$ Accrued claims payable - - - 11,885,922 11,885,922 Provider risk sharing payable - - - 5,214,242 5,214,242 Unpaid compensated absences - - - - - Unearned revenues 61,438 - - - 61,438 Other liabilities - - - 1,177,605 1,177,605
Total Liabilities 2,887,208 123,765 19,584 21,308,347 24,338,904
NET ASSETSInvestment in capital assets, net of related debt 1,267,554 3,333 - 19,613,822 20,884,709 Unrestricted net assets (639,727) 1,062,965 288,353 29,986,736 30,698,327
Total Net Assets 627,827 1,066,298 288,353 49,600,558 51,583,036
Total Liabilities and Net Assets 3,515,035$ 1,190,063$ 307,937$ 70,908,905$ 75,921,940$

74
NOTE 17 – COMPONENT UNIT CONDENSED FINANCIAL INFORMATION (Continued) Statement of Changes in Net Assets
Head Start San Joaquin LocalChild Economic Agency Health
Development Development Formation Plan ofCouncil, Inc. Association Commission San Joaquin Total
Program Revenues:Operating grants and contributions 34,824,115$ 165,557$ 715,170$ 160,569,078$ 196,273,920$ Charges for services 2,275,485 - - 1,271,474 3,546,959 Interest income - 1,222 2,634 287,859 291,715 Miscellaneous - 1,054,155 1,805 - 1,055,960
Total Program Revenues 37,099,600 1,220,934 719,609 162,128,411 201,168,554
Program Expenses:General government - - 632,197 - 632,197 Public assistance 36,654,407 673,441 - - 37,327,848 Health - - - 155,255,672 155,255,672
Total Program Expenses 36,654,407 673,441 632,197 155,255,672 193,215,717
Change in net assets 445,193 547,493 87,412 6,872,739 7,952,837
Net assets, beginning 182,634 518,805 200,941 42,727,819 43,630,199
Net assets, ending 627,827$ 1,066,298$ 288,353$ 49,600,558$ 51,583,036$
NOTE 18 – COMMITMENTS AND CONTINGENCIES
Pending Litigations The County is a defendant in various casualty and workers compensation lawsuits. Based on the most recent actuary report issued in December 2010, the County’s actuarially determined ultimate loss liability of these lawsuits under the casualty insurance and workers compensation programs were approximately $18.1 million and $30.2 million, respectively. The assets of these two insurance funds totaling $80.2 million were sufficient to cover these actuarially determined losses as of June 30, 2011 (See Note 9). Grants The County recognizes as revenue, grant monies received and available within 60 days as reimbursement for costs incurred in certain Federal and State programs it administers. Amounts received or receivable from grantor agencies are subject to audit and adjustment by grantor agencies, principally the Federal government. Any disallowed claims, including amounts already collected, may constitute a liability of the applicable funds. The amount, if any, of expenditures which may be disallowed by the grantor cannot be determined at this time although the County expects such amounts, if any, to be immaterial. Medicare and Medi-Cal Programs The Medicare program provides for reimbursement for the cost of service provided to program patients. The Medi-Cal program provides for reimbursement based on cost per patient day or service provided for administrative day services. Preliminary estimates of the amounts to be received from or due to third parties are included in the current year’s financial statements. Final determination of amounts due for services to program patients is made when the cost reports are settled with respective administrative agencies, and any adjustments are made in the period such amounts are fully determined. Medicare and Medi-Cal cost reports have been audited through June 30, 2010 and June 30, 2009, respectively. The Hospital recorded a cost report liability of $0.8 million in 2011 and recognized approximately $1.9 million in net patient service revenue in 2010 for changes in estimated cost report settlements.

75
NOTE 18 – COMMITMENTS AND CONTINGENCIES (Continued) Proposition 1A Borrowing by the State of California Under the provisions of Proposition 1A and as part of the 2009-10 budget package passed by the California state legislature on July 28, 2009, the State of California borrowed 8% of the amount of property tax revenue, including those property taxes associated with the in-lieu motor vehicle license fee, the triple flip in lieu sales tax, and supplemental property tax, apportioned to cities, counties and special districts (excluding redevelopment agencies). The State is required to repay this borrowing plus interest by June 30, 2013. After repayment of this initial borrowing, the California legislature may consider only one additional borrowing within a ten-year period. The amount of this borrowing pertaining to the County was $16,901,488. Authorized with the 2009-10 State budget package, the Proposition 1A Securitization Program was instituted by the California Statewide Communities Development Authority (“California Communities”), a joint powers authority sponsored by the California State Association of Counties and the League of California Cities, to enable local governments to sell their Proposition 1A receivables to California Communities. Under the securitization program, California Communities simultaneously purchased the Proposition 1A receivables and issued bonds (“Prop 1A Bonds”) to provide local agencies with cash proceeds in two equal installments, on January 15, 2010 and May 3, 2010. The purchase price paid to the local agencies equaled 100% of the amount of the property tax reduction. All transaction costs of issuance and interest were paid by the State of California. Participating local agencies have no obligation on the bonds and no credit exposure to the State. The County participated in the Securitization Program and accordingly property taxes have been recorded in the same manner as if the State had not exercised its rights under Proposition 1A. The receivable sale proceeds were equal to the book value and, as a result, no gain or loss was recorded. NOTE 19 – PRIOR PERIOD ADJUSTMENTS Adjustments resulting from errors or changes to comply with provisions of accounting standards are treated as adjustments to prior periods. Accordingly, the County reports these changes as restatements of beginning fund balance/net assets.
Fiduciary FundStatements
InvestmentTrust Fund
Net Assets/Fund Balance, June 30, 2010, as previously reported after adjustment for change in reporting entity 845,941,739$
Restatements:Correct reporting of prior year revenues and expenditures (31,776,889)
Fund Balance, June 30, 2010, as restated 814,164,850$

REQUIRED SUPPLEMENTARY INFORMATION

76
COUNTY OF SAN JOAQUIN REQUIRED SUPPLEMENTARY INFORMATION
FOR THE YEAR ENDED JUNE 30, 2011
Schedule of Funding Progress and Funding Status – Pension Trust Fund The tables below show a) a multi-year analysis of the actuarial value of assets as a percentage of the actuarial accrued liability and the unfunded actuarial accrued liability as a percentage of the annual covered payroll as of June 30 and b) a multi-year history of the funding status of the Pension Trust Fund:
Required Supplementary Information For the Year Ended June 30, 2011
Pension Benefit Plan Schedule of Funding Progress
(amounts in thousands)
Actuarial UnfundedAccrued (Overfunded)
Actuarial Liability Unfunded/ AAL PercentageValuation Value of (AAL) (Overfunded) Funded Covered of Covered
Date Assets Entry Age AAL Ratio Payroll Payroll
1/1/2002 1,357,409$ 1,266,747$ (90,662)$ 107.2% 243,327$ 0%1/1/2003 1,448,905 1,418,209 (30,696) 102.2% 259,812 0%1/1/2004 1,531,288 1,621,060 89,772 94.5% 286,429 31%1/1/2005 1,614,979 1,769,507 154,528 91.3% 296,473 52%1/1/2006 1,727,033 1,935,818 208,785 89.2% 309,692 67%1/1/2007 1,869,717 2,149,938 280,221 87.0% 340,828 82%1/1/2008 2,029,949 2,334,521 304,572 87.0% 367,361 83%1/1/2009 1,821,357 2,510,925 689,568 72.5% 377,559 183%1/1/2010 1,949,011 2,769,612 820,601 70.4% 385,442 213%
Schedule of Employer Contributions (amount in thousands)
Actual Annual Net
Actuarial Annual Required Percentage PensionValuation Contribution Contribution Contribution Obligation
2005 62,509$ 62,509$ 100.0% -$ 2006 73,612 73,612 100.0% - 2007 85,869 85,869 100.0% - 2008 94,163 94,163 100.0% - 2009 97,806 97,806 100.0% - 2010 104,452 104,452 100.0% -
(Employer contributions for fiscal years 2002, 2003, and 2004 are not available.)

77
COUNTY OF SAN JOAQUIN REQUIRED SUPPLEMENTARY INFORMATION
FOR THE YEAR ENDED JUNE 30, 2011
Required Supplementary Information For the Year Ended June 30, 2011
Postemployment Healthcare – Sick Leave Bank Program Schedule of Funding Progress
(amounts in thousands)
Actuarial UnfundedAccrued (Overfunded)
Actuarial Liability Unfunded/ AAL PercentageValuation Value of (AAL) (Overfunded) Funded Covered of Covered
Date Assets Entry Age AAL Ratio Payroll Payroll
1/1/2005 16,636$ 30,465$ 13,829$ 54.6% 224,753$ 6%1/1/2006 14,660 37,475 22,815 39.1% 229,726 10%1/1/2007 14,702 41,583 26,881 35.4% 221,626 12%1/1/2008 13,120 41,203 28,083 31.8% 212,675 13%1/1/2009 14,890 41,760 26,870 35.7% 203,064 13%
(Schedule of Funding Progress information for fiscal year ended December 31, 2004, is not available.)
Schedule of Employer Contributions (amounts in thousands)
Actual Annual Net
Actuarial Annual Required Percentage PensionValuation Contribution Contribution Contribution Obligation
2006 650,000$ 650,000$ 100.0% -$ 2007 2,780,500 2,780,500 100.0% - 2008 4,083,235 4,083,235 100.0% - 2009 4,202,490 4,202,490 100.0% - 2010 4,361,915 4,361,915 100.0% -
(Employer contributions for fiscal years 2004 and 2005 are not available.)

78
COUNTY OF SAN JOAQUIN REQUIRED SUPPLEMENTARY INFORMATION
FOR THE YEAR ENDED JUNE 30, 2011
Required Supplementary Information For the Year Ended June 30, 2011
Postemployment Healthcare – Implicit Subsidy Schedule of Funding Progress
(amounts in thousands)
Actuarial UnfundedAccrued (Overfunded)
Actuarial Liability Unfunded/ AAL PercentageValuation Value of (AAL) (Overfunded) Funded Covered of Covered
Date Assets Entry Age AAL Ratio Payroll Payroll
12/31/2007 -$ 157,337$ 157,337$ 0.0% 367,062$ 43%12/31/2008 - 163,596 163,596 0.0% 377,213 43%12/31/2009 - 123,763 123,763 0.0% 385,394 32%12/31/2010 - 108,631 108,631 0.0% 367,671 30%
(Schedule of Funding Progress information begins with fiscal year ended June 30, 2008, per GASB Statement No. 45.)
Schedule of Employer Contributions (amount in thousands)
Actual Annual Net
Actuarial Annual Required Percentage PensionValuation Contribution Contribution Contribution Obligation
2007 3,139$ 16,768$ 18.7% 13,629$ 2008 3,582 17,650 20.3% 27,697 2009 3,174 13,707 23.2% 38,230 2010 2,022 12,554 16.1% 48,762
(Employer contributions begin with fiscal year 2007 per GASB Statement No. 45.)

79
COUNTY OF SAN JOAQUIN REQUIRED SUPPLEMENTARY INFORMATION
FOR THE YEAR ENDED JUNE 30, 2011 BUDGETARY COMPARISON SCHEDULE
GENERAL FUND
ActualAmount
Budgetary Variance withOriginal Final Basis Final Budget
Budgetary fund balance, July 1 35,191,213$ 35,191,213$ 35,191,213$ -$
Resources (inflows):Taxes 179,187,757 179,187,757 200,807,678 21,619,921 Licenses and permits 4,378,898 4,378,898 4,924,424 545,526 Fines, forfeitures, and penalties 9,802,905 9,802,905 7,799,828 (2,003,077) Use of money and property 1,096,115 1,096,115 711,091 (385,024) Aid from other governmental agencies 412,291,827 416,022,571 397,338,447 (18,684,124) Charges for services 43,330,730 45,045,687 44,602,814 (442,873) Other revenues 2,102,284 2,337,284 8,069,033 5,731,749 Other financing sources 40,766,518 51,655,560 25,004,064 (26,651,496)
Total resources 692,957,034 709,526,777 689,257,379 (20,269,398)
Charges to appropriations (outflows):Current:
General government 57,705,032 57,705,032 40,283,476 (17,421,556) Public protection 235,057,785 239,285,443 231,656,822 (7,628,621) Public ways and facilities 91,036 91,036 (53,005) (144,041) Health and sanitation 33,439,199 35,833,952 31,768,982 (4,064,970) Public assistance 344,084,092 344,634,052 305,445,885 (39,188,167) Education 286,772 286,772 275,911 (10,861) Recreation and culture 6,001,072 6,001,072 5,630,122 (370,950) Reserve for contingency 10,600,000 19,064,705 - (19,064,705) Capital outlay - - - -
Debt service:Principal - - 776,304 776,304 Interest - 49,042 278,796 229,754
Other financing uses-transfers out 36,579,986 39,678,692 35,039,381 (4,639,311)
Total charges to appropriations 723,844,974 742,629,798 651,102,674 (91,527,124)
Fund balance, end of year 4,303,273$ 2,088,192$ 73,345,918$ 71,257,726$
Budgeted Amounts
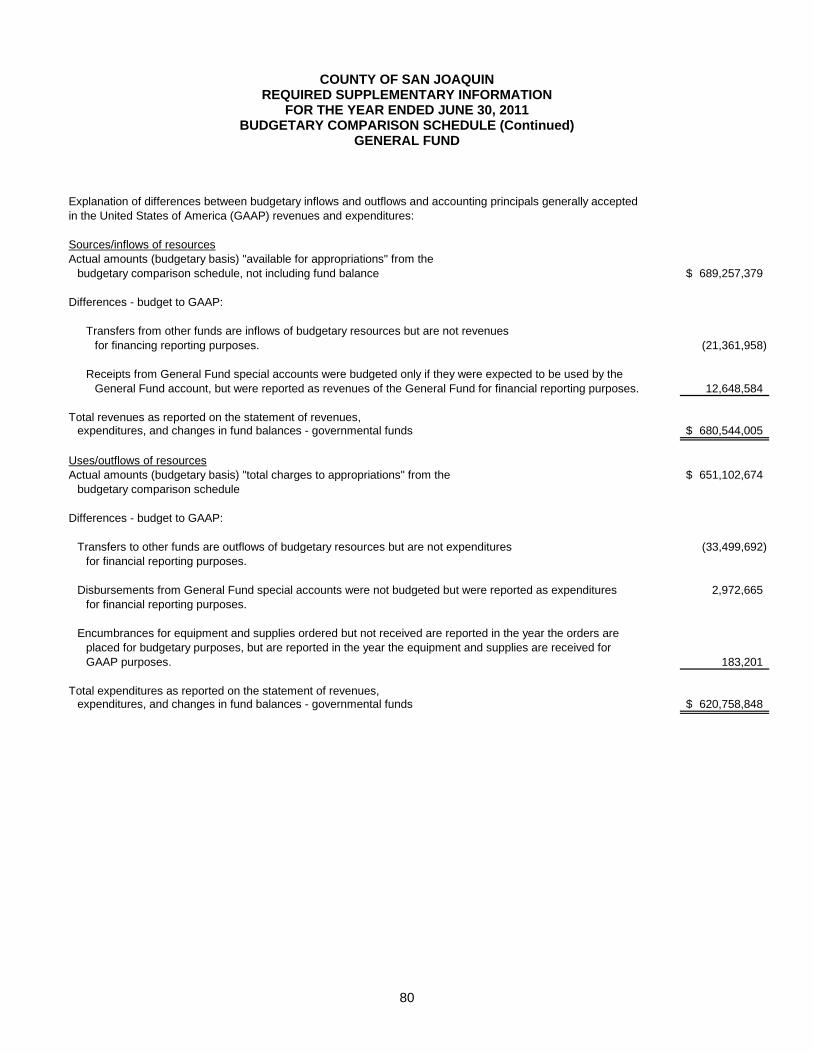
80
COUNTY OF SAN JOAQUIN REQUIRED SUPPLEMENTARY INFORMATION
FOR THE YEAR ENDED JUNE 30, 2011 BUDGETARY COMPARISON SCHEDULE (Continued)
GENERAL FUND
Explanation of differences between budgetary inflows and outflows and accounting principals generally accepted in the United States of America (GAAP) revenues and expenditures:
Sources/inflows of resourcesActual amounts (budgetary basis) "available for appropriations" from the
budgetary comparison schedule, not including fund balance 689,257,379$
Differences - budget to GAAP:
Transfers from other funds are inflows of budgetary resources but are not revenuesfor financing reporting purposes. (21,361,958)
Receipts from General Fund special accounts were budgeted only if they were expected to be used by theGeneral Fund account, but were reported as revenues of the General Fund for financial reporting purposes. 12,648,584
Total revenues as reported on the statement of revenues, expenditures, and changes in fund balances - governmental funds 680,544,005$
Uses/outflows of resourcesActual amounts (budgetary basis) "total charges to appropriations" from the 651,102,674$
budgetary comparison schedule
Differences - budget to GAAP:
Transfers to other funds are outflows of budgetary resources but are not expenditures (33,499,692) for financial reporting purposes.
Disbursements from General Fund special accounts were not budgeted but were reported as expenditures 2,972,665 for financial reporting purposes.
Encumbrances for equipment and supplies ordered but not received are reported in the year the orders are placed for budgetary purposes, but are reported in the year the equipment and supplies are received for GAAP purposes. 183,201
Total expenditures as reported on the statement of revenues,expenditures, and changes in fund balances - governmental funds 620,758,848$

81
COUNTY OF SAN JOAQUIN REQUIRED SUPPLEMENTARY INFORMATION
FOR THE YEAR ENDED JUNE 30, 2011 BUDGETARY COMPARISON SCHEDULE
MENTAL HEALTH AND SUBSTANCE ABUSE FUND
ActualAmount
Budgetary Variance withOriginal Final Basis Final Budget
Budgetary fund balance, July 1 32,373,047$ 32,373,047$ 32,373,047$ -$
Resources (inflows): Taxes - - - -
Fines, forfeitures, and penalties 205,000 205,000 360,422 155,422 Use of money and property 25,000 25,000 207,789 182,789 Aid from other governmental agencies 45,572,097 45,622,097 51,786,718 6,164,621 Charges for services 32,388,304 32,388,304 27,012,992 (5,375,312) Other revenues 445,536 445,536 542,307 96,771 Other financing sources 9,242,274 9,242,274 8,480,181 (762,093)
Total resources 87,878,211 87,928,211 88,390,409 462,198
Charges to appropriations (outflows):Current:
Health and sanitation 90,225,888 90,275,888 77,565,629 (12,710,259)
Total charges to appropriations 90,225,888 90,275,888 77,565,629 (12,710,259)
Fund balance, end of year 30,025,370$ 30,025,370$ 43,197,827$ 13,172,457$
Budgeted Amounts

82
COUNTY OF SAN JOAQUIN REQUIRED SUPPLEMENTARY INFORMATION
FOR THE YEAR ENDED JUNE 30, 2011 BUDGETARY COMPARISON SCHEDULE (Continued) MENTAL HEALTH AND SUBSTANCE ABUSE FUND
Explanation of differences between budgetary inflows and outflows and GAAP revenues and expenditures:
Sources/inflows of resourcesActual amounts (budgetary basis) "available for appropriations" from the
budgetary comparison schedule, not including fund balance 88,390,409$
Differences - budget to GAAP:
Transfers from other funds are inflows of budgetary resources but are not revenuesfor financing reporting purposes. (8,480,182)
Total revenues as reported on the statement of revenues, expenditures, and changes in fund balances - governmental funds 79,910,227$
Uses/outflows of resources
77,565,629$ Differences - budget to GAAP:
Transfers to other funds are outflows of budgetary resources but are not expenditures for financial reporting purposes. (1,253,469)
Changes in outstanding encumbrances - encumbrances for equipment and supplies ordered but not received -are reported in the year the orders are placed for budgetary purposes, but are reported in the year the equipment and supplies are received for GAAP purposes. (738,532)
Total expenditures as reported on the statement of revenues,expenditures, and changes in fund balances - governmental funds 75,573,628$
Actual amounts (budgetary basis) "total charges to appropriations" from the budgetary comparison schedule, not including fund balance

83
COUNTY OF SAN JOAQUIN REQUIRED SUPPLEMENTARY INFORMATION
FOR THE YEAR ENDED JUNE 30, 2011 BUDGETARY COMPARISON SCHEDULE
FIRST FIVE PROGRAM FUND
ActualAmount
Budgetary Variance withOriginal Final Basis Final Budget
Budgetary fund balances, July 1 5,609,205$ 5,609,205$ 5,609,205$ -$
Resources (inflows):Use of money and property 49,465 49,465 28,909 (20,556) Aid from other governmental agencies 8,826,847 8,826,847 8,248,177 (578,670) Other revenues - - 976 976
Total resources 8,876,312 8,876,312 8,278,062 (598,250)
Charges to appropriations (outflows):Current:
Health and sanitation 14,793,327 14,793,327 12,359,424 (2,433,903) Other financing uses - - - -
Total charges to appropriations 14,793,327 14,793,327 12,359,424 (2,433,903)
Fund balance, end of year (307,810)$ (307,810)$ 1,527,843$ 1,835,653$
Explanation of differences between budgetary inflows and outflows and GAAP revenues and expenditures:
Uses/outflows of resources
8,278,062$
Actual amounts (budgetary basis) "total charges to appropriations" from the budgetary comparison schedule 12,359,424$
Differences - budget to GAAP:
Transfers to other funds are outflows of budgetary resources but are not expenditures for financial reporting purposes. (128,132)
Changes in outstanding encumbrances - encumbrances for equipment and supplies ordered but not received - are reported in the year the orders are placed for budgetary purposes, but are reported in the year the equipment and supplies are received for GAAP purposes. (3,988,138)
Total expenditures as reported on the statement of revenues,expenditures, and changes in fund balances - governmental funds 8,243,154$
Actual amounts (budgetary basis) "available for appropriations" from the budgetary comparison schedule, not including fund balance
Budgeted Amounts

84
COUNTY OF SAN JOAQUIN NOTE TO REQUIRED SUPPLEMENTARY INFORMATION
FOR THE YEAR ENDED JUNE 30, 2011
BUDGETARY BASIS OF ACCOUNTING In accordance with provisions of Sections 29000 through 29144 of the California Government Code and other statutory provisions, commonly known as the County Budget Act, the County prepares and legally adopts an operating balanced final budget on or before June 30, of each year. Public hearings are conducted to review all proposed appropriations and the sources of financing before the adoption. Since the final budget must be balanced, any shortfall in revenue and other financing sources requires an equal reduction in appropriations. This operating balanced budget is adopted each fiscal year for the general, special revenue and special district service funds. It is prepared on a modified cash basis except that encumbrances are treated as budgeted expenditures in the year the purchase commitment is made. The encumbered appropriations do not lapse at year-end. Accordingly, encumbrances outstanding at year-end are reported as reservations of fund balances for subsequent year expenditures and become authorized encumbrance appropriations carried over. Throughout the fiscal year, supplemental appropriations may be made by the Board when revenues are received from unanticipated sources, or from anticipated sources in excess of estimates thereof or from contingency sources. The legal level for budgetary control (the level at which expenditures may not exceed budgeted appropriations) is at the index and object level. An “index” for legal appropriation purposes may be (1) a single department (2) a division of a large department having multiple divisions, or (3) an entire fund. Object levels of expenditures for legal appropriation purposes are:
1. Salaries and benefits 2. Services and supplies 3. Other charges 4. Capital outlay 5. Other financing uses 6. Interfund transfers 7. Appropriation for contingencies 8. Contracts 9. Unclassified
All amendments or transfers of line item appropriations between objects within the same index require County Administrator approval. Amendments and transfers of appropriations between indexes or that involve the addition or deletion of a project or piece of equipment must be approved by the Board of Supervisors. The Board of Supervisors has authorized the Auditor-Controller of the County to make year-end budget adjustments and appropriation transfers within the respective County budgets and funds to provide for expenditures in excess of budgeted amounts. The budget approved by the Board of Supervisors for the general fund includes budgeted expenditures and reimbursements for amounts disbursed on behalf of other Governmental Funds. Actual reimbursements for these items have been eliminated in the accompanying budgetary financial schedules. Accordingly, the related budgets for these items have also been eliminated in order to provide a meaningful comparison of actual and budgeted results of operations. The budgets for the governmental funds may include an object level known as “intrafund transfers” in the charges for appropriations. This object level is an accounting mechanism used by the County to show reimbursements between operations within the same fund (an example would be the General Fund).

SUPPLEMENTARY INFORMATION

GENERAL FUND ACCOUNTS
General Fund Accounts, representing the general operating fund of the County, include General Account (General Fund) and certain special accounts that are under the control of various General Fund departments. They are used to account for all financial resources not accounted for in another fund.

85
COUNTY OF SAN JOAQUIN COMBINING BALANCE SHEET
ALL GENERAL FUNDS JUNE 30, 2011
General Accounts Contingency
GeneralReserve Total
ASSETSCash and investments:
Pooled 116,790,897$ 13,364,917$ 10,006,276$ 140,162,090$ Imprest cash 249,775 - - 249,775
Interest receivable 94,479 - - 94,479 Accounts receivable 2,743,208 - - 2,743,208 Taxes receivable 57,178,859 - - 57,178,859 Due from other agencies 53,220,784 - - 53,220,784 Due from other funds 177,809 391,124 - 568,933 Advances to other funds 3,402,801 4,646,428 - 8,049,229 Loans receivable - 20,000 - 20,000 Other assets 25,500 - - 25,500
Total Assets 233,884,112$ 18,422,469$ 10,006,276$ 262,312,857$
LIABILITIESAccounts payable 4,346,689$ -$ -$ 4,346,689$ Accrued payroll 10,243,113 - - 10,243,113 Due to other funds 970,629 - - 970,629 Teeter note 14,500,000 - - 14,500,000 Deferred revenues 104,064,542 - - 104,064,542 Other liabilities 592,078 - - 592,078 Interest payable 44,054 - - 44,054
Total Liabilities 134,761,105 - - 134,761,105
FUND BALANCES
Non-spendable 3,428,301 4,666,428 - 8,094,729 Restricted 35,245,339 - - 35,245,339 Committed - - 10,006,276 10,006,276 Assigned 16,529,045 13,360,655 - 29,889,700 Unassigned 43,920,322 395,386 - 44,315,708
Total Fund Balances 99,123,007 18,422,469 10,006,276 127,551,752
Total Liabilities and Fund Balances 233,884,112$ 18,422,469$ 10,006,276$ 262,312,857$

86
COUNTY OF SAN JOAQUIN COMBINING STATEMENT OF REVENUES, EXPENDITURES,
AND CHANGES IN FUND BALANCES ALL GENERAL FUNDS
FOR THE YEAR ENDED JUNE 30, 2011
General Accounts Contingency
GeneralReserve Total
Revenues:Taxes 200,807,678$ -$ -$ 200,807,678$ Licenses, permits, and franchises 5,036,563 - - 5,036,563 Fines, forfeitures, and penalties 9,191,361 - - 9,191,361 Revenue from use of money and property 994,891 237,925 (12,194) 1,220,622 Aid from other governmental agencies 403,257,470 - - 403,257,470 Charges for services 48,200,244 - - 48,200,244 Other revenue 13,649,067 (819,000) - 12,830,067
Total Revenues 681,137,274 (581,075) (12,194) 680,544,005
Expenditures:Current:
General government 41,583,865 - - 41,583,865 Public protection 235,150,322 - - 235,150,322 Public ways and facilities 4,813 - - 4,813 Health and sanitation 31,144,414 - - 31,144,414 Public assistance 304,812,263 - - 304,812,263 Education 274,431 - - 274,431 Recreation and cultural services 5,636,071 - - 5,636,071
Capital outlay 1,097,569 - - 1,097,569 Debt service:
Principal 776,304 - - 776,304 Interest 278,796 - - 278,796
Total Expenditures 620,758,848 - - 620,758,848
Excess (Deficiency) of RevenuesOver (Under) Expenditures 60,378,426 (581,075) (12,194) 59,785,157
Other Financing Sources (Uses):Proceeds from long-term debt 180,026 - - 180,026 Operating Transfers between (3,870,376) 3,870,376 - - Transfers in 15,850,593 2,472,437 - 18,323,030 Transfers out (37,620,826) (1,653,437) - (39,274,263)
Total Other Financing Sources (Uses) (25,460,583) 4,689,376 - (20,771,207)
Net Change in Fund Balances 34,917,843 4,108,301 (12,194) 39,013,950
Fund Balances, Beginning of Year 64,205,164 14,314,168 10,018,470 88,537,802
Fund Balances, End of Year 99,123,007$ 18,422,469$ 10,006,276$ 127,551,752$

87
COUNTY OF SAN JOAQUIN COMBINING BALANCE SHEET
ALL GENERAL FUND SPECIAL ACCOUNTS JUNE 30, 2011
General Accounts
Sheriff'sSpecial
Accounts
PrisonerWelfare
Accounts
Sheriff Commissary Jail Industries
ASSETSCash and investments:
Pooled 42,977,596$ 2,582,011$ 11,563$ 171,083$ Imprest cash 97,175 - - -
Accounts receivable 2,263,088 77,435 180,550 40,500 Taxes receivable 57,171,854 - - - Interest receivable 27,845 3,832 - - Due from other agencies 52,544,220 148,517 4,300 - Due from other funds 149,877 - - - Advances to other funds 3,402,801 - - - Other assets 25,500 - - -
Total Assets 158,659,956$ 2,811,795$ 196,413$ 211,583$
LIABILITIESAccounts payable 3,923,879$ 1,290$ 22,229$ -$ Due to other funds 930,493 2,503 4,885 - Accrued payroll 10,237,519 - - - Deferred revenues 83,697,962 47,208 60,056 - Teeter note 14,500,000 - - - Accrued interest 44,054 - - - Other liabilities 592,078 - - -
Total Liabilities 113,925,985 51,001 87,170 -
FUND BALANCES Non-spendable 3,428,301 - - - Restricted - 2,760,794 109,243 211,583 Committed - - - - Assigned 16,529,045 - - - Unassigned 24,776,625 - - -
Total Fund Balances 44,733,971 2,760,794 109,243 211,583
Total Liabilities and Fund Balances 158,659,956$ 2,811,795$ 196,413$ 211,583$
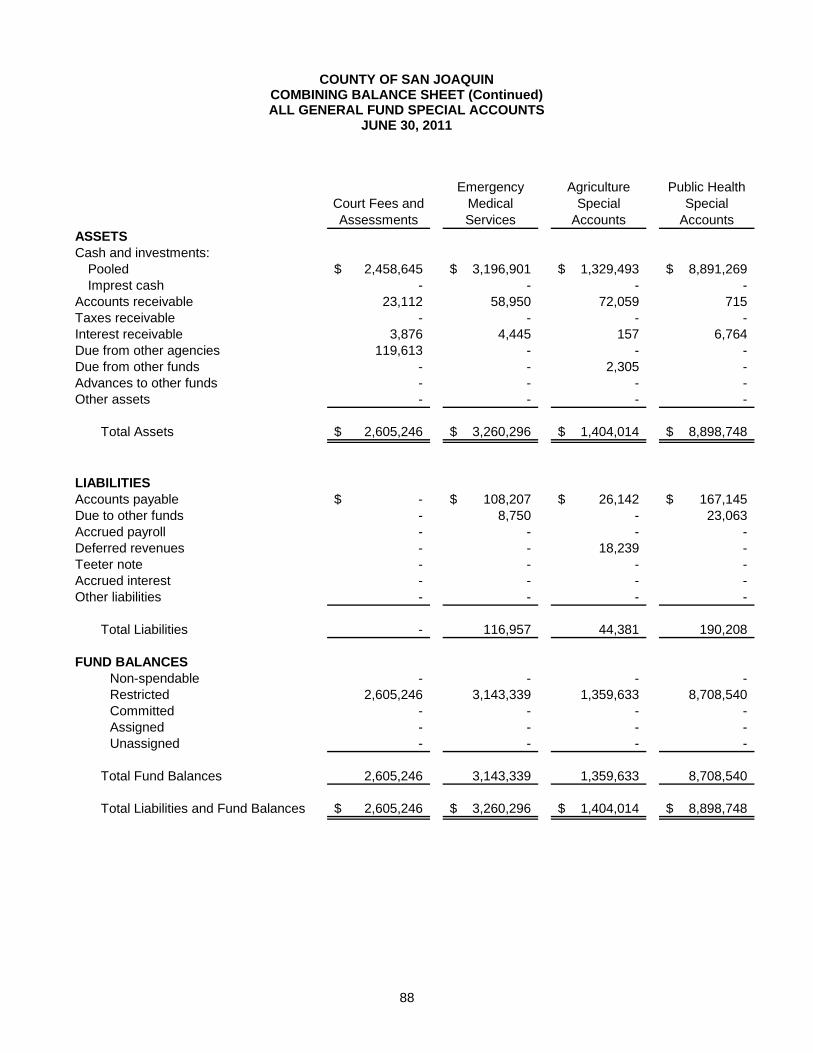
88
COUNTY OF SAN JOAQUIN COMBINING BALANCE SHEET (Continued) ALL GENERAL FUND SPECIAL ACCOUNTS
JUNE 30, 2011
Court Fees and Assessments
EmergencyMedical Services
AgricultureSpecial
Accounts
Public HealthSpecial
AccountsASSETSCash and investments:
Pooled 2,458,645$ 3,196,901$ 1,329,493$ 8,891,269$ Imprest cash - - - -
Accounts receivable 23,112 58,950 72,059 715 Taxes receivable - - - - Interest receivable 3,876 4,445 157 6,764 Due from other agencies 119,613 - - - Due from other funds - - 2,305 - Advances to other funds - - - - Other assets - - - -
Total Assets 2,605,246$ 3,260,296$ 1,404,014$ 8,898,748$
LIABILITIESAccounts payable -$ 108,207$ 26,142$ 167,145$ Due to other funds - 8,750 - 23,063 Accrued payroll - - - - Deferred revenues - - 18,239 - Teeter note - - - - Accrued interest - - - - Other liabilities - - - -
Total Liabilities - 116,957 44,381 190,208
FUND BALANCES Non-spendable - - - - Restricted 2,605,246 3,143,339 1,359,633 8,708,540 Committed - - - - Assigned - - - - Unassigned - - - -
Total Fund Balances 2,605,246 3,143,339 1,359,633 8,708,540
Total Liabilities and Fund Balances 2,605,246$ 3,260,296$ 1,404,014$ 8,898,748$
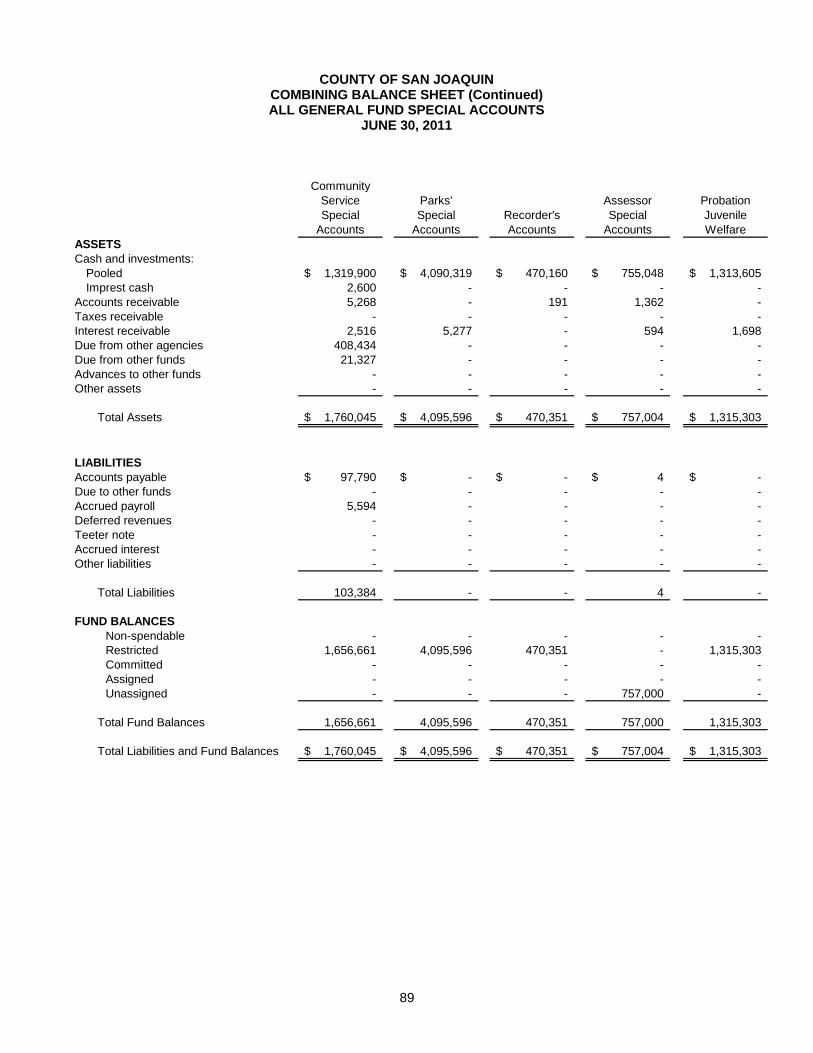
89
COUNTY OF SAN JOAQUIN COMBINING BALANCE SHEET (Continued) ALL GENERAL FUND SPECIAL ACCOUNTS
JUNE 30, 2011
CommunityServiceSpecial
Accounts
Parks'Special
AccountsRecorder's Accounts
AssessorSpecial
Accounts
Probation Juvenile Welfare
ASSETSCash and investments:
Pooled 1,319,900$ 4,090,319$ 470,160$ 755,048$ 1,313,605$ Imprest cash 2,600 - - - -
Accounts receivable 5,268 - 191 1,362 - Taxes receivable - - - - - Interest receivable 2,516 5,277 - 594 1,698 Due from other agencies 408,434 - - - - Due from other funds 21,327 - - - - Advances to other funds - - - - - Other assets - - - - -
Total Assets 1,760,045$ 4,095,596$ 470,351$ 757,004$ 1,315,303$
LIABILITIESAccounts payable 97,790$ -$ -$ 4$ -$ Due to other funds - - - - - Accrued payroll 5,594 - - - - Deferred revenues - - - - - Teeter note - - - - - Accrued interest - - - - - Other liabilities - - - - -
Total Liabilities 103,384 - - 4 -
FUND BALANCES Non-spendable - - - - - Restricted 1,656,661 4,095,596 470,351 - 1,315,303 Committed - - - - - Assigned - - - - - Unassigned - - - 757,000 -
Total Fund Balances 1,656,661 4,095,596 470,351 757,000 1,315,303
Total Liabilities and Fund Balances 1,760,045$ 4,095,596$ 470,351$ 757,004$ 1,315,303$

90
COUNTY OF SAN JOAQUIN COMBINING BALANCE SHEET (Continued) ALL GENERAL FUND SPECIAL ACCOUNTS
JUNE 30, 2011
CommunityDevelopment
Accounts
DistrictAttorneyAccounts
HSAGrant
AccountsOther
Accounts TotalASSETSCash and investments:
Pooled 2,517,167$ 6,102,816$ 20,239,228$ 18,364,093$ 116,790,897$ Imprest cash - - 150,000 - 249,775
Accounts receivable 8,577 11,242 - 159 2,743,208 Taxes receivable - 7,005 - - 57,178,859 Interest receivable 3,581 11,449 - 22,445 94,479 Due from other agencies - - - - 53,225,084 Due from other funds - - - - 173,509 Advances to other funds - - - - 3,402,801 Other assets - - - - 25,500
Total Assets 2,529,325$ 6,132,512$ 20,389,228$ 18,386,697$ 233,884,112$
LIABILITIESAccounts payable -$ 3$ -$ -$ 4,346,689$ Due to other funds 935 - - - 970,629 Accrued payroll - - - - 10,243,113 Deferred revenues - - 20,241,077 - 104,064,542 Teeter note - - - - 14,500,000 Accrued interest - - - - 44,054 Other liabilities - - - - 592,078
Total Liabilities 935 3 20,241,077 - 134,761,105
FUND BALANCES Non-spendable - - - - 3,428,301 Restricted 2,528,390 6,132,509 148,151 - 35,245,339 Committed - - - - - Assigned - - - - 16,529,045 Unassigned - - - 18,386,697 43,920,322
Total Fund Balances 2,528,390 6,132,509 148,151 18,386,697 99,123,007
Total Liabilities and Fund Balances 2,529,325$ 6,132,512$ 20,389,228$ 18,386,697$ 233,884,112$
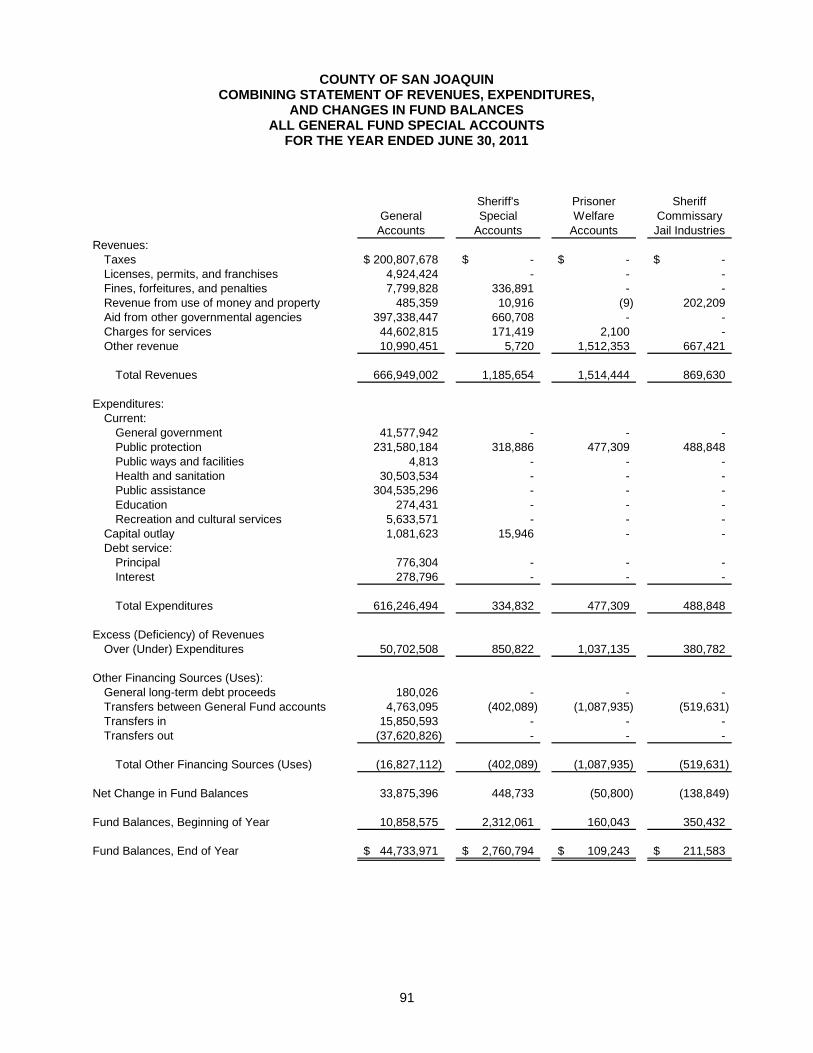
91
COUNTY OF SAN JOAQUIN COMBINING STATEMENT OF REVENUES, EXPENDITURES,
AND CHANGES IN FUND BALANCES ALL GENERAL FUND SPECIAL ACCOUNTS
FOR THE YEAR ENDED JUNE 30, 2011
General Accounts
Sheriff'sSpecial
Accounts
PrisonerWelfare
Accounts
Sheriff Commissary Jail Industries
Revenues:Taxes 200,807,678$ -$ -$ -$ Licenses, permits, and franchises 4,924,424 - - - Fines, forfeitures, and penalties 7,799,828 336,891 - - Revenue from use of money and property 485,359 10,916 (9) 202,209 Aid from other governmental agencies 397,338,447 660,708 - - Charges for services 44,602,815 171,419 2,100 - Other revenue 10,990,451 5,720 1,512,353 667,421
Total Revenues 666,949,002 1,185,654 1,514,444 869,630
Expenditures:Current:
General government 41,577,942 - - - Public protection 231,580,184 318,886 477,309 488,848 Public ways and facilities 4,813 - - - Health and sanitation 30,503,534 - - - Public assistance 304,535,296 - - - Education 274,431 - - - Recreation and cultural services 5,633,571 - - -
Capital outlay 1,081,623 15,946 - - Debt service:
Principal 776,304 - - - Interest 278,796 - - -
Total Expenditures 616,246,494 334,832 477,309 488,848
Excess (Deficiency) of RevenuesOver (Under) Expenditures 50,702,508 850,822 1,037,135 380,782
Other Financing Sources (Uses):General long-term debt proceeds 180,026 - - - Transfers between General Fund accounts 4,763,095 (402,089) (1,087,935) (519,631) Transfers in 15,850,593 - - - Transfers out (37,620,826) - - -
Total Other Financing Sources (Uses) (16,827,112) (402,089) (1,087,935) (519,631)
Net Change in Fund Balances 33,875,396 448,733 (50,800) (138,849)
Fund Balances, Beginning of Year 10,858,575 2,312,061 160,043 350,432
Fund Balances, End of Year 44,733,971$ 2,760,794$ 109,243$ 211,583$

92
COUNTY OF SAN JOAQUIN COMBINING STATEMENT OF REVENUES, EXPENDITURES,
AND CHANGES IN FUND BALANCES (Continued) ALL GENERAL FUND SPECIAL ACCOUNTS
FOR THE YEAR ENDED JUNE 30, 2011
Court Fees and Assessments
EmergencyMedical Services
AgricultureSpecial
Accounts
Public HealthSpecial
AccountsRevenues:
Taxes -$ -$ -$ -$ Licenses, permits, and franchises - - - - Fines, forfeitures, and penalties 310,445 567,940 - 371,657 Revenue from use of money and property 11,681 13,586 22,148 2,642 Aid from other governmental agencies 526,128 96,388 - 1,091,893 Charges for services - - 587,295 (150,610) Other revenue - 62,352 123,407 (307,903)
Total Revenues 848,254 740,266 732,850 1,007,679
Expenditures:Current:
General government - - - - Public protection - - 118,288 - Public ways and facilities - - - - Health and sanitation - 537,140 - 103,740 Public assistance - - - - Education - - - - Recreation and cultural services - - - -
Capital outlay - - - - Debt service:
Principal - - - - Interest - - - -
Total Expenditures - 537,140 118,288 103,740
Excess (Deficiency) of RevenuesOver (Under) Expenditures 848,254 203,126 614,562 903,939
Other Financing Sources (Uses):General long-term debt proceeds - - - - Transfers between General Fund accounts (590,259) - (660,529) (737,702) Transfers in - - - - Transfers out - - - -
Total Other Financing Sources (Uses) (590,259) - (660,529) (737,702)
Net Change in Fund Balances 257,995 203,126 (45,967) 166,237
Fund Balances, Beginning of Year 2,347,251 2,940,213 1,405,600 8,542,303
Fund Balances, End of Year 2,605,246$ 3,143,339$ 1,359,633$ 8,708,540$

93
COUNTY OF SAN JOAQUIN COMBINING STATEMENT OF REVENUES, EXPENDITURES,
AND CHANGES IN FUND BALANCES (Continued) ALL GENERAL FUND SPECIAL ACCOUNTS
FOR THE YEAR ENDED JUNE 30, 2011
CommunityServiceSpecial
Accounts
Parks'Special
AccountsRecorder's Accounts
AssessorSpecial
Accounts
Probation Juvenile Welfare
Revenues:Taxes -$ -$ -$ -$ -$ Licenses, permits, and franchises - - - - - Fines, forfeitures, and penalties 61,332 - - - - Revenue from use of money and property 5,918 14,406 (514) 12,870 31,830 Aid from other governmental agencies 1,304,790 - - - 2,283,566 Charges for services 167,949 188,330 51,008 314,328 - Other revenue 50,690 494,590 - - 2,172
Total Revenues 1,590,679 697,326 50,494 327,198 2,317,568
Expenditures:Current:
General government - - - - - Public protection - - - - 2,164,341 Public ways and facilities - - - - - Health and sanitation - - - - - Public assistance 276,967 - - - - Education - - - - - Recreation and cultural services - 2,500 - - -
Capital outlay - - - - - Debt service:
Principal - - - - - Interest - - - - -
Total Expenditures 276,967 2,500 - - 2,164,341
Excess (Deficiency) of RevenuesOver (Under) Expenditures 1,313,712 694,826 50,494 327,198 153,227
Other Financing Sources (Uses):General long-term debt proceeds - - - - - Transfers between General Fund accounts (1,738,513) (1,422,965) (12,900) 219,975 - Transfers in - - - - - Transfers out - - - - -
Total Other Financing Sources (Uses) (1,738,513) (1,422,965) (12,900) 219,975 -
Net Change in Fund Balances (424,801) (728,139) 37,594 547,173 153,227
Fund Balances, Beginning of Year 2,081,462 4,823,735 432,757 209,827 1,162,076
Fund Balances, End of Year 1,656,661$ 4,095,596$ 470,351$ 757,000$ 1,315,303$

94
COUNTY OF SAN JOAQUIN COMBINING STATEMENT OF REVENUES, EXPENDITURES,
AND CHANGES IN FUND BALANCES (Continued) ALL GENERAL FUND SPECIAL ACCOUNTS
FOR THE YEAR ENDED JUNE 30, 2011
Community Development
Accounts
DistrictAttorneyAccounts
HSAGrant
AccountsOther
Accounts TotalRevenues:
Taxes -$ -$ -$ -$ 200,807,678$ Licenses, permits, and franchises 112,139 - - - 5,036,563 Fines, forfeitures, and penalties - (256,732) - - 9,191,361 Revenue from use of money and property 11,018 33,794 (27,199) 164,236 994,891 Aid from other governmental agencies - (44,450) - - 403,257,470 Charges for services 5,000 2,105,811 - 154,799 48,200,244 Other revenue - - - 47,814 13,649,067
Total Revenues 128,157 1,838,423 (27,199) 366,849 681,137,274
Expenditures:Current:
General government - - - 5,923 41,583,865 Public protection 2,466 - - - 235,150,322 Public ways and facilities - - - - 4,813 Health and sanitation - - - - 31,144,414 Public assistance - - - - 304,812,263 Education - - - - 274,431 Recreation and cultural services - - - - 5,636,071
Capital outlay - - - - 1,097,569 Debt service:
Principal - - - - 776,304 Interest - - - - 278,796
Total Expenditures 2,466 - - 5,923 620,758,848
Excess (Deficiency) of RevenuesOver (Under) Expenditures 125,691 1,838,423 (27,199) 360,926 60,378,426
Other Financing Sources (Uses):General long-term debt proceeds - - - - 180,026 Transfers between General Fund accounts - (2,050,923) - 370,000 (3,870,376) Transfers in - - - - 15,850,593 Transfers out - - - - (37,620,826)
Total Other Financing Sources (Uses) - (2,050,923) - 370,000 (25,460,583)
Net Change in Fund Balances 125,691 (212,500) (27,199) 730,926 34,917,843
Fund Balances, Beginning of Year 2,402,699 6,345,009 175,350 17,655,771 64,205,164
Fund Balances, End of Year 2,528,390$ 6,132,509$ 148,151$ 18,386,697$ 99,123,007$

NONMAJOR GOVERNMENTAL FUNDS
Nonmajor governmental funds include special revenue funds, capital project funds, and debt service funds that are not classified as major funds by the County.

95
COUNTY OF SAN JOAQUIN COMBINING BALANCE SHEET
NONMAJOR GOVERNMENTAL FUNDS JUNE 30, 2011
SpecialRevenue
Funds
DebtServiceFunds
CapitalProjectsFunds
TotalNonmajor
GovernmentalFunds
ASSETSCash and investments:
Pooled 120,121,548$ 8,049,700$ 21,295,383$ 149,466,631$ Imprest cash 33,650 - - 33,650
Interest receivable 180,577 77 21,642 202,296 Accounts receivable 572,721 - 87,542 660,263 Taxes receivable 1,910,019 - - 1,910,019 Due from other agencies 3,040,700 - 19,527 3,060,227 Due from other funds 51,620 - - 51,620 Inventory 357,982 - - 357,982 Advances to other funds 664,892 - - 664,892 Restricted assets:
Restricted cash and investments - 10,468,083 - 10,468,083 Others - 64,248 - 64,248
Total Assets 126,933,709$ 18,582,108$ 21,424,094$ 166,939,911$
LIABILITIESAccounts payable 3,974,142$ -$ 65,260$ 4,039,402$ Accrued payroll 1,342,545 - - 1,342,545 Due to other funds 313,089 - - 313,089 Advances from other funds 4,593,179 - 1,781,446 6,374,625 Deferred revenues 1,895,551 - 14,346 1,909,897
Total Liabilities 12,118,506 - 1,861,052 13,979,558
FUND BALANCESNon-spendable 1,022,874 - - 1,022,874 Restricted 116,322,367 692,084 11,325,992 128,340,443 Assigned - 17,890,024 8,799,052 26,689,076 Unassigned (2,530,038) - (562,002) (3,092,040)
Total Fund Balances 114,815,203 18,582,108 19,563,042 152,960,353
Total Liabilities and Fund Balances 126,933,709$ 18,582,108$ 21,424,094$ 166,939,911$

96
COUNTY OF SAN JOAQUIN COMBINING STATEMENT OF REVENUES, EXPENDITURES,
AND CHANGES IN FUND BALANCES NONMAJOR GOVERNMENTAL FUNDS FOR THE YEAR ENDED JUNE 30, 2011
SpecialRevenue
Funds
DebtServiceFunds
CapitalProjectsFunds
TotalNonmajor
GovernmentalFunds
Revenues:Taxes 18,816,364$ -$ -$ 18,816,364$ Licenses, permits, and franchises 246,716 - - 246,716 Fines, forfeitures, and penalties 14,267 - 1,022,023 1,036,290 Revenue from use of money and property 554,198 105,777 49,698 709,673 Aid from other governmental agencies 83,076,325 - 956,140 84,032,465 Charges for services 18,860,089 23,659 2,716 18,886,464 Other revenue 1,302,539 - - 1,302,539
Total Revenues 122,870,498 129,436 2,030,577 125,030,511
Expenditures:Current:
General government - 532 - 532 Public protection 26,929,995 - 209,573 27,139,568 Public ways and facilities 27,095,722 - 224,714 27,320,436 Community infrastructure program 2,490,201 2,490,201 Health and sanitation 597,797 - - 597,797 Public assistance 40,735,836 - - 40,735,836 Education 5,389,036 - - 5,389,036 Recreation and cultural services 249,386 - - 249,386
Capital outlay 18,590,549 - 3,298,711 21,889,260 Debt service:
Principal 18,535 2,355,400 - 2,373,935 Interest and debt issuance costs 89,067 6,566,061 - 6,655,128
Total Expenditures 122,186,124 8,921,993 3,732,998 134,841,115
Excess (Deficiency) of RevenuesOver (Under) Expenditures 684,374 (8,792,557) (1,702,421) (9,810,604)
Other Financing Sources (Uses):Transfers in 1,901,281 8,898,240 277,474 11,076,995 Transfers out (3,163,772) (12,513) (3,431,189) (6,607,474)
Total Other Financing Sources (Uses) (1,262,491) 8,885,727 (3,153,715) 4,469,521
Net Change in Fund Balances (578,117) 93,170 (4,856,136) (5,341,083)
Fund Balances, Beginning of the Year 115,393,320 18,488,938 24,419,178 158,301,436
Fund Balances, End of Year 114,815,203$ 18,582,108$ 19,563,042$ 152,960,353$

Special Revenue Funds Special revenue funds are used to account for and report the proceeds of specific revenue sources that are restricted or committed to expenditure for specified purposes other than debt service and capital projects.

97
COUNTY OF SAN JOAQUIN COMBINING BALANCE SHEET
NONMAJOR SPECIAL REVENUE FUNDS JUNE 30, 2011
RoadFish andGame
CountyFacilities
Fee Program
SpecialDistricts
SettlementFund
ASSETSCash and investments 31,154,729$ 283,990$ 13,918,222$ 666,366$ Imprest cash 500 - - - Interest receivable 43,993 151 21,089 992 Accounts receivable 35,862 12,554 287,789 - Taxes receivable 1,400,870 - - - Due from other agencies 1,312,920 - - - Due from other funds 48,169 - - - Inventories 357,982 - - - Advances to other funds - - - 664,892
Total Assets 34,355,025$ 296,695$ 14,227,100$ 1,332,250$
LIABILITIESAccounts payable 1,987,017$ -$ 1,507$ -$ Accrued payroll 496,630 - - - Due to other funds 156,474 - - - Advances from other funds - - - - Deferred revenues 1,325,332 - - -
Total Liabilities 3,965,453 - 1,507 -
FUND BALANCES
Non-spendable 357,982 - - 664,892 Restricted 30,031,590 296,695 14,225,593 667,358 Unassigned - - - -
Total Fund Balances 30,389,572 296,695 14,225,593 1,332,250
Total Liabilities and Fund Balances 34,355,025$ 296,695$ 14,227,100$ 1,332,250$

98
COUNTY OF SAN JOAQUIN COMBINING BALANCE SHEET (Continued)
NONMAJOR SPECIAL REVENUE FUNDS JUNE 30, 2011
JobTraining
PartnershipAct
RabiesTreatment
CountyHead Start
RoadDistrict
#1ASSETSCash and investments 970,673$ 48,757$ (21,924)$ 2,929,221$ Imprest cash 250 - - - Interest receivable - - 836 4,243 Accounts receivable 2,333 - - - Taxes receivable - - - 20,434 Due from other agencies 557,742 - - - Due from other funds - - - - Inventories - - - - Advances to other funds - - - -
Total Assets 1,530,998$ 48,757$ (21,088)$ 2,953,898$
LIABILITIESAccounts payable 221,814$ -$ 25$ 1,490$ Accrued payroll 314,338 - 13,203 - Due to other funds 8,250 - - 3,879 Advances from other funds - - - - Deferred revenues - - - 20,472
Total Liabilities 544,402 - 13,228 25,841
FUND BALANCES
Non-spendable - - - - Restricted 986,596 48,757 - 2,928,057 Unassigned - - (34,316) -
Total Fund Balances 986,596 48,757 (34,316) 2,928,057
Total Liabilities and Fund Balances 1,530,998$ 48,757$ (21,088)$ 2,953,898$

99
COUNTY OF SAN JOAQUIN COMBINING BALANCE SHEET (Continued)
NONMAJOR SPECIAL REVENUE FUNDS JUNE 30, 2011
RoadDistrict
#2
RoadDistrict
#3
RoadDistrict
#4
RoadDistrict
#5ASSETSCash and investments 2,190,984$ 901,488$ 5,355,552$ 5,773,627$ Imprest cash - - - - Interest receivable 3,161 1,469 7,888 8,411 Accounts receivable - - - - Taxes receivable 25,070 15,761 111,329 52,364 Due from other agencies - - - - Due from other funds - - - - Inventories - - - - Advances to other funds - - - -
Total Assets 2,219,215$ 918,718$ 5,474,769$ 5,834,402$
LIABILITIESAccounts payable 159,092$ 96,024$ 460,153$ 123,802$ Accrued payroll - - - - Due to other funds 960 1,425 11,066 16,736 Advances from other funds - - - - Deferred revenues 25,137 15,596 111,577 52,452
Total Liabilities 185,189 113,045 582,796 192,990
FUND BALANCES
Non-spendable - - - - Restricted 2,034,026 805,673 4,891,973 5,641,412 Unassigned - - - -
Total Fund Balances 2,034,026 805,673 4,891,973 5,641,412
Total Liabilities and Fund Balances 2,219,215$ 918,718$ 5,474,769$ 5,834,402$

100
COUNTY OF SAN JOAQUIN COMBINING BALANCE SHEET (Continued)
NONMAJOR SPECIAL REVENUE FUNDS JUNE 30, 2011
CountyLibrary
DistrictAttorneyNarcotics
Enforcement
SheriffNarcotics
Enforcement
JusticeAssistance
GrantASSETSCash and investments 927,197$ 1,625$ 41,916$ 12,630$ Imprest cash - - 7,500 - Interest receivable 1,249 52 53 110 Accounts receivable - 1,532 - - Taxes receivable 194,626 - - - Due from other agencies - - - - Due from other funds - - - - Inventories - - - - Advances to other funds - - - -
Total Assets 1,123,072$ 3,209$ 49,469$ 12,740$
LIABILITIESAccounts payable -$ -$ -$ 8,201$ Accrued payroll - - - 20,996 Due to other funds - - - 1,286 Advances from other funds - - - - Deferred revenues 194,956 - - -
Total Liabilities 194,956 - - 30,483
FUND BALANCES
Non-spendable - - - - Restricted 928,116 3,209 49,469 - Unassigned - - - (17,743)
Total Fund Balances 928,116 3,209 49,469 (17,743)
Total Liabilities and Fund Balances 1,123,072$ 3,209$ 49,469$ 12,740$

101
COUNTY OF SAN JOAQUIN COMBINING BALANCE SHEET (Continued)
NONMAJOR SPECIAL REVENUE FUNDS JUNE 30, 2011
SupplementalLocal Law
EnforcementBlock Grant
Recorder'sEquipmentAutomation
Family Support and
IncentiveEarnings
CommunityInfra-
StructureASSETSCash and investments 33,942$ 5,443,295$ 182,400$ 25,015,720$ Imprest cash - - 25,400 - Interest receivable 418 8,440 1,598 36,442 Accounts receivable - 4,332 - 87,205 Taxes receivable - - - - Due from other agencies 1,148,871 - - - Due from other funds - - - - Inventories - - - - Advances to other funds - - - -
Total Assets 1,183,231$ 5,456,067$ 209,398$ 25,139,367$
LIABILITIESAccounts payable 255,934$ 2,506$ 63,272$ 5,124$ Accrued payroll 34,154 14,400 435,553 - Due to other funds 3,168 - 20,241 11,943 Advances from other funds - - - - Deferred revenues - - (370) -
Total Liabilities 293,256 16,906 518,696 17,067
FUND BALANCES
Non-spendable - - - - Restricted 889,975 5,439,161 - 25,122,300 Unassigned - - (309,298) -
Total Fund Balances 889,975 5,439,161 (309,298) 25,122,300
Total Liabilities and Fund Balances 1,183,231$ 5,456,067$ 209,398$ 25,139,367$

102
COUNTY OF SAN JOAQUIN COMBINING BALANCE SHEET (Continued)
NONMAJOR SPECIAL REVENUE FUNDS JUNE 30, 2011
SubstanceAbuse and
CrimePrevention
PublicWorksSpecial
Accounts
SpecialDistricts
Under theBoard Total
ASSETSCash and investments (83,304)$ 2,948,807$ 21,425,635$ 120,121,548$ Imprest cash - - - 33,650 Interest receivable (8) 4,440 35,550 180,577 Accounts receivable - 24,354 116,760 572,721 Taxes receivable - - 89,565 1,910,019 Due from other agencies - - 21,167 3,040,700 Due from other funds - - 3,451 51,620 Inventories - - - 357,982 Advances to other funds - - - 664,892
Total Assets (83,312)$ 2,977,601$ 21,692,128$ 126,933,709$
LIABILITIESAccounts payable 93$ -$ 588,088$ 3,974,142$ Accrued payroll - - 13,271 1,342,545 Due to other funds - 1,680 75,981 313,089 Advances from other funds - - 4,593,179 4,593,179 Deferred revenues - - 150,399 1,895,551
Total Liabilities 93 1,680 5,420,918 12,118,506
FUND BALANCES
Non-spendable - - - 1,022,874 Restricted - 2,975,921 18,356,486 116,322,367 Unassigned (83,405) - (2,085,276) (2,530,038)
Total Fund Balances (83,405) 2,975,921 16,271,210 114,815,203
Total Liabilities and Fund Balances (83,312)$ 2,977,601$ 21,692,128$ 126,933,709$
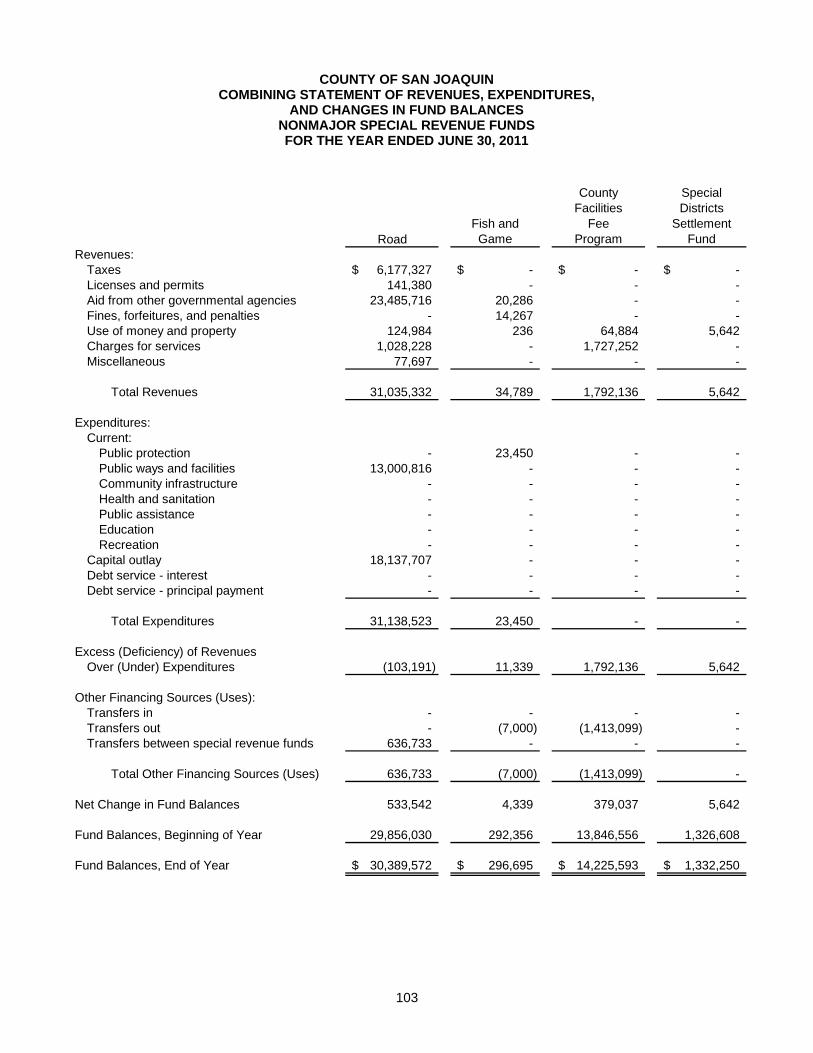
103
COUNTY OF SAN JOAQUIN COMBINING STATEMENT OF REVENUES, EXPENDITURES,
AND CHANGES IN FUND BALANCES NONMAJOR SPECIAL REVENUE FUNDS FOR THE YEAR ENDED JUNE 30, 2011
RoadFish andGame
CountyFacilities
FeeProgram
SpecialDistricts
SettlementFund
Revenues:Taxes 6,177,327$ -$ -$ -$ Licenses and permits 141,380 - - - Aid from other governmental agencies 23,485,716 20,286 - - Fines, forfeitures, and penalties - 14,267 - - Use of money and property 124,984 236 64,884 5,642 Charges for services 1,028,228 - 1,727,252 - Miscellaneous 77,697 - - -
Total Revenues 31,035,332 34,789 1,792,136 5,642
Expenditures:Current:
Public protection - 23,450 - - Public ways and facilities 13,000,816 - - - Community infrastructure - - - - Health and sanitation - - - - Public assistance - - - - Education - - - - Recreation - - - -
Capital outlay 18,137,707 - - - Debt service - interest - - - - Debt service - principal payment - - - -
Total Expenditures 31,138,523 23,450 - -
Excess (Deficiency) of RevenuesOver (Under) Expenditures (103,191) 11,339 1,792,136 5,642
Other Financing Sources (Uses):Transfers in - - - - Transfers out - (7,000) (1,413,099) - Transfers between special revenue funds 636,733 - - -
Total Other Financing Sources (Uses) 636,733 (7,000) (1,413,099) -
Net Change in Fund Balances 533,542 4,339 379,037 5,642
Fund Balances, Beginning of Year 29,856,030 292,356 13,846,556 1,326,608
Fund Balances, End of Year 30,389,572$ 296,695$ 14,225,593$ 1,332,250$
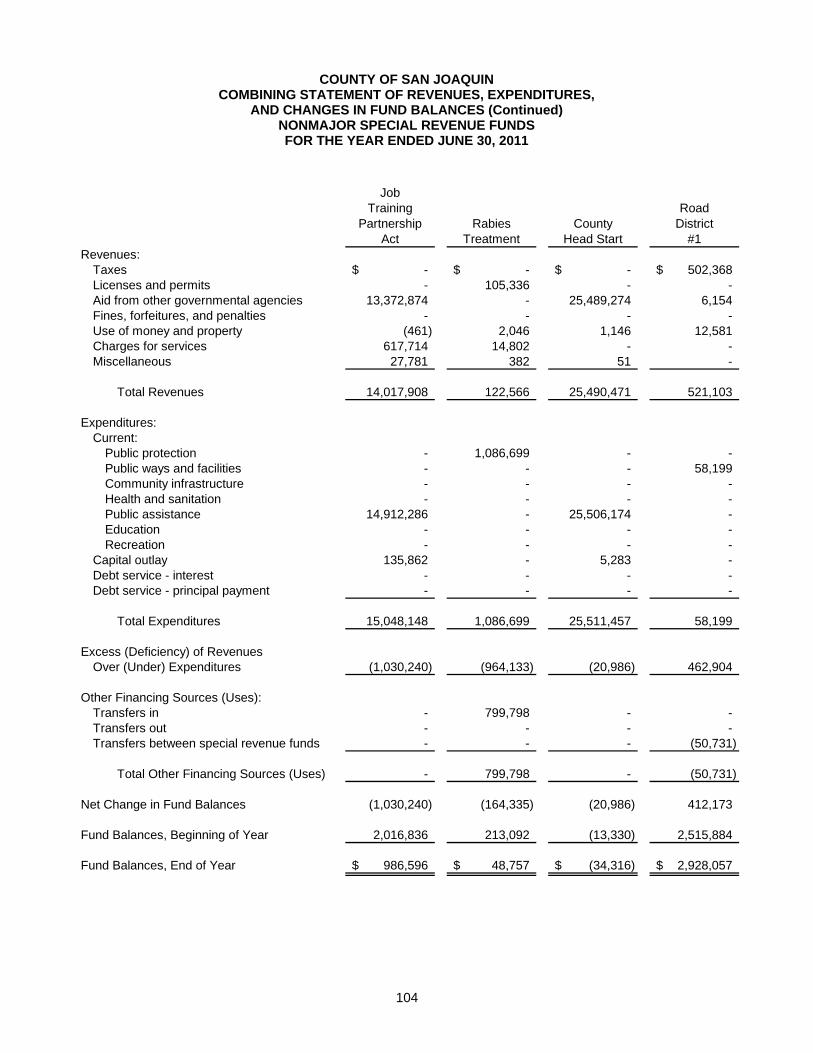
104
COUNTY OF SAN JOAQUIN COMBINING STATEMENT OF REVENUES, EXPENDITURES,
AND CHANGES IN FUND BALANCES (Continued) NONMAJOR SPECIAL REVENUE FUNDS FOR THE YEAR ENDED JUNE 30, 2011
JobTraining
PartnershipAct
RabiesTreatment
CountyHead Start
RoadDistrict
#1Revenues:
Taxes -$ -$ -$ 502,368$ Licenses and permits - 105,336 - - Aid from other governmental agencies 13,372,874 - 25,489,274 6,154 Fines, forfeitures, and penalties - - - - Use of money and property (461) 2,046 1,146 12,581 Charges for services 617,714 14,802 - - Miscellaneous 27,781 382 51 -
Total Revenues 14,017,908 122,566 25,490,471 521,103
Expenditures:Current:
Public protection - 1,086,699 - - Public ways and facilities - - - 58,199 Community infrastructure - - - - Health and sanitation - - - - Public assistance 14,912,286 - 25,506,174 - Education - - - - Recreation - - - -
Capital outlay 135,862 - 5,283 - Debt service - interest - - - - Debt service - principal payment - - - -
Total Expenditures 15,048,148 1,086,699 25,511,457 58,199
Excess (Deficiency) of RevenuesOver (Under) Expenditures (1,030,240) (964,133) (20,986) 462,904
Other Financing Sources (Uses):Transfers in - 799,798 - - Transfers out - - - - Transfers between special revenue funds - - - (50,731)
Total Other Financing Sources (Uses) - 799,798 - (50,731)
Net Change in Fund Balances (1,030,240) (164,335) (20,986) 412,173
Fund Balances, Beginning of Year 2,016,836 213,092 (13,330) 2,515,884
Fund Balances, End of Year 986,596$ 48,757$ (34,316)$ 2,928,057$

105
COUNTY OF SAN JOAQUIN COMBINING STATEMENT OF REVENUES, EXPENDITURES,
AND CHANGES IN FUND BALANCES (Continued) NONMAJOR SPECIAL REVENUE FUNDS FOR THE YEAR ENDED JUNE 30, 2011
RoadDistrict
#2
RoadDistrict
#3
RoadDistrict
#4
RoadDistrict
#5Revenues:
Taxes 604,623$ 513,664$ 2,716,560$ 1,295,799$ Licenses and permits - - - - Aid from other governmental agencies 7,556 8,188 33,537 15,766 Fines, forfeitures, and penalties - - - - Use of money and property 9,122 4,023 21,155 24,588 Charges for services - - 500 - Miscellaneous - - 9,418 -
Total Revenues 621,301 525,875 2,781,170 1,336,153
Expenditures:Current:
Public protection - - - - Public ways and facilities 416,819 168,392 1,524,960 302,090 Community infrastructure - - - - Health and sanitation - - - - Public assistance - - - - Education - - - - Recreation - - - -
Capital outlay - - - - Debt service - interest - - - - Debt service - principal payment - - - -
Total Expenditures 416,819 168,392 1,524,960 302,090
Excess (Deficiency) of RevenuesOver (Under) Expenditures 204,482 357,483 1,256,210 1,034,063
Other Financing Sources (Uses):Transfers in - - - - Transfers out - - - - Transfers between special revenue funds (37,337) (147,633) (245,517) (155,515)
Total Other Financing Sources (Uses) (37,337) (147,633) (245,517) (155,515)
Net Change in Fund Balances 167,145 209,850 1,010,693 878,548
Fund Balances, Beginning of Year 1,866,881 595,823 3,881,280 4,762,864
Fund Balances, End of Year 2,034,026$ 805,673$ 4,891,973$ 5,641,412$

106
COUNTY OF SAN JOAQUIN COMBINING STATEMENT OF REVENUES, EXPENDITURES,
AND CHANGES IN FUND BALANCES (Continued) NONMAJOR SPECIAL REVENUE FUNDS FOR THE YEAR ENDED JUNE 30, 2011
CountyLibrary
DistrictAttorneyNarcotics
Enforcement
SheriffNarcotics
Enforcement
JusticeAssistance
GrantRevenues:
Taxes 4,815,616$ -$ -$ -$ Licenses and permits - - - - Aid from other governmental agencies 187,510 - 3,058 876,453 Fines, forfeitures, and penalties - - - - Use of money and property 2,010 134 162 204 Charges for services 250,865 - - - Miscellaneous - 29,346 9,005 1
Total Revenues 5,256,001 29,480 12,225 876,658
Expenditures:Current:
Public protection - 7,254 7,847 1,026,017 Public ways and facilities - - - - Community infrastructure - - - - Health and sanitation - - - - Public assistance - - - - Education 5,389,036 - - - Recreation - - - -
Capital outlay - - - - Debt service - interest - - - - Debt service - principal payment - - - -
Total Expenditures 5,389,036 7,254 7,847 1,026,017
Excess (Deficiency) of RevenuesOver (Under) Expenditures (133,035) 22,226 4,378 (149,359)
Other Financing Sources (Uses):Transfers in 186,355 - - 98,000 Transfers out - (32,000) - (98,000) Transfers between special revenue funds - - - -
Total Other Financing Sources (Uses) 186,355 (32,000) - -
Net Change in Fund Balances 53,320 (9,774) 4,378 (149,359)
Fund Balances, Beginning of Year 874,796 12,983 45,091 131,616
Fund Balances, End of Year 928,116$ 3,209$ 49,469$ (17,743)$

107
COUNTY OF SAN JOAQUIN COMBINING STATEMENT OF REVENUES, EXPENDITURES,
AND CHANGES IN FUND BALANCES (Continued) NONMAJOR SPECIAL REVENUE FUNDS FOR THE YEAR ENDED JUNE 30, 2011
SupplementalLocal Law
EnforcementBlock Grant
Recorder'sEquipmentAutomation
FamilySupport and
IncentiveEarnings
CommunityInfra-
StructureRevenues:
Taxes -$ -$ -$ -$ Licenses and permits - - - - Aid from other governmental agencies 2,912,696 - 15,260,768 - Fines, forfeitures, and penalties - - - - Use of money and property 2,148 26,285 6,340 112,323 Charges for services - 667,814 - 1,194,634 Miscellaneous - - 12 -
Total Revenues 2,914,844 694,099 15,267,120 1,306,957
Expenditures:Current:
Public protection 2,793,766 769,411 15,344,486 - Public ways and facilities - - - - Community infrastructure - - - 2,490,201 Health and sanitation - - - - Public assistance - - - - Education - - - - Recreation - - - -
Capital outlay 79,847 2,017 - - Debt service - interest - - - - Debt service - principal payment - - - -
Total Expenditures 2,873,613 771,428 15,344,486 2,490,201
Excess (Deficiency) of RevenuesOver (Under) Expenditures 41,231 (77,329) (77,366) (1,183,244)
Other Financing Sources (Uses):Transfers in - 30,025 - - Transfers out - (487,700) (243,286) - Transfers between special revenue funds - - - -
Total Other Financing Sources (Uses) - (457,675) (243,286) -
Net Change in Fund Balances 41,231 (535,004) (320,652) (1,183,244)
Fund Balances, Beginning of Year 848,744 5,974,165 11,354 26,305,544
Fund Balances, End of Year 889,975$ 5,439,161$ (309,298)$ 25,122,300$

108
COUNTY OF SAN JOAQUIN COMBINING STATEMENT OF REVENUES, EXPENDITURES,
AND CHANGES IN FUND BALANCES (Continued) NONMAJOR SPECIAL REVENUE FUNDS FOR THE YEAR ENDED JUNE 30, 2011
SubstanceAbuse and
CrimePrevention
PublicWorksSpecial
Accounts
SpecialDistricts
Under theBoard Total
Revenues:Taxes -$ -$ 2,190,407$ 18,816,364$ Licenses and permits - - - 246,716 Aid from other governmental agencies 924,670 - 471,819 83,076,325 Fines, forfeitures, and penalties - - - 14,267 Use of money and property 552 11,483 122,611 554,198 Charges for services - 5,367 13,352,913 18,860,089 Miscellaneous - 582,070 566,776 1,302,539
Total Revenues 925,222 598,920 16,704,526 122,870,498
Expenditures:Current:
Public protection - - 5,871,065 26,929,995 Public ways and facilities - 591,936 11,032,510 27,095,722 Community infrastructure - - - 2,490,201 Health and sanitation 597,797 - - 597,797 Public assistance - - 317,376 40,735,836 Education - - - 5,389,036 Recreation - - 249,386 249,386
Capital outlay - - 229,833 18,590,549 Debt service - interest - - 18,535 18,535 Debt service -Principal payment - - 89,067 89,067
Total Expenditures 597,797 591,936 17,807,772 122,186,124
Excess (Deficiency) of RevenuesOver (Under) Expenditures 327,425 6,984 (1,103,246) 684,374
Other Financing Sources (Uses):Transfers in - - 787,103 1,901,281 Transfers out - - (882,687) (3,163,772) Transfers between special revenue funds - - - -
Total Other Financing Sources (Uses) - - (95,584) (1,262,491)
Net Change in Fund Balances 327,425 6,984 (1,198,830) (578,117)
Fund Balances, Beginning of Year (410,830) 2,968,937 17,470,040 115,393,320
Fund Balances, End of Year (83,405)$ 2,975,921$ 16,271,210$ 114,815,203$

109
COUNTY OF SAN JOAQUIN COMBINING BALANCE SHEET
NONMAJOR SPECIAL DISTRICTS GOVERNED BY THE BOARD OF SUPERVISORS – SPECIAL REVENUE FUNDS
JUNE 30, 2011
LightingDistricts
ServiceAreas
MaintenanceDistricts
ASSETSCash and investments 646,751$ 5,474,578$ 6,936,966$ Interest receivable 878 9,123 12,132 Accounts receivable 98 25,586 19,536 Taxes receivable 7,209 7,001 14,893 Due from other funds/agencies - 149 -
Total Assets 654,936$ 5,516,437$ 6,983,527$
LIABILITIESAccounts payable 23,012$ 210,909$ 194,515$ Accrued salaries and benefits - - - Advances from other funds - 1,190,378 - Due to other funds 626 20,040 2,132 Deferred revenues 7,225 18,841 25,365
Total Liabilities 30,863 1,440,168 222,012
FUND BALANCES
Non-spendable - - - Restricted 624,073 4,076,269 6,761,515 Unassigned - - -
Total Fund Balances 624,073 4,076,269 6,761,515
Total Liabilities and Fund Balances 654,936$ 5,516,437$ 6,983,527$

110
COUNTY OF SAN JOAQUIN COMBINING BALANCE SHEET (Continued)
NONMAJOR SPECIAL DISTRICTS GOVERNED BY THE BOARD OF SUPERVISORS – SPECIAL REVENUE FUNDS
JUNE 30, 2011
FloodControlDistrict
WaterDistrict
North EasternSan Joaquin
Ground WaterBanking Authority
ASSETSCash and investments 6,508,624$ (25,695)$ 145,571$ Interest receivable 10,742 3 220 Accounts receivable 69,263 2,277 - Taxes receivable 60,374 88 - Due from other funds/agencies 21,018 - -
Total Assets 6,670,021$ (23,327)$ 145,791$
LIABILITIESAccounts payable 61,336$ 766$ 1,901$ Accrued salaries and benefits 37 - - Advances from other funds - - 497,012 Due to other funds 49,675 55 - Deferred revenues 98,880 88 -
Total Liabilities 209,928 909 498,913
FUND BALANCES
Non-spendable - - - Restricted 6,460,093 - - Unassigned - (24,236) (353,122)
Total Fund Balances 6,460,093 (24,236) (353,122)
Total Liabilities and Fund Balances 6,670,021$ (23,327)$ 145,791$

111
COUNTY OF SAN JOAQUIN COMBINING BALANCE SHEET (Continued)
NONMAJOR SPECIAL DISTRICTS GOVERNED BY THE BOARD OF SUPERVISORS – SPECIAL REVENUE FUNDS
JUNE 30, 2011
Mokelumne Water
and PowerAuthority
Improvement Districts
IHSS PublicAuthority Total
ASSETSCash and investments 1,292,317$ 126,936$ 319,587$ 21,425,635$ Interest receivable 2,273 179 - 35,550 Accounts receivable - - - 116,760 Taxes receivable - - - 89,565 Due from other funds/agencies - - 3,451 24,618
Total Assets 1,294,590$ 127,115$ 323,038$ 21,692,128$
LIABILITIESAccounts payable 96,682$ -$ 2,420$ 591,541$ Accrued salaries and benefits 37 - 13,197 13,271 Advances from other funds 2,905,789 - - 4,593,179 Due to other funds - - - 72,528 Deferred revenues - - - 150,399
Total Liabilities 3,002,508 - 15,617 5,420,918
FUND BALANCES
Non-spendable - - - - Restricted - 127,115 307,421 18,356,486 Unassigned (1,707,918) - - (2,085,276)
Total Fund Balances (1,707,918) 127,115 307,421 16,271,210
Total Liabilities and Fund Balances 1,294,590$ 127,115$ 323,038$ 21,692,128$

112
COUNTY OF SAN JOAQUIN COMBINING STATEMENT OF REVENUES, EXPENDITURES,
AND CHANGES IN FUND BALANCES NONMAJOR SPECIAL DISTRICTS GOVERNED BY
THE BOARD OF SUPERVISORS – SPECIAL REVENUE FUNDS FOR THE YEAR ENDED JUNE 30, 2011
LightingDistricts
ServiceAreas
MaintenanceDistricts
Revenues:Taxes 174,947$ 176,193$ 370,736$ Aid from other governmental agencies 2,170 301,755 4,523 Use of money and property 2,549 39,152 36,893 Charges for services 257,655 4,265,113 4,705,362 Miscellaneous - 50,723 11,087
Total Revenues 437,321 4,832,936 5,128,601
Expenditures:Current:
Public protection - - - Public ways and facilities 258,659 4,357,515 4,885,528 Public assistance - - - Recreation - 249,386 -
Capital outlay - 29,614 - Debt service - interest - 68,728 - Debt service - principal - - -
Total Expenditures 258,659 4,705,243 4,885,528
Excess (Deficiency) of RevenuesOver (Under) Expenditures 178,662 127,693 243,073
Other Financing Sources (Uses):Transfers in 500 39,530 25,931 Transfers out (23,000) (688,616) (171,071) Transfers between Special Revenue Funds
Total Other Financing Sources (Uses) (22,500) (649,086) (145,140)
Net Change in Fund Balances 156,162 (521,393) 97,933
Fund Balances, Beginning of Year 467,911 4,597,662 6,663,582
Fund Balances, End of Year 624,073$ 4,076,269$ 6,761,515$

113
COUNTY OF SAN JOAQUIN COMBINING STATEMENT OF REVENUES, EXPENDITURES,
AND CHANGES IN FUND BALANCES (Continued) NONMAJOR SPECIAL DISTRICTS GOVERNED BY
THE BOARD OF SUPERVISORS – SPECIAL REVENUE FUNDS FOR THE YEAR ENDED JUNE 30, 2011
FloodControlDistrict
WaterDistrict
North EasternSan Joaquin
Ground WaterBanking Authority
Revenues:Taxes 1,466,346$ 2,185$ -$ Aid from other governmental agencies 48,345 26 115,000 Use of money and property 34,976 61 775 Charges for services 4,053,574 74,415 - Miscellaneous 504,041 - -
Total Revenues 6,107,282 76,687 115,775
Expenditures:Current:
Public protection 5,871,065 - - Public ways and facilities - 65,081 178,701 Public assistance - - - Recreation - - -
Capital outlay 198,221 - - Debt service - interest 1,212 - 2,793 Debt service - principal payment 18,535 - -
Total Expenditures 6,089,033 65,081 181,494
Excess (Deficiency) of RevenuesOver (Under) Expenditures 18,249 11,606 (65,719)
Other Financing Sources (Uses):Transfers in 62,000 - - Transfers out - - - Transfers between Special Revenue Funds (200,000) - 100,000
Total Other Financing Sources (Uses) (138,000) - 100,000
Net Change in Fund Balances (119,751) 11,606 34,281
Fund Balances, Beginning of Year 6,579,844 (35,842) (387,403)
Fund Balances, End of Year 6,460,093$ (24,236)$ (353,122)$

114
COUNTY OF SAN JOAQUIN COMBINING STATEMENT OF REVENUES, EXPENDITURES,
AND CHANGES IN FUND BALANCES (Continued) NONMAJOR SPECIAL DISTRICTS GOVERNED BY
THE BOARD OF SUPERVISORS – SPECIAL REVENUE FUNDS FOR THE YEAR ENDED JUNE 30, 2011
MokelumneWater
and PowerAuthority
ImprovementDistricts
IHSS PublicAuthority Total
Revenues:Taxes -$ -$ -$ 2,190,407$ Aid from other governmental agencies - - - 471,819 Use of money and property 6,551 560 1,094 122,611 Charges for services - (3,206) - 13,352,913 Miscellaneous 925 - - 566,776
Total Revenues 7,476 (2,646) 1,094 16,704,526
Expenditures:Current:
Public protection - - - 5,871,065 Public ways and facilities 1,287,026 - - 11,032,510 Public assistance - - 317,376 317,376 Recreation - - - 249,386
Capital outlay - - 1,998 229,833 Debt service - interest 16,334 - - 89,067 Debt service - principal payment - - - 18,535
Total Expenditures 1,303,360 - 319,374 17,807,772
Excess (Deficiency) of RevenuesOver (Under) Expenditures (1,295,884) (2,646) (318,280) (1,103,246)
Other Financing Sources (Uses):Transfers in 659,142 - - 787,103 Transfers out - - - (882,687) Transfers between Special Revenue Funds 100,000 - - -
Total Other Financing Sources (Uses) 759,142 - - (95,584)
Net Change in Fund Balances (536,742) (2,646) (318,280) (1,198,830)
Fund Balances, Beginning of Year (1,171,176) 129,761 625,701 17,470,040
Fund Balances, End of Year (1,707,918)$ 127,115$ 307,421$ 16,271,210$

Debt Service Funds
Debt service funds are used to account for and to report financial resources that are restricted, committed, or assigned to expenditure for principal and interest. Debt service funds are therefore used to report the accumulation of resources for, and the payment of, general long-term debt principal, interest, and related costs.

115
COUNTY OF SAN JOAQUIN COMBINING BALANCE SHEET
NONMAJOR DEBT SERVICE FUNDS JUNE 30, 2011
1993 MaintenanceCapital District MaintenanceFacility Shaded District FlagProject Terrace Sunnyside City Total
ASSETSCash and investments 8,002,552$ 37,151$ 9,997$ -$ 8,049,700$ Interest receivable - 61 16 - 77 Restricted assets:
Cash and investments 9,830,075 - - 638,008 10,468,083 Receivables 57,397 - - 6,851 64,248
Total Assets 17,890,024$ 37,212$ 10,013$ 644,859$ 18,582,108$
FUND BALANCES Restricted -$ 37,212$ 10,013$ 644,859$ 692,084$ Assigned 17,890,024 - - - 17,890,024
Total Fund Balances 17,890,024$ 37,212$ 10,013$ 644,859$ 18,582,108$
Special DistrictsGoverned by Board

116
COUNTY OF SAN JOAQUIN COMBINING STATEMENT OF REVENUES, EXPENDITURES,
AND CHANGES IN FUND BALANCES NONMAJOR DEBT SERVICE FUNDS
JUNE 30, 2011
1993 MaintenanceCapital District MaintenanceFacility Shaded District FlagProject Terrace Sunnyside City Total
Revenues:Use of money and property 101,478$ 188$ 50$ 4,061$ 105,777$ Charges for services - 18,220 5,439 - 23,659
Total Revenues 101,478 18,408 5,489 4,061 129,436
Expenditures:Debt service:
General government - 330 202 - 532 Principal retirement 2,220,000 4,000 1,400 130,000 2,355,400 Interest and debt issuance costs 6,073,975 13,838 3,983 474,265 6,566,061
Total Expenditures 8,293,975 18,168 5,585 604,265 8,921,993
Excess (Deficiency) of RevenuesOver (Under) Expenditures (8,192,497) 240 (96) (600,204) (8,792,557)
Other Financing Sources (Uses):Transfers in 8,293,975 - - 604,265 8,898,240 Transfers out - - - (12,513) (12,513)
Total Other Financing Sources 8,293,975 - - 591,752 8,885,727
Net Change in Fund Balances 101,478 240 (96) (8,452) 93,170
Fund Balances, Beginning of Year 17,788,546 36,972 10,109 653,311 18,488,938
Fund Balances, End of Year 17,890,024$ 37,212$ 10,013$ 644,859$ 18,582,108$
Special DistrictsGoverned by Board

Capital Projects Funds
Capital Projects Funds are used to account for and report financial resources that are restricted, committed, or assigned to expenditure for capital outlays, including the acquisition or construction of capital facilities and other capital assets. Capital projects funds exclude major capital facilities financed by proprietary funds or in trust funds for individual, private organizations, or other governments.

117
COUNTY OF SAN JOAQUIN COMBINING BALANCE SHEET
NONMAJOR CAPITAL PROJECTS FUNDS JUNE 30, 2011
Courthouse Construction
Criminal Justice
Construction
Airport East
ConstructionASSETS
Cash and investments 234,694$ 7,159,313$ 7,685,753$ Interest receivable 337 13,540 - Due from other agencies - - - Accounts receivable 17,598 69,944 -
Total Assets 252,629$ 7,242,797$ 7,685,753$
LIABILITIESCurrent liabilities:
Accounts payables -$ -$ -$ Advances from other funds - - - Deferred revenues - - -
Total Liabilities - - -
FUND BALANCES Non-spendable - - - Restricted 252,629 7,242,797 - Committed - - - Assigned - - 7,685,753 Unassigned - - -
Total Fund Balances 252,629 7,242,797 7,685,753
Total Liabilities and Fund Balances 252,629$ 7,242,797$ 7,685,753$

118
COUNTY OF SAN JOAQUIN COMBINING BALANCE SHEET (Continued) NONMAJOR CAPITAL PROJECTS FUNDS
JUNE 30, 2011
Public Health Construction
Special Districts Governed by
the Board TotalASSETS
Cash and investments 1,111,714$ 5,103,909$ 21,295,383$ Interest receivable 1,585 6,180 21,642 Due from other agencies - 19,527 19,527 Accounts receivable - - 87,542
Total Assets 1,113,299$ 5,129,616$ 21,424,094$
LIABILITIESCurrent liabilities:
Accounts payables -$ 65,260$ 65,260$ Advances from other funds - 1,781,446 1,781,446 Deferred revenues - 14,346 14,346
Total Liabilities - 1,861,052 1,861,052
FUND BALANCES Non-spendable - - - Restricted - 3,830,566 11,325,992 Committed - - - Assigned 1,113,299 - 8,799,052 Unassigned - (562,002) (562,002)
Total Fund Balances 1,113,299 3,268,564 19,563,042
Total Liabilities and Fund Balances 1,113,299$ 5,129,616$ 21,424,094$

119
COUNTY OF SAN JOAQUIN COMBINING STATEMENT OF REVENUES, EXPENDITURES,
AND CHANGES IN FUND BALANCES NONMAJOR CAPITAL PROJECTS FUNDS
FOR THE YEAR ENDED JUNE 30, 2011
Courthouse Construction
Criminal Justice
Construction
Airport East
ConstructionRevenues:
Fines, forfeitures, and penalties 161,393$ 860,630$ -$ Use of money and property 1,106 42,781 (10,788) Aid from other governmental agencies - - - Charges for services - - -
Total Revenues 162,499 903,411 (10,788)
Expenditures:Public protection 209,573 - - Public ways and facilities - - - Capital outlay - - 924,740
Total Expenditures 209,573 - 924,740
Excess (Deficiency) of RevenuesOver (Under) Expenditures (47,074) 903,411 (935,528)
Other Financing Sources (Uses):Transfers in - - - Transfers out - (3,316,689) -
Total Other Financing Sources (Uses) - (3,316,689) -
Net Change in Fund Balances (47,074) (2,413,278) (935,528)
Fund Balances, Beginning of Year 299,703 9,656,075 8,621,281
Fund Balances, End of Year 252,629$ 7,242,797$ 7,685,753$

120
COUNTY OF SAN JOAQUIN COMBINING STATEMENT OF REVENUES, EXPENDITURES,
AND CHANGES IN FUND BALANCES (Continued) NONMAJOR CAPITAL PROJECTS FUNDS
FOR THE YEAR ENDED JUNE 30, 2011
Public Health Construction
Special Districts Governed by
the Board TotalRevenues:
Fines, forfeitures, and penalties -$ -$ 1,022,023$ Use of money and property 4,902 11,697 49,698 Aid from other governmental agencies - 956,140 956,140 Charges for services - 2,716 2,716
Total Revenues 4,902 970,553 2,030,577
Expenditures:Public protection - - 209,573 Public ways and facilities - 224,714 224,714 Capital outlay - 2,373,971 3,298,711
Total Expenditures - 2,598,685 3,732,998
Excess (Deficiency) of RevenuesOver (Under) Expenditures 4,902 (1,628,132) (1,702,421)
Other Financing Sources (Uses):Transfers in - 277,474 277,474 Transfers out - (114,500) (3,431,189)
Total Other Financing Sources (Uses) - 162,974 (3,153,715)
Net Change in Fund Balances 4,902 (1,465,158) (4,856,136)
Fund Balances, Beginning of Year 1,108,397 4,733,722 24,419,178
Fund Balances, End of Year 1,113,299$ 3,268,564$ 19,563,042$
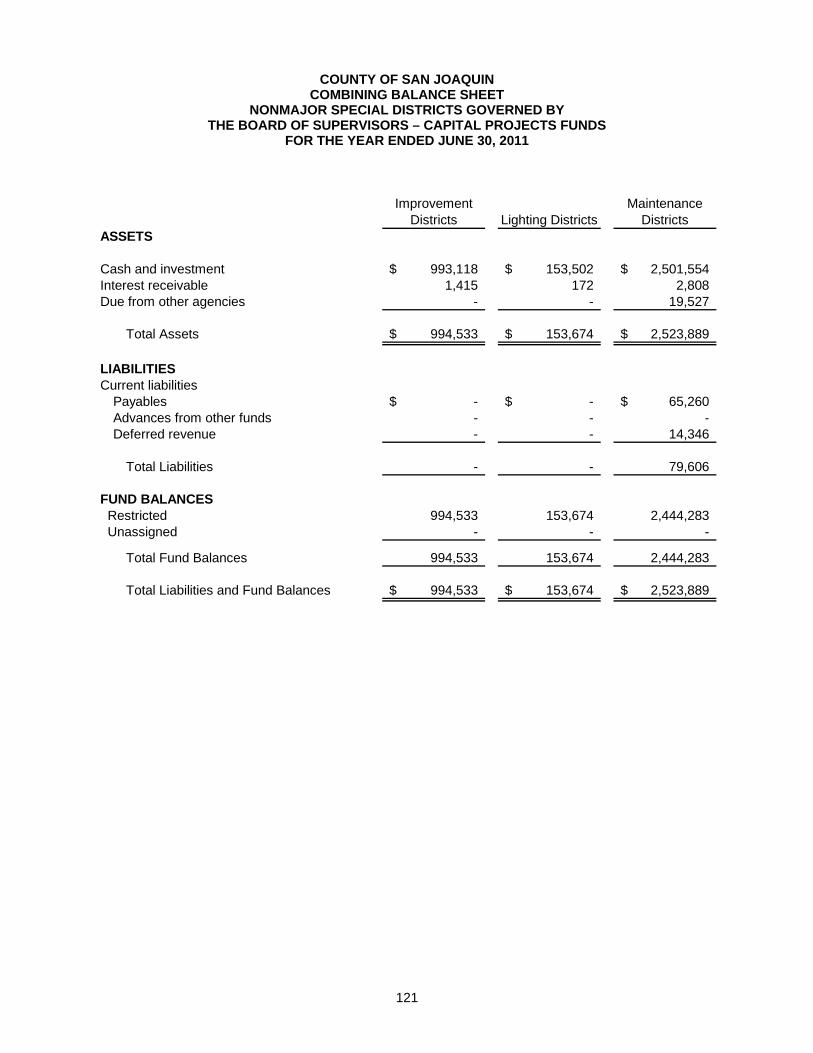
121
COUNTY OF SAN JOAQUIN COMBINING BALANCE SHEET
NONMAJOR SPECIAL DISTRICTS GOVERNED BY THE BOARD OF SUPERVISORS – CAPITAL PROJECTS FUNDS
FOR THE YEAR ENDED JUNE 30, 2011
Improvement Districts Lighting Districts
Maintenance Districts
ASSETS
Cash and investment 993,118$ 153,502$ 2,501,554$ Interest receivable 1,415 172 2,808 Due from other agencies - - 19,527
Total Assets 994,533$ 153,674$ 2,523,889$
LIABILITIESCurrent liabilities
Payables -$ -$ 65,260$ Advances from other funds - - - Deferred revenue - - 14,346
Total Liabilities - - 79,606
FUND BALANCES Restricted 994,533 153,674 2,444,283 Unassigned - - -
Total Fund Balances 994,533 153,674 2,444,283
Total Liabilities and Fund Balances 994,533$ 153,674$ 2,523,889$

122
COUNTY OF SAN JOAQUIN COMBINING BALANCE SHEET (Continued)
NONMAJOR SPECIAL DISTRICTS GOVERNED BY THE BOARD OF SUPERVISORS – CAPITAL PROJECTS FUNDS
FOR THE YEAR ENDED JUNE 30, 2011 County Service Areas Flood Control Total
ASSETS
Cash and investment 1,217,659$ 238,076$ 5,103,909$ Interest receivable 1,785 - 6,180 Due from other agencies - - 19,527
Total Assets 1,219,444$ 238,076$ 5,129,616$
LIABILITIESCurrent liabilities
Payables -$ -$ 65,260$ Advances from other funds 1,781,446 - 1,781,446 Deferred revenue - - 14,346
Total Liabilities 1,781,446 - 1,861,052
FUND BALANCES Restricted - 238,076 3,830,566 Unassigned (562,002) - (562,002)
Total Fund Balances (562,002) 238,076 3,268,564
Total Liabilities and Fund Balances 1,219,444$ 238,076$ 5,129,616$

123
COUNTY OF SAN JOAQUIN COMBINING STATEMENT OF REVENUES, EXPENDITURES,
AND CHANGES IN FUND BALANCES NONMAJOR SPECIAL DISTRICTS GOVERNED BY
THE BOARD OF SUPERVISORS – CAPITAL PROJECTS FUNDS FOR THE YEAR ENDED JUNE 30, 2011
ImprovementDistricts Lighting Districts
MaintenanceDistricts
Revenues:Use of money and property 4,376$ 538$ 9,346$ Aid from other agencies - - 956,140 Charges for services 2,716 - -
Total Revenues 7,092 538 965,486
Expenditures:Public ways and facilities - - 224,714 Capital outlay - - 967,341
Total Expenditures - - 1,192,055
Excess (Deficiency) of RevenuesOver (Under) Expenditures 7,092 538 (226,569)
Other Financing Sources (Uses):Transfers in - 23,000 170,140 Transfers out - (500) (25,000)
Total Other Financing Sources (Uses) - 22,500 145,140
Net Change in Fund Balances 7,092 23,038 (81,429)
Fund Balances, Beginning of Year 987,441 130,636 2,525,712
Fund Balances, End of Year 994,533$ 153,674$ 2,444,283$

124
COUNTY OF SAN JOAQUIN COMBINING STATEMENT OF REVENUES, EXPENDITURES,
AND CHANGES IN FUND BALANCES (Continued) NONMAJOR SPECIAL DISTRICTS GOVERNED BY
THE BOARD OF SUPERVISORS – CAPITAL PROJECTS FUNDS FOR THE YEAR ENDED JUNE 30, 2011
County ServiceAreas Flood Control Total
Revenues:Use of money and property (2,178)$ (385)$ 11,697$ Aid from other agencies - - 956,140 Charges for services - - 2,716
Total Revenues (2,178) (385) 970,553
Expenditures:Public ways and facilities - - 224,714 Capital outlay 1,406,630 - 2,373,971
Total Expenditures 1,406,630 - 2,598,685
Excess (Deficiency) of RevenuesOver (Under) Expenditures (1,408,808) (385) (1,628,132)
Other Financing Sources (Uses):Transfers in 84,334 - 277,474 Transfers out (27,000) (62,000) (114,500)
Total Other Financing Sources (Uses) 57,334 (62,000) 162,974
Net Change in Fund Balances (1,351,474) (62,385) (1,465,158)
Fund Balances, Beginning of Year 789,472 300,461 4,733,722
Fund Balances, End of Year (562,002)$ 238,076$ 3,268,564$

Internal Service Funds
Internal service funds are used to account for the financing of goods or services provided by one department or agency to other departments or agencies of the County, or to other governments on a cost-reimbursement basis.

125
COUNTY OF SAN JOAQUIN COMBINING STATEMENT OF FUND NET ASSETS
INTERNAL SERVICE FUNDS AS OF JUNE 30, 2011
FleetServices
OfficeAutomation
CentralTelephone
Radio Communi-
cationsAssetsCurrent Assets:
Cash and investments 19,340,720$ 523,111$ 391,568$ 3,076,927$ Imprest cash 40 - - - Receivables 3,481 586 16,914 - Interest receivable 27,410 671 165 3,928 Due from Enterprise funds 14,929 937 46,909 - Due from govt funds 768,257 63,046 223,957 58,001 Due from other governments - - - - Prepaid expense - 36,536 - - Receivable-ISFS 1,532 6,818 5,455 - Inventories 581,643 - 121,045 -
Total Current Assets 20,738,012 631,705 806,013 3,138,856
Noncurrent Assets:Capital assets: - - - -
Non-depreciable - - - - Depreciable 5,854,907 1,545,600 1,356,313 5,001,054
Total Noncurrent Assets 5,854,907 1,545,600 1,356,313 5,001,054
Total Assets 26,592,919$ 2,177,305$ 2,162,326$ 8,139,910$
LiabilitiesCurrent Liabilities:
Accounts payable 628,593$ 247,122$ 141,333$ 37,518$ AP- Due to other Funds 1,999 11,572 100 AP- Due to Govt Funds 8 3,455 18,720 6,650 Accrued payroll 86,877 - 44,204 - Interest expense 89 6,365 - 7,563 Due to other funds - - - - Compensated absences 161,428 - 76,644 - Current portion of capital leases 10,323 591,268 - 521,133 Current portion of notes payable - - - -
Total Current Liabilities 889,317 848,210 292,473 572,964
Long-Term Liabilities:Advances from other funds - - - - Compensated absences 12,835 - 4,145 - Capital lease obligations 5,426 551,270 - 1,337,518 Claims liability - - - - Notes payable - - - - OPEB liability 305,079 - 88,080 -
Total Liabilities 1,212,657 1,399,480 384,698 1,910,482
Net AssetsInvested in capital assets, net of related debt 5,839,158 403,062 1,356,313 3,142,403 Unrestricted 19,541,104 374,763 421,315 3,087,025
Total Net Assets 25,380,262 777,825 1,777,628 6,229,428
Total Liabilities and Net Assets 26,592,919$ 2,177,305$ 2,162,326$ 8,139,910$

126
COUNTY OF SAN JOAQUIN COMBINING STATEMENT OF FUND NET ASSETS (Continued)
INTERNAL SERVICE FUNDS AS OF JUNE 30, 2011
Southern
WaterSystem
PurchasingISF
MedicalInsurance
DentalInsurance
AssetsCurrent Assets:
Cash and investments 206,886$ 922,790$ 27,487,368$ 2,521,496$ Imprest cash - - - - Receivables 172,005 21 - - Interest receivable 355 1,059 43,187 3,642 Due from Enterprise funds - 1,330 - - Due from govt funds - 12,302 - - Due from other governments - - 1,436,694 167,452 Prepaid expense - - - - Receivable-ISFS - - - - Inventories - - - -
Total Current Assets 379,246 937,502 28,967,249 2,692,590
Noncurrent Assets:Capital assets:
Non-depreciable 17,481 - - - Depreciable 65,712 - - -
Total Noncurrent Assets 83,193 - - -
Total Assets 462,439$ 937,502$ 28,967,249$ 2,692,590$
LiabilitiesCurrent Liabilities:
Accounts payable -$ 471,083$ 5,255,445$ 491,354$ AP- Due to other Funds - 2,241 - - AP- Due to Govt Funds - 58 - - Accrued payroll - - - - Interest expense - - - - Due to other funds - - - - Compensated absences - - - - Current portion of capital leases - - - - Current portion of notes payable - - - -
Total Current Liabilities - 473,382 5,255,445 491,354
Long-Term Liabilities:Advances from other funds 276,134 - - - Compensated absences - - - - Capital lease obligations - - - - Claims liability - - 6,994,140 247,356 Notes payable - - - - OPEB liability - - - -
Total Liabilities 276,134 473,382 12,249,585 738,710
Net AssetsInvested in capital assets, net of related debt 83,193 - - - Unrestricted 103,112 464,120 16,717,664 1,953,880
Total Net Assets 186,305 464,120 16,717,664 1,953,880
Total Liabilities and Net Assets 462,439$ 937,502$ 28,967,249$ 2,692,590$

127
COUNTY OF SAN JOAQUIN COMBINING STATEMENT OF FUND NET ASSETS (Continued)
INTERNAL SERVICE FUNDS AS OF JUNE 30, 2011
CasualtyInsurance
Workers Comp Insurance
UnemploymentInsurance Total
AssetsCurrent Assets:
Cash and investments 25,628,799$ 53,939,304$ 2,021,157$ 136,060,126$ Imprest cash - - - 40 Receivables - - - 193,007 Interest receivable 37,798 81,365 3,264 202,844 Due from Enterprise funds - - - 64,105 Due from govt funds - - - 1,125,563 Due from other governments 3,959 5,000 65,036 1,678,141 Prepaid expense 224,349 250,000 (4,462) 506,423 Receivable-ISFS - - - 13,805 Inventories - - - 702,688
Total Current Assets 25,894,905 54,275,669 2,084,995 140,546,742
Noncurrent Assets:Capital assets:
Non-depreciable - - - 17,481 Depreciable - - - 13,823,586
Total Noncurrent Assets - - - 13,841,067
Total Assets 25,894,905$ 54,275,669$ 2,084,995$ 154,387,809$
LiabilitiesCurrent Liabilities:
Accounts payable 1,622,735$ 415,457$ -$ 9,310,640$ AP- Due to other Funds - 133 - 16,045 AP- Due to Govt Funds - - - 28,891 Accrued payroll - - - 131,081 Interest expense 66,685 - - 80,702 Due to other funds 649,415 - - 649,415 Compensated absences - - - 238,072 Current portion of capital leases - - - 1,122,724 Current portion of notes payable 59,368 - - 59,368
Total Current Liabilities 2,398,203 415,590 - 11,636,938
Long-Term Liabilities:Advances from other funds - - - 276,134 Compensated absences - - - 16,980 Capital lease obligations - - - 1,894,214 Claims liability 18,134,000 29,425,000 365,967 55,166,463 Notes payable 1,632,434 - - 1,632,434 OPEB liability - - - 393,159
Total Liabilities 22,164,637 29,840,590 365,967 71,016,322
Net AssetsInvested in capital assets, net of related debt - - - 10,824,129 Unrestricted 3,730,268 24,435,079 1,719,028 72,547,358
Total Net Assets 3,730,268 24,435,079 1,719,028 83,371,487
Total Liabilities and Net Assets 25,894,905$ 54,275,669$ 2,084,995$ 154,387,809$

128
COUNTY OF SAN JOAQUIN COMBINING STATEMENT OF REVENUES, EXPENSES,
AND CHANGES IN FUND NET ASSETS INTERNAL SERVICE FUNDS
AS OF JUNE 30, 2011
FleetServices
OfficeAutomation
CentralTelephone
RadioCommuni-
cationsOperating Revenues:
Charges for services -$ -$ -$ -$ Equipment rental 6,167,343 1,093,846 362,244 225,842 User fees 2,653,818 76,200 4,344,879 1,635,187 Interest charges to users - 109,717 - - Other 265,528 - - -
Total Operating Revenues 9,086,689 1,279,763 4,707,123 1,861,029
Operating Expenses:Liability claims and loss adjustment - - - - Salaries and benefits 2,876,887 - 1,210,445 - Insurance - - - - Services and supplies 5,499,421 238,976 4,039,139 1,236,826 Depreciation and amortization 1,573,414 689,117 419,560 760,402 Miscellaneous 19,819 - - -
Total Operating Expenses 9,969,541 928,093 5,669,144 1,997,228
Operating Income (Loss) (882,852) 351,670 (962,021) (136,199)
Non-Operating Revenues (Expenses):Gain (loss) on sale of equipment 16,370 - - - Investment income 86,310 1,792 592 10,659 Interest expense (1,419) (82,211) - (91,938) Insurance recovery 71,812 - - -
Total Non-Operating Revenues (Expenses) 173,073 (80,419) 592 (81,279)
Net Income (Loss) Before Transfers and Contributions (709,779) 271,251 (961,429) (217,478)
Transfers in - - - 1,015,805
- - - 1,015,805
Change in Net Assets (709,779) 271,251 (961,429) 798,327
Net Assets - Beginning of Year 26,090,041 506,574 2,739,057 5,431,101
Net Assets - End of Year 25,380,262$ 777,825$ 1,777,628$ 6,229,428$

129
COUNTY OF SAN JOAQUIN COMBINING STATEMENT OF REVENUES, EXPENSES,
AND CHANGES IN FUND NET ASSETS (Continued) INTERNAL SERVICE FUNDS
AS OF JUNE 30, 2011
SouthernWater
SystemPurchasing
ISFMedical
InsuranceDental
InsuranceOperating Revenues:
Charges for services 57,335$ -$ 43,827,913$ 5,249,157$ Equipment rental - - - - User fees - 5,454,089 239,420 - Interest charges to users - - - - Other - 33,347 3,362 -
Total Operating Revenues 57,335 5,487,436 44,070,695 5,249,157
Operating Expenses:Liability claims and loss adjustment - - 44,055,639 4,835,357 Salaries and benefits - - - - Insurance - - - - Services and supplies - 5,491,673 1,978,467 64,284 Depreciation and amortization 78,457 - - - Miscellaneous - - - -
Total Operating Expenses 78,457 5,491,673 46,034,106 4,899,641
Operating Income (Loss) (21,122) (4,237) (1,963,411) 349,516
Non-Operating Revenues (Expenses):Gain (loss) on sale of equipment - - - - Investment income 1,124 4,237 167,801 11,957 Interest expense (22,482) - - - Insurance recovery - - - -
Total Non-Operating Revenues (Expenses) (21,358) 4,237 167,801 11,957
Net Income (Loss) Before Transfers and Contributions (42,480) - (1,795,610) 361,473
Transfers in - - - -
- - - -
Change in Net Assets (42,480) - (1,795,610) 361,473
Net Assets - Beginning of Year 228,785 464,120 18,513,274 1,592,407
Net Assets - End of Year 186,305$ 464,120$ 16,717,664$ 1,953,880$

130
COUNTY OF SAN JOAQUIN COMBINING STATEMENT OF REVENUES, EXPENSES,
AND CHANGES IN FUND NET ASSETS (Continued) INTERNAL SERVICE FUNDS
AS OF JUNE 30, 2011
CasualtyInsurance
Workers Comp Insurance
UnemploymentInsurance Total
Operating Revenues:Charges for services 9,903,171$ 12,286,044$ 1,132,690$ 72,456,310$ Equipment rental - - - 7,849,275 User fees - - - 14,403,593 Interest charges to users - - - 109,717 Other 768,024 - - 1,070,261
Total Operating Revenues 10,671,195 12,286,044 1,132,690 95,889,156
Operating Expenses:Liability claims and loss adjustment 6,060,011 5,972,921 2,139,438 63,063,366 Salaries and benefits - - - 4,087,332 Insurance 1,456,336 899,998 - 2,356,334 Services and supplies 2,011,705 1,863,085 21,894 22,445,470 Depreciation and amortization - 1,169 - 3,522,119 Miscellaneous - - - 19,819
Total Operating Expenses 9,528,052 8,737,173 2,161,332 95,494,440
Operating Income (Loss) 1,143,143 3,548,871 (1,028,642) 394,716
Non-Operating Revenues (Expenses):Gain (loss) on sale of equipment - - - 16,370 Investment income 105,048 262,996 11,749 664,265 Interest expense (72,951) - - (271,001) Insurance recovery - - - 71,812
Total Non-Operating Revenues (Expenses) 32,097 262,996 11,749 481,446
Net Income (Loss) Before Transfers and Contributions 1,175,240 3,811,867 (1,016,893) 876,162
Transfers in - - - 1,015,805
- - - 1,015,805
Change in Net Assets 1,175,240 3,811,867 (1,016,893) 1,891,967
Net Assets - Beginning of Year 2,555,028 20,623,212 2,735,921 81,479,520
Net Assets - End of Year 3,730,268$ 24,435,079$ 1,719,028$ 83,371,487$

131
COUNTY OF SAN JOAQUIN COMBINING STATEMENT OF CASH FLOWS
INTERNAL SERVICE FUNDS AS OF JUNE 30, 2011
FleetServices
OfficeAutomation
Central Telephone
Radio Communi-
cationsCash Flows from Operating Activities:
Cash received from user departments 8,910,747$ 1,098,659$ 4,735,567$ 1,866,595$ Cash payments to suppliers for goods and services (4,129,990) (179,728) (4,060,476) (1,231,943) Cash payments to employees for services (2,870,652) - (1,180,121) - Cash paid to County departments for services (766,289) (46,791) (286,280) (23,226) Other operating revenues 265,528 109,717 - -
Net Cash Provided (Used) by Operating Activities 1,409,344 981,857 (791,310) 611,426
Cash Flows from Noncapital Financing Activities:Transfers in (out) - - - 1,014,652
Net Cash Provided (Used) by Noncapital Financing Activities - - - 1,014,652
Cash Flows from Capital and Related Financing Activities:Acquisition of capital assets (592,257) (607,954) (267,036) (1,261,027) Debt interest payments (1,474) (85,608) - (94,635) Debt principal payments (9,657) (304,753) - (217,526) OPEB obligation 67,418 - 25,281 - Proceeds from sale of capital assets 16,370 - - - Receipts from insurance recovery 71,812 - - -
Net Cash Provided (Used) by Capital and Related Financing Activities (447,788) (998,315) (241,755) (1,573,188)
Cash Flows from Investing Activities:Interest on Investments-Pooled Cash 85,805 1,762 1,767 10,563
Net Cash Provided by Investing Activities 85,805 1,762 1,767 10,563
Increase (Decrease) in Cash and Cash Equivalents 1,047,361 (14,696) (1,031,298) 63,453
Cash and Cash Equivalents, Beginning of Year 18,293,399 537,807 1,422,866 3,013,474
Cash and Cash Equivalents, End of Year 19,340,760$ 523,111$ 391,568$ 3,076,927$

132
COUNTY OF SAN JOAQUIN COMBINING STATEMENT OF CASH FLOWS (Continued)
INTERNAL SERVICE FUNDS AS OF JUNE 30, 2011
Southern
Water System
Purchasing ISF
Medical Insurance
Dental Insurance
Cash Flows from Operating Activities:Cash received from user departments (1)$ 5,533,136$ 43,936,510$ 5,229,494$ Cash payments to suppliers for goods and services - (5,368,183) (45,896,912) (4,726,200) Cash payments to employees for services - - - - Cash paid to County departments for services - (224,363) (509,490) (63,787) Other operating revenues - 33,347 (413,612) (67,777)
Net Cash Provided (Used) by Operating Activities (1) (26,063) (2,883,504) 371,730
Cash Flows from Noncapital Financing Activities:Transfers in (out) - - - -
- Net Cash Provided (Used) by Noncapital Financing Activities - - - -
Cash Flows from Capital and Related Financing Activities:Acquisition of capital assets - - - - Debt interest payments (22,481) - - - Debt principal payments (34,853) - - - OPEB obligation - - - - Proceeds from sale of capital assets - - - - Receipts from insurance recovery - - - -
Net Cash Provided (Used) by Capital and Related Financing Activities (57,334) - - -
Cash Flows from Investing Activities:Interest on Investments-Pooled Cash 1,209 4,371 169,590 11,500
Net Cash Provided by Investing Activities 1,209 4,371 169,590 11,500
Increase (Decrease) in Cash and Cash Equivalents (56,126) (21,692) (2,713,914) 383,230
Cash and Cash Equivalents, Beginning of Year 263,012 944,482 30,201,282 2,138,266
Cash and Cash Equivalents, End of Year 206,886$ 922,790$ 27,487,368$ 2,521,496$

133
COUNTY OF SAN JOAQUIN COMBINING STATEMENT OF CASH FLOWS (Continued)
INTERNAL SERVICE FUNDS AS OF JUNE 30, 2011
Casualty Insurance
Workers Comp Insurance
UnemploymentInsurance Total
Cash Flows from Operating Activities:Cash received from user departments 9,899,707$ 12,281,044$ 1,097,990$ 94,589,448$ Cash payments to suppliers for goods and services (8,145,864) (7,165,427) (2,148,956) (83,053,679) Cash payments to employees for services - - - (4,050,773) Cash paid to County departments for services (291,068) (1,450,990) (12,376) (3,674,660) Other operating revenues 547,025 (1,789,000) (184,599) (1,499,371)
Net Cash Provided (Used) by Operating Activities 2,009,800 1,875,627 (1,247,941) 2,310,965
Cash Flows from Noncapital Financing Activities:Transfers in (out) - - - 1,014,652
Net Cash Provided (Used) by Noncapital Financing Activities - - - 1,014,652
Cash Flows from Capital and Related Financing Activities:Acquisition of capital assets - - - (2,728,274) Debt interest payments (75,195) - - (279,393) Debt principal payments (56,920) - - (623,709) OPEB obligation - - - 92,699 Proceeds from sale of capital assets - - - 16,370 Receipts from insurance recovery - - - 71,812
Net Cash Provided (Used) by Capital and Related Financing Activities (132,115) - - (3,450,495)
Cash Flows from Investing Activities:Interest on Investments-Pooled Cash 103,422 260,773 13,521 664,283
Net Cash Provided by Investing Activities 103,422 260,773 13,521 664,283
Increase (Decrease) in Cash and Cash Equivalents 1,981,107 2,136,400 (1,234,420) 539,405
Cash and Cash Equivalents, Beginning of Year 23,647,692 51,802,904 3,255,577 135,520,761
Cash and Cash Equivalents, End of Year 25,628,799$ 53,939,304$ 2,021,157$ 136,060,166$

134
COUNTY OF SAN JOAQUIN COMBINING STATEMENT OF CASH FLOWS (Continued)
INTERNAL SERVICE FUNDS AS OF JUNE 30, 2011
FleetServices
Office Automation
CentralTelephone
Radio Communi-
cationsReconciliation of operating income (loss) tonet cash provided (used) by operating activities:
Operating income (loss) (882,852)$ 351,670$ (962,021)$ (135,046)$ Adjustments to reconcile operating income (loss) tonet cash provided (used) by operating activities:
Depreciation & Amortization 1,573,414 689,117 419,560 760,402 (Increase) decrease in accounts receivable 89,586 (71,387) 28,443 5,566 (Increase) decrease in inventories 78,202 - (4,455) - (Increase) decrease in prepaid expenses - (17,032) - - Increase (decrease) in accounts payable 550,994 29,489 (272,837) (19,496) Increase (decrease) in OPEB liability - - - - Increase (decrease) in claims liability - - - -
Net Cash Provided (Used) by Operating Activities 1,409,344$ 981,857$ (791,310)$ 611,426$

135
COUNTY OF SAN JOAQUIN COMBINING STATEMENT OF CASH FLOWS (Continued)
INTERNAL SERVICE FUNDS AS OF JUNE 30, 2011
Southern Water System
Purchasing ISF
Medical Insurance
Dental Insurance
Reconciliation of operating income (loss) tonet cash provided (used) by operating activities:
Operating income (loss) (21,122)$ (4,237)$ (1,963,411)$ 349,516$ Adjustments to reconcile operating income (loss) tonet cash provided (used) by operating activities:
Depreciation & Amortization 78,457 - - - (Increase) decrease in accounts receivable (57,336) 79,047 (130,823) (19,663) (Increase) decrease in inventories - - - - (Increase) decrease in prepaid expenses - 52,741 - - Increase (decrease) in accounts payable - (153,614) (372,296) 109,654 Increase (decrease) in OPEB liability - - (416,974) (67,777) Increase (decrease) in claims liability - - - -
Net Cash Provided (Used) by Operating Activities (1)$ (26,063)$ (2,883,504)$ 371,730$

136
COUNTY OF SAN JOAQUIN COMBINING STATEMENT OF CASH FLOWS (Continued)
INTERNAL SERVICE FUNDS AS OF JUNE 30, 2011
Casualty Insurance
Workers Comp Insurance
UnemploymentInsurance Total
Reconciliation of operating income (loss) tonet cash provided (used) by operating activities:
Operating income (loss) 1,143,143$ 3,548,871$ (1,028,642)$ 395,869$ Adjustments to reconcile operating income (loss) tonet cash provided (used) by operating activities:
Depreciation & Amortization - 1,169 - 3,522,119 (Increase) decrease in accounts receivable (3,463) (5,000) (34,700) (119,730) (Increase) decrease in inventories - - - 73,747 (Increase) decrease in prepaid expenses 90,540 - - 126,249 Increase (decrease) in accounts payable 1,000,580 119,587 - 992,061 Increase (decrease) in OPEB liability (221,000) (1,789,000) (184,599) (2,679,350) Increase (decrease) in claims liability - - - -
Net Cash Provided (Used) by Operating Activities 2,009,800$ 1,875,627$ (1,247,941)$ 2,310,965$

Private Purpose Trust Funds
Private Purpose Trust Funds are used to report various federal-sponsored community development loan programs and other private trust agreements. None of the resources of these funds are used to support governmental programs.
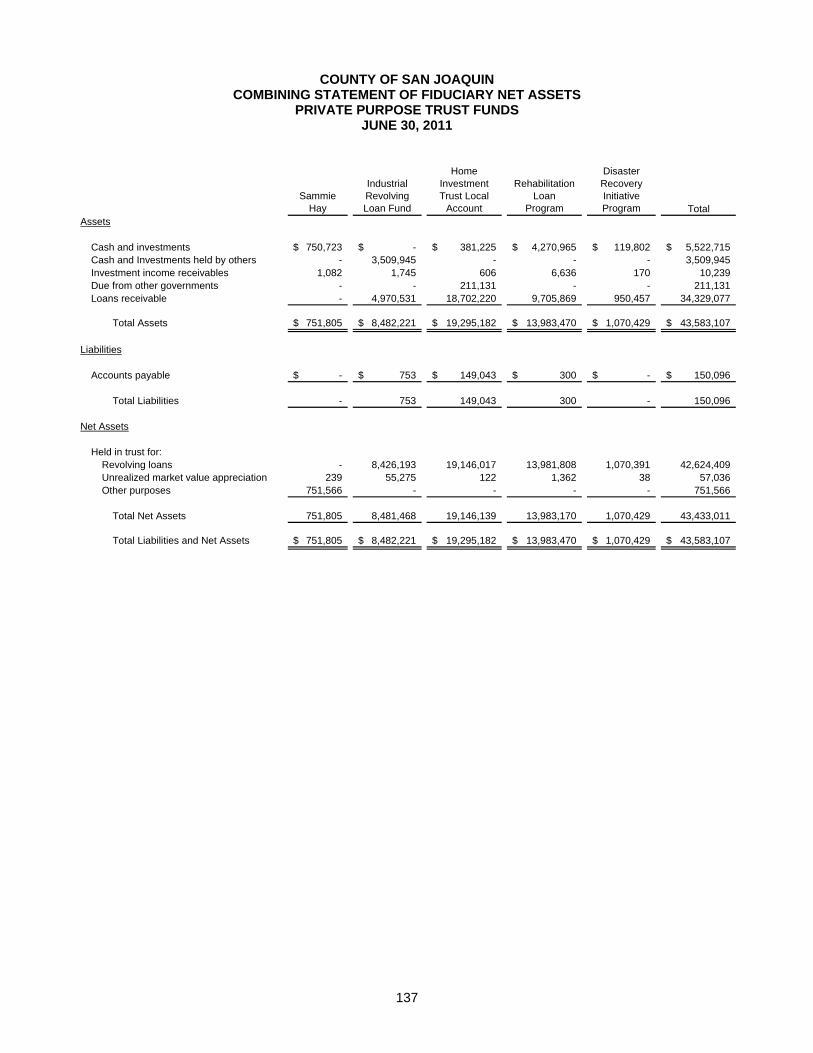
137
COUNTY OF SAN JOAQUIN COMBINING STATEMENT OF FIDUCIARY NET ASSETS
PRIVATE PURPOSE TRUST FUNDS JUNE 30, 2011
SammieHay
IndustrialRevolvingLoan Fund
HomeInvestmentTrust Local
Account
RehabilitationLoan
Program
DisasterRecoveryInitiativeProgram Total
Assets
Cash and investments 750,723$ -$ 381,225$ 4,270,965$ 119,802$ 5,522,715$ Cash and Investments held by others - 3,509,945 - - - 3,509,945 Investment income receivables 1,082 1,745 606 6,636 170 10,239 Due from other governments - - 211,131 - - 211,131 Loans receivable - 4,970,531 18,702,220 9,705,869 950,457 34,329,077
Total Assets 751,805$ 8,482,221$ 19,295,182$ 13,983,470$ 1,070,429$ 43,583,107$
Liabilities
Accounts payable -$ 753$ 149,043$ 300$ -$ 150,096$
Total Liabilities - 753 149,043 300 - 150,096
Net Assets
Held in trust for:Revolving loans - 8,426,193 19,146,017 13,981,808 1,070,391 42,624,409 Unrealized market value appreciation 239 55,275 122 1,362 38 57,036 Other purposes 751,566 - - - - 751,566
Total Net Assets 751,805 8,481,468 19,146,139 13,983,170 1,070,429 43,433,011
Total Liabilities and Net Assets 751,805$ 8,482,221$ 19,295,182$ 13,983,470$ 1,070,429$ 43,583,107$

138
COUNTY OF SAN JOAQUIN COMBINING STATEMENT OF CHANGES IN FIDUCIARY NET ASSETS
PRIVATE PURPOSE TRUST FUNDS FOR THE YEAR ENDED JUNE 30, 2011
SammieHay
IndustrialRevolvingLoan Fund
HomeInvestmentTrust Local
Account
RehabilitationLoan
Program
DisasterRecoveryInitiativeProgram Total
Additions:Contributions from other governments -$ -$ 2,885,817$ 395,404$ -$ 3,281,221$ Investment income 3,587 56,321 2,233 20,026 525 82,692 Loan income - 266,091 54,497 85,998 5 406,591 Miscellaneous income - 15,006 5,897 102,607 - 123,510
Total Additions 3,587 337,418 2,948,444 604,035 530 3,894,014
Deductions:Benefit payments 119,009 - - - - 119,009 Program expenses - 1,101 3,055,744 215,317 104,854 3,377,016 Allowance for loan adjustments - 209,399 - - - 209,399 Loan servicing fees - 12,466 1,364 - - 13,830 Administrative expenses - 491,518 129,320 148,173 - 769,011
Total Deductions 119,009 714,484 3,186,428 363,490 104,854 4,488,265
Change in Net Assets (115,422) (377,066) (237,984) 240,545 (104,324) (594,251)
Net Assets, Beginning 867,227 8,858,534 19,384,123 13,742,625 1,174,753 44,027,262
Net Assets, Ending 751,805$ 8,481,468$ 19,146,139$ 13,983,170$ 1,070,429$ 43,433,011$

Agency Funds
Agency Funds are used to account for the assets and liabilities of various clearing accounts for which the County’s role is purely custodial.

139
COUNTY OF SAN JOAQUIN STATEMENT OF CHANGES IN ASSETS AND LIABILITIES
ARISING FROM CASH TRANSACTIONS ALL AGENCY FUNDS
JUNE 30, 2011
June 30, 2010 Additions Deductions June 30, 2011Assets
Cash and investments - pooled 33,307,268$ 594,931,065$ 594,770,777$ 33,467,556$ Cash and investments held by others 5,419,650 24,559,790 24,584,067 5,395,373 Receivables 25,559,539 26,702,980 25,559,539 26,702,980 Loans receivable 40,500,000 26,500,000 40,500,000 26,500,000 Other assets 256,836 - 68,463 188,373
Total Assets 105,043,293$ 672,693,835$ 685,482,846$ 92,254,282$
Liabilities
Accounts payable 31,537,932$ -$ 497,951$ 31,039,981$ Due to other agencies 73,485,361 696,177,604 708,468,664 61,194,301 Loan payable 20,000 - - 20,000
Total Liabilities 105,043,293$ 696,177,604$ 708,966,615$ 92,254,282$

COMPONENT UNIT FINANCIAL STATEMENTS
County Service Area No. 31 Flag City
County Service Area No. 31 – Flag City financial statements (part of the governmental funds) provide an overall financial picture of the Service Area as a whole. It presents the general operational fund, the sewer service fund, and the capital outlay fund at the basic fund level and the district-wide level. The general operational fund and the sewer service fund are reported as special revenue funds and the capital outlay fund is reported as a capital outlay fund. Both the special revenue fund and the capital outlay fund are part of the nonmajor governmental funds. The reconciliation from the governmental funds on the basic fund level to the district-wide level is presented in the face of the following financial statements.

140
COUNTY OF SAN JOAQUIN STATEMENT OF NET ASSETS
COUNTY SERVICE AREA NO. 31 – FLAG CITY JUNE 30, 2011
GovernmentalActivities
ASSETSPooled cash and investments 654,316$ Accounts receivable 7,483 Interest receivable 1,017 Restricted assets:
Cash and investments 638,008 Receivable 6,851
Capital assets:Depreciable, net 6,862,655
Total Assets 8,170,330$
LIABILITIESAccounts payable 2,075$ Interest payable 225,044 Advances from other County funds 1,179,378 Long-term liabilities:
Certificates of participation: 8,195,000 Discounts on COP's (106,312)
Total Liabilities 9,495,185
NET ASSETS Net assets invested in capital assets, net of related debts (581,174) RReserved for Encumbrances 860 RReserved for Debt Service (202,375) Designated 209 Undesignated (542,375)
Total Net Assets (1,324,855)
Total Liabilities and Net Assets 8,170,330$

141
COUNTY OF SAN JOAQUIN STATEMENT OF ACTIVITIES
COUNTY SERVICE AREA NO. 31 – FLAG CITY FOR THE YEAR ENDED JUNE 30, 2011
GovernmentalActivities
Program Expenses:Public Ways and Facilities:
Professional services 350,610$ Utilities 186,275Communication 367Office expenses 1,752Special expenses 8,953Maintenance 4,983Insurance 31,460Miscellaneous 16,767Depreciation 311,679Interest 544,505
Total Program Expenses 1,457,351
Program Revenues:Use of Money and Property 6,599 Charges for Services 1,022,421
Total Program Revenue 1,029,020
Change in Net Assets (428,331)
Net Assets, Beginning of Year (896,524)
Net Assets, End of Year (1,324,855)$

142
COUNTY OF SAN JOAQUIN COMBINING BALANCE SHEET
COUNTY SERVICE AREA NO. 31 – FLAG CITY ALL GOVERNMENTAL FUNDS
JUNE 30, 2011
OperatingFund
SewerServiceFund
All SpecialRevenue
FundsDebt
ServiceCapitalProjects Totals
ASSETS
Cash and investments 281,695$ 363,416$ 645,111$ -$ 9,205$ 654,316$ Interest receivable 465 550 1,015 - 2 1,017 Accounts receivable 7,483 - 7,483 - - 7,483 Restricted assets:
Cash and investments - - - 638,008 - 638,008 Interest receivable - - - 6,851 - 6,851
Total Assets 289,643$ 363,966$ 653,609$ 644,859$ 9,207$ 1,307,675$
LIABILITIES
Accounts payable 1,770$ 305$ 2,075$ -$ -$ 2,075$ Advances from other funds - 1,179,378 1,179,378 - - 1,179,378
Total Liabilities 1,770 1,179,683 1,181,453 - - 1,181,453
FUND BALANCES
RRestricted 860 - 860 653,311 - 654,171 DAssigned 287,013 116 287,129 9,207 296,336 UUnassigned - (815,833) (815,833) (8,452) - (824,285)
Total Fund Balances 287,873 (815,717) (527,844) 644,859 9,207 126,222
Total Liabilities and Fund Balances 289,643$ 363,966$ 653,609$ 644,859$ 9,207$ 1,307,675$
RECONCILIATION OF THE BALANCE SHEET -GOVERNMENTAL FUNDS TO THE STATEMENT OF NET ASSETS:
Fund Balances from above 126,222$ Amounts reported for governmental activities in the statement of net assets are difference because:
Capital assets used in governmental activities are not financial resources 6,862,655 and therefore are not reported in the funds
Long-term liabilities, including bonds payable, are not due and payable in the current period, and therefore are not reported in the governmental funds:
Certificates of participation (8,088,688) Accrued interest payable (225,044)
Net assets of governmental activities (1,324,855)$
Special Revenue Funds

143
COUNTY OF SAN JOAQUIN COMBINING STATEMENT OF REVENUES, EXPENDITURES,
AND CHANGES IN FUND BALANCES COUNTY SERVICE AREA NO. 31 – FLAG CITY
FOR THE YEAR ENDED JUNE 30, 2011
OperatingFund
SewerServiceFund
All SpecialRevenue
FundsDebt
ServiceCapitalProjects Totals
Revenues:Use of money and property 1,441$ 1,090$ 2,531$ 4,061$ 7$ 6,599$ Charges for services 239,082 783,339 1,022,421 - - 1,022,421
Total Revenues 240,523 784,429 1,024,952 4,061 7 1,029,020
Expenditures:Current:
Public ways and facilities:Professional services 180,468 170,142 350,610 - - 350,610 Utilities 19,270 167,005 186,275 - - 186,275 Communication 367 367 - - 367 Office expenses 1,524 228 1,752 - - 1,752 Special expenses 8,713 240 8,953 - - 8,953 Maintenance 2,531 2,452 4,983 - - 4,983 Insurance 11,434 20,026 31,460 - - 31,460 Miscellaneous 13,767 3,000 16,767 - - 16,767
Capital outlay - - - - - - Interest - 68,604 68,604 604,265 - 672,869
Total Expenditures 237,707 432,064 669,771 604,265 - 1,274,036
Excess of RevenuesOver (Under) Expenditures 2,816 352,365 355,181 (600,204) 7 (245,016)
Other Financing Sources and Uses:Transfers in - 12,513 12,513 604,265 7,800 624,578 Transfers out (7,800) (604,265) (612,065) (12,513) - (624,578)
Total Other Financing Sources and Uses (7,800) (591,752) (599,552) 591,752 7,800 -
Change in Fund Balances (4,984) (239,387) (244,371) (8,452) 7,807 (245,016)
Fund Balances, Beginning of Year 292,857 (576,330) (283,473) 653,311 1,400 371,238
Fund Balances, End of Year 287,873$ (815,717)$ (527,844)$ 644,859$ 9,207$ 126,222$
Special Revenue Funds
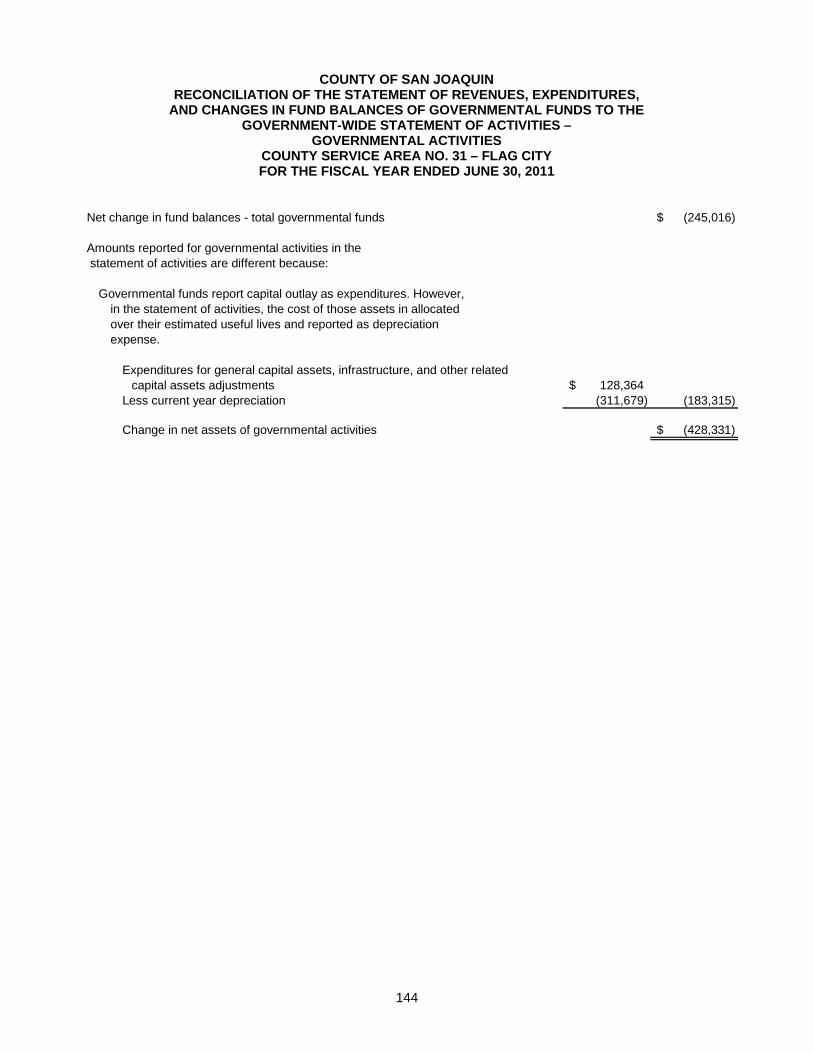
144
COUNTY OF SAN JOAQUIN RECONCILIATION OF THE STATEMENT OF REVENUES, EXPENDITURES,
AND CHANGES IN FUND BALANCES OF GOVERNMENTAL FUNDS TO THE GOVERNMENT-WIDE STATEMENT OF ACTIVITIES –
GOVERNMENTAL ACTIVITIES COUNTY SERVICE AREA NO. 31 – FLAG CITY FOR THE FISCAL YEAR ENDED JUNE 30, 2011
Net change in fund balances - total governmental funds (245,016)$
Amounts reported for governmental activities in the statement of activities are different because:
Governmental funds report capital outlay as expenditures. However,in the statement of activities, the cost of those assets in allocatedover their estimated useful lives and reported as depreciationexpense.
Expenditures for general capital assets, infrastructure, and other relatedcapital assets adjustments 128,364$
Less current year depreciation (311,679) (183,315)
Change in net assets of governmental activities (428,331)$

STATISTICAL SECTION – FINANCIAL ONLY

145
COUNTY OF SAN JOAQUIN CHANGES IN NET ASSETS
LAST EIGHT FISCAL YEARS FOR THE YEAR ENDED JUNE 30, 2011
2010-11 2009-10 2008-09Expenses:Governmental activities:
General government 27,299,881$ 26,098,049$ 38,743,985$ Public protection 279,598,113 297,597,268 303,010,545 Public ways and facilities 43,102,885 46,579,136 41,407,882 Health and sanitation 120,331,660 127,103,901 135,808,377 Public assistance 351,331,147 355,777,105 344,216,452 Education 6,055,394 5,921,627 6,724,552 Culture and recreation 9,054,852 9,956,704 9,069,181 Interest on long-term debt 7,506,293 7,311,782 8,424,991
Total governmental activities expenses 844,280,225 876,345,572 887,405,965
Business-type activities:Solid Waste 16,373,498 19,748,649 20,980,240 Hospital 206,416,196 204,730,696 203,675,658 Airport 4,304,072 4,024,516 3,813,218
Total business-type activities expenses 227,093,766 228,503,861 228,469,116
Total primary governmental expenses 1,071,373,991 1,104,849,433 1,115,875,081
Program Revenues:Governmental activities:
Charges for services:General government 17,166,522 16,002,101 20,891,343 Public protection 42,841,343 44,575,946 46,309,079 Public ways and facilities 11,088,079 10,876,151 10,333,240 Community infrastructure program 1,194,635 933,701 1,344,892 Health and sanitation 36,338,946 38,321,000 34,934,714 Children and families act program 975 750 574 Public assistance 1,152,025 2,775,286 2,166,674 Education 250,865 297,122 274,717 Recreation 2,219,648 2,293,085 1,885,727
Operating grants and contribution 531,236,543 524,926,700 481,756,701 Capital grants and contribution (3) 11,548,756 17,920,366 21,311,899
Total governmental activities revenues 655,038,337 658,922,208 621,209,560
Business-type activities:Charges for services:
Solid Waste 18,459,508 17,316,220 16,274,245 Hospital 219,637,752 171,131,971 169,748,603 Airport 1,853,720 1,715,024 1,576,065
Operating grants and contribution 5,475,622 791,175 974,955 Capital grants and contribution (3) - - -
Total business-type activities revenues 245,426,602 190,954,390 188,573,868
Total primary government revenues 900,464,939 849,876,598 809,783,428
Net (expense)/revenueGovernmental activities (189,241,888) (217,423,364) (266,196,405) Business-type activities 18,332,836 (37,549,471) (39,895,248) Total primary government net expense (170,909,052)$ (254,972,835)$ (306,091,653)$

146
2007-08 2006-07 2005-06 2004-05 2003-04
31,655,441$ 20,374,318$ 25,732,859$ 27,912,118$ 30,779,313$ 277,183,027 248,844,996 230,090,340 209,655,788 202,926,413
49,711,444 37,531,443 37,605,714 33,381,324 39,656,503 133,879,694 124,328,143 119,566,506 113,805,931 114,164,687 332,367,831 324,549,286 307,459,822 286,344,969 262,306,099
7,010,323 6,266,998 5,865,222 5,670,639 4,141,557 7,377,767 6,108,149 5,580,859 5,151,479 4,851,047
11,684,229 5,188,180 4,040,221 3,301,400 3,602,597 850,869,756 773,191,513 735,941,543 685,223,648 662,428,216
19,682,725 21,022,270 17,685,787 19,128,619 18,258,876 204,207,568 194,540,564 189,776,046 171,184,362 158,342,874
3,915,507 4,592,686 3,663,416 3,492,808 2,877,679 227,805,800 220,155,520 211,125,249 193,805,789 179,479,429
1,078,675,556 993,347,033 947,066,792 879,029,437 841,907,645
20,878,702 25,644,079 20,161,576 13,147,165 12,902,374 46,128,760 43,895,054 50,135,663 47,004,966 45,568,340 10,970,609 10,750,679 9,713,552 8,084,373 14,917,746
3,564,809 5,424,835 3,922,438 2,744,572 - 33,600,035 32,909,784 29,049,369 32,172,418 33,432,777
1,000 3,507 - - - 1,329,035 1,004,460 1,162,124 882,179 770,841
157,664 137,306 146,925 165,664 146,494 1,588,227 1,504,986 1,580,398 1,429,929 1,468,930
517,574,981 506,957,550 476,195,426 445,160,436 401,581,907 15,098,553 6,167,215 14,389,355 6,523,968 10,343,663
650,892,375 634,399,455 606,456,826 557,315,670 521,133,072
17,678,924 19,171,854 19,699,066 16,397,404 14,421,249 166,670,823 151,052,423 158,935,264 151,749,835 139,106,939
1,664,750 1,364,367 1,456,000 2,505,795 1,764,248 1,715,573 1,357,945 219,750 443,470 402,321
- - 57,372,734 - 6,199,257 187,730,070 172,946,589 237,682,814 171,096,504 161,894,014
838,622,445 807,346,044 844,139,640 728,412,174 683,027,086
(199,977,381) (138,792,058) (129,484,717) (127,907,978) (141,295,144) (40,075,730) (47,208,931) 26,557,565 (22,709,285) (17,585,415)
(240,053,111)$ (186,000,989)$ (102,927,152)$ (150,617,263)$ (158,880,559)$

147
COUNTY OF SAN JOAQUIN CHANGES IN NET ASSETS (Continued)
LAST EIGHT FISCAL YEARS FOR THE YEAR ENDED JUNE 30, 2011
2010-11 2009-10 2008-09General revenues and other changes in net assetsGovernmental activities:
Property taxes 197,588,751$ 194,019,051$ 228,875,556$ Sales taxes 22,201,894 21,314,504 22,034,677 Motor vehicle and other in-lieu taxes 4,209,020 2,742,578 4,383,463 Tobacco settlement proceeds 5,972,551 5,708,772 6,849,537 Other 2,477,535 4,950,211 5,440,246 Investment earnings 3,240,049 4,632,198 15,167,101 Miscellaneous 854,293 78,437 (116,862) Transfers (18,439,088) (31,215,630) (26,006,773) Extraordinary item (1) - - - Prior period adjustments (2) - 3,615,017 (78,007,878)
Total governmental activities 218,105,005 205,845,138 178,619,067
Business-type activitiesProperty taxes 412,356 495,249 624,866 Investment earnings 576,172 590,015 1,407,937 Other - - - Transfers 18,439,088 31,215,630 26,006,773 Prior period adjustment (3) - (575,937) 23,575,078
Total business-type activities 19,427,616 31,724,957 51,614,654 Total primary government 237,532,621$ 237,570,095$ 230,233,721$
Changes in net assets Governmental activities 28,863,117$ (15,193,243)$ (87,577,338)$ Business-type activities 37,760,452 (5,248,577) 11,719,406 Total primary government 66,623,569$ (20,441,820)$ (75,857,932)$
(1) = The County's share of the State of California's penalty assessment by the federal government for its failure to establish a State-wide automated child support collection system.(2) = 2002-03 - Funds classified as "agency fund group" previoulsy are reclassified as an integral part of the County's governmental fund group.(2) = 2004-05 - Reflect the capitalization of the financial and personnel computer system and the right-of-way acquistions expended in prior years.(2) & (3) = 2006-07 - Reflect deduction of the infrastructure transferred by the developers to the Mountain House Service District in prior years as a result of the Final Deduction accepted in August 2007. it also reflects the reduction of the revenue liability as the development fees were collected by the developers without being recorded in the pledged utility funds.(2) & (3) = 2008-09 - Reflect the removal of Mountain House Services District as an independent district from the County.(2) & (3) = 2009-10 - See prior period adjustments at Note 19.

148
2007-08 2006-07 2005-06 2004-05 2003-04
234,895,057$ 219,157,813$ 185,372,303$ 151,882,750$ 86,669,108$ 26,759,854 28,596,414 32,125,346 28,403,230 27,140,610
4,804,452 4,952,713 5,159,327 17,446,086 37,340,881 6,230,445 5,936,350 5,591,287 6,025,258 6,067,708 6,258,720 6,948,456 8,938,958 9,140,545 7,144,766
27,198,618 27,259,242 17,501,863 7,916,246 3,535,745 83,414 - - - 151,610
(47,806,151) (21,743,326) (39,971,492) (24,124,551) (20,180,124) - - - - (1,010,334) - 25,881,120 - 9,091,468 -
258,424,409 296,988,782 214,717,592 205,781,032 146,859,970
486,589 497,427 447,221 - - 1,701,493 1,922,346 1,474,136 2,097,150 1,352,743 2,444,975 3,214,888 - - -
47,806,151 21,743,326 39,971,492 24,124,551 20,180,124 - (57,749,160) - - -
52,439,208 (30,371,173) 41,892,849 26,221,701 21,532,867 310,863,617$ 266,617,609$ 256,610,441$ 232,002,733$ 168,392,837$
58,447,028$ 158,196,724$ 85,232,875$ 77,873,054$ 5,564,826$ 12,363,478 (77,580,104) 68,450,414 3,512,416 3,947,452 70,810,506$ 80,616,620$ 153,683,289$ 81,385,470$ 9,512,278$

149
COUNTY OF SAN JOAQUIN FUND BALANCES – GOVERNMENTAL FUNDS
LAST EIGHT FISCAL YEARS AS OF JUNE 30, 2011
2009-10 2008-09General Fund:
Reserved 17,422,015$ 21,134,010$ Unreserved 71,115,787 71,447,235
Total general fund 88,537,802 92,581,245
All Other Governmental FundsReserved 93,677,487 121,178,489 Unreserved, reported in:
Special Revenue Funds 136,683,212 103,502,191 Capital Projects Funds 23,212,463 12,060,452
Total all other governmental funds 253,573,162 236,741,132
Total - all governmental funds 342,110,964$ 329,322,377$
2010-11 (1)General Fund:
Nonspendable 8,094,729$ Restricted 35,245,339 Committed 10,006,276 Assigned 29,889,700 Unassigned 44,315,708
Total general fund 127,551,752
All Other Governmental FundsNonspendable 1,491,076 Restricted 177,632,988 Committed - Assigned 69,136,987 Unassigned (3,092,040)
Total all other governmental funds 245,169,011
Total - all governmental funds 372,720,763$
(1) In fiscal year 2010-11, the County implemented GASB Statement No. 54 under whichgovernmental fund balances are reported as nonspendable, restricted, committed, assigned, andunassigned.

150
2007-08 2006-07 2005-06 2004-05 2003-04 2002-03
21,001,803$ 14,546,165$ 15,070,347$ 15,059,550$ 16,282,303$ 18,071,737$ 47,908,310 83,156,996 102,807,800 54,302,437 14,809,035 26,612,224 68,910,113 97,703,161 117,878,147 69,361,987 31,091,338 44,683,961
207,438,037 251,338,071 82,359,538 67,074,862 85,343,195 89,295,726
106,034,209 107,507,012 84,887,806 86,357,996 58,703,829 70,284,471 14,278,900 18,843,149 15,319,173 7,616,277 1,118,684 (10,340,773)
327,751,146 377,688,232 182,566,517 161,049,135 145,165,708 149,239,424
396,661,259$ 475,391,393$ 300,444,664$ 230,411,122$ 176,257,046$ 193,923,385$
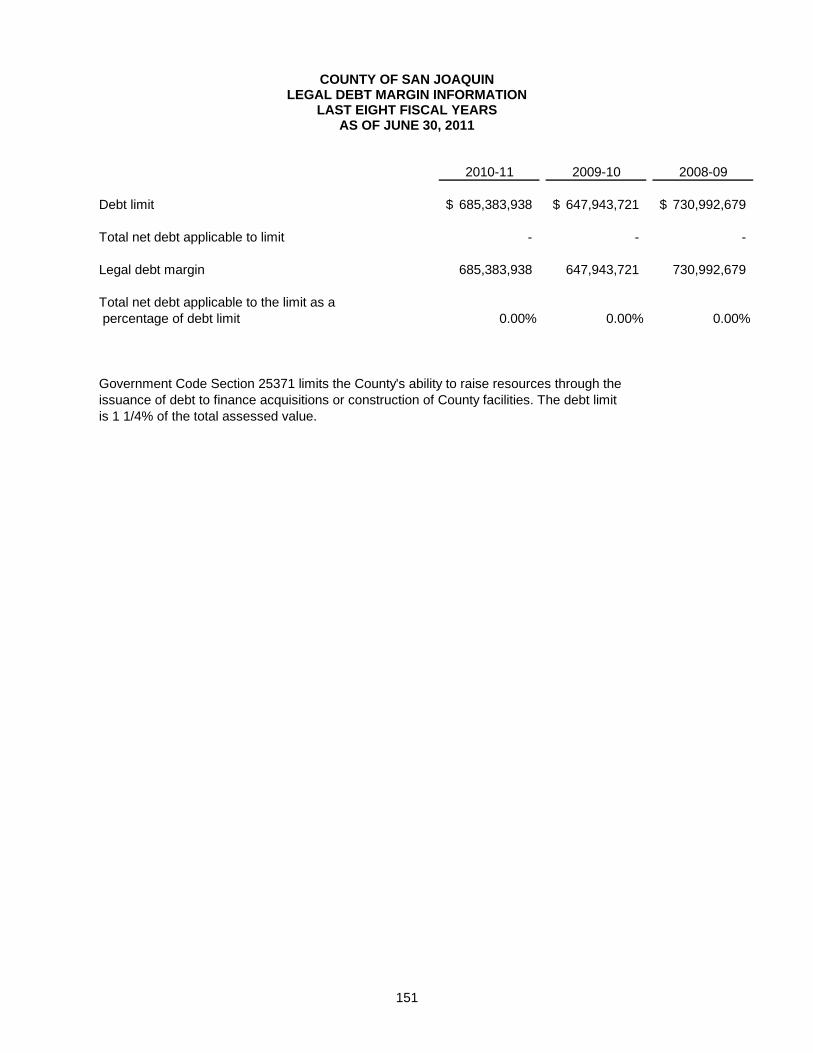
151
COUNTY OF SAN JOAQUIN LEGAL DEBT MARGIN INFORMATION
LAST EIGHT FISCAL YEARS AS OF JUNE 30, 2011
2010-11 2009-10 2008-09
Debt limit 685,383,938$ 647,943,721$ 730,992,679$
Total net debt applicable to limit - - -
Legal debt margin 685,383,938 647,943,721 730,992,679
Total net debt applicable to the limit as a percentage of debt limit 0.00% 0.00% 0.00%
Government Code Section 25371 limits the County's ability to raise resources through the issuance of debt to finance acquisitions or construction of County facilities. The debt limitis 1 1/4% of the total assessed value.

152
2007-08 2006-07 2005-06 2004-05 2003-04
746,277,606$ 681,583,871$ 576,919,493$ 497,461,589$ 440,925,627$
- - - - -
746,277,606 681,583,871 576,919,493 497,461,589 440,925,627
0.00% 0.00% 0.00% 0.00% 0.00%
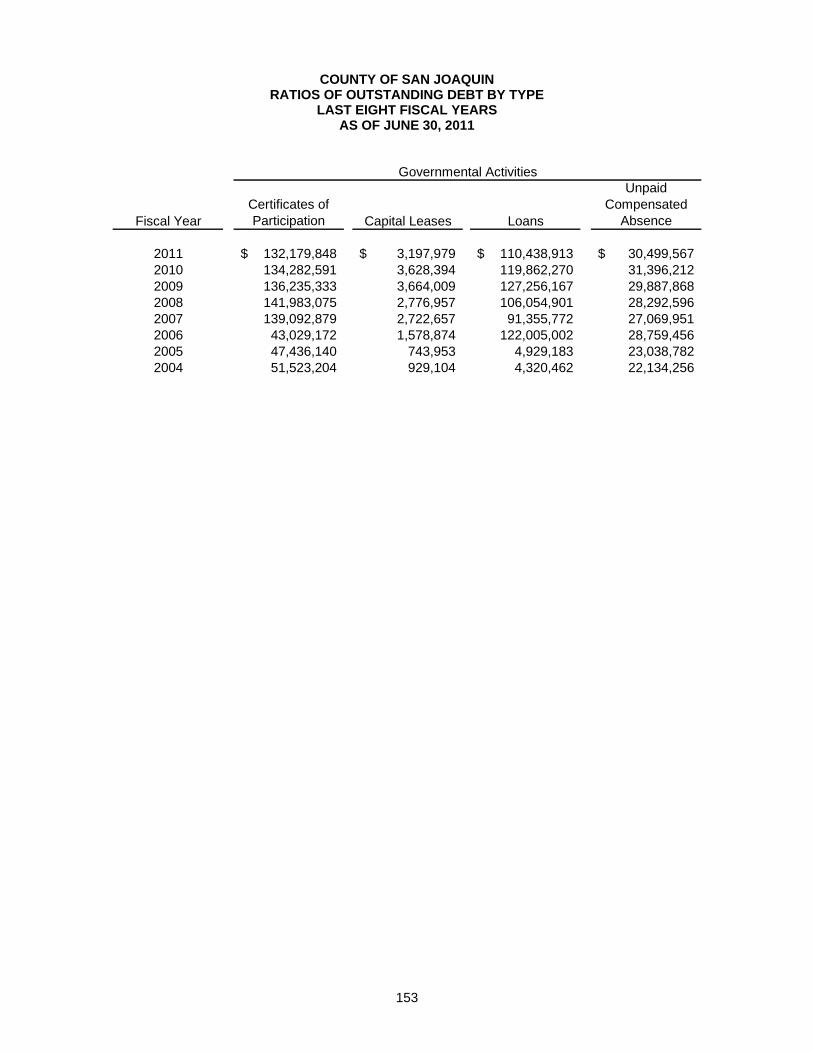
153
COUNTY OF SAN JOAQUIN RATIOS OF OUTSTANDING DEBT BY TYPE
LAST EIGHT FISCAL YEARS AS OF JUNE 30, 2011
Fiscal YearCertificates ofParticipation Capital Leases Loans
UnpaidCompensated
Absence
2011 132,179,848$ 3,197,979$ 110,438,913$ 30,499,567$ 2010 134,282,591 3,628,394 119,862,270 31,396,212 2009 136,235,333 3,664,009 127,256,167 29,887,868 2008 141,983,075 2,776,957 106,054,901 28,292,596 2007 139,092,879 2,722,657 91,355,772 27,069,951 2006 43,029,172 1,578,874 122,005,002 28,759,456 2005 47,436,140 743,953 4,929,183 23,038,782 2004 51,523,204 929,104 4,320,462 22,134,256
Governmental Activities

154
COUNTY OF SAN JOAQUIN RATIOS OF OUTSTANDING DEBT BY TYPE (Continued)
LAST EIGHT FISCAL YEARS AS OF JUNE 30, 2011
Fiscal YearCertificates ofParticipation Capital Leases Loans
UnpaidCompensated
Absence
LandfillClosure andPostclosure
2011 76,504,359$ 1,865,864$ 9,822,005$ 6,532,674$ 10,997,051$ 2010 83,449,303 1,221,660 7,619,442 6,409,974 14,186,541 2009 90,639,277 1,735,271 5,954,580 5,985,578 12,971,673 2008 121,731,924 2,290,525 134,007,676 5,880,632 10,628,021 2007 103,679,165 2,731,896 116,921,026 5,353,769 9,949,652 2006 109,239,109 151,638 118,864,360 5,257,321 8,685,737 2005 114,254,053 233,382 90,134 4,802,333 10,021,598 2004 118,788,998 311,742 92,792 5,133,855 6,908,034
Business-Type Activities

155
COUNTY OF SAN JOAQUIN RATIOS OF OUTSTANDING DEBT BY TYPE (Continued)
LAST EIGHT FISCAL YEARS AS OF JUNE 30, 2011
FiscalYear
Total PrimaryGovernment Per Capita Population
2011 382,038,260 551 693,589 2010 402,056,387 579 694,293 2009 414,329,756 601 689,480 2008 553,646,307 807 685,660 2007 498,876,767 734 679,687 2006 437,570,669 655 668,265 2005 205,549,558 317 648,422 2004 210,142,447 333 630,577

156
COUNTY OF SAN JOAQUIN CHANGES IN FUND BALANCES – GOVERNMENTAL FUNDS
LAST EIGHT YEARS AS OF JUNE 30, 2011
2010-11 2009-10 2008-09 2007-08REVENUES
Taxes 219,624,042$ 233,592,658$ 262,120,999$ 227,076,417$ Licenses and permits 5,283,279 4,521,601 4,909,610 6,659,886 Fines, forfeits, and penalties 10,588,072 14,505,266 17,169,243 17,348,913 Use of money and property 2,809,953 4,078,513 12,190,863 22,631,106 Aid from other governmental agencies 548,416,708 548,283,284 511,206,416 540,440,978 Charges for services 94,099,700 91,896,037 91,461,555 101,260,527 Miscellaneous 15,880,988 14,084,177 13,211,719 14,508,125
Total Revenues 896,702,742 910,961,536 912,270,405 929,925,952
EXPENDITURESCurrent:
General government 41,693,019 41,684,459 48,006,592 51,768,284 Public safety 262,332,207 273,972,542 276,607,702 263,415,264 Public ways and facilities 29,815,450 32,346,727 28,236,546 35,818,333 Health and sanitation 115,529,363 122,569,723 130,599,944 131,038,122 Public assistance 345,721,093 349,552,643 337,562,155 328,313,700 Education 5,663,467 5,848,898 6,646,636 6,927,513 Recreation 5,917,793 6,222,469 6,369,288 5,468,614
Capital outlay 30,061,521 27,521,442 99,541,241 122,920,479 Debt service:
Principal 3,150,239 2,593,667 6,397,785 13,690,137 Interest 6,933,924 7,152,094 7,936,181 10,593,228 Refunding escrow - - - -
Total expenditures 846,818,076 869,464,664 947,904,070 969,953,674 Excess (deficiency) of revenues
over (under) expenditures 49,884,666 41,496,872 (35,633,665) (40,027,722)
OTHER FINANCING SOURCES (USES)Transfers in 38,890,956 27,517,174 57,611,137 61,170,226 Transfers out (58,345,849) (59,329,240) (84,143,865) (109,397,997) Interfund interest - - - - Loan proceeds 180,026 317,604 790,682 9,525,359 Capital grants - - - - Extraordinary and special item - Fed Govt Penalty - - - -
Prior period adjustments - - - - Total Other Financing Sources (Uses) (19,274,867) (31,494,462) (25,742,046) (38,702,412)
Net change in fund balances 30,609,799$ 10,002,410$ (61,375,711)$ (78,730,134)$

157
2006-07 2005-06 2004-05 2003-04
218,146,216$ 216,269,438$ 169,201,969$ 112,347,258$ 8,486,276 9,844,592 7,407,564 7,430,313
13,722,623 18,067,404 14,080,149 11,656,083 22,192,339 14,275,552 6,611,373 3,133,097
523,657,229 498,014,555 475,119,794 448,488,147 108,213,886 91,903,011 85,555,433 83,232,358 12,019,797 15,186,059 15,277,219 14,665,287
906,438,366 863,560,611 773,253,501 680,952,543
44,561,751 38,369,942 31,018,117 31,296,316 237,999,875 215,520,350 199,948,767 194,602,048 36,445,617 34,935,720 31,528,734 29,781,894
121,594,955 116,869,120 112,053,011 112,618,258 320,973,887 304,048,779 285,095,525 260,876,919
6,182,337 5,803,595 5,586,424 4,018,930 4,706,578 4,131,171 3,554,593 3,368,867
43,451,406 31,683,615 25,711,923 35,030,831
12,879,337 5,486,955 5,216,438 5,484,743 4,304,826 3,208,775 3,266,278 3,237,657
18,398,858 - - - 851,499,427 760,058,022 702,979,810 680,316,463
54,938,939 103,502,589 70,273,691 636,080
224,284,684 47,101,771 35,711,734 24,458,294 (247,086,701) (82,599,029) (52,034,944) (45,047,748)
- 33,615 - - 119,431,952 425,981 203,597 3,297,369
- 1,568,615 - - - - - (1,010,334) - - - -
96,629,935 (33,469,047) (16,119,613) (18,302,419)
151,568,874$ 70,033,542$ 54,154,078$ (17,666,339)$

158
COUNTY OF SAN JOAQUIN NET ASSETS BY COMPONENT
LAST EIGHT FISCAL YEARS AS OF JUNE 30, 2011
2010-11 2009-10 2008-09 2007-08Governmental activities
Invested in capital assets, net of related debt 447,107,088$ 442,095,234$ 441,546,314$ 485,015,056$ Restricted net assets 354,890,877 366,388,735 357,928,522 373,275,682 Unrestricted net assets 96,696,997 61,347,876 81,935,235 118,084,147
Total governmental activities net assets 898,694,962 869,831,845 881,410,071 976,374,885
Business-type activitiesInvested in capital assets, net of related debt 36,708,379 40,321,738 40,581,470 18,627,614 Restricted net assets 1,914,093 1,785,070 2,133,763 11,528,014 Unrestricted net assets 50,815,667 9,570,879 14,786,968 18,372,385
Total business-type activities net assets 89,438,139 51,677,687 57,502,201 48,528,013
Primary governmentInvested in capital assets, net of related debt 483,815,467 482,416,972 482,127,784 503,642,670 Restricted net assets 356,804,970 368,173,805 360,062,285 384,803,696 Unrestricted net assets 147,512,664 70,918,755 96,722,203 136,456,532
Total primary government net assets 988,133,101$ 921,509,532$ 938,912,272$ 1,024,902,898$

159
2006-07 2005-06 2004-05 2003-04
430,608,245$ 351,981,529$ 374,392,279$ 368,137,777$ 392,180,625 250,392,162 213,625,664 152,047,237 102,397,924 139,875,959 100,898,953 91,807,063 925,186,794 742,249,650 688,916,896 611,992,077
33,306,890 28,558,534 26,284,166 13,900,024 6,420,931 14,403,192 6,131,099 12,797,787
13,385,486 35,221,568 42,054,455 44,259,493 53,113,307 78,183,294 74,469,720 70,957,304
463,915,135 380,540,063 400,676,445 382,037,801 398,601,556 264,795,354 219,756,763 164,845,024 115,783,410 175,097,527 142,953,408 136,066,556 978,300,101$ 820,432,944$ 763,386,616$ 682,949,381$