san joaquin county employees retirement association
TRANSCRIPT

San Joaquin County EmployeesRetirement Association
A G E N D ABOARD MEETING
SAN JOAQUIN COUNTY EMPLOYEES RETIREMENT ASSOCIATIONBOARD OF RETIREMENT
FRIDAY, OCTOBER 9, 2020AT 9:00 AM
Location: Via Zoom Client
In accordance with current state and local emergency proclamations and orders,this Board Meeting will be held virtually via Zoom Client.
The public may only attend the meeting by (1) clicking here https://us02web.zoom.us/j/82173120129 and following the prompts to enter your name and email,or (2) calling (669) 219-2599 or (669) 900-9128 and entering Meeting ID82173120129#.
Persons who require disability-related accommodations should contact SJCERAat (209) 468-9950 or [email protected] at least forty-eight (48) hours prior tothe scheduled meeting time.
Public comments, limited to 250 words or less, may be submitted by [email protected]. Every effort will be made to read all commentsreceived into the record, but some comments may not be read due to timelimitations. Comments received after an agenda item will be made part of theofficial record on file with SJCERA if received prior to the end of the meeting.
1.0 ROLL CALL2.0 PLEDGE OF ALLEGIANCE3.0 APPROVAL OF MINUTES
3.01 Approval of the minutes for the Board Meeting of September 11, 2020 43.02 Board to approve minutes
4.0 PUBLIC COMMENT4.01 E-mails received at [email protected], limited to 250 words or less, will
be read into the record at this time. Comments received after this agenda item iscompleted will be made part of the official record on file with SJCERA if receivedprior to the end of the meeting. Public comment is expected to be civil andcourteous.
Except as otherwise permitted by the Ralph M. Brown Act (California GovernmentCode Sections 54950 et seq.), no deliberation, discussion or action may be takenby the Board on items not listed on the agenda. Members of the Board may, butare not required to: (1) briefly respond to statements made or questions posed bypersons addressing the Board; (2) ask a brief question for clarification; or (3) referthe matter to staff for further information.
5.0 CONSENT ITEMS5.01 Service Retirement (19) 85.02 General (2)
6 South El Dorado Street, Suite 400 • Stockton, CA 95202(209) 468-2163 • [email protected] • www.sjcera.org
SJCERA Board Meeting • 10/9/2020 • Page 1
01 PROPOSED 2021 BOARD MEETING CALENDAR 1102 REVISED ACTUARIAL REPORT AND 2021 RETIREMENT CONTRIBUTION
RATES15
a Revised Actuarial Valuation Report as of January 1, 2020 prepared byCheiron
17
b Resolution 2020-10-02 titled “Revised Actuarial Report and 2021Retirement Contribution Rates”
119
c Board to accept the revised actuarial report, approve the retirementcontribution rates for 2021 and adopt Resolution 2020-10-02
6.0 CYBER SECURITY PRESENTATION6.01 Presentation by Peter Dewar of Linea Secure 125
7.0 CONSULTANT REPORTS7.01 Negative Interest Rate Discussion 1657.02 Monthly Investment Performance Updates
01 Receive and File Manager Performance Flash Report - August 2020 18402 Receive and File Capital Markets Outlook and Risk Metrics - September 2020 188
7.03 Board to accept and file reports8.0 CLOSED SESSION
8.01 CONFERENCE WITH LEGAL COUNSEL - PENDING LITIGATIONCALIFORNIA GOVERNMENT CODE SECTION 54956.9(d)(2)01 Significant Exposure of Litigation (1 Case)
8.02 PERSONNEL MATTERSCALIFORNIA GOVERNMENT CODE SECTION 54957EMPLOYEE DISABILITY RETIREMENT APPLICATIONS (3)
8.03 PERSONNEL MATTERSCALIFORNIA GOVERNMENT CODE SECTION 54957(b)01 Public Employee Appointment
Title: Retirement Investment Officer9.0 STAFF REPORTS
9.01 Pending Retiree Accounts Receivable - Third Quarter 2020 2219.02 Legislative Summary Report 2229.03 Trustee and Executive Staff Travel
01 Conferences and Events Schedule for 2020 225a CALAPRS Virtual Trustees Roundtable 226
02 Summary of Pending Trustee and Executive Staff Travel - None03 Summary of Completed Trustee and Executive Staff Travel 228
9.04 Board to accept and file reports9.05 CEO Report 229
01 2021 Action Plan 239
SJCERA Board Meeting • 10/9/2020 • Page 2

02 Pension System Enhancement Project 24003 Board to give staff direction as necessary
10.0 CORRESPONDENCE10.01 Letters Received10.02 Letters Sent10.03 Market Commentary/Newsletters/Articles
01 NCPERS The Monitor September 2020 24111.0 COMMENTS
11.01 Comments from the Board of Retirement12.0 CALENDAR
12.01 Special Board Meeting, October 15, 2020 at 3:00 PM12.02 Board Meeting, November 6, 2020 at 9:00 AM12.03 Administrative Committee Meeting, November 12, 2020 at 9:00 AM
13.0 ADJOURNMENT
SJCERA Board Meeting • 10/9/2020 • Page 3
M I N U T E SBOARD MEETING
SAN JOAQUIN COUNTY EMPLOYEES RETIREMENT ASSOCIATIONBOARD OF RETIREMENT
FRIDAY, SEPTEMBER 11, 2020AT 9:00 AM
Location: Via Zoom Client
San Joaquin County EmployeesRetirement Association
1.0 ROLL CALL1.01 MEMBERS PRESENT: Phonxay Keokham, Emily Nicholas, Jennifer Goodman,
Michael Duffy, Katherine Miller, Chanda Bassett, Adrian Van Houten, Margo Praus,Raymond McCray, and Michael Restuccia presidingMEMBERS ABSENT: NoneSTAFF PRESENT: Chief Executive Officer Johanna Shick, Assistant Chief ExecutiveOfficer Kathy Herman, Financial Officer Lily Cherng, Management Analyst III GregFrank, Department Information Systems Analyst II Lolo Garza, Information SystemsSpecialist II Jordan Regevig, and Retirement Administrative Assistant Andrea BonillaOTHERS PRESENT: Deputy County Counsel Jason Morrish, David Sancewich andRyan Lobdell of Meketa Investment Group
2.0 PLEDGE OF ALLEGIANCE2.01 Led by Michael Restuccia
After the Pledge of Allegiance, Chair Restuccia called for a moment of silence inacknowledgment of this day as the nineteenth anniversary of September 11, 2001and to honor those who lost their lives.
3.0 APPROVAL OF MINUTES3.01 Approval of the minutes for the Board Meeting of August 14, 20203.02 The Board voted unanimously (9-0) to approve the Minutes of the Board
Meeting of August 14, 2020. (Motion: McCray; Second: Miller)4.0 PUBLIC COMMENT
4.01 There was no public comment5.0 CONSENT ITEMS
5.01 Service Retirement (13)5.02 The Board voted unanimously (9-0) to approve the Consent Items. (Motion:
Duffy; Second: Bassett)6.0 CONSULTANT REPORTS PRESENTED BY DAVID SANCEWICH OF MEKETA
INVESTMENT GROUP6.01 QUARTERLY REPORTS FROM INVESTMENT CONSULTANT FOR PERIOD
ENDED JUNE 30, 202001 Quarterly Investment Performance Analysis02 Manager Certification Report
6 South El Dorado Street, Suite 400 • Stockton, CA 95202(209) 468-2163 • [email protected] • www.sjcera.org
SJCERA Board Meeting • 9/11/2020 • Page 1

03 Manager Review Schedule04 David Sancewich of Meketa Investment Group reviewed and discussed the
reports in relation to the Board’s investment policies. The Total Portfolio net returnwas 4.6 percent for the quarter and 1.7 percent for the one-year period endedJune 30, 2020; performance trailed the policy benchmark by 1.4 percent for thequarter and by 0.8 percent for the one-year.
6.02 Monthly Investment Performance Updates01 Receive and File Manager Performance Flash Report - July 202002 Receive and File Capital Markets Outlook and Risk Metrics - August 2020
6.03 Board accepted and filed reports7.0 EVALUATION OF CONSULTANTS
7.01 Consulting Actuary7.02 Investment Consultant7.03 This was an informational item; the Board took no action nor gave direction on
this item.8.0 STAFF REPORTS
8.01 Legislative Summary Report8.02 Trustee and Executive Staff Travel
01 Conferences and Events Schedule for 202002 Summary of Pending Trustee and Executive Staff Travel03 Summary of Completed Trustee and Executive Staff Travel
8.03 Board accepted and filed reports8.04 CEO Report
CEO Shick highlighted the following from the CEO Report: SJCERA’s assets are atan all time high when looking at recent periods; the Investment Officer recruitmentclosed last Friday and she is pleased with the strong candidate pool and will provideanother update at the next Board meeting; she thanked staff and Counsel for theirwork and input on the new Disability Hearing fact sheet that will be very helpful tomembers.01 Pension System Enhancement Project
ACEO Kathy Herman reported that the cutover to the enhanced portion of thepension system is progressing well. She reviewed the diagram of the system andreported that the focus of this enhancement was the Active Member System(AMS), and the Queue Member System (QMS), which validates incoming dataand controls workflow. Refunds and Service Purchases are also being automated.Staff will continue to work on this enhancement project to complete the scope ofwork as outlined in the contract.
9.0 CORRESPONDENCE9.01 Letters Received9.02 Letters Sent9.03 Market Commentary/Newsletters/Articles
01 NCPERS The Monitor August 2020SJCERA Board Meeting • 9/11/2020 • Page 2
02 NCPERS PERSist Summer 202003 Pensions & Investments August 11, 202004 Institutional Investor August 14, 2020
10.0 COMMENTS10.01 Comments from the Board of Retirement - None
11.0 CLOSED SESSION
THE CHAIR CONVENED A CLOSED SESSION AT 9:55 A.M. THE CHAIRADJOURNED THE CLOSED SESSION AND RECONVENED THE OPEN SESSION AT10:02 A.M.
11.01 PERSONNEL MATTERSCALIFORNIA GOVERNMENT CODE SECTION 54957EMPLOYEE DISABILITY RETIREMENT APPLICATIONS (2)01 Disability Retirement Consent (2)
Counsel reported that in Closed Session the Board took the following action onpersonnel matters:a Correctional Officer
Service-Connected Disability
The Board voted unanimously (9-0) to accept the findings andrecommendation of the Administrative Law Judge and deny theapplication for a service-connected disability retirement. (Motion:Keokham; Second: Van Houten)
b Substance Abuse Counselor IINonservice-Connected Disability
The Board voted unanimously (9-0) to grant the applicant a Nonservice-Connected Disability Retirement. (Motion: Keokham; Second: VanHouten)
12.0 REPORT OF CLOSED SESSIONS12.01 At the June 5, 2020, meeting, the Board elected to redeem its allocation in the
following funds: BlackRock-Russell 1000; Black-Rock-Small Cap Growth; BlackRock-International Markets; BlackRock-Developed es-US REIT; Capital Prospects-SmallCap Value; and PIMCO/RAE-Fundamental International. The Board approvedreinvestment of the proceeds (approximately $860 million) in Northern Trust’s passiveUS and International markets fund, NT Collective MSCI World IMI.
12.02 On January 10, 2020, the Board unanimously approved Resolution 2020-01-02 titled"HPS European Asset Value Fund II" and authorized the CEO to sign the necessarydocuments to invest $50 million in the Fund.
13.0 CALENDAR13.01 Board Meeting, October 9, 2020 at 9:00 AM
14.0 ADJOURNMENT
SJCERA Board Meeting • 9/11/2020 • Page 3

14.01 There being no further business the meeting was adjourned at 10:05 a.m.
Respectfully Submitted:
______________________Michael Restuccia, Chair
Attest:
_______________________Raymond McCray, Secretary
SJCERA Board Meeting • 9/11/2020 • Page 4
San Joaquin County Employees RetirementAssociationOctober 2020
PUBLIC
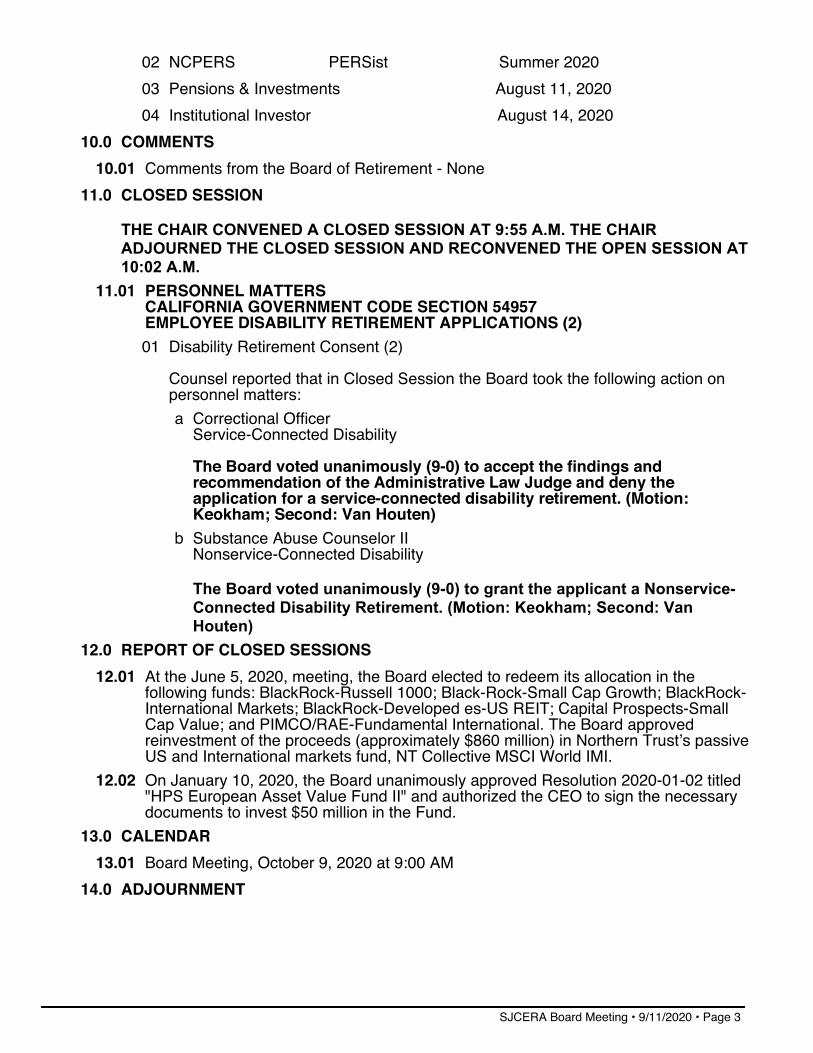
5.01 Service Retirement ConsentKIMBERLY A ANDREJKO Eligibility Supervisor
HSA - Eligibility StaffMember Type: GeneralYears of Service: 16y 02m 19dRetirement Date: 8/15/2020
01
MAX T CANNON Deferred MemberN/A
Member Type: GeneralYears of Service: 00y 03m 20dRetirement Date: 8/30/2020Comments: Deferred from SJCERA since December 2001. Outgoing reciprocity and concurrent retirement withCalPERS.
02
JAMES F COOPER Courts-Business SvcsSpecialistCourt-Court Oper-Bus Facilitie
Member Type: GeneralYears of Service: 04y 10m 18dRetirement Date: 8/25/2020
03
SUKHVINDER K DEOL Senior Psychiatric TechnicianMental HealthPHF-Inpatient Fac
Member Type: GeneralYears of Service: 20y 10m 15dRetirement Date: 8/31/2020
04
JUDITH A DOLYNIUK Mental Health Clinician IIMental Health - Lodi Clinic
Member Type: GeneralYears of Service: 17y 05m 13dRetirement Date: 8/15/2020
05
RICHARD M FLORES Assistant County CounselCounty Counsel
Member Type: GeneralYears of Service: 05y 05m 23dRetirement Date: 8/31/2020Comments: Incoming reciprocity and concurrent retirement with MCERA.
06
KIMBERLEE A JONES Deferred MemberN/A
Member Type: GeneralYears of Service: 08y 04m 08dRetirement Date: 8/26/2020
07
NARIN T KHLOK Hospital Unit ClerkHosp Emergency Room
Member Type: GeneralYears of Service: 29y 09m 18dRetirement Date: 8/15/2020
08
CARTER I LITTLE Nursing Dept Mgr - InpatientHosp Nursing Administration
Member Type: GeneralYears of Service: 33y 10m 29dRetirement Date: 8/17/2020
09
10/2/2020 4:15:57 PM Page: 1
San Joaquin County Employees RetirementAssociationOctober 2020
PUBLIC
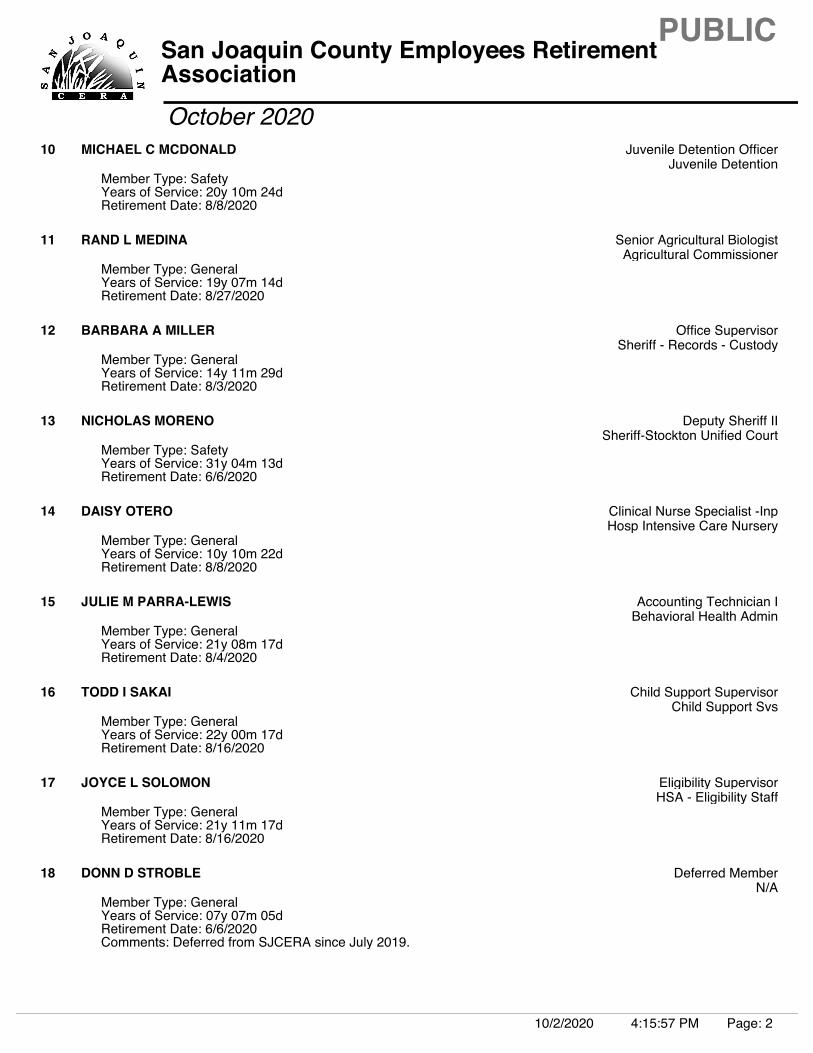
MICHAEL C MCDONALD Juvenile Detention OfficerJuvenile Detention
Member Type: SafetyYears of Service: 20y 10m 24dRetirement Date: 8/8/2020
10
RAND L MEDINA Senior Agricultural BiologistAgricultural Commissioner
Member Type: GeneralYears of Service: 19y 07m 14dRetirement Date: 8/27/2020
11
BARBARA A MILLER Office SupervisorSheriff - Records - Custody
Member Type: GeneralYears of Service: 14y 11m 29dRetirement Date: 8/3/2020
12
NICHOLAS MORENO Deputy Sheriff IISheriff-Stockton Unified Court
Member Type: SafetyYears of Service: 31y 04m 13dRetirement Date: 6/6/2020
13
DAISY OTERO Clinical Nurse Specialist -InpHosp Intensive Care Nursery
Member Type: GeneralYears of Service: 10y 10m 22dRetirement Date: 8/8/2020
14
JULIE M PARRA-LEWIS Accounting Technician IBehavioral Health Admin
Member Type: GeneralYears of Service: 21y 08m 17dRetirement Date: 8/4/2020
15
TODD I SAKAI Child Support SupervisorChild Support Svs
Member Type: GeneralYears of Service: 22y 00m 17dRetirement Date: 8/16/2020
16
JOYCE L SOLOMON Eligibility SupervisorHSA - Eligibility Staff
Member Type: GeneralYears of Service: 21y 11m 17dRetirement Date: 8/16/2020
17
DONN D STROBLE Deferred MemberN/A
Member Type: GeneralYears of Service: 07y 07m 05dRetirement Date: 6/6/2020Comments: Deferred from SJCERA since July 2019.
18
10/2/2020 4:15:57 PM Page: 2

San Joaquin County Employees RetirementAssociationOctober 2020
PUBLIC
CATHERINE M WOOD Senior Office AssistantCalifornia Childrens Services
Member Type: GeneralYears of Service: 13y 11m 24dRetirement Date: 8/15/2020
19
10/2/2020 4:15:57 PM Page: 3

Board of Retirement Meeting San Joaquin County Employees’ Retirement Association
Agenda Item 5.02-01 October 9, 2020 SUBJECT: Proposed Board Calendar for 2021 SUBMITTED FOR: ___ CONSENT _X_l ACTION ___ INFORMATION RECOMMENDATION Staff recommends the Board adopt its meeting calendar for 2021 using Proposal A, which schedules the Investment Roundtable in October. While Proposal B schedules the Investment Roundtable in May to address the Board’s request for a possible spring Roundtable, given the uncertainty of the status of the pandemic and the safety of holding in-person meetings, Proposal B is not the recommended option. PURPOSE To establish the calendar of scheduled meetings of the Board and its standing Committees for calendar year 2021. DISCUSSION In October, the Board of Retirement (BOR) adopts its meeting calendar for the following year. SJCERA’s Bylaws specify that the meetings of the Board shall be held once each month. At the July Board meeting, the Board canceled the 2020 Investment Roundtable due to the COVID-19 pandemic and its restrictions on gatherings, and directed staff to look at the possibility of holding the event in the Spring of 2021. On the proposed 2021 calendars, all Board meetings are scheduled on the second Friday of the month beginning at 9:00 a.m. with modifications for the following months.
• May: The Board meeting is scheduled for the first Friday to accommodate the semi-annual SACRS Conference.
• June: The Board meeting is scheduled for the first Friday of the month to ensure sufficient time to submit the BOR-approved, audited financial statements to the Board of Supervisors and accommodate their meeting schedule, and still meet the State Auditor-Controller’s and the GFOA’s filing deadlines.
• November: The Board meeting is scheduled for the first Friday to accommodate the semi-annual SACRS Conference.
In addition, the month we hold the Investment Roundtable, the Board meeting is held the day before the Roundtable so that staff and consultants can provide pertinent information in advance of the meeting. The Roundtable is generally held on a Thursday (for scheduling and pricing), which places the Board meeting on Wednesday.
October 9, 2020 Page 2 of 2 Agenda Item 5.02-01
• Proposal A: Hold the October Board meeting on Wednesday, October 6, and the Investment Roundtable on Thursday, October 7;
• Proposal B: Hold the May Board meeting Wednesday, May 5, and the Investment Roundtable on Thursday, May 6.
ATTACHMENTS Proposal A - 2021 Proposed SJCERA Board of Retirement Meeting Calendar
(Investment Roundtable in October) Proposal B - 2021 Proposed SJCERA Board of Retirement Meeting Calendar
(Investment Roundtable in May)
______________________ ______________________ JOHANNA SHICK ANDREA BONILLA Chief Executive Officer Retirement Administrative Assistant

MONTH DATE MONTH DATE
JAN 8 Board Meeting JUL 9 Board MeetingEarnings Code Ratification Mid-Year Administrative Budget ReportFourth Quarter Operations Reports* Second Quarter Operations Reports*Trustee Education Compliance Report Election of Board Officers
TBD CEO Performance Review Committee Investment Fee Transparency ReportAnnual Policy Review
FEB 12 Board Meeting TBD SACRS UC BerkeleyNotice of CPI/Set Retiree COLADeclining ER Payroll Report AUG 13 Board Meeting
Adoption of Plan Contribution RatesMAR 12 Board Meeting TBD CALAPRS Principles of Pension Governance
Fourth Quarter Inv Reports for Trustees, Pepperdine12 Audit Committee Meeting
6 - 9 CALAPRS General Assembly, Monterey SEP 10 Board Meeting3/31 - 4/2 CALAPRS Advanced Principles of Pension Second Quarter Inv Reports
Mgmt for Trustees, UCLA Consultants and Actuaries Evaluations
APR 9 Board Meeting OCT 6 Board MeetingFirst Quarter Operations Reports* Adoption of Board Calendar for next year
Third Quarter Operations Reports*2021 Action Plan
MAY 7 Board Meeting 7 Special Meeting; Investment Roundtable11 - 14 SACRS Spring Conf
TBD Audit Committee Meeting NOV 5 Board MeetingActuarial Experience Study
TBD Administrative Committee MeetingJUN 4 Board Meeting 9 - 12 SACRS Fall Conference
First Quarter Inv ReportsAuditor's Annual Report / CAFR DEC 10 Board MeetingMid Year Action Plan Results Third Quarter Inv Reports
TBD Administrative Committee Meeting Annual Administrative Budget10 RPESJC Picnic 9 RPESJC Holiday Lunch
* Disability App Status Report and Pending Retiree Accounts Receivable ReportNotes: May meeting is on the first Friday due to the SACRS Spring Conference.
June meeting is on the first Friday due to BOS meeting schedule.October meeting is on the first Wednesday due to the Investment Roundtable.November meeting is on the first Friday due to the SACRS Fall Conference.One meeting per month on all subjects; special Manager Due Diligence Meetings as needed.
2021 - SJCERA BOARD OF RETIREMENT MEETING CALENDAR PROPOSAL A Periodic Items / Other Events Periodic Items / Other Events
Unless otherwise noted on the agenda, Board Meetings convene at 9:00 a.m.

MONTH DATE MONTH DATE
JAN 8 Board Meeting JUL 9 Board MeetingEarnings Code Ratification Mid-Year Administrative Budget ReportFourth Quarter Operations Reports* Second Quarter Operations Reports*Trustee Education Compliance Report Election of Board Officers
TBD CEO Performance Review Committee Investment Fee Transparency ReportAnnual Policy Review
FEB 12 Board Meeting TBD SACRS UC BerkeleyNotice of CPI/Set Retiree COLADeclining ER Payroll Report AUG 13 Board Meeting
Adoption of Plan Contribution RatesMAR 12 Board Meeting TBD CALAPRS Principles of Pension Governance
Fourth Quarter Inv Reports for Trustees, Pepperdine12 Audit Committee Meeting
6 - 9 CALAPRS General Assembly, Monterey SEP 10 Board Meeting3/31 - 4/2 CALAPRS Advanced Principles of Pension Second Quarter Inv Reports
Mgmt for Trustees, UCLA Consultants and Actuaries Evaluations
APR 9 Board Meeting OCT 8 Board MeetingFirst Quarter Operations Reports* Adoption of Board Calendar for next year
Third Quarter Operations Reports*MAY 5 Board Meeting 2021 Action Plan
6 Special Meeting; Investment Roundtable11 - 14 SACRS Spring Conf NOV 5 Board Meeting
TBD Audit Committee Meeting Actuarial Experience StudyTBD Administrative Committee Meeting
JUN 4 Board Meeting 9 - 12 SACRS Fall ConferenceFirst Quarter Inv ReportsAuditor's Annual Report / CAFR DEC 10 Board MeetingMid Year Action Plan Results Third Quarter Inv Reports
TBD Administrative Committee Meeting Annual Administrative Budget10 RPESJC Picnic 9 RPESJC Holiday Lunch
* Disability App Status Report and Pending Retiree Accounts Receivable ReportNotes: May meeting is on the first Wednesday due to the Investment Roundtable.
June meeting is on the first Friday due to BOS meeting schedule.November meeting is on the first Friday due to the SACRS Fall Conference.One meeting per month on all subjects; special Manager Due Diligence Meetings as needed.
2021 - SJCERA BOARD OF RETIREMENT MEETING CALENDAR PROPOSAL B Periodic Items / Other Events Periodic Items / Other Events
Unless otherwise noted on the agenda, Board Meetings convene at 9:00 a.m.
________________________________________________________
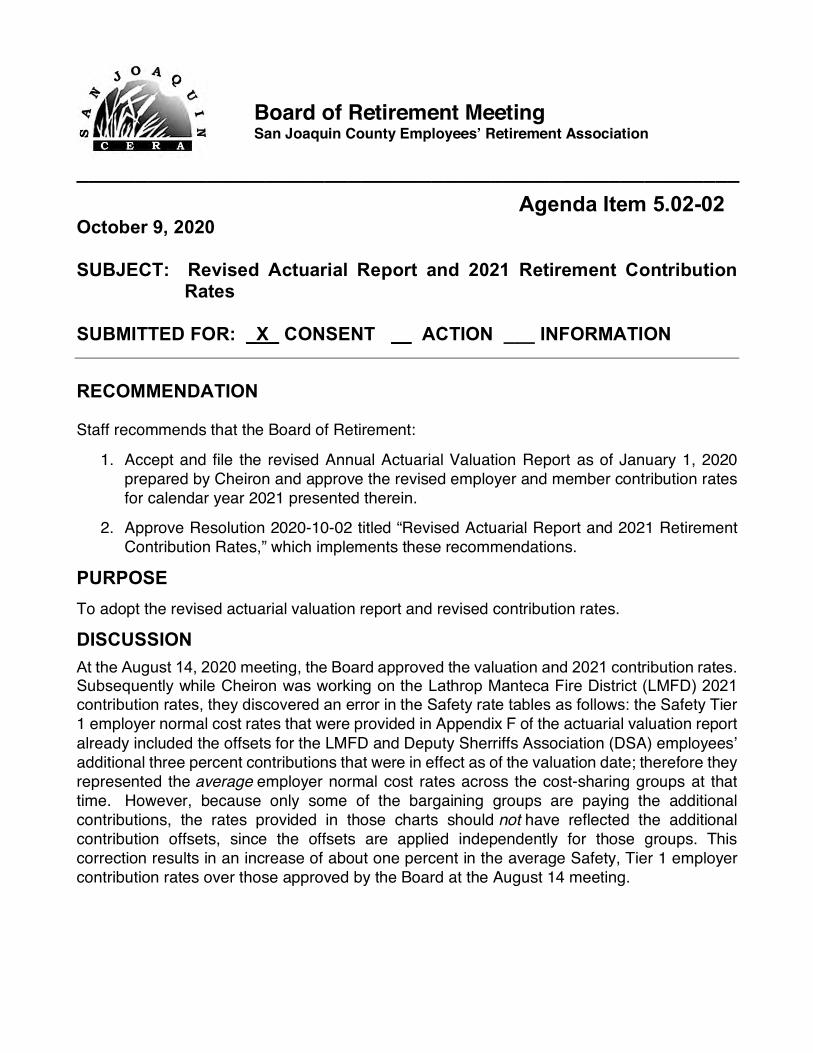
Agenda Item 5.02-02 October 9, 2020 SUBJECT: Revised Actuarial Report and 2021 Retirement Contribution
Rates SUBMITTED FOR: _X_ CONSENT l__l ACTION ___ INFORMATION
RECOMMENDATION Staff recommends that the Board of Retirement:
1. Accept and file the revised Annual Actuarial Valuation Report as of January 1, 2020 prepared by Cheiron and approve the revised employer and member contribution rates for calendar year 2021 presented therein.
2. Approve Resolution 2020-10-02 titled “Revised Actuarial Report and 2021 Retirement Contribution Rates,” which implements these recommendations.
PURPOSE To adopt the revised actuarial valuation report and revised contribution rates.
DISCUSSION At the August 14, 2020 meeting, the Board approved the valuation and 2021 contribution rates. Subsequently while Cheiron was working on the Lathrop Manteca Fire District (LMFD) 2021 contribution rates, they discovered an error in the Safety rate tables as follows: the Safety Tier 1 employer normal cost rates that were provided in Appendix F of the actuarial valuation report already included the offsets for the LMFD and Deputy Sherriffs Association (DSA) employees’ additional three percent contributions that were in effect as of the valuation date; therefore they represented the average employer normal cost rates across the cost-sharing groups at that time. However, because only some of the bargaining groups are paying the additional contributions, the rates provided in those charts should not have reflected the additional contribution offsets, since the offsets are applied independently for those groups. This correction results in an increase of about one percent in the average Safety, Tier 1 employer contribution rates over those approved by the Board at the August 14 meeting.
Board of Retirement Meeting San Joaquin County Employees’ Retirement Association
October 9, 2020 Page 2 of 2 Agenda Item 5.02-02
!
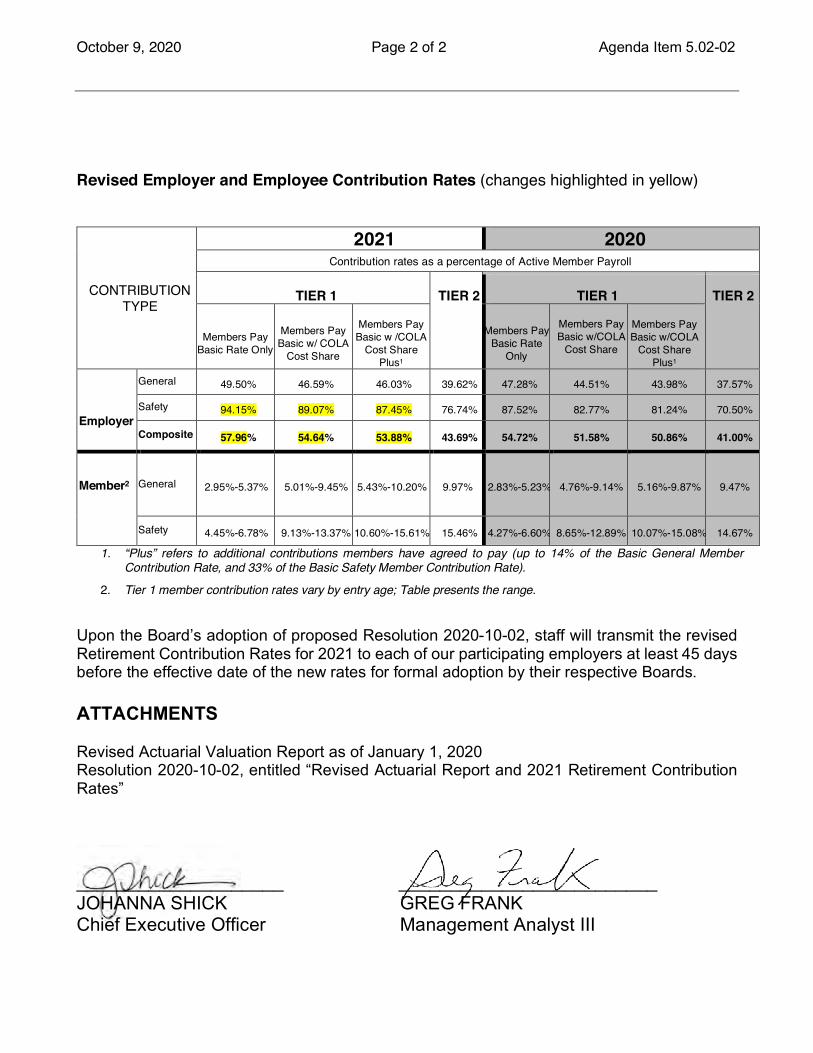
Revised Employer and Employee Contribution Rates (changes highlighted in yellow)
1. “Plus” refers to additional contributions members have agreed to pay (up to 14% of the Basic General Member Contribution Rate, and 33% of the Basic Safety Member Contribution Rate).
2. Tier 1 member contribution rates vary by entry age; Table presents the range.
Upon the Board’s adoption of proposed Resolution 2020-10-02, staff will transmit the revised Retirement Contribution Rates for 2021 to each of our participating employers at least 45 days before the effective date of the new rates for formal adoption by their respective Boards. ATTACHMENTS Revised Actuarial Valuation Report as of January 1, 2020 Resolution 2020-10-02, entitled “Revised Actuarial Report and 2021 Retirement Contribution Rates” ____________________ _________________________ JOHANNA SHICK GREG FRANK Chief Executive Officer Management Analyst III
CONTRIBUTION TYPE
2021 2020 Contribution rates as a percentage of Active Member Payroll
TIER 1 TIER 2 TIER 1 TIER 2
Members Pay Basic Rate Only
Members Pay Basic w/ COLA
Cost Share
Members Pay Basic w /COLA
Cost Share Plus1
Members Pay Basic Rate
Only
Members Pay Basic w/COLA
Cost Share
Members Pay Basic w/COLA
Cost Share Plus1
Employer
General 49.50% 46.59% 46.03% 39.62% 47.28% 44.51% 43.98% 37.57%
Safety 94.15% 89.07% 87.45% 76.74% 87.52% 82.77% 81.24% 70.50%
Composite 57.96% 54.64% 53.88% 43.69% 54.72% 51.58% 50.86% 41.00%
Member2
General 2.95%-5.37% 5.01%-9.45% 5.43%-10.20% 9.97% 2.83%-5.23% 4.76%-9.14% 5.16%-9.87% 9.47%
Safety 4.45%-6.78% 9.13%-13.37% 10.60%-15.61% 15.46% 4.27%-6.60% 8.65%-12.89% 10.07%-15.08% 14.67%
San Joaquin County Employees’ Retirement Association
Actuarial Valuation Report as of January 1, 2020
Produced by Cheiron
September 2020
(Revised)
TABLE OF CONTENTS Section Page
Letter of Transmittal ........................................................................................................................ i Section I Executive Summary .................................................................................................1 Section II Disclosures Related to Risk ...................................................................................15 Section III Assets .....................................................................................................................25 Section IV Liabilities ...............................................................................................................33 Section V Contributions..........................................................................................................37 Section VI Additional CAFR Schedules ..................................................................................41 Appendices Appendix A Membership Information .......................................................................................42 Appendix B Statement of Current Actuarial Assumptions and Methods ..................................65 Appendix C Summary of Plan Provisions ..................................................................................73 Appendix D 401(h) Repayment Schedule ..................................................................................86
Appendix E Glossary .................................................................................................................87 Appendix F General and Safety Employer Contribution Rates .................................................89 Appendix G Member Contribution Rates ...................................................................................95
September 28, 2020 Retirement Board of San Joaquin County Employees’ Retirement Association 6 South El Dorado Street, Suite 400 Stockton, CA 95202 Dear Members of the Board: At your request, we have conducted an actuarial valuation of the San Joaquin County Employees’ Retirement Association (SJCERA, the System, the Fund, the Plan) as of January 1, 2020. This report contains information on the System’s assets and liabilities and discloses employer and employee contribution levels. It also contains schedules for inclusion in the Actuarial Section of the Comprehensive Annual Financial Report (CAFR). Your attention is called to the Foreword in which we refer to the general approach employed in the preparation of this report. The purpose of this report is to present the results of the annual actuarial valuation of SJCERA. This report is for the use of the Retirement Board of SJCERA and its auditors in preparing financial reports in accordance with applicable law and accounting requirements. Cheiron’s report was prepared solely for the Retirement Board of SJCERA for the purposes described herein, except that the plan auditor may rely on this report solely for the purpose of completing an audit related to the matters herein. Other users of this report are not intended users as defined in the Actuarial Standards of Practice, and Cheiron assumes no duty or liability to any other user.
This report and its contents have been prepared in accordance with generally recognized and accepted actuarial principles and practices and our understanding of the Code of Professional Conduct and applicable Actuarial Standards of Practice set out by the Actuarial Standards Board as well as applicable laws and regulations. Furthermore, as credentialed actuaries, we meet the Qualification Standards of the American Academy of Actuaries to render the opinion contained in this report. This report does not address any contractual or legal issues. We are not attorneys and our firm does not provide any legal services or advice.
Sincerely, Cheiron Graham A. Schmidt, ASA, FCA, MAAA, EA Anne D. Harper, FSA, MAAA, EA Consulting Actuary Principal Consulting Actuary
SAN JOAQUIN COUNTY EMPLOYEES’ RETIREMENT ASSOCIATION ACTUARIAL VALUATION REPORT AS OF JANUARY 1, 2020
SECTION I – EXECUTIVE SUMMARY
1
Cheiron has performed the actuarial valuation of the San Joaquin County Employees’ Retirement Association as of January 1, 2020. The valuation is organized as follows:
In Section I, the Executive Summary, we describe the purpose of an actuarial valuation,
summarize the key results found in this valuation and disclose important trends.
The Main Body of the report presents details on the System’s
o Section II – Identification and Assessment of Risks o Section III – Assets o Section IV – Liabilities o Section V – Contributions o Section VI – Additional CAFR Schedules
In the Appendices, we conclude our report with detailed information describing plan
membership (Appendix A), actuarial assumptions and methods employed in the valuation (Appendix B), a summary of pertinent plan provisions (Appendix C), a 401(h) repayment schedule (Appendix D), a glossary of key actuarial terms (Appendix E), a summary of General and Safety Employer contribution rates (Appendix F), and tables containing member contribution rates (Appendix G).
Future results may differ significantly from the current results presented in this report due to such factors as the following: plan experience differing from that anticipated by the assumptions; changes in assumptions; and, changes in plan provisions or applicable law. This report does not contain any adjustment for the potential impact of COVID-19. We anticipate the virus will affect both demographic and economic experience. In preparing our report, we relied on information (some oral and some written) supplied by the SJCERA staff. This information includes, but is not limited to, plan provisions, employee data, and financial information. We performed an informal examination of the obvious characteristics of the data for reasonableness and consistency in accordance with Actuarial Standard of Practice No. 23.
SAN JOAQUIN COUNTY EMPLOYEES’ RETIREMENT ASSOCIATION ACTUARIAL VALUATION REPORT AS OF JANUARY 1, 2020
SECTION I – EXECUTIVE SUMMARY
2
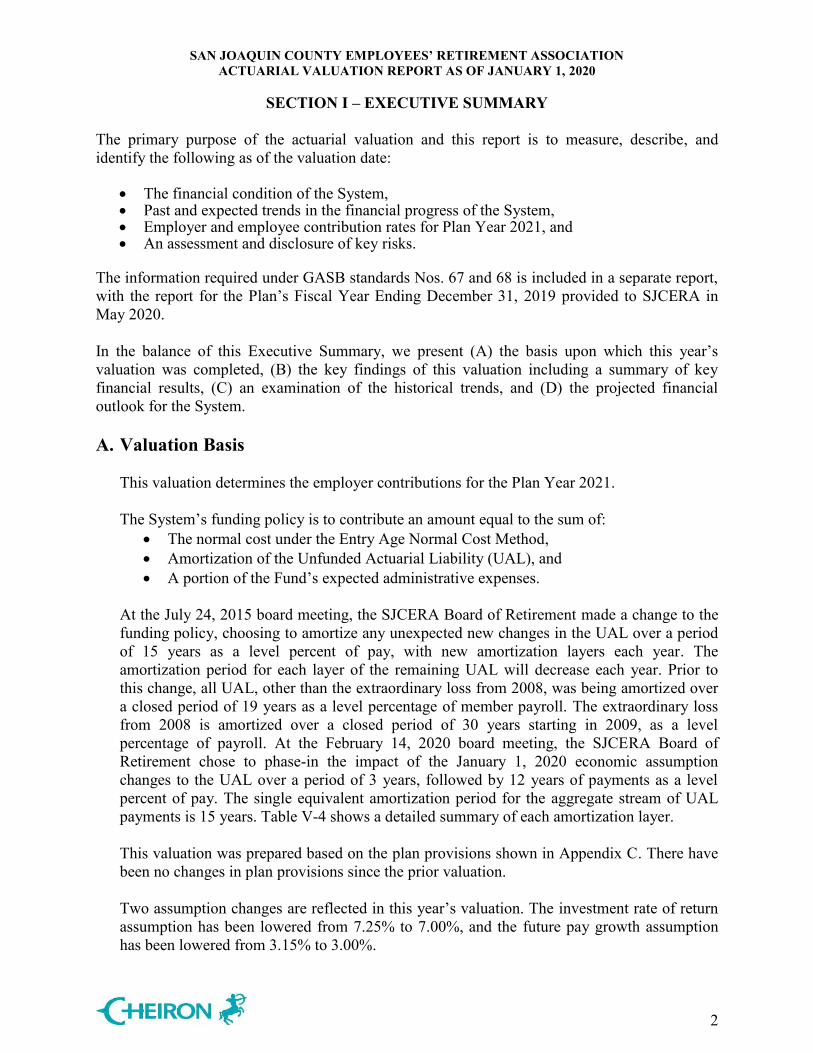
The primary purpose of the actuarial valuation and this report is to measure, describe, and identify the following as of the valuation date:
The financial condition of the System, Past and expected trends in the financial progress of the System, Employer and employee contribution rates for Plan Year 2021, and An assessment and disclosure of key risks.
The information required under GASB standards Nos. 67 and 68 is included in a separate report, with the report for the Plan’s Fiscal Year Ending December 31, 2019 provided to SJCERA in May 2020. In the balance of this Executive Summary, we present (A) the basis upon which this year’s valuation was completed, (B) the key findings of this valuation including a summary of key financial results, (C) an examination of the historical trends, and (D) the projected financial outlook for the System. A. Valuation Basis
This valuation determines the employer contributions for the Plan Year 2021. The System’s funding policy is to contribute an amount equal to the sum of:
The normal cost under the Entry Age Normal Cost Method, Amortization of the Unfunded Actuarial Liability (UAL), and A portion of the Fund’s expected administrative expenses.
At the July 24, 2015 board meeting, the SJCERA Board of Retirement made a change to the funding policy, choosing to amortize any unexpected new changes in the UAL over a period of 15 years as a level percent of pay, with new amortization layers each year. The amortization period for each layer of the remaining UAL will decrease each year. Prior to this change, all UAL, other than the extraordinary loss from 2008, was being amortized over a closed period of 19 years as a level percentage of member payroll. The extraordinary loss from 2008 is amortized over a closed period of 30 years starting in 2009, as a level percentage of payroll. At the February 14, 2020 board meeting, the SJCERA Board of Retirement chose to phase-in the impact of the January 1, 2020 economic assumption changes to the UAL over a period of 3 years, followed by 12 years of payments as a level percent of pay. The single equivalent amortization period for the aggregate stream of UAL payments is 15 years. Table V-4 shows a detailed summary of each amortization layer. This valuation was prepared based on the plan provisions shown in Appendix C. There have been no changes in plan provisions since the prior valuation. Two assumption changes are reflected in this year’s valuation. The investment rate of return assumption has been lowered from 7.25% to 7.00%, and the future pay growth assumption has been lowered from 3.15% to 3.00%.
SAN JOAQUIN COUNTY EMPLOYEES’ RETIREMENT ASSOCIATION ACTUARIAL VALUATION REPORT AS OF JANUARY 1, 2020
SECTION I – EXECUTIVE SUMMARY
3
B. Key Findings of this Valuation
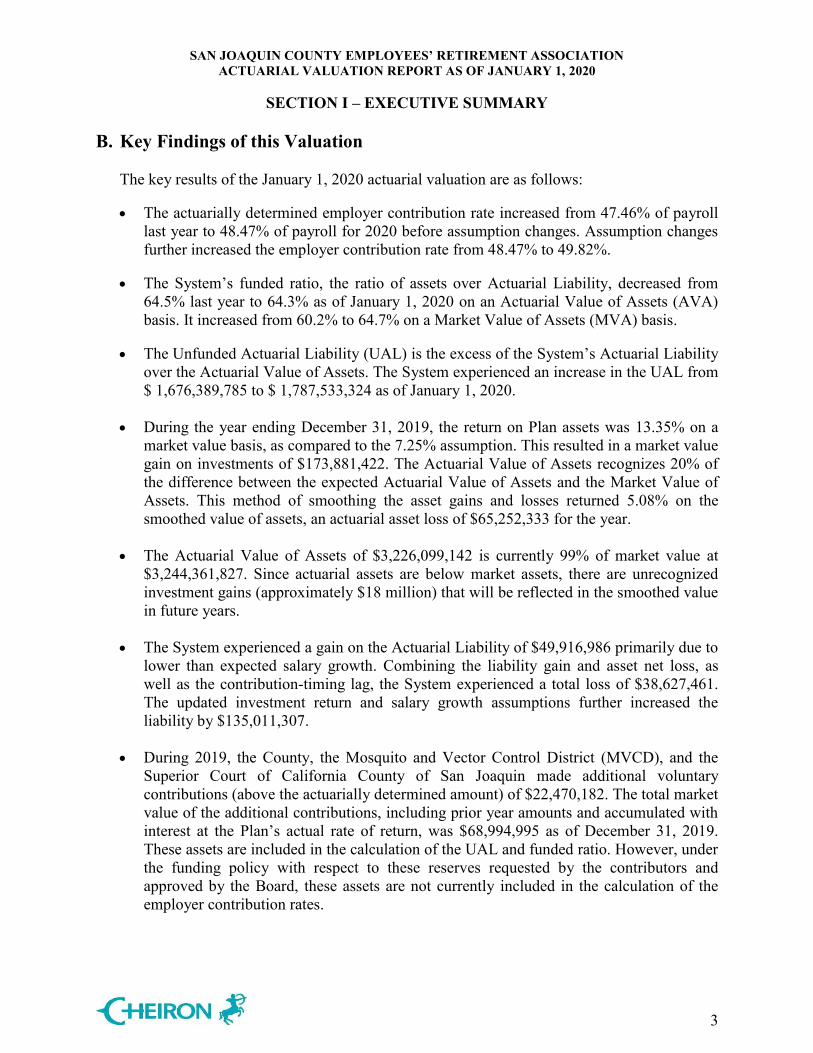
The key results of the January 1, 2020 actuarial valuation are as follows: The actuarially determined employer contribution rate increased from 47.46% of payroll
last year to 48.47% of payroll for 2020 before assumption changes. Assumption changes further increased the employer contribution rate from 48.47% to 49.82%.
The System’s funded ratio, the ratio of assets over Actuarial Liability, decreased from 64.5% last year to 64.3% as of January 1, 2020 on an Actuarial Value of Assets (AVA) basis. It increased from 60.2% to 64.7% on a Market Value of Assets (MVA) basis.
The Unfunded Actuarial Liability (UAL) is the excess of the System’s Actuarial Liability over the Actuarial Value of Assets. The System experienced an increase in the UAL from $ 1,676,389,785 to $ 1,787,533,324 as of January 1, 2020.
During the year ending December 31, 2019, the return on Plan assets was 13.35% on a market value basis, as compared to the 7.25% assumption. This resulted in a market value gain on investments of $173,881,422. The Actuarial Value of Assets recognizes 20% of the difference between the expected Actuarial Value of Assets and the Market Value of Assets. This method of smoothing the asset gains and losses returned 5.08% on the smoothed value of assets, an actuarial asset loss of $65,252,333 for the year.
The Actuarial Value of Assets of $3,226,099,142 is currently 99% of market value at $3,244,361,827. Since actuarial assets are below market assets, there are unrecognized investment gains (approximately $18 million) that will be reflected in the smoothed value in future years.
The System experienced a gain on the Actuarial Liability of $49,916,986 primarily due to lower than expected salary growth. Combining the liability gain and asset net loss, as well as the contribution-timing lag, the System experienced a total loss of $38,627,461. The updated investment return and salary growth assumptions further increased the liability by $135,011,307.
During 2019, the County, the Mosquito and Vector Control District (MVCD), and the
Superior Court of California County of San Joaquin made additional voluntary contributions (above the actuarially determined amount) of $22,470,182. The total market value of the additional contributions, including prior year amounts and accumulated with interest at the Plan’s actual rate of return, was $68,994,995 as of December 31, 2019. These assets are included in the calculation of the UAL and funded ratio. However, under the funding policy with respect to these reserves requested by the contributors and approved by the Board, these assets are not currently included in the calculation of the employer contribution rates.
SAN JOAQUIN COUNTY EMPLOYEES’ RETIREMENT ASSOCIATION ACTUARIAL VALUATION REPORT AS OF JANUARY 1, 2020
SECTION I – EXECUTIVE SUMMARY
4
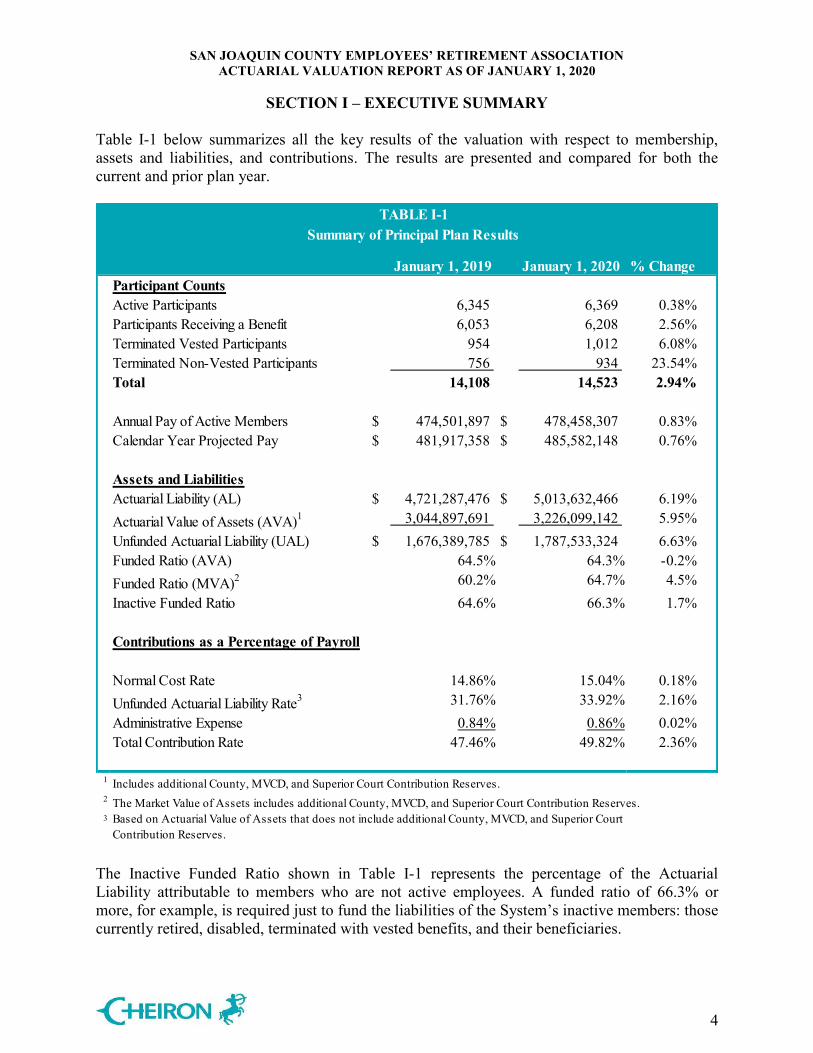
Table I-1 below summarizes all the key results of the valuation with respect to membership, assets and liabilities, and contributions. The results are presented and compared for both the current and prior plan year.
January 1, 2019 January 1, 2020 % ChangeParticipant CountsActive Participants 6,345 6,369 0.38%Participants Receiving a Benefit 6,053 6,208 2.56%Terminated Vested Participants 954 1,012 6.08%Terminated Non-Vested Participants 756 934 23.54%Total 14,108 14,523 2.94%
Annual Pay of Active Members $ 474,501,897 $ 478,458,307 0.83%Calendar Year Projected Pay $ 481,917,358 $ 485,582,148 0.76%
Assets and LiabilitiesActuarial Liability (AL) $ 4,721,287,476 $ 5,013,632,466 6.19%Actuarial Value of Assets (AVA)1 3,044,897,691 3,226,099,142 5.95%Unfunded Actuarial Liability (UAL) $ 1,676,389,785 $ 1,787,533,324 6.63%Funded Ratio (AVA) 64.5% 64.3% -0.2%Funded Ratio (MVA)2 60.2% 64.7% 4.5%Inactive Funded Ratio 64.6% 66.3% 1.7%
Contributions as a Percentage of Payroll
Normal Cost Rate 14.86% 15.04% 0.18%Unfunded Actuarial Liability Rate3 31.76% 33.92% 2.16%Administrative Expense 0.84% 0.86% 0.02%Total Contribution Rate 47.46% 49.82% 2.36%
1
2 The Market Value of Assets includes additional County, MVCD, and Superior Court Contribution Reserves.3
TABLE I-1Summary of Principal Plan Results
Includes additional County, MVCD, and Superior Court Contribution Reserves.
Based on Actuarial Value of Assets that does not include additional County, MVCD, and Superior Court Contribution Reserves.
The Inactive Funded Ratio shown in Table I-1 represents the percentage of the Actuarial Liability attributable to members who are not active employees. A funded ratio of 66.3% or more, for example, is required just to fund the liabilities of the System’s inactive members: those currently retired, disabled, terminated with vested benefits, and their beneficiaries.
SAN JOAQUIN COUNTY EMPLOYEES’ RETIREMENT ASSOCIATION ACTUARIAL VALUATION REPORT AS OF JANUARY 1, 2020
SECTION I – EXECUTIVE SUMMARY
5
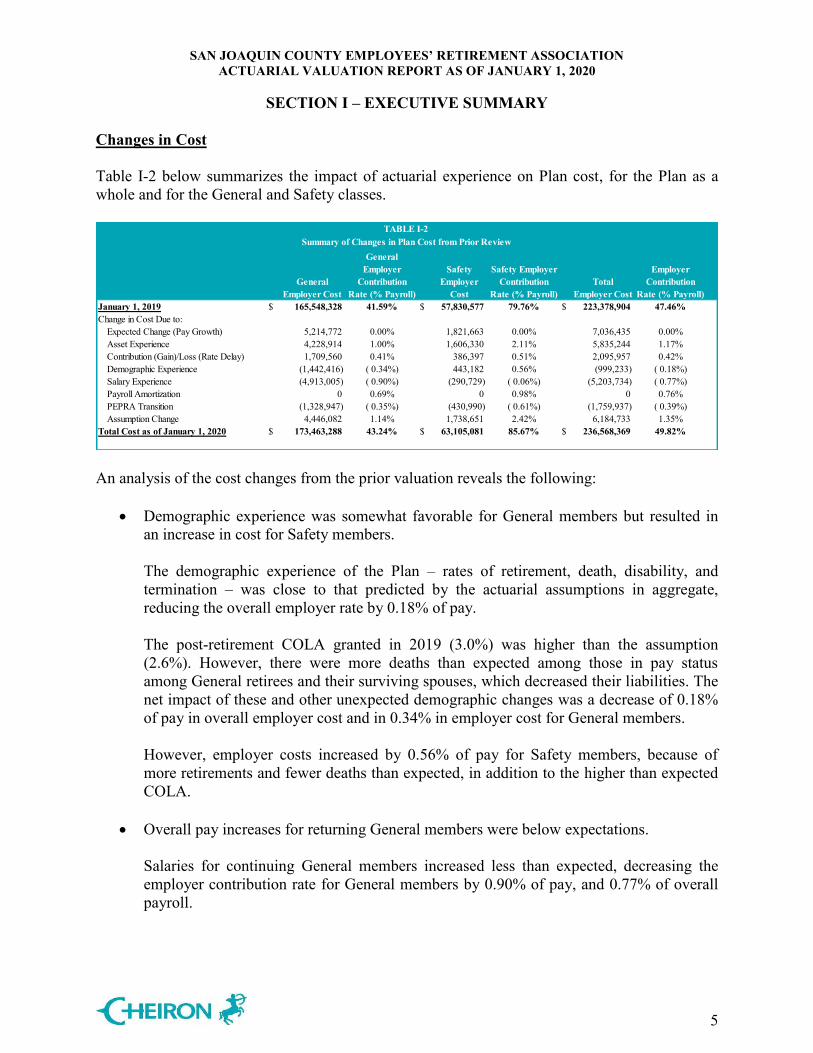
Changes in Cost Table I-2 below summarizes the impact of actuarial experience on Plan cost, for the Plan as a whole and for the General and Safety classes.
General Employer Cost
General Employer
Contribution Rate (% Payroll)
Safety Employer
Cost
Safety Employer Contribution
Rate (% Payroll)Total
Employer Cost
Employer Contribution
Rate (% Payroll)January 1, 2019 $ 165,548,328 41.59% $ 57,830,577 79.76% $ 223,378,904 47.46% Change in Cost Due to:
Expected Change (Pay Growth) 5,214,772 0.00% 1,821,663 0.00% 7,036,435 0.00% Asset Experience 4,228,914 1.00% 1,606,330 2.11% 5,835,244 1.17% Contribution (Gain)/Loss (Rate Delay) 1,709,560 0.41% 386,397 0.51% 2,095,957 0.42% Demographic Experience (1,442,416) ( 0.34%) 443,182 0.56% (999,233) ( 0.18%)Salary Experience (4,913,005) ( 0.90%) (290,729) ( 0.06%) (5,203,734) ( 0.77%)Payroll Amortization 0 0.69% 0 0.98% 0 0.76% PEPRA Transition (1,328,947) ( 0.35%) (430,990) ( 0.61%) (1,759,937) ( 0.39%)Assumption Change 4,446,082 1.14% 1,738,651 2.42% 6,184,733 1.35%
Total Cost as of January 1, 2020 $ 173,463,288 43.24% $ 63,105,081 85.67% $ 236,568,369 49.82%
TABLE I-2Summary of Changes in Plan Cost from Prior Review
An analysis of the cost changes from the prior valuation reveals the following:
Demographic experience was somewhat favorable for General members but resulted in an increase in cost for Safety members. The demographic experience of the Plan – rates of retirement, death, disability, and termination – was close to that predicted by the actuarial assumptions in aggregate, reducing the overall employer rate by 0.18% of pay. The post-retirement COLA granted in 2019 (3.0%) was higher than the assumption (2.6%). However, there were more deaths than expected among those in pay status among General retirees and their surviving spouses, which decreased their liabilities. The net impact of these and other unexpected demographic changes was a decrease of 0.18% of pay in overall employer cost and in 0.34% in employer cost for General members. However, employer costs increased by 0.56% of pay for Safety members, because of more retirements and fewer deaths than expected, in addition to the higher than expected COLA.
Overall pay increases for returning General members were below expectations.
Salaries for continuing General members increased less than expected, decreasing the employer contribution rate for General members by 0.90% of pay, and 0.77% of overall payroll.
SAN JOAQUIN COUNTY EMPLOYEES’ RETIREMENT ASSOCIATION ACTUARIAL VALUATION REPORT AS OF JANUARY 1, 2020
SECTION I – EXECUTIVE SUMMARY
6
However, salaries for continuing Safety members were close to the assumption, with small gains that reduced the rate by 0.06% of pay.
The unfunded liability is being amortized over a smaller-than-expected payroll base for the General members and Safety members.
The payroll used to amortize the unfunded liability for General members was lower than expected due to lower than expected payroll growth (0.65%, versus the 3.15% assumption), which increased the General employer contribution rate by an additional 0.69% of pay, since the UAL payments are spread out over a lower payroll base than expected. The lower than expected Safety projected payroll (reflecting a 1.39% increase) resulted in an increase in the contribution rate by about 0.98% of pay. The aggregate impact from the change in total projected payroll was an increase in the contribution rate of 0.76% of pay. Note that the change in the payroll base used to amortize the unfunded liability does not change the dollar amount of the contribution – only the contribution rate calculated as a percentage of pay.
New members entered the Plan as PEPRA members.
During 2019, there were 790 newly hired or rehired members entering the Plan to replace departing members. New Tier 2 hires have a smaller Plan normal cost as a percentage of payroll when compared to the legacy (Tier 1) members. Due to the shift in both populations towards more Tier 2 members, the employer contribution rate decreased by 0.35% of payroll for General members, 0.61% of pay for Safety members, and the overall contribution rate dropped by 0.39% of pay. In addition, different bargaining groups continue to negotiate modifications to the cost sharing arrangements for their Legacy members. The valuation results reflect the arrangements in place as of the valuation date. Changes to the cost sharing arrangements occurring after the valuation date will affect the aggregate employer costs in future valuations.
Overall, the combined demographic and salary experience resulted in a decrease in the dollar amount of the actuarial cost by about $8 million and a decrease in the contribution rate by about 0.58% of pay.
New economic assumptions increased cost.
The decrease in the investment return assumption from 7.25% to 7.00% and pay growth assumption from 3.15% to 3.00% increased the employer contribution rate by 1.35% of pay overall and by about $6.2 million. The increase was 1.14% of pay for General
SAN JOAQUIN COUNTY EMPLOYEES’ RETIREMENT ASSOCIATION ACTUARIAL VALUATION REPORT AS OF JANUARY 1, 2020
SECTION I – EXECUTIVE SUMMARY
7
members and 2.42% of pay for Safety members. These increases reflect the first year of a three-year phase-in of the UAL payment due to the new economic assumptions.
Asset experience produced an investment gain on a market basis and a loss on a
smoothed basis. The assets of the Plan returned 13.35% on a market basis, higher than the assumed rate of 7.25%, resulting in a gain of approximately $174 million for 2019. Under the actuarial asset smoothing policy, 20% of this gain is recognized in the current year, in addition to 20% of the gains and losses from each of the prior three years. The overall return on the smoothed assets was 5.08%; lower than the assumed return of 7.25%, so the overall contribution rate increased by 1.17% of pay. The contribution rate increased more for Safety members (by 2.11% of pay) than for General members (1.00% of pay) as a result of the asset loss; this is due to the fact that the Safety members have a higher ratio of assets to payroll than the General members, and is discussed further in this report.
Contributions less than the actuarial cost increased the employer contribution rate by 0.42% of pay, largely due to the 12-month delay in implementation of the contribution rates and a shortfall in actual versus projected payroll.

SAN JOAQUIN COUNTY EMPLOYEES’ RETIREMENT ASSOCIATION ACTUARIAL VALUATION REPORT AS OF JANUARY 1, 2020
SECTION I – EXECUTIVE SUMMARY
8
C. Historical Trends Despite the fact that for most retirement plans the greatest attention is given to the current valuation results and in particular, the size of the current Unfunded Actuarial Liability and the employer contribution, it is important to remember that each valuation is merely a snapshot in the long-term progress of a pension fund. It is more important to judge a current year’s valuation result relative to historical trends, as well as trends expected into the future. Assets and Liabilities The chart on this page compares the Market Value of Assets (MVA) and Actuarial Value of Assets (AVA) to the Actuarial Liabilities. The percentage shown at the top of each bar is the ratio of the Actuarial Value of Assets to the Actuarial Liability (the funded ratio).
72.7% 69.9% 63.4% 64.2% 66.2% 65.0% 64.6% 64.8% 64.5% 64.3%
$0.0
$1.0
$2.0
$3.0
$4.0
$5.0
$6.0
2011 2012 2013 2014 2015 2016 2017 2018 2019 2020
Bill
ions
Actuarial Liability MVA AVA
The funded ratio has declined from 72.7% in 2011 to 64.3% in 2020. The extraordinary asset loss of 2008 adversely affected the funded ratio through 2013, as losses were recognized with asset smoothing. In addition, for the 2013, 2016, 2018, and 2020 valuations, assumption changes were made that reflected lower expected future returns on assets and improved mortality, increasing the Actuarial Liability, and therefore decreasing the funded ratio. The return on the Actuarial Value of Assets the last five years has been between 3.9%-5.6%, lower than the assumed rate of return, which has also contributed to the Plan’s lack of funding progress.
SAN JOAQUIN COUNTY EMPLOYEES’ RETIREMENT ASSOCIATION ACTUARIAL VALUATION REPORT AS OF JANUARY 1, 2020
SECTION I – EXECUTIVE SUMMARY
9
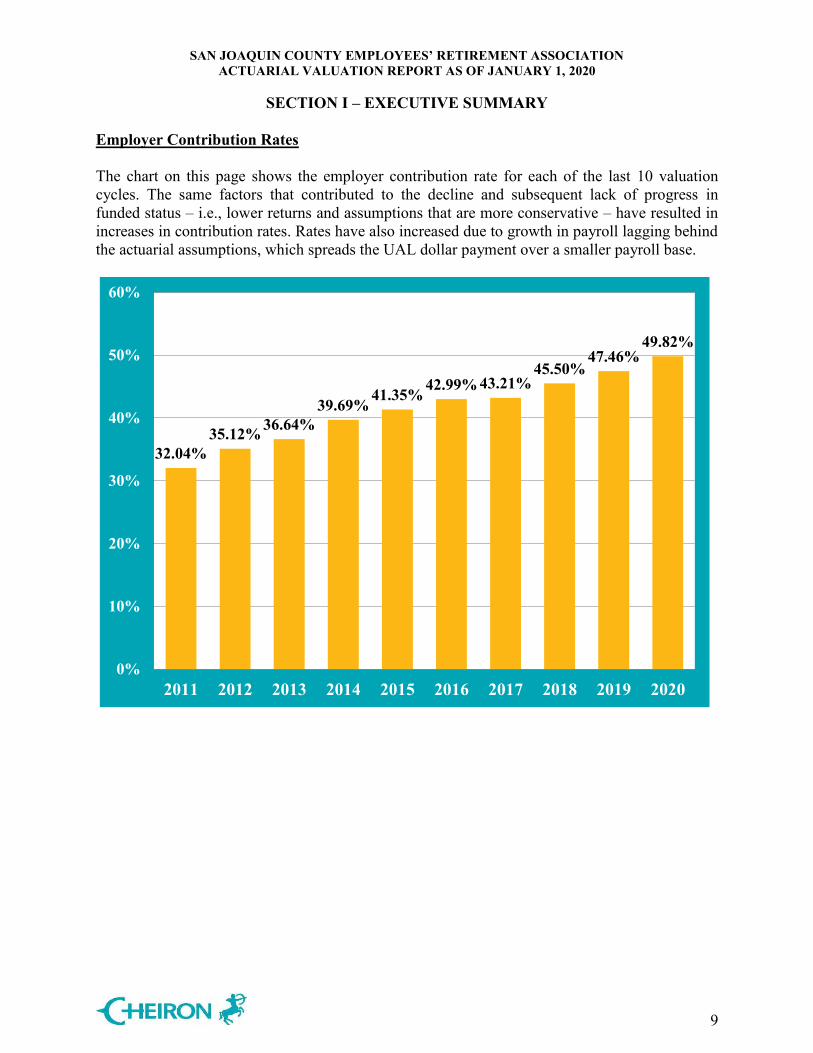
Employer Contribution Rates The chart on this page shows the employer contribution rate for each of the last 10 valuation cycles. The same factors that contributed to the decline and subsequent lack of progress in funded status – i.e., lower returns and assumptions that are more conservative – have resulted in increases in contribution rates. Rates have also increased due to growth in payroll lagging behind the actuarial assumptions, which spreads the UAL dollar payment over a smaller payroll base.
32.04%35.12% 36.64%
39.69% 41.35% 42.99% 43.21%45.50%
47.46%49.82%
0%
10%
20%
30%
40%
50%
60%
2011 2012 2013 2014 2015 2016 2017 2018 2019 2020
SAN JOAQUIN COUNTY EMPLOYEES’ RETIREMENT ASSOCIATION ACTUARIAL VALUATION REPORT AS OF JANUARY 1, 2020
SECTION I – EXECUTIVE SUMMARY
10
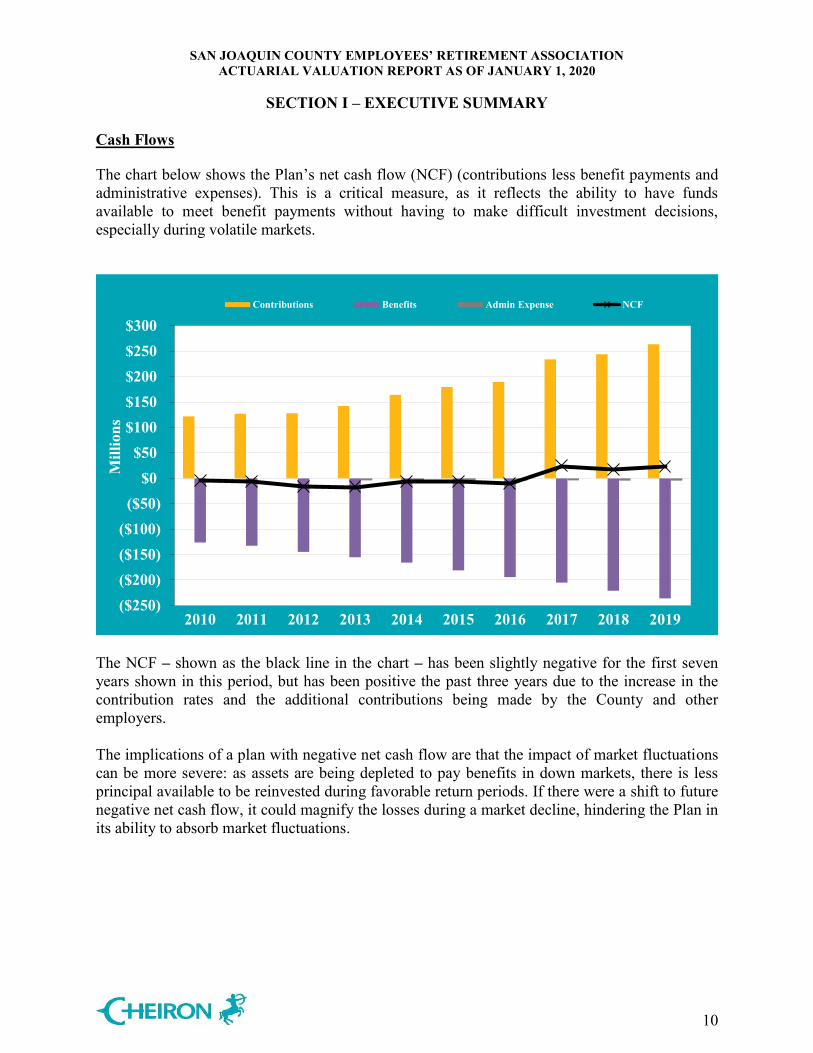
Cash Flows The chart below shows the Plan’s net cash flow (NCF) (contributions less benefit payments and administrative expenses). This is a critical measure, as it reflects the ability to have funds available to meet benefit payments without having to make difficult investment decisions, especially during volatile markets.
($250)($200)($150)($100)
($50)$0
$50$100$150$200$250$300
2010 2011 2012 2013 2014 2015 2016 2017 2018 2019
Mill
ions
Contributions Benefits Admin Expense NCF
The NCF – shown as the black line in the chart – has been slightly negative for the first seven years shown in this period, but has been positive the past three years due to the increase in the contribution rates and the additional contributions being made by the County and other employers. The implications of a plan with negative net cash flow are that the impact of market fluctuations can be more severe: as assets are being depleted to pay benefits in down markets, there is less principal available to be reinvested during favorable return periods. If there were a shift to future negative net cash flow, it could magnify the losses during a market decline, hindering the Plan in its ability to absorb market fluctuations.
SAN JOAQUIN COUNTY EMPLOYEES’ RETIREMENT ASSOCIATION ACTUARIAL VALUATION REPORT AS OF JANUARY 1, 2020
SECTION I – EXECUTIVE SUMMARY
11
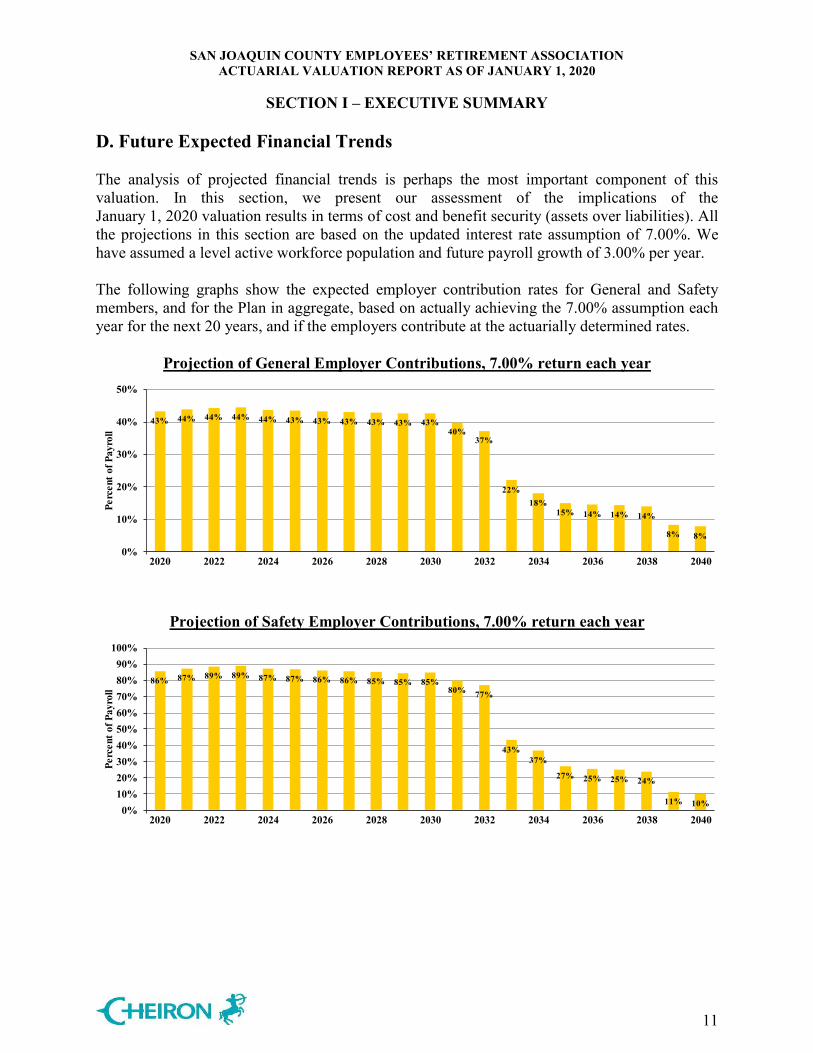
D. Future Expected Financial Trends The analysis of projected financial trends is perhaps the most important component of this valuation. In this section, we present our assessment of the implications of the January 1, 2020 valuation results in terms of cost and benefit security (assets over liabilities). All the projections in this section are based on the updated interest rate assumption of 7.00%. We have assumed a level active workforce population and future payroll growth of 3.00% per year. The following graphs show the expected employer contribution rates for General and Safety members, and for the Plan in aggregate, based on actually achieving the 7.00% assumption each year for the next 20 years, and if the employers contribute at the actuarially determined rates.
Projection of General Employer Contributions, 7.00% return each year
43% 44% 44% 44% 44% 43% 43% 43% 43% 43% 43%40%
37%
22%18%
15% 14% 14% 14%
8% 8%
0%
10%
20%
30%
40%
50%
2020 2022 2024 2026 2028 2030 2032 2034 2036 2038 2040
Perc
ent o
f Pay
roll
Projection of Safety Employer Contributions, 7.00% return each year
86% 87% 89% 89% 87% 87% 86% 86% 85% 85% 85%80% 77%
43%37%
27% 25% 25% 24%
11% 10%0%
10%20%30%40%50%60%70%80%90%
100%
2020 2022 2024 2026 2028 2030 2032 2034 2036 2038 2040
Perc
ent o
f Pay
roll
SAN JOAQUIN COUNTY EMPLOYEES’ RETIREMENT ASSOCIATION ACTUARIAL VALUATION REPORT AS OF JANUARY 1, 2020
SECTION I – EXECUTIVE SUMMARY
12
Projection of Total Employer Contributions, 7.00% return each year
50% 51% 51% 51% 50% 50% 50% 50% 49% 49% 49%46%
43%
25%21%
17% 16% 16% 16%
9% 8%0%
10%
20%
30%
40%
50%
60%
2020 2022 2024 2026 2028 2030 2032 2034 2036 2038 2040
Perc
ent o
f Pay
roll
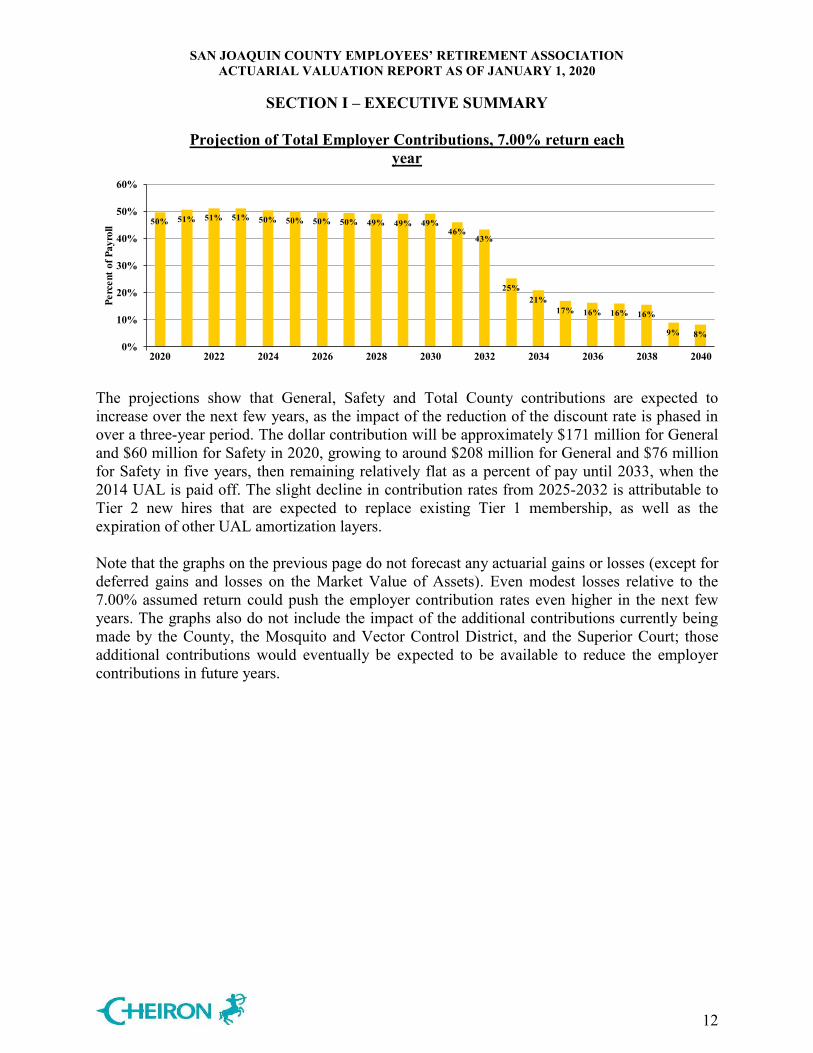
The projections show that General, Safety and Total County contributions are expected to increase over the next few years, as the impact of the reduction of the discount rate is phased in over a three-year period. The dollar contribution will be approximately $171 million for General and $60 million for Safety in 2020, growing to around $208 million for General and $76 million for Safety in five years, then remaining relatively flat as a percent of pay until 2033, when the 2014 UAL is paid off. The slight decline in contribution rates from 2025-2032 is attributable to Tier 2 new hires that are expected to replace existing Tier 1 membership, as well as the expiration of other UAL amortization layers. Note that the graphs on the previous page do not forecast any actuarial gains or losses (except for deferred gains and losses on the Market Value of Assets). Even modest losses relative to the 7.00% assumed return could push the employer contribution rates even higher in the next few years. The graphs also do not include the impact of the additional contributions currently being made by the County, the Mosquito and Vector Control District, and the Superior Court; those additional contributions would eventually be expected to be available to reduce the employer contributions in future years.
SAN JOAQUIN COUNTY EMPLOYEES’ RETIREMENT ASSOCIATION ACTUARIAL VALUATION REPORT AS OF JANUARY 1, 2020
SECTION I – EXECUTIVE SUMMARY
13
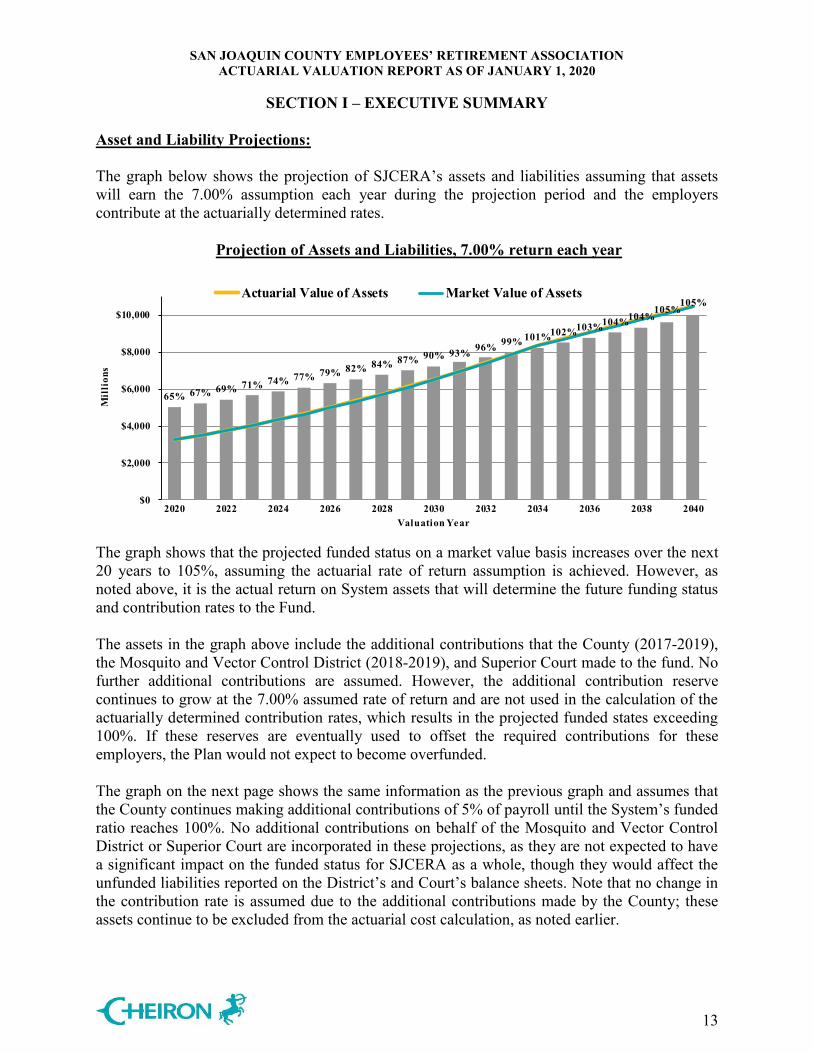
Asset and Liability Projections: The graph below shows the projection of SJCERA’s assets and liabilities assuming that assets will earn the 7.00% assumption each year during the projection period and the employers contribute at the actuarially determined rates.
Projection of Assets and Liabilities, 7.00% return each year
2020202120222023202420252026202720282029203020312032
65% 67% 69% 71% 74% 77% 79% 82% 84% 87% 90% 93% 96% 99% 101%102%103%104%104%105%
105%
$0
$2,000
$4,000
$6,000
$8,000
$10,000
2020 2022 2024 2026 2028 2030 2032 2034 2036 2038 2040
Mil
lion
s
Valuation Year
Actuarial Value of Assets Market Value of Assets
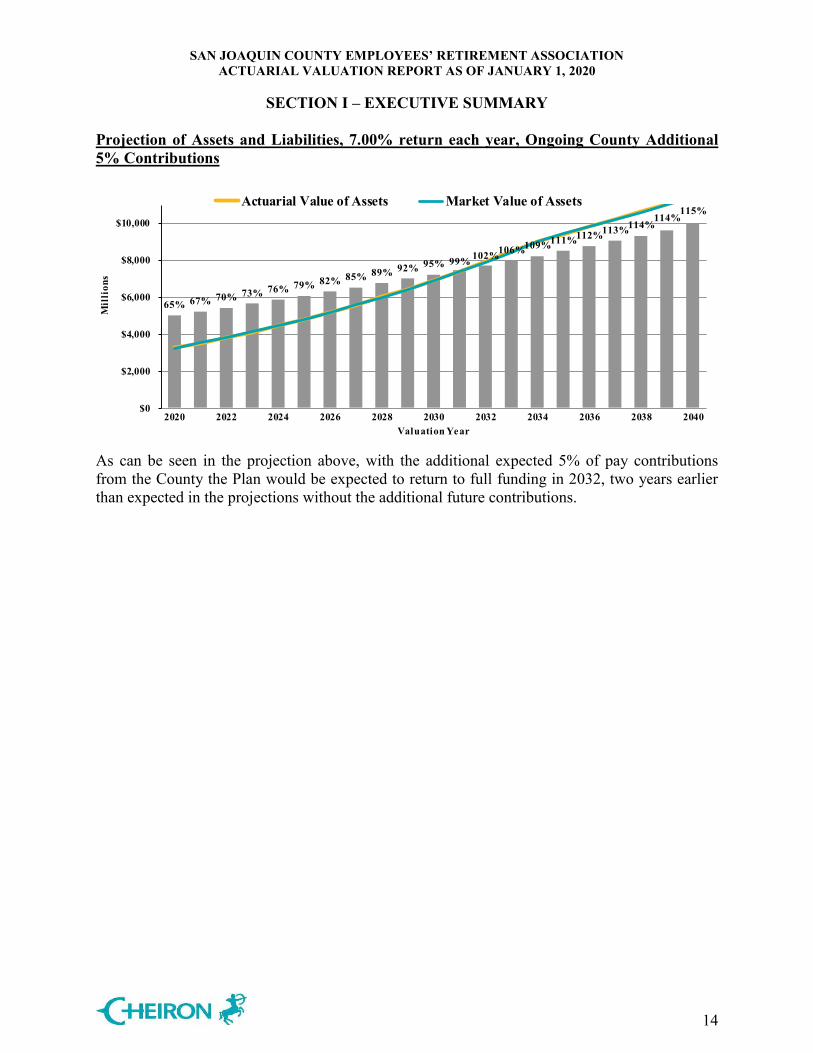
The graph shows that the projected funded status on a market value basis increases over the next 20 years to 105%, assuming the actuarial rate of return assumption is achieved. However, as noted above, it is the actual return on System assets that will determine the future funding status and contribution rates to the Fund. The assets in the graph above include the additional contributions that the County (2017-2019), the Mosquito and Vector Control District (2018-2019), and Superior Court made to the fund. No further additional contributions are assumed. However, the additional contribution reserve continues to grow at the 7.00% assumed rate of return and are not used in the calculation of the actuarially determined contribution rates, which results in the projected funded states exceeding 100%. If these reserves are eventually used to offset the required contributions for these employers, the Plan would not expect to become overfunded. The graph on the next page shows the same information as the previous graph and assumes that the County continues making additional contributions of 5% of payroll until the System’s funded ratio reaches 100%. No additional contributions on behalf of the Mosquito and Vector Control District or Superior Court are incorporated in these projections, as they are not expected to have a significant impact on the funded status for SJCERA as a whole, though they would affect the unfunded liabilities reported on the District’s and Court’s balance sheets. Note that no change in the contribution rate is assumed due to the additional contributions made by the County; these assets continue to be excluded from the actuarial cost calculation, as noted earlier.
SAN JOAQUIN COUNTY EMPLOYEES’ RETIREMENT ASSOCIATION ACTUARIAL VALUATION REPORT AS OF JANUARY 1, 2020
SECTION I – EXECUTIVE SUMMARY
14
Projection of Assets and Liabilities, 7.00% return each year, Ongoing County Additional 5% Contributions
2020202120222023202420252026202720282029203020312032
65% 67% 70% 73% 76% 79% 82% 85% 89% 92% 95% 99% 102%106%109%111%112%113%114%114%
115%
$0
$2,000
$4,000
$6,000
$8,000
$10,000
2020 2022 2024 2026 2028 2030 2032 2034 2036 2038 2040
Mil
lion
s
Valuation Year
Actuarial Value of Assets Market Value of Assets
As can be seen in the projection above, with the additional expected 5% of pay contributions from the County the Plan would be expected to return to full funding in 2032, two years earlier than expected in the projections without the additional future contributions.
SAN JOAQUIN COUNTY EMPLOYEES’ RETIREMENT ASSOCIATION ACTUARIAL VALUATION REPORT AS OF JANUARY 1, 2020
SECTION II – DISCLOSURES RELATED TO RISK
15
Actuarial valuations are based on a set of assumptions about future economic and demographic experience. These assumptions represent a reasonable estimate of future experience, but actual future experience will undoubtedly be different and may vary significantly. This section of the report is intended to identify the primary risks to the Plan, provide some background information about those risks, and provide an assessment of those risks. Identification of Risks A fundamental risk to a pension plan is that the contributions needed to pay the benefits become unaffordable. While we believe it is unlikely that the Plan by itself would become unaffordable, the contributions needed to support the Plan may differ significantly from expectations. While there are a number of factors that could lead to contribution amounts deviating from expectations, we believe the primary risks are:
Investment risk, Assumption change risk, and Contribution and payroll risk.
Other risks that we have not identified may also turn out to be important. Investment Risk is the potential for investment returns to be different than expected. Lower investment returns than anticipated will increase the unfunded actuarial liability necessitating higher contributions in the future unless there are other gains that offset these investment losses. The potential volatility of future investment returns is determined by the Plan’s asset allocation and the affordability of the investment risk is determined by the amount of assets invested relative to the size of the plan sponsors or other contribution base. Assumption change risk is the potential for the environment to change such that future valuation assumptions are different than the current assumptions. For example, declines in interest rates over the last three decades resulted in higher investment returns for fixed income investments, but lower expected future returns necessitating either a change in investment policy, a reduction in discount rate, or some combination of the two. Assumption change risk is an extension of the other risks identified, but rather than capturing the risk as it is experienced, it captures the cost of recognizing a change in environment when the current assumption is no longer reasonable. Contribution risk is the potential for actual future contributions to deviate from expected future contributions. There are different sources of contribution risk such as the sponsor choosing to not make contributions in accordance with the funding policy or if the contribution requirement becomes such a financial strain on the sponsor as a result of material changes in the contribution base (e.g., covered employees, covered payroll) that affect the amount of contributions the Plan can collect.
SAN JOAQUIN COUNTY EMPLOYEES’ RETIREMENT ASSOCIATION ACTUARIAL VALUATION REPORT AS OF JANUARY 1, 2020
SECTION II – DISCLOSURES RELATED TO RISK
16
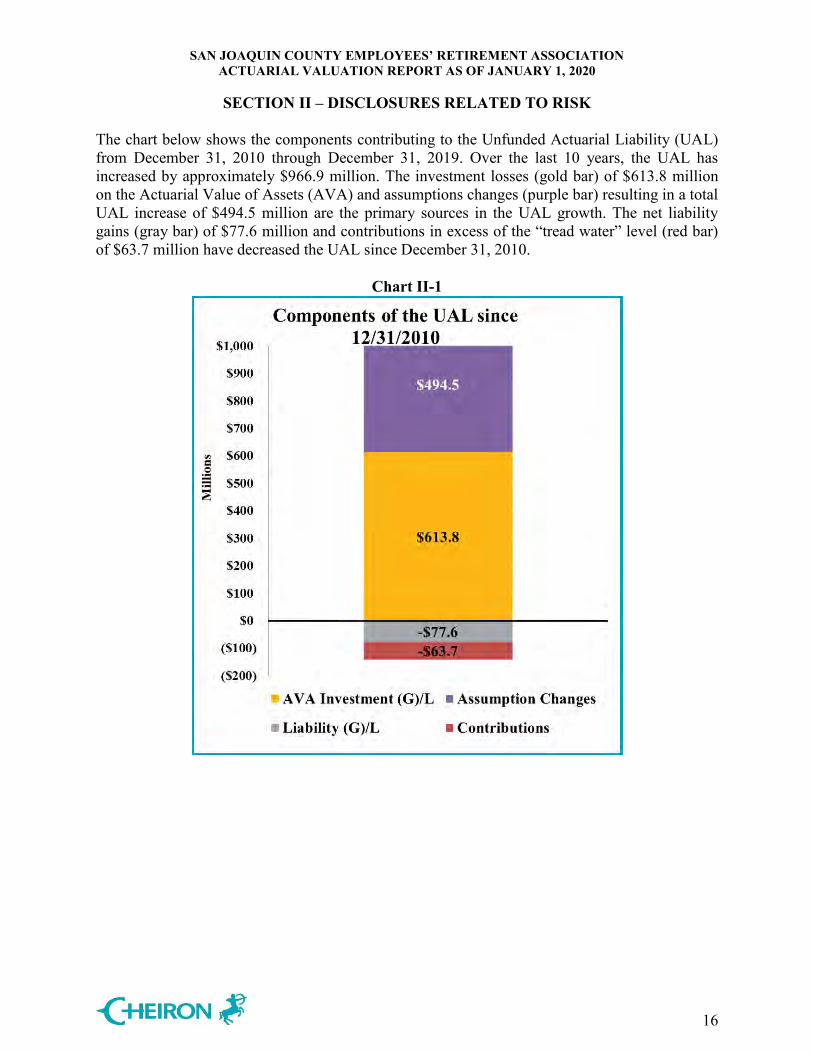
The chart below shows the components contributing to the Unfunded Actuarial Liability (UAL) from December 31, 2010 through December 31, 2019. Over the last 10 years, the UAL has increased by approximately $966.9 million. The investment losses (gold bar) of $613.8 million on the Actuarial Value of Assets (AVA) and assumptions changes (purple bar) resulting in a total UAL increase of $494.5 million are the primary sources in the UAL growth. The net liability gains (gray bar) of $77.6 million and contributions in excess of the “tread water” level (red bar) of $63.7 million have decreased the UAL since December 31, 2010.
Chart II-1
SAN JOAQUIN COUNTY EMPLOYEES’ RETIREMENT ASSOCIATION ACTUARIAL VALUATION REPORT AS OF JANUARY 1, 2020
SECTION II – DISCLOSURES RELATED TO RISK
17
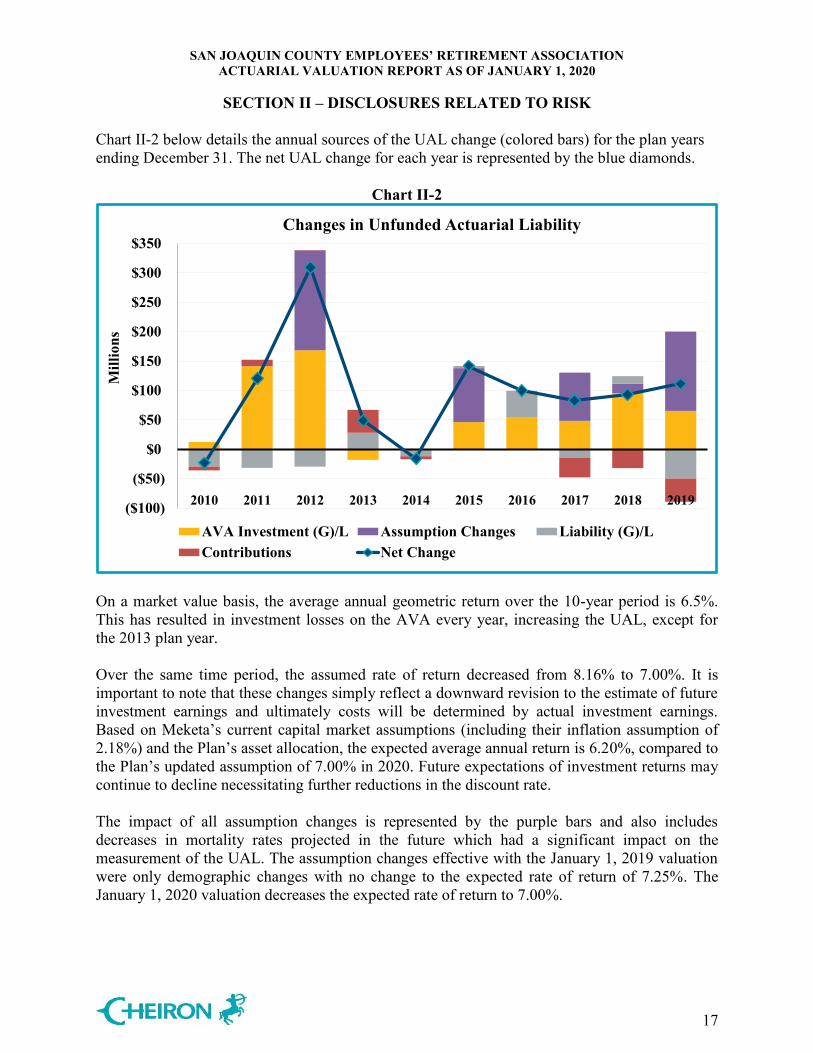
Chart II-2 below details the annual sources of the UAL change (colored bars) for the plan years ending December 31. The net UAL change for each year is represented by the blue diamonds.
Chart II-2
($100)
($50)
$0
$50
$100
$150
$200
$250
$300
$350
2010 2011 2012 2013 2014 2015 2016 2017 2018 2019
Mill
ions
Changes in Unfunded Actuarial Liability
AVA Investment (G)/L Assumption Changes Liability (G)/LContributions Net Change
On a market value basis, the average annual geometric return over the 10-year period is 6.5%. This has resulted in investment losses on the AVA every year, increasing the UAL, except for the 2013 plan year. Over the same time period, the assumed rate of return decreased from 8.16% to 7.00%. It is important to note that these changes simply reflect a downward revision to the estimate of future investment earnings and ultimately costs will be determined by actual investment earnings. Based on Meketa’s current capital market assumptions (including their inflation assumption of 2.18%) and the Plan’s asset allocation, the expected average annual return is 6.20%, compared to the Plan’s updated assumption of 7.00% in 2020. Future expectations of investment returns may continue to decline necessitating further reductions in the discount rate.
The impact of all assumption changes is represented by the purple bars and also includes decreases in mortality rates projected in the future which had a significant impact on the measurement of the UAL. The assumption changes effective with the January 1, 2019 valuation were only demographic changes with no change to the expected rate of return of 7.25%. The January 1, 2020 valuation decreases the expected rate of return to 7.00%.
SAN JOAQUIN COUNTY EMPLOYEES’ RETIREMENT ASSOCIATION ACTUARIAL VALUATION REPORT AS OF JANUARY 1, 2020
SECTION II – DISCLOSURES RELATED TO RISK
18
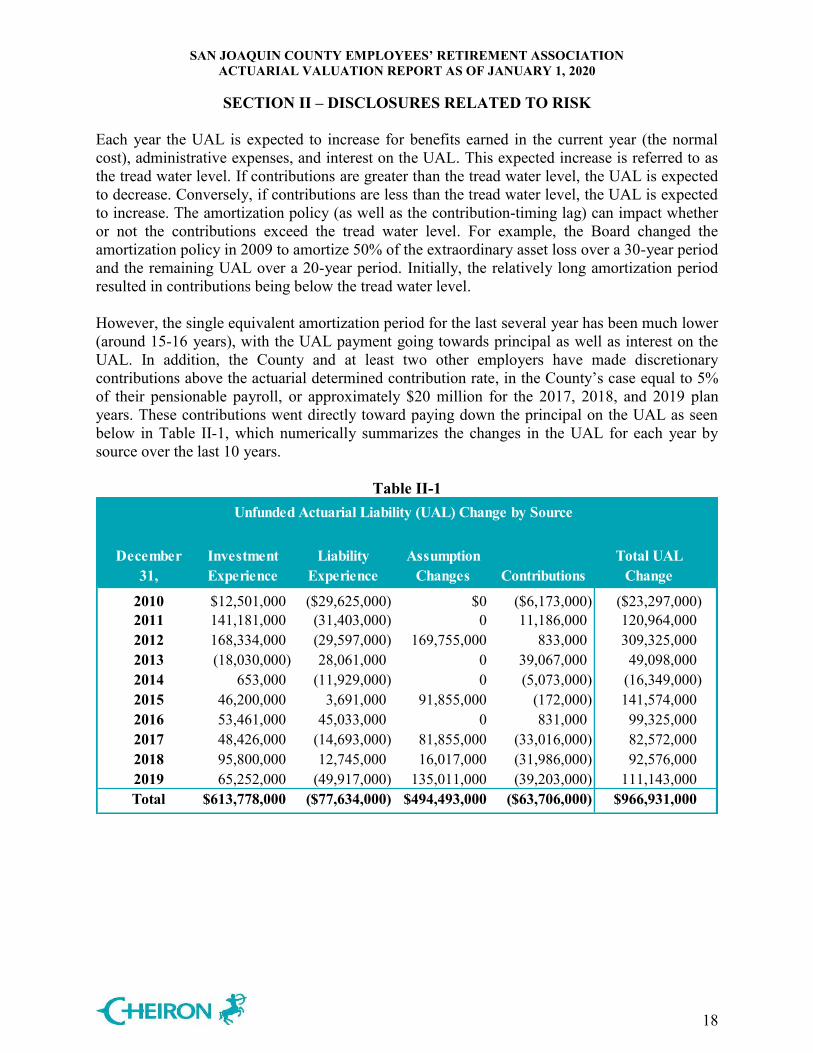
Each year the UAL is expected to increase for benefits earned in the current year (the normal cost), administrative expenses, and interest on the UAL. This expected increase is referred to as the tread water level. If contributions are greater than the tread water level, the UAL is expected to decrease. Conversely, if contributions are less than the tread water level, the UAL is expected to increase. The amortization policy (as well as the contribution-timing lag) can impact whether or not the contributions exceed the tread water level. For example, the Board changed the amortization policy in 2009 to amortize 50% of the extraordinary asset loss over a 30-year period and the remaining UAL over a 20-year period. Initially, the relatively long amortization period resulted in contributions being below the tread water level. However, the single equivalent amortization period for the last several year has been much lower (around 15-16 years), with the UAL payment going towards principal as well as interest on the UAL. In addition, the County and at least two other employers have made discretionary contributions above the actuarial determined contribution rate, in the County’s case equal to 5% of their pensionable payroll, or approximately $20 million for the 2017, 2018, and 2019 plan years. These contributions went directly toward paying down the principal on the UAL as seen below in Table II-1, which numerically summarizes the changes in the UAL for each year by source over the last 10 years.
Table II-1 Unfunded Actuarial Liability (UAL) Change by Source
December 31,
Investment Experience
Liability Experience
Assumption Changes Contributions
Total UAL Change
2010 $12,501,000 ($29,625,000) $0 ($6,173,000) ($23,297,000)2011 141,181,000 (31,403,000) 0 11,186,000 120,964,000 2012 168,334,000 (29,597,000) 169,755,000 833,000 309,325,000 2013 (18,030,000) 28,061,000 0 39,067,000 49,098,000 2014 653,000 (11,929,000) 0 (5,073,000) (16,349,000) 2015 46,200,000 3,691,000 91,855,000 (172,000) 141,574,000 2016 53,461,000 45,033,000 0 831,000 99,325,000 2017 48,426,000 (14,693,000) 81,855,000 (33,016,000) 82,572,000 2018 95,800,000 12,745,000 16,017,000 (31,986,000) 92,576,000 2019 65,252,000 (49,917,000) 135,011,000 (39,203,000) 111,143,000 Total $613,778,000 ($77,634,000) $494,493,000 ($63,706,000) $966,931,000
SAN JOAQUIN COUNTY EMPLOYEES’ RETIREMENT ASSOCIATION ACTUARIAL VALUATION REPORT AS OF JANUARY 1, 2020
SECTION II – DISCLOSURES RELATED TO RISK
19
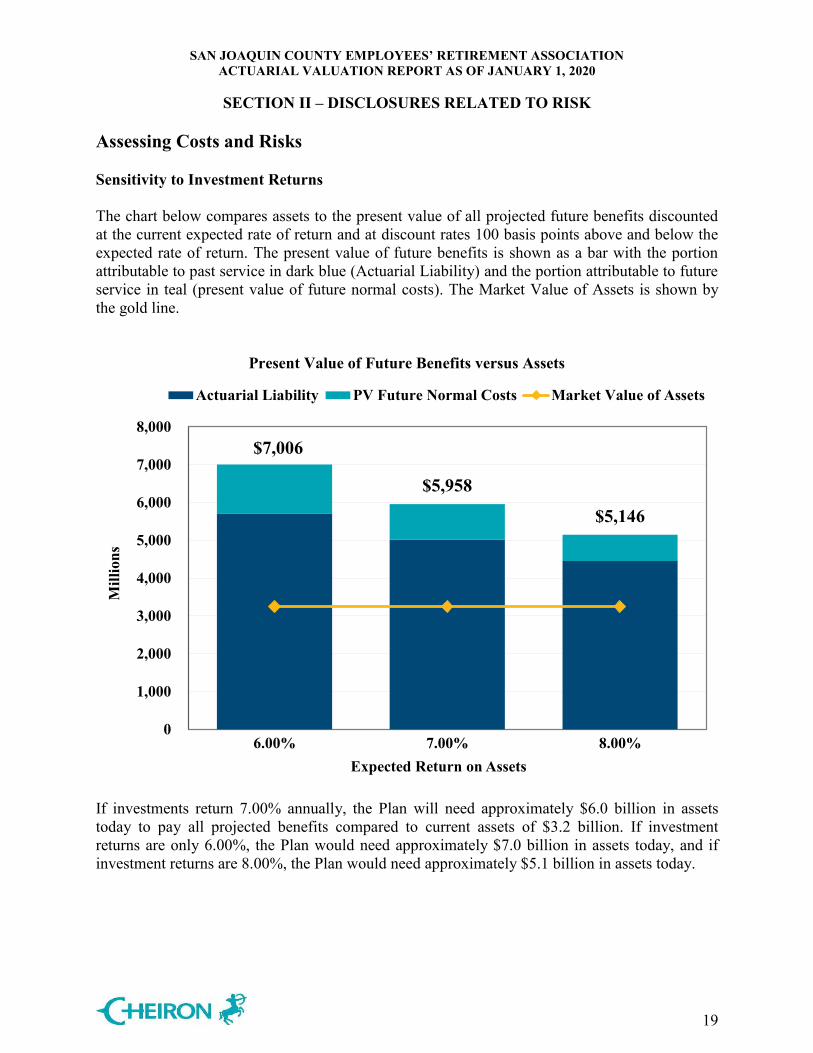
Assessing Costs and Risks Sensitivity to Investment Returns The chart below compares assets to the present value of all projected future benefits discounted at the current expected rate of return and at discount rates 100 basis points above and below the expected rate of return. The present value of future benefits is shown as a bar with the portion attributable to past service in dark blue (Actuarial Liability) and the portion attributable to future service in teal (present value of future normal costs). The Market Value of Assets is shown by the gold line.
Present Value of Future Benefits versus Assets
$7,006
$5,958
$5,146
0
1,000
2,000
3,000
4,000
5,000
6,000
7,000
8,000
6.00% 7.00% 8.00%
Mill
ions
Expected Return on Assets
Actuarial Liability PV Future Normal Costs Market Value of Assets
If investments return 7.00% annually, the Plan will need approximately $6.0 billion in assets today to pay all projected benefits compared to current assets of $3.2 billion. If investment returns are only 6.00%, the Plan would need approximately $7.0 billion in assets today, and if investment returns are 8.00%, the Plan would need approximately $5.1 billion in assets today.
SAN JOAQUIN COUNTY EMPLOYEES’ RETIREMENT ASSOCIATION ACTUARIAL VALUATION REPORT AS OF JANUARY 1, 2020
SECTION II – DISCLOSURES RELATED TO RISK
20
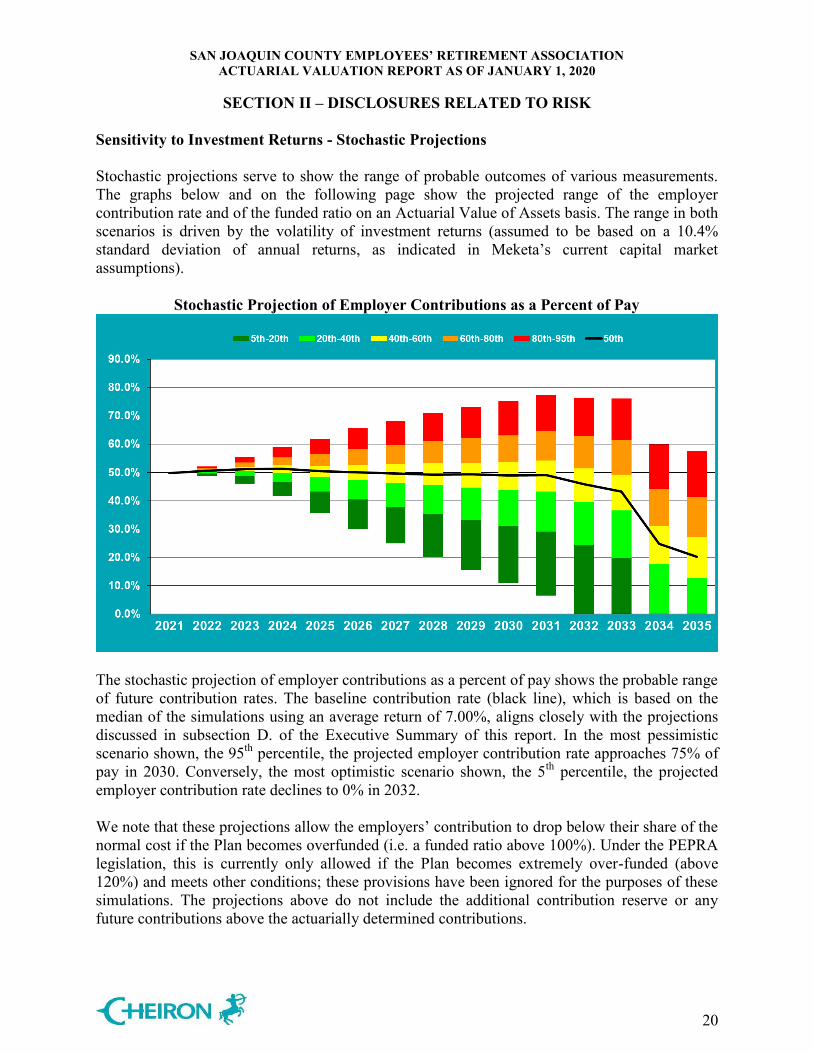
Sensitivity to Investment Returns - Stochastic Projections Stochastic projections serve to show the range of probable outcomes of various measurements. The graphs below and on the following page show the projected range of the employer contribution rate and of the funded ratio on an Actuarial Value of Assets basis. The range in both scenarios is driven by the volatility of investment returns (assumed to be based on a 10.4% standard deviation of annual returns, as indicated in Meketa’s current capital market assumptions).
Stochastic Projection of Employer Contributions as a Percent of Pay
The stochastic projection of employer contributions as a percent of pay shows the probable range of future contribution rates. The baseline contribution rate (black line), which is based on the median of the simulations using an average return of 7.00%, aligns closely with the projections discussed in subsection D. of the Executive Summary of this report. In the most pessimistic scenario shown, the 95th percentile, the projected employer contribution rate approaches 75% of pay in 2030. Conversely, the most optimistic scenario shown, the 5th percentile, the projected employer contribution rate declines to 0% in 2032. We note that these projections allow the employers’ contribution to drop below their share of the normal cost if the Plan becomes overfunded (i.e. a funded ratio above 100%). Under the PEPRA legislation, this is currently only allowed if the Plan becomes extremely over-funded (above 120%) and meets other conditions; these provisions have been ignored for the purposes of these simulations. The projections above do not include the additional contribution reserve or any future contributions above the actuarially determined contributions.
SAN JOAQUIN COUNTY EMPLOYEES’ RETIREMENT ASSOCIATION ACTUARIAL VALUATION REPORT AS OF JANUARY 1, 2020
SECTION II – DISCLOSURES RELATED TO RISK
21
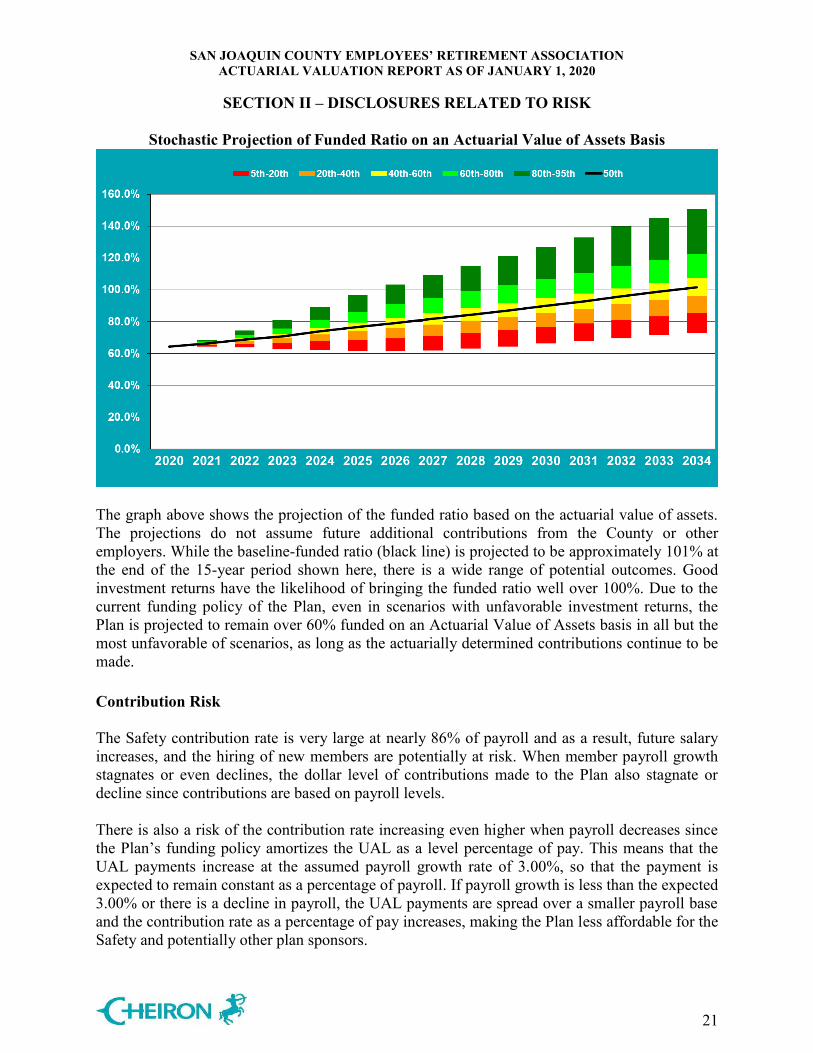
Stochastic Projection of Funded Ratio on an Actuarial Value of Assets Basis
The graph above shows the projection of the funded ratio based on the actuarial value of assets. The projections do not assume future additional contributions from the County or other employers. While the baseline-funded ratio (black line) is projected to be approximately 101% at the end of the 15-year period shown here, there is a wide range of potential outcomes. Good investment returns have the likelihood of bringing the funded ratio well over 100%. Due to the current funding policy of the Plan, even in scenarios with unfavorable investment returns, the Plan is projected to remain over 60% funded on an Actuarial Value of Assets basis in all but the most unfavorable of scenarios, as long as the actuarially determined contributions continue to be made. Contribution Risk The Safety contribution rate is very large at nearly 86% of payroll and as a result, future salary increases, and the hiring of new members are potentially at risk. When member payroll growth stagnates or even declines, the dollar level of contributions made to the Plan also stagnate or decline since contributions are based on payroll levels. There is also a risk of the contribution rate increasing even higher when payroll decreases since the Plan’s funding policy amortizes the UAL as a level percentage of pay. This means that the UAL payments increase at the assumed payroll growth rate of 3.00%, so that the payment is expected to remain constant as a percentage of payroll. If payroll growth is less than the expected 3.00% or there is a decline in payroll, the UAL payments are spread over a smaller payroll base and the contribution rate as a percentage of pay increases, making the Plan less affordable for the Safety and potentially other plan sponsors.
SAN JOAQUIN COUNTY EMPLOYEES’ RETIREMENT ASSOCIATION ACTUARIAL VALUATION REPORT AS OF JANUARY 1, 2020
SECTION II – DISCLOSURES RELATED TO RISK
22
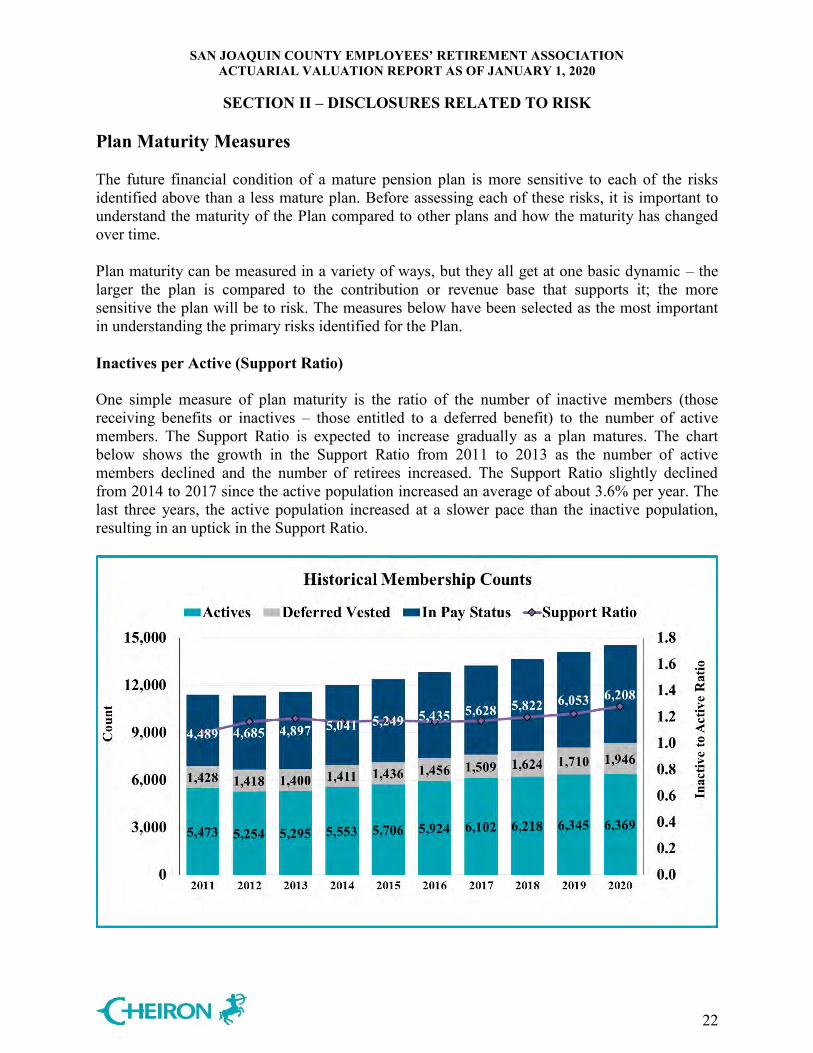
Plan Maturity Measures The future financial condition of a mature pension plan is more sensitive to each of the risks identified above than a less mature plan. Before assessing each of these risks, it is important to understand the maturity of the Plan compared to other plans and how the maturity has changed over time. Plan maturity can be measured in a variety of ways, but they all get at one basic dynamic – the larger the plan is compared to the contribution or revenue base that supports it; the more sensitive the plan will be to risk. The measures below have been selected as the most important in understanding the primary risks identified for the Plan. Inactives per Active (Support Ratio) One simple measure of plan maturity is the ratio of the number of inactive members (those receiving benefits or inactives – those entitled to a deferred benefit) to the number of active members. The Support Ratio is expected to increase gradually as a plan matures. The chart below shows the growth in the Support Ratio from 2011 to 2013 as the number of active members declined and the number of retirees increased. The Support Ratio slightly declined from 2014 to 2017 since the active population increased an average of about 3.6% per year. The last three years, the active population increased at a slower pace than the inactive population, resulting in an uptick in the Support Ratio.
SAN JOAQUIN COUNTY EMPLOYEES’ RETIREMENT ASSOCIATION ACTUARIAL VALUATION REPORT AS OF JANUARY 1, 2020
SECTION II – DISCLOSURES RELATED TO RISK
23
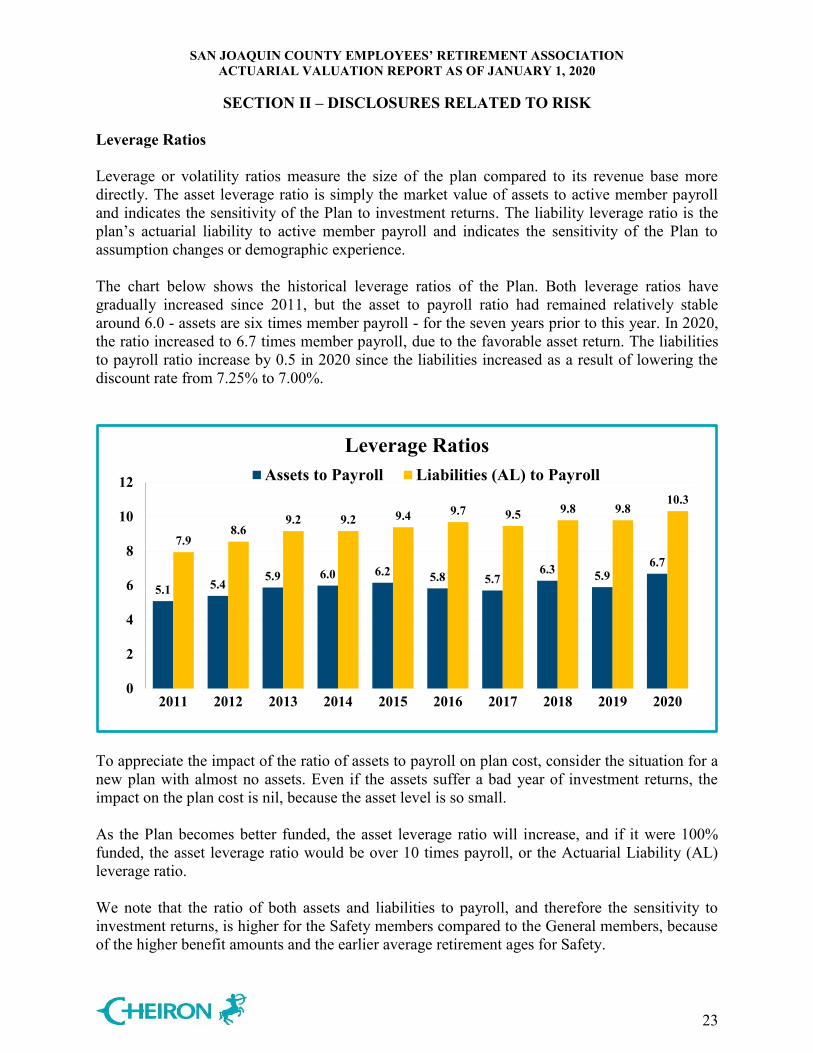
Leverage Ratios Leverage or volatility ratios measure the size of the plan compared to its revenue base more directly. The asset leverage ratio is simply the market value of assets to active member payroll and indicates the sensitivity of the Plan to investment returns. The liability leverage ratio is the plan’s actuarial liability to active member payroll and indicates the sensitivity of the Plan to assumption changes or demographic experience. The chart below shows the historical leverage ratios of the Plan. Both leverage ratios have gradually increased since 2011, but the asset to payroll ratio had remained relatively stable around 6.0 - assets are six times member payroll - for the seven years prior to this year. In 2020, the ratio increased to 6.7 times member payroll, due to the favorable asset return. The liabilities to payroll ratio increase by 0.5 in 2020 since the liabilities increased as a result of lowering the discount rate from 7.25% to 7.00%.
5.1 5.45.9 6.0 6.2 5.8 5.7
6.3 5.96.7
7.98.6
9.2 9.2 9.4 9.7 9.5 9.8 9.810.3
0
2
4
6
8
10
12
2011 2012 2013 2014 2015 2016 2017 2018 2019 2020
Leverage RatiosAssets to Payroll Liabilities (AL) to Payroll
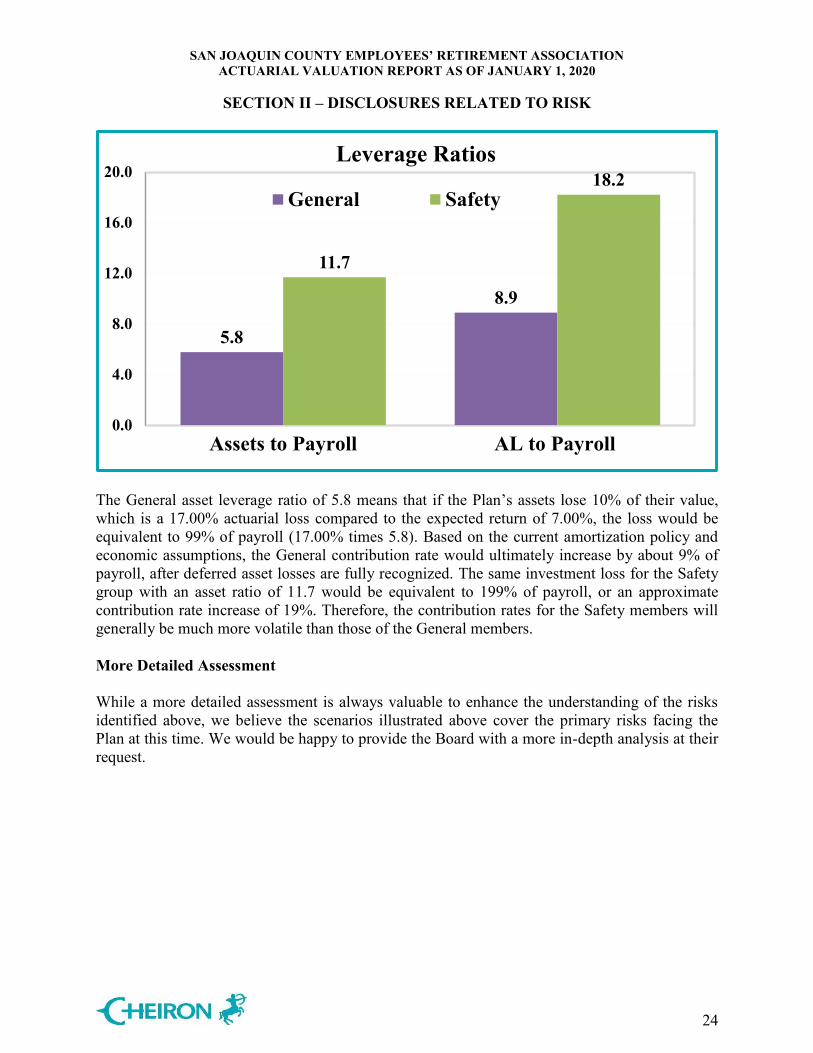
To appreciate the impact of the ratio of assets to payroll on plan cost, consider the situation for a new plan with almost no assets. Even if the assets suffer a bad year of investment returns, the impact on the plan cost is nil, because the asset level is so small. As the Plan becomes better funded, the asset leverage ratio will increase, and if it were 100% funded, the asset leverage ratio would be over 10 times payroll, or the Actuarial Liability (AL) leverage ratio. We note that the ratio of both assets and liabilities to payroll, and therefore the sensitivity to investment returns, is higher for the Safety members compared to the General members, because of the higher benefit amounts and the earlier average retirement ages for Safety.
SAN JOAQUIN COUNTY EMPLOYEES’ RETIREMENT ASSOCIATION ACTUARIAL VALUATION REPORT AS OF JANUARY 1, 2020
SECTION II – DISCLOSURES RELATED TO RISK
24
5.8
8.9
11.7
18.2
0.0
4.0
8.0
12.0
16.0
20.0
Assets to Payroll AL to Payroll
Leverage Ratios
General Safety
The General asset leverage ratio of 5.8 means that if the Plan’s assets lose 10% of their value, which is a 17.00% actuarial loss compared to the expected return of 7.00%, the loss would be equivalent to 99% of payroll (17.00% times 5.8). Based on the current amortization policy and economic assumptions, the General contribution rate would ultimately increase by about 9% of payroll, after deferred asset losses are fully recognized. The same investment loss for the Safety group with an asset ratio of 11.7 would be equivalent to 199% of payroll, or an approximate contribution rate increase of 19%. Therefore, the contribution rates for the Safety members will generally be much more volatile than those of the General members. More Detailed Assessment While a more detailed assessment is always valuable to enhance the understanding of the risks identified above, we believe the scenarios illustrated above cover the primary risks facing the Plan at this time. We would be happy to provide the Board with a more in-depth analysis at their request.
SAN JOAQUIN COUNTY EMPLOYEES’ RETIREMENT ASSOCIATION ACTUARIAL VALUATION REPORT AS OF JANUARY 1, 2020
SECTION III – ASSETS
25
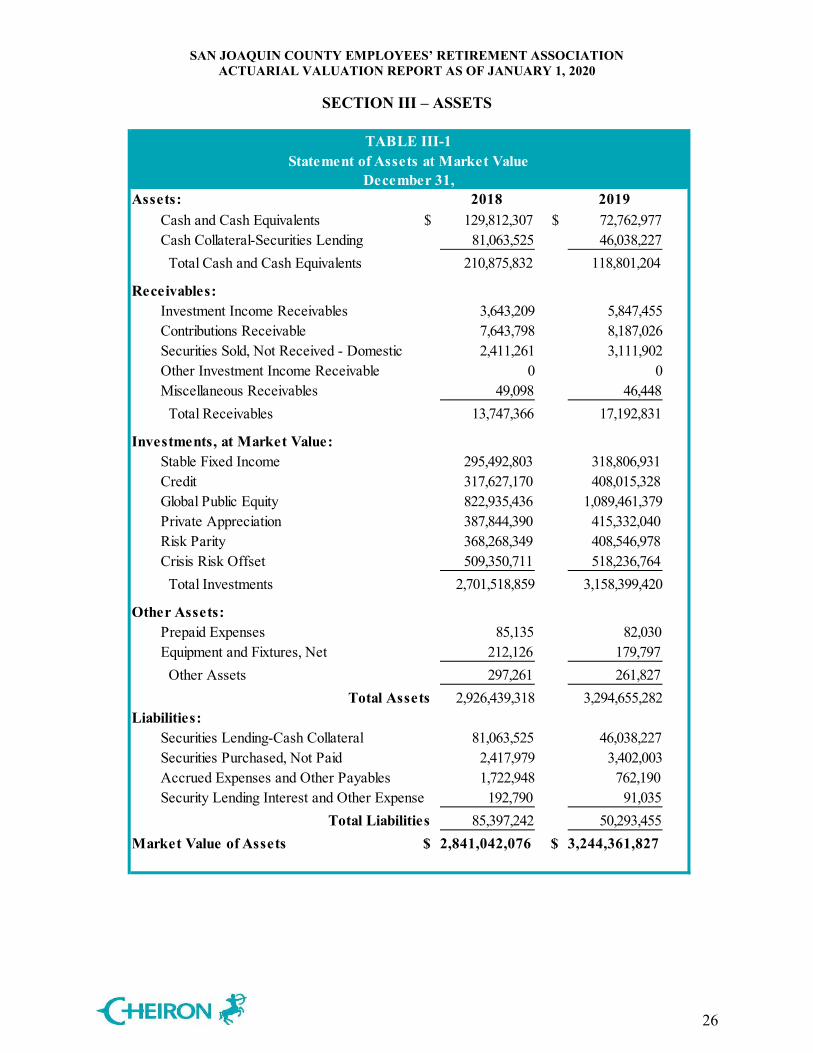
Pension Plan assets play a key role in the financial operation of the System and in the decisions the Board may make with respect to future deployment of those assets. The level of assets, the allocation of assets among asset classes, and the methodology used to measure assets will likely impact benefit levels, employer contributions, and the ultimate security of participants’ benefits. In this section, we present detailed information on System assets including:
Disclosure of System assets as of December 31, 2018 and December 31, 2019, Statement of the changes in market values during the year, Development of the Actuarial Value of Assets, An assessment of investment performance, and Determination of reserve balances as of January 1, 2020.
Disclosure There are two types of asset values disclosed in the valuation, the Market Value of Assets, and the Actuarial Value of Assets. The market value represents the fair value of assets that provide the principal basis for measuring financial performance from one year to the next. Market values, however, can fluctuate widely with corresponding swings in the marketplace. As a result, market values are usually not as suitable for long-range planning as are the Actuarial Value of Assets, which reflect smoothing of annual investment returns. Table III-1 on the next page discloses and compares the market values as of December 31, 2018 and December 31, 2019.
SAN JOAQUIN COUNTY EMPLOYEES’ RETIREMENT ASSOCIATION ACTUARIAL VALUATION REPORT AS OF JANUARY 1, 2020
SECTION III – ASSETS
26
2018 2019Cash and Cash Equivalents $ 129,812,307 $ 72,762,977 Cash Collateral-Securities Lending 81,063,525 46,038,227 Total Cash and Cash Equivalents 210,875,832 118,801,204
Receivables:Investment Income Receivables 3,643,209 5,847,455 Contributions Receivable 7,643,798 8,187,026 Securities Sold, Not Received - Domestic 2,411,261 3,111,902 Other Investment Income Receivable 0 0 Miscellaneous Receivables 49,098 46,448 Total Receivables 13,747,366 17,192,831
Investments, at Market Value:Stable Fixed Income 295,492,803 318,806,931 Credit 317,627,170 408,015,328 Global Public Equity 822,935,436 1,089,461,379 Private Appreciation 387,844,390 415,332,040 Risk Parity 368,268,349 408,546,978 Crisis Risk Offset 509,350,711 518,236,764 Total Investments 2,701,518,859 3,158,399,420
Other Assets:Prepaid Expenses 85,135 82,030 Equipment and Fixtures, Net 212,126 179,797 Other Assets 297,261 261,827
Total Assets 2,926,439,318 3,294,655,282 Liabilities:
Securities Lending-Cash Collateral 81,063,525 46,038,227 Securities Purchased, Not Paid 2,417,979 3,402,003 Accrued Expenses and Other Payables 1,722,948 762,190 Security Lending Interest and Other Expense 192,790 91,035
Total Liabilities 85,397,242 50,293,455 $ 2,841,042,076 $ 3,244,361,827
TABLE III-1Statement of Assets at Market Value
December 31,
Market Value of Assets
Assets:
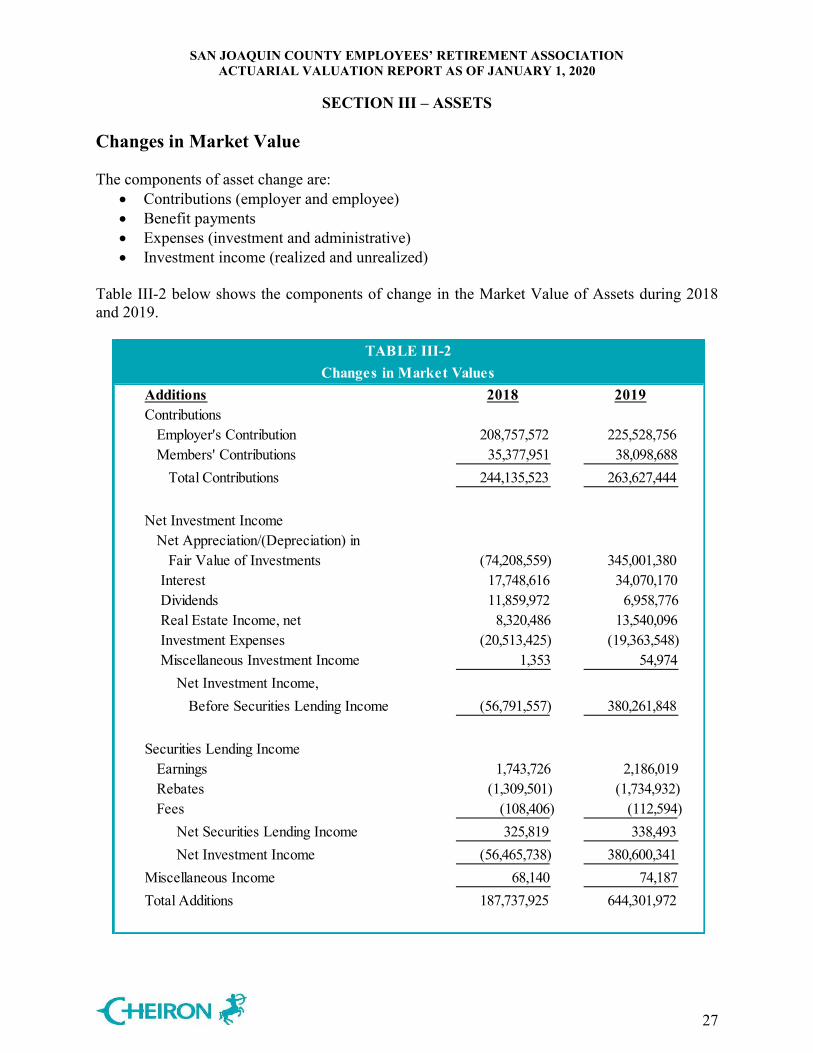
SAN JOAQUIN COUNTY EMPLOYEES’ RETIREMENT ASSOCIATION ACTUARIAL VALUATION REPORT AS OF JANUARY 1, 2020
SECTION III – ASSETS
27
Changes in Market Value The components of asset change are:
Contributions (employer and employee) Benefit payments Expenses (investment and administrative) Investment income (realized and unrealized)
Table III-2 below shows the components of change in the Market Value of Assets during 2018 and 2019.
Additions 2018 2019Contributions Employer's Contribution 208,757,572 225,528,756 Members' Contributions 35,377,951 38,098,688 Total Contributions 244,135,523 263,627,444
Net Investment Income Net Appreciation/(Depreciation) in Fair Value of Investments (74,208,559) 345,001,380 Interest 17,748,616 34,070,170 Dividends 11,859,972 6,958,776 Real Estate Income, net 8,320,486 13,540,096 Investment Expenses (20,513,425) (19,363,548) Miscellaneous Investment Income 1,353 54,974 Net Investment Income, Before Securities Lending Income (56,791,557) 380,261,848 Securities Lending Income Earnings 1,743,726 2,186,019 Rebates (1,309,501) (1,734,932) Fees (108,406) (112,594) Net Securities Lending Income 325,819 338,493 Net Investment Income (56,465,738) 380,600,341 Miscellaneous Income 68,140 74,187 Total Additions 187,737,925 644,301,972
TABLE III-2Changes in Market Values
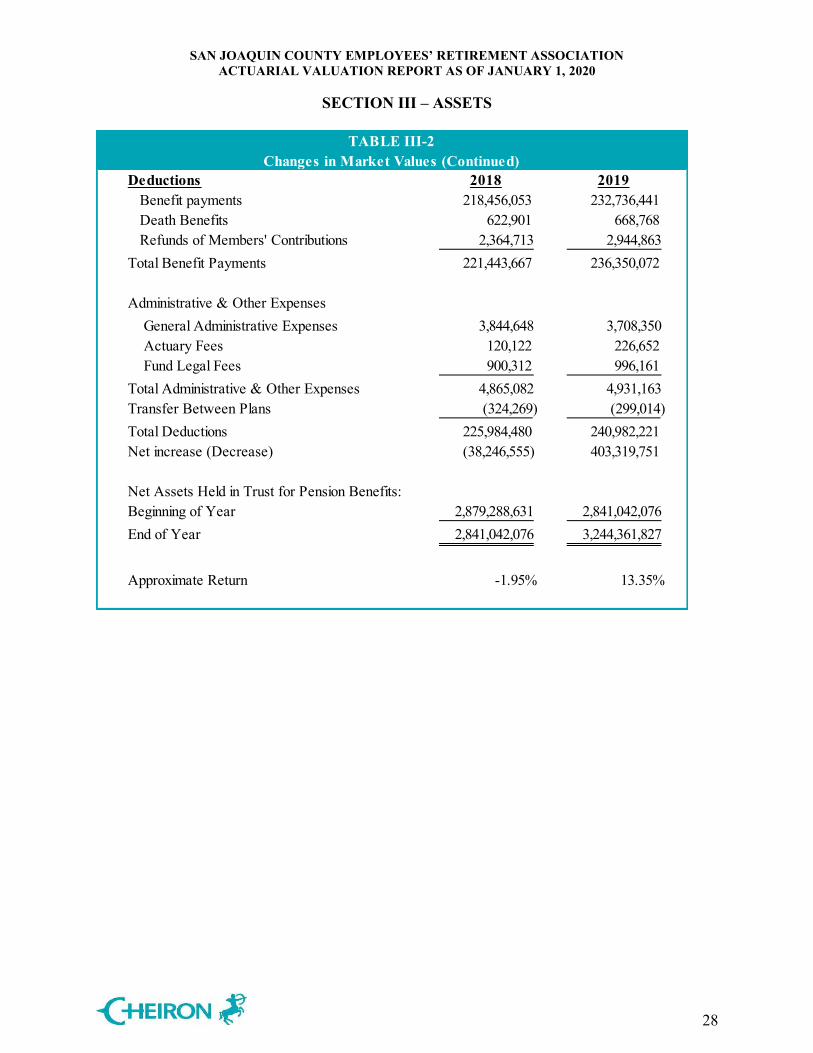
SAN JOAQUIN COUNTY EMPLOYEES’ RETIREMENT ASSOCIATION ACTUARIAL VALUATION REPORT AS OF JANUARY 1, 2020
SECTION III – ASSETS
28
Deductions 2018 2019 Benefit payments 218,456,053 232,736,441 Death Benefits 622,901 668,768 Refunds of Members' Contributions 2,364,713 2,944,863 Total Benefit Payments 221,443,667 236,350,072
Administrative & Other Expenses General Administrative Expenses 3,844,648 3,708,350 Actuary Fees 120,122 226,652 Fund Legal Fees 900,312 996,161 Total Administrative & Other Expenses 4,865,082 4,931,163 Transfer Between Plans (324,269) (299,014)Total Deductions 225,984,480 240,982,221 Net increase (Decrease) (38,246,555) 403,319,751
Net Assets Held in Trust for Pension Benefits:Beginning of Year 2,879,288,631 2,841,042,076 End of Year 2,841,042,076 3,244,361,827
Approximate Return -1.95% 13.35%
TABLE III-2Changes in Market Values (Continued)
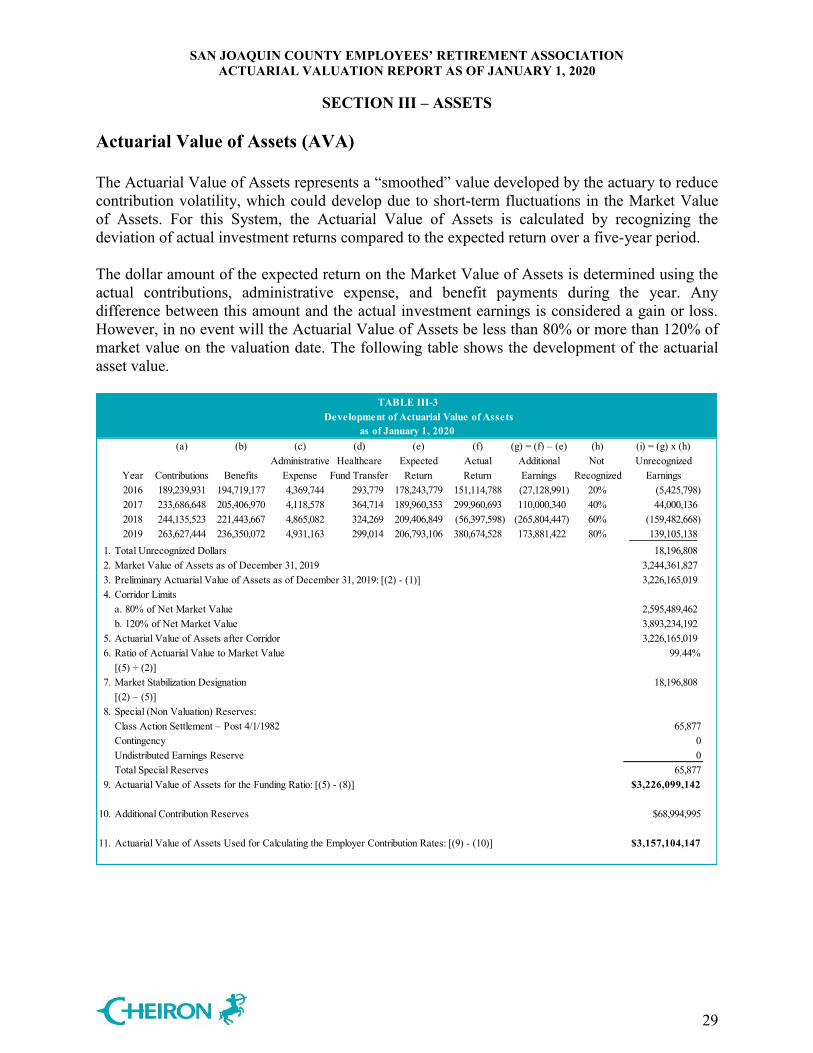
SAN JOAQUIN COUNTY EMPLOYEES’ RETIREMENT ASSOCIATION ACTUARIAL VALUATION REPORT AS OF JANUARY 1, 2020
SECTION III – ASSETS
29
Actuarial Value of Assets (AVA) The Actuarial Value of Assets represents a “smoothed” value developed by the actuary to reduce contribution volatility, which could develop due to short-term fluctuations in the Market Value of Assets. For this System, the Actuarial Value of Assets is calculated by recognizing the deviation of actual investment returns compared to the expected return over a five-year period. The dollar amount of the expected return on the Market Value of Assets is determined using the actual contributions, administrative expense, and benefit payments during the year. Any difference between this amount and the actual investment earnings is considered a gain or loss. However, in no event will the Actuarial Value of Assets be less than 80% or more than 120% of market value on the valuation date. The following table shows the development of the actuarial asset value.
TABLE III-3 Development of Actuarial Value of Assets
as of January 1, 2020(a) (b) (c) (d) (e) (f) (g) = (f) – (e) (h) (i) = (g) x (h)
Administrative Healthcare Expected Actual Additional Not UnrecognizedYear Contributions Benefits Expense Fund Transfer Return Return Earnings Recognized Earnings2016 189,239,931 194,719,177 4,369,744 293,779 178,243,779 151,114,788 (27,128,991) 20% (5,425,798) 2017 233,686,648 205,406,970 4,118,578 364,714 189,960,353 299,960,693 110,000,340 40% 44,000,136 2018 244,135,523 221,443,667 4,865,082 324,269 209,406,849 (56,397,598) (265,804,447) 60% (159,482,668) 2019 263,627,444 236,350,072 4,931,163 299,014 206,793,106 380,674,528 173,881,422 80% 139,105,138
1. Total Unrecognized Dollars 18,196,808 2. Market Value of Assets as of December 31, 2019 3,244,361,827 3. Preliminary Actuarial Value of Assets as of December 31, 2019: [(2) - (1)] 3,226,165,019 4. Corridor Limits
a. 80% of Net Market Value 2,595,489,462 b. 120% of Net Market Value 3,893,234,192
5. Actuarial Value of Assets after Corridor 3,226,165,019 6. Ratio of Actuarial Value to Market Value 99.44%
[(5) ÷ (2)]7. Market Stabilization Designation 18,196,808
[(2) – (5)]8. Special (Non Valuation) Reserves:
Class Action Settlement – Post 4/1/1982 65,877Contingency 0Undistributed Earnings Reserve 0Total Special Reserves 65,877
9. Actuarial Value of Assets for the Funding Ratio: [(5) - (8)] $3,226,099,142
10. Additional Contribution Reserves $68,994,995
11. Actuarial Value of Assets Used for Calculating the Employer Contribution Rates: [(9) - (10)] $3,157,104,147
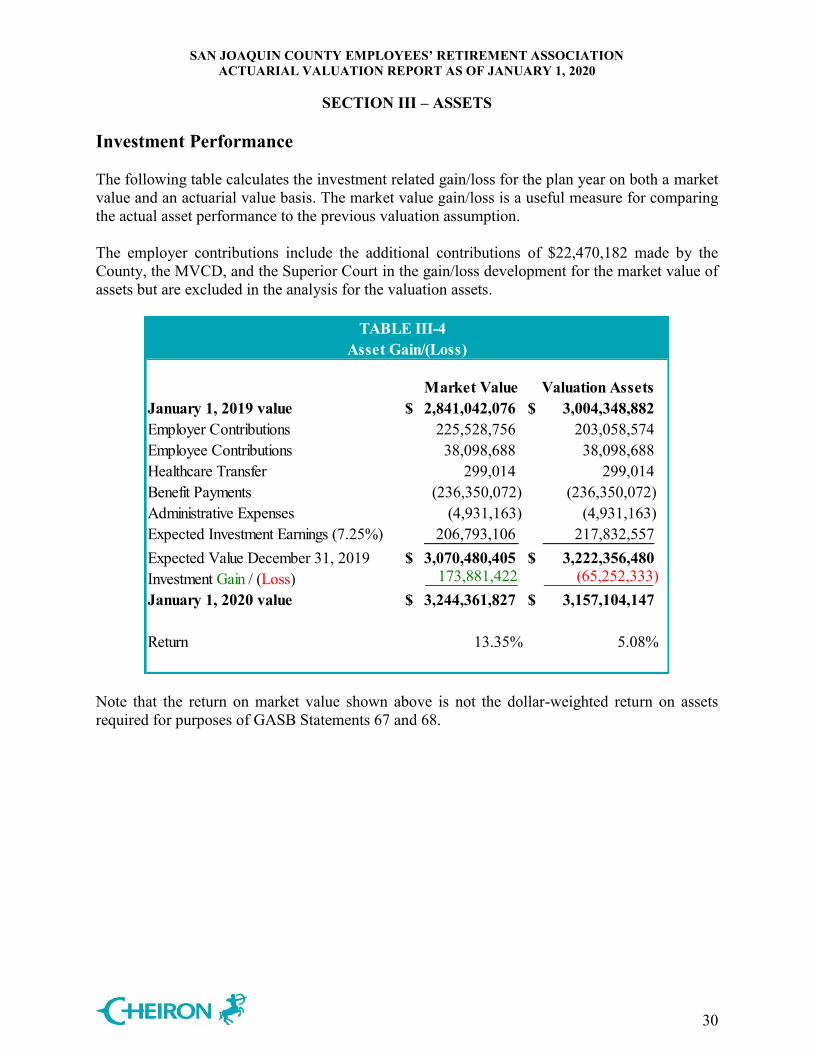
SAN JOAQUIN COUNTY EMPLOYEES’ RETIREMENT ASSOCIATION ACTUARIAL VALUATION REPORT AS OF JANUARY 1, 2020
SECTION III – ASSETS
30
Investment Performance The following table calculates the investment related gain/loss for the plan year on both a market value and an actuarial value basis. The market value gain/loss is a useful measure for comparing the actual asset performance to the previous valuation assumption. The employer contributions include the additional contributions of $22,470,182 made by the County, the MVCD, and the Superior Court in the gain/loss development for the market value of assets but are excluded in the analysis for the valuation assets.
Asset Gain/(Loss)
Market Value Valuation Assets January 1, 2019 value $ 2,841,042,076 $ 3,004,348,882 Employer Contributions 225,528,756 203,058,574 Employee Contributions 38,098,688 38,098,688 Healthcare Transfer 299,014 299,014 Benefit Payments (236,350,072) (236,350,072)Administrative Expenses (4,931,163) (4,931,163)Expected Investment Earnings (7.25%) 206,793,106 217,832,557 Expected Value December 31, 2019 $ 3,070,480,405 $ 3,222,356,480 Investment Gain / (Loss) 173,881,422 (65,252,333) January 1, 2020 value $ 3,244,361,827 $ 3,157,104,147
Return 13.35% 5.08%
TABLE III-4
Note that the return on market value shown above is not the dollar-weighted return on assets required for purposes of GASB Statements 67 and 68.
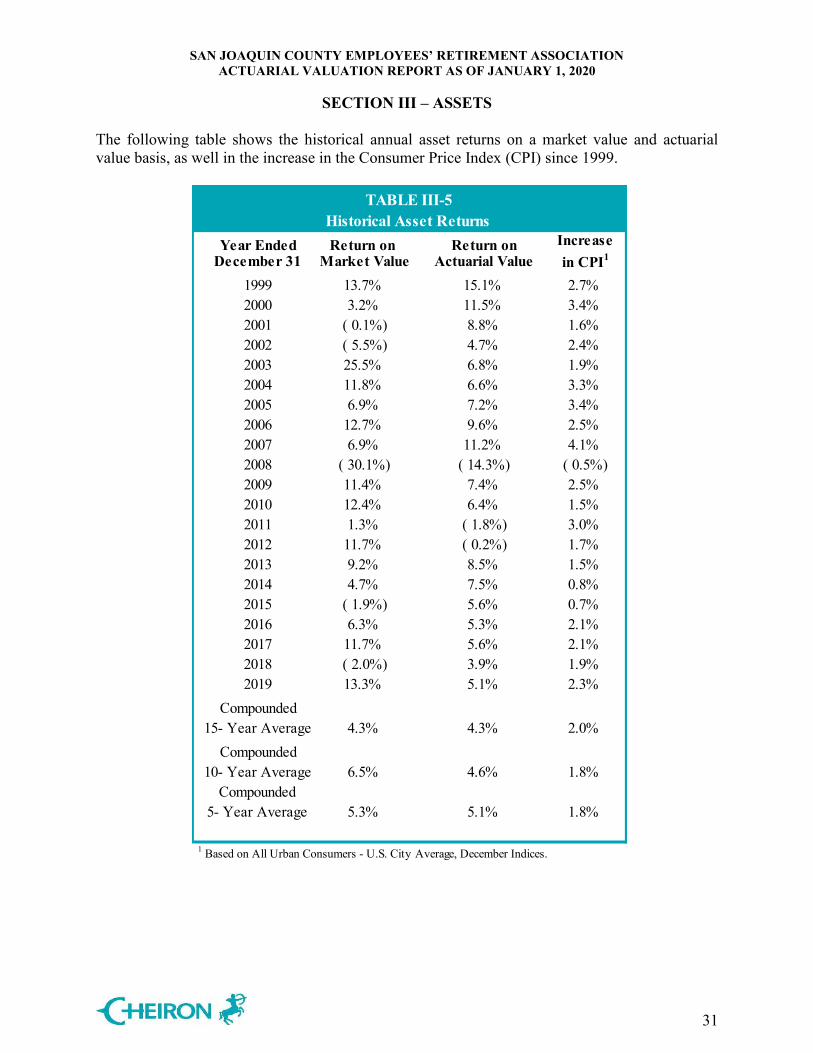
SAN JOAQUIN COUNTY EMPLOYEES’ RETIREMENT ASSOCIATION ACTUARIAL VALUATION REPORT AS OF JANUARY 1, 2020
SECTION III – ASSETS
31
The following table shows the historical annual asset returns on a market value and actuarial value basis, as well in the increase in the Consumer Price Index (CPI) since 1999.
Historical Asset ReturnsYear Ended Return on Return on
December 31 Market Value Actuarial Value1999 13.7% 15.1% 2.7% 2000 3.2% 11.5% 3.4% 2001 ( 0.1%) 8.8% 1.6% 2002 ( 5.5%) 4.7% 2.4% 2003 25.5% 6.8% 1.9% 2004 11.8% 6.6% 3.3% 2005 6.9% 7.2% 3.4% 2006 12.7% 9.6% 2.5% 2007 6.9% 11.2% 4.1% 2008 ( 30.1%) ( 14.3%) ( 0.5%)2009 11.4% 7.4% 2.5% 2010 12.4% 6.4% 1.5% 2011 1.3% ( 1.8%) 3.0% 2012 11.7% ( 0.2%) 1.7% 2013 9.2% 8.5% 1.5% 2014 4.7% 7.5% 0.8% 2015 ( 1.9%) 5.6% 0.7% 2016 6.3% 5.3% 2.1% 2017 11.7% 5.6% 2.1% 2018 ( 2.0%) 3.9% 1.9% 2019 13.3% 5.1% 2.3%
Compounded 15- Year Average 4.3% 4.3% 2.0%
Compounded 10- Year Average 6.5% 4.6% 1.8%
Compounded 5- Year Average 5.3% 5.1% 1.8%
1 Based on All Urban Consumers - U.S. City Average, December Indices.
Increase in CPI1
TABLE III-5

SAN JOAQUIN COUNTY EMPLOYEES’ RETIREMENT ASSOCIATION ACTUARIAL VALUATION REPORT AS OF JANUARY 1, 2020
SECTION III – ASSETS
32
Reserve Balances The following table shows historical balances of the Post-1982 Settlement Reserve.
Valuation Date Number Estimated YearsJanuary 1 Eligible Benefits Payable Reserve of Payments
2008 1,896 3,683,939 25,872,222 132009 1,856 3,602,904 22,015,055 102010 1,800 3,484,762 20,090,654 92011 1,738 3,370,636 18,108,660 62012 1,679 3,243,068 14,556,866 52013 1,709 3,244,009 11,063,855 42014 1,662 3,197,416 8,765,004 32015 1,617 3,046,233 6,338,007 22016 1,560 2,939,133 3,644,507 12017 1,501 2,821,575 915,393 <12018 1,441 2,705,007 485,100 <12019 1,376 2,594,058 62,951 <12020 1,313 2,479,710 65,877 <1
TABLE III-6Post-1982 Settlement Reserve
As of January 1, 2020, the total projected liability associated with paying the Post-82 Settlement allowances for the remaining lifetime of the eligible members and beneficiaries was estimated to be approximately $18.6 million. Payments from the Post-82 Settlement reserve have been suspended, with the last benefits payable in August of 2018.
SAN JOAQUIN COUNTY EMPLOYEES’ RETIREMENT ASSOCIATION ACTUARIAL VALUATION REPORT AS OF JANUARY 1, 2020
SECTION IV – LIABILITIES
33
In this section, we present detailed information on System liabilities including:
Disclosure of System liabilities at January 1, 2019 and January 1, 2020 Statement of changes in these liabilities during the year
Disclosure Several types of liabilities are calculated and presented in this report. We note that the liabilities described below are not appropriate for assessing the sufficiency of plan assets to cover the estimated cost of settling the plan’s benefit obligations, in the case of a plan termination or other similar action.
Present Value of Future Benefits: Used for measuring all future System obligations, represents the amount of money needed today to fully fund all benefits of the System both earned as of the valuation date and those to be earned in the future by current plan participants, under the current System provisions.
Actuarial Liability: Used for funding calculations, this liability is calculated taking the Present Value of Future Benefits and subtracting the present value of future Member Contributions and future Employer Normal Costs under an acceptable actuarial funding method. The method used for this System is called the Entry Age Normal (EAN) funding method.
Unfunded Actuarial Liability: The excess of the Actuarial Liability over the Actuarial Value of Assets.
Table IV-1 discloses each of these liabilities for the current and prior valuations. With respect to each disclosure, a subtraction of the appropriate value of Plan assets yields, for each respective type, a net surplus, or an Unfunded Actuarial Liability.
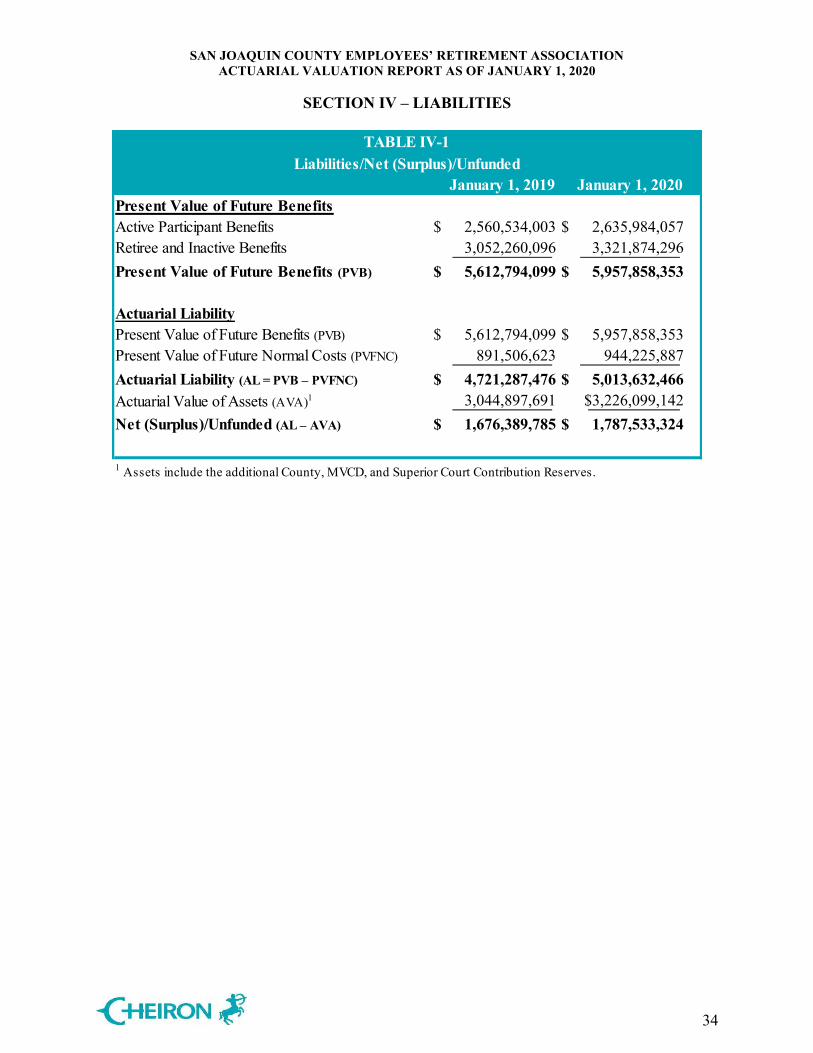
SAN JOAQUIN COUNTY EMPLOYEES’ RETIREMENT ASSOCIATION ACTUARIAL VALUATION REPORT AS OF JANUARY 1, 2020
SECTION IV – LIABILITIES
34
January 1, 2019 January 1, 2020Present Value of Future BenefitsActive Participant Benefits $ 2,560,534,003 $ 2,635,984,057 Retiree and Inactive Benefits 3,052,260,096 3,321,874,296 Present Value of Future Benefits (PVB) $ 5,612,794,099 $ 5,957,858,353
Actuarial LiabilityPresent Value of Future Benefits (PVB) $ 5,612,794,099 $ 5,957,858,353 Present Value of Future Normal Costs (PVFNC) 891,506,623 944,225,887 Actuarial Liability (AL = PVB – PVFNC) $ 4,721,287,476 $ 5,013,632,466 Actuarial Value of Assets (AVA)1 3,044,897,691 $3,226,099,142 Net (Surplus)/Unfunded (AL – AVA) $ 1,676,389,785 $ 1,787,533,324
1 Assets include the additional County, MVCD, and Superior Court Contribution Reserves.
TABLE IV-1Liabilities/Net (Surplus)/Unfunded
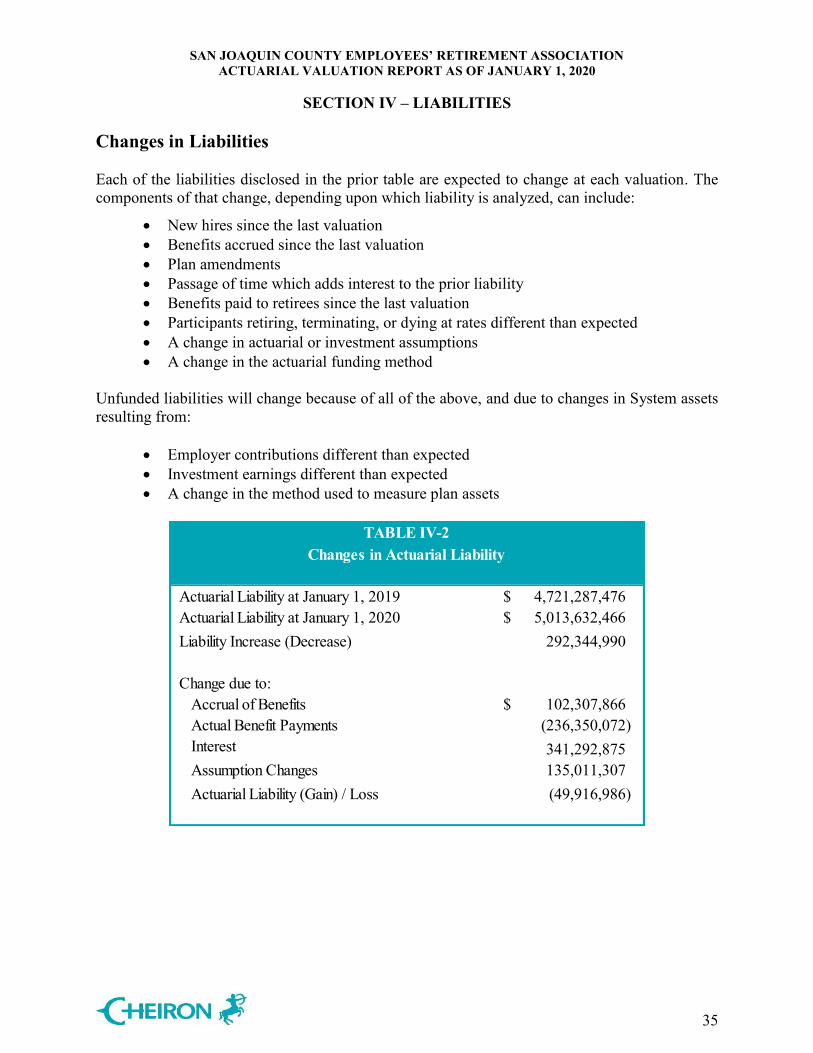
SAN JOAQUIN COUNTY EMPLOYEES’ RETIREMENT ASSOCIATION ACTUARIAL VALUATION REPORT AS OF JANUARY 1, 2020
SECTION IV – LIABILITIES
35
Changes in Liabilities Each of the liabilities disclosed in the prior table are expected to change at each valuation. The components of that change, depending upon which liability is analyzed, can include:
New hires since the last valuation Benefits accrued since the last valuation Plan amendments Passage of time which adds interest to the prior liability Benefits paid to retirees since the last valuation Participants retiring, terminating, or dying at rates different than expected A change in actuarial or investment assumptions A change in the actuarial funding method
Unfunded liabilities will change because of all of the above, and due to changes in System assets resulting from:
Employer contributions different than expected Investment earnings different than expected A change in the method used to measure plan assets
Actuarial Liability at January 1, 2019 $ 4,721,287,476 Actuarial Liability at January 1, 2020 $ 5,013,632,466 Liability Increase (Decrease) 292,344,990
Change due to: Accrual of Benefits $ 102,307,866 Actual Benefit Payments (236,350,072) Interest 341,292,875 Assumption Changes 135,011,307 Actuarial Liability (Gain) / Loss (49,916,986)
TABLE IV-2Changes in Actuarial Liability
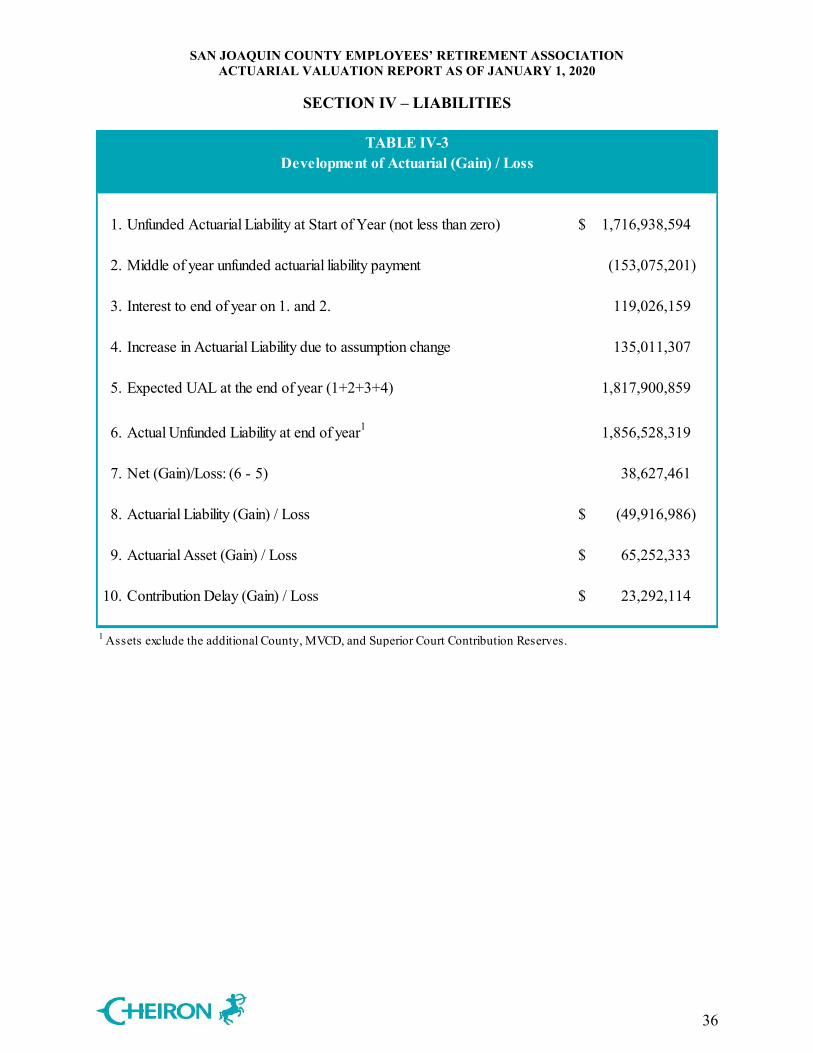
SAN JOAQUIN COUNTY EMPLOYEES’ RETIREMENT ASSOCIATION ACTUARIAL VALUATION REPORT AS OF JANUARY 1, 2020
SECTION IV – LIABILITIES
36
1. Unfunded Actuarial Liability at Start of Year (not less than zero) $ 1,716,938,594
2. Middle of year unfunded actuarial liability payment (153,075,201)
3. Interest to end of year on 1. and 2. 119,026,159
4. Increase in Actuarial Liability due to assumption change 135,011,307
5. Expected UAL at the end of year (1+2+3+4) 1,817,900,859
6. Actual Unfunded Liability at end of year1 1,856,528,319
7. Net (Gain)/Loss: (6 - 5) 38,627,461
8. Actuarial Liability (Gain) / Loss $ (49,916,986)
9. Actuarial Asset (Gain) / Loss $ 65,252,333
10. Contribution Delay (Gain) / Loss $ 23,292,114
1 Assets exclude the additional County, MVCD, and Superior Court Contribution Reserves.
TABLE IV-3Development of Actuarial (Gain) / Loss
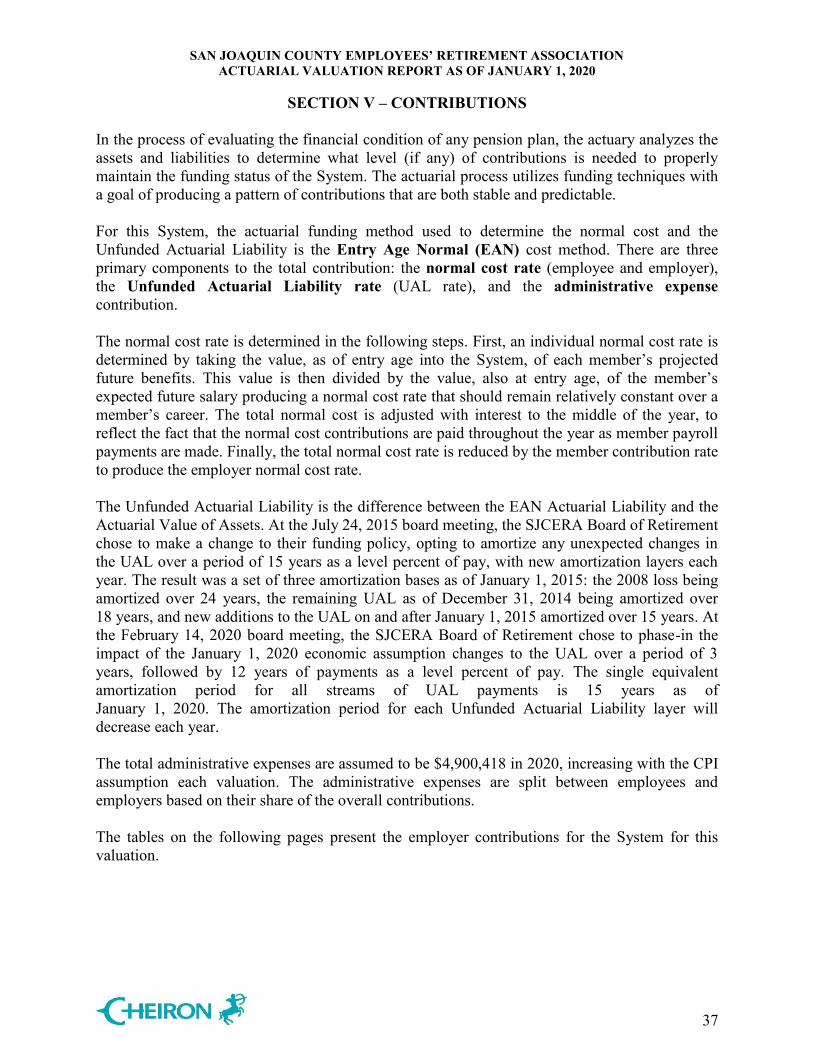
SAN JOAQUIN COUNTY EMPLOYEES’ RETIREMENT ASSOCIATION ACTUARIAL VALUATION REPORT AS OF JANUARY 1, 2020
SECTION V – CONTRIBUTIONS
37
In the process of evaluating the financial condition of any pension plan, the actuary analyzes the assets and liabilities to determine what level (if any) of contributions is needed to properly maintain the funding status of the System. The actuarial process utilizes funding techniques with a goal of producing a pattern of contributions that are both stable and predictable. For this System, the actuarial funding method used to determine the normal cost and the Unfunded Actuarial Liability is the Entry Age Normal (EAN) cost method. There are three primary components to the total contribution: the normal cost rate (employee and employer), the Unfunded Actuarial Liability rate (UAL rate), and the administrative expense contribution. The normal cost rate is determined in the following steps. First, an individual normal cost rate is determined by taking the value, as of entry age into the System, of each member’s projected future benefits. This value is then divided by the value, also at entry age, of the member’s expected future salary producing a normal cost rate that should remain relatively constant over a member’s career. The total normal cost is adjusted with interest to the middle of the year, to reflect the fact that the normal cost contributions are paid throughout the year as member payroll payments are made. Finally, the total normal cost rate is reduced by the member contribution rate to produce the employer normal cost rate. The Unfunded Actuarial Liability is the difference between the EAN Actuarial Liability and the Actuarial Value of Assets. At the July 24, 2015 board meeting, the SJCERA Board of Retirement chose to make a change to their funding policy, opting to amortize any unexpected changes in the UAL over a period of 15 years as a level percent of pay, with new amortization layers each year. The result was a set of three amortization bases as of January 1, 2015: the 2008 loss being amortized over 24 years, the remaining UAL as of December 31, 2014 being amortized over 18 years, and new additions to the UAL on and after January 1, 2015 amortized over 15 years. At the February 14, 2020 board meeting, the SJCERA Board of Retirement chose to phase-in the impact of the January 1, 2020 economic assumption changes to the UAL over a period of 3 years, followed by 12 years of payments as a level percent of pay. The single equivalent amortization period for all streams of UAL payments is 15 years as of January 1, 2020. The amortization period for each Unfunded Actuarial Liability layer will decrease each year. The total administrative expenses are assumed to be $4,900,418 in 2020, increasing with the CPI assumption each valuation. The administrative expenses are split between employees and employers based on their share of the overall contributions. The tables on the following pages present the employer contributions for the System for this valuation.
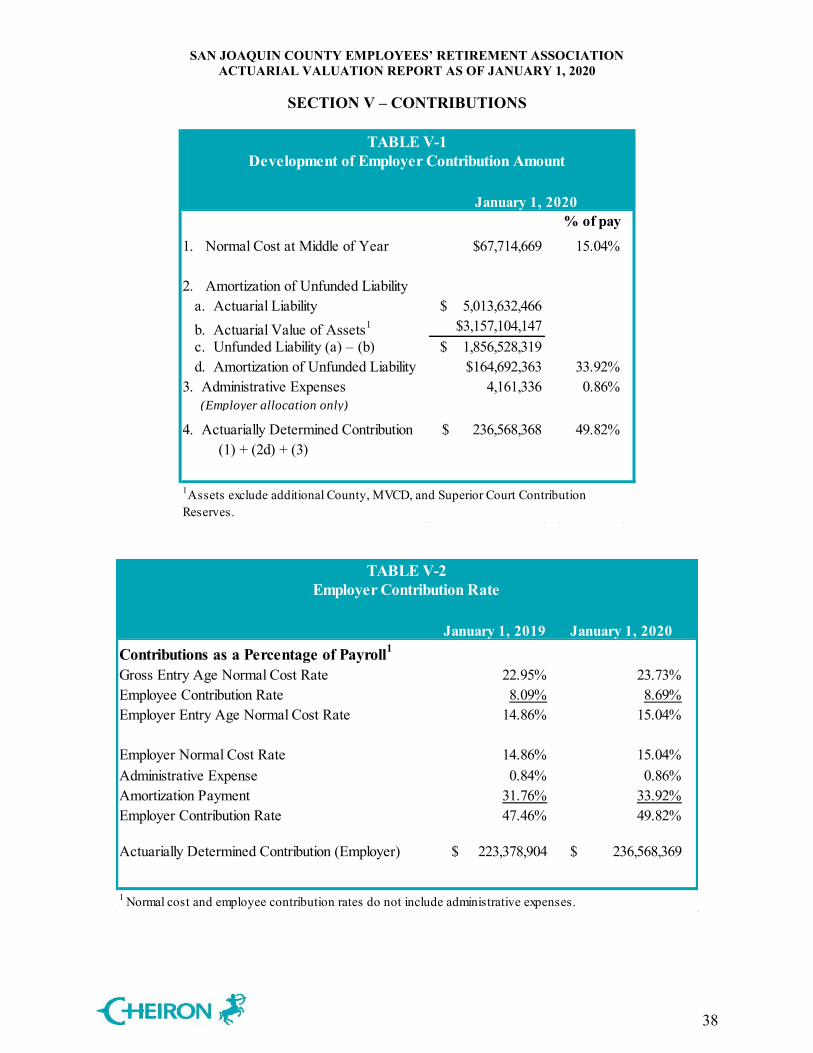
SAN JOAQUIN COUNTY EMPLOYEES’ RETIREMENT ASSOCIATION ACTUARIAL VALUATION REPORT AS OF JANUARY 1, 2020
SECTION V – CONTRIBUTIONS
38
% of pay
1. Normal Cost at Middle of Year $67,714,669 15.04%
2. Amortization of Unfunded Liability a. Actuarial Liability $ 5,013,632,466 b. Actuarial Value of Assets1 $3,157,104,147 c. Unfunded Liability (a) – (b) $ 1,856,528,319 d. Amortization of Unfunded Liability $164,692,363 33.92%
3. Administrative Expenses 4,161,336 0.86% (Employer allocation only)
4. Actuarially Determined Contribution $ 236,568,368 49.82%(1) + (2d) + (3)
TABLE V-1Development of Employer Contribution Amount
January 1, 2020
1Assets exclude additional County, MVCD, and Superior Court Contribution Reserves.
January 1, 2019 January 1, 2020Contributions as a Percentage of Payroll1
Gross Entry Age Normal Cost Rate 22.95% 23.73%Employee Contribution Rate 8.09% 8.69%Employer Entry Age Normal Cost Rate 14.86% 15.04%
Employer Normal Cost Rate 14.86% 15.04%Administrative Expense 0.84% 0.86%Amortization Payment 31.76% 33.92%Employer Contribution Rate 47.46% 49.82%
Actuarially Determined Contribution (Employer) $ 223,378,904 $ 236,568,369
TABLE V-2Employer Contribution Rate
1 Normal cost and employee contribution rates do not include administrative expenses.
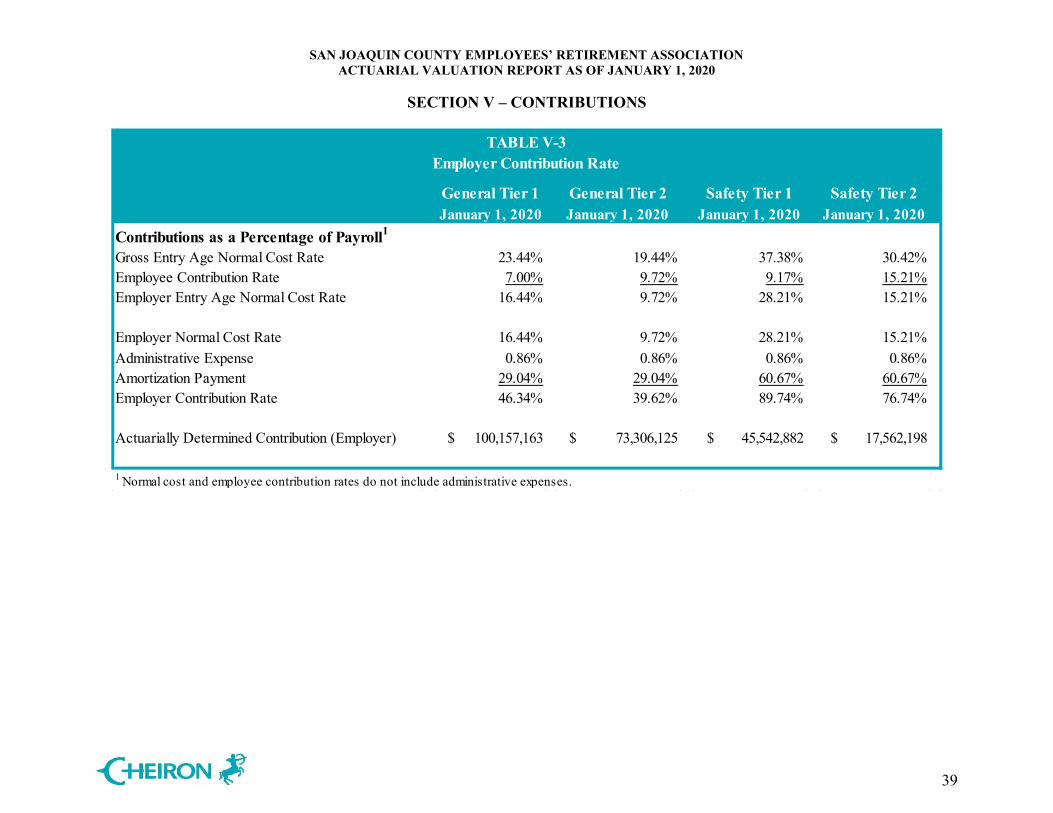
SAN JOAQUIN COUNTY EMPLOYEES’ RETIREMENT ASSOCIATION ACTUARIAL VALUATION REPORT AS OF JANUARY 1, 2020
SECTION V – CONTRIBUTIONS
39
General Tier 1 General Tier 2 Safety Tier 1 Safety Tier 2January 1, 2020 January 1, 2020 January 1, 2020 January 1, 2020
Contributions as a Percentage of Payroll1
Gross Entry Age Normal Cost Rate 23.44% 19.44% 37.38% 30.42%Employee Contribution Rate 7.00% 9.72% 9.17% 15.21%Employer Entry Age Normal Cost Rate 16.44% 9.72% 28.21% 15.21%
Employer Normal Cost Rate 16.44% 9.72% 28.21% 15.21%Administrative Expense 0.86% 0.86% 0.86% 0.86%Amortization Payment 29.04% 29.04% 60.67% 60.67%Employer Contribution Rate 46.34% 39.62% 89.74% 76.74%
Actuarially Determined Contribution (Employer) $ 100,157,163 $ 73,306,125 $ 45,542,882 $ 17,562,198
1 Normal cost and employee contribution rates do not include administrative expenses.
TABLE V-3Employer Contribution Rate
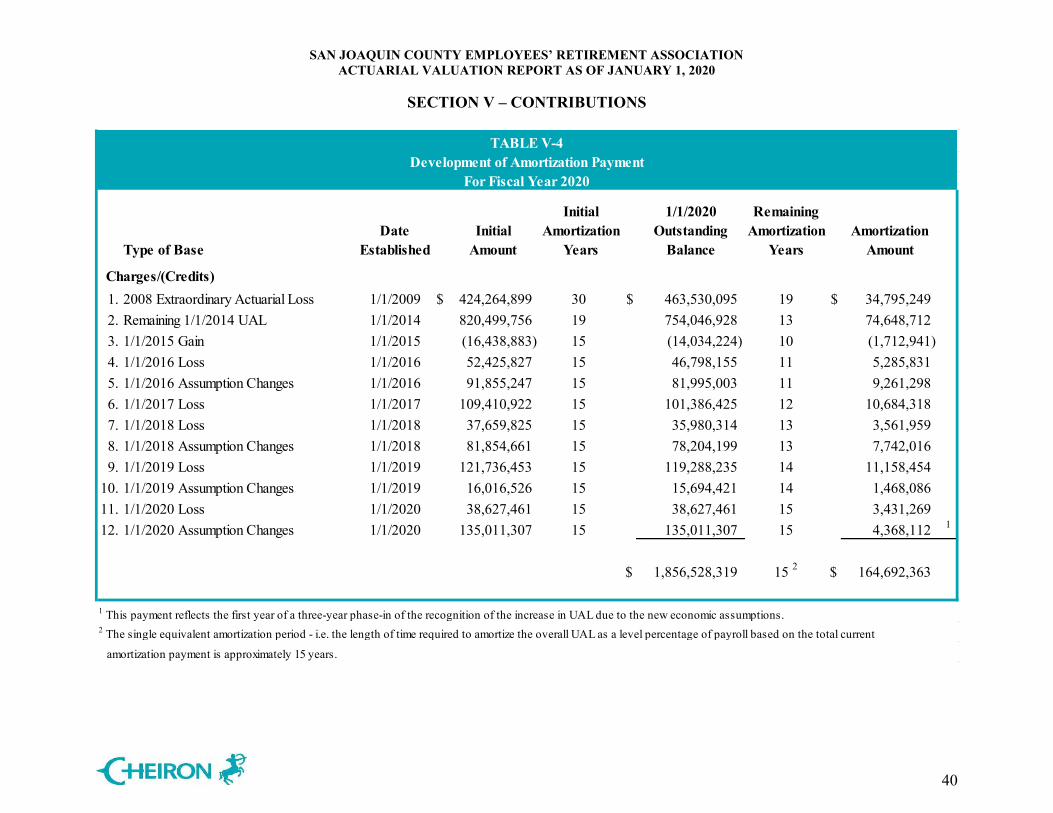
SAN JOAQUIN COUNTY EMPLOYEES’ RETIREMENT ASSOCIATION ACTUARIAL VALUATION REPORT AS OF JANUARY 1, 2020
SECTION V – CONTRIBUTIONS
40
Initial 1/1/2020 RemainingDate Initial Amortization Outstanding Amortization Amortization
Type of Base Established Amount Years Balance Years Amount
Charges/(Credits)1. 2008 Extraordinary Actuarial Loss 1/1/2009 $ 424,264,899 30 $ 463,530,095 19 $ 34,795,249 2. Remaining 1/1/2014 UAL 1/1/2014 820,499,756 19 754,046,928 13 74,648,712 3. 1/1/2015 Gain 1/1/2015 (16,438,883) 15 (14,034,224) 10 (1,712,941) 4. 1/1/2016 Loss 1/1/2016 52,425,827 15 46,798,155 11 5,285,831 5. 1/1/2016 Assumption Changes 1/1/2016 91,855,247 15 81,995,003 11 9,261,298 6. 1/1/2017 Loss 1/1/2017 109,410,922 15 101,386,425 12 10,684,318 7. 1/1/2018 Loss 1/1/2018 37,659,825 15 35,980,314 13 3,561,959 8. 1/1/2018 Assumption Changes 1/1/2018 81,854,661 15 78,204,199 13 7,742,016 9. 1/1/2019 Loss 1/1/2019 121,736,453 15 119,288,235 14 11,158,454
10. 1/1/2019 Assumption Changes 1/1/2019 16,016,526 15 15,694,421 14 1,468,086 11. 1/1/2020 Loss 1/1/2020 38,627,461 15 38,627,461 15 3,431,269 12. 1/1/2020 Assumption Changes 1/1/2020 135,011,307 15 135,011,307 15 4,368,112 1
$ 1,856,528,319 15 2 $ 164,692,363
1 This payment reflects the first year of a three-year phase-in of the recognition of the increase in UAL due to the new economic assumptions.2 The single equivalent amortization period - i.e. the length of time required to amortize the overall UAL as a level percentage of payroll based on the total current
amortization payment is approximately 15 years.
TABLE V-4Development of Amortization Payment
For Fiscal Year 2020
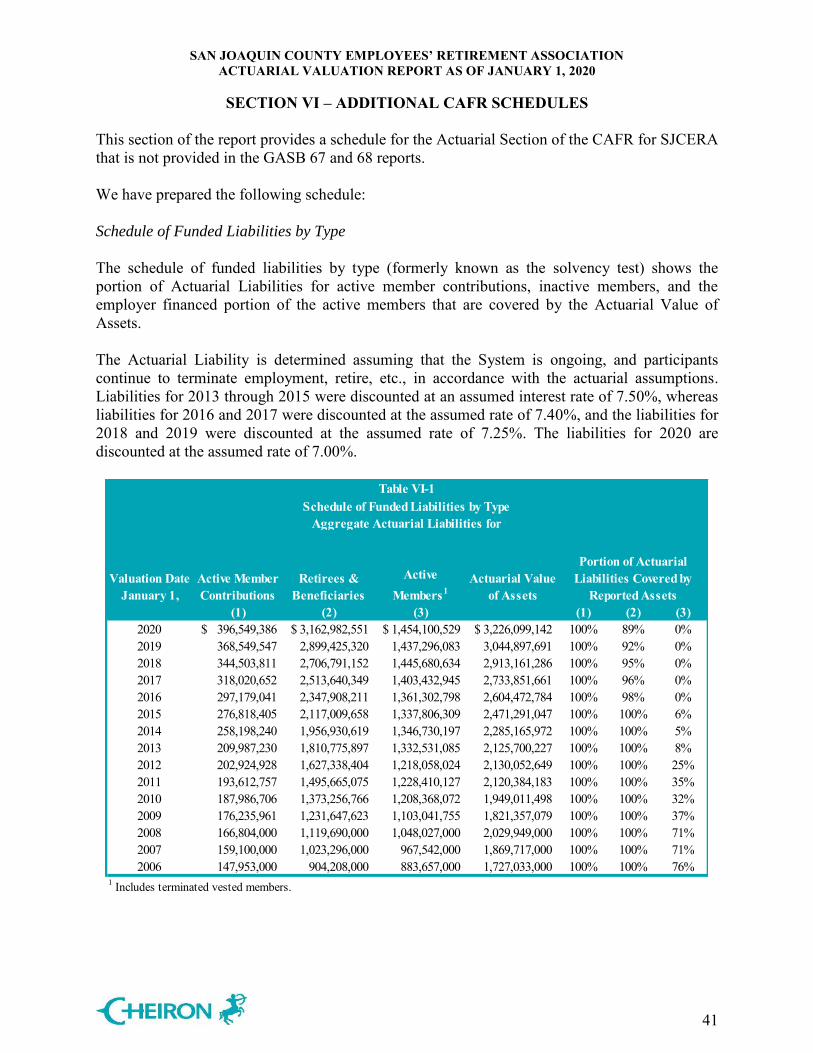
SAN JOAQUIN COUNTY EMPLOYEES’ RETIREMENT ASSOCIATION ACTUARIAL VALUATION REPORT AS OF JANUARY 1, 2020
SECTION VI – ADDITIONAL CAFR SCHEDULES
41
This section of the report provides a schedule for the Actuarial Section of the CAFR for SJCERA that is not provided in the GASB 67 and 68 reports. We have prepared the following schedule: Schedule of Funded Liabilities by Type
The schedule of funded liabilities by type (formerly known as the solvency test) shows the portion of Actuarial Liabilities for active member contributions, inactive members, and the employer financed portion of the active members that are covered by the Actuarial Value of Assets.
The Actuarial Liability is determined assuming that the System is ongoing, and participants continue to terminate employment, retire, etc., in accordance with the actuarial assumptions. Liabilities for 2013 through 2015 were discounted at an assumed interest rate of 7.50%, whereas liabilities for 2016 and 2017 were discounted at the assumed rate of 7.40%, and the liabilities for 2018 and 2019 were discounted at the assumed rate of 7.25%. The liabilities for 2020 are discounted at the assumed rate of 7.00%.
Valuation Date January 1,
(1) (2) (3) (1) (2) (3)2020 396,549,386$ 3,162,982,551$ 1,454,100,529$ 3,226,099,142$ 100% 89% 0%2019 368,549,547 2,899,425,320 1,437,296,083 3,044,897,691 100% 92% 0%2018 344,503,811 2,706,791,152 1,445,680,634 2,913,161,286 100% 95% 0%2017 318,020,652 2,513,640,349 1,403,432,945 2,733,851,661 100% 96% 0%2016 297,179,041 2,347,908,211 1,361,302,798 2,604,472,784 100% 98% 0%2015 276,818,405 2,117,009,658 1,337,806,309 2,471,291,047 100% 100% 6%2014 258,198,240 1,956,930,619 1,346,730,197 2,285,165,972 100% 100% 5%2013 209,987,230 1,810,775,897 1,332,531,085 2,125,700,227 100% 100% 8%2012 202,924,928 1,627,338,404 1,218,058,024 2,130,052,649 100% 100% 25%2011 193,612,757 1,495,665,075 1,228,410,127 2,120,384,183 100% 100% 35%2010 187,986,706 1,373,256,766 1,208,368,072 1,949,011,498 100% 100% 32%2009 176,235,961 1,231,647,623 1,103,041,755 1,821,357,079 100% 100% 37%2008 166,804,000 1,119,690,000 1,048,027,000 2,029,949,000 100% 100% 71%2007 159,100,000 1,023,296,000 967,542,000 1,869,717,000 100% 100% 71%2006 147,953,000 904,208,000 883,657,000 1,727,033,000 100% 100% 76%
1 Includes terminated vested members.
Table VI-1Schedule of Funded Liabilities by Type
Active Member Contributions
Retirees & Beneficiaries
Active Members1
Actuarial Value of Assets
Aggregate Actuarial Liabilities for
Portion of Actuarial Liabilities Covered by
Reported Assets
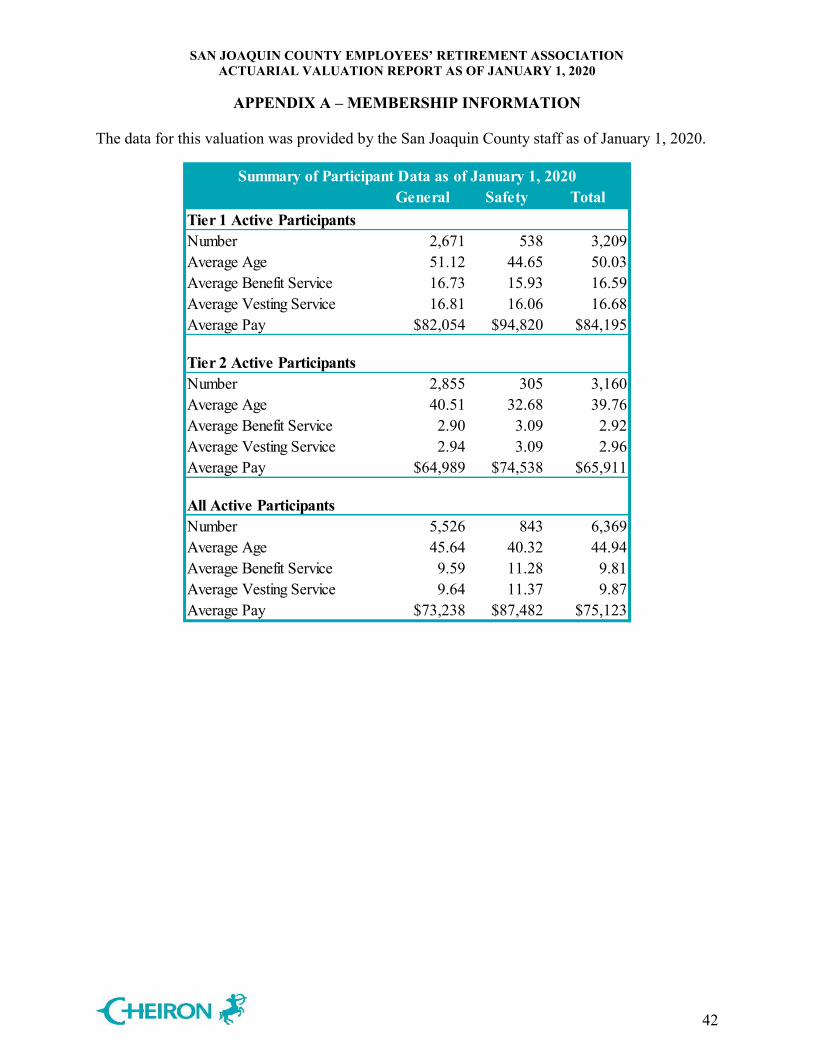
SAN JOAQUIN COUNTY EMPLOYEES’ RETIREMENT ASSOCIATION ACTUARIAL VALUATION REPORT AS OF JANUARY 1, 2020
APPENDIX A – MEMBERSHIP INFORMATION
42
The data for this valuation was provided by the San Joaquin County staff as of January 1, 2020.
Summary of Participant Data as of January 1, 2020General Safety Total
Tier 1 Active ParticipantsNumber 2,671 538 3,209Average Age 51.12 44.65 50.03Average Benefit Service 16.73 15.93 16.59Average Vesting Service 16.81 16.06 16.68Average Pay $82,054 $94,820 $84,195
Tier 2 Active ParticipantsNumber 2,855 305 3,160Average Age 40.51 32.68 39.76Average Benefit Service 2.90 3.09 2.92Average Vesting Service 2.94 3.09 2.96Average Pay $64,989 $74,538 $65,911
All Active ParticipantsNumber 5,526 843 6,369Average Age 45.64 40.32 44.94Average Benefit Service 9.59 11.28 9.81Average Vesting Service 9.64 11.37 9.87Average Pay $73,238 $87,482 $75,123
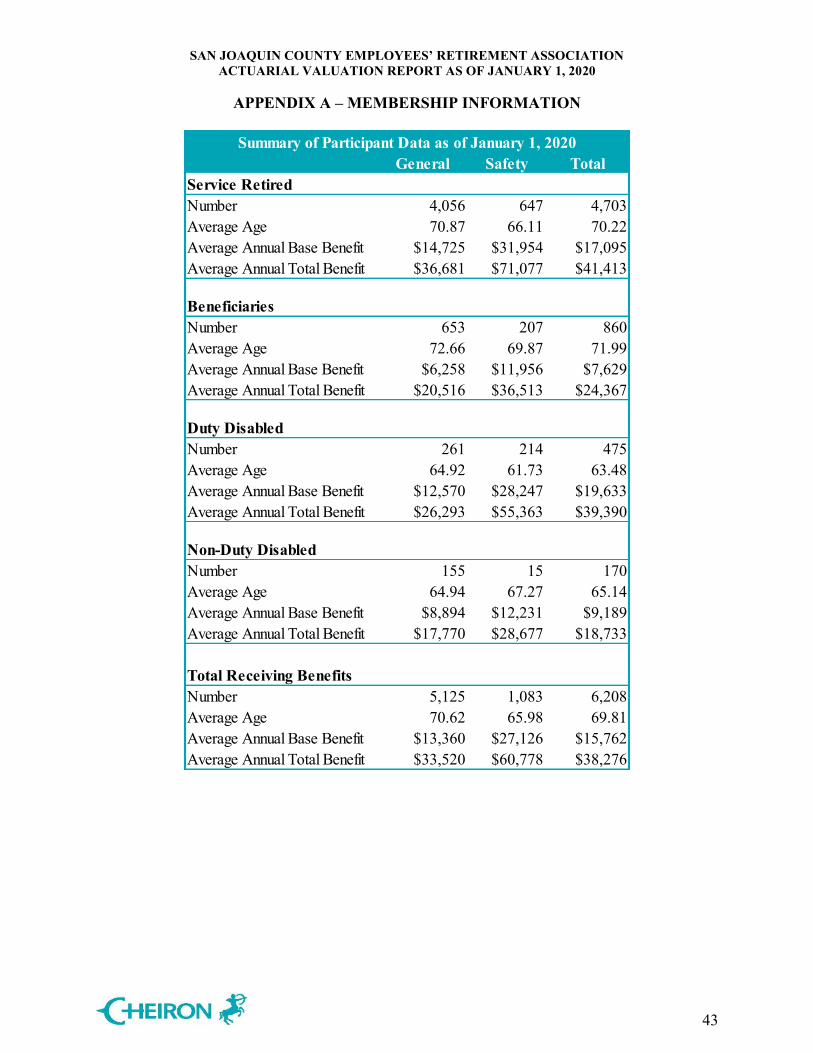
SAN JOAQUIN COUNTY EMPLOYEES’ RETIREMENT ASSOCIATION ACTUARIAL VALUATION REPORT AS OF JANUARY 1, 2020
APPENDIX A – MEMBERSHIP INFORMATION
43
Summary of Participant Data as of January 1, 2020General Safety Total
Service RetiredNumber 4,056 647 4,703Average Age 70.87 66.11 70.22Average Annual Base Benefit $14,725 $31,954 $17,095Average Annual Total Benefit $36,681 $71,077 $41,413
BeneficiariesNumber 653 207 860Average Age 72.66 69.87 71.99Average Annual Base Benefit $6,258 $11,956 $7,629Average Annual Total Benefit $20,516 $36,513 $24,367
Duty DisabledNumber 261 214 475Average Age 64.92 61.73 63.48Average Annual Base Benefit $12,570 $28,247 $19,633Average Annual Total Benefit $26,293 $55,363 $39,390
Non-Duty DisabledNumber 155 15 170Average Age 64.94 67.27 65.14Average Annual Base Benefit $8,894 $12,231 $9,189Average Annual Total Benefit $17,770 $28,677 $18,733
Total Receiving BenefitsNumber 5,125 1,083 6,208Average Age 70.62 65.98 69.81Average Annual Base Benefit $13,360 $27,126 $15,762Average Annual Total Benefit $33,520 $60,778 $38,276
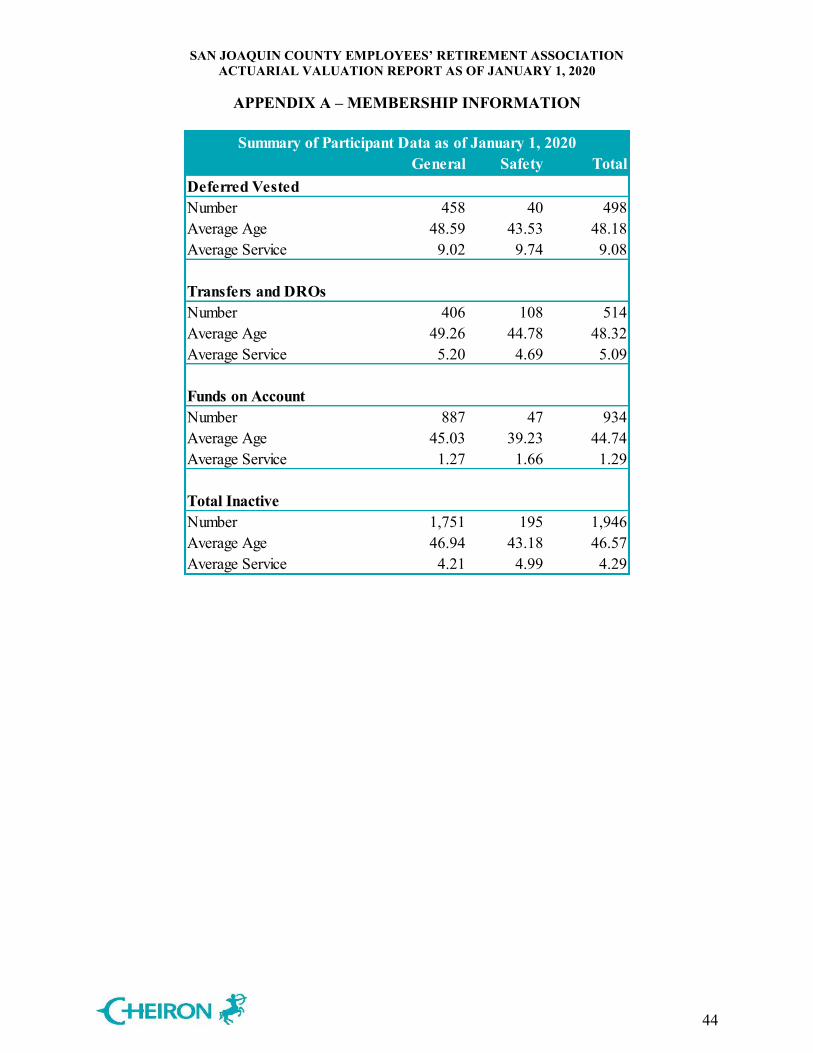
SAN JOAQUIN COUNTY EMPLOYEES’ RETIREMENT ASSOCIATION ACTUARIAL VALUATION REPORT AS OF JANUARY 1, 2020
APPENDIX A – MEMBERSHIP INFORMATION
44
Summary of Participant Data as of January 1, 2020General Safety Total
Deferred VestedNumber 458 40 498Average Age 48.59 43.53 48.18Average Service 9.02 9.74 9.08
Transfers and DROsNumber 406 108 514Average Age 49.26 44.78 48.32Average Service 5.20 4.69 5.09
Funds on AccountNumber 887 47 934Average Age 45.03 39.23 44.74Average Service 1.27 1.66 1.29
Total InactiveNumber 1,751 195 1,946Average Age 46.94 43.18 46.57Average Service 4.21 4.99 4.29
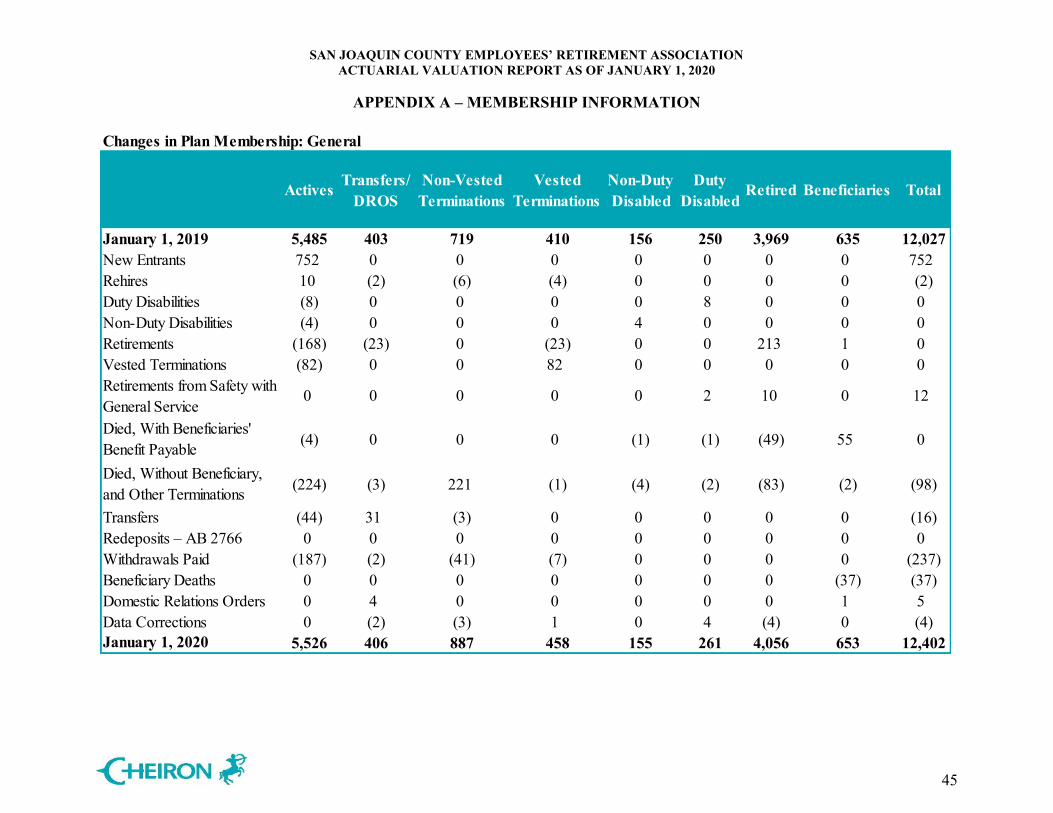
SAN JOAQUIN COUNTY EMPLOYEES’ RETIREMENT ASSOCIATION ACTUARIAL VALUATION REPORT AS OF JANUARY 1, 2020
APPENDIX A – MEMBERSHIP INFORMATION
45
Changes in Plan Membership: General
Actives Transfers/ DROS
Non-Vested Terminations
Vested Terminations
Non-Duty Disabled
Duty Disabled
Retired Beneficiaries Total
January 1, 2019 5,485 403 719 410 156 250 3,969 635 12,027New Entrants 752 0 0 0 0 0 0 0 752Rehires 10 (2) (6) (4) 0 0 0 0 (2)Duty Disabilities (8) 0 0 0 0 8 0 0 0Non-Duty Disabilities (4) 0 0 0 4 0 0 0 0Retirements (168) (23) 0 (23) 0 0 213 1 0Vested Terminations (82) 0 0 82 0 0 0 0 0Retirements from Safety with General Service
0 0 0 0 0 2 10 0 12
Died, With Beneficiaries' Benefit Payable (4) 0 0 0 (1) (1) (49) 55 0
Died, Without Beneficiary, and Other Terminations (224) (3) 221 (1) (4) (2) (83) (2) (98)
Transfers (44) 31 (3) 0 0 0 0 0 (16)Redeposits – AB 2766 0 0 0 0 0 0 0 0 0Withdrawals Paid (187) (2) (41) (7) 0 0 0 0 (237)Beneficiary Deaths 0 0 0 0 0 0 0 (37) (37)Domestic Relations Orders 0 4 0 0 0 0 0 1 5Data Corrections 0 (2) (3) 1 0 4 (4) 0 (4)January 1, 2020 5,526 406 887 458 155 261 4,056 653 12,402
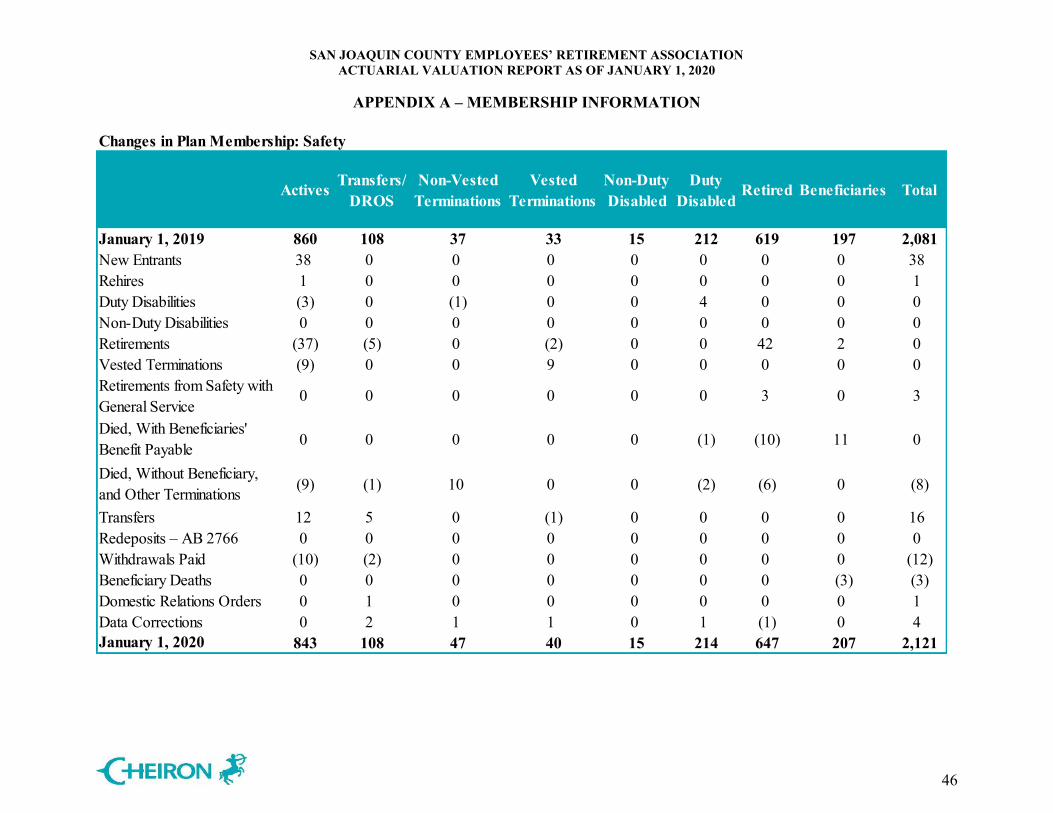
SAN JOAQUIN COUNTY EMPLOYEES’ RETIREMENT ASSOCIATION ACTUARIAL VALUATION REPORT AS OF JANUARY 1, 2020
APPENDIX A – MEMBERSHIP INFORMATION
46
Changes in Plan Membership: Safety
Actives Transfers/ DROS
Non-Vested Terminations
Vested Terminations
Non-Duty Disabled
Duty Disabled
Retired Beneficiaries Total
January 1, 2019 860 108 37 33 15 212 619 197 2,081New Entrants 38 0 0 0 0 0 0 0 38Rehires 1 0 0 0 0 0 0 0 1Duty Disabilities (3) 0 (1) 0 0 4 0 0 0Non-Duty Disabilities 0 0 0 0 0 0 0 0 0Retirements (37) (5) 0 (2) 0 0 42 2 0Vested Terminations (9) 0 0 9 0 0 0 0 0Retirements from Safety with General Service
0 0 0 0 0 0 3 0 3
Died, With Beneficiaries' Benefit Payable 0 0 0 0 0 (1) (10) 11 0
Died, Without Beneficiary, and Other Terminations (9) (1) 10 0 0 (2) (6) 0 (8)
Transfers 12 5 0 (1) 0 0 0 0 16Redeposits – AB 2766 0 0 0 0 0 0 0 0 0Withdrawals Paid (10) (2) 0 0 0 0 0 0 (12)Beneficiary Deaths 0 0 0 0 0 0 0 (3) (3)Domestic Relations Orders 0 1 0 0 0 0 0 0 1Data Corrections 0 2 1 1 0 1 (1) 0 4January 1, 2020 843 108 47 40 15 214 647 207 2,121
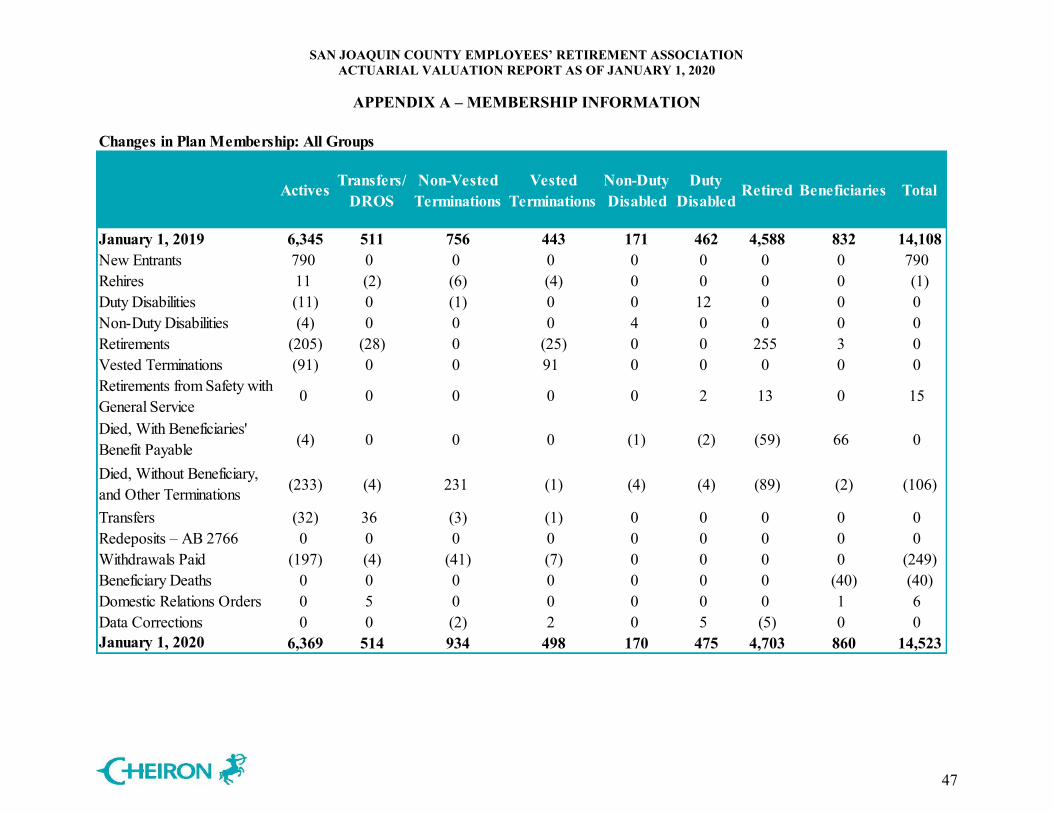
SAN JOAQUIN COUNTY EMPLOYEES’ RETIREMENT ASSOCIATION ACTUARIAL VALUATION REPORT AS OF JANUARY 1, 2020
APPENDIX A – MEMBERSHIP INFORMATION
47
Changes in Plan Membership: All Groups
Actives Transfers/ DROS
Non-Vested Terminations
Vested Terminations
Non-Duty Disabled
Duty Disabled
Retired Beneficiaries Total
January 1, 2019 6,345 511 756 443 171 462 4,588 832 14,108New Entrants 790 0 0 0 0 0 0 0 790Rehires 11 (2) (6) (4) 0 0 0 0 (1)Duty Disabilities (11) 0 (1) 0 0 12 0 0 0Non-Duty Disabilities (4) 0 0 0 4 0 0 0 0Retirements (205) (28) 0 (25) 0 0 255 3 0Vested Terminations (91) 0 0 91 0 0 0 0 0Retirements from Safety with General Service
0 0 0 0 0 2 13 0 15
Died, With Beneficiaries' Benefit Payable (4) 0 0 0 (1) (2) (59) 66 0
Died, Without Beneficiary, and Other Terminations (233) (4) 231 (1) (4) (4) (89) (2) (106)
Transfers (32) 36 (3) (1) 0 0 0 0 0Redeposits – AB 2766 0 0 0 0 0 0 0 0 0Withdrawals Paid (197) (4) (41) (7) 0 0 0 0 (249)Beneficiary Deaths 0 0 0 0 0 0 0 (40) (40)Domestic Relations Orders 0 5 0 0 0 0 0 1 6Data Corrections 0 0 (2) 2 0 5 (5) 0 0January 1, 2020 6,369 514 934 498 170 475 4,703 860 14,523
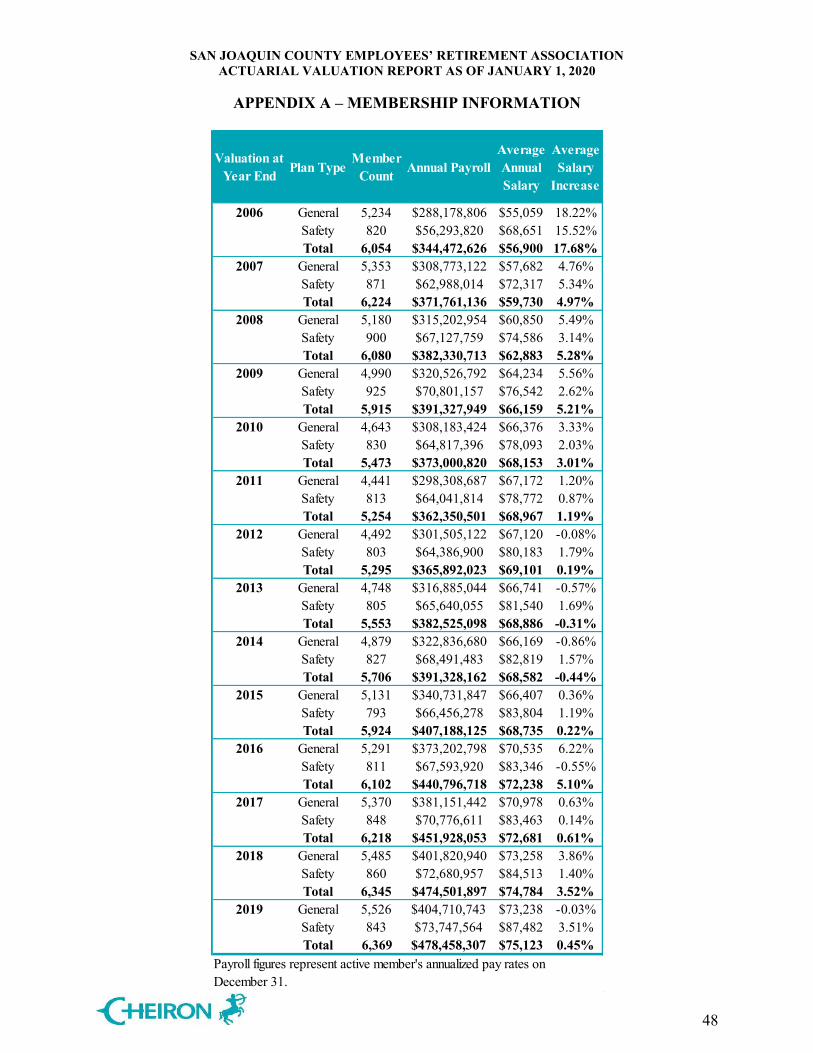
SAN JOAQUIN COUNTY EMPLOYEES’ RETIREMENT ASSOCIATION ACTUARIAL VALUATION REPORT AS OF JANUARY 1, 2020
APPENDIX A – MEMBERSHIP INFORMATION
48
Valuation at Year End Plan Type
Member Count Annual Payroll
Average Annual Salary
Average Salary
Increase
2006 General 5,234 $288,178,806 $55,059 18.22%Safety 820 $56,293,820 $68,651 15.52%Total 6,054 $344,472,626 $56,900 17.68%
2007 General 5,353 $308,773,122 $57,682 4.76%Safety 871 $62,988,014 $72,317 5.34%Total 6,224 $371,761,136 $59,730 4.97%
2008 General 5,180 $315,202,954 $60,850 5.49%Safety 900 $67,127,759 $74,586 3.14%Total 6,080 $382,330,713 $62,883 5.28%
2009 General 4,990 $320,526,792 $64,234 5.56%Safety 925 $70,801,157 $76,542 2.62%Total 5,915 $391,327,949 $66,159 5.21%
2010 General 4,643 $308,183,424 $66,376 3.33%Safety 830 $64,817,396 $78,093 2.03%Total 5,473 $373,000,820 $68,153 3.01%
2011 General 4,441 $298,308,687 $67,172 1.20%Safety 813 $64,041,814 $78,772 0.87%Total 5,254 $362,350,501 $68,967 1.19%
2012 General 4,492 $301,505,122 $67,120 -0.08%Safety 803 $64,386,900 $80,183 1.79%Total 5,295 $365,892,023 $69,101 0.19%
2013 General 4,748 $316,885,044 $66,741 -0.57%Safety 805 $65,640,055 $81,540 1.69%Total 5,553 $382,525,098 $68,886 -0.31%
2014 General 4,879 $322,836,680 $66,169 -0.86%Safety 827 $68,491,483 $82,819 1.57%Total 5,706 $391,328,162 $68,582 -0.44%
2015 General 5,131 $340,731,847 $66,407 0.36%Safety 793 $66,456,278 $83,804 1.19%Total 5,924 $407,188,125 $68,735 0.22%
2016 General 5,291 $373,202,798 $70,535 6.22%Safety 811 $67,593,920 $83,346 -0.55%Total 6,102 $440,796,718 $72,238 5.10%
2017 General 5,370 $381,151,442 $70,978 0.63%Safety 848 $70,776,611 $83,463 0.14%Total 6,218 $451,928,053 $72,681 0.61%
2018 General 5,485 $401,820,940 $73,258 3.86%Safety 860 $72,680,957 $84,513 1.40%Total 6,345 $474,501,897 $74,784 3.52%
2019 General 5,526 $404,710,743 $73,238 -0.03%Safety 843 $73,747,564 $87,482 3.51%Total 6,369 $478,458,307 $75,123 0.45%
Payroll figures represent active member's annualized pay rates on December 31.
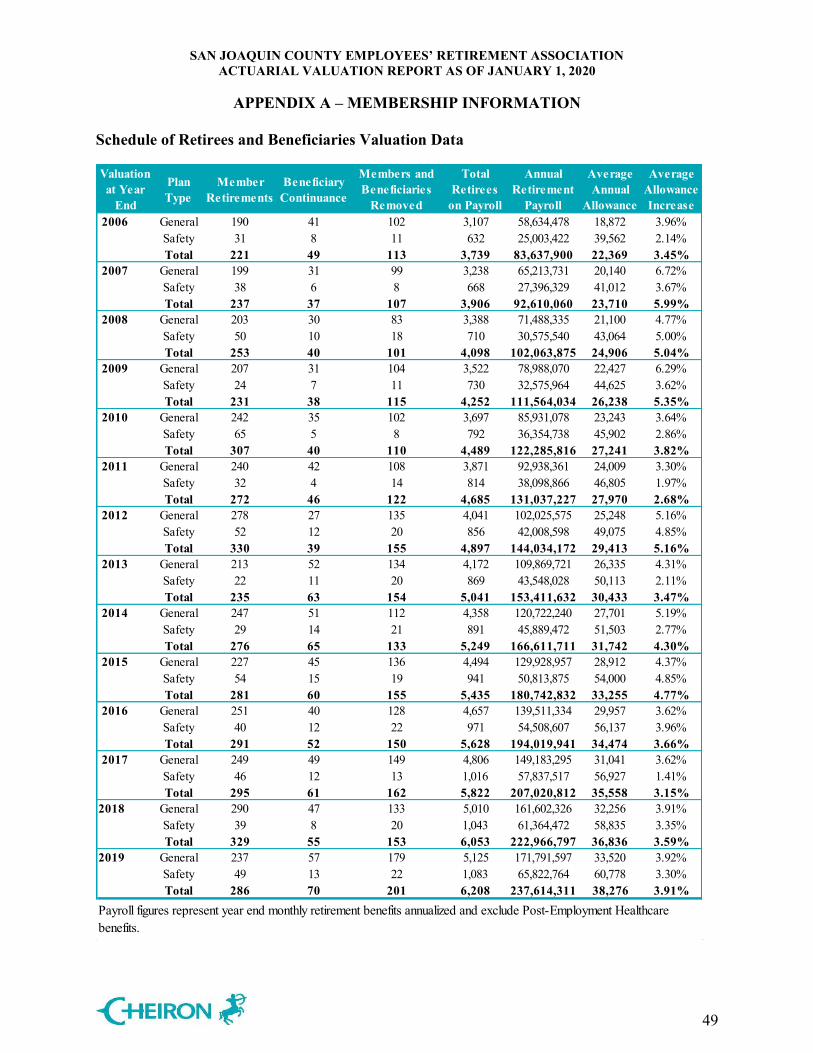
SAN JOAQUIN COUNTY EMPLOYEES’ RETIREMENT ASSOCIATION ACTUARIAL VALUATION REPORT AS OF JANUARY 1, 2020
APPENDIX A – MEMBERSHIP INFORMATION
49
Schedule of Retirees and Beneficiaries Valuation Data
Valuation at Year
End
Plan Type
Member Retirements
Beneficiary Continuance
Members and Beneficiaries
Removed
Total Retirees
on Payroll
Annual Retirement
Payroll
Average Annual
Allowance
Average Allowance Increase
2006 General 190 41 102 3,107 58,634,478 18,872 3.96%Safety 31 8 11 632 25,003,422 39,562 2.14%Total 221 49 113 3,739 83,637,900 22,369 3.45%
2007 General 199 31 99 3,238 65,213,731 20,140 6.72%Safety 38 6 8 668 27,396,329 41,012 3.67%Total 237 37 107 3,906 92,610,060 23,710 5.99%
2008 General 203 30 83 3,388 71,488,335 21,100 4.77%Safety 50 10 18 710 30,575,540 43,064 5.00%Total 253 40 101 4,098 102,063,875 24,906 5.04%
2009 General 207 31 104 3,522 78,988,070 22,427 6.29%Safety 24 7 11 730 32,575,964 44,625 3.62%Total 231 38 115 4,252 111,564,034 26,238 5.35%
2010 General 242 35 102 3,697 85,931,078 23,243 3.64%Safety 65 5 8 792 36,354,738 45,902 2.86%Total 307 40 110 4,489 122,285,816 27,241 3.82%
2011 General 240 42 108 3,871 92,938,361 24,009 3.30%Safety 32 4 14 814 38,098,866 46,805 1.97%Total 272 46 122 4,685 131,037,227 27,970 2.68%
2012 General 278 27 135 4,041 102,025,575 25,248 5.16%Safety 52 12 20 856 42,008,598 49,075 4.85%Total 330 39 155 4,897 144,034,172 29,413 5.16%
2013 General 213 52 134 4,172 109,869,721 26,335 4.31%Safety 22 11 20 869 43,548,028 50,113 2.11%Total 235 63 154 5,041 153,411,632 30,433 3.47%
2014 General 247 51 112 4,358 120,722,240 27,701 5.19%Safety 29 14 21 891 45,889,472 51,503 2.77%Total 276 65 133 5,249 166,611,711 31,742 4.30%
2015 General 227 45 136 4,494 129,928,957 28,912 4.37%Safety 54 15 19 941 50,813,875 54,000 4.85%Total 281 60 155 5,435 180,742,832 33,255 4.77%
2016 General 251 40 128 4,657 139,511,334 29,957 3.62%Safety 40 12 22 971 54,508,607 56,137 3.96%Total 291 52 150 5,628 194,019,941 34,474 3.66%
2017 General 249 49 149 4,806 149,183,295 31,041 3.62%Safety 46 12 13 1,016 57,837,517 56,927 1.41%Total 295 61 162 5,822 207,020,812 35,558 3.15%
2018 General 290 47 133 5,010 161,602,326 32,256 3.91%Safety 39 8 20 1,043 61,364,472 58,835 3.35%Total 329 55 153 6,053 222,966,797 36,836 3.59%
2019 General 237 57 179 5,125 171,791,597 33,520 3.92%Safety 49 13 22 1,083 65,822,764 60,778 3.30%Total 286 70 201 6,208 237,614,311 38,276 3.91%
Payroll figures represent year end monthly retirement benefits annualized and exclude Post-Employment Healthcare benefits.
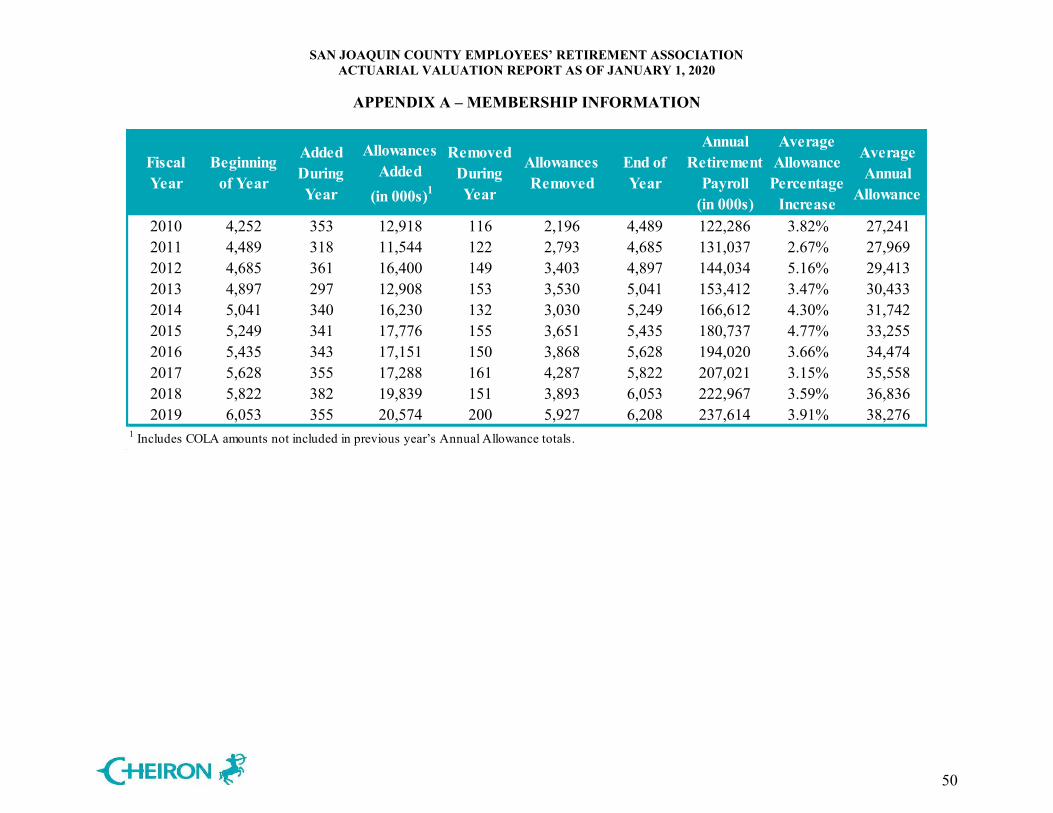
SAN JOAQUIN COUNTY EMPLOYEES’ RETIREMENT ASSOCIATION ACTUARIAL VALUATION REPORT AS OF JANUARY 1, 2020
APPENDIX A – MEMBERSHIP INFORMATION
50
Fiscal Year
Beginning of Year
Added During Year
Allowances Added
(in 000s)1
Removed During Year
Allowances Removed
End of Year
Annual Retirement
Payroll (in 000s)
Average Allowance Percentage
Increase
Average Annual
Allowance
2010 4,252 353 12,918 116 2,196 4,489 122,286 3.82% 27,2412011 4,489 318 11,544 122 2,793 4,685 131,037 2.67% 27,9692012 4,685 361 16,400 149 3,403 4,897 144,034 5.16% 29,4132013 4,897 297 12,908 153 3,530 5,041 153,412 3.47% 30,4332014 5,041 340 16,230 132 3,030 5,249 166,612 4.30% 31,7422015 5,249 341 17,776 155 3,651 5,435 180,737 4.77% 33,2552016 5,435 343 17,151 150 3,868 5,628 194,020 3.66% 34,4742017 5,628 355 17,288 161 4,287 5,822 207,021 3.15% 35,5582018 5,822 382 19,839 151 3,893 6,053 222,967 3.59% 36,8362019 6,053 355 20,574 200 5,927 6,208 237,614 3.91% 38,276
1 Includes COLA amounts not included in previous year’s Annual Allowance totals.
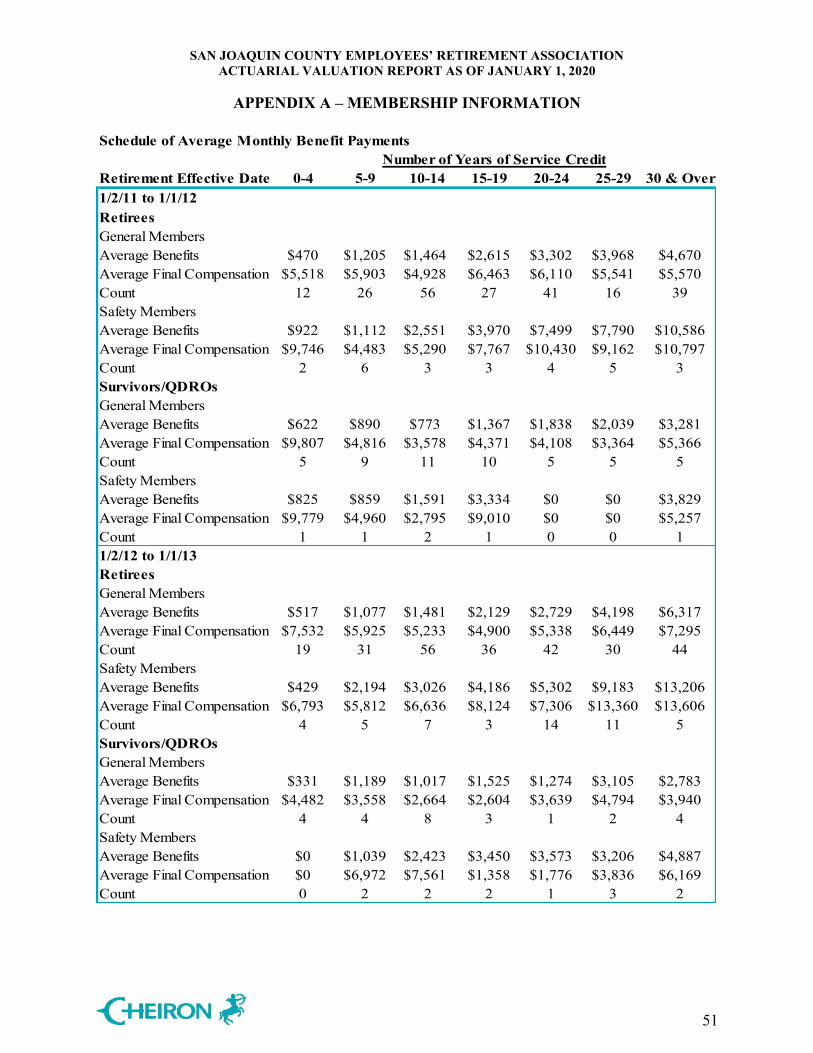
SAN JOAQUIN COUNTY EMPLOYEES’ RETIREMENT ASSOCIATION ACTUARIAL VALUATION REPORT AS OF JANUARY 1, 2020
APPENDIX A – MEMBERSHIP INFORMATION
51
Schedule of Average Monthly Benefit PaymentsNumber of Years of Service Credit
Retirement Effective Date 0-4 5-9 10-14 15-19 20-24 25-29 30 & Over1/2/11 to 1/1/12RetireesGeneral MembersAverage Benefits $470 $1,205 $1,464 $2,615 $3,302 $3,968 $4,670 Average Final Compensation $5,518 $5,903 $4,928 $6,463 $6,110 $5,541 $5,570 Count 12 26 56 27 41 16 39Safety MembersAverage Benefits $922 $1,112 $2,551 $3,970 $7,499 $7,790 $10,586 Average Final Compensation $9,746 $4,483 $5,290 $7,767 $10,430 $9,162 $10,797 Count 2 6 3 3 4 5 3Survivors/QDROsGeneral MembersAverage Benefits $622 $890 $773 $1,367 $1,838 $2,039 $3,281 Average Final Compensation $9,807 $4,816 $3,578 $4,371 $4,108 $3,364 $5,366 Count 5 9 11 10 5 5 5Safety MembersAverage Benefits $825 $859 $1,591 $3,334 $0 $0 $3,829 Average Final Compensation $9,779 $4,960 $2,795 $9,010 $0 $0 $5,257 Count 1 1 2 1 0 0 11/2/12 to 1/1/13RetireesGeneral MembersAverage Benefits $517 $1,077 $1,481 $2,129 $2,729 $4,198 $6,317 Average Final Compensation $7,532 $5,925 $5,233 $4,900 $5,338 $6,449 $7,295 Count 19 31 56 36 42 30 44Safety MembersAverage Benefits $429 $2,194 $3,026 $4,186 $5,302 $9,183 $13,206 Average Final Compensation $6,793 $5,812 $6,636 $8,124 $7,306 $13,360 $13,606 Count 4 5 7 3 14 11 5Survivors/QDROsGeneral MembersAverage Benefits $331 $1,189 $1,017 $1,525 $1,274 $3,105 $2,783 Average Final Compensation $4,482 $3,558 $2,664 $2,604 $3,639 $4,794 $3,940 Count 4 4 8 3 1 2 4Safety MembersAverage Benefits $0 $1,039 $2,423 $3,450 $3,573 $3,206 $4,887 Average Final Compensation $0 $6,972 $7,561 $1,358 $1,776 $3,836 $6,169 Count 0 2 2 2 1 3 2
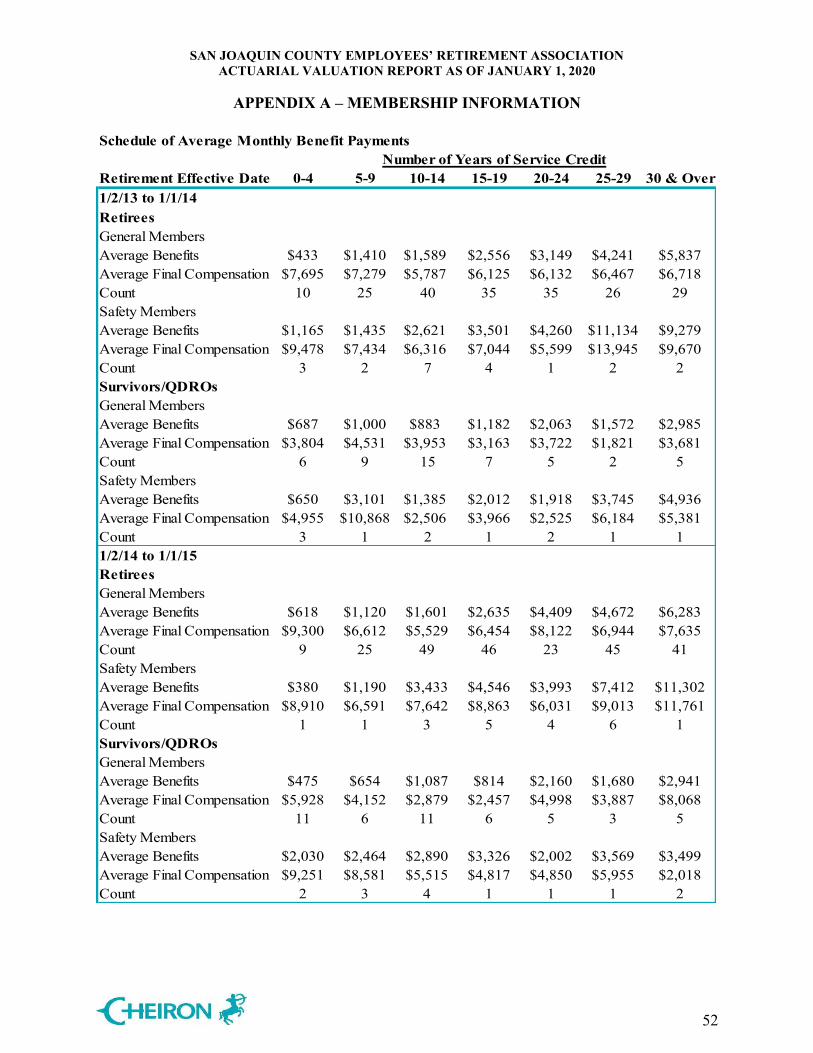
SAN JOAQUIN COUNTY EMPLOYEES’ RETIREMENT ASSOCIATION ACTUARIAL VALUATION REPORT AS OF JANUARY 1, 2020
APPENDIX A – MEMBERSHIP INFORMATION
52
Schedule of Average Monthly Benefit PaymentsNumber of Years of Service Credit
Retirement Effective Date 0-4 5-9 10-14 15-19 20-24 25-29 30 & Over1/2/13 to 1/1/14RetireesGeneral MembersAverage Benefits $433 $1,410 $1,589 $2,556 $3,149 $4,241 $5,837 Average Final Compensation $7,695 $7,279 $5,787 $6,125 $6,132 $6,467 $6,718 Count 10 25 40 35 35 26 29Safety MembersAverage Benefits $1,165 $1,435 $2,621 $3,501 $4,260 $11,134 $9,279 Average Final Compensation $9,478 $7,434 $6,316 $7,044 $5,599 $13,945 $9,670 Count 3 2 7 4 1 2 2Survivors/QDROsGeneral MembersAverage Benefits $687 $1,000 $883 $1,182 $2,063 $1,572 $2,985 Average Final Compensation $3,804 $4,531 $3,953 $3,163 $3,722 $1,821 $3,681 Count 6 9 15 7 5 2 5Safety MembersAverage Benefits $650 $3,101 $1,385 $2,012 $1,918 $3,745 $4,936 Average Final Compensation $4,955 $10,868 $2,506 $3,966 $2,525 $6,184 $5,381 Count 3 1 2 1 2 1 11/2/14 to 1/1/15RetireesGeneral MembersAverage Benefits $618 $1,120 $1,601 $2,635 $4,409 $4,672 $6,283 Average Final Compensation $9,300 $6,612 $5,529 $6,454 $8,122 $6,944 $7,635 Count 9 25 49 46 23 45 41Safety MembersAverage Benefits $380 $1,190 $3,433 $4,546 $3,993 $7,412 $11,302 Average Final Compensation $8,910 $6,591 $7,642 $8,863 $6,031 $9,013 $11,761 Count 1 1 3 5 4 6 1Survivors/QDROsGeneral MembersAverage Benefits $475 $654 $1,087 $814 $2,160 $1,680 $2,941 Average Final Compensation $5,928 $4,152 $2,879 $2,457 $4,998 $3,887 $8,068 Count 11 6 11 6 5 3 5Safety MembersAverage Benefits $2,030 $2,464 $2,890 $3,326 $2,002 $3,569 $3,499 Average Final Compensation $9,251 $8,581 $5,515 $4,817 $4,850 $5,955 $2,018 Count 2 3 4 1 1 1 2

SAN JOAQUIN COUNTY EMPLOYEES’ RETIREMENT ASSOCIATION ACTUARIAL VALUATION REPORT AS OF JANUARY 1, 2020
APPENDIX A – MEMBERSHIP INFORMATION
53
Schedule of Average Monthly Benefit PaymentsNumber of Years of Service Credit
Retirement Effective Date 0-4 5-9 10-14 15-19 20-24 25-29 30 & Over1/2/15 to 1/1/16RetireesGeneral MembersAverage Benefits $330 $988 $1,661 $2,449 $3,277 $4,342 $5,770 Average Final Compensation $5,778 $5,953 $5,826 $5,723 $5,918 $6,501 $6,781 Count 12 27 36 43 26 29 37Safety MembersAverage Benefits $585 $1,352 $2,452 $3,959 $5,597 $8,061 $10,770 Average Final Compensation $7,403 $5,334 $6,269 $6,943 $8,120 $9,621 $11,481 Count 2 2 4 3 10 21 6Survivors/QDROsGeneral MembersAverage Benefits $376 $987 $999 $1,612 $3,184 $2,709 $5,276 Average Final Compensation $3,328 $5,939 $3,359 $4,532 $8,017 $5,312 $5,850 Count 4 10 9 4 4 3 5Safety MembersAverage Benefits $530 $2,019 $2,184 $1,970 $2,902 $4,784 $5,026 Average Final Compensation $6,052 $11,395 $9,909 $3,887 $4,783 $6,788 $5,405 Count 2 1 2 1 2 4 31/2/16 to 1/1/17RetireesGeneral MembersAverage Benefits $310 $1,100 $1,823 $2,487 $3,779 $3,911 $5,931 Average Final Compensation $6,616 $5,885 $6,368 $5,950 $6,805 $5,756 $7,132 Count 21 24 54 48 24 31 42Safety MembersAverage Benefits $3,817 $1,759 $2,546 $6,290 $5,510 $9,513 $12,671 Average Final Compensation $7,634 $5,985 $6,353 $11,452 $8,566 $11,959 $13,175 Count 1 6 6 3 7 12 4Survivors/QDROsGeneral MembersAverage Benefits $313 $858 $1,065 $1,596 $3,214 $1,720 $2,769 Average Final Compensation $5,726 $4,674 $4,527 $4,648 $6,051 $3,809 $3,313 Count 5 7 11 6 2 5 1Safety MembersAverage Benefits $495 $2,235 $1,253 $1,661 $4,086 $5,943 $4,712 Average Final Compensation $7,339 $9,642 $3,842 $2,755 $5,646 $8,003 $4,803 Count 2 4 1 1 1 1 2
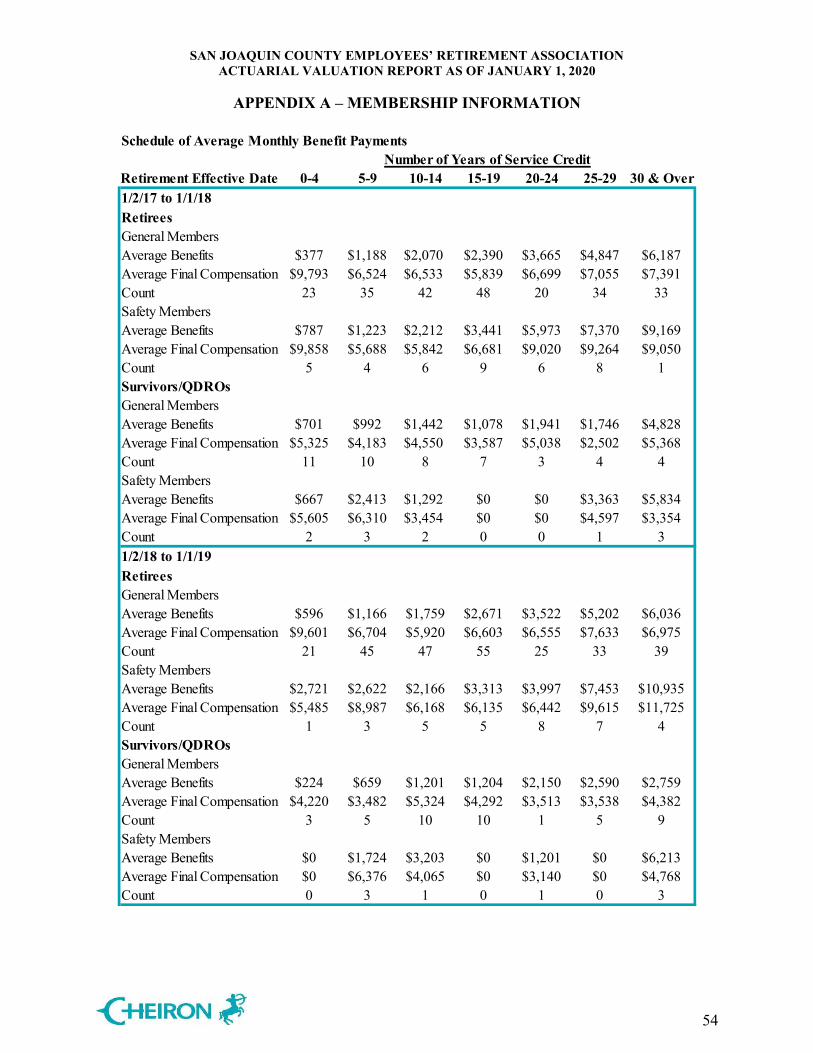
SAN JOAQUIN COUNTY EMPLOYEES’ RETIREMENT ASSOCIATION ACTUARIAL VALUATION REPORT AS OF JANUARY 1, 2020
APPENDIX A – MEMBERSHIP INFORMATION
54
Schedule of Average Monthly Benefit PaymentsNumber of Years of Service Credit
Retirement Effective Date 0-4 5-9 10-14 15-19 20-24 25-29 30 & Over1/2/17 to 1/1/18RetireesGeneral MembersAverage Benefits $377 $1,188 $2,070 $2,390 $3,665 $4,847 $6,187 Average Final Compensation $9,793 $6,524 $6,533 $5,839 $6,699 $7,055 $7,391 Count 23 35 42 48 20 34 33Safety MembersAverage Benefits $787 $1,223 $2,212 $3,441 $5,973 $7,370 $9,169 Average Final Compensation $9,858 $5,688 $5,842 $6,681 $9,020 $9,264 $9,050 Count 5 4 6 9 6 8 1Survivors/QDROsGeneral MembersAverage Benefits $701 $992 $1,442 $1,078 $1,941 $1,746 $4,828 Average Final Compensation $5,325 $4,183 $4,550 $3,587 $5,038 $2,502 $5,368 Count 11 10 8 7 3 4 4Safety MembersAverage Benefits $667 $2,413 $1,292 $0 $0 $3,363 $5,834 Average Final Compensation $5,605 $6,310 $3,454 $0 $0 $4,597 $3,354 Count 2 3 2 0 0 1 31/2/18 to 1/1/19RetireesGeneral MembersAverage Benefits $596 $1,166 $1,759 $2,671 $3,522 $5,202 $6,036 Average Final Compensation $9,601 $6,704 $5,920 $6,603 $6,555 $7,633 $6,975 Count 21 45 47 55 25 33 39Safety MembersAverage Benefits $2,721 $2,622 $2,166 $3,313 $3,997 $7,453 $10,935 Average Final Compensation $5,485 $8,987 $6,168 $6,135 $6,442 $9,615 $11,725 Count 1 3 5 5 8 7 4Survivors/QDROsGeneral MembersAverage Benefits $224 $659 $1,201 $1,204 $2,150 $2,590 $2,759 Average Final Compensation $4,220 $3,482 $5,324 $4,292 $3,513 $3,538 $4,382 Count 3 5 10 10 1 5 9Safety MembersAverage Benefits $0 $1,724 $3,203 $0 $1,201 $0 $6,213 Average Final Compensation $0 $6,376 $4,065 $0 $3,140 $0 $4,768 Count 0 3 1 0 1 0 3
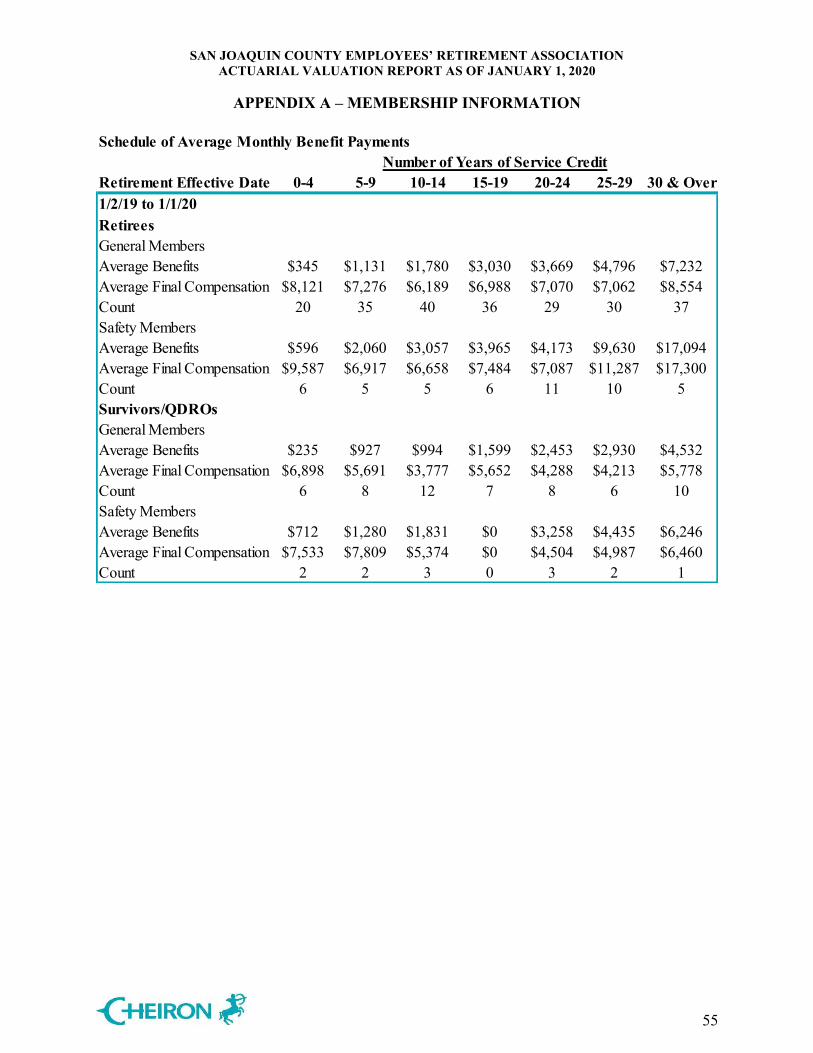
SAN JOAQUIN COUNTY EMPLOYEES’ RETIREMENT ASSOCIATION ACTUARIAL VALUATION REPORT AS OF JANUARY 1, 2020
APPENDIX A – MEMBERSHIP INFORMATION
55
Schedule of Average Monthly Benefit PaymentsNumber of Years of Service Credit
Retirement Effective Date 0-4 5-9 10-14 15-19 20-24 25-29 30 & Over1/2/19 to 1/1/20RetireesGeneral MembersAverage Benefits $345 $1,131 $1,780 $3,030 $3,669 $4,796 $7,232 Average Final Compensation $8,121 $7,276 $6,189 $6,988 $7,070 $7,062 $8,554 Count 20 35 40 36 29 30 37Safety MembersAverage Benefits $596 $2,060 $3,057 $3,965 $4,173 $9,630 $17,094 Average Final Compensation $9,587 $6,917 $6,658 $7,484 $7,087 $11,287 $17,300 Count 6 5 5 6 11 10 5Survivors/QDROsGeneral MembersAverage Benefits $235 $927 $994 $1,599 $2,453 $2,930 $4,532 Average Final Compensation $6,898 $5,691 $3,777 $5,652 $4,288 $4,213 $5,778 Count 6 8 12 7 8 6 10Safety MembersAverage Benefits $712 $1,280 $1,831 $0 $3,258 $4,435 $6,246 Average Final Compensation $7,533 $7,809 $5,374 $0 $4,504 $4,987 $6,460 Count 2 2 3 0 3 2 1
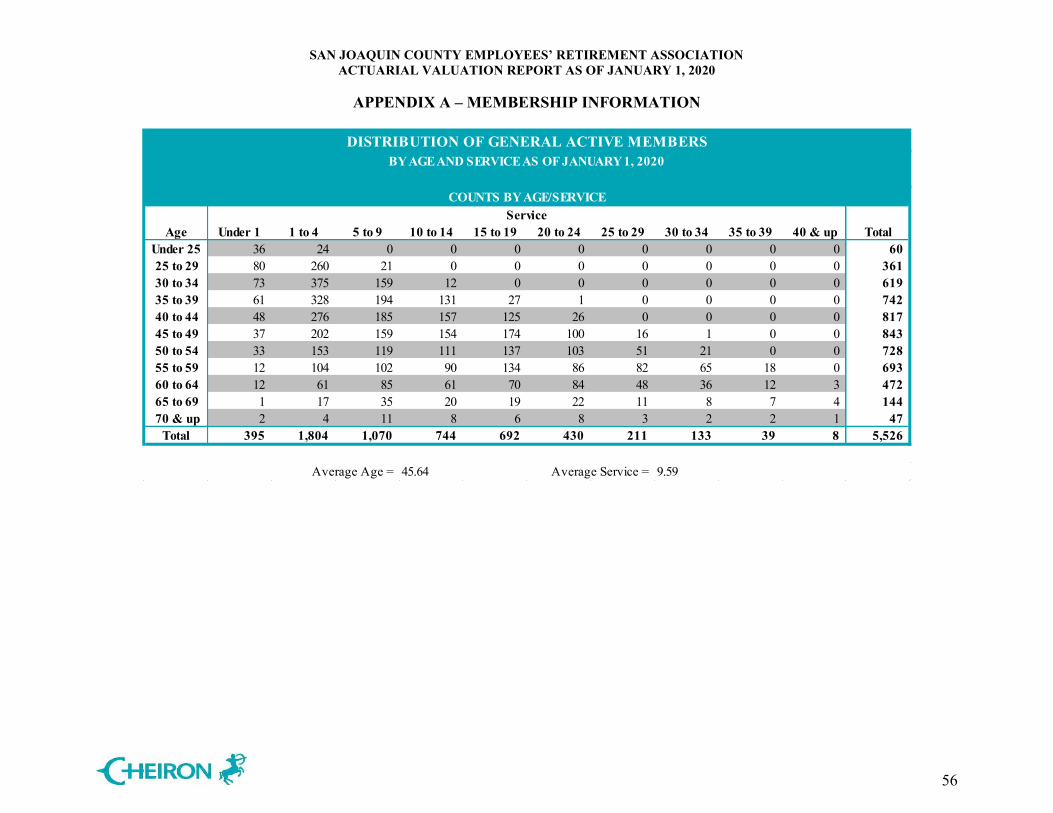
SAN JOAQUIN COUNTY EMPLOYEES’ RETIREMENT ASSOCIATION ACTUARIAL VALUATION REPORT AS OF JANUARY 1, 2020
APPENDIX A – MEMBERSHIP INFORMATION
56
DISTRIBUTION OF GENERAL ACTIVE MEMBERS DISTRIBUTION OF SAFETY ACTIVE MEMBERSBY AGE AND SERVICE AS OF JANUARY 1, 2020 BY AGE AND SERVICE AS OF JANUARY 1, 2020
COUNTS BY AGE/SERVICE COUNTS BY AGE/SERVICEService Service
Age Under 1 1 to 4 5 to 9 10 to 14 15 to 19 20 to 24 25 to 29 30 to 34 35 to 39 40 & up TotalUnder 25 36 24 0 0 0 0 0 0 0 0 60 25 to 29 80 260 21 0 0 0 0 0 0 0 361 30 to 34 73 375 159 12 0 0 0 0 0 0 619 35 to 39 61 328 194 131 27 1 0 0 0 0 742 40 to 44 48 276 185 157 125 26 0 0 0 0 817 45 to 49 37 202 159 154 174 100 16 1 0 0 843 50 to 54 33 153 119 111 137 103 51 21 0 0 728 55 to 59 12 104 102 90 134 86 82 65 18 0 693 60 to 64 12 61 85 61 70 84 48 36 12 3 472 65 to 69 1 17 35 20 19 22 11 8 7 4 144 70 & up 2 4 11 8 6 8 3 2 2 1 47
Total 395 1,804 1,070 744 692 430 211 133 39 8 5,526
Average Age = 45.64 Average Service = 9.59
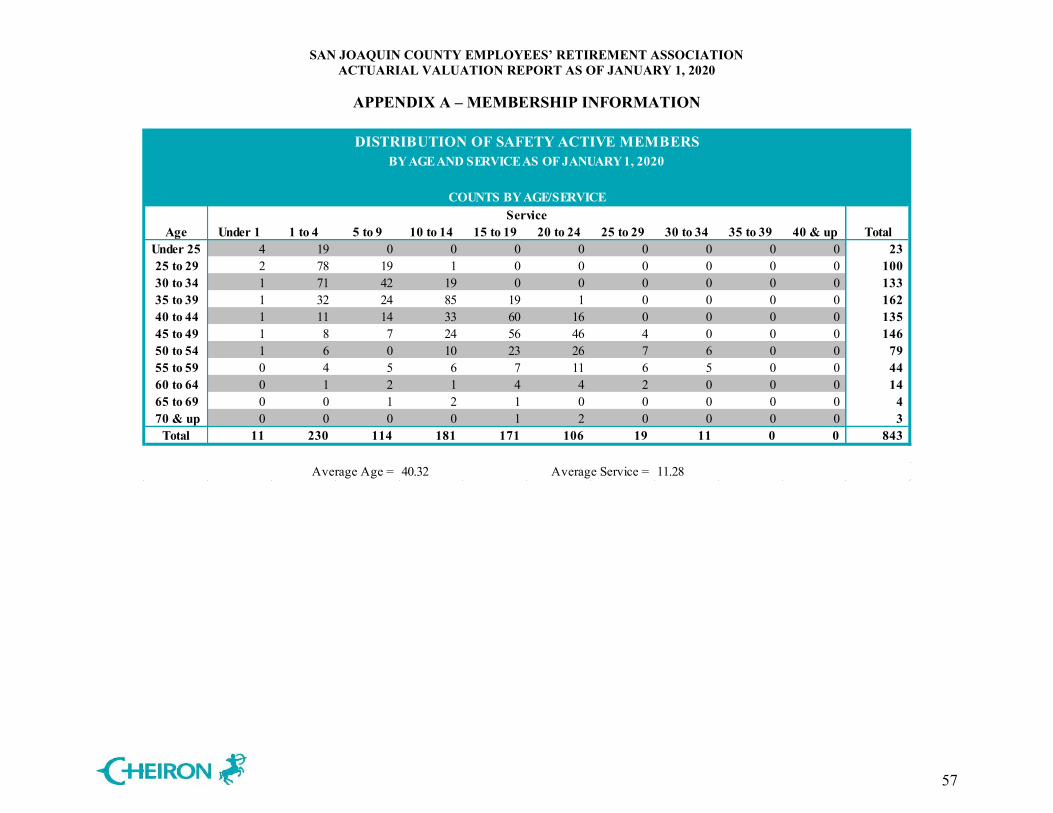
SAN JOAQUIN COUNTY EMPLOYEES’ RETIREMENT ASSOCIATION ACTUARIAL VALUATION REPORT AS OF JANUARY 1, 2020
APPENDIX A – MEMBERSHIP INFORMATION
57
DISTRIBUTION OF SAFETY ACTIVE MEMBERS PAYROLL DISTRIBUTION OF GENERAL ACTIVE PARTICIPANTSBY AGE AND SERVICE AS OF JANUARY 1, 2020 BY AGE AND SERVICE AS OF JANUARY 1, 2020
COUNTS BY AGE/SERVICE COUNTS BY AGE/SERVICEService Service
Age Under 1 1 to 4 5 to 9 10 to 14 15 to 19 20 to 24 25 to 29 30 to 34 35 to 39 40 & up TotalUnder 25 4 19 0 0 0 0 0 0 0 0 23 25 to 29 2 78 19 1 0 0 0 0 0 0 100 30 to 34 1 71 42 19 0 0 0 0 0 0 133 35 to 39 1 32 24 85 19 1 0 0 0 0 162 40 to 44 1 11 14 33 60 16 0 0 0 0 135 45 to 49 1 8 7 24 56 46 4 0 0 0 146 50 to 54 1 6 0 10 23 26 7 6 0 0 79 55 to 59 0 4 5 6 7 11 6 5 0 0 44 60 to 64 0 1 2 1 4 4 2 0 0 0 14 65 to 69 0 0 1 2 1 0 0 0 0 0 4 70 & up 0 0 0 0 1 2 0 0 0 0 3
Total 11 230 114 181 171 106 19 11 0 0 843
Average Age = 40.32 Average Service = 11.28
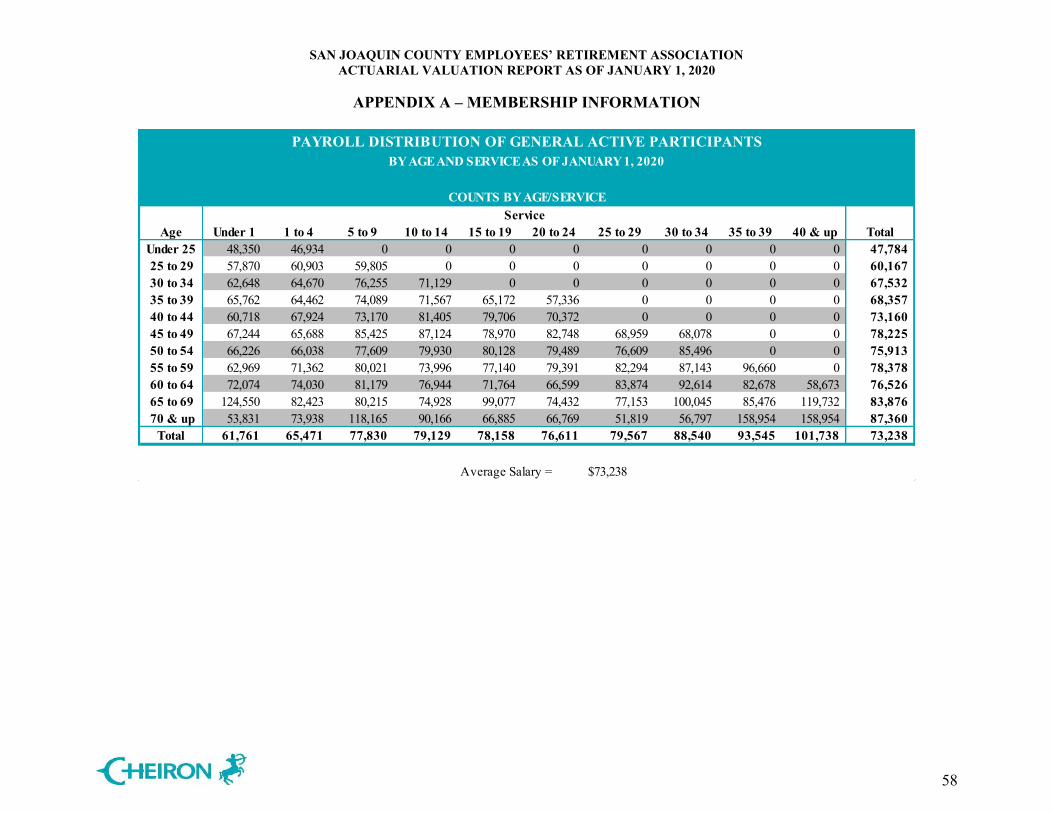
SAN JOAQUIN COUNTY EMPLOYEES’ RETIREMENT ASSOCIATION ACTUARIAL VALUATION REPORT AS OF JANUARY 1, 2020
APPENDIX A – MEMBERSHIP INFORMATION
58
PAYROLL DISTRIBUTION OF GENERAL ACTIVE PARTICIPANTS PAYROLL DISTRIBUTION OF SAFETY ACTIVE PARTICIPANTSBY AGE AND SERVICE AS OF JANUARY 1, 2020 BY AGE AND SERVICE AS OF JANUARY 1, 2020
COUNTS BY AGE/SERVICE COUNTS BY AGE/SERVICEService Service
Age Under 1 1 to 4 5 to 9 10 to 14 15 to 19 20 to 24 25 to 29 30 to 34 35 to 39 40 & up TotalUnder 25 48,350 46,934 0 0 0 0 0 0 0 0 47,784 25 to 29 57,870 60,903 59,805 0 0 0 0 0 0 0 60,167 30 to 34 62,648 64,670 76,255 71,129 0 0 0 0 0 0 67,532 35 to 39 65,762 64,462 74,089 71,567 65,172 57,336 0 0 0 0 68,357 40 to 44 60,718 67,924 73,170 81,405 79,706 70,372 0 0 0 0 73,160 45 to 49 67,244 65,688 85,425 87,124 78,970 82,748 68,959 68,078 0 0 78,225 50 to 54 66,226 66,038 77,609 79,930 80,128 79,489 76,609 85,496 0 0 75,913 55 to 59 62,969 71,362 80,021 73,996 77,140 79,391 82,294 87,143 96,660 0 78,378 60 to 64 72,074 74,030 81,179 76,944 71,764 66,599 83,874 92,614 82,678 58,673 76,526 65 to 69 124,550 82,423 80,215 74,928 99,077 74,432 77,153 100,045 85,476 119,732 83,876 70 & up 53,831 73,938 118,165 90,166 66,885 66,769 51,819 56,797 158,954 158,954 87,360
Total 61,761 65,471 77,830 79,129 78,158 76,611 79,567 88,540 93,545 101,738 73,238
Average Salary = $73,238
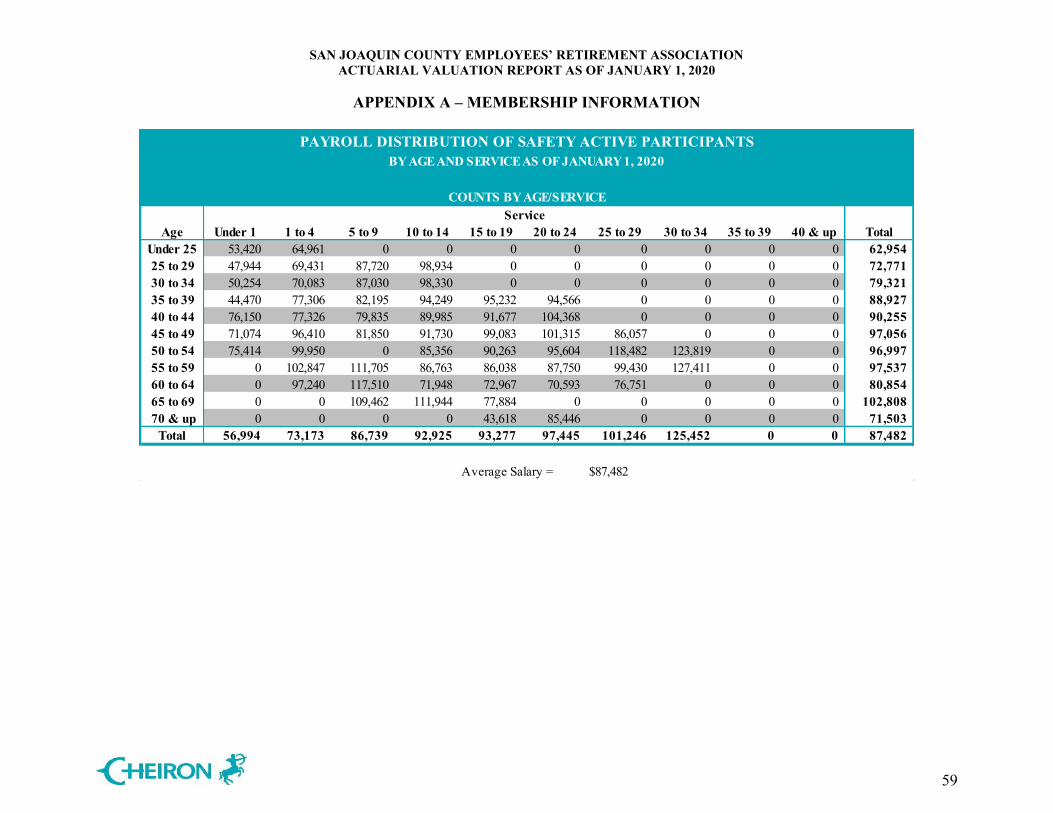
SAN JOAQUIN COUNTY EMPLOYEES’ RETIREMENT ASSOCIATION ACTUARIAL VALUATION REPORT AS OF JANUARY 1, 2020
APPENDIX A – MEMBERSHIP INFORMATION
59
PAYROLL DISTRIBUTION OF SAFETY ACTIVE PARTICIPANTSBY AGE AND SERVICE AS OF JANUARY 1, 2020
COUNTS BY AGE/SERVICEService
Age Under 1 1 to 4 5 to 9 10 to 14 15 to 19 20 to 24 25 to 29 30 to 34 35 to 39 40 & up TotalUnder 25 53,420 64,961 0 0 0 0 0 0 0 0 62,954 25 to 29 47,944 69,431 87,720 98,934 0 0 0 0 0 0 72,771 30 to 34 50,254 70,083 87,030 98,330 0 0 0 0 0 0 79,321 35 to 39 44,470 77,306 82,195 94,249 95,232 94,566 0 0 0 0 88,927 40 to 44 76,150 77,326 79,835 89,985 91,677 104,368 0 0 0 0 90,255 45 to 49 71,074 96,410 81,850 91,730 99,083 101,315 86,057 0 0 0 97,056 50 to 54 75,414 99,950 0 85,356 90,263 95,604 118,482 123,819 0 0 96,997 55 to 59 0 102,847 111,705 86,763 86,038 87,750 99,430 127,411 0 0 97,537 60 to 64 0 97,240 117,510 71,948 72,967 70,593 76,751 0 0 0 80,854 65 to 69 0 0 109,462 111,944 77,884 0 0 0 0 0 102,808 70 & up 0 0 0 0 43,618 85,446 0 0 0 0 71,503
Total 56,994 73,173 86,739 92,925 93,277 97,445 101,246 125,452 0 0 87,482
Average Salary = $87,482
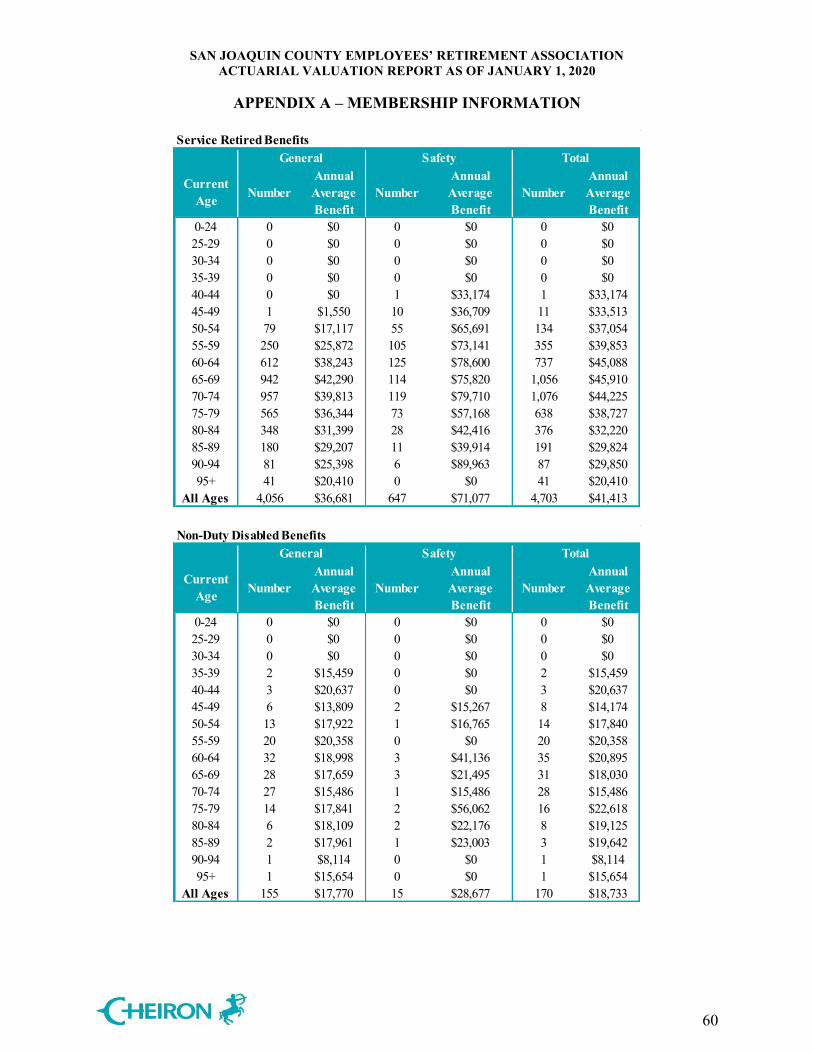
SAN JOAQUIN COUNTY EMPLOYEES’ RETIREMENT ASSOCIATION ACTUARIAL VALUATION REPORT AS OF JANUARY 1, 2020
APPENDIX A – MEMBERSHIP INFORMATION
60
Service Retired Benefits
Current Age Number
Annual Average Benefit
NumberAnnual Average Benefit
NumberAnnual Average Benefit
0-24 0 $0 0 $0 0 $0 25-29 0 $0 0 $0 0 $0 30-34 0 $0 0 $0 0 $0 35-39 0 $0 0 $0 0 $0 40-44 0 $0 1 $33,174 1 $33,174 45-49 1 $1,550 10 $36,709 11 $33,513 50-54 79 $17,117 55 $65,691 134 $37,054 55-59 250 $25,872 105 $73,141 355 $39,853 60-64 612 $38,243 125 $78,600 737 $45,088 65-69 942 $42,290 114 $75,820 1,056 $45,910 70-74 957 $39,813 119 $79,710 1,076 $44,225 75-79 565 $36,344 73 $57,168 638 $38,727 80-84 348 $31,399 28 $42,416 376 $32,220 85-89 180 $29,207 11 $39,914 191 $29,824 90-94 81 $25,398 6 $89,963 87 $29,850 95+ 41 $20,410 0 $0 41 $20,410
All Ages 4,056 $36,681 647 $71,077 4,703 $41,413
General Safety Total
Non-Duty Disabled Benefits
Current Age Number
Annual Average Benefit
NumberAnnual Average Benefit
NumberAnnual Average Benefit
0-24 0 $0 0 $0 0 $0 25-29 0 $0 0 $0 0 $0 30-34 0 $0 0 $0 0 $0 35-39 2 $15,459 0 $0 2 $15,459 40-44 3 $20,637 0 $0 3 $20,637 45-49 6 $13,809 2 $15,267 8 $14,174 50-54 13 $17,922 1 $16,765 14 $17,840 55-59 20 $20,358 0 $0 20 $20,358 60-64 32 $18,998 3 $41,136 35 $20,895 65-69 28 $17,659 3 $21,495 31 $18,030 70-74 27 $15,486 1 $15,486 28 $15,486 75-79 14 $17,841 2 $56,062 16 $22,618 80-84 6 $18,109 2 $22,176 8 $19,125 85-89 2 $17,961 1 $23,003 3 $19,642 90-94 1 $8,114 0 $0 1 $8,114 95+ 1 $15,654 0 $0 1 $15,654
All Ages 155 $17,770 15 $28,677 170 $18,733
General Safety Total
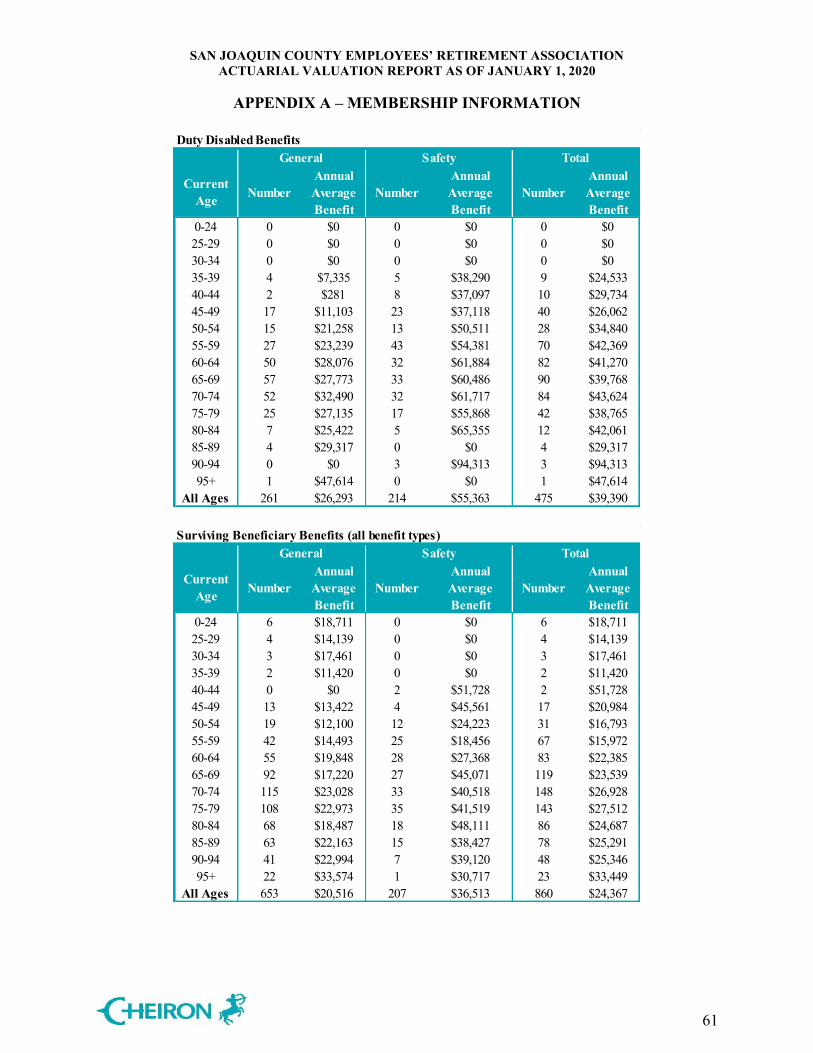
SAN JOAQUIN COUNTY EMPLOYEES’ RETIREMENT ASSOCIATION ACTUARIAL VALUATION REPORT AS OF JANUARY 1, 2020
APPENDIX A – MEMBERSHIP INFORMATION
61
Duty Disabled Benefits
Current Age Number
Annual Average Benefit
NumberAnnual Average Benefit
NumberAnnual Average Benefit
0-24 0 $0 0 $0 0 $0 25-29 0 $0 0 $0 0 $0 30-34 0 $0 0 $0 0 $0 35-39 4 $7,335 5 $38,290 9 $24,533 40-44 2 $281 8 $37,097 10 $29,734 45-49 17 $11,103 23 $37,118 40 $26,062 50-54 15 $21,258 13 $50,511 28 $34,840 55-59 27 $23,239 43 $54,381 70 $42,369 60-64 50 $28,076 32 $61,884 82 $41,270 65-69 57 $27,773 33 $60,486 90 $39,768 70-74 52 $32,490 32 $61,717 84 $43,624 75-79 25 $27,135 17 $55,868 42 $38,765 80-84 7 $25,422 5 $65,355 12 $42,061 85-89 4 $29,317 0 $0 4 $29,317 90-94 0 $0 3 $94,313 3 $94,313 95+ 1 $47,614 0 $0 1 $47,614
All Ages 261 $26,293 214 $55,363 475 $39,390
General Safety Total
Surviving Beneficiary Benefits (all benefit types)
Current Age Number
Annual Average Benefit
NumberAnnual Average Benefit
NumberAnnual Average Benefit
0-24 6 $18,711 0 $0 6 $18,711 25-29 4 $14,139 0 $0 4 $14,139 30-34 3 $17,461 0 $0 3 $17,461 35-39 2 $11,420 0 $0 2 $11,420 40-44 0 $0 2 $51,728 2 $51,728 45-49 13 $13,422 4 $45,561 17 $20,984 50-54 19 $12,100 12 $24,223 31 $16,793 55-59 42 $14,493 25 $18,456 67 $15,972 60-64 55 $19,848 28 $27,368 83 $22,385 65-69 92 $17,220 27 $45,071 119 $23,539 70-74 115 $23,028 33 $40,518 148 $26,928 75-79 108 $22,973 35 $41,519 143 $27,512 80-84 68 $18,487 18 $48,111 86 $24,687 85-89 63 $22,163 15 $38,427 78 $25,291 90-94 41 $22,994 7 $39,120 48 $25,346 95+ 22 $33,574 1 $30,717 23 $33,449
All Ages 653 $20,516 207 $36,513 860 $24,367
General Safety Total
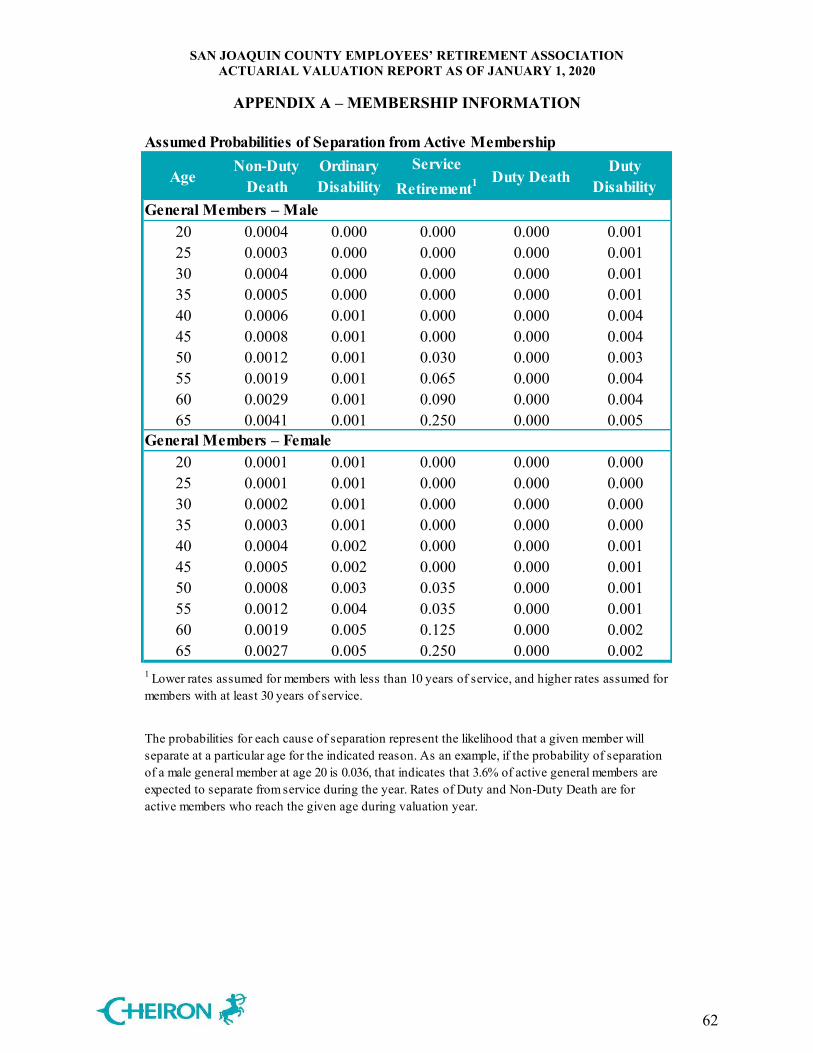
SAN JOAQUIN COUNTY EMPLOYEES’ RETIREMENT ASSOCIATION ACTUARIAL VALUATION REPORT AS OF JANUARY 1, 2020
APPENDIX A – MEMBERSHIP INFORMATION
62
Assumed Probabilities of Separation from Active Membership
AgeNon-Duty
DeathOrdinary Disability
Service Retirement1 Duty Death
Duty Disability
20 0.0004 0.000 0.000 0.000 0.00125 0.0003 0.000 0.000 0.000 0.00130 0.0004 0.000 0.000 0.000 0.00135 0.0005 0.000 0.000 0.000 0.00140 0.0006 0.001 0.000 0.000 0.00445 0.0008 0.001 0.000 0.000 0.00450 0.0012 0.001 0.030 0.000 0.00355 0.0019 0.001 0.065 0.000 0.00460 0.0029 0.001 0.090 0.000 0.00465 0.0041 0.001 0.250 0.000 0.005
20 0.0001 0.001 0.000 0.000 0.00025 0.0001 0.001 0.000 0.000 0.00030 0.0002 0.001 0.000 0.000 0.00035 0.0003 0.001 0.000 0.000 0.00040 0.0004 0.002 0.000 0.000 0.00145 0.0005 0.002 0.000 0.000 0.00150 0.0008 0.003 0.035 0.000 0.00155 0.0012 0.004 0.035 0.000 0.00160 0.0019 0.005 0.125 0.000 0.00265 0.0027 0.005 0.250 0.000 0.002
General Members – Male
General Members – Female
1 Lower rates assumed for members with less than 10 years of service, and higher rates assumed for members with at least 30 years of service.
The probabilities for each cause of separation represent the likelihood that a given member will separate at a particular age for the indicated reason. As an example, if the probability of separation of a male general member at age 20 is 0.036, that indicates that 3.6% of active general members are expected to separate from service during the year. Rates of Duty and Non-Duty Death are for active members who reach the given age during valuation year.
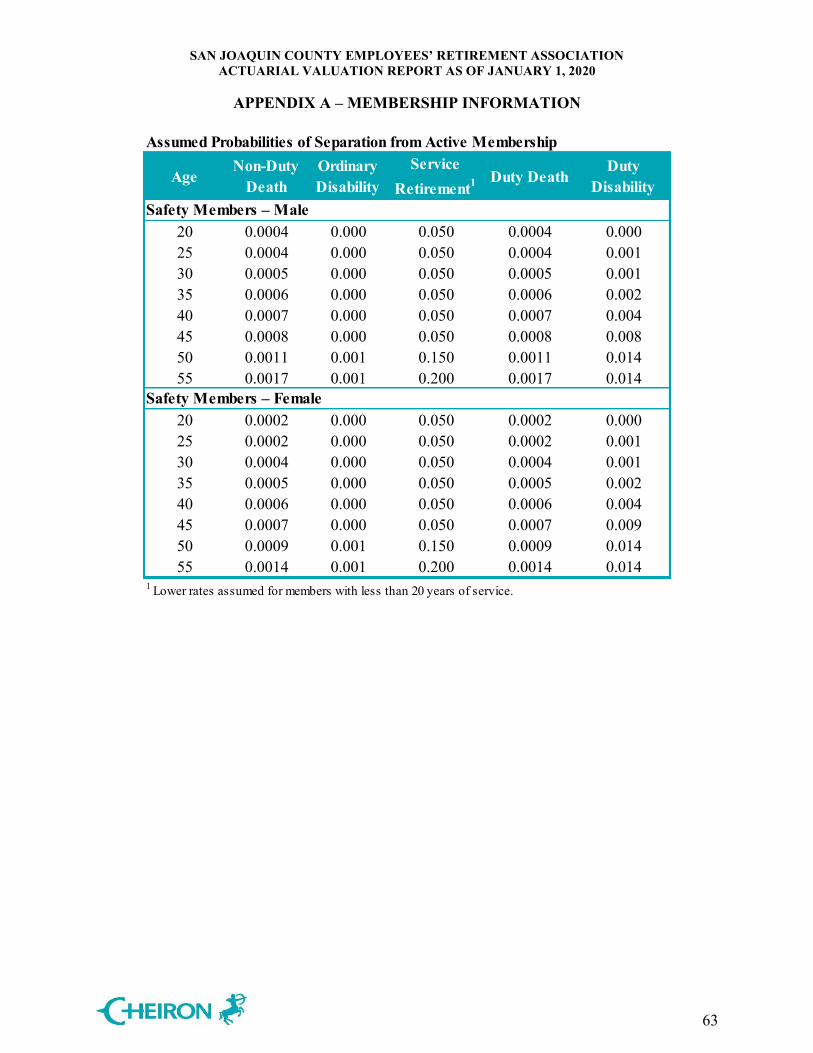
SAN JOAQUIN COUNTY EMPLOYEES’ RETIREMENT ASSOCIATION ACTUARIAL VALUATION REPORT AS OF JANUARY 1, 2020
APPENDIX A – MEMBERSHIP INFORMATION
63
Assumed Probabilities of Separation from Active Membership
AgeNon-Duty
DeathOrdinary Disability
Service Retirement1 Duty Death
Duty Disability
20 0.0004 0.000 0.050 0.0004 0.00025 0.0004 0.000 0.050 0.0004 0.00130 0.0005 0.000 0.050 0.0005 0.00135 0.0006 0.000 0.050 0.0006 0.00240 0.0007 0.000 0.050 0.0007 0.00445 0.0008 0.000 0.050 0.0008 0.00850 0.0011 0.001 0.150 0.0011 0.01455 0.0017 0.001 0.200 0.0017 0.014
20 0.0002 0.000 0.050 0.0002 0.00025 0.0002 0.000 0.050 0.0002 0.00130 0.0004 0.000 0.050 0.0004 0.00135 0.0005 0.000 0.050 0.0005 0.00240 0.0006 0.000 0.050 0.0006 0.00445 0.0007 0.000 0.050 0.0007 0.00950 0.0009 0.001 0.150 0.0009 0.01455 0.0014 0.001 0.200 0.0014 0.014
1 Lower rates assumed for members with less than 20 years of service.
Safety Members – Male
Safety Members – Female
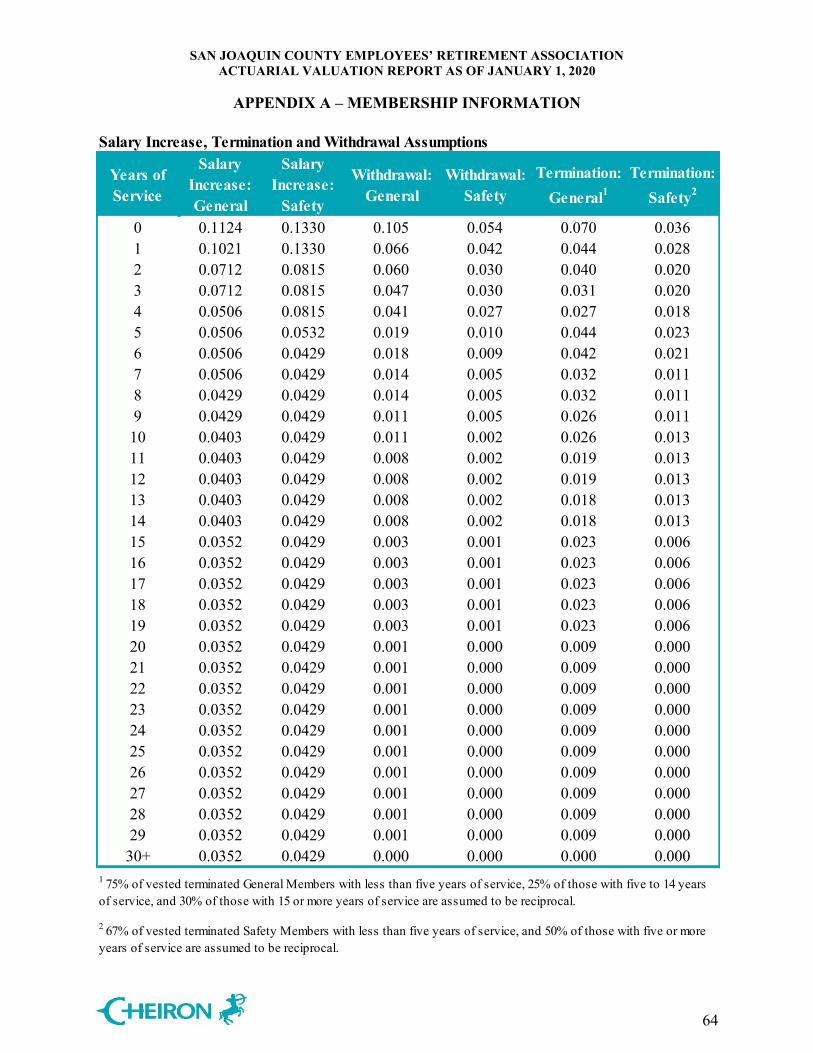
SAN JOAQUIN COUNTY EMPLOYEES’ RETIREMENT ASSOCIATION ACTUARIAL VALUATION REPORT AS OF JANUARY 1, 2020
APPENDIX A – MEMBERSHIP INFORMATION
64
Salary Increase, Termination and Withdrawal Assumptions
Years of Service
Salary Increase: General
Salary Increase:
Safety
Withdrawal: General
Withdrawal: Safety
Termination: General1
Termination: Safety2
0 0.1124 0.1330 0.105 0.054 0.070 0.0361 0.1021 0.1330 0.066 0.042 0.044 0.0282 0.0712 0.0815 0.060 0.030 0.040 0.0203 0.0712 0.0815 0.047 0.030 0.031 0.0204 0.0506 0.0815 0.041 0.027 0.027 0.0185 0.0506 0.0532 0.019 0.010 0.044 0.0236 0.0506 0.0429 0.018 0.009 0.042 0.0217 0.0506 0.0429 0.014 0.005 0.032 0.0118 0.0429 0.0429 0.014 0.005 0.032 0.0119 0.0429 0.0429 0.011 0.005 0.026 0.01110 0.0403 0.0429 0.011 0.002 0.026 0.01311 0.0403 0.0429 0.008 0.002 0.019 0.01312 0.0403 0.0429 0.008 0.002 0.019 0.01313 0.0403 0.0429 0.008 0.002 0.018 0.01314 0.0403 0.0429 0.008 0.002 0.018 0.01315 0.0352 0.0429 0.003 0.001 0.023 0.00616 0.0352 0.0429 0.003 0.001 0.023 0.00617 0.0352 0.0429 0.003 0.001 0.023 0.00618 0.0352 0.0429 0.003 0.001 0.023 0.00619 0.0352 0.0429 0.003 0.001 0.023 0.00620 0.0352 0.0429 0.001 0.000 0.009 0.00021 0.0352 0.0429 0.001 0.000 0.009 0.00022 0.0352 0.0429 0.001 0.000 0.009 0.00023 0.0352 0.0429 0.001 0.000 0.009 0.00024 0.0352 0.0429 0.001 0.000 0.009 0.00025 0.0352 0.0429 0.001 0.000 0.009 0.00026 0.0352 0.0429 0.001 0.000 0.009 0.00027 0.0352 0.0429 0.001 0.000 0.009 0.00028 0.0352 0.0429 0.001 0.000 0.009 0.00029 0.0352 0.0429 0.001 0.000 0.009 0.000
30+ 0.0352 0.0429 0.000 0.000 0.000 0.0001 75% of vested terminated General Members with less than five years of service, 25% of those with five to 14 years of service, and 30% of those with 15 or more years of service are assumed to be reciprocal.
2 67% of vested terminated Safety Members with less than five years of service, and 50% of those with five or more years of service are assumed to be reciprocal.
SAN JOAQUIN COUNTY EMPLOYEES’ RETIREMENT ASSOCIATION ACTUARIAL VALUATION REPORT AS OF JANUARY 1, 2020
APPENDIX B – STATEMENT OF CURRENT
ACTUARIAL ASSUMPTIONS AND METHODS
65
The assumptions and methods used in the actuarial valuation as of January 1, 2020 are: Actuarial Methods
1. Actuarial Cost Method The actuarial valuation is prepared using the entry age actuarial cost method (CERL 31453.5). Under the principles of this method, the actuarial present value of the projected benefits of each individual included in the valuation is allocated as a level percentage of the individual's projected compensation between entry age and assumed exit (until maximum retirement age). For members who transferred from outside of SJCERA, entry age (for the actuarial cost calculation only) is based on entry into the system. The normal cost for the Plan is based on the sum of the individual normal costs for each member (Individual Entry Age Method). The UAL (or Surplus Funding) is amortized as a percentage of the projected salaries of present and future members of SJCERA. Effective with the January 1, 2015 valuation, the UAL as of January 1, 2014 is amortized over a closed 19-year period (13 years remaining as of January 1, 2020), except for the additional UAL attributable to the extraordinary loss from 2008, which is being amortized over a separate closed period (19 years as of January 1, 2020). Any subsequent unexpected change in the Unfunded Actuarial Liability after January 1, 2014 is amortized over 15 years. The UAL payment for the 2020 assumption change is being phased in over a three-year period.
2. Valuation of Assets
The assets are valued using a five-year smoothed method based on the difference between the expected market value and the actual market value of the assets as of the valuation date. The expected market value is the prior year’s market value increased with the net increase in the cash flow of funds, all increased with interest during the past fiscal year at the expected investment return rate assumption. An asset corridor limit is applied such that the smoothed Market Value of Assets stays within 20% of the Market Value of Assets.
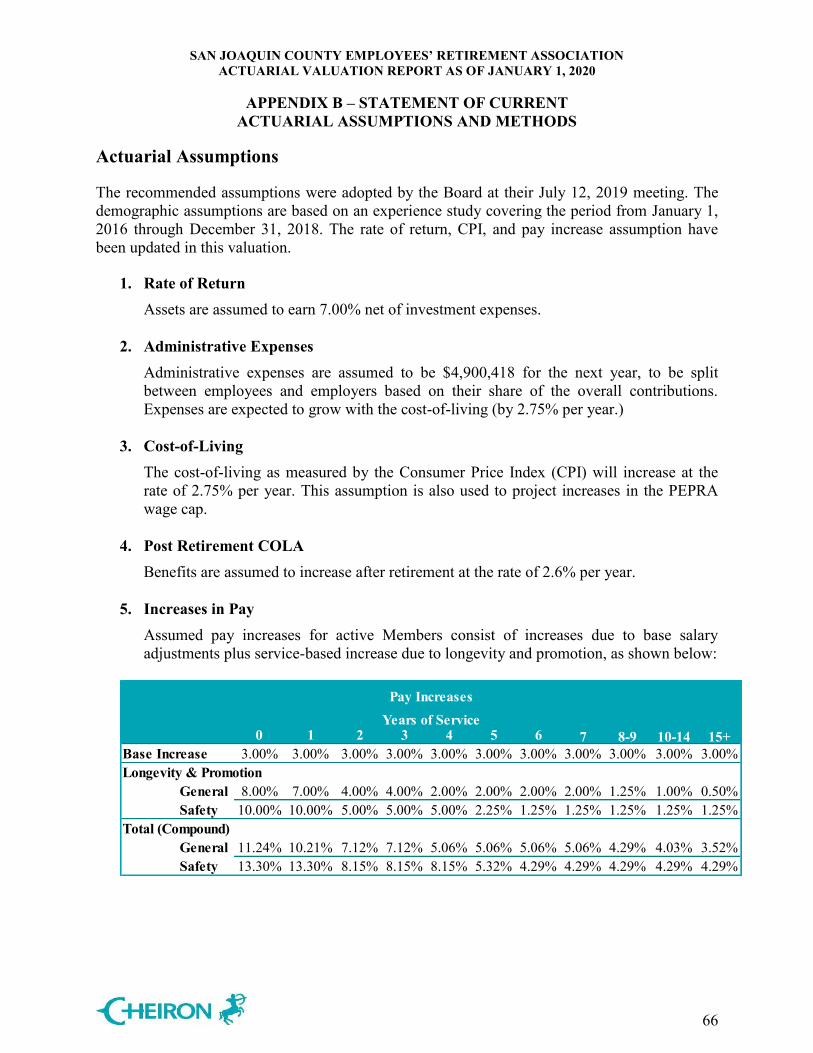
SAN JOAQUIN COUNTY EMPLOYEES’ RETIREMENT ASSOCIATION ACTUARIAL VALUATION REPORT AS OF JANUARY 1, 2020
APPENDIX B – STATEMENT OF CURRENT
ACTUARIAL ASSUMPTIONS AND METHODS
66
Actuarial Assumptions The recommended assumptions were adopted by the Board at their July 12, 2019 meeting. The demographic assumptions are based on an experience study covering the period from January 1, 2016 through December 31, 2018. The rate of return, CPI, and pay increase assumption have been updated in this valuation.
1. Rate of Return Assets are assumed to earn 7.00% net of investment expenses.
2. Administrative Expenses Administrative expenses are assumed to be $4,900,418 for the next year, to be split between employees and employers based on their share of the overall contributions. Expenses are expected to grow with the cost-of-living (by 2.75% per year.)
3. Cost-of-Living
The cost-of-living as measured by the Consumer Price Index (CPI) will increase at the rate of 2.75% per year. This assumption is also used to project increases in the PEPRA wage cap.
4. Post Retirement COLA
Benefits are assumed to increase after retirement at the rate of 2.6% per year.
5. Increases in Pay Assumed pay increases for active Members consist of increases due to base salary adjustments plus service-based increase due to longevity and promotion, as shown below:
Years of Service0 1 2 3 4 5 6 7 8-9 10-14 15+
Base Increase 3.00% 3.00% 3.00% 3.00% 3.00% 3.00% 3.00% 3.00% 3.00% 3.00% 3.00%Longevity & Promotion
General 8.00% 7.00% 4.00% 4.00% 2.00% 2.00% 2.00% 2.00% 1.25% 1.00% 0.50%Safety 10.00% 10.00% 5.00% 5.00% 5.00% 2.25% 1.25% 1.25% 1.25% 1.25% 1.25%
Total (Compound)General 11.24% 10.21% 7.12% 7.12% 5.06% 5.06% 5.06% 5.06% 4.29% 4.03% 3.52%Safety 13.30% 13.30% 8.15% 8.15% 8.15% 5.32% 4.29% 4.29% 4.29% 4.29% 4.29%
Pay Increases

SAN JOAQUIN COUNTY EMPLOYEES’ RETIREMENT ASSOCIATION ACTUARIAL VALUATION REPORT AS OF JANUARY 1, 2020
APPENDIX B – STATEMENT OF CURRENT
ACTUARIAL ASSUMPTIONS AND METHODS
67
6. Family Composition
Percentage married for all active members who retire, become disabled, or die during active service is shown in the following table. Male members are assumed to be three years older than their spouses, and female members are assumed to be two years younger than their spouses.
Gender PercentageMales 75%
Females 55%
Percentage Married
7. Rates of Termination Sample rates of termination are shown in the following table. Termination rates do not apply once a member is eligible for retirement.
Years of Service
General Safety
0 17.50% 9.00%1 11.00% 7.00%2 10.00% 5.00%3 7.75% 5.00%4 6.75% 4.50%5 6.25% 3.25%6 6.00% 3.00%7 4.50% 1.50%8 4.50% 1.50%9 3.75% 1.50%10 3.75% 1.50%
11-12 2.75% 1.50%13-14 2.50% 1.50%15-19 2.50% 0.75%20-29 1.00% 0.00%30+ 0.00% 0.00%
Rates of Termination
8. Withdrawal Rates of withdrawal apply to active Members who terminate their employment and withdraw their member contributions, forfeiting entitlement to future Plan benefits.
SAN JOAQUIN COUNTY EMPLOYEES’ RETIREMENT ASSOCIATION ACTUARIAL VALUATION REPORT AS OF JANUARY 1, 2020
APPENDIX B – STATEMENT OF CURRENT
ACTUARIAL ASSUMPTIONS AND METHODS
68
60% of all General Member terminations with less than five years of service, 30% of those with five to 14 years of service, and 10% of those with more than 15 years of service, are assumed to take a refund of contributions. 60% of all Safety Member terminations with less than five years of service, 30% of those with five to 9 years of service, and 15% of those with more than 10 years of service, are assumed to take a refund of contributions.
9. Vested Termination and Reciprocal Transfers Rates of vested termination apply to active Members who terminate their employment and leave their member contributions on deposit with the Plan. 40% of all General Member terminations with less than five years of service, 70% of those with five to 14 years of service, and 90% of those with 15 or more years of service, are assumed to leave their contributions on deposit. 40% of all Safety Member terminations with less than five years of service, 70% of those with five to nine years of service, and 85% of those with 10 or more years of service, are assumed to leave their contributions on deposit. Vested terminated General Members are assumed to begin receiving benefits at age 58; vested terminated Safety Members are assumed to begin receiving benefits at age 50, unless they have outgoing reciprocity, in which case they are assumed to begin receiving benefits at age 53. 75% of vested terminated General Members with less than five years of service, 25% of those with five to 14 years of service, and 30% of those with 15 or more years of service, are assumed to be reciprocal. 67% of vested terminated Safety Members with less than five years of service, and 50% of those with five or more years of service, are assumed to be reciprocal. Final average pay for General Members who terminate with reciprocity is assumed to increase by 3.67% per year until their assumed retirement date. Final average pay for Safety Members who terminate with reciprocity is assumed to increase by 4.44% per year until their assumed retirement date.
10. Rates of Service-Connected Disability Sample service-connected disability rates of active participants are provided in the table on the next page.
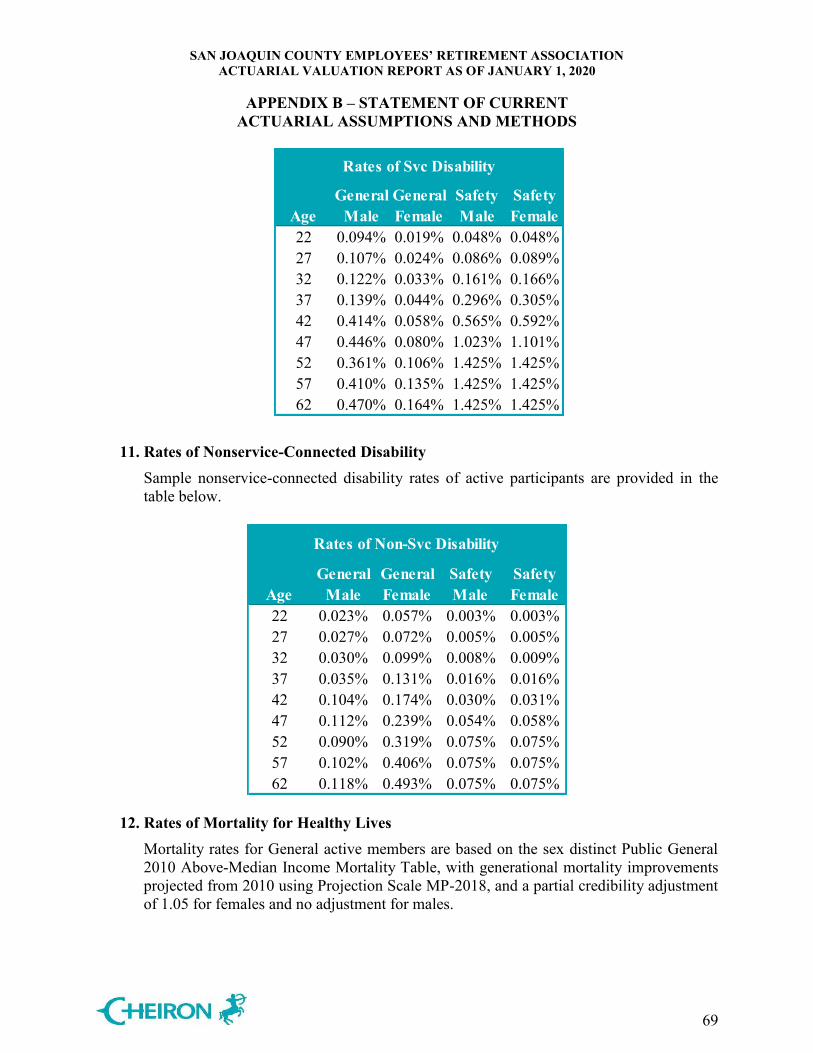
SAN JOAQUIN COUNTY EMPLOYEES’ RETIREMENT ASSOCIATION ACTUARIAL VALUATION REPORT AS OF JANUARY 1, 2020
APPENDIX B – STATEMENT OF CURRENT
ACTUARIAL ASSUMPTIONS AND METHODS
69
General General Safety SafetyAge Male Female Male Female22 0.094% 0.019% 0.048% 0.048%27 0.107% 0.024% 0.086% 0.089%32 0.122% 0.033% 0.161% 0.166%37 0.139% 0.044% 0.296% 0.305%42 0.414% 0.058% 0.565% 0.592%47 0.446% 0.080% 1.023% 1.101%52 0.361% 0.106% 1.425% 1.425%57 0.410% 0.135% 1.425% 1.425%62 0.470% 0.164% 1.425% 1.425%
Rates of Svc Disability
11. Rates of Nonservice-Connected Disability Sample nonservice-connected disability rates of active participants are provided in the table below.
General General Safety SafetyAge Male Female Male Female22 0.023% 0.057% 0.003% 0.003%27 0.027% 0.072% 0.005% 0.005%32 0.030% 0.099% 0.008% 0.009%37 0.035% 0.131% 0.016% 0.016%42 0.104% 0.174% 0.030% 0.031%47 0.112% 0.239% 0.054% 0.058%52 0.090% 0.319% 0.075% 0.075%57 0.102% 0.406% 0.075% 0.075%62 0.118% 0.493% 0.075% 0.075%
Rates of Non-Svc Disability
12. Rates of Mortality for Healthy Lives
Mortality rates for General active members are based on the sex distinct Public General 2010 Above-Median Income Mortality Table, with generational mortality improvements projected from 2010 using Projection Scale MP-2018, and a partial credibility adjustment of 1.05 for females and no adjustment for males.
SAN JOAQUIN COUNTY EMPLOYEES’ RETIREMENT ASSOCIATION ACTUARIAL VALUATION REPORT AS OF JANUARY 1, 2020
APPENDIX B – STATEMENT OF CURRENT
ACTUARIAL ASSUMPTIONS AND METHODS
70
Mortality rates for Safety active members are based on the sex distinct Public Safety 2010 Mortality Table, with generational mortality improvements projected from 2010 using Projection Scale MP-2018, and a partial credibility adjustment of 0.98 for males and 1.06 for females. 10% of Safety member active deaths are assumed to occur in the line of duty.
Mortality rates for healthy General annuitants and General beneficiaries are based on the sex distinct Public General 2010 Above-Median Income Mortality Table, with generational mortality improvements projected from 2010 using Projection Scale MP-2018, and a partial credibility adjustment of 1.04 for females and no adjustment for males.
Mortality rates for Safety annuitants and Safety beneficiaries are based on the sex distinct Public Safety 2010 Mortality Table, with generational mortality improvements projected from 2010 using Projection Scale MP-2018, and a partial credibility adjustment of 1.02 for males and 1.05 for females.
13. Rates of Mortality for Disabled Retirees
Mortality rates for General disabled annuitants are based on the sex distinct Public General Disabled Annuitant 2010 Mortality Table, with generational mortality improvements projected from 2010 using Projection Scale MP-2018, with a partial credibility adjustment of 1.04 for males and 1.07 for females. Mortality rates for Safety disabled annuitants are based on the sex distinct Public Safety Disabled Annuitant 2010 Mortality Table, with generational mortality improvements projected from 2010 using Projection Scale MP-2018, with a partial credibility adjustment of 1.04 for males and 0.98 for females.
14. Mortality Improvement
The mortality assumptions employ a fully generational mortality improvement projection from the base year of the Society of Actuaries’ new Public mortality tables (2010) using Scale MP-2018.
15. Adjustment for Service Purchases
SJCERA provides Cheiron with the amount of service that active employees are eligible to purchase. We include this service when calculating the employees’ benefit eligibility. Half of eligible service purchases, which have not been purchased by the members, are included in the employees’ Credited Service, as employees will pay approximately half of the normal cost for these benefits when purchasing this service.
SAN JOAQUIN COUNTY EMPLOYEES’ RETIREMENT ASSOCIATION ACTUARIAL VALUATION REPORT AS OF JANUARY 1, 2020
APPENDIX B – STATEMENT OF CURRENT
ACTUARIAL ASSUMPTIONS AND METHODS
71
16. Assumptions for Employee Contribution Rates Mortality rates are the base mortality tables described above, projected using Scale MP-2018 from 2010 to 2040 for General and Safety Members. The projection periods are based on the duration of active liabilities for the respective groups, and the period during which the associated employee contribution rates will be in use. The employee contribution rates are also blended using a male/female weighting of 29%/71% for General Members and 75%/25% for Safety members.
17. Rates of Retirement Rates of retirement are based on age and service according to the following table.

SAN JOAQUIN COUNTY EMPLOYEES’ RETIREMENT ASSOCIATION ACTUARIAL VALUATION REPORT AS OF JANUARY 1, 2020
APPENDIX B – STATEMENT OF CURRENT
ACTUARIAL ASSUMPTIONS AND METHODS
72
Age 5-9 10-29 30+ 5-9 10-29 30+ 5-19 20+45 0.00% 0.00% 5.00% 0.00% 0.00% 4.50% 0.00% 5.00%46 0.00% 0.00% 5.00% 0.00% 0.00% 4.50% 0.00% 5.00%47 0.00% 0.00% 5.00% 0.00% 0.00% 4.50% 0.00% 5.00%48 0.00% 0.00% 5.00% 0.00% 0.00% 4.50% 0.00% 5.00%49 0.00% 0.00% 5.00% 0.00% 0.00% 4.50% 0.00% 5.00%50 3.00% 3.00% 5.00% 1.00% 3.50% 4.50% 5.00% 15.00%51 3.00% 3.00% 5.00% 1.00% 3.50% 4.50% 5.00% 10.00%52 3.00% 3.00% 5.00% 1.00% 3.50% 4.50% 5.00% 10.00%53 3.00% 3.00% 5.00% 1.00% 3.50% 4.50% 5.00% 20.00%54 3.00% 3.00% 10.00% 5.75% 3.50% 4.50% 5.00% 20.00%55 3.00% 6.50% 10.00% 2.50% 3.50% 4.50% 5.00% 20.00%56 3.00% 4.00% 10.00% 1.50% 7.00% 15.00% 10.00% 20.00%57 3.00% 4.00% 10.00% 1.50% 7.00% 15.00% 10.00% 20.00%58 3.00% 4.00% 10.00% 1.50% 7.00% 15.00% 10.00% 20.00%59 7.00% 9.00% 27.50% 2.00% 7.00% 15.00% 10.00% 15.00%60 7.00% 9.00% 27.50% 6.25% 12.50% 25.00% 10.00% 30.00%61 7.00% 15.00% 27.50% 6.25% 12.50% 25.00% 10.00% 30.00%62 7.00% 30.00% 40.00% 18.50% 25.00% 35.00% 20.00% 30.00%63 7.00% 25.00% 40.00% 5.00% 25.00% 35.00% 20.00% 30.00%64 15.00% 25.00% 40.00% 9.00% 25.00% 35.00% 20.00% 50.00%65 25.00% 25.00% 40.00% 12.50% 25.00% 35.00% 100.00% 100.00%66 10.00% 35.00% 50.00% 25.00% 25.00% 30.00% 100.00% 100.00%67 15.00% 30.00% 40.00% 25.00% 25.00% 30.00% 100.00% 100.00%68 15.00% 30.00% 30.00% 25.00% 25.00% 30.00% 100.00% 100.00%69 30.00% 40.00% 30.00% 25.00% 25.00% 30.00% 100.00% 100.00%70 100.00% 100.00% 100.00% 100.00% 100.00% 100.00% 100.00% 100.00%
General Male General Female SafetyYears of Service Years of Service Years of Service
Rates of Retirement
18. Changes in Assumptions The investment rate of return assumption has been lowered from 7.25% to 7.00%, the CPI increase assumption has been lowered from 2.90% to 2.75%, and the future pay growth assumption has been lowered from 3.15% to 3.00%.
SAN JOAQUIN COUNTY EMPLOYEES’ RETIREMENT ASSOCIATION ACTUARIAL VALUATION REPORT AS OF JANUARY 1, 2020
APPENDIX C – SUMMARY OF PLAN PROVISIONS
73
A. Definitions
Compensation: Compensation means the cash remuneration for services paid by the employer. It includes base pay and certain differential, incentive, and special pay allowances defined by the Board of Retirement. Overtime is excluded, with the exception of overtime paid under the Fair Labor Standards Act that is regular and recurring.
For members joining the Plan on and after January 1, 2013 (Tier 2 Members), only pensionable compensation up to the PEPRA compensation limit ($126,291 for 2020) will count for computing Plan benefits and employee contributions and employer contributions for those participating in Social Security. For those not participating in Social Security, the compensation cap is 120% of the PEPRA compensation limit ($151,549 for 2020.) In addition, it is possible that some sources of compensation, such as any payments deemed to be terminal or special pays, may be excluded from benefit and contribution computations for Tier 2 Members.
Credited Service: In general, Credited Service is earned for the period during which Member
Contributions are paid. Temporary service for which the Member was not credited, or service for
which the Member withdrew his or her Member Contributions, may be purchased by paying or repaying the Member Contributions with interest. Credit for up to 12 months of a medical leave of absence and all military leaves of absence may also be purchased.
Public Service (see below) is part of Credited Service for the computation
of benefits only, not for eligibility for benefits or for vesting. Final Compensation: For Tier 1 Members, Final Compensation means the highest average
Compensation earned during any 12 consecutive months of the Member’s employment.
For Tier 2 Members, highest average Compensation will be based on the
highest 36 consecutive months, rather than 12 months. General Member: Any Member who is not a Safety Member is a General Member. Public Service: The Member may elect to purchase Public Service for time spent while
employed in another recognized public agency. The public agency must have a reciprocal agreement with the Plan or be one of several specified municipalities, counties, special districts, or State or Federal agencies.
SAN JOAQUIN COUNTY EMPLOYEES’ RETIREMENT ASSOCIATION ACTUARIAL VALUATION REPORT AS OF JANUARY 1, 2020
APPENDIX C – SUMMARY OF PLAN PROVISIONS
74
Public Service cannot be purchased if it is used for eligibility for another pension.
The cost to purchase Public Service is twice the Member Contributions
and interest applicable for the period of time purchased. Public Service is used to compute benefits but does not count toward eligibility for benefits or vesting.
Safety Member: Any sworn Member engaged in law enforcement, probation, or fire
suppression is a Safety Member. B. Membership
Eligibility: All full-time, permanent employees of San Joaquin County and other
participating special districts become Members on their date of appointment. Membership is mandatory; only elected officials and members who are age 60 or older at the time of employment in a position requiring membership in SJCERA may choose not to participate.
A Tier 2 Member is any Member joining the Plan for the first time on or
after January 1, 2013. Employees who transfer from and are eligible for reciprocity with another public employer will not be Tier 2 Members if their service in the reciprocal system was under a previous tier. Employees who were Members of SJCERA prior to January 1, 2013 and experienced a break in service of more than six months and then were reemployed by a different SJCERA-participating employer on or after January 1, 2013 will be considered Tier 2 Members for all subsequent service.
Member Contributions: Each Member contributes a percentage of Compensation to the Plan
through payroll deduction. For Tier 1 members, the percentage contributed depends on the Member’s age upon joining the Plan. Representative rates are shown in Table 1 on the next page.
Tier 1 members covered by Social Security have their contributions
reduced by one-third on the first $161.54 of biweekly Compensation. General Members who joined the Plan prior to March 7, 1973 and who have earned 30 years of Credited Service do not contribute; Safety Members do not contribute after earning 30 years of Credited Service.
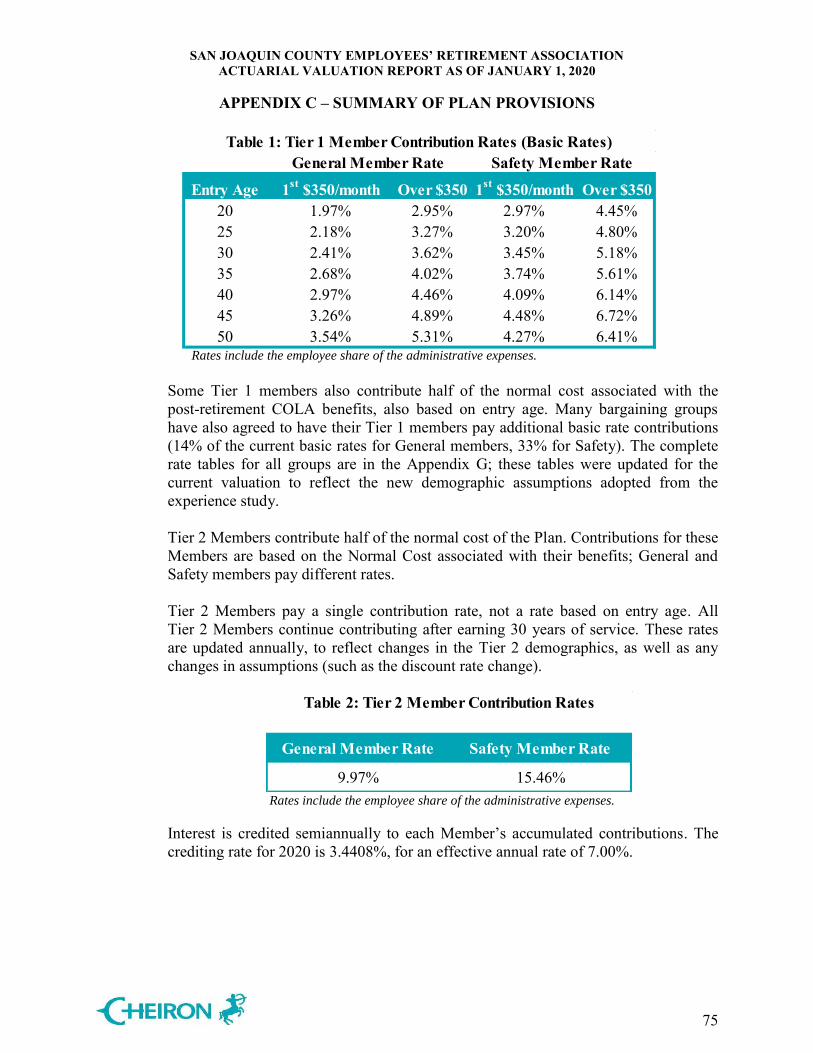
SAN JOAQUIN COUNTY EMPLOYEES’ RETIREMENT ASSOCIATION ACTUARIAL VALUATION REPORT AS OF JANUARY 1, 2020
APPENDIX C – SUMMARY OF PLAN PROVISIONS
75
Table 1: Tier 1 Member Contribution Rates (Basic Rates)General Member Rate Safety Member Rate
Entry Age Over $350 1st $350/month Over $35020 2.95% 2.97% 4.45%25 3.27% 3.20% 4.80%30 3.62% 3.45% 5.18%35 4.02% 3.74% 5.61%40 4.46% 4.09% 6.14%45 4.89% 4.48% 6.72%50 5.31% 4.27% 6.41%
3.26%3.54%
1st $350/month1.97%2.18%2.41%2.68%2.97%
Rates include the employee share of the administrative expenses.
Some Tier 1 members also contribute half of the normal cost associated with the post-retirement COLA benefits, also based on entry age. Many bargaining groups have also agreed to have their Tier 1 members pay additional basic rate contributions (14% of the current basic rates for General members, 33% for Safety). The complete rate tables for all groups are in the Appendix G; these tables were updated for the current valuation to reflect the new demographic assumptions adopted from the experience study.
Tier 2 Members contribute half of the normal cost of the Plan. Contributions for these
Members are based on the Normal Cost associated with their benefits; General and Safety members pay different rates.
Tier 2 Members pay a single contribution rate, not a rate based on entry age. All
Tier 2 Members continue contributing after earning 30 years of service. These rates are updated annually, to reflect changes in the Tier 2 demographics, as well as any changes in assumptions (such as the discount rate change).
Table 2: Tier 2 Member Contribution Rates
9.97% 15.46%
Safety Member RateGeneral Member Rate
Rates include the employee share of the administrative expenses.
Interest is credited semiannually to each Member’s accumulated contributions. The crediting rate for 2020 is 3.4408%, for an effective annual rate of 7.00%.
SAN JOAQUIN COUNTY EMPLOYEES’ RETIREMENT ASSOCIATION ACTUARIAL VALUATION REPORT AS OF JANUARY 1, 2020
APPENDIX C – SUMMARY OF PLAN PROVISIONS
76
C. Service Retirement Eligibility: Tier 1 General Members are eligible to retire at age 50 if they have earned
five years of Credited Service and have passed the tenth anniversary of their membership in the Plan. Alternatively, General Members are eligible to retire at any age after having earned 30 years of Credited Service, or upon reaching age 70 with no service requirement.
Tier 1 Safety Members are eligible to retire at age 50 if they have earned
five years of Credited Service and have passed the tenth anniversary of their membership in the Plan. Alternatively, Safety Members are eligible to retire at any age after having earned 20 years of Credited Service.
Tier 2 General Members are eligible to retire upon attaining age 52 and
completing five or more years of service. Tier 2 Safety Members are eligible to retire upon attaining age 50 and completing five or more years of service. Tier 2 Members are eligible to retire, regardless of service, after attaining age 70.
Benefit Amount: The Service Retirement Benefit payable to Tier 1 General Members is
equal to the percentage in Table 3 on the next page multiplied by the Member’s Final Compensation. The Service Retirement Benefit payable to Tier 1 Safety Members is equal to the percentage in the upcoming Table 4 multiplied by the Member’s Final Compensation. The percentage of Final Compensation may not exceed 100%.

SAN JOAQUIN COUNTY EMPLOYEES’ RETIREMENT ASSOCIATION ACTUARIAL VALUATION REPORT AS OF JANUARY 1, 2020
APPENDIX C – SUMMARY OF PLAN PROVISIONS
77
Table 3: Tier 1 General Members (CERL Section 31676.14)
Service 46 47 48 49 50 51 52 53 54 55 56 57 58 59 60 61 62 63 64 6510 14.75 15.67 16.67 17.41 18.41 19.48 20.61 21.82 22.68 23.54 24.40 25.26 26.11 26.11 26.11 26.1111 16.23 17.23 18.33 19.15 20.25 21.42 22.67 24.00 24.95 25.89 26.84 27.78 28.72 28.72 28.72 28.7212 17.70 18.80 20.00 20.89 22.10 23.37 24.73 26.19 27.22 28.25 29.28 30.31 31.34 31.34 31.34 31.3413 19.18 20.36 21.67 22.64 23.94 25.32 26.79 28.37 29.48 30.60 31.72 32.83 33.95 33.95 33.95 33.9514 20.65 21.93 23.33 24.38 25.78 27.27 28.85 30.55 31.75 32.95 34.16 35.36 36.56 36.56 36.56 36.5615 22.13 23.50 25.00 26.12 27.62 29.22 30.91 32.73 34.02 35.31 36.60 37.88 39.17 39.17 39.17 39.1716 23.60 25.06 26.67 27.86 29.46 31.16 32.97 34.92 36.29 37.66 39.04 40.41 41.78 41.78 41.78 41.7817 25.08 26.63 28.33 29.60 31.30 33.11 35.03 37.10 38.56 40.01 41.47 42.93 44.39 44.39 44.39 44.3918 26.55 28.20 30.00 31.34 33.14 35.06 37.09 39.28 40.82 42.37 43.91 45.46 47.00 47.00 47.00 47.0019 28.03 29.76 31.67 33.08 34.98 37.01 39.16 41.46 43.09 44.72 46.35 47.98 49.61 49.61 49.61 49.6120 29.50 31.33 33.33 34.82 36.83 38.95 41.22 43.64 45.36 47.08 48.79 50.51 52.23 52.23 52.23 52.2321 30.98 32.90 35.00 36.57 38.67 40.90 43.28 45.83 47.63 49.43 51.23 53.04 54.84 54.84 54.84 54.8422 32.45 34.46 36.67 38.31 40.51 42.85 45.34 48.01 49.90 51.78 53.67 55.56 57.45 57.45 57.45 57.4523 33.93 36.03 38.33 40.05 42.35 44.80 47.40 50.19 52.16 54.14 56.11 58.09 60.06 60.06 60.06 60.0624 35.40 37.60 40.00 41.79 44.19 46.74 49.46 52.37 54.43 56.49 58.55 60.61 62.67 62.67 62.67 62.6725 36.88 39.16 41.67 43.53 46.03 48.69 51.52 54.56 56.70 58.85 60.99 63.14 65.28 65.28 65.28 65.2826 38.35 40.73 43.33 45.27 47.87 50.64 53.58 56.74 58.97 61.20 63.43 65.66 67.89 67.89 67.89 67.8927 39.83 42.30 45.00 47.01 49.72 52.59 55.64 58.92 61.24 63.55 65.87 68.19 70.51 70.51 70.51 70.5128 41.30 43.86 46.67 48.75 51.56 54.54 57.70 61.10 63.50 65.91 68.31 70.71 73.12 73.12 73.12 73.1229 42.78 45.43 48.33 50.49 53.40 56.48 59.76 63.28 65.77 68.26 70.75 73.24 75.73 75.73 75.73 75.7330 35.28 37.27 39.41 41.73 44.25 47.00 50.00 52.24 55.24 58.43 61.82 65.47 68.04 70.61 73.19 75.77 78.34 78.34 78.34 78.3431 38.51 40.72 43.12 45.73 48.56 51.67 53.98 57.08 60.38 63.88 67.65 70.31 72.97 75.63 78.29 80.95 80.95 80.95 80.9532 42.04 44.51 47.20 50.13 53.33 55.72 58.92 62.33 65.95 69.83 72.58 75.32 78.07 80.82 83.56 83.56 83.56 83.5633 45.90 48.68 51.69 55.00 57.46 60.76 64.27 68.01 72.01 74.84 77.68 80.51 83.34 86.17 86.17 86.17 86.1734 50.15 53.26 56.67 59.20 62.60 66.22 70.07 74.19 77.11 80.03 82.95 85.87 88.78 88.78 88.78 88.7835 54.83 58.33 60.94 64.45 68.17 72.13 76.38 79.38 82.38 85.39 88.39 91.40 91.40 91.40 91.4036 60.00 62.68 66.29 70.12 74.19 78.56 81.65 84.74 87.83 90.92 94.01 94.01 94.01 94.0137 64.42 68.13 72.06 76.25 80.74 83.92 87.09 90.27 93.44 96.62 96.62 96.62 96.6238 69.97 74.01 78.31 82.92 86.18 89.44 92.71 95.97 99.23 99.23 99.23 99.2339 75.96 80.37 85.11 88.45 91.80 95.15 98.49 100 100 100 10040 82.43 87.29 90.72 94.15 97.59 10041 89.47 92.99 96.51 10042 95.26 98.8643 100
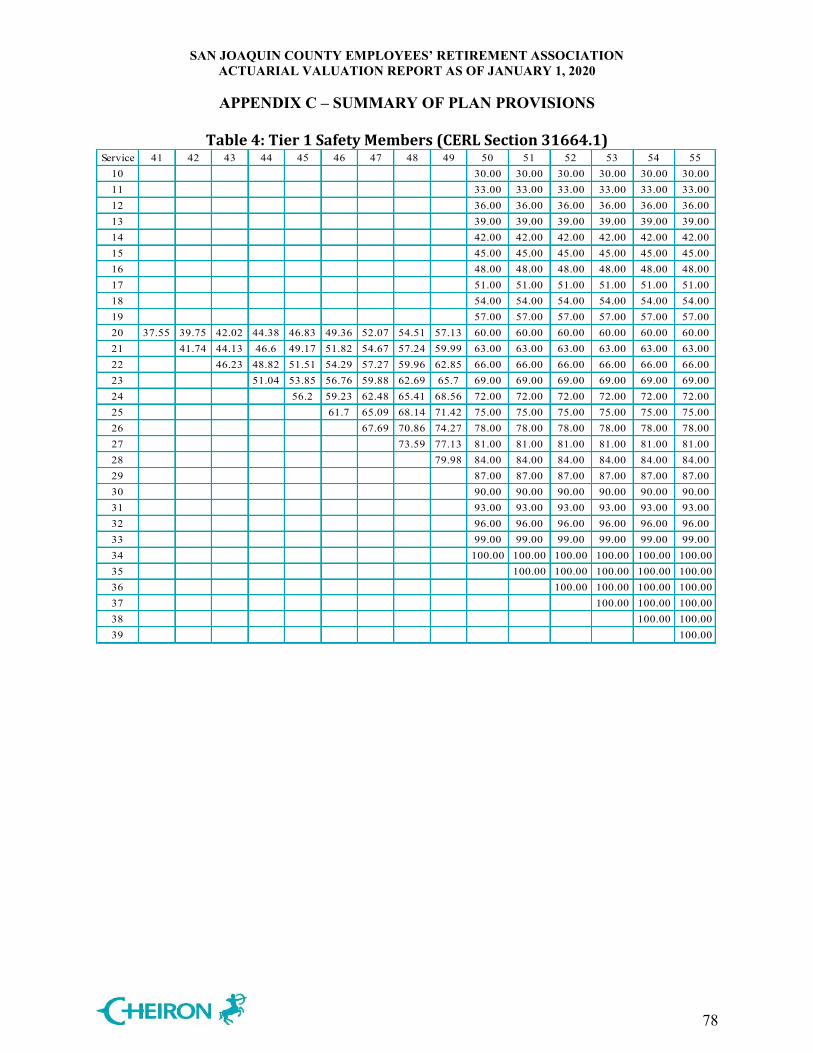
SAN JOAQUIN COUNTY EMPLOYEES’ RETIREMENT ASSOCIATION ACTUARIAL VALUATION REPORT AS OF JANUARY 1, 2020
APPENDIX C – SUMMARY OF PLAN PROVISIONS
78
Table 4: Tier 1 Safety Members (CERL Section 31664.1) Service 41 42 43 44 45 46 47 48 49 50 51 52 53 54 55
10 30.00 30.00 30.00 30.00 30.00 30.0011 33.00 33.00 33.00 33.00 33.00 33.0012 36.00 36.00 36.00 36.00 36.00 36.0013 39.00 39.00 39.00 39.00 39.00 39.0014 42.00 42.00 42.00 42.00 42.00 42.0015 45.00 45.00 45.00 45.00 45.00 45.0016 48.00 48.00 48.00 48.00 48.00 48.0017 51.00 51.00 51.00 51.00 51.00 51.0018 54.00 54.00 54.00 54.00 54.00 54.0019 57.00 57.00 57.00 57.00 57.00 57.0020 37.55 39.75 42.02 44.38 46.83 49.36 52.07 54.51 57.13 60.00 60.00 60.00 60.00 60.00 60.0021 41.74 44.13 46.6 49.17 51.82 54.67 57.24 59.99 63.00 63.00 63.00 63.00 63.00 63.0022 46.23 48.82 51.51 54.29 57.27 59.96 62.85 66.00 66.00 66.00 66.00 66.00 66.0023 51.04 53.85 56.76 59.88 62.69 65.7 69.00 69.00 69.00 69.00 69.00 69.0024 56.2 59.23 62.48 65.41 68.56 72.00 72.00 72.00 72.00 72.00 72.0025 61.7 65.09 68.14 71.42 75.00 75.00 75.00 75.00 75.00 75.0026 67.69 70.86 74.27 78.00 78.00 78.00 78.00 78.00 78.0027 73.59 77.13 81.00 81.00 81.00 81.00 81.00 81.0028 79.98 84.00 84.00 84.00 84.00 84.00 84.0029 87.00 87.00 87.00 87.00 87.00 87.0030 90.00 90.00 90.00 90.00 90.00 90.0031 93.00 93.00 93.00 93.00 93.00 93.0032 96.00 96.00 96.00 96.00 96.00 96.0033 99.00 99.00 99.00 99.00 99.00 99.0034 100.00 100.00 100.00 100.00 100.00 100.0035 100.00 100.00 100.00 100.00 100.0036 100.00 100.00 100.00 100.0037 100.00 100.00 100.0038 100.00 100.0039 100.00
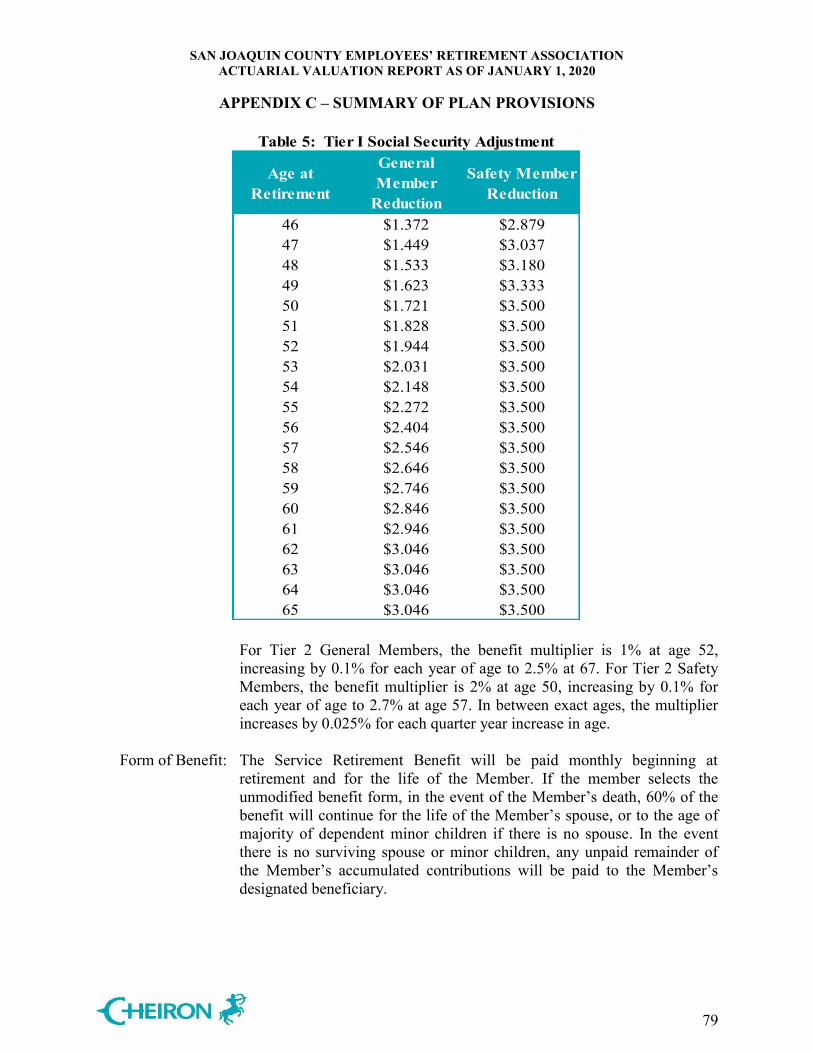
SAN JOAQUIN COUNTY EMPLOYEES’ RETIREMENT ASSOCIATION ACTUARIAL VALUATION REPORT AS OF JANUARY 1, 2020
APPENDIX C – SUMMARY OF PLAN PROVISIONS
79
Table 5: Tier I Social Security Adjustment
Age at Retirement
General Member
Reduction
Safety Member Reduction
46 $1.372 $2.879 47 $1.449 $3.037 48 $1.533 $3.180 49 $1.623 $3.333 50 $1.721 $3.500 51 $1.828 $3.500 52 $1.944 $3.500 53 $2.031 $3.500 54 $2.148 $3.500 55 $2.272 $3.500 56 $2.404 $3.500 57 $2.546 $3.500 58 $2.646 $3.500 59 $2.746 $3.500 60 $2.846 $3.500 61 $2.946 $3.500 62 $3.046 $3.500 63 $3.046 $3.500 64 $3.046 $3.500 65 $3.046 $3.500
For Tier 2 General Members, the benefit multiplier is 1% at age 52, increasing by 0.1% for each year of age to 2.5% at 67. For Tier 2 Safety Members, the benefit multiplier is 2% at age 50, increasing by 0.1% for each year of age to 2.7% at age 57. In between exact ages, the multiplier increases by 0.025% for each quarter year increase in age.
Form of Benefit: The Service Retirement Benefit will be paid monthly beginning at
retirement and for the life of the Member. If the member selects the unmodified benefit form, in the event of the Member’s death, 60% of the benefit will continue for the life of the Member’s spouse, or to the age of majority of dependent minor children if there is no spouse. In the event there is no surviving spouse or minor children, any unpaid remainder of the Member’s accumulated contributions will be paid to the Member’s designated beneficiary.
SAN JOAQUIN COUNTY EMPLOYEES’ RETIREMENT ASSOCIATION ACTUARIAL VALUATION REPORT AS OF JANUARY 1, 2020
APPENDIX C – SUMMARY OF PLAN PROVISIONS
80
Actuarially equivalent optional benefit forms are also available. Annually on April 1, benefits are adjusted to reflect changes in the CPI for
the San Francisco Bay Area. Annual adjustments may not exceed 3%, but changes in CPI in excess of 3% are “banked” and used for future adjustments when changes in CPI are less than 3%.
In addition, ad hoc cost-of-living adjustments have been granted in the
past and may be granted in the future. A lump sum benefit of $5,000 will be payable upon the death of a retired
member. D. Service-Connected Disability Eligibility: Members are eligible for Service-Connected Disability Retirement
benefits at any age if they are permanently disabled as a result of injuries or illness sustained in the line of duty.
Benefit Amount: The Service-Connected Disability Retirement Benefit payable to Members
is equal to the greater of 50% of their Final Compensation or – if the Member is eligible at disability for a Service Retirement Benefit – the Service Retirement Benefit accrued on the date of disability.
Members who return to work at a different position with lower pay may
receive a Supplemental Disability Allowance that, when added to their new pay, may bring the Member’s total income up to the current pay for his or her position at the time of disability. The Supplemental Disability Allowance may not exceed the Service-Connected Disability Retirement benefit.
Form of Benefit: The Service-Connected Disability Retirement Benefit will be paid
monthly beginning at the effective date of disability retirement and for the life of the Member; in the event of the Member’s death, 100% of the benefit will continue for the life of the Member’s spouse, or to the age of majority of dependent minor children if there is no spouse. In the event there is no surviving spouse or minor children, any unpaid remainder of the Member’s accumulated contributions will be paid to the Member’s designated beneficiary.
Actuarially equivalent optional benefit forms are also available. Annually on April 1, benefits are adjusted to reflect changes in the CPI for
the San Francisco Bay Area. Annual adjustments may not exceed 3%, but
SAN JOAQUIN COUNTY EMPLOYEES’ RETIREMENT ASSOCIATION ACTUARIAL VALUATION REPORT AS OF JANUARY 1, 2020
APPENDIX C – SUMMARY OF PLAN PROVISIONS
81
changes in CPI in excess of 3% are “banked” and used for future adjustments when changes in CPI are less than 3%.
In addition, ad hoc cost-of-living adjustments have been granted in the
past and may be granted in the future. A lump sum benefit of $5,000 will be payable upon the death of a retired
member. E. Nonservice-Connected Disability
Eligibility: Members are eligible for Nonservice-Connected Disability Retirement
benefits if they are permanently disabled at any age after earning five years of Credited Service or after becoming eligible for a deferred vested benefit.
Benefit Amount: The Nonservice-Connected Disability Retirement Benefit payable to
General Members is equal to the greatest of:
1.5% of Final Compensation at disability multiplied by years of Credited Service at disability; 1.5% of Final Compensation at disability multiplied by years of
Credited Service projected to age 65, but not to exceed one-third of Final Compensation; or
If the Member is eligible at disability for a Service Retirement Benefit, the Service Retirement Benefit accrued on the date of disability.
The Nonservice-Connected Disability Retirement Benefit payable to Safety Members is equal to the greatest of: 1.8% of Final Compensation at disability multiplied by years of
Credited Service at disability; 1.8% of Final Compensation at disability multiplied by years of
Credited Service projected to age 55, but not to exceed one-third of Final Compensation; or
If the Member is eligible at disability for a Service Retirement Benefit, the Service Retirement Benefit accrued on the date of disability.
Members who return to work at a different position with lower pay may receive a Supplemental Disability Allowance that, when added to their new pay, may bring the Member’s total income up to the current pay for his or her position at the time of disability. The Supplemental Disability

SAN JOAQUIN COUNTY EMPLOYEES’ RETIREMENT ASSOCIATION ACTUARIAL VALUATION REPORT AS OF JANUARY 1, 2020
APPENDIX C – SUMMARY OF PLAN PROVISIONS
82
Allowance may not exceed the Nonservice-Connected Disability Retirement benefit.
Form of Benefit: The Nonservice-Connected Disability Retirement Benefit will be paid monthly beginning at the effective date of disability retirement, and for the life of the Member; in the event of the Member’s death, 60% of the benefit will continue for the life of the Member’s spouse or to the age of majority of dependent minor children if there is no spouse. In the event there is no surviving spouse or minor children, any unpaid remainder of the Member’s accumulated contributions will be paid to the Member’s designated beneficiary.
Actuarially equivalent optional benefit forms are also available. Annually on April 1, benefits are adjusted to reflect changes in the CPI for
the San Francisco Bay Area. Annual adjustments may not exceed 3%, but changes in CPI in excess of 3% are “banked” and used for future adjustments when changes in CPI are less than 3%.
In addition, ad hoc cost-of-living adjustments have been granted in the
past and may be granted in the future. A lump sum benefit of $5,000 will be payable upon the death of a retired
member.
F. Service-Connected Death Eligibility: A Member’s survivors are eligible to receive Service-Connected Death
benefits if the Member’s death resulted from injury or illness sustained in connection with the Member’s duties.
Benefit Amount: The Service-Connected Death benefit payable to a surviving spouse or
minor children will be 50% of the Member’s Final Compensation. In the event the Member’s death was caused by external violence or
physical force, an additional benefit of 25% of the above basic benefit will be paid for the first minor child, 15% for the second, and 10% for the third.
Furthermore, for Safety Members only, there will be an additional lump
sum benefit of 12 months of pay at the time of death. Form of Benefit: The Service-Connected Death Benefit will be paid monthly beginning at
the Member’s death and for the life of the surviving spouse or to the age of majority of dependent minor children if there is no spouse.

SAN JOAQUIN COUNTY EMPLOYEES’ RETIREMENT ASSOCIATION ACTUARIAL VALUATION REPORT AS OF JANUARY 1, 2020
APPENDIX C – SUMMARY OF PLAN PROVISIONS
83
Annually on April 1, benefits are adjusted to reflect changes in the CPI for the San Francisco Bay Area. Annual adjustments may not exceed 3%, but changes in CPI in excess of 3% are “banked” and used for future adjustments when changes in CPI are less than 3%.
In addition, ad hoc cost-of-living adjustments have been granted in the
past and may be granted in the future. G. Nonservice-Connected Death
Eligibility: A Member’s survivors are eligible to receive Nonservice-Connected Death
benefits if the Member’s death arose from causes unrelated to the Member’s duties.
Benefit Amount: In the event the Member had earned fewer than five years of Credited
Service and has no or insufficient reciprocity service from another system, the Nonservice-Connected Death benefit will be a refund of the Member’s accumulated contributions with interest plus a payment of one month of Final Compensation for each year of Credited Service, not to exceed six months.
In the event the Member had earned five or more years of Credited
Service, the Nonservice-Connected Death benefit payable to a surviving spouse or minor children will be 60% of the amount the Member would have received as a Nonservice-Connected Disability Retirement Benefit on the date of death.
Form of Benefit: For Members who had earned fewer than five years of Credited Service at
death, the benefit will be paid as a lump sum. For Members with five or more years of Credited Service, the
Nonservice-Connected Death Benefit will be paid monthly beginning at the Member’s death and for the life of the surviving spouse or to the age of majority of dependent minor children if there is no spouse.
Annually on April 1, benefits are adjusted to reflect changes in the CPI for
the San Francisco Bay Area. Annual adjustments may not exceed 3%, but changes in CPI in excess of 3% are “banked” and used for future adjustments when changes in CPI are less than 3%.
In addition, ad hoc cost-of-living adjustments have been granted in the
past and may be granted in the future.

SAN JOAQUIN COUNTY EMPLOYEES’ RETIREMENT ASSOCIATION ACTUARIAL VALUATION REPORT AS OF JANUARY 1, 2020
APPENDIX C – SUMMARY OF PLAN PROVISIONS
84
H. Withdrawal Benefit Eligibility: A Member is eligible for a Withdrawal Benefit upon termination of
employment. Benefit Amount: The Withdrawal Benefit is a refund of the Member’s accumulated
contributions with interest. Upon receipt of the Withdrawal Benefit, the Member forfeits all Credited Service.
Form of Benefit: The Withdrawal Benefit is paid in a lump sum upon election by the
Member.
I. Deferred Vested Benefit Eligibility: A Member is eligible for a Deferred Vested Benefit upon termination of
employment after earning five years of Credited Service, including reciprocity service from another system. The Member must leave his or her Member Contributions with interest on deposit with the Plan.
Benefit Amount: The Deferred Vested Benefit is computed in the same manner as the
Service Retirement Benefit, but it is based on Credited Service and Final Compensation on the date of termination.
For Tier 1 Members, Tables 2 and 3 are extended for service under 10
years using benefit multipliers of one-sixtieth per year of Credited Service at age 52 (General) or 3% per year of Credited Service at age 50 (Safety), with adjustments for earlier or later retirement under Sections 31676.14 and 31664.1, respectively, of the County Employees Retirement Law of 1937.
Form of Benefit: The Deferred Vested Benefit will be paid monthly beginning at retirement
and for the life of the Member; in the event of the Member’s death, 60% of the benefit will continue for the life of the Member’s spouse or to the age of majority of dependent minor children if there is no spouse. In the event there is no surviving spouse or minor children, any unpaid remainder of the Member’s accumulated contributions will be paid to the Member’s designated beneficiary.
Actuarially equivalent optional benefit forms are also available. Annually on April 1, benefits are adjusted to reflect changes in the CPI for the San Francisco Bay Area. Annual adjustments may not exceed 3%, but changes in CPI in excess of 3% are “banked” and used for future adjustments when changes in CPI are less than 3%.

SAN JOAQUIN COUNTY EMPLOYEES’ RETIREMENT ASSOCIATION ACTUARIAL VALUATION REPORT AS OF JANUARY 1, 2020
APPENDIX C – SUMMARY OF PLAN PROVISIONS
85
In addition, ad hoc cost-of-living adjustments have been granted in the past and may be granted in the future. A lump sum benefit of $5,000 will be payable upon the death of a retired member.
J. Reciprocal Benefit
Eligibility: A Member is eligible for a Reciprocal Benefit upon termination of employment and entry, within a specified period of time, into another retirement system recognized as a reciprocal system by the Plan. In addition, the Member must leave his or her Member Contributions with interest on deposit with the Plan.
Benefit Amount: The Reciprocal Benefit is computed in the same manner as the Service
Retirement Benefit, but it is based on Credited Service on the date of termination and Final Compensation on the date of retirement; Final Compensation is based on the highest of the Compensation earned under this Plan or the reciprocal plan.
Form of Benefit: The Reciprocal Benefit will be paid monthly beginning at retirement and
for the life of the Member; in the event of the Member’s death, 60% of the benefit will continue for the life of the Member’s spouse or to the age of majority of dependent minor children if there is no spouse. In the event there is no surviving spouse or minor children, any unpaid remainder of the Member’s accumulated contributions will be paid to the Member’s designated beneficiary.
Actuarially equivalent optional benefit forms are also available. Annually on April 1, benefits are adjusted to reflect changes in the CPI for
the San Francisco Bay Area. Annual adjustments may not exceed 3%, but changes in CPI in excess of 3% are “banked” and used for future adjustments when changes in CPI are less than 3%.
In addition, ad hoc cost-of-living adjustments have been granted in the
past and may be granted in the future. A lump sum benefit may be payable upon the death of a retired Member
by the last system under which the Member’s service was covered.
The member contribution rates have been updated for the current valuation to reflect the change in the discount rate and pay growth assumptions. There have been no other changes in plan provisions since the prior valuation.
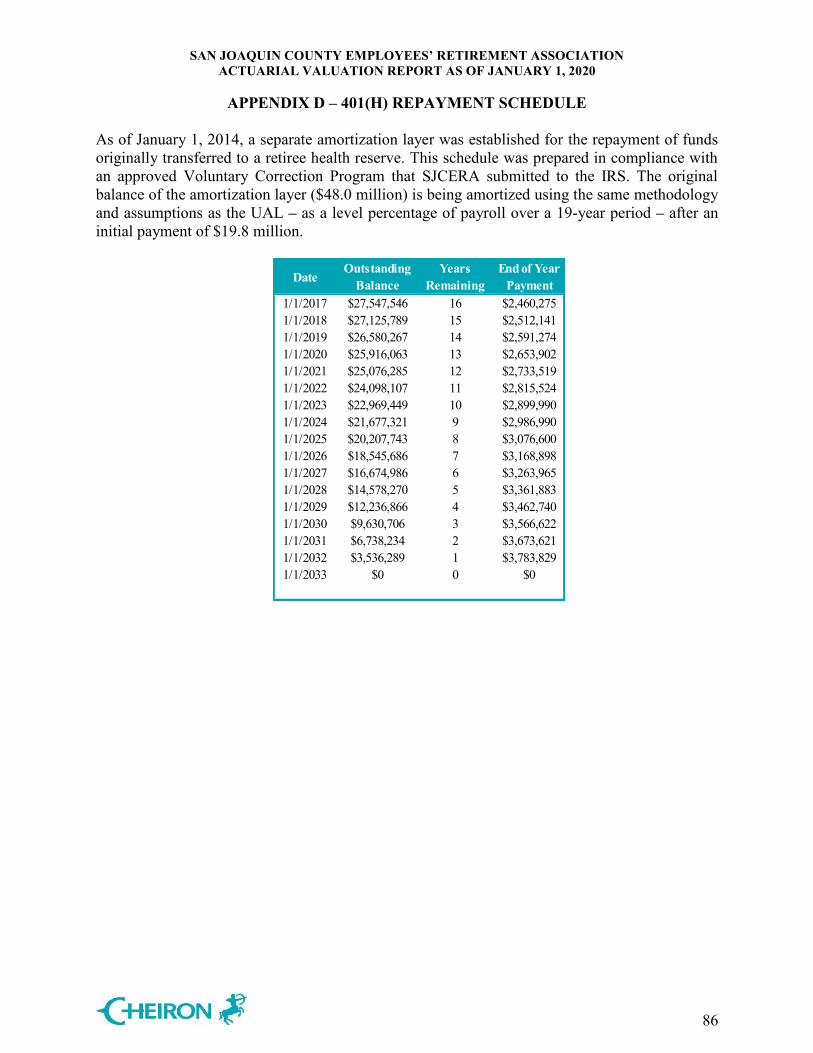
SAN JOAQUIN COUNTY EMPLOYEES’ RETIREMENT ASSOCIATION ACTUARIAL VALUATION REPORT AS OF JANUARY 1, 2020
APPENDIX D – 401(H) REPAYMENT SCHEDULE
86
As of January 1, 2014, a separate amortization layer was established for the repayment of funds originally transferred to a retiree health reserve. This schedule was prepared in compliance with an approved Voluntary Correction Program that SJCERA submitted to the IRS. The original balance of the amortization layer ($48.0 million) is being amortized using the same methodology and assumptions as the UAL – as a level percentage of payroll over a 19-year period – after an initial payment of $19.8 million.
DateOutstanding
BalanceYears
RemainingEnd of Year
Payment1/1/2017 $27,547,546 16 $2,460,275 1/1/2018 $27,125,789 15 $2,512,141 1/1/2019 $26,580,267 14 $2,591,274 1/1/2020 $25,916,063 13 $2,653,902 1/1/2021 $25,076,285 12 $2,733,519 1/1/2022 $24,098,107 11 $2,815,524 1/1/2023 $22,969,449 10 $2,899,990 1/1/2024 $21,677,321 9 $2,986,990 1/1/2025 $20,207,743 8 $3,076,600 1/1/2026 $18,545,686 7 $3,168,898 1/1/2027 $16,674,986 6 $3,263,965 1/1/2028 $14,578,270 5 $3,361,883 1/1/2029 $12,236,866 4 $3,462,740 1/1/2030 $9,630,706 3 $3,566,622 1/1/2031 $6,738,234 2 $3,673,621 1/1/2032 $3,536,289 1 $3,783,829 1/1/2033 $0 0 $0
SAN JOAQUIN COUNTY EMPLOYEES’ RETIREMENT ASSOCIATION ACTUARIAL VALUATION REPORT AS OF JANUARY 1, 2020
APPENDIX E – GLOSSARY
87
1. Actuarial Assumptions Assumptions as to the occurrence of future events affecting pension costs such as mortality,
withdrawal, disability, retirement, changes in compensation, and rates of investment return. 2. Actuarial Cost Method A procedure for determining the actuarial present value of pension plan benefits and
expenses and for developing an allocation of such value to each year of service, usually in the form of a normal cost and an Actuarial Liability.
3. Actuarial Gain (Loss) The difference between actual experience and that expected based upon a set of actuarial
assumptions during the period between two actuarial valuation dates, as determined in accordance with a particular actuarial cost method.
4. Actuarial Liability The portion of the actuarial present value of projected benefits that will not be paid by future
normal costs. It represents the value of the past normal costs with interest to the valuation date.
5. Actuarial Present Value (Present Value) The value as of a given date of a future amount or series of payments. The actuarial present
value discounts the payments to the given date at the assumed investment return and includes the probability of the payment being made.
6. Actuarial Valuation The determination, as of a specified date, of the normal cost, Actuarial Liability, Actuarial
Value of Assets, and related actuarial present values for a pension plan. 7. Actuarial Value of Assets The value of cash, investments, and other property belonging to a pension plan as used by the
actuary for the purpose of an actuarial valuation. The purpose of an Actuarial Value of Assets is to smooth out fluctuations in market values.
8. Actuarially Equivalent Of equal actuarial present value, determined as of a given date, with each value based on the
same set of actuarial assumptions.
SAN JOAQUIN COUNTY EMPLOYEES’ RETIREMENT ASSOCIATION ACTUARIAL VALUATION REPORT AS OF JANUARY 1, 2020
APPENDIX E – GLOSSARY
88
9. Amortization Payment The portion of the pension plan contribution that is designed to pay interest and principal on
the Unfunded Actuarial Liability in order to pay for that liability in a given number of years. 10. Entry Age Normal Actuarial Cost Method A method under which the actuarial present value of the projected benefits of each individual
included in an actuarial valuation is allocated on a level basis over the earnings of the individual between entry age and assumed exit ages.
11. Funded Ratio The ratio of the Actuarial Value of Assets to the Actuarial Liabilities. The funded ratio
shown in this report is not appropriate for assessing the sufficiency of plan assets to cover the estimated cost of settling the plan’s benefit obligations, in the case of a plan termination or other similar action. However, it is an appropriate measure for assessing the need for or the amount of future contributions.
12. Inactive Funded Ratio The ratio of the Inactive Actuarial Liabilities to the total Actuarial Liabilities. The inactive
funded ratio is a measure that shows the minimum funded status needed to pay benefits for all inactive members.
13. Normal Cost That portion of the actuarial present value of pension plan benefits and expenses, which is
allocated to a valuation year by the actuarial cost method. 14. Projected Benefits Those pension plan benefit amounts which are expected to be paid in the future under a
particular set of actuarial assumptions, taking into account such items as increases in future compensation and service credits.
15. Unfunded Actuarial Liability The excess of the Actuarial Liability over the Actuarial Value of Assets.
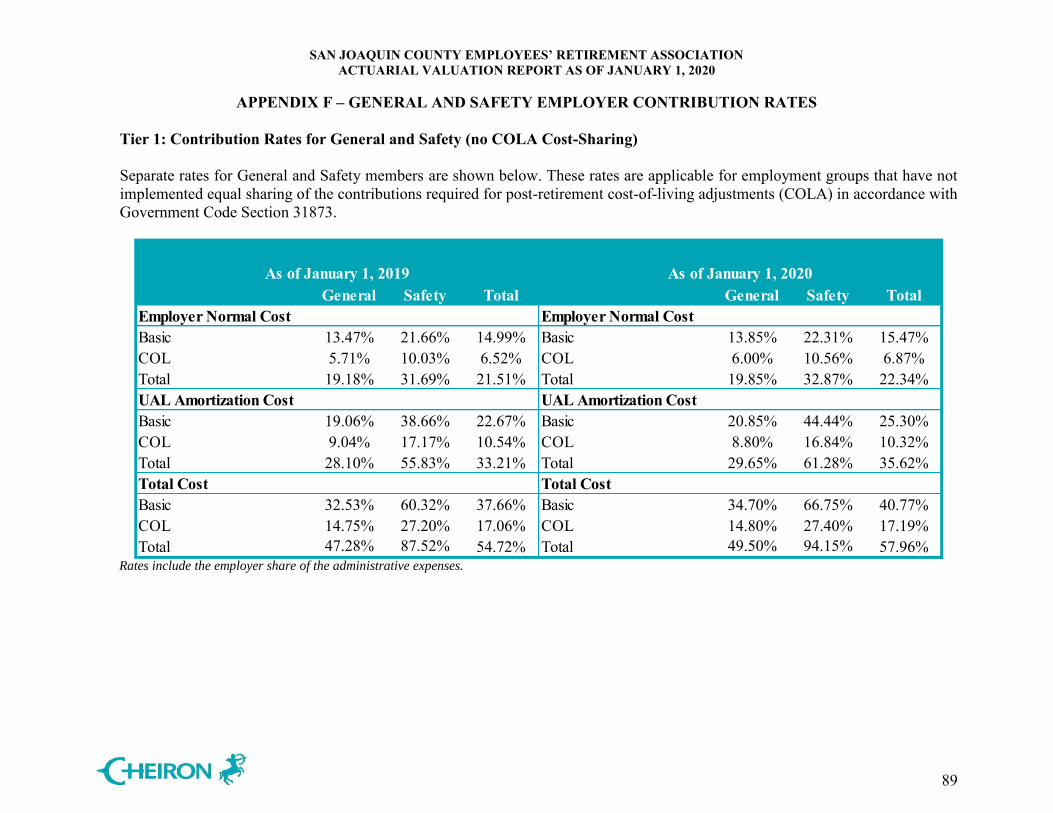
SAN JOAQUIN COUNTY EMPLOYEES’ RETIREMENT ASSOCIATION ACTUARIAL VALUATION REPORT AS OF JANUARY 1, 2020
APPENDIX F – GENERAL AND SAFETY EMPLOYER CONTRIBUTION RATES
89
Tier 1: Contribution Rates for General and Safety (no COLA Cost-Sharing) Separate rates for General and Safety members are shown below. These rates are applicable for employment groups that have not implemented equal sharing of the contributions required for post-retirement cost-of-living adjustments (COLA) in accordance with Government Code Section 31873.
General Safety Total General Safety TotalEmployer Normal Cost Employer Normal CostBasic 13.47% 21.66% 14.99% Basic 13.85% 22.31% 15.47%COL 5.71% 10.03% 6.52% COL 6.00% 10.56% 6.87%Total 19.18% 31.69% 21.51% Total 19.85% 32.87% 22.34%UAL Amortization Cost UAL Amortization CostBasic 19.06% 38.66% 22.67% Basic 20.85% 44.44% 25.30%COL 9.04% 17.17% 10.54% COL 8.80% 16.84% 10.32%Total 28.10% 55.83% 33.21% Total 29.65% 61.28% 35.62%Total Cost Total CostBasic 32.53% 60.32% 37.66% Basic 34.70% 66.75% 40.77%COL 14.75% 27.20% 17.06% COL 14.80% 27.40% 17.19%Total 47.28% 87.52% 54.72% Total 49.50% 94.15% 57.96%
As of January 1, 2019 As of January 1, 2020
Rates include the employer share of the administrative expenses.
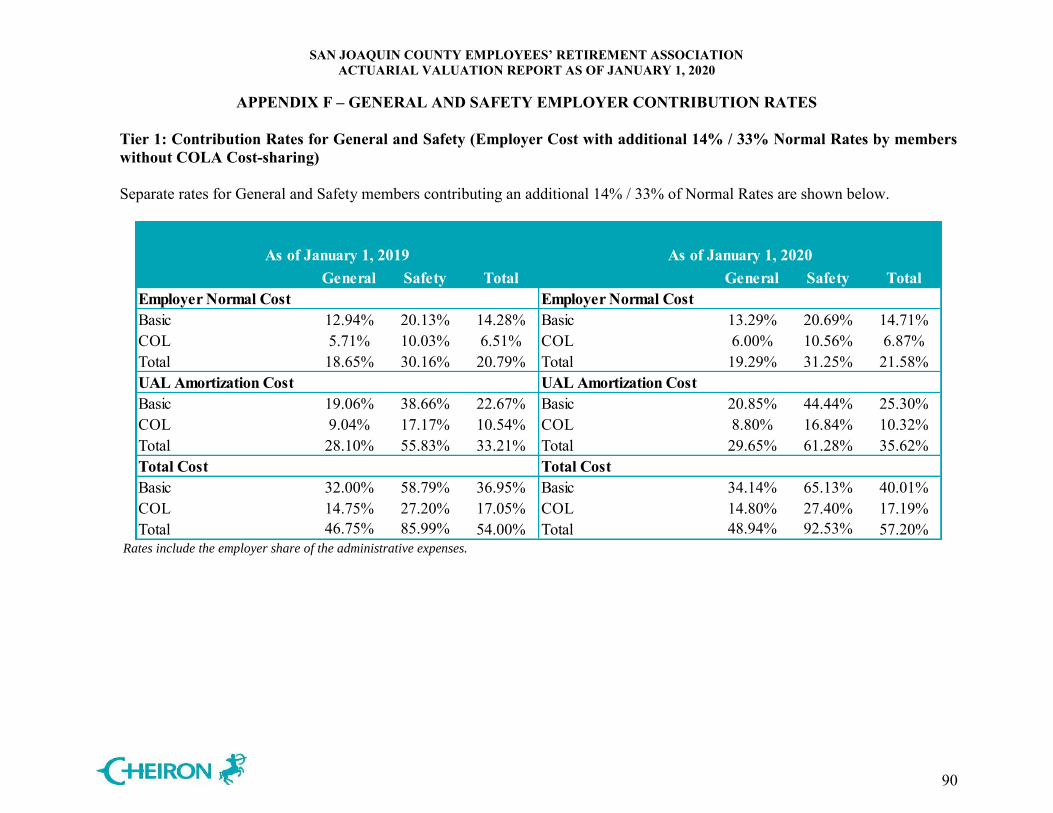
SAN JOAQUIN COUNTY EMPLOYEES’ RETIREMENT ASSOCIATION ACTUARIAL VALUATION REPORT AS OF JANUARY 1, 2020
APPENDIX F – GENERAL AND SAFETY EMPLOYER CONTRIBUTION RATES
90
Tier 1: Contribution Rates for General and Safety (Employer Cost with additional 14% / 33% Normal Rates by members without COLA Cost-sharing) Separate rates for General and Safety members contributing an additional 14% / 33% of Normal Rates are shown below.
General Safety Total General Safety TotalEmployer Normal Cost Employer Normal CostBasic 12.94% 20.13% 14.28% Basic 13.29% 20.69% 14.71%COL 5.71% 10.03% 6.51% COL 6.00% 10.56% 6.87%Total 18.65% 30.16% 20.79% Total 19.29% 31.25% 21.58%UAL Amortization Cost UAL Amortization CostBasic 19.06% 38.66% 22.67% Basic 20.85% 44.44% 25.30%COL 9.04% 17.17% 10.54% COL 8.80% 16.84% 10.32%Total 28.10% 55.83% 33.21% Total 29.65% 61.28% 35.62%Total Cost Total CostBasic 32.00% 58.79% 36.95% Basic 34.14% 65.13% 40.01%COL 14.75% 27.20% 17.05% COL 14.80% 27.40% 17.19%Total 46.75% 85.99% 54.00% Total 48.94% 92.53% 57.20%
As of January 1, 2019 As of January 1, 2020
Rates include the employer share of the administrative expenses.
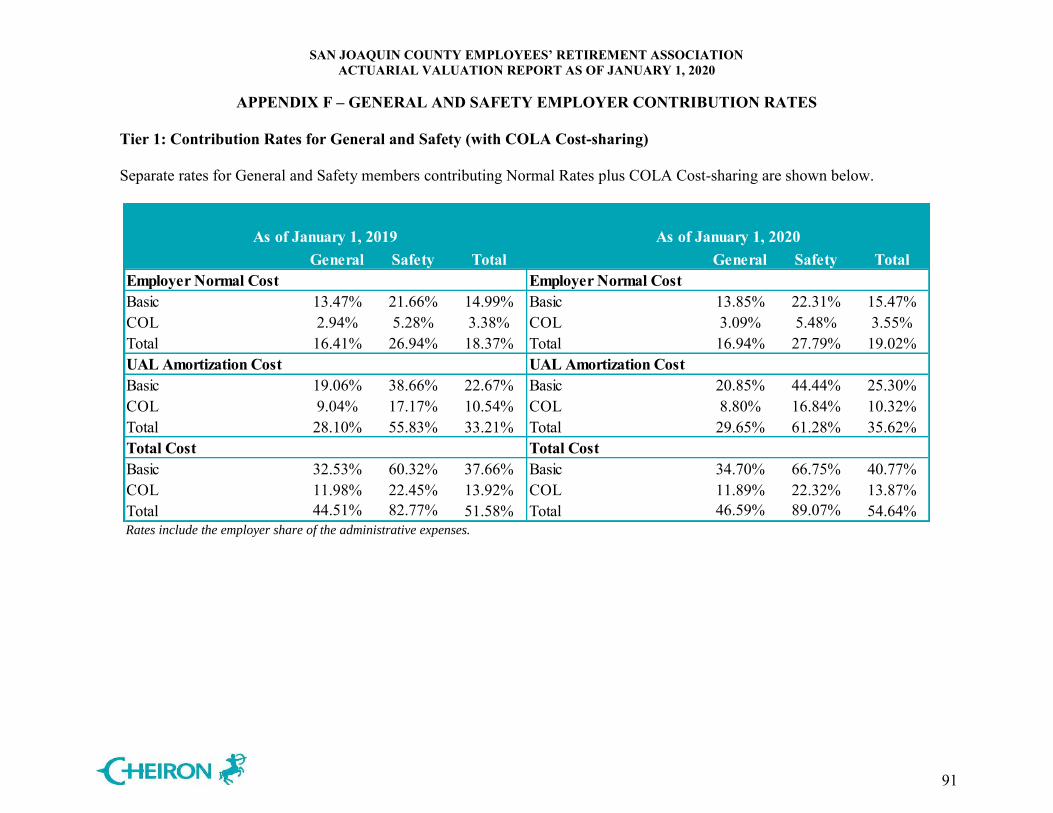
SAN JOAQUIN COUNTY EMPLOYEES’ RETIREMENT ASSOCIATION ACTUARIAL VALUATION REPORT AS OF JANUARY 1, 2020
APPENDIX F – GENERAL AND SAFETY EMPLOYER CONTRIBUTION RATES
91
Tier 1: Contribution Rates for General and Safety (with COLA Cost-sharing) Separate rates for General and Safety members contributing Normal Rates plus COLA Cost-sharing are shown below.
General Safety Total General Safety TotalEmployer Normal Cost Employer Normal CostBasic 13.47% 21.66% 14.99% Basic 13.85% 22.31% 15.47%COL 2.94% 5.28% 3.38% COL 3.09% 5.48% 3.55%Total 16.41% 26.94% 18.37% Total 16.94% 27.79% 19.02%UAL Amortization Cost UAL Amortization CostBasic 19.06% 38.66% 22.67% Basic 20.85% 44.44% 25.30%COL 9.04% 17.17% 10.54% COL 8.80% 16.84% 10.32%Total 28.10% 55.83% 33.21% Total 29.65% 61.28% 35.62%Total Cost Total CostBasic 32.53% 60.32% 37.66% Basic 34.70% 66.75% 40.77%COL 11.98% 22.45% 13.92% COL 11.89% 22.32% 13.87%Total 44.51% 82.77% 51.58% Total 46.59% 89.07% 54.64%
As of January 1, 2019 As of January 1, 2020
Rates include the employer share of the administrative expenses.
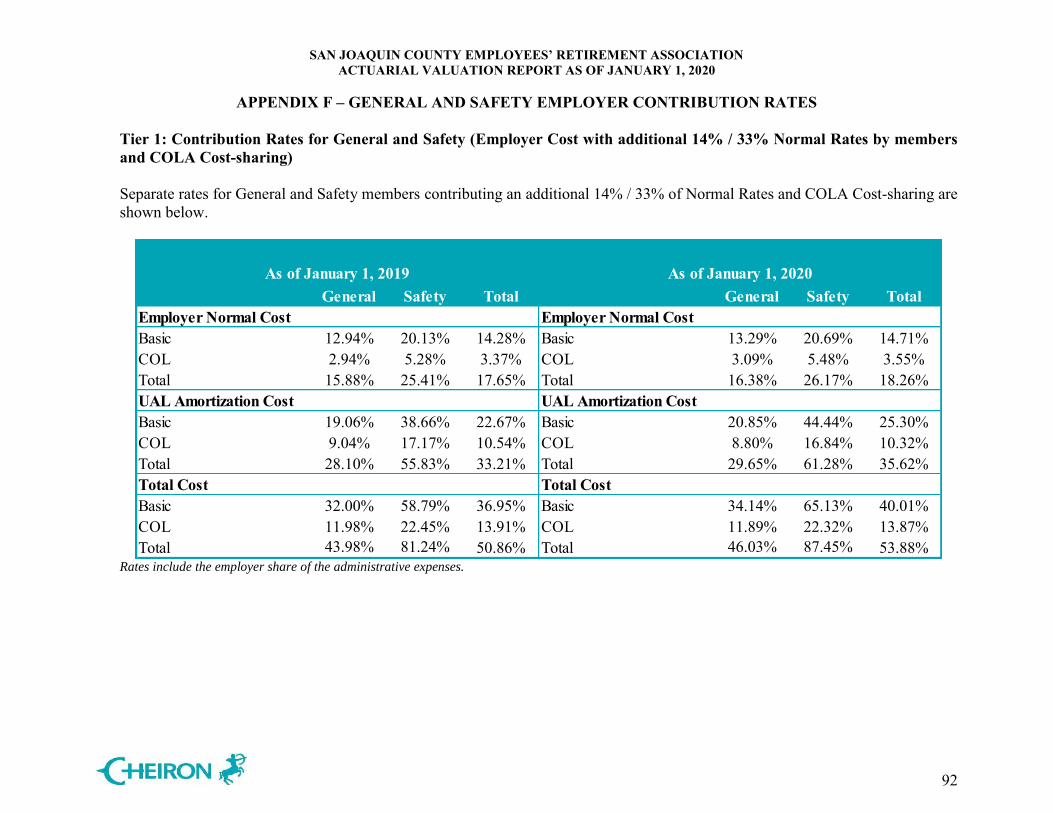
SAN JOAQUIN COUNTY EMPLOYEES’ RETIREMENT ASSOCIATION ACTUARIAL VALUATION REPORT AS OF JANUARY 1, 2020
APPENDIX F – GENERAL AND SAFETY EMPLOYER CONTRIBUTION RATES
92
Tier 1: Contribution Rates for General and Safety (Employer Cost with additional 14% / 33% Normal Rates by members and COLA Cost-sharing) Separate rates for General and Safety members contributing an additional 14% / 33% of Normal Rates and COLA Cost-sharing are shown below.
General Safety Total General Safety TotalEmployer Normal Cost Employer Normal CostBasic 12.94% 20.13% 14.28% Basic 13.29% 20.69% 14.71%COL 2.94% 5.28% 3.37% COL 3.09% 5.48% 3.55%Total 15.88% 25.41% 17.65% Total 16.38% 26.17% 18.26%UAL Amortization Cost UAL Amortization CostBasic 19.06% 38.66% 22.67% Basic 20.85% 44.44% 25.30%COL 9.04% 17.17% 10.54% COL 8.80% 16.84% 10.32%Total 28.10% 55.83% 33.21% Total 29.65% 61.28% 35.62%Total Cost Total CostBasic 32.00% 58.79% 36.95% Basic 34.14% 65.13% 40.01%COL 11.98% 22.45% 13.91% COL 11.89% 22.32% 13.87%Total 43.98% 81.24% 50.86% Total 46.03% 87.45% 53.88%
As of January 1, 2019 As of January 1, 2020
Rates include the employer share of the administrative expenses.
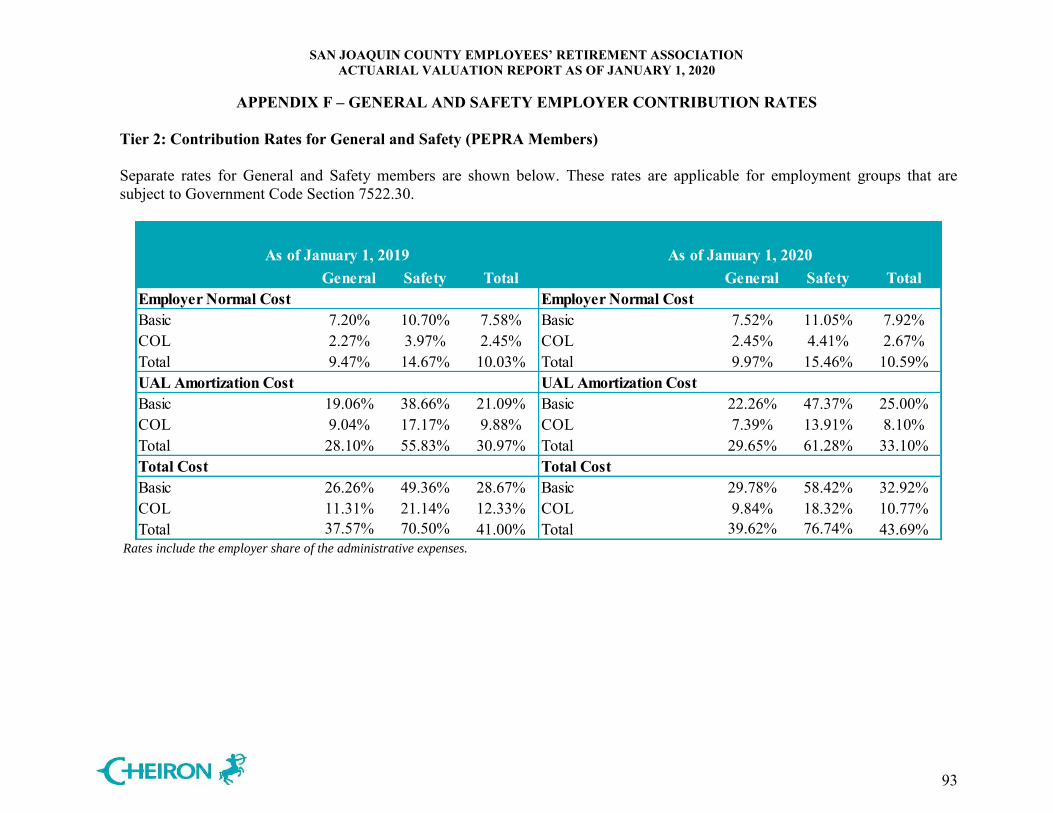
SAN JOAQUIN COUNTY EMPLOYEES’ RETIREMENT ASSOCIATION ACTUARIAL VALUATION REPORT AS OF JANUARY 1, 2020
APPENDIX F – GENERAL AND SAFETY EMPLOYER CONTRIBUTION RATES
93
Tier 2: Contribution Rates for General and Safety (PEPRA Members) Separate rates for General and Safety members are shown below. These rates are applicable for employment groups that are subject to Government Code Section 7522.30.
General Safety Total General Safety TotalEmployer Normal Cost Employer Normal CostBasic 7.20% 10.70% 7.58% Basic 7.52% 11.05% 7.92%COL 2.27% 3.97% 2.45% COL 2.45% 4.41% 2.67%Total 9.47% 14.67% 10.03% Total 9.97% 15.46% 10.59%UAL Amortization Cost UAL Amortization CostBasic 19.06% 38.66% 21.09% Basic 22.26% 47.37% 25.00%COL 9.04% 17.17% 9.88% COL 7.39% 13.91% 8.10%Total 28.10% 55.83% 30.97% Total 29.65% 61.28% 33.10%Total Cost Total CostBasic 26.26% 49.36% 28.67% Basic 29.78% 58.42% 32.92%COL 11.31% 21.14% 12.33% COL 9.84% 18.32% 10.77%Total 37.57% 70.50% 41.00% Total 39.62% 76.74% 43.69%
As of January 1, 2019 As of January 1, 2020
Rates include the employer share of the administrative expenses.
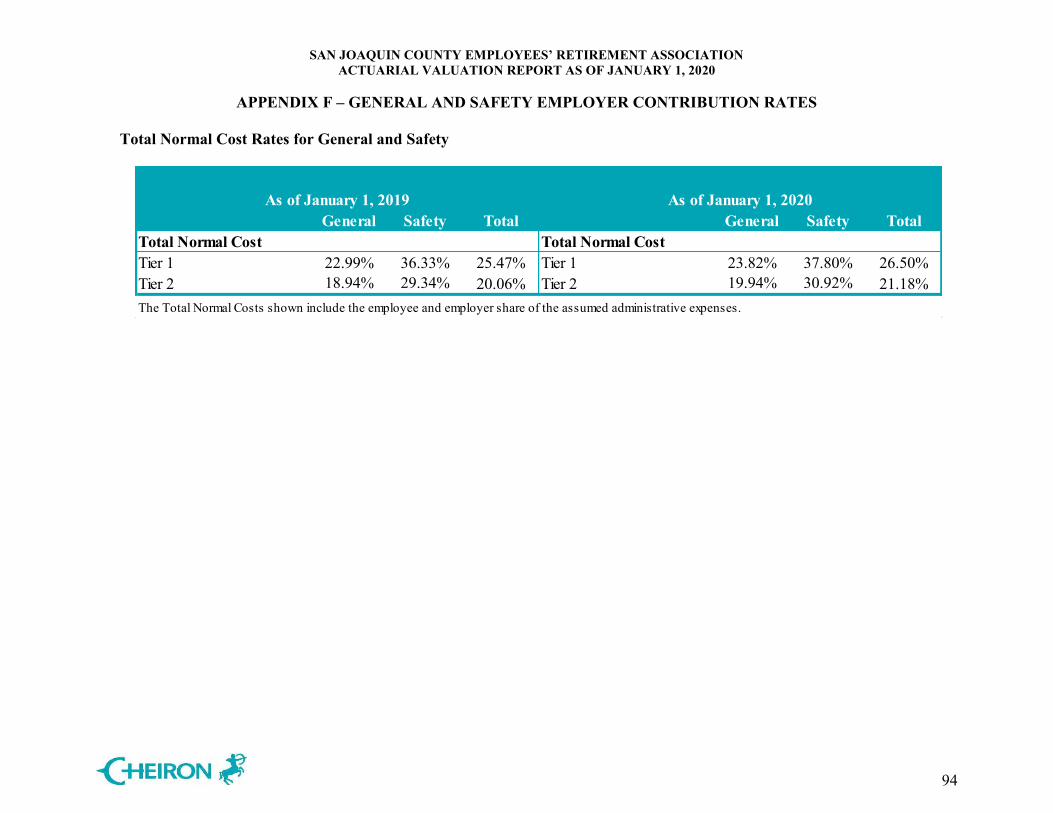
SAN JOAQUIN COUNTY EMPLOYEES’ RETIREMENT ASSOCIATION ACTUARIAL VALUATION REPORT AS OF JANUARY 1, 2020
APPENDIX F – GENERAL AND SAFETY EMPLOYER CONTRIBUTION RATES
94
Total Normal Cost Rates for General and Safety
General Safety Total General Safety TotalTotal Normal Cost Total Normal CostTier 1 22.99% 36.33% 25.47% Tier 1 23.82% 37.80% 26.50%Tier 2 18.94% 29.34% 20.06% Tier 2 19.94% 30.92% 21.18%The Total Normal Costs shown include the employee and employer share of the assumed administrative expenses.
As of January 1, 2019 As of January 1, 2020
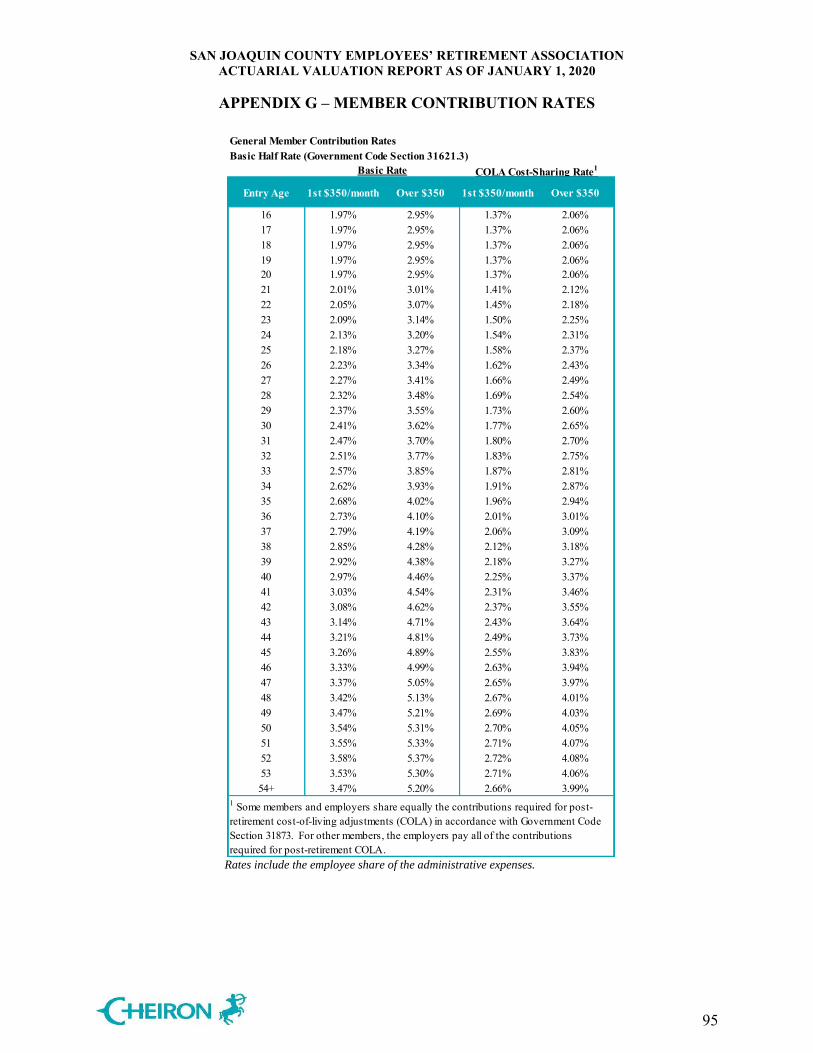
SAN JOAQUIN COUNTY EMPLOYEES’ RETIREMENT ASSOCIATION ACTUARIAL VALUATION REPORT AS OF JANUARY 1, 2020
APPENDIX G – MEMBER CONTRIBUTION RATES
95
Entry Age 1st $350/month Over $350 1st $350/month Over $350
16 1.97% 2.95% 1.37% 2.06%17 1.97% 2.95% 1.37% 2.06%18 1.97% 2.95% 1.37% 2.06%19 1.97% 2.95% 1.37% 2.06%20 1.97% 2.95% 1.37% 2.06%21 2.01% 3.01% 1.41% 2.12%22 2.05% 3.07% 1.45% 2.18%23 2.09% 3.14% 1.50% 2.25%24 2.13% 3.20% 1.54% 2.31%25 2.18% 3.27% 1.58% 2.37%26 2.23% 3.34% 1.62% 2.43%27 2.27% 3.41% 1.66% 2.49%28 2.32% 3.48% 1.69% 2.54%29 2.37% 3.55% 1.73% 2.60%30 2.41% 3.62% 1.77% 2.65%31 2.47% 3.70% 1.80% 2.70%32 2.51% 3.77% 1.83% 2.75%33 2.57% 3.85% 1.87% 2.81%34 2.62% 3.93% 1.91% 2.87%35 2.68% 4.02% 1.96% 2.94%36 2.73% 4.10% 2.01% 3.01%37 2.79% 4.19% 2.06% 3.09%38 2.85% 4.28% 2.12% 3.18%39 2.92% 4.38% 2.18% 3.27%40 2.97% 4.46% 2.25% 3.37%41 3.03% 4.54% 2.31% 3.46%42 3.08% 4.62% 2.37% 3.55%43 3.14% 4.71% 2.43% 3.64%44 3.21% 4.81% 2.49% 3.73%45 3.26% 4.89% 2.55% 3.83%46 3.33% 4.99% 2.63% 3.94%47 3.37% 5.05% 2.65% 3.97%48 3.42% 5.13% 2.67% 4.01%49 3.47% 5.21% 2.69% 4.03%50 3.54% 5.31% 2.70% 4.05%51 3.55% 5.33% 2.71% 4.07%52 3.58% 5.37% 2.72% 4.08%53 3.53% 5.30% 2.71% 4.06%54+ 3.47% 5.20% 2.66% 3.99%
Basic Rate COLA Cost-Sharing Rate1
1 Some members and employers share equally the contributions required for post-retirement cost-of-living adjustments (COLA) in accordance with Government Code Section 31873. For other members, the employers pay all of the contributions required for post-retirement COLA.
General Member Contribution RatesBasic Half Rate (Government Code Section 31621.3)
Rates include the employee share of the administrative expenses.
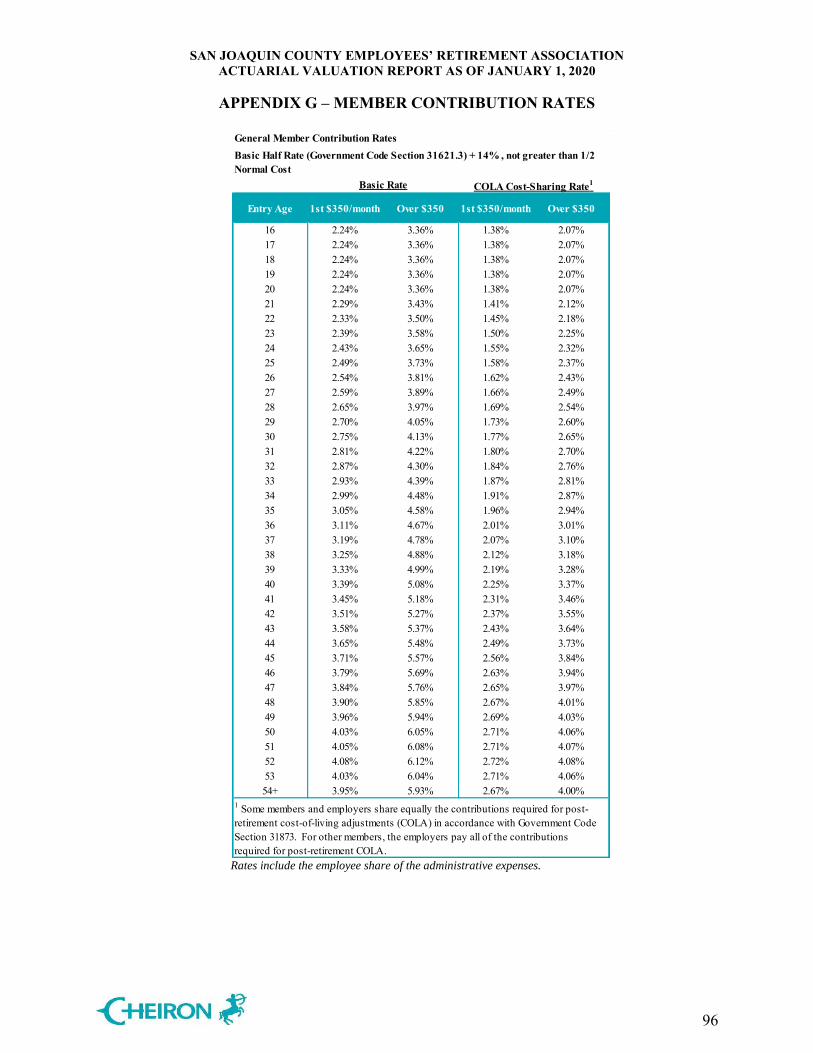
SAN JOAQUIN COUNTY EMPLOYEES’ RETIREMENT ASSOCIATION ACTUARIAL VALUATION REPORT AS OF JANUARY 1, 2020
APPENDIX G – MEMBER CONTRIBUTION RATES
96
Entry Age 1st $350/month Over $350 1st $350/month Over $350
16 2.24% 3.36% 1.38% 2.07%17 2.24% 3.36% 1.38% 2.07%18 2.24% 3.36% 1.38% 2.07%19 2.24% 3.36% 1.38% 2.07%20 2.24% 3.36% 1.38% 2.07%21 2.29% 3.43% 1.41% 2.12%22 2.33% 3.50% 1.45% 2.18%23 2.39% 3.58% 1.50% 2.25%24 2.43% 3.65% 1.55% 2.32%25 2.49% 3.73% 1.58% 2.37%26 2.54% 3.81% 1.62% 2.43%27 2.59% 3.89% 1.66% 2.49%28 2.65% 3.97% 1.69% 2.54%29 2.70% 4.05% 1.73% 2.60%30 2.75% 4.13% 1.77% 2.65%31 2.81% 4.22% 1.80% 2.70%32 2.87% 4.30% 1.84% 2.76%33 2.93% 4.39% 1.87% 2.81%34 2.99% 4.48% 1.91% 2.87%35 3.05% 4.58% 1.96% 2.94%36 3.11% 4.67% 2.01% 3.01%37 3.19% 4.78% 2.07% 3.10%38 3.25% 4.88% 2.12% 3.18%39 3.33% 4.99% 2.19% 3.28%40 3.39% 5.08% 2.25% 3.37%41 3.45% 5.18% 2.31% 3.46%42 3.51% 5.27% 2.37% 3.55%43 3.58% 5.37% 2.43% 3.64%44 3.65% 5.48% 2.49% 3.73%45 3.71% 5.57% 2.56% 3.84%46 3.79% 5.69% 2.63% 3.94%47 3.84% 5.76% 2.65% 3.97%48 3.90% 5.85% 2.67% 4.01%49 3.96% 5.94% 2.69% 4.03%50 4.03% 6.05% 2.71% 4.06%51 4.05% 6.08% 2.71% 4.07%52 4.08% 6.12% 2.72% 4.08%53 4.03% 6.04% 2.71% 4.06%54+ 3.95% 5.93% 2.67% 4.00%
Basic Rate COLA Cost-Sharing Rate1
1 Some members and employers share equally the contributions required for post-retirement cost-of-living adjustments (COLA) in accordance with Government Code Section 31873. For other members, the employers pay all of the contributions required for post-retirement COLA.
Basic Half Rate (Government Code Section 31621.3) + 14% , not greater than 1/2 Normal Cost
General Member Contribution Rates
Rates include the employee share of the administrative expenses.
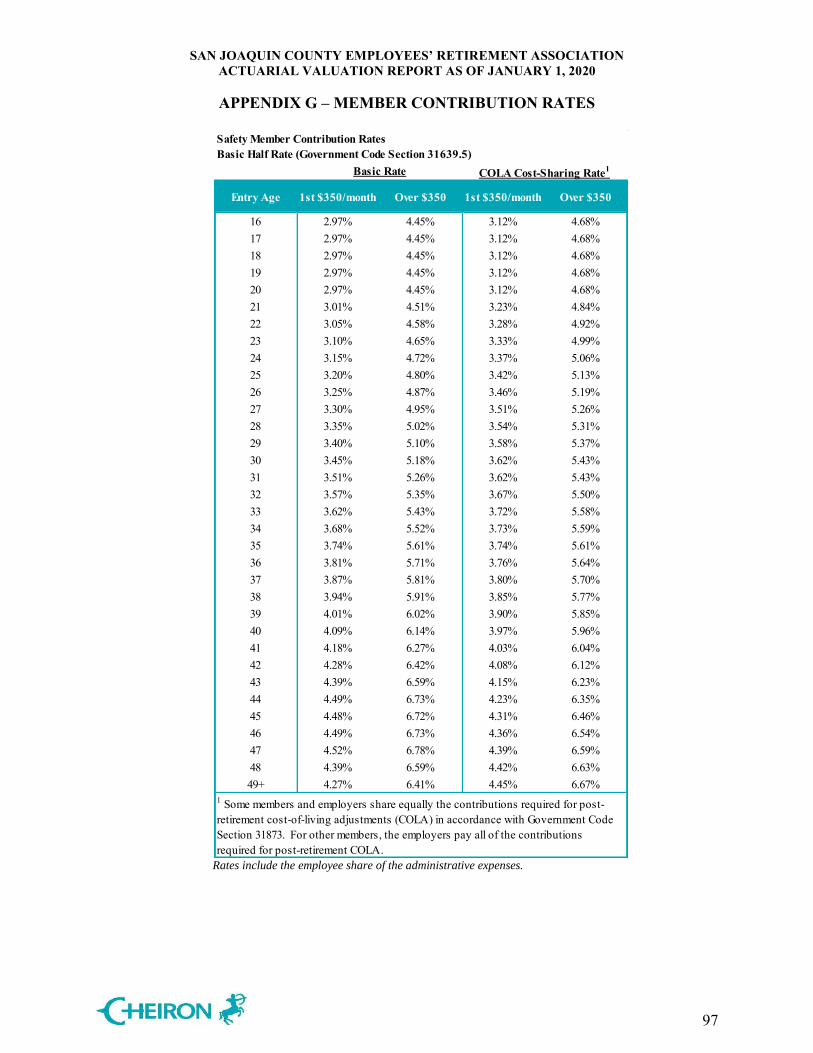
SAN JOAQUIN COUNTY EMPLOYEES’ RETIREMENT ASSOCIATION ACTUARIAL VALUATION REPORT AS OF JANUARY 1, 2020
APPENDIX G – MEMBER CONTRIBUTION RATES
97
Entry Age 1st $350/month Over $350 1st $350/month Over $350
16 2.97% 4.45% 3.12% 4.68%17 2.97% 4.45% 3.12% 4.68%18 2.97% 4.45% 3.12% 4.68%19 2.97% 4.45% 3.12% 4.68%20 2.97% 4.45% 3.12% 4.68%21 3.01% 4.51% 3.23% 4.84%22 3.05% 4.58% 3.28% 4.92%23 3.10% 4.65% 3.33% 4.99%24 3.15% 4.72% 3.37% 5.06%25 3.20% 4.80% 3.42% 5.13%26 3.25% 4.87% 3.46% 5.19%27 3.30% 4.95% 3.51% 5.26%28 3.35% 5.02% 3.54% 5.31%29 3.40% 5.10% 3.58% 5.37%30 3.45% 5.18% 3.62% 5.43%31 3.51% 5.26% 3.62% 5.43%32 3.57% 5.35% 3.67% 5.50%33 3.62% 5.43% 3.72% 5.58%34 3.68% 5.52% 3.73% 5.59%35 3.74% 5.61% 3.74% 5.61%36 3.81% 5.71% 3.76% 5.64%37 3.87% 5.81% 3.80% 5.70%38 3.94% 5.91% 3.85% 5.77%39 4.01% 6.02% 3.90% 5.85%40 4.09% 6.14% 3.97% 5.96%41 4.18% 6.27% 4.03% 6.04%42 4.28% 6.42% 4.08% 6.12%43 4.39% 6.59% 4.15% 6.23%44 4.49% 6.73% 4.23% 6.35%45 4.48% 6.72% 4.31% 6.46%46 4.49% 6.73% 4.36% 6.54%47 4.52% 6.78% 4.39% 6.59%48 4.39% 6.59% 4.42% 6.63%49+ 4.27% 6.41% 4.45% 6.67%
Safety Member Contribution RatesBasic Half Rate (Government Code Section 31639.5)
Basic Rate COLA Cost-Sharing Rate1
1 Some members and employers share equally the contributions required for post-retirement cost-of-living adjustments (COLA) in accordance with Government Code Section 31873. For other members, the employers pay all of the contributions required for post-retirement COLA.
Rates include the employee share of the administrative expenses.
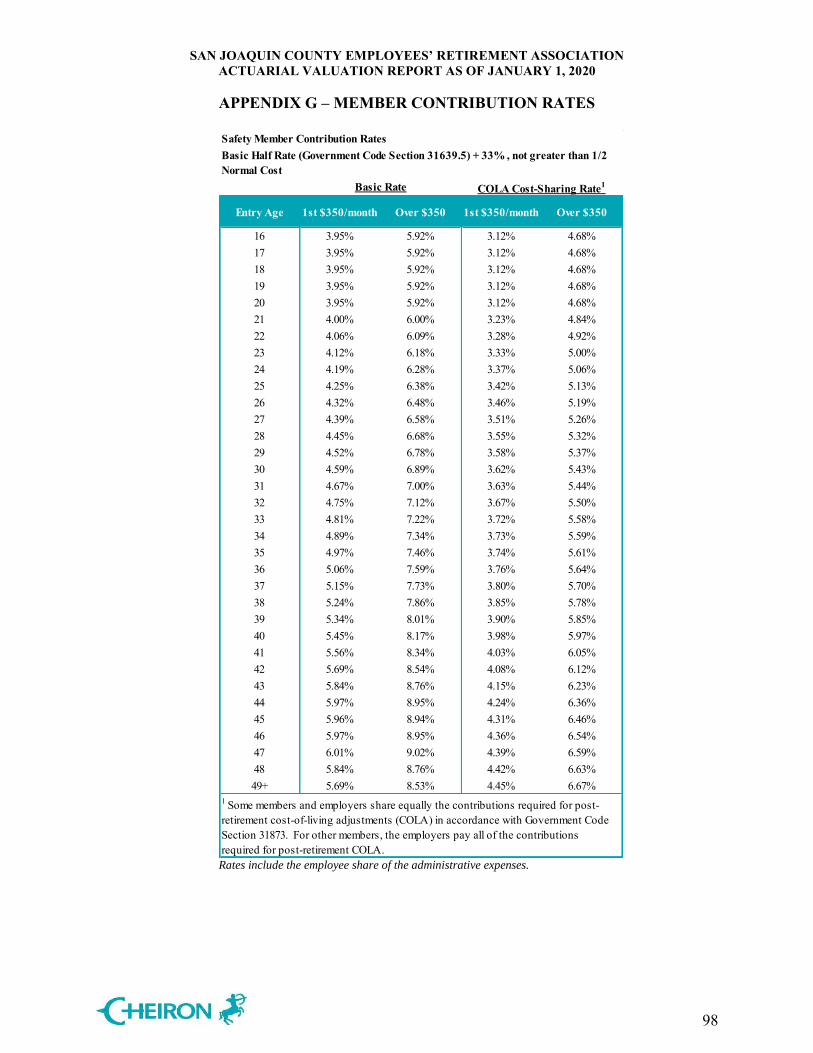
SAN JOAQUIN COUNTY EMPLOYEES’ RETIREMENT ASSOCIATION ACTUARIAL VALUATION REPORT AS OF JANUARY 1, 2020
APPENDIX G – MEMBER CONTRIBUTION RATES
98
Entry Age 1st $350/month Over $350 1st $350/month Over $350
16 3.95% 5.92% 3.12% 4.68%17 3.95% 5.92% 3.12% 4.68%18 3.95% 5.92% 3.12% 4.68%19 3.95% 5.92% 3.12% 4.68%20 3.95% 5.92% 3.12% 4.68%21 4.00% 6.00% 3.23% 4.84%22 4.06% 6.09% 3.28% 4.92%23 4.12% 6.18% 3.33% 5.00%24 4.19% 6.28% 3.37% 5.06%25 4.25% 6.38% 3.42% 5.13%26 4.32% 6.48% 3.46% 5.19%27 4.39% 6.58% 3.51% 5.26%28 4.45% 6.68% 3.55% 5.32%29 4.52% 6.78% 3.58% 5.37%30 4.59% 6.89% 3.62% 5.43%31 4.67% 7.00% 3.63% 5.44%32 4.75% 7.12% 3.67% 5.50%33 4.81% 7.22% 3.72% 5.58%34 4.89% 7.34% 3.73% 5.59%35 4.97% 7.46% 3.74% 5.61%36 5.06% 7.59% 3.76% 5.64%37 5.15% 7.73% 3.80% 5.70%38 5.24% 7.86% 3.85% 5.78%39 5.34% 8.01% 3.90% 5.85%40 5.45% 8.17% 3.98% 5.97%41 5.56% 8.34% 4.03% 6.05%42 5.69% 8.54% 4.08% 6.12%43 5.84% 8.76% 4.15% 6.23%44 5.97% 8.95% 4.24% 6.36%45 5.96% 8.94% 4.31% 6.46%46 5.97% 8.95% 4.36% 6.54%47 6.01% 9.02% 4.39% 6.59%48 5.84% 8.76% 4.42% 6.63%49+ 5.69% 8.53% 4.45% 6.67%
1 Some members and employers share equally the contributions required for post-retirement cost-of-living adjustments (COLA) in accordance with Government Code Section 31873. For other members, the employers pay all of the contributions required for post-retirement COLA.
Safety Member Contribution RatesBasic Half Rate (Government Code Section 31639.5) + 33% , not greater than 1/2 Normal Cost
Basic Rate COLA Cost-Sharing Rate1
Rates include the employee share of the administrative expenses.

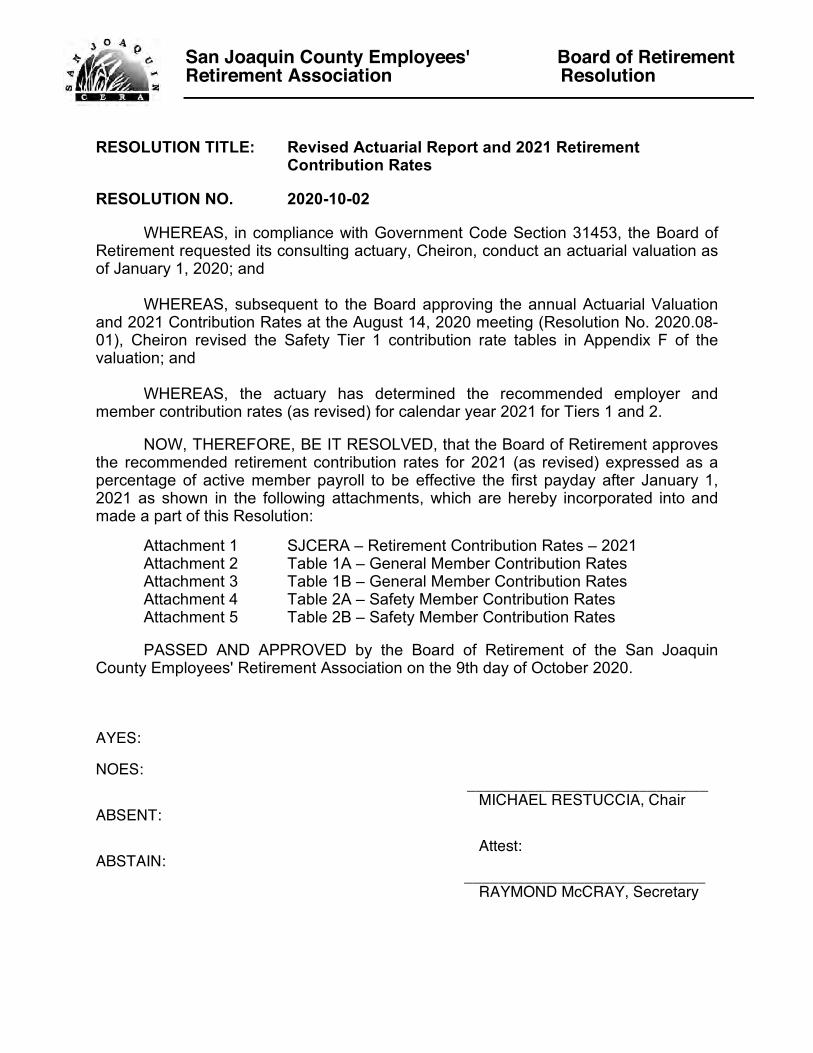
San Joaquin County Employees' Board of Retirement Retirement Association Resolution
RESOLUTION TITLE: Revised Actuarial Report and 2021 Retirement Contribution Rates
RESOLUTION NO. 2020-10-02
WHEREAS, in compliance with Government Code Section 31453, the Board of Retirement requested its consulting actuary, Cheiron, conduct an actuarial valuation as of January 1, 2020; and
WHEREAS, subsequent to the Board approving the annual Actuarial Valuation
and 2021 Contribution Rates at the August 14, 2020 meeting (Resolution No. 2020.08-01), Cheiron revised the Safety Tier 1 contribution rate tables in Appendix F of the valuation; and
WHEREAS, the actuary has determined the recommended employer and member contribution rates (as revised) for calendar year 2021 for Tiers 1 and 2.
NOW, THEREFORE, BE IT RESOLVED, that the Board of Retirement approves
the recommended retirement contribution rates for 2021 (as revised) expressed as a percentage of active member payroll to be effective the first payday after January 1, 2021 as shown in the following attachments, which are hereby incorporated into and made a part of this Resolution:
Attachment 1 SJCERA – Retirement Contribution Rates – 2021 Attachment 2 Table 1A – General Member Contribution Rates Attachment 3 Table 1B – General Member Contribution Rates Attachment 4 Table 2A – Safety Member Contribution Rates Attachment 5 Table 2B – Safety Member Contribution Rates
PASSED AND APPROVED by the Board of Retirement of the San Joaquin County Employees' Retirement Association on the 9th day of October 2020. AYES:
NOES: ____________________________
MICHAEL RESTUCCIA, Chair ABSENT: Attest: ABSTAIN: ____________________________ RAYMOND McCRAY, Secretary
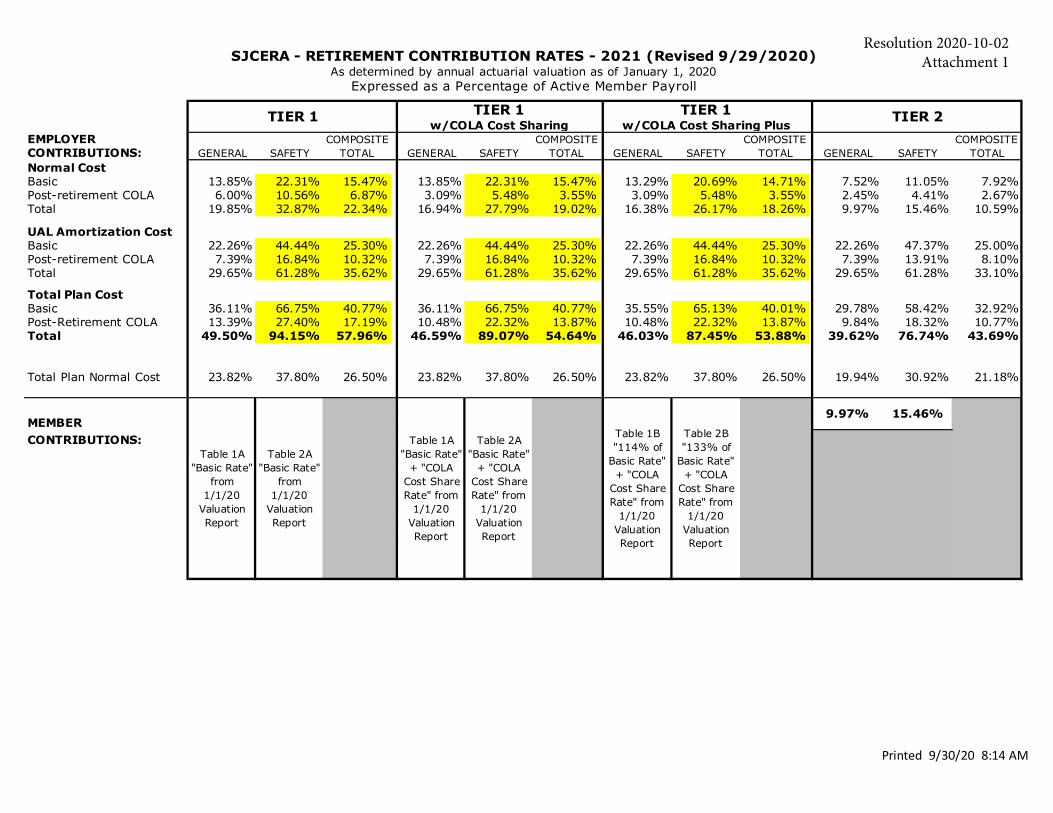
Printed 9/30/20 8:14 AM
EMPLOYER COMPOSITE COMPOSITE COMPOSITE COMPOSITECONTRIBUTIONS: GENERAL SAFETY TOTAL GENERAL SAFETY TOTAL GENERAL SAFETY TOTAL GENERAL SAFETY TOTALNormal CostBasic 13.85% 22.31% 15.47% 13.85% 22.31% 15.47% 13.29% 20.69% 14.71% 7.52% 11.05% 7.92%Post-retirement COLA 6.00% 10.56% 6.87% 3.09% 5.48% 3.55% 3.09% 5.48% 3.55% 2.45% 4.41% 2.67%Total 19.85% 32.87% 22.34% 16.94% 27.79% 19.02% 16.38% 26.17% 18.26% 9.97% 15.46% 10.59%
UAL Amortization CostBasic 22.26% 44.44% 25.30% 22.26% 44.44% 25.30% 22.26% 44.44% 25.30% 22.26% 47.37% 25.00%Post-retirement COLA 7.39% 16.84% 10.32% 7.39% 16.84% 10.32% 7.39% 16.84% 10.32% 7.39% 13.91% 8.10%Total 29.65% 61.28% 35.62% 29.65% 61.28% 35.62% 29.65% 61.28% 35.62% 29.65% 61.28% 33.10%
Total Plan CostBasic 36.11% 66.75% 40.77% 36.11% 66.75% 40.77% 35.55% 65.13% 40.01% 29.78% 58.42% 32.92%Post-Retirement COLA 13.39% 27.40% 17.19% 10.48% 22.32% 13.87% 10.48% 22.32% 13.87% 9.84% 18.32% 10.77%Total 49.50% 94.15% 57.96% 46.59% 89.07% 54.64% 46.03% 87.45% 53.88% 39.62% 76.74% 43.69%
Total Plan Normal Cost 23.82% 37.80% 26.50% 23.82% 37.80% 26.50% 23.82% 37.80% 26.50% 19.94% 30.92% 21.18%
MEMBERCONTRIBUTIONS:
SJCERA - RETIREMENT CONTRIBUTION RATES - 2021 (Revised 9/29/2020)As determined by annual actuarial valuation as of January 1, 2020
Expressed as a Percentage of Active Member Payroll
TIER 1 TIER 1 TIER 1 TIER 2w/COLA Cost Sharing w/COLA Cost Sharing Plus
Table 1A "Basic Rate"
from 1/1/20
Valuation Report
Table 2A "Basic Rate"
from 1/1/20
Valuation Report
Table 1A "Basic Rate"
+ "COLA Cost Share Rate" from
1/1/20 Valuation Report
Table 2A "Basic Rate"
+ "COLA Cost Share Rate" from
1/1/20 Valuation Report
Table 1B "114% of
Basic Rate" + "COLA
Cost Share Rate" from
1/1/20 Valuation Report
Table 2B "133% of
Basic Rate" + "COLA
Cost Share Rate" from
1/1/20 Valuation Report
9.97% 15.46%
Resolution 2020-10-02 Attachment 1

SAN JOAQUIN COUNTY EMPLOYEES’ RETIREMENT ASSOCIATION ACTUARIAL VALUATION REPORT AS OF JANUARY 1, 2020
APPENDIX G – MEMBER CONTRIBUTION RATES
95
Entry Age 1st $350/month Over $350 1st $350/month Over $350
16 1.97% 2.95% 1.37% 2.06%17 1.97% 2.95% 1.37% 2.06%18 1.97% 2.95% 1.37% 2.06%19 1.97% 2.95% 1.37% 2.06%20 1.97% 2.95% 1.37% 2.06%21 2.01% 3.01% 1.41% 2.12%22 2.05% 3.07% 1.45% 2.18%23 2.09% 3.14% 1.50% 2.25%24 2.13% 3.20% 1.54% 2.31%25 2.18% 3.27% 1.58% 2.37%26 2.23% 3.34% 1.62% 2.43%27 2.27% 3.41% 1.66% 2.49%28 2.32% 3.48% 1.69% 2.54%29 2.37% 3.55% 1.73% 2.60%30 2.41% 3.62% 1.77% 2.65%31 2.47% 3.70% 1.80% 2.70%32 2.51% 3.77% 1.83% 2.75%33 2.57% 3.85% 1.87% 2.81%34 2.62% 3.93% 1.91% 2.87%35 2.68% 4.02% 1.96% 2.94%36 2.73% 4.10% 2.01% 3.01%37 2.79% 4.19% 2.06% 3.09%38 2.85% 4.28% 2.12% 3.18%39 2.92% 4.38% 2.18% 3.27%40 2.97% 4.46% 2.25% 3.37%41 3.03% 4.54% 2.31% 3.46%42 3.08% 4.62% 2.37% 3.55%43 3.14% 4.71% 2.43% 3.64%44 3.21% 4.81% 2.49% 3.73%45 3.26% 4.89% 2.55% 3.83%46 3.33% 4.99% 2.63% 3.94%47 3.37% 5.05% 2.65% 3.97%48 3.42% 5.13% 2.67% 4.01%49 3.47% 5.21% 2.69% 4.03%50 3.54% 5.31% 2.70% 4.05%51 3.55% 5.33% 2.71% 4.07%52 3.58% 5.37% 2.72% 4.08%53 3.53% 5.30% 2.71% 4.06%54+ 3.47% 5.20% 2.66% 3.99%
Basic Rate COLA Cost-Sharing Rate1
1 Some members and employers share equally the contributions required for post-retirement cost-of-living adjustments (COLA) in accordance with Government Code Section 31873. For other members, the employers pay all of the contributions required for post-retirement COLA.
General Member Contribution RatesBasic Half Rate (Government Code Section 31621.3)
Rates include the employee share of the administrative expenses.
Resolution 2020-10-02 Attachment 2
Table 1A
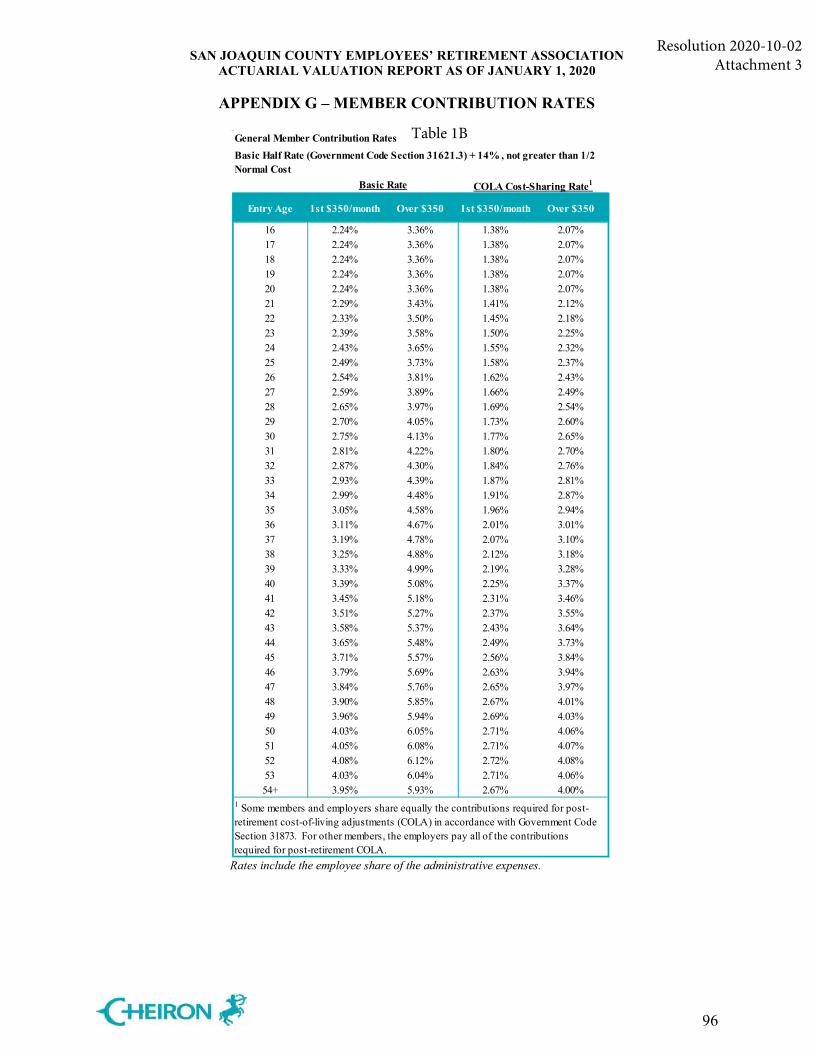
SAN JOAQUIN COUNTY EMPLOYEES’ RETIREMENT ASSOCIATION ACTUARIAL VALUATION REPORT AS OF JANUARY 1, 2020
APPENDIX G – MEMBER CONTRIBUTION RATES
96
Entry Age 1st $350/month Over $350 1st $350/month Over $350
16 2.24% 3.36% 1.38% 2.07%17 2.24% 3.36% 1.38% 2.07%18 2.24% 3.36% 1.38% 2.07%19 2.24% 3.36% 1.38% 2.07%20 2.24% 3.36% 1.38% 2.07%21 2.29% 3.43% 1.41% 2.12%22 2.33% 3.50% 1.45% 2.18%23 2.39% 3.58% 1.50% 2.25%24 2.43% 3.65% 1.55% 2.32%25 2.49% 3.73% 1.58% 2.37%26 2.54% 3.81% 1.62% 2.43%27 2.59% 3.89% 1.66% 2.49%28 2.65% 3.97% 1.69% 2.54%29 2.70% 4.05% 1.73% 2.60%30 2.75% 4.13% 1.77% 2.65%31 2.81% 4.22% 1.80% 2.70%32 2.87% 4.30% 1.84% 2.76%33 2.93% 4.39% 1.87% 2.81%34 2.99% 4.48% 1.91% 2.87%35 3.05% 4.58% 1.96% 2.94%36 3.11% 4.67% 2.01% 3.01%37 3.19% 4.78% 2.07% 3.10%38 3.25% 4.88% 2.12% 3.18%39 3.33% 4.99% 2.19% 3.28%40 3.39% 5.08% 2.25% 3.37%41 3.45% 5.18% 2.31% 3.46%42 3.51% 5.27% 2.37% 3.55%43 3.58% 5.37% 2.43% 3.64%44 3.65% 5.48% 2.49% 3.73%45 3.71% 5.57% 2.56% 3.84%46 3.79% 5.69% 2.63% 3.94%47 3.84% 5.76% 2.65% 3.97%48 3.90% 5.85% 2.67% 4.01%49 3.96% 5.94% 2.69% 4.03%50 4.03% 6.05% 2.71% 4.06%51 4.05% 6.08% 2.71% 4.07%52 4.08% 6.12% 2.72% 4.08%53 4.03% 6.04% 2.71% 4.06%54+ 3.95% 5.93% 2.67% 4.00%
Basic Rate COLA Cost-Sharing Rate1
1 Some members and employers share equally the contributions required for post-retirement cost-of-living adjustments (COLA) in accordance with Government Code Section 31873. For other members, the employers pay all of the contributions required for post-retirement COLA.
Basic Half Rate (Government Code Section 31621.3) + 14% , not greater than 1/2 Normal Cost
General Member Contribution Rates
Rates include the employee share of the administrative expenses.
Resolution 2020-10-02 Attachment 3
Table 1B
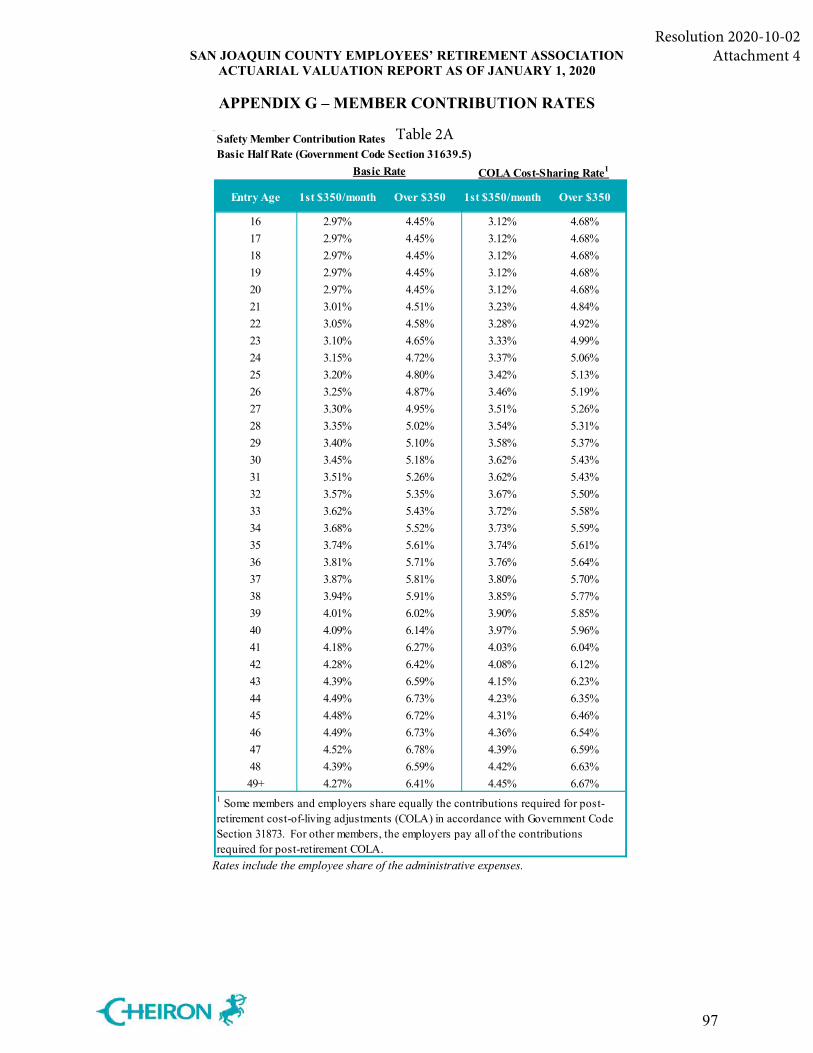
SAN JOAQUIN COUNTY EMPLOYEES’ RETIREMENT ASSOCIATION ACTUARIAL VALUATION REPORT AS OF JANUARY 1, 2020
APPENDIX G – MEMBER CONTRIBUTION RATES
97
Entry Age 1st $350/month Over $350 1st $350/month Over $350
16 2.97% 4.45% 3.12% 4.68%17 2.97% 4.45% 3.12% 4.68%18 2.97% 4.45% 3.12% 4.68%19 2.97% 4.45% 3.12% 4.68%20 2.97% 4.45% 3.12% 4.68%21 3.01% 4.51% 3.23% 4.84%22 3.05% 4.58% 3.28% 4.92%23 3.10% 4.65% 3.33% 4.99%24 3.15% 4.72% 3.37% 5.06%25 3.20% 4.80% 3.42% 5.13%26 3.25% 4.87% 3.46% 5.19%27 3.30% 4.95% 3.51% 5.26%28 3.35% 5.02% 3.54% 5.31%29 3.40% 5.10% 3.58% 5.37%30 3.45% 5.18% 3.62% 5.43%31 3.51% 5.26% 3.62% 5.43%32 3.57% 5.35% 3.67% 5.50%33 3.62% 5.43% 3.72% 5.58%34 3.68% 5.52% 3.73% 5.59%35 3.74% 5.61% 3.74% 5.61%36 3.81% 5.71% 3.76% 5.64%37 3.87% 5.81% 3.80% 5.70%38 3.94% 5.91% 3.85% 5.77%39 4.01% 6.02% 3.90% 5.85%40 4.09% 6.14% 3.97% 5.96%41 4.18% 6.27% 4.03% 6.04%42 4.28% 6.42% 4.08% 6.12%43 4.39% 6.59% 4.15% 6.23%44 4.49% 6.73% 4.23% 6.35%45 4.48% 6.72% 4.31% 6.46%46 4.49% 6.73% 4.36% 6.54%47 4.52% 6.78% 4.39% 6.59%48 4.39% 6.59% 4.42% 6.63%49+ 4.27% 6.41% 4.45% 6.67%
Safety Member Contribution RatesBasic Half Rate (Government Code Section 31639.5)
Basic Rate COLA Cost-Sharing Rate1
1 Some members and employers share equally the contributions required for post-retirement cost-of-living adjustments (COLA) in accordance with Government Code Section 31873. For other members, the employers pay all of the contributions required for post-retirement COLA.
Rates include the employee share of the administrative expenses.
Resolution 2020-10-02 Attachment 4
Table 2A
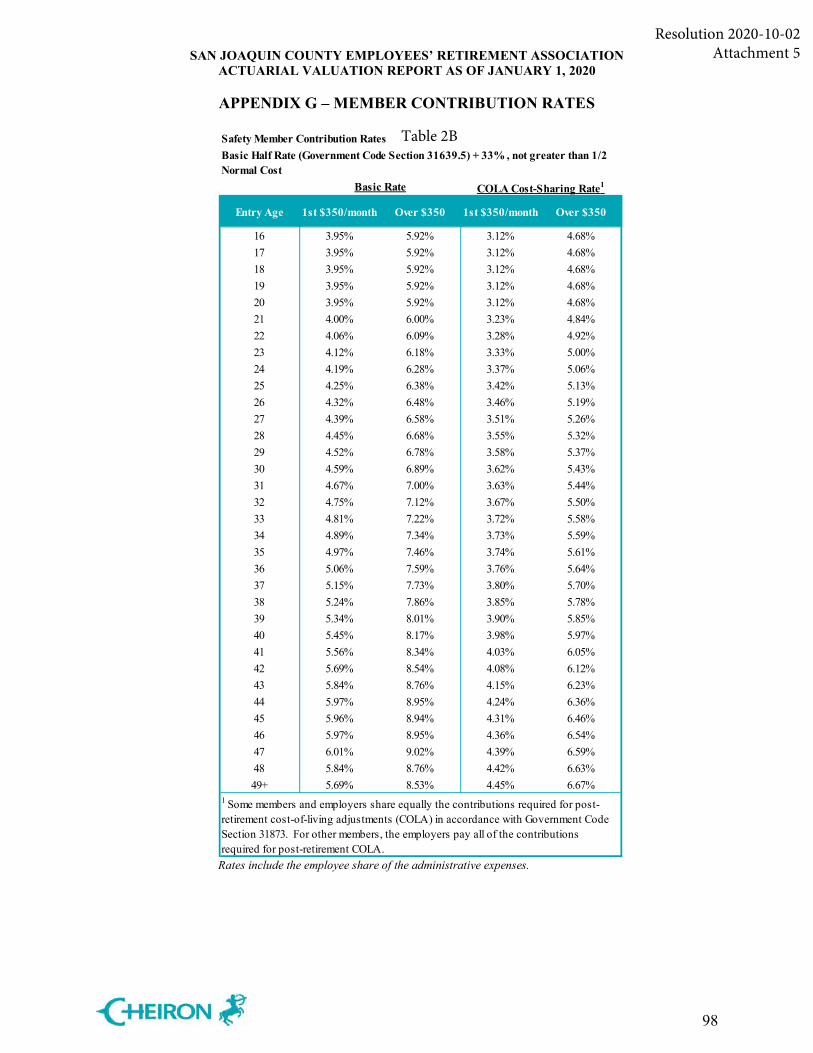
SAN JOAQUIN COUNTY EMPLOYEES’ RETIREMENT ASSOCIATION ACTUARIAL VALUATION REPORT AS OF JANUARY 1, 2020
APPENDIX G – MEMBER CONTRIBUTION RATES
98
Entry Age 1st $350/month Over $350 1st $350/month Over $350
16 3.95% 5.92% 3.12% 4.68%17 3.95% 5.92% 3.12% 4.68%18 3.95% 5.92% 3.12% 4.68%19 3.95% 5.92% 3.12% 4.68%20 3.95% 5.92% 3.12% 4.68%21 4.00% 6.00% 3.23% 4.84%22 4.06% 6.09% 3.28% 4.92%23 4.12% 6.18% 3.33% 5.00%24 4.19% 6.28% 3.37% 5.06%25 4.25% 6.38% 3.42% 5.13%26 4.32% 6.48% 3.46% 5.19%27 4.39% 6.58% 3.51% 5.26%28 4.45% 6.68% 3.55% 5.32%29 4.52% 6.78% 3.58% 5.37%30 4.59% 6.89% 3.62% 5.43%31 4.67% 7.00% 3.63% 5.44%32 4.75% 7.12% 3.67% 5.50%33 4.81% 7.22% 3.72% 5.58%34 4.89% 7.34% 3.73% 5.59%35 4.97% 7.46% 3.74% 5.61%36 5.06% 7.59% 3.76% 5.64%37 5.15% 7.73% 3.80% 5.70%38 5.24% 7.86% 3.85% 5.78%39 5.34% 8.01% 3.90% 5.85%40 5.45% 8.17% 3.98% 5.97%41 5.56% 8.34% 4.03% 6.05%42 5.69% 8.54% 4.08% 6.12%43 5.84% 8.76% 4.15% 6.23%44 5.97% 8.95% 4.24% 6.36%45 5.96% 8.94% 4.31% 6.46%46 5.97% 8.95% 4.36% 6.54%47 6.01% 9.02% 4.39% 6.59%48 5.84% 8.76% 4.42% 6.63%49+ 5.69% 8.53% 4.45% 6.67%
1 Some members and employers share equally the contributions required for post-retirement cost-of-living adjustments (COLA) in accordance with Government Code Section 31873. For other members, the employers pay all of the contributions required for post-retirement COLA.
Safety Member Contribution RatesBasic Half Rate (Government Code Section 31639.5) + 33% , not greater than 1/2 Normal Cost
Basic Rate COLA Cost-Sharing Rate1
Rates include the employee share of the administrative expenses.
Resolution 2020-10-02 Attachment 5
Table 2B

Protecting Pension Funds From The Evolving Cyber Threat
Los Angeles | Washington DC | Toronto
SJCERA Board Cybersecurity Workshop

Who We Are
2

Peter Dewar
3
Peter is a senior strategist with over 25 years of experience in I.T. and cybersecurity. His expertise spans government, energy, not for profit, and health care sectors.
Prior to Linea Secure, Peter spent the last 8 years at the District of Columbia Retirement Board (DCRB), providing strategic technology and cybersecurity direction as CTO and Director of Information Technology. Prior to DCRB, he spent 12 years acting as President of DataFlow Systems, an I.T. consulting firm.
Peter has overseen many cybersecurity assessments and implementations including cybersecurity frameworks, policies, procedures, and technology. He is a Certified Information Systems Security Professional (CISSP) and has completed the Certificate of Achievement in Public Plan Policy (CAPPP) in Employee Pension.
PresidentLinea Secure

Bryce Haws
4
Bryce is in his eight year with Linea Solutions. He has spent most of that time in business development, sales, strategic vendor relations, and management of many of Linea’s key accounts. He has also been involved with many of the marketing aspects of the firm. He has assisted with classifying the overall consulting activities Linea provides to a distinct set of services specifically focused on assisting clients through business and technology change.
Bryce has worked his entire career in the I.T. field. While he spent the early part of his career as an application developer with multiple technologies, he also gained experience very early on with business development and project management. He has managed many large system integration projects, especially in the Public Sector. Bryce has worked most of his career with consulting firms, although he built the foundation of his technical expertise in corporate America working at American Express and Utah Power and Light.
Vice President of Strategic RelationsLinea Solutions
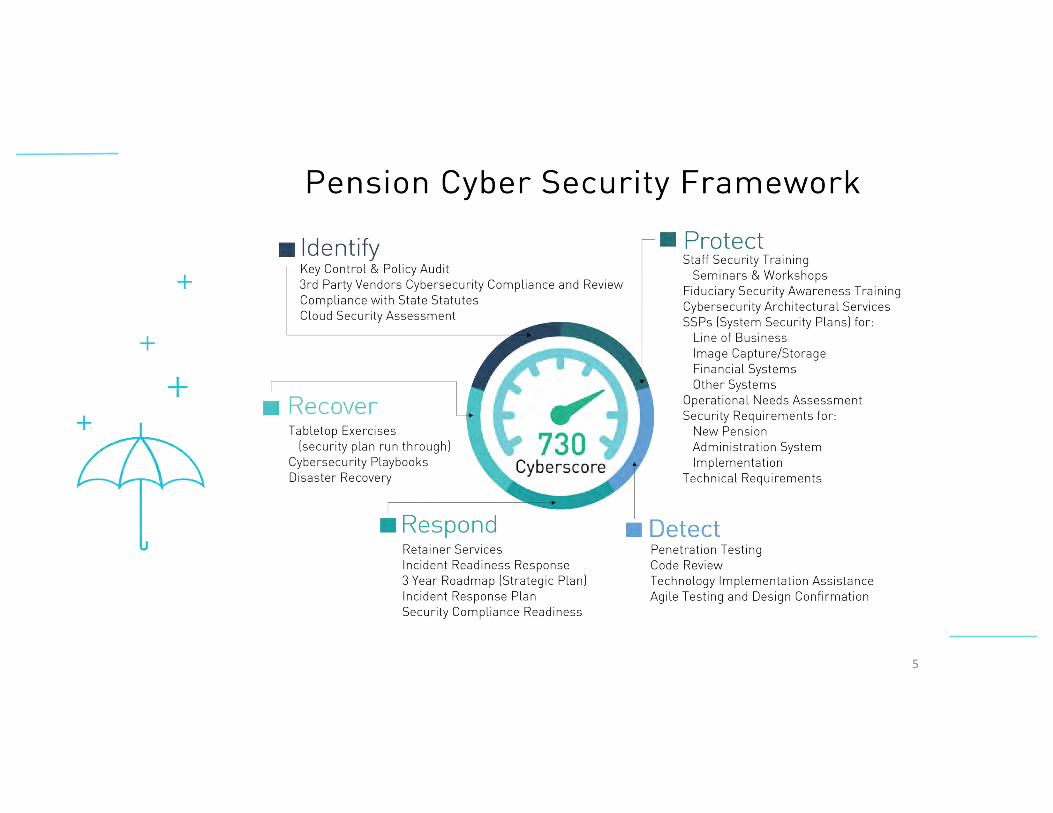
5

6
Agenda – Protecting SCERA from the evolving cybersecurity threat
• Understanding the landscape that requires protection
• Determining your cybersecurity risk level
• Implementing a customized framework that addresses cybersecurity risks

7
Understanding the landscape that requires protection
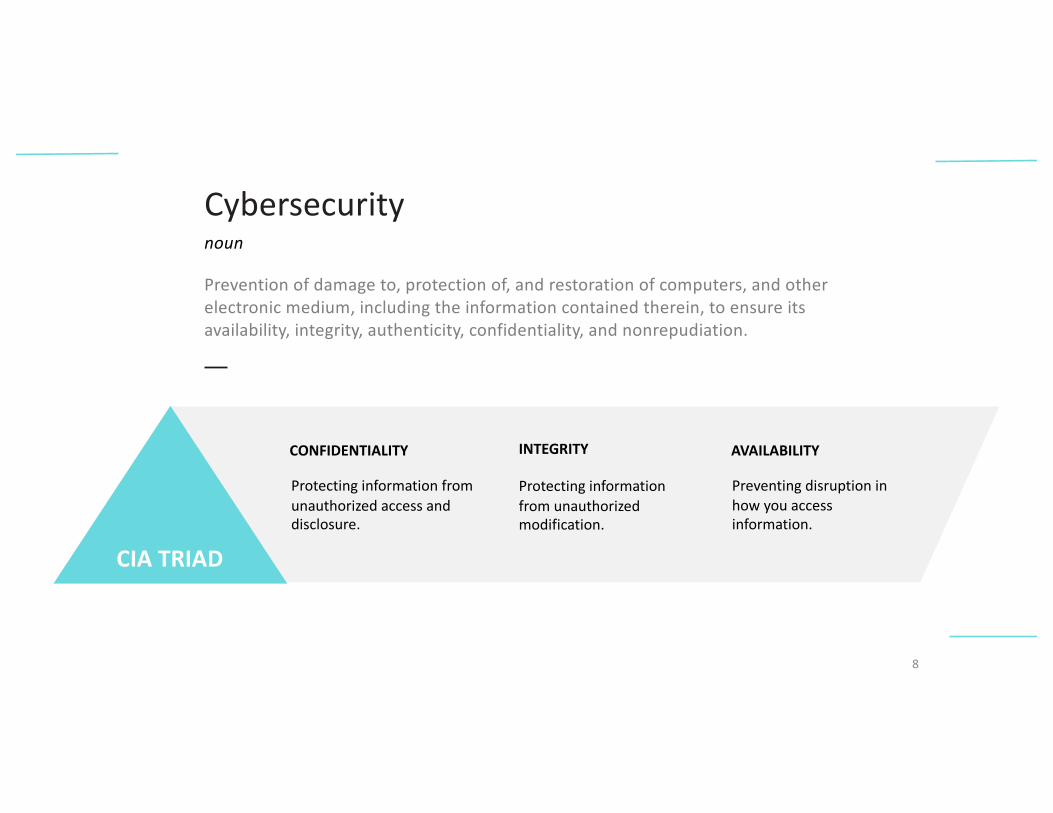
8
A
Cybersecurity
CONFIDENTIALITY
noun
CIA TRIAD
Prevention of damage to, protection of, and restoration of computers, and other electronic medium, including the information contained therein, to ensure its availability, integrity, authenticity, confidentiality, and nonrepudiation.
Protecting information from unauthorized modification.
AVAILABILITYINTEGRITY
Protecting information from unauthorized access and disclosure.
Preventing disruption in how you access information.
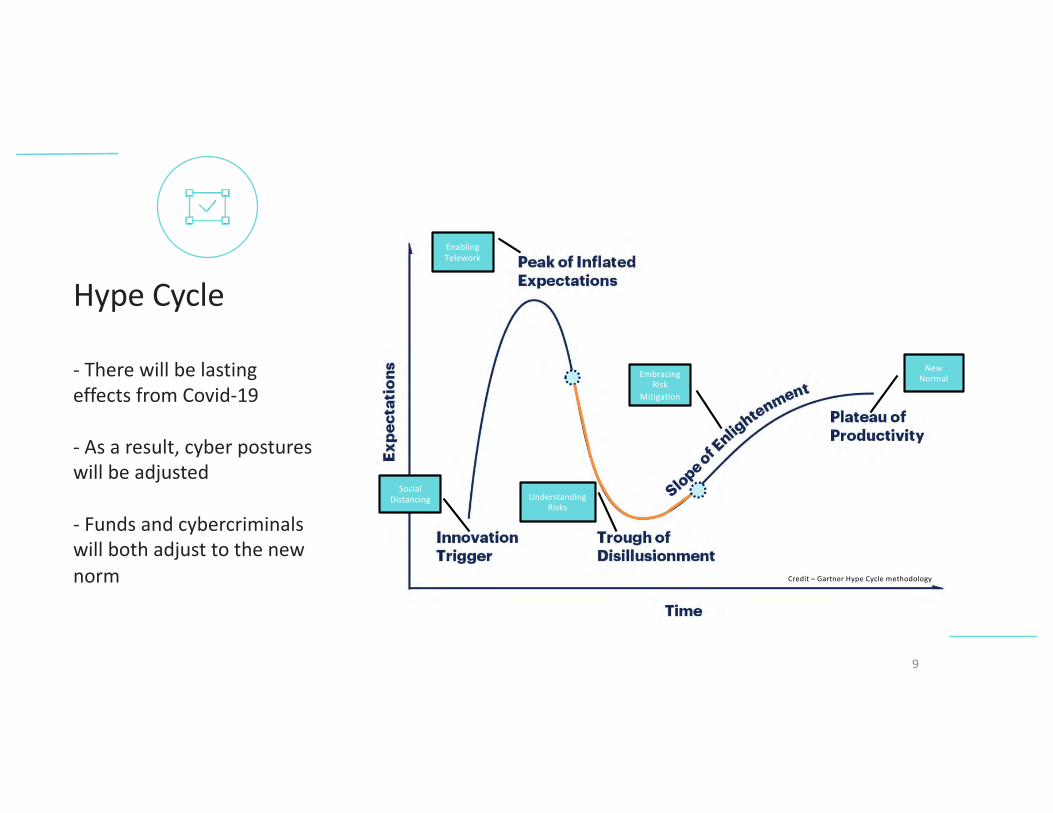
Hype Cycle
- There will be lasting effects from Covid-19
- As a result, cyber postures will be adjusted
- Funds and cybercriminals will both adjust to the new norm
9
Credit – Gartner Hype Cycle methodology
Social Distancing
Enabling Telework
Understanding Risks
Embracing Risk
Mitigation
New Normal
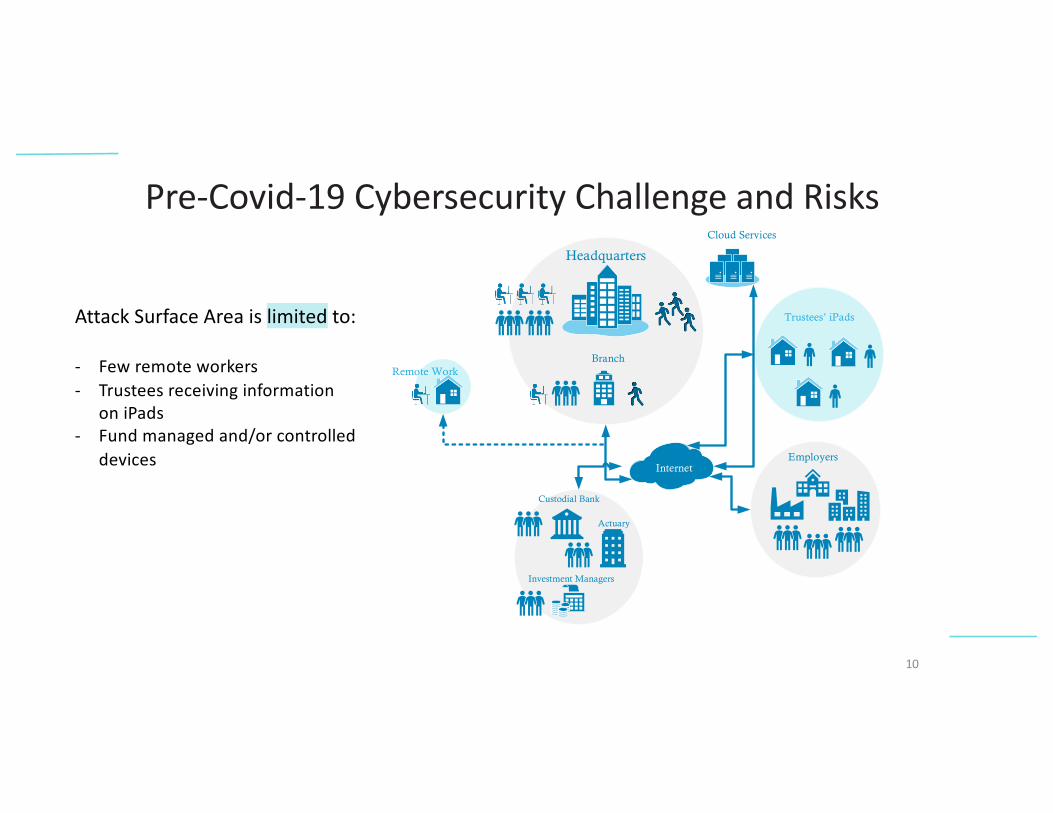
10
Pre-Covid-19 Cybersecurity Challenge and Risks
Attack Surface Area is limited to:
- Few remote workers- Trustees receiving information
on iPads- Fund managed and/or controlled
devices
Headquarters
Branch
Custodial Bank
Employers
Trustees’ iPads
Actuary
Investment Managers
Internet
Cloud Services
Remote Work
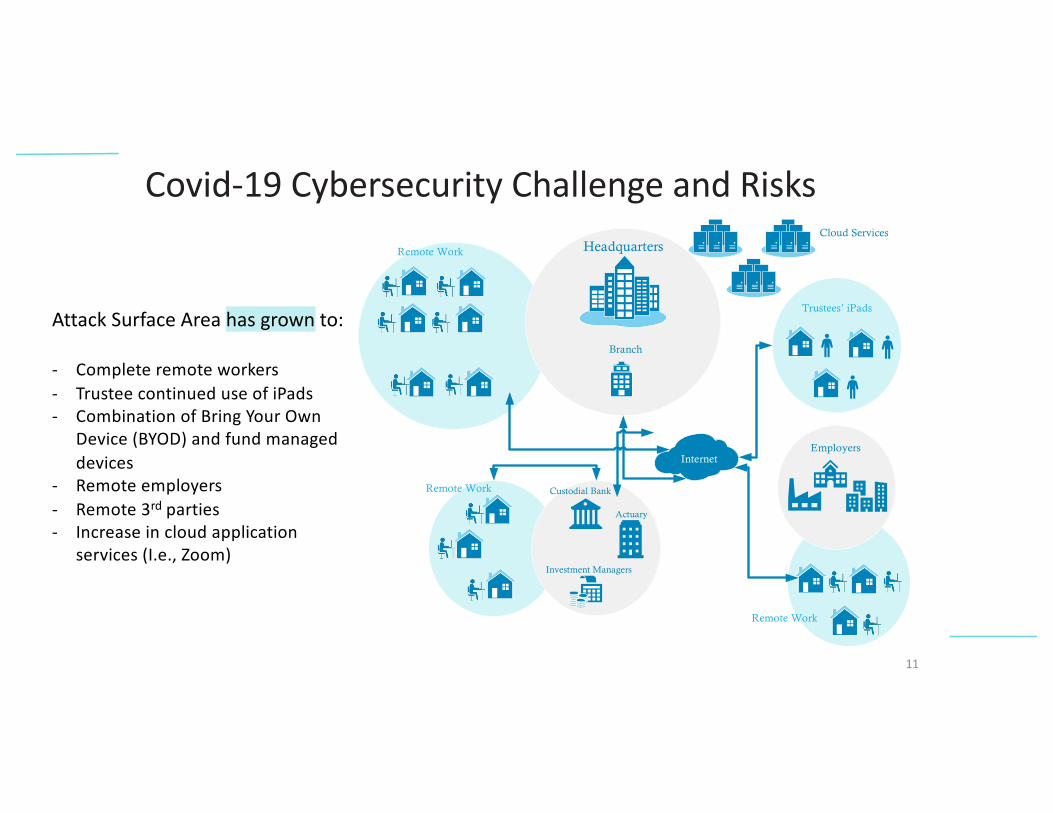
11
Covid-19 Cybersecurity Challenge and Risks
Attack Surface Area has grown to:
- Complete remote workers- Trustee continued use of iPads- Combination of Bring Your Own
Device (BYOD) and fund managed devices
- Remote employers- Remote 3rd parties- Increase in cloud application
services (I.e., Zoom)
Headquarters
Branch
Custodial Bank
Employers
Trustees’ iPads
Actuary
Investment Managers
Remote Work
Remote Work
Remote Work
Internet
Cloud Services
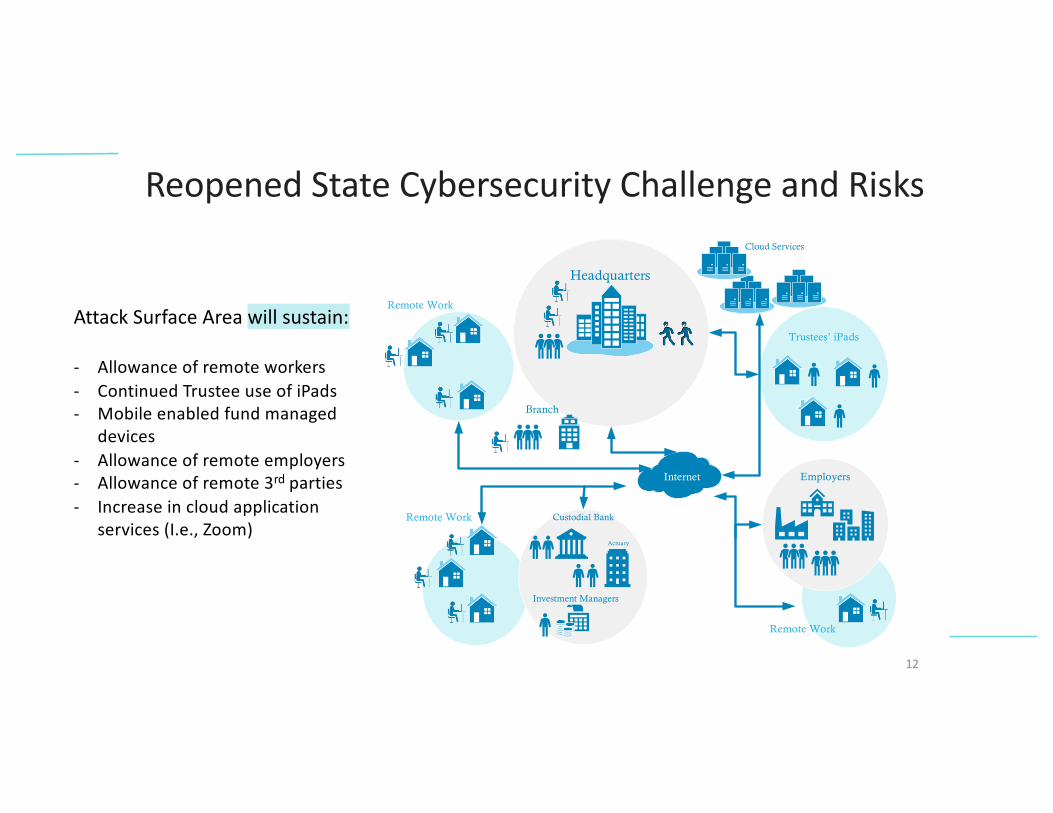
12
Reopened State Cybersecurity Challenge and Risks
Attack Surface Area will sustain:
- Allowance of remote workers- Continued Trustee use of iPads- Mobile enabled fund managed
devices- Allowance of remote employers- Allowance of remote 3rd parties- Increase in cloud application
services (I.e., Zoom)
Headquarters
Branch
Custodial Bank
Employers
Trustees’ iPads
Internet
Actuary
Investment Managers
Remote Work
Remote Work
Remote Work
Cloud Services

13
The Cost of
Compromise
2019
IBM Cost of
Data Breach
Study
Organizations
Sampled
Countries
Average size of
data breach in
the US
Average cost
per stolen
record in the
USAverage total
cost of data
breach in the
US*
$2.7 MOrg size
<50032,434
$242
507
16
*Excerpted IBM Security 2019 Report
$8.9 MAll orgs
14
Calculating the Cost – after a breach
• Conducting investigations and forensics to determine the root cause of the data breach
• Determining the probable victims of the data breach
• Organizing the incident response team
• Conducting communication and public relations outreach
• Preparing notice documents and other required disclosures to data breach victims and regulators
• Implementing telephone communication procedures and specialized training

15
Calculating the Cost – after a breach, continued
• Audit and consulting services
• Legal services for defense & compliance
• Identity protection services for victims
• Rebuilding member and annuitant confidence
• Service interruption of your system
• Regulatory action and significant fines

16
Determining your cybersecurity risk level
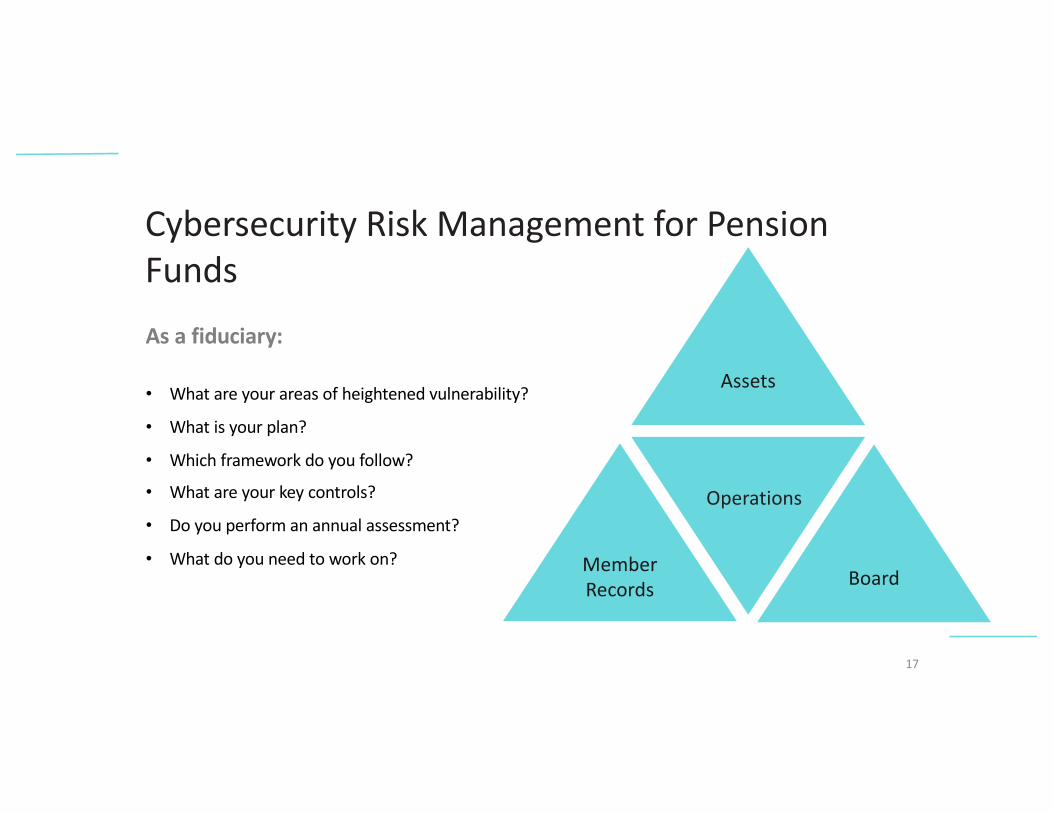
17
Assets
Member Records Board
As a fiduciary:
Operations
Cybersecurity Risk Management for Pension Funds
• What are your areas of heightened vulnerability?
• What is your plan?
• Which framework do you follow?
• What are your key controls?
• Do you perform an annual assessment?
• What do you need to work on?
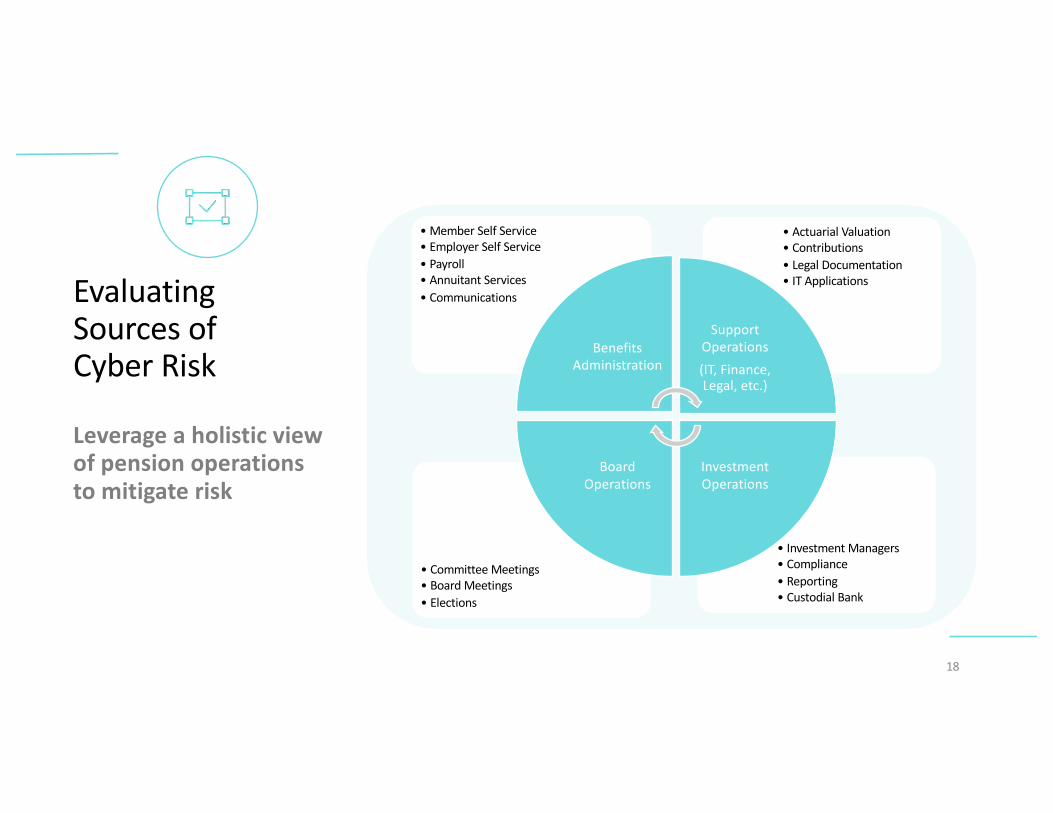
Evaluating
Sources of
Cyber Risk
Leverage a holistic view of pension operations to mitigate risk
18
• Investment Managers
• Compliance
• Reporting
• Custodial Bank
• Committee Meetings
• Board Meetings
• Elections
• Actuarial Valuation
• Contributions
• Legal Documentation
• IT Applications
• Member Self Service
• Employer Self Service
• Payroll
• Annuitant Services
• Communications
Benefits
Administration
Support
Operations
(IT, Finance,
Legal, etc.)
Investment
Operations
Board
Operations
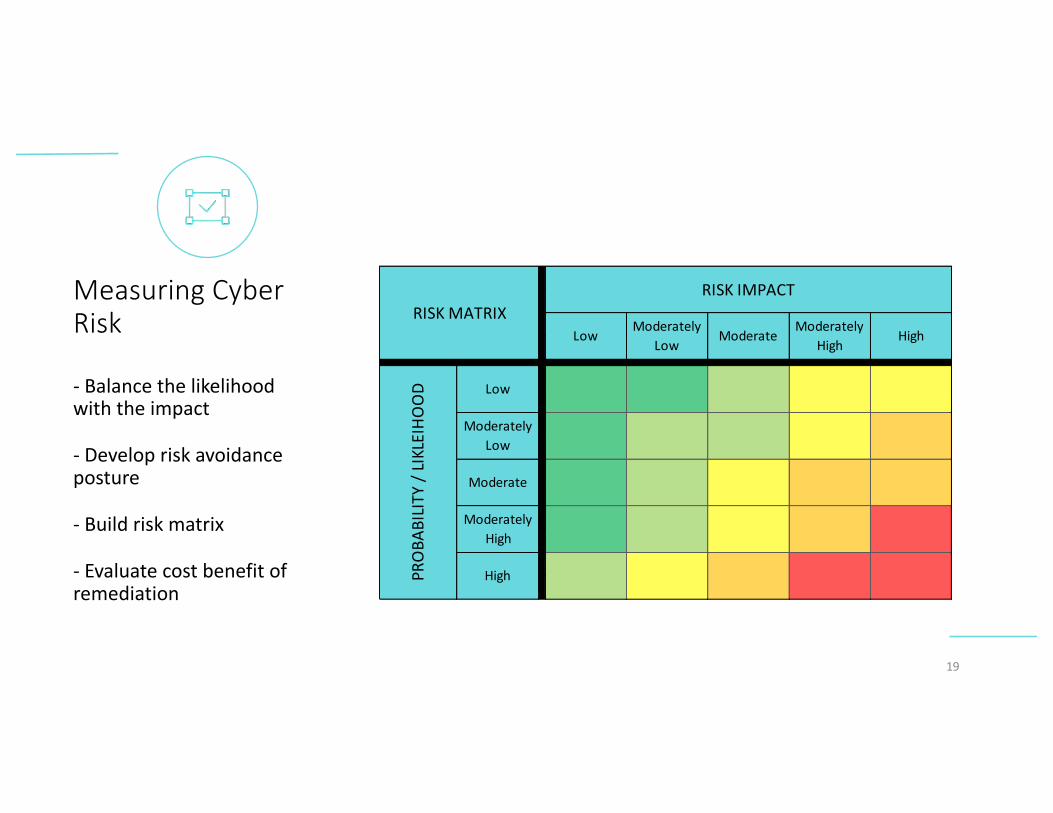
Measuring Cyber Risk
- Balance the likelihood with the impact
- Develop risk avoidance posture
- Build risk matrix
- Evaluate cost benefit of remediation
19
PRO
BABI
LITY
/ LI
KLEI
HOO
D
High
RISK IMPACT
Low Moderately Low Moderate Moderately
High HighRISK MATRIX
Low
Moderately Low
Moderate
Moderately High
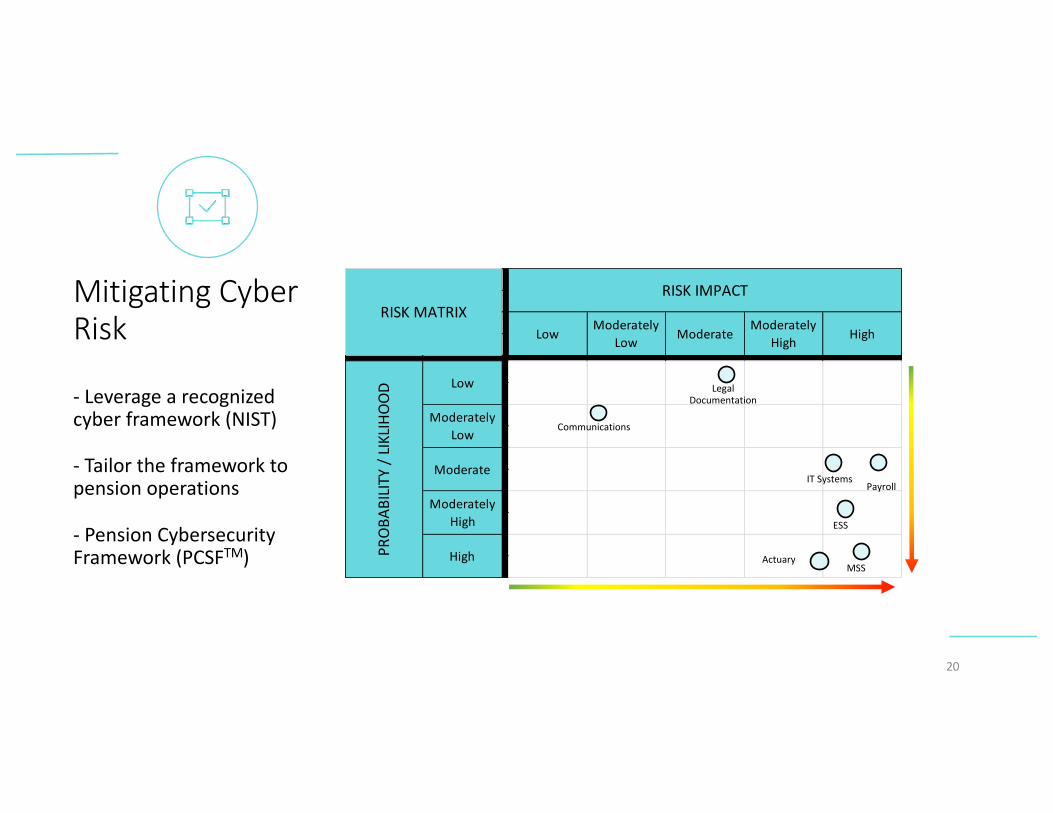
Mitigating Cyber Risk
- Leverage a recognized cyber framework (NIST)
- Tailor the framework to pension operations
- Pension Cybersecurity Framework (PCSFTM)
20
PROB
ABILI
TY /
LIKLIH
OOD
High
RISK IMPACT
Low Moderately Low Moderate Moderately
High HighRISK MATRIX
Low
Moderately Low
Moderate
Moderately High
Legal Documentation
Communications
Payroll
MSS
ESS
Actuary
IT Systems
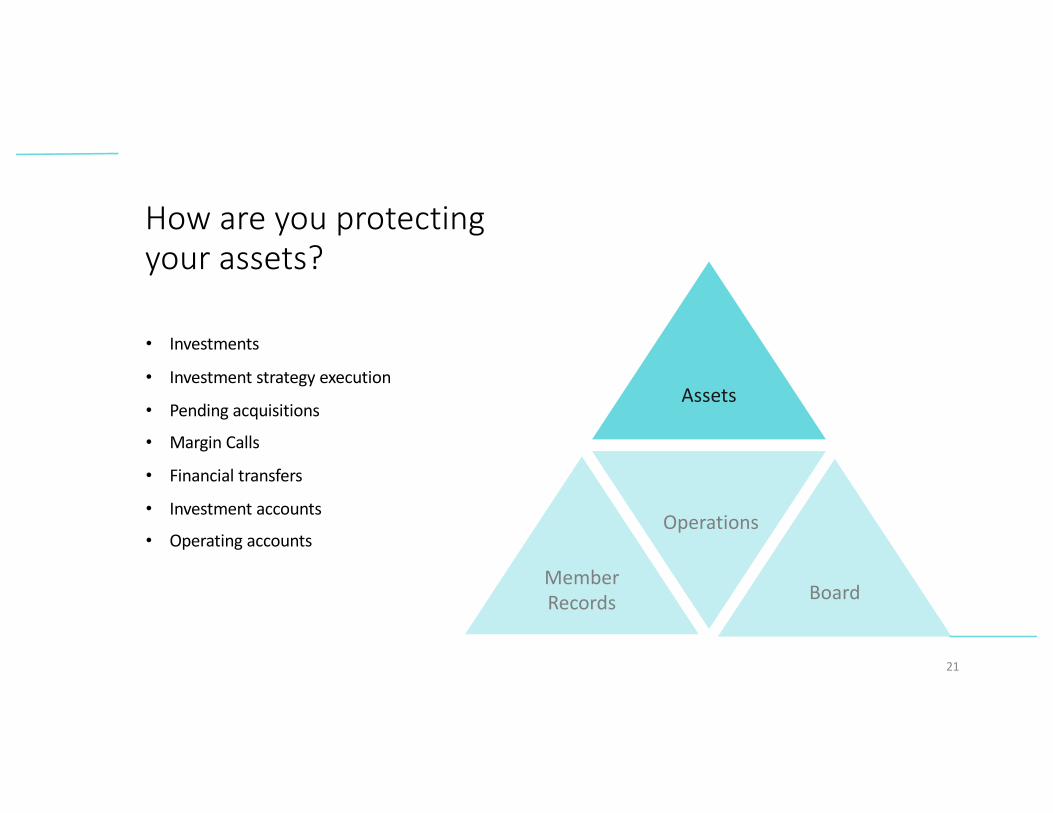
How are you protecting your assets?
21
Assets
Member Records Board
• Investments
• Investment strategy execution
• Pending acquisitions
• Margin Calls
• Financial transfers
• Investment accounts
• Operating accountsOperations
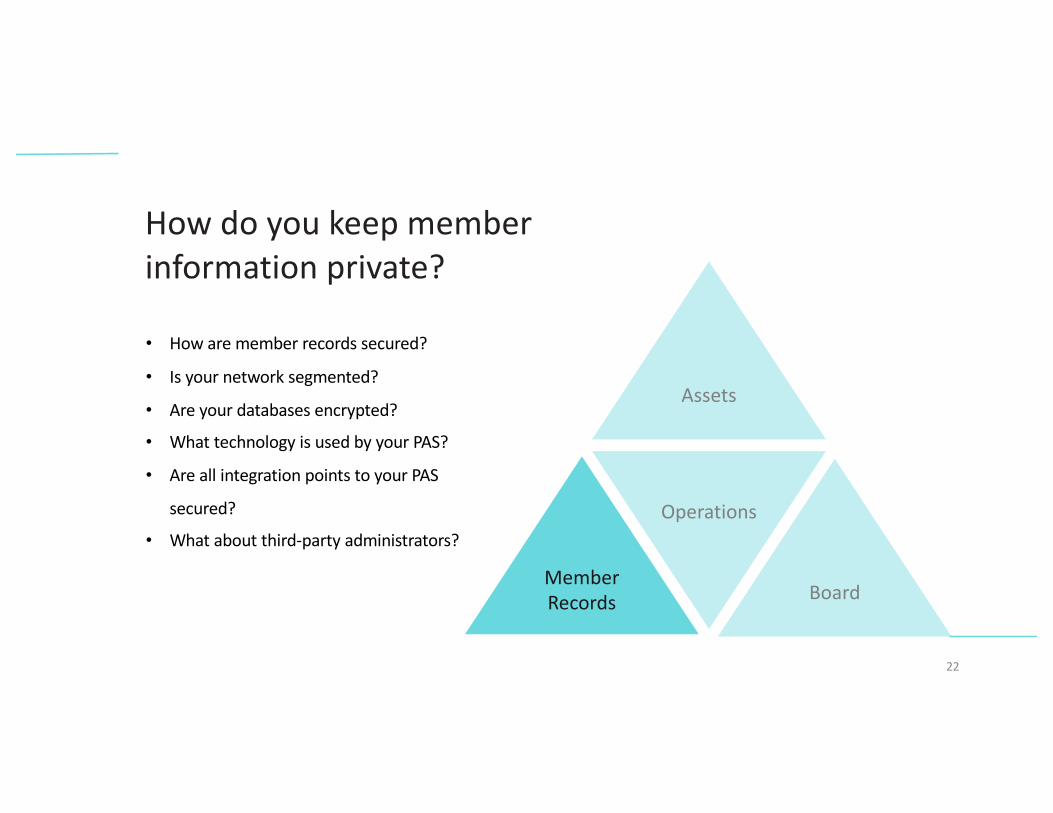
22
Assets
Member Records Board
How do you keep member information private?
• How are member records secured?
• Is your network segmented?
• Are your databases encrypted?
• What technology is used by your PAS?
• Are all integration points to your PAS
secured?
• What about third-party administrators?Operations

23
Assets
Member Records Board
How do you protect privileged Board communications?
• How is information shared?
• How do you ensure the information is not
duplicated?
• Do you have disability cases?
• Are Board meetings held remotely?
• How is the Board communicating?
• Do you have closed sessions?Operations
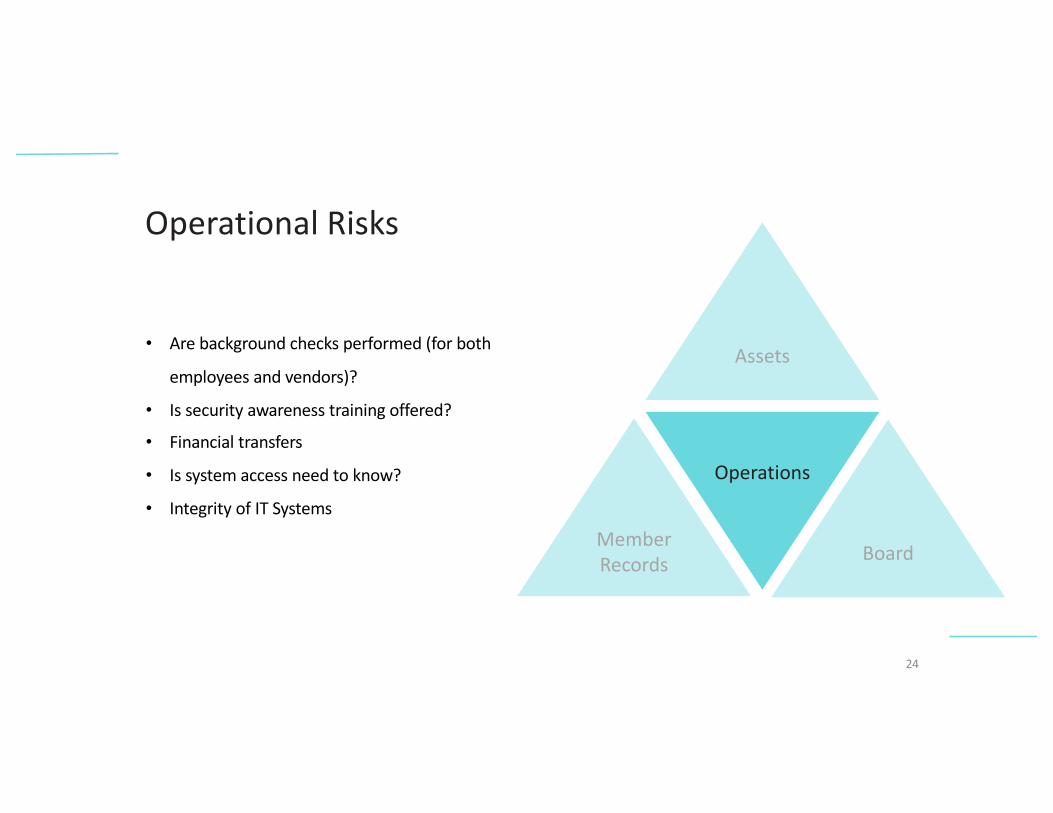
24
Operational Risks
• Are background checks performed (for both
employees and vendors)?
• Is security awareness training offered?
• Financial transfers
• Is system access need to know?
• Integrity of IT Systems
Assets
Member Records Board
Operations
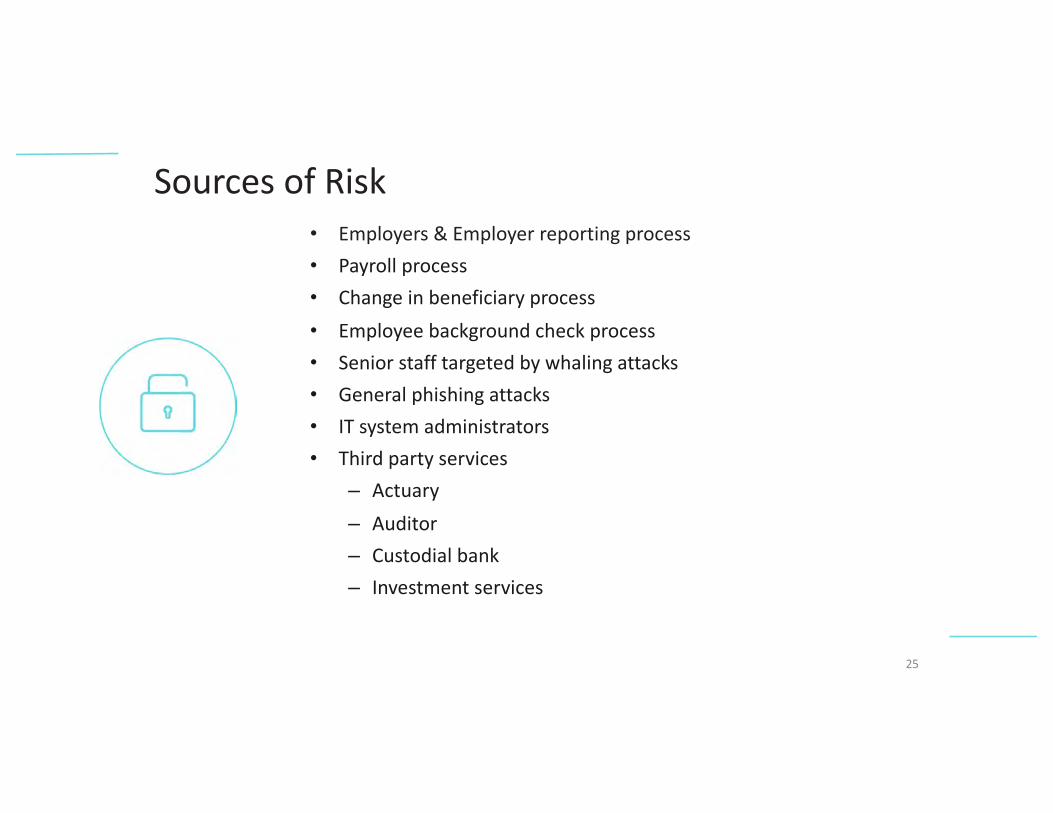
25
Sources of Risk• Employers & Employer reporting process• Payroll process• Change in beneficiary process• Employee background check process• Senior staff targeted by whaling attacks• General phishing attacks• IT system administrators • Third party services
– Actuary– Auditor– Custodial bank– Investment services
26
Specific Process Weaknesses
Benefits payroll services
– Insider threat
• Same enrollment and approval person
• Phishing emails
• Weak or non-frequent employee background checks
27
Specific Process Weaknesses Cont.
Investments– Margin Call
• Impersonation emails from the CIO to the CFO• Weak or non-frequent background checks• Same requester and approver with custodial bank
– Investment Managers• Whaling attacks on money managers• Weak internal security controls• Inconsistent application patching• Lack of independent external assessment
28
Specific Process Weaknesses Cont.
Actuary– Census data sharing
• Weak transmission mechanism
• Unencrypted files
• Use of spreadsheets and laptops
• Weak internal controls
• Self-developed applications
• Lack of external testing & assessment
Determining your level of risk
• Perform a security audit to see :– If the controls are documented and distributed throughout the
organization
– If the controls are appropriately implemented– If the organization follows the security policies– If the controls are monitored
29
What are auditors looking for?
• Auditors check to see if controls are in place to protect against known risks• They test to see if the controls are documented and distributed throughout
the organization
• They check to see if the controls are appropriately implemented• They check to see if the controls are followed by the organization• They check to see if the controls are measured and audited
30
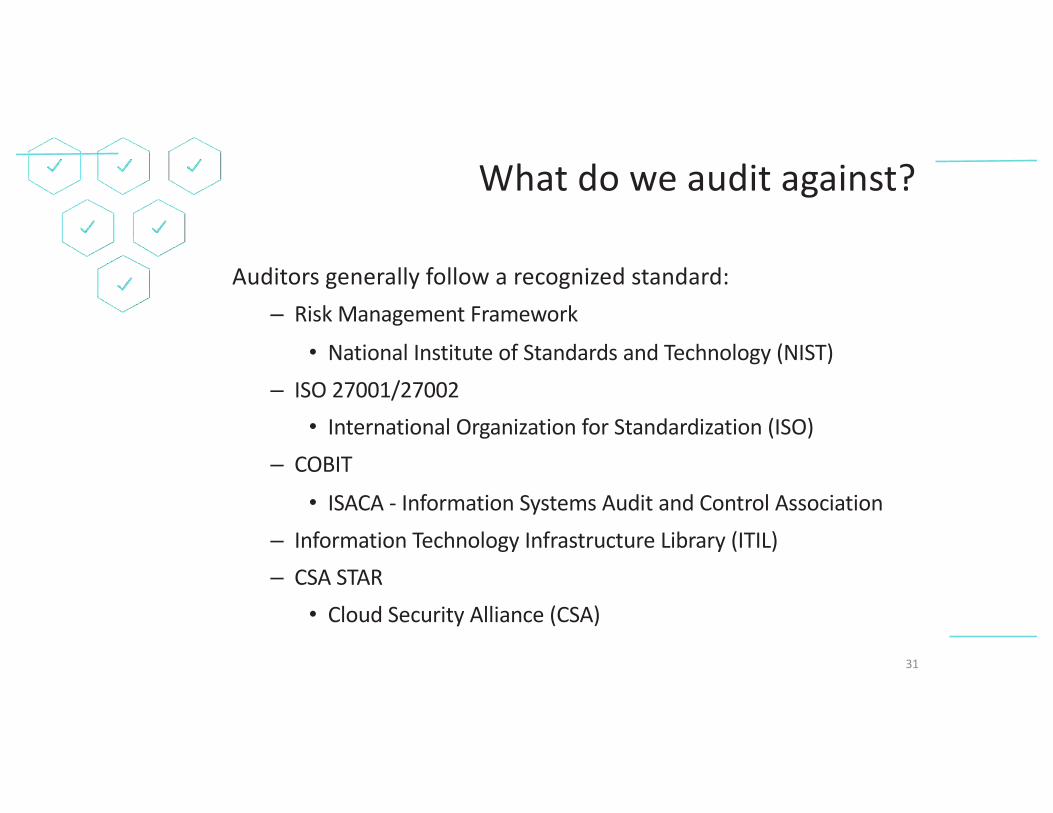
What do we audit against?
Auditors generally follow a recognized standard:– Risk Management Framework
• National Institute of Standards and Technology (NIST)– ISO 27001/27002
• International Organization for Standardization (ISO)– COBIT
• ISACA - Information Systems Audit and Control Association – Information Technology Infrastructure Library (ITIL)– CSA STAR
• Cloud Security Alliance (CSA)
31
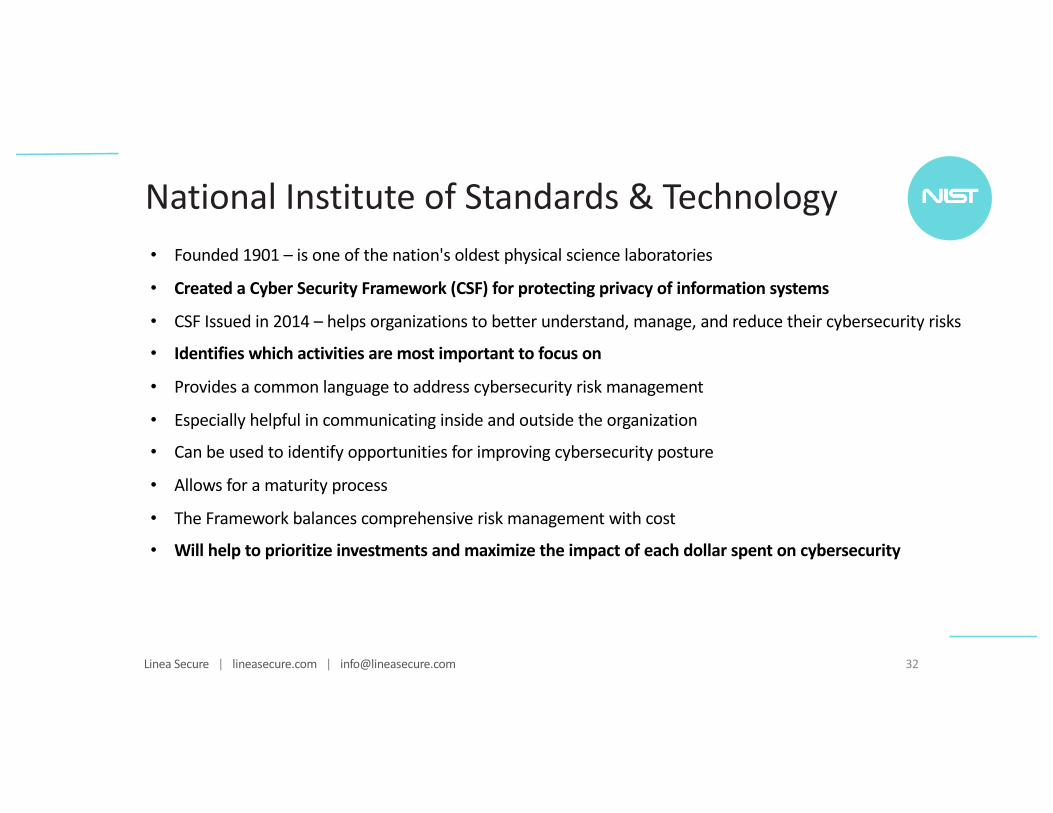
Linea Secure | lineasecure.com | [email protected] 32
• Founded 1901 – is one of the nation's oldest physical science laboratories
• Created a Cyber Security Framework (CSF) for protecting privacy of information systems
• CSF Issued in 2014 – helps organizations to better understand, manage, and reduce their cybersecurity risks
• Identifies which activities are most important to focus on
• Provides a common language to address cybersecurity risk management
• Especially helpful in communicating inside and outside the organization
• Can be used to identify opportunities for improving cybersecurity posture
• Allows for a maturity process
• The Framework balances comprehensive risk management with cost
• Will help to prioritize investments and maximize the impact of each dollar spent on cybersecurity
National Institute of Standards & Technology
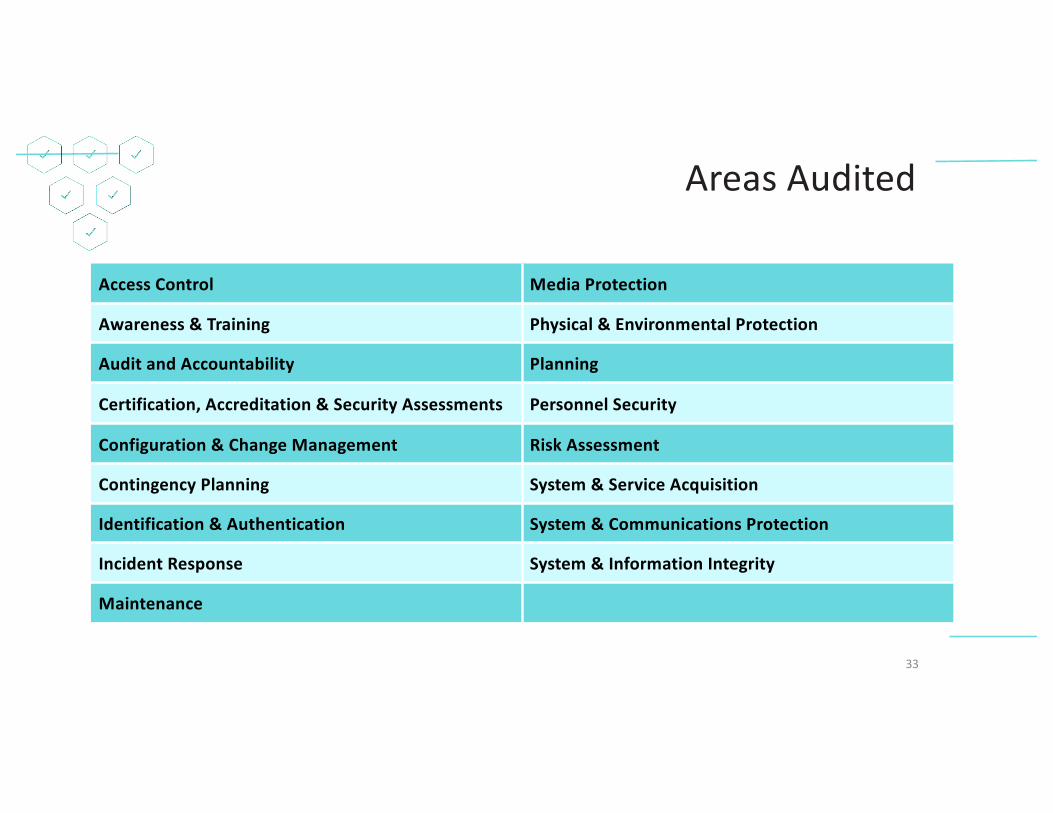
Areas Audited
Access Control Media Protection
Awareness & Training Physical & Environmental Protection
Audit and Accountability Planning
Certification, Accreditation & Security Assessments Personnel Security
Configuration & Change Management Risk Assessment
Contingency Planning System & Service Acquisition
Identification & Authentication System & Communications Protection
Incident Response System & Information Integrity
Maintenance
33
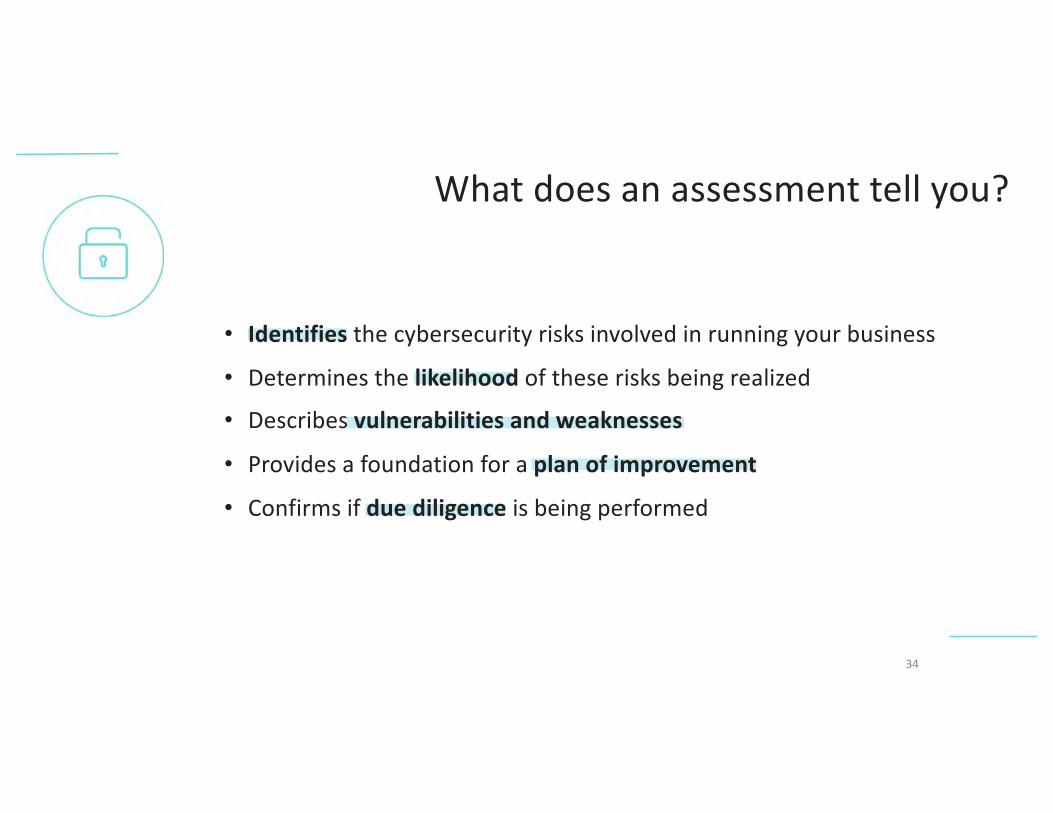
• Identifies the cybersecurity risks involved in running your business
• Determines the likelihood of these risks being realized
• Describes vulnerabilities and weaknesses
• Provides a foundation for a plan of improvement• Confirms if due diligence is being performed
What does an assessment tell you?
34
How to prepare for an audit
• Perform a moderate self-assessment
• Gather organization policies, and procedures
• Assign appropriate staff
• Select a reputable auditor
35
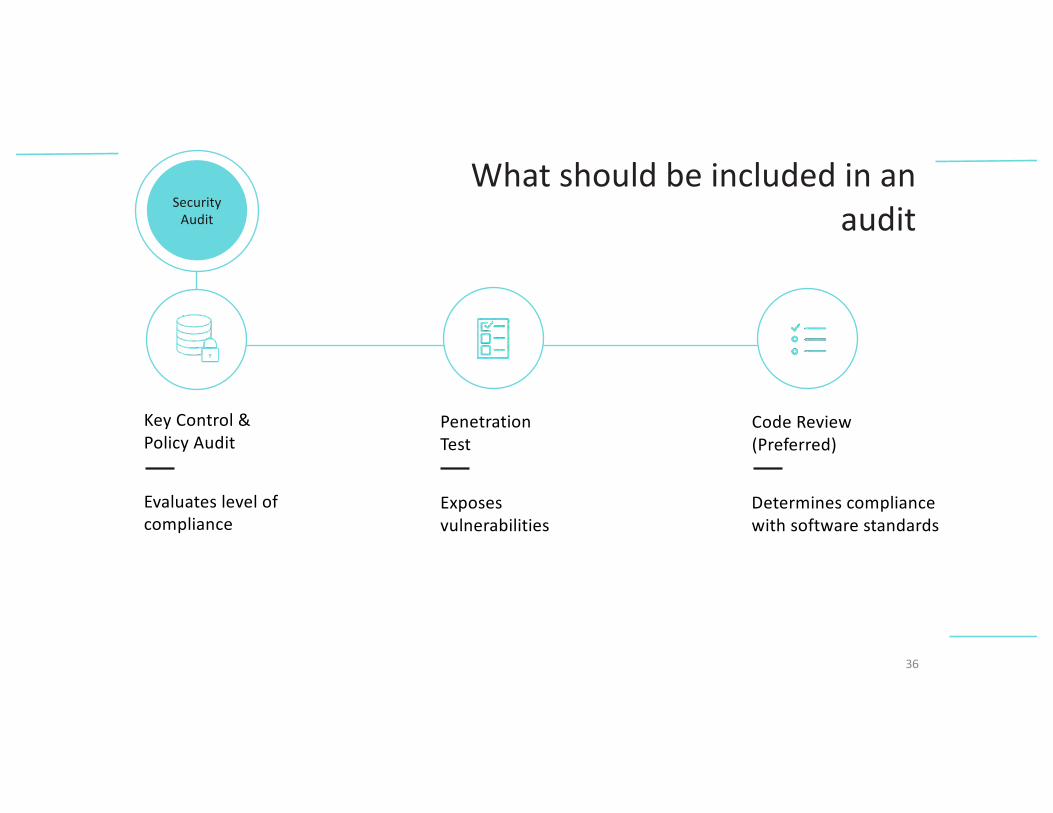
SecurityAudit
What should be included in an audit
36
Evaluates level of compliance
Exposes vulnerabilities
Penetration Test
Determines compliance with software standards
Code Review (Preferred)
Key Control & Policy Audit

37
Implementing a framework that addresses pension specific risks
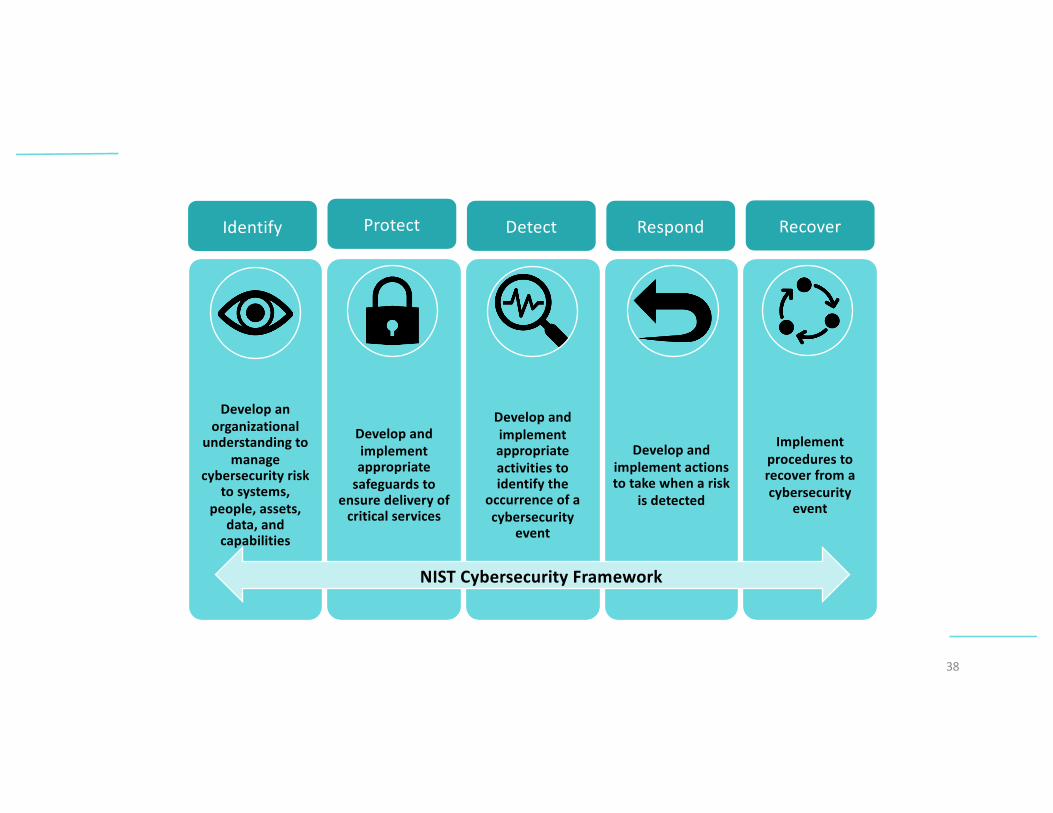
38
Develop an organizational
understanding to manage
cybersecurity risk to systems,
people, assets, data, and
capabilities
Develop and implement appropriate
safeguards to ensure delivery of
critical services
Develop and implement appropriate activities to identify the
occurrence of a cybersecurity
event
Develop and implement actions to take when a risk
is detected
Implementprocedures to recover from a cybersecurity
event
NIST Cybersecurity Framework
Identify Protect Detect Respond Recover
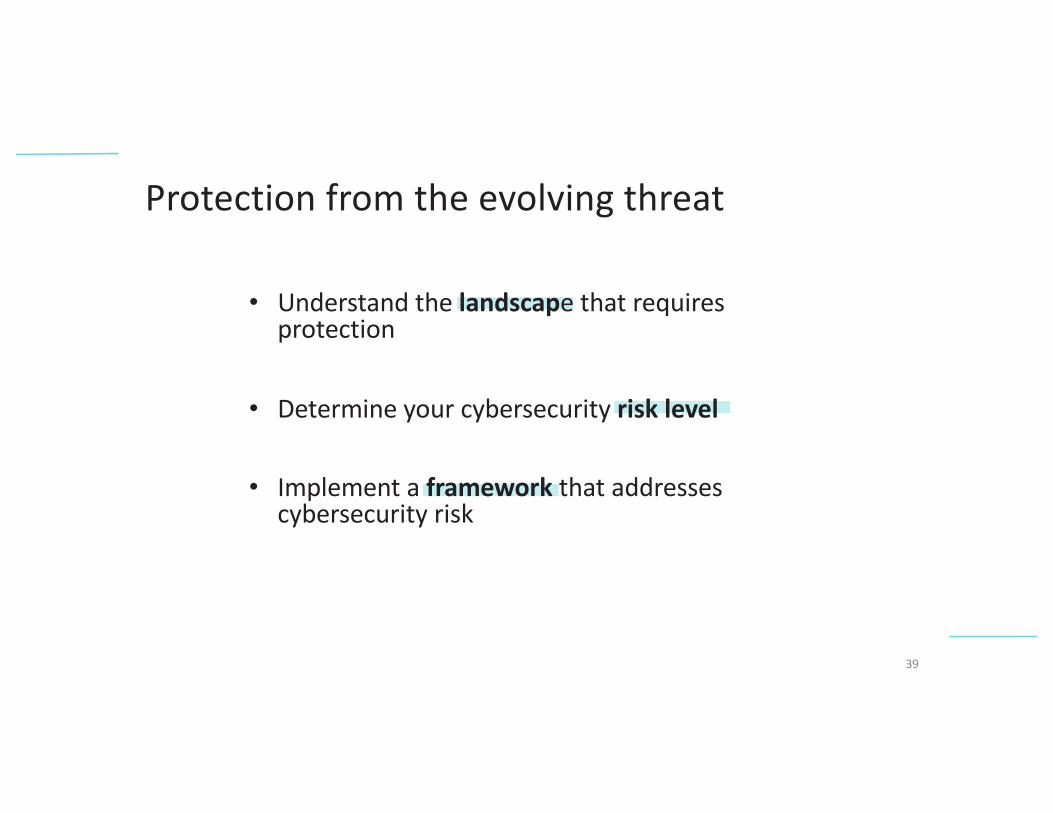
• Understand the landscape that requires protection
• Determine your cybersecurity risk level
• Implement a framework that addresses cybersecurity risk
Protection from the evolving threat
39

Collapsing Global Interest Rates / Negative Rates
As of June 30, 2020
SJCERA
Collapsing Global Interest Rates / Negative Rates
Collapsing Global Interest Rates
1. Summary – Current State of Markets
2. US 10-Year Treasury Yield at All Time Lows
3. Total Return Given Changes in Interest Rates
4. “Low-Rate Environment” Is a Global Issue
5. The Role of US Inflation
Negative Rates
6. What Does Negative Rates actually Mean?
7. How Do Rates Become Negative?
8. Negative Yielding Debt Makes Up Over 20% of Barclays Global Aggregate Index
9. Why Negative Rates?
10. Potential Impact from Negative Rates
Page 2 of 19
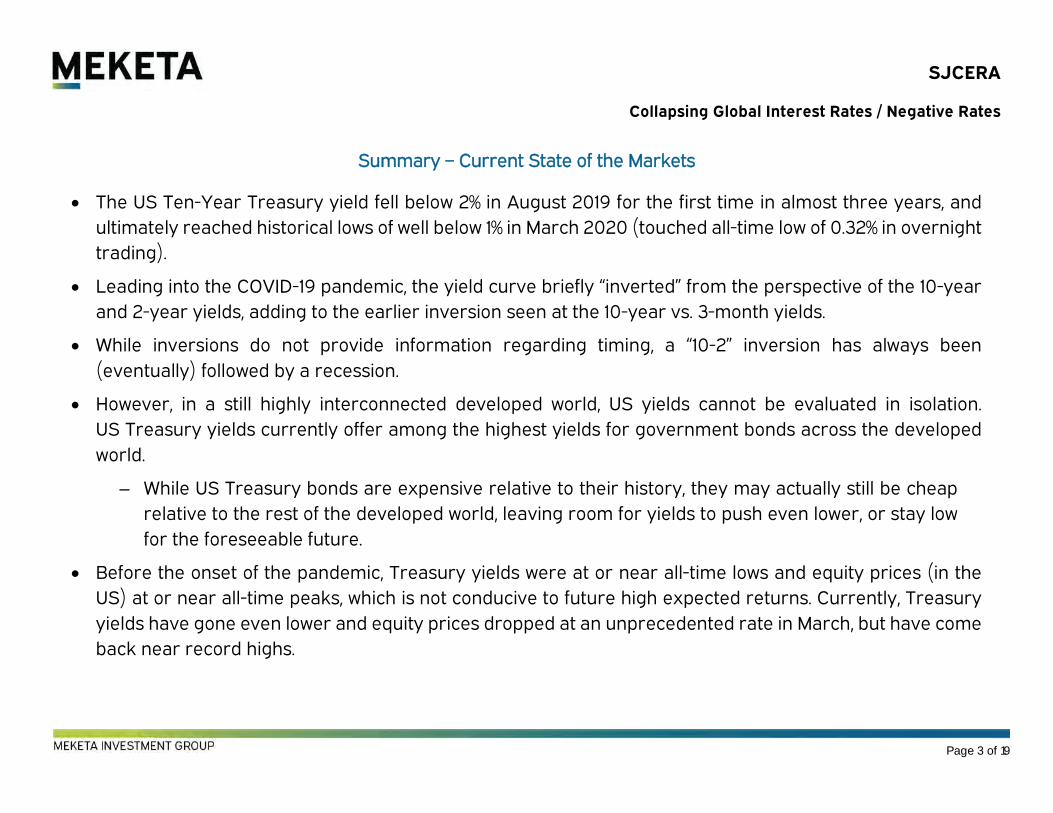
SJCERA
Collapsing Global Interest Rates / Negative Rates
Summary – Current State of the Markets
The US Ten-Year Treasury yield fell below 2% in August 2019 for the first time in almost three years, and
ultimately reached historical lows of well below 1% in March 2020 (touched all-time low of 0.32% in overnight
trading).
Leading into the COVID-19 pandemic, the yield curve briefly “inverted” from the perspective of the 10-year
and 2-year yields, adding to the earlier inversion seen at the 10-year vs. 3-month yields.
While inversions do not provide information regarding timing, a “10-2” inversion has always been
(eventually) followed by a recession.
However, in a still highly interconnected developed world, US yields cannot be evaluated in isolation.
US Treasury yields currently offer among the highest yields for government bonds across the developed
world.
While US Treasury bonds are expensive relative to their history, they may actually still be cheap
relative to the rest of the developed world, leaving room for yields to push even lower, or stay low
for the foreseeable future.
Before the onset of the pandemic, Treasury yields were at or near all-time lows and equity prices (in the
US) at or near all-time peaks, which is not conducive to future high expected returns. Currently, Treasury
yields have gone even lower and equity prices dropped at an unprecedented rate in March, but have come
back near record highs.
Page 3 of 19
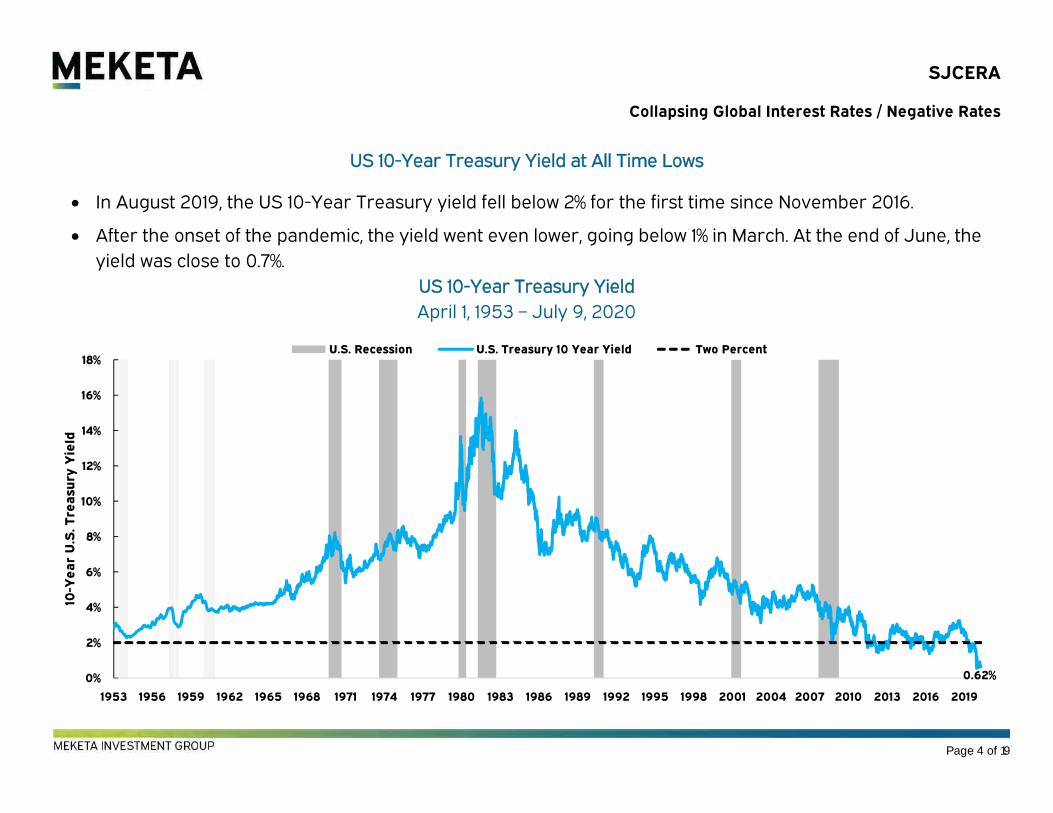
SJCERA
Collapsing Global Interest Rates / Negative Rates
US 10-Year Treasury Yield at All Time Lows
In August 2019, the US 10-Year Treasury yield fell below 2% for the first time since November 2016.
After the onset of the pandemic, the yield went even lower, going below 1% in March. At the end of June, the
yield was close to 0.7%.
US 10-Year Treasury Yield
April 1, 1953 – July 9, 2020
0.62%0%
2%
4%
6%
8%
10%
12%
14%
16%
18%
1953 1956 1959 1962 1965 1968 1971 1974 1977 1980 1983 1986 1989 1992 1995 1998 2001 2004 2007 2010 2013 2016 2019
10-Y
ea
r U
.S. T
rea
sury
Yie
ld
U.S. Recession U.S. Treasury 10 Year Yield Two Percent
Page 4 of 19
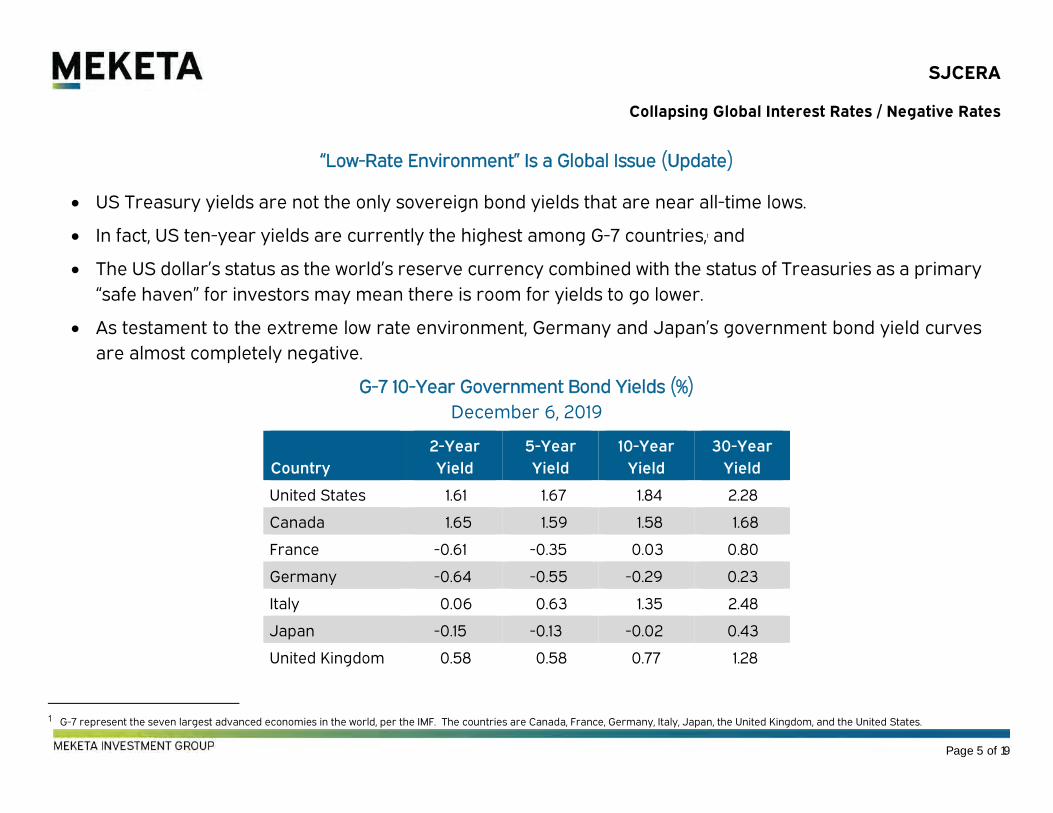
SJCERA
Collapsing Global Interest Rates / Negative Rates
“Low-Rate Environment” Is a Global Issue (Update)
US Treasury yields are not the only sovereign bond yields that are near all-time lows.
In fact, US ten-year yields are currently the highest among G-7 countries,1 and
The US dollar’s status as the world’s reserve currency combined with the status of Treasuries as a primary
“safe haven” for investors may mean there is room for yields to go lower.
As testament to the extreme low rate environment, Germany and Japan’s government bond yield curves
are almost completely negative.
G-7 10-Year Government Bond Yields (%)
December 6, 2019
Country
2-Year
Yield
5-Year
Yield
10-Year
Yield
30-Year
Yield
United States 1.61 1.67 1.84 2.28
Canada 1.65 1.59 1.58 1.68
France -0.61 -0.35 0.03 0.80
Germany -0.64 -0.55 -0.29 0.23
Italy 0.06 0.63 1.35 2.48
Japan -0.15 -0.13 -0.02 0.43
United Kingdom 0.58 0.58 0.77 1.28
1 G-7 represent the seven largest advanced economies in the world, per the IMF. The countries are Canada, France, Germany, Italy, Japan, the United Kingdom, and the United States.
Page 5 of 19
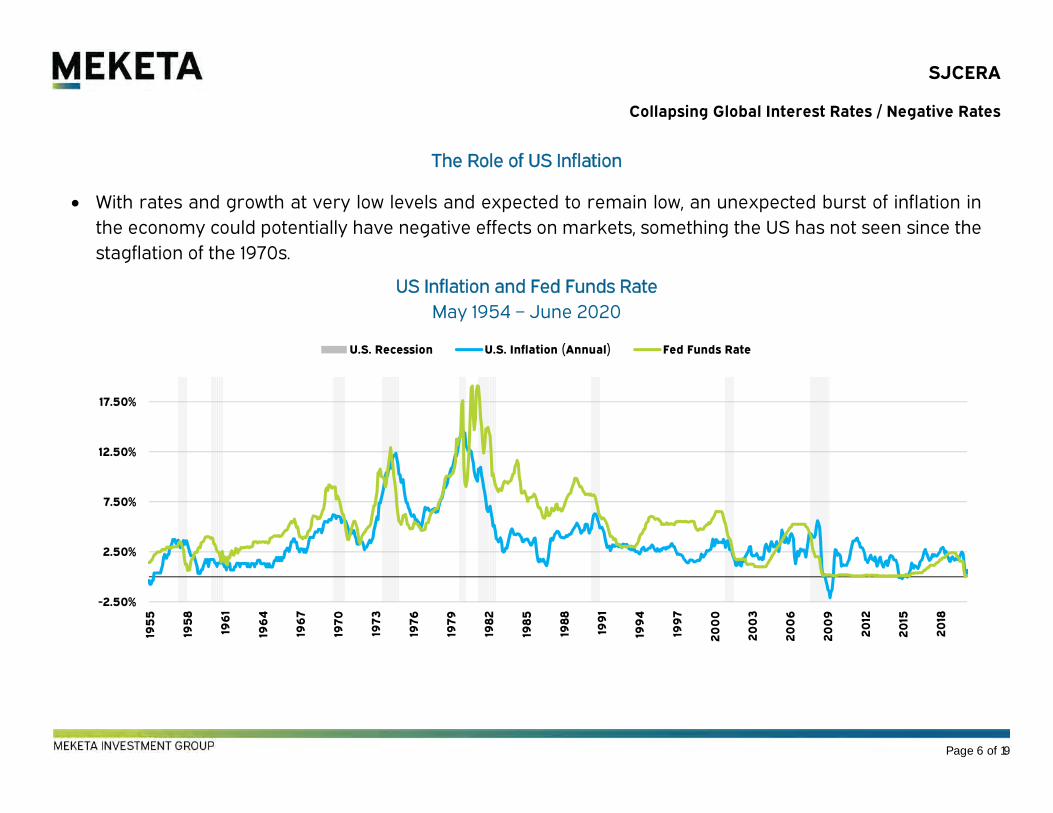
SJCERA
Collapsing Global Interest Rates / Negative Rates
The Role of US Inflation
With rates and growth at very low levels and expected to remain low, an unexpected burst of inflation in
the economy could potentially have negative effects on markets, something the US has not seen since the
stagflation of the 1970s.
US Inflation and Fed Funds Rate
May 1954 – June 2020
-2.50%
2.50%
7.50%
12.50%
17.50%
195
5
195
8
196
1
196
4
196
7
1970
1973
1976
1979
198
2
198
5
198
8
199
1
199
4
199
7
20
00
20
03
20
06
20
09
20
12
20
15
20
18
U.S. Recession U.S. Inflation (Annual) Fed Funds Rate
Page 6 of 19
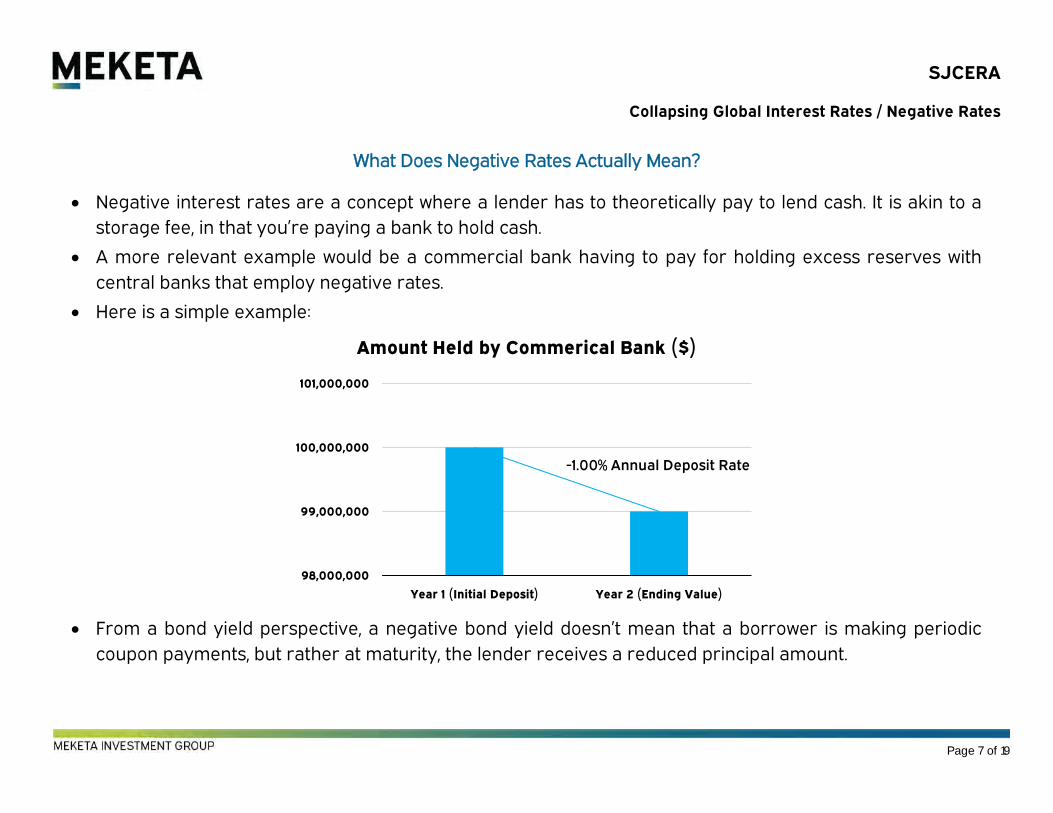
SJCERA
Collapsing Global Interest Rates / Negative Rates
What Does Negative Rates Actually Mean?
Negative interest rates are a concept where a lender has to theoretically pay to lend cash. It is akin to a
storage fee, in that you’re paying a bank to hold cash.
A more relevant example would be a commercial bank having to pay for holding excess reserves with
central banks that employ negative rates.
Here is a simple example:
From a bond yield perspective, a negative bond yield doesn’t mean that a borrower is making periodic
coupon payments, but rather at maturity, the lender receives a reduced principal amount.
98,000,000
99,000,000
100,000,000
101,000,000
Year 1 (Initial Deposit) Year 2 (Ending Value)
Amount Held by Commerical Bank ($)
-1.00% Annual Deposit Rate
Page 7 of 19
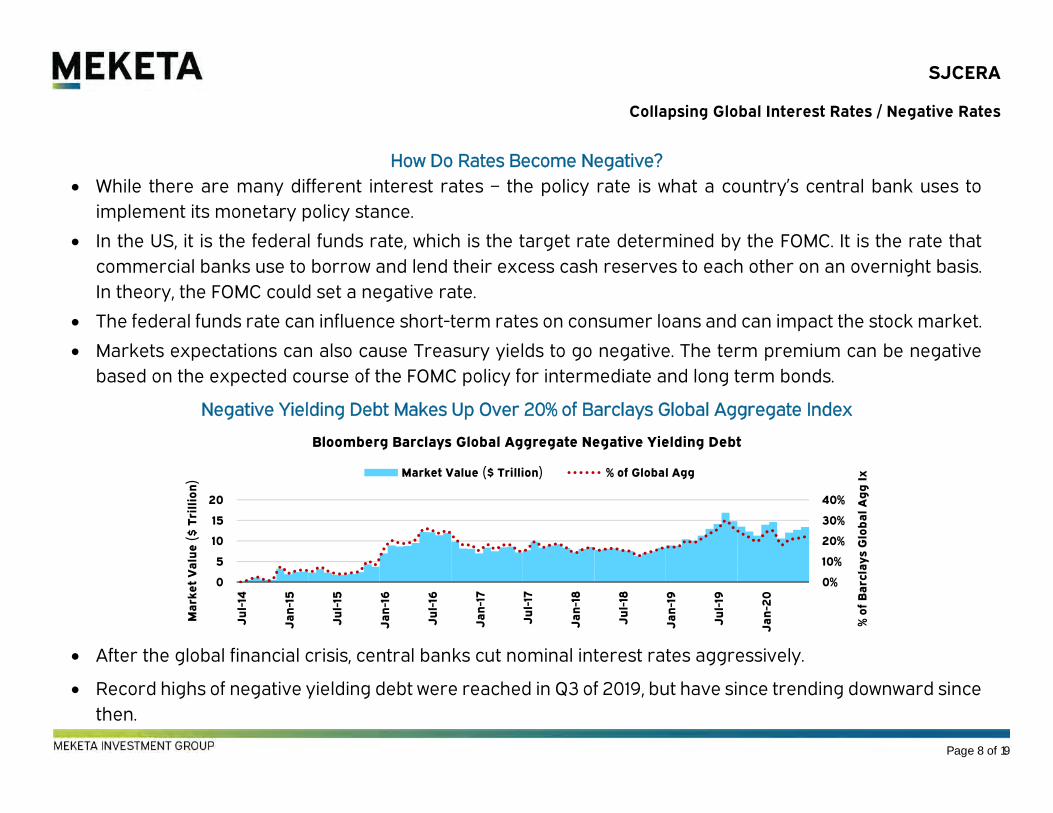
SJCERA
Collapsing Global Interest Rates / Negative Rates
How Do Rates Become Negative?
While there are many different interest rates – the policy rate is what a country’s central bank uses to
implement its monetary policy stance.
In the US, it is the federal funds rate, which is the target rate determined by the FOMC. It is the rate that
commercial banks use to borrow and lend their excess cash reserves to each other on an overnight basis.
In theory, the FOMC could set a negative rate.
The federal funds rate can influence short-term rates on consumer loans and can impact the stock market.
Markets expectations can also cause Treasury yields to go negative. The term premium can be negative
based on the expected course of the FOMC policy for intermediate and long term bonds.
Negative Yielding Debt Makes Up Over 20% of Barclays Global Aggregate Index
After the global financial crisis, central banks cut nominal interest rates aggressively.
Record highs of negative yielding debt were reached in Q3 of 2019, but have since trending downward since
then.
0%
10%
20%
30%
40%
0
5
10
15
20
Ju
l-14
Ja
n-1
5
Ju
l-15
Ja
n-1
6
Ju
l-16
Ja
n-1
7
Ju
l-17
Ja
n-1
8
Ju
l-18
Ja
n-1
9
Ju
l-19
Ja
n-2
0
% o
f B
arc
lay
s G
lob
al
Ag
g I
x
Ma
rke
t V
alu
e (
$ T
rill
ion
)
Bloomberg Barclays Global Aggregate Negative Yielding Debt
Market Value ($ Trillion) % of Global Agg
Page 8 of 19
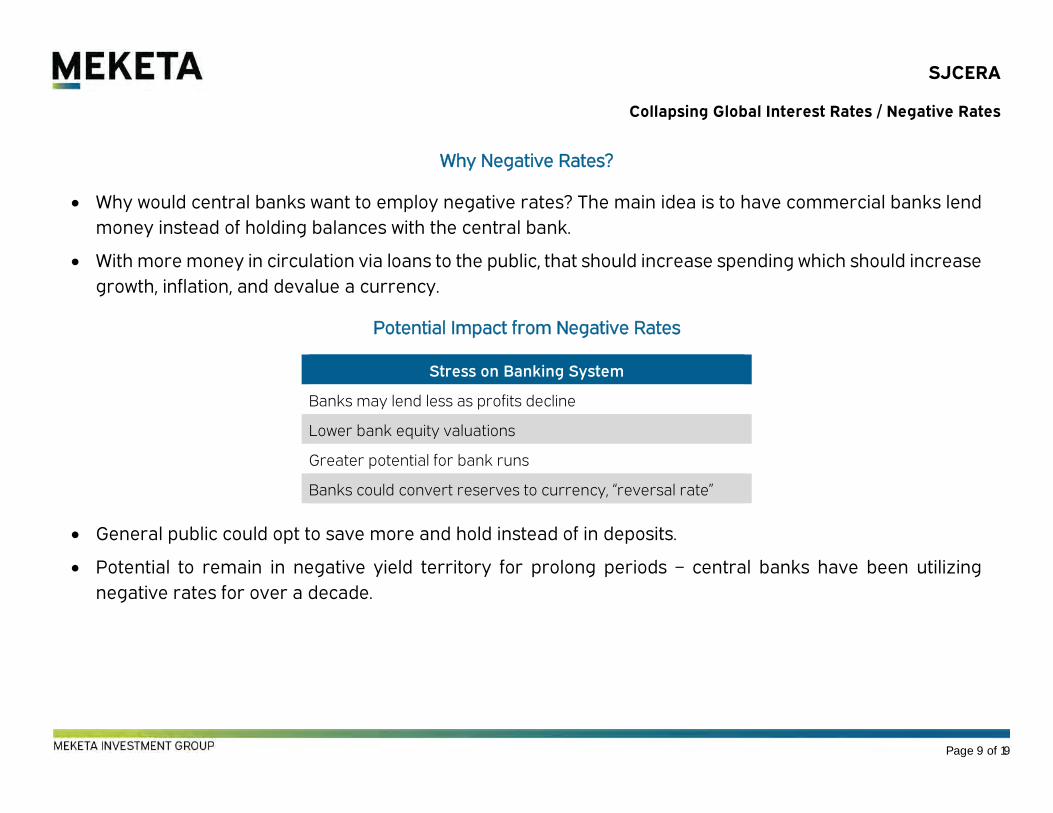
SJCERA
Collapsing Global Interest Rates / Negative Rates
Why Negative Rates?
Why would central banks want to employ negative rates? The main idea is to have commercial banks lend
money instead of holding balances with the central bank.
With more money in circulation via loans to the public, that should increase spending which should increase
growth, inflation, and devalue a currency.
Potential Impact from Negative Rates
Stress on Banking System
Banks may lend less as profits decline
Lower bank equity valuations
Greater potential for bank runs
Banks could convert reserves to currency, “reversal rate”
General public could opt to save more and hold instead of in deposits.
Potential to remain in negative yield territory for prolong periods – central banks have been utilizing
negative rates for over a decade.
Page 9 of 19
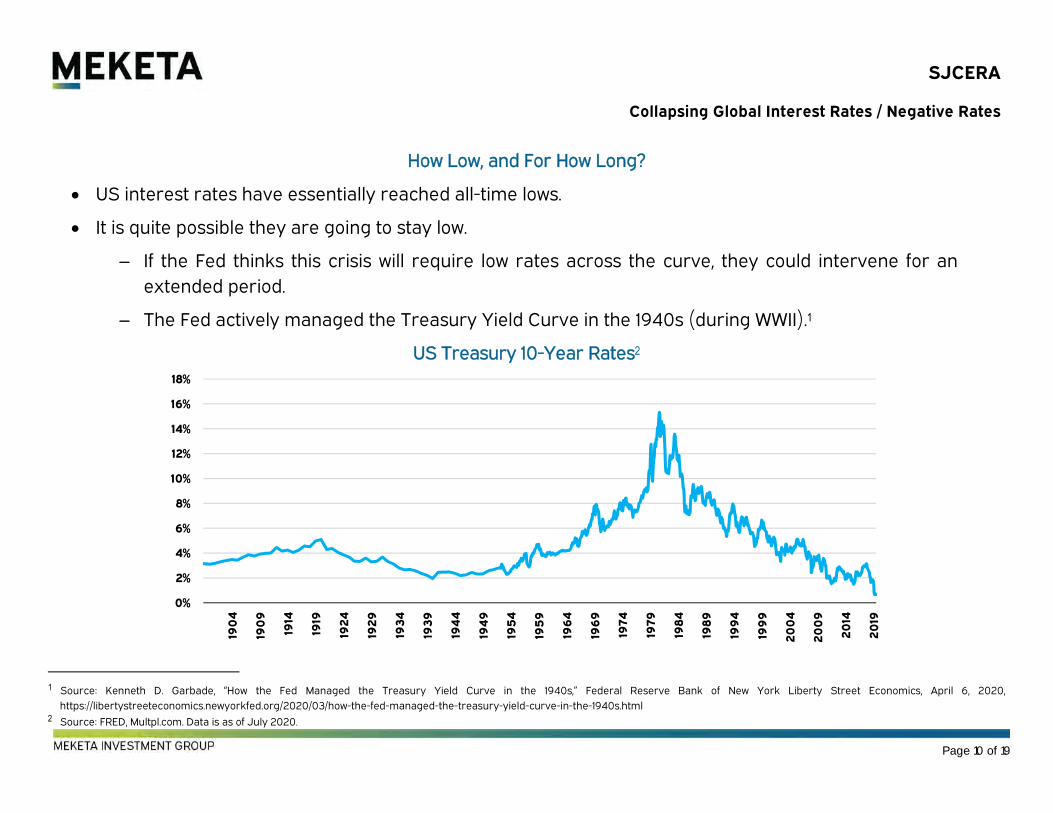
SJCERA
Collapsing Global Interest Rates / Negative Rates
How Low, and For How Long?
US interest rates have essentially reached all-time lows.
It is quite possible they are going to stay low.
If the Fed thinks this crisis will require low rates across the curve, they could intervene for an
extended period.
The Fed actively managed the Treasury Yield Curve in the 1940s (during WWII).1
US Treasury 10-Year Rates2
1 Source: Kenneth D. Garbade, “How the Fed Managed the Treasury Yield Curve in the 1940s,” Federal Reserve Bank of New York Liberty Street Economics, April 6, 2020,
https://libertystreeteconomics.newyorkfed.org/2020/03/how-the-fed-managed-the-treasury-yield-curve-in-the-1940s.html 2 Source: FRED, Multpl.com. Data is as of July 2020.
0%
2%
4%
6%
8%
10%
12%
14%
16%
18%
190
4
190
9
1914
1919
192
4
192
9
193
4
193
9
194
4
194
9
195
4
195
9
196
4
196
9
1974
1979
198
4
198
9
199
4
199
9
20
04
20
09
20
14
20
19
Page 10 of 19
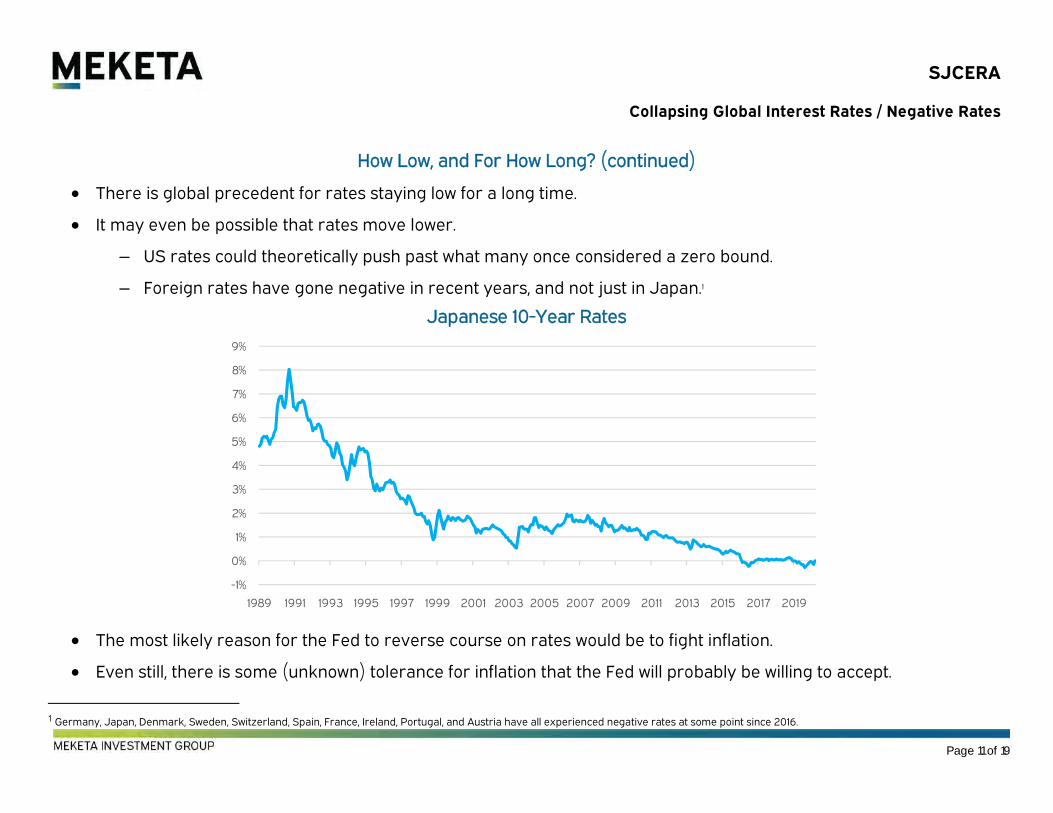
SJCERA
Collapsing Global Interest Rates / Negative Rates
How Low, and For How Long? (continued)
There is global precedent for rates staying low for a long time.
It may even be possible that rates move lower.
US rates could theoretically push past what many once considered a zero bound.
Foreign rates have gone negative in recent years, and not just in Japan.1
Japanese 10-Year Rates
The most likely reason for the Fed to reverse course on rates would be to fight inflation.
Even still, there is some (unknown) tolerance for inflation that the Fed will probably be willing to accept.
1 Germany, Japan, Denmark, Sweden, Switzerland, Spain, France, Ireland, Portugal, and Austria have all experienced negative rates at some point since 2016.
-1%
0%
1%
2%
3%
4%
5%
6%
7%
8%
9%
1989 1991 1993 1995 1997 1999 2001 2003 2005 2007 2009 2011 2013 2015 2017 2019
Page 11 of 19
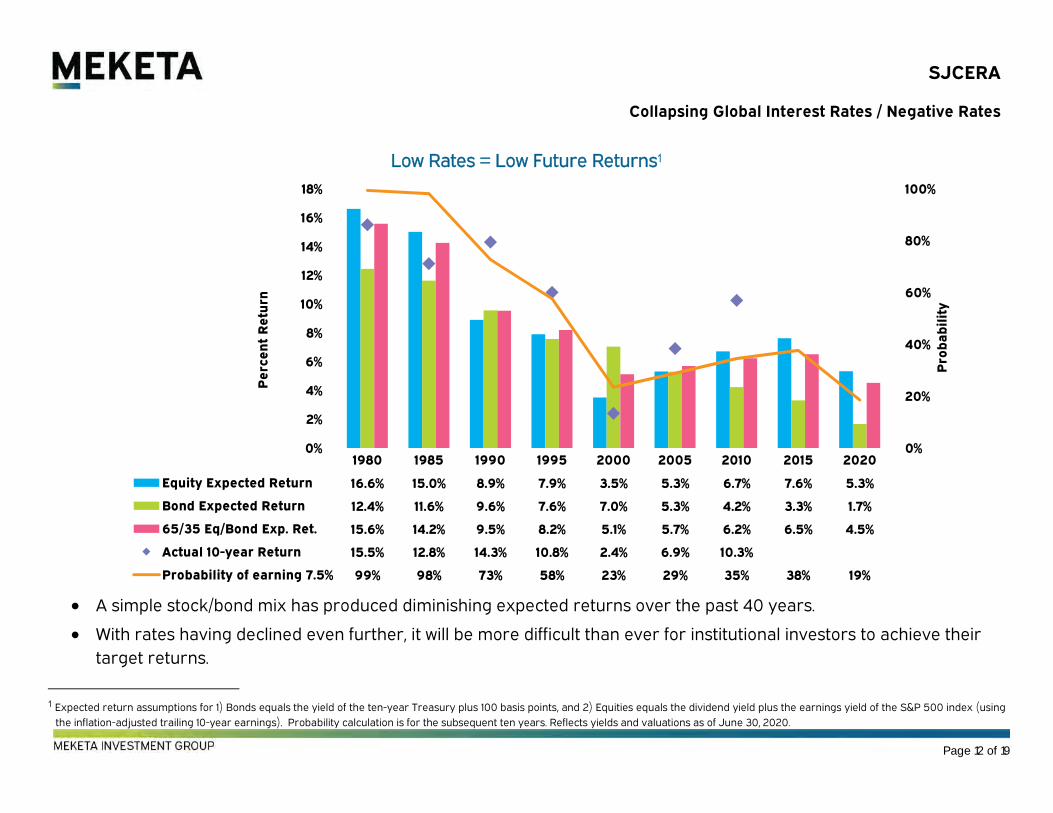
SJCERA
Collapsing Global Interest Rates / Negative Rates
Low Rates = Low Future Returns1
A simple stock/bond mix has produced diminishing expected returns over the past 40 years.
With rates having declined even further, it will be more difficult than ever for institutional investors to achieve their
target returns.
1 Expected return assumptions for 1) Bonds equals the yield of the ten-year Treasury plus 100 basis points, and 2) Equities equals the dividend yield plus the earnings yield of the S&P 500 index (using
the inflation-adjusted trailing 10-year earnings). Probability calculation is for the subsequent ten years. Reflects yields and valuations as of June 30, 2020.
1980 1985 1990 1995 2000 2005 2010 2015 2020
Equity Expected Return 16.6% 15.0% 8.9% 7.9% 3.5% 5.3% 6.7% 7.6% 5.3%
Bond Expected Return 12.4% 11.6% 9.6% 7.6% 7.0% 5.3% 4.2% 3.3% 1.7%
65/35 Eq/Bond Exp. Ret. 15.6% 14.2% 9.5% 8.2% 5.1% 5.7% 6.2% 6.5% 4.5%
Actual 10-year Return 15.5% 12.8% 14.3% 10.8% 2.4% 6.9% 10.3%
Probability of earning 7.5% 99% 98% 73% 58% 23% 29% 35% 38% 19%
0%
20%
40%
60%
80%
100%
0%
2%
4%
6%
8%
10%
12%
14%
16%
18%
Pro
ba
bil
ity
Pe
rce
nt
Re
turn
Page 12 of 19
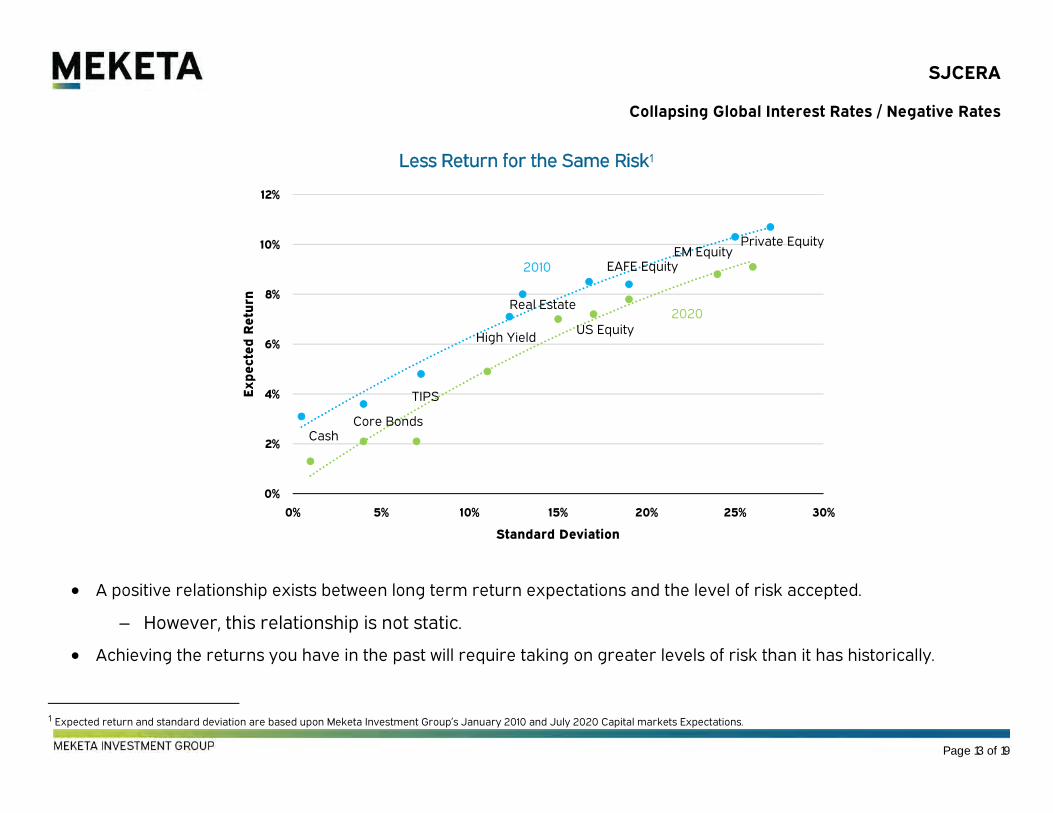
SJCERA
Collapsing Global Interest Rates / Negative Rates
Less Return for the Same Risk1
A positive relationship exists between long term return expectations and the level of risk accepted.
However, this relationship is not static.
Achieving the returns you have in the past will require taking on greater levels of risk than it has historically.
1 Expected return and standard deviation are based upon Meketa Investment Group’s January 2010 and July 2020 Capital markets Expectations.
0%
2%
4%
6%
8%
10%
12%
0% 5% 10% 15% 20% 25% 30%
Ex
pe
cte
d R
etu
rn
Standard Deviation
2010
2020
CashCore Bonds
TIPS
High Yield
Real Estate
US Equity
EAFE EquityEM Equity
Private Equity
Page 13 of 19

SJCERA
Collapsing Global Interest Rates / Negative Rates
The Barbell Approach: Mixing Low and High Risk Assets
Target returns for institutional investors have been declining, but not nearly as quickly as interest rates.
Low interest rates flow through to many asset classes, thus lowering their expected return.
The lower expected return across asset classes argues for a “barbell approach” to portfolio structuring.
This means owning higher-risk assets such as equities along with hedges such as long Treasuries
and other Diversifying Strategies.
It effectively “crowds out” assets with expected returns in the middle that tend to be correlated with higher
risk assets.
It will be harder for high yield, bank loans, EM debt, GTAA, and traditional hedge funds to find a
home.
A barbell approach takes on risk more efficiently.
It provides better downside protection than a typical portfolio that theoretically has the same level
of risk in it.
Page 14 of 19
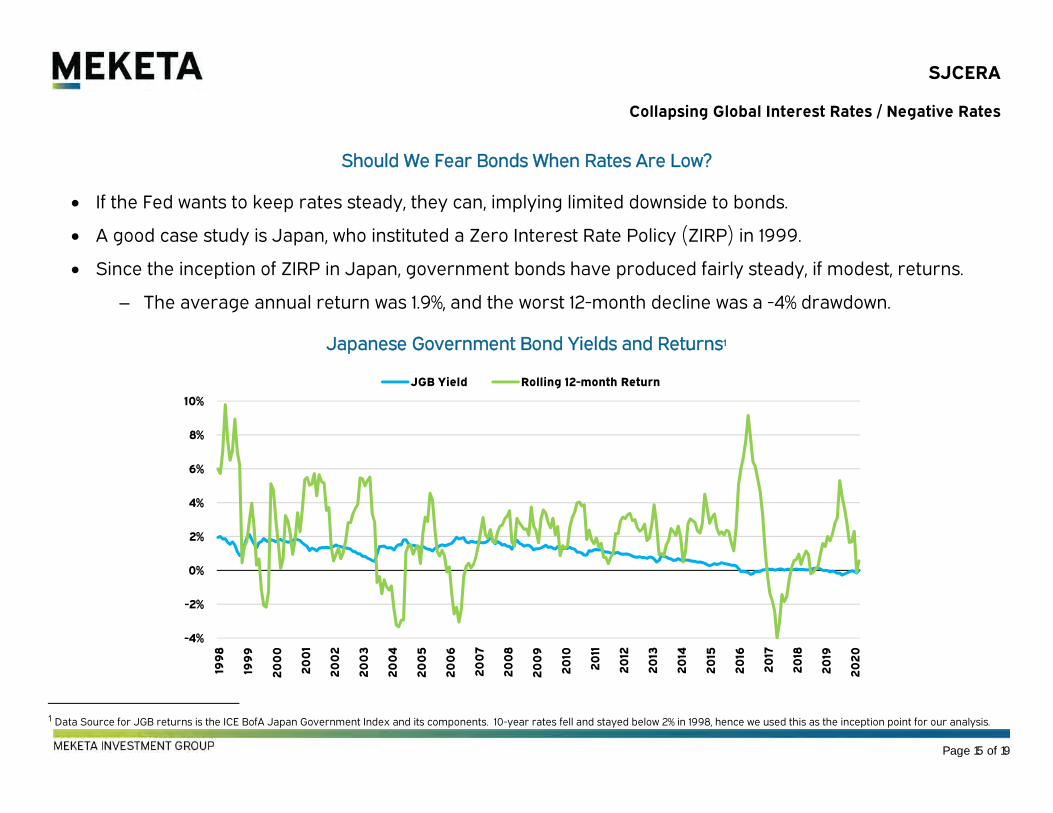
SJCERA
Collapsing Global Interest Rates / Negative Rates
Should We Fear Bonds When Rates Are Low?
If the Fed wants to keep rates steady, they can, implying limited downside to bonds.
A good case study is Japan, who instituted a Zero Interest Rate Policy (ZIRP) in 1999.
Since the inception of ZIRP in Japan, government bonds have produced fairly steady, if modest, returns.
The average annual return was 1.9%, and the worst 12-month decline was a -4% drawdown.
Japanese Government Bond Yields and Returns1
1 Data Source for JGB returns is the ICE BofA Japan Government Index and its components. 10-year rates fell and stayed below 2% in 1998, hence we used this as the inception point for our analysis.
-4%
-2%
0%
2%
4%
6%
8%
10%
199
8
199
9
20
00
20
01
20
02
20
03
20
04
20
05
20
06
20
07
20
08
20
09
20
10
20
11
20
12
20
13
20
14
20
15
20
16
20
17
20
18
20
19
20
20
JGB Yield Rolling 12-month Return
Page 15 of 19
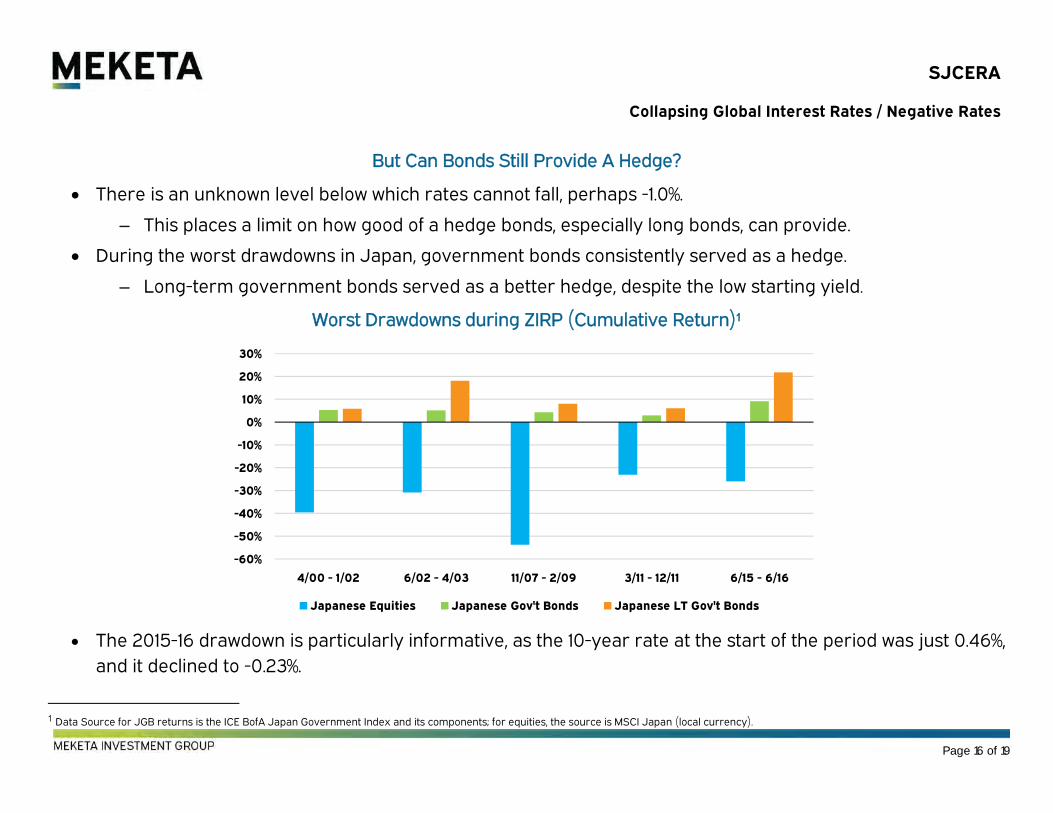
SJCERA
Collapsing Global Interest Rates / Negative Rates
But Can Bonds Still Provide A Hedge?
There is an unknown level below which rates cannot fall, perhaps -1.0%.
This places a limit on how good of a hedge bonds, especially long bonds, can provide.
During the worst drawdowns in Japan, government bonds consistently served as a hedge.
Long-term government bonds served as a better hedge, despite the low starting yield.
Worst Drawdowns during ZIRP (Cumulative Return)1
The 2015-16 drawdown is particularly informative, as the 10-year rate at the start of the period was just 0.46%,
and it declined to -0.23%.
1 Data Source for JGB returns is the ICE BofA Japan Government Index and its components; for equities, the source is MSCI Japan (local currency).
-60%
-50%
-40%
-30%
-20%
-10%
0%
10%
20%
30%
4/00 - 1/02 6/02 - 4/03 11/07 - 2/09 3/11 - 12/11 6/15 - 6/16
Japanese Equities Japanese Gov't Bonds Japanese LT Gov't Bonds
Page 16 of 19
SJCERA
Collapsing Global Interest Rates / Negative Rates
Diversifying Strategies
Also often referred to as Crisis Risk Offset “CRO” or Risk Mitigating Strategies, or “RMS,” is an asset
allocation program designed to provide robust, impactful diversification benefits and defensive
characteristics relative to growth-like asset classes.
Programs are designed to have:
Low correlation with traditional portfolios.
Low to negative correlations to equities during volatile markets or equity drawdowns.
Programs generally incorporate at least several of the following strategies:
Long Term US Treasuries
Trend Following
Global Macro
Alternative Risk Premia
Long Volatility
By diversifying across several of these strategies, it reduces the reliance upon any single component.
Each strategy will react differently, depending on the type and magnitude of the drawdown, thus
supporting a portfolio approach to building a program.
Page 17 of 19
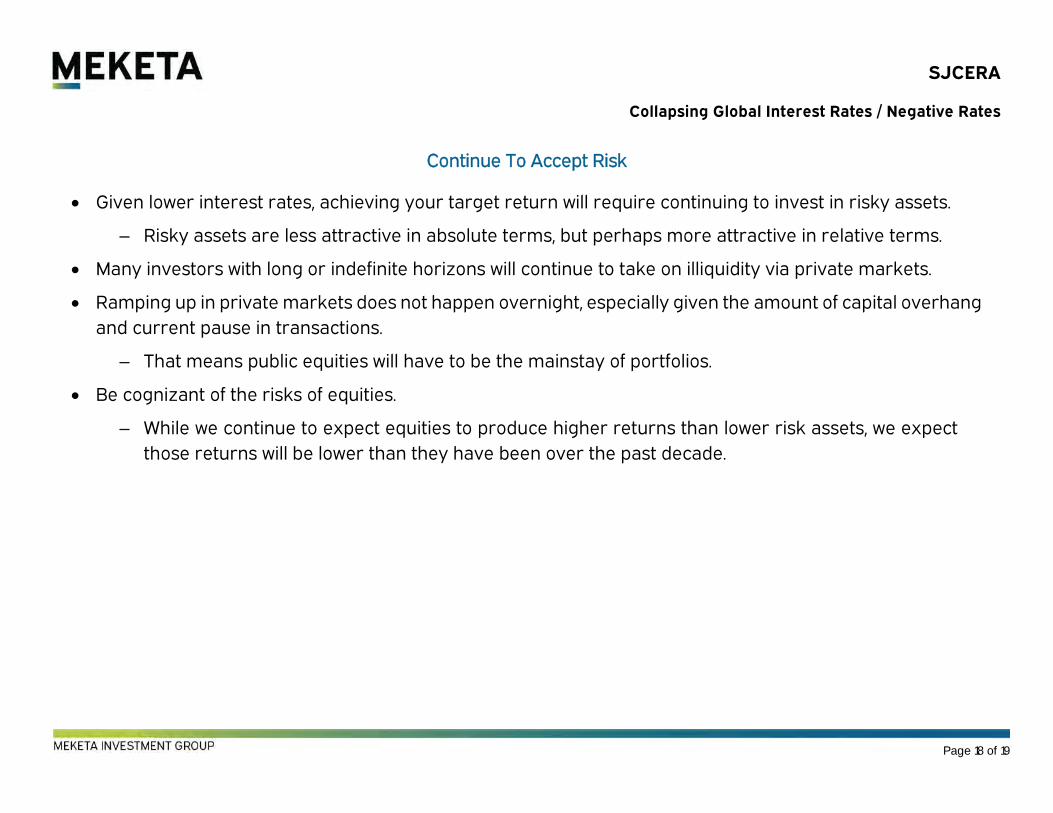
SJCERA
Collapsing Global Interest Rates / Negative Rates
Continue To Accept Risk
Given lower interest rates, achieving your target return will require continuing to invest in risky assets.
Risky assets are less attractive in absolute terms, but perhaps more attractive in relative terms.
Many investors with long or indefinite horizons will continue to take on illiquidity via private markets.
Ramping up in private markets does not happen overnight, especially given the amount of capital overhang
and current pause in transactions.
That means public equities will have to be the mainstay of portfolios.
Be cognizant of the risks of equities.
While we continue to expect equities to produce higher returns than lower risk assets, we expect
those returns will be lower than they have been over the past decade.
Page 18 of 19
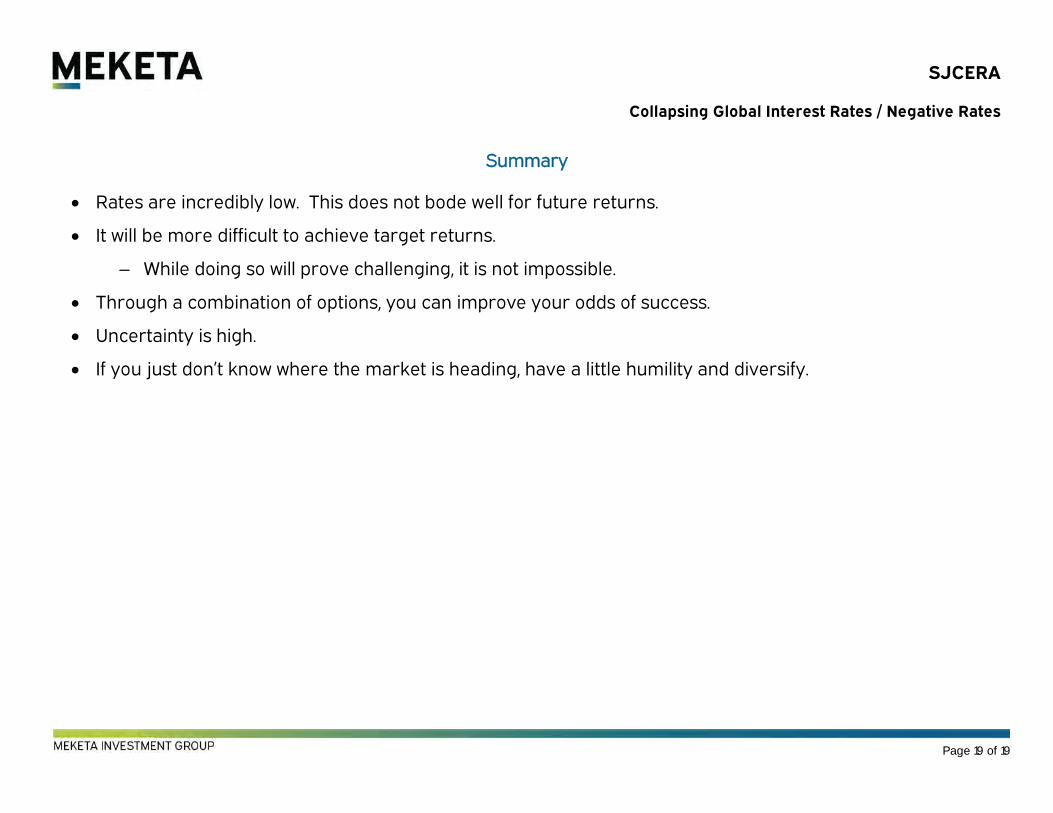
SJCERA
Collapsing Global Interest Rates / Negative Rates
Summary
Rates are incredibly low. This does not bode well for future returns.
It will be more difficult to achieve target returns.
While doing so will prove challenging, it is not impossible.
Through a combination of options, you can improve your odds of success.
Uncertainty is high.
If you just don’t know where the market is heading, have a little humility and diversify.
Page 19 of 19
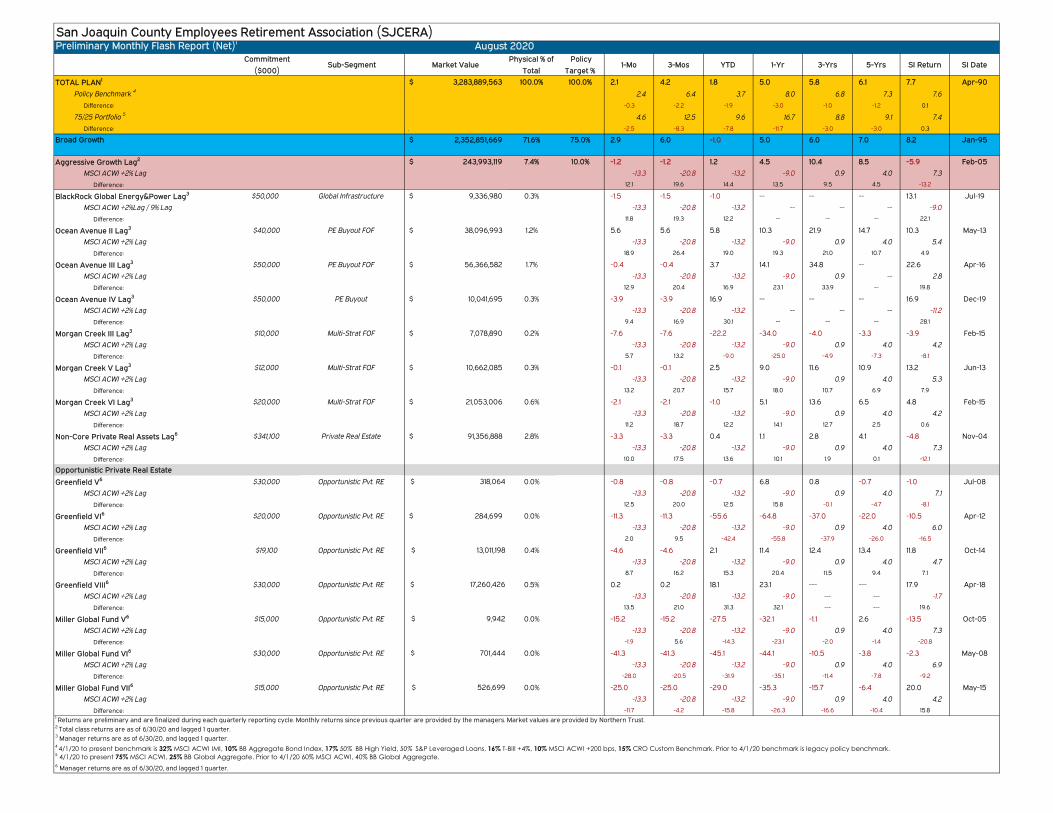
San Joaquin County Employees Retirement Association (SJCERA)Preliminary Monthly Flash Report (Net)1
Commitment
($000)Sub-Segment Market Value
Physical % of
Total
Policy
Target %1-Mo 3-Mos YTD 1-Yr 3-Yrs 5-Yrs SI Return SI Date
TOTAL PLAN1 3,283,889,563$ 100.0% 100.0% 2.1 4.2 1.8 5.0 5.8 6.1 7.7 Apr-90
Policy Benchmark 42.4 6.4 3.7 8.0 6.8 7.3 7.6
Difference: -0.3 -2.2 -1.9 -3.0 -1.0 -1.2 0.1
75/25 Portfolio 54.6 12.5 9.6 16.7 8.8 9.1 7.4
Difference: . -2.5 -8.3 -7.8 -11.7 -3.0 -3.0 0.3
Broad Growth 2,352,851,669$ 71.6% 75.0% 2.9 6.0 -1.0 5.0 6.0 7.0 8.2 Jan-95
Aggressive Growth Lag2 243,993,119$ 7.4% 10.0% -1.2 -1.2 1.2 4.5 10.4 8.5 -5.9 Feb-05
MSCI ACWI +2% Lag -13.3 -20.8 -13.2 -9.0 0.9 4.0 7.3
Difference: 12.1 19.6 14.4 13.5 9.5 4.5 -13.2
BlackRock Global Energy&Power Lag3 $50,000 Global Infrastructure 9,336,980$ 0.3% -1.5 -1.5 -1.0 -- -- -- 13.1 Jul-19
MSCI ACWI +2%Lag / 9% Lag -13.3 -20.8 -13.2 -- -- -- -9.0
Difference: 11.8 19.3 12.2 -- -- -- 22.1
Ocean Avenue II Lag3 $40,000 PE Buyout FOF 38,096,993$ 1.2% 5.6 5.6 5.8 10.3 21.9 14.7 10.3 May-13
MSCI ACWI +2% Lag -13.3 -20.8 -13.2 -9.0 0.9 4.0 5.4
Difference: 18.9 26.4 19.0 19.3 21.0 10.7 4.9
Ocean Avenue III Lag3 $50,000 PE Buyout FOF 56,366,582$ 1.7% -0.4 -0.4 3.7 14.1 34.8 -- 22.6 Apr-16
MSCI ACWI +2% Lag -13.3 -20.8 -13.2 -9.0 0.9 -- 2.8
Difference: 12.9 20.4 16.9 23.1 33.9 -- 19.8
Ocean Avenue IV Lag3 $50,000 PE Buyout 10,041,695$ 0.3% -3.9 -3.9 16.9 -- -- -- 16.9 Dec-19
MSCI ACWI +2% Lag -13.3 -20.8 -13.2 -- -- -- -11.2
Difference: 9.4 16.9 30.1 -- -- -- 28.1
Morgan Creek III Lag3 $10,000 Multi-Strat FOF 7,078,890$ 0.2% -7.6 -7.6 -22.2 -34.0 -4.0 -3.3 -3.9 Feb-15
MSCI ACWI +2% Lag -13.3 -20.8 -13.2 -9.0 0.9 4.0 4.2
Difference: 5.7 13.2 -9.0 -25.0 -4.9 -7.3 -8.1
Morgan Creek V Lag3 $12,000 Multi-Strat FOF 10,662,085$ 0.3% -0.1 -0.1 2.5 9.0 11.6 10.9 13.2 Jun-13
MSCI ACWI +2% Lag -13.3 -20.8 -13.2 -9.0 0.9 4.0 5.3
Difference: 13.2 20.7 15.7 18.0 10.7 6.9 7.9
Morgan Creek VI Lag3 $20,000 Multi-Strat FOF 21,053,006$ 0.6% -2.1 -2.1 -1.0 5.1 13.6 6.5 4.8 Feb-15
MSCI ACWI +2% Lag -13.3 -20.8 -13.2 -9.0 0.9 4.0 4.2
Difference: 11.2 18.7 12.2 14.1 12.7 2.5 0.6
Non-Core Private Real Assets Lag6 $341,100 Private Real Estate 91,356,888$ 2.8% -3.3 -3.3 0.4 1.1 2.8 4.1 -4.8 Nov-04
MSCI ACWI +2% Lag -13.3 -20.8 -13.2 -9.0 0.9 4.0 7.3
Difference: 10.0 17.5 13.6 10.1 1.9 0.1 -12.1
Opportunistic Private Real Estate
Greenfield V6 $30,000 Opportunistic Pvt. RE $ 318,064 0.0% -0.8 -0.8 -0.7 6.8 0.8 -0.7 -1.0 Jul-08
MSCI ACWI +2% Lag -13.3 -20.8 -13.2 -9.0 0.9 4.0 7.1
Difference: 12.5 20.0 12.5 15.8 -0.1 -4.7 -8.1
Greenfield VI6 $20,000 Opportunistic Pvt. RE 284,699$ 0.0% -11.3 -11.3 -55.6 -64.8 -37.0 -22.0 -10.5 Apr-12
MSCI ACWI +2% Lag -13.3 -20.8 -13.2 -9.0 0.9 4.0 6.0
Difference: 2.0 9.5 -42.4 -55.8 -37.9 -26.0 -16.5
Greenfield VII6 $19,100 Opportunistic Pvt. RE $ 13,011,198 0.4% -4.6 -4.6 2.1 11.4 12.4 13.4 11.8 Oct-14
MSCI ACWI +2% Lag -13.3 -20.8 -13.2 -9.0 0.9 4.0 4.7
Difference: 8.7 16.2 15.3 20.4 11.5 9.4 7.1
Greenfield VIII6 $30,000 Opportunistic Pvt. RE $ 17,260,426 0.5% 0.2 0.2 18.1 23.1 --- --- 17.9 Apr-18
MSCI ACWI +2% Lag -13.3 -20.8 -13.2 -9.0 --- --- -1.7
Difference: 13.5 21.0 31.3 32.1 --- --- 19.6
Miller Global Fund V6 $15,000 Opportunistic Pvt. RE $ 9,942 0.0% -15.2 -15.2 -27.5 -32.1 -1.1 2.6 -13.5 Oct-05
MSCI ACWI +2% Lag -13.3 -20.8 -13.2 -9.0 0.9 4.0 7.3
Difference: -1.9 5.6 -14.3 -23.1 -2.0 -1.4 -20.8
Miller Global Fund VI6 $30,000 Opportunistic Pvt. RE $ 701,444 0.0% -41.3 -41.3 -45.1 -44.1 -10.5 -3.8 -2.3 May-08
MSCI ACWI +2% Lag -13.3 -20.8 -13.2 -9.0 0.9 4.0 6.9
Difference: -28.0 -20.5 -31.9 -35.1 -11.4 -7.8 -9.2
Miller Global Fund VII6 $15,000 Opportunistic Pvt. RE $ 526,699 0.0% -25.0 -25.0 -29.0 -35.3 -15.7 -6.4 20.0 May-15
MSCI ACWI +2% Lag -13.3 -20.8 -13.2 -9.0 0.9 4.0 4.2
Difference: -11.7 -4.2 -15.8 -26.3 -16.6 -10.4 15.81 Returns are preliminary and are finalized during each quarterly reporting cycle. Monthly returns since previous quarter are provided by the managers. Market values are provided by Northern Trust. 2 Total class returns are as of 6/30/20 and lagged 1 quarter.3 Manager returns are as of 6/30/20, and lagged 1 quarter.
5 4/1/20 to present 75% MSCI ACWI, 25% BB Global Aggregate. Prior to 4/1/20 60% MSCI ACWI, 40% BB Global Aggregate.6 Manager returns are as of 6/30/20, and lagged 1 quarter.
August 2020
4 4/1/20 to present benchmark is 32% MSCI ACWI IMI, 10% BB Aggregate Bond Index, 17% 50% BB High Yield, 50% S&P Leveraged Loans, 16% T-Bill +4%, 10% MSCI ACWI +200 bps, 15% CRO Custom Benchmark. Prior to 4/1/20 benchmark is legacy policy benchmark.
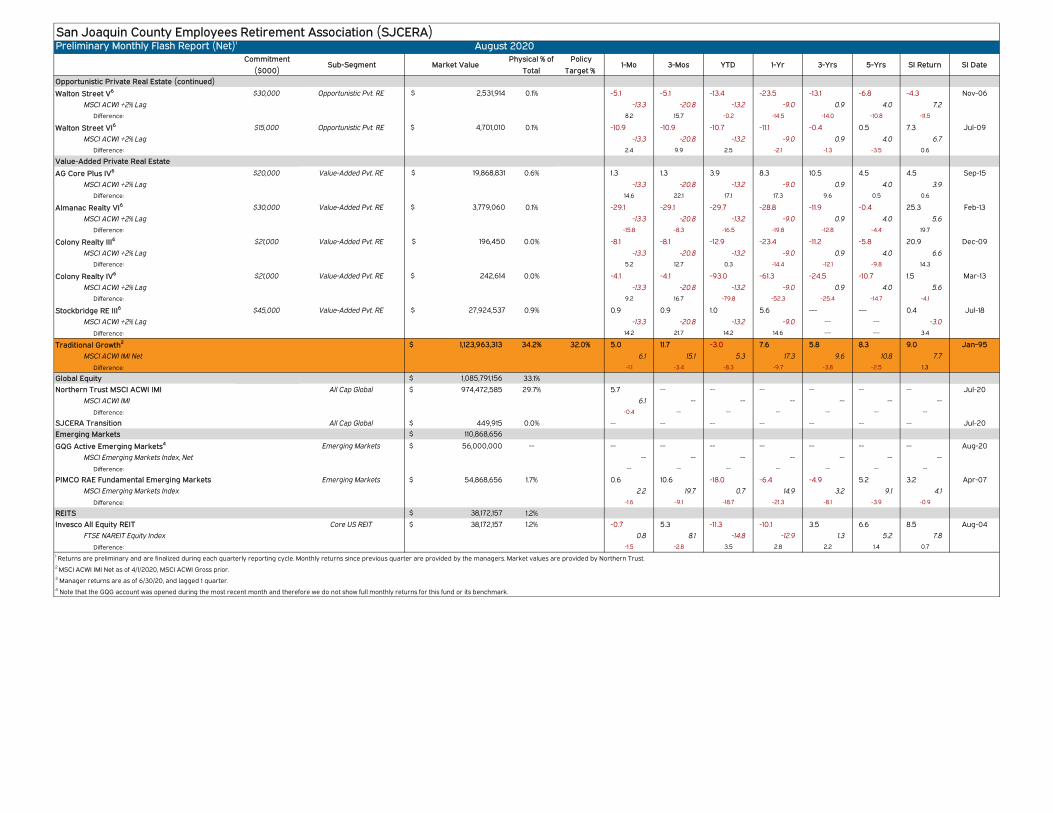
San Joaquin County Employees Retirement Association (SJCERA)Preliminary Monthly Flash Report (Net)1
Commitment
($000)Sub-Segment Market Value
Physical % of
Total
Policy
Target %1-Mo 3-Mos YTD 1-Yr 3-Yrs 5-Yrs SI Return SI Date
August 2020
Opportunistic Private Real Estate (continued)
Walton Street V6 $30,000 Opportunistic Pvt. RE $ 2,531,914 0.1% -5.1 -5.1 -13.4 -23.5 -13.1 -6.8 -4.3 Nov-06
MSCI ACWI +2% Lag -13.3 -20.8 -13.2 -9.0 0.9 4.0 7.2
Difference: 8.2 15.7 -0.2 -14.5 -14.0 -10.8 -11.5
Walton Street VI6 $15,000 Opportunistic Pvt. RE $ 4,701,010 0.1% -10.9 -10.9 -10.7 -11.1 -0.4 0.5 7.3 Jul-09
MSCI ACWI +2% Lag -13.3 -20.8 -13.2 -9.0 0.9 4.0 6.7
Difference: 2.4 9.9 2.5 -2.1 -1.3 -3.5 0.6
Value-Added Private Real Estate
AG Core Plus IV6 $20,000 Value-Added Pvt. RE $ 19,868,831 0.6% 1.3 1.3 3.9 8.3 10.5 4.5 4.5 Sep-15
MSCI ACWI +2% Lag -13.3 -20.8 -13.2 -9.0 0.9 4.0 3.9
Difference: 14.6 22.1 17.1 17.3 9.6 0.5 0.6
Almanac Realty VI6 $30,000 Value-Added Pvt. RE $ 3,779,060 0.1% -29.1 -29.1 -29.7 -28.8 -11.9 -0.4 25.3 Feb-13
MSCI ACWI +2% Lag -13.3 -20.8 -13.2 -9.0 0.9 4.0 5.6
Difference: -15.8 -8.3 -16.5 -19.8 -12.8 -4.4 19.7
Colony Realty III6 $21,000 Value-Added Pvt. RE $ 196,450 0.0% -8.1 -8.1 -12.9 -23.4 -11.2 -5.8 20.9 Dec-09
MSCI ACWI +2% Lag -13.3 -20.8 -13.2 -9.0 0.9 4.0 6.6
Difference: 5.2 12.7 0.3 -14.4 -12.1 -9.8 14.3
Colony Realty IV6 $21,000 Value-Added Pvt. RE $ 242,614 0.0% -4.1 -4.1 -93.0 -61.3 -24.5 -10.7 1.5 Mar-13
MSCI ACWI +2% Lag -13.3 -20.8 -13.2 -9.0 0.9 4.0 5.6
Difference: 9.2 16.7 -79.8 -52.3 -25.4 -14.7 -4.1
Stockbridge RE III6 $45,000 Value-Added Pvt. RE $ 27,924,537 0.9% 0.9 0.9 1.0 5.6 --- --- 0.4 Jul-18
MSCI ACWI +2% Lag -13.3 -20.8 -13.2 -9.0 --- --- -3.0
Difference: 14.2 21.7 14.2 14.6 --- --- 3.4
Traditional Growth2 1,123,963,313$ 34.2% 32.0% 5.0 11.7 -3.0 7.6 5.8 8.3 9.0 Jan-95
MSCI ACWI IMI Net 6.1 15.1 5.3 17.3 9.6 10.8 7.7
Difference: -1.1 -3.4 -8.3 -9.7 -3.8 -2.5 1.3
Global Equity 1,085,791,156$ 33.1%
Northern Trust MSCI ACWI IMI All Cap Global 974,472,585$ 29.7% 5.7 -- -- -- -- -- -- Jul-20
MSCI ACWI IMI 6.1 -- -- -- -- -- --
Difference: -0.4 -- -- -- -- -- --
SJCERA Transition All Cap Global 449,915$ 0.0% -- -- -- -- -- -- -- Jul-20
Emerging Markets 110,868,656$
GQG Active Emerging Markets4 Emerging Markets 56,000,000$ -- -- -- -- -- -- -- -- Aug-20
MSCI Emerging Markets Index, Net -- -- -- -- -- -- --
Difference: -- -- -- -- -- -- --
PIMCO RAE Fundamental Emerging Markets Emerging Markets 54,868,656$ 1.7% 0.6 10.6 -18.0 -6.4 -4.9 5.2 3.2 Apr-07
MSCI Emerging Markets Index 2.2 19.7 0.7 14.9 3.2 9.1 4.1
Difference: -1.6 -9.1 -18.7 -21.3 -8.1 -3.9 -0.9
REITS 38,172,157$ 1.2%
Invesco All Equity REIT Core US REIT 38,172,157$ 1.2% -0.7 5.3 -11.3 -10.1 3.5 6.6 8.5 Aug-04
FTSE NAREIT Equity Index 0.8 8.1 -14.8 -12.9 1.3 5.2 7.8
Difference: -1.5 -2.8 3.5 2.8 2.2 1.4 0.7
1 Returns are preliminary and are finalized during each quarterly reporting cycle. Monthly returns since previous quarter are provided by the managers. Market values are provided by Northern Trust. 2 MSCI ACWI IMI Net as of 4/1/2020, MSCI ACWI Gross prior.3 Manager returns are as of 6/30/20, and lagged 1 quarter.4 Note that the GQG account was opened during the most recent month and therefore we do not show full monthly returns for this fund or its benchmark.
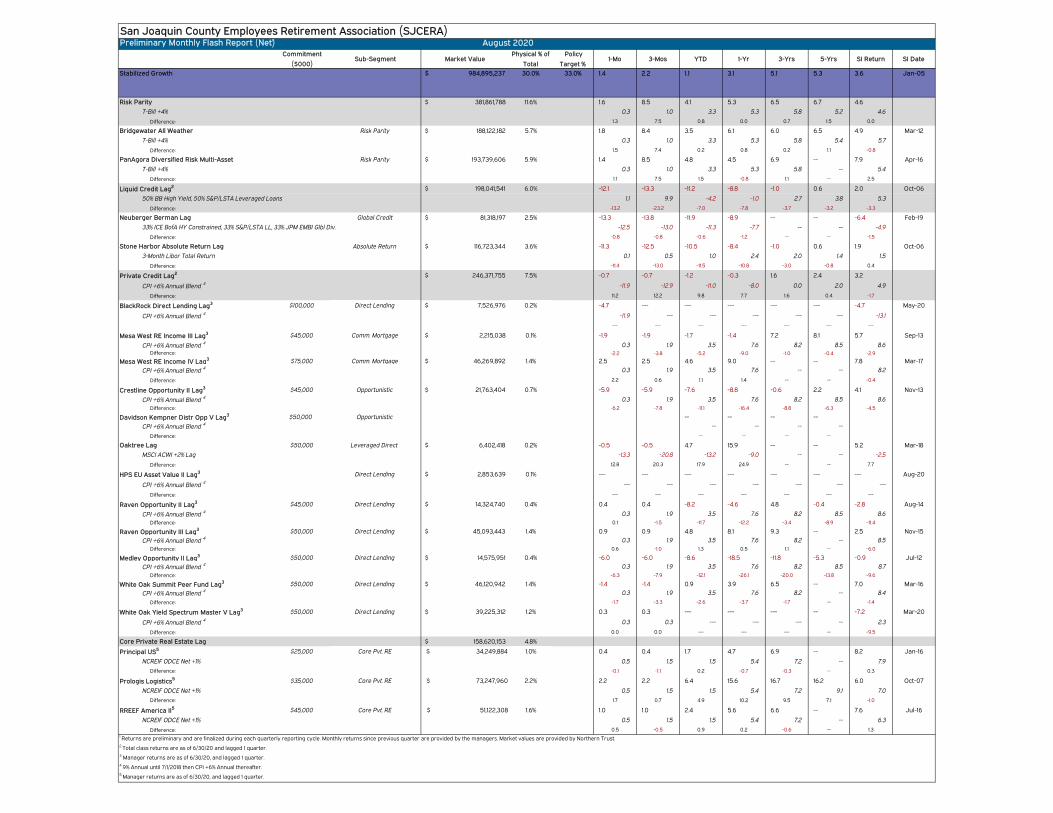
San Joaquin County Employees Retirement Association (SJCERA)Preliminary Monthly Flash Report (Net)1
Commitment
($000)Sub-Segment Market Value
Physical % of
Total
Policy
Target %1-Mo 3-Mos YTD 1-Yr 3-Yrs 5-Yrs SI Return SI Date
August 2020
Stabilized Growth 984,895,237$ 30.0% 33.0% 1.4 2.2 1.1 3.1 5.1 5.3 3.6 Jan-05
Risk Parity 381,861,788$ 11.6% 1.6 8.5 4.1 5.3 6.5 6.7 4.6
T-Bill +4% 0.3 1.0 3.3 5.3 5.8 5.2 4.6
Difference: 1.3 7.5 0.8 0.0 0.7 1.5 0.0
Bridgewater All Weather Risk Parity 188,122,182$ 5.7% 1.8 8.4 3.5 6.1 6.0 6.5 4.9 Mar-12
T-Bill +4% 0.3 1.0 3.3 5.3 5.8 5.4 5.7
Difference: 1.5 7.4 0.2 0.8 0.2 1.1 -0.8
PanAgora Diversified Risk Multi-Asset Risk Parity 193,739,606$ 5.9% 1.4 8.5 4.8 4.5 6.9 -- 7.9 Apr-16
T-Bill +4% 0.3 1.0 3.3 5.3 5.8 -- 5.4
Difference: 1.1 7.5 1.5 -0.8 1.1 -- 2.5
Liquid Credit Lag2 198,041,541$ 6.0% -12.1 -13.3 -11.2 -8.8 -1.0 0.6 2.0 Oct-06
50% BB High Yield, 50% S&P/LSTA Leveraged Loans 1.1 9.9 -4.2 -1.0 2.7 3.8 5.3
Difference: -13.2 -23.2 -7.0 -7.8 -3.7 -3.2 -3.3
Neuberger Berman Lag Global Credit 81,318,197$ 2.5% -13.3 -13.8 -11.9 -8.9 -- -- -6.4 Feb-19
33% ICE BofA HY Constrained, 33% S&P/LSTA LL, 33% JPM EMBI Glbl Div. -12.5 -13.0 -11.3 -7.7 -- -- -4.9
Difference: -0.8 -0.8 -0.6 -1.2 -- -- -1.5
Stone Harbor Absolute Return Lag Absolute Return 116,723,344$ 3.6% -11.3 -12.5 -10.5 -8.4 -1.0 0.6 1.9 Oct-06
3-Month Libor Total Return 0.1 0.5 1.0 2.4 2.0 1.4 1.5
Difference: -11.4 -13.0 -11.5 -10.8 -3.0 -0.8 0.4
Private Credit Lag2 246,371,755$ 7.5% -0.7 -0.7 -1.2 -0.3 1.6 2.4 3.2
CPI +6% Annual Blend4 -11.9 -12.9 -11.0 -8.0 0.0 2.0 4.9
Difference: 11.2 12.2 9.8 7.7 1.6 0.4 -1.7
BlackRock Direct Lending Lag3 $100,000 Direct Lending 7,526,976$ 0.2% -4.7 --- --- --- --- --- -4.7 May-20
CPI +6% Annual Blend4 -11.9 --- --- --- --- --- -13.1
--- --- --- --- --- --- ---
Mesa West RE Income III Lag3 $45,000 Comm. Mortgage 2,215,038$ 0.1% -1.9 -1.9 -1.7 -1.4 7.2 8.1 5.7 Sep-13
CPI +6% Annual Blend4 0.3 1.9 3.5 7.6 8.2 8.5 8.6
Difference: -2.2 -3.8 -5.2 -9.0 -1.0 -0.4 -2.9
Mesa West RE Income IV Lag3 $75,000 Comm. Mortgage 46,269,892$ 1.4% 2.5 2.5 4.6 9.0 -- -- 7.8 Mar-17
CPI +6% Annual Blend4 0.3 1.9 3.5 7.6 -- -- 8.2
Difference: 2.2 0.6 1.1 1.4 -- -- -0.4
Crestline Opportunity II Lag3 $45,000 Opportunistic 21,763,404$ 0.7% -5.9 -5.9 -7.6 -8.8 -0.6 2.2 4.1 Nov-13
CPI +6% Annual Blend 4 0.3 1.9 3.5 7.6 8.2 8.5 8.6
Difference: -6.2 -7.8 -11.1 -16.4 -8.8 -6.3 -4.5
Davidson Kempner Distr Opp V Lag3 $50,000 Opportunistic -- -- -- --
CPI +6% Annual Blend4 -- -- -- --
Difference: -- -- -- --
Oaktree Lag $50,000 Leveraged Direct 6,402,418$ 0.2% -0.5 -0.5 4.7 15.9 -- -- 5.2 Mar-18
MSCI ACWI +2% Lag -13.3 -20.8 -13.2 -9.0 -- -- -2.5
Difference: 12.8 20.3 17.9 24.9 -- -- 7.7
HPS EU Asset Value II Lag3 Direct Lending 2,853,639$ 0.1% --- --- --- --- --- --- --- Aug-20
CPI +6% Annual Blend 4 --- --- --- --- --- --- ---
Difference: --- --- --- --- --- --- ---
Raven Opportunity II Lag3 $45,000 Direct Lending 14,324,740$ 0.4% 0.4 0.4 -8.2 -4.6 4.8 -0.4 -2.8 Aug-14
CPI +6% Annual Blend4 0.3 1.9 3.5 7.6 8.2 8.5 8.6
Difference: 0.1 -1.5 -11.7 -12.2 -3.4 -8.9 -11.4
Raven Opportunity III Lag3 $50,000 Direct Lending 45,093,443$ 1.4% 0.9 0.9 4.8 8.1 9.3 -- 2.5 Nov-15
CPI +6% Annual Blend 4 0.3 1.9 3.5 7.6 8.2 -- 8.5
Difference: 0.6 -1.0 1.3 0.5 1.1 -- -6.0
Medley Opportunity II Lag3 $50,000 Direct Lending 14,575,951$ 0.4% -6.0 -6.0 -8.6 -18.5 -11.8 -5.3 -0.9 Jul-12
CPI +6% Annual Blend 4 0.3 1.9 3.5 7.6 8.2 8.5 8.7
Difference: -6.3 -7.9 -12.1 -26.1 -20.0 -13.8 -9.6
White Oak Summit Peer Fund Lag3 $50,000 Direct Lending 46,120,942$ 1.4% -1.4 -1.4 0.9 3.9 6.5 -- 7.0 Mar-16
CPI +6% Annual Blend 4 0.3 1.9 3.5 7.6 8.2 -- 8.4
Difference: -1.7 -3.3 -2.6 -3.7 -1.7 -- -1.4
White Oak Yield Spectrum Master V Lag3 $50,000 Direct Lending 39,225,312$ 1.2% 0.3 0.3 --- --- --- -- -7.2 Mar-20
CPI +6% Annual Blend 4 0.3 0.3 --- --- --- -- 2.3
Difference: 0.0 0.0 --- --- --- -- -9.5
Core Private Real Estate Lag 158,620,153$ 4.8%
Principal US5 $25,000 Core Pvt. RE $ 34,249,884 1.0% 0.4 0.4 1.7 4.7 6.9 -- 8.2 Jan-16
NCREIF ODCE Net +1% 0.5 1.5 1.5 5.4 7.2 -- 7.9
Difference: -0.1 -1.1 0.2 -0.7 -0.3 -- 0.3
Prologis Logistics5 $35,000 Core Pvt. RE $ 73,247,960 2.2% 2.2 2.2 6.4 15.6 16.7 16.2 6.0 Oct-07
NCREIF ODCE Net +1% 0.5 1.5 1.5 5.4 7.2 9.1 7.0
Difference: 1.7 0.7 4.9 10.2 9.5 7.1 -1.0
RREEF America II5 $45,000 Core Pvt. RE $ 51,122,308 1.6% 1.0 1.0 2.4 5.6 6.6 -- 7.6 Jul-16
NCREIF ODCE Net +1% 0.5 1.5 1.5 5.4 7.2 -- 6.3
Difference: 0.5 -0.5 0.9 0.2 -0.6 -- 1.31 Returns are preliminary and are finalized during each quarterly reporting cycle. Monthly returns since previous quarter are provided by the managers. Market values are provided by Northern Trust.2 Total class returns are as of 6/30/20 and lagged 1 quarter.3 Manager returns are as of 6/30/20, and lagged 1 quarter.4 9% Annual until 7/1/2018 then CPI +6% Annual thereafter.5 Manager returns are as of 6/30/20, and lagged 1 quarter.
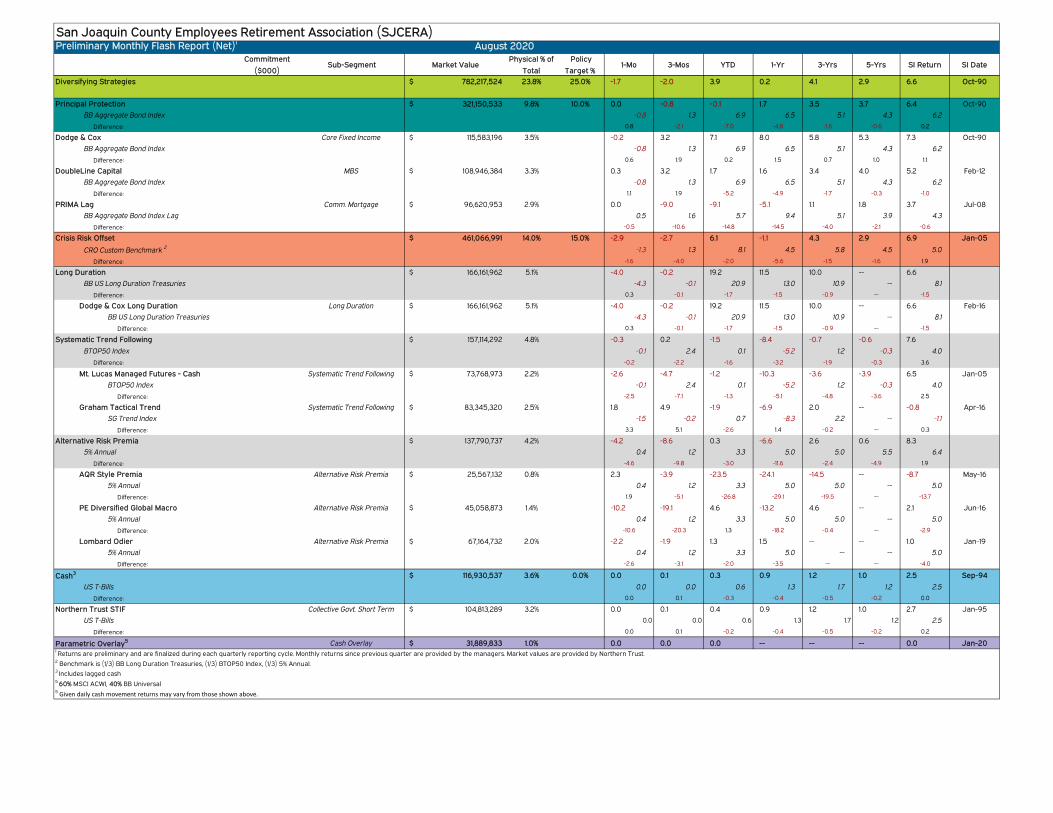
San Joaquin County Employees Retirement Association (SJCERA)Preliminary Monthly Flash Report (Net)1
Commitment
($000)Sub-Segment Market Value
Physical % of
Total
Policy
Target %1-Mo 3-Mos YTD 1-Yr 3-Yrs 5-Yrs SI Return SI Date
August 2020
Diversifying Strategies 782,217,524$ 23.8% 25.0% -1.7 -2.0 3.9 0.2 4.1 2.9 6.6 Oct-90
Principal Protection 321,150,533$ 9.8% 10.0% 0.0 -0.8 -0.1 1.7 3.5 3.7 6.4 Oct-90
BB Aggregate Bond Index -0.8 1.3 6.9 6.5 5.1 4.3 6.2
Difference: 0.8 -2.1 -7.0 -4.8 -1.6 -0.6 0.2
Dodge & Cox Core Fixed Income 115,583,196$ 3.5% -0.2 3.2 7.1 8.0 5.8 5.3 7.3 Oct-90
BB Aggregate Bond Index -0.8 1.3 6.9 6.5 5.1 4.3 6.2
Difference: 0.6 1.9 0.2 1.5 0.7 1.0 1.1
DoubleLine Capital MBS 108,946,384$ 3.3% 0.3 3.2 1.7 1.6 3.4 4.0 5.2 Feb-12
BB Aggregate Bond Index -0.8 1.3 6.9 6.5 5.1 4.3 6.2
Difference: 1.1 1.9 -5.2 -4.9 -1.7 -0.3 -1.0
PRIMA Lag Comm. Mortgage 96,620,953$ 2.9% 0.0 -9.0 -9.1 -5.1 1.1 1.8 3.7 Jul-08
BB Aggregate Bond Index Lag 0.5 1.6 5.7 9.4 5.1 3.9 4.3
Difference: -0.5 -10.6 -14.8 -14.5 -4.0 -2.1 -0.6
Crisis Risk Offset 461,066,991$ 14.0% 15.0% -2.9 -2.7 6.1 -1.1 4.3 2.9 6.9 Jan-05
CRO Custom Benchmark 2 -1.3 1.3 8.1 4.5 5.8 4.5 5.0
Difference: -1.6 -4.0 -2.0 -5.6 -1.5 -1.6 1.9
Long Duration 166,161,962$ 5.1% -4.0 -0.2 19.2 11.5 10.0 -- 6.6
BB US Long Duration Treasuries -4.3 -0.1 20.9 13.0 10.9 -- 8.1
Difference: 0.3 -0.1 -1.7 -1.5 -0.9 -- -1.5
Dodge & Cox Long Duration Long Duration 166,161,962$ 5.1% -4.0 -0.2 19.2 11.5 10.0 -- 6.6 Feb-16
BB US Long Duration Treasuries -4.3 -0.1 20.9 13.0 10.9 -- 8.1
Difference: 0.3 -0.1 -1.7 -1.5 -0.9 -- -1.5
Systematic Trend Following 157,114,292$ 4.8% -0.3 0.2 -1.5 -8.4 -0.7 -0.6 7.6
BTOP50 Index -0.1 2.4 0.1 -5.2 1.2 -0.3 4.0
Difference: -0.2 -2.2 -1.6 -3.2 -1.9 -0.3 3.6
Mt. Lucas Managed Futures - Cash Systematic Trend Following 73,768,973$ 2.2% -2.6 -4.7 -1.2 -10.3 -3.6 -3.9 6.5 Jan-05
BTOP50 Index -0.1 2.4 0.1 -5.2 1.2 -0.3 4.0
Difference: -2.5 -7.1 -1.3 -5.1 -4.8 -3.6 2.5
Graham Tactical Trend Systematic Trend Following 83,345,320$ 2.5% 1.8 4.9 -1.9 -6.9 2.0 -- -0.8 Apr-16
SG Trend Index -1.5 -0.2 0.7 -8.3 2.2 -- -1.1
Difference: 3.3 5.1 -2.6 1.4 -0.2 -- 0.3
Alternative Risk Premia 137,790,737$ 4.2% -4.2 -8.6 0.3 -6.6 2.6 0.6 8.3
5% Annual 0.4 1.2 3.3 5.0 5.0 5.5 6.4
Difference: -4.6 -9.8 -3.0 -11.6 -2.4 -4.9 1.9
AQR Style Premia Alternative Risk Premia 25,567,132$ 0.8% 2.3 -3.9 -23.5 -24.1 -14.5 -- -8.7 May-16
5% Annual 0.4 1.2 3.3 5.0 5.0 -- 5.0
Difference: 1.9 -5.1 -26.8 -29.1 -19.5 -- -13.7
PE Diversified Global Macro Alternative Risk Premia 45,058,873$ 1.4% -10.2 -19.1 4.6 -13.2 4.6 -- 2.1 Jun-16
5% Annual 0.4 1.2 3.3 5.0 5.0 -- 5.0
Difference: -10.6 -20.3 1.3 -18.2 -0.4 -- -2.9
Lombard Odier Alternative Risk Premia 67,164,732$ 2.0% -2.2 -1.9 1.3 1.5 -- -- 1.0 Jan-19
5% Annual 0.4 1.2 3.3 5.0 -- -- 5.0
Difference: -2.6 -3.1 -2.0 -3.5 -- -- -4.0
Cash3 116,930,537$ 3.6% 0.0% 0.0 0.1 0.3 0.9 1.2 1.0 2.5 Sep-94
US T-Bills 0.0 0.0 0.6 1.3 1.7 1.2 2.5
Difference: 0.0 0.1 -0.3 -0.4 -0.5 -0.2 0.0
Northern Trust STIF Collective Govt. Short Term 104,813,289$ 3.2% 0.0 0.1 0.4 0.9 1.2 1.0 2.7 Jan-95
US T-Bills 0.0 0.0 0.6 1.3 1.7 1.2 2.5
Difference: 0.0 0.1 -0.2 -0.4 -0.5 -0.2 0.2
Parametric Overlay5 Cash Overlay 31,889,833$ 1.0% 0.0 0.0 0.0 -- -- -- 0.0 Jan-20
3 Includes lagged cash5 60% MSCI ACWI, 40% BB Universal5 Given daily cash movement returns may vary from those shown above.
1 Returns are preliminary and are finalized during each quarterly reporting cycle. Monthly returns since previous quarter are provided by the managers. Market values are provided by Northern Trust. 2 Benchmark is (1/3) BB Long Duration Treasuries, (1/3) BTOP50 Index, (1/3) 5% Annual.
Capital Markets Outlook & Risk Metrics
Capital Markets Outlook & Risk Metrics
As of August 31, 2020

Capital Markets Outlook & Risk Metrics
Capital Markets Outlook
Takeaways
Q3 is turning out to be a sustained extension of Q2. For the fifth month in a row, equity markets across the
globe produced strong positive returns in August. As a reversal from most of 2020, safe haven assets (e.g.,
US Treasury bonds) declined in value as interest rates ticked up.
While risk-oriented markets have rebounded significantly since the March lows, there has been a high
degree of divergence among regions/styles/capitalizations, and this is exemplified at the extremes with US
large cap growth stocks (e.g., Russell 1000 Growth) outperforming US small cap value stocks (e.g., Russell
2000 Value) by nearly 50% thus far in 2020.
The Federal Reserve introduced a subtle, but very important, change to their inflation policy. The Fed is
now seeking to achieve an average level of inflation (2%) rather than a sustained target. This change
provides the Fed with additional flexibility, as it may now allow inflation to run higher than the target.
Real yields in the US (i.e., TIPs) declined throughout the month of August, and the entire real yield curve is
in meaningfully negative territory.
Although monetary and fiscal policies across the globe remain extremely accommodative, many global
authorities appear to be in a period of observation as they attempt to gauge how the economy does, or
does not, recover in the short term. If the recovery proves insufficient, it is expected that we will experience
a continuation of the until recently unprecedented policies to combat a sustained economic downturn.
Page 2 of 33
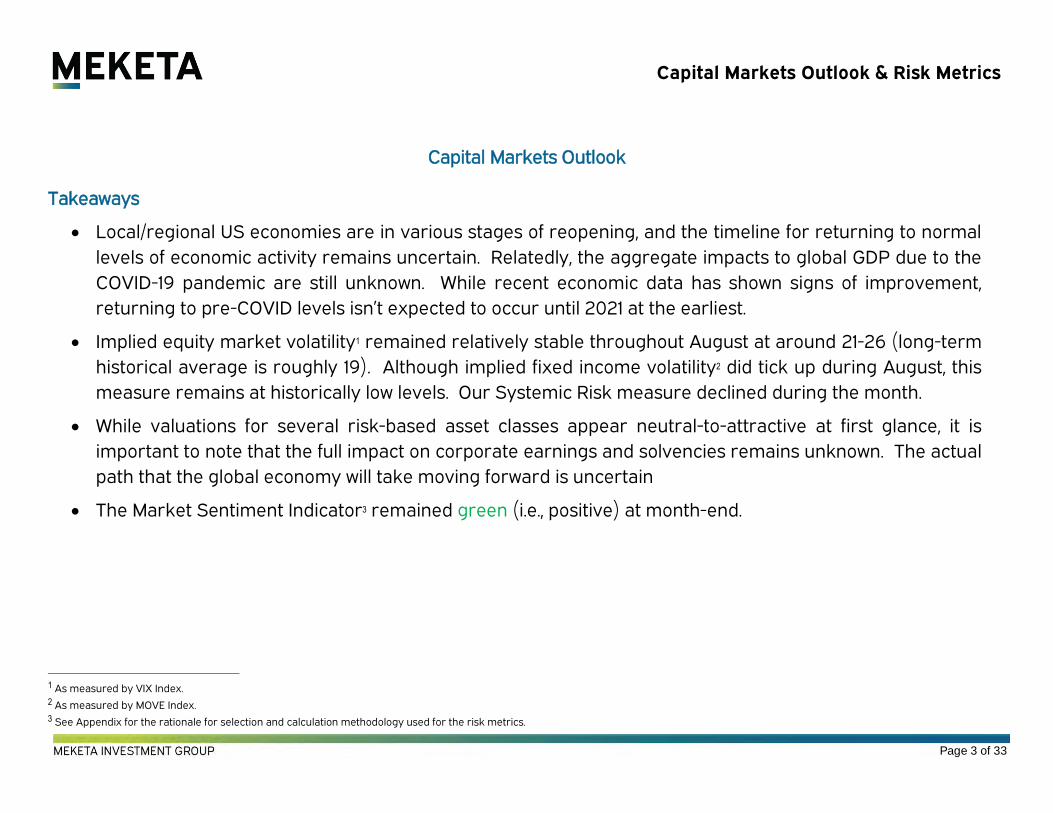
Capital Markets Outlook & Risk Metrics
Capital Markets Outlook
Takeaways
Local/regional US economies are in various stages of reopening, and the timeline for returning to normal
levels of economic activity remains uncertain. Relatedly, the aggregate impacts to global GDP due to the
COVID-19 pandemic are still unknown. While recent economic data has shown signs of improvement,
returning to pre-COVID levels isn’t expected to occur until 2021 at the earliest.
Implied equity market volatility1 remained relatively stable throughout August at around 21-26 (long-term
historical average is roughly 19). Although implied fixed income volatility2 did tick up during August, this
measure remains at historically low levels. Our Systemic Risk measure declined during the month.
While valuations for several risk-based asset classes appear neutral-to-attractive at first glance, it is
important to note that the full impact on corporate earnings and solvencies remains unknown. The actual
path that the global economy will take moving forward is uncertain
The Market Sentiment Indicator3 remained green (i.e., positive) at month-end.
1 As measured by VIX Index. 2 As measured by MOVE Index. 3 See Appendix for the rationale for selection and calculation methodology used for the risk metrics.
Page 3 of 33
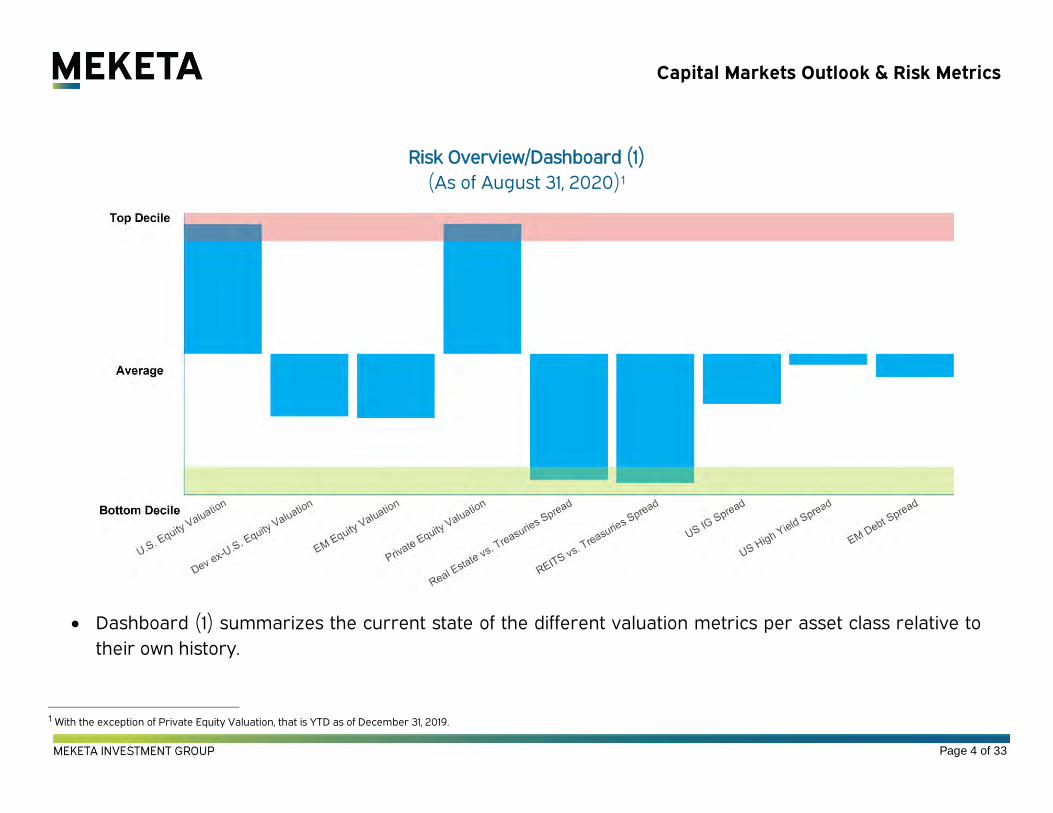
Capital Markets Outlook & Risk Metrics
Risk Overview/Dashboard (1)
(As of August 31, 2020)1
Dashboard (1) summarizes the current state of the different valuation metrics per asset class relative to
their own history.
1 With the exception of Private Equity Valuation, that is YTD as of December 31, 2019.
Page 4 of 33
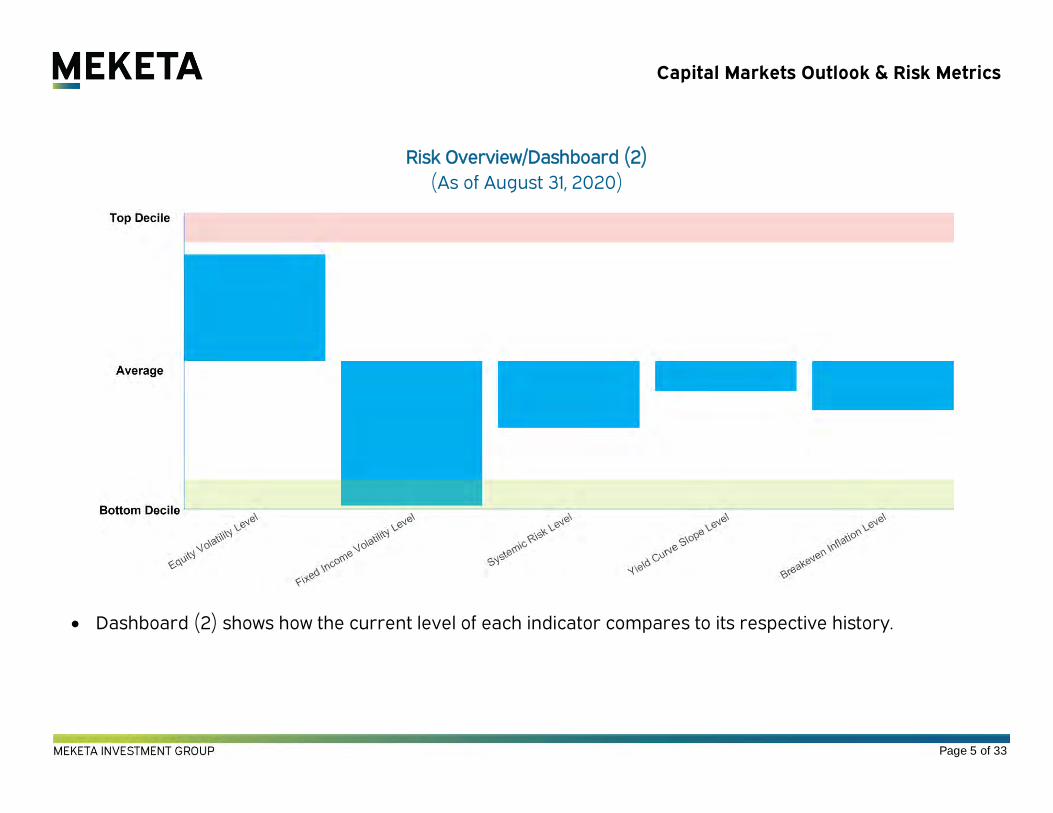
Capital Markets Outlook & Risk Metrics
Risk Overview/Dashboard (2)
(As of August 31, 2020)
Dashboard (2) shows how the current level of each indicator compares to its respective history.
Page 5 of 33

Capital Markets Outlook & Risk Metrics
Market Sentiment Indicator (All History)
(As of August 31, 2020)
Page 6 of 33
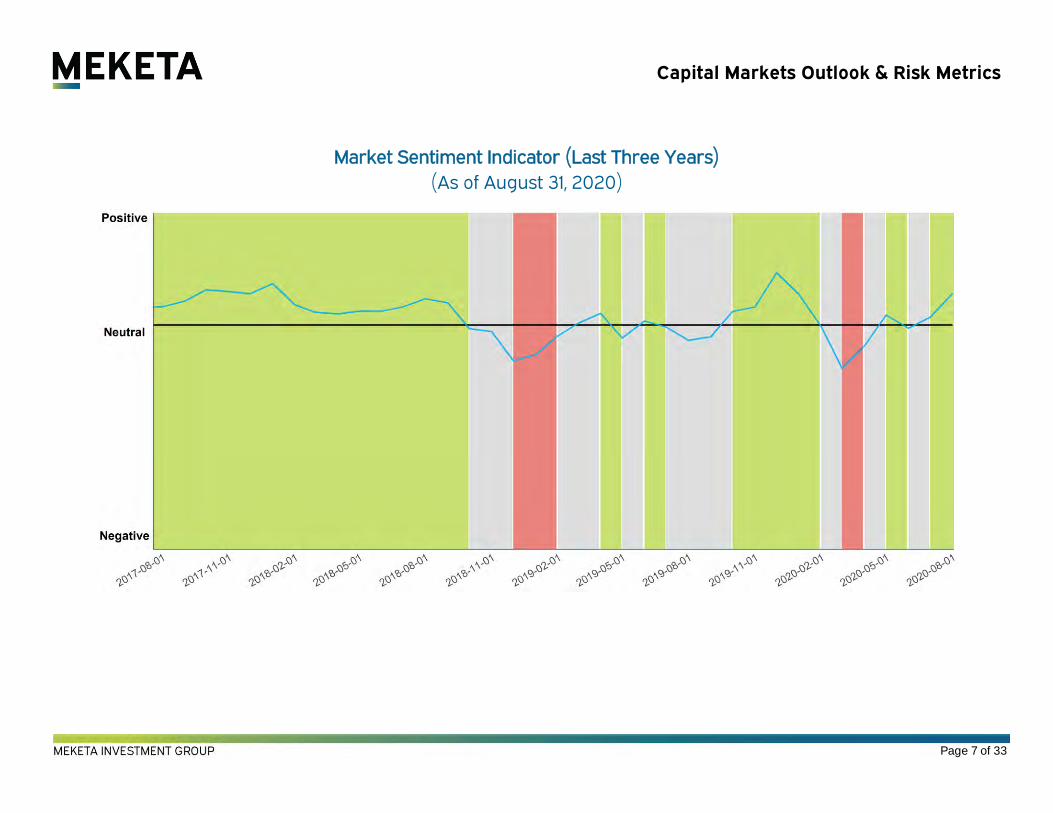
Capital Markets Outlook & Risk Metrics
Market Sentiment Indicator (Last Three Years)
(As of August 31, 2020)
Page 7 of 33
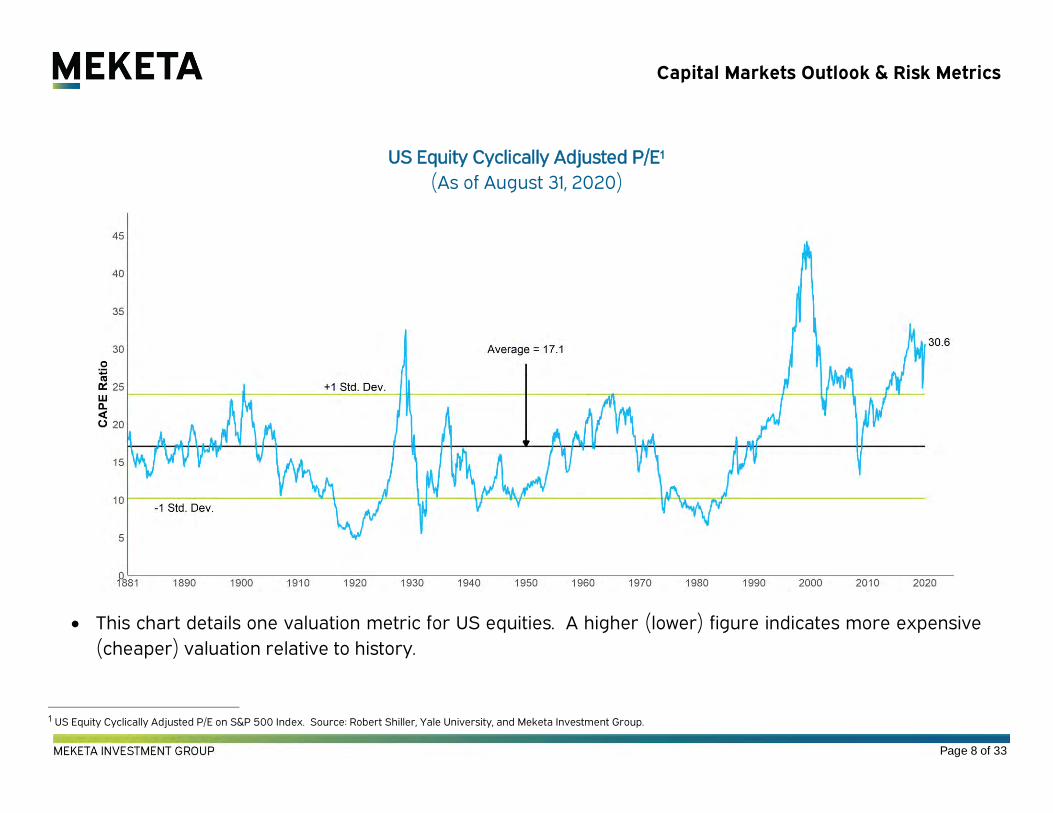
Capital Markets Outlook & Risk Metrics
US Equity Cyclically Adjusted P/E1
(As of August 31, 2020)
This chart details one valuation metric for US equities. A higher (lower) figure indicates more expensive
(cheaper) valuation relative to history.
1 US Equity Cyclically Adjusted P/E on S&P 500 Index. Source: Robert Shiller, Yale University, and Meketa Investment Group.
Page 8 of 33

Capital Markets Outlook & Risk Metrics
Small Cap P/E vs. Large Cap P/E1
(As of August 31, 2020)
This chart compares the relative attractiveness of small cap US equities vs. large cap US equities on a
valuation basis. A higher (lower) figure indicates that large cap (small cap) is more attractive.
1 Small Cap P/E (Russell 2000 Index) vs. Large Cap P/E (Russell 1000 Index) - Source: Russell Investments. Earnings figures represent 12-month “as reported” earnings.
Page 9 of 33
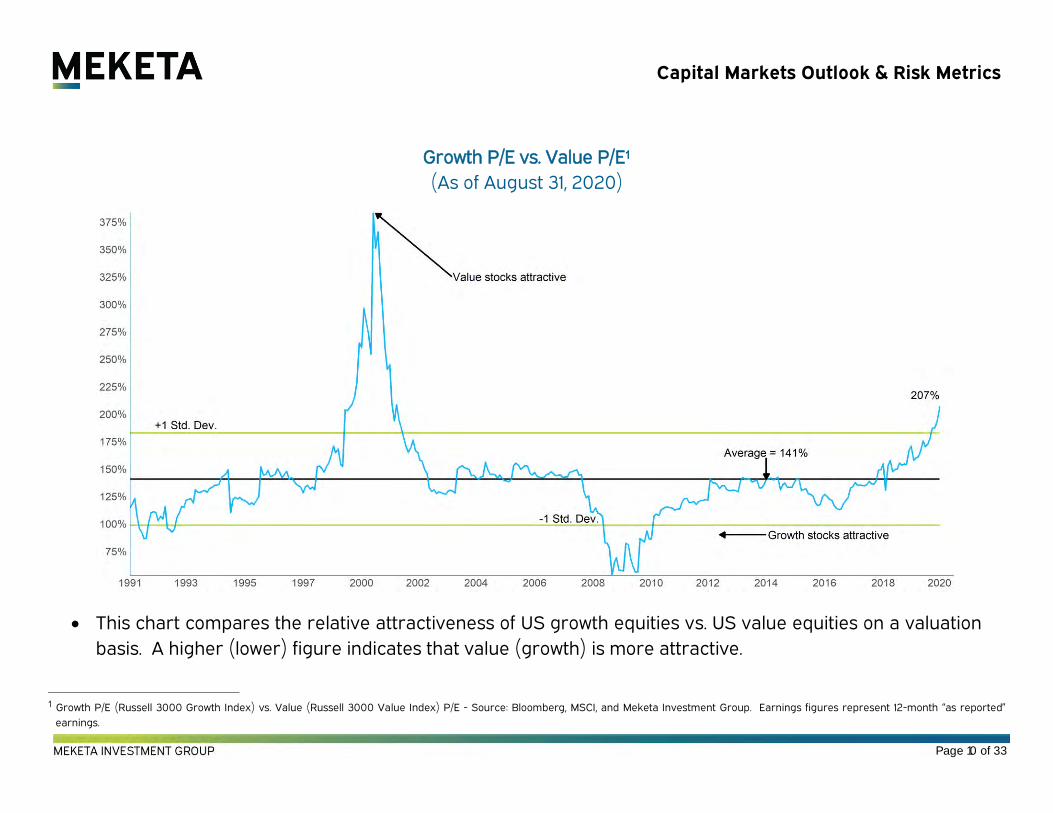
Capital Markets Outlook & Risk Metrics
Growth P/E vs. Value P/E1
(As of August 31, 2020)
This chart compares the relative attractiveness of US growth equities vs. US value equities on a valuation
basis. A higher (lower) figure indicates that value (growth) is more attractive.
1 Growth P/E (Russell 3000 Growth Index) vs. Value (Russell 3000 Value Index) P/E - Source: Bloomberg, MSCI, and Meketa Investment Group. Earnings figures represent 12-month “as reported”
earnings.
Page 10 of 33
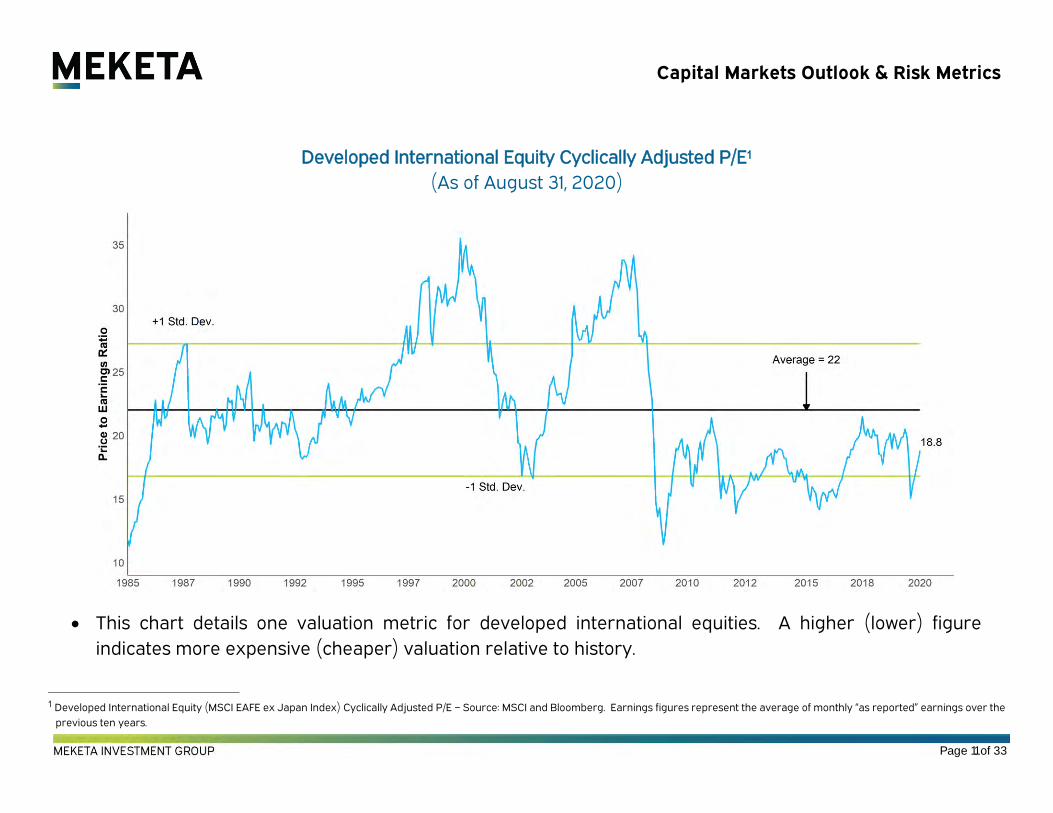
Capital Markets Outlook & Risk Metrics
Developed International Equity Cyclically Adjusted P/E1
(As of August 31, 2020)
This chart details one valuation metric for developed international equities. A higher (lower) figure
indicates more expensive (cheaper) valuation relative to history.
1 Developed International Equity (MSCI EAFE ex Japan Index) Cyclically Adjusted P/E – Source: MSCI and Bloomberg. Earnings figures represent the average of monthly “as reported” earnings over the
previous ten years.
Page 11 of 33
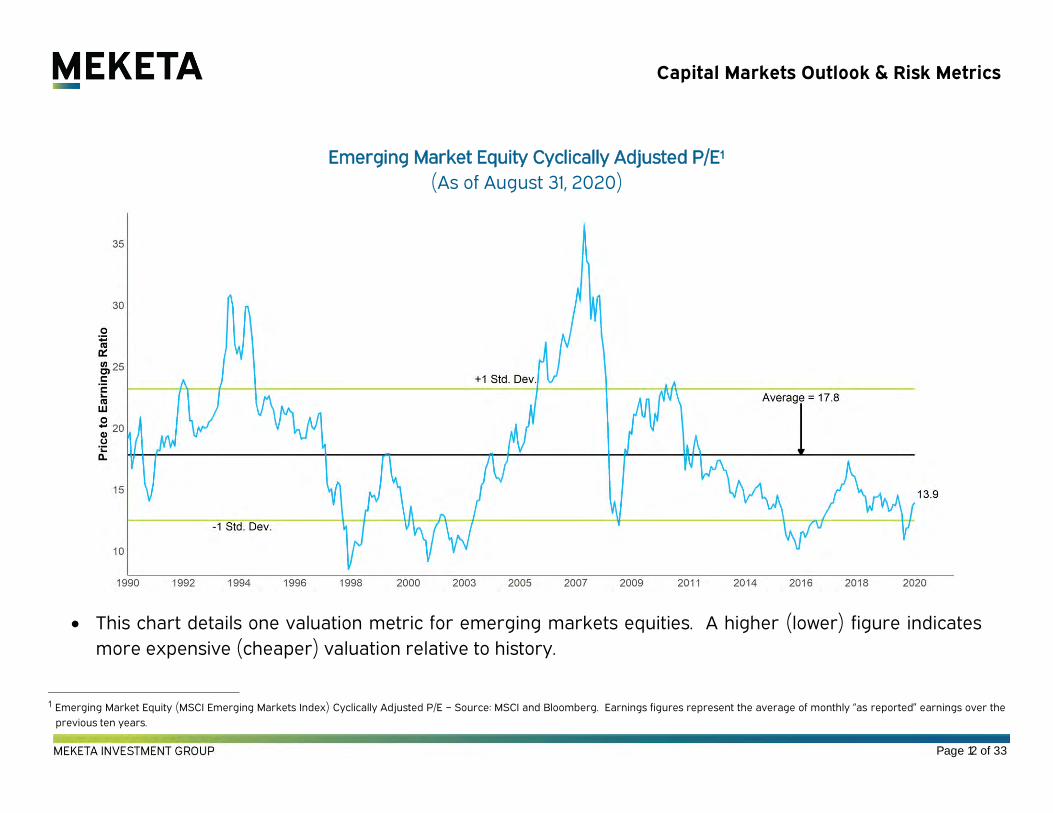
Capital Markets Outlook & Risk Metrics
Emerging Market Equity Cyclically Adjusted P/E1
(As of August 31, 2020)
This chart details one valuation metric for emerging markets equities. A higher (lower) figure indicates
more expensive (cheaper) valuation relative to history.
1 Emerging Market Equity (MSCI Emerging Markets Index) Cyclically Adjusted P/E – Source: MSCI and Bloomberg. Earnings figures represent the average of monthly “as reported” earnings over the
previous ten years.
Page 12 of 33
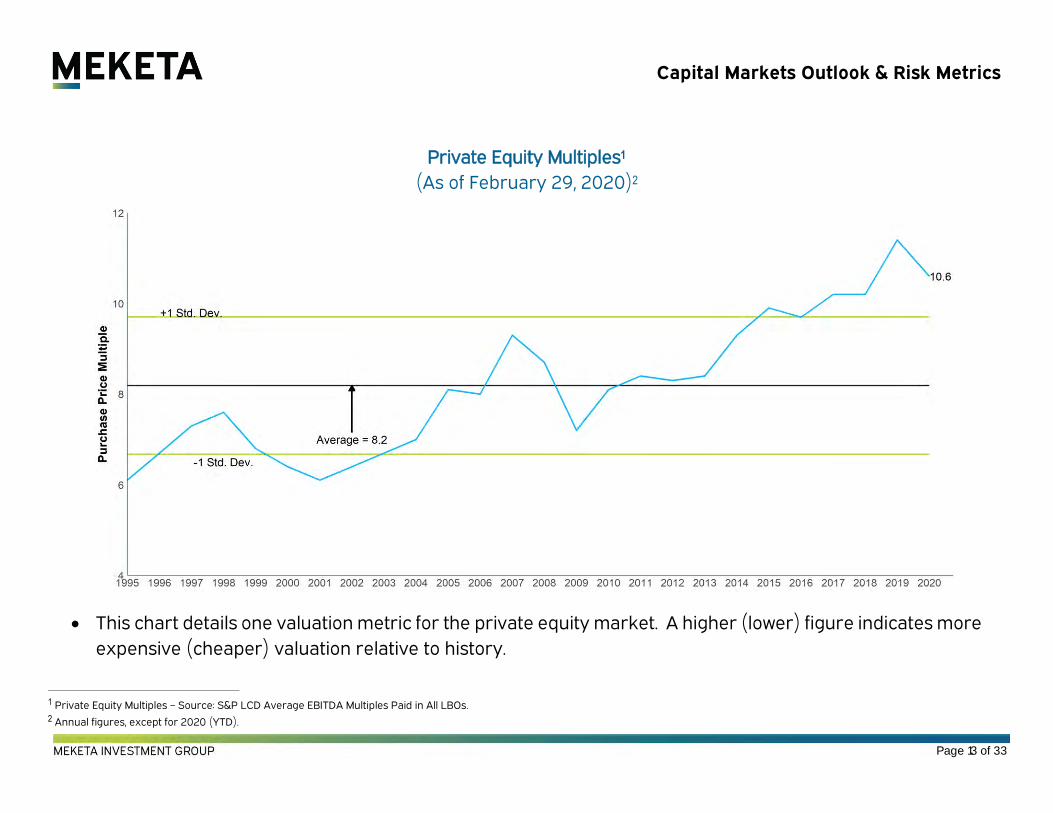
Capital Markets Outlook & Risk Metrics
Private Equity Multiples1
(As of February 29, 2020)2
This chart details one valuation metric for the private equity market. A higher (lower) figure indicates more
expensive (cheaper) valuation relative to history.
1 Private Equity Multiples – Source: S&P LCD Average EBITDA Multiples Paid in All LBOs. 2 Annual figures, except for 2020 (YTD).
Page 13 of 33
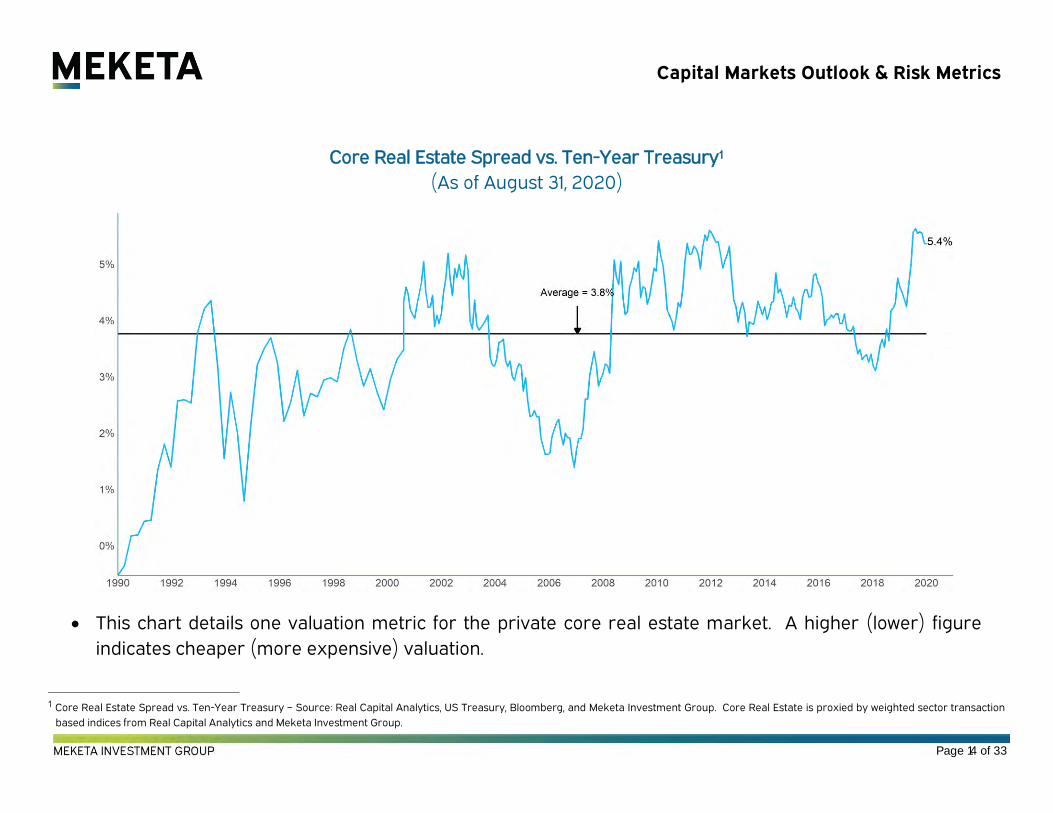
Capital Markets Outlook & Risk Metrics
Core Real Estate Spread vs. Ten-Year Treasury1
(As of August 31, 2020)
This chart details one valuation metric for the private core real estate market. A higher (lower) figure
indicates cheaper (more expensive) valuation.
1 Core Real Estate Spread vs. Ten-Year Treasury – Source: Real Capital Analytics, US Treasury, Bloomberg, and Meketa Investment Group. Core Real Estate is proxied by weighted sector transaction
based indices from Real Capital Analytics and Meketa Investment Group.
Page 14 of 33
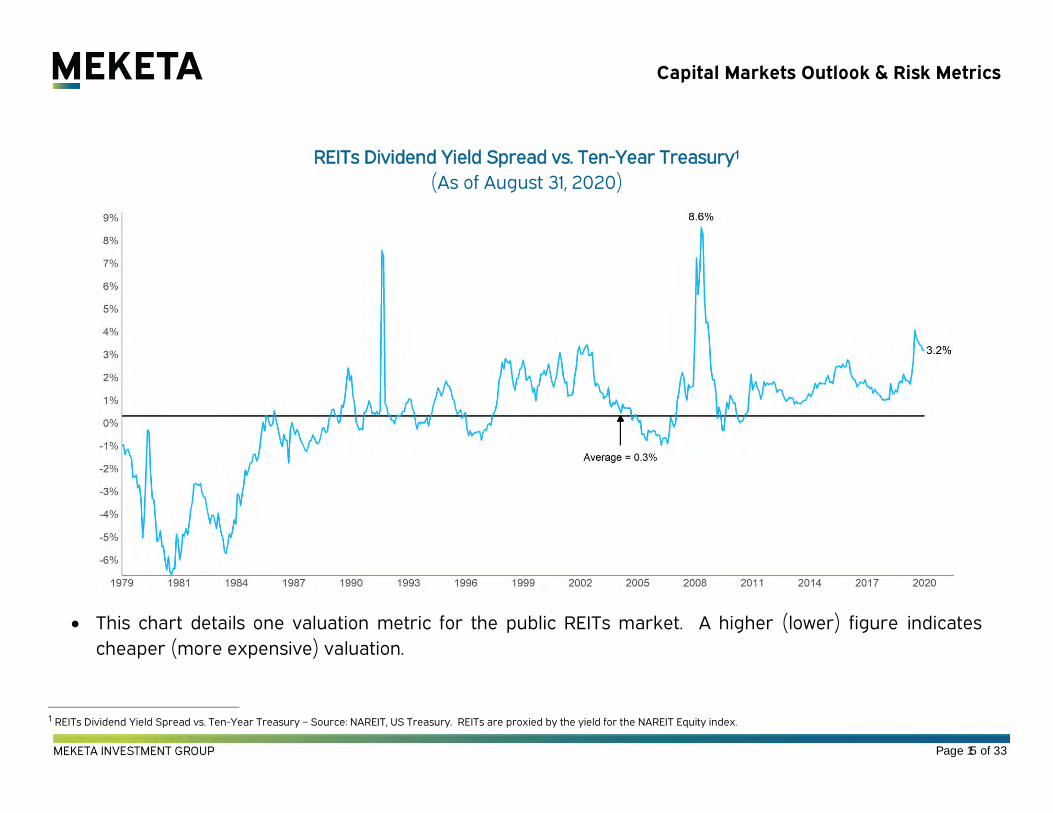
Capital Markets Outlook & Risk Metrics
REITs Dividend Yield Spread vs. Ten-Year Treasury1
(As of August 31, 2020)
This chart details one valuation metric for the public REITs market. A higher (lower) figure indicates
cheaper (more expensive) valuation.
1 REITs Dividend Yield Spread vs. Ten-Year Treasury – Source: NAREIT, US Treasury. REITs are proxied by the yield for the NAREIT Equity index.
Page 15 of 33
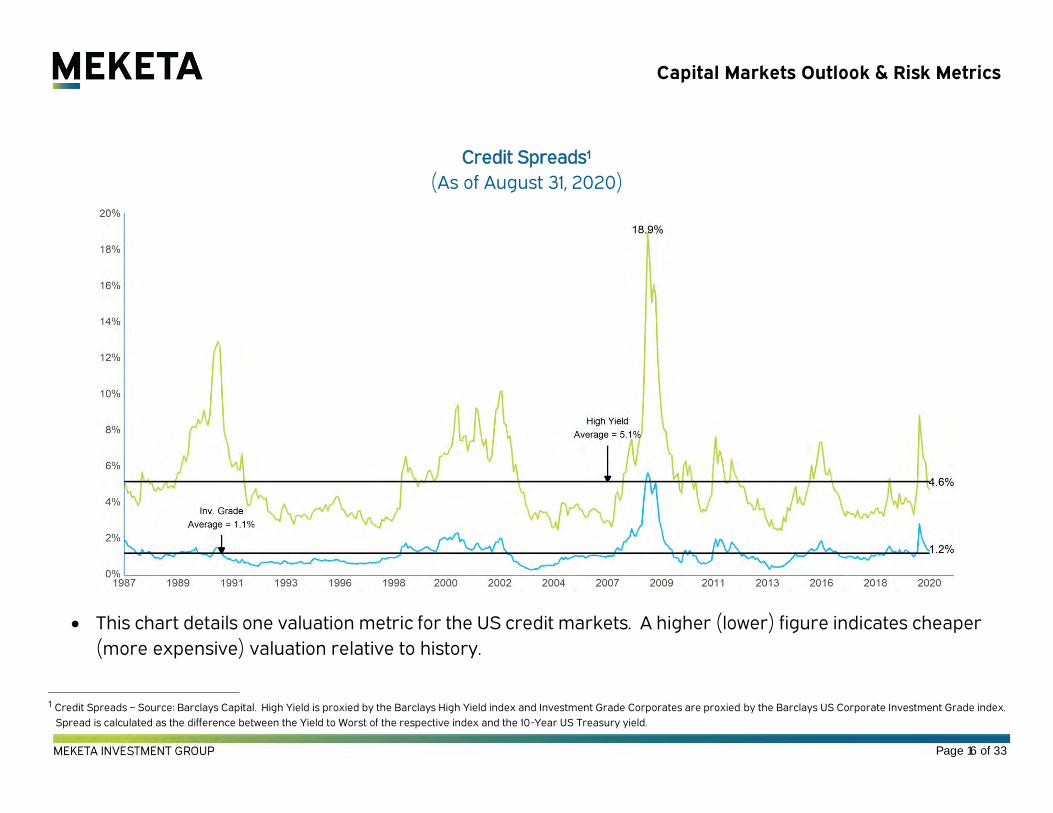
Capital Markets Outlook & Risk Metrics
Credit Spreads1
(As of August 31, 2020)
This chart details one valuation metric for the US credit markets. A higher (lower) figure indicates cheaper
(more expensive) valuation relative to history.
1 Credit Spreads – Source: Barclays Capital. High Yield is proxied by the Barclays High Yield index and Investment Grade Corporates are proxied by the Barclays US Corporate Investment Grade index.
Spread is calculated as the difference between the Yield to Worst of the respective index and the 10-Year US Treasury yield.
Page 16 of 33
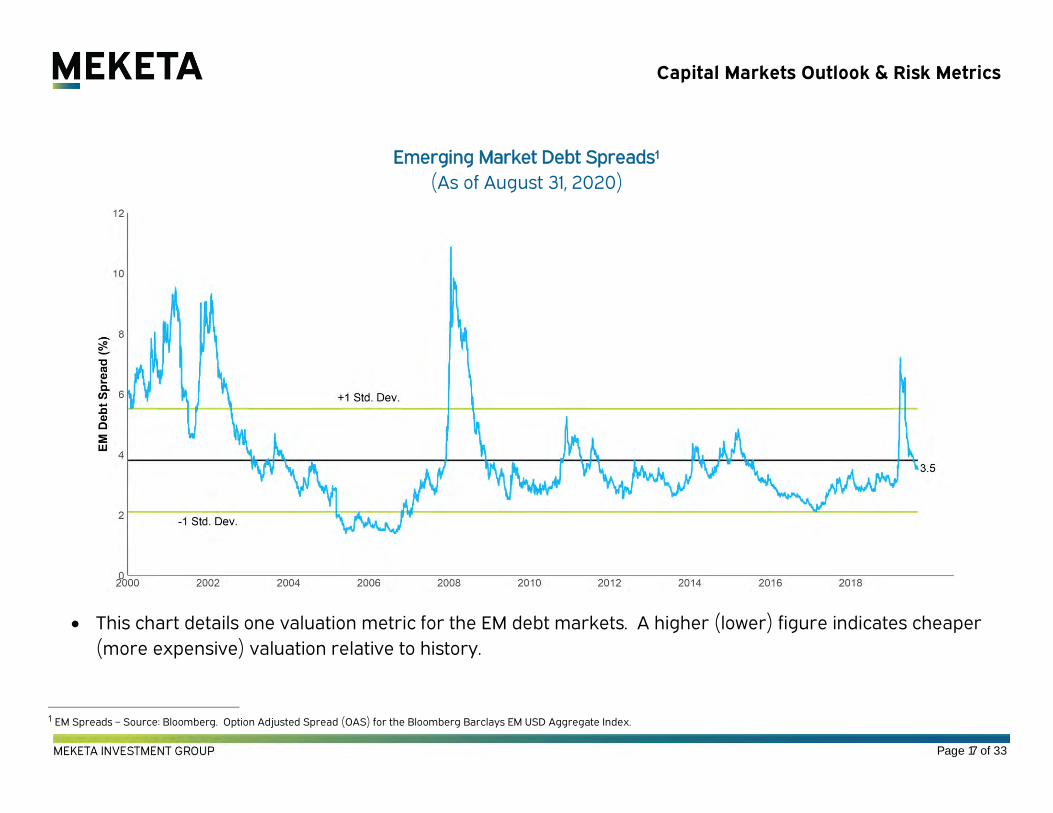
Capital Markets Outlook & Risk Metrics
Emerging Market Debt Spreads1
(As of August 31, 2020)
This chart details one valuation metric for the EM debt markets. A higher (lower) figure indicates cheaper
(more expensive) valuation relative to history.
1 EM Spreads – Source: Bloomberg. Option Adjusted Spread (OAS) for the Bloomberg Barclays EM USD Aggregate Index.
Page 17 of 33
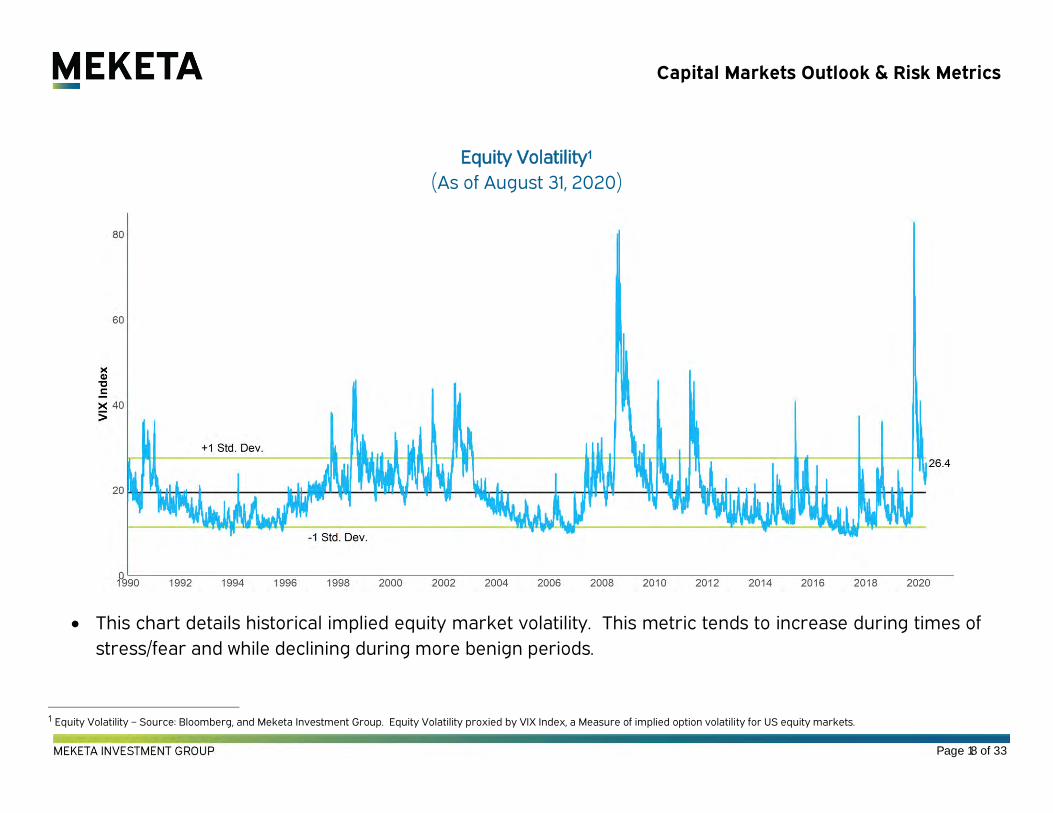
Capital Markets Outlook & Risk Metrics
Equity Volatility1
(As of August 31, 2020)
This chart details historical implied equity market volatility. This metric tends to increase during times of
stress/fear and while declining during more benign periods.
1 Equity Volatility – Source: Bloomberg, and Meketa Investment Group. Equity Volatility proxied by VIX Index, a Measure of implied option volatility for US equity markets.
Page 18 of 33
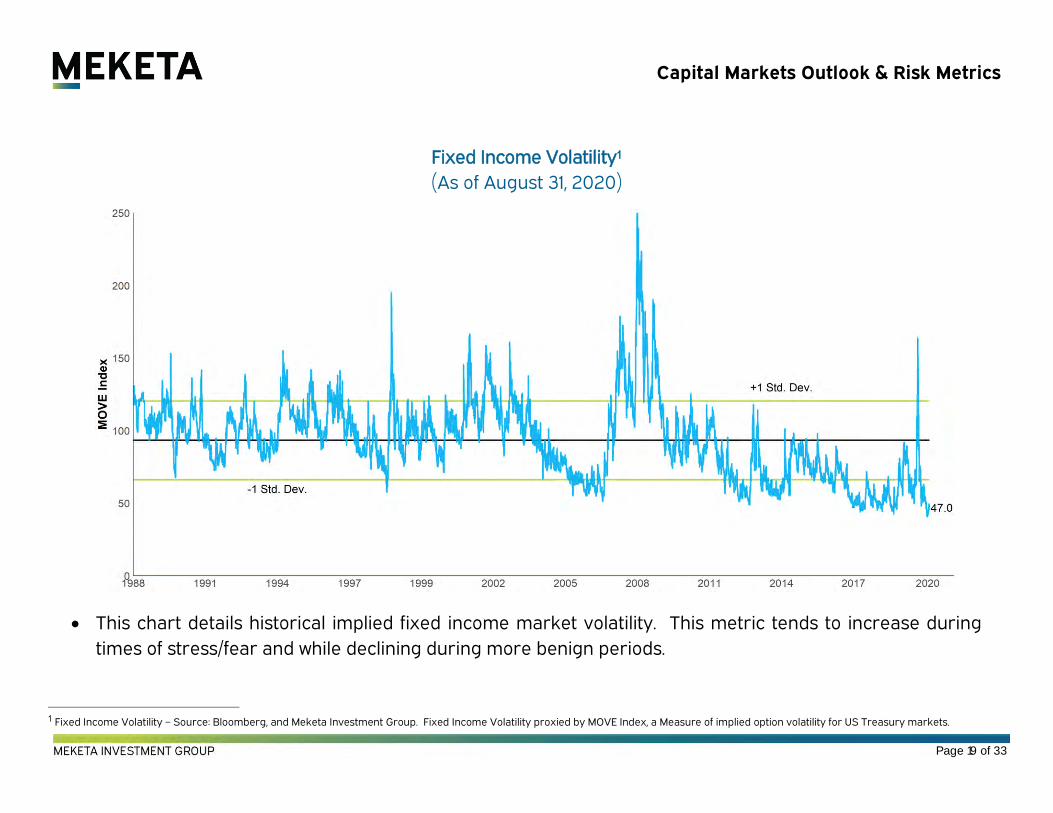
Capital Markets Outlook & Risk Metrics
Fixed Income Volatility1
(As of August 31, 2020)
This chart details historical implied fixed income market volatility. This metric tends to increase during
times of stress/fear and while declining during more benign periods.
1 Fixed Income Volatility – Source: Bloomberg, and Meketa Investment Group. Fixed Income Volatility proxied by MOVE Index, a Measure of implied option volatility for US Treasury markets.
Page 19 of 33
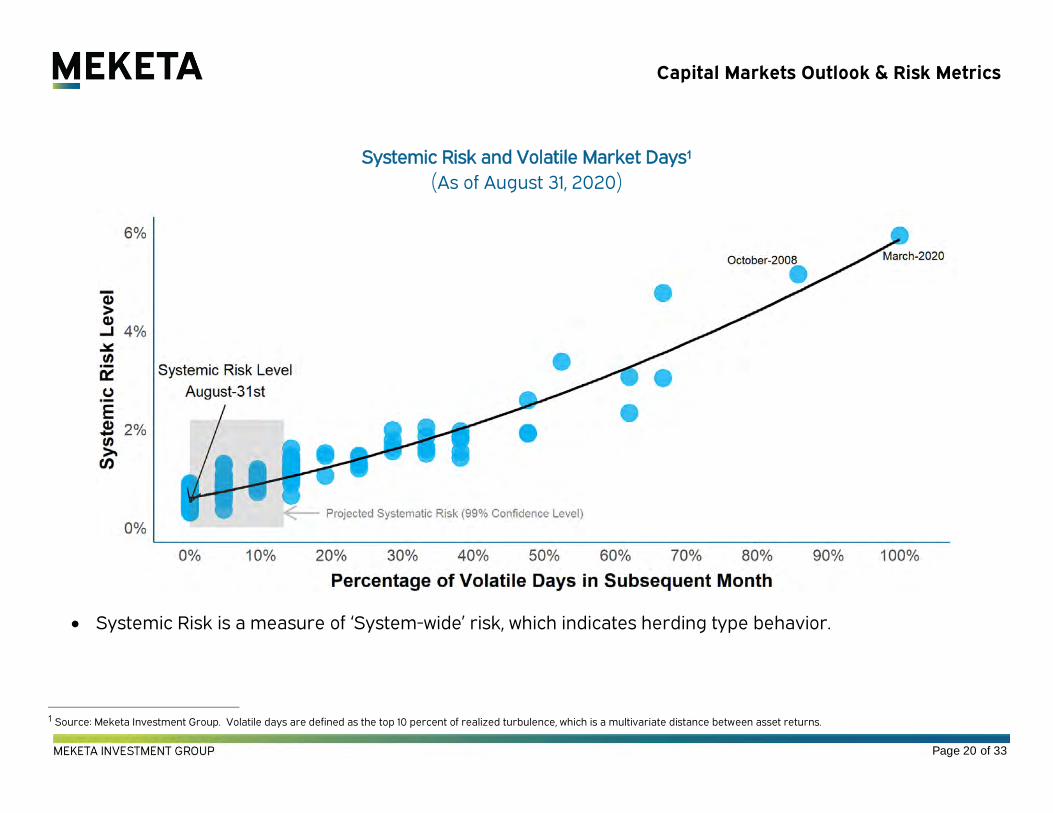
Capital Markets Outlook & Risk Metrics
Systemic Risk and Volatile Market Days1
(As of August 31, 2020)
Systemic Risk is a measure of ‘System-wide’ risk, which indicates herding type behavior.
1 Source: Meketa Investment Group. Volatile days are defined as the top 10 percent of realized turbulence, which is a multivariate distance between asset returns.
Page 20 of 33
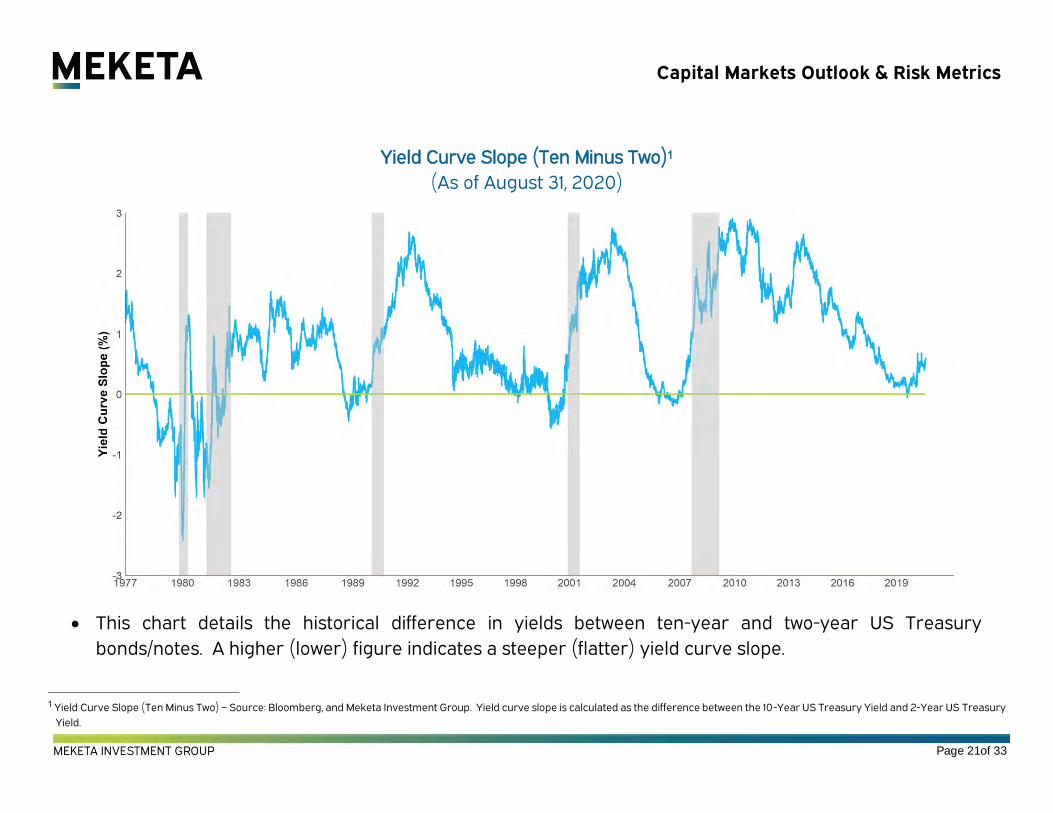
Capital Markets Outlook & Risk Metrics
Yield Curve Slope (Ten Minus Two)1
(As of August 31, 2020)
This chart details the historical difference in yields between ten-year and two-year US Treasury
bonds/notes. A higher (lower) figure indicates a steeper (flatter) yield curve slope.
1 Yield Curve Slope (Ten Minus Two) – Source: Bloomberg, and Meketa Investment Group. Yield curve slope is calculated as the difference between the 10-Year US Treasury Yield and 2-Year US Treasury
Yield.
Page 21 of 33

Capital Markets Outlook & Risk Metrics
Ten-Year Breakeven Inflation1
(As of August 31, 2020)
This chart details the difference between nominal and inflation-adjusted US Treasury bonds. A higher
(lower) figure indicates higher (lower) inflation expectations.
1 Ten-Year Breakeven Inflation – Source: US Treasury and Federal Reserve. Inflation is measured by the Consumer Price Index (CPI-U NSA).
Page 22 of 33
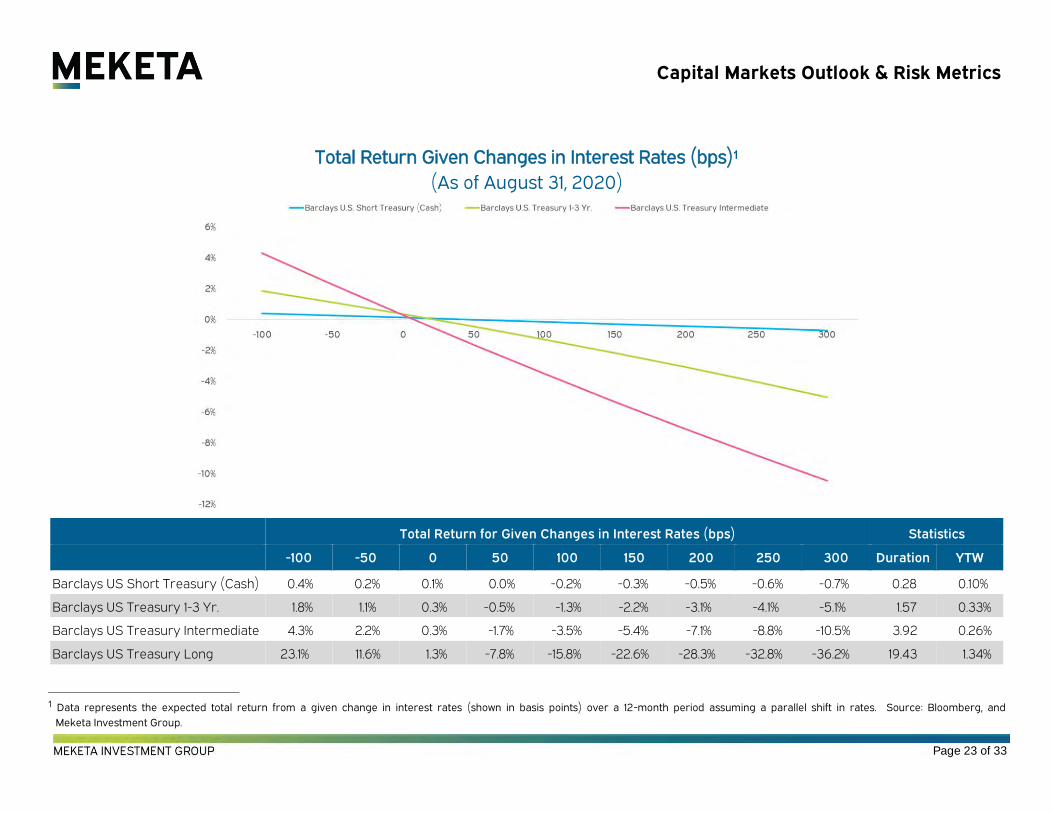
Capital Markets Outlook & Risk Metrics
Total Return Given Changes in Interest Rates (bps)1
(As of August 31, 2020)
Total Return for Given Changes in Interest Rates (bps) Statistics
-100 -50 0 50 100 150 200 250 300 Duration YTW
Barclays US Short Treasury (Cash) 0.4% 0.2% 0.1% 0.0% -0.2% -0.3% -0.5% -0.6% -0.7% 0.28 0.10%
Barclays US Treasury 1-3 Yr. 1.8% 1.1% 0.3% -0.5% -1.3% -2.2% -3.1% -4.1% -5.1% 1.57 0.33%
Barclays US Treasury Intermediate 4.3% 2.2% 0.3% -1.7% -3.5% -5.4% -7.1% -8.8% -10.5% 3.92 0.26%
Barclays US Treasury Long 23.1% 11.6% 1.3% -7.8% -15.8% -22.6% -28.3% -32.8% -36.2% 19.43 1.34%
1 Data represents the expected total return from a given change in interest rates (shown in basis points) over a 12-month period assuming a parallel shift in rates. Source: Bloomberg, and
Meketa Investment Group.
Page 23 of 33

Capital Markets Outlook & Risk Metrics
Long-Term Outlook – 20-Year Annualized Expected Returns1
This chart details Meketa’s long-term forward-looking expectations for total returns across asset classes.
1 Source: Meketa Investment Group’s 2020 Annual Asset Study.
0%
1%
2%
3%
4%
5%
6%
7%
8%
9%
10%20
-yea
r E
xpec
ted
Ret
urn
Page 24 of 33
Capital Markets Outlook & Risk Metrics
Appendix
Data Sources and Explanations1
US Equity Cyclically Adjusted P/E on S&P 500 Index – Source: Robert Shiller and Yale University.
Small Cap P/E (Russell 2000 Index) vs. Large Cap P/E (Russell 1000 Index) - Source: Russell Investments.
Earnings figures represent 12-month “as reported” earnings.
Growth P/E (Russell 3000 Growth Index) vs. Value (Russell 3000 Value Index) P/E - Source: Bloomberg,
MSCI, and Meketa Investment Group. Earnings figures represent 12-month “as reported” earnings.
Developed International Equity (MSCI EAFE ex Japan Index) Cyclically Adjusted P/E – Source: MSCI and
Bloomberg. Earnings figures represent the average of monthly “as reported” earnings over the previous
ten years.
Emerging Market Equity (MSCI Emerging Markets Index) Cyclically Adjusted P/E – Source: MSCI and
Bloomberg. Earnings figures represent the average of monthly “as reported” earnings over the previous
ten years.
Private Equity Multiples – Source: S&P LCD Average EBITDA Multiples Paid in All LBOs.
Core Real Estate Spread vs. Ten-Year Treasury – Source: Real Capital Analytics, US Treasury, Bloomberg,
and Meketa Investment Group. Core Real Estate is proxied by weighted sector transaction based indices
from Real Capital Analytics and Meketa Investment Group.
1 All Data as of August 31, 2020 unless otherwise noted.
Page 25 of 33
Capital Markets Outlook & Risk Metrics
Appendix
Data Sources and Explanations1
REITs Dividend Yield Spread vs. Ten-Year Treasury – Source: NAREIT, US Treasury. REITs are proxied by
the yield for the NAREIT Equity index.
Credit Spreads – Source: Barclays Capital. High Yield is proxied by the Barclays High Yield index and
Investment Grade Corporates are proxied by the Barclays US Corporate Investment Grade index.
Spread is calculated as the difference between the Yield to Worst of the respective index and the
10-Year Treasury Yield.
EM Debt Spreads – Source: Bloomberg, and Meketa Investment Group. Option Adjusted Spread (OAS) for
the Bloomberg Barclays EM USD Aggregate Index.
Equity Volatility – Source: Bloomberg, and Meketa Investment Group. Equity Volatility proxied by VIX Index,
a Measure of implied option volatility for US equity markets.
Fixed Income Volatility – Source: Bloomberg, and Meketa Investment Group. Equity Volatility proxied by
MOVE Index, a Measure of implied option volatility for US Treasury markets.
Systemic Risk and Volatile Market Days – Source: Meketa Investment Group. Volatile days are defined as
the top 10 percent of realized turbulence, which is a multivariate distance between asset returns.
Systemic Risk, which measures risk across markets, is important because the more contagion of risk that
exists between assets, the more likely it is that markets will experience volatile periods.
1 All Data as of August 31, 2020 unless otherwise noted.
Page 26 of 33
Capital Markets Outlook & Risk Metrics
Appendix
Data Sources and Explanations1
Yield Curve Slope (Ten Minus Two) – Source: Bloomberg, and Meketa Investment Group. Yield curve slope
is calculated as the difference between the 10-Year US Treasury Yield and 2-Year US Treasury Yield.
Ten-Year Breakeven Inflation – Source: US Treasury and Federal Reserve. Inflation is measured by the
Consumer Price Index (CPI-U NSA).
1 All Data as of August 31, 2020 unless otherwise noted.
Page 27 of 33
Capital Markets Outlook & Risk Metrics
Meketa Market Sentiment Indicator
Explanation, Construction and Q&A
Page 28 of 33

Capital Markets Outlook & Risk Metrics
Meketa has created the MIG Market Sentiment Indicator (MIG-MSI) to complement our valuation-focused Risk
Metrics. This measure of sentiment is meant to capture significant and persistent shifts in long-lived market trends
of economic growth risk, either towards a risk-seeking trend or a risk-aversion trend.
This appendix explores:
What is the Meketa Market Sentiment Indicator?
How do I read the indicator graph?
How is the Meketa Market Sentiment Indicator constructed?
What do changes in the indicator mean?
Page 29 of 33

Capital Markets Outlook & Risk Metrics
Meketa has created a market sentiment indicator for monthly publication (the MIG-MSI – see below) to complement
Meketa’s Risk Metrics.
Meketa’s Risk Metrics, which rely significantly on standard market measures of relative valuation, often
provide valid early signals of increasing long-term risk levels in the global investment markets. However,
as is the case with numerous valuation measures, the Risk Metrics may convey such risk concerns long
before a market corrections take place. The MIG-MSI helps to address this early-warning bias by
measuring whether the markets are beginning to acknowledge key Risk Metrics trends, and / or indicating
non-valuation based concerns. Once the MIG-MSI indicates that the market sentiment has shifted, it is our
belief that investors should consider significant action, particularly if confirmed by the Risk Metrics.
Importantly, Meketa believes the Risk Metrics and MIG-MSI should always be used in conjunction with one
another and never in isolation. The questions and answers below highlight and discuss the basic
underpinnings of the Meketa MIG-MSI:
What is the Meketa Market Sentiment Indicator (MIG-MSI)?
The MIG-MSI is a measure meant to gauge the market’s sentiment regarding economic growth risk. Growth
risk cuts across most financial assets, and is the largest risk exposure that most portfolios bear. The
MIG-MSI takes into account the momentum (trend over time, positive or negative) of the economic growth
risk exposure of publicly traded stocks and bonds, as a signal of the future direction of growth risk returns;
either positive (risk seeking market sentiment), or negative (risk averse market sentiment).
Page 30 of 33
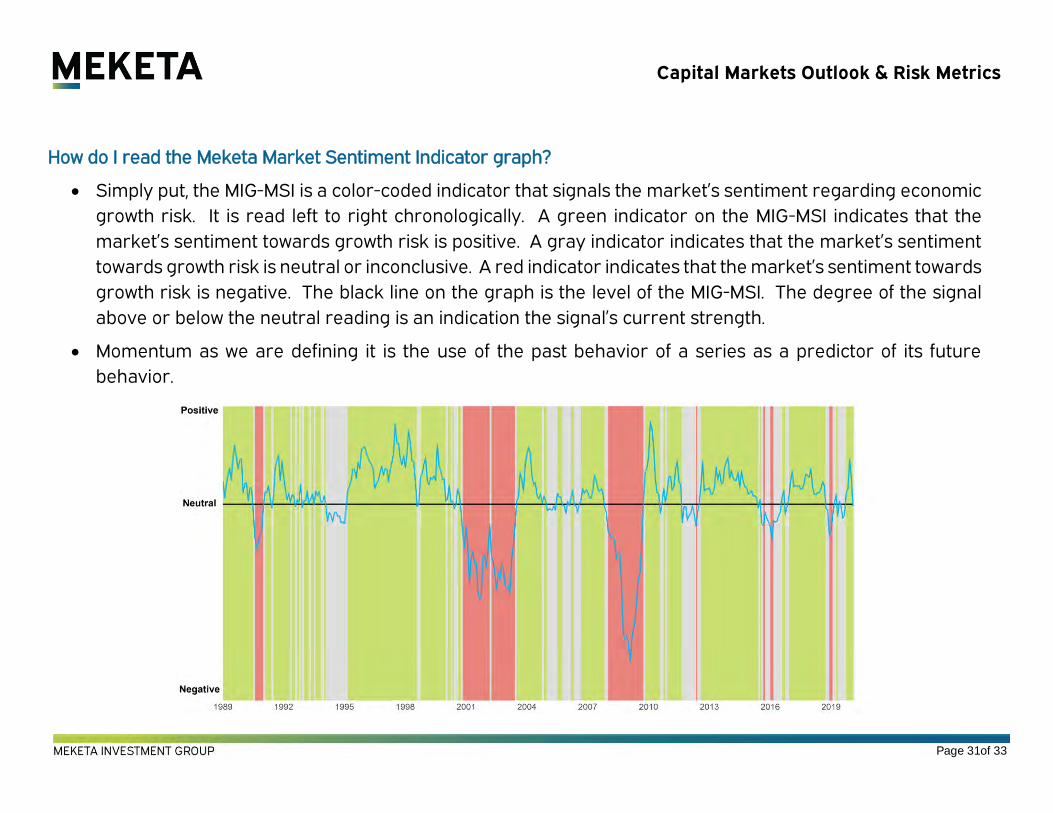
Capital Markets Outlook & Risk Metrics
How do I read the Meketa Market Sentiment Indicator graph?
Simply put, the MIG-MSI is a color-coded indicator that signals the market’s sentiment regarding economic
growth risk. It is read left to right chronologically. A green indicator on the MIG-MSI indicates that the
market’s sentiment towards growth risk is positive. A gray indicator indicates that the market’s sentiment
towards growth risk is neutral or inconclusive. A red indicator indicates that the market’s sentiment towards
growth risk is negative. The black line on the graph is the level of the MIG-MSI. The degree of the signal
above or below the neutral reading is an indication the signal’s current strength.
Momentum as we are defining it is the use of the past behavior of a series as a predictor of its future
behavior.
Page 31 of 33
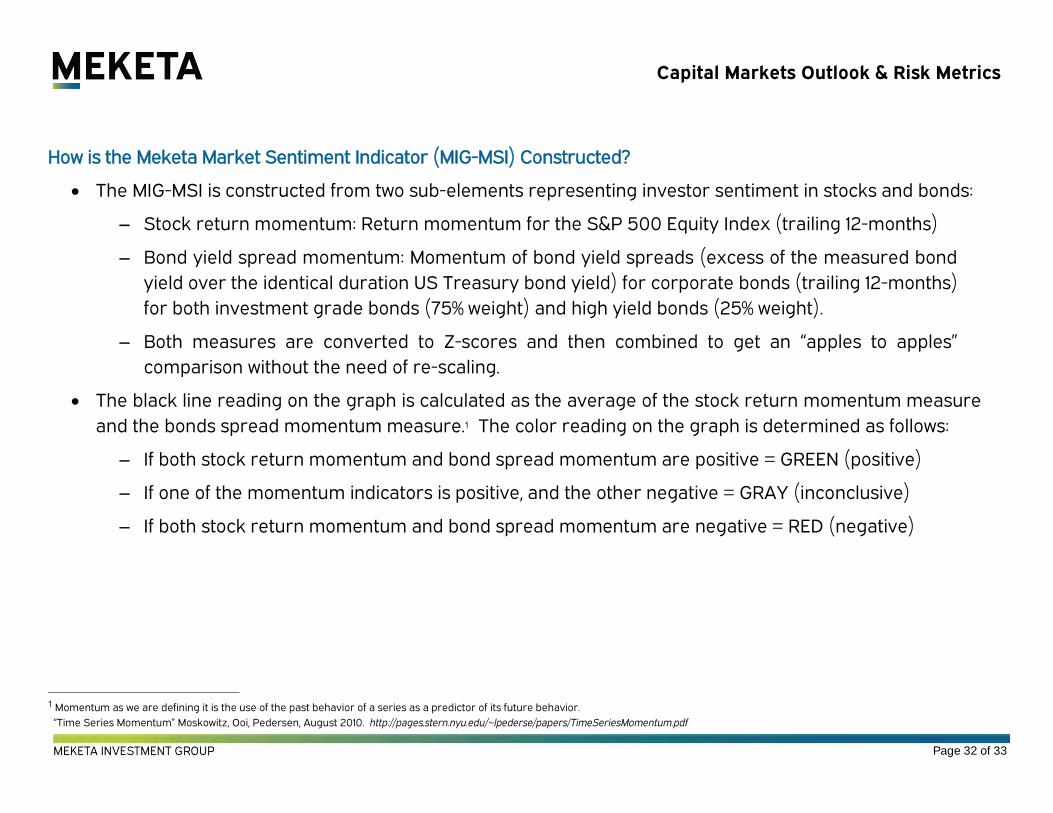
Capital Markets Outlook & Risk Metrics
How is the Meketa Market Sentiment Indicator (MIG-MSI) Constructed?
The MIG-MSI is constructed from two sub-elements representing investor sentiment in stocks and bonds:
Stock return momentum: Return momentum for the S&P 500 Equity Index (trailing 12-months)
Bond yield spread momentum: Momentum of bond yield spreads (excess of the measured bond
yield over the identical duration US Treasury bond yield) for corporate bonds (trailing 12-months)
for both investment grade bonds (75% weight) and high yield bonds (25% weight).
Both measures are converted to Z-scores and then combined to get an “apples to apples”
comparison without the need of re-scaling.
The black line reading on the graph is calculated as the average of the stock return momentum measure
and the bonds spread momentum measure.1 The color reading on the graph is determined as follows:
If both stock return momentum and bond spread momentum are positive = GREEN (positive)
If one of the momentum indicators is positive, and the other negative = GRAY (inconclusive)
If both stock return momentum and bond spread momentum are negative = RED (negative)
1 Momentum as we are defining it is the use of the past behavior of a series as a predictor of its future behavior.
“Time Series Momentum” Moskowitz, Ooi, Pedersen, August 2010. http://pages.stern.nyu.edu/~lpederse/papers/TimeSeriesMomentum.pdf
Page 32 of 33

Capital Markets Outlook & Risk Metrics
What does the Meketa Market Sentiment Indicator (MIG-MSI) mean? Why might it be useful?
There is strong evidence that time series momentum is significant and persistent. In particular, across an
extensive array of asset classes, the sign of the trailing 12-month return (positive or negative) is indicative
of future returns (positive or negative) over the next 12-month period. The MIG-MSI is constructed to
measure this momentum in stocks and corporate bond spreads. A reading of green or red is agreement
of both the equity and bond measures, indicating that it is likely that this trend (positive or negative) will
continue over the next 12 months. When the measures disagree, the indicator turns gray. A gray reading
does not necessarily mean a new trend is occurring, as the indicator may move back to green, or into the
red from there. The level of the reading (black line) and the number of months at the red or green reading,
gives the user additional information on which to form an opinion, and potentially take action.
Page 33 of 33
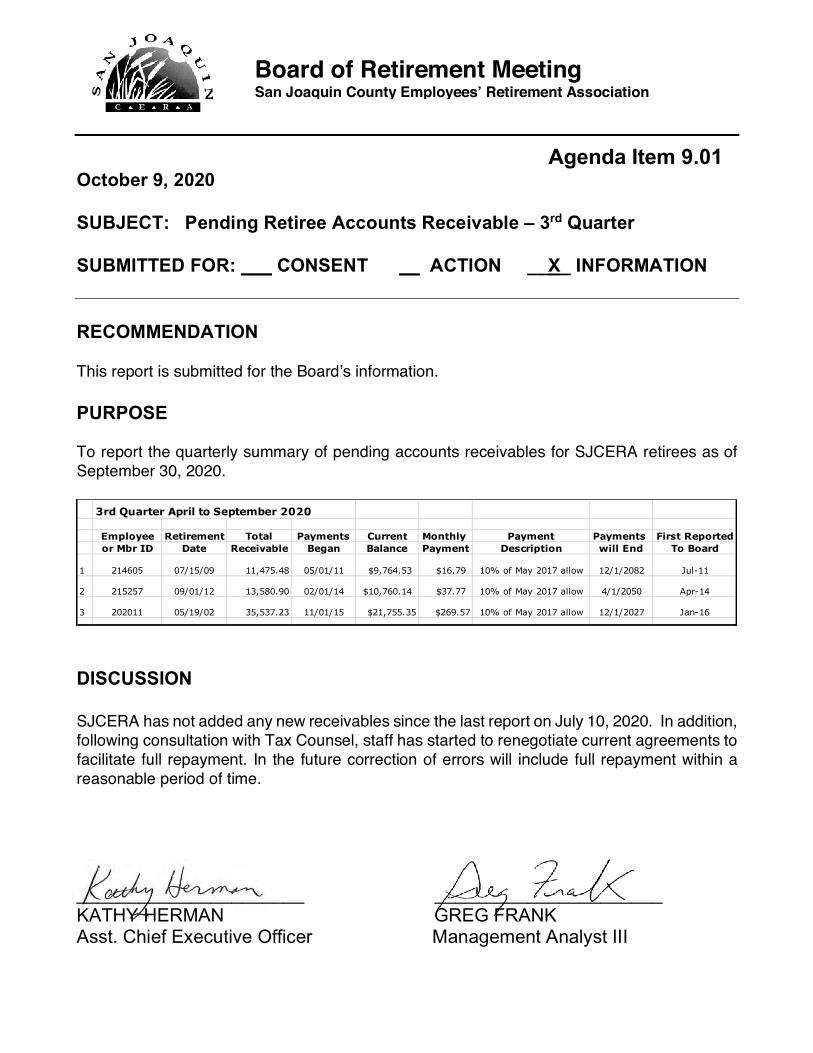
Board of Retirement Meeting San Joaquin County Employees’ Retirement Association
!
Agenda Item 9.01 October 9, 2020
SUBJECT: Pending Retiree Accounts Receivable – 3rd Quarter
SUBMITTED FOR: ___ CONSENT __l ACTION __X_ INFORMATION
RECOMMENDATION
This report is submitted for the Board’s information.
PURPOSE
To report the quarterly summary of pending accounts receivables for SJCERA retirees as of September 30, 2020.
DISCUSSION
SJCERA has not added any new receivables since the last report on July 10, 2020. In addition, following consultation with Tax Counsel, staff has started to renegotiate current agreements to facilitate full repayment. In the future correction of errors will include full repayment within a reasonable period of time.
______________________ ______________________ KATHY HERMAN GREG FRANK Asst. Chief Executive Officer Management Analyst III
3rd Quarter April to September 2020
Employee Retirement Total Payments Current Monthly Payment Payments First Reportedor Mbr ID Date Receivable Began Balance Payment Description will End To Board
1 214605 07/15/09 11,475.48 05/01/11 $9,764.53 $16.79 10% of May 2017 allow 12/1/2082 Jul-11
2 215257 09/01/12 13,580.90 02/01/14 $10,760.14 $37.77 10% of May 2017 allow 4/1/2050 Apr-14
3 202011 05/19/02 35,537.23 11/01/15 $21,755.35 $269.57 10% of May 2017 allow 12/1/2027 Jan-16
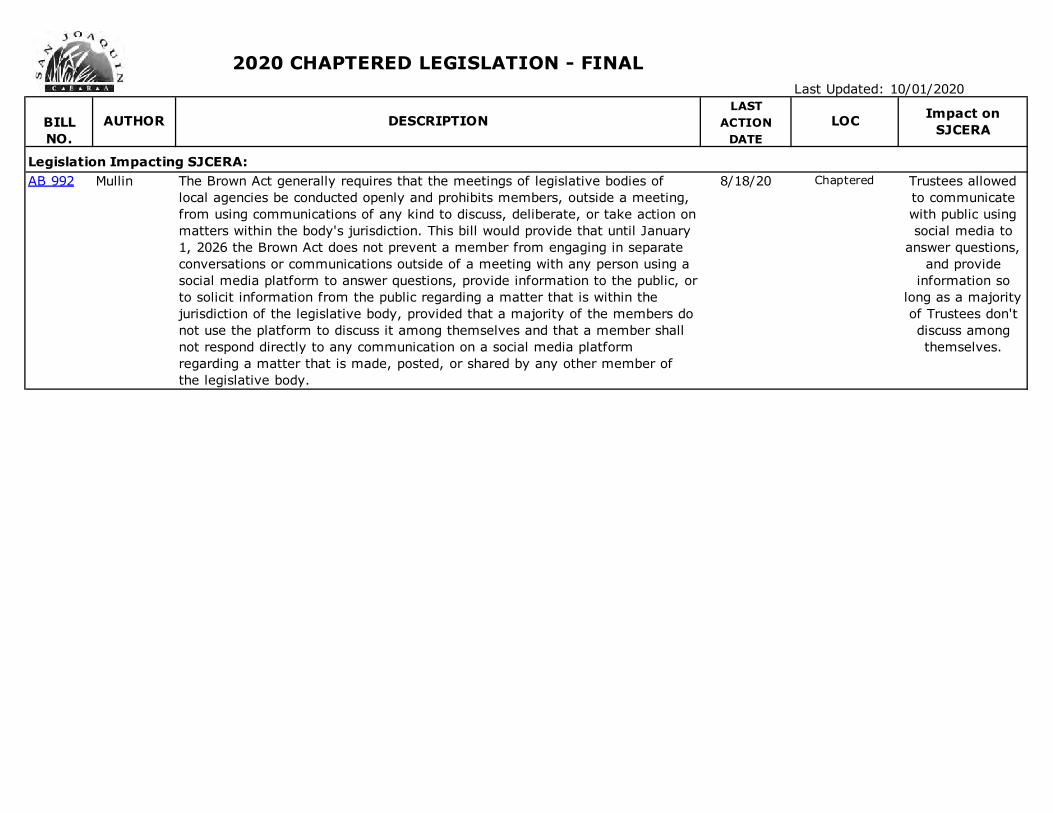
2020 CHAPTERED LEGISLATION - FINALLast Updated: 10/01/2020
LASTBILL ACTIONNO. DATE
Legislation Impacting SJCERA:AB 992 Mullin The Brown Act generally requires that the meetings of legislative bodies of
local agencies be conducted openly and prohibits members, outside a meeting, from using communications of any kind to discuss, deliberate, or take action on matters within the body's jurisdiction. This bill would provide that until January 1, 2026 the Brown Act does not prevent a member from engaging in separate conversations or communications outside of a meeting with any person using a social media platform to answer questions, provide information to the public, or to solicit information from the public regarding a matter that is within the jurisdiction of the legislative body, provided that a majority of the members do not use the platform to discuss it among themselves and that a member shall not respond directly to any communication on a social media platform regarding a matter that is made, posted, or shared by any other member of the legislative body.
8/18/20 Chaptered Trustees allowed to communicate with public using social media to
answer questions, and provide
information so long as a majority of Trustees don't discuss among themselves.
AUTHOR DESCRIPTION LOC Impact on SJCERA
!
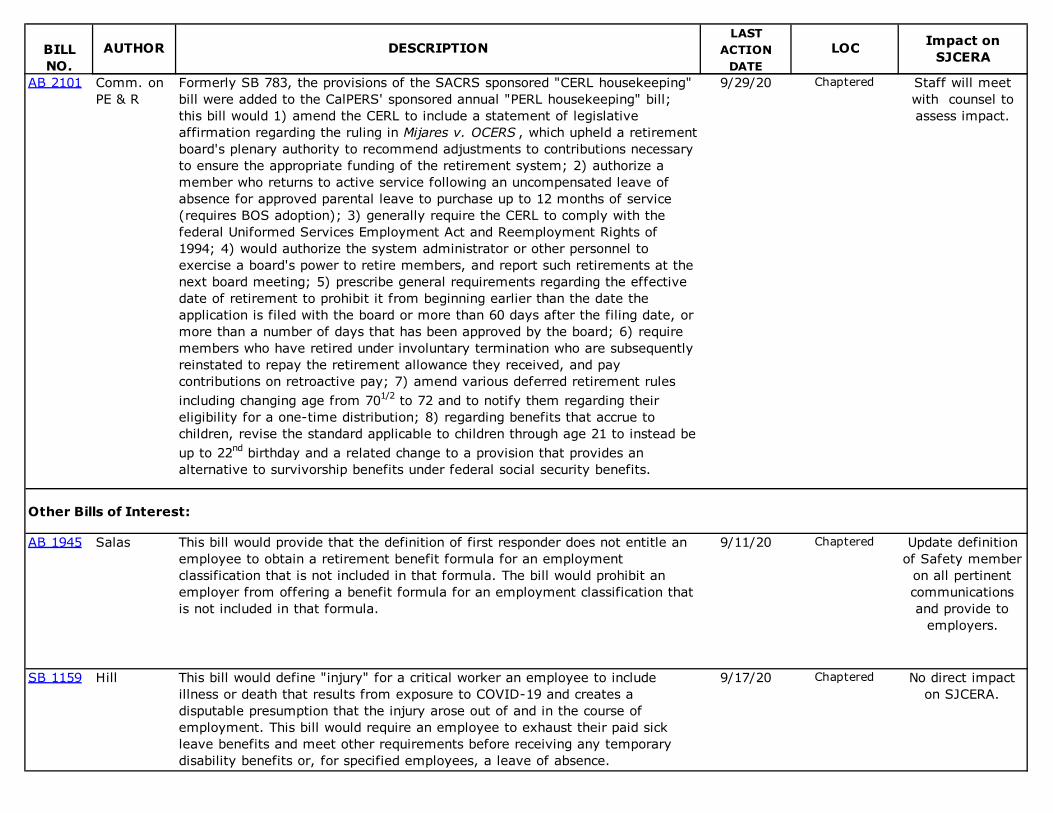
LASTBILL ACTIONNO. DATE
AUTHOR DESCRIPTION LOC Impact on SJCERA
AB 2101 Comm. on PE & R
Formerly SB 783, the provisions of the SACRS sponsored "CERL housekeeping" bill were added to the CalPERS' sponsored annual "PERL housekeeping" bill; this bill would 1) amend the CERL to include a statement of legislative affirmation regarding the ruling in Mijares v. OCERS , which upheld a retirement board's plenary authority to recommend adjustments to contributions necessary to ensure the appropriate funding of the retirement system; 2) authorize a member who returns to active service following an uncompensated leave of absence for approved parental leave to purchase up to 12 months of service (requires BOS adoption); 3) generally require the CERL to comply with the federal Uniformed Services Employment Act and Reemployment Rights of 1994; 4) would authorize the system administrator or other personnel to exercise a board's power to retire members, and report such retirements at the next board meeting; 5) prescribe general requirements regarding the effective date of retirement to prohibit it from beginning earlier than the date the application is filed with the board or more than 60 days after the filing date, or more than a number of days that has been approved by the board; 6) require members who have retired under involuntary termination who are subsequently reinstated to repay the retirement allowance they received, and pay contributions on retroactive pay; 7) amend various deferred retirement rules including changing age from 701/2 to 72 and to notify them regarding their eligibility for a one-time distribution; 8) regarding benefits that accrue to children, revise the standard applicable to children through age 21 to instead be up to 22nd birthday and a related change to a provision that provides an alternative to survivorship benefits under federal social security benefits.
9/29/20 Chaptered Staff will meet with counsel to assess impact.
Other Bills of Interest:
AB 1945 Salas This bill would provide that the definition of first responder does not entitle an employee to obtain a retirement benefit formula for an employment classification that is not included in that formula. The bill would prohibit an employer from offering a benefit formula for an employment classification that is not included in that formula.
9/11/20 Chaptered Update definition of Safety member
on all pertinent communications and provide to
employers.
SB 1159 Hill This bill would define "injury" for a critical worker an employee to include illness or death that results from exposure to COVID-19 and creates a disputable presumption that the injury arose out of and in the course of employment. This bill would require an employee to exhaust their paid sick leave benefits and meet other requirements before receiving any temporary disability benefits or, for specified employees, a leave of absence.
9/17/20 Chaptered No direct impact on SJCERA.
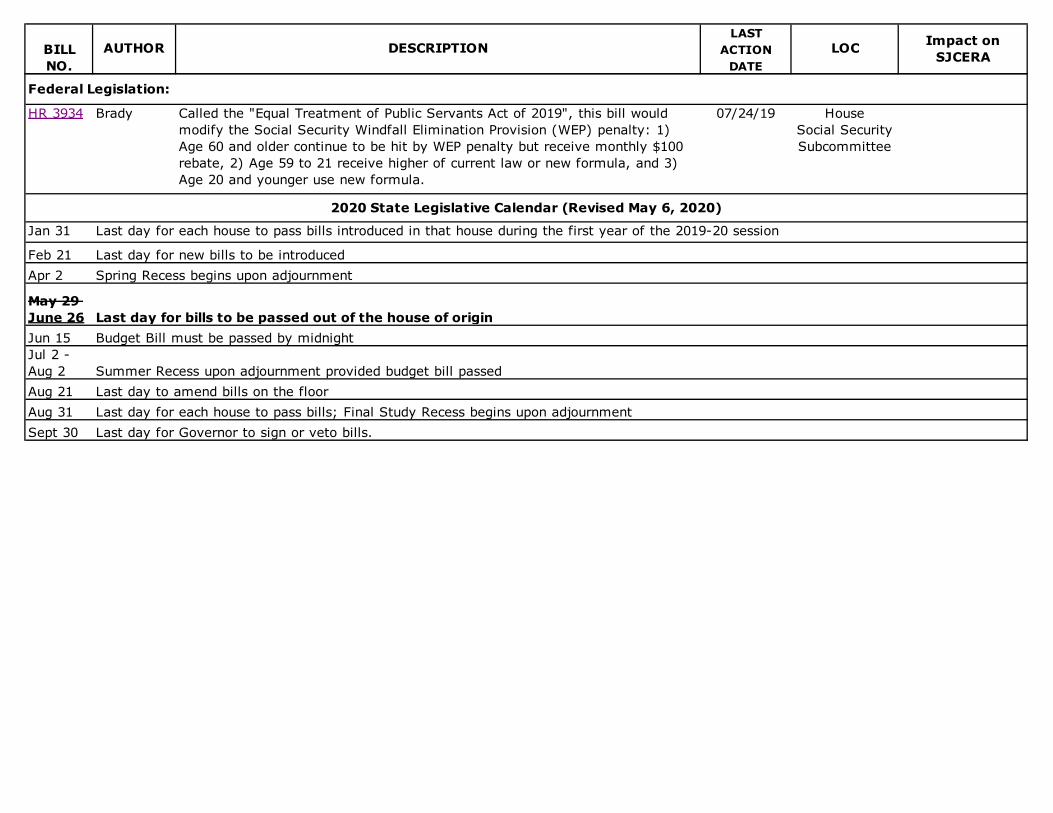
LASTBILL ACTIONNO. DATE
AUTHOR DESCRIPTION LOC Impact on SJCERA
Federal Legislation:
HR 3934 Brady Called the "Equal Treatment of Public Servants Act of 2019", this bill would modify the Social Security Windfall Elimination Provision (WEP) penalty: 1) Age 60 and older continue to be hit by WEP penalty but receive monthly $100 rebate, 2) Age 59 to 21 receive higher of current law or new formula, and 3) Age 20 and younger use new formula.
07/24/19 House Social Security Subcommittee
Jan 31
Feb 21 Last day for new bills to be introducedApr 2 Spring Recess begins upon adjournment
May 29 June 26Jun 15 Budget Bill must be passed by midnightJul 2 - Aug 2 Summer Recess upon adjournment provided budget bill passedAug 21 Last day to amend bills on the floorAug 31 Last day for each house to pass bills; Final Study Recess begins upon adjournmentSept 30 Last day for Governor to sign or veto bills.
Last day for each house to pass bills introduced in that house during the first year of the 2019-20 session
Last day for bills to be passed out of the house of origin
2020 State Legislative Calendar (Revised May 6, 2020)
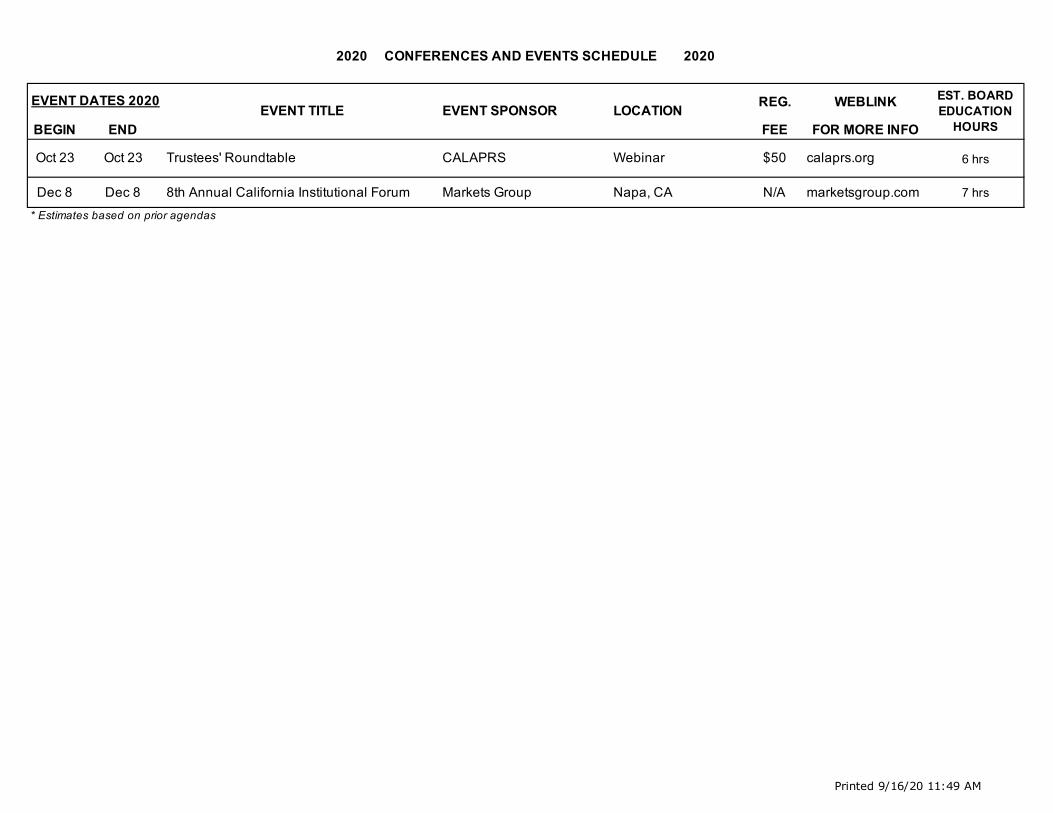
Printed 9/16/20 11:49 AM
REG. WEBLINK
BEGIN END FEE FOR MORE INFO
Oct 23 Oct 23 Trustees' Roundtable CALAPRS Webinar $50 calaprs.org 6 hrs
Dec 8 Dec 8 8th Annual California Institutional Forum Markets Group Napa, CA N/A marketsgroup.com 7 hrs
* Estimates based on prior agendas
2020 CONFERENCES AND EVENTS SCHEDULE 2020
EVENT DATES 2020EVENT TITLE EVENT SPONSOR LOCATION
EST. BOARD EDUCATION
HOURS

VIRTUAL TRUSTEES ROUNDTABLE
Friday, October 23, 2020 9:30 a.m. – 3:30 p.m. PST
Held Virtually On Zoom
PRELIMINARY AGENDA
9:30 a.m. – 12:30 p.m. Session I: “What is the Role of Trustees in Choosing and/or Monitoring Money Managers?” Should Trustees choose money managers, or should they delegate this to staff or to outside investment counsel? If yes, are there better ways to do it? If no, how should trustee monitor the managers and/or their staff who selects them? In all cases, there is a need for the board to monitor manager performance, and boards must choose reporting tools and methodologies to do that. Panel #1: Two industry professionals will give their perspectives on the role of Trustees to choose and/or monitor money managers. Speakers Include:
• Von Hughes, Partner & Managing Director of PAAMCOP Prisma, and author, U.S. Public Pension Handbook
• Ben Carlson, Director of Institutional Investment, Ritholtz Wealth Management, author of multiple books, latest one being Organizational Alpha, and host of a podcast, Animal Spirits.
Panel #2: Two county pension plans will be represented with different perspectives and practices on choosing of money managers.
Speakers Include:
• Orange County Employees’ Retirement System o Steve Delaney, CEO o Russell Baldwin, Former Trustee
• Fresno County Employees’ Retirement Association
o Nathan Magasig, Trustee o Doug Kidd, CIO or Donald Kendig, CEO

Panel #3: Two speakers from the financial industry to discuss monitoring tools.
• “Monitoring Tools for Money Managers” o Speaker: Cindy Lau, Blackrock
• “Best Practices of How Trustees Can Monitor Money Managers”
o Speaker: Alan Emkin, Mekata
12:30 – 1:00 PM: 30 minute Break. 1:00 p.m. - 3:30 p.m. Session II: “What is the Role of Trustees on Corporate Policies?” Corporations, as well as other entities in which pension plans invest, all have policies which may or not contribute to performance as well as other long-term sustainability. While there are various monitoring tools to help trustees, it is very difficult for either plan trustees or staff to become involved in all potential issues and with all the investments of a typical plan. There are shareholder activist groups which try to choose the issues with certain businesses. However, most plans have given the control to staff, which in turn have given it to one of two proxy-voting firms to vote on behalf of the board. It is not possible for trustees to vote on all the proxies coming before corporate shareholder meetings (not to mention getting more involved in limited partnerships), so trustees need to understand the resources available for them. Furthermore, for those boards which delegate manager selection process to staff, getting involved in policy issues may become the major work that trustees do. Topics Will Include:
• What might be some of the fiduciary responsibilities for trustees to consider before getting involved in corporate policy work?
• What are the typical issues that engagement typically covers? • What are the various tools to measure performance and sustainability
metrics?
Speakers will most likely include:
a) Representative from ISS (Institutional Shareholder Services) b) Representative from Council of Institutional Investors c) Representative from Institutional Limited Partners Association d) Representative from State-Wide Pension Plans (CALSTRS/CALPERS) e) Speaker from Activist Money Manager f) Speakers who Are Currently Engaged in Corporate Activism
More information on Session II will be released at a later date. For additional questions you may contact the CALAPRS Office at [email protected].
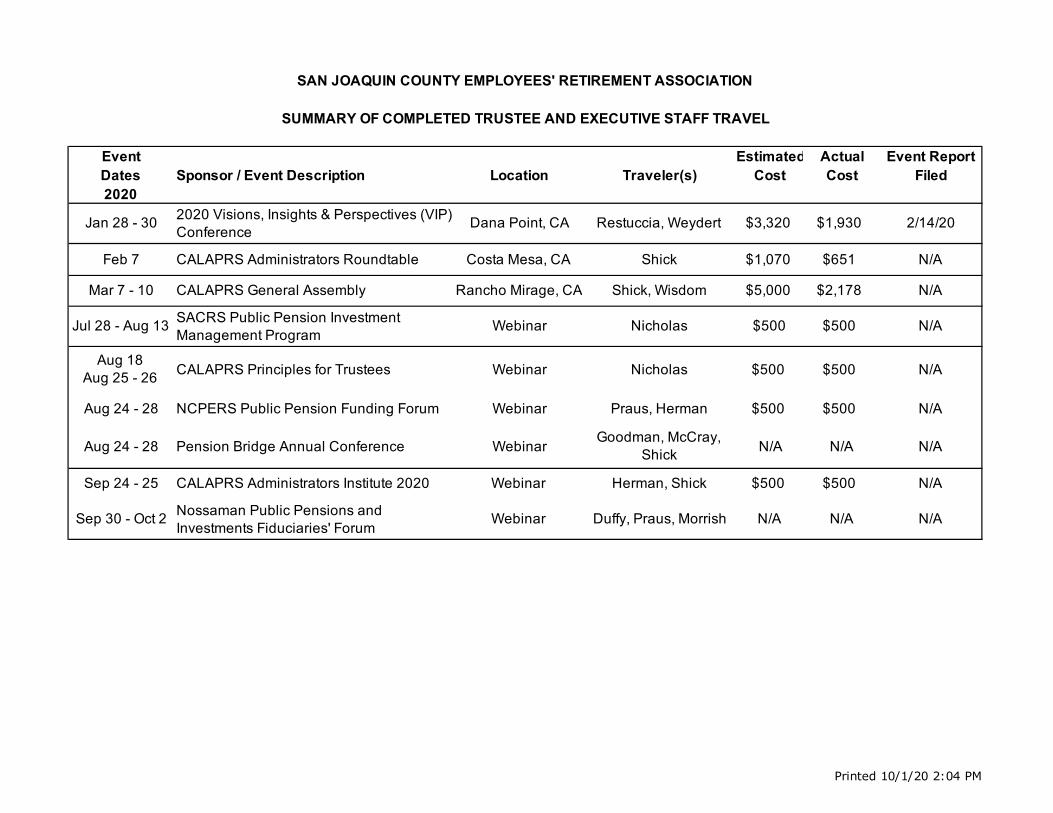
Printed 10/1/20 2:04 PM
Event Estimated Actual Event ReportDates Sponsor / Event Description Location Traveler(s) Cost Cost Filed2020
Jan 28 - 30 2020 Visions, Insights & Perspectives (VIP) Conference Dana Point, CA Restuccia, Weydert $3,320 $1,930 2/14/20
Feb 7 CALAPRS Administrators Roundtable Costa Mesa, CA Shick $1,070 $651 N/A
Mar 7 - 10 CALAPRS General Assembly Rancho Mirage, CA Shick, Wisdom $5,000 $2,178 N/A
Jul 28 - Aug 13 SACRS Public Pension Investment Management Program Webinar Nicholas $500 $500 N/A
Aug 18 Aug 25 - 26 CALAPRS Principles for Trustees Webinar Nicholas $500 $500 N/A
Aug 24 - 28 NCPERS Public Pension Funding Forum Webinar Praus, Herman $500 $500 N/A
Aug 24 - 28 Pension Bridge Annual Conference Webinar Goodman, McCray, Shick N/A N/A N/A
Sep 24 - 25 CALAPRS Administrators Institute 2020 Webinar Herman, Shick $500 $500 N/A
Sep 30 - Oct 2 Nossaman Public Pensions and Investments Fiduciaries' Forum Webinar Duffy, Praus, Morrish N/A N/A N/A
SAN JOAQUIN COUNTY EMPLOYEES' RETIREMENT ASSOCIATION
SUMMARY OF COMPLETED TRUSTEE AND EXECUTIVE STAFF TRAVEL
6 South El Dorado Street, Suite 400 • Stockton, CA 95202 (209) 468-2163 • [email protected] • www.sjcera.org
San Joaquin County Employees' Retirement Association
October 1, 2020
TO: Board of Retirement
FROM: Johanna Shick Chief Executive Officer
SUBJECT: Chief Executive Officer Report
Strengthen Fund Stability SJCERA’s Portfolio. As part of our Global Equity transition, it was identified that Keeley, one of the funds within our previous Attucks investment, was not liquidated because there is no market for it, and it is currently valued at zero. After consulting with Attucks, our Custodial Bank, and Investment Consultant, it was decided to transfer the remaining Keeley warrants to our cash account so we can close the account this calendar year.
Expand Board Education. At the October meeting, David Sancewich will provide the Board information on negative interest rates.
Leverage Technology to Improve Accuracy and Efficiency Enhanced Pension System. The new Active Member System (AMS) supports wildcard searches, is assisting staff to research issues such as earnings codes related to implementing the Alameda decision. Management Analyst III, Greg Frank said “I love, love, love the new search capabilities! I am no longer dependent upon IT to pull data, which is critical to my analysis regarding the Alameda decision.”
On September 17, for the first time in SJCERA history, the Contribution Register, which records members’ contributions and service credit in the pension administration system, was updated and reconciled within 24 hours of receiving data files from the employers. This one change, will ultimately eliminate the manual reconciliation of individual member contributions records prior to benefit or refund distribution.
The first two refunds of contributions to be generated from the enhanced pension system will be paid on the October 1. The enhanced system processes refunds as part of the retiree payroll process, rather than manually through the County’s accounts payable.
Improve Operational Efficiency Assess Merits of Calendar Year versus Fiscal Year. Staff has completed the analysis of the relative merits of being a calendar versus fiscal year plan. Our conclusion is SJCERA should remain a calendar year plan because there is no compelling reason to change to a fiscal year plan (and there are a few disadvantages). The memo summarizing the team’s findings is attached. Many thanks to Greg Frank, Kathy Herman, Lily Cherng, Chris Wisdom, Marta Gonzalez, Adnan Khan, and Andrea Bonilla for their thoughtful consideration of this topic.
Deliver Excellent Service and Support to Stakeholders Active Member Communication. Understanding Your Retirement Benefit Webinar. Nineteen members of Superior Court staff attended our pilot webinar on September 17, 2020. Debra Khan and Ron Banez created the presentation and co-
CEO Report October 1, 2020 Page
6 South El Dorado Street, Suite 400 • Stockton, CA 95202 (209) 468-2163 • [email protected] • www.sjcera.org
2
presented the webinar, and Lolo Garza taught them how to use the technology. Attendee feedback was positive and the suggestions were helpful. Melinda DeOliveira and Ron Banez have made some adjustments and will present this same information during two separate sessions to a total of about 150 County employees in October, for National Retirement Security month. Great job everyone! New Employee Orientation. The County now offers a virtual New Employee Orientation program using MicroSoft Teams. Prior to the COVID 19 Emergency Shelter in Place order, this was a two-day in-person program for all new employees, now participants watch a video of each presenter’s portion of the program. Ron Banez took the initiative to attend the first session on September 14, and answered questions following his video. This went so well, that the County has now incorporated a live question/answer session following each recorded presentation. Ron’s initiative improved the quality of the education experience for all new hires—well done!
Maintain a High-Performing Workforce Recruitment. Assistant CEO Kathy Herman and I did an initial screening interview of all qualified Investment Officer candidates and identified those that would participate in the next stage of the interview process. We were fortunate to have a highly competitive pool of candidates with extensive portfolio oversight and institutional investing experience. Investment Consultant, David Sancewich, Contra Costa CERA Chief Investment Officer Tim Price, and I conducted interviews on September 28. Retirement. Retirement Service Officer Debra Khan is retiring effective October 24, after nearly 36 years of service to the county, the last 25 of which have been at SJCERA. I think she must have received a special waiver of the child labor laws—she can’t possibly have worked that many years! We are of course delighted for her, but we will miss her sparkling personality, her special way of working with customers, and her long, deep institutional knowledge. (Some of her co-workers are also wondering who will bring us the best donuts in Stockton—perhaps her grandkids will let her work for Uber Eats occasionally?) She will leave a big hole, but fortunately, she has trained many of us who are still here, so our members will be in good hands. Employee of the Month. Adnan Khan was named employee of the month for the excellent work he was done spearheading our Pension Administration System (PAS) Enhancement project while juggling his other IT responsibilities. I can truly say, that without Adnan’s leadership, we would not have accomplished as much as we have. He is quick to give credit to the team (and they deserve lots of credit too), but I am pleased to have this opportunity to recognize Adnan for his leadership. Training. Marta Gonzalez and Lily Cherng attended the CALAPRS Management/Leadership Forum. Due to COVID-19, the in-person event was postponed; however, instead CALAPRS offered a series of five online presentations on management and leaderships topics particularly relevant to these unprecedented times: Performance Management and Coaching; Customer Service Right Now; Building Resilience and Managing Stress in Times of Change; The Profound Power of Communication; and How to Lead a Virtual Team: Tips and Strategies for Working Remotely. Melinda DeOliveria, Ron Banez and Marta Gonzalez took part in the Benefits Round table on September 10, 2020. Feedback on the virtual roundtables has been strongly positive overall, and there has been increased attendance. As a result, CALAPRS is considering offering them at least once a year even after it is safe to meet in person. Kathy Herman and I attended the virtual Administrators’ Institute held on September 24-25. Topics included Communicating Effectively in the Virtual World, and The Roots of Social Justice: Framing and Analysis of Systems and Structures. The Roots of Social Justice presentation included pre-work of viewing the video, “Cracking the Codes: The System of Racial Inequity” and reading the first three
CEO Report October 1, 2020 Page
6 South El Dorado Street, Suite 400 • Stockton, CA 95202 (209) 468-2163 • [email protected] • www.sjcera.org
3
chapters of “Caste: The Origins of Our Discontents” by Isabel Wilkerson, both of which are powerful, thought-provoking works. Manage Risk Continue to Strengthen Cyber Security. Peter Dewar of Linea Secure will provide a cyber-security presentation, including what should be included in an IT Audit, at the October 9 Board meeting. Manage Emerging Organizational Needs Alameda Decision. Recommendations related to implementing the Alameda decision are scheduled to be presented at the Special Board meeting scheduled for Thursday, October 15 at 3:00 p.m. Interest Posting. Government Code Section 31591, requires SJCERA to credit interest semiannually on June 30 and December 31 to all contributions in the Retirement Fund that have been on deposit for six months immediately prior to such date. On August 12, 2020, staff posted interest as of June 30, 2020 to contributions that had been on deposit as of December 31, 2019. SJCERA’s Statement of Reserve policy requires crediting the Member Reserve before any other reserves; crediting of other reserves is deferred until the close of the calendar year (i.e., CY 2020) when the full impact of investment earnings during 2020 is known. The Statement of Reserve policy also defines the interest rate to be credited as the “rate which, when compounded, produces the annual actuarial assumed rate of investment return.” Based on the applicable annual assumed rate of return, semiannual interest was credited at 3.5616 percent. Action Plan Thank you to staff and trustees for your input on the 2021 Action plan. The proposed plan is attached to this report. Conclusion October is the time of year when we begin making plans for next year and assessing what remains to be done on this year’s goals. We are driving toward the finish line on our 2020 Action Plan and I look forward to reporting the results in January. During this very unusual year, with remote work and virtual meetings, I have often reflected that fortunately, in 2020 we have the technology to make it all possible. However, it appears that the Brady Bunch had Zoom in the 1960s!
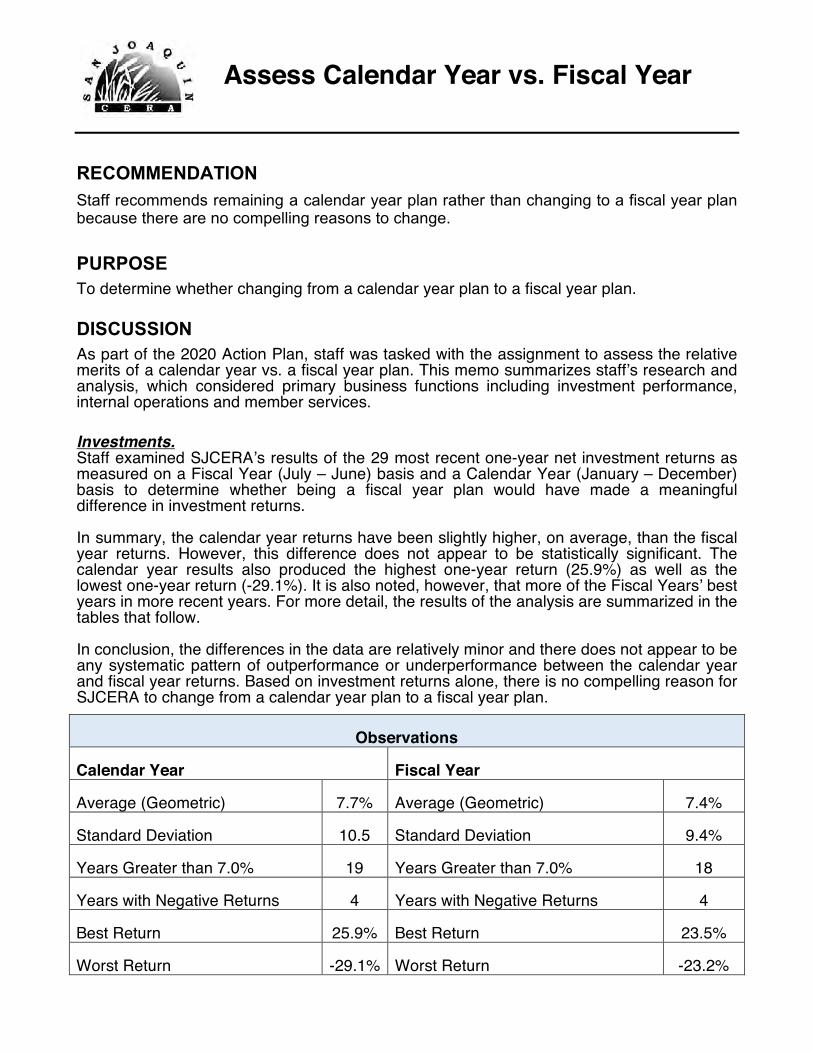
Assess Calendar Year vs. Fiscal Year
RECOMMENDATION Staff recommends remaining a calendar year plan rather than changing to a fiscal year plan because there are no compelling reasons to change. PURPOSE To determine whether changing from a calendar year plan to a fiscal year plan. DISCUSSION As part of the 2020 Action Plan, staff was tasked with the assignment to assess the relative merits of a calendar year vs. a fiscal year plan. This memo summarizes staff’s research and analysis, which considered primary business functions including investment performance, internal operations and member services. Investments. Staff examined SJCERA’s results of the 29 most recent one-year net investment returns as measured on a Fiscal Year (July – June) basis and a Calendar Year (January – December) basis to determine whether being a fiscal year plan would have made a meaningful difference in investment returns.
In summary, the calendar year returns have been slightly higher, on average, than the fiscal year returns. However, this difference does not appear to be statistically significant. The calendar year results also produced the highest one-year return (25.9%) as well as the lowest one-year return (-29.1%). It is also noted, however, that more of the Fiscal Years’ best years in more recent years. For more detail, the results of the analysis are summarized in the tables that follow. In conclusion, the differences in the data are relatively minor and there does not appear to be any systematic pattern of outperformance or underperformance between the calendar year and fiscal year returns. Based on investment returns alone, there is no compelling reason for SJCERA to change from a calendar year plan to a fiscal year plan.
Observations
Calendar Year Fiscal Year
Average (Geometric) 7.7% Average (Geometric) 7.4%
Standard Deviation 10.5 Standard Deviation 9.4%
Years Greater than 7.0% 19 Years Greater than 7.0% 18
Years with Negative Returns 4 Years with Negative Returns 4
Best Return 25.9% Best Return 23.5%
Worst Return -29.1% Worst Return -23.2%
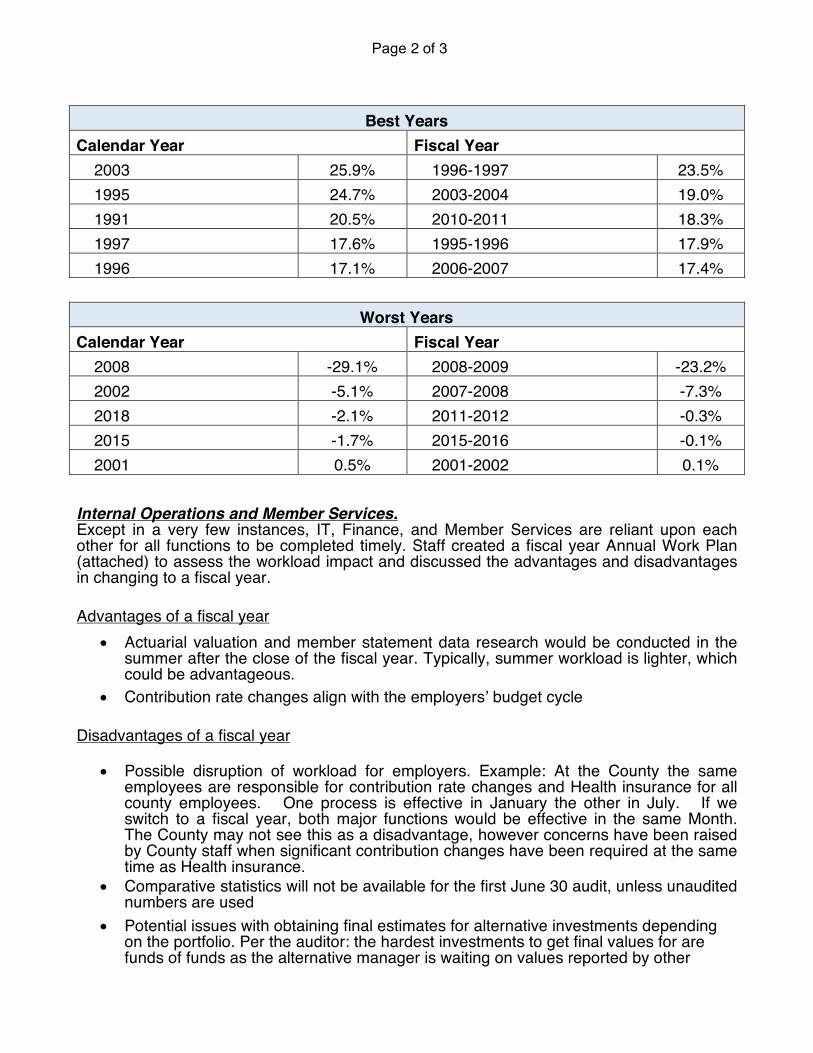
Page 2 of 3
Best Years Calendar Year Fiscal Year 2003 25.9% 1996-1997 23.5% 1995 24.7% 2003-2004 19.0% 1991 20.5% 2010-2011 18.3% 1997 17.6% 1995-1996 17.9% 1996 17.1% 2006-2007 17.4%
Worst Years Calendar Year Fiscal Year 2008 -29.1% 2008-2009 -23.2% 2002 -5.1% 2007-2008 -7.3% 2018 -2.1% 2011-2012 -0.3% 2015 -1.7% 2015-2016 -0.1% 2001 0.5% 2001-2002 0.1% Internal Operations and Member Services. Except in a very few instances, IT, Finance, and Member Services are reliant upon each other for all functions to be completed timely. Staff created a fiscal year Annual Work Plan (attached) to assess the workload impact and discussed the advantages and disadvantages in changing to a fiscal year.
Advantages of a fiscal year
• Actuarial valuation and member statement data research would be conducted in the summer after the close of the fiscal year. Typically, summer workload is lighter, which could be advantageous.
• Contribution rate changes align with the employers’ budget cycle
Disadvantages of a fiscal year
• Possible disruption of workload for employers. Example: At the County the same employees are responsible for contribution rate changes and Health insurance for all county employees. One process is effective in January the other in July. If we switch to a fiscal year, both major functions would be effective in the same Month. The County may not see this as a disadvantage, however concerns have been raised by County staff when significant contribution changes have been required at the same time as Health insurance.
• Comparative statistics will not be available for the first June 30 audit, unless unaudited numbers are used
• Potential issues with obtaining final estimates for alternative investments depending on the portfolio. Per the auditor: the hardest investments to get final values for are funds of funds as the alternative manager is waiting on values reported by other
Page 3 of 3
!
private equity funds. Depending on the size of the alternative investment portfolio we might overcome by waiting to finalize the trial balance at the end of October. Sometimes if the cutoff for financials occurs prior to 9/30 and the audit doesn’t get issued until November they might we may have an unadjusted difference come up if it is significant prior to issuance which is reported in the audit report to the board.
• Potential discrepancy between SJCERA financials and GASB 67/68 data due to timing, Per the auditor: other systems have their 67 valuation performed using the funding valuation on a one year lag so they can have the 67 valuation in time for the CAFR meet deadlines.
• Short term increase in audit fees • Short term increase in actuarial fees.
Staff contacted both our actuarial and auditing firms regarding the possible transition and availability of staff. Cheiron and Brown Armstrong both recommended an 18-month valuation and audit period for the transition and assured SJCERA that they could adequately continue to provide service per their contracts. They both indicated that costs would increase in the transition year and would normalize thereafter.
Tax Qualification Letter. SJCERA was a calendar year plan when we received the first IRS tax qualification letter. In 2011, when SJCERA and other 1937 Act systems submitted an application for a determination letter on tax qualification, it was done through the voluntary compliance program. Follow-up letters were obtained as the cycle permitted. SJCERA’s 2017 determination letter did not apply to any qualification changes that become effective, any guidance issued, or any statutes enacted after the dates specified in the Cumulative List of Changes in Plan Requirements. A major change such as moving to a fiscal year plan, would result in further review by Tax Counsel and may require another submission to the IRS for guidance. Other administrative considerations. Staff also assessed any potential impact on the annual budget process, Board meeting calendars, and the filing of national surveys and determined there was no significant impact. In conclusion, while becoming a fiscal year plan would assist with employer budgeting because contribution rates would remain the same throughout the budget year, there are no significant advantages and there are some disadvantages to SJCERA operations. As a result, staff recommends remaining a calendar year plan. ATTACHMENT Annual Work Plan on a fiscal year basis ____________________ _________________________ KATHY HERMAN GREG FRANK ASST. Chief Executive Officer Management Analyst III

Printed 10/2/20 11:33 AM/Volumes/ERA_SR01/New File System/Administration/Business Planning/Annual Plans/Action Plans/2020 Action Plan Implementation/Goal
3.d.ii Assess FY vs CY.ii/Fiscal Year Draft Work Plan.xlsx
* Board Materials-develop & distribute * Board Materials-develop & distribute * Board Materials-develop & distribute* Retiree payroll: adds/changes/terms; run;
verify; distrib* Retiree payroll: adds/changes/terms; run;
verify; distrib* Retiree payroll: adds/changes/terms; run;
verify; distrib* Benefit Change Ltrs (62, 65, 26, eligible "child", s/l exhausted, supplemental)
* Benefit Change Ltrs (62, 65, 26, eligible "child", s/l exhausted, supplemental)
* Benefit Change Ltrs (62, 65, 26, eligible "child", s/l exhausted, supplemental)
* Contribution & investment reconciliations * Contribution & investment reconciliations * Contribution & investment reconciliations* Federal & State Taxes * Federal & State Taxes * Federal & State Taxes* Retiree payroll reconciliation * Retiree payroll reconciliation * Retiree payroll reconciliation* Sick Lv Bank Bene. Collection frm SJC
(SJC gets frm Cts)* Sick Lv Bank Bene. Collection frm SJC
(SJC gets frm Cts)* Sick Lv Bank Bene. Collection frm SJC (SJC
gets frm Cts)* New Employee Orientation * New Employee Orientation * New Employee Orientation* Deferred/Deaths * Deferred/Deaths * Deferred/Deaths* Send 415 testing file to actuary * Send 415 testing file to actuary * Send 415 testing file to actuary
* 1099 * Open Enrollment * COLA* Holiday Closure * Holiday Closure * Update new CERL on website* GASB 72 disclosures * Actuarial Valuation Changes
* Supplemental Disability Allowance Review * Cash Activity Report - to CEO * Run reports for Age 70 & RMD - Age 72* File State Tax Quarterly Return * Securities Litigation Status Report * 4th Qtr Investment & Due Diligence Reports* Sick Leave Bank Conversion invoice to
Employers* Death Match-all members with PBI * Quarterly Tax Run
* Disability Statistics & Detail Reports* Pending Retiree Accounts Receivable
* Update About to Retire seminar slides * About to Retire seminar * Write SACRS What's New (due ~ 4/1)* Interest Crediting-notify BOR in CEO Rpt * RMD - Age 72 notices sent
* Health & Wellness Letters (90 plus)
* Prepare and mail 1099Rs * Sch. ER meetings (in lieu of symposium) * Peak workload-Ret. Payroll Techs (& RSOs?)* Prepare 1099 script for Front Desk &
website * Begin Board election process, if applicable * Receive / record Form 700 filings
* Update tax tables * Cash flow statement - to CEO * CALAPRS General Assembly* Update Medicare Part B in system (for 2/1
payroll)* Receive / record Form 700 filings * RofV Board Elections - 7th in 2019; 2nd in
2020 (Feb-June)* 415(b) benefits: reinstate to normal benefit (for 2/1 )
* Notice & Establishment of CPI for Retiree COLA
* Develop/Finalize Action Plan* Rcv. Actuary's COLA letter & update COLA
spreadsheet* RofV Board Elections - 7th in 2019; 2nd in
2020 (Feb-June)* Plan for End of the Year
* Post interest eff 12/31 on balances as of previous 6/30
* Announcement of Board Election, if applicable
* Actuarial Valuation (& Experience Study)
* Trustee Education Compliance report Start planning for Investment Round Table* Mid-year Admin Budget Update – Board * NT Mail TEFRA Letter* HR notifies retires OE* IT remove agendas & minutes from website
(only current and prior year)* Issue Notice for Form 700 & Placement
Agents* Send Fee Transparency Letter* Give feedback to HR on OE packet * File Federal 945 Form* Submit Electronic Federal Tax File
Quarterly
SJCERA Annual Work Plan / Schedule
Monthly
January MarchMonthly
FebruaryMonthly
Quarterly Quarterly
Web Updates Web Updates Web Updates
Annually
Semi-Annually
AnnuallyAnnually
Semi-Annually Semi-Annually
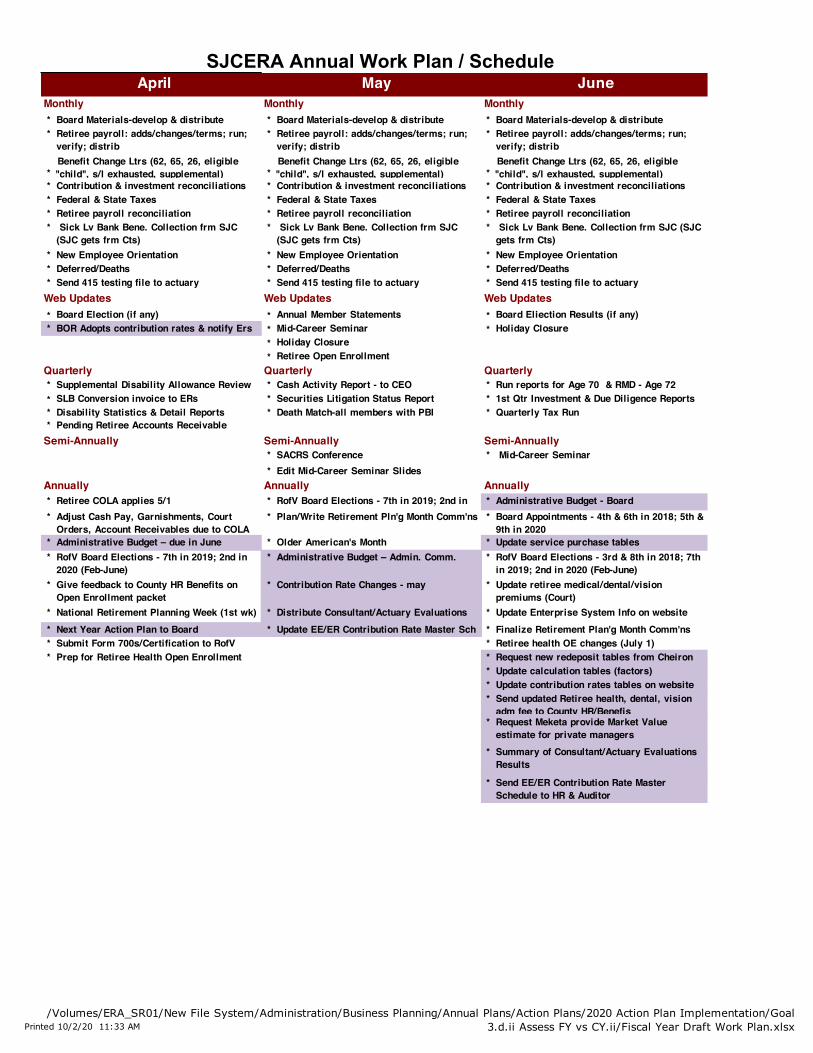
Printed 10/2/20 11:33 AM/Volumes/ERA_SR01/New File System/Administration/Business Planning/Annual Plans/Action Plans/2020 Action Plan Implementation/Goal
3.d.ii Assess FY vs CY.ii/Fiscal Year Draft Work Plan.xlsx
SJCERA Annual Work Plan / Schedule
* Board Materials-develop & distribute * Board Materials-develop & distribute * Board Materials-develop & distribute* Retiree payroll: adds/changes/terms; run;
verify; distrib* Retiree payroll: adds/changes/terms; run;
verify; distrib* Retiree payroll: adds/changes/terms; run;
verify; distrib
* Benefit Change Ltrs (62, 65, 26, eligible "child", s/l exhausted, supplemental) *
Benefit Change Ltrs (62, 65, 26, eligible "child", s/l exhausted, supplemental) *
Benefit Change Ltrs (62, 65, 26, eligible "child", s/l exhausted, supplemental)
* Contribution & investment reconciliations * Contribution & investment reconciliations * Contribution & investment reconciliations* Federal & State Taxes * Federal & State Taxes * Federal & State Taxes* Retiree payroll reconciliation * Retiree payroll reconciliation * Retiree payroll reconciliation* Sick Lv Bank Bene. Collection frm SJC
(SJC gets frm Cts)* Sick Lv Bank Bene. Collection frm SJC
(SJC gets frm Cts)* Sick Lv Bank Bene. Collection frm SJC (SJC
gets frm Cts)* New Employee Orientation * New Employee Orientation * New Employee Orientation* Deferred/Deaths * Deferred/Deaths * Deferred/Deaths* Send 415 testing file to actuary * Send 415 testing file to actuary * Send 415 testing file to actuary
* Board Election (if any) * Annual Member Statements * Board Eliection Results (if any)* BOR Adopts contribution rates & notify Ers * Mid-Career Seminar * Holiday Closure
* Holiday Closure* Retiree Open Enrollment
* Supplemental Disability Allowance Review * Cash Activity Report - to CEO * Run reports for Age 70 & RMD - Age 72* SLB Conversion invoice to ERs * Securities Litigation Status Report * 1st Qtr Investment & Due Diligence Reports* Disability Statistics & Detail Reports * Death Match-all members with PBI * Quarterly Tax Run* Pending Retiree Accounts Receivable
* SACRS Conference * Mid-Career Seminar* Edit Mid-Career Seminar Slides
* Retiree COLA applies 5/1 * RofV Board Elections - 7th in 2019; 2nd in 2020 (Feb-June)
* Administrative Budget - Board* Adjust Cash Pay, Garnishments, Court
Orders, Account Receivables due to COLA* Plan/Write Retirement Pln'g Month Comm'ns * Board Appointments - 4th & 6th in 2018; 5th &
9th in 2020* Administrative Budget – due in June * Older American's Month * Update service purchase tables * RofV Board Elections - 7th in 2019; 2nd in
2020 (Feb-June)* Administrative Budget – Admin. Comm. * RofV Board Elections - 3rd & 8th in 2018; 7th
in 2019; 2nd in 2020 (Feb-June)* Give feedback to County HR Benefits on
Open Enrollment packet * Contribution Rate Changes - may * Update retiree medical/dental/vision
premiums (Court) * National Retirement Planning Week (1st wk) * Distribute Consultant/Actuary Evaluations * Update Enterprise System Info on website* Next Year Action Plan to Board * Update EE/ER Contribution Rate Master Sch * Finalize Retirement Plan'g Month Comm'ns* Submit Form 700s/Certification to RofV * Retiree health OE changes (July 1)* Prep for Retiree Health Open Enrollment * Request new redeposit tables from Cheiron
* Update calculation tables (factors)* Update contribution rates tables on website* Send updated Retiree health, dental, vision
adm fee to County HR/Benefis* Request Meketa provide Market Value
estimate for private managers * Summary of Consultant/Actuary Evaluations
Results
* Send EE/ER Contribution Rate Master Schedule to HR & Auditor
June
Quarterly
AprilMonthly
Annually
Semi-AnnuallySemi-Annually
Quarterly
Monthly
Semi-Annually
MayMonthly
Quarterly
Annually
Web Updates Web Updates Web Updates
Annually

Printed 10/2/20 11:33 AM/Volumes/ERA_SR01/New File System/Administration/Business Planning/Annual Plans/Action Plans/2020 Action Plan Implementation/Goal
3.d.ii Assess FY vs CY.ii/Fiscal Year Draft Work Plan.xlsx
SJCERA Annual Work Plan / Schedule
* Board Materials-develop & distribute * Board Materials-develop & distribute * Board Materials-develop & distribute* Retiree payroll: adds/changes/terms; run;
verify; distrib* Retiree payroll: adds/changes/terms; run;
verify; distrib* Retiree payroll: adds/changes/terms; run;
verify; distrib* Benefit Change Ltrs (62, 65, 26, eligible
"child", s/l exhausted, supplemental)* Benefit Change Ltrs (62, 65, 26, eligible
"child", s/l exhausted, supplemental)* Benefit Change Ltrs (62, 65, 26, eligible
"child", s/l exhausted, supplemental)* Contribution & investment reconciliations * Contribution & investment reconciliations * Contribution & investment reconciliations* Federal & State Taxes * Federal & State Taxes * Federal & State Taxes* Retiree payroll reconciliation * Retiree payroll reconciliation * Retiree payroll reconciliation* Sick Lv Bank Bene. Collection frm SJC
(SJC gets frm Cts)* Sick Lv Bank Bene. Collection frm SJC
(SJC gets frm Cts)* Sick Lv Bank Bene. Collection frm SJC (SJC
gets frm Cts)* New Employee Orientation * New Employee Orientation * New Employee Orientation* Deferred/Deaths * Deferred/Deaths * Deferred/Deaths* Send 415 testing file to actuary * Send 415 testing file to actuary * Send 415 testing file to actuary
* update new cont. rates on active & employer pages
* Holiday Closure * About to Retire seminar
* Holiday Closure
* Supplemental Disability Allowance Review * Cash Activity Report- to CEO * 2nd Qtr Investment & Due Diligence Reports* Sick Leave Bank Conversion invoice to
Employers* Securities Litigation Status Report * Quarterly Tax Run
* Disability Statistics & Detail Reports * Death Match-all members with PBI Run reports for Age 70 & RMD - Age 72* Pending Retiree Accounts Receivable
* Post interest eff 6/30 on balances as of previous 12/31
* Update About to Retire slides * About to Retire seminar
* Interest Crediting-notify BOR in CEO Rpt * Health & Wellness Letters (90 plus) * SACRS What's New (due ~ 10/1)
* Complete custodial audit & finalize investment reports
* Request calculation for adjusting retirement benefits for 415(b) limits from Cheiron
* Audit Entrance Interview with Audit Committee
* Retirement plan cost projections to CAO based on estimated prior year’s return
* 415(b) limits: Adjust Benefits; send letter to mbrs (Aug-Jan)
* Active & Retired Member, OPEB, GASB Data to Actuary
* Election of Board Officers * BOR Committee Assignments * Finance prepare materials for Audit
* National Retirement Planning Month * Provide agencies with actuarial information * Year-end Close / Accounting * Prepare &/or Send Retiree Data to auditor
and actuary (2019 Experience Study)* Distribute GFOA comments to Mgmt Team;
Discuss* Mail member statements
* Finalize audit timeline * Begin actuarial data collection * Prepare Med B Materials* Review CAFR checklist * Begin Annual Report (CAFR) & timeline* Schedule August Audit Committee meeting * Renewal of Fiduciary Liability Insurance* Schedule pre-audit conference with Auditor* Prior YR Action Plan to BOR* Close prior year Contributions Register* Conduct pre-audit conference with Auditor* Send GASB 72 /questionnaire to Inv. Mgrs* BOR ratify prior yr earnings codes* Begin Member Statements
Monthly
Semi-Annually
August September
Annually
Monthly
Annually
Quarterly Quarterly
Semi-Annually
Annually
Semi-Annually
Quarterly
Web Updates Web Updates Web Updates
Monthly
July

Printed 10/2/20 11:33 AM/Volumes/ERA_SR01/New File System/Administration/Business Planning/Annual Plans/Action Plans/2020 Action Plan Implementation/Goal
3.d.ii Assess FY vs CY.ii/Fiscal Year Draft Work Plan.xlsx
SJCERA Annual Work Plan / Schedule December
* Board Materials-develop & distribute * Board Materials-develop & distribute * Board Materials-develop & distribute* Retiree payroll: adds/changes/terms; run;
verify; distrib* Retiree payroll: adds/changes/terms; run;
verify; distrib* Retiree payroll: adds/changes/terms; run;
verify; distrib*
Benefit Change Ltrs (62, 65, 26, eligible "child", s/l exhausted, supplemental) *
Benefit Change Ltrs (62, 65, 26, eligible "child", s/l exhausted, supplemental) *
Benefit Change Ltrs (62, 65, 26, eligible "child", s/l exhausted, supplemental)
* Contribution & investment reconciliations * Contribution & investment reconciliations * Contribution & investment reconciliations* Federal & State Taxes * Federal & State Taxes * Federal & State Taxes* Retiree payroll reconciliation * Retiree payroll reconciliation * Retiree payroll reconciliation* Sick Lv Bank Bene. Collection frm SJC
(SJC gets frm Cts)* Sick Lv Bank Bene. Collection frm SJC
(SJC gets frm Cts)* Sick Lv Bank Bene. Collection frm SJC (SJC
gets frm Cts)* New Employee Orientation * New Employee Orientation * Scanning* Deferred/Deaths * Deferred/Deaths * New Employee Orientation* Send 415 testing file to actuary * Send 415 testing file to actuary * Deferred/Deaths
* Send 415 testing file to actuary
* Mid-Career Seminar * Medicare B* Holiday Closures (Veterans & Thangsgiving) * Holiday Closures (Christmas & New Years)
* IRS and PEPRA Comp Limits * 1st paycheck schedule (2 years available on the web
* CAFR/PAFR Awards
* Supplemental Disability Allowance Review * Cash Activity Report - to CEO * Reconcile 1099s* SLB Conversion invoice to ERs * Securities Litigation Status Report * Run reports for Age 70 & RMD - Age 72* Disability Statistics & Detail Reports * Death Match-all members with PBI * 3rd Qtr Investment & Due Diligence Reports* Pending Retiree Accounts Receivable * Quarterly Tax Run
* Edit Mid-Career Seminar Slides * Mid-Career Seminar * SACRS Conference * Administrative Comm. Mtg (if Budget Adj or
Other Need)
* Historical Returns * Start 1099 process * Look for updated state and fed tax tables* Adjust retiree benefits for 415 (b) Limits
(adjustment covers 11/1- 1/1 payments)* IRS Tax publications/forms/withholding * Update retiree medical/dental/vision
premiums Mosquito District & Court * Retirement Security Week (3rd wk of mo) * Mail Medicare Part B letters ~12/1 (Nov. if possible)
* 1099s Test Run, Process & Coordinate Mail Date w/County Mail* Obtain new 415 & 401 (a) limits from IRS
(~10/20) or Cheiron* Submit CAFR to BOS & State
Auditor/Controller* Update Employer Breakdown Schedule * Update Retiree Payroll Calendar w/ NT * Auditor's Annual Report / CAFR* Order 1099 forms * 415(b) Limit Adjusted Benefits cont-12/1
payment* Prepare Mid-year Admin Budget Update
* Investment Round Table * Obtain PEPRA Comp limits from Cheiron (~11/28)
* Email Holiday Schedule to CBRE
* Review IRS Pubs (1099R General Filing, 1099R Magnetic Filing, Publication 575)
* Send IRS and PEPRA Comp Limits to County Payroll/ISD (Lori & Lynn) & all ERs
* Updated TEFRA Notice to Northern Trust (for Feb 1 mailing)
* Begin review of Policies (for Dec BOR) * Get Medicare Part B Premium; update letters
* GFOA submission
* PPCC Application * Check for new BOS/elected officials regarding membership
* 415(b) Limit Adjusted Benefits cont-1/1 payment
* Adopt Next Year's Board Calendar - oct * Finalize Annual Report* NCPERS survey* Finalize Audit* Audit Exit Interview with Audit Committee* Receive GASB 67/68 Report
November October
Annually
Quarterly
Monthly
Annually
Semi-Annually
Quarterly
Monthly
Semi-AnuallySemi-Annually
Quarterly
Monthly
Web Updates Web Updates Web Updates
Annually

2021ActionPlanSanJoaquinCountyEmployees’RetirementAssociation
1. Strengthen Fund Sustainability a. Deliver target investment return
2. Leverage technology to improve accuracy and efficiency
a. Implement Year 1 of five-year technology plan
3. Manage Risk a. Conduct Cyber-Security Audit b. Conduct Actuarial Audit c. Implement Alameda Decision d. Implement retirement-eligible compensation controls for both incoming contributions and
retirement calculations e. Assess Disaster Recovery procedures and identify opportunities for improvement f. Research Enterprise-Wide Risk Management (EWRM) methodologies
4. Improve Operational Efficiency
a. Include disability application processing time performance standard measurements in quarterly performance report.
b. Research providing retiree earnings statements electronically c. Reduce Complexity
i. Identify SJCERA-unique processes and opportunities to align with industry norms d. Improve website architecture and functionality
5. Deliver Excellent Service and Support to Stakeholders
a. Provide stakeholder communication and education i. Revise and update prioritized member communications and web content ii. Develop quality online SJCERA benefit videos
6. Maintain a High-Performing Workforce
a. Modify SJCERA job descriptions for career paths to meet organizational needs b. Implement approved changes to physical layout of the office c. Offer enterprise training on topics intended to strengthen SJCERA’s succession planning
7. Manage Emerging Organizational Needs
a. Assess need to issue RFPs for example for Custodian Bank, Investment Counsel, and Writing of Pension Administration RFP
b. Identify and begin implementing a 2022 Strategic Planning process
6 South El Dorado Street, Suite 400 • Stockton, CA 95202 (209) 468-2163 • [email protected] • www.sjcera.org
San Joaquin County Employees' Retirement Association October 1, 2020
TO: Board of Retirement FROM: Kathy Herman Assistant Chief Executive Officer SUBJECT: Pension System Enhancement Project Update The cutover which began on August 31, 2020 was successful and SJCERA is now live on one version of the Core 37 pension system. The following are some of the immediate improvements that are being realized:
• Additional access to tables and controls • Importing active member payroll data is quicker, more accurate and faster, eliminating
four hours of processing time every two weeks. • Active member system validations quickly identify missing codes, minimizing long term
corrections • The Contribution and Service register is updated every pay period, eliminating four to six
week lag. • Terminated members are automatically deferred, eliminating manual process • Refund of contributions are system generated, including taxes. Eliminating manual
calculation, completion County specific forms, hand delivery of documents and duplicate data entry into the County’s account payable system. In addition, the 1099R is automatically populated and electronic payment is now available through Northern Trust.
• Enhanced wildcard search capabilities, previously only available to IT staff. • Automatic status change for new retirees, eliminating manual process • Automatic interest eligibility update, eliminating manual process • New member process significantly automated, including assigning Member ID’s • Termination process significantly automated, reducing duplicate data entry
Next steps include:
• IT and Finance closely monitoring all transactions • Troubleshooting issues with the above • Confirm “change of address” override problem has been eliminated • Ongoing staff training • Activate member payroll business validations • Clarify what is unfinished • Prioritize the remaining work
Data clean-up is ongoing and critical to the proper functionality of any system. Staff will continue to look for issues and make corrections.
MONITORThe Latest in Legislative News
THE NCPERS
September 2020
NATIONAL CONFERENCE ON PUBLIC EMPLOYEE RETIREMENT SYSTEMS
NCPERS has teamed up with two public-sector retirement organizations to recommend changes to a standard-setting organization’s proposal on how actuaries should measure certain pension risks.
A comment letter to the Actuarial Standards Board (ASB) spearheaded by the National Association of State Retirement Administrators (NASRA) praised the board’s embrace of a low-default risk obligation measure. However, this calculation does not belong in the exposure draft under consideration, which would revise Actuarial Standards of Practice No. 4 (ASOP 4), the authors argued. NCPERS and the National Council on Teacher Retirement (NCTR) joined NASRA in signing the July 30 letter.
ASOP 4, which was last revised in 2013, is titled Measuring Pension Obligations and Determining Pension Plan Costs or Contributions. In December 2014, ASB formed a Pension Task Force to address potential changes and began discussing how to calculate and disclose a
CONTINUED ON PAGE 5
In This Issue2 Fall Congressional
Agenda
Photo Illustration ©
202
0, Shutterstock.com
This month, we wil l highlight Maine, Michigan, North Carolina and Oregon.
4 Around the Regions
As we move through the virtual party conventions and into the home stretch of the election season, Congressional legislative actions will become fewer and fewer.
Photo Illustration ©
20
20
, adobestock.com
F AFINANCIAL
ACTUARIAL
L LLEGISLATIVE
LEGAL September 29-30, 2020
CONFERENCE
The NCPERS Financial, Actuarial, Legislative & Legal (FALL) Conference, scheduled for September 29 and 30, is a creative response to extraordinary circumstances. It is, essentially, an unconventional convention that will bring our community together for two days of in-depth learning and networking from the safety of our own workspaces.
3 Executive Directors Corner
Public Pension Trade Groups to Actuarial Standards Board: Rethink New Risk Measurement
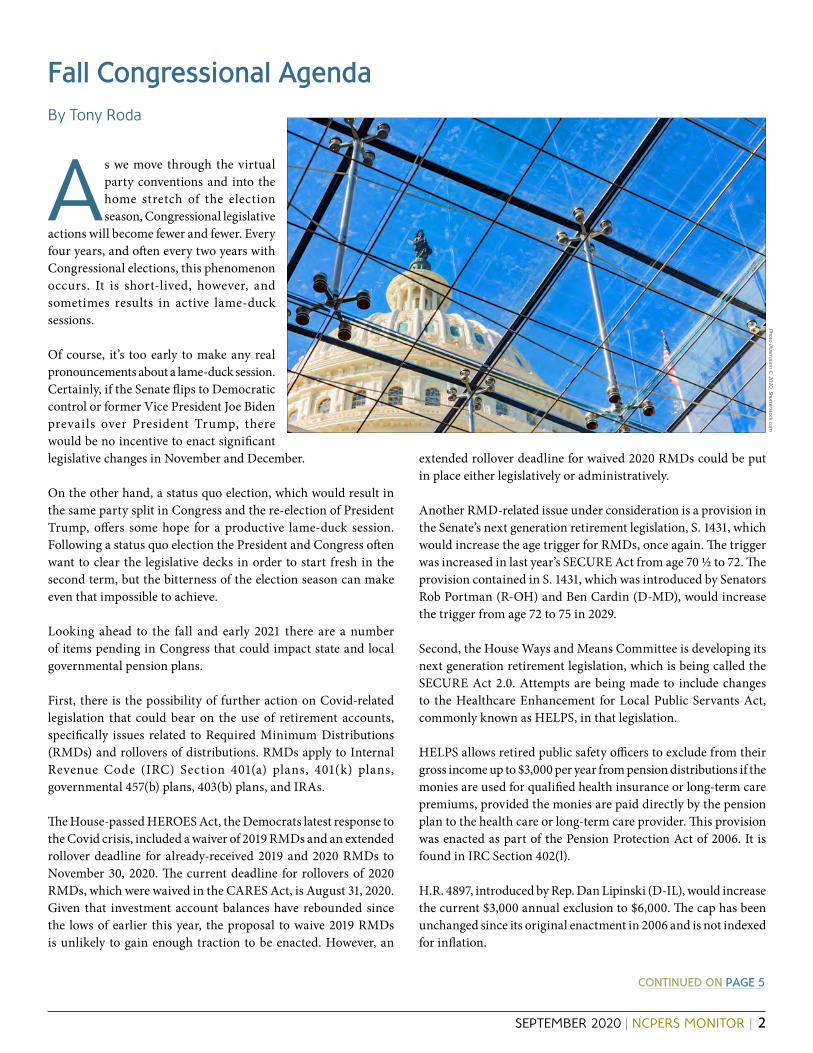
SEPTEMBER 2020 | NCPERS MONITOR | 2
As we move through the virtual party conventions and into the home stretch of the election season, Congressional legislative
actions will become fewer and fewer. Every four years, and often every two years with Congressional elections, this phenomenon occurs. It is short-lived, however, and sometimes results in active lame-duck sessions.
Of course, it’s too early to make any real pronouncements about a lame-duck session. Certainly, if the Senate flips to Democratic control or former Vice President Joe Biden prevails over President Trump, there would be no incentive to enact significant legislative changes in November and December.
On the other hand, a status quo election, which would result in the same party split in Congress and the re-election of President Trump, offers some hope for a productive lame-duck session. Following a status quo election the President and Congress often want to clear the legislative decks in order to start fresh in the second term, but the bitterness of the election season can make even that impossible to achieve.
Looking ahead to the fall and early 2021 there are a number of items pending in Congress that could impact state and local governmental pension plans.
First, there is the possibility of further action on Covid-related legislation that could bear on the use of retirement accounts, specifically issues related to Required Minimum Distributions (RMDs) and rollovers of distributions. RMDs apply to Internal Revenue Code (IRC) Section 401(a) plans, 401(k) plans, governmental 457(b) plans, 403(b) plans, and IRAs.
The House-passed HEROES Act, the Democrats latest response to the Covid crisis, included a waiver of 2019 RMDs and an extended rollover deadline for already-received 2019 and 2020 RMDs to November 30, 2020. The current deadline for rollovers of 2020 RMDs, which were waived in the CARES Act, is August 31, 2020. Given that investment account balances have rebounded since the lows of earlier this year, the proposal to waive 2019 RMDs is unlikely to gain enough traction to be enacted. However, an
extended rollover deadline for waived 2020 RMDs could be put in place either legislatively or administratively.
Another RMD-related issue under consideration is a provision in the Senate’s next generation retirement legislation, S. 1431, which would increase the age trigger for RMDs, once again. The trigger was increased in last year’s SECURE Act from age 70 ½ to 72. The provision contained in S. 1431, which was introduced by Senators Rob Portman (R-OH) and Ben Cardin (D-MD), would increase the trigger from age 72 to 75 in 2029.
Second, the House Ways and Means Committee is developing its next generation retirement legislation, which is being called the SECURE Act 2.0. Attempts are being made to include changes to the Healthcare Enhancement for Local Public Servants Act, commonly known as HELPS, in that legislation.
HELPS allows retired public safety officers to exclude from their gross income up to $3,000 per year from pension distributions if the monies are used for qualified health insurance or long-term care premiums, provided the monies are paid directly by the pension plan to the health care or long-term care provider. This provision was enacted as part of the Pension Protection Act of 2006. It is found in IRC Section 402(l).
H.R. 4897, introduced by Rep. Dan Lipinski (D-IL), would increase the current $3,000 annual exclusion to $6,000. The cap has been unchanged since its original enactment in 2006 and is not indexed for inflation.
By Tony Roda
Fall Congressional Agenda
CONTINUED ON PAGE 5
Photo Illustration ©
20
20
, Shutterstock.com

SEPTEMBER 2020 | NCPERS MONITOR | 3
Sometimes it seems that the world has stopped, but in the public pension arena, we know that’s not true. Pension systems are busy and are keenly focused on delivering on their promises to their members. To help our members continue to do just that,
we at NCPERS are focused on delivering quality educational offerings.
The NCPERS Financial, Actuarial, Legislative & Legal (FALL) Conference, scheduled for September 29 and 30, is a creative response to extraordinary circumstances. It is, essentially, an unconventional convention that will bring our community together for two days of in-depth learning and networking from the safety of our own workspaces.
The FALL Conference is structured into three tracks to provide opportunities for in-depth learning in Financial, Actuarial, Legislative & Legal matters impacting public pensions.
The schedule provides time for everything you expect from an NCPERS conference—keynotes, breakout sessions, networking, and even an exhibit, all delivered virtually. And it is compact, with sessions scheduled six hours each day, starting at 11 A.M. EDT and concluding at 5 P.M. EDT.
Two keynotes will serve as bookends for the conference. We will open with Randi Weingarten, president of the American Federation of Teachers, presenting our opening keynote. The renowned labor leader, educator, and lawyer will address our imperative to protect public employees and pensions during a triple crisis—a health crisis, an economic crisis, and a justice crisis. In the closing session, we will hear firsthand from a pioneering doctor and medical researcher, Camillo Ricordi, on efforts underway to develop a potentially groundbreaking therapy for Covid-19 patients. A distinguished professor at the
Executive Directors CornerNCPERS
NCPERS FALL Conference Delivers Real Value Virtually
University of Miami, Dr. Ricordi will illuminate how we can all band together to fight the battle against Covid-19.
In between, we will have 18 separate breakout sessions—seven in the financial track, six in the legislative and legal track, and five in the actuarial track—as well as four express talks. Sessions will explore big-picture issues, such as pandemic aftershocks, societal changes, and the outlook for global equity markets, as well as more granular matters, such as responding to cyber-attacks, reconsidering pension obligation bonds, and sustainable investing strategies.
Participating is easy. You will receive an email from NCPERS with your log in instructions; once you have logged in to the ‘welcome’ page, go to the ‘agenda’ page for all of our sessions. You will be able to join the sessions live here and view the sessions until December 1!
Getting the most out of a virtual conference is easy too, but it does take planning. It’s important to block out time to attend, just as you would if you were traveling out of town for a conference. Put away distractions and silence your phone so you can concentrate on the learning experience. Test your technology before you get online. Use the live chat function to participate in Q&A sessions. Engage on social media, and reach out to people you’ve met or would like to meet.
We are all continuing to adapt and adjust to the situation in which we find ourselves. Our signature events like the Annual Conference & Exhibition will be back as soon as it’s safe. But in the meantime, our gathering space is virtual, and our need to keep learning and growing hasn’t changed. We look forward to seeing many of you at the Fall Conference. u
F AFINANCIAL
ACTUARIAL
L LLEGISLATIVE
LEGALA Virtual Event with Educational Tracks September 29-30, 2020
NCPERS CONFERENCE
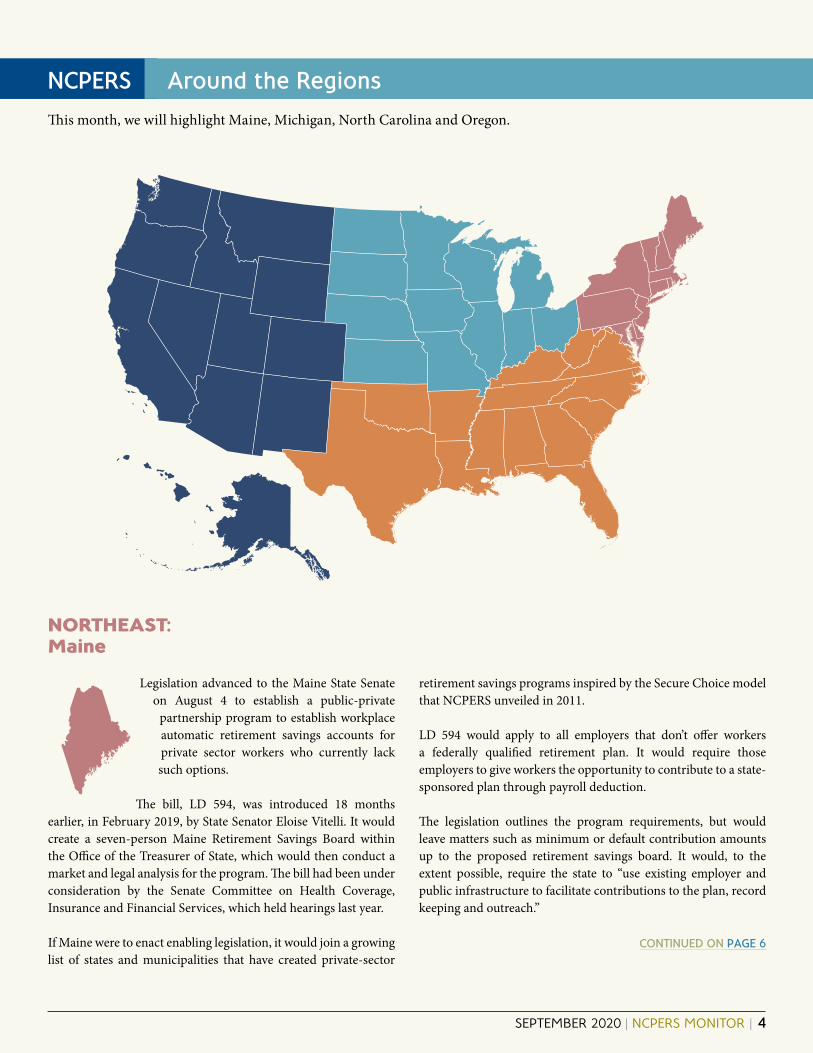
Around the RegionsNCPERS
SEPTEMBER 2020 | NCPERS MONITOR | 4
Around the RegionsNCPERS
NORTHEAST:Maine
Legislation advanced to the Maine State Senate on August 4 to establish a public-private
partnership program to establish workplace automatic retirement savings accounts for private sector workers who currently lack such options.
The bill, LD 594, was introduced 18 months earlier, in February 2019, by State Senator Eloise Vitelli. It would create a seven-person Maine Retirement Savings Board within the Office of the Treasurer of State, which would then conduct a market and legal analysis for the program. The bill had been under consideration by the Senate Committee on Health Coverage, Insurance and Financial Services, which held hearings last year.
If Maine were to enact enabling legislation, it would join a growing list of states and municipalities that have created private-sector
This month, we will highlight Maine, Michigan, North Carolina and Oregon.
retirement savings programs inspired by the Secure Choice model that NCPERS unveiled in 2011.
LD 594 would apply to all employers that don’t offer workers a federally qualified retirement plan. It would require those employers to give workers the opportunity to contribute to a state-sponsored plan through payroll deduction.
The legislation outlines the program requirements, but would leave matters such as minimum or default contribution amounts up to the proposed retirement savings board. It would, to the extent possible, require the state to “use existing employer and public infrastructure to facilitate contributions to the plan, record keeping and outreach.”
CONTINUED ON PAGE 6

SEPTEMBER 2020 | NCPERS MONITOR | 5
RETHINK NEW RISK MEASUREMENT CONTINUED FROM PAGE 1
FALL CONGRESSIONAL AGENDA CONTINUED FROM PAGE 2
solvency value for funding purposes. The ASB issued its first exposure draft of proposed revisions in March 2018 and a second exposure draft in December 2019. A public comment period closed July 31.
In its second exposure draft, the ASB maintained that the calculation and disclosure of a low-default-risk obligation measure provides appropriate, useful information regarding the funded status of a pension plan. It praised the ASB for improving upon what it originally called the investment risk defeasement measure in the first exposure draft, and for making clear in the second exposure draft that the new risk measure is intended to be informative, not prescriptive.
But while the risk measure was improved in the second exposure, it does not belong in ASOP 4, NASRA, NCPERS, and NCTR said. The purpose of the risk measure is to gauge a plan’s level of risk, a purpose that is inconsistent with ASOP 4 but is consistent with ASOP 51, which is titled Assessment and Disclosure of Risk Associated with Measuring Pension Obligations and Determining Pension Plan Contributions, the letter said.
The risk measure belongs in ASOP 51, the letter said. “Because the purpose of an actuarial valuation is to measure a pension plan’s obligations and costs, our overarching concern with the second exposure draft is that the proposed [risk measure] will result in confusion to users,” it stated.
The letter noted that ASOP 51 does not include mandatory quantitative risk assessments, nor does it require a specific one. Instead, ASOP 51 suggests various methods for assessment of risk. Many of the methods listed as examples in ASOP 51 would be more generally applicable than the proposed LDROM currently prescribed in the ASOP 4 exposure draft, the authors wrote. But confusion and misinterpretations may result if funds are required to calculate and report a low-default-risk obligation measure while also complying with ASOP 51, the letter said. u
DON’T DELAY!
Renew Your MembershipOnline Today!
Renew Your Membershipat http://ncpers.org/Members/
Tony Roda is a partner at the Washington, D.C. law and
lobbying firm Williams & Jensen, where he specializes in
federal legislative and regulatory issues affecting state
and local governmental pension plans. He represents
NCPERS and statewide, county, and municipal pension
plans in California, Colorado, Georgia, Kentucky, Ohio,
Tennessee, and Texas. He has an undergraduate
degree in government and politics from the University
of Maryland, J.D. from Catholic University of America,
and LL.M (tax law) from Georgetown University.
Also, H.R. 6436, introduced by Reps. Steve Chabot (R-OH) and Kendra Horn (D-OK), would repeal the direct payment requirement. This requirement is not an excessive burden when the pension plan needs to interact with one or just a handful of insurance providers. However, in many cases pension plans must interface with dozens of insurance providers or, as one public plan said in a letter to Congress, “hundreds of insurance companies…” In fact, this administrative complexity has led some plans to decide not to offer the HELPS benefit to its retired first responders.
Additional issues are certain to arise in the next Congress, particularly if there is a change in the presidency or in party control of the Senate. New priorities will certainly emerge if either situation occurs.
Please be aware that NCPERS will keep you apprised as relevant and significant events unfold. u
Around the RegionsNCPERS
SEPTEMBER 2020 | NCPERS MONITOR | 6
MIDWEST:Michigan
Two City of Grand Rapids pension funds are seeking class-action status in a lawsuit
against the Bayer pharmaceutical company, arguing that the company deceived and misled investors in its acquisition of Monsanto. The case was
filed in July in the U.S. District Court for the Northern District of California.
The city’s General Retirement System and Police and Fire Retirement System said that, during the acquisition, Bayer downplayed the risks from Monsanto’s Roundup weed-killer, Pensions & Investments reported. Bayer’s purchase of Monsanto was announced in September 2016 and completed in June 2018.
The chemical ingredients in Roundup were classified as “probably carcinogenic to humans” in early 2016. The company was hit with numerous lawsuits from consumers who claimed their cancers were caused by the herbicide.
Between May 23, 2016, and March 19, 2019—the period covered by the proposed class action—Bayer misled the public by downplaying liability risks related to Roundup, the pension funds argued. Instead, Bayer presented the Monsanto deal as a compelling transaction that would create significant shareholder value by generating “stronger growth, better profitability, and a more resilient business profile.”
In 2018, a California Superior Court jury unanimously fund that Monsanto’s Roundup was a “substantial factor” in causing a plaintiff to develop non-Hodgkin’s lymphoma.” In 2019, the U.S. District Court for the Northern District of California made a similar finding.
SOUTHEAST:North Carolina
North Carolina’s state pension system has bounced back from Covid-19-induced
stock market shocks, producing a 6.38% return in the second quarter, State Treasurer Dale Folwell announced.
After recording a $4.2 billion drop in the first quarter, the state pension plan has now
surpassed its record value set in December 2019, Folwell said. The system’s assets totaled $103.9 billion on June 30, an increase of $5.6 billion from $98.3 billion at the end of the 1st quarter of 2020. As of August 14, assets had climbed further to $107.3 billion, exceeding the fund’s 2020 high of $106.9 billion in February prior to the Covid-19 economic shutdown.
“A 6.38% return during one of the most volatile markets I’ve ever seen is a testament to the great work done here by our investment management team,” Folwell said. “We’ve maintained the conservative investment strategies of previous state treasurers, allowing us to minimize losses during the down market, and to also see substantial gains when the market rebounded.”
The treasurer’s office also reported that its internal passive equity funds yielded second-quarter returns of 20.84% and 24.71%, in lined with the Russell 200 and the Russell Mid Cap indexes respectively. North Carolina created the first-ever Department of State Treasurer internally managed passive index funds in November 2017, and currently manages $11.6 billion in these funds.
AROUND THE REGIONS CONTINUED FROM PAGE 4
CONTINUED ON PAGE 7

Around the RegionsNCPERS
SEPTEMBER 2020 | NCPERS MONITOR | 7
WEST:Oregon
The Oregon Supreme Court on August 6 upheld certain reductions in public
employee pension benefits that state lawmakers passed in 2019. As a result of the decision, employees will shoulder increased costs for pension benefits, and
a $195,000 limit on the final salary will be applied in some benefit calculations.
An Oregon Public Employee Retirement System (PERS) coalition had asked the court to strike down parts of the state’s pension reform law on grounds that the changes breached the PERS contract with workers and impacted benefits that workers had already earned.
The court concluded that the legislative actions—first, to divert a portion of employees’ contributions to a new account designed to lower employer costs, and second, to institute a permanent cap on the salary against which benefits are calculated—only impacted
future benefits and that the statutes at issue did not contain a promise that was “irrevocable.” The court did, however, reaffirm that benefits for service already provided are fully protected and cannot be changed.
The decision raises issues of generational equity, recruitment and retention, and what is morally right, said Aruna Basih, a partner with the Portland, Ore., law firm of Bennett Hartman, who represented PERS coalition members.
Starting July 1, 2020, people earning more than $2,500 a month lost a portion of the 6% of salary that previously went into individual account programs. Instead, the funds are being diverted into a new account to lower employer costs. The amount diverted would be either 0.75% or 2.5% depending on the employee’s tier level. The diversion will stay in effect until the PERS fund is 90% funded, and it provides no benefit to members.
The salary cap change affects benefits after January 1, 2020, and the diversion affects benefits after July 1, 2020. Benefits earned prior to that remain protected. u
AROUND THE REGIONS CONTINUED FROM PAGE 6
Don’t Miss NCPERS’ Social Media

SEPTEMBER 2020 | NCPERS MONITOR | 8
SeptemberNCPERS F.A.L.L. Conference September 29-30, 2020A Virtual Event
Daniel FortunaPresident
Kathy HarrellFirst Vice President
Dale ChaseSecond Vice President
Carol Stukes-BaylorSecretary
Will PryorTreasurer
Mel AaronsonImmediate Past President
2020 Conferences 2020-2021 Officers
Executive Board MembersState Employees ClassificationStacy BirdwellJohn Neal
County Employees ClassificationTeresa Valenzuela
Local Employees ClassificationSherry MoseThomas RossRalph Sicuro
Police ClassificationKenneth HauserJames Sklenar
Fire ClassificationDan GivensEmmit KaneJames Lemonda
Educational ClassificationDavid KazanskyRichard Ingram
Protective ClassificationPeter Carozza, Jr.Ronald Saathoff
Canadian ClassificationFrank Ramagnano
The Monitor is published by the National Conference on Public Employee Retirement Systems. Website: www.NCPERS.org • E-mail: [email protected]
Photo Illustration ©
20
20
, Shutterstock.com
The Voice for Public Pensions