michigan state employees’ retirement system€¦ · michigan state employees’ retirement system...
TRANSCRIPT
MICHIGAN STATE EMPLOYEES’ RETIREMENT SYSTEM • 1
Michigan State Employees’ Retirement System A Pension and Other Employee Benefit Trust Fund of the State of Michigan
Comprehensive Annual Financial Report for the Fiscal Year Ended September 30, 2009
M S E R S
Prepared by: Financial Services
for Office of Retirement Services
P.O. Box 30171 Lansing, Michigan 48909-7671
517-322-5103 1-800-381-5111
2 • MICHIGAN STATE EMPLOYEES’ RETIREMENT SYSTEM
Table of Contents Introductory Section
Certificate of Achievement....................................................................................................................................... 4 Public Pension Standards Award.............................................................................................................................. 5 Letter of Transmittal................................................................................................................................................. 6 Retirement Board Members ................................................................................................................................... 12 Advisors and Consultants ...................................................................................................................................... 12 Organization Chart ................................................................................................................................................ 13
Financial Section
Independent Auditor’s Report ................................................................................................................................ 16 Management’s Discussion and Analysis ................................................................................................................ 18 Basic Financial Statements Statements of Pension Plan and Other Postemployment Benefit Plan Net Assets.............................................. 22 Statements of Changes in Pension Plan and Other Postemployment Benefit Plan Net Assets........................... 23 Notes to Basic Financial Statements .................................................................................................................. 24 Required Supplementary Information Schedules of Funding Progress........................................................................................................................... 43 Schedules of Employer and Other Contributions ............................................................................................... 44 Note to Required Supplementary Information ....................................................................................................... 45 Supporting Schedules ............................................................................................................................................. 46
Investment Section
Report on Investment Activity ............................................................................................................................... 52 Asset Allocation ..................................................................................................................................................... 72 Investment Results ................................................................................................................................................. 73 List of Largest Stock Holdings............................................................................................................................... 74 List of Largest Bond Holdings ............................................................................................................................... 74 Schedule of Investment Fees .................................................................................................................................. 75 Schedule of Investment Commissions.................................................................................................................... 76 Investment Summary.............................................................................................................................................. 77
Actuarial Section
Actuary’s Certification ........................................................................................................................................... 80 Summary of Actuarial Assumptions and Methods................................................................................................. 82 Schedule of Active Member Valuation Data.......................................................................................................... 84 Schedule of Changes in the Retirement Rolls ........................................................................................................ 84 Prioritized Solvency Test ....................................................................................................................................... 85 Analysis of System Experience .............................................................................................................................. 87 Summary of Plan Provisions ................................................................................................................................. 88
Statistical Section
Schedules of Additions by Source.......................................................................................................................... 93 Schedules of Deductions by Type .......................................................................................................................... 94 Schedules of Changes in Net Assets....................................................................................................................... 95 Schedules of Benefits and Refunds by Type .......................................................................................................... 96 Schedules of Retired Members by Type of Benefit................................................................................................ 97 Schedule of Other Postemployment Benefits ......................................................................................................... 99 Schedules of Average Benefit Payments.............................................................................................................. 100 Ten Year History of Membership......................................................................................................................... 104
Acknowledgements....................................................................................................................................................... 105
MICHIGAN STATE EMPLOYEES’ RETIREMENT SYSTEM • 3
INTRODUCTORY SECTION
Certificate of Achievement Public Pension Standards Award
Letter of Transmittal Retirement Board Members
Advisors and Consultants Organization Chart
INTRODUCTORY SECTION
4 • MICHIGAN STATE EMPLOYEES’ RETIREMENT SYSTEM
Certificate of Achievement

INTRODUCTORY SECTION
MICHIGAN STATE EMPLOYEES’ RETIREMENT SYSTEM • 5
Public Pension Standards Award
P CP C Public Pension Coordinating Council
Public Pension Standards Award For Funding and Administration
2009
Presented to
Michigan Office of Retirement Services
In recognition of meeting professional standards for
plan funding and administration as set forth in the Public Pension Standards.
Presented by the Public Pension Coordinating Council, a confederation of
National Association of State Retirement Administrators (NASRA)
National Conference on Public Employee Retirement Systems (NCPERS) National Council on Teacher Retirement (NCTR)
Alan H. Winkle
Program Administrator
INTRODUCTORY SECTION
6 • MICHIGAN STATE EMPLOYEES’ RETIREMENT SYSTEM
Letter of Transmittal
State Employees’ Retirement System P.O. Box 30171 Lansing, Michigan 48909 Telephone 517-322-5103 Outside Lansing 1-800-381-5111
STATE OF MICHIGAN
JENNIFER M. GRANHOLM, Governor
DEPARTMENT OF MANAGEMENT AND BUDGET
December 23, 2009 The Honorable Jennifer M. Granholm Governor, State of Michigan, Members of the Legislature State of Michigan, Retirement Board Members and Members, Retirees and Beneficiaries Ladies and Gentlemen: We are pleased to present the comprehensive annual financial report of the Michigan State Employees’ Retirement System (System) for fiscal year 2009. INTRODUCTION TO REPORT The System was established by legislation under Public Act 240 of 1943 (the Michigan State Employees’ Retirement Act) and is administered by the Office of Retirement Services (ORS). The number of active and retired members and beneficiaries of the System and a list of participating employers is presented in Note 1 of the financial statements in the Financial Section of this report. The purpose of the System is to provide benefits for all State Employees. The services performed by the staff provide benefits to members. Responsibility Responsibility for both the accuracy of the data and the completeness and fairness of the presentation, including all disclosures, rests with the leadership team of the System. To the best of our knowledge and belief, the enclosed data is accurate in all material respects and is reported in a manner designed to present fairly the financial position and results of operations of the System. Internal Control Structure The leadership team of the System is responsible for maintaining adequate internal accounting controls designed to provide reasonable assurance that transactions are executed in accordance with management’s general or specific authorization, and are recorded as necessary to maintain accountability for assets and to permit preparation of financial statements in accordance with accounting principles generally accepted in the United States of America. The internal
INTRODUCTORY SECTION
MICHIGAN STATE EMPLOYEES’ RETIREMENT SYSTEM • 7
Letter of Transmittal (continued) control structure is designed to provide reasonable assurance regarding the safekeeping of assets and reliability of all financial records. Independent Auditors and Actuary The Office of the Auditor General (OAG), independent auditors, conducted an annual audit of the System. The independent auditor’s report on the System’s financial statements is included in the Financial Section of this report. Statute requires an annual actuarial valuation be conducted. The purpose of the valuation is to evaluate the mortality, service, compensation and other financial experience of the System and to recommend employer-funding rates for the subsequent year. The annual actuarial valuation was completed by Gabriel Roeder Smith & Company for the fiscal year ended September 30, 2008. Actuarial certification and supporting statistics are included in the Actuarial Section of this report. Management’s Discussion and Analysis (MD&A) Generally Accepted Accounting Principles (GAAP) require that management provide a narrative introduction, overview, and analysis to accompany the Basic Financial Statements in the form of MD&A. This letter of transmittal is intended to complement MD&A and should be read in conjunction with it. The MD&A can be found immediately following the Independent Auditor’s Report. PROFILE OF THE GOVERNMENT The System was established by Public Act 240 of 1943 and is administered by a nine-member board under the direction of the Executive Secretary. Public Act 216 of 1974 eliminated the requirement for member contributions and provided for financing by legislative appropriation and investment earnings. Effective March 31, 1997, Public Act 487 of 1996 closed the plan to new applicants. All new employees become members of the State’s defined contribution plan. The public act also allows for returning employees and members who left state employment on or before March 31, 1997, to elect the defined benefit plan instead of the defined contribution plan. ECONOMIC CONDITIONS AND OUTLOOK Despite challenging economic times, the System continues to show steady performance over the long-term. Investments The State Treasurer is the investment fiduciary and custodian of all investments of the System pursuant to State law. The primary investment objective is to maximize the rate of return on the total investment portfolio, consistent with a high degree of prudence and sufficient diversity to eliminate inordinate risks and to meet the actuarial assumption for the investment return rate. The investment activity for the year produced a total rate of return on the portfolio of (6.3)%. For the last five years, the System has experienced an annualized rate of return of 4.1%. A summary of asset allocation and rates of return can be found in the Investment Section of this report.
Accounting System Transactions of the System are reported on the accrual basis of accounting. Revenues are recorded when earned and expenses are recorded when incurred. Participants’ benefits are recorded when payable by law. We believe the accounting and administrative internal controls established by the System provide reasonable assurance the System is carrying out its responsibilities in safeguarding its assets, in maintaining the reliability of financial records for preparing the financial statements, and in maintaining accountability for its assets.
INTRODUCTORY SECTION
8 • MICHIGAN STATE EMPLOYEES’ RETIREMENT SYSTEM
Letter of Transmittal (continued) Funding Funds are derived from the excess of additions to plan net assets over deductions from plan net assets. Funds are accumulated by the System to meet future benefit obligations to retirees and beneficiaries. The percentage computed by dividing the actuarial value of assets by the actuarial accrued liability is referred to as the “funded ratio.” This ratio provides an indication of the funding status of the System and generally, the greater this percentage, the stronger the System. Effective in fiscal year 2001, the System uses the actuarial valuation from the previous fiscal year for this report in accordance with Governmental Accounting Standards Board (GASB) Statement No. 25. Consistent with this approach, the most recent actuarial valuation was performed as of September 30, 2008. The actuarial value of the assets and actuarial accrued liability of the System were $11.4 billion and $13.8 billion, respectively, resulting in a funded ratio of 82.8% on September 30, 2008. An historical perspective of funding levels for the System is presented on the Schedule of Funding Progress in the Required Supplementary Information in the Financial Section of this report. Postemployment Benefits In fiscal year 2007, the System implemented Governmental Accounting Standards Board (GASB) Statement No. 43, Financial Reporting for Postemployment Benefit Plans Other Than Pension Plans. A GASB No. 43 compliant actuarial valuation is completed annually to determine the actuarial accrued liability if the postemployment benefits were to be pre-funded. If these benefits were pre-funded, the actuarial accrued liability as of September 30, 2008 would be approximately $13.5 billion. Only members of the defined benefit plan were included when calculating the actuarial accrued liability. Statement No. 43 does not require retroactive application of the reporting changes. Therefore, only three valuation years are presented and included in the required supplementary information of this report. In fiscal year 2008 the State of Michigan adopted Government Accounting Standards Board (GASB) Statement No. 45, Accounting and Financial Reporting by Employers for Postemployment Benefits Other Than Pensions. Because GASB Statement No. 45 requires the exclusion of all postemployment benefits, all assets accumulated as a result of retiree contributions collected in excess of retiree healthcare benefits, along with all fiscal year 2008 activity, were accounted for within the Reserve for OPEB Related Benefits in fiscal year 2008. OPEB benefits were accounted for according to GASB Statement No. 45 guidance in fiscal year 2009. MAJOR GOALS ACCOMPLISHED The Michigan Department of Management and Budget, Office of Retirement Services (ORS) is an innovative retirement organization driven to empower our customers for a successful today and a secure tomorrow. During fiscal year 2009, we concluded our strategic planning process outlining the next three years of business goals. The project united staff members from across the organization, generated fresh and unique perspectives, and created broad staff support of the strategic objectives. Focus on our Customer
miAccount offers secure, online access to personal account information - miAccount, which premiered in 2008, continues to grow in popularity. During its first full year of operations over 65,000 customers registered to use the system and performed more than 43,000 individual transactions without any support from ORS staff. Because of miAccount, we experienced a 30 percent reduction in paper forms for addresses and tax changes, a 62 percent reduction in paper beneficiary nomination forms, and a 33 percent reduction in telephone calls requesting pension estimates.
One of the most popular features of miAccount is the Message Board, which is a secure environment where members can leave account-specific questions; we respond to most of these messages within 12 business hours. Due to the popularity of this service, we completed 7.5 percent more customer contacts as compared to 2008.
Retirees who use miAccount reported a 91 percent satisfaction rate with the service. ORS will continue to focus resources to market the service to our members and to expand the services available through miAccount.

INTRODUCTORY SECTION
MICHIGAN STATE EMPLOYEES’ RETIREMENT SYSTEM • 9
Letter of Transmittal (continued)
Delivered 1099-Rs earlier than ever - For the first time, retirees were able to view and print their 1099-Rs through miAccount, our account access tool. We sent an email to registered miAccount users to let them know their 1099-Rs, a statement of distributions for tax purposes, were available on December 29, 2008, which was also the first time we have marketed our products or services through email. We delivered paper copies of 1099-Rs to retirees in the first full week of January. The combination of online accessibility and early delivery resulted in a 38 percent reduction in the number of calls received requesting 1099-R reprints.
Broad survey guides business practices - We conducted a Customer Needs and Expectations Study to determine what is important to our active and retired members. Study categories included accessibility, communication, education, flexibility, innovation, courtesy, and confidence. This study tells us what are our customers’ expectations and helps us determine what services we will offer in the future.
Customer satisfaction is high - We conducted three annual surveys of our active members, retired members, and members who had recently contacted us. We asked a variety of questions including how they rated our service. Over 88 percent of active members rated our service good to excellent, and over 90 percent of retiree respondents rated our service good to excellent. Members who have recently contacted us echoed this satisfaction and gave us a customer satisfaction rating of 89 percent.
Customer service continues to drive daily business - We continue to be accessible and responsive to our customers. We answered 223,259 customer telephone calls, assisted 7,714 customers face-to-face, and replied to 51,826 electronic messages on the new, secure miAccount message board.
In addition to direct customer interaction, we continue to offer customers easily accessible sources of clear, concise information about their retirement plans through our websites, seminars, and publications. As more of our customers use these tools, they become more knowledgeable and have less need to contact us with basic questions, giving us capacity to respond to more complicated customer inquiries.
New training sessions for soon-to-retire members - We crafted Ready Set Retire sessions to help members who are retiring in the next 12 months to better understand their pension estimates and assist with questions they may have as they prepare for this significant life change.
Member Statements feature new design - We mailed 264,000 Member Statements to our active members. The Member Statements featured a new efficient one-page, double-sided design displaying personal account details including service credit, contributions, wages, employer, and beneficiary data. The statement mailing included a PROactive newsletter, which provides retirement planning information to working employees.
Online tutorials offer customers the option of self-education - We created and posted five tutorials to the state employee website covering pension eligibility, pension calculation, and pension payment options. Two additional tutorials cover specific information for conservation officers and those who are eligible for a supplemental pension because they work directly with prisoners.
Webinars offer new avenue for customer education - We began delivering pilot seminars to state employees via webinar. During this pilot, we served more than 350 members. Feedback has been positive as customers learn about their plan in an interactive way but in the comfort of their homes and at more convenient times.
Convenient services available through payroll deduction - Partnering with the Civil Service Commission Employee Benefits Division, we now offer retirees the option of using pension payroll deduction to participate in Benefits for Life, a voluntary benefits program. Retirees are able to choose from a combination of benefits and features that may help meet their personal and family insurance needs, and have their premiums withheld from their pension payments.
INTRODUCTORY SECTION
10 • MICHIGAN STATE EMPLOYEES’ RETIREMENT SYSTEM
Letter of Transmittal (continued)
We’re going green with ING - In a joint effort to be more earth friendly, we have paired with ING to offer 457 and 401(k) plan participants paperless statements. Within a month of making the offering, seven percent of customers signed up for the new service, and we expect this to grow as we continue to market the new service.
Supporting Pure Michigan efforts - We carried the efforts of the Pure Michigan marketing campaign into our websites and newsletters to support attracting tourism to our state.
Continuously Improve Processes
Scanning decreases response time - We completed a massive imaging project converting member files into electronic files. Nearly 4,000 documents were imaged and now can be accessed within minutes, allowing us to quickly respond to customer queries.
Aligned staff to more efficiently meet customer demand - This year, we focused on our organizational goal of achieving a flexible, adaptable workforce by realigning processing staff into teams who share duties and a common goal. The small groups and team atmosphere allow ORS to shift resources rapidly to meet customer demand and to absorb seasonal business spikes. The realignment provided an opportunity for cross-training and enhanced additional quality assurance measures.
Optimize Technology
Insurance processing goes paperless - Our health insurance carriers for vision, dental, and prescription coverage replaced paper insurance enrollments with automatic digital file transfers. The solution improves accuracy, timeliness, and security of our enrollment process. We successfully streamlined Blue Cross Blue Shield of Michigan enrollments similarly in September 2008.
Upgraded software saves money, customer wait time - We delivered an automated workforce management solution. The new technology automates the scheduling of staff based on projected customer demand for calls, applications, and correspondence. As a result, customers have shorter wait times and our monthly toll-free costs have decreased.
Enhanced Information Security - Our Security Awareness Committee implemented measures to define the acceptable use of mobile devices and portable media to ensure proper handling of sensitive data. Our Security Advisory Committee deployed an information security self-assessment that highlighted our strong internal controls and also identified opportunities for future focus.
Small technology changes yield large savings - We implemented several cost-saving measures to reduce technology energy usage, telecommunication, and personal computer costs. The annual saving is estimated to be $15 per personal computer.
Promote a Positive Work Environment
Unified staff events, celebrations strengthen culture - In spite of tough economic times, we found a number of ways to show staff appreciation. In our annual ORS Excellence Awards, we recognized 30 staff members for dedication. We supported the Department of Management and Budget’s value of fun with picnics and holiday events.
ORS staff also generously participated in charitable activities such as the State Employees Combined Campaign, Harvest Gathering, and hosted a giving tree through the holiday season.
Additionally, we held two ORS all-staff meetings, providing opportunities to share business updates, respond to questions, and welcome new staff. Two planning committees, comprised of staff volunteers from across our organization, determined each agenda and coordinated the meetings.
INTRODUCTORY SECTION
MICHIGAN STATE EMPLOYEES’ RETIREMENT SYSTEM • 11
Letter of Transmittal (continued) AWARDS AND ACKNOWLEDGEMENTS ORS received the following recognitions:
• Certificate of Achievement for Excellence in Financial Reporting for our fiscal year 2008 Comprehensive Annual Financial Report. Awarded by the Government Finance Officers Association of the United States and Canada, 2008 marks the 18th consecutive year we received this prestigious award.
• Public Pension Standards 2009 Award by the Public Pension Coordinating Council for meeting standards for
public retirement system management and administration.
• ORS was named in the Best Practices Report of Cost Effectiveness Measurement, Inc. for written product planning, desired branding image, redesign of welcome package, testing of online tutorial participant knowledge, and for a new tool that helps define education objectives and measurements for its products and services.
• The Department of Management and Budget honored an ORS employee for her leadership with one of its five prestigious Employee Excellence Awards.
• The Office of the Governor honored an ORS employee for her embodiment of our shared values of Inclusion, Excellence, Integrity, and Teamwork.
Acknowledgements The preparation of this report was accomplished with the dedication and cooperation of many people. It is intended to provide complete and reliable information as a basis for making management decisions, as a means of determining compliance with legal provisions, and as a means for determining responsible stewardship of the funds of the System. We would, therefore, like to express our appreciation for the assistance given by staff, the advisors and the many people who contributed to its preparation. We believe their combined efforts have produced a report that will enable employers and plan members to better evaluate and understand the Michigan State Employees’ Retirement System. Their cooperation contributes significantly to the success of the System. Sincerely,
Lisa Webb Sharpe, Director Department of Management and Budget
Phillip J. Stoddard, Director Office of Retirement Services
INTRODUCTORY SECTION
12 • MICHIGAN STATE EMPLOYEES’ RETIREMENT SYSTEM
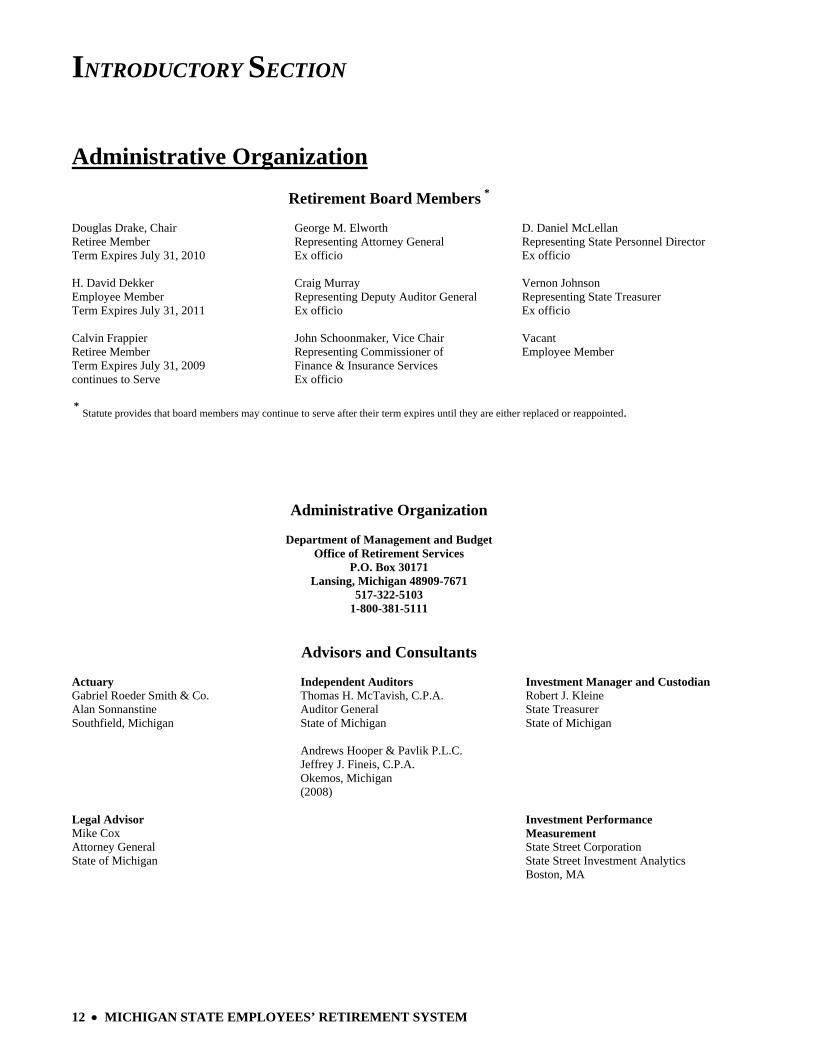
Administrative Organization Retirement Board Members * Douglas Drake, Chair Retiree Member Term Expires July 31, 2010
George M. Elworth Representing Attorney General Ex officio
D. Daniel McLellan Representing State Personnel Director Ex officio
H. David Dekker Employee Member Term Expires July 31, 2011
Craig Murray Representing Deputy Auditor General Ex officio
Vernon Johnson Representing State Treasurer Ex officio
Calvin Frappier Retiree Member Term Expires July 31, 2009 continues to Serve
John Schoonmaker, Vice Chair Representing Commissioner of Finance & Insurance Services Ex officio
Vacant Employee Member
* Statute provides that board members may continue to serve after their term expires until they are either replaced or reappointed.
Administrative Organization Department of Management and Budget
Office of Retirement Services P.O. Box 30171
Lansing, Michigan 48909-7671 517-322-5103
1-800-381-5111
Advisors and Consultants Actuary Gabriel Roeder Smith & Co. Alan Sonnanstine Southfield, Michigan
Independent Auditors Thomas H. McTavish, C.P.A. Auditor General State of Michigan Andrews Hooper & Pavlik P.L.C. Jeffrey J. Fineis, C.P.A. Okemos, Michigan (2008)
Investment Manager and Custodian Robert J. Kleine State Treasurer State of Michigan
Legal Advisor Mike Cox Attorney General State of Michigan
Investment Performance Measurement State Street Corporation State Street Investment Analytics Boston, MA
INTRODUCTORY SECTION
MICHIGAN STATE EMPLOYEES’ RETIREMENT SYSTEM • 13
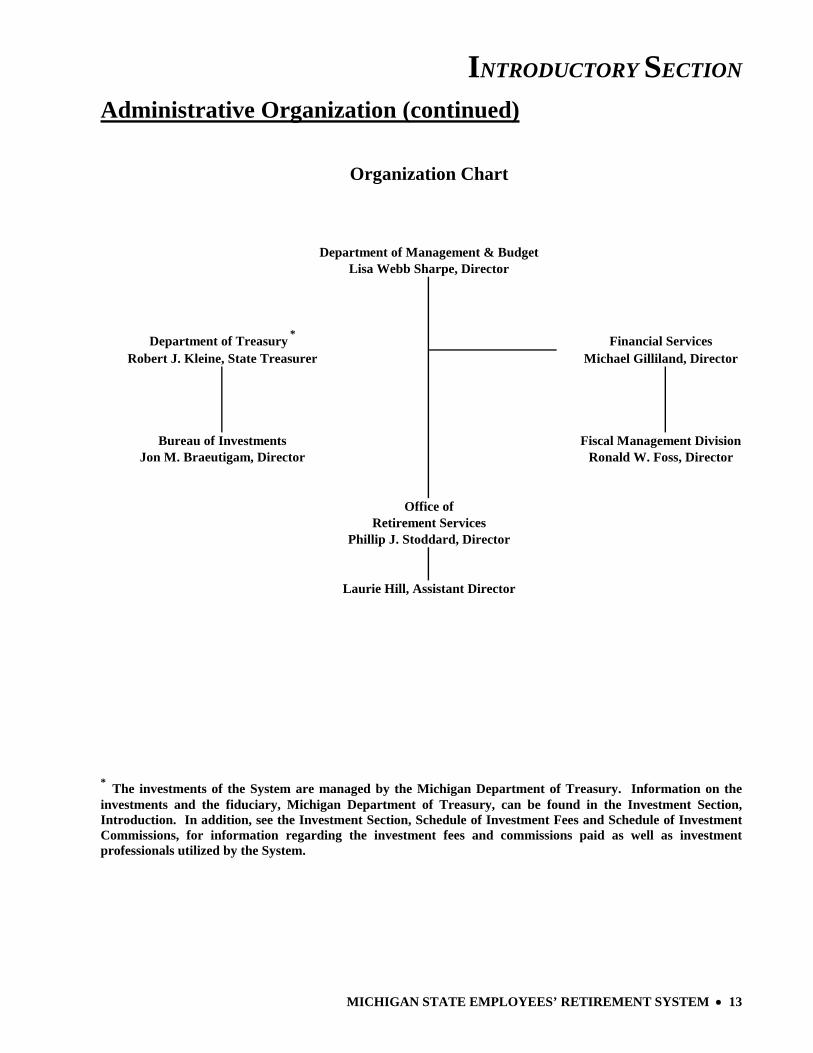
Administrative Organization (continued)
Financial ServicesMichael Gilliland, Director
Fiscal Management DivisionRonald W. Foss, Director
Office ofRetirement Services
Department of Treasury *
Phillip J. Stoddard, Director
Laurie Hill, Assistant Director
Bureau of InvestmentsJon M. Braeutigam, Director
Organization Chart
Department of Management & BudgetLisa Webb Sharpe, Director
Robert J. Kleine, State Treasurer
* The investments of the System are managed by the Michigan Department of Treasury. Information on the investments and the fiduciary, Michigan Department of Treasury, can be found in the Investment Section, Introduction. In addition, see the Investment Section, Schedule of Investment Fees and Schedule of Investment Commissions, for information regarding the investment fees and commissions paid as well as investment professionals utilized by the System.

14 • MICHIGAN STATE EMPLOYEES’ RETIREMENT SYSTEM
This page was intentionally left blank.

MICHIGAN STATE EMPLOYEES’ RETIREMENT SYSTEM • 15
FINANCIAL SECTION
Independent Auditor’s Report Management’s Discussion and Analysis
Basic Financial Statements Notes to Basic Financial Statements
Required Supplementary Information Note to Required Supplementary Information
Supporting Schedules
FINANCIAL SECTION
16 • MICHIGAN STATE EMPLOYEES’ RETIREMENT SYSTEM
Independent Auditor’s Report
FINANCIAL SECTION
MICHIGAN STATE EMPLOYEES’ RETIREMENT SYSTEM • 17
Independent Auditor’s Report (continued)
FINANCIAL SECTION
18 • MICHIGAN STATE EMPLOYEES’ RETIREMENT SYSTEM
Management’s Discussion and Analysis Our discussion and analysis of the Michigan State Employees’ Retirement System’s (System) financial performance provides an overview of the System’s financial activities for the fiscal year ended September 30, 2009. Please read it in conjunction with the transmittal letter in the Introductory Section on page 6 and the basic financial statements, which follow this discussion. FINANCIAL HIGHLIGHTS
• System assets exceeded liabilities at the close of fiscal year 2009 by $8.6 billion (reported as net assets). Net assets are held in trust to meet future benefit payments.
• The System’s funding objective is to meet long-term benefit obligations through contributions and investment
income. As of September 30, 2008, the funded ratio was approximately 82.8% for pension benefits and the funded ratio for other postemployment benefits (OPEB) was 0.0%.
• Additions for the year were $79.7 million, which are comprised primarily of contributions of $756.2 million
and investment losses of ($677.2) million.
• Deductions increased over the prior year from $1.27 billion to $1.29 billion or 1.5%. Most of this increase represented an increase in pension benefits paid.
THE STATEMENT OF PLAN NET ASSETS AND THE STATEMENT OF CHANGES IN PLAN NET ASSETS This Comprehensive Annual Financial Report (CAFR) consists of two financial statements; The Statements of Pension Plan and Other Postemployment Benefit Plan Net Assets (page 22) and The Statements of Changes in Pension Plan and Other Postemployment Benefit Plan Net Assets (page 23). These financial statements report information about the System, as a whole, and about its financial condition that should help answer the question: Is the System, as a whole, better off or worse off as a result of this year’s activities? These statements include all assets and liabilities using the economic resources measurement focus and the accrual basis of accounting. Under the accrual basis of accounting, all revenues and expenses are taken into account regardless of when cash is received or paid. The Statement of Pension Plan and Other Postemployment Benefit Plan Net Assets presents all of the System’s assets and liabilities, with the difference between the two reported as net assets. Over time, increases and decreases in net assets measure whether the System’s financial position is improving or deteriorating. The Statement of Changes in Pension Plan and Other Postemployment Benefit Plan Net Assets presents how the System’s net assets changed during the most recent fiscal year. These two financial statements should be reviewed along with the Schedules of Funding Progress (page 43) and Schedules of Employer and Other Contributions (page 44) to determine whether the System is becoming financially stronger or weaker and to understand changes over time in the funded status of the System.
FINANCIAL SECTION
MICHIGAN STATE EMPLOYEES’ RETIREMENT SYSTEM • 19
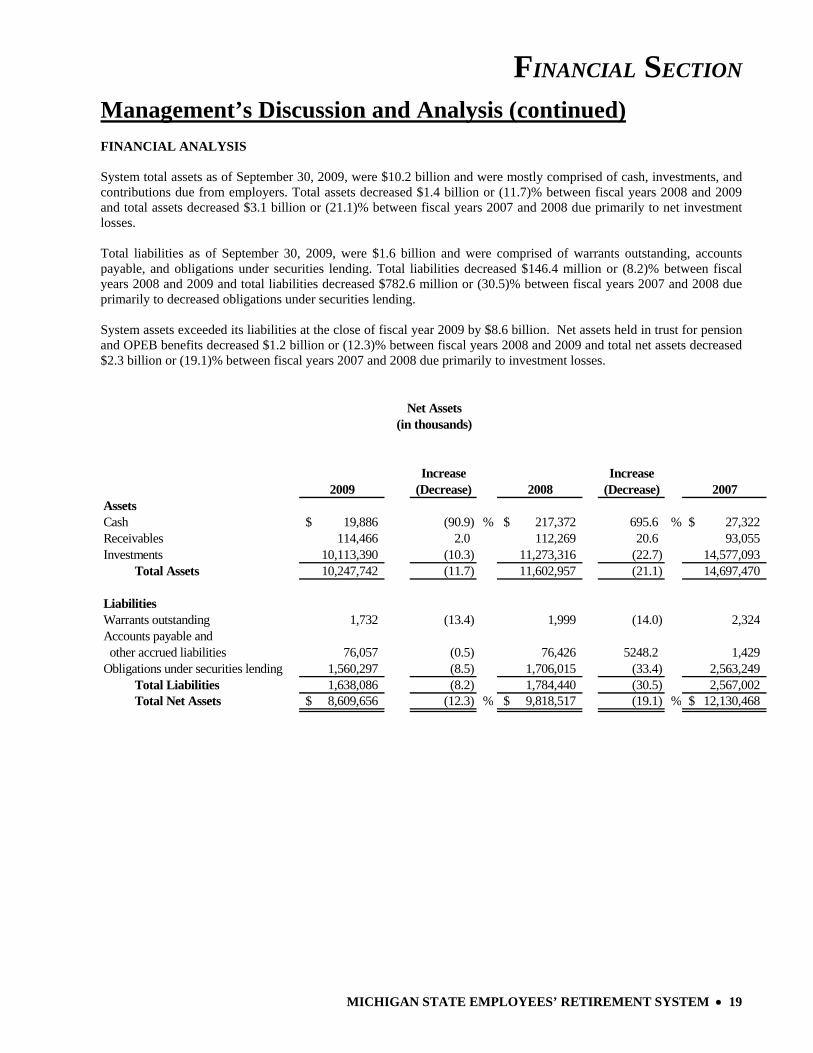
Management’s Discussion and Analysis (continued) FINANCIAL ANALYSIS System total assets as of September 30, 2009, were $10.2 billion and were mostly comprised of cash, investments, and contributions due from employers. Total assets decreased $1.4 billion or (11.7)% between fiscal years 2008 and 2009 and total assets decreased $3.1 billion or (21.1)% between fiscal years 2007 and 2008 due primarily to net investment losses. Total liabilities as of September 30, 2009, were $1.6 billion and were comprised of warrants outstanding, accounts payable, and obligations under securities lending. Total liabilities decreased $146.4 million or (8.2)% between fiscal years 2008 and 2009 and total liabilities decreased $782.6 million or (30.5)% between fiscal years 2007 and 2008 due primarily to decreased obligations under securities lending. System assets exceeded its liabilities at the close of fiscal year 2009 by $8.6 billion. Net assets held in trust for pension and OPEB benefits decreased $1.2 billion or (12.3)% between fiscal years 2008 and 2009 and total net assets decreased $2.3 billion or (19.1)% between fiscal years 2007 and 2008 due primarily to investment losses.
Increase Increase2009 (Decrease) 2008 (Decrease) 2007
AssetsCash 19,886$ (90.9) % 217,372$ 695.6 % 27,322$ Receivables 114,466 2.0 112,269 20.6 93,055 Investments 10,113,390 (10.3) 11,273,316 (22.7) 14,577,093 Total Assets 10,247,742 (11.7) 11,602,957 (21.1) 14,697,470
LiabilitiesWarrants outstanding 1,732 (13.4) 1,999 (14.0) 2,324 Accounts payable and other accrued liabilities 76,057 (0.5) 76,426 5248.2 1,429 Obligations under securities lending 1,560,297 (8.5) 1,706,015 (33.4) 2,563,249 Total Liabilities 1,638,086 (8.2) 1,784,440 (30.5) 2,567,002 Total Net Assets 8,609,656$ (12.3) % 9,818,517$ (19.1) % 12,130,468$
lasklxkjf;lskdjf
Net Assets(in thousands)
FINANCIAL SECTION
20 • MICHIGAN STATE EMPLOYEES’ RETIREMENT SYSTEM
Management’s Discussion and Analysis (continued) ADDITIONS TO PLAN NET ASSETS The reserves needed to finance pension and other postemployment benefits are accumulated through the collection of employer contributions and through earnings on investments. Contributions and net investment losses for fiscal year 2009 totaled $79.7 million. Total additions for fiscal year 2009 increased $1.2 billion from those of fiscal year 2008 due primarily to decreased net investment losses. Total additions decreased $3.5 billion between fiscal years 2007 and 2008 due primarily to net investment losses. Total employer contributions increased between fiscal years 2008 and 2009 by $8.3 million or 1.2% due to an increase in contribution rates. This compares to an increase in total employer contributions between fiscal years 2007 and 2008 of $187.7 million or 36.8% due to an increase in contribution rates. Member contributions increased between fiscal years 2008 and 2009 by $9.2 million or 49.3%, while member contributions between fiscal years 2007 and 2008 decreased by $12.7 million or (40.4)%. The System is non-contributory; however, members may purchase service credit. The increase in member contributions for fiscal year 2009 occurred because there was an increase in individuals purchasing service credit. Net investment income increased between fiscal years 2008 and 2009 by $1.2 billion. Net investment income decreased between fiscal years 2007 and 2008 by $3.6 billion. The Investment Section of this report reviews the results of investment activity for 2009. DEDUCTIONS FROM PLAN NET ASSETS The primary expenses of the System include the payment of pension benefits to members and beneficiaries, payment for health, dental and vision benefits, refunds of contributions to former members, and the cost of administering the System. Total deductions for fiscal year 2009 were $1.29 billion, an increase of 1.5% over fiscal year 2008 expenses. Total deductions for fiscal year 2008 were $1.27 billion, an increase of 5.3% over fiscal year 2007 expenses. Payments for health care benefits to members and beneficiaries increased by $14.6 million or 3.9% from $377.5 million to $392.1 million during the fiscal year. This compares to an increase of $13.5 million or 3.7% from $364.0 million to $377.5 million between fiscal years 2007 and 2008. The payment of pension benefits increased by $37.7 million or 4.5% between fiscal years 2008 and 2009 and by $36.7 million or 4.6% between fiscal years 2007 and 2008. In fiscal years 2008 and 2009, pension benefit expenses increased due to an increase in benefit payments to retirees and an increase of 1192 retirees and 945 retirees, respectively. Refunds increased by $27.0 thousand or 9.3% between fiscal years 2008 and 2009. This compares to an increase of $69.0 thousand or 31.1% between fiscal years 2007 and 2008. Administrative expenses increased by $1.3 million from $24.4 million in fiscal year 2008 to $25.8 million in fiscal year 2009, due primarily to an increase in OPEB administrative expenses paid to insurance carriers. Administrative expenses increased by $19.3 million from $5.1 million in fiscal year 2007 to $24.4 million in fiscal year 2008, due primarily to the transfer of all retiree health related activity, including administrative fees paid to insurance carriers, from the State Sponsored Group Insurance Fund (SSGIF) to the OPEB Plan in accordance with GASB Statement No. 45. Note 5 to the basic financial statements describes the accounting change as required by Governmental Accounting Standards Board (GASB) Statement No. 45, Accounting and Financial Reporting by Employers for Postemployment Benefits Other Than Pensions.
FINANCIAL SECTION
MICHIGAN STATE EMPLOYEES’ RETIREMENT SYSTEM • 21
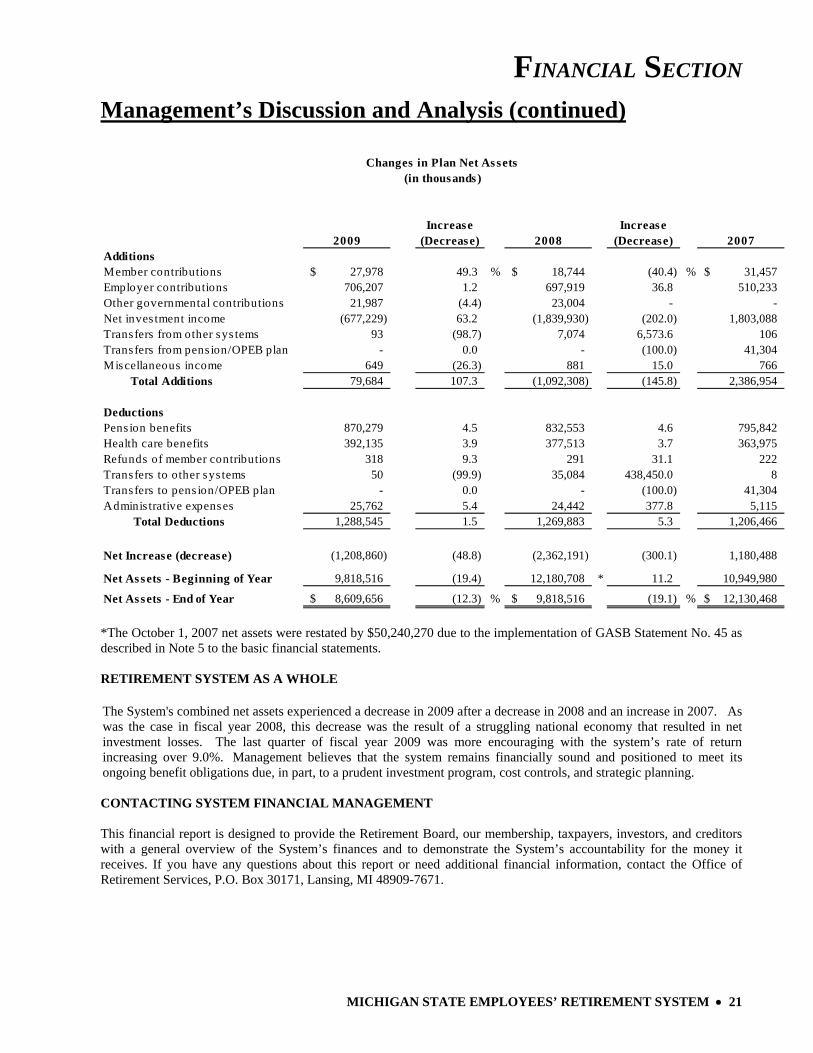
Management’s Discussion and Analysis (continued)
Increase Increase2009 (Decrease) 2008 (Decrease) 2007
AdditionsMember contributions 27,978$ 49.3 % 18,744$ (40.4) % 31,457$ Employer contributions 706,207 1.2 697,919 36.8 510,233 Other governmental contributions 21,987 (4.4) 23,004 - - Net inves tment income (677,229) 63.2 (1,839,930) (202.0) 1,803,088 Transfers from other sys tems 93 (98.7) 7,074 6,573.6 106 Transfers from pens ion/OPEB plan - 0.0 - (100.0) 41,304 Miscellaneous income 649 (26.3) 881 15.0 766 Total Additions 79,684 107.3 (1,092,308) (145.8) 2,386,954
DeductionsPens ion benefits 870,279 4.5 832,553 4.6 795,842 Health care benefits 392,135 3.9 377,513 3.7 363,975 Refunds of member contributions 318 9.3 291 31.1 222 Transfers to other sys tems 50 (99.9) 35,084 438,450.0 8 Transfers to pens ion/OPEB plan - 0.0 - (100.0) 41,304 Adminis trative expenses 25,762 5.4 24,442 377.8 5,115 Total Deductions 1,288,545 1.5 1,269,883 5.3 1,206,466
Net Increase (decrease) (1,208,860) (48.8) (2,362,191) (300.1) 1,180,488
Net Assets - Beginning of Year 9,818,516 (19.4) 12,180,708 * 11.2 10,949,980
Net Assets - End of Year 8,609,656$ (12.3) % 9,818,516$ (19.1) % 12,130,468$
Changes in Plan Net Assets(in thousands)
*The October 1, 2007 net assets were restated by $50,240,270 due to the implementation of GASB Statement No. 45 as described in Note 5 to the basic financial statements. RETIREMENT SYSTEM AS A WHOLE The System's combined net assets experienced a decrease in 2009 after a decrease in 2008 and an increase in 2007. As was the case in fiscal year 2008, this decrease was the result of a struggling national economy that resulted in net investment losses. The last quarter of fiscal year 2009 was more encouraging with the system’s rate of return increasing over 9.0%. Management believes that the system remains financially sound and positioned to meet its ongoing benefit obligations due, in part, to a prudent investment program, cost controls, and strategic planning. CONTACTING SYSTEM FINANCIAL MANAGEMENT This financial report is designed to provide the Retirement Board, our membership, taxpayers, investors, and creditors with a general overview of the System’s finances and to demonstrate the System’s accountability for the money it receives. If you have any questions about this report or need additional financial information, contact the Office of Retirement Services, P.O. Box 30171, Lansing, MI 48909-7671.
FINANCIAL SECTION
22 • MICHIGAN STATE EMPLOYEES’ RETIREMENT SYSTEM
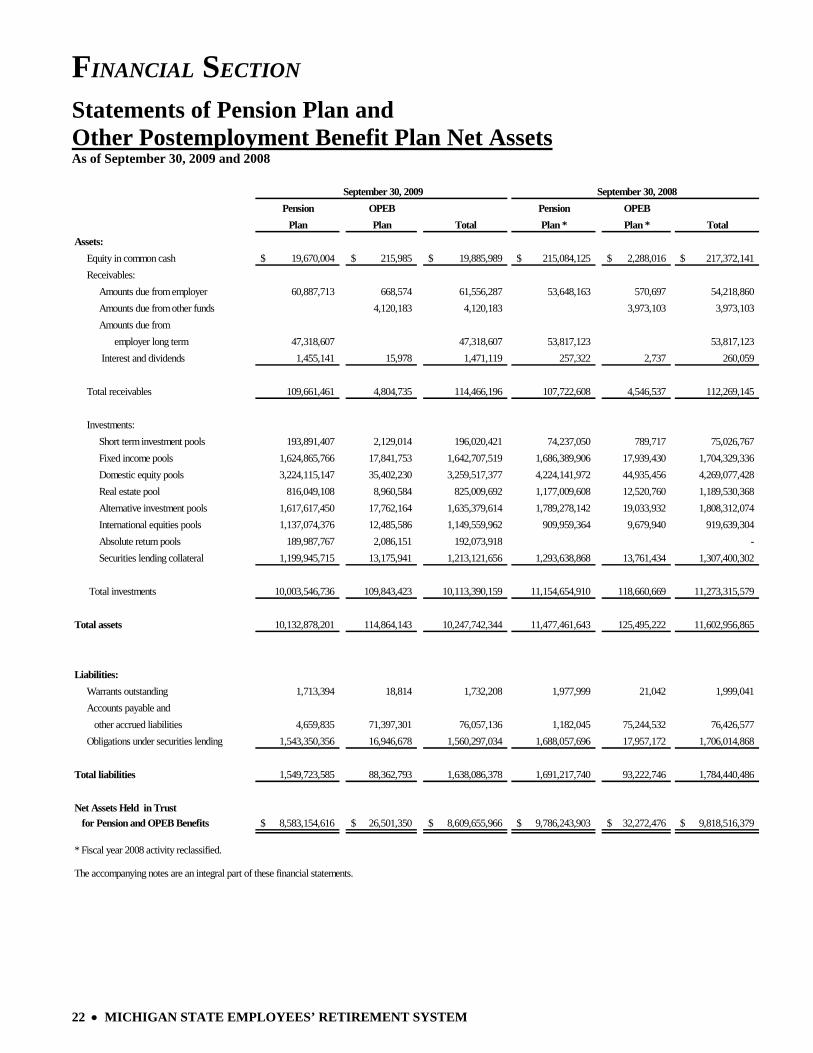
Statements of Pension Plan and Other Postemployment Benefit Plan Net Assets As of September 30, 2009 and 2008
September 30, 2009 September 30, 2008Pension OPEB Pension OPEB
Plan Plan Total Plan * Plan * TotalAssets: Equity in common cash 19,670,004$ 215,985$ 19,885,989$ 215,084,125$ 2,288,016$ 217,372,141$ Receivables: Amounts due from employer 60,887,713 668,574 61,556,287 53,648,163 570,697 54,218,860 Amounts due from other funds 4,120,183 4,120,183 3,973,103 3,973,103 Amounts due from employer long term 47,318,607 47,318,607 53,817,123 53,817,123
Interest and dividends 1,455,141 15,978 1,471,119 257,322 2,737 260,059
Total receivables 109,661,461 4,804,735 114,466,196 107,722,608 4,546,537 112,269,145
Investments: Short term investment pools 193,891,407 2,129,014 196,020,421 74,237,050 789,717 75,026,767 Fixed income pools 1,624,865,766 17,841,753 1,642,707,519 1,686,389,906 17,939,430 1,704,329,336 Domestic equity pools 3,224,115,147 35,402,230 3,259,517,377 4,224,141,972 44,935,456 4,269,077,428 Real estate pool 816,049,108 8,960,584 825,009,692 1,177,009,608 12,520,760 1,189,530,368 Alternative investment pools 1,617,617,450 17,762,164 1,635,379,614 1,789,278,142 19,033,932 1,808,312,074 International equities pools 1,137,074,376 12,485,586 1,149,559,962 909,959,364 9,679,940 919,639,304 Absolute return pools 189,987,767 2,086,151 192,073,918 - Securities lending collateral 1,199,945,715 13,175,941 1,213,121,656 1,293,638,868 13,761,434 1,307,400,302
Total investments 10,003,546,736 109,843,423 10,113,390,159 11,154,654,910 118,660,669 11,273,315,579
Total assets 10,132,878,201 114,864,143 10,247,742,344 11,477,461,643 125,495,222 11,602,956,865
Liabilities: Warrants outstanding 1,713,394 18,814 1,732,208 1,977,999 21,042 1,999,041 Accounts payable and other accrued liabilities 4,659,835 71,397,301 76,057,136 1,182,045 75,244,532 76,426,577 Obligations under securities lending 1,543,350,356 16,946,678 1,560,297,034 1,688,057,696 17,957,172 1,706,014,868
Total liabilities 1,549,723,585 88,362,793 1,638,086,378 1,691,217,740 93,222,746 1,784,440,486
Net Assets Held in Trust for Pension and OPEB Benefits 8,583,154,616$ 26,501,350$ 8,609,655,966$ 9,786,243,903$ 32,272,476$ 9,818,516,379$
* Fiscal year 2008 activity reclassified.
The accompanying notes are an integral part of these financial statements.
FINANCIAL SECTION
MICHIGAN STATE EMPLOYEES’ RETIREMENT SYSTEM • 23
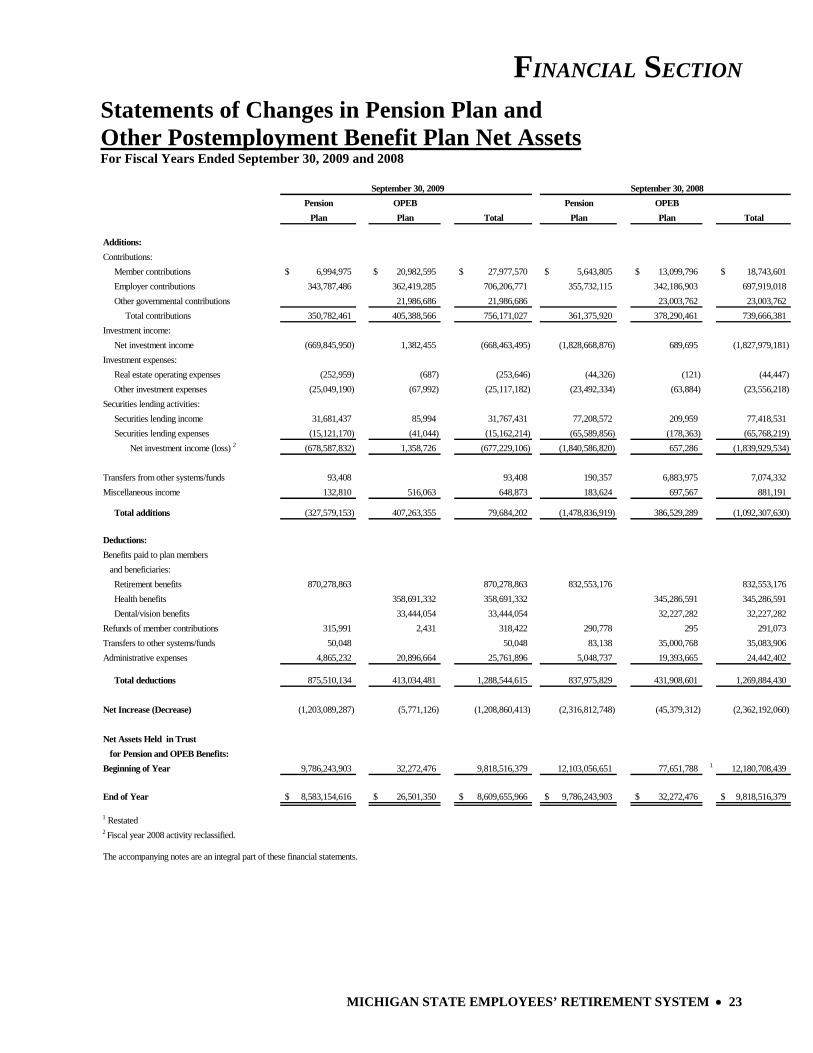
Statements of Changes in Pension Plan and Other Postemployment Benefit Plan Net Assets For Fiscal Years Ended September 30, 2009 and 2008
September 30, 2009 September 30, 2008Pension OPEB Pension OPEB
Plan Plan Total Plan Plan Total
Additions:Contributions: Member contributions 6,994,975$ 20,982,595$ 27,977,570$ 5,643,805$ 13,099,796$ 18,743,601$ Employer contributions 343,787,486 362,419,285 706,206,771 355,732,115 342,186,903 697,919,018 Other governmental contributions 21,986,686 21,986,686 23,003,762 23,003,762 Total contributions 350,782,461 405,388,566 756,171,027 361,375,920 378,290,461 739,666,381 Investment income: Net investment income (669,845,950) 1,382,455 (668,463,495) (1,828,668,876) 689,695 (1,827,979,181) Investment expenses: Real estate operating expenses (252,959) (687) (253,646) (44,326) (121) (44,447) Other investment expenses (25,049,190) (67,992) (25,117,182) (23,492,334) (63,884) (23,556,218) Securities lending activities: Securities lending income 31,681,437 85,994 31,767,431 77,208,572 209,959 77,418,531 Securities lending expenses (15,121,170) (41,044) (15,162,214) (65,589,856) (178,363) (65,768,219) Net investment income (loss) 2 (678,587,832) 1,358,726 (677,229,106) (1,840,586,820) 657,286 (1,839,929,534)
Transfers from other systems/funds 93,408 93,408 190,357 6,883,975 7,074,332 Miscellaneous income 132,810 516,063 648,873 183,624 697,567 881,191
Total additions (327,579,153) 407,263,355 79,684,202 (1,478,836,919) 386,529,289 (1,092,307,630)
Deductions:Benefits paid to plan members and beneficiaries: Retirement benefits 870,278,863 870,278,863 832,553,176 832,553,176 Health benefits 358,691,332 358,691,332 345,286,591 345,286,591 Dental/vision benefits 33,444,054 33,444,054 32,227,282 32,227,282 Refunds of member contributions 315,991 2,431 318,422 290,778 295 291,073 Transfers to other systems/funds 50,048 50,048 83,138 35,000,768 35,083,906 Administrative expenses 4,865,232 20,896,664 25,761,896 5,048,737 19,393,665 24,442,402
Total deductions 875,510,134 413,034,481 1,288,544,615 837,975,829 431,908,601 1,269,884,430
Net Increase (Decrease) (1,203,089,287) (5,771,126) (1,208,860,413) (2,316,812,748) (45,379,312) (2,362,192,060)
Net Assets Held in Trust for Pension and OPEB Benefits:Beginning of Year 9,786,243,903 32,272,476 9,818,516,379 12,103,056,651 77,651,788 1 12,180,708,439
End of Year 8,583,154,616$ 26,501,350$ 8,609,655,966$ 9,786,243,903$ 32,272,476$ 9,818,516,379$
1 Restated2 Fiscal year 2008 activity reclassified.
The accompanying notes are an integral part of these financial statements.
FINANCIAL SECTION
24 • MICHIGAN STATE EMPLOYEES’ RETIREMENT SYSTEM
Notes to Basic Financial Statements September 30, 2009 and 2008
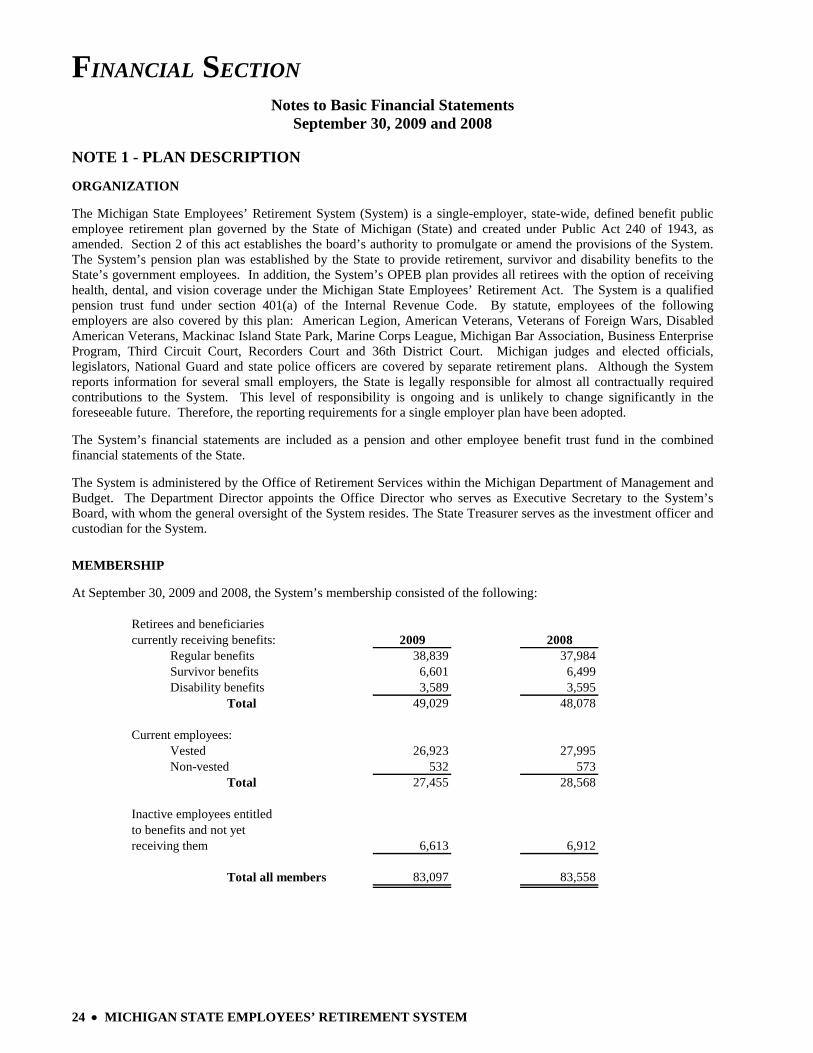
NOTE 1 - PLAN DESCRIPTION ORGANIZATION The Michigan State Employees’ Retirement System (System) is a single-employer, state-wide, defined benefit public employee retirement plan governed by the State of Michigan (State) and created under Public Act 240 of 1943, as amended. Section 2 of this act establishes the board’s authority to promulgate or amend the provisions of the System. The System’s pension plan was established by the State to provide retirement, survivor and disability benefits to the State’s government employees. In addition, the System’s OPEB plan provides all retirees with the option of receiving health, dental, and vision coverage under the Michigan State Employees’ Retirement Act. The System is a qualified pension trust fund under section 401(a) of the Internal Revenue Code. By statute, employees of the following employers are also covered by this plan: American Legion, American Veterans, Veterans of Foreign Wars, Disabled American Veterans, Mackinac Island State Park, Marine Corps League, Michigan Bar Association, Business Enterprise Program, Third Circuit Court, Recorders Court and 36th District Court. Michigan judges and elected officials, legislators, National Guard and state police officers are covered by separate retirement plans. Although the System reports information for several small employers, the State is legally responsible for almost all contractually required contributions to the System. This level of responsibility is ongoing and is unlikely to change significantly in the foreseeable future. Therefore, the reporting requirements for a single employer plan have been adopted. The System’s financial statements are included as a pension and other employee benefit trust fund in the combined financial statements of the State. The System is administered by the Office of Retirement Services within the Michigan Department of Management and Budget. The Department Director appoints the Office Director who serves as Executive Secretary to the System’s Board, with whom the general oversight of the System resides. The State Treasurer serves as the investment officer and custodian for the System. MEMBERSHIP At September 30, 2009 and 2008, the System’s membership consisted of the following:
Retirees and beneficiariescurrently receiving benefits: 2009 2008
Regular benefits 38,839 37,984Survivor benefits 6,601 6,499Disability benefits 3,589 3,595
Total 49,029 48,078
Current employees:Vested 26,923 27,995Non-vested 532 573
Total 27,455 28,568
Inactive employees entitledto benefits and not yetreceiving them 6,613 6,912
Total all members 83,097 83,558
FINANCIAL SECTION
MICHIGAN STATE EMPLOYEES’ RETIREMENT SYSTEM • 25
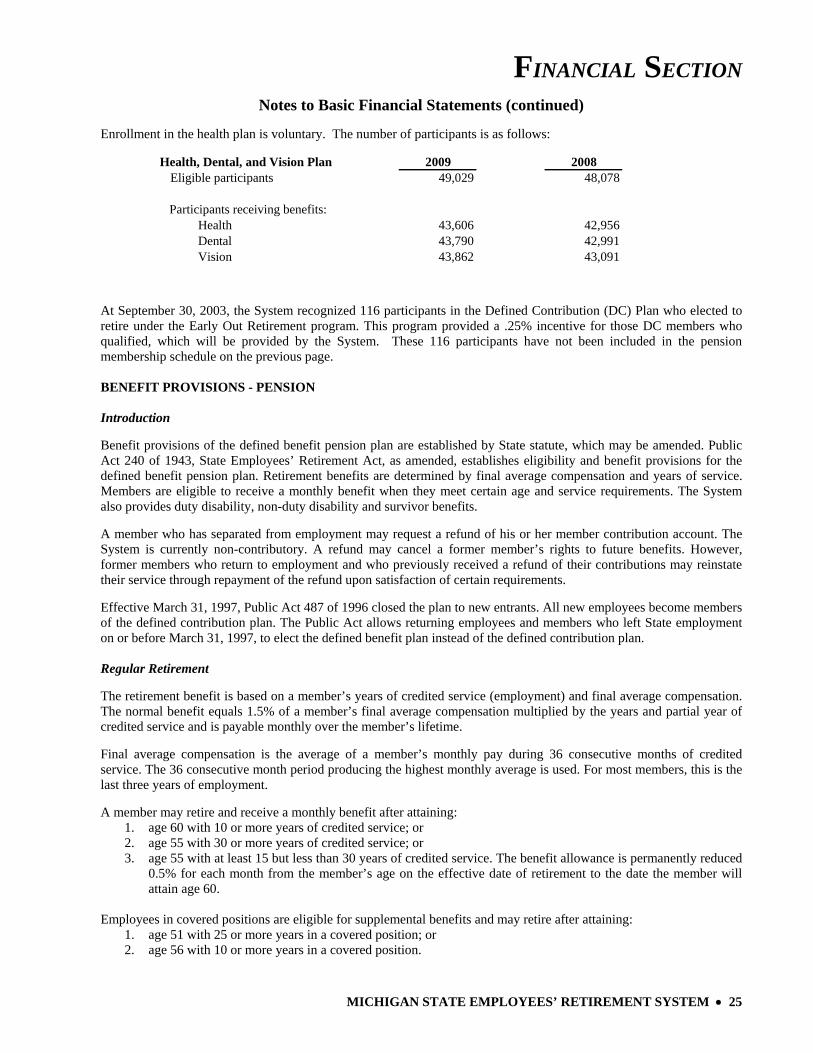
Notes to Basic Financial Statements (continued) Enrollment in the health plan is voluntary. The number of participants is as follows:
Health, Dental, and Vision Plan 2009 2008Eligible participants 49,029 48,078
Participants receiving benefits: Health 43,606 42,956
Dental 43,790 42,991Vision 43,862 43,091
At September 30, 2003, the System recognized 116 participants in the Defined Contribution (DC) Plan who elected to retire under the Early Out Retirement program. This program provided a .25% incentive for those DC members who qualified, which will be provided by the System. These 116 participants have not been included in the pension membership schedule on the previous page.
BENEFIT PROVISIONS - PENSION Introduction Benefit provisions of the defined benefit pension plan are established by State statute, which may be amended. Public Act 240 of 1943, State Employees’ Retirement Act, as amended, establishes eligibility and benefit provisions for the defined benefit pension plan. Retirement benefits are determined by final average compensation and years of service. Members are eligible to receive a monthly benefit when they meet certain age and service requirements. The System also provides duty disability, non-duty disability and survivor benefits. A member who has separated from employment may request a refund of his or her member contribution account. The System is currently non-contributory. A refund may cancel a former member’s rights to future benefits. However, former members who return to employment and who previously received a refund of their contributions may reinstate their service through repayment of the refund upon satisfaction of certain requirements. Effective March 31, 1997, Public Act 487 of 1996 closed the plan to new entrants. All new employees become members of the defined contribution plan. The Public Act allows returning employees and members who left State employment on or before March 31, 1997, to elect the defined benefit plan instead of the defined contribution plan. Regular Retirement The retirement benefit is based on a member’s years of credited service (employment) and final average compensation. The normal benefit equals 1.5% of a member’s final average compensation multiplied by the years and partial year of credited service and is payable monthly over the member’s lifetime. Final average compensation is the average of a member’s monthly pay during 36 consecutive months of credited service. The 36 consecutive month period producing the highest monthly average is used. For most members, this is the last three years of employment. A member may retire and receive a monthly benefit after attaining:
1. age 60 with 10 or more years of credited service; or 2. age 55 with 30 or more years of credited service; or 3. age 55 with at least 15 but less than 30 years of credited service. The benefit allowance is permanently reduced
0.5% for each month from the member’s age on the effective date of retirement to the date the member will attain age 60.
Employees in covered positions are eligible for supplemental benefits and may retire after attaining:
1. age 51 with 25 or more years in a covered position; or 2. age 56 with 10 or more years in a covered position.
FINANCIAL SECTION
26 • MICHIGAN STATE EMPLOYEES’ RETIREMENT SYSTEM
Notes to Basic Financial Statements (continued)
In either case, the three years immediately preceding retirement must have been in a covered position. Employees in covered positions are responsible for the custody and supervision of inmates. Employees of closing Department of Community Health facilities are eligible for retirement under one of the following conditions:
1. age 51 with 25 years of service, the last 5 of which were rendered in the closing facility; or 2. age 56 with 10 years of service, the last 5 of which were rendered in the closing facility; or 3. 25 years of service at the closing facility regardless of age.
Employees of the State Accident Fund, Michigan Biologic Products, or Liquor Control Commission who were terminated as the result of privatization may retire if the member’s age and length of service was equal to or greater than 70 on the date of transfer or termination.
Conservation Officers (CO) with a hire date on or before April 1, 1991, are eligible to retire after 25 years of service, 20 of which must have been rendered as a CO. COs hired after April 1, 1991, and before March 31, 1997, must have 23 years of service as a CO to be eligible for a full retirement benefit with only 25 years of service. In either case, 2 years immediately preceding retirement must be as a CO. Deferred Retirement Any member with 10 or more years of credited service who terminates employment but has not reached the age of retirement is a deferred member and is entitled to receive a monthly pension upon reaching age 60, provided the member’s accumulated contributions have not been refunded. Deferred retirement is available after 5 years of service for State employees occupying unclassified positions in the executive and legislative branches and certain Department of Community Health employees subject to reduction in force lay-offs by reason of deinstitutionalization. Non-Duty Disability Benefit A member with 10 or more years of credited service who becomes totally and permanently disabled not due to performing duties as a State employee is eligible for a non-duty disability pension. The non-duty disability benefit is computed in the same manner as an age and service allowance based upon service and salary at the time of disability. Duty Disability Benefit A member who becomes totally and permanently disabled from performing duties as a State employee as a direct result of State employment and who has not met the age and service requirement for a regular pension, is eligible for a duty disability pension. Public Act 109 of 2004 amended the State Employees’ Retirement Act to change the calculation of the pension benefit and increase the minimum annual payment. If the member is under age 60, the duty disability allowance is now a minimum of $6,000 payable annually. At age 60 the benefit is recomputed under service retirement. Survivor Benefit Upon the death of a member who was vested, the surviving spouse shall receive a benefit calculated as if the member had retired the day before the date of death and selected a survivor pension. Certain designated beneficiaries can be named to receive a survivor benefit. Public Act 109 of 2004 amended the State Employees’ Retirement Act to change the calculation of Duty Death benefits and redefines eligibility for deceased member’s survivors. The new minimum duty-related death benefit has been increased to $6,000. Pension Payment Options When applying for retirement, an employee may name a person other than his or her spouse as a beneficiary if the spouse waives this right. If a beneficiary is named, the employee must choose whether the beneficiary will receive 100%, 75% or 50% of the retiree’s pension benefit after the retiree’s death. The decision is irrevocable. A description of the options follows.
FINANCIAL SECTION
MICHIGAN STATE EMPLOYEES’ RETIREMENT SYSTEM • 27
Notes to Basic Financial Statements (continued)
Regular Pension - The pension benefit is computed with no beneficiary rights. If the retiree made contributions while an employee and has not received the total accumulated contributions before death, a refund of the balance of the contributions is made to the beneficiary of record. If the retiree did not make any contributions, there will not be payments to beneficiaries. 100% Survivor Pension - Under this option, after the retiree’s death, the beneficiary will receive 100% of the pension for the remainder of the beneficiary’s lifetime. If this option is elected, the normal retirement benefit is reduced by a factor based upon the ages of the retiree and of the beneficiary. If the beneficiary predeceases the retiree, the pension “pops-up” to the regular pension amount; another beneficiary cannot be named. 75% Survivor Pension - Under this option, after the retiree’s death, the beneficiary will receive 75% of the pension for the remainder of the beneficiary’s lifetime. If this option is elected, the normal retirement benefit is reduced by a factor based upon the ages of the retiree and of the beneficiary. If the beneficiary predeceases the retiree, the pension “pops-up” to the regular pension amount; another beneficiary cannot be named. 50% Survivor Pension - Under this option, after the retiree’s death, the beneficiary will receive 50% of the pension for the remainder of the beneficiary’s lifetime. If this option is elected, the normal retirement benefit is reduced by a factor based upon the ages of the retiree and of the beneficiary. The reduction factor is lower than the factor used in the 100% or 75% option previously described. If the beneficiary predeceases the retiree, the pension “pops-up” to the regular pension amount; another beneficiary cannot be named. Equated Pension - An equated pension may be chosen by any member under age 65 except a disability retiree and an early supplemental retiree. Equated pensions provide an additional amount until age 65 and may be combined with Regular, 100%, 75% or 50% option. At age 65 the monthly amount is permanently reduced. The initial and reduced amounts are based on an estimate of social security benefits at age 65, provided by the Social Security Administration Office. In order to calculate this benefit, members choosing this option must provide ORS with an estimate from the Social Security Administration Office. The actual amount received from social security may vary from the estimate. Post Retirement Adjustments One-time upward benefit adjustments were made in 1972, 1974, 1976, 1977 and 1987. Beginning October 1, 1988, a 3% non-compounding increase, up to a maximum of $25 monthly, is paid each October to recipients who have been retired 12 full months. Beginning in 1983, eligible benefit recipients share in a distribution of investment income earned in excess of 8% annually. This distribution is known as the supplemental payment. The supplemental payment is offset by one year’s cumulative increases received after the implementation of the annual 3% increase in benefits. These adjustment payments were not issued during fiscal years 1991 through 1994. Members who retired on or after October 1, 1987, are not eligible for the supplemental payment. Contributions Member Contributions - Members currently participate in the System on a non-contributory basis. Under certain circumstances, members may contribute to the System for the purchase of creditable service, such as military service or maternity leave, or a universal buy-in. If a member terminates the System employment before a retirement benefit is payable, the member’s contribution and interest on deposit may be refunded. If the member dies before being vested, the member’s contribution and interest are refunded to the designated beneficiaries. Employer Contributions - The statute requires the employer to contribute to finance the benefits of plan members. These employer contributions are determined annually by the System’s actuary and are based upon level-dollar value funding principles so the contribution rates do not have to increase over time. Transfers to Defined Contribution Plan During fiscal year 1998, the Michigan State Employees’ Retirement Act provided members an opportunity to transfer to the Defined Contribution Plan. This was a one-time opportunity and the decision is irrevocable. The transfer must have been completed by September 30, 1998. With the passage of the legislation permitting the transfer, the System also became a closed system. All new employees are members of the Defined Contribution Plan.
FINANCIAL SECTION
28 • MICHIGAN STATE EMPLOYEES’ RETIREMENT SYSTEM
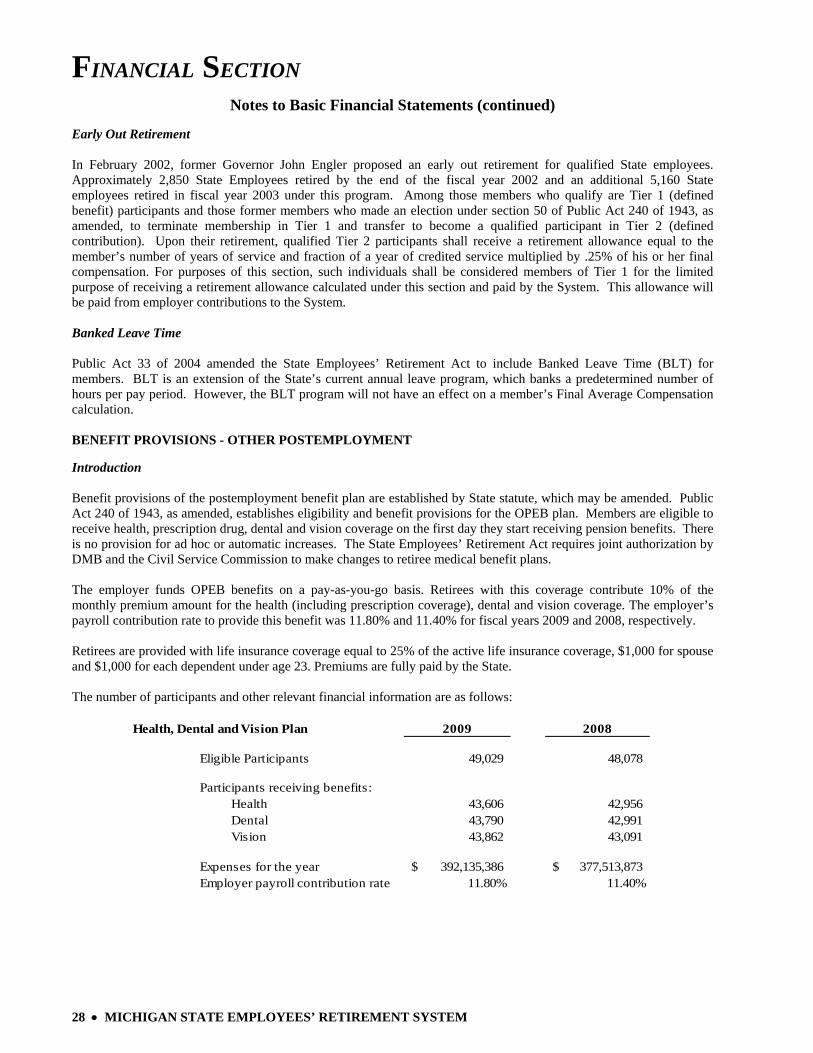
Notes to Basic Financial Statements (continued) Early Out Retirement In February 2002, former Governor John Engler proposed an early out retirement for qualified State employees. Approximately 2,850 State Employees retired by the end of the fiscal year 2002 and an additional 5,160 State employees retired in fiscal year 2003 under this program. Among those members who qualify are Tier 1 (defined benefit) participants and those former members who made an election under section 50 of Public Act 240 of 1943, as amended, to terminate membership in Tier 1 and transfer to become a qualified participant in Tier 2 (defined contribution). Upon their retirement, qualified Tier 2 participants shall receive a retirement allowance equal to the member’s number of years of service and fraction of a year of credited service multiplied by .25% of his or her final compensation. For purposes of this section, such individuals shall be considered members of Tier 1 for the limited purpose of receiving a retirement allowance calculated under this section and paid by the System. This allowance will be paid from employer contributions to the System. Banked Leave Time Public Act 33 of 2004 amended the State Employees’ Retirement Act to include Banked Leave Time (BLT) for members. BLT is an extension of the State’s current annual leave program, which banks a predetermined number of hours per pay period. However, the BLT program will not have an effect on a member’s Final Average Compensation calculation. BENEFIT PROVISIONS - OTHER POSTEMPLOYMENT Introduction Benefit provisions of the postemployment benefit plan are established by State statute, which may be amended. Public Act 240 of 1943, as amended, establishes eligibility and benefit provisions for the OPEB plan. Members are eligible to receive health, prescription drug, dental and vision coverage on the first day they start receiving pension benefits. There is no provision for ad hoc or automatic increases. The State Employees’ Retirement Act requires joint authorization by DMB and the Civil Service Commission to make changes to retiree medical benefit plans. The employer funds OPEB benefits on a pay-as-you-go basis. Retirees with this coverage contribute 10% of the monthly premium amount for the health (including prescription coverage), dental and vision coverage. The employer’s payroll contribution rate to provide this benefit was 11.80% and 11.40% for fiscal years 2009 and 2008, respectively. Retirees are provided with life insurance coverage equal to 25% of the active life insurance coverage, $1,000 for spouse and $1,000 for each dependent under age 23. Premiums are fully paid by the State. The number of participants and other relevant financial information are as follows:
Health, Dental and Vision Plan 2009 2008
Eligible Participants 49,029 48,078
Participants receiving benefits:Health 43,606 42,956 Dental 43,790 42,991 Vision 43,862 43,091
Expenses for the year 392,135,386$ 377,513,873$ Employer payroll contribution rate 11.80% 11.40%
FINANCIAL SECTION
MICHIGAN STATE EMPLOYEES’ RETIREMENT SYSTEM • 29
Notes to Basic Financial Statements (continued)
NOTE 2 - SUMMARY OF SIGNIFICANT ACCOUNTING POLICIES Basis of Accounting and Presentation The System’s financial statements are prepared using the accrual basis of accounting. Contributions from the State are recognized as revenue when due and payable. Benefits and refunds are recognized when due and payable in accordance with the terms of the System. Reserves Public Act 240 of 1943, as amended, created the Reserve for Employee Contributions, Reserve for Employer Contributions, Reserve for Retired Benefit Payments, Reserve for Undistributed Investment Income, and Reserve for Health (OPEB) Related Benefits. The financial transactions of the System are recorded in these reserves as required by Public Act 240 of 1943, as amended. Reserve for Employee Contributions - Members no longer contribute to this reserve except to purchase eligible service credit or repay previously refunded contributions. This reserve represents active member contributions and interest less amounts transferred to the Reserve for Retired Benefit Payments for regular and disability retirement, amounts refunded to terminated members and unclaimed amounts transferred to the income account. At September 30, 2009, and 2008, the balance in this reserve was $197.3 million and $205.5 million, respectively. Reserve for Employer Contributions - All employer contributions are credited to this reserve. Interest from the income account is credited annually. Amounts are transferred annually from this reserve to the Reserve for Retired Benefit Payments to fund that reserve. At September 30, 2009, and 2008, the balance in this reserve was $1.3 billion and $3.0 billion, respectively. Reserve for Retired Benefit Payments - This represents the reserves for payment of future retirement benefits to current retirees. At retirement, a member’s accumulated contributions plus interest are transferred into this reserve from the Reserve for Employee Contributions. Monthly benefits, which are paid to the retiree, reduce the reserve. At the end of each fiscal year, an amount determined by an annual actuarial valuation is transferred from the Reserve for Employer Contributions to this reserve to bring the reserve into balance with the actuarial present value of retirement allowances. At September 30, 2009, and 2008, the balance in this reserve was $8.0 billion and $6.0 billion, respectively. Reserve for Undistributed Investment Income - The net investment earnings (losses) are recorded in this reserve. Interest as authorized by the board is transferred annually to the other reserves. Administrative expenses are paid from this reserve. At September 30, 2009, and 2008, the net balance of this reserve was ($879.6) million and $531.9 million, respectively. Reserve for Health (OPEB) Related Benefits - This reserve is credited with employee and employer contributions for retirees’ health (including prescription coverage), dental, and vision benefits. The required contribution is based on pay-as-you-go funding. It represents a level of funding that, if paid on an ongoing basis, is projected to cover normal cost each year and amortize any unfunded actuarial liability (or funding excess) over a period not to exceed thirty years. However, the actual annual contributions have been less than the annual required contribution (the ARC). Interest is allocated based on the beginning balance of the reserve. Premiums for health, dental, and vision benefits are paid from this reserve. At September 30, 2009, and 2008, the balance in this reserve was $26.5 million and $32.3 million, respectively.

FINANCIAL SECTION
30 • MICHIGAN STATE EMPLOYEES’ RETIREMENT SYSTEM
Notes to Basic Financial Statements (continued) In fiscal year 2008 the State of Michigan adopted the reporting requirement promulgated by the Government Accounting Standards Board (GASB) Statement No. 45, Accounting and Financial Reporting by Employers for Postemployment Benefits Other Than Pensions. For fiscal years 2007 and previous, retiree related OPEB activity was accounted for in the State Sponsored Group Insurance (SSGI) Fund which, under section 204 of Public Act 431 of 1984, as amended, bore the risk of any losses in years where expenses exceeded revenues. The SSGI Fund is reported as an internal service fund in the State of Michigan’s Comprehensive Annual Financial Report and GASB Statement No. 10 was the relevant guidance for retiree related OPEB. GASB Statement No. 45 amends GASB Statement No. 10 to require the exclusion of retiree OPEB activity from the SSGI Fund and account for it separately in other employee benefit trust funds. All retiree related activity, including the restatement of October 1, 2007 accumulated net assets in the amount of $50,240,270, is included in the reserve for OPEB related benefits. Health Advance Funding SubAccount - This funding subaccount was created by Public Act 93 of 2002 as a means to begin pre-funding, on an actuarial basis, health benefits for participants in the System. Any amounts received in the Health Advance Funding SubAccount (HAFS) and accumulated earnings on those amounts shall not be expended until the actuarial accrued liability for health benefits is at least 100% funded. However, the System may transfer an amount from the HAFS to the employer’s accumulation fund (Reserve for Employer Contributions) under certain conditions described in the enabling legislation. At September 30, 2007, the balance of this subaccount was zero. Reporting Entity The System is a pension and other employee benefit trust fund of the State. As such, the System is considered part of the State and is included in the State’s Comprehensive Annual Financial Report as a pension and other employee benefit trust fund. The System and its Board are not financially accountable for any other entities or other organizations. Accordingly, the System is the only entity included in this financial report.
Benefit Protection Public Act 100 of 2002 was passed by the Michigan Legislature to protect pension benefits of public employees from alienation (being transferred). Alienation is attachment, garnishment, levy, execution, bankruptcy or other legal process except for divorce orders or eligible domestic relation orders. The statutes governing the System contained an “anti-alienation” clause to provide for this protection; however, many smaller public pension systems did not have the benefit of this protection. Therefore, Public Act 100 of 2002 was passed to establish legal protection of pension assets that encompasses all public employees. Fair Value of Investments Plan investments are reported at fair value. Securities traded on a national or international exchange are valued at the last reported sales price at current exchange rates. Corporate bonds not traded on a national or international exchange are based on equivalent values of comparable securities with similar yield and risk. Real estate debt is valued on the basis of future principal and interest payments, and is discounted at prevailing interest rates for similar instruments. The fair value of real estate investments is based on independent appraisals. Securities purchased with cash collateral under securities lending activities are recorded at estimated fair value. Other investments not having an established market are recorded at estimated fair value. Investment Income Dividend and interest income are recognized on the accrual basis. Fair value changes are recorded as investment income or loss. Purchases and sales of investments are recorded as of the trade date (the date upon which the transaction is initiated), except for purchase and sale of mortgages, real estate, and alternative investments, which are recorded as of the settlement date (the date upon which the transaction is ultimately completed). The effect of recording such transactions as of the settlement date does not materially affect the financial statements.
FINANCIAL SECTION
MICHIGAN STATE EMPLOYEES’ RETIREMENT SYSTEM • 31
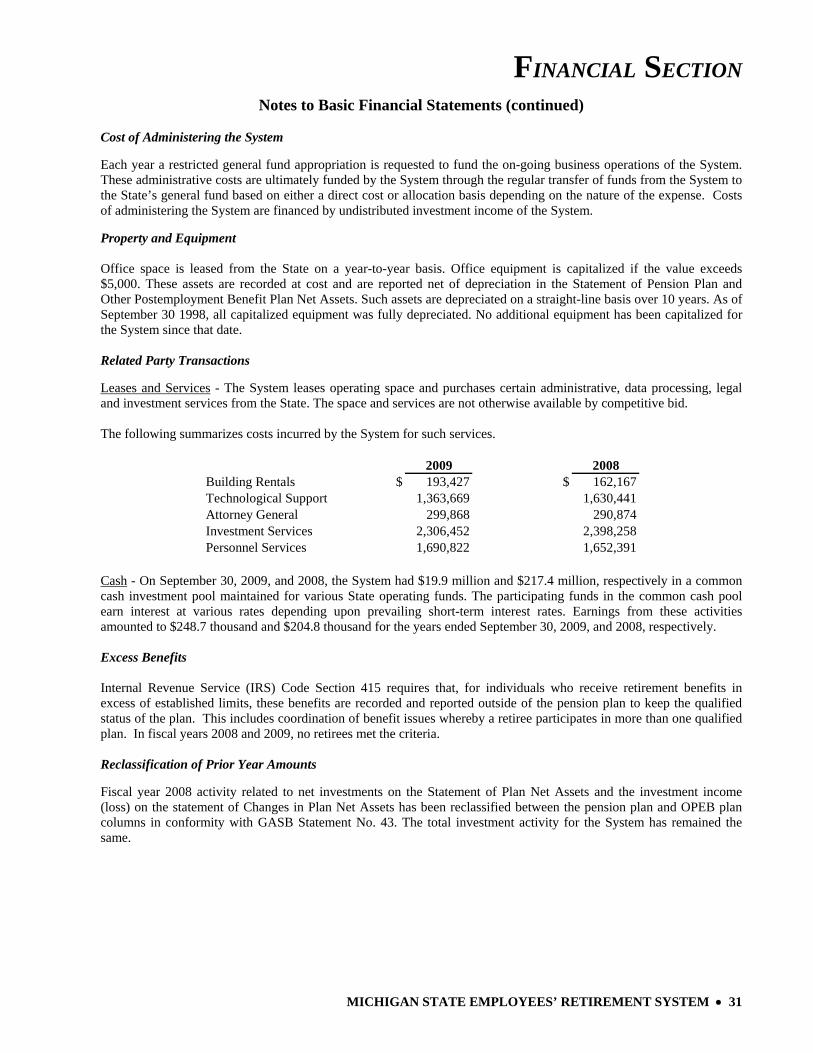
Notes to Basic Financial Statements (continued) Cost of Administering the System Each year a restricted general fund appropriation is requested to fund the on-going business operations of the System. These administrative costs are ultimately funded by the System through the regular transfer of funds from the System to the State’s general fund based on either a direct cost or allocation basis depending on the nature of the expense. Costs of administering the System are financed by undistributed investment income of the System. Property and Equipment Office space is leased from the State on a year-to-year basis. Office equipment is capitalized if the value exceeds $5,000. These assets are recorded at cost and are reported net of depreciation in the Statement of Pension Plan and Other Postemployment Benefit Plan Net Assets. Such assets are depreciated on a straight-line basis over 10 years. As of September 30 1998, all capitalized equipment was fully depreciated. No additional equipment has been capitalized for the System since that date. Related Party Transactions Leases and Services - The System leases operating space and purchases certain administrative, data processing, legal and investment services from the State. The space and services are not otherwise available by competitive bid. The following summarizes costs incurred by the System for such services.
2009 2008Building Rentals $ 193,427 $ 162,167Technological Support 1,363,669 1,630,441Attorney General 299,868 290,874Investment Services 2,306,452 2,398,258Personnel Services 1,690,822 1,652,391
Cash - On September 30, 2009, and 2008, the System had $19.9 million and $217.4 million, respectively in a common cash investment pool maintained for various State operating funds. The participating funds in the common cash pool earn interest at various rates depending upon prevailing short-term interest rates. Earnings from these activities amounted to $248.7 thousand and $204.8 thousand for the years ended September 30, 2009, and 2008, respectively. Excess Benefits Internal Revenue Service (IRS) Code Section 415 requires that, for individuals who receive retirement benefits in excess of established limits, these benefits are recorded and reported outside of the pension plan to keep the qualified status of the plan. This includes coordination of benefit issues whereby a retiree participates in more than one qualified plan. In fiscal years 2008 and 2009, no retirees met the criteria. Reclassification of Prior Year Amounts Fiscal year 2008 activity related to net investments on the Statement of Plan Net Assets and the investment income (loss) on the statement of Changes in Plan Net Assets has been reclassified between the pension plan and OPEB plan columns in conformity with GASB Statement No. 43. The total investment activity for the System has remained the same.
FINANCIAL SECTION
32 • MICHIGAN STATE EMPLOYEES’ RETIREMENT SYSTEM
Notes to Basic Financial Statements (continued) NOTE 3 – CONTRIBUTIONS AND FUNDED STATUS Contributions Members currently participate in the System on a non-contributory basis. Under certain circumstances, members may contribute to the System for the purchase of creditable service, such as military service or maternity leave. Effective August 1, 1998, the retirement act was amended to permit a universal buy-in. With a universal buy-in, a member may elect to purchase no more than 5 years of service credit (less other service credit purchased). The State is required by Public Act 240 of 1943, as amended, to contribute amounts necessary to finance the coverage of members and retiree OPEB. Contribution provisions are specified by State statute and may be amended only by action of the State Legislature. Employer contributions to the System are determined on an actuarial basis using the entry age normal actuarial cost method. Under this method, the actuarial present value of the projected benefits of each individual included in the actuarial valuation is allocated on a level basis over the service of the individual between entry age and assumed exit age. The portion of this cost allocated to the current valuation year is called the normal cost. The remainder is called the actuarial accrued liability. Normal cost is funded on a current basis. For retirement and OPEB, the unfunded (overfunded) actuarial accrued liability will be amortized over a 27 year period for the 2009 fiscal year and is amortized over a 28 year period for the 2008 fiscal year. Actual employer contributions for retirement benefits were $343.8 million and $355.7 million for fiscal years 2009 and 2008, respectively, representing 20.2% of annual covered payroll for the year ended September 30, 2008. The fiscal year 2009 annual covered payroll is not yet available. Required employer contributions based on previous year actuarial valuations for pensions included:
1. $146.0 million and $151.3 million for fiscal years 2009 and 2008, respectively, for the normal cost of pensions representing 8.3% and 8.3% (before reconciliation) of annual covered payroll for fiscal years 2008 and 2007, respectively.
2. $205.7 million and $156.7 million for fiscal years 2009 and 2008, respectively, for amortization of unfunded
actuarial accrued liability representing 11.7% and 8.6% (before reconciliation) of annual covered payroll for fiscal years 2008 and 2007, respectively.
Actual employer contributions for other postemployment benefits (OPEB) were $362.4 million and $342.2 million for fiscal years 2009 and 2008, respectively, representing 19.4% of annual covered payroll for the year ended September 30, 2008. The fiscal year 2009 annual covered payroll is not yet available. Required employer contributions based on previous year actuarial valuations for OPEB included:
1. $396.9 million and $391.9 million for fiscal years 2009 and 2008, respectively, for the normal cost of OPEB
representing 14.1% and 13.3% (before reconciliation) of annual covered payroll for fiscal years 2008 and 2007, respectively.
2. $525.9 million and $487.3 million for fiscal years 2009 and 2008, respectively, for amortization of unfunded
actuarial accrued liability representing 18.6% and 16.5% (before reconciliation) of annual covered payroll for fiscal years 2008 and 2007, respectively.
The System is required to reconcile with actuarial requirements annually. Any funding excess or deficiency for pension benefits is smoothed over 5 years. One fifth (20%) of the funding excess or deficiency is included in each of the subsequent years’ contribution, and is not recognized as a payable or receivable in the accounting records.
In March 2001, the Internal Revenue Service issued a private letter ruling allowing the System’s members to purchase service credit and repay refunds using tax-deferred (pre-tax) dollars. The program was implemented and payments began in fiscal year 2002.
FINANCIAL SECTION
MICHIGAN STATE EMPLOYEES’ RETIREMENT SYSTEM • 33
Notes to Basic Financial Statements (continued) The program allows members to purchase service credit and repay refunds on a tax-deferred basis. Members sign an irrevocable agreement that identifies the contract duration, monthly payment, total contract amount and years of service credit being purchased. The duration of the contract can range from 1 to 20 years. The amounts are withheld from the members’ paycheck and are treated as employer pick-up contributions pursuant to Internal Revenue Code Section 414(h). At September 30, 2009, and September 30, 2008, there were 5,531 and 5,896 agreements, respectively. Agreement amounts that will not be collected within 12 months are discounted using the assumed actuarial rate of return of 8%. The average length remaining of a contract was approximately 12.6 and 13.3 years for 2009 and 2008. The short-term receivable was $10.0 million and the discounted long-term receivable was $48.5 million at September 30, 2009. At September 30, 2008, the short-term receivable was $10.6 million and the discounted long-term receivable was $53.8 million. Funded Status Participating employers are required to contribute at an actuarially determined rate for both pension benefits and OPEB. For fiscal year 2008, the actuarial accrued liability (AAL) for pension benefits was $13.8 billion, and the actuarial value of assets was $11.4 billion, resulting in an unfunded actuarial accrued liability (UAAL) of $2.4 billion and a funded ratio of 82.8%. The covered payroll (annual payroll of active employees covered by the plan) was $1.8 billion, and the ratio of the UAAL to the covered payroll was 134.0%. For fiscal year 2008, the actuarial accrued liability (AAL) for OPEB was $13.5 billion, and the actuarial value of assets was $0, resulting in an unfunded actuarial accrued liability (UAAL) of $13.5 billion and a funded ratio of 0.0%. The covered payroll (annual payroll of active employees covered by the plan) was $2.8 billion, and the ratio of the UAAL to the covered payroll was 479.9%. Actuarial Valuations and Assumptions Actuarial valuations for both the pension and OPEB plans involve estimates of the value of reported amounts and assumptions about the probability of occurrence of events far into the future. Examples include assumptions about future employment, mortality and the healthcare cost trend. Amounts determined regarding the funded status of the plan and the annual required contributions (ARC) are subject to continual revision as actual results are compared with past expectations and new estimates are made about the future. The schedules of funding progress, presented as required supplementary information following the notes to the financial statements, present multi-year trend information about whether the actuarial value of plan assets for both pension and OPEB plans is increasing or decreasing over time relative to the actuarial accrued liabilities for benefits. The accompanying schedules of employer contributions present trend information about the amounts contributed to the plan by employers in comparison to the ARC, an amount that is actuarially determined in accordance with the parameters of GASB Statement No. 25 for pension contributions and GASB Statement No. 43 for OPEB contributions. Projections of benefits for financial reporting purposes are based on the substantive plan (the plan as understood by the employer and plan members) and include the types of benefits provided at the time of each valuation and the historical pattern of sharing of benefit costs between the employer and plan members to that point. The actuarial methods and assumptions used include techniques that are designed to reduce the effects of short-term volatility in actuarial accrued liabilities and the actuarial value of assets, consistent with the long-term perspective of the calculations.
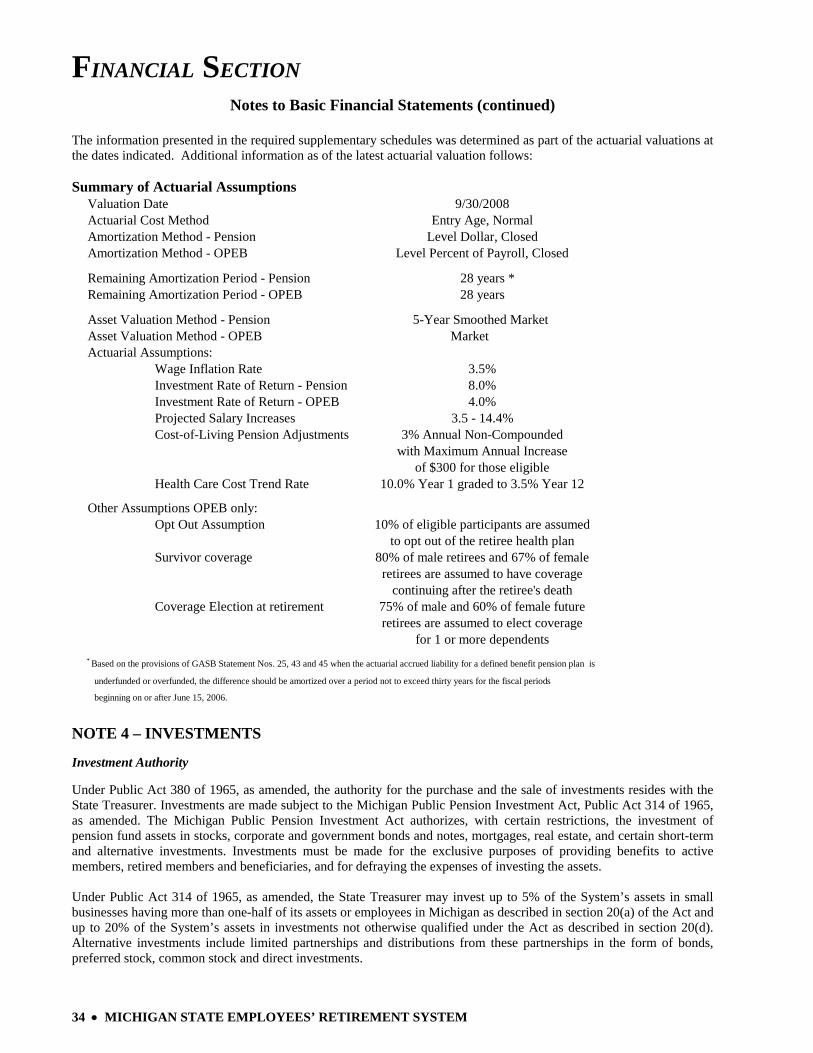
FINANCIAL SECTION
34 • MICHIGAN STATE EMPLOYEES’ RETIREMENT SYSTEM
Notes to Basic Financial Statements (continued)
The information presented in the required supplementary schedules was determined as part of the actuarial valuations at the dates indicated. Additional information as of the latest actuarial valuation follows: Summary of Actuarial Assumptions
Valuation Date 9/30/2008Actuarial Cost Method Entry Age, NormalAmortization Method - Pension Level Dollar, ClosedAmortization Method - OPEB Level Percent of Payroll, Closed
Remaining Amortization Period - Pension 28 years *Remaining Amortization Period - OPEB 28 years
Asset Valuation Method - Pension 5-Year Smoothed Market Asset Valuation Method - OPEB MarketActuarial Assumptions:
Wage Inflation Rate 3.5%Investment Rate of Return - Pension 8.0%Investment Rate of Return - OPEB 4.0%Projected Salary Increases 3.5 - 14.4%Cost-of-Living Pension Adjustments 3% Annual Non-Compounded
with Maximum Annual Increaseof $300 for those eligible
Health Care Cost Trend Rate 10.0% Year 1 graded to 3.5% Year 12
Other Assumptions OPEB only:Opt Out Assumption 10% of eligible participants are assumed
to opt out of the retiree health planSurvivor coverage 80% of male retirees and 67% of female
retirees are assumed to have coveragecontinuing after the retiree's death
Coverage Election at retirement 75% of male and 60% of female futureretirees are assumed to elect coverage
for 1 or more dependents* Based on the provisions of GASB Statement Nos. 25, 43 and 45 when the actuarial accrued liability for a defined benefit pension plan is
underfunded or overfunded, the difference should be amortized over a period not to exceed thirty years for the fiscal periods
beginning on or after June 15, 2006. NOTE 4 – INVESTMENTS Investment Authority Under Public Act 380 of 1965, as amended, the authority for the purchase and the sale of investments resides with the State Treasurer. Investments are made subject to the Michigan Public Pension Investment Act, Public Act 314 of 1965, as amended. The Michigan Public Pension Investment Act authorizes, with certain restrictions, the investment of pension fund assets in stocks, corporate and government bonds and notes, mortgages, real estate, and certain short-term and alternative investments. Investments must be made for the exclusive purposes of providing benefits to active members, retired members and beneficiaries, and for defraying the expenses of investing the assets. Under Public Act 314 of 1965, as amended, the State Treasurer may invest up to 5% of the System’s assets in small businesses having more than one-half of its assets or employees in Michigan as described in section 20(a) of the Act and up to 20% of the System’s assets in investments not otherwise qualified under the Act as described in section 20(d). Alternative investments include limited partnerships and distributions from these partnerships in the form of bonds, preferred stock, common stock and direct investments.
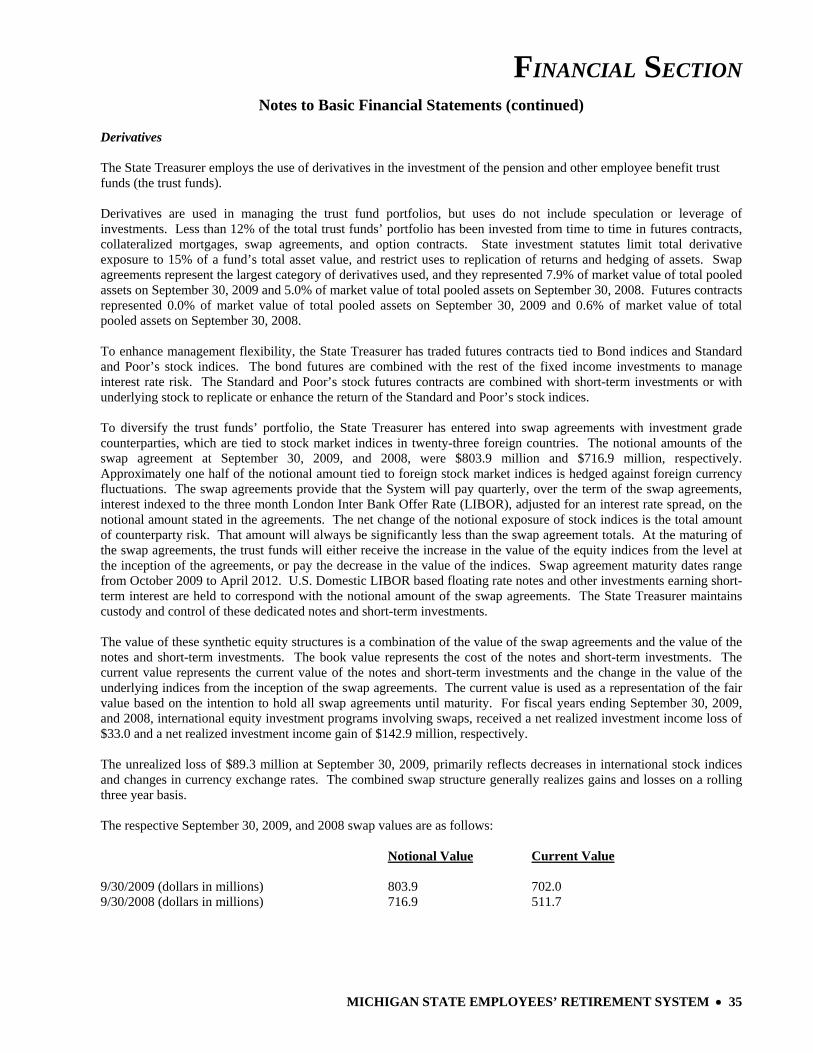
FINANCIAL SECTION
MICHIGAN STATE EMPLOYEES’ RETIREMENT SYSTEM • 35
Notes to Basic Financial Statements (continued) Derivatives The State Treasurer employs the use of derivatives in the investment of the pension and other employee benefit trust funds (the trust funds). Derivatives are used in managing the trust fund portfolios, but uses do not include speculation or leverage of investments. Less than 12% of the total trust funds’ portfolio has been invested from time to time in futures contracts, collateralized mortgages, swap agreements, and option contracts. State investment statutes limit total derivative exposure to 15% of a fund’s total asset value, and restrict uses to replication of returns and hedging of assets. Swap agreements represent the largest category of derivatives used, and they represented 7.9% of market value of total pooled assets on September 30, 2009 and 5.0% of market value of total pooled assets on September 30, 2008. Futures contracts represented 0.0% of market value of total pooled assets on September 30, 2009 and 0.6% of market value of total pooled assets on September 30, 2008. To enhance management flexibility, the State Treasurer has traded futures contracts tied to Bond indices and Standard and Poor’s stock indices. The bond futures are combined with the rest of the fixed income investments to manage interest rate risk. The Standard and Poor’s stock futures contracts are combined with short-term investments or with underlying stock to replicate or enhance the return of the Standard and Poor’s stock indices. To diversify the trust funds’ portfolio, the State Treasurer has entered into swap agreements with investment grade counterparties, which are tied to stock market indices in twenty-three foreign countries. The notional amounts of the swap agreement at September 30, 2009, and 2008, were $803.9 million and $716.9 million, respectively. Approximately one half of the notional amount tied to foreign stock market indices is hedged against foreign currency fluctuations. The swap agreements provide that the System will pay quarterly, over the term of the swap agreements, interest indexed to the three month London Inter Bank Offer Rate (LIBOR), adjusted for an interest rate spread, on the notional amount stated in the agreements. The net change of the notional exposure of stock indices is the total amount of counterparty risk. That amount will always be significantly less than the swap agreement totals. At the maturing of the swap agreements, the trust funds will either receive the increase in the value of the equity indices from the level at the inception of the agreements, or pay the decrease in the value of the indices. Swap agreement maturity dates range from October 2009 to April 2012. U.S. Domestic LIBOR based floating rate notes and other investments earning short-term interest are held to correspond with the notional amount of the swap agreements. The State Treasurer maintains custody and control of these dedicated notes and short-term investments. The value of these synthetic equity structures is a combination of the value of the swap agreements and the value of the notes and short-term investments. The book value represents the cost of the notes and short-term investments. The current value represents the current value of the notes and short-term investments and the change in the value of the underlying indices from the inception of the swap agreements. The current value is used as a representation of the fair value based on the intention to hold all swap agreements until maturity. For fiscal years ending September 30, 2009, and 2008, international equity investment programs involving swaps, received a net realized investment income loss of $33.0 and a net realized investment income gain of $142.9 million, respectively. The unrealized loss of $89.3 million at September 30, 2009, primarily reflects decreases in international stock indices and changes in currency exchange rates. The combined swap structure generally realizes gains and losses on a rolling three year basis. The respective September 30, 2009, and 2008 swap values are as follows: Notional Value Current Value 9/30/2009 (dollars in millions) 803.9 702.0 9/30/2008 (dollars in millions) 716.9 511.7
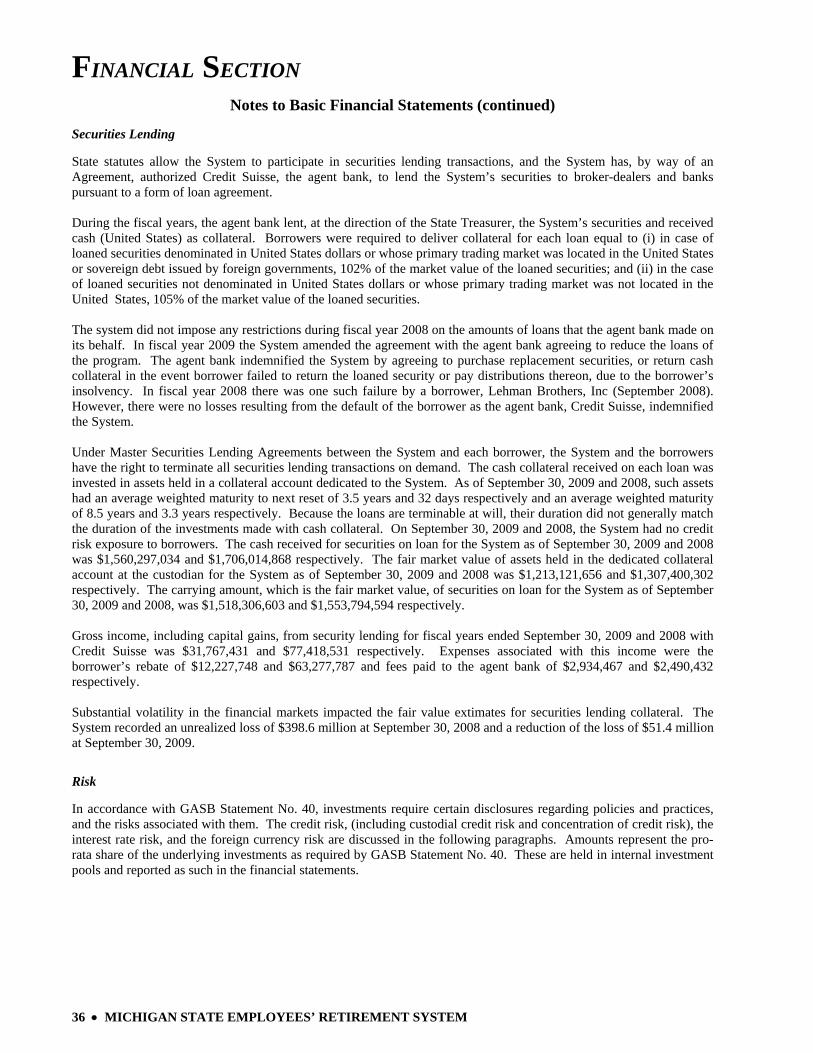
FINANCIAL SECTION
36 • MICHIGAN STATE EMPLOYEES’ RETIREMENT SYSTEM
Notes to Basic Financial Statements (continued) Securities Lending State statutes allow the System to participate in securities lending transactions, and the System has, by way of an Agreement, authorized Credit Suisse, the agent bank, to lend the System’s securities to broker-dealers and banks pursuant to a form of loan agreement. During the fiscal years, the agent bank lent, at the direction of the State Treasurer, the System’s securities and received cash (United States) as collateral. Borrowers were required to deliver collateral for each loan equal to (i) in case of loaned securities denominated in United States dollars or whose primary trading market was located in the United States or sovereign debt issued by foreign governments, 102% of the market value of the loaned securities; and (ii) in the case of loaned securities not denominated in United States dollars or whose primary trading market was not located in the United States, 105% of the market value of the loaned securities. The system did not impose any restrictions during fiscal year 2008 on the amounts of loans that the agent bank made on its behalf. In fiscal year 2009 the System amended the agreement with the agent bank agreeing to reduce the loans of the program. The agent bank indemnified the System by agreeing to purchase replacement securities, or return cash collateral in the event borrower failed to return the loaned security or pay distributions thereon, due to the borrower’s insolvency. In fiscal year 2008 there was one such failure by a borrower, Lehman Brothers, Inc (September 2008). However, there were no losses resulting from the default of the borrower as the agent bank, Credit Suisse, indemnified the System. Under Master Securities Lending Agreements between the System and each borrower, the System and the borrowers have the right to terminate all securities lending transactions on demand. The cash collateral received on each loan was invested in assets held in a collateral account dedicated to the System. As of September 30, 2009 and 2008, such assets had an average weighted maturity to next reset of 3.5 years and 32 days respectively and an average weighted maturity of 8.5 years and 3.3 years respectively. Because the loans are terminable at will, their duration did not generally match the duration of the investments made with cash collateral. On September 30, 2009 and 2008, the System had no credit risk exposure to borrowers. The cash received for securities on loan for the System as of September 30, 2009 and 2008 was $1,560,297,034 and $1,706,014,868 respectively. The fair market value of assets held in the dedicated collateral account at the custodian for the System as of September 30, 2009 and 2008 was $1,213,121,656 and $1,307,400,302 respectively. The carrying amount, which is the fair market value, of securities on loan for the System as of September 30, 2009 and 2008, was $1,518,306,603 and $1,553,794,594 respectively. Gross income, including capital gains, from security lending for fiscal years ended September 30, 2009 and 2008 with Credit Suisse was $31,767,431 and $77,418,531 respectively. Expenses associated with this income were the borrower’s rebate of $12,227,748 and $63,277,787 and fees paid to the agent bank of $2,934,467 and $2,490,432 respectively. Substantial volatility in the financial markets impacted the fair value extimates for securities lending collateral. The System recorded an unrealized loss of $398.6 million at September 30, 2008 and a reduction of the loss of $51.4 million at September 30, 2009.
Risk In accordance with GASB Statement No. 40, investments require certain disclosures regarding policies and practices, and the risks associated with them. The credit risk, (including custodial credit risk and concentration of credit risk), the interest rate risk, and the foreign currency risk are discussed in the following paragraphs. Amounts represent the pro-rata share of the underlying investments as required by GASB Statement No. 40. These are held in internal investment pools and reported as such in the financial statements.
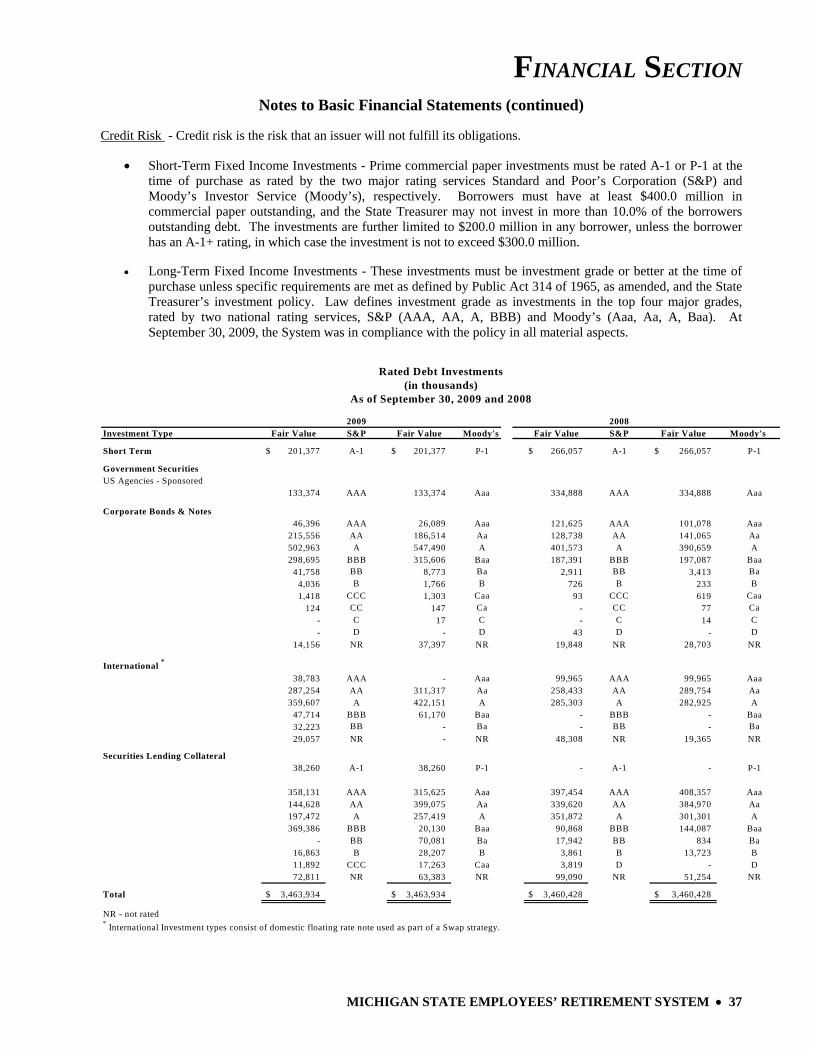
FINANCIAL SECTION
MICHIGAN STATE EMPLOYEES’ RETIREMENT SYSTEM • 37
Notes to Basic Financial Statements (continued) Credit Risk - Credit risk is the risk that an issuer will not fulfill its obligations.
• Short-Term Fixed Income Investments - Prime commercial paper investments must be rated A-1 or P-1 at the time of purchase as rated by the two major rating services Standard and Poor’s Corporation (S&P) and Moody’s Investor Service (Moody’s), respectively. Borrowers must have at least $400.0 million in commercial paper outstanding, and the State Treasurer may not invest in more than 10.0% of the borrowers outstanding debt. The investments are further limited to $200.0 million in any borrower, unless the borrower has an A-1+ rating, in which case the investment is not to exceed $300.0 million.
• Long-Term Fixed Income Investments - These investments must be investment grade or better at the time of
purchase unless specific requirements are met as defined by Public Act 314 of 1965, as amended, and the State Treasurer’s investment policy. Law defines investment grade as investments in the top four major grades, rated by two national rating services, S&P (AAA, AA, A, BBB) and Moody’s (Aaa, Aa, A, Baa). At September 30, 2009, the System was in compliance with the policy in all material aspects.
2009 2008Investment Type Fair Value S&P Fair Value Moody's Fair Value S&P Fair Value Moody's
Short Term 201,377$ A-1 201,377$ P-1 266,057$ A-1 266,057$ P-1
Government SecuritiesUS Agencies - Sponsored
133,374 AAA 133,374 Aaa 334,888 AAA 334,888 Aaa
Corporate Bonds & Notes46,396 AAA 26,089 Aaa 121,625 AAA 101,078 Aaa
215,556 AA 186,514 Aa 128,738 AA 141,065 Aa502,963 A 547,490 A 401,573 A 390,659 A298,695 BBB 315,606 Baa 187,391 BBB 197,087 Baa
41,758 BB 8,773 Ba 2,911 BB 3,413 Ba4,036 B 1,766 B 726 B 233 B1,418 CCC 1,303 Caa 93 CCC 619 Caa
124 CC 147 Ca - CC 77 Ca- C 17 C - C 14 C- D - D 43 D - D
14,156 NR 37,397 NR 19,848 NR 28,703 NR
International *
38,783 AAA - Aaa 99,965 AAA 99,965 Aaa287,254 AA 311,317 Aa 258,433 AA 289,754 Aa359,607 A 422,151 A 285,303 A 282,925 A
47,714 BBB 61,170 Baa - BBB - Baa32,223 BB - Ba - BB - Ba29,057 NR - NR 48,308 NR 19,365 NR
Securities Lending Collateral 38,260 A-1 38,260 P-1 - A-1 - P-1
358,131 AAA 315,625 Aaa 397,454 AAA 408,357 Aaa144,628 AA 399,075 Aa 339,620 AA 384,970 Aa197,472 A 257,419 A 351,872 A 301,301 A369,386 BBB 20,130 Baa 90,868 BBB 144,087 Baa
- BB 70,081 Ba 17,942 BB 834 Ba16,863 B 28,207 B 3,861 B 13,723 B11,892 CCC 17,263 Caa 3,819 D - D72,811 NR 63,383 NR 99,090 NR 51,254 NR
Total 3,463,934$ 3,463,934$ 3,460,428$ 3,460,428$
NR - not rated* International Investment types consist of domestic floating rate note used as part of a Swap strategy.
Rated Debt Investments(in thousands)
As of September 30, 2009 and 2008
FINANCIAL SECTION
38 • MICHIGAN STATE EMPLOYEES’ RETIREMENT SYSTEM
Notes to Basic Financial Statements (continued) Custodial Credit Risk - Custodial credit risk for investments is the risk that, in the event of a failure of the counterparty, the State will not be able to recover the value of the investment or collateral securities that are in the possession of an outside party. Investment securities are exposed to custodial credit risk if the securities are uninsured, are not registered in the name of the government and are held by either:
• The counterparty or
• The counterparty’s trust department or agent but not in the government name. The State Treasurer does not have a policy for custodial credit risk. However, the State’s custodial bank had a credit rating of A+ at September 30, 2009. As of September 30, 2009, no securities were exposed to custodial credit risk. As of September 30, 2008, government securities with a market value of $4.7 million, were exposed to custodial credit risk. These securities were held by the counterparty not in the name of the System.
Concentration of Credit Risk - Concentration of credit risk is the risk of loss attributed to the magnitude of a government’s investment in a single issuer. Other than obligations issued, assumed or guaranteed by the United States, its agencies or United States government sponsored enterprises, the System is prohibited by Public Act 314 of 1965, as amended, from investing in more than 5.0% of the outstanding obligations of any one issuer or investing more than 5.0% of a System’s assets in the obligations of any one issuer. At September 30, 2009, and 2008, there were no investments in any single issuer that accounted for more than 5% of the System’s assets nor were there any investments totaling more than 5% of the obligations of any one issuer, other than U.S. Government Securities as described above. Interest Rate Risk - Fixed Income Investments - Interest rate risk is the risk that changes in interest rates of debt investments will adversely affect the fair value of an investment. The State Treasurer’s policy states that cash equivalents are invested in short-term fixed income securities with an average weighted maturity of less than one year to provide liquidity and safety of principal from capital market and default risk. At September 30, 2009, and 2008, the fair value of the System’s prime commercial paper was $201.4 million and $266.1 million with the weighted average maturity of 3 days and 5 days, respectively. The State Treasurer does not have a policy regarding interest rate risk for long-term debt investments. However, the trust funds are invested with a long-term strategy. The goal is to balance higher returns while accepting minimum risk for the return. Analyzing the yield curve on individual securities as compared to U.S. Treasuries determines, in part, what is an acceptable risk for the return. Therefore, market conditions such as lower interest rates result in shorter duration and higher interest rates result in longer duration.
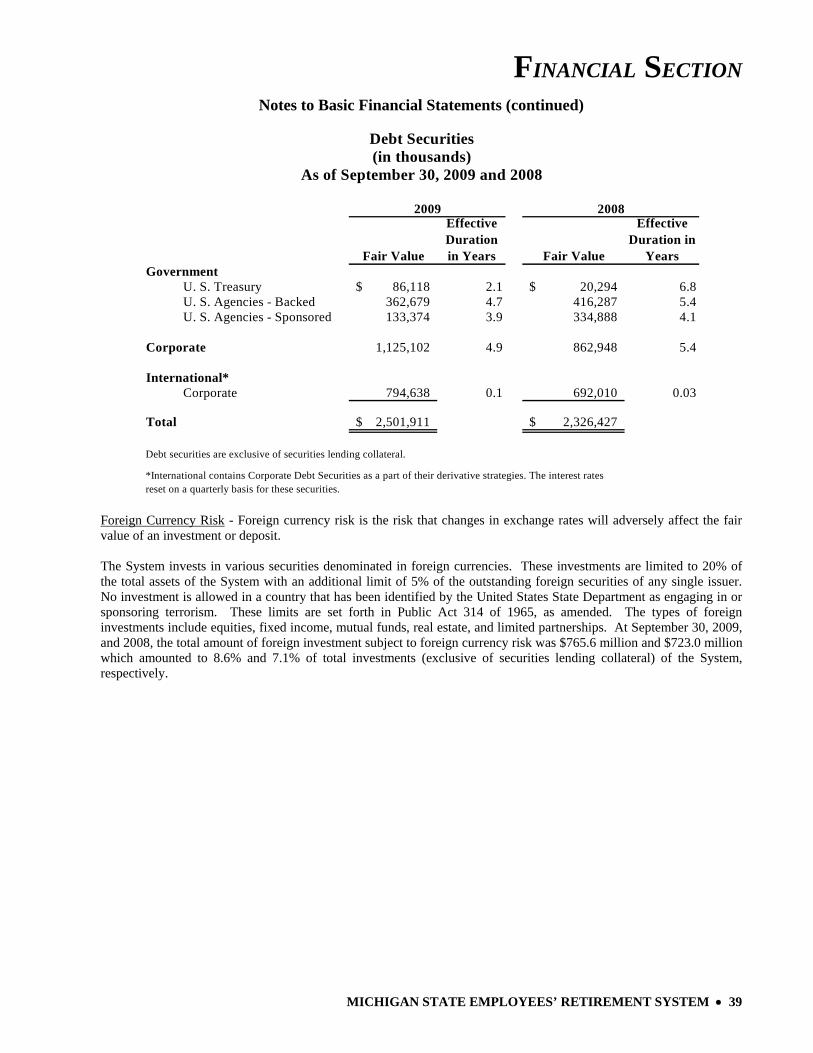
FINANCIAL SECTION
MICHIGAN STATE EMPLOYEES’ RETIREMENT SYSTEM • 39
Notes to Basic Financial Statements (continued)
Fair Value
Effective Duration in Years Fair Value
Effective Duration in
YearsGovernment
U. S. Treasury 86,118$ 2.1 20,294$ 6.8U. S. Agencies - Backed 362,679 4.7 416,287 5.4U. S. Agencies - Sponsored 133,374 3.9 334,888 4.1
Corporate 1,125,102 4.9 862,948 5.4
International*Corporate 794,638 0.1 692,010 0.03
Total 2,501,911$ 2,326,427$
Debt securities are exclusive of securities lending collateral.
*International contains Corporate Debt Securities as a part of their derivative strategies. The interest rates reset on a quarterly basis for these securities.
Debt Securities(in thousands)
As of September 30, 2009 and 2008
2009 2008
Foreign Currency Risk - Foreign currency risk is the risk that changes in exchange rates will adversely affect the fair value of an investment or deposit. The System invests in various securities denominated in foreign currencies. These investments are limited to 20% of the total assets of the System with an additional limit of 5% of the outstanding foreign securities of any single issuer. No investment is allowed in a country that has been identified by the United States State Department as engaging in or sponsoring terrorism. These limits are set forth in Public Act 314 of 1965, as amended. The types of foreign investments include equities, fixed income, mutual funds, real estate, and limited partnerships. At September 30, 2009, and 2008, the total amount of foreign investment subject to foreign currency risk was $765.6 million and $723.0 million which amounted to 8.6% and 7.1% of total investments (exclusive of securities lending collateral) of the System, respectively.
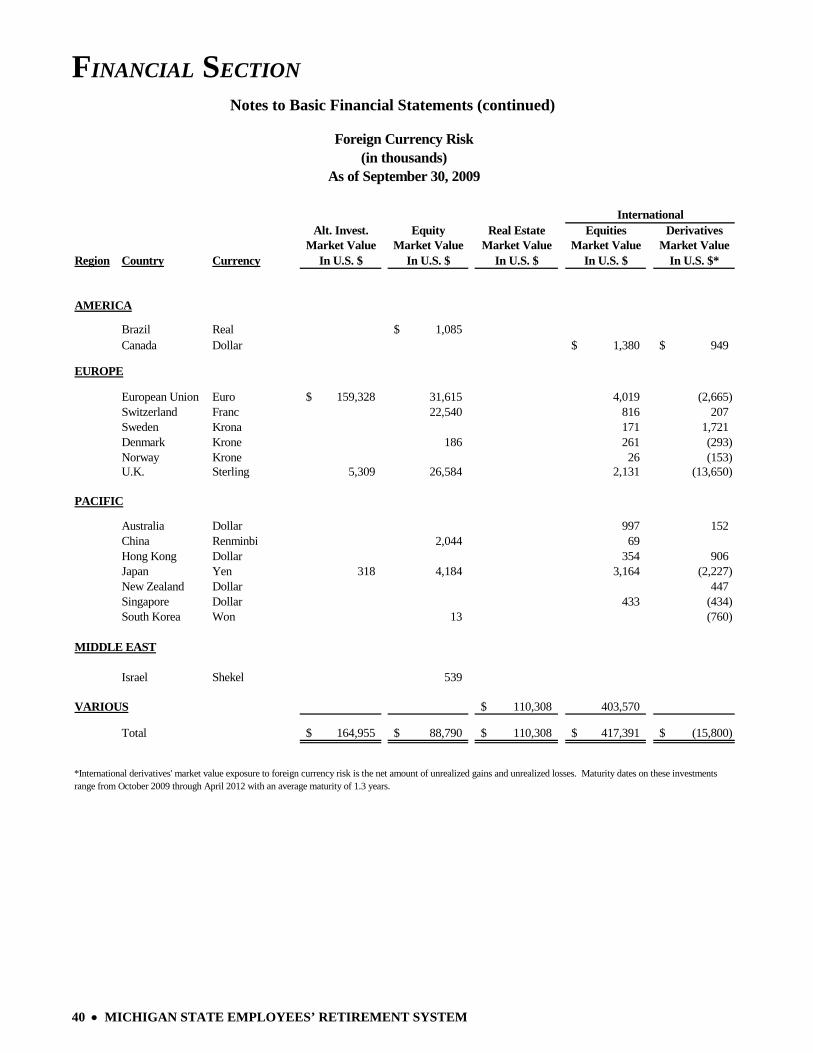
FINANCIAL SECTION
40 • MICHIGAN STATE EMPLOYEES’ RETIREMENT SYSTEM
Notes to Basic Financial Statements (continued)
Alt. Invest. Equity Real Estate Equities Derivatives
Region Country CurrencyMarket Value
In U.S. $Market Value
In U.S. $Market Value
In U.S. $Market Value
In U.S. $Market Value
In U.S. $*
AMERICA
Brazil Real 1,085$ Canada Dollar 1,380$ 949$
EUROPE
European Union Euro 159,328$ 31,615 4,019 (2,665) Switzerland Franc 22,540 816 207Sweden Krona 171 1,721Denmark Krone 186 261 (293)Norway Krone 26 (153)U.K. Sterling 5,309 26,584 2,131 (13,650)
PACIFIC
Australia Dollar 997 152China Renminbi 2,044 69Hong Kong Dollar 354 906Japan Yen 318 4,184 3,164 (2,227)New Zealand Dollar 447Singapore Dollar 433 (434)South Korea Won 13 (760)
MIDDLE EAST
Israel Shekel 539
VARIOUS 110,308$ 403,570
Total 164,955$ 88,790$ 110,308$ 417,391$ (15,800)$
*International derivatives' market value exposure to foreign currency risk is the net amount of unrealized gains and unrealized losses. Maturity dates on these investments range from October 2009 through April 2012 with an average maturity of 1.3 years.
Foreign Currency Risk(in thousands)
As of September 30, 2009
International
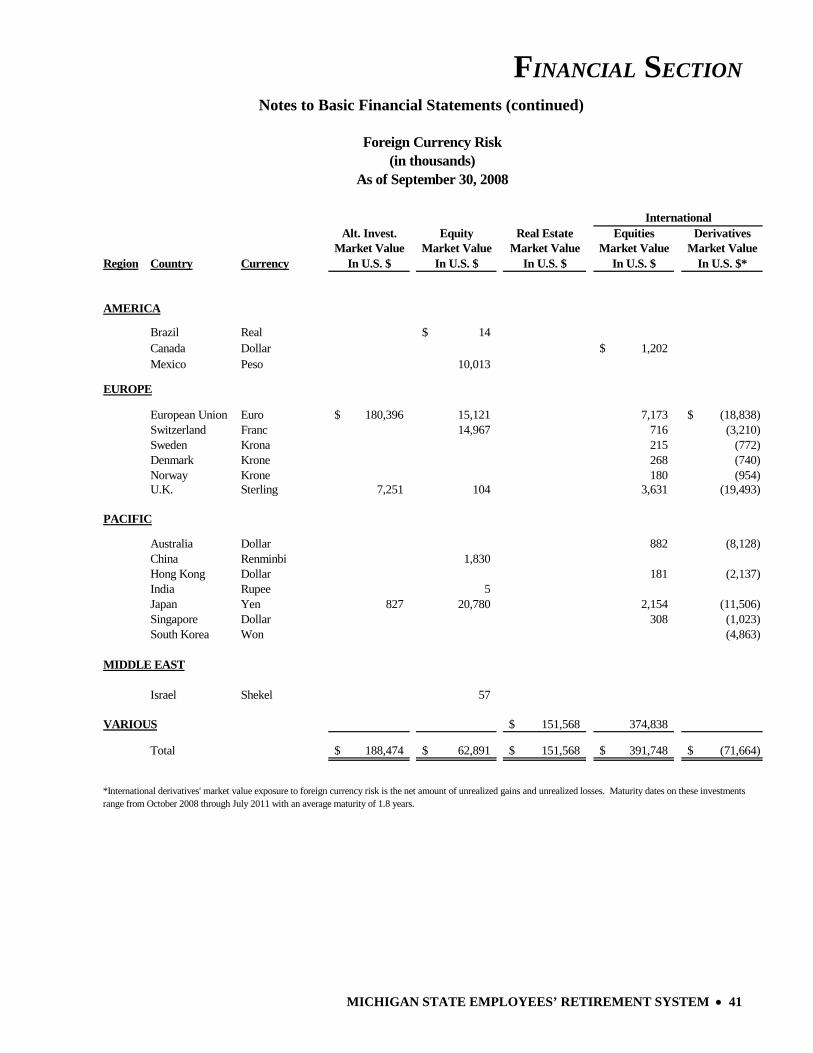
FINANCIAL SECTION
MICHIGAN STATE EMPLOYEES’ RETIREMENT SYSTEM • 41
Notes to Basic Financial Statements (continued)
Alt. Invest. Equity Real Estate Equities Derivatives
Region Country CurrencyMarket Value
In U.S. $Market Value
In U.S. $Market Value
In U.S. $Market Value
In U.S. $Market Value
In U.S. $*
AMERICA
Brazil Real 14$ Canada Dollar 1,202$ Mexico Peso 10,013
EUROPE
European Union Euro 180,396$ 15,121 7,173 (18,838)$ Switzerland Franc 14,967 716 (3,210)Sweden Krona 215 (772)Denmark Krone 268 (740)Norway Krone 180 (954)U.K. Sterling 7,251 104 3,631 (19,493)
PACIFIC
Australia Dollar 882 (8,128)China Renminbi 1,830Hong Kong Dollar 181 (2,137)India Rupee 5Japan Yen 827 20,780 2,154 (11,506)Singapore Dollar 308 (1,023)South Korea Won (4,863)
MIDDLE EAST
Israel Shekel 57
VARIOUS 151,568$ 374,838
Total 188,474$ 62,891$ 151,568$ 391,748$ (71,664)$
*International derivatives' market value exposure to foreign currency risk is the net amount of unrealized gains and unrealized losses. Maturity dates on these investments range from October 2008 through July 2011 with an average maturity of 1.8 years.
Foreign Currency Risk(in thousands)
As of September 30, 2008
International
FINANCIAL SECTION
42 • MICHIGAN STATE EMPLOYEES’ RETIREMENT SYSTEM
Notes to Basic Financial Statements (continued)
NOTE 5 - ACCOUNTING CHANGES AND RESTATEMENT The Governmental Accounting Standards Board (GASB) Statement No. 45, Accounting and Financial Reporting by Employers for Postemployment Benefits Other Than Pensions, has been adopted by the State of Michigan for fiscal year 2008. Statement No. 45 prohibits the reporting of retiree related postemployment benefits within the State Sponsored Group Insurance Fund, an internal service fund administratively established to provide health, long-term disability, life, vision, and dental coverage for participating employees and retirees. Beginning October 1, 2007, all retiree related activity, including an equity transfer of $50,240,270 in accumulated net assets, is included in the Statements of OPEB Plan Net Assets and Changes in OPEB Plan Net Assets as reflected in this report. The GASB has issued Statement No. 53, Accounting and Financial Reporting for Derivative Instruments, which establishes accounting and financial reporting requirements for derivative instruments entered into by state and local governments. This statement will be implemented in fiscal year 2010. NOTE 6 - COMMITMENTS AND CONTINGENCIES Under the Administrative Procedures Act, members may appeal a decision made by the Board. Once the administrative procedure has been exhausted, the decision may be appealed in Michigan’s court system. Various cases that have exhausted the administrative procedures have been appealed in the court system. These cases are in the normal course of business and the System does not anticipate any material loss as a result of the contingent liabilities.
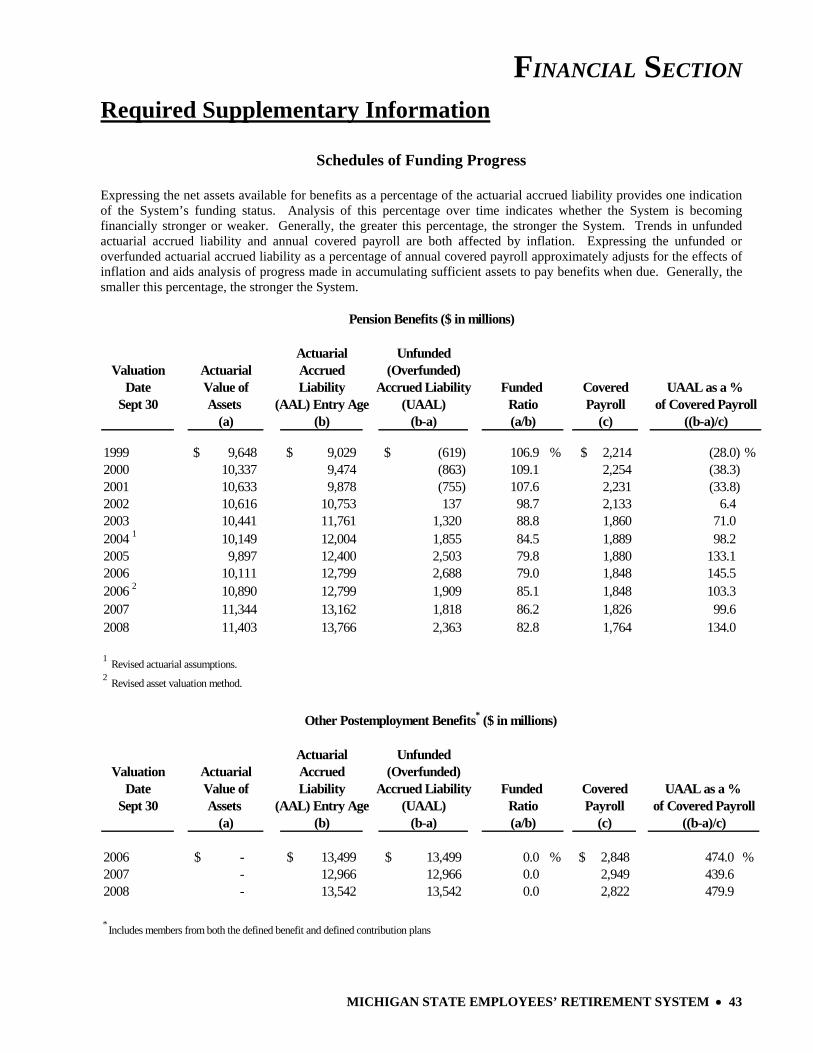
FINANCIAL SECTION
MICHIGAN STATE EMPLOYEES’ RETIREMENT SYSTEM • 43
Required Supplementary Information
Schedules of Funding Progress Expressing the net assets available for benefits as a percentage of the actuarial accrued liability provides one indication of the System’s funding status. Analysis of this percentage over time indicates whether the System is becoming financially stronger or weaker. Generally, the greater this percentage, the stronger the System. Trends in unfunded actuarial accrued liability and annual covered payroll are both affected by inflation. Expressing the unfunded or overfunded actuarial accrued liability as a percentage of annual covered payroll approximately adjusts for the effects of inflation and aids analysis of progress made in accumulating sufficient assets to pay benefits when due. Generally, the smaller this percentage, the stronger the System.
Actuarial UnfundedValuation Actuarial Accrued (Overfunded)
Date Value of Liability Accrued Liability CoveredSept 30 Assets (AAL) Entry Age (UAAL) Payroll
(a) (b) (b-a) (c)
1999 9,648$ 9,029$ (619)$ 106.9 % 2,214$ (28.0) %2000 10,337 9,474 (863) 109.1 2,254 (38.3)2001 10,633 9,878 (755) 107.6 2,231 (33.8)2002 10,616 10,753 137 98.7 2,133 6.42003 10,441 11,761 1,320 88.8 1,860 71.02004 1 10,149 12,004 1,855 84.5 1,889 98.22005 9,897 12,400 2,503 79.8 1,880 133.12006 10,111 12,799 2,688 79.0 1,848 145.52006 2 10,890 12,799 1,909 85.1 1,848 103.32007 11,344 13,162 1,818 86.2 1,826 99.62008 11,403 13,766 2,363 82.8 1,764 134.0
1 Revised actuarial assumptions.2 Revised asset valuation method.
(a/b) ((b-a)/c)
Pension Benefits ($ in millions)
Funded UAAL as a % Ratio of Covered Payroll
Actuarial UnfundedValuation Actuarial Accrued (Overfunded)
Date Value of Liability Accrued Liability CoveredSept 30 Assets (AAL) Entry Age (UAAL) Payroll
(a) (b) (b-a) (c)
2006 -$ 13,499$ 13,499$ 0.0 % 2,848$ 474.0 %2007 - 12,966 12,966 0.0 2,949 439.62008 - 13,542 13,542 0.0 2,822 479.9
* Includes members from both the defined benefit and defined contribution plans
(a/b) ((b-a)/c)
Other Postemployment Benefits* ($ in millions)
Funded UAAL as a % Ratio of Covered Payroll
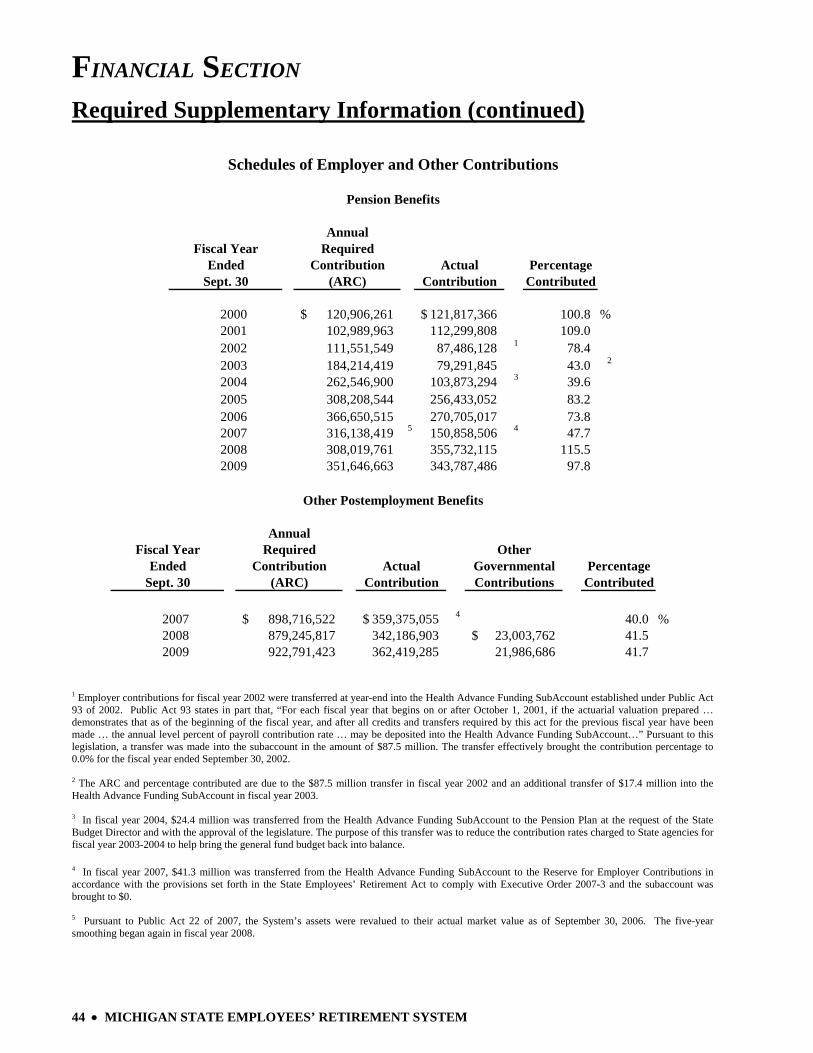
FINANCIAL SECTION
44 • MICHIGAN STATE EMPLOYEES’ RETIREMENT SYSTEM
Required Supplementary Information (continued)
AnnualRequired
Contribution Actual Percentage(ARC) Contribution Contributed
2000 120,906,261$ 121,817,366$ 100.8 %2001 102,989,963 112,299,808 109.02002 111,551,549 87,486,128 1 78.42003 184,214,419 79,291,845 43.0 2
2004 262,546,900 103,873,294 3 39.62005 308,208,544 256,433,052 83.22006 366,650,515 270,705,017 73.82007 316,138,419 5 150,858,506 4 47.72008 308,019,761 355,732,115 115.52009 351,646,663 343,787,486 97.8
Schedules of Employer and Other Contributions
Fiscal YearEnded
Sept. 30
Pension Benefits
AnnualRequired Other
Contribution Actual Governmental Percentage(ARC) Contribution Contributions Contributed
2007 898,716,522$ 359,375,055$ 4 40.0 %2008 879,245,817 342,186,903 23,003,762$ 41.5
2009 922,791,423 362,419,285 21,986,686 41.7
Fiscal YearEnded
Sept. 30
Other Postemployment Benefits
1 Employer contributions for fiscal year 2002 were transferred at year-end into the Health Advance Funding SubAccount established under Public Act 93 of 2002. Public Act 93 states in part that, “For each fiscal year that begins on or after October 1, 2001, if the actuarial valuation prepared … demonstrates that as of the beginning of the fiscal year, and after all credits and transfers required by this act for the previous fiscal year have been made … the annual level percent of payroll contribution rate … may be deposited into the Health Advance Funding SubAccount…” Pursuant to this legislation, a transfer was made into the subaccount in the amount of $87.5 million. The transfer effectively brought the contribution percentage to 0.0% for the fiscal year ended September 30, 2002. 2 The ARC and percentage contributed are due to the $87.5 million transfer in fiscal year 2002 and an additional transfer of $17.4 million into the Health Advance Funding SubAccount in fiscal year 2003. 3 In fiscal year 2004, $24.4 million was transferred from the Health Advance Funding SubAccount to the Pension Plan at the request of the State Budget Director and with the approval of the legislature. The purpose of this transfer was to reduce the contribution rates charged to State agencies for fiscal year 2003-2004 to help bring the general fund budget back into balance. 4 In fiscal year 2007, $41.3 million was transferred from the Health Advance Funding SubAccount to the Reserve for Employer Contributions in accordance with the provisions set forth in the State Employees’ Retirement Act to comply with Executive Order 2007-3 and the subaccount was brought to $0. 5 Pursuant to Public Act 22 of 2007, the System’s assets were revalued to their actual market value as of September 30, 2006. The five-year smoothing began again in fiscal year 2008.
FINANCIAL SECTION
MICHIGAN STATE EMPLOYEES’ RETIREMENT SYSTEM • 45
Note to Required Supplementary Information NOTE A - DESCRIPTION Ten-year historical trend information designed to provide information about the System’s progress made in accumulating sufficient assets to pay benefits when due is presented in the preceding schedules. Other ten-year historical trend information related to the System is presented in the Statistical and Actuarial Sections of the report. This information is presented to enable the reader to assess the progress made by the System in accumulating sufficient assets to pay pension and other postemployment benefits as they become due. Because this is the third year the System is reporting other postemployment benefits in accordance with GASB Statement No. 43, three years of historical trend information is provided. The comparability of trend information is affected by changes in actuarial assumptions, benefit provisions, actuarial funding methods, accounting policies, and other changes. Those changes usually affect trends in contribution requirements and in ratios that use the pension and other postemployment benefit obligations as a factor. The Schedules of Funding Progress and Schedules of Employer Contributions are reported as historical trend information. The Schedules of Funding Progress are presented to measure the progress being made to accumulate sufficient assets to pay benefits when due. The Schedules of Employer Contributions are presented to show the responsibility of the Employer in meeting the actuarial requirements to maintain the System on a sound financial basis.
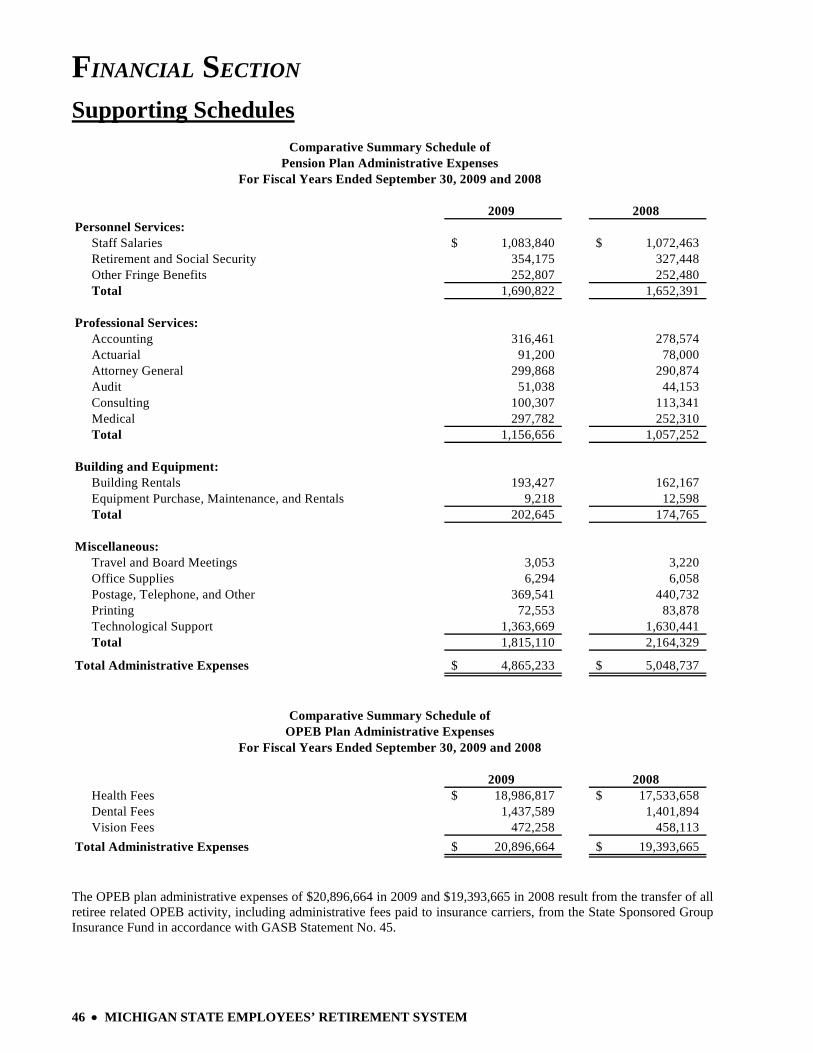
FINANCIAL SECTION
46 • MICHIGAN STATE EMPLOYEES’ RETIREMENT SYSTEM
Supporting Schedules
2009 2008
Personnel Services: Staff Salaries 1,083,840$ 1,072,463$ Retirement and Social Security 354,175 327,448 Other Fringe Benefits 252,807 252,480 Total 1,690,822 1,652,391
Professional Services: Accounting 316,461 278,574 Actuarial 91,200 78,000 Attorney General 299,868 290,874 Audit 51,038 44,153 Consulting 100,307 113,341 Medical 297,782 252,310 Total 1,156,656 1,057,252
Building and Equipment: Building Rentals 193,427 162,167 Equipment Purchase, Maintenance, and Rentals 9,218 12,598 Total 202,645 174,765
Miscellaneous: Travel and Board Meetings 3,053 3,220 Office Supplies 6,294 6,058 Postage, Telephone, and Other 369,541 440,732 Printing 72,553 83,878 Technological Support 1,363,669 1,630,441 Total 1,815,110 2,164,329
Total Administrative Expenses 4,865,233$ 5,048,737$
2009 2008 Health Fees 18,986,817$ 17,533,658$ Dental Fees 1,437,589 1,401,894 Vision Fees 472,258 458,113 Total Administrative Expenses 20,896,664$ 19,393,665$
Comparative Summary Schedule of Pension Plan Administrative Expenses
Comparative Summary Schedule of OPEB Plan Administrative Expenses
For Fiscal Years Ended September 30, 2009 and 2008
For Fiscal Years Ended September 30, 2009 and 2008
The OPEB plan administrative expenses of $20,896,664 in 2009 and $19,393,665 in 2008 result from the transfer of all retiree related OPEB activity, including administrative fees paid to insurance carriers, from the State Sponsored Group Insurance Fund in accordance with GASB Statement No. 45.
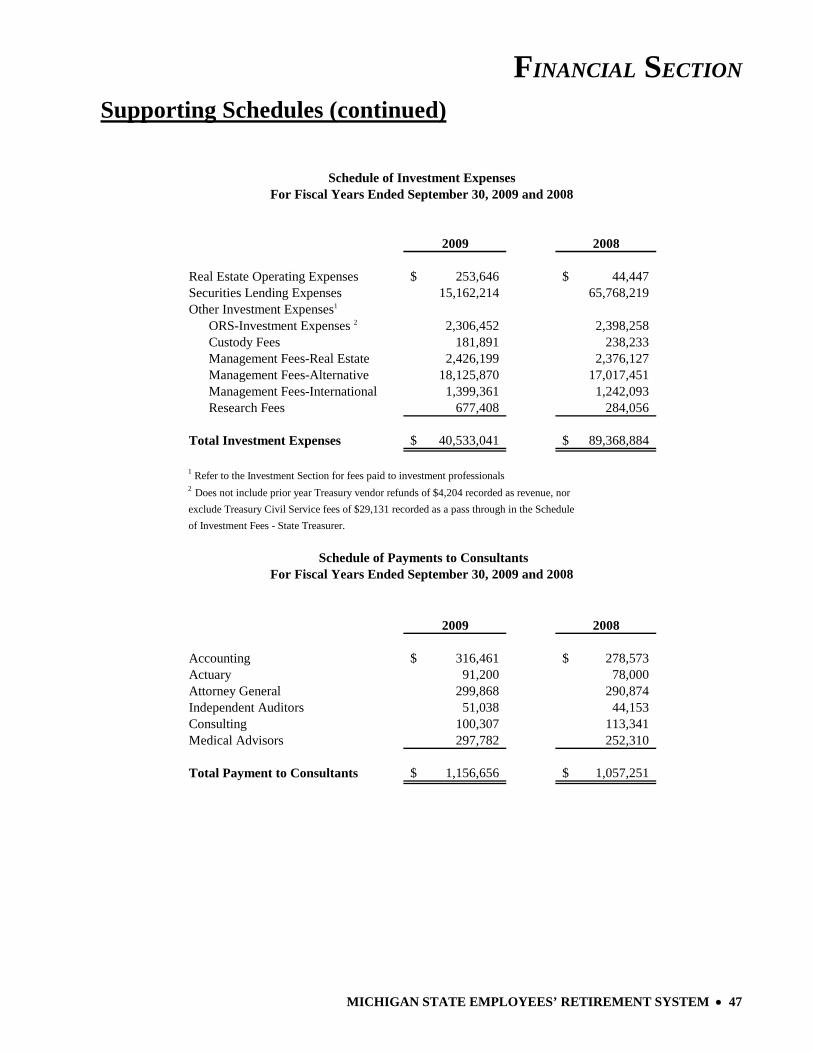
FINANCIAL SECTION
MICHIGAN STATE EMPLOYEES’ RETIREMENT SYSTEM • 47
Supporting Schedules (continued)
2009 2008
Real Estate Operating Expenses 253,646$ 44,447$ Securities Lending Expenses 15,162,214 65,768,219 Other Investment Expenses1
ORS-Investment Expenses 2 2,306,452 2,398,258 Custody Fees 181,891 238,233 Management Fees-Real Estate 2,426,199 2,376,127 Management Fees-Alternative 18,125,870 17,017,451 Management Fees-International 1,399,361 1,242,093 Research Fees 677,408 284,056
Total Investment Expenses 40,533,041$ 89,368,884$
1 Refer to the Investment Section for fees paid to investment professionals2 Does not include prior year Treasury vendor refunds of $4,204 recorded as revenue, norexclude Treasury Civil Service fees of $29,131 recorded as a pass through in the Scheduleof Investment Fees - State Treasurer.
2009 2008
Accounting 316,461$ 278,573$ Actuary 91,200 78,000 Attorney General 299,868 290,874 Independent Auditors 51,038 44,153 Consulting 100,307 113,341 Medical Advisors 297,782 252,310
Total Payment to Consultants 1,156,656$ 1,057,251$
Schedule of Investment Expenses
Schedule of Payments to Consultants
For Fiscal Years Ended September 30, 2009 and 2008
For Fiscal Years Ended September 30, 2009 and 2008

FINANCIAL SECTION
48 • MICHIGAN STATE EMPLOYEES’ RETIREMENT SYSTEM
Supporting Schedules (continued) Detail of Changes in Plan Net Assets (Pension and Other Postemployment Benefits) For the Year Ended September 30, 2009
Retired UndistributedEmployee Employer Benefit Investment
Contributions Contributions Payments Income OPEB TotalAdditions: Contributions: Member contributions 6,994,975$ 20,982,595$ 27,977,570$ Employer contributions 343,787,486$ 362,419,285 706,206,771 Other governmental contributions 21,986,686 21,986,686 Total Contributions 6,994,975 343,787,486 - - 405,388,566 756,171,027 Investment income: Net investment income (loss) (669,845,950)$ 1,382,455 (668,463,495) Investment expenses: Real estate operating expenses (252,959) (687) (253,646) Other investment expenses (25,049,190) (67,992) (25,117,182) Securities lending activities: Securities lending income 31,681,437 85,994 31,767,431 Securities lending expenses (15,121,170) (41,044) (15,162,214) Net investment income (loss) * - - - (678,587,832) 1,358,726 (677,229,106)
Transfer from other systems/funds 93,408 93,408 Miscellaneous income 130,847$ 1,963 516,063 648,873
Total additions 7,088,383 343,787,486 130,847 (678,585,869) 407,263,355 79,684,202
Deductions: Benefits paid to plan members and beneficiaries:
Retirement benefits 870,278,863 870,278,863 Health benefits 358,691,332 358,691,332 Dental/vision benefits 33,444,054 33,444,054 Refunds of member contributions 177,079 133,294 5,618 2,431 318,422 Transfers to other systems/funds 14,852 35,196 50,048 Administrative expenses 4,865,232 20,896,664 25,761,896
Total deductions 191,931 168,490 870,284,481 4,865,232 413,034,481 1,288,544,615
Net Increase (Decrease) Before Other Changes 6,896,452 343,618,996 (870,153,634) (683,451,101) (5,771,126) (1,208,860,413)
Other Changes in Net Assets: Interest allocation 4,138,491 242,938,414 480,968,884 (728,045,789) - Transfers upon retirement (19,277,042) 19,277,042 - Transfers of employer shares (2,348,414,049) 2,348,414,049 - Total other changes in net assets (15,138,551) (2,105,475,635) 2,848,659,975 (728,045,789) - -
Net Increase (Decrease) (8,242,099) (1,761,856,639) 1,978,506,341 (1,411,496,890) (5,771,126) (1,208,860,413) Net Assets Held in Trust for Pension and OPEB Benefits:Beginning of Year 205,532,842 3,036,730,170 6,012,111,048 531,869,843 32,272,476 9,818,516,379
End of Year 197,290,743$ 1,274,873,531$ 7,990,617,389$ (879,627,047)$ 26,501,350$ 8,609,655,966$ xxxxxxxxxxxxxxxxxx* Fiscal year 2008 activity reclassified.
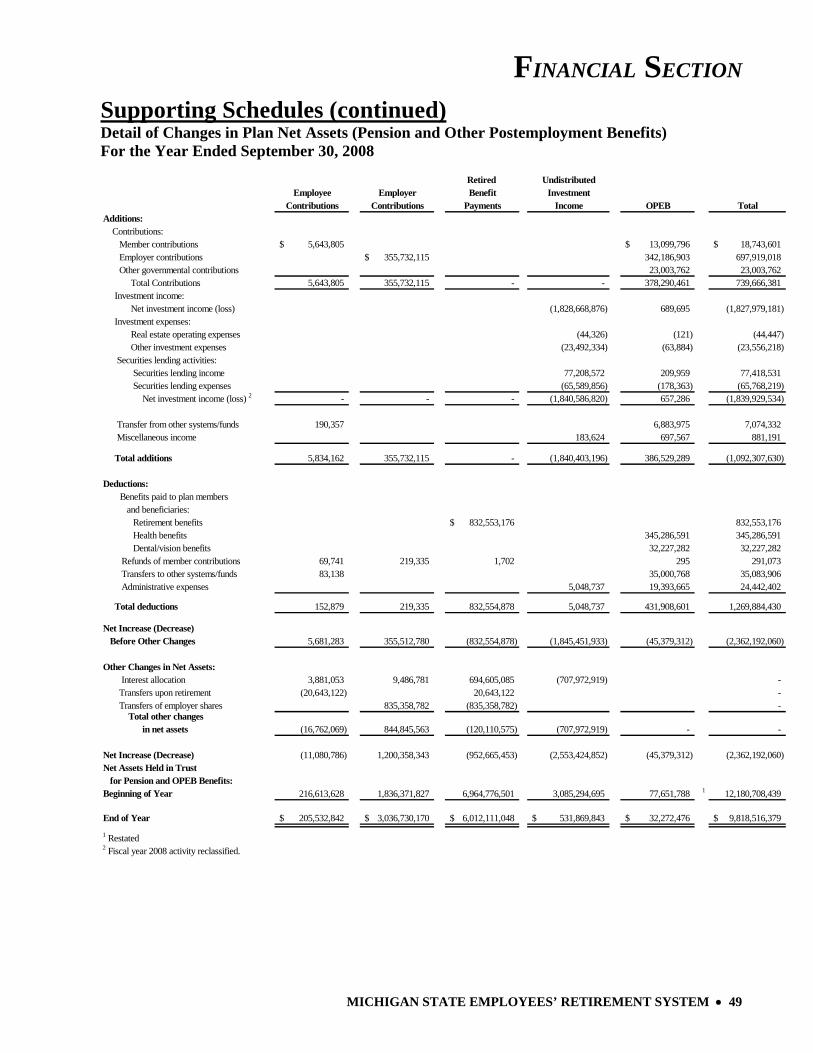
FINANCIAL SECTION
MICHIGAN STATE EMPLOYEES’ RETIREMENT SYSTEM • 49
Supporting Schedules (continued) Detail of Changes in Plan Net Assets (Pension and Other Postemployment Benefits) For the Year Ended September 30, 2008
Retired UndistributedEmployee Employer Benefit Investment
Contributions Contributions Payments Income OPEB TotalAdditions: Contributions: Member contributions 5,643,805$ 13,099,796$ 18,743,601$ Employer contributions 355,732,115$ 342,186,903 697,919,018 Other governmental contributions 23,003,762 23,003,762 Total Contributions 5,643,805 355,732,115 - - 378,290,461 739,666,381 Investment income: Net investment income (loss) (1,828,668,876) 689,695 (1,827,979,181) Investment expenses: Real estate operating expenses (44,326) (121) (44,447) Other investment expenses (23,492,334) (63,884) (23,556,218) Securities lending activities: Securities lending income 77,208,572 209,959 77,418,531 Securities lending expenses (65,589,856) (178,363) (65,768,219) Net investment income (loss) 2 - - - (1,840,586,820) 657,286 (1,839,929,534)
Transfer from other systems/funds 190,357 6,883,975 7,074,332 Miscellaneous income 183,624 697,567 881,191
Total additions 5,834,162 355,732,115 - (1,840,403,196) 386,529,289 (1,092,307,630)
Deductions: Benefits paid to plan members and beneficiaries:
Retirement benefits 832,553,176$ 832,553,176 Health benefits 345,286,591 345,286,591 Dental/vision benefits 32,227,282 32,227,282 Refunds of member contributions 69,741 219,335 1,702 295 291,073 Transfers to other systems/funds 83,138 35,000,768 35,083,906 Administrative expenses 5,048,737 19,393,665 24,442,402
Total deductions 152,879 219,335 832,554,878 5,048,737 431,908,601 1,269,884,430
Net Increase (Decrease) Before Other Changes 5,681,283 355,512,780 (832,554,878) (1,845,451,933) (45,379,312) (2,362,192,060)
Other Changes in Net Assets: Interest allocation 3,881,053 9,486,781 694,605,085 (707,972,919) - Transfers upon retirement (20,643,122) 20,643,122 - Transfers of employer shares 835,358,782 (835,358,782) - Total other changes in net assets (16,762,069) 844,845,563 (120,110,575) (707,972,919) - -
Net Increase (Decrease) (11,080,786) 1,200,358,343 (952,665,453) (2,553,424,852) (45,379,312) (2,362,192,060) Net Assets Held in Trust for Pension and OPEB Benefits:Beginning of Year 216,613,628 1,836,371,827 6,964,776,501 3,085,294,695 77,651,788 1 12,180,708,439
End of Year 205,532,842$ 3,036,730,170$ 6,012,111,048$ 531,869,843$ 32,272,476$ 9,818,516,379$ xxxxxxxxxxxxxxxxxx1 Restated2 Fiscal year 2008 activity reclassified.

50 • MICHIGAN STATE EMPLOYEES’ RETIREMENT SYSTEM
This page was intentionally left blank.
MICHIGAN STATE EMPLOYEES’ RETIREMENT SYSTEM • 51
INVESTMENT SECTION
Prepared by Michigan Department of Treasury, Bureau of Investments Jon M. Braeutigam, Director
Report on Investment Activity
Asset Allocation Investment Results
List of Largest Stock Holdings List of Largest Bond Holdings
Schedule of Investment Fees Schedule of Investment Commissions
Investment Summary

INVESTMENT SECTION
52 • MICHIGAN STATE EMPLOYEES’ RETIREMENT SYSTEM
Report on Investment Activity
INTRODUCTION The State Treasurer reports investment activity quarterly to the Investment Advisory Committee (Committee), which reviews the investments, goals, and objectives of the retirement funds and may submit recommendations regarding them to the State Treasurer. The Investment Advisory Committee may also, by a majority vote, direct the State Treasurer to dispose of any holdings that, in the Committee’s judgment, are not suitable for the funds involved, and may, by unanimous vote, direct the State Treasurer to make specific investments. The Investment Advisory Committee was created by Act 380 of the Public Acts of 1965. The three public members of the five-member committee are appointed by the Governor with the advice and consent of the Senate for three-year terms. The Director of the Department of Energy, Labor and Economic Growth and the Director of the Department of Management and Budget are ex-officio members. As of September 30, 2009, members of the Committee were as follows: David G. Sowerby, CFA (public member), Glenn P. Murray (public member), James B. Jacobs (public member), Stanley Pruss (ex-officio member), and Lisa Webb Sharpe (ex-officio member). The public members serve without pay, but may be paid actual and necessary travel and other expenses. INVESTMENT POLICY & GOALS Investment policy states that the fiduciary will operate within standard investment practices of the prudent person and in accordance with Public Employee Retirement System Investment Act 314 of 1965. The fiduciary is authorized to invest in government obligations, corporate obligations, various short-term obligations, corporate (domestic and international) stocks, private equity interests, mutual funds, real estate interests, and other investments subject to specific parameters. Above all, trust fund assets are to be invested for the exclusive benefit of the members of the System, in a fiduciary capacity. The System’s Proxy Voting Policy sets forth directives on the following issues: Boards of Directors, corporate governance, social issues, corporate restructurings and defenses. All proxies are reviewed and voted in accordance with the System’s policy. The primary function of the System is to provide retirement, survivor and disability benefits along with health and other postemployment benefits to its members. The State Treasurer is the sole investment fiduciary and custodian of the System’s investments pursuant to State law. The goals of the System are: 1. Achieve the optimal rate of return possible within prudent levels of risk.
2. Maintain sufficient liquidity to pay benefits. 3. Diversify assets to preserve capital and avoid large losses.
4. Meet or exceed the actuarial assumption over the long term. 5. Perform in the top half of the public plan universe over the long term. 6. Exceed individual asset class benchmarks over the long term. 7. Operate in a cost-effective manner. The strategy for achieving these goals is carried out by investing the assets of the System according to a two-year asset allocation model. The System currently invests in seven different asset classes, which provides for a well-diversified portfolio.
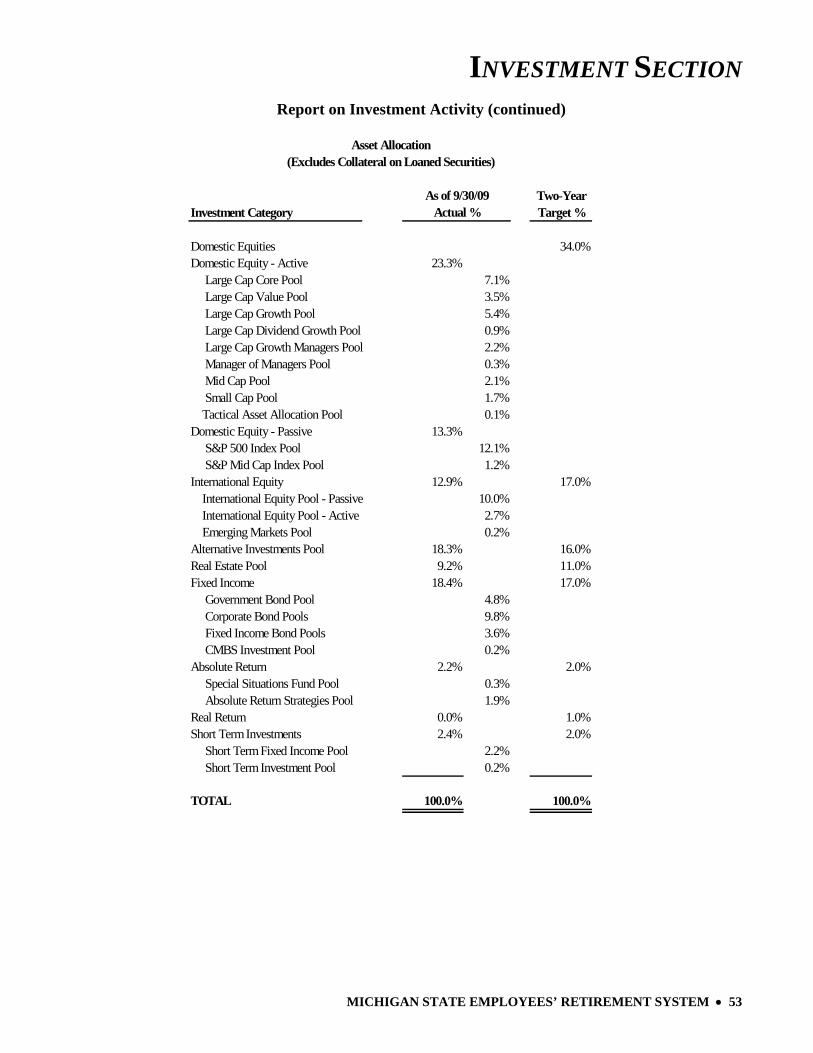
INVESTMENT SECTION
MICHIGAN STATE EMPLOYEES’ RETIREMENT SYSTEM • 53
Report on Investment Activity (continued)
Two-YearInvestment Category Target %
Domestic Equities 34.0%Domestic Equity - Active 23.3% Large Cap Core Pool 7.1% Large Cap Value Pool 3.5% Large Cap Growth Pool 5.4% Large Cap Dividend Growth Pool 0.9% Large Cap Growth Managers Pool 2.2% Manager of Managers Pool 0.3% Mid Cap Pool 2.1% Small Cap Pool 1.7% Tactical Asset Allocation Pool 0.1%Domestic Equity - Passive 13.3% S&P 500 Index Pool 12.1% S&P Mid Cap Index Pool 1.2%International Equity 12.9% 17.0% International Equity Pool - Passive 10.0% International Equity Pool - Active 2.7% Emerging Markets Pool 0.2%Alternative Investments Pool 18.3% 16.0%Real Estate Pool 9.2% 11.0%Fixed Income 18.4% 17.0% Government Bond Pool 4.8% Corporate Bond Pools 9.8% Fixed Income Bond Pools 3.6% CMBS Investment Pool 0.2%Absolute Return 2.2% 2.0% Special Situations Fund Pool 0.3% Absolute Return Strategies Pool 1.9%Real Return 0.0% 1.0%Short Term Investments 2.4% 2.0% Short Term Fixed Income Pool 2.2% Short Term Investment Pool 0.2%
TOTAL 100.0% 100.0%xxx xxx
Asset Allocation(Excludes Collateral on Loaned Securities)
As of 9/30/09Actual %
INVESTMENT SECTION
54 • MICHIGAN STATE EMPLOYEES’ RETIREMENT SYSTEM
Report on Investment Activity (continued) INVESTMENT AUTHORITY Pursuant to State Law (Section 91 of Act No. 380 of the Public Acts of 1965, as amended), the State Treasurer, State of Michigan, is the investment fiduciary for the following four State sponsored retirement systems: Michigan Public School Employees’ Retirement System, Michigan State Employees’ Retirement System, Michigan State Police Retirement System, and Michigan Judges’ Retirement System. Act No. 314 of the Public Acts of 1965, as amended, authorizes the investment of assets of public employee retirement systems or plans created and established by the State or any political subdivision.
INVESTMENT RESULTS Total Portfolio Results For the fiscal year ended September 30, 2009, the total System’s rate of return was (6.3)% as compiled by State Street Investment Analytics. Annualized rates of return for the three-year period ending September 30, 2009, were (1.3)%; for the five-year period were 4.1%; and for the ten-year period were 3.7%. Returns were calculated using a time-weighted rate of return in accordance with industry standards, unless a modification is described in the discussion of the reported return. Fiscal year ended September 2009 marked one of the most turbulent and volatile years in the capital markets and overall economy in several generations. Though a great deal of uncertainty and distress remains evident throughout the global economy and capital markets, the System’s investments ended the year on a more positive note rising in the final three months of the fiscal year driven by a sharp recovery in the U.S. and international equity markets. Moreover, as challenging as the investment environment has been for pension plan investments across the country, the System has ample assets to provide benefits now and far into the future. In the fall of 2008, the financial markets were in the midst of a truly historic period marked by precipitous declines in the U.S. and international equity markets, sharp declines in large portions of the bond market, and major signs of stress in alternative investments as well. Alternative investments are generally considered to include those outside the traditional stock and bond markets such as real estate, private equity, hedge funds, etc. The stress on the investment markets was so severe at times, major portions of the capital markets ceased to function effectively, or for a period of time, function at all. The investment markets were reacting to many factors including the massive amount of debt that had accumulated throughout the economy generally, but particularly in the residential mortgage markets. Powered by years of borrowed funds, asset prices, most notably home prices in the U.S. and in a number of foreign countries as well, rose dramatically. The price increases outpaced both inflation and the growth of the incomes of those borrowing. Lenders, able to themselves borrow funds at low rates under a liberal monetary policy, lowered lending standards making subprime loans to homebuyers with little capital for down payments and uncertain ability to repay the loans. A subprime loan is defined generally as those where the borrower has a FICO score below 640. The contraction of credit available to companies and consumers led to a dramatic decline in the overall U.S. and global economies. The U.S. unemployment rate ended fiscal year 2009 at 9.8%. Paralleling the effects on the financial services sector, investors witnessed bankruptcies and cutbacks in many non-financial companies, such as GM and Chrysler (which the System did not materially own). Faced with a sharply contracting economy and the nearly frozen financial sector, the U.S. government (and many foreign governments) enacted a series of programs designed to assist the lending markets. Programs such as the Troubled Asset Relief Program (TARP) and Term Asset-Backed Securities Loan Facility (TALF) were enacted to help areas such as commercial paper and mortgages regain normal operation and allow a sense of confidence and normalcy to re-emerge among investors, depositors, lenders, consumers, and corporate managements.
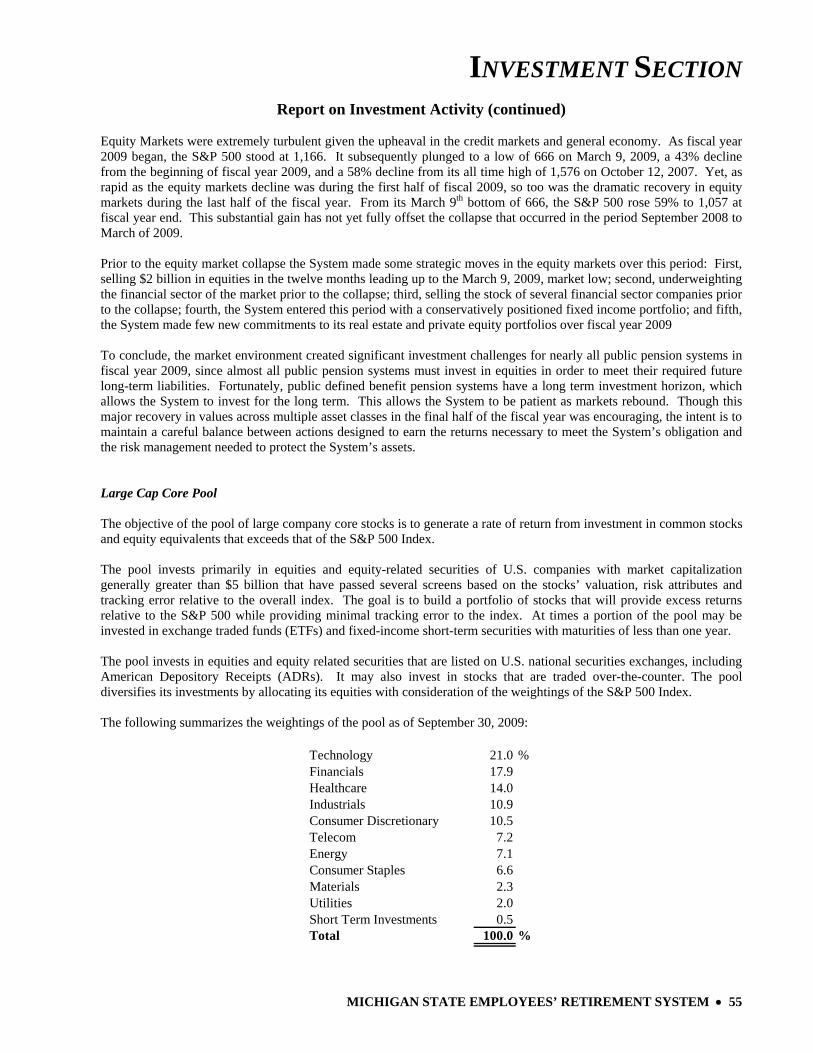
INVESTMENT SECTION
MICHIGAN STATE EMPLOYEES’ RETIREMENT SYSTEM • 55
Report on Investment Activity (continued) Equity Markets were extremely turbulent given the upheaval in the credit markets and general economy. As fiscal year 2009 began, the S&P 500 stood at 1,166. It subsequently plunged to a low of 666 on March 9, 2009, a 43% decline from the beginning of fiscal year 2009, and a 58% decline from its all time high of 1,576 on October 12, 2007. Yet, as rapid as the equity markets decline was during the first half of fiscal 2009, so too was the dramatic recovery in equity markets during the last half of the fiscal year. From its March 9th bottom of 666, the S&P 500 rose 59% to 1,057 at fiscal year end. This substantial gain has not yet fully offset the collapse that occurred in the period September 2008 to March of 2009. Prior to the equity market collapse the System made some strategic moves in the equity markets over this period: First, selling $2 billion in equities in the twelve months leading up to the March 9, 2009, market low; second, underweighting the financial sector of the market prior to the collapse; third, selling the stock of several financial sector companies prior to the collapse; fourth, the System entered this period with a conservatively positioned fixed income portfolio; and fifth, the System made few new commitments to its real estate and private equity portfolios over fiscal year 2009 To conclude, the market environment created significant investment challenges for nearly all public pension systems in fiscal year 2009, since almost all public pension systems must invest in equities in order to meet their required future long-term liabilities. Fortunately, public defined benefit pension systems have a long term investment horizon, which allows the System to invest for the long term. This allows the System to be patient as markets rebound. Though this major recovery in values across multiple asset classes in the final half of the fiscal year was encouraging, the intent is to maintain a careful balance between actions designed to earn the returns necessary to meet the System’s obligation and the risk management needed to protect the System’s assets. Large Cap Core Pool The objective of the pool of large company core stocks is to generate a rate of return from investment in common stocks and equity equivalents that exceeds that of the S&P 500 Index. The pool invests primarily in equities and equity-related securities of U.S. companies with market capitalization generally greater than $5 billion that have passed several screens based on the stocks’ valuation, risk attributes and tracking error relative to the overall index. The goal is to build a portfolio of stocks that will provide excess returns relative to the S&P 500 while providing minimal tracking error to the index. At times a portion of the pool may be invested in exchange traded funds (ETFs) and fixed-income short-term securities with maturities of less than one year. The pool invests in equities and equity related securities that are listed on U.S. national securities exchanges, including American Depository Receipts (ADRs). It may also invest in stocks that are traded over-the-counter. The pool diversifies its investments by allocating its equities with consideration of the weightings of the S&P 500 Index.
The following summarizes the weightings of the pool as of September 30, 2009:
Technology 21.0 %Financials 17.9Healthcare 14.0Industrials 10.9Consumer Discretionary 10.5Telecom 7.2Energy 7.1Consumer Staples 6.6Materials 2.3Utilities 2.0Short Term Investments 0.5Total 100.0 %
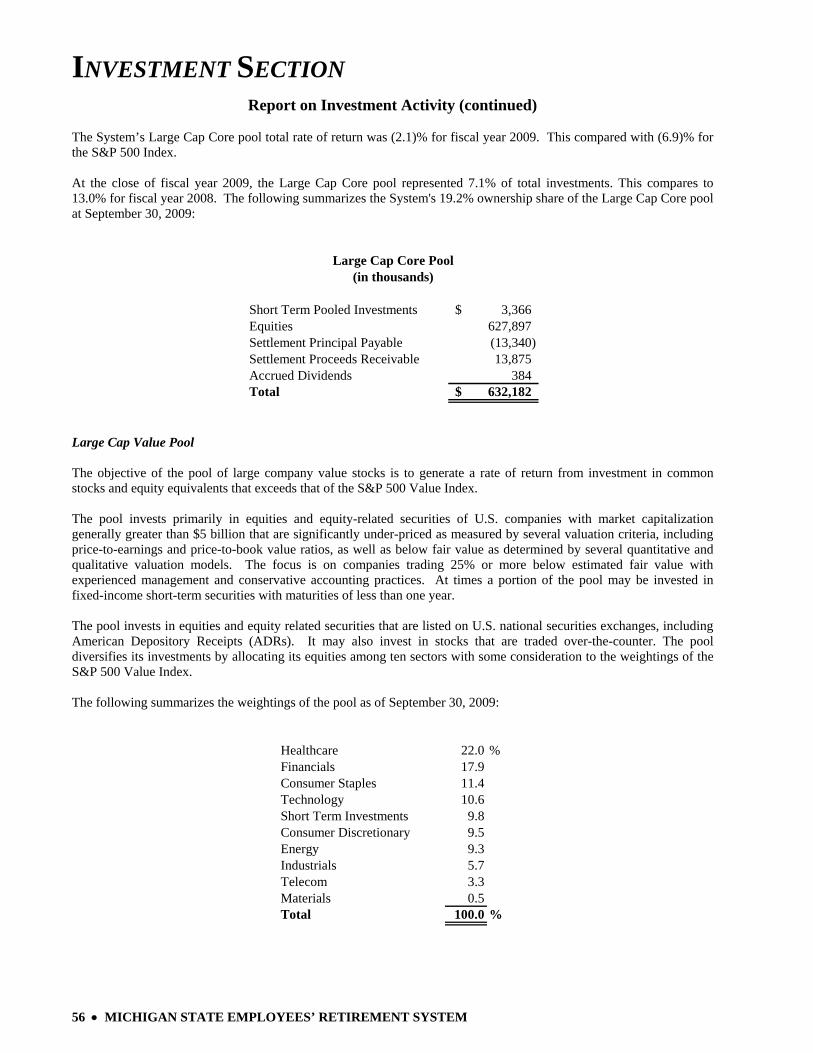
INVESTMENT SECTION
56 • MICHIGAN STATE EMPLOYEES’ RETIREMENT SYSTEM
Report on Investment Activity (continued) The System’s Large Cap Core pool total rate of return was (2.1)% for fiscal year 2009. This compared with (6.9)% for the S&P 500 Index. At the close of fiscal year 2009, the Large Cap Core pool represented 7.1% of total investments. This compares to 13.0% for fiscal year 2008. The following summarizes the System's 19.2% ownership share of the Large Cap Core pool at September 30, 2009:
Short Term Pooled Investments 3,366$ Equities 627,897 Settlement Principal Payable (13,340) Settlement Proceeds Receivable 13,875 Accrued Dividends 384 Total 632,182$
Large Cap Core Pool(in thousands)
Large Cap Value Pool The objective of the pool of large company value stocks is to generate a rate of return from investment in common stocks and equity equivalents that exceeds that of the S&P 500 Value Index. The pool invests primarily in equities and equity-related securities of U.S. companies with market capitalization generally greater than $5 billion that are significantly under-priced as measured by several valuation criteria, including price-to-earnings and price-to-book value ratios, as well as below fair value as determined by several quantitative and qualitative valuation models. The focus is on companies trading 25% or more below estimated fair value with experienced management and conservative accounting practices. At times a portion of the pool may be invested in fixed-income short-term securities with maturities of less than one year. The pool invests in equities and equity related securities that are listed on U.S. national securities exchanges, including American Depository Receipts (ADRs). It may also invest in stocks that are traded over-the-counter. The pool diversifies its investments by allocating its equities among ten sectors with some consideration to the weightings of the S&P 500 Value Index. The following summarizes the weightings of the pool as of September 30, 2009:
Healthcare 22.0 %Financials 17.9Consumer Staples 11.4Technology 10.6Short Term Investments 9.8Consumer Discretionary 9.5Energy 9.3Industrials 5.7Telecom 3.3Materials 0.5Total 100.0 %
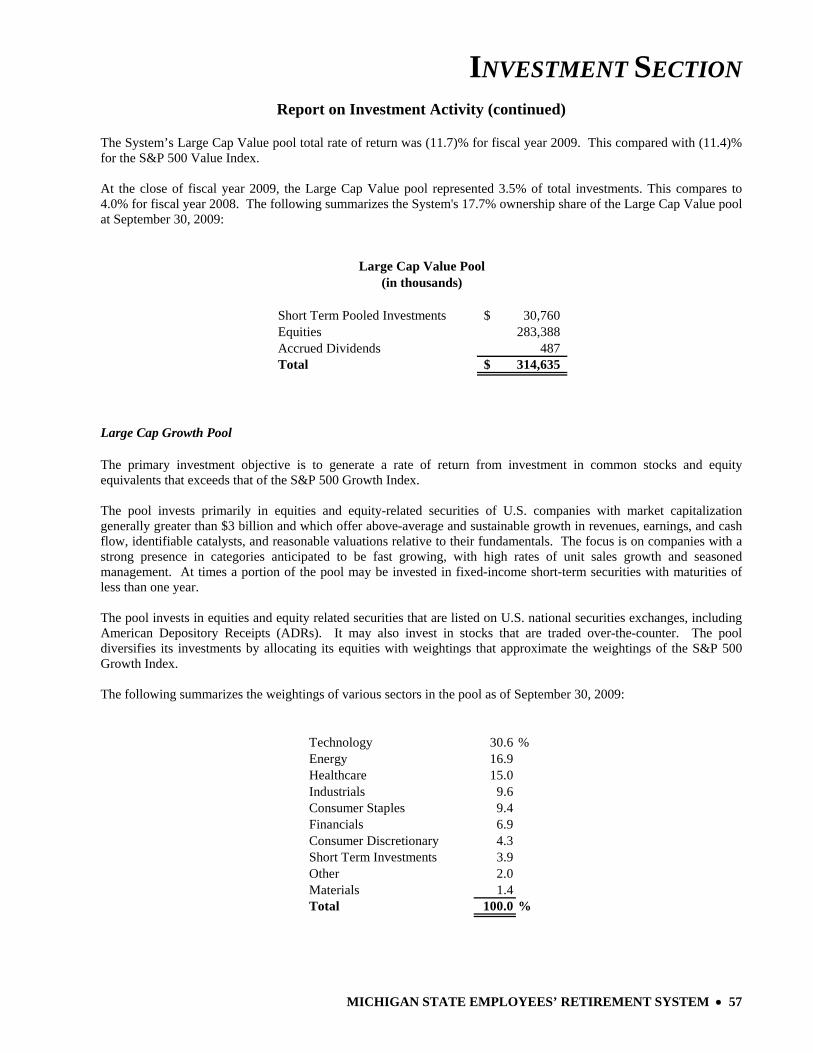
INVESTMENT SECTION
MICHIGAN STATE EMPLOYEES’ RETIREMENT SYSTEM • 57
Report on Investment Activity (continued) The System’s Large Cap Value pool total rate of return was (11.7)% for fiscal year 2009. This compared with (11.4)% for the S&P 500 Value Index. At the close of fiscal year 2009, the Large Cap Value pool represented 3.5% of total investments. This compares to 4.0% for fiscal year 2008. The following summarizes the System's 17.7% ownership share of the Large Cap Value pool at September 30, 2009:
Short Term Pooled Investments 30,760$ Equities 283,388 Accrued Dividends 487 Total 314,635$
Large Cap Value Pool(in thousands)
Large Cap Growth Pool The primary investment objective is to generate a rate of return from investment in common stocks and equity equivalents that exceeds that of the S&P 500 Growth Index.
The pool invests primarily in equities and equity-related securities of U.S. companies with market capitalization generally greater than $3 billion and which offer above-average and sustainable growth in revenues, earnings, and cash flow, identifiable catalysts, and reasonable valuations relative to their fundamentals. The focus is on companies with a strong presence in categories anticipated to be fast growing, with high rates of unit sales growth and seasoned management. At times a portion of the pool may be invested in fixed-income short-term securities with maturities of less than one year. The pool invests in equities and equity related securities that are listed on U.S. national securities exchanges, including American Depository Receipts (ADRs). It may also invest in stocks that are traded over-the-counter. The pool diversifies its investments by allocating its equities with weightings that approximate the weightings of the S&P 500 Growth Index. The following summarizes the weightings of various sectors in the pool as of September 30, 2009:
Technology 30.6 %Energy 16.9Healthcare 15.0Industrials 9.6Consumer Staples 9.4Financials 6.9Consumer Discretionary 4.3Short Term Investments 3.9Other 2.0Materials 1.4Total 100.0 %
INVESTMENT SECTION
58 • MICHIGAN STATE EMPLOYEES’ RETIREMENT SYSTEM
Report on Investment Activity (continued) The Large Cap Growth pool total rate of return was 1.2% for fiscal year 2009 versus (2.6)% for the S&P 500 Growth Index. At the close of fiscal year 2009, the Large Cap Growth pool represented 5.4% of total investments. This compares to 5.2% for fiscal year 2008. The following summarizes the System's 19.2% ownership share of the Large Cap Growth pool at September 30, 2009:
Short Term Pooled Investments 18,980$ Equities 467,177 Settlement Principal Payable (3,305) Settlement Proceeds Receivable 473 Accrued Dividends 191 Total 483,516$
Large Cap Growth Pool(in thousands)
Large Cap Dividend Growth Pool The primary investment objective is to generate a rate of return from investment in common stocks and equity equivalents that exceeds that of the S&P 500 Growth Index. The Large Cap Dividend Growth pool rate of return from inception to fiscal year end was 53.9%. At the close of fiscal year 2009, the Large Cap Dividend Growth pool represented 0.9% of total investments. The following summarizes the System's 19.2% ownership share of the Large Cap Dividend Growth pool at September 30, 2009:
Short Term Pooled Investments 1,500$ Equities 73,858 Accrued Dividends 44 Total 75,402$
Large Cap Dividend Growth Pool(in thousands)
Large Cap Growth Managers Pool The primary investment objective is to generate a rate of return from investment in common stocks and equity equivalents that exceeds that of the S&P 500 Growth Index. The rate of return from inception to fiscal year end for Edgewood Large Cap Growth was 27.6% and for Aletheia Large Cap Growth was 42.1%.
INVESTMENT SECTION
MICHIGAN STATE EMPLOYEES’ RETIREMENT SYSTEM • 59
Report on Investment Activity (continued) At the close of fiscal year 2009, the Large Cap Growth Managers pool represented 2.2% of total investments. The following summarizes the System's ownership share and composition of the Large Cap Growth Managers pool at September 30, 2009:
Edgewood AletheiaLarge Cap Large Cap
Growth GrowthTotal Investment 125,055$ 69,655$
Ownership Percentage 19.2% 19.2%
Large Cap Growth Managers Pool (in thousands)
Manager of Managers Pool The primary investment objective is to generate a rate of return from investment in common stocks and equivalents that exceeds the S&P 1500 Index by selecting stocks of all market capitalizations and investment styles. In October 2007, three new managers were hired that specialize in creating manager-of-manager portfolios, allowing the System an opportunity to invest in minority- and women-owned and emerging investment managers in a risk-controlled environment. The Manager of Managers pool total rate of return was (6.1)% for fiscal year 2009 versus (6.8)% for the S&P 1500 Index. At the close of fiscal year 2009, the Manager of Managers pool represented 0.3% of total investments. This compares to 0.3% for fiscal year 2008. The following summarizes the System's ownership share and composition of the Manager of Managers pool at September 30, 2009:
Attucks Bivium Leading EdgeAsset Capital Investment
Management Partners AdvisorsTotal Investment 13,365$ 10,103$ 7,174$
Ownership Percentage 19.3% 19.3% 19.3%
Manager of Managers Pool (in thousands)
INVESTMENT SECTION
60 • MICHIGAN STATE EMPLOYEES’ RETIREMENT SYSTEM
Report on Investment Activity (continued) Mid Cap Pool Nine Mid Cap managers were selected in 2005 and they were funded out of the Large Cap Value and Growth pools. The manager’s investment styles range from value, growth and core and they select stocks with average market capitalizations greater than $1 billion but less than $5 billion. The investment objective of the Mid Cap manager pool is to generate a combined rate of return from investment in common stocks and equivalents that exceeds the S&P 400 Mid Cap Index. The Mid Cap pool total rate of return was (3.9)% for fiscal year 2009 versus (3.1)% for the S&P 400 Mid Cap Index. At the close of fiscal year 2009, the Mid Cap pool represented 2.1% of total investments. This compares to 2.1% for fiscal year 2008. The following summarizes the System's ownership share and composition of the Mid Cap pool at September 30, 2009:
Mid Cap Value and Core Pool (in thousands)
CramerRosenthal Los Angeles
Artisan McGlynn Champlain Capital MunderMid Cap Mid Cap Mid Cap Mid Cap Mid Cap
Value Value Core Core CoreTotal Investment 33,132$ 29,014$ 13,395$ 23,377$ 26,624$
Ownership Percentage 19.9% 20.0% 20.1% 19.9% 19.9%
WellingtonRainer UBS Management
Mid Cap Mid Cap Mid CapGrowth Growth Growth
Total Investment 18,147$ 18,722$ 20,462$
Ownership Percentage 20.1% 20.1% 20.1%
Mid Cap Growth Pool (in thousands)
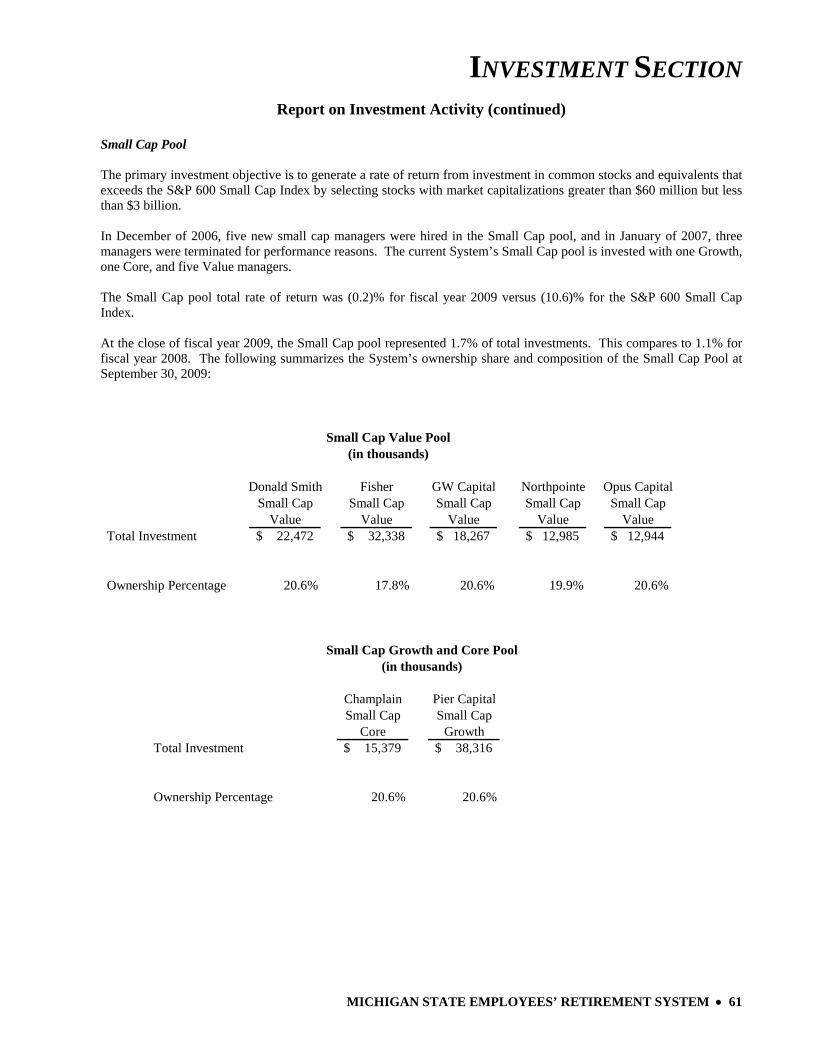
INVESTMENT SECTION
MICHIGAN STATE EMPLOYEES’ RETIREMENT SYSTEM • 61
Report on Investment Activity (continued)
Small Cap Pool The primary investment objective is to generate a rate of return from investment in common stocks and equivalents that exceeds the S&P 600 Small Cap Index by selecting stocks with market capitalizations greater than $60 million but less than $3 billion. In December of 2006, five new small cap managers were hired in the Small Cap pool, and in January of 2007, three managers were terminated for performance reasons. The current System’s Small Cap pool is invested with one Growth, one Core, and five Value managers. The Small Cap pool total rate of return was (0.2)% for fiscal year 2009 versus (10.6)% for the S&P 600 Small Cap Index. At the close of fiscal year 2009, the Small Cap pool represented 1.7% of total investments. This compares to 1.1% for fiscal year 2008. The following summarizes the System’s ownership share and composition of the Small Cap Pool at September 30, 2009:
Donald Smith Fisher GW Capital Northpointe Opus CapitalSmall Cap Small Cap Small Cap Small Cap Small Cap
Value Value Value Value ValueTotal Investment 22,472$ 32,338$ 18,267$ 12,985$ 12,944$
Ownership Percentage 20.6% 17.8% 20.6% 19.9% 20.6%
Small Cap Value Pool(in thousands)
Champlain Pier CapitalSmall Cap Small Cap
Core GrowthTotal Investment 15,379$ 38,316$
Ownership Percentage 20.6% 20.6%
Small Cap Growth and Core Pool(in thousands)
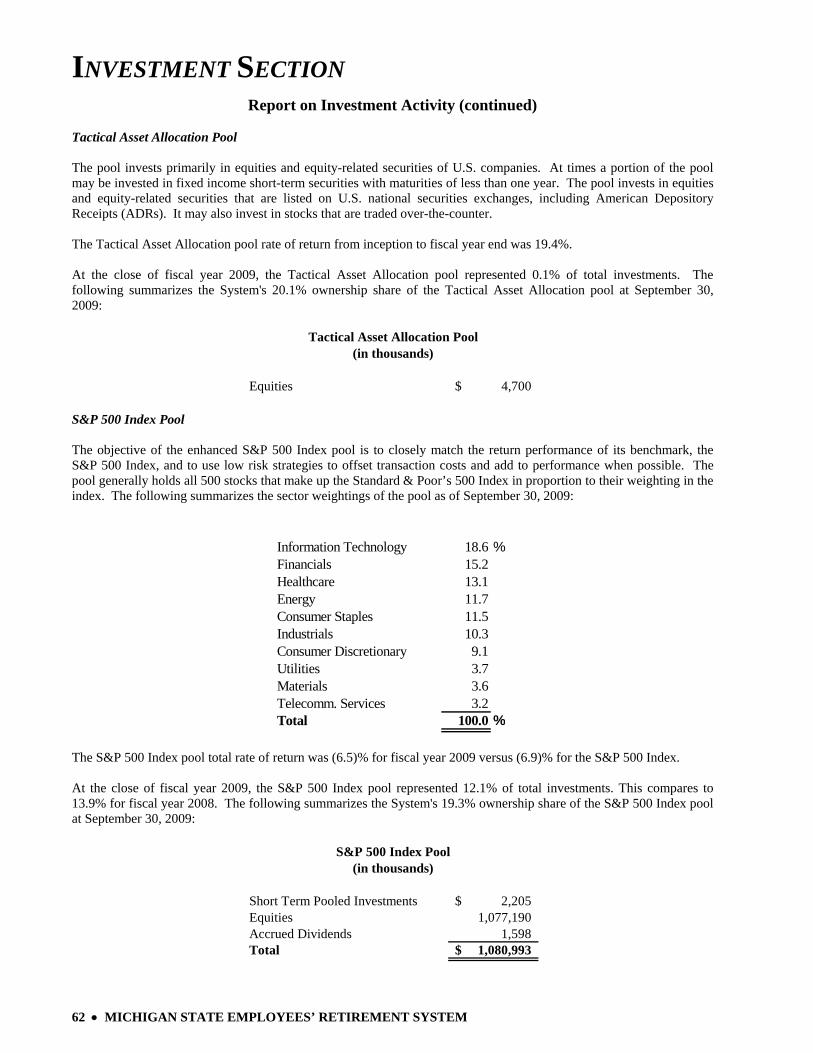
INVESTMENT SECTION
62 • MICHIGAN STATE EMPLOYEES’ RETIREMENT SYSTEM
Report on Investment Activity (continued) Tactical Asset Allocation Pool The pool invests primarily in equities and equity-related securities of U.S. companies. At times a portion of the pool may be invested in fixed income short-term securities with maturities of less than one year. The pool invests in equities and equity-related securities that are listed on U.S. national securities exchanges, including American Depository Receipts (ADRs). It may also invest in stocks that are traded over-the-counter. The Tactical Asset Allocation pool rate of return from inception to fiscal year end was 19.4%. At the close of fiscal year 2009, the Tactical Asset Allocation pool represented 0.1% of total investments. The following summarizes the System's 20.1% ownership share of the Tactical Asset Allocation pool at September 30, 2009:
Equities 4,700$
Tactical Asset Allocation Pool(in thousands)
S&P 500 Index Pool The objective of the enhanced S&P 500 Index pool is to closely match the return performance of its benchmark, the S&P 500 Index, and to use low risk strategies to offset transaction costs and add to performance when possible. The pool generally holds all 500 stocks that make up the Standard & Poor’s 500 Index in proportion to their weighting in the index. The following summarizes the sector weightings of the pool as of September 30, 2009:
Information Technology 18.6 %Financials 15.2Healthcare 13.1Energy 11.7Consumer Staples 11.5Industrials 10.3Consumer Discretionary 9.1Utilities 3.7Materials 3.6Telecomm. Services 3.2Total 100.0 %
The S&P 500 Index pool total rate of return was (6.5)% for fiscal year 2009 versus (6.9)% for the S&P 500 Index. At the close of fiscal year 2009, the S&P 500 Index pool represented 12.1% of total investments. This compares to 13.9% for fiscal year 2008. The following summarizes the System's 19.3% ownership share of the S&P 500 Index pool at September 30, 2009:
Short Term Pooled Investments 2,205$ Equities 1,077,190 Accrued Dividends 1,598 Total 1,080,993$
S&P 500 Index Pool(in thousands)
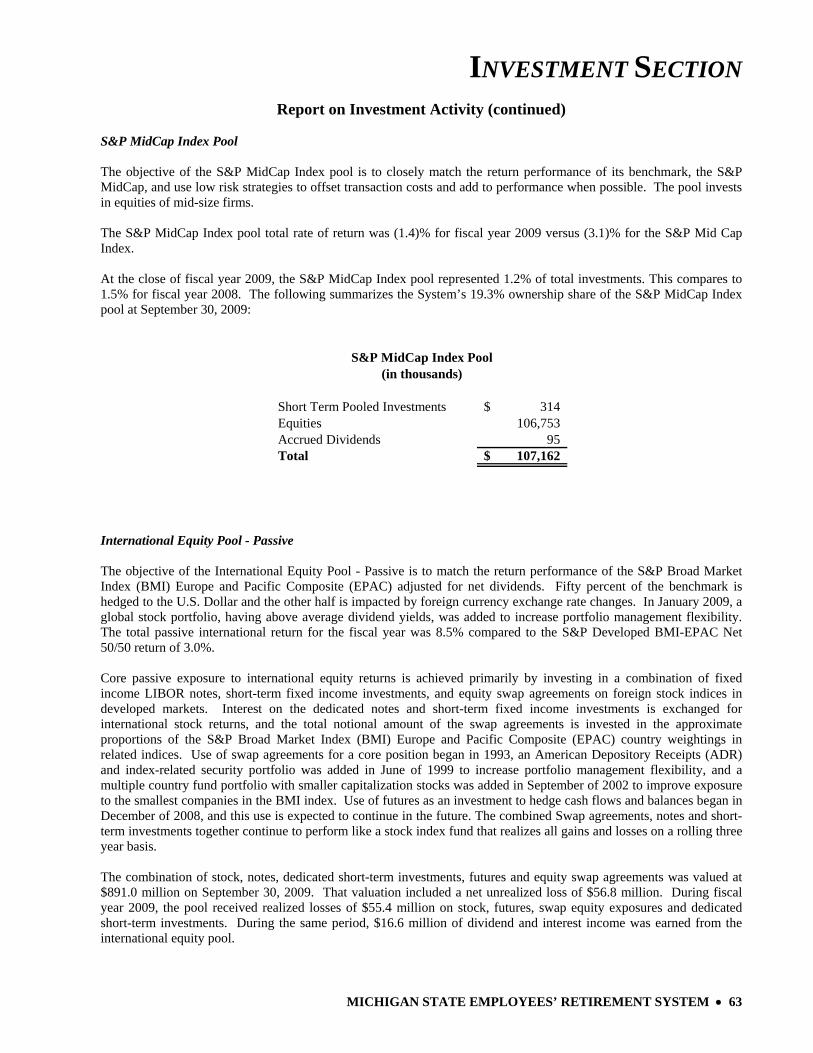
INVESTMENT SECTION
MICHIGAN STATE EMPLOYEES’ RETIREMENT SYSTEM • 63
Report on Investment Activity (continued) S&P MidCap Index Pool The objective of the S&P MidCap Index pool is to closely match the return performance of its benchmark, the S&P MidCap, and use low risk strategies to offset transaction costs and add to performance when possible. The pool invests in equities of mid-size firms. The S&P MidCap Index pool total rate of return was (1.4)% for fiscal year 2009 versus (3.1)% for the S&P Mid Cap Index. At the close of fiscal year 2009, the S&P MidCap Index pool represented 1.2% of total investments. This compares to 1.5% for fiscal year 2008. The following summarizes the System’s 19.3% ownership share of the S&P MidCap Index pool at September 30, 2009:
Short Term Pooled Investments 314$ Equities 106,753 Accrued Dividends 95 Total 107,162$
S&P MidCap Index Pool(in thousands)
International Equity Pool - Passive The objective of the International Equity Pool - Passive is to match the return performance of the S&P Broad Market Index (BMI) Europe and Pacific Composite (EPAC) adjusted for net dividends. Fifty percent of the benchmark is hedged to the U.S. Dollar and the other half is impacted by foreign currency exchange rate changes. In January 2009, a global stock portfolio, having above average dividend yields, was added to increase portfolio management flexibility. The total passive international return for the fiscal year was 8.5% compared to the S&P Developed BMI-EPAC Net 50/50 return of 3.0%. Core passive exposure to international equity returns is achieved primarily by investing in a combination of fixed income LIBOR notes, short-term fixed income investments, and equity swap agreements on foreign stock indices in developed markets. Interest on the dedicated notes and short-term fixed income investments is exchanged for international stock returns, and the total notional amount of the swap agreements is invested in the approximate proportions of the S&P Broad Market Index (BMI) Europe and Pacific Composite (EPAC) country weightings in related indices. Use of swap agreements for a core position began in 1993, an American Depository Receipts (ADR) and index-related security portfolio was added in June of 1999 to increase portfolio management flexibility, and a multiple country fund portfolio with smaller capitalization stocks was added in September of 2002 to improve exposure to the smallest companies in the BMI index. Use of futures as an investment to hedge cash flows and balances began in December of 2008, and this use is expected to continue in the future. The combined Swap agreements, notes and short-term investments together continue to perform like a stock index fund that realizes all gains and losses on a rolling three year basis. The combination of stock, notes, dedicated short-term investments, futures and equity swap agreements was valued at $891.0 million on September 30, 2009. That valuation included a net unrealized loss of $56.8 million. During fiscal year 2009, the pool received realized losses of $55.4 million on stock, futures, swap equity exposures and dedicated short-term investments. During the same period, $16.6 million of dividend and interest income was earned from the international equity pool.
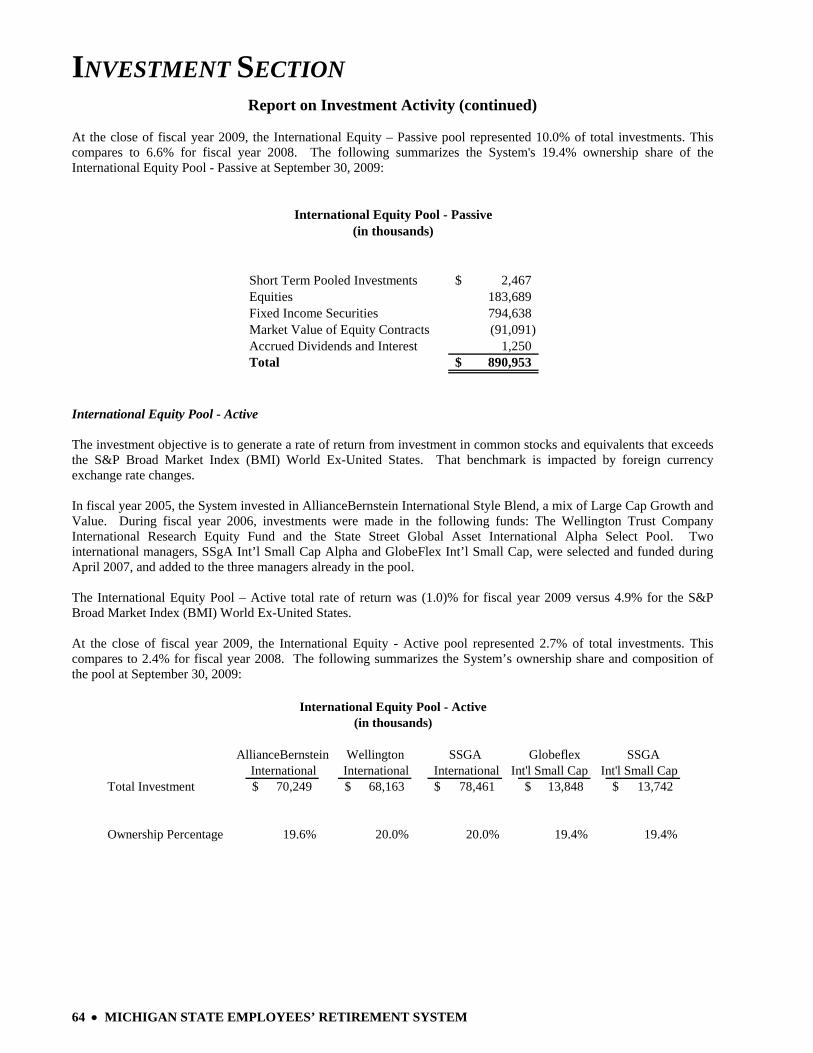
INVESTMENT SECTION
64 • MICHIGAN STATE EMPLOYEES’ RETIREMENT SYSTEM
Report on Investment Activity (continued) At the close of fiscal year 2009, the International Equity – Passive pool represented 10.0% of total investments. This compares to 6.6% for fiscal year 2008. The following summarizes the System's 19.4% ownership share of the International Equity Pool - Passive at September 30, 2009:
Short Term Pooled Investments 2,467$ Equities 183,689 Fixed Income Securities 794,638 Market Value of Equity Contracts (91,091) Accrued Dividends and Interest 1,250 Total 890,953$
International Equity Pool - Passive(in thousands)
International Equity Pool - Active The investment objective is to generate a rate of return from investment in common stocks and equivalents that exceeds the S&P Broad Market Index (BMI) World Ex-United States. That benchmark is impacted by foreign currency exchange rate changes. In fiscal year 2005, the System invested in AllianceBernstein International Style Blend, a mix of Large Cap Growth and Value. During fiscal year 2006, investments were made in the following funds: The Wellington Trust Company International Research Equity Fund and the State Street Global Asset International Alpha Select Pool. Two international managers, SSgA Int’l Small Cap Alpha and GlobeFlex Int’l Small Cap, were selected and funded during April 2007, and added to the three managers already in the pool. The International Equity Pool – Active total rate of return was (1.0)% for fiscal year 2009 versus 4.9% for the S&P Broad Market Index (BMI) World Ex-United States. At the close of fiscal year 2009, the International Equity - Active pool represented 2.7% of total investments. This compares to 2.4% for fiscal year 2008. The following summarizes the System’s ownership share and composition of the pool at September 30, 2009:
AllianceBernstein Wellington SSGA Globeflex SSGAInternational International International Int'l Small Cap Int'l Small Cap
Total Investment 70,249$ 68,163$ 78,461$ 13,848$ 13,742$
Ownership Percentage 19.6% 20.0% 20.0% 19.4% 19.4%
International Equity Pool - Active(in thousands)
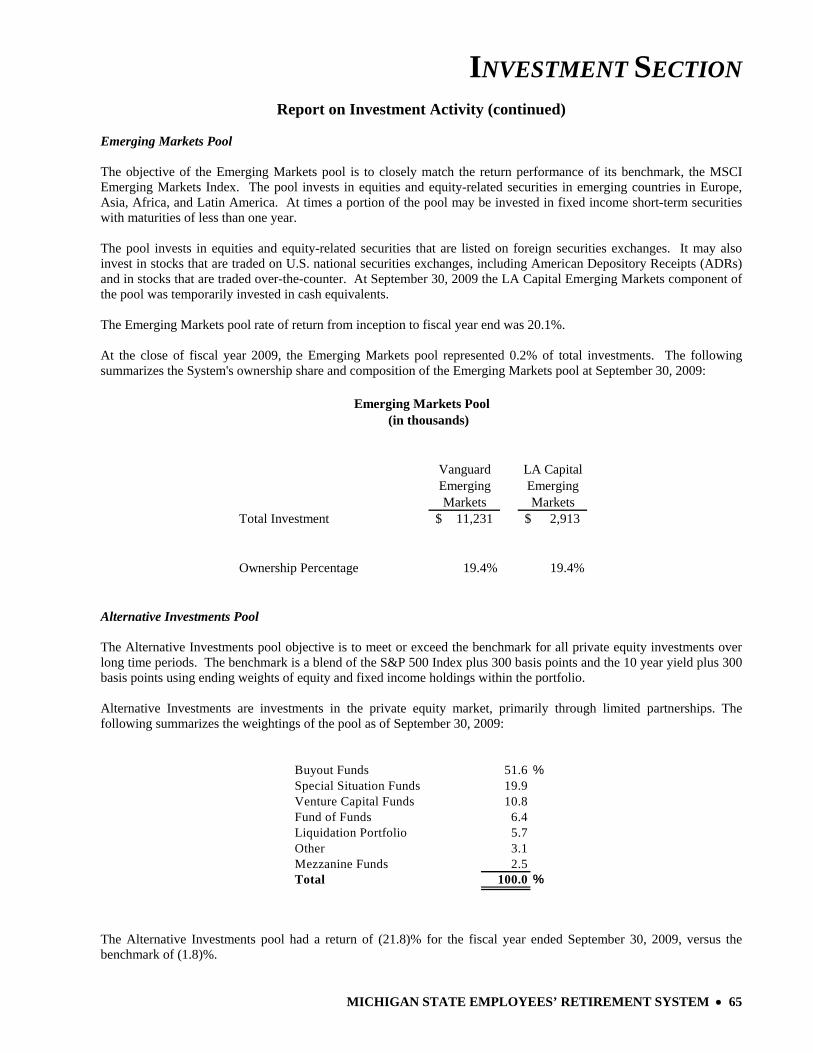
INVESTMENT SECTION
MICHIGAN STATE EMPLOYEES’ RETIREMENT SYSTEM • 65
Report on Investment Activity (continued) Emerging Markets Pool The objective of the Emerging Markets pool is to closely match the return performance of its benchmark, the MSCI Emerging Markets Index. The pool invests in equities and equity-related securities in emerging countries in Europe, Asia, Africa, and Latin America. At times a portion of the pool may be invested in fixed income short-term securities with maturities of less than one year. The pool invests in equities and equity-related securities that are listed on foreign securities exchanges. It may also invest in stocks that are traded on U.S. national securities exchanges, including American Depository Receipts (ADRs) and in stocks that are traded over-the-counter. At September 30, 2009 the LA Capital Emerging Markets component of the pool was temporarily invested in cash equivalents. The Emerging Markets pool rate of return from inception to fiscal year end was 20.1%. At the close of fiscal year 2009, the Emerging Markets pool represented 0.2% of total investments. The following summarizes the System's ownership share and composition of the Emerging Markets pool at September 30, 2009:
Vanguard LA CapitalEmerging EmergingMarkets Markets
Total Investment 11,231$ 2,913$
Ownership Percentage 19.4% 19.4%
Emerging Markets Pool (in thousands)
Alternative Investments Pool The Alternative Investments pool objective is to meet or exceed the benchmark for all private equity investments over long time periods. The benchmark is a blend of the S&P 500 Index plus 300 basis points and the 10 year yield plus 300 basis points using ending weights of equity and fixed income holdings within the portfolio. Alternative Investments are investments in the private equity market, primarily through limited partnerships. The following summarizes the weightings of the pool as of September 30, 2009:
Buyout Funds 51.6 %Special Situation Funds 19.9Venture Capital Funds 10.8Fund of Funds 6.4Liquidation Portfolio 5.7Other 3.1Mezzanine Funds 2.5Total 100.0 %
The Alternative Investments pool had a return of (21.8)% for the fiscal year ended September 30, 2009, versus the benchmark of (1.8)%.
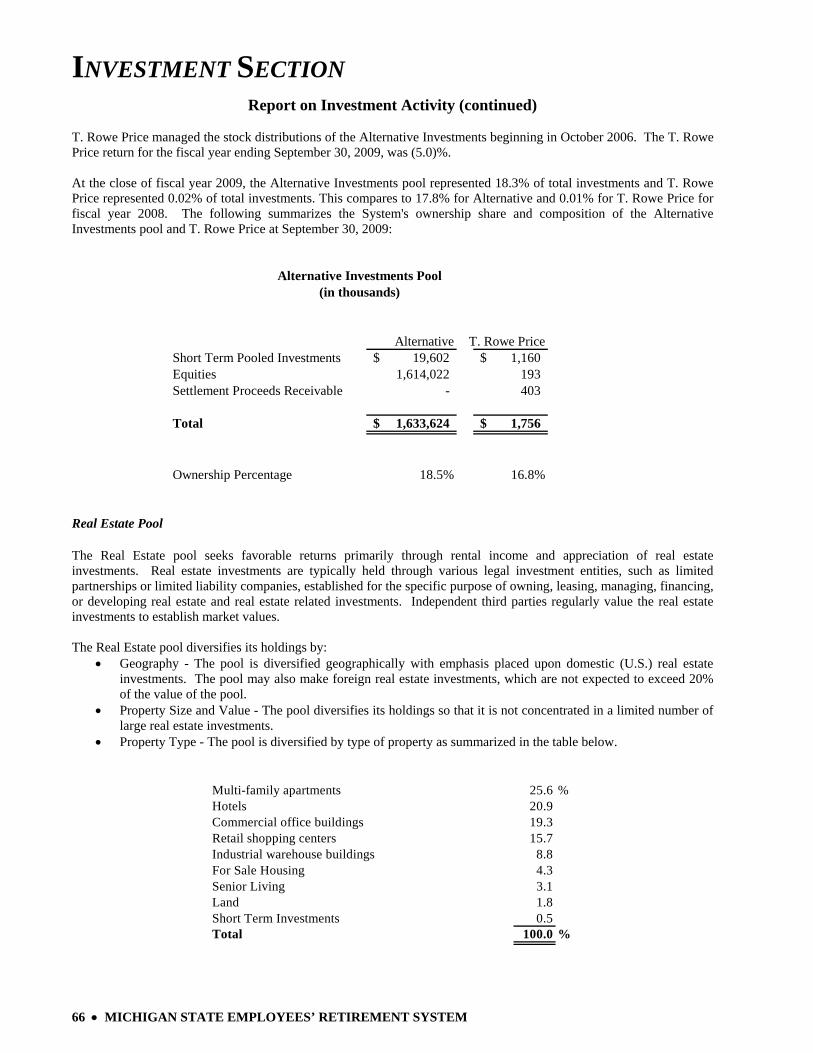
INVESTMENT SECTION
66 • MICHIGAN STATE EMPLOYEES’ RETIREMENT SYSTEM
Report on Investment Activity (continued) T. Rowe Price managed the stock distributions of the Alternative Investments beginning in October 2006. The T. Rowe Price return for the fiscal year ending September 30, 2009, was (5.0)%. At the close of fiscal year 2009, the Alternative Investments pool represented 18.3% of total investments and T. Rowe Price represented 0.02% of total investments. This compares to 17.8% for Alternative and 0.01% for T. Rowe Price for fiscal year 2008. The following summarizes the System's ownership share and composition of the Alternative Investments pool and T. Rowe Price at September 30, 2009:
Alternative T. Rowe PriceShort Term Pooled Investments 19,602$ 1,160$ Equities 1,614,022 193 Settlement Proceeds Receivable - 403
Total 1,633,624$ 1,756$
Ownership Percentage 18.5% 16.8%
Alternative Investments Pool(in thousands)
Real Estate Pool The Real Estate pool seeks favorable returns primarily through rental income and appreciation of real estate investments. Real estate investments are typically held through various legal investment entities, such as limited partnerships or limited liability companies, established for the specific purpose of owning, leasing, managing, financing, or developing real estate and real estate related investments. Independent third parties regularly value the real estate investments to establish market values. The Real Estate pool diversifies its holdings by:
• Geography - The pool is diversified geographically with emphasis placed upon domestic (U.S.) real estate investments. The pool may also make foreign real estate investments, which are not expected to exceed 20% of the value of the pool.
• Property Size and Value - The pool diversifies its holdings so that it is not concentrated in a limited number of large real estate investments.
• Property Type - The pool is diversified by type of property as summarized in the table below.
Multi-family apartments 25.6 %Hotels 20.9Commercial office buildings 19.3Retail shopping centers 15.7Industrial warehouse buildings 8.8For Sale Housing 4.3Senior Living 3.1Land 1.8Short Term Investments 0.5Total 100.0 %
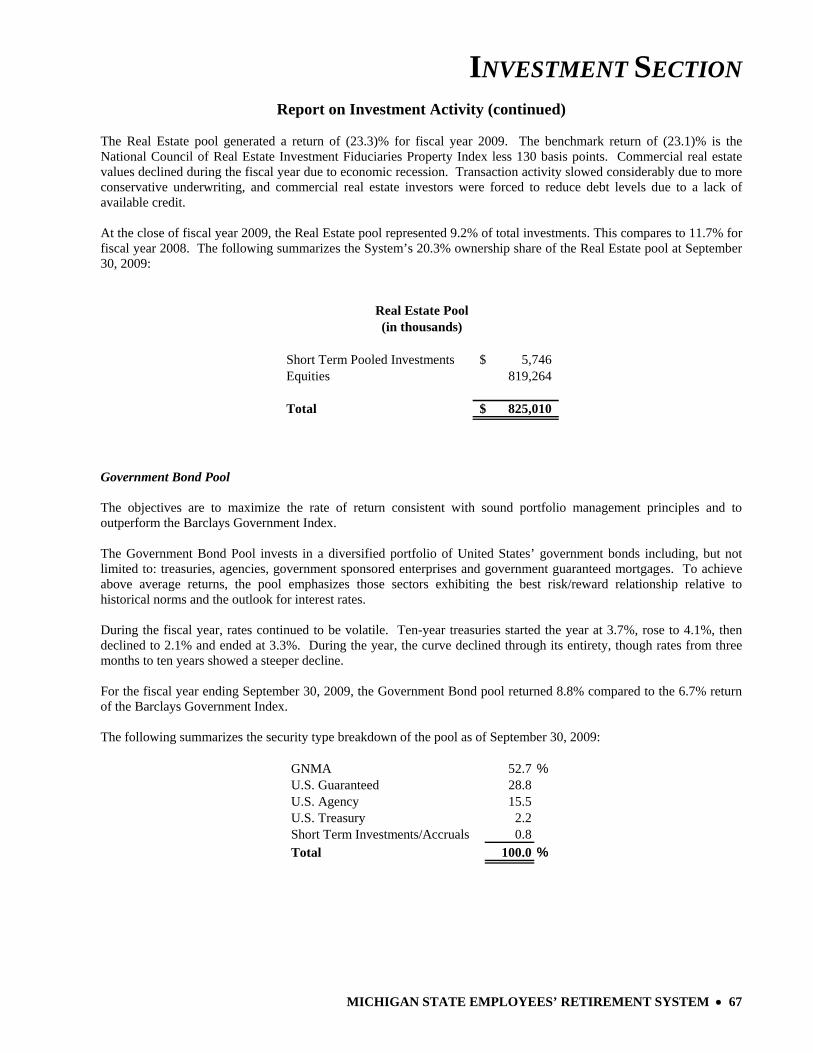
INVESTMENT SECTION
MICHIGAN STATE EMPLOYEES’ RETIREMENT SYSTEM • 67
Report on Investment Activity (continued) The Real Estate pool generated a return of (23.3)% for fiscal year 2009. The benchmark return of (23.1)% is the National Council of Real Estate Investment Fiduciaries Property Index less 130 basis points. Commercial real estate values declined during the fiscal year due to economic recession. Transaction activity slowed considerably due to more conservative underwriting, and commercial real estate investors were forced to reduce debt levels due to a lack of available credit. At the close of fiscal year 2009, the Real Estate pool represented 9.2% of total investments. This compares to 11.7% for fiscal year 2008. The following summarizes the System’s 20.3% ownership share of the Real Estate pool at September 30, 2009:
Short Term Pooled Investments 5,746$ Equities 819,264
Total 825,010$
Real Estate Pool(in thousands)
Government Bond Pool The objectives are to maximize the rate of return consistent with sound portfolio management principles and to outperform the Barclays Government Index. The Government Bond Pool invests in a diversified portfolio of United States’ government bonds including, but not limited to: treasuries, agencies, government sponsored enterprises and government guaranteed mortgages. To achieve above average returns, the pool emphasizes those sectors exhibiting the best risk/reward relationship relative to historical norms and the outlook for interest rates. During the fiscal year, rates continued to be volatile. Ten-year treasuries started the year at 3.7%, rose to 4.1%, then declined to 2.1% and ended at 3.3%. During the year, the curve declined through its entirety, though rates from three months to ten years showed a steeper decline. For the fiscal year ending September 30, 2009, the Government Bond pool returned 8.8% compared to the 6.7% return of the Barclays Government Index. The following summarizes the security type breakdown of the pool as of September 30, 2009:
GNMA 52.7 %U.S. Guaranteed 28.8U.S. Agency 15.5U.S. Treasury 2.2Short Term Investments/Accruals 0.8Total 100.0 %
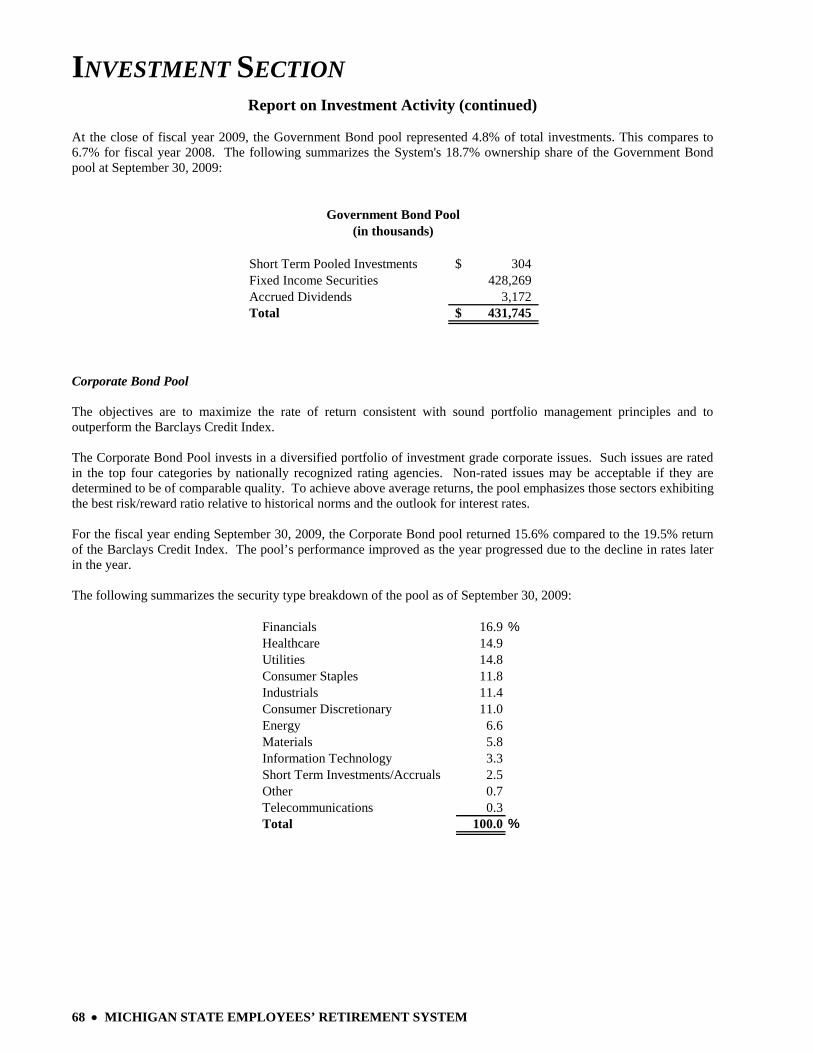
INVESTMENT SECTION
68 • MICHIGAN STATE EMPLOYEES’ RETIREMENT SYSTEM
Report on Investment Activity (continued) At the close of fiscal year 2009, the Government Bond pool represented 4.8% of total investments. This compares to 6.7% for fiscal year 2008. The following summarizes the System's 18.7% ownership share of the Government Bond pool at September 30, 2009:
Short Term Pooled Investments 304$ Fixed Income Securities 428,269 Accrued Dividends 3,172 Total 431,745$
Government Bond Pool(in thousands)
Corporate Bond Pool The objectives are to maximize the rate of return consistent with sound portfolio management principles and to outperform the Barclays Credit Index. The Corporate Bond Pool invests in a diversified portfolio of investment grade corporate issues. Such issues are rated in the top four categories by nationally recognized rating agencies. Non-rated issues may be acceptable if they are determined to be of comparable quality. To achieve above average returns, the pool emphasizes those sectors exhibiting the best risk/reward ratio relative to historical norms and the outlook for interest rates. For the fiscal year ending September 30, 2009, the Corporate Bond pool returned 15.6% compared to the 19.5% return of the Barclays Credit Index. The pool’s performance improved as the year progressed due to the decline in rates later in the year. The following summarizes the security type breakdown of the pool as of September 30, 2009:
Financials 16.9 %Healthcare 14.9Utilities 14.8Consumer Staples 11.8Industrials 11.4Consumer Discretionary 11.0Energy 6.6Materials 5.8Information Technology 3.3Short Term Investments/Accruals 2.5Other 0.7Telecommunications 0.3Total 100.0 %
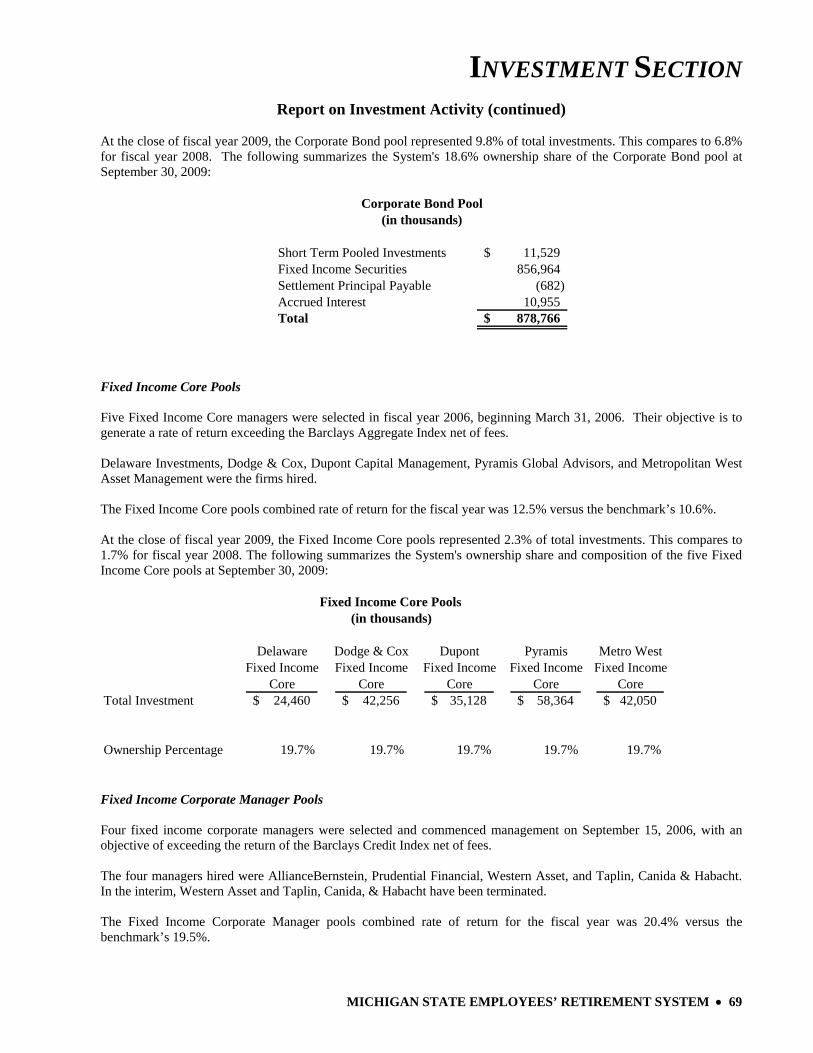
INVESTMENT SECTION
MICHIGAN STATE EMPLOYEES’ RETIREMENT SYSTEM • 69
Report on Investment Activity (continued) At the close of fiscal year 2009, the Corporate Bond pool represented 9.8% of total investments. This compares to 6.8% for fiscal year 2008. The following summarizes the System's 18.6% ownership share of the Corporate Bond pool at September 30, 2009:
Short Term Pooled Investments 11,529$ Fixed Income Securities 856,964 Settlement Principal Payable (682) Accrued Interest 10,955 Total 878,766$
Corporate Bond Pool(in thousands)
Fixed Income Core Pools Five Fixed Income Core managers were selected in fiscal year 2006, beginning March 31, 2006. Their objective is to generate a rate of return exceeding the Barclays Aggregate Index net of fees. Delaware Investments, Dodge & Cox, Dupont Capital Management, Pyramis Global Advisors, and Metropolitan West Asset Management were the firms hired. The Fixed Income Core pools combined rate of return for the fiscal year was 12.5% versus the benchmark’s 10.6%. At the close of fiscal year 2009, the Fixed Income Core pools represented 2.3% of total investments. This compares to 1.7% for fiscal year 2008. The following summarizes the System's ownership share and composition of the five Fixed Income Core pools at September 30, 2009:
Fixed Income Core Pools (in thousands)
Delaware Dodge & Cox Dupont Pyramis Metro WestFixed Income Fixed Income Fixed Income Fixed Income Fixed Income
Core Core Core Core CoreTotal Investment 24,460$ 42,256$ 35,128$ 58,364$ 42,050$
Ownership Percentage 19.7% 19.7% 19.7% 19.7% 19.7%
Fixed Income Corporate Manager Pools Four fixed income corporate managers were selected and commenced management on September 15, 2006, with an objective of exceeding the return of the Barclays Credit Index net of fees. The four managers hired were AllianceBernstein, Prudential Financial, Western Asset, and Taplin, Canida & Habacht. In the interim, Western Asset and Taplin, Canida, & Habacht have been terminated. The Fixed Income Corporate Manager pools combined rate of return for the fiscal year was 20.4% versus the benchmark’s 19.5%.
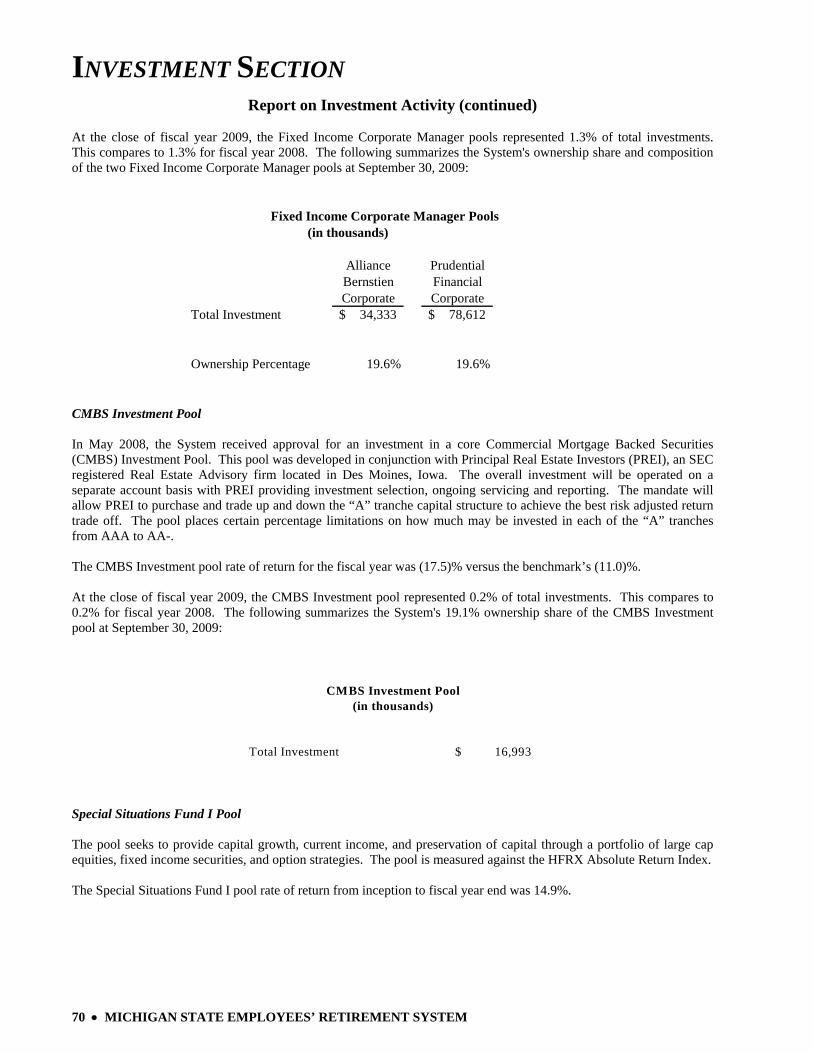
INVESTMENT SECTION
70 • MICHIGAN STATE EMPLOYEES’ RETIREMENT SYSTEM
Report on Investment Activity (continued) At the close of fiscal year 2009, the Fixed Income Corporate Manager pools represented 1.3% of total investments. This compares to 1.3% for fiscal year 2008. The following summarizes the System's ownership share and composition of the two Fixed Income Corporate Manager pools at September 30, 2009:
Alliance PrudentialBernstien FinancialCorporate Corporate
Total Investment 34,333$ 78,612$
Ownership Percentage 19.6% 19.6%
Fixed Income Corporate Manager Pools (in thousands)
CMBS Investment Pool In May 2008, the System received approval for an investment in a core Commercial Mortgage Backed Securities (CMBS) Investment Pool. This pool was developed in conjunction with Principal Real Estate Investors (PREI), an SEC registered Real Estate Advisory firm located in Des Moines, Iowa. The overall investment will be operated on a separate account basis with PREI providing investment selection, ongoing servicing and reporting. The mandate will allow PREI to purchase and trade up and down the “A” tranche capital structure to achieve the best risk adjusted return trade off. The pool places certain percentage limitations on how much may be invested in each of the “A” tranches from AAA to AA-. The CMBS Investment pool rate of return for the fiscal year was (17.5)% versus the benchmark’s (11.0)%. At the close of fiscal year 2009, the CMBS Investment pool represented 0.2% of total investments. This compares to 0.2% for fiscal year 2008. The following summarizes the System's 19.1% ownership share of the CMBS Investment pool at September 30, 2009:
Total Investment 16,993$
CMBS Investment Pool(in thousands)
Special Situations Fund I Pool The pool seeks to provide capital growth, current income, and preservation of capital through a portfolio of large cap equities, fixed income securities, and option strategies. The pool is measured against the HFRX Absolute Return Index. The Special Situations Fund I pool rate of return from inception to fiscal year end was 14.9%.
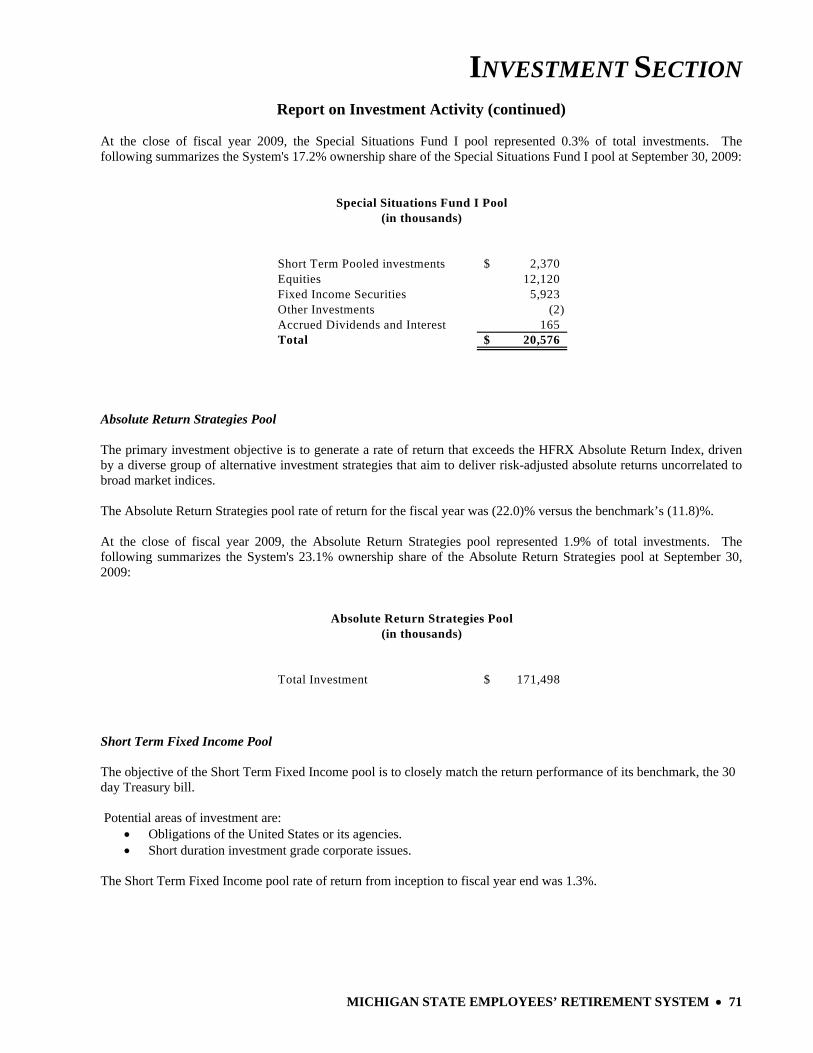
INVESTMENT SECTION
MICHIGAN STATE EMPLOYEES’ RETIREMENT SYSTEM • 71
Report on Investment Activity (continued) At the close of fiscal year 2009, the Special Situations Fund I pool represented 0.3% of total investments. The following summarizes the System's 17.2% ownership share of the Special Situations Fund I pool at September 30, 2009:
Short Term Pooled investments 2,370$ Equities 12,120 Fixed Income Securities 5,923 Other Investments (2) Accrued Dividends and Interest 165 Total 20,576$
Special Situations Fund I Pool(in thousands)
Absolute Return Strategies Pool The primary investment objective is to generate a rate of return that exceeds the HFRX Absolute Return Index, driven by a diverse group of alternative investment strategies that aim to deliver risk-adjusted absolute returns uncorrelated to broad market indices. The Absolute Return Strategies pool rate of return for the fiscal year was (22.0)% versus the benchmark’s (11.8)%. At the close of fiscal year 2009, the Absolute Return Strategies pool represented 1.9% of total investments. The following summarizes the System's 23.1% ownership share of the Absolute Return Strategies pool at September 30, 2009:
Total Investment 171,498$
Absolute Return Strategies Pool(in thousands)
Short Term Fixed Income Pool The objective of the Short Term Fixed Income pool is to closely match the return performance of its benchmark, the 30 day Treasury bill. Potential areas of investment are:
• Obligations of the United States or its agencies. • Short duration investment grade corporate issues.
The Short Term Fixed Income pool rate of return from inception to fiscal year end was 1.3%.
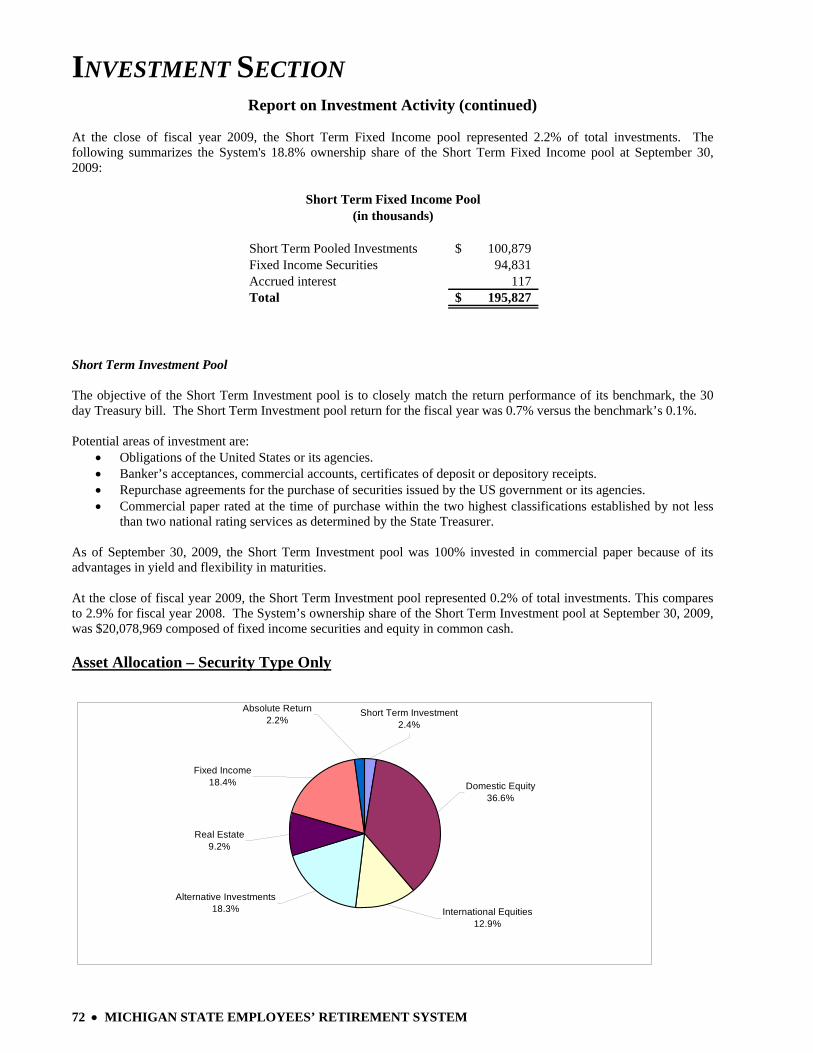
INVESTMENT SECTION
72 • MICHIGAN STATE EMPLOYEES’ RETIREMENT SYSTEM
Report on Investment Activity (continued) At the close of fiscal year 2009, the Short Term Fixed Income pool represented 2.2% of total investments. The following summarizes the System's 18.8% ownership share of the Short Term Fixed Income pool at September 30, 2009:
Short Term Pooled Investments 100,879$ Fixed Income Securities 94,831 Accrued interest 117 Total 195,827$
Short Term Fixed Income Pool(in thousands)
Short Term Investment Pool The objective of the Short Term Investment pool is to closely match the return performance of its benchmark, the 30 day Treasury bill. The Short Term Investment pool return for the fiscal year was 0.7% versus the benchmark’s 0.1%. Potential areas of investment are:
• Obligations of the United States or its agencies. • Banker’s acceptances, commercial accounts, certificates of deposit or depository receipts. • Repurchase agreements for the purchase of securities issued by the US government or its agencies. • Commercial paper rated at the time of purchase within the two highest classifications established by not less
than two national rating services as determined by the State Treasurer.
As of September 30, 2009, the Short Term Investment pool was 100% invested in commercial paper because of its advantages in yield and flexibility in maturities. At the close of fiscal year 2009, the Short Term Investment pool represented 0.2% of total investments. This compares to 2.9% for fiscal year 2008. The System’s ownership share of the Short Term Investment pool at September 30, 2009, was $20,078,969 composed of fixed income securities and equity in common cash. Asset Allocation – Security Type Only
Absolute Return2.2%
Domestic Equity36.6%
Short Term Investment2.4%
Fixed Income18.4%
Real Estate9.2%
Alternative Investments18.3% International Equities
12.9%
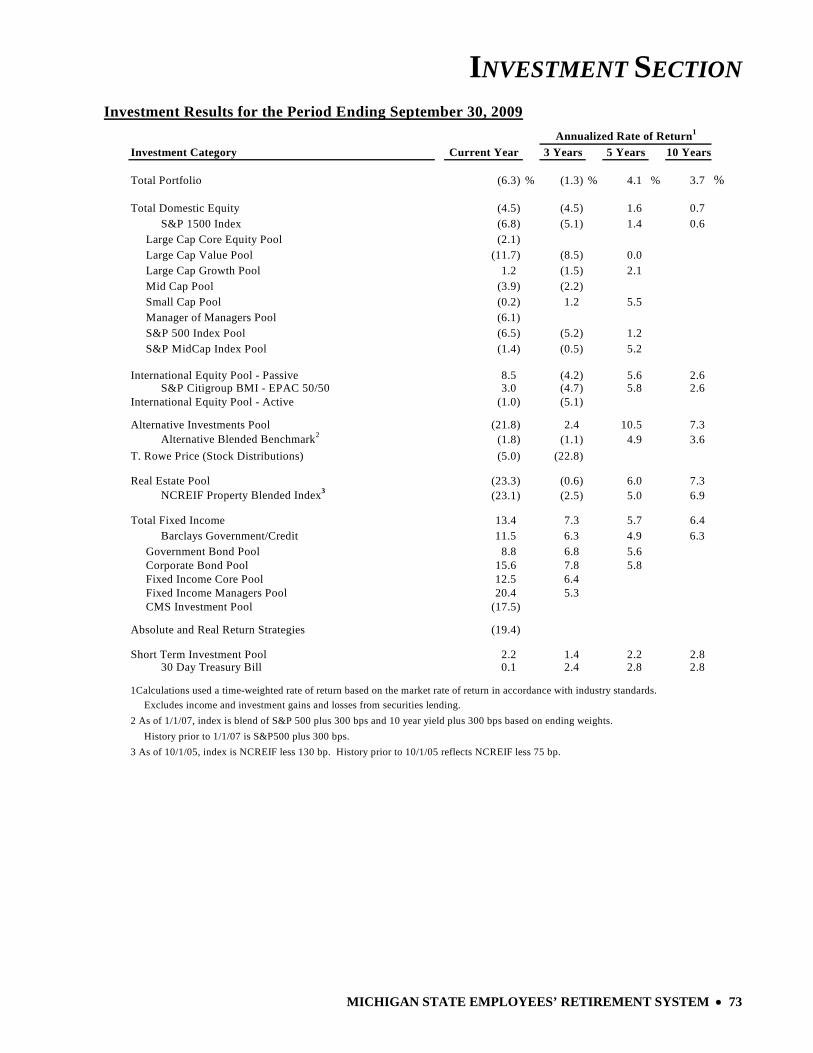
INVESTMENT SECTION
MICHIGAN STATE EMPLOYEES’ RETIREMENT SYSTEM • 73
Investment Results for the Period Ending September 30, 2009Annualized Rate of Return1
Investment Category Current Year 3 Years 5 Years 10 Years
Total Portfolio (6.3) % (1.3) % 4.1 % 3.7 %
Total Domestic Equity (4.5) (4.5) 1.6 0.7 S&P 1500 Index (6.8) (5.1) 1.4 0.6 Large Cap Core Equity Pool (2.1) Large Cap Value Pool (11.7) (8.5) 0.0 Large Cap Growth Pool 1.2 (1.5) 2.1 Mid Cap Pool (3.9) (2.2) Small Cap Pool (0.2) 1.2 5.5 Manager of Managers Pool (6.1) S&P 500 Index Pool (6.5) (5.2) 1.2 S&P MidCap Index Pool (1.4) (0.5) 5.2
International Equity Pool - Passive 8.5 (4.2) 5.6 2.6 S&P Citigroup BMI - EPAC 50/50 3.0 (4.7) 5.8 2.6International Equity Pool - Active (1.0) (5.1)
Alternative Investments Pool (21.8) 2.4 10.5 7.3 Alternative Blended Benchmark2 (1.8) (1.1) 4.9 3.6T. Rowe Price (Stock Distributions) (5.0) (22.8)
Real Estate Pool (23.3) (0.6) 6.0 7.3 NCREIF Property Blended Index3 (23.1) (2.5) 5.0 6.9
Total Fixed Income 13.4 7.3 5.7 6.4 Barclays Government/Credit 11.5 6.3 4.9 6.3 Government Bond Pool 8.8 6.8 5.6 Corporate Bond Pool 15.6 7.8 5.8 Fixed Income Core Pool 12.5 6.4 Fixed Income Managers Pool 20.4 5.3 CMS Investment Pool (17.5)
Absolute and Real Return Strategies (19.4)
Short Term Investment Pool 2.2 1.4 2.2 2.8 30 Day Treasury Bill 0.1 2.4 2.8 2.8
1Calculations used a time-weighted rate of return based on the market rate of return in accordance with industry standards. Excludes income and investment gains and losses from securities lending.2 As of 1/1/07, index is blend of S&P 500 plus 300 bps and 10 year yield plus 300 bps based on ending weights. History prior to 1/1/07 is S&P500 plus 300 bps.
3 As of 10/1/05, index is NCREIF less 130 bp. History prior to 10/1/05 reflects NCREIF less 75 bp.
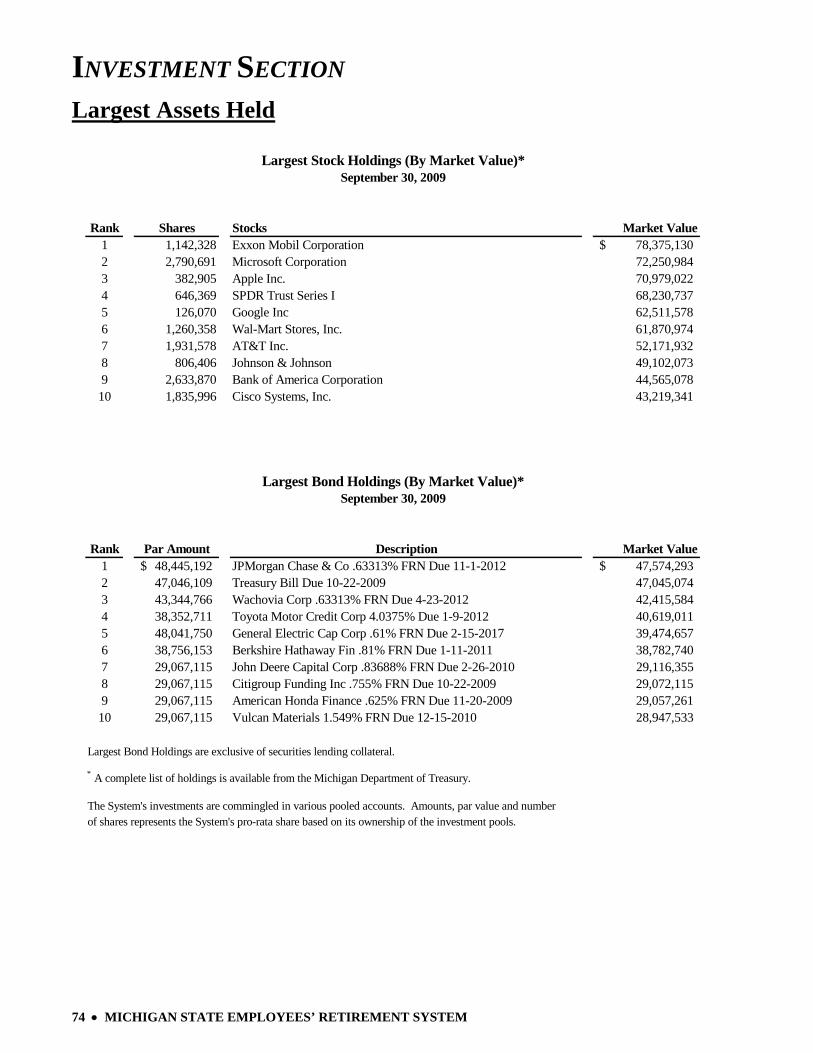
INVESTMENT SECTION
74 • MICHIGAN STATE EMPLOYEES’ RETIREMENT SYSTEM
Largest Assets Held
Rank Shares Stocks Market Value1 1,142,328 Exxon Mobil Corporation 78,375,130$ 2 2,790,691 Microsoft Corporation 72,250,984 3 382,905 Apple Inc. 70,979,022 4 646,369 SPDR Trust Series I 68,230,737 5 126,070 Google Inc 62,511,578 6 1,260,358 Wal-Mart Stores, Inc. 61,870,974 7 1,931,578 AT&T Inc. 52,171,932 8 806,406 Johnson & Johnson 49,102,073 9 2,633,870 Bank of America Corporation 44,565,078 10 1,835,996 Cisco Systems, Inc. 43,219,341
Rank Par Amount Description Market Value1 48,445,192$ JPMorgan Chase & Co .63313% FRN Due 11-1-2012 47,574,293$ 2 47,046,109 Treasury Bill Due 10-22-2009 47,045,074 3 43,344,766 Wachovia Corp .63313% FRN Due 4-23-2012 42,415,584 4 38,352,711 Toyota Motor Credit Corp 4.0375% Due 1-9-2012 40,619,011 5 48,041,750 General Electric Cap Corp .61% FRN Due 2-15-2017 39,474,657 6 38,756,153 Berkshire Hathaway Fin .81% FRN Due 1-11-2011 38,782,740 7 29,067,115 John Deere Capital Corp .83688% FRN Due 2-26-2010 29,116,355 8 29,067,115 Citigroup Funding Inc .755% FRN Due 10-22-2009 29,072,115 9 29,067,115 American Honda Finance .625% FRN Due 11-20-2009 29,057,261 10 29,067,115 Vulcan Materials 1.549% FRN Due 12-15-2010 28,947,533
Largest Bond Holdings are exclusive of securities lending collateral.
* A complete list of holdings is available from the Michigan Department of Treasury.
The System's investments are commingled in various pooled accounts. Amounts, par value and number of shares represents the System's pro-rata share based on its ownership of the investment pools.
Largest Stock Holdings (By Market Value)*September 30, 2009
Largest Bond Holdings (By Market Value)*September 30, 2009
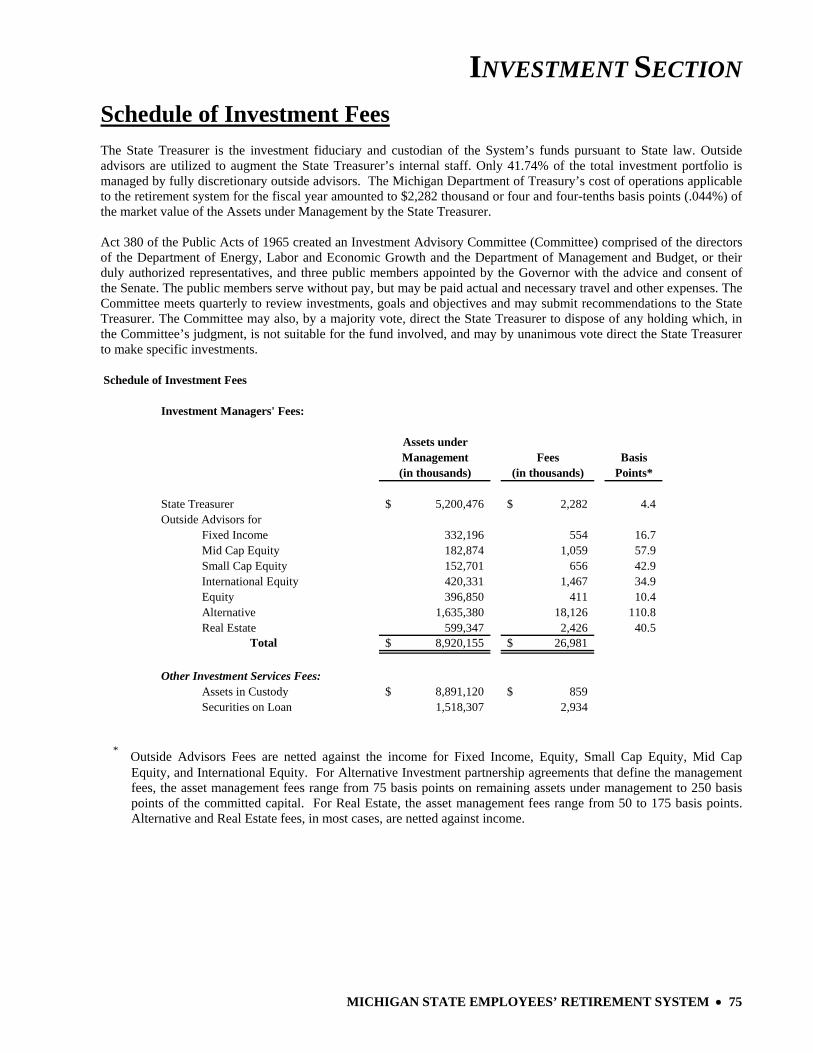
INVESTMENT SECTION
MICHIGAN STATE EMPLOYEES’ RETIREMENT SYSTEM • 75
Schedule of Investment Fees The State Treasurer is the investment fiduciary and custodian of the System’s funds pursuant to State law. Outside advisors are utilized to augment the State Treasurer’s internal staff. Only 41.74% of the total investment portfolio is managed by fully discretionary outside advisors. The Michigan Department of Treasury’s cost of operations applicable to the retirement system for the fiscal year amounted to $2,282 thousand or four and four-tenths basis points (.044%) of the market value of the Assets under Management by the State Treasurer. Act 380 of the Public Acts of 1965 created an Investment Advisory Committee (Committee) comprised of the directors of the Department of Energy, Labor and Economic Growth and the Department of Management and Budget, or their duly authorized representatives, and three public members appointed by the Governor with the advice and consent of the Senate. The public members serve without pay, but may be paid actual and necessary travel and other expenses. The Committee meets quarterly to review investments, goals and objectives and may submit recommendations to the State Treasurer. The Committee may also, by a majority vote, direct the State Treasurer to dispose of any holding which, in the Committee’s judgment, is not suitable for the fund involved, and may by unanimous vote direct the State Treasurer to make specific investments. Schedule of Investment Fees
Investment Managers' Fees:
Assets underManagement Fees Basis(in thousands) (in thousands) Points*
State Treasurer 5,200,476$ 2,282$ 4.4Outside Advisors for
Fixed Income 332,196 554 16.7Mid Cap Equity 182,874 1,059 57.9Small Cap Equity 152,701 656 42.9International Equity 420,331 1,467 34.9Equity 396,850 411 10.4Alternative 1,635,380 18,126 110.8Real Estate 599,347 2,426 40.5
Total 8,920,155$ 26,981$
Other Investment Services Fees:Assets in Custody 8,891,120$ 859$ Securities on Loan 1,518,307 2,934
* Outside Advisors Fees are netted against the income for Fixed Income, Equity, Small Cap Equity, Mid Cap Equity, and International Equity. For Alternative Investment partnership agreements that define the management fees, the asset management fees range from 75 basis points on remaining assets under management to 250 basis points of the committed capital. For Real Estate, the asset management fees range from 50 to 175 basis points. Alternative and Real Estate fees, in most cases, are netted against income.
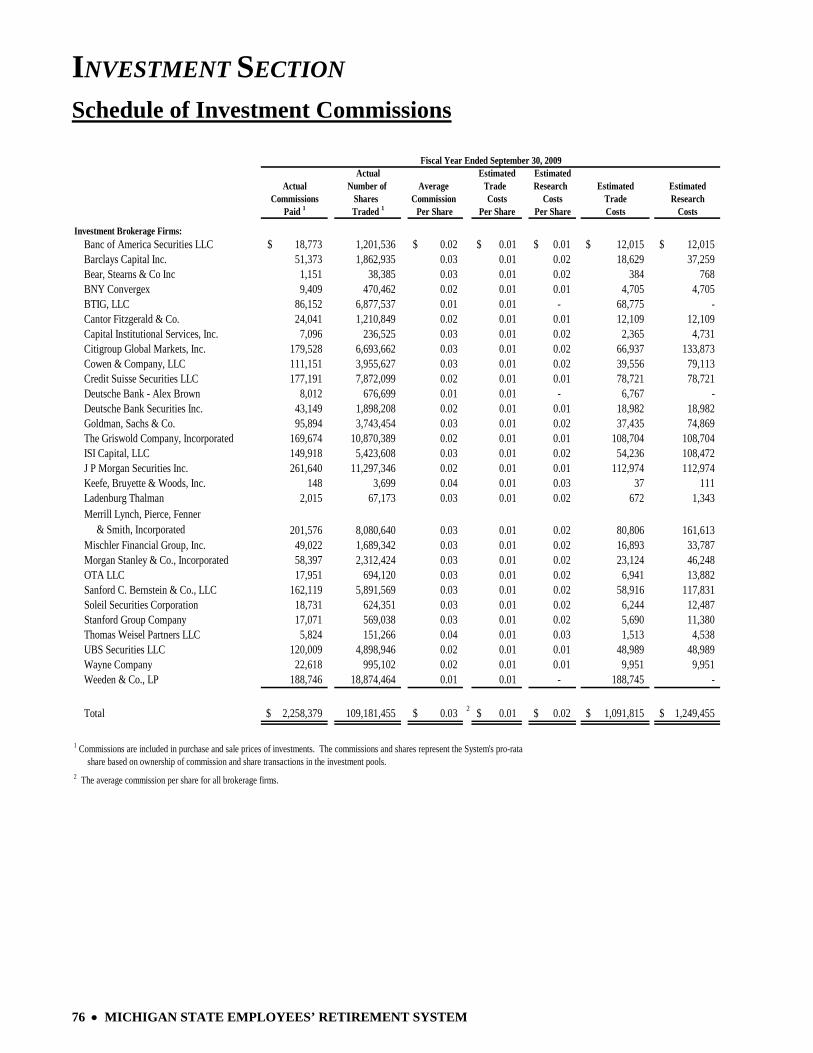
INVESTMENT SECTION
76 • MICHIGAN STATE EMPLOYEES’ RETIREMENT SYSTEM
Schedule of Investment Commissions
Actual Estimated EstimatedActual Number of Average Trade Research Estimated Estimated
Commissions Shares Commission Costs Costs Trade ResearchPaid 1 Traded 1 Per Share Per Share Per Share Costs Costs
Investment Brokerage Firms:Banc of America Securities LLC 18,773$ 1,201,536 0.02$ 0.01$ 0.01$ 12,015$ 12,015$ Barclays Capital Inc. 51,373 1,862,935 0.03 0.01 0.02 18,629 37,259 Bear, Stearns & Co Inc 1,151 38,385 0.03 0.01 0.02 384 768 BNY Convergex 9,409 470,462 0.02 0.01 0.01 4,705 4,705 BTIG, LLC 86,152 6,877,537 0.01 0.01 - 68,775 - Cantor Fitzgerald & Co. 24,041 1,210,849 0.02 0.01 0.01 12,109 12,109 Capital Institutional Services, Inc. 7,096 236,525 0.03 0.01 0.02 2,365 4,731 Citigroup Global Markets, Inc. 179,528 6,693,662 0.03 0.01 0.02 66,937 133,873 Cowen & Company, LLC 111,151 3,955,627 0.03 0.01 0.02 39,556 79,113 Credit Suisse Securities LLC 177,191 7,872,099 0.02 0.01 0.01 78,721 78,721 Deutsche Bank - Alex Brown 8,012 676,699 0.01 0.01 - 6,767 - Deutsche Bank Securities Inc. 43,149 1,898,208 0.02 0.01 0.01 18,982 18,982 Goldman, Sachs & Co. 95,894 3,743,454 0.03 0.01 0.02 37,435 74,869 The Griswold Company, Incorporated 169,674 10,870,389 0.02 0.01 0.01 108,704 108,704 ISI Capital, LLC 149,918 5,423,608 0.03 0.01 0.02 54,236 108,472 J P Morgan Securities Inc. 261,640 11,297,346 0.02 0.01 0.01 112,974 112,974 Keefe, Bruyette & Woods, Inc. 148 3,699 0.04 0.01 0.03 37 111 Ladenburg Thalman 2,015 67,173 0.03 0.01 0.02 672 1,343 Merrill Lynch, Pierce, Fenner & Smith, Incorporated 201,576 8,080,640 0.03 0.01 0.02 80,806 161,613 Mischler Financial Group, Inc. 49,022 1,689,342 0.03 0.01 0.02 16,893 33,787 Morgan Stanley & Co., Incorporated 58,397 2,312,424 0.03 0.01 0.02 23,124 46,248 OTA LLC 17,951 694,120 0.03 0.01 0.02 6,941 13,882 Sanford C. Bernstein & Co., LLC 162,119 5,891,569 0.03 0.01 0.02 58,916 117,831 Soleil Securities Corporation 18,731 624,351 0.03 0.01 0.02 6,244 12,487 Stanford Group Company 17,071 569,038 0.03 0.01 0.02 5,690 11,380 Thomas Weisel Partners LLC 5,824 151,266 0.04 0.01 0.03 1,513 4,538 UBS Securities LLC 120,009 4,898,946 0.02 0.01 0.01 48,989 48,989 Wayne Company 22,618 995,102 0.02 0.01 0.01 9,951 9,951 Weeden & Co., LP 188,746 18,874,464 0.01 0.01 - 188,745 -
Total 2,258,379$ 109,181,455 0.03$ 2 0.01$ 0.02$ 1,091,815$ 1,249,455$
1 Commissions are included in purchase and sale prices of investments. The commissions and shares represent the System's pro-rata share based on ownership of commission and share transactions in the investment pools.2 The average commission per share for all brokerage firms.
Fiscal Year Ended September 30, 2009
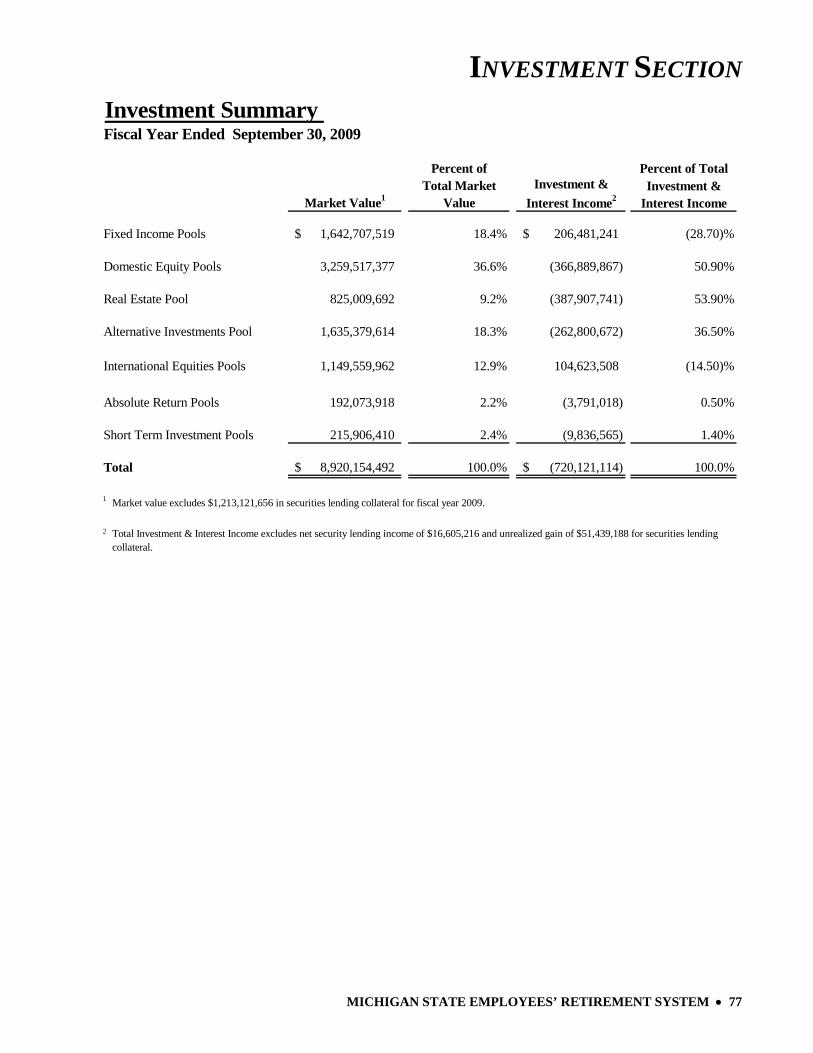
INVESTMENT SECTION
MICHIGAN STATE EMPLOYEES’ RETIREMENT SYSTEM • 77
Investment Summary Fiscal Year Ended September 30, 2009
Percent of Percent of TotalTotal Market Investment &
Market Value1 Value Interest Income
Fixed Income Pools 1,642,707,519$ 18.4% 206,481,241$ (28.70)%
Domestic Equity Pools 3,259,517,377 36.6% (366,889,867) 50.90%
Real Estate Pool 825,009,692 9.2% (387,907,741) 53.90%
Alternative Investments Pool 1,635,379,614 18.3% (262,800,672) 36.50%
International Equities Pools 1,149,559,962 12.9% 104,623,508 (14.50)%
Absolute Return Pools 192,073,918 2.2% (3,791,018) 0.50%
Short Term Investment Pools 215,906,410 2.4% (9,836,565) 1.40%
Total 8,920,154,492$ 100.0% (720,121,114)$ 100.0%
1 Market value excludes $1,213,121,656 in securities lending collateral for fiscal year 2009.
2
Investment & Interest Income2
Total Investment & Interest Income excludes net security lending income of $16,605,216 and unrealized gain of $51,439,188 for securities lending collateral.
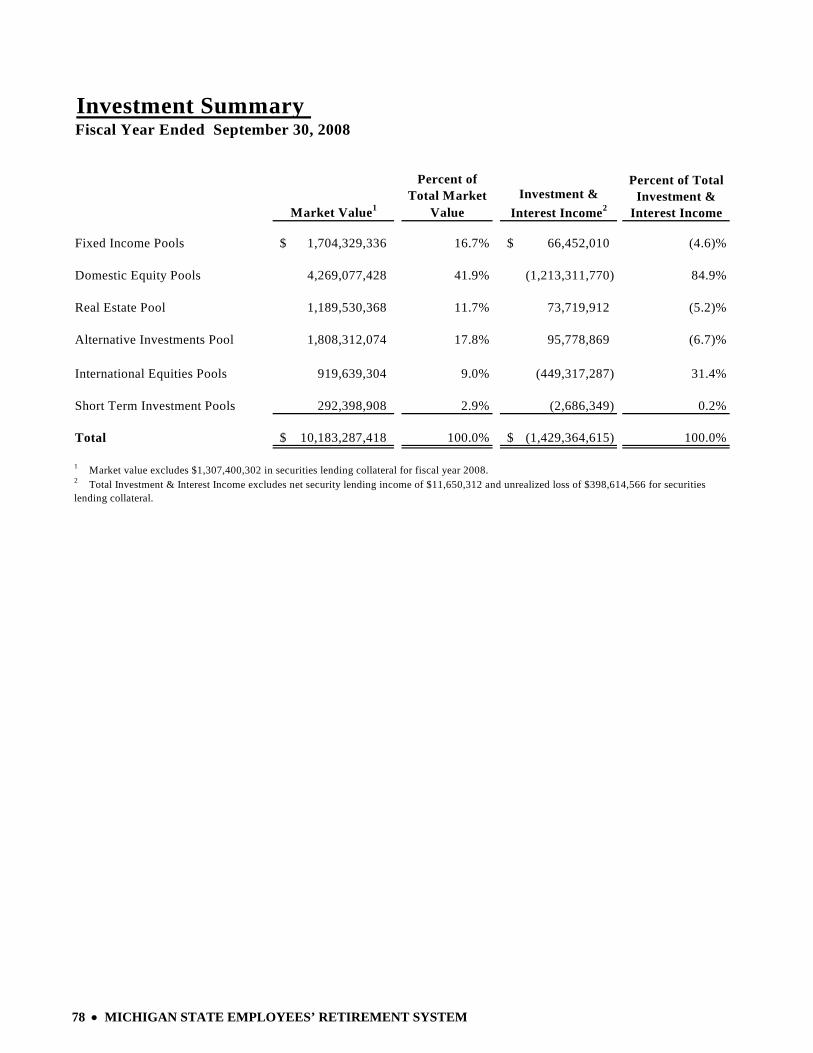
78 • MICHIGAN STATE EMPLOYEES’ RETIREMENT SYSTEM
Investment Summary Fiscal Year Ended September 30, 2008
Percent of Total Market
Market Value1 Value
Fixed Income Pools 1,704,329,336$ 16.7% 66,452,010$ (4.6)%
Domestic Equity Pools 4,269,077,428 41.9% (1,213,311,770) 84.9%
Real Estate Pool 1,189,530,368 11.7% 73,719,912 (5.2)%
Alternative Investments Pool 1,808,312,074 17.8% 95,778,869 (6.7)%
International Equities Pools 919,639,304 9.0% (449,317,287) 31.4%
Short Term Investment Pools 292,398,908 2.9% (2,686,349) 0.2%
Total 10,183,287,418$ 100.0% (1,429,364,615)$ 100.0%
1 Market value excludes $1,307,400,302 in securities lending collateral for fiscal year 2008.
Investment & Interest Income2
Percent of Total Investment &
Interest Income
2 Total Investment & Interest Income excludes net security lending income of $11,650,312 and unrealized loss of $398,614,566 for securities lending collateral.
MICHIGAN STATE EMPLOYEES’ RETIREMENT SYSTEM • 79
ACTUARIAL SECTION
Actuary’s Certification Summary of Actuarial Assumptions and Methods
Schedule of Active Member Valuation Data Schedule of Changes in the Retirement Rolls
Prioritized Solvency Test Analysis of System Experience
Summary of Plan Provisions
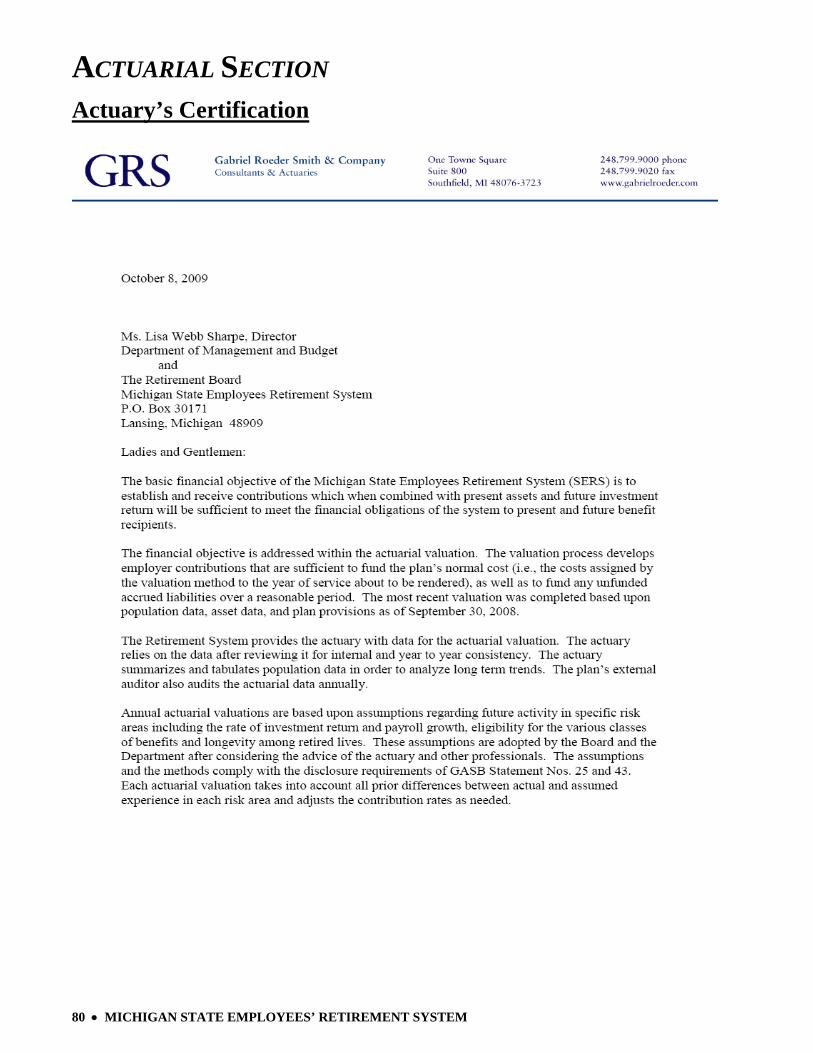
ACTUARIAL SECTION
80 • MICHIGAN STATE EMPLOYEES’ RETIREMENT SYSTEM
Actuary’s Certification
ACTUARIAL SECTION
MICHIGAN STATE EMPLOYEES’ RETIREMENT SYSTEM • 81
Actuary’s Certification (continued)
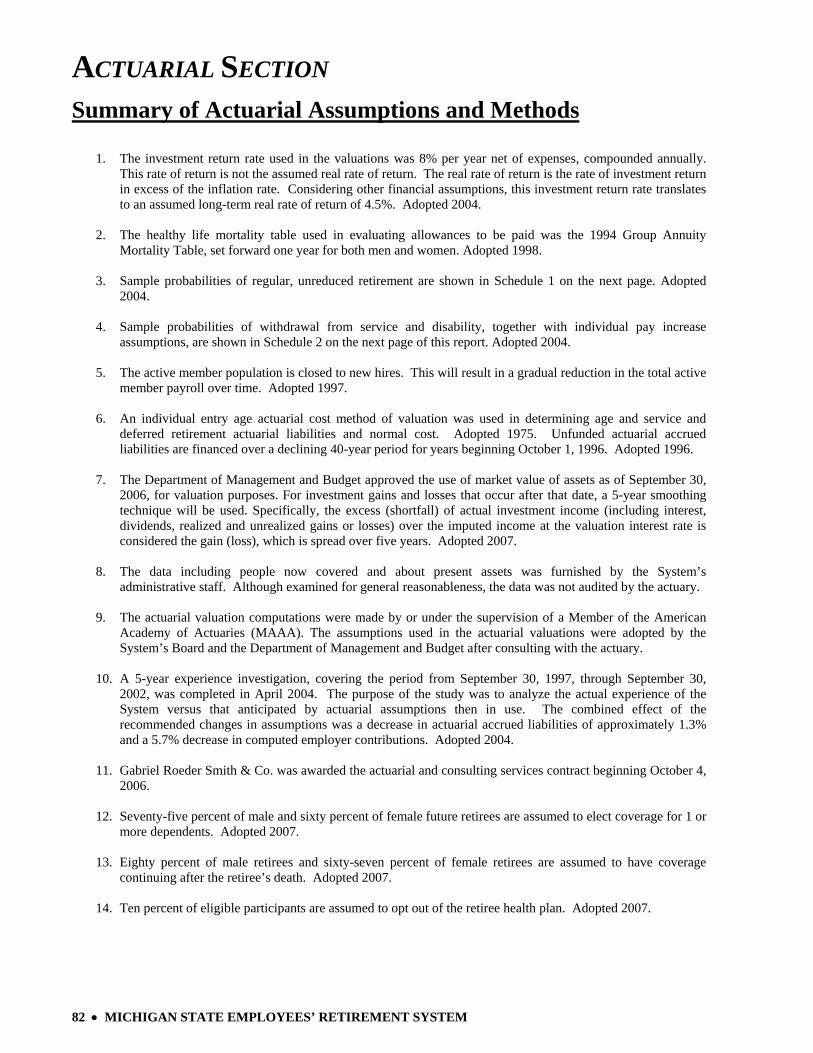
ACTUARIAL SECTION
82 • MICHIGAN STATE EMPLOYEES’ RETIREMENT SYSTEM
Summary of Actuarial Assumptions and Methods
1. The investment return rate used in the valuations was 8% per year net of expenses, compounded annually.
This rate of return is not the assumed real rate of return. The real rate of return is the rate of investment return in excess of the inflation rate. Considering other financial assumptions, this investment return rate translates to an assumed long-term real rate of return of 4.5%. Adopted 2004.
2. The healthy life mortality table used in evaluating allowances to be paid was the 1994 Group Annuity
Mortality Table, set forward one year for both men and women. Adopted 1998.
3. Sample probabilities of regular, unreduced retirement are shown in Schedule 1 on the next page. Adopted 2004.
4. Sample probabilities of withdrawal from service and disability, together with individual pay increase
assumptions, are shown in Schedule 2 on the next page of this report. Adopted 2004.
5. The active member population is closed to new hires. This will result in a gradual reduction in the total active member payroll over time. Adopted 1997.
6. An individual entry age actuarial cost method of valuation was used in determining age and service and
deferred retirement actuarial liabilities and normal cost. Adopted 1975. Unfunded actuarial accrued liabilities are financed over a declining 40-year period for years beginning October 1, 1996. Adopted 1996.
7. The Department of Management and Budget approved the use of market value of assets as of September 30,
2006, for valuation purposes. For investment gains and losses that occur after that date, a 5-year smoothing technique will be used. Specifically, the excess (shortfall) of actual investment income (including interest, dividends, realized and unrealized gains or losses) over the imputed income at the valuation interest rate is considered the gain (loss), which is spread over five years. Adopted 2007.
8. The data including people now covered and about present assets was furnished by the System’s
administrative staff. Although examined for general reasonableness, the data was not audited by the actuary.
9. The actuarial valuation computations were made by or under the supervision of a Member of the American Academy of Actuaries (MAAA). The assumptions used in the actuarial valuations were adopted by the System’s Board and the Department of Management and Budget after consulting with the actuary.
10. A 5-year experience investigation, covering the period from September 30, 1997, through September 30,
2002, was completed in April 2004. The purpose of the study was to analyze the actual experience of the System versus that anticipated by actuarial assumptions then in use. The combined effect of the recommended changes in assumptions was a decrease in actuarial accrued liabilities of approximately 1.3% and a 5.7% decrease in computed employer contributions. Adopted 2004.
11. Gabriel Roeder Smith & Co. was awarded the actuarial and consulting services contract beginning October 4,
2006.
12. Seventy-five percent of male and sixty percent of female future retirees are assumed to elect coverage for 1 or more dependents. Adopted 2007.
13. Eighty percent of male retirees and sixty-seven percent of female retirees are assumed to have coverage
continuing after the retiree’s death. Adopted 2007.
14. Ten percent of eligible participants are assumed to opt out of the retiree health plan. Adopted 2007.

ACTUARIAL SECTION
MICHIGAN STATE EMPLOYEES’ RETIREMENT SYSTEM • 83
Summary of Actuarial Assumptions and Methods (continued)
RetirementAges
45 16 %48 1651 25 % 1655 15 16 18 %58 12 15 1261 15 15 1464 22 22 2067 25 25 2570 50 50 5075 100 100 100
SCHEDULE 1
Percent of Eligible Active Members Retiring Within Next Year
Correction Officers Conservation Officers Other Members
Sample Years of
Ages Service
All 0 12.00 %1 8.502 6.503 5.004 4.00
25 5 & Over 3.50 0.03 % 0.05 % 10.74 %35 2.50 0.10 0.05 4.9545 2.00 0.34 0.05 4.1255 1.75 0.62 0.05 3.9160 1.75 0.82 0.05 3.50
SCHEDULE 2
Separation From Active Employment BeforeAge & Service Retirement & Individual Pay Increase Assumptions
Percent of ActivePercent of Active Members Becoming Percent
Members Withdrawing Disabled Within Next Year IncreaseWithin Next Year Duty In Pay During(Men and Women) Disabilities Next Year
Non-DutyDisabilities
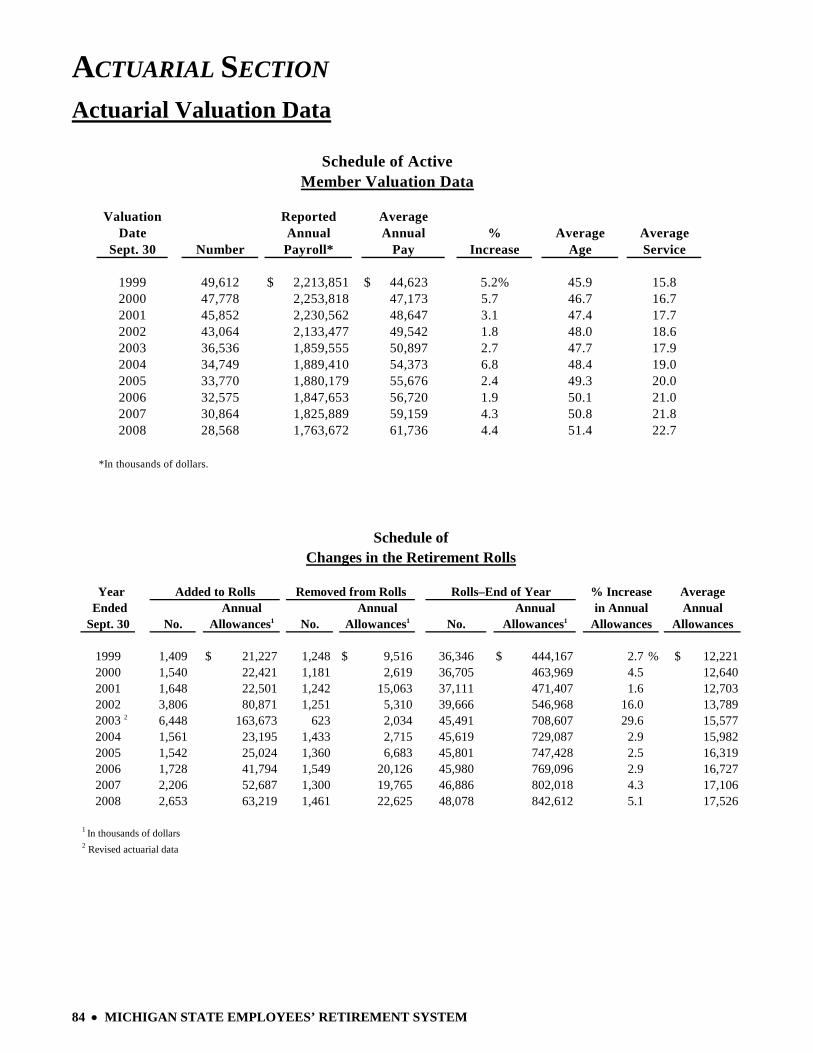
ACTUARIAL SECTION
84 • MICHIGAN STATE EMPLOYEES’ RETIREMENT SYSTEM
Actuarial Valuation Data
ValuationDate Average Average
Sept. 30 Number Age Service
1999 49,612 $ 2,213,851 $ 44,623 5.2% 45.9 15.82000 47,778 2,253,818 47,173 5.7 46.7 16.72001 45,852 2,230,562 48,647 3.1 47.4 17.72002 43,064 2,133,477 49,542 1.8 48.0 18.62003 36,536 1,859,555 50,897 2.7 47.7 17.92004 34,749 1,889,410 54,373 6.8 48.4 19.02005 33,770 1,880,179 55,676 2.4 49.3 20.02006 32,575 1,847,653 56,720 1.9 50.1 21.02007 30,864 1,825,889 59,159 4.3 50.8 21.82008 28,568 1,763,672 61,736 4.4 51.4 22.7
*In thousands of dollars.
Schedule of ActiveMember Valuation Data
Reported AverageAnnual Annual %
Payroll* Pay Increase
Year EndedSept. 30 No. No. No.
1999 1,409 $ 21,227 1,248 $ 9,516 36,346 $ 444,167 2.7 % $ 12,2212000 1,540 22,421 1,181 2,619 36,705 463,969 4.5 12,6402001 1,648 22,501 1,242 15,063 37,111 471,407 1.6 12,7032002 3,806 80,871 1,251 5,310 39,666 546,968 16.0 13,789
2003 2 6,448 163,673 623 2,034 45,491 708,607 29.6 15,5772004 1,561 23,195 1,433 2,715 45,619 729,087 2.9 15,9822005 1,542 25,024 1,360 6,683 45,801 747,428 2.5 16,3192006 1,728 41,794 1,549 20,126 45,980 769,096 2.9 16,7272007 2,206 52,687 1,300 19,765 46,886 802,018 4.3 17,1062008 2,653 63,219 1,461 22,625 48,078 842,612 5.1 17,526
1 In thousands of dollars2 Revised actuarial data
AllowancesAnnual
Allowances1
Added to RollsAnnual
Removed from Rolls
Allowances1
AverageAnnual
Allowances
Schedule ofChanges in the Retirement Rolls
Rolls–End of YearAnnual
Allowances1
% Increasein Annual
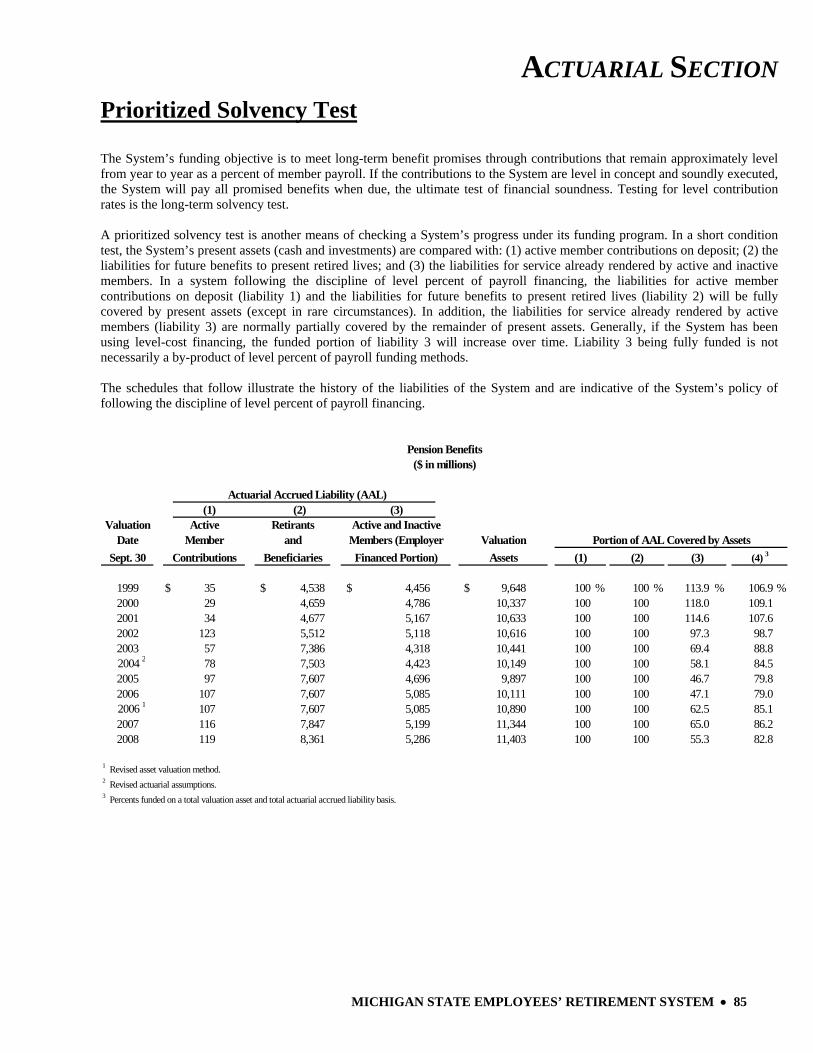
ACTUARIAL SECTION
MICHIGAN STATE EMPLOYEES’ RETIREMENT SYSTEM • 85
Prioritized Solvency Test The System’s funding objective is to meet long-term benefit promises through contributions that remain approximately level from year to year as a percent of member payroll. If the contributions to the System are level in concept and soundly executed, the System will pay all promised benefits when due, the ultimate test of financial soundness. Testing for level contribution rates is the long-term solvency test. A prioritized solvency test is another means of checking a System’s progress under its funding program. In a short condition test, the System’s present assets (cash and investments) are compared with: (1) active member contributions on deposit; (2) the liabilities for future benefits to present retired lives; and (3) the liabilities for service already rendered by active and inactive members. In a system following the discipline of level percent of payroll financing, the liabilities for active member contributions on deposit (liability 1) and the liabilities for future benefits to present retired lives (liability 2) will be fully covered by present assets (except in rare circumstances). In addition, the liabilities for service already rendered by active members (liability 3) are normally partially covered by the remainder of present assets. Generally, if the System has been using level-cost financing, the funded portion of liability 3 will increase over time. Liability 3 being fully funded is not necessarily a by-product of level percent of payroll funding methods. The schedules that follow illustrate the history of the liabilities of the System and are indicative of the System’s policy of following the discipline of level percent of payroll financing.
(2) (3)Valuation
DateSept. 30
1999 $ 35 $ 4,538 $ 4,456 $ 9,648 100 % 100 % 113.9 % 106.9 %2000 29 4,659 4,786 10,337 100 100 118.0 109.12001 34 4,677 5,167 10,633 100 100 114.6 107.62002 123 5,512 5,118 10,616 100 100 97.3 98.72003 57 7,386 4,318 10,441 100 100 69.4 88.8
2004 2 78 7,503 4,423 10,149 100 100 58.1 84.52005 97 7,607 4,696 9,897 100 100 46.7 79.82006 107 7,607 5,085 10,111 100 100 47.1 79.0
2006 1 107 7,607 5,085 10,890 100 100 62.5 85.12007 116 7,847 5,199 11,344 100 100 65.0 86.22008 119 8,361 5,286 11,403 100 100 55.3 82.8
1 Revised asset valuation method.2 Revised actuarial assumptions.3 Percents funded on a total valuation asset and total actuarial accrued liability basis.
Pension Benefits($ in millions)
Portion of AAL Covered by Assets(1) (2) (3) (4) 3Beneficiaries
andContributions
MemberAssets
Members (EmployerFinanced Portion)
Valuation
Actuarial Accrued Liability (AAL)
Active and InactiveRetirantsActive(1)
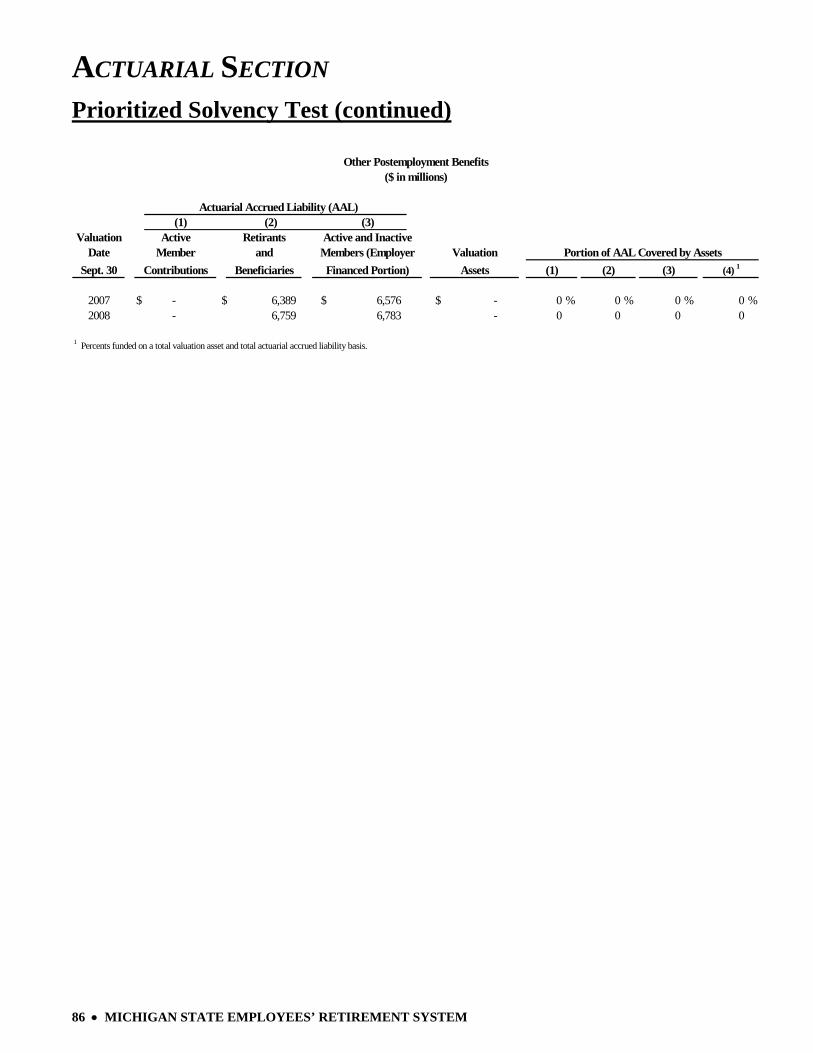
ACTUARIAL SECTION
86 • MICHIGAN STATE EMPLOYEES’ RETIREMENT SYSTEM
Prioritized Solvency Test (continued)
(2) (3)Valuation
DateSept. 30
2007 $ - $ 6,389 $ 6,576 $ - 0 % 0 % 0 % 0 %2008 - 6,759 6,783 - 0 0 0 0
1 Percents funded on a total valuation asset and total actuarial accrued liability basis.
Actuarial Accrued Liability (AAL)
Active and InactiveRetirantsActive(1)
MemberAssets
Members (EmployerFinanced Portion)
Valuation
Other Postemployment Benefits($ in millions)
Portion of AAL Covered by Assets(1) (2) (3) (4) 1Beneficiaries
andContributions

ACTUARIAL SECTION
MICHIGAN STATE EMPLOYEES’ RETIREMENT SYSTEM • 87
1. Retirements (including Disability Retirement). If members retire at older ages or with lower final average pay than assumed, there is a gain. If younger ages or higher average pays, a loss. $ (5,096,183)
2. Withdrawal From Employment (including death-in-service). If more liabilities are released by withdrawals and deaths than assumed, there is a gain. If smaller releases, a loss. 20,076,547
3. Pay Increases. If there are smaller pay increases than assumed, there is a gain. If greater increases, a loss. (14,661,117)
4. Investment Income. If there is greater investment income than assumed, there is a gain. If less income, a loss. (357,935,204)
5. Death After Retirement. If retirants live longer than assumed, there is a loss. If not as long, a gain. (38,477,272)
6. Rehires. Rehires will generally result in an actuarial loss. (1,849,864)
7. Other. Miscellaneous gains and losses resulting from data adjustments, timing of financial transactions, etc. (38,960,971)
8. Composite Gain (or Loss) During Year $ (436,904,064)
Analysis of System Experience
Gains/(Losses) in Accrued Liabilities During Year Ended September 30, 2008Resulting from Differences Between Assumed Experience & Actual Experience
Type of Activity Gain/(Loss)
ACTUARIAL SECTION
88 • MICHIGAN STATE EMPLOYEES’ RETIREMENT SYSTEM
Summary of Plan Provisions Our actuarial valuation of the System as of September 30, 2008, is based on the present provisions of the Michigan State Employees’ Retirement Act (Public Act 240 of 1943, as amended). Regular Retirement (no reduction factor for age) Eligibility - Age 55 with 30 years service, or age 60 with 10 or more years of service. Corrections Officers may retire at age 51 with 25 or more years of service, or age 56 with 10 or more years of service. Conservation Officers may retire after 25 years of service regardless of age. Final Average Compensation - Regular retirement benefit is based on final average compensation (FAC), which is the average of highest 3 consecutive years (2 years for Conservation Officers). Annual Amount - Total service times 1.5% of FAC. For members with 20 or more years of service, a $3,000 minimum annual benefit is payable. Corrections Officers receive an additional temporary supplement to age 62 equal to the product of supplemental service times 0.5% of FAC. Conservation Officers retiring after 25 years receive a benefit equal to 60% of FAC. Early Retirement (age reduction factor used) Eligibility - Age 55 with 15 or more years of service. Annual Amount - Computed as regular retirement benefit but reduced by 0.5% for each month under age 60. Deferred Retirement (vested benefit) Eligibility - 10 years of service (5 years for unclassified persons in the executive or legislative branch). Benefit commences at age 60. Annual Amount - Computed as regular retirement benefit based on service and FAC at termination. Duty Disability Retirement Eligibility - No age or service requirement. Annual Amount - Disability age 60+: Computed as regular retirement benefit with minimum benefit based on 10 years service. Disability prior to age 60: To age 60, benefit is computed as a regular retirement benefit using service at the time of disability retirement with a minimum benefit of $6,000 per year. Additional limitation such that benefit plus workers’ compensation does not exceed final compensation. At age 60, benefit is recomputed as a regular retirement benefit with service granted for period in receipt of disability benefit before age 60. If the member dies before age 60, benefits are payable to a surviving spouse computed as a regular retirement benefit but based on service at time of disability retirement plus elapsed time between date of retirement and age 60. Non-Duty Disability Retirement Eligibility - 10 years of service. Annual Amount - Computed as regular retirement benefit based on service and FAC at time of disability. Minimum annual benefit is $600. Duty Death Before Retirement Eligibility - No age or service requirement.
ACTUARIAL SECTION
MICHIGAN STATE EMPLOYEES’ RETIREMENT SYSTEM • 89
Summary of Plan Provisions (continued) Annual Amount - Accumulated employee contributions are refunded. Surviving spouse receives annual benefit computed as a regular retirement benefit as if the deceased member retired the day before date of death and elected Option A. Benefit is based on member’s service at time of death, or 10 years of service, whichever is greater. A minimum benefit of $6,000 per year is payable. Children under age 21 each receive equal share of one-half of the benefit payable (surviving spouse receives the other half), to a maximum of one-half for all children. A given child’s share of benefits terminates upon the child’s marriage, death or attainment of age 21. In the event that there is no surviving spouse, the benefit is allocated equally among all children subject to the limitations described above. In the event that there is no surviving spouse or eligible children, benefits may be paid to an eligible, dependent parent. Benefits end upon the marriage or death of the surviving parent. Additional limitation such that benefit plus workers’ compensation does not exceed final compensation. Non-Duty Death Before Retirement Eligibility - 10 years of service. In the case of a deceased vested former member, the survivor benefit commences when the deceased former member would have attained age 60. Annual Amount - Computed as regular retirement benefit but reduced in accordance with a 100% joint and survivor election. Post-Retirement Cost-of-Living Adjustments One-time upward adjustments have been made in 1972, 1974, 1976, 1977 and 1987. Beginning in 1983, some benefit recipients share in a distribution of a portion of investment income earned in excess of 8% annually (supplemental payment). Beginning in 1988, all benefit recipients are eligible for automatic 3% annual (non-compounded) benefit increases, with a maximum $300 annual increase. Eligibility for the above benefits:
Retired before October 1, 1987 Greater of supplemental payment or the combination of the 1987 one-time adjustment and the automatic increases.
Retired on or after October 1, 1987 Automatic increases only.
Post-Retirement Health Benefits Coverage Persons in receipt of retirement allowance (including members who did not retire directly from the System, but come from a vested deferred status), and their dependents, are eligible for 95% System paid health insurance coverage and 90% System paid dental and vision insurance. Member Contributions None. Defined Contribution (Public Act 487 of 1996) New employees hired on or after March 31, 1997, become participants in Tier 2 (i.e., the defined contribution plan) rather than Tier 1 (i.e., the above described defined benefit plan). Active members on March 30, 1997, had an opportunity to irrevocably elect to terminate membership in Tier 1 and become participants in Tier 2. Elections were in writing and submitted between January 2, 1998, and April 30, 1998. Such members became Tier 2 participants on June 1, 1998, and had the actuarial present value of their Tier 1 accrued benefit transferred into Tier 2 by September 30, 1998.
ACTUARIAL SECTION
90 • MICHIGAN STATE EMPLOYEES’ RETIREMENT SYSTEM
Summary of Plan Provisions (continued) 2002 Early Out Window Members who retired between April 1, 2002, and November 1, 2002, and whose combined age and service equaled 80 points, or who were age 60 or older with 10 or more years of service were eligible to receive a benefit equal to 1.75% of their final average compensation multiplied by years of credited service. Members, who had previously transferred to the Defined Contribution plan, were eligible to receive a benefit equal to 0.25% of their final average compensation multiplied by years of credited service.
MICHIGAN STATE EMPLOYEES’ RETIREMENT SYSTEM • 91
STATISTICAL SECTION
Schedules of Additions by Source Schedules of Deductions by Type
Schedules of Changes in Net Assets Schedules of Benefits and Refunds by Type
Schedules of Retired Members by Type of Benefit Schedule of Other Postemployment Benefits
Schedules of Average Benefit Payments Ten Year History of Membership

STATISTICAL SECTION
92 • MICHIGAN STATE EMPLOYEES’ RETIREMENT SYSTEM
This part of the System’s comprehensive annual financial report presents detailed information as a context for understanding what the information in the financial statements, note disclosures, and required supplementary information says about the System’s overall financial health.
Contents
Financial Trends These schedules contain trend information to help the reader understand how the System’s financial performance and fiscal health has changed over time. The schedules are presented for the last ten fiscal years. Schedules included are:
• Schedule of Pension Plan Additions by Source • Schedule of OPEB Plan Additions by Source • Schedule of Pension Plan Deductions by Type • Schedule of OPEB Plan Deductions by Type • Schedule of Changes in Net Assets - Pension Plan • Schedule of Changes in Net Assets - OPEB Plan • Schedule of Pension Benefits and Refunds by Type • Schedule of OPEB Benefits and Refunds by Type
Operating Information These schedules contain contextual information to assist the reader’s understanding of how the System’s financial information relates to the combination of participating members and the benefits it provides. Schedules are presented for the last ten fiscal years, except where noted. Schedules included are:
• Schedule of Retired Members by Type of Pension Benefit • Schedule of Retired Members by Type of Other Postemployment Benefit • Schedule of Other Post Employment Benefits • Schedule of Average Benefit Payments - Pension • Schedule of Average Benefit Payments - Health • Schedule of Average Benefit Payments - Dental • Schedule of Average Benefit Payments - Vision • Ten Year History of Membership
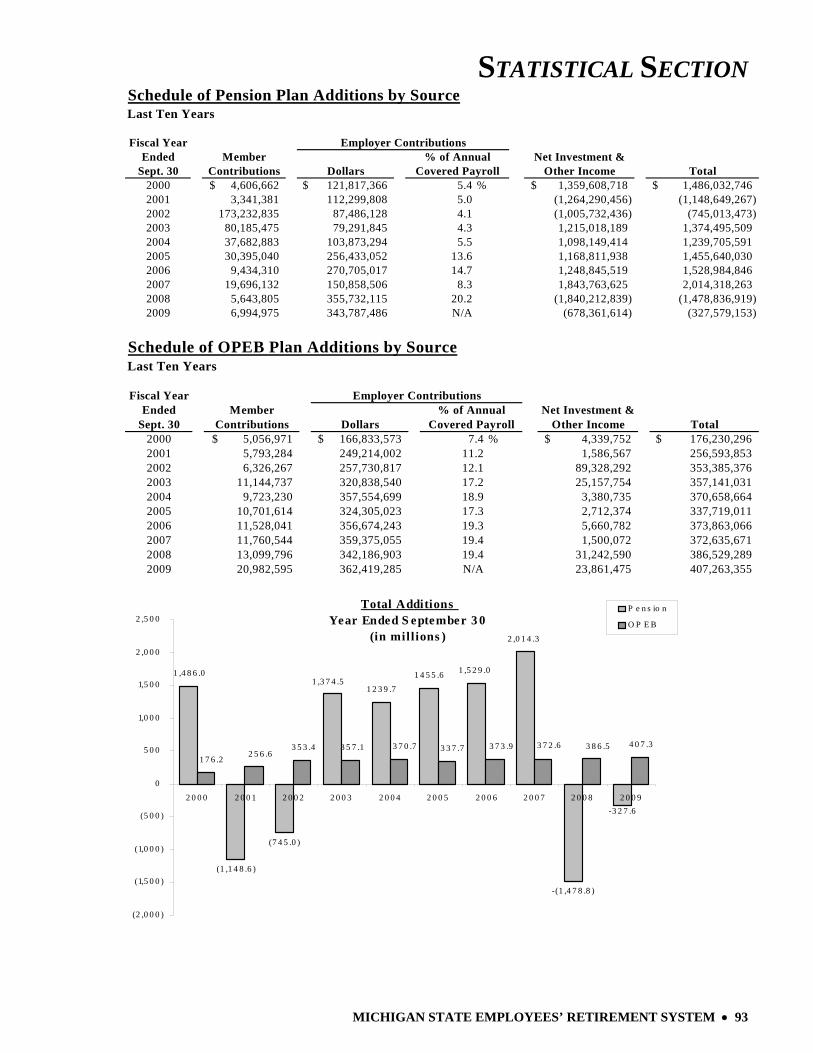
STATISTICAL SECTION
MICHIGAN STATE EMPLOYEES’ RETIREMENT SYSTEM • 93
Last Ten Years
Fiscal YearEnded Member Net Investment &
Sept. 30 Contributions Dollars Other Income Total2000 4,606,662$ 121,817,366$ 5.4 % 1,359,608,718$ 1,486,032,746$ 2001 3,341,381 112,299,808 5.0 (1,264,290,456) (1,148,649,267) 2002 173,232,835 87,486,128 4.1 (1,005,732,436) (745,013,473) 2003 80,185,475 79,291,845 4.3 1,215,018,189 1,374,495,509 2004 37,682,883 103,873,294 5.5 1,098,149,414 1,239,705,591 2005 30,395,040 256,433,052 13.6 1,168,811,938 1,455,640,030 2006 9,434,310 270,705,017 14.7 1,248,845,519 1,528,984,846 2007 19,696,132 150,858,506 8.3 1,843,763,625 2,014,318,263 2008 5,643,805 355,732,115 20.2 (1,840,212,839) (1,478,836,919) 2009 6,994,975 343,787,486 N/A (678,361,614) (327,579,153)
Schedule of Pension Plan Additions by Source
Covered Payroll% of Annual
Employer Contributions
Last Ten Years
Fiscal YearEnded Member Net Investment &
Sept. 30 Contributions Dollars Other Income Total2000 5,056,971$ 166,833,573$ 7.4 % 4,339,752$ 176,230,296$ 2001 5,793,284 249,214,002 11.2 1,586,567 256,593,853 2002 6,326,267 257,730,817 12.1 89,328,292 353,385,376 2003 11,144,737 320,838,540 17.2 25,157,754 357,141,031 2004 9,723,230 357,554,699 18.9 3,380,735 370,658,664 2005 10,701,614 324,305,023 17.3 2,712,374 337,719,011 2006 11,528,041 356,674,243 19.3 5,660,782 373,863,066 2007 11,760,544 359,375,055 19.4 1,500,072 372,635,671 2008 13,099,796 342,186,903 19.4 31,242,590 386,529,289 2009 20,982,595 362,419,285 N/A 23,861,475 407,263,355
Schedule of OPEB Plan Additions by Source
Covered Payroll% of Annual
Employer Contributions
Total Additions Year Ended S eptember 3 0
(in mill ions )
(1 ,1 4 8 .6 )
(7 4 5 .0 )
1 ,5 2 9 .0
2 ,0 1 4 .3
-(1 ,4 7 8 .8 )
-3 2 7 .6
1 ,4 8 6 .0 1 4 5 5 .6
1 2 3 9 .71 ,3 7 4 .5
3 3 7 .73 7 0 .71 7 6 .2
2 5 6 .63 5 3 .4 3 5 7 .1 3 7 3 .9 3 7 2 .6 3 8 6 .5 4 0 7 .3
(2 ,0 0 0 )
(1,5 0 0 )
(1,0 0 0 )
(5 0 0 )
0
5 0 0
1,0 0 0
1,5 0 0
2 ,0 0 0
2 ,5 0 0
2 0 0 0 2 0 0 1 2 0 0 2 2 0 0 3 2 0 0 4 2 0 0 5 2 0 0 6 2 0 0 7 2 0 0 8 2 0 0 9
P e n s io n
O P E B

STATISTICAL SECTION
94 • MICHIGAN STATE EMPLOYEES’ RETIREMENT SYSTEM
Last Ten Years
Fiscal Year AdministrativeEnded Benefit Refunds and Other
Sept. 30 Payments and Transfers Expenses Total2000 458,803,774$ 222,163$ 3,954,992$ 462,980,929$ 2001 478,525,328 91,699 4,149,284 482,766,311 2002 503,453,879 87,504,459 6,432,819 597,391,157 2003 701,664,432 17,484,652 5,192,039 724,341,123 2004 731,009,109 183,126 4,316,433 735,508,668 2005 746,673,263 306,643 4,297,985 751,277,891 2006 767,000,706 256,533 4,628,043 771,885,282 2007 795,842,013 229,600 5,115,226 801,186,839 2008 832,553,176 373,916 5,048,737 837,975,829 2009 870,278,863 366,039 4,865,232 875,510,134
Schedule of Pension Plan Deductions by Type
Last Ten Years
Fiscal Year AdministrativeEnded Benefit Refunds and Other
Sept. 30 Payments and Transfers Expenses Total2000 208,627,602$ 8$ 208,627,610$ 2001 248,246,380 248,246,380 2002 278,998,333 278,998,333 2003 354,084,838 58,211,100 412,295,938 2004 354,649,665 24,363,516 379,013,181 2005 322,834,138 322,834,138 2006 362,597,685 362,597,685 2007 363,975,051 41,304,031 405,279,082 2008 377,513,873 35,001,063 19,393,665$ 431,908,601 2009 392,135,386 2,431 20,896,664 413,034,481
Schedule of OPEB Plan Deductions by Type
T otal D eductions Y ear E nded Septem ber 30
(in millions)
463.0 482.8
597.4
724.3771.9
801.2838.0
875.5
751.3735.5
208.6248.2
279.0
412.3379.0
322.8362.6
405.3431.9
413.0
0
100
200
300
400
500
600
700
800
900
1,000
2000 2001 2002 2003 2004 2005 2006 2007 2008 2009
Pension
O PEB
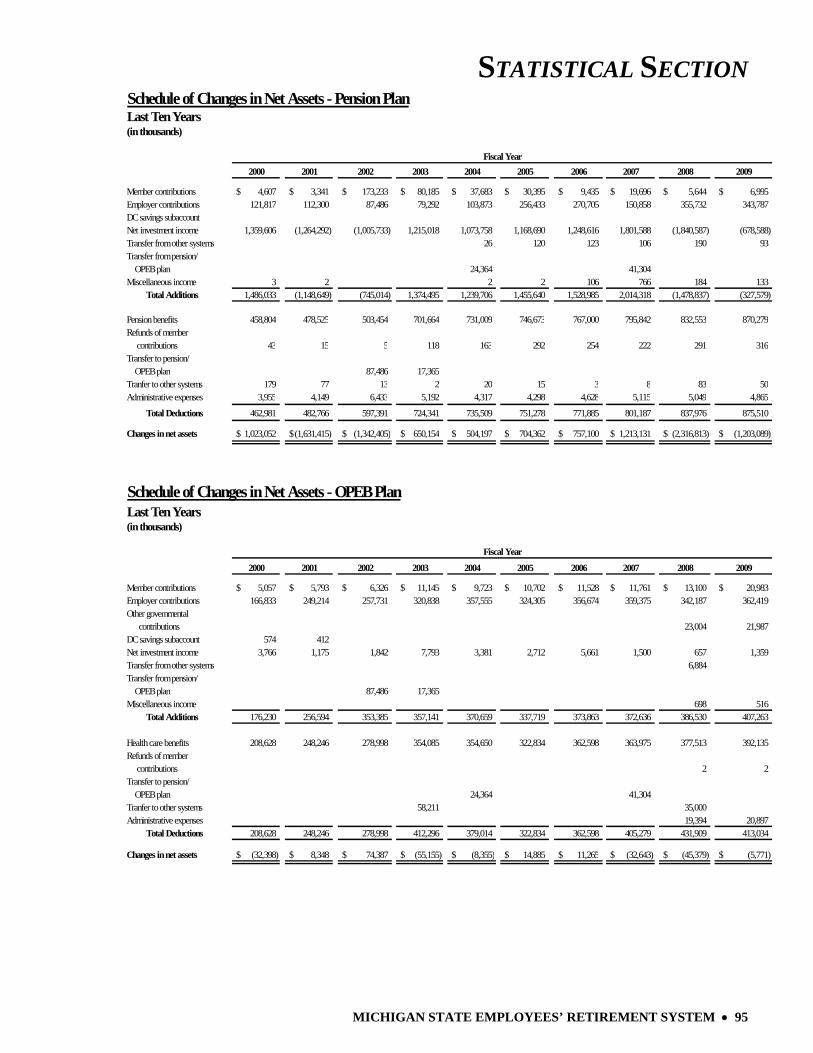
STATISTICAL SECTION
MICHIGAN STATE EMPLOYEES’ RETIREMENT SYSTEM • 95
Schedule of Changes in Net Assets - Pension PlanLast Ten Years(in thousands)
2000 2001 2002 2003 2004 2005 2006 2007 2008 2009
Member contributions 4,607$ 3,341$ 173,233$ 80,185$ 37,683$ 30,395$ 9,435$ 19,696$ 5,644$ 6,995$ Employer contributions 121,817 112,300 87,486 79,292 103,873 256,433 270,705 150,858 355,732 343,787 DC savings subaccountNet investment income 1,359,606 (1,264,292) (1,005,733) 1,215,018 1,073,758 1,168,690 1,248,616 1,801,588 (1,840,587) (678,588) Transfer from other systems 26 120 123 106 190 93 Transfer from pension/ OPEB plan 24,364 41,304 Miscellaneous income 3 2 2 2 106 766 184 133
Total Additions 1,486,033 (1,148,649) (745,014) 1,374,495 1,239,706 1,455,640 1,528,985 2,014,318 (1,478,837) (327,579)
Pension benefits 458,804 478,525 503,454 701,664 731,009 746,673 767,000 795,842 832,553 870,279 Refunds of member contributions 43 15 5 118 163 292 254 222 291 316 Transfer to pension/ OPEB plan 87,486 17,365 Tranfer to other systems 179 77 13 2 20 15 3 8 83 50 Administrative expenses 3,955 4,149 6,433 5,192 4,317 4,298 4,628 5,115 5,049 4,865
Total Deductions 462,981 482,766 597,391 724,341 735,509 751,278 771,885 801,187 837,976 875,510
Changes in net assets 1,023,052$ (1,631,415)$ (1,342,405)$ 650,154$ 504,197$ 704,362$ 757,100$ 1,213,131$ (2,316,813)$ (1,203,089)$
Schedule of Changes in Net Assets - OPEB PlanLast Ten Years(in thousands)
2000 2001 2002 2003 2004 2005 2006 2007 2008 2009
Member contributions 5,057$ 5,793$ 6,326$ 11,145$ 9,723$ 10,702$ 11,528$ 11,761$ 13,100$ 20,983$ Employer contributions 166,833 249,214 257,731 320,838 357,555 324,305 356,674 359,375 342,187 362,419 Other governmental contributions 23,004 21,987 DC savings subaccount 574 412 Net investment income 3,766 1,175 1,842 7,793 3,381 2,712 5,661 1,500 657 1,359 Transfer from other systems 6,884 Transfer from pension/ OPEB plan 87,486 17,365 Miscellaneous income 698 516
Total Additions 176,230 256,594 353,385 357,141 370,659 337,719 373,863 372,636 386,530 407,263
Health care benefits 208,628 248,246 278,998 354,085 354,650 322,834 362,598 363,975 377,513 392,135 Refunds of member contributions 2 2 Transfer to pension/ OPEB plan 24,364 41,304 Tranfer to other systems 58,211 35,000 Administrative expenses 19,394 20,897
Total Deductions 208,628 248,246 278,998 412,296 379,014 322,834 362,598 405,279 431,909 413,034
Changes in net assets (32,398)$ 8,348$ 74,387$ (55,155)$ (8,355)$ 14,885$ 11,265$ (32,643)$ (45,379)$ (5,771)$
Fiscal Year
Fiscal Year
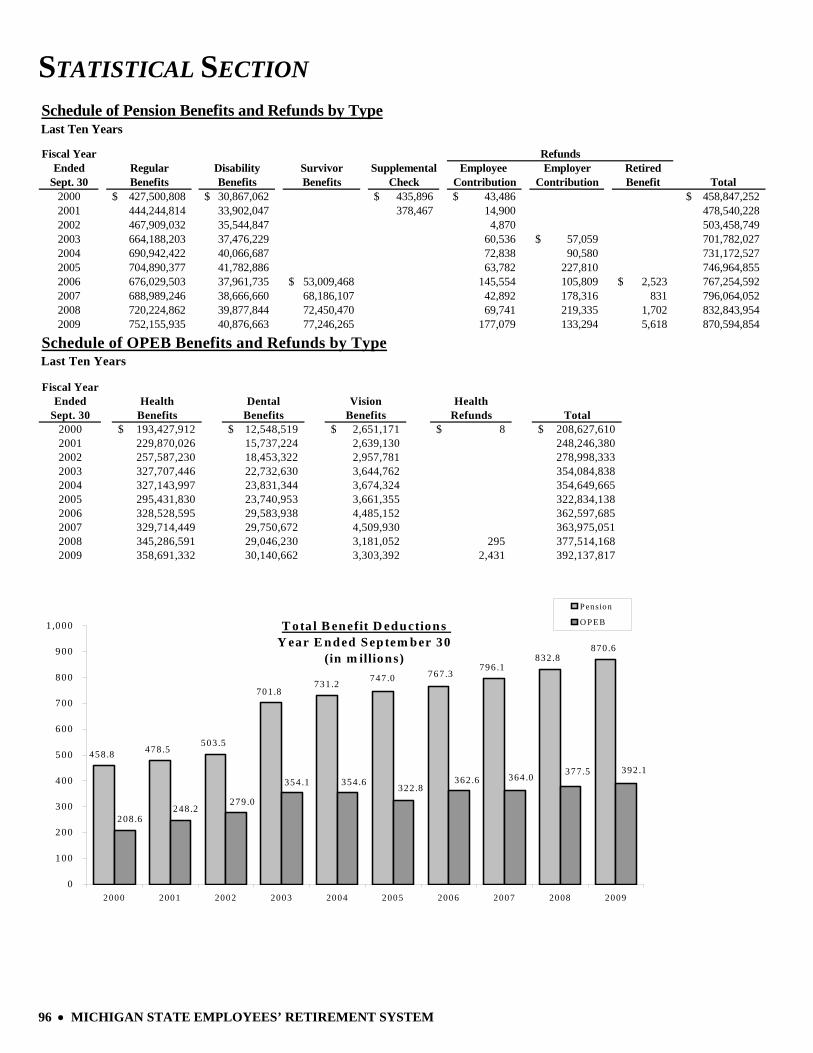
STATISTICAL SECTION
96 • MICHIGAN STATE EMPLOYEES’ RETIREMENT SYSTEM
Schedule of Pension Benefits and Refunds by TypeLast Ten Years
Fiscal YearEnded Regular Disability Survivor Supplemental Employee Employer Retired
Sept. 30 Benefits Benefits Benefits Check Contribution Contribution Benefit Total2000 427,500,808$ 30,867,062$ 435,896$ 43,486$ 458,847,252$ 2001 444,244,814 33,902,047 378,467 14,900 478,540,228 2002 467,909,032 35,544,847 4,870 503,458,749 2003 664,188,203 37,476,229 60,536 57,059$ 701,782,027 2004 690,942,422 40,066,687 72,838 90,580 731,172,527 2005 704,890,377 41,782,886 63,782 227,810 746,964,855 2006 676,029,503 37,961,735 53,009,468$ 145,554 105,809 2,523$ 767,254,592 2007 688,989,246 38,666,660 68,186,107 42,892 178,316 831 796,064,052 2008 720,224,862 39,877,844 72,450,470 69,741 219,335 1,702 832,843,954 2009 752,155,935 40,876,663 77,246,265 177,079 133,294 5,618 870,594,854
Refunds
Last Ten Years
Fiscal YearEnded Health Dental Vision Health
Sept. 30 Benefits Benefits Benefits Refunds Total2000 193,427,912$ 12,548,519$ 2,651,171$ 8$ 208,627,610$ 2001 229,870,026 15,737,224 2,639,130 248,246,380 2002 257,587,230 18,453,322 2,957,781 278,998,333 2003 327,707,446 22,732,630 3,644,762 354,084,838 2004 327,143,997 23,831,344 3,674,324 354,649,665 2005 295,431,830 23,740,953 3,661,355 322,834,138 2006 328,528,595 29,583,938 4,485,152 362,597,685 2007 329,714,449 29,750,672 4,509,930 363,975,051 2008 345,286,591 29,046,230 3,181,052 295 377,514,168 2009 358,691,332 30,140,662 3,303,392 2,431 392,137,817
Schedule of OPEB Benefits and Refunds by Type
T ota l B enefit D eductions Y ear E nded Septem ber 30
(in m illions)
458.8 478.5503.5
701.8
832.8870.6
796 .1767.3
731.2 747.0
392.1377.5364.0362.6322.8354.6354.1
279.0248.2
208.6
0
100
200
300
400
500
600
700
800
900
1 ,000
2000 2001 2002 2003 2004 2005 2006 2007 2008 2009
Pension
O PE B
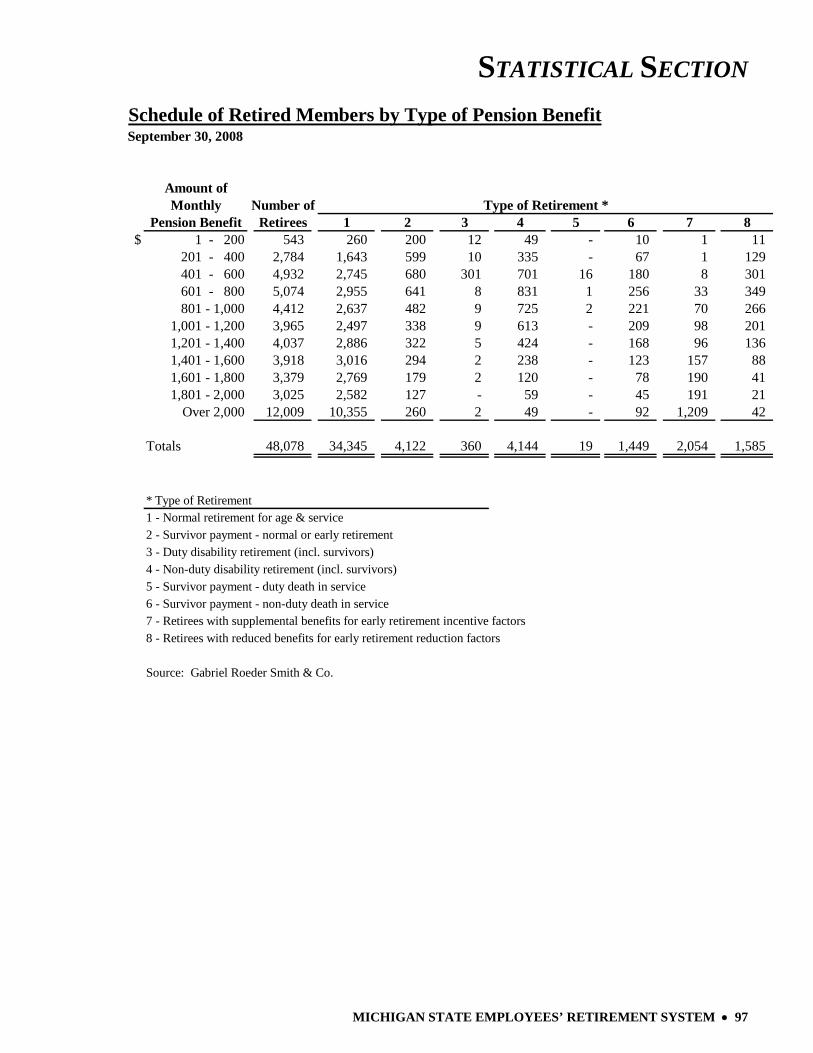
STATISTICAL SECTION
MICHIGAN STATE EMPLOYEES’ RETIREMENT SYSTEM • 97
Schedule of Retired Members by Type of Pension BenefitSeptember 30, 2008
Amount ofMonthly Number of
Pension Benefit Retirees 1 2 3 4 5 6 7 8$ 1 - 200 543 260 200 12 49 - 10 1 11
201 - 400 2,784 1,643 599 10 335 - 67 1 129 401 - 600 4,932 2,745 680 301 701 16 180 8 301 601 - 800 5,074 2,955 641 8 831 1 256 33 349 801 - 1,000 4,412 2,637 482 9 725 2 221 70 266
1,001 - 1,200 3,965 2,497 338 9 613 - 209 98 201 1,201 - 1,400 4,037 2,886 322 5 424 - 168 96 136 1,401 - 1,600 3,918 3,016 294 2 238 - 123 157 88 1,601 - 1,800 3,379 2,769 179 2 120 - 78 190 41 1,801 - 2,000 3,025 2,582 127 - 59 - 45 191 21
Over 2,000 12,009 10,355 260 2 49 - 92 1,209 42
Totals 48,078 34,345 4,122 360 4,144 19 1,449 2,054 1,585
* Type of Retirement1 - Normal retirement for age & service2 - Survivor payment - normal or early retirement3 - Duty disability retirement (incl. survivors)4 - Non-duty disability retirement (incl. survivors)5 - Survivor payment - duty death in service 6 - Survivor payment - non-duty death in service7 - Retirees with supplemental benefits for early retirement incentive factors8 - Retirees with reduced benefits for early retirement reduction factors
Source: Gabriel Roeder Smith & Co.
Type of Retirement *
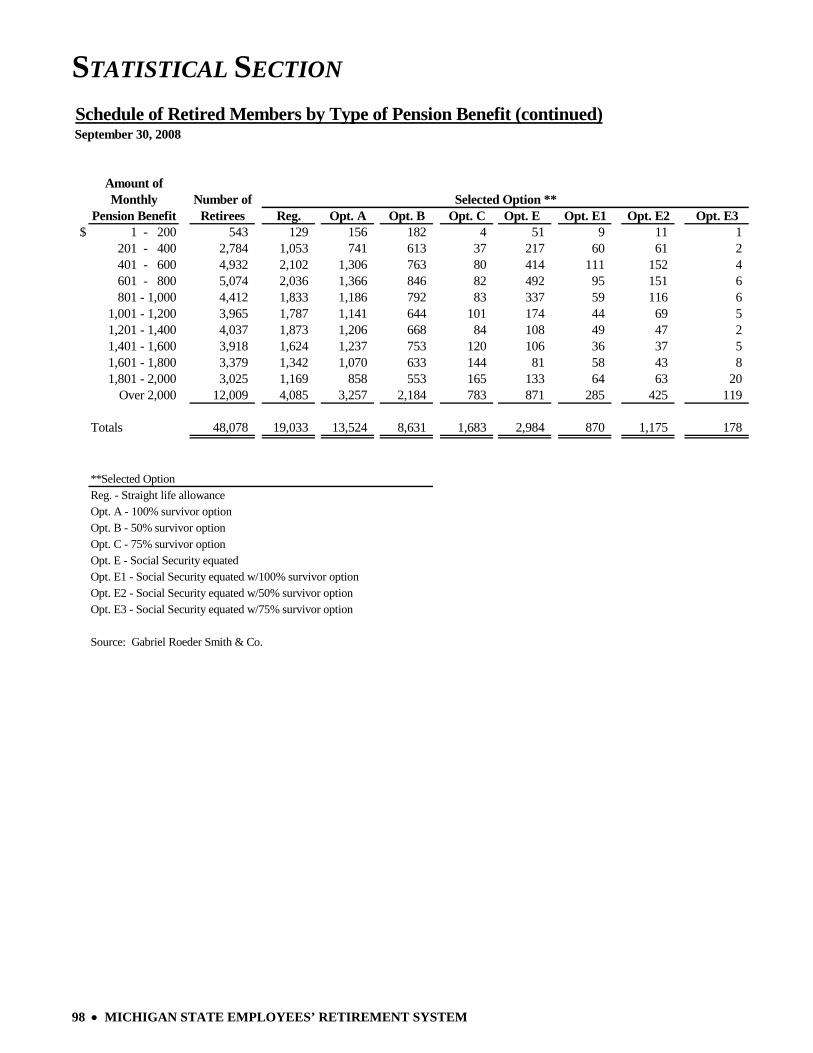
STATISTICAL SECTION
98 • MICHIGAN STATE EMPLOYEES’ RETIREMENT SYSTEM
Schedule of Retired Members by Type of Pension Benefit (continued)September 30, 2008
Amount ofMonthly Number of
Pension Benefit Retirees Reg. Opt. A Opt. B Opt. C Opt. E Opt. E1 Opt. E2 Opt. E3$ 1 - 200 543 129 156 182 4 51 9 11 1
201 - 400 2,784 1,053 741 613 37 217 60 61 2 401 - 600 4,932 2,102 1,306 763 80 414 111 152 4 601 - 800 5,074 2,036 1,366 846 82 492 95 151 6 801 - 1,000 4,412 1,833 1,186 792 83 337 59 116 6
1,001 - 1,200 3,965 1,787 1,141 644 101 174 44 69 5 1,201 - 1,400 4,037 1,873 1,206 668 84 108 49 47 2 1,401 - 1,600 3,918 1,624 1,237 753 120 106 36 37 5 1,601 - 1,800 3,379 1,342 1,070 633 144 81 58 43 8 1,801 - 2,000 3,025 1,169 858 553 165 133 64 63 20
Over 2,000 12,009 4,085 3,257 2,184 783 871 285 425 119
Totals 48,078 19,033 13,524 8,631 1,683 2,984 870 1,175 178
**Selected OptionReg. - Straight life allowanceOpt. A - 100% survivor optionOpt. B - 50% survivor optionOpt. C - 75% survivor optionOpt. E - Social Security equatedOpt. E1 - Social Security equated w/100% survivor optionOpt. E2 - Social Security equated w/50% survivor optionOpt. E3 - Social Security equated w/75% survivor option
Source: Gabriel Roeder Smith & Co.
Selected Option **

STATISTICAL SECTION
MICHIGAN STATE EMPLOYEES’ RETIREMENT SYSTEM • 99
Schedule of Retired Members by Type of Other Postemployment Benefit
Amount ofMonthly Eligible
Pension Benefit Retirees$ 1 - 200 543 341 337 337
201 - 400 2,784 2,044 1,984 2,019401 - 600 4,932 4,059 4,062 4,074601 - 800 5,074 4,388 4,352 4,370
801 - 1,000 4,412 3,933 3,928 3,9461,001 - 1,200 3,965 3,623 3,601 3,6121,201 - 1,400 4,037 3,726 3,720 3,7251,401 - 1,600 3,918 3,664 3,677 3,6771,601 - 1,800 3,379 3,151 3,159 3,1671,801 - 2,000 3,025 2,828 2,862 2,851
Over 2,000 12,009 11,199 11,309 11,313Totals 48,078 42,956 42,991 43,091
Source: Gabriel Roeder Smith & Co.
September 30, 2008
VisionDental Health
Type of Other Postemployment Benefits
Schedule of Other Postemployment BenefitsFor Years Ended September 30, 2009 and 2008
2009 2008Claims Health Insurance 288,555,075 275,108,533 Vision Insurance 2,951,172 2,835,477 Dental Insurance 29,261,053 28,148,101
Total Claims 320,767,300 306,092,111
Estimated Claims Liability Health Insurance 70,136,257 70,178,058 Vision Insurance 352,220 345,576 Dental Insurance 879,609 898,128
Total Estimated Claims Liability 71,368,086 71,421,762
Administrative Fees Health Insurance 18,986,817 17,533,658 Vision Insurance 472,258 458,113 Dental Insurance 1,437,589 1,401,894
Total Administrative Fees 20,896,664 19,393,665
Subtotal
Refunds 2,431 295 Transfers to Other Systems 35,000,768
Grand Total 413,034,481 431,908,601
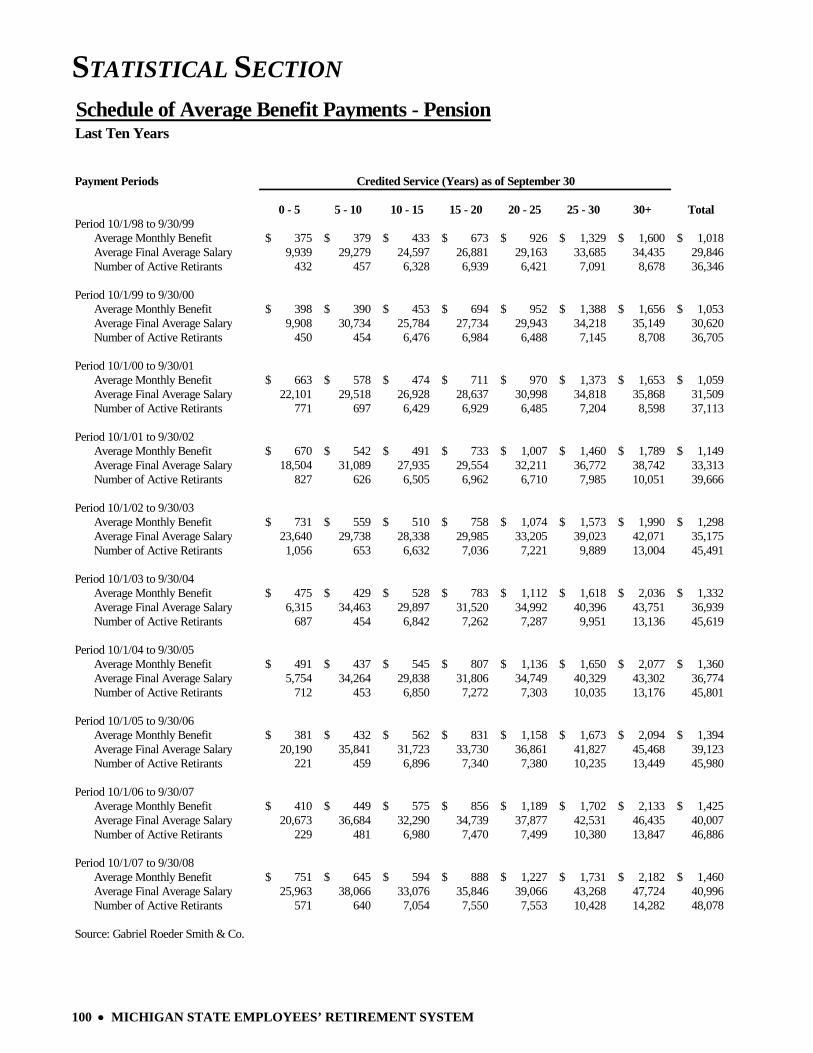
STATISTICAL SECTION
100 • MICHIGAN STATE EMPLOYEES’ RETIREMENT SYSTEM
Schedule of Average Benefit Payments - PensionLast Ten Years
Payment Periods
0 - 5 5 - 10 10 - 15 15 - 20 20 - 25 25 - 30 30+ TotalPeriod 10/1/98 to 9/30/99
Average Monthly Benefit 375$ 379$ 433$ 673$ 926$ 1,329$ 1,600$ 1,018$ Average Final Average Salary 9,939 29,279 24,597 26,881 29,163 33,685 34,435 29,846Number of Active Retirants 432 457 6,328 6,939 6,421 7,091 8,678 36,346
Period 10/1/99 to 9/30/00Average Monthly Benefit 398$ 390$ 453$ 694$ 952$ 1,388$ 1,656$ 1,053$ Average Final Average Salary 9,908 30,734 25,784 27,734 29,943 34,218 35,149 30,620 Number of Active Retirants 450 454 6,476 6,984 6,488 7,145 8,708 36,705
Period 10/1/00 to 9/30/01Average Monthly Benefit 663$ 578$ 474$ 711$ 970$ 1,373$ 1,653$ 1,059$ Average Final Average Salary 22,101 29,518 26,928 28,637 30,998 34,818 35,868 31,509 Number of Active Retirants 771 697 6,429 6,929 6,485 7,204 8,598 37,113
Period 10/1/01 to 9/30/02Average Monthly Benefit 670$ 542$ 491$ 733$ 1,007$ 1,460$ 1,789$ 1,149$ Average Final Average Salary 18,504 31,089 27,935 29,554 32,211 36,772 38,742 33,313 Number of Active Retirants 827 626 6,505 6,962 6,710 7,985 10,051 39,666
Period 10/1/02 to 9/30/03Average Monthly Benefit 731$ 559$ 510$ 758$ 1,074$ 1,573$ 1,990$ 1,298$ Average Final Average Salary 23,640 29,738 28,338 29,985 33,205 39,023 42,071 35,175 Number of Active Retirants 1,056 653 6,632 7,036 7,221 9,889 13,004 45,491
Period 10/1/03 to 9/30/04Average Monthly Benefit 475$ 429$ 528$ 783$ 1,112$ 1,618$ 2,036$ 1,332$ Average Final Average Salary 6,315 34,463 29,897 31,520 34,992 40,396 43,751 36,939 Number of Active Retirants 687 454 6,842 7,262 7,287 9,951 13,136 45,619
Period 10/1/04 to 9/30/05Average Monthly Benefit 491$ 437$ 545$ 807$ 1,136$ 1,650$ 2,077$ 1,360$ Average Final Average Salary 5,754 34,264 29,838 31,806 34,749 40,329 43,302 36,774 Number of Active Retirants 712 453 6,850 7,272 7,303 10,035 13,176 45,801
Period 10/1/05 to 9/30/06Average Monthly Benefit 381$ 432$ 562$ 831$ 1,158$ 1,673$ 2,094$ 1,394$ Average Final Average Salary 20,190 35,841 31,723 33,730 36,861 41,827 45,468 39,123 Number of Active Retirants 221 459 6,896 7,340 7,380 10,235 13,449 45,980
Period 10/1/06 to 9/30/07Average Monthly Benefit 410$ 449$ 575$ 856$ 1,189$ 1,702$ 2,133$ 1,425$ Average Final Average Salary 20,673 36,684 32,290 34,739 37,877 42,531 46,435 40,007 Number of Active Retirants 229 481 6,980 7,470 7,499 10,380 13,847 46,886
Period 10/1/07 to 9/30/08Average Monthly Benefit 751$ 645$ 594$ 888$ 1,227$ 1,731$ 2,182$ 1,460$ Average Final Average Salary 25,963 38,066 33,076 35,846 39,066 43,268 47,724 40,996 Number of Active Retirants 571 640 7,054 7,550 7,553 10,428 14,282 48,078
Source: Gabriel Roeder Smith & Co.
Credited Service (Years) as of September 30

STATISTICAL SECTION
MICHIGAN STATE EMPLOYEES’ RETIREMENT SYSTEM • 101
Schedule of Average Benefit Payments - Health
Payment Periods
0 - 5 5 - 10 10 - 15 15 - 20 20 - 25 25 - 30 30+ Total
Period 10/1/04 to 9/30/05Average Monthly Benefit 303$ 447$ 568$ 837$ 1,169$ 1,665$ 2,097$ 1,403$ Average Final Average Salary 24,519 32,338 31,463 33,062 36,386 41,099 44,724 38,580 Number of Active Retirants 139 625 5,807 6,476 6,787 9,409 12,064 41,307*
Period 10/1/05 to 9/30/06Average Monthly Benefit 337$ 446$ 582$ 851$ 1,190$ 1,693$ 2,127$ 1,427$ Average Final Average Salary 25,056 32,732 32,188 34,003 37,149 41,689 45,360 39,296 Number of Active Retirants 136 623 5,812 6,510 6,805 9,469 12,158 41,513
Period 10/1/06 to 9/30/07Average Monthly Benefit 362$ 464$ 596$ 879$ 1,220$ 1,723$ 2,167$ 1,462$ Average Final Average Salary 25,607 33,691 32,779 35,044 38,135 42,355 46,304 40,186 Number of Active Retirants 137 625 5,833 6,568 6,892 9,574 12,491 42,120
Period 10/1/07 to 9/30/08Average Monthly Benefit 836$ 622$ 618$ 912$ 1,258$ 1,752$ 2,218$ 1,502$ Average Final Average Salary 29,453 35,651 33,645 36,130 39,275 43,094 47,598 41,221 Number of Active Retirants 423 730 5,821 6,572 6,933 9,596 12,881 42,956
Last Four Years
Credited Service (Years) as of September 30
Source: Gabriel Roeder Smith & Co. - for all periods except 10/1/04 to 9/30/05
*Participating member totals displayed in this schedule and the information presented in Note 1 of this report may differ. These variances are the result of a mid-year data conversion.
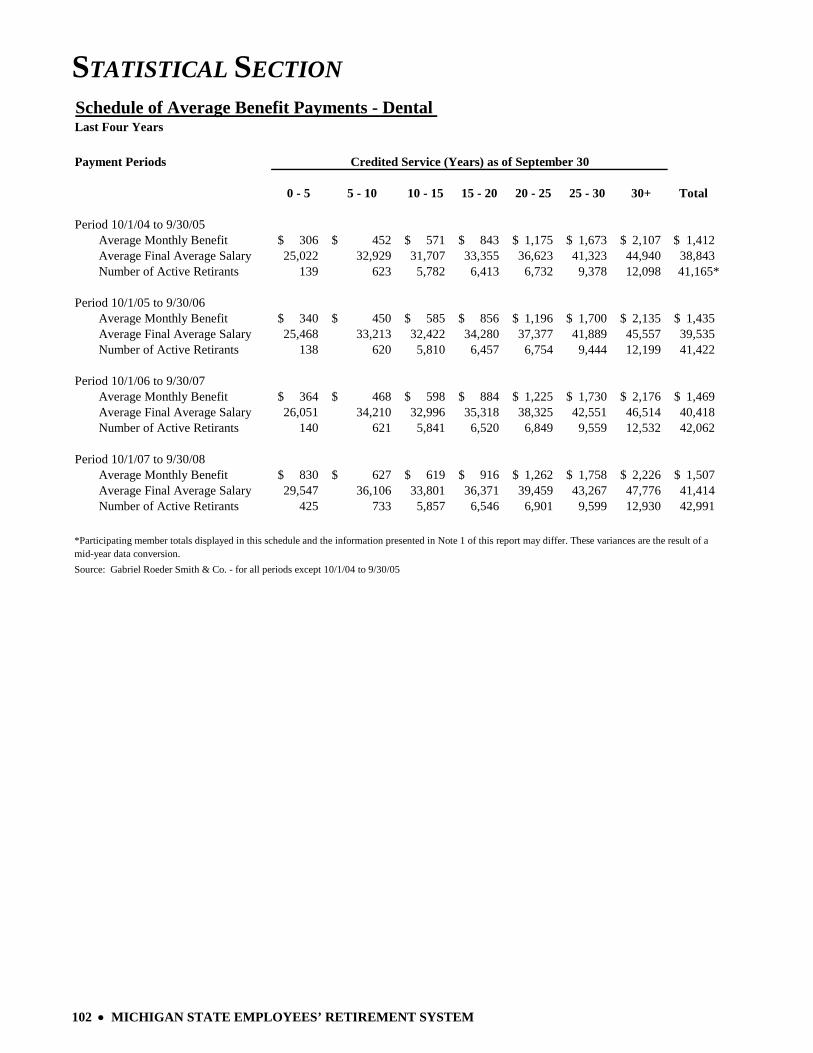
STATISTICAL SECTION
102 • MICHIGAN STATE EMPLOYEES’ RETIREMENT SYSTEM
Schedule of Average Benefit Payments - Dental
Payment Periods
0 - 5 5 - 10 10 - 15 15 - 20 20 - 25 25 - 30 30+ Total
Period 10/1/04 to 9/30/05Average Monthly Benefit 306$ 452$ 571$ 843$ 1,175$ 1,673$ 2,107$ 1,412$ Average Final Average Salary 25,022 32,929 31,707 33,355 36,623 41,323 44,940 38,843Number of Active Retirants 139 623 5,782 6,413 6,732 9,378 12,098 41,165*
Period 10/1/05 to 9/30/06Average Monthly Benefit 340$ 450$ 585$ 856$ 1,196$ 1,700$ 2,135$ 1,435$ Average Final Average Salary 25,468 33,213 32,422 34,280 37,377 41,889 45,557 39,535Number of Active Retirants 138 620 5,810 6,457 6,754 9,444 12,199 41,422
Period 10/1/06 to 9/30/07Average Monthly Benefit 364$ 468$ 598$ 884$ 1,225$ 1,730$ 2,176$ 1,469$ Average Final Average Salary 26,051 34,210 32,996 35,318 38,325 42,551 46,514 40,418 Number of Active Retirants 140 621 5,841 6,520 6,849 9,559 12,532 42,062
Period 10/1/07 to 9/30/08Average Monthly Benefit 830$ 627$ 619$ 916$ 1,262$ 1,758$ 2,226$ 1,507$ Average Final Average Salary 29,547 36,106 33,801 36,371 39,459 43,267 47,776 41,414 Number of Active Retirants 425 733 5,857 6,546 6,901 9,599 12,930 42,991
*Participating member totals displayed in this schedule and the information presented in Note 1 of this report may differ. These variances are the result of a mid-year data conversion.
Credited Service (Years) as of September 30
Last Four Years
Source: Gabriel Roeder Smith & Co. - for all periods except 10/1/04 to 9/30/05
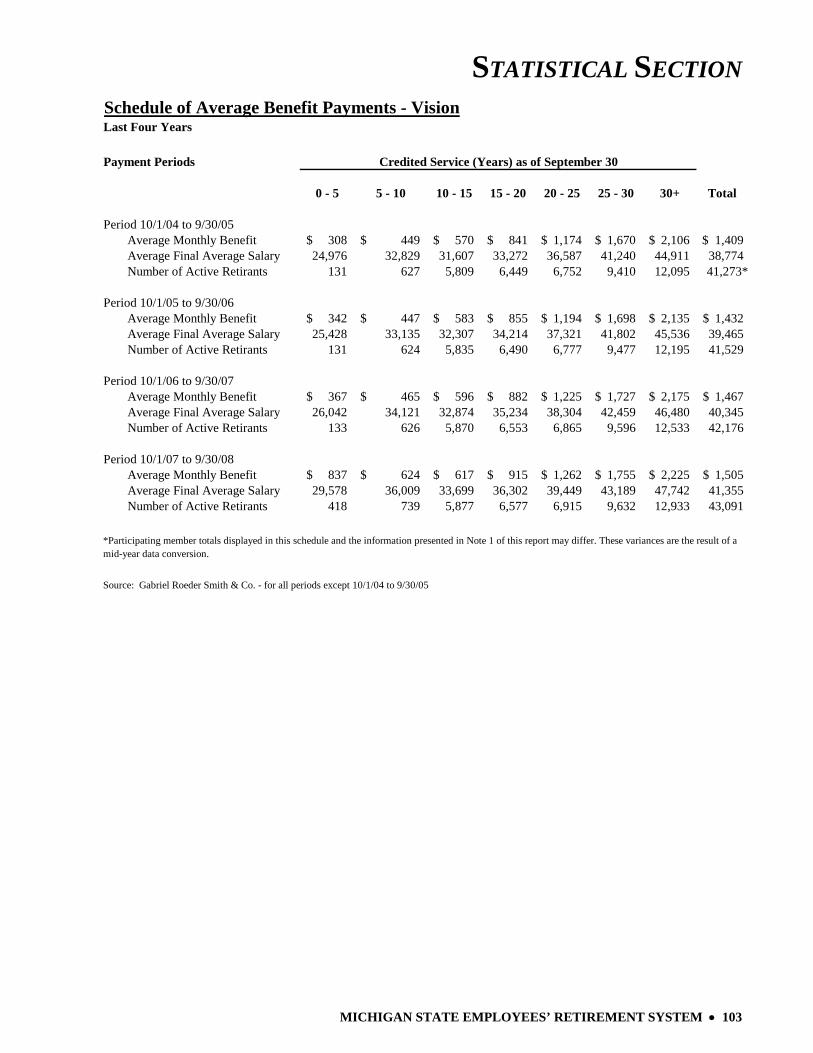
STATISTICAL SECTION
MICHIGAN STATE EMPLOYEES’ RETIREMENT SYSTEM • 103
Schedule of Average Benefit Payments - Vision
Payment Periods
0 - 5 5 - 10 10 - 15 15 - 20 20 - 25 25 - 30 30+ Total
Period 10/1/04 to 9/30/05Average Monthly Benefit 308$ 449$ 570$ 841$ 1,174$ 1,670$ 2,106$ 1,409$ Average Final Average Salary 24,976 32,829 31,607 33,272 36,587 41,240 44,911 38,774Number of Active Retirants 131 627 5,809 6,449 6,752 9,410 12,095 41,273*
Period 10/1/05 to 9/30/06Average Monthly Benefit 342$ 447$ 583$ 855$ 1,194$ 1,698$ 2,135$ 1,432$ Average Final Average Salary 25,428 33,135 32,307 34,214 37,321 41,802 45,536 39,465Number of Active Retirants 131 624 5,835 6,490 6,777 9,477 12,195 41,529
Period 10/1/06 to 9/30/07Average Monthly Benefit 367$ 465$ 596$ 882$ 1,225$ 1,727$ 2,175$ 1,467$ Average Final Average Salary 26,042 34,121 32,874 35,234 38,304 42,459 46,480 40,345Number of Active Retirants 133 626 5,870 6,553 6,865 9,596 12,533 42,176
Period 10/1/07 to 9/30/08Average Monthly Benefit 837$ 624$ 617$ 915$ 1,262$ 1,755$ 2,225$ 1,505$ Average Final Average Salary 29,578 36,009 33,699 36,302 39,449 43,189 47,742 41,355Number of Active Retirants 418 739 5,877 6,577 6,915 9,632 12,933 43,091
*Participating member totals displayed in this schedule and the information presented in Note 1 of this report may differ. These variances are the result of a mid-year data conversion.
Credited Service (Years) as of September 30
Source: Gabriel Roeder Smith & Co. - for all periods except 10/1/04 to 9/30/05
Last Four Years
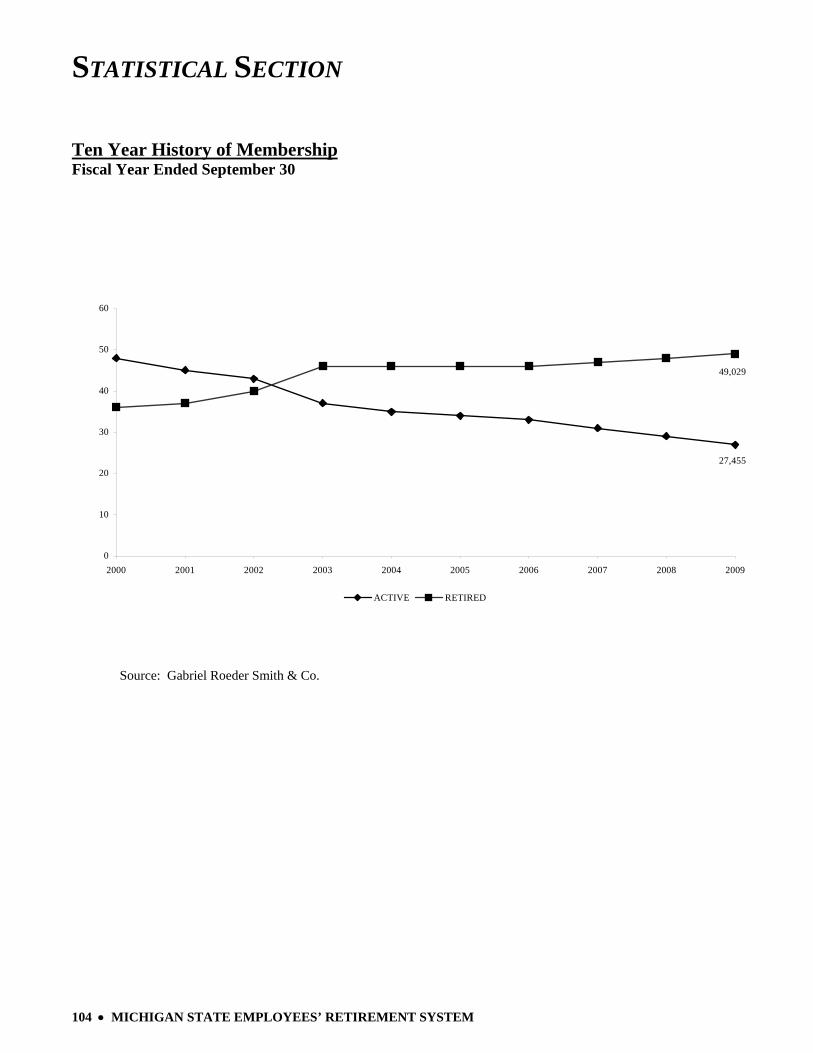
STATISTICAL SECTION
104 • MICHIGAN STATE EMPLOYEES’ RETIREMENT SYSTEM
Ten Year History of Membership Fiscal Year Ended September 30
27,455
49,029
0
10
20
30
40
50
60
2000 2001 2002 2003 2004 2005 2006 2007 2008 2009
ACTIVE RETIRED
Source: Gabriel Roeder Smith & Co.

MICHIGAN STATE EMPLOYEES’ RETIREMENT SYSTEM • 105
ACKNOWLEDGMENTS The Michigan State Employees’ Retirement System Comprehensive Annual Financial Report is prepared by Financial Services, Fiscal Management Division. Staff of the division for the fiscal year 2008-2009 report included: Management: Ronald W. Foss, Director Cindy Peters, Accounting Manager Accountants: Randy Bitner Dan Harry Erik Simmer Paula Webb Julie Zolnai Technical and Support Staff: Patricia Jorae Jamin Schroeder Marilyn Williams Special thanks are also extended to the Office of Retirement Services personnel, accounting and support personnel throughout Financial Services, Investments Division of Treasury, Office of the Auditor General, Andrews Hooper & Pavlik P.L.C., Gabriel Roeder Smith & Co., and the staff at the Office of Financial Management. Preparation of this report would not have been possible without the efforts of these individuals. The report may be viewed on-line at: www.michigan.gov/ors