coty turnaround plan - s23.q4cdn.com€¦ · sku rationalization. operational leadership ......
TRANSCRIPT

COTYTURNAROUND PLAN
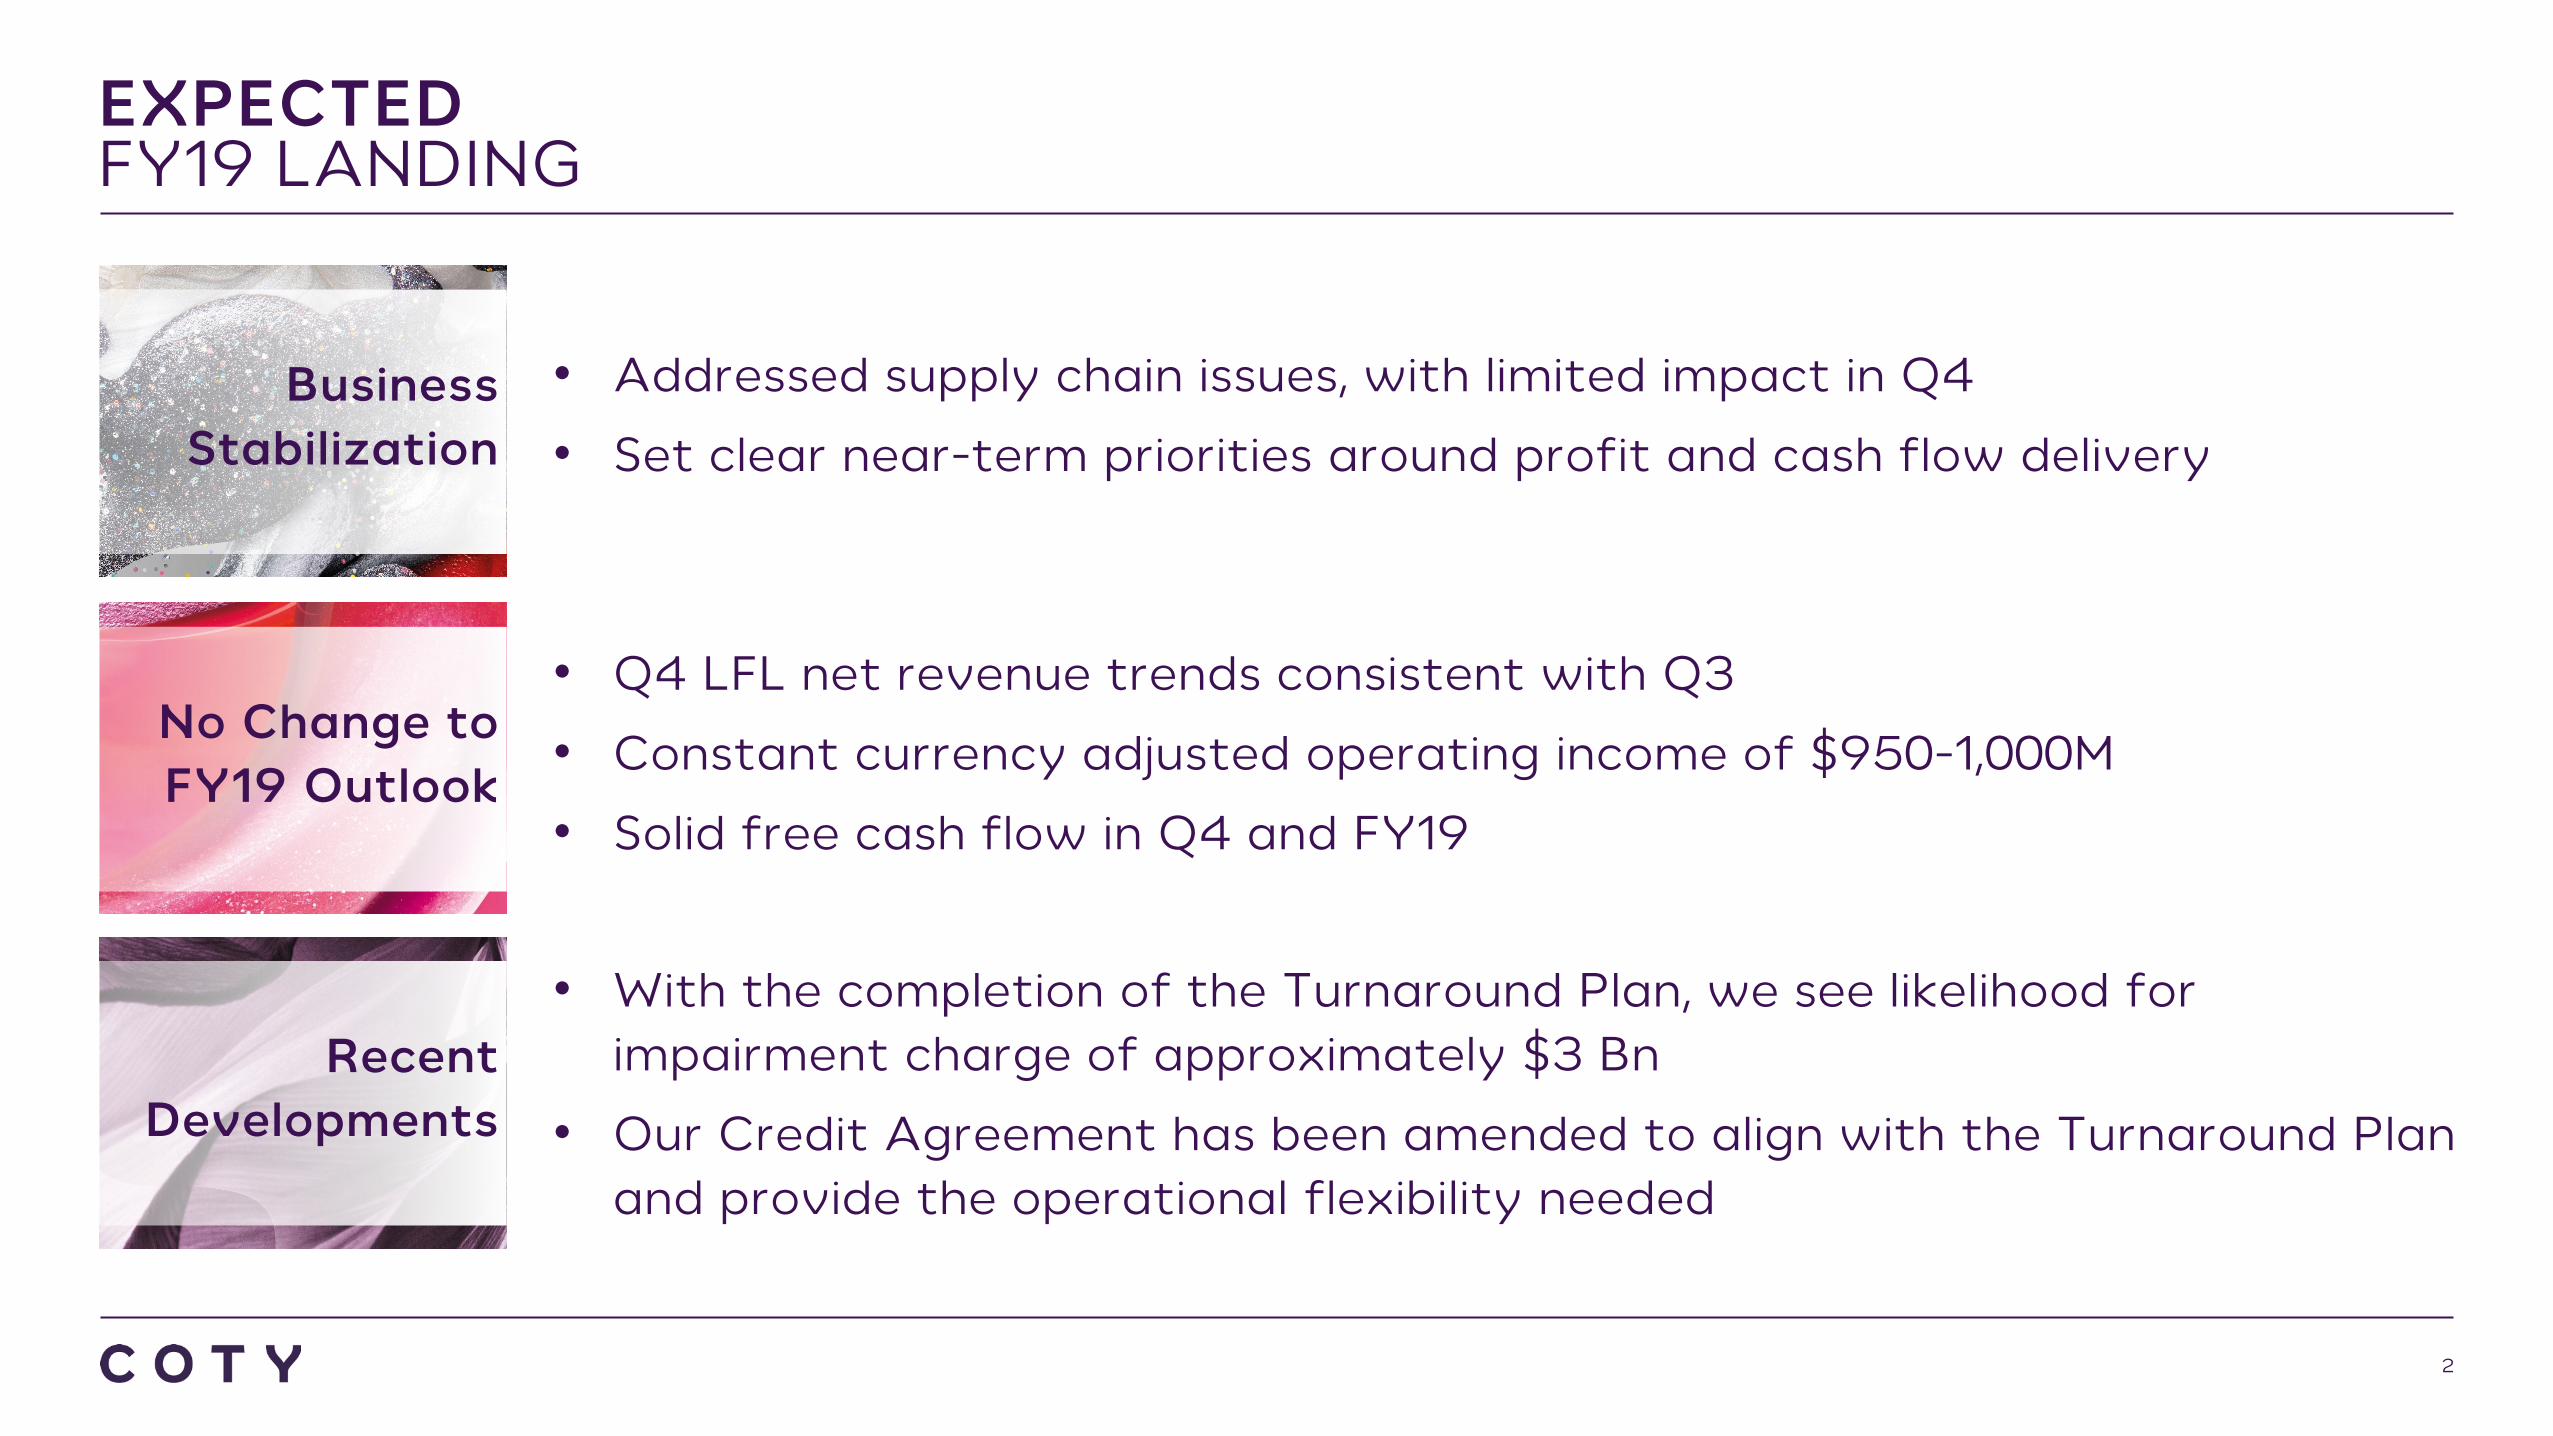
EXPECTEDFY19 LANDING
2
• Addressed supply chain issues, with limited impact in Q4
• Set clear near-term priorities around profit and cash flow delivery
• Q4 LFL net revenue trends consistent with Q3
• Constant currency adjusted operating income of $950-1,000M
• Solid free cash flow in Q4 and FY19
• With the completion of the Turnaround Plan, we see likelihood for impairment charge of approximately $3 Bn
• Our Credit Agreement has been amended to align with the Turnaround Plan and provide the operational flexibility needed
Business Stabilization
No Change to FY19 Outlook
Recent Developments
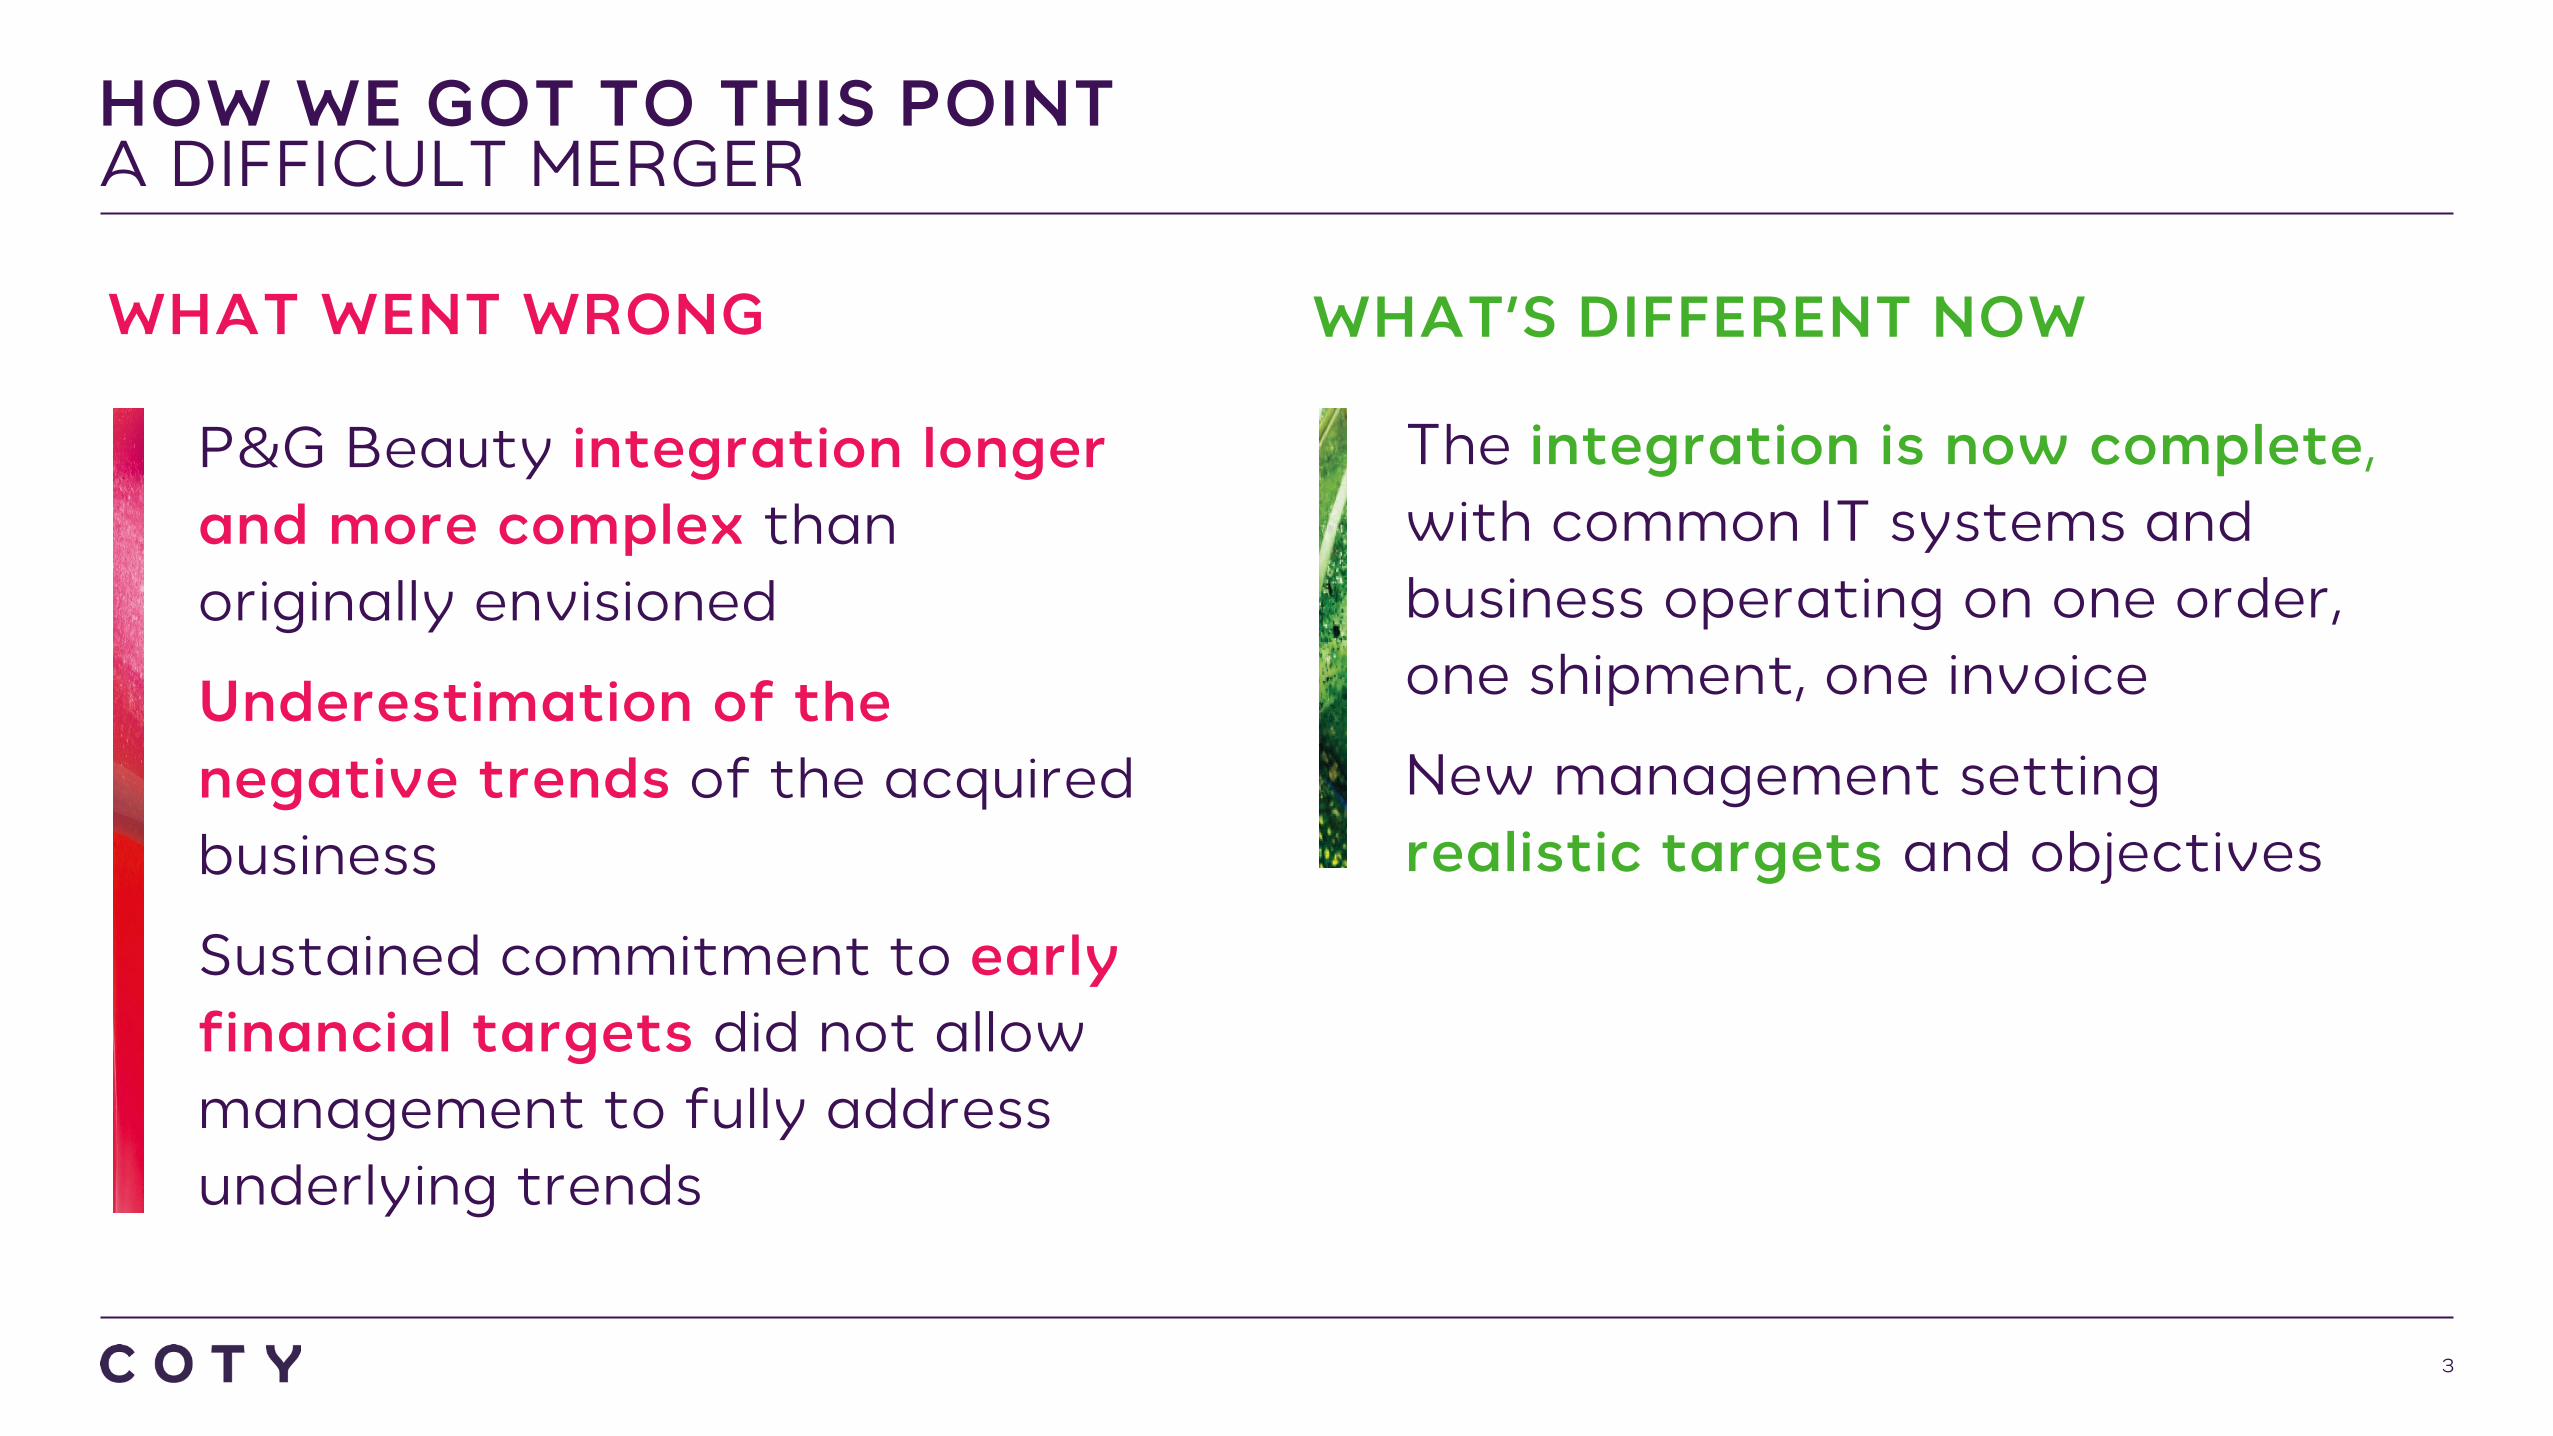
HOW WE GOT TO THIS POINTA DIFFICULT MERGER
3
WHAT WENT WRONG WHAT’S DIFFERENT NOW
P&G Beauty integration longer and more complex than originally envisioned
Underestimation of the negative trends of the acquired business
Sustained commitment to early financial targets did not allow management to fully address underlying trends
The integration is now complete, with common IT systems and business operating on one order, one shipment, one invoice
New management setting realistic targets and objectives
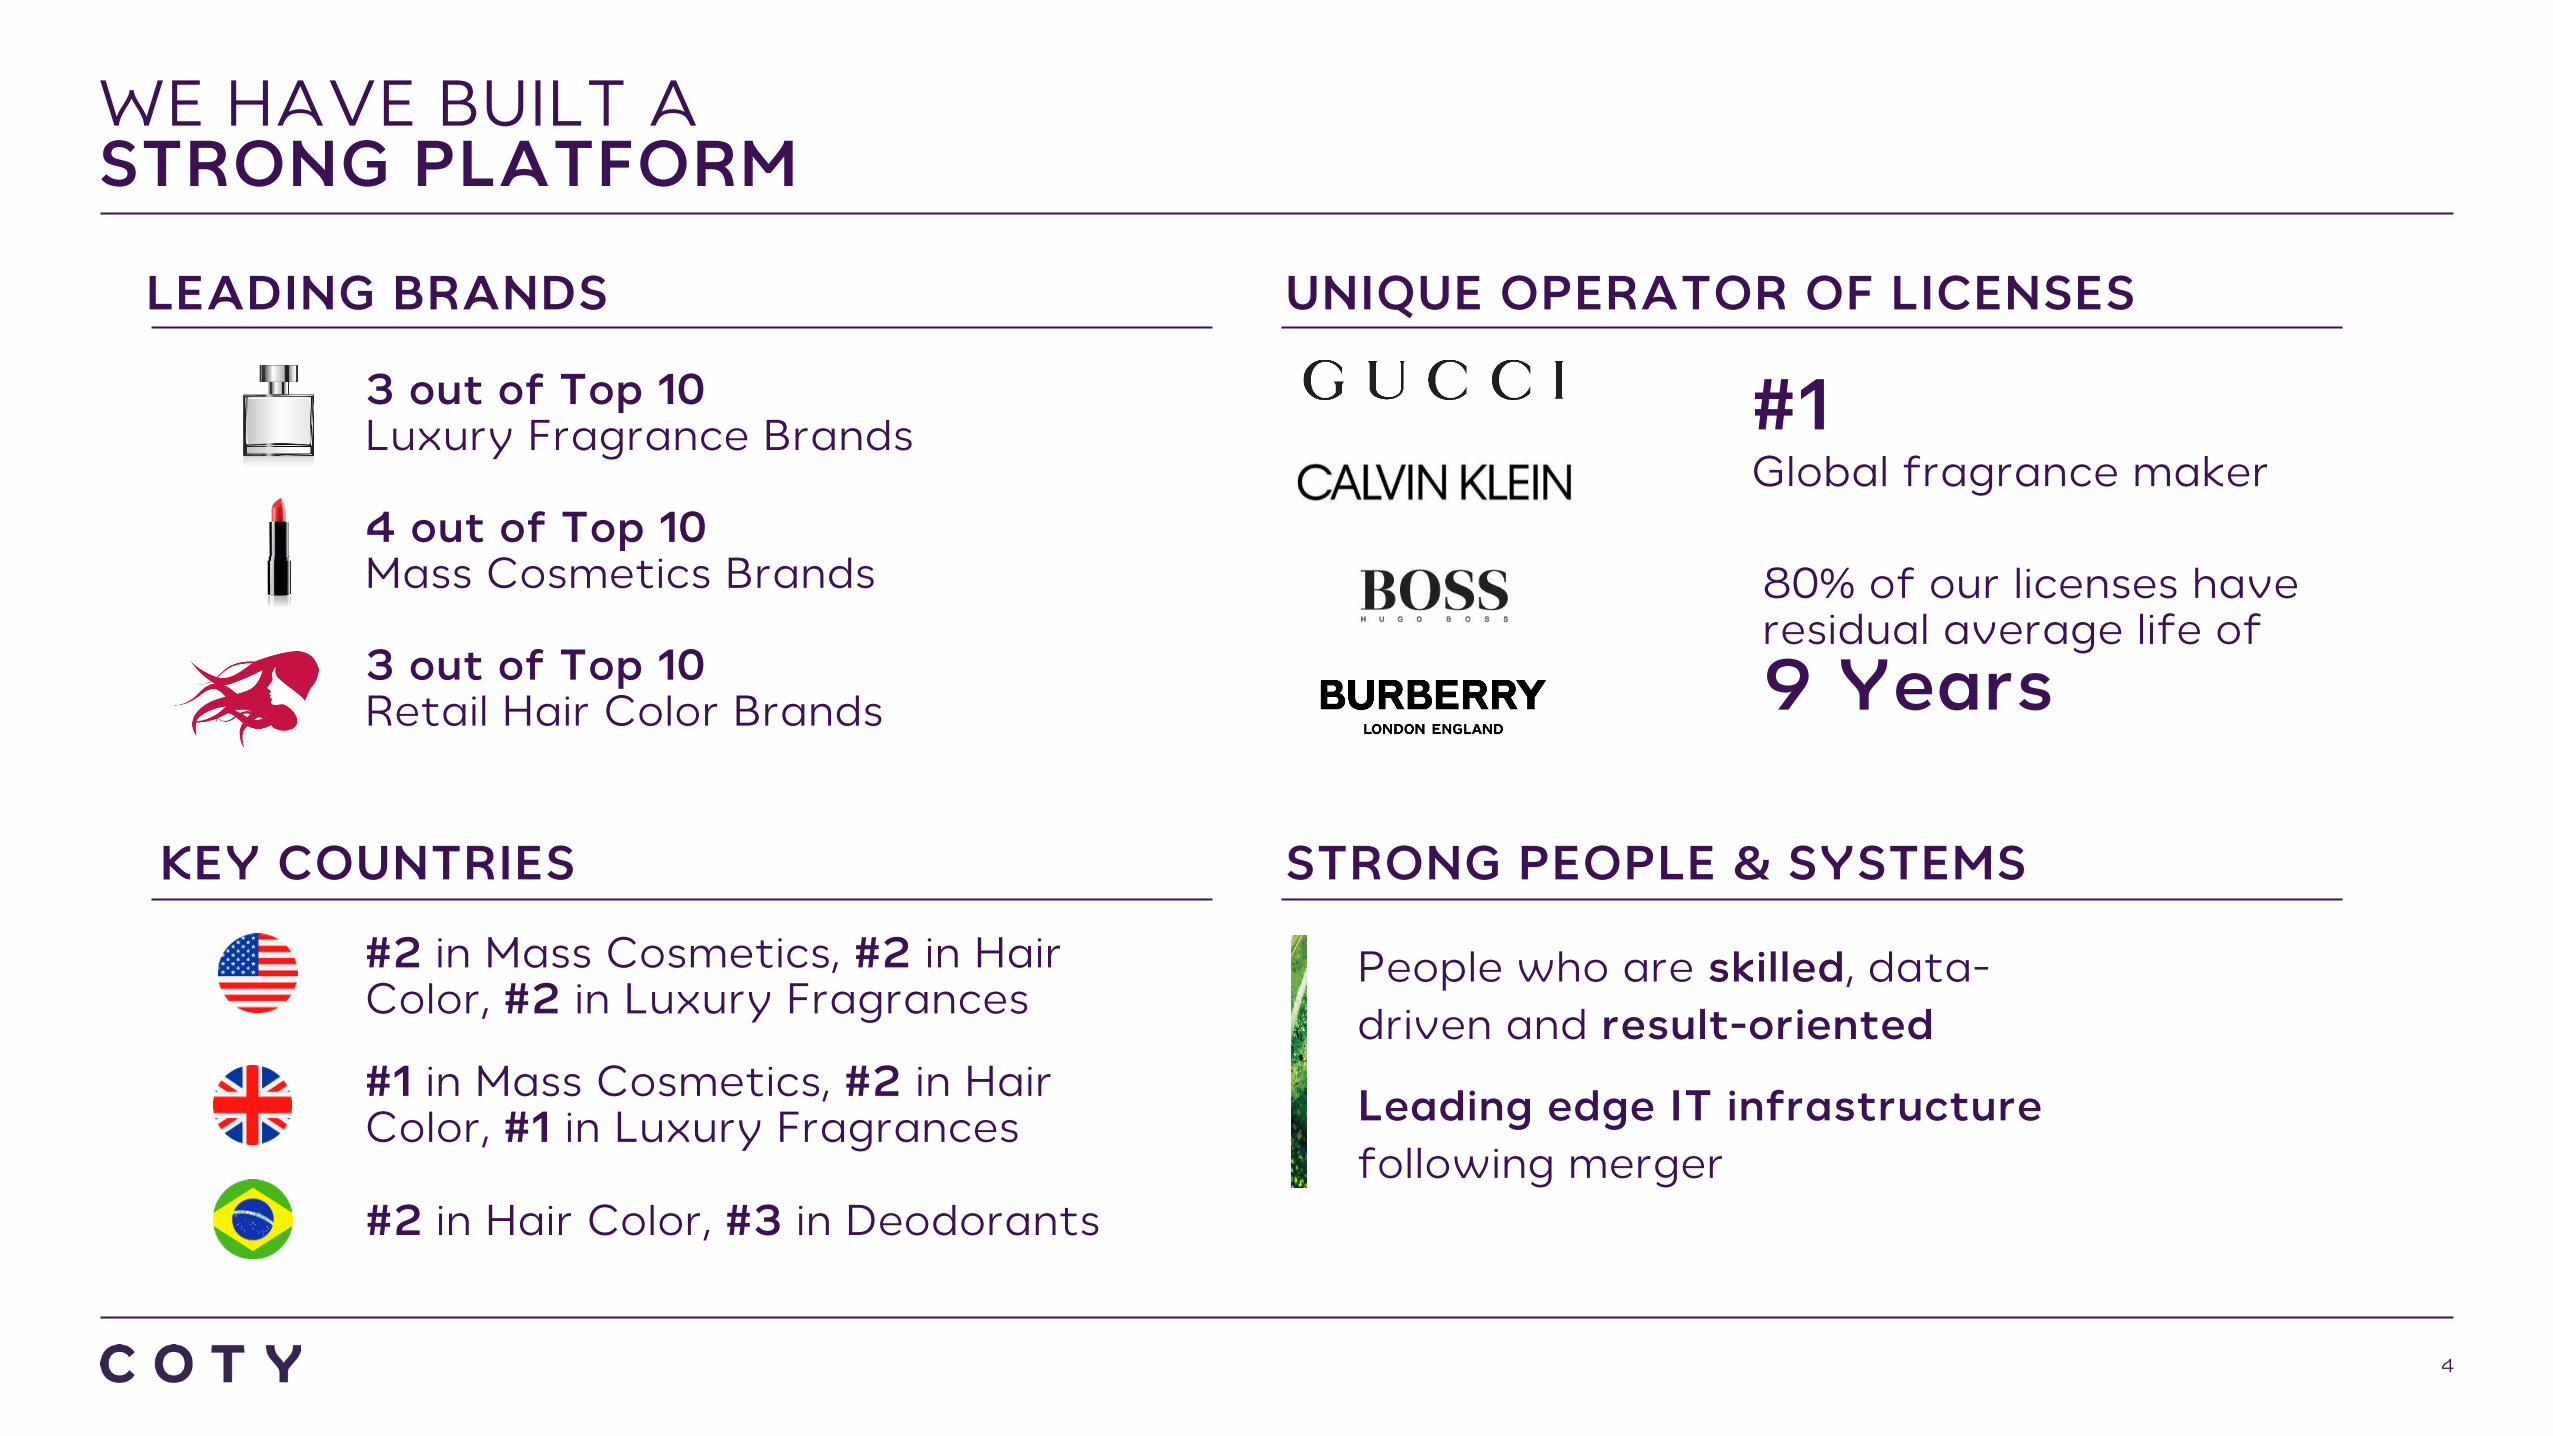
WE HAVE BUILT ASTRONG PLATFORM
4
LEADING BRANDS
KEY COUNTRIES
UNIQUE OPERATOR OF LICENSES
STRONG PEOPLE & SYSTEMS
People who are skilled, data-driven and result-oriented
Leading edge IT infrastructure following merger
#1Global fragrance maker
80% of our licenses have residual average life of9 Years
3 out of Top 10Luxury Fragrance Brands
4 out of Top 10Mass Cosmetics Brands
3 out of Top 10Retail Hair Color Brands
#2 in Mass Cosmetics, #2 in Hair Color, #2 in Luxury Fragrances
#1 in Mass Cosmetics, #2 in Hair Color, #1 in Luxury Fragrances
#2 in Hair Color, #3 in Deodorants

~60% OF THE BUSINESSON STRONG FOOTING
5
• Portfolio of leading luxury brands has grown inline with the category in the last 2 years
• Substantial opportunities ahead through scaled presence in existing markets and further geographic, channel and category expansion
LUXURY
• Attractive industry structure
• Opportunities to expand penetration through digital and e-commerce
• #1 brand in salon hair color and #1 brand in salon nail
PROFESSIONAL BEAUTY
1.9%
5.2%4.1%
-1.1%
6.0%
4.4%
FY17 FY18 YTD FY19 (March)
Global Luxury Fragrances Coty Luxury Net Revenues
0.1%
1.1% 1.0%
2.0% 1.8%2.1%
-2.6%
-0.8% -0.6%
Impacted by Supply Chain
disruption
PB LFL Net Revenues
Q3 Q4
FY17
Q1 Q2 Q3 Q4
FY18
Q1 Q2 Q3
FY19
Source: NPD, Euromonitor, Coty estimatesGlobal Luxury fragrance category trends for FY17/FY18 correspond to CY16/CY17 data, respectively.
Coty Luxury vs. Luxury Fragrance Trends
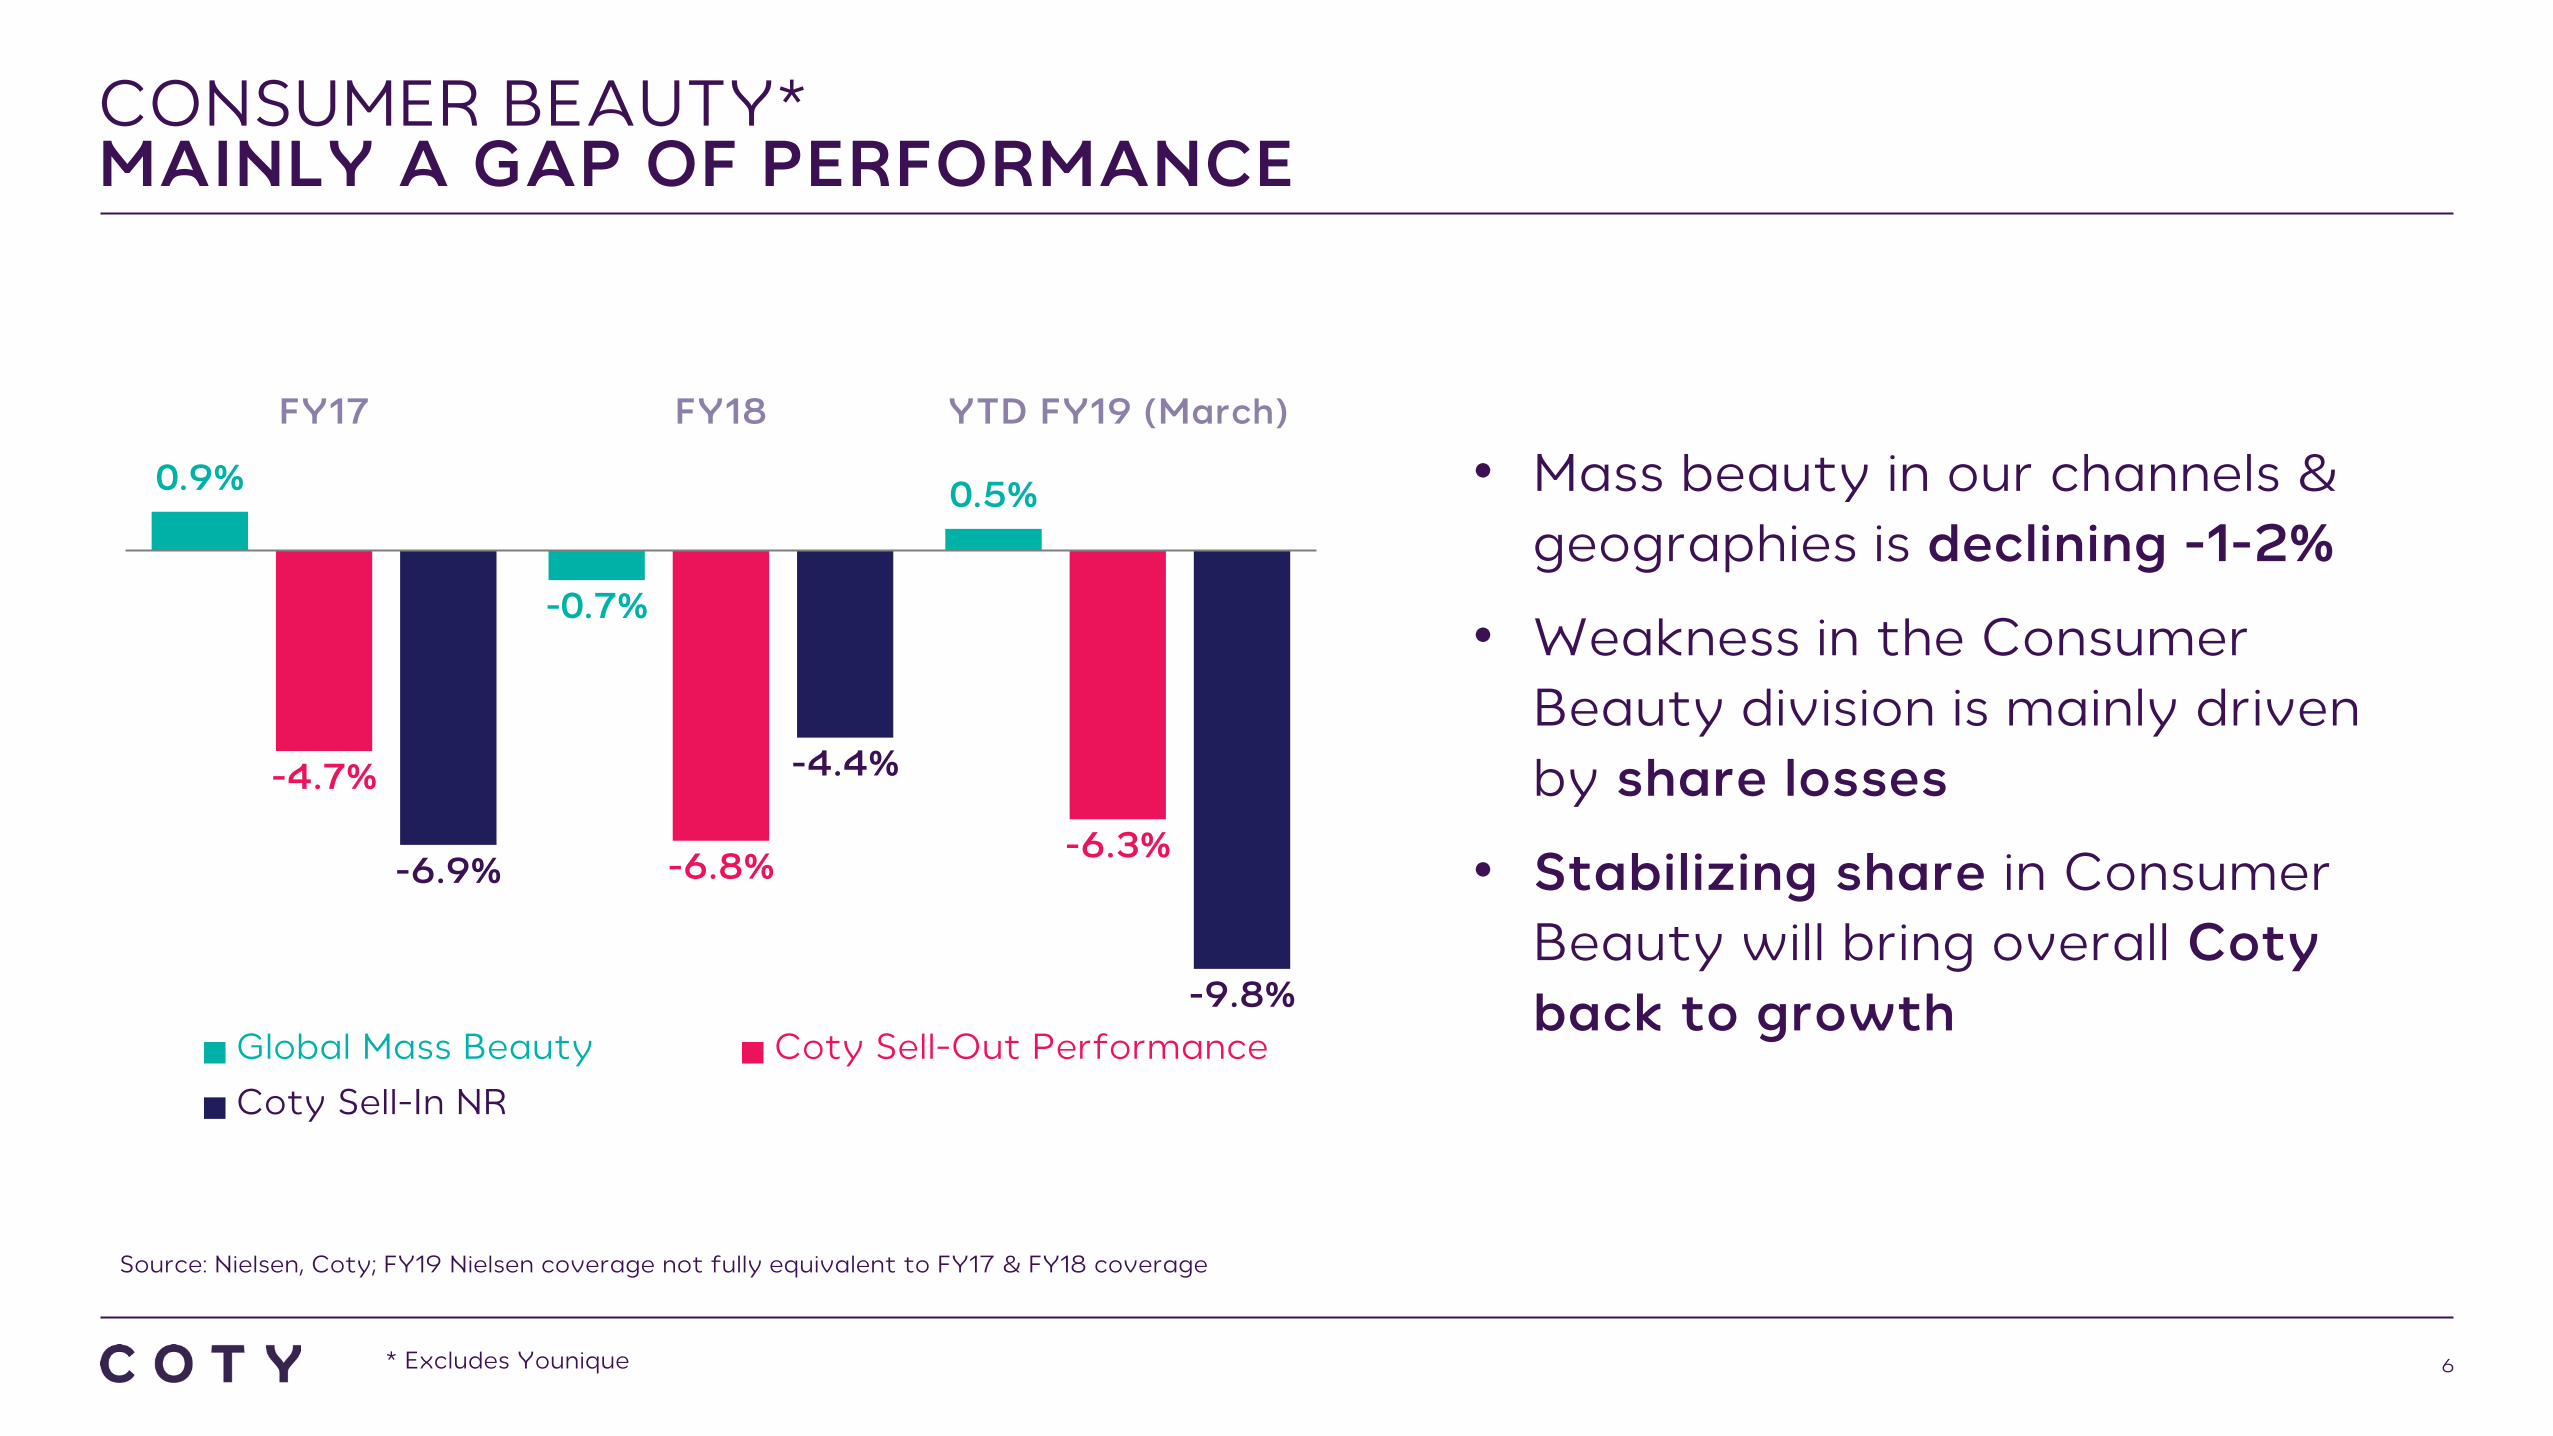
CONSUMER BEAUTY*MAINLY A GAP OF PERFORMANCE
6
0.9%
-0.7%
0.5%
-4.7%
-6.8% -6.3%-6.9%
-4.4%
-9.8%
FY17 FY18 YTD FY19 (March)
Global Mass Beauty Coty Sell-Out PerformanceCoty Sell-In NR
• Mass beauty in our channels & geographies is declining -1-2%
• Weakness in the Consumer Beauty division is mainly driven by share losses
• Stabilizing share in Consumer Beauty will bring overall Coty back to growth
Source: Nielsen, Coty; FY19 Nielsen coverage not fully equivalent to FY17 & FY18 coverage
* Excludes Younique

THREE PILLARSOF OUR TURNAROUND PLAN
7
These three pillars are focused on driving substantial improvement in Consumer Beauty while also further optimizing Luxury and Professional Beauty
REDISCOVERGROWTH
REGAIN OPERATIONAL LEADERSHIP
BUILD A CULTURE OF
PRIDE AND PERFORMANCE
REDISCOVER GROWTH
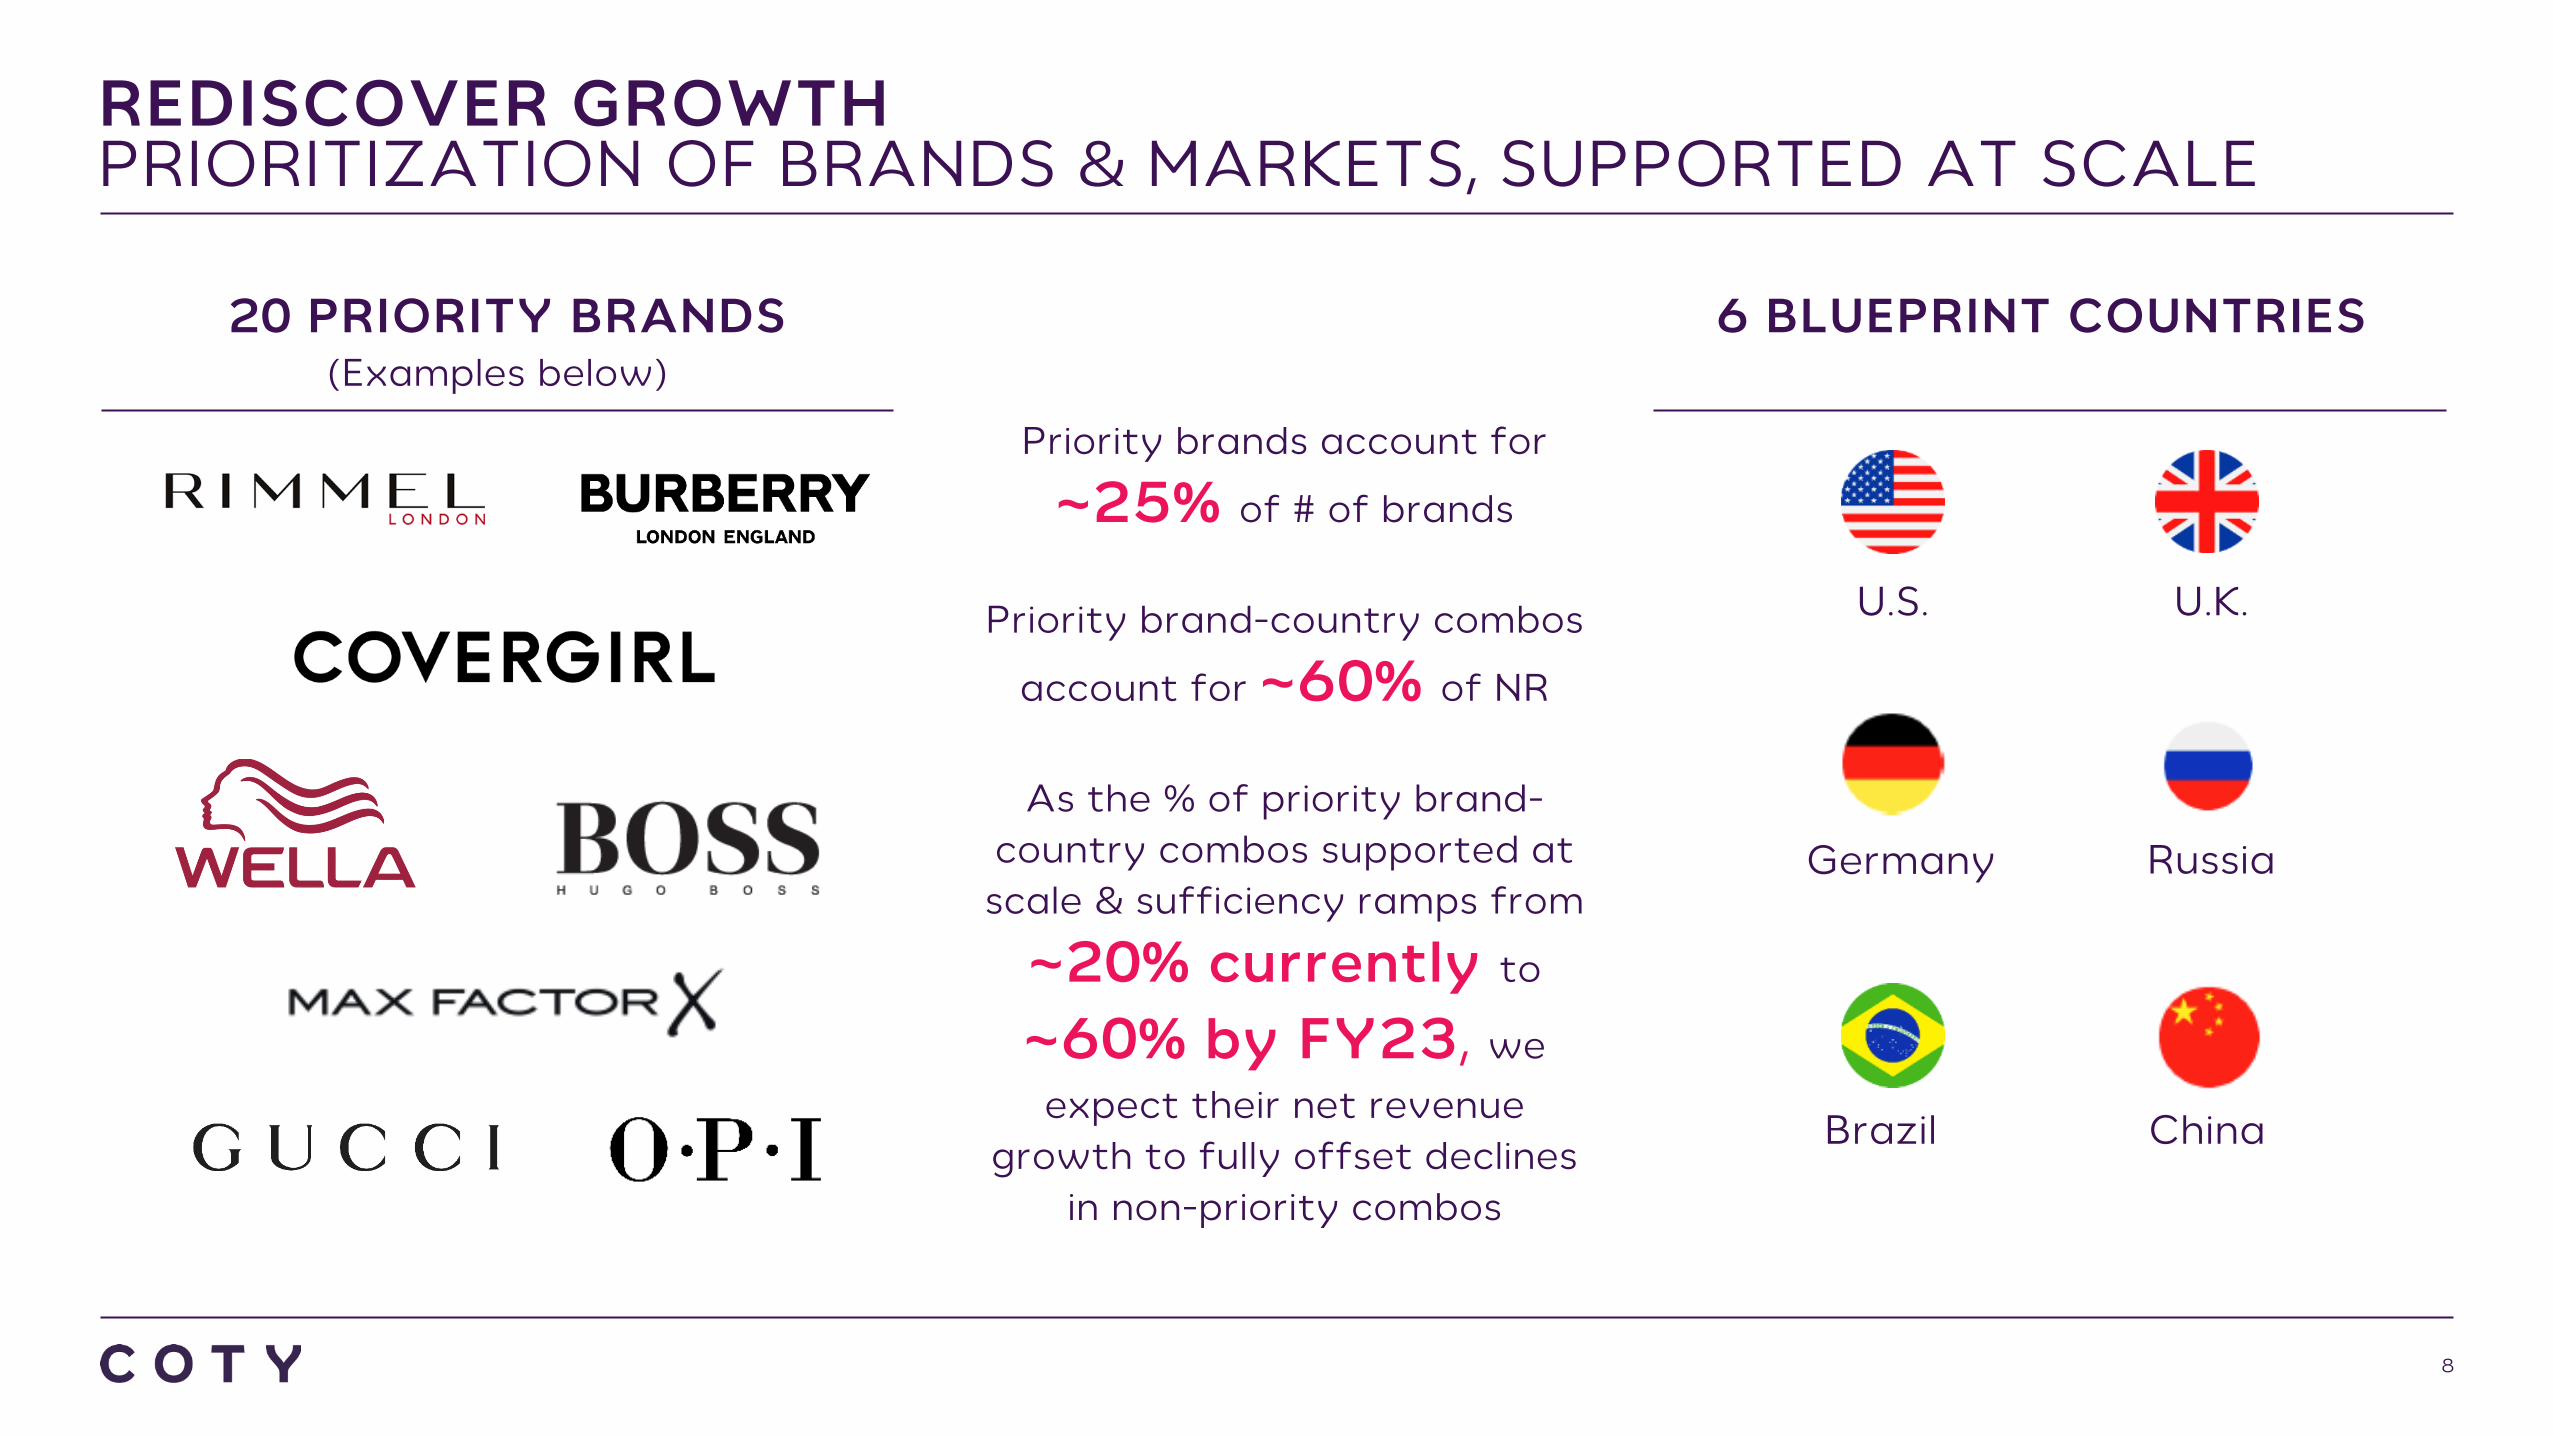
REDISCOVER GROWTHPRIORITIZATION OF BRANDS & MARKETS, SUPPORTED AT SCALE
8
Priority brands account for
~25% of # of brands
Priority brand-country combos
account for ~60% of NR
As the % of priority brand-country combos supported at scale & sufficiency ramps from
~20% currently to
~60% by FY23, we expect their net revenue
growth to fully offset declines in non-priority combos
20 PRIORITY BRANDS(Examples below)
6 BLUEPRINT COUNTRIES
U.K.U.S.
Germany Russia
ChinaBrazil

REDISCOVER GROWTHIMPROVING PORTFOLIO STRUCTURE AND OPTIMIZING ASSORTMENT
9
Data-driven analysis shows clear opportunities for improved portfolio structure and optimized product assortment, as findings show:
1. The premium tier of mass beauty continues to grow
2. As we shift focus from driving higher sales to driving better sales in the upper tiers of the category, this will create more value
3. We can significantly improve shelf productivity by simplifying and optimizing our assortment
-17%
-4%
5%
-1%
11% 11%
Mass Cosmetics Trend by Price Tier(2-Year CAGR*)
Value Mainstream Premium
Source: Nielsen, Kantar* 2-Year CAGR: CY16-CY18
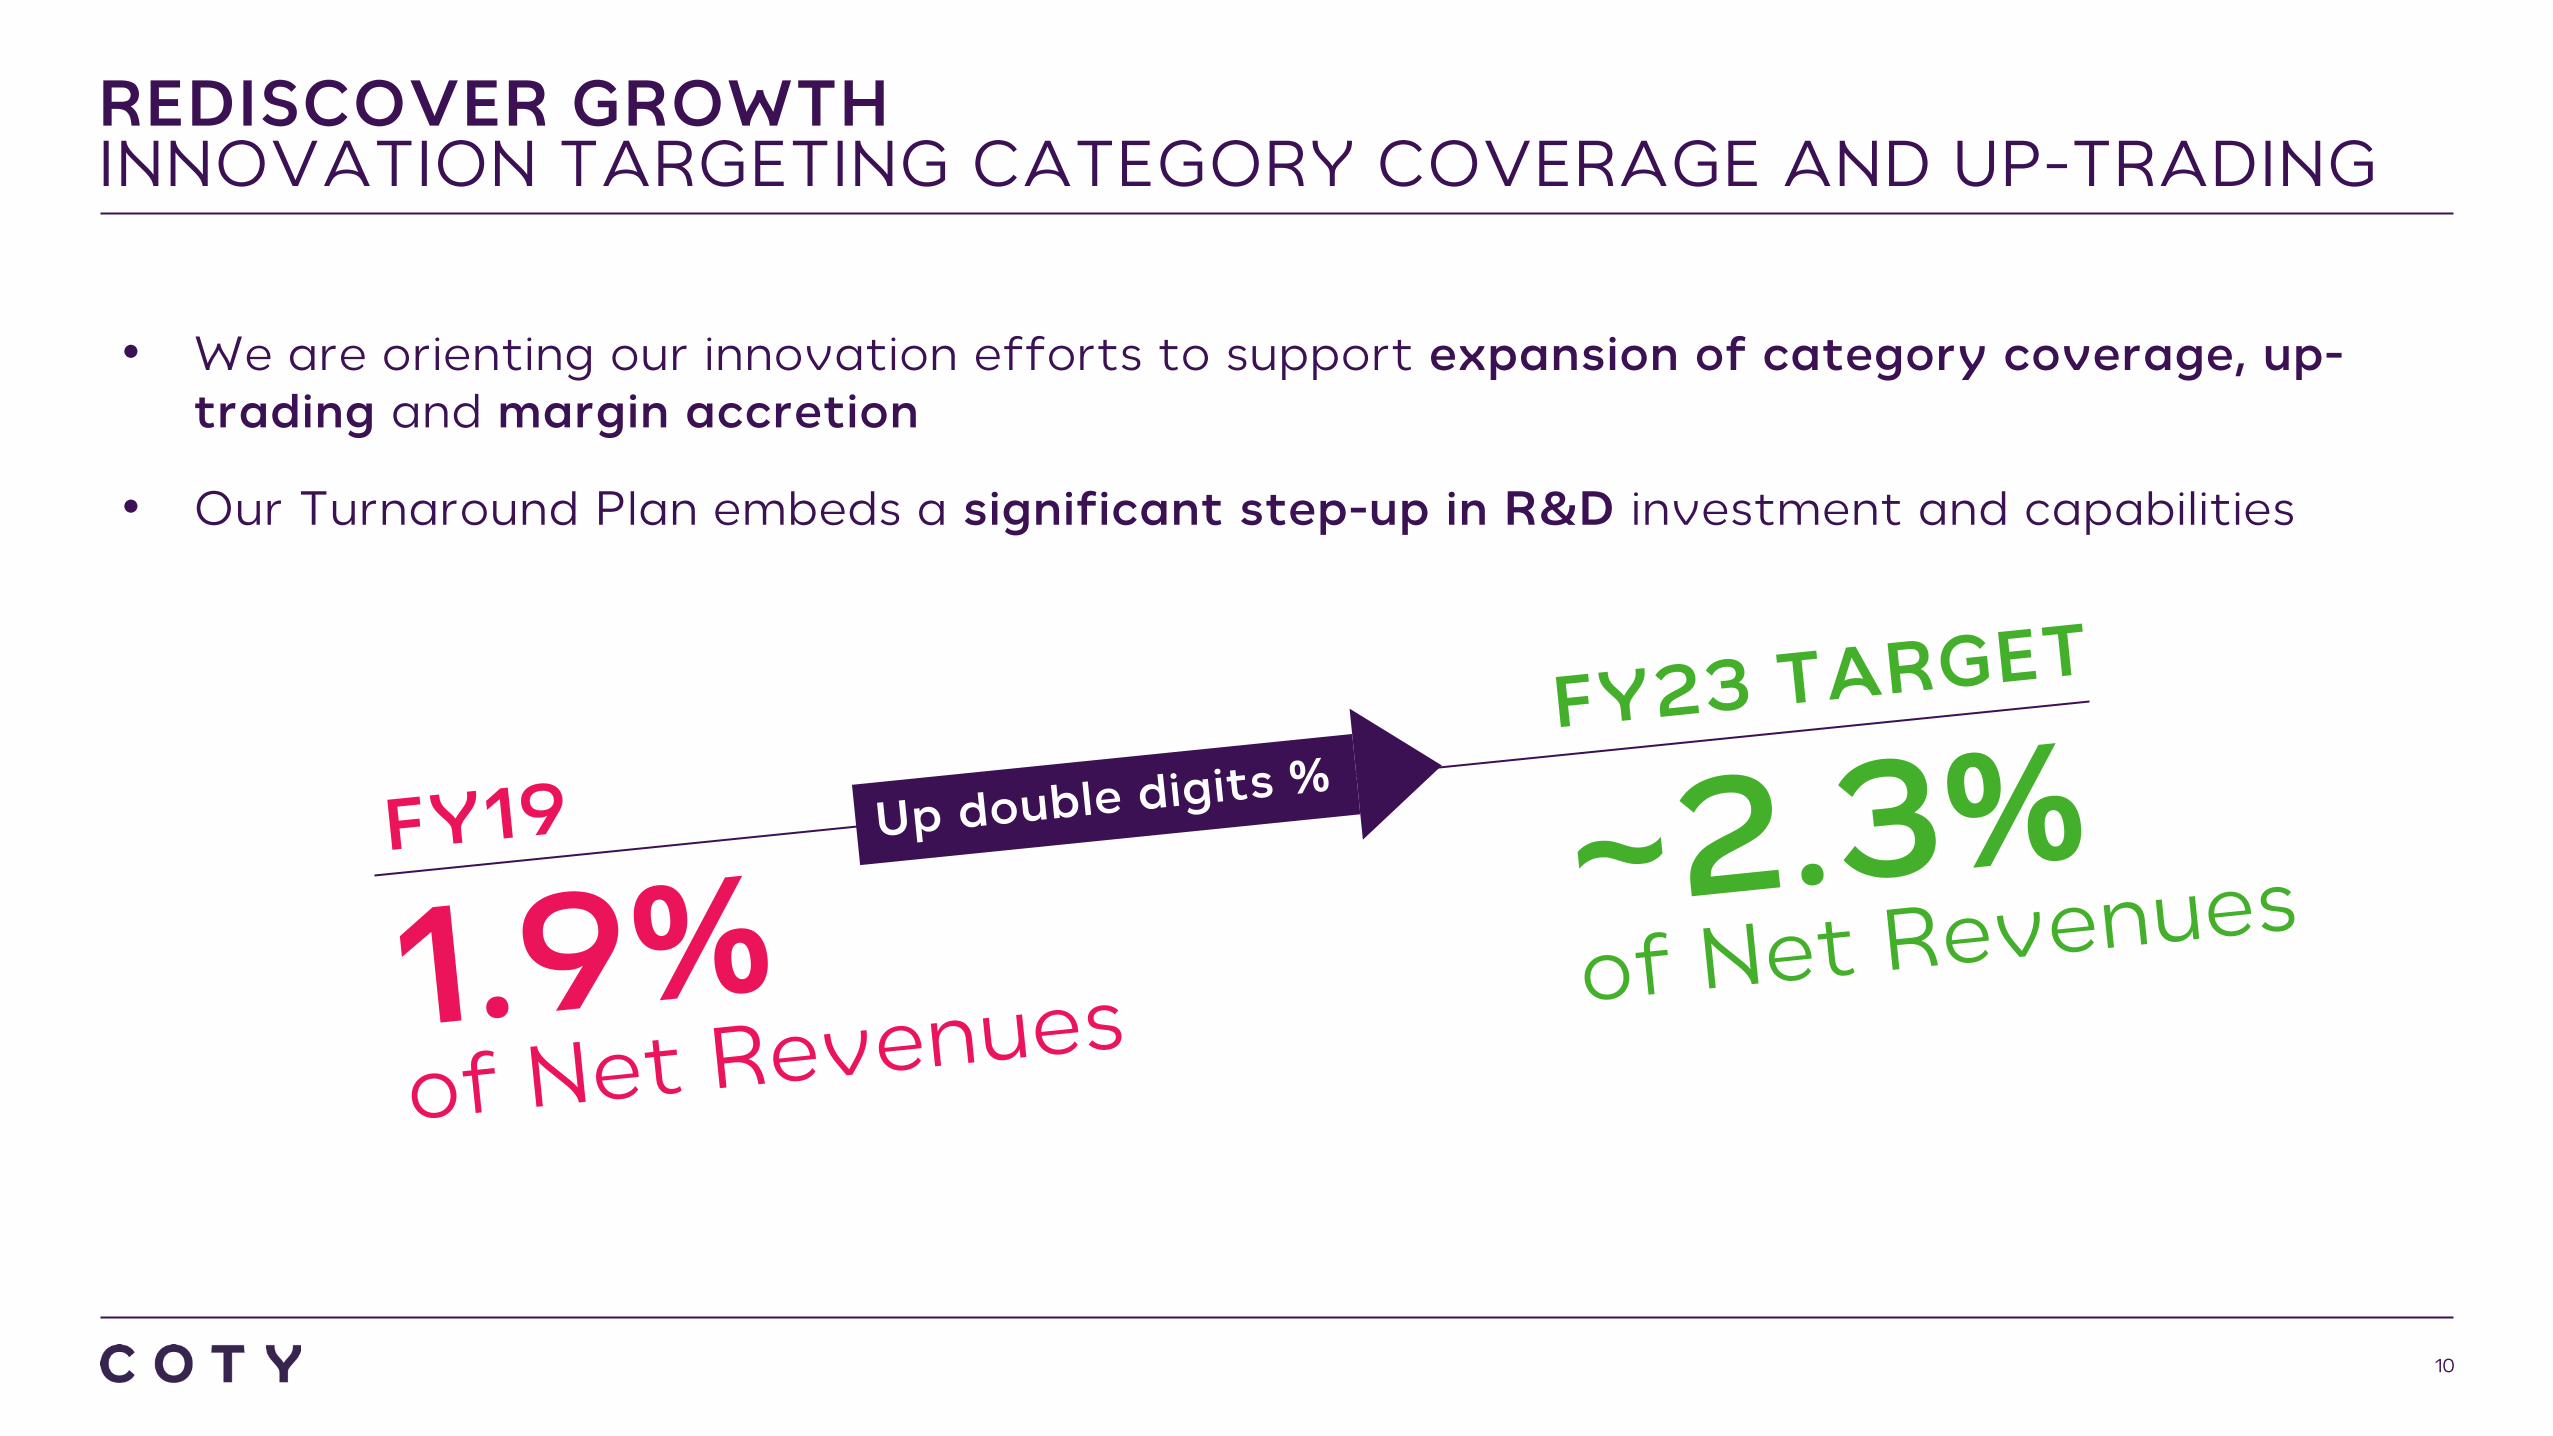
REDISCOVER GROWTHINNOVATION TARGETING CATEGORY COVERAGE AND UP-TRADING
10
• We are orienting our innovation efforts to support expansion of category coverage, up-trading and margin accretion
• Our Turnaround Plan embeds a significant step-up in R&D investment and capabilities

OPERATIONAL LEADERSHIPMORE OPPORTUNITIES IN SUPPLY CHAIN
11
• On a comparable basis, we estimate we have over 10% gross margin gap vs. competition
• While we have been optimizing our supply chain footprint, still substantial room for further COGS savings
Gross margin
Shelf Productivity
Supply chain efficiency
Supply chain productivity
Capture scale benefits of higher volume per SKU
Accelerate existing procurement savings2/3
of
savi
ngs
1/3
of
savi
ngs Cut the tail of margin dilutive SKUs
Grow the head of hero SKUs
Value engineer lower margin but strategic SKUs
COGS Reduction
SKU rationalization

OPERATIONAL LEADERSHIPADDRESSING MARKETS’ SCALE AND BUILDING A LEANER ORGANIZATION
12
1. Simpler organization 2. Leaner structure 3. Co-located top team
• Mutualised support functions
• Markets managed in 3 regions
• Brand units focus on marketing / brand building
• More efficient, lean team
• Executive Committee and center of gravity closer to markets
• Greater in-market scale andfaster / better decisions
• New management HQ in Amsterdam - one management team, one place, one culture
• Foster cooperation
• Remove silos
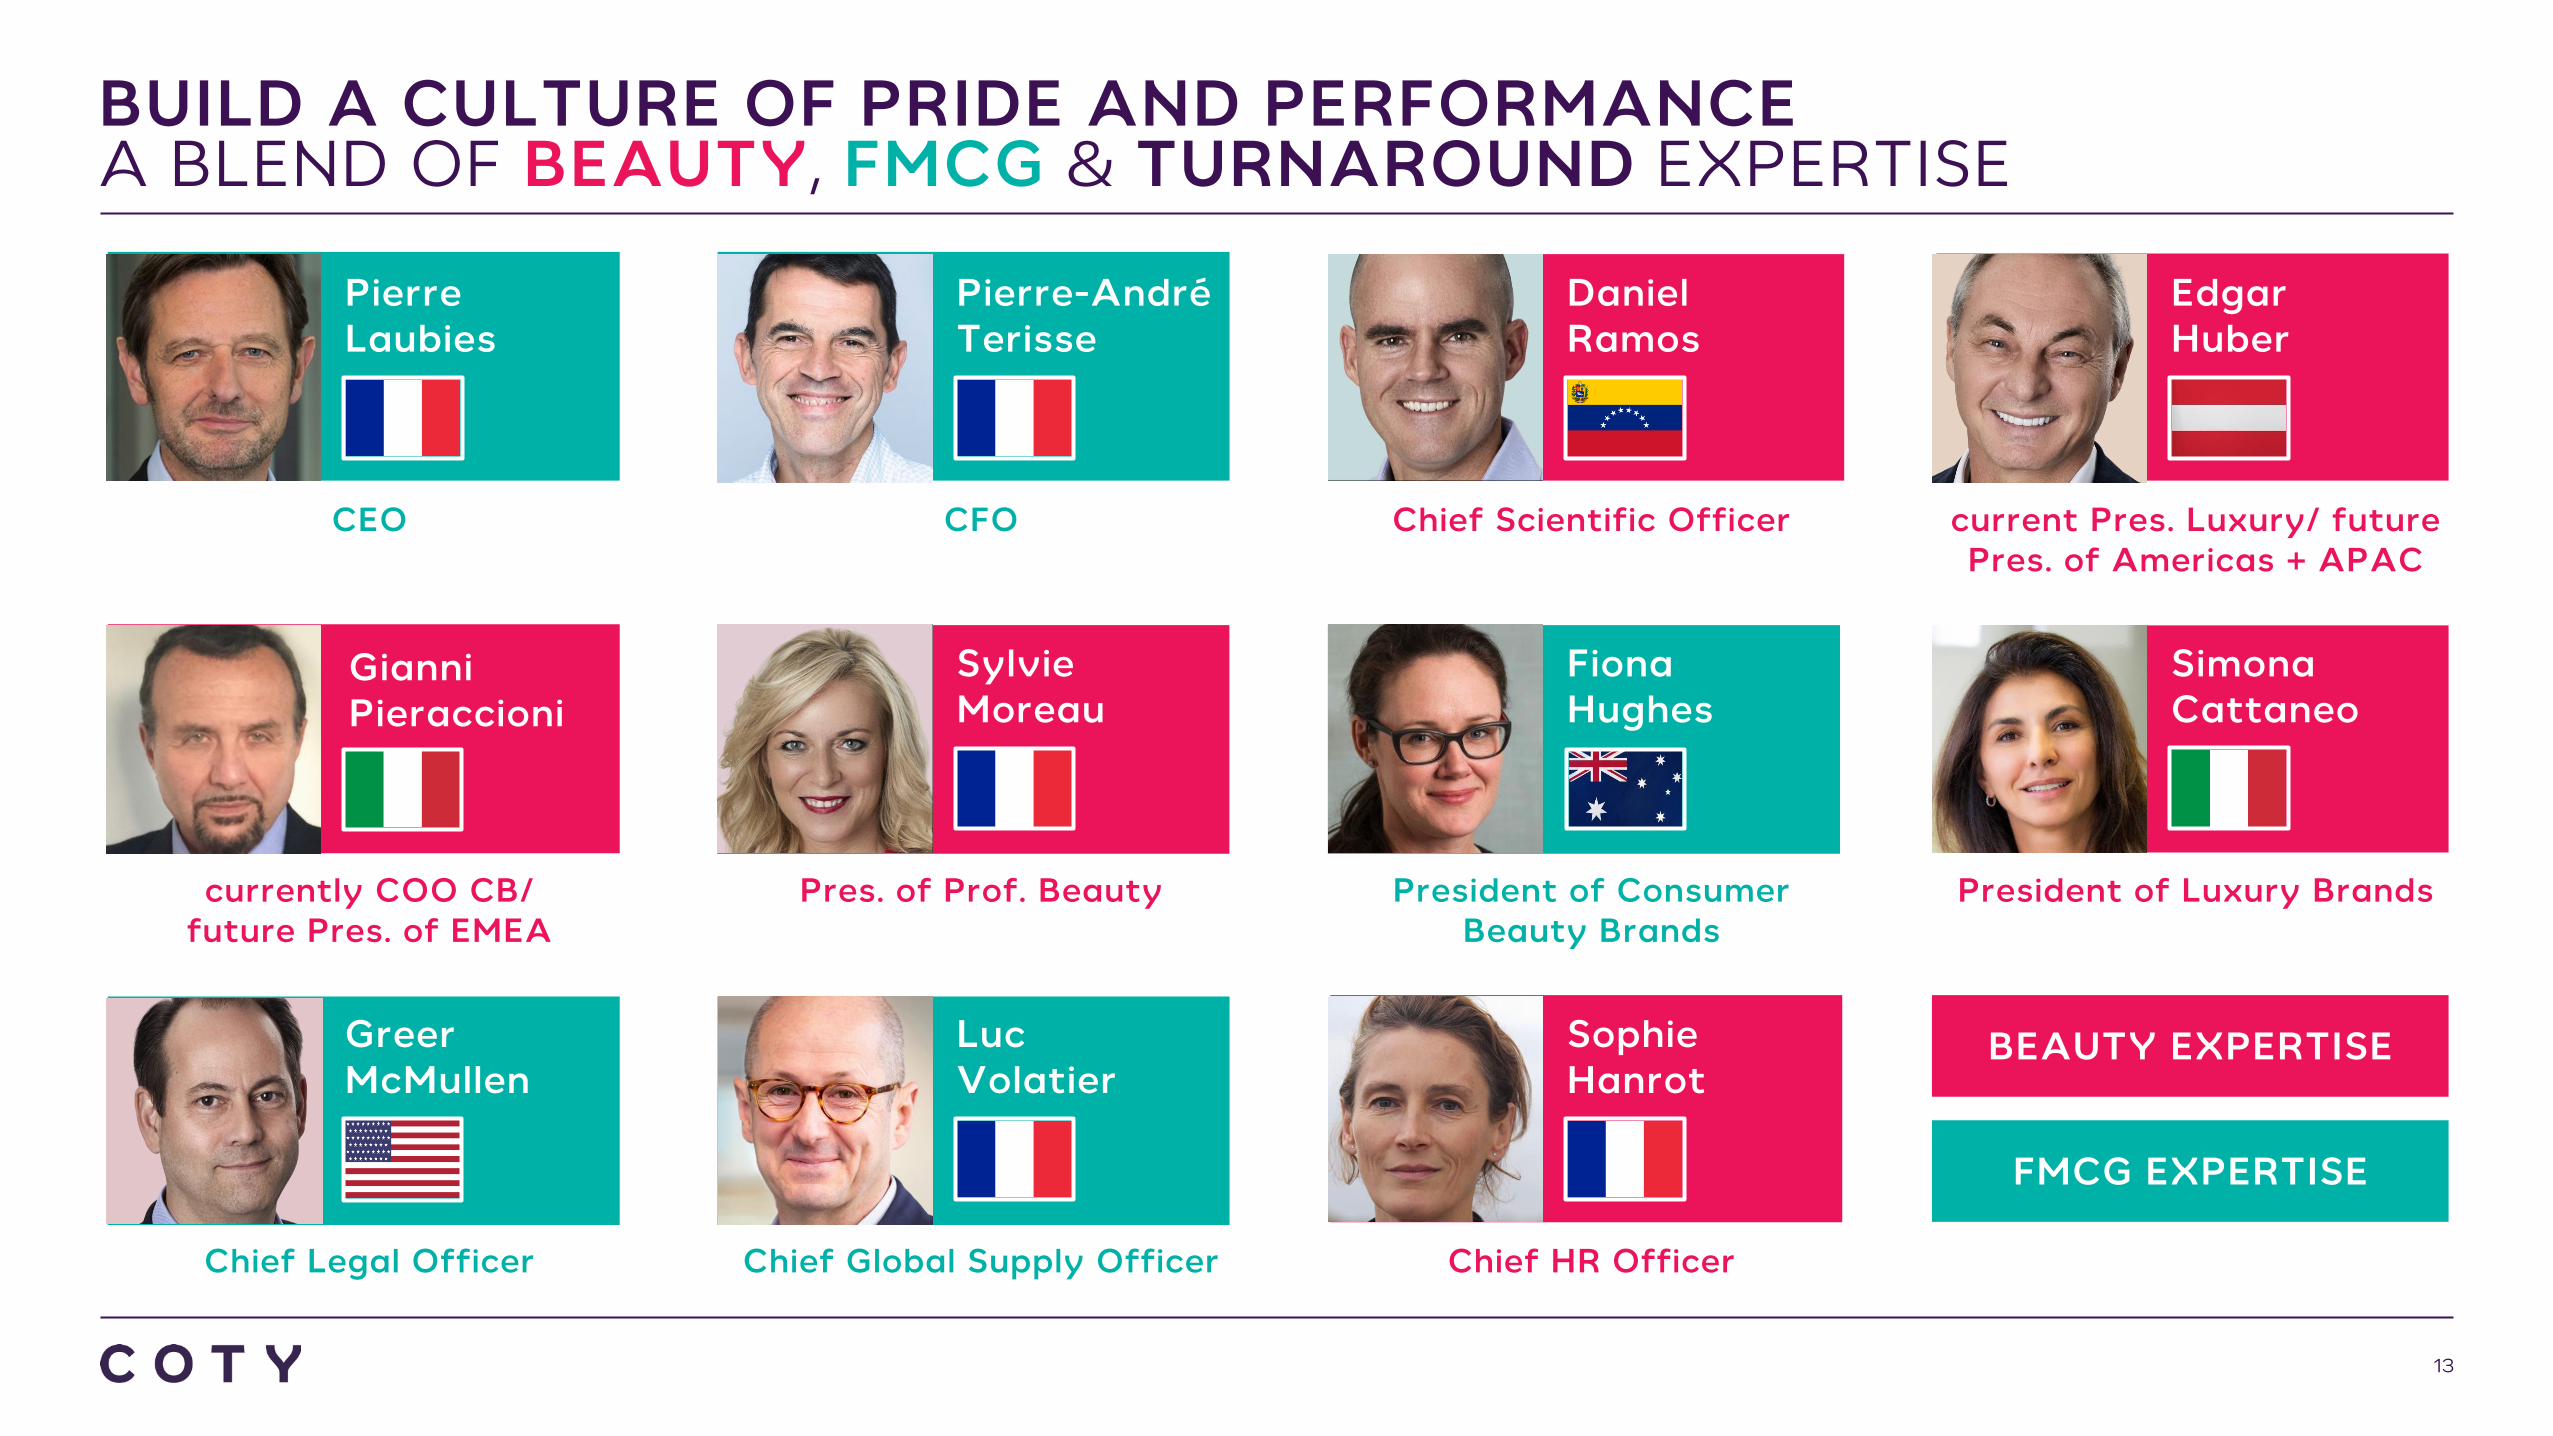
BUILD A CULTURE OF PRIDE AND PERFORMANCEA BLEND OF BEAUTY, FMCG & TURNAROUND EXPERTISE
13
current Pres. Luxury/ future Pres. of Americas + APAC
EdgarHuber
President of Luxury Brands
SimonaCattaneo
Chief Scientific Officer
DanielRamos
President of Consumer Beauty Brands
FionaHughes
Chief HR Officer
SophieHanrot
CFO
Pierre-AndréTerisse
Pres. of Prof. Beauty
SylvieMoreau
Chief Global Supply Officer
LucVolatier
CEO
PierreLaubies
currently COO CB/future Pres. of EMEA
GianniPieraccioni
Chief Legal Officer
GreerMcMullen
BEAUTY EXPERTISE
FMCG EXPERTISE
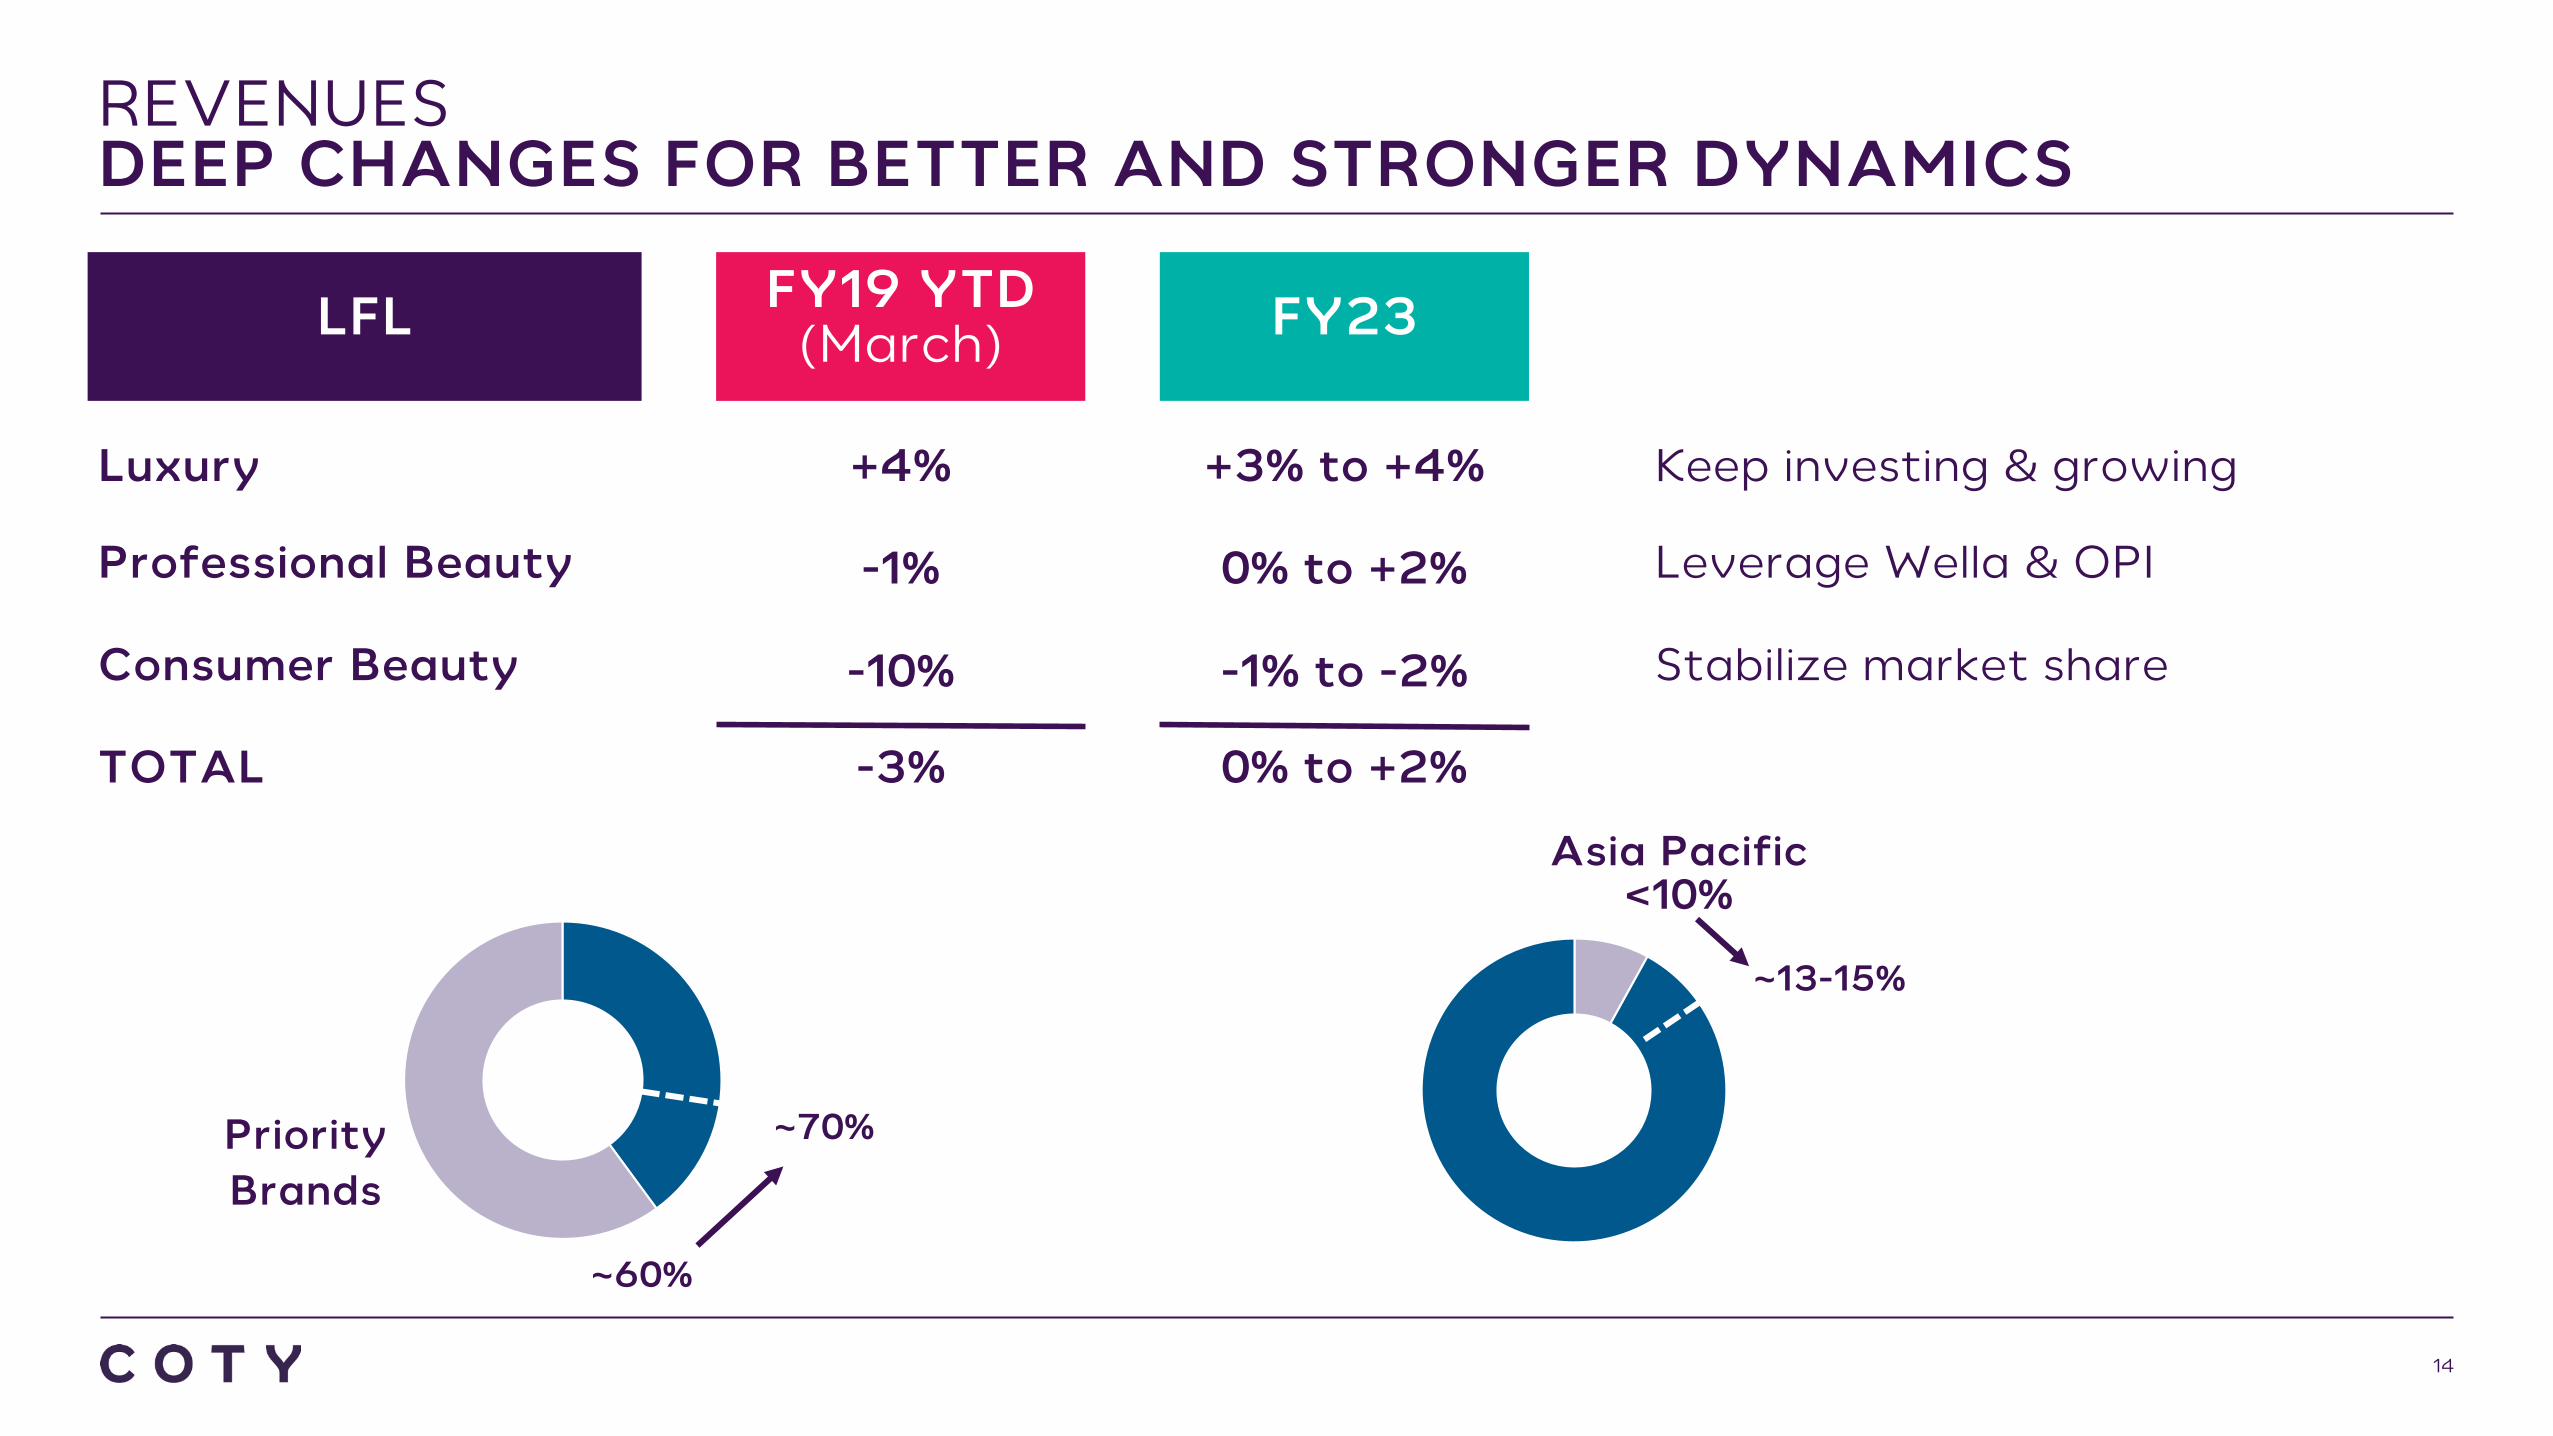
REVENUESDEEP CHANGES FOR BETTER AND STRONGER DYNAMICS
14
LFL FY19 YTD (March) FY23
Luxury
Professional Beauty
Consumer Beauty
TOTAL
+4%
-1%
-10%
-3%
+3% to +4%
0% to +2%
-1% to -2%
0% to +2%
Keep investing & growing
Leverage Wella & OPI
Stabilize market share
Priority Brands
~60%
~70%
Asia Pacific<10%
~13-15%
FCF
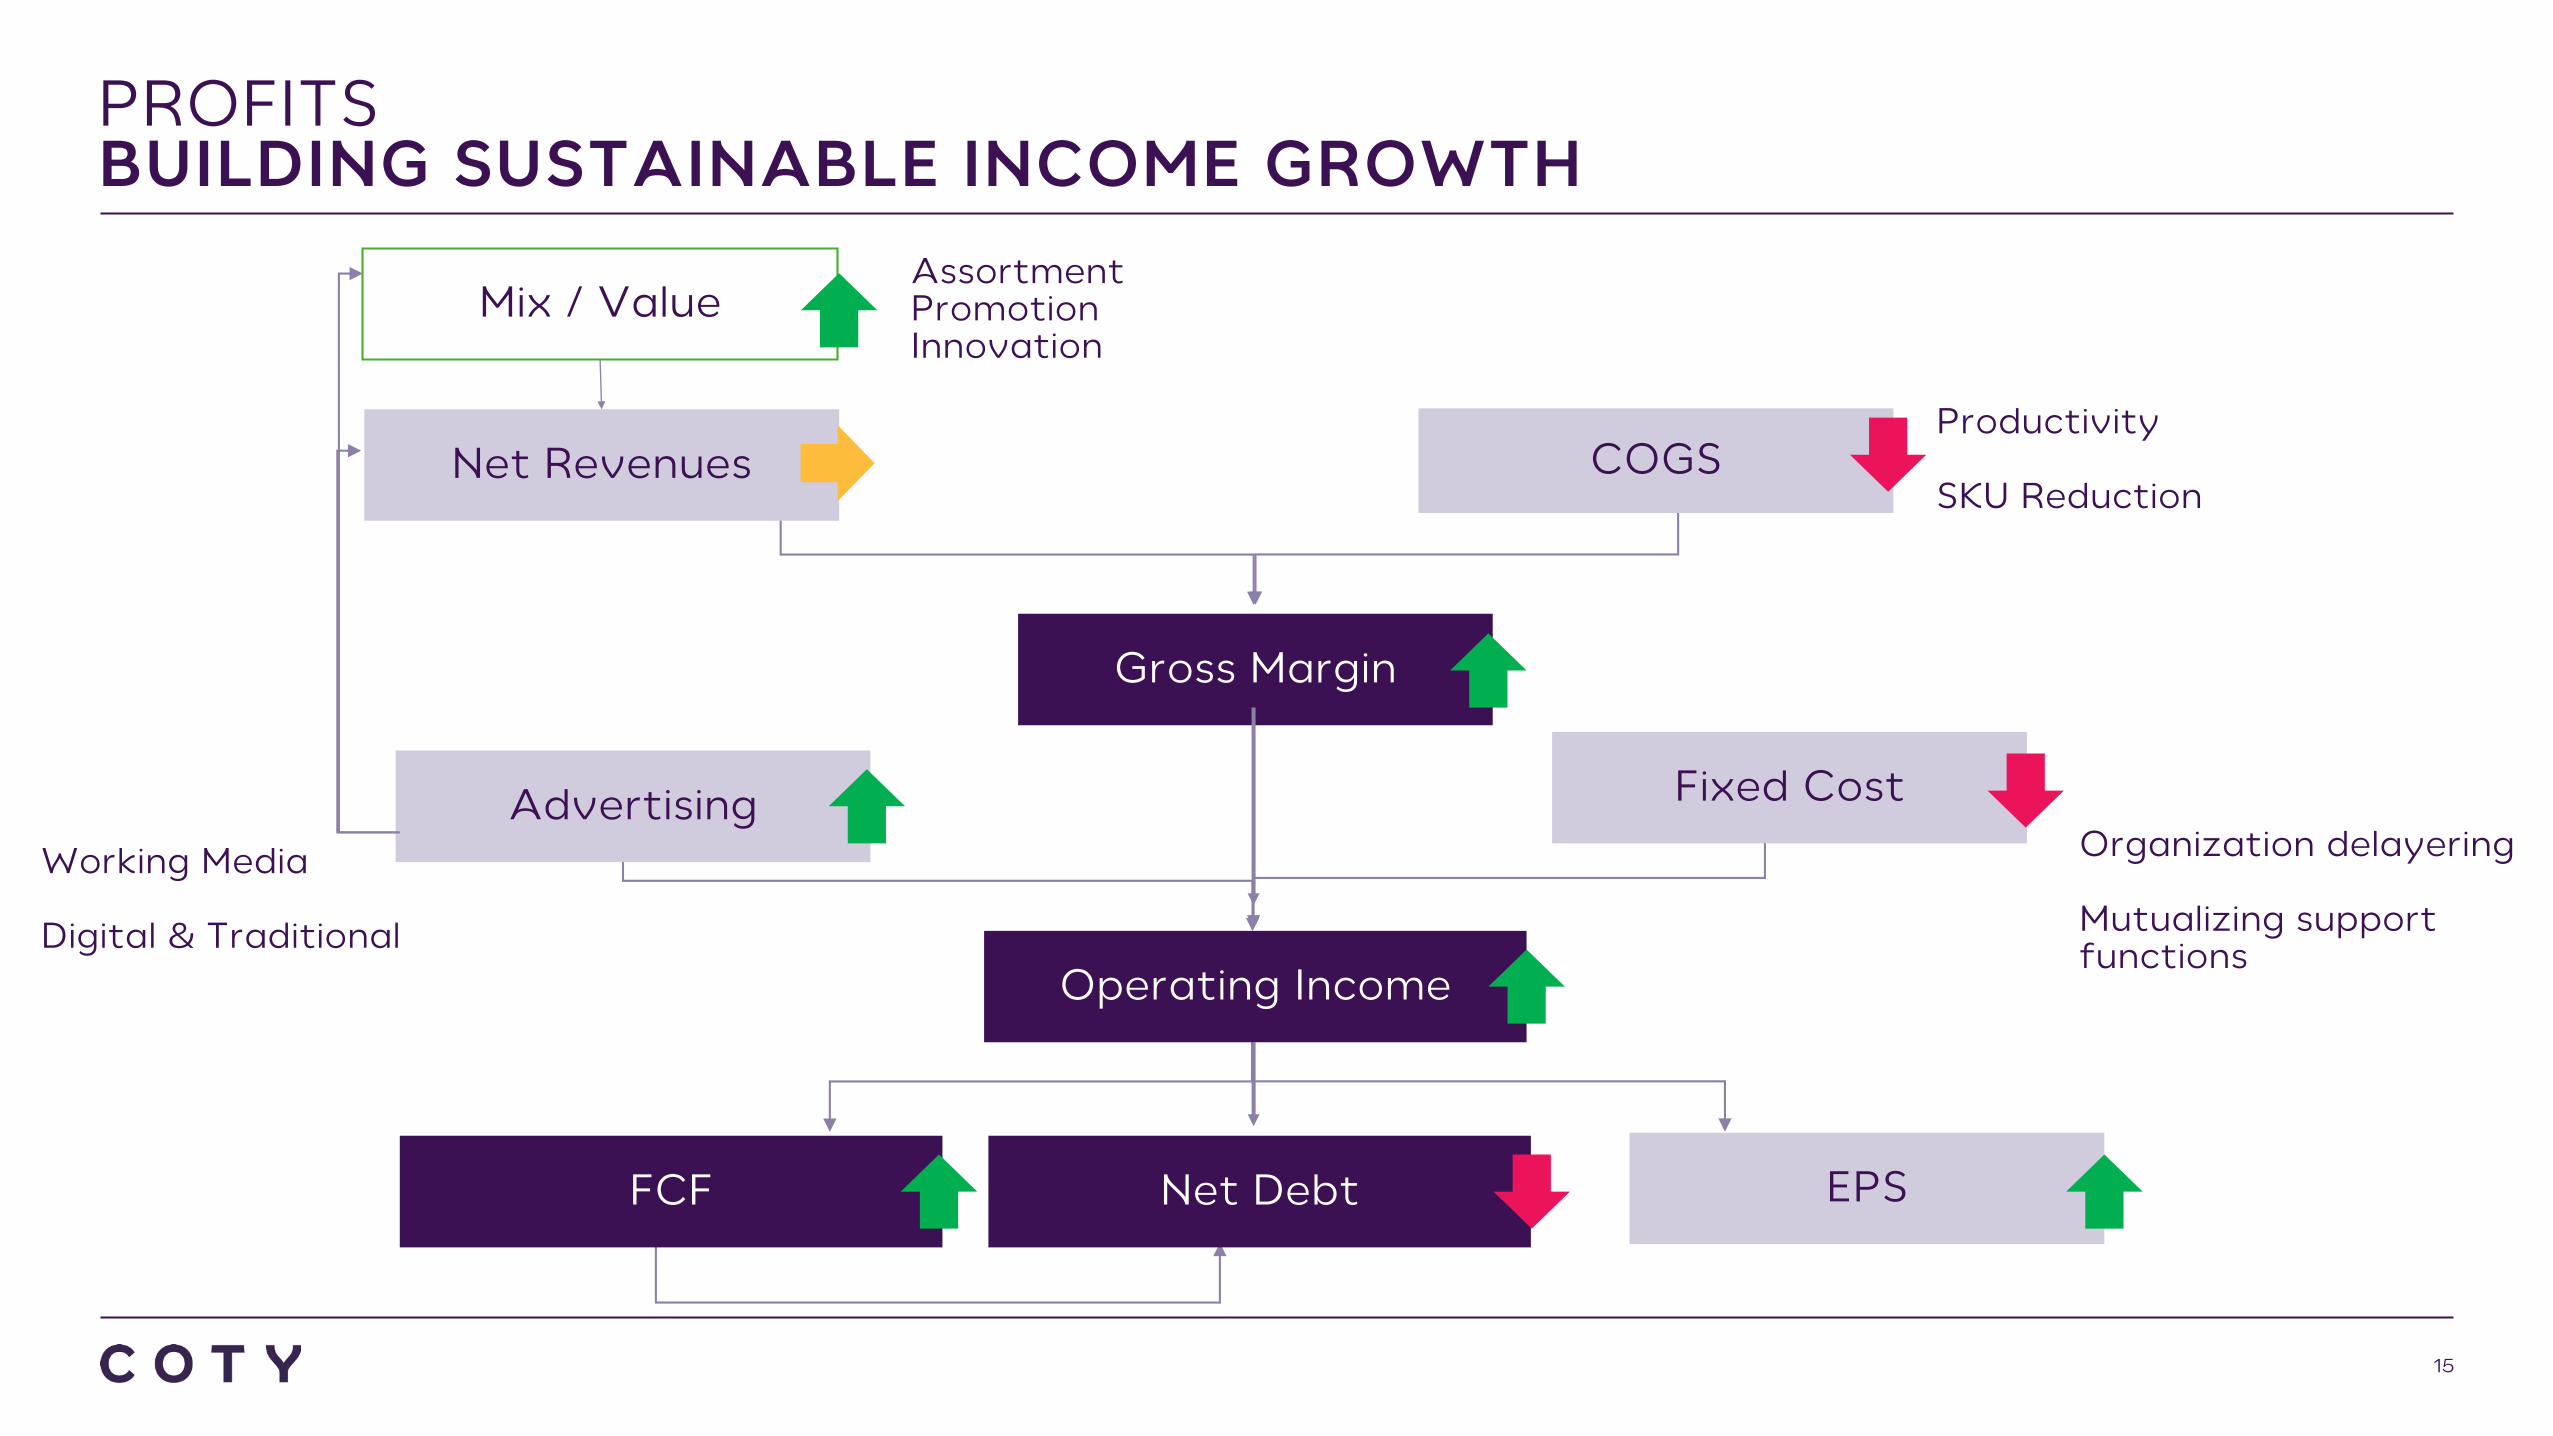
PROFITSBUILDING SUSTAINABLE INCOME GROWTH
15
Mix / Value
Fixed Cost
Gross Margin
COGS
Advertising
Net Revenues
Net Debt EPS
Operating Income
AssortmentPromotionInnovation
Productivity
SKU Reduction
Organization delayering
Mutualizing support functions
Working Media
Digital & Traditional

CASH FLOW AND NET DEBT TRAJECTORY
16
Key Building Blocks
• One-time costs: ~$160M cash outflow from previous programs (largely FY20), plus ~$600M from newly announced program spread over FY20-FY23. 2-3 year payback objective on all projects.
• Working Capital: Gradual progress, with a focus on inventory and receivables
• Capex: End of P&G related one-time capex and tight management expected to drive capex from 4.5-5.0% of revenues to 3.5-4.0%
Continue to target net debt to EBITDA of <4x by FY23
Flat to declining interest expense to fuel EPS growth above Operating Income growth
~$1B
~$5.7B
FY19 FY20 FY21 FY22 FY23
FCF Net Debt
$0.2-0.3B
$7.3-7.4B

OUR GOALFY23 TARGETS
17
Net revenues growth(constant FX & scope)
Free Cash Flow
Net Debt to EBITDA
Adjusted Operating margin
0 to 2%(stable FY23 vs FY19)
~$1 billion
Less than 4x
14% to 16%

OUR NEW PATH STARTS NOWFISCAL 2020 OUTLOOK
18
Net revenues growth(constant FX & scope)
Free Cash Flow
Adjusted Operating margin(constant FX & scope)
Moderating decline
Moderate improvement
5 to 10% growth

APPENDIX

NEWORGANIZATIONAL STRUCTURE
20
GMCountry 1
GMCountry 2
President, Americas & APAC(Full P&L Ownership)
President, EMEA(Full P&L Ownership)
President, Professional Beauty(Full P&L Ownership)
GMCountry 3
GMCountry 4
GMCountry 1
GMCountry 2
President, Consumer
Beauty Brands
President, Luxury Brands
Enabling FunctionsFinance
R&DHR
Legal

CURRENTORGANIZATIONAL STRUCTURE
21
President, Luxury(Full P&L Ownership)
President/COO, Consumer Beauty(Full P&L Ownership)
President, Professional Beauty(Full P&L Ownership)
Regional SVP 1
Regional SVP 2
Luxury CMO
CFO
GM Country 1
GM Country 2
Regional SVP 1
Regional SVP 2
CBCMO
CFO
GM Country 1
GM Country 2
Regional SVP 1
Regional SVP 2
PBCMO
CFO
GM Country 1
GM Country 2

DISCLAIMER
22
Forward-Looking Statements
Certain statements in this presentation are forward-looking statements. These forward-looking statements reflect Coty Inc.’s (“Coty’s”) current views with respect to, among other things, Coty’s Turnaround Plan, strategic planning, targets, segmentreporting and outlook for fiscal year 2020 and future reporting periods (including the extent and timing of revenue and profit trends and the Consumer Beauty business’s stabilization), expected 2019 results and estimated 2019 impairments; Coty’s futureoperations and strategy, synergies, savings, performance, cost, timing and integration of acquisitions), allocation and amount of advertising and consumer promotion costs, allocation and amount of research and development investments, ongoing andfuture cost efficiency and restructuring initiatives and programs (including the expected timing and impact), investments, licenses and portfolio changes), future cash flows and liquidity and borrowing capacity, timing and size of cash outflows and debtdeleveraging, impact and timing of supply chain disruptions and the resolution thereof, timing and extent of any future impairments, and the synergies, savings, impact, cost, timing and implementation of Coty’s Turnaround Plan, including operational andorganizational structure changes, operational execution and simplification initiatives, the move of Coty’s headquarters, and the priorities of senior management. These forward-looking statements are generally identified by words or phrases, such as“anticipate”, “are going to”, “estimate”, “plan”, “project”, “expect”, “believe”, “intend”, “foresee”, “forecast”, “will”, “may”, “should”, “outlook”, “continue”, “temporary”, “target”, “aim”, “potential”, “goal” and similar words or phrases. These statements are based oncertain assumptions and estimates that we consider reasonable, but are subject to a number of risks and uncertainties, many of which are beyond the control of Coty, which could cause actual results to differ materially from such statements. Such risksand uncertainties are identified in the periodic reports Coty has filed and may file with the Securities and Exchange Commission (the “SEC”) including, but not limited to: Coty’s ability successfully implement its multi-year Turnaround Plan and to develop andachieve its global business strategies, compete effectively in the beauty industry and achieve the benefits contemplated by its strategic initiatives within the expected time frame or at all, the integration of recent acquisitions with Coty’s business,operations, systems, financial data and culture and the ability to realize synergies, avoid future supply chain and other business disruptions, reduce costs and realize other potential efficiencies and benefits (including through its restructuring initiatives) atthe levels and at the costs and within the time frames contemplated or at all, and managerial, integration, operational, regulatory, legal and financial risks, including diversion of management attention to and management of cash flows, expenses and costsassociated with multiple ongoing and future strategic initiatives, internal reorganizations and restructuring activities, including the Turnaround Plan, and Coty’s ability to retain and attract key personnel and the impact of senior management transitions andorganizational structure changes.
The foregoing review of important factors should not be construed as exhaustive and should be read in conjunction with the other cautionary statements that are included elsewhere, including in Coty’s Press Release dated July 1, 2019. More informationabout potential risks and uncertainties that could affect Coty’s business and financial results is included under “Risk Factors” and “Management’s Discussion and Analysis of Financial Condition and Results of Operations” in Coty’s Annual Report on Form 10-Kfor the fiscal year ended June 30, 2018, and other periodic reports Coty has filed and may file with the SEC from time to time. Any forward-looking statements made in this presentation are qualified in their entirety by these cautionary statements. Allforward-looking statements are made only as of the date of this presentation, and, Coty undertakes no obligation, other than as may be required by applicable law, update or revise any forward-looking or cautionary statements to reflect changes inassumptions, the occurrence of events, unanticipated or otherwise, or changes in future operating results over time or otherwise.
Non-GAAP Financial Measures
In this presentation, Coty presents certain non-GAAP financial measures that we believe enable management and investors to analyze and compare the underlying business results from period to period, including constant currency, organic like-for-like (LFL)and adjusted metrics, as well as free cash flow and net debt. Constant currency information compares results between periods as if exchange rates had remained constant period-over-period, with the current period’s results calculated at the prior-yearperiod’s rates. The term “like-for-like” describes the Coty's core operating performance, excluding the financial impact of (i) acquired brands or businesses in the current year period until Coty has twelve months of comparable financial results, (ii) divestedbrands or businesses or early terminated brands in the prior year period to maintain comparable financial results with the current fiscal year period and (iii) foreign currency exchange translations to the extent applicable. Adjusted metrics excludenonrecurring items, purchase price accounting related amortization, acquisition-related costs, restructuring costs and certain other information as noted within this presentation. Free cash flow is defined as net cash provided by operating activities, lesscapital expenditures, and net debt is defined as total debt less cash and cash equivalents. These non-GAAP financial measures should not be considered in isolation, or as a substitute for, or superior to, financial measures calculated in accordance withGAAP. To the extent that Coty provides guidance, it does so only on a non-GAAP basis and does not provide reconciliations of such forward-looking non-GAAP measures to GAAP due to the inherent difficulty in forecasting and quantifying certain amountsthat are necessary for such reconciliation, including adjustments that could be made for restructuring, integration and acquisition-related expenses, amortization expenses, adjustments to inventory, and other charges reflected in our reconciliation ofhistoric numbers, the amount of which, based on historical experience, could be significant.
Outlook Information
In this presentation, Coty presents outlook information as of July 1, 2019.