agenda - s23.q4cdn.com
TRANSCRIPT

Agenda
Wednesday, March 7, 2012
8:00-8:05am Welcome Coleen Tabor
8:05-8:35am Strategy Review and Business Update Jeff Turner
8:35-9:05am Financial Performance and Outlook Phil Anderson
9:05-9:25am Fuselage Segment: Operational Efficiency David Coleal
9:25-9:40am BREAK
9:40-10:00am Propulsion Segment: Value Engineering John Pilla
10:00-10:20 am Wing Segment: New Program Execution Alex Kummant
10:20-10:40 am 787 Program Update Terry George
10:40-11:00 am Aligning the Team for Success Sam Marnick
11:00-11:05 am Closing Remarks Jeff Turner

Forward-Looking Information
Cautionary Statement Regarding Forward-Looking Statements:
This presentation contains “forward-looking statements” that may involve many risks and uncertainties. Forward-looking statements reflect our current expectations or forecasts of future events. Forward-looking statements generally can be identified by the use of forward-looking terminology such as “may,” “will,” “should,” “expect,” “anticipate,” “intend,” “estimate,” “believe,” “project,” “continue,” “plan,” “forecast,” or other similar words, or the negative thereof, unless the context requires otherwise. These statements reflect management’s current views with respect to future events and are subject to risks and uncertainties, both known and unknown. Our actual results may vary materially from those anticipated in forward-looking statements. We caution investors not to place undue reliance on any forward-looking statements. Important factors that could cause actual results to differ materially from those reflected in such forward-looking statements and that should be considered in evaluating our outlook include, but are not limited to, the following: our ability to continue to grow our business and execute our growth strategy, including the timing, execution and profitability of new programs; our ability to perform our obligations and manage costs related to our new commercial and business aircraft development programs and the related recurring production; margin pressures and the potential for additional forward-losses on aircraft development programs; our ability to accommodate, and the cost of accommodating, announced increases in the build rates of certain aircraft, including, but not limited to, the Boeing B737, B747, B767 and B777 programs, and the Airbus A320 and A380 programs; the effect on business and commercial aircraft demand and build rates of the following factors: continuing weakness in the global economy and economic challenges facing commercial airlines, a lack of business and consumer confidence, and the impact of continuing instability in global financial and credit markets, including, but not limited to, any failure to avert a sovereign debt crisis in Europe; customer cancellations or deferrals as a result of global economic uncertainty; the success and timely execution of key milestones such as deliveries of Boeing’s new B787 and first flight, certification and first delivery of Airbus’ new A350 XWB aircraft programs, receipt of necessary regulatory approvals, and customer adherence to their announced schedules; our ability to enter into profitable supply arrangements with additional customers; the ability of all parties to satisfy their performance requirements under existing supply contracts with Boeing and Airbus, our two major customers, and other customers and the risk of nonpayment by such customers; any adverse impact on Boeing’s and Airbus’ production of aircraft resulting from cancellations, deferrals or reduced orders by their customers or from labor disputes or acts of terrorism; any adverse impact on the demand for air travel or our operations from the outbreak of diseases or epidemic or pandemic outbreaks; returns on pension plan assets and impact of future discount rate changes on pension obligations; our ability to borrow additional funds or refinance debt; competition from original equipment manufacturers and other aerostructures suppliers; the effect of governmental laws, such as U.S. export control laws and U.S. and foreign anti-bribery laws such as the Foreign Corrupt Practices Act and United Kingdom Bribery Act, environmental laws and agency regulations, both in the U.S. and abroad; the cost and availability of raw materials and purchased components; our ability to successfully extend or renegotiate our primary collective bargaining contracts with our labor unions; our ability to recruit and retain highly skilled employees and our relationships with the unions representing many of our employees; spending by the U.S. and other governments on defense; the possibility that our cash flows and borrowing facilities may not be adequate for our additional capital needs or for payment of interest on and principal of our indebtedness; our exposure under our existing senior secured revolving credit facility to higher interest payments should interest rates increase substantially; the effectiveness of our interest rate and foreign currency hedging programs; the outcome or impact of ongoing or future litigation, claims and regulatory actions; and our exposure to potential product liability and warranty claims. These factors are not exhaustive and it is not possible for us to predict all factors that could cause actual results to differ materially from those reflected in our forward-looking statements. These factors speak only as of the date hereof, and new factors may emerge or changes to the foregoing factors may occur that could impact our business. As with any projection or forecast, these statements are inherently susceptible to uncertainty and changes in circumstances. Except to the extent required by law, we undertake no obligation to, and expressly disclaim any obligation to, publicly update or revise any forward-looking statements, whether as a result of new information, future events or otherwise. You should review carefully the sections captioned “Risk Factors” in our 2011 Form 10-K filed February 23, 2012 for a more complete discussion of these and other factors that may affect our business.
Jeff Turner
President and Chief Executive Officer
March 7, 2012
Strategy Review and Business Update

Strong, Experienced Team
Spirit AeroSystems Executive Leadership
= Presenting Today
2

Division of $67B company
Controlling some of the costs
100% Boeing supplier
Part of a duopoly
Cost center
Cost manager
Independent ~$5.2B Company
Controlling all of the costs
Global industry partner
Multiple customers
Multiple competitors
Profit maker
Low-cost leader
From To
June 2005 2012
Focused on Execution, Growth and Diversification
Transformation and Growth
3
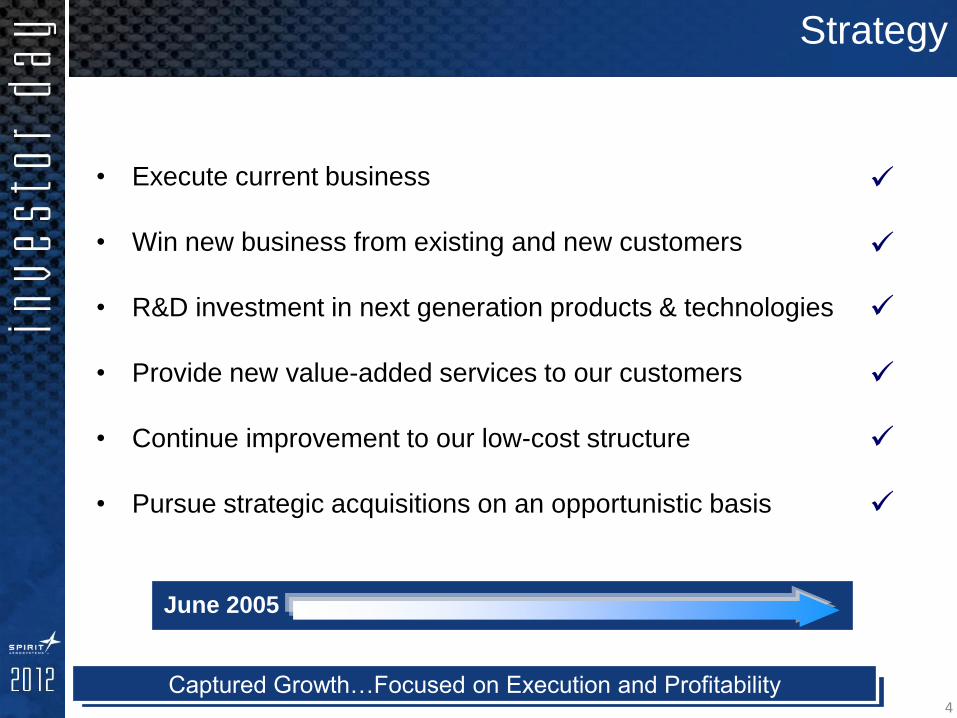
• Execute current business
• Win new business from existing and new customers
• R&D investment in next generation products & technologies
• Provide new value-added services to our customers
• Continue improvement to our low-cost structure
• Pursue strategic acquisitions on an opportunistic basis
June 2005
Captured Growth…Focused on Execution and Profitability
Strategy
4

8 Comprehensive AeroStructures Partner… Design and Build
Executing the Core Business
5

~ 1,300 HARDWARE PRODUCTION & DESIGN SUPPLIERS
Spirit Worldwide Operations / Aftermarket
Worldwide Supply Base
Competing Globally with Global Resources
Successful Management of Global Supply Chain
~ 1,400 Hardware Production & Design Suppliers
6
Global Resources

Air Traffic Growth
Strong Long-Term Growth
0
2
4
6
8
10
12
14
1985 1990 1995 2000 2005 2010 2015 2020 2025 2030
RP
Ks
(tr
illio
n)
20-year global
traffic growth
CAGR 4.9%
Forecast: 2x
air traffic in 15
years
Source: Airline Monitor, Spirit analysis
7

Strong Demand for Replacements & Growth Airplanes
Source : Boeing 2011 Commercial Market Outlook 8

Spirit’s Core Business
Well Positioned on Best Selling Commercial Airplanes
B737 B747
B777
B767
A320 A380
= Spiri t Responsibility
Shipset Value: $5.6–7.5MM Shipset Value: $8.4–14.6MM Shipset Value: $4.0–6.9MM
Shipset Value: $10-11.3MM Shipset Value: $0.9–1.4MM Shipset Value: $1.2MM
9

Delivered forward fuselage unit #60 to Charleston, SC
Excellent overall product quality
The 787-9 activities are progressing
Continuing to work with supply base in preparation for production ramp-up
Focused on cost reduction initiatives
787
787 Forward Fuselage Cockpit = Spirit Responsibility
787 Forward Fuselage
Growth with Boeing
Successfully Expanding Our Capabilities 10
Shipset Value: $8.0-12.0MM

A350 XWB
Design and build A350 XWB Section 15 and wing front spar in new state-of-the-art composites facility
Initial fabrication of production units underway
Shipped first production center fuselage panels from our North Carolina facility to our Saint-Nazaire, France facility for assembly in 2011, delivered to the customer in the first quarter
Shared investment between Spirit, Airbus, suppliers and local governments
Foundation for future composites expansion
Saint-Nazaire, France
Kinston, North Carolina
Growth with Airbus
= Spirit Responsibility
Leveraging Our Design and Build Capability to New Customers 11
Shipset Value: $4.0-5.0MM

Diversification Platforms
Partnering With Market Leaders
Gulfstream G280
Gulfstream G650 Mitsubishi Regional Jet (MRJ)
Bombardier CSeries
Sikorsky CH-53K
Boeing P-8A Poseidon
Business / Regional Jets Military
= Spiri t Responsibility
Shipset Value: $1-2MM
Shipset Value: 5.5-6.5MM
12

Sikorsky CH-53K Heavy Lift Helicopter Boeing P-8A Poseidon
Design-Build Composite
Cockpit and Cabin Design-Build
Fuselage
First Unit Delivered To Customer
Expanding Into New Markets
Military Aircraft Development
13
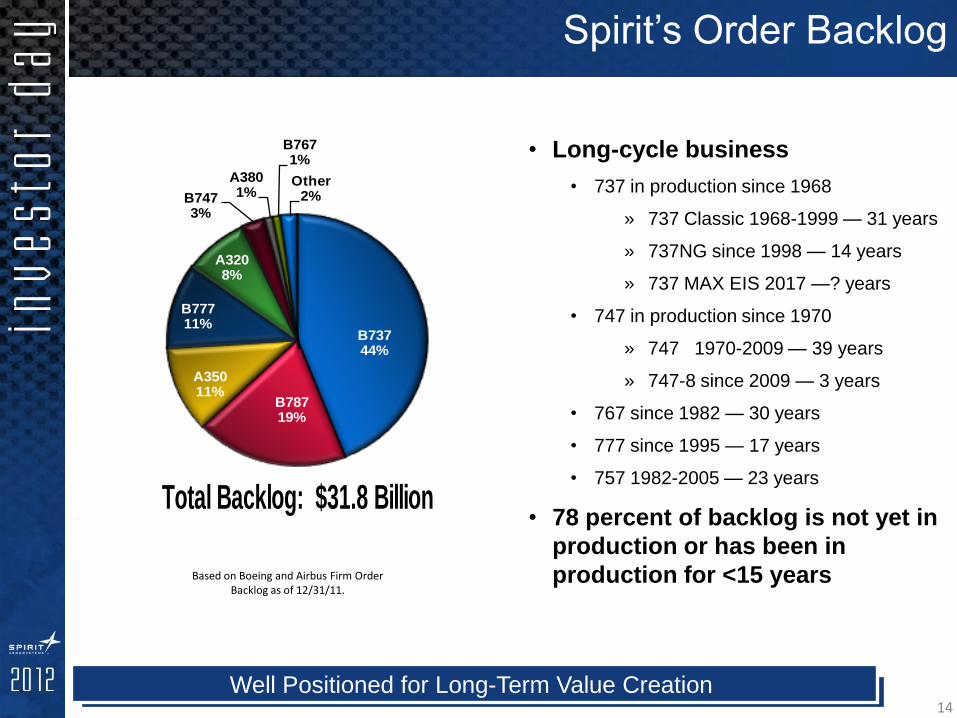
17 Well Positioned for Long-Term Value Creation
• Long-cycle business
• 737 in production since 1968
» 737 Classic 1968-1999 — 31 years
» 737NG since 1998 — 14 years
» 737 MAX EIS 2017 —? years
• 747 in production since 1970
» 747 1970-2009 — 39 years
» 747-8 since 2009 — 3 years
• 767 since 1982 — 30 years
• 777 since 1995 — 17 years
• 757 1982-2005 — 23 years
• 78 percent of backlog is not yet in
production or has been in
production for <15 years
B73744%
B78719%
A35011%
B77711%
A3208%
B7473%
A3801%
B7671%
Other2%
2244
Total Backlog: $31.8 Billion
Based on Boeing and Airbus Firm Order Backlog as of 12/31/11.
Spirit’s Order Backlog
14
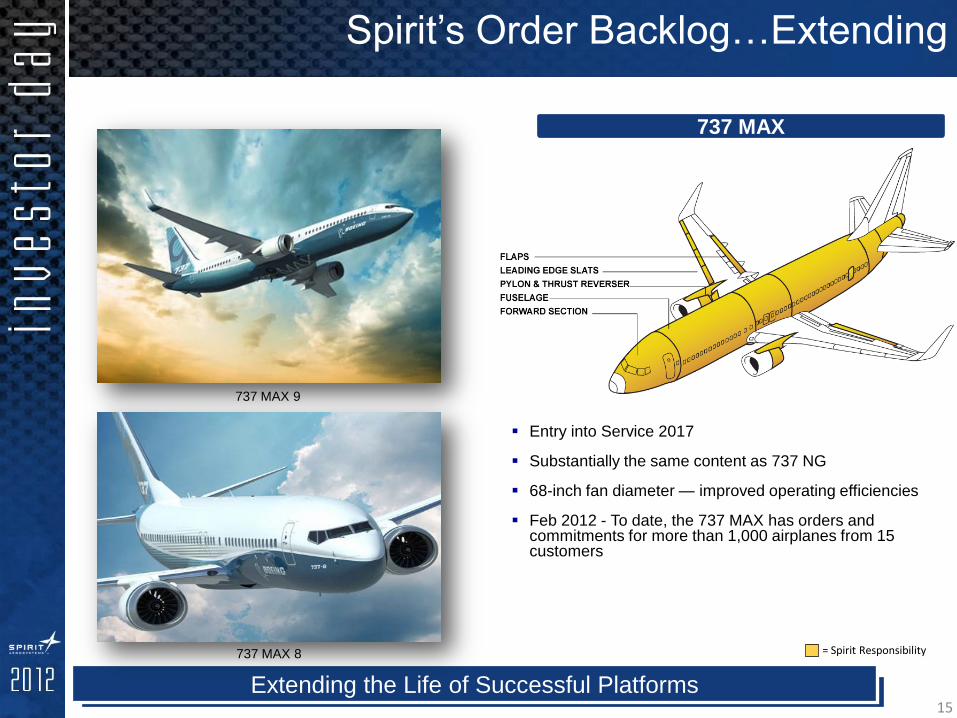
18 Extending the Life of Successful Platforms
737 MAX
Entry into Service 2017
Substantially the same content as 737 NG
68-inch fan diameter — improved operating efficiencies
Feb 2012 - To date, the 737 MAX has orders and commitments for more than 1,000 airplanes from 15 customers
= Spirit Responsibility
737 MAX 9
737 MAX 8
Spirit’s Order Backlog…Extending
15

Growing Core Market
High Growth Platforms, Backlog Growth
Executing New Business
Leading the Outsourcing Trend
787 Content
Growth Through Core Business Expansion and Diversification
Long-Term Value Creation
16

17

Phil Anderson
Senior Vice President &
Chief Financial Officer
March 7, 2012
Financial Performance and Outlook

Agenda
• Executing the strategy
• Financial Performance
• Growth, Profitability, and New Programs
• 2012 Financial Guidance
2

Executing The Strategy
3
Development 5-7 years
1-2 Years
20-30 Year Product Lifecycles
Full Production 12 – 21 Years Initial
Production
A350 XWB
CSeries Pylon
MRJ Pylon
CH-53K
787
G280
G650
BR725
P-8
747-8
Core Business
737
777
767
A320
A330/A340
A380
High Reducing Financial
Risk
Generated
over $2B in Cash since
2005
Aggressively invested In growth and diversification…
More selective going forward
Business Risk
Mitigation
Contracting
Program Mgmt
Execution
Change Control
Capital Structure and
Liquidity Mgmt
Mitigation
Backlog Management
Production Rate Management
Reduce capital intensive nature of the business
Move to more variable costs
Proactive capital structure and liquidity management
Re-invested in new
programs
Economically sensitive, cyclical
Quality Products, Capable and Reliable Supplier — Financially Strong
Investing in Core Business Growth
Investing in diversification and
managing to risk
Str
ate
gy E
xe
cu
tio
n
Ris
k M
an
age
me
nt
1
2
3
4
5
6
7 8
9 10

Total Ship Set Deliveries by Year Ship Set Deliveries by Customer
Rate Increases Driving Higher Deliveries
5 Year Delivery Trend
4
520
520
49 -
200
400
600
800
1,000
1,200
2007 2008 2009 2010 2011S
hip
Se
t D
eli
ve
rie
s
Boeing Airbus Other
963 978 1,029
969
1,089
-
200
400
600
800
1,000
1,200
2007 2008 2009 2010 2011
To
tal
Sh
ip S
et
De
liv
eri
es
by
Ye
ar
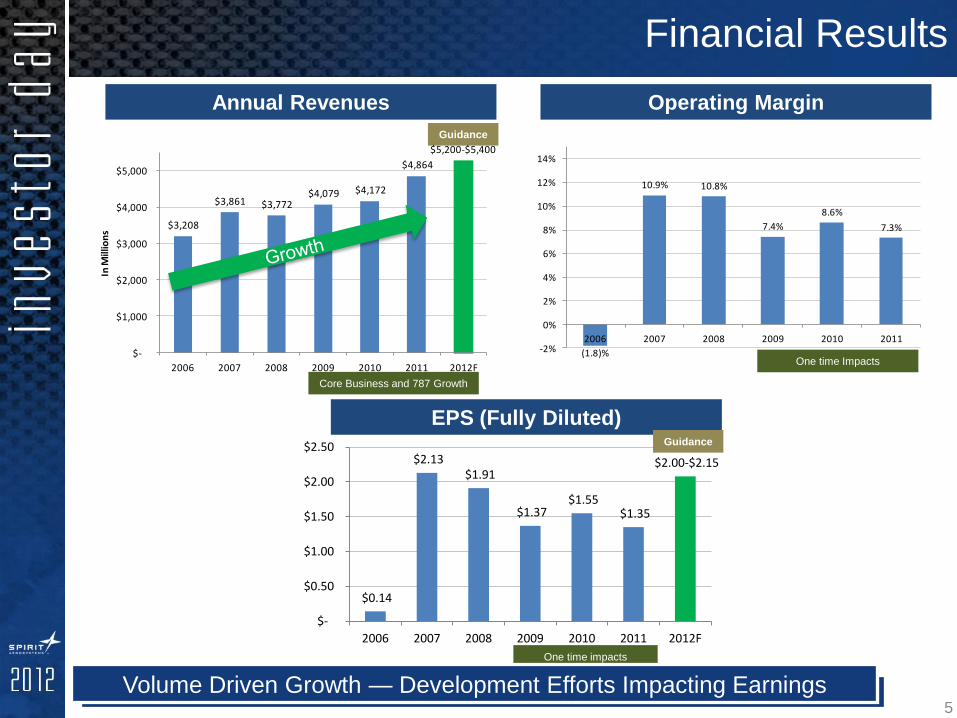
Financial Results
One time Impacts
Annual Revenues
(1.8)%
10.9% 10.8%
7.4%
8.6%
7.3%
-2%
0%
2%
4%
6%
8%
10%
12%
14%
2006 2007 2008 2009 2010 2011
Operating Margin
$0.14
$2.13 $1.91
$1.37 $1.55
$1.35
$2.00-$2.15
$-
$0.50
$1.00
$1.50
$2.00
$2.50
2006 2007 2008 2009 2010 2011 2012F
EPS (Fully Diluted)
5
One time impacts
Core Business and 787 Growth
Guidance
Guidance
Volume Driven Growth — Development Efforts Impacting Earnings
$3,208
$3,861 $3,772 $4,079 $4,172
$4,864
$5,200-$5,400
$-
$1,000
$2,000
$3,000
$4,000
$5,000
2006 2007 2008 2009 2010 2011 2012F
In M
illio
ns

Financial Results
* Partial Year Results… Spirit began operations on June 17, 2005
$224
$274
$180
$211
($14)
$125
($47)
>$300
($50)
$0
$50
$100
$150
$200
$250
$300
$350
2005* 2006 2007 2008 2009 2010 2011 2012F
In M
illio
ns
Cash Flow from Operations Capital Expenditures
$145
$343
$288
$236 $228
$288
$250 ~$250
$0
$50
$100
$150
$200
$250
$300
$350
2005* 2006 2007 2008 2009 2010 2011 2012F
In M
illio
ns
6
Guidance
Guidance
Strong Cash Flow From Core Business — Reinvesting for Growth
Strong core business cash flow
Customer Advances Advance Repayments
New Program Investments
Volume Increase Dri
vers
New Program Investments
Capacity
Expansion
Maintenance Capital
Dri
vers

Financial Results
Solid Balance Sheet to Support Diversification, Growth and Cyclicality
* Partial Year Results… Spirit began operations on June 17, 2005
$722 $618 $595 $588
$894
$1,197 $1,201
$241 $184
$133 $217
$369
$482
$178
$-
$200
$400
$600
$800
$1,000
$1,200
2005* 2006 2007 2008 2009 2010 2011
In M
illio
ns
Debt Cash
Cash/Debt Balances Net Debt to Capital
7
Customer Advances Advance Repayments
Bond Issuancse
Credit-line
$650M
IPO and Customer Advances Stand Alone Financing
Dri
vers
60%
34%
27%
22%25%
28%
34%
0%
10%
20%
30%
40%
50%
60%
70%
2005* 2006 2007 2008 2009 2010 2011
Growth and Profitability
8

5 Year Growth Trend
9
Program 2007
Deliveries
2011
Deliveries
%
Delivery
Growth
737 331 377 14%
777 83 78 (6%)
767 13 23 77%
747 18 17 (6%)
787 1 25 2,400%
A320 359 403 12%
Revenue 5 Year Growth Drivers
Core Business Growth
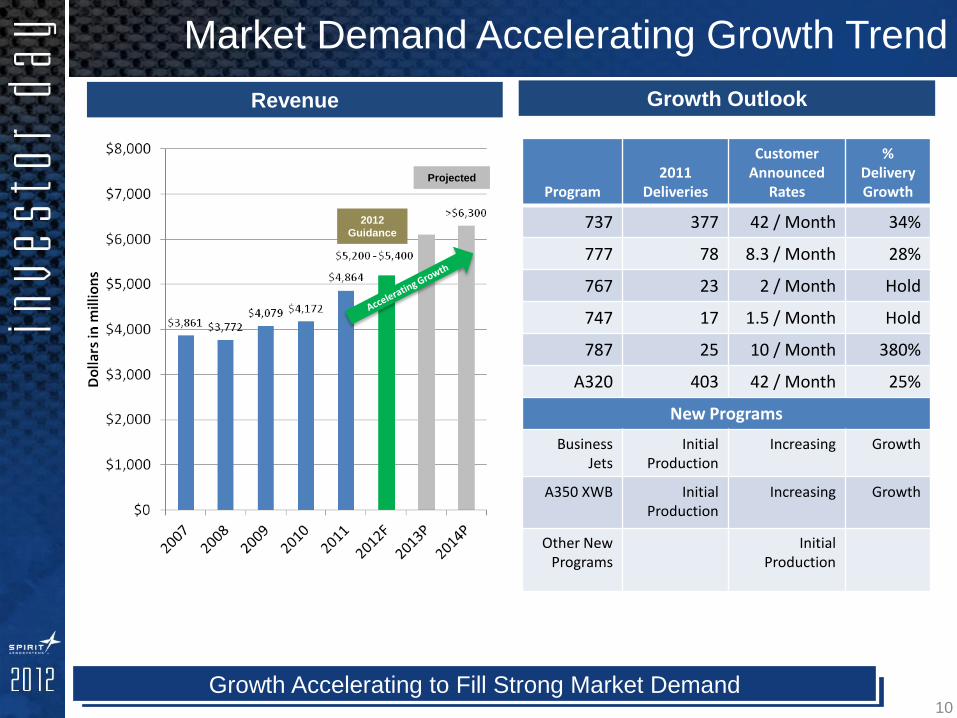
Market Demand Accelerating Growth Trend
10
Program 2011
Deliveries
Customer Announced
Rates
% Delivery Growth
737 377 42 / Month 34%
777 78 8.3 / Month 28%
767 23 2 / Month Hold
747 17 1.5 / Month Hold
787 25 10 / Month 380%
A320 403 42 / Month 25%
New Programs
Business Jets
Initial Production
Increasing Growth
A350 XWB Initial Production
Increasing Growth
Other New Programs
Initial Production
Revenue Growth Outlook
Growth Accelerating to Fill Strong Market Demand
2012
Guidance
Projected

9.7% 9.9%9.3%
10.5%9.6%
8.3%
11.2%
10.0%
0%
2%
4%
6%
8%
10%
12%
1Q 2Q 3Q 4Q 1Q 2Q 3Q 4Q
Adjusted Operating Margins
Solid Core Operating Margins On Growing Volume
11
$M 1Q 2Q 3Q 4Q 1Q 2Q* 3Q 4Q
Revenue 1,043 1,056 1,002 1,071 1,050 1,466 1,130 1,219
GAAP
Operating
Income
93 86 82 96 70 64 121 102
New Program
Charges 3 28 53 10 41
Other 8 19 11 13 3 4 (4) (21)
Adjusted Op.
Income 101 105 93 112 101 121 127 122
Adjusted Op.
Margin 1.
9.7% 9.9% 9.3% 10.5% 9.6% 8.3% 11.2% 10.0%
* Includes the impact of 787 MOA
2010 2011
2010 2010 2011 2011
Revenue Operating Margins
1. Non-GAAP measure. Definitions, reconciliations, and further disclosures regarding this non-GAAP measure are appended to this document.

New Program Investments and Inventory
12

Spirit Programs
New Program Diversification Strategy 13

• Revenues and costs projected for
contract block (fixed # of units)
• As contract matures, includes
actual and projected costs
• SPR revenue reconciliation on
units shipped
• Book profit margins reflect average
gross profit
• Difference between actual and
average cost reflected in inventory
• SPR updates profit estimates
every quarter
Revenue
Average
Gross Profit
Actual Cost
exceeds Average
so Inventory
builds
Average Cost
Actual Cost
below
Average so
Inventory declines
Units Delivered/Time
Revenue &
Cost/Unit
New Progams Contract Block Units
787 500
G650 350
G280 250
BR725 350
747-8 56
14
Contract Accounting New Program Perspective
Most Important SPR Accounting Policy

146 280
418 441 485 495 475
-
500
1,000
1,500
2,000
2,500
3,000
3,500
4,000
2006 2007 2008 2009 2010 2011 2012F 2013F
$ M
illi
on
Capitalized Pre-production
694 1,006
1,302 1,309 1,263 1,323 1,225
-
500
1,000
1,500
2,000
2,500
3,000
3,500
4,000
2006 2007 2008 2009 2010 2011 2012F 2013F
$ M
illi
on
Physical InventoryIncludes Non-recuring Production Costs
42 57 162
457
760 813
1,150
-
500
1,000
1,500
2,000
2,500
3,000
3,500
4,000
2006 2007 2008 2009 2010 2011 2012F 2013F
$ M
illi
on
Deferred Inventory
882
1,343
1,882
2,207
2,508 2,631
2,850
-
500
1,000
1,500
2,000
2,500
3,000
3,500
4,000
2006 2007 2008 2009 2010 2011 2012F 2013F
$ M
illi
on
Total Inventory
Inventory Trend and Outlook
15
New Program Investment Peaking
Total Inventory Deferred Inventory
Physical Inventory Includes Non-recurring Production Costs
Capitalized Pre-Production
~
~
~
~

Reinvesting For Growth and Diversification
Cash Flow from Operations
16
Excludes 787 MOA settlement cash received in 4th quarter 2010
As reported
Financial Guidance
Guidance
Improving Cash Flow
Strong core business cash flow increasing
Advance repayments moderating
New program investments peaking
Dri
vers
1. Non-GAAP measure. Definitions, reconciliations, and further disclosures regarding this non-GAAP measure are appended to this document.
1.

Financial Guidance
17
2012 Financial Guidance
2012 Guidance
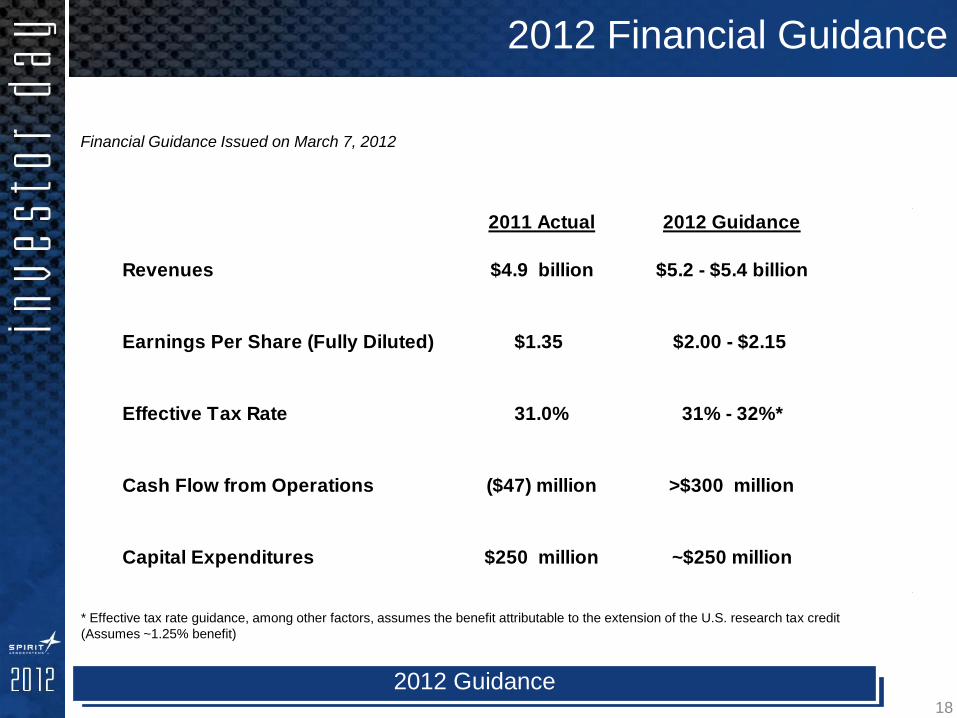
Financial Guidance Issued on March 7, 2012
* Effective tax rate guidance, among other factors, assumes the benefit attributable to the extension of the U.S. research tax credit
(Assumes ~1.25% benefit)
18
2011 Actual 2012 Guidance
Revenues $4.9 billion $5.2 - $5.4 billion
Earnings Per Share (Fully Diluted) $1.35 $2.00 - $2.15
Effective Tax Rate 31.0% 31% - 32%*
Cash Flow from Operations ($47) million >$300 million
Capital Expenditures $250 million ~$250 million

Revenue
Gross Profit Margins
• Significant growth from 787 and new programs moving to production
• Growth from core program rate increases
• Incremental margin improvement in new accounting blocks
• Moving work to lower-cost locations (Malaysia, North Carolina)
• Modest labor cost increases expected in current environment
• Dilutive new program margins
SG&A/R&D • Combined SG&A and R&D 4% - 4.25%
Free Cash Flow
• Liquidated first tranche of 787 advances and spread second tranche over
1,000 units
• New programs move to revenue generating production units
• New program investment peaking
• 737 MAX investment
• Opportunities to improve inventory turns for legacy programs
• No pension funding anticipated for U.S. defined benefit plan
Post 2012 Financial Trends
Top Line Growth & Cash Generation 19

Financial Summary
• Captured Growth
• New program investment peaking
• Moving to positive cash flow
• Looking Forward…
– Focused on productivity and efficiency
– More modest investment environment… Product refresh
– Be more selective on “clean sheet” design opportunities
– Continue to proactively manage capital structure and liquidity
20
40 Executing Our Strategy
Business Summary
• Strong long-term market demand
• Strategically positioned on best programs in commercial
aerospace
• Revenue growth projected as market demand increases
• Core business driving earnings growth and strong cash flows
• Continuing to manage development program risk
• Financially strong
21
41 Delivering Value

22

23
Non-GAAP Measure Disclosure
Management believes that the non-GAAP (Generally Accepted Accounting Principles) measures (indicated by 1) used in this
report provide investors with important perspectives into the company’s ongoing business performance. The company does
not intend for the information to be considered in isolation or as a substitute for the related GAAP measure. Other companies
may define the measure differently.
Q1 Q2 Q3 Q4 Q1 Q2 Q3 Q4
Revenue (GAAP) 1,043.3$ 1,056.0$ 1,002.0$ 1,071.1$ 1,049.6$ 1,465.6$ 1,129.7$ 1,218.9$
Operating Income (GAAP) 93.0$ 85.7$ 82.4$ 95.9$ 69.6$ 63.6$ 120.5$ 102.4$
New Program Charges
Gulfstream G280 2.8$ 53.3$ 28.5$
Sikorsky CH-53K 28.2$ 10.0$ (9.2)$
B747-8 18.3$
B787
A350 XWB 3.0$
Total New Proram Charges -$ -$ -$ 2.8$ 28.2$ 53.3$ 10.0$ 40.6$
Other
Cumulative Catch 8.2$ 4.2$ 10.1$ 3.1$ (6.3)$ (3.7)$ (21.2)$
Warranty and Extranordinary Rework 9.0$
IAM Stock Compensations 18.9$
IAM Early Retirement Incentive 6.5$
UAW Stock Compensation 3.3$
UAW Early Retirement 1.8$
Total Other 8.2$ 18.9$ 10.7$ 13.4$ 3.1$ 4.5$ (3.7)$ (21.2)$
Total 8.2$ 18.9$ 10.7$ 16.2$ 31.3$ 57.8$ 6.3$ 19.4$
Adjusted Operating Income 101.2$ 104.6$ 93.1$ 112.1$ 100.9$ 121.4$ 126.8$ 121.8$
Adjusted Operating Margin 9.7% 9.9% 9.3% 10.5% 9.6% 8.3% 11.2% 10.0%
12/31/2010
Cash Flow From Operations (GAAP) 125.1$
Boeing Memorandum of Agreement ("MOA") (236.2)$
Cash Flow From Operations Excluding MOA (111.10)$
2010 2011

David Coleal
Senior VP / General Manager
Fuselage Business Segment
March 7, 2012
Fuselage Segment: Operational Efficiency

2
Fuselage Segment
Boeing 747
Boeing 777
Boeing 787
Boeing 737
Boeing 767 Sikorsky
Airbus A350 XWB

Fuselage Segment Perspective
$2,425.0
$1,221.5
$1,207.8
Fuselage Propulsion Wing
2011 Revenues
$1,570.0
$1,790.7 $1,758.4
$2,003.6 $2,035.1
$2,425.0
$-
$500.0
$1,000.0
$1,500.0
$2,000.0
$2,500.0
$3,000.0
2006 2007 2008 2009 2010 2011$
Mill
ion
Fuselage Revenues
3
$ Million
Strong Core Business Growth
Excludes All other segment income of $9.5M

• Reduce Operating Costs and Improve Product Quality to Increase
Margins and Enhance Customer Satisfaction
• Engage/Optimize Supply Base to Meet Initiatives
• Lead New Programs for Manufacturable / On Schedule / Cost
Efficient Product to Ensure Profitability
• Engage and Develop our Employees / Leaders to Maximize
Performance
• Document, Share and Deploy Best Practices to Achieve
Functional Excellence (SQCDT)
Fuselage Segment Focus
4

Value Engineering
Operational
Discipline Lean Maturity
• Design For Manufacturing
• Knowledge Based
Engineering
• Functional Excellence
• Spirit EXACT
• Daily Communication
• Rapid Problem Solving
• Focused Execution
• Employee Engagement
• Leadership Visibility
• Growth Platform for
Lean
• Continuous Improvement
• Waste Reduction
• Flow Reduction
• Improved Quality
• Cost Reduction
• Customer Satisfaction
Engaged Workforce
Operational Efficiency Model
Keys to Continued Success
5

Daily Operational Discipline
Rapid Communication & Problem Solving at All Levels 6

Lean Maturity Approach
Focus on an Engaged Team….All the Time! 7

Oklahoma Slat Moving Line • Labor efficiency
• Optimized flow
Prestwick
Automated Drilling • Improved quality
• Reduced testing
• Structural optimization
Propulsion Streamlined Parts Cleaning
• Reduced flow
• Reduction of hazardous waste
Fuselage Pull Production System •Reduced inventory
•Increased throughput
•Lower overtime
Lean Maturity Across Spirit
Improving Efficiency Across the Company
Malaysia 787 Fixed Leading Edge
• Inventory reduction
• Improved cycle time
• Labor/shipping cost reduction
8

9

John Pilla
Senior VP / General Manager
Propulsion Business Segment
March 7, 2012
Propulsion Segment: Value Engineering
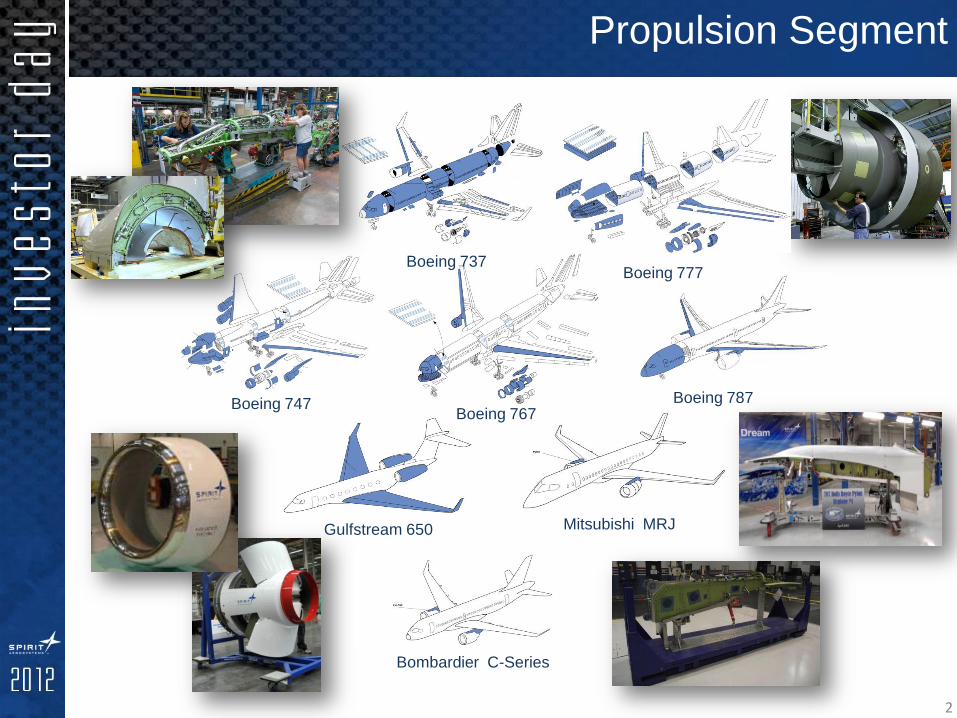
Propulsion Segment
Boeing 787 Boeing 767
Boeing 777 Boeing 737
Boeing 747
Gulfstream 650
Bombardier C-Series
Mitsubishi MRJ
2

Propulsion Segment Perspective
2011 Revenues Propulsion Revenues
$887.7
$1,063.6 $1,031.7 $1,030.0 $1,061.8
$1,221.5
$-
$200.0
$400.0
$600.0
$800.0
$1,000.0
$1,200.0
$1,400.0
2006 2007 2008 2009 2010 2011
$ M
illi
on$2,425.0
$1,221.5
$1,207.8
Fuselage Propulsion Wing
3
$ Million
Strong Core Business Growth
Excludes All other segment income of $9.5M

• Reduce Operating Costs and Improve Product Quality to Increase
Margins and Enhance Customer Satisfaction
• Engage/Optimize Supply Base to Meet Initiatives
• Lead New Programs for Manufacturable / On Schedule / Cost
Efficient Product to Ensure Profitability
• Engage and Develop our Employees / Leaders to Maximize
Performance
• Document, Share and Deploy Best Practices to Achieve
Functional Excellence (SQCDT)
Propulsion Segment Focus
4

Value Engineering
Keys to Continued Success 5
Value Engineering
Operational
Discipline Lean Maturity
• Design For Manufacturing
• Knowledge Based
Engineering
• Functional Excellence
• Spirit EXACT
• Daily Communication
• Rapid Problem Solving
• Focused Execution
• Employee Engagement
• Leadership Visibility
• Growth Platform for
Lean
• Continuous Improvement
• Waste Reduction
• Flow Reduction
• Improved Quality
• Cost Reduction
• Customer Satisfaction
Engaged Workforce

Design Develop Produce
$
Greatest Impact
Program Phases
Design For Manufacturing
Investing Up Front for Long Term Production Benefits 6
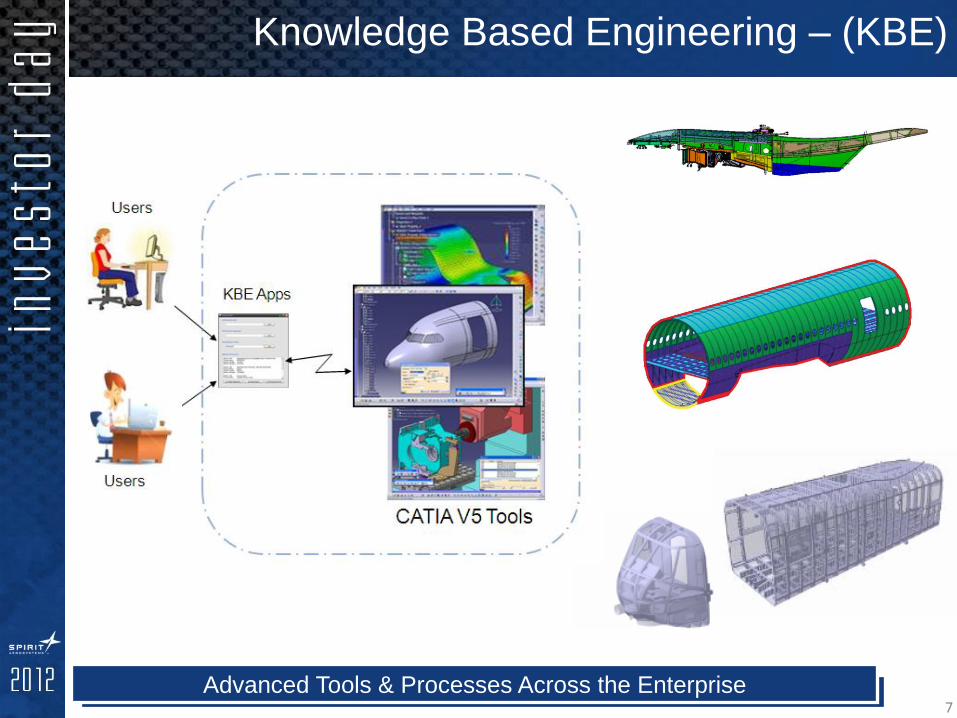
Knowledge Based Engineering – (KBE)
Advanced Tools & Processes Across the Enterprise 7

Spirit Exact
Spirit Exact Reduces Cost , Variation, and Lead Time 8
Detail Tooling • Part location & measurement
• Framework for drill plate support
Automated Tooling • Self-locating parts
• Flexible robotic drilling
™
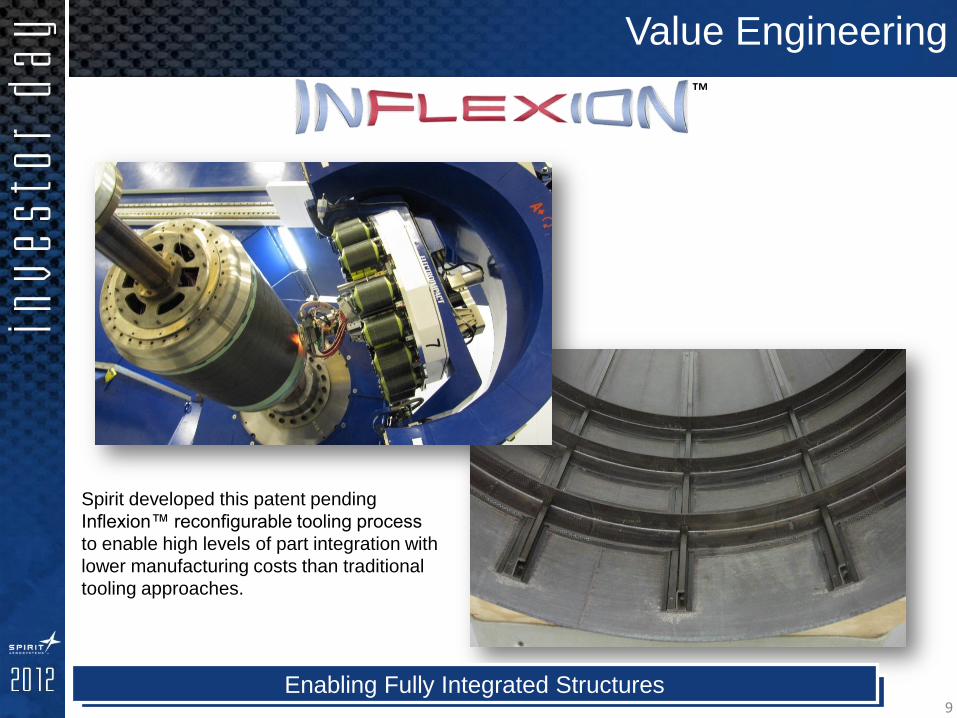
Value Engineering
9
Spirit developed this patent pending
Inflexion™ reconfigurable tooling process
to enable high levels of part integration with
lower manufacturing costs than traditional
tooling approaches.
™
Enabling Fully Integrated Structures

10

Alex Kummant
Senior VP/ General Manager
Oklahoma Operations
March 7, 2012
Wing Segment: New Program Execution
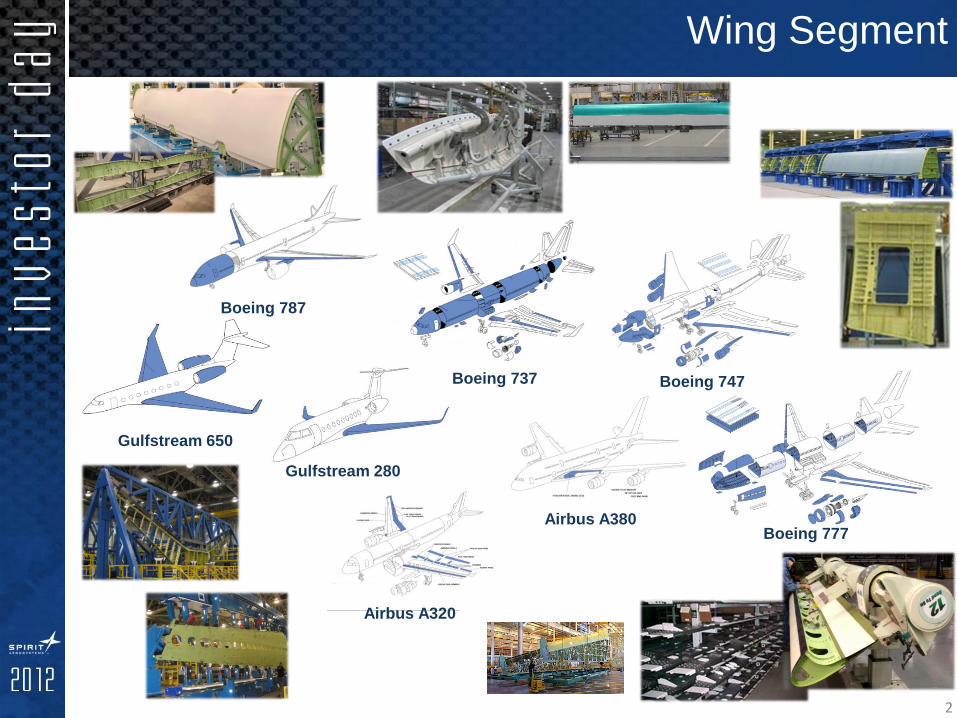
Wing Segment
2
Boeing 777
Gulfstream 650
Boeing 747
Boeing 787
Gulfstream 280
Airbus A320
Airbus A380
Boeing 737

Wing Segment Perspective
2011 Revenues Wing Revenues
$2,425.0
$1,221.5
$1,207.8
Fuselage Propulsion Wing
$720.3
$985.5 $955.6 $1,024.4
$1,067.4
$1,207.8
$-
$200.0
$400.0
$600.0
$800.0
$1,000.0
$1,200.0
$1,400.0
2006 2007 2008 2009 2010 2011
$ M
illio
n
3
$ Million
Strong Core Business Growth
Excludes All other segment income of $9.5M

• Reduce Operating Costs and Improve Product Quality to Increase
Margins and Enhance Customer Satisfaction
• Engage/Optimize Supply Base to Meet Initiatives
• Lead New Programs for Manufacturable / On Schedule / Cost
Efficient Product to Ensure Profitability
• Engage and Develop our Employees / Leaders to Maximize
Performance
• Document, Share and Deploy Best Practices to Achieve
Functional Excellence (SQCDT)
Wing Segment Focus
4
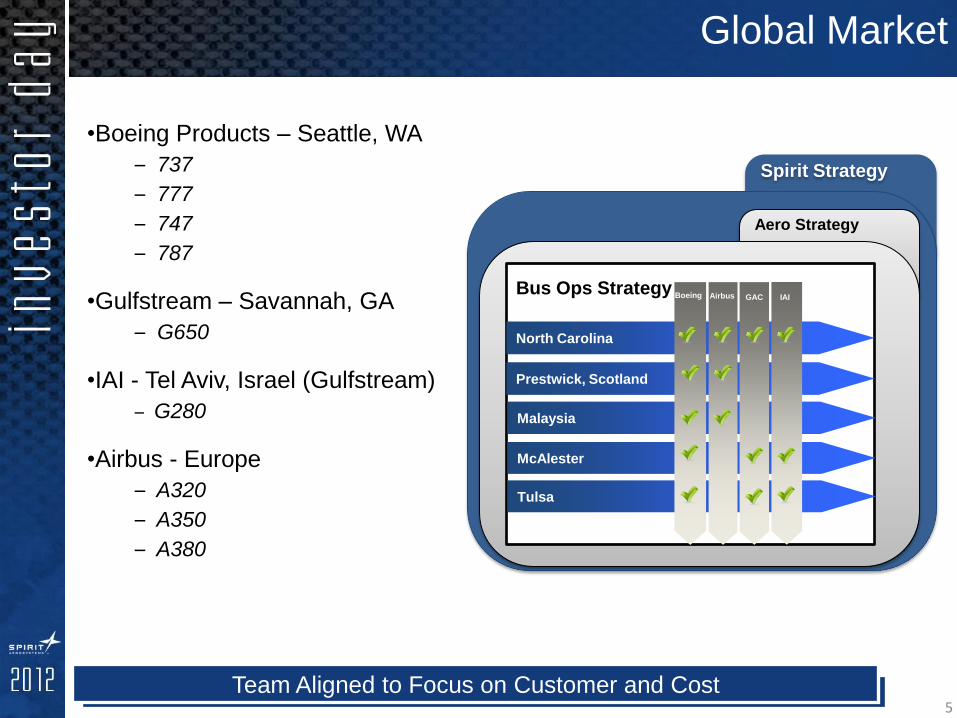
Spirit Strategy
•Boeing Products – Seattle, WA
– 737
– 777
– 747
– 787
•Gulfstream – Savannah, GA
– G650
•IAI - Tel Aviv, Israel (Gulfstream)
– G280
•Airbus - Europe
– A320
– A350
– A380
North Carolina
Prestwick, Scotland
Malaysia
McAlester
Tulsa
IAI Legacy Airbus GAC Bus Ops Strategy
Aero Strategy
Boeing
Global Market
Team Aligned to Focus on Customer and Cost 5

Executing the Business Strategic Placement Lean Investment Plant Floor Evolution
A320 787
200+ Lean Events for 2012 737 Slat Moving Line
A380 737 777 747
Executing Core Business
6 Focused on Continuous Improvement

• 737 stationary tools
• Limited floor space
• Interrupted product flow
• Limited lighting
• Optimized moving product flow
• Improved lighting/quality
• Operational effectiveness
Talladega Assembly Line
737 Flaps and Slats Program
7

• Fixed Leading Edge line transition to Malaysia
• Incorporating improvements
• Work-in-Process reduction
• Improved cycle time and delivery flow
• Labor and shipping cost reductions
Fixed Leading Edge
Detailed Assembly
787 Wing Leading Edge Program
8
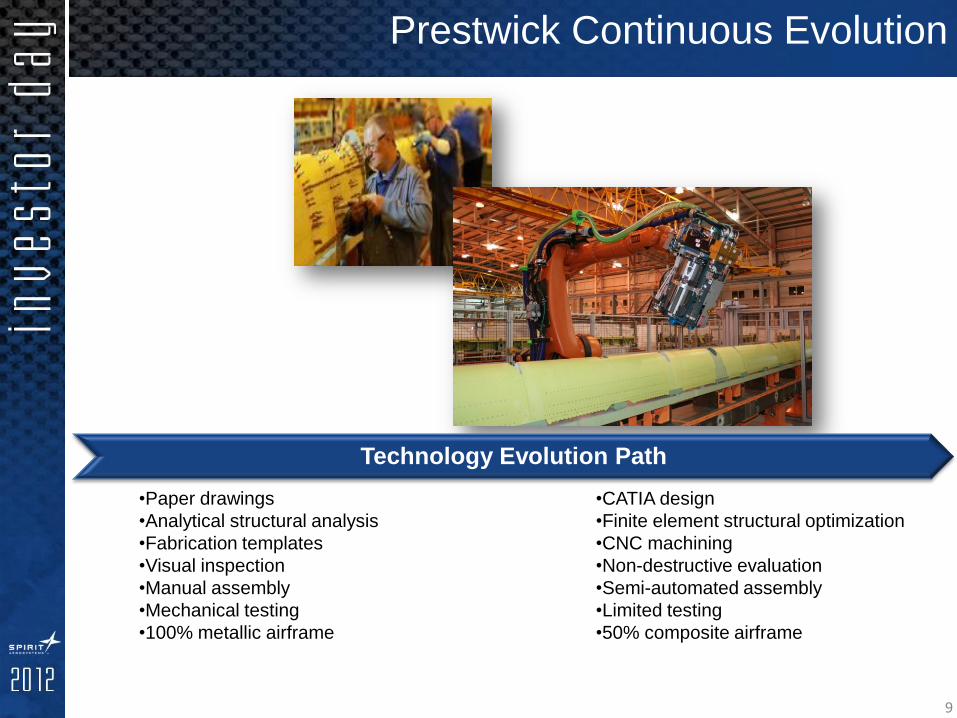
•Paper drawings
•Analytical structural analysis
•Fabrication templates
•Visual inspection
•Manual assembly
•Mechanical testing
•100% metallic airframe
•CATIA design
•Finite element structural optimization
•CNC machining
•Non-destructive evaluation
•Semi-automated assembly
•Limited testing
•50% composite airframe
Prestwick Continuous Evolution
Technology Evolution Path
9
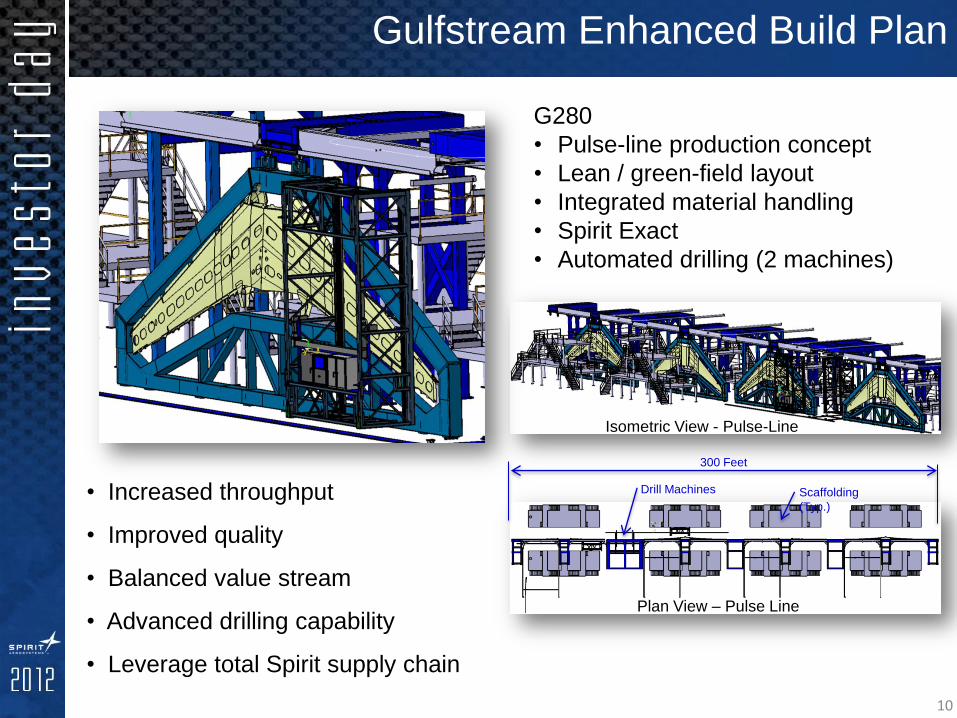
G280
• Pulse-line production concept
• Lean / green-field layout
• Integrated material handling
• Spirit Exact
• Automated drilling (2 machines)
• Increased throughput
• Improved quality
• Balanced value stream
• Advanced drilling capability
• Leverage total Spirit supply chain
Isometric View - Pulse-Line
Plan View – Pulse Line
Scaffolding
(Typ.)
Drill Machines
300 Feet
Gulfstream Enhanced Build Plan
10

• Supply chain improvements
• Technology development
• Early start to -1000
• Full implementation of Spirit Exact
• Flawless fit-up of parts
• Ease of integration with Center Wing Box
A350 XWB Leading Edge Spar
• Technology validated
• Achieved mass targets
• In series production
• Strong schedule position
• Few defects
• Rate capable
• Spirit Exact-integration with Fixed Leading Edge
• Common wing & -1000 next up
A350 XWB Section 15
Customer Response to Product
11
Spirit France

Up-front Program Planning
Capture and Manage Program
Requirements
Program Execution
Change Management
Training and Coaching
On Time, Profitable New Program Execution
•Program
management plan
•Gated review
process
•Value stream
mapping
•IPT/Org Identified
•Manage OEM’s
requirements
•System
Engineering
•Team center SE
tool
•Contracting
•Integrated
program schedules
•Earned value
management
•Life cycle
management
•Risk , Issue &
Opportunity
•Accountability
•Electronic
document
management
•Change boards
•Robust Change
Management
•Knowledge
sharing
•Customer
Relationship
Management
•Critical Chain
Scheduling
•PMBP Training
Program Management Best Practices
12
New Program Execution
13

Terry George
Vice President 787 Program
March 7, 2012
787 Program Update

787 Program Summary
2
Boeing 787
• 787-8 certified and in-service
• 787-9 in development
• Strong customer base and order backlog
• 870 orders with 56 identified customers
Strong Customer Demand Strong Customer Demand
555, 64%
315, 36%
787-9
787-8
787 Orders
As of: February 2012
Source: Boeing website

Spirit 787 Statement of Work
3 Strong Customer Demand Design, Build and Deliver Flight Ready Structures

• Forward Fuselage
• Delivered ship set #59 to Everett, WA
• Delivered ship set #60 to Charleston, SC
• Excellent condition of assembly
• Planning to deliver approx. 40 Fuselage ship sets in 2012
• Engine Pylons
• Delivered ship set #62
• Wing Components
• Fixed leading edge ship set #75 and moveable leading edge
#61 delivered
• Engineering
• Beginning to Release Engineering for the 787-9 Derivative
Spirit 787 Program Update
4
Forward Fuselage double load — February 2012
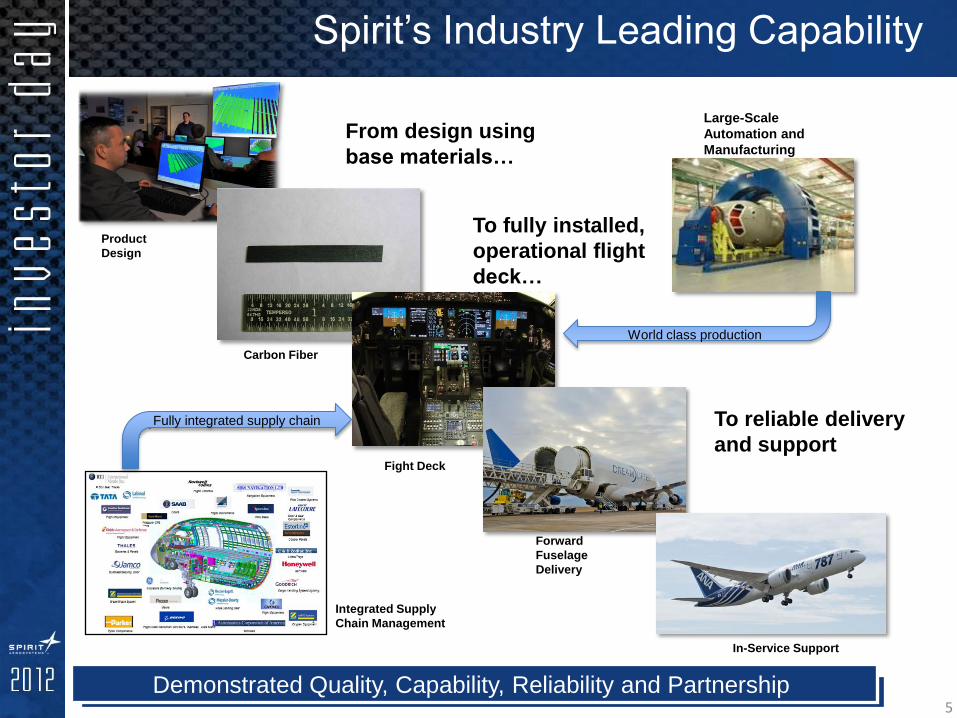
Spirit’s Industry Leading Capability
5 Strong Customer Demand Demonstrated Quality, Capability, Reliability and Partnership
In-Service Support
Integrated Supply
Chain Management
Product
Design
Carbon Fiber
Fight Deck
Forward
Fuselage
Delivery
Fully integrated supply chain
World class production
Large-Scale
Automation and
Manufacturing
From design using
base materials…
To fully installed,
operational flight
deck…
To reliable delivery
and support
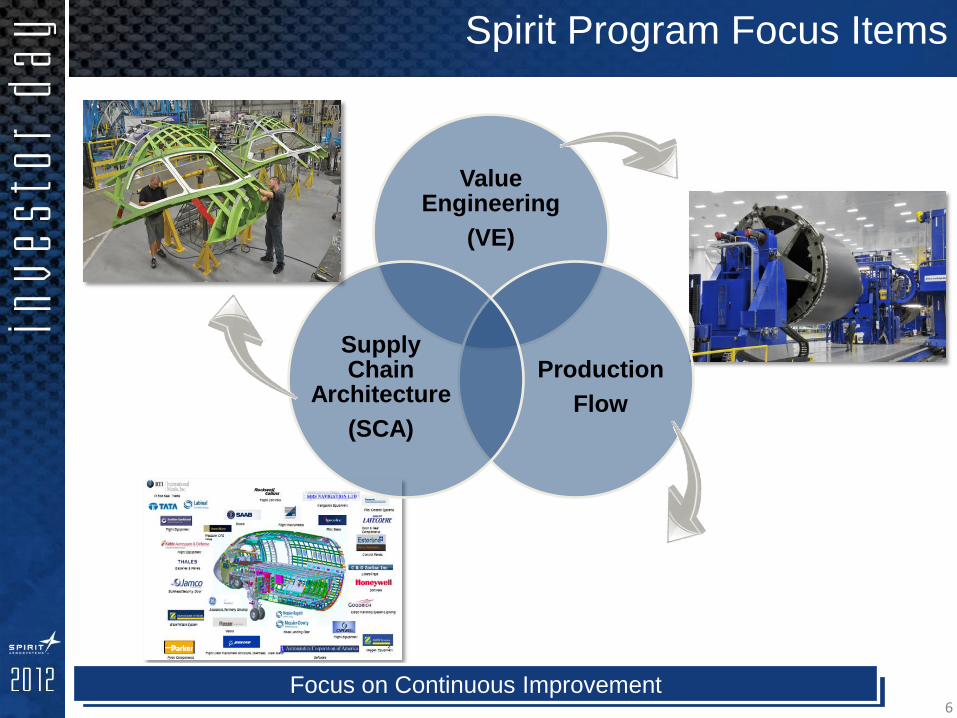
Value Engineering
(VE)
Production
Flow
Supply Chain
Architecture
(SCA)
Spirit Program Focus Items
6
NWW FWD Bulkhead Bolt to Rivet Monolithic Cab Focus on Continuous Improvement

3.5apm 7.0apm 10apm 5.0apm
Rate Readiness Overview
7 Robust Rate Readiness Planning
People Ready
Supply Chain Ready
Factory Ready

Summary
• Strong orders and backlog
• Spirit content demonstrates capabilities
• Focused on quality and cost improvements
8

9

Sam Marnick
Senior VP / Corporate
Administration & Human Resources
March 7, 2012
Aligning the Team

The Spirit Team
A Growing Global Team
2

People Strategy
• Deploy performance management
• Align individual, team & enterprise performance
• Embed daily management & operating disciplines
Drive performance excellence to protect
and grow spirit
• Identify, acquire & develop global talent
• Focus training on-the-job & on knowledge transfer
Build the team for the future to deliver spirit’s strategic
advantage
• Focus labor relationships on driving value
• Realize productivity & efficiency gains
Build strategic internal and external partnerships
Opportunity to Focus on Labor
3
New Model
Variable
Fixed
Previous Model
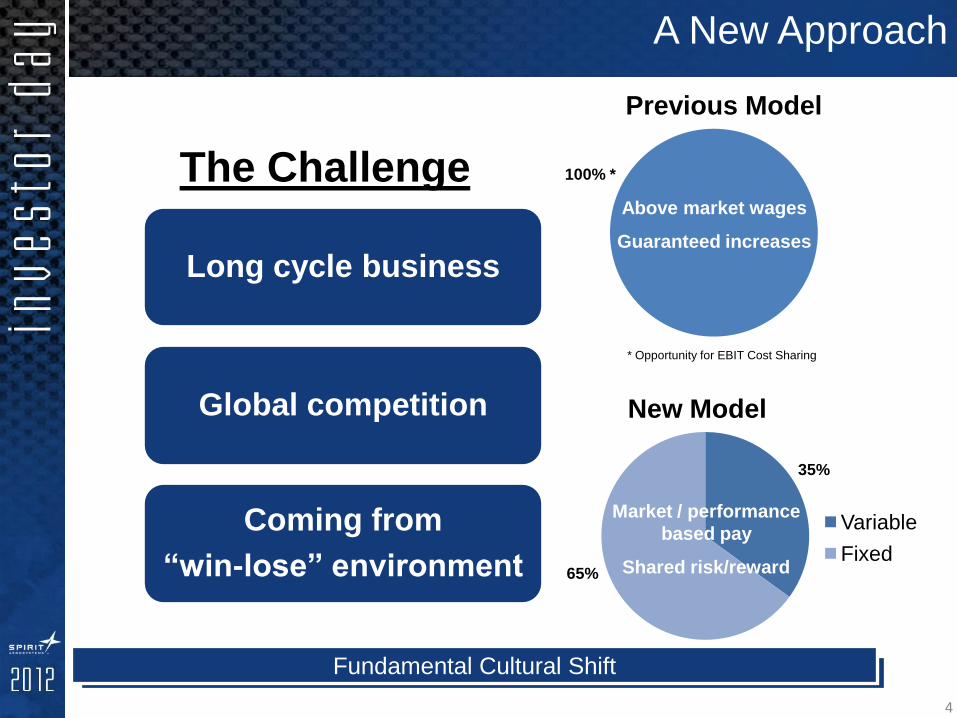
The Challenge
Long cycle business
Global competition
Coming from
“win-lose” environment
* Opportunity for EBIT Cost Sharing
A New Approach
Fundamental Cultural Shift
4
Market / performance
based pay
Shared risk/reward
Above market wages
Guaranteed increases
100% *
35%
65%
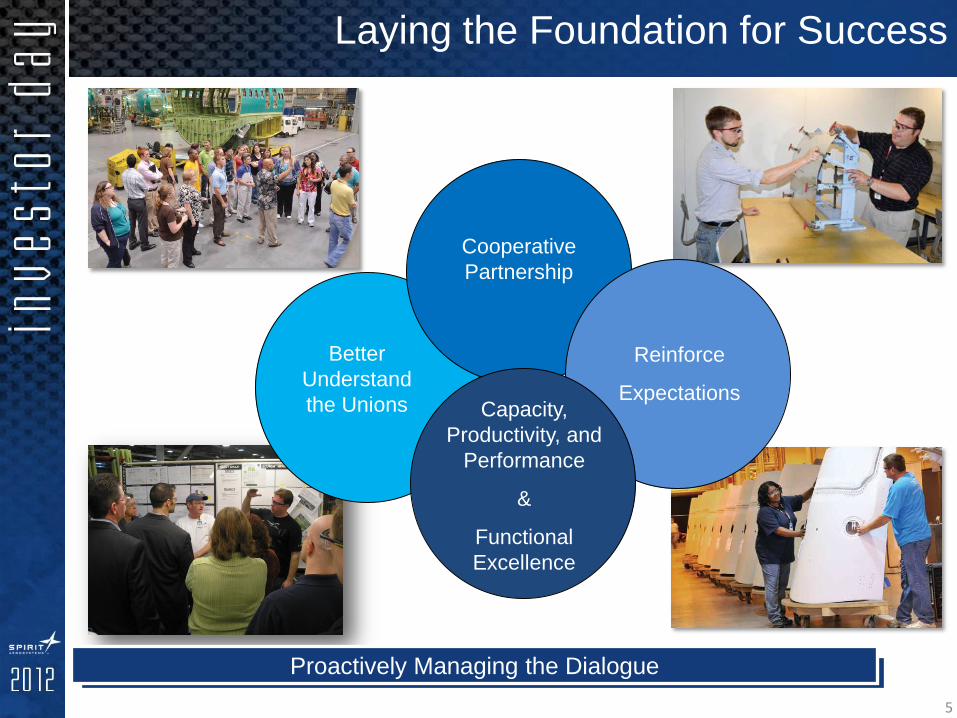
Laying the Foundation for Success
Better
Understand
the Unions
Cooperative
Partnership
Reinforce
Expectations
Proactively Managing the Dialogue
5
Capacity,
Productivity, and
Performance
&
Functional
Excellence

Ensure Stability for our customers and competitiveness of the unit,
through an enhanced partnership with a long-term agreement
Build the Flexibility required to maintain a healthy business that aligns with the production cycles
and productivity challenges
Provide Health Care options that Align with the Needs of the
Employees, as well as supporting the realities of the economic
market conditions through the life of the contract
Align Compensation with market and business performance, while
providing baseline protection
Keep The Company Healthy & The Team for The Future Intact
Contract Objectives
6
―Win-Win‖ Outcomes

Key Success Factors
Visible Leadership
Educate About Spirit
Shared Responsibility
Targeted Interaction
Where We Are Today
Creating a Drumbeat on the Floor 7

• Long Term Agreements in Place
-IAM, IBEW, UAW, & SPEEA-WTPU
• Collaborative Relationships
- Living agreements that can flow with the business
• Performance Compensation
- Company & bargaining unit specific performance targets
• Health Care Cost Escalation
- Incentives to migrate to lower costs & encourage wellness
Summary
Building on a Solid Foundation
8

9
Jeff Turner
President and Chief Executive Officer
March 7, 2012
Closing Comments

• Positioned on best selling platforms in the business
• Core business execution is strong — extending life of programs
• Successfully delivering higher production volumes — increasing through 2014
• New programs transitioning to production
• Focused on execution
• Financially strong
Long Term Value Creation
Summary
2
3