costar office report - mcalpine · pdf filed the costar office report ©2013 costar group,...
TRANSCRIPT

Houston Office MarketY E A R - E N D 2 0 1 2
The CoStarOffice Report

Houston Office Market
©2013 COSTAR GROUP, INC. THE COSTAR OFFICE REPORT A
YEAR-END 2012 – HOUSTON
Table of ContentsTable of Contents . . . . . . . . . . . . . . . . . . . . . . . . . . . . . . . . . . . . . . . . . . . . . . . . . . . . . . . . . . . . . . . . . . . . A
Methodology. . . . . . . . . . . . . . . . . . . . . . . . . . . . . . . . . . . . . . . . . . . . . . . . . . . . . . . . . . . . . . . . . . . . . . . . C
Terms & Definitions. . . . . . . . . . . . . . . . . . . . . . . . . . . . . . . . . . . . . . . . . . . . . . . . . . . . . . . . . . . . . . . . . . D
Market Highlights & Overview. . . . . . . . . . . . . . . . . . . . . . . . . . . . . . . . . . . . . . . . . . . . . . . . . . . . . . . . . 1
CoStar Markets & Submarkets . . . . . . . . . . . . . . . . . . . . . . . . . . . . . . . . . . . . . . . . . . . . . . . . . . . . . . . . . 4
Inventory & Development Analysis. . . . . . . . . . . . . . . . . . . . . . . . . . . . . . . . . . . . . . . . . . . . . . . . . . . . . . 5Inventory & Development AnalysisSelect Top DeliveriesSelect Top Under Construction Properties
Figures at a Glance . . . . . . . . . . . . . . . . . . . . . . . . . . . . . . . . . . . . . . . . . . . . . . . . . . . . . . . . . . . . . . . . . . . 9Figures at a Glance by Class & MarketFigures at a Glance by Class & SubmarketFigures at a Glance Grouped by CBD vs SuburbanHistorical Figures at a Glance
Leasing Activity Analysis . . . . . . . . . . . . . . . . . . . . . . . . . . . . . . . . . . . . . . . . . . . . . . . . . . . . . . . . . . . . . 17Select Top Lease Transactions
Sales Activity Analysis . . . . . . . . . . . . . . . . . . . . . . . . . . . . . . . . . . . . . . . . . . . . . . . . . . . . . . . . . . . . . . . 19Sales Activity AnalysisSelect Top Sales TransactionsAustin County Market
Analysis of Individual CoStar Submarket Clusters . . . . . . . . . . . . . . . . . . . . . . . . . . . . . . . . . . . . . . . . . 22Bellaire MarketDowntown MarketE Fort Bend Co/Sugar Land MarketFM 1960 MarketGreenway Plaza MarketGulf Freeway/Pasadena MarketI-10 East MarketKaty Freeway MarketKingwood/Humble MarketNASA/Clear Lake MarketNorth Belt MarketNortheast Near MarketNorthwest MarketRichmond/Fountainview MarketSan Felipe/Voss MarketSan Jacinto County MarketSouth MarketSouth Hwy 35 MarketSouth Main/Medical Center MarketSouthwest MarketWest Loop MarketWestchase MarketWoodlands Market
Houston Office Market
B THE COSTAR OFFICE REPORT ©2013 COSTAR GROUP, INC.
HOUSTON – YEAR-END 2012
Houston Office Market
©2013 COSTAR GROUP, INC. THE COSTAR OFFICE REPORT C
YEAR-END 2012 – HOUSTON
Table of Contents (Continued)

Houston Office Market
B THE COSTAR OFFICE REPORT ©2013 COSTAR GROUP, INC.
HOUSTON – YEAR-END 2012
Houston Office Market
©2013 COSTAR GROUP, INC. THE COSTAR OFFICE REPORT C
YEAR-END 2012 – HOUSTON
Methodology
The CoStar Office Report, unless specifically stated otherwise, calculates office statistics using CoStar Group’s entire database of existing and under construction office buildings in each metropolitan area. Included are office, office condominium, office loft, office medical, all classes and all sizes, and both multi-tenant and single-tenant buildings, including owner-occupied buildings. CoStar Group's national database includes approximately 80.7 billion square feet of coverage in 3.5 million properties. All rental rates reported in the CoStar Office Report have been converted to a Full Service equivalent rental rate.
© Copyright 2013 CoStar Group, Inc. All Rights Reserved. Although CoStar makes efforts to ensure the accuracy and reliability of the information contained herein, CoStar makes no guarantee, representation or warranty regarding the quality, accuracy, timeliness or completeness of the information. The publication is provided ‘as is’ and CoStar expressly disclaims any guarantees, representations or warranties of any kind, including those of MERCHANTABILITY AND FITNESS FOR A PARTICULAR PURPOSE.
CoStar Group, Inc.
1331 L ST NW • Washington, DC 20005• (800) 204-5960 • www.costar.com • NASDAQ: CSGP
For information on subscribing to CoStar’s other products and services, please contact us at
1-877-7COSTAR, or visit our web site at www.costar.com

Houston Office Market
D THE COSTAR OFFICE REPORT ©2013 COSTAR GROUP, INC.
HOUSTON – YEAR-END 2012
Houston Office Market
©2013 COSTAR GROUP, INC. THE COSTAR OFFICE REPORT E
YEAR-END 2012 – HOUSTON
Terms & DefinitionsAvailability Rate: The ratio of available space to total rentable space, calculated by dividing the total available square feet by the total rentable square feet.
Available Space: The total amount of space that is currently being marketed as available for lease in a given time period. It includes any space that is available, regardless of whether the space is vacant, occupied, available for sublease, or available at a future date.
Build-to-Suit: A term describing a particular property, developed specifically for a certain tenant to occupy, with structural features, systems, or improvement work designed specifically for the needs of that tenant. A build-to-suit can be leased or owned by the ten-ant. In a leased build-to-suit, a tenant will usually have a long term lease on the space.
Buyer: The individual, group, company, or entity that has pur-chased a commercial real estate asset.
Cap Rate: Short for capitalization rate. The Cap Rate is a calcula-tion that reflects the relationship between one year’s net operating income and the current market value of a particular property. The Cap Rate is calculated by dividing the annual net operating income by the sales price (or asking sales price).
CBD: Abbreviation for Central Business District. (See also: Central Business District)
Central Business District: The designations of Central Business District (CBD) and Suburban refer to a particular geographic area within a metropolitan statistical area (MSA) describing the level of real estate development found there. The CBD is characterized by a high density, well organized core within the largest city of a given MSA.
Class A: A classification used to describe buildings that generally qualify as extremely desirable investment-grade properties and command the highest rents or sale prices compared to other buildings in the same market. Such buildings are well located and provide efficient tenant layouts as well as high quality, and in some buildings, one-of-a-kind floor plans. They can be an archi-tectural or historical landmark designed by prominent architects. These buildings contain a modern mechanical system, and have above-average maintenance and management as well as the best quality materials and workmanship in their trim and interior fit-tings. They are generally the most attractive and eagerly sought by investors willing to pay a premium for quality.
Class B: A classification used to describe buildings that generally qualify as a more speculative investment, and as such, command lower rents or sale prices compared to Class A properties. Such buildings offer utilitarian space without special attractions, and have ordinary design, if new or fairly new; good to excellent design if an older non-landmark building. These buildings typical-ly have average to good maintenance, management and tenants. They are less appealing to tenants than Class A properties, and may be deficient in a number of respects including floor plans, condition and facilities. They lack prestige and must depend chiefly on a lower price to attract tenants and investors.
Class C: A classification used to describe buildings that gener-ally qualify as no-frills, older buildings that offer basic space and command lower rents or sale prices compared to other buildings in the same market. Such buildings typically have below-average maintenance and management, and could have mixed or low tenant prestige, inferior elevators, and/or mechanical/electrical systems. These buildings lack prestige and must depend chiefly on a lower price to attract tenants and investors.
Construction Starts: Buildings that began construction during a specific period of time. (See also: Deliveries)
Contiguous Blocks of Space: Space within a building that is, or is able to be joined together into a single contiguous space.
Deliveries: Buildings that complete construction during a specified period of time. In order for space to be considered delivered, a certificate of occupancy must have been issued for the property.
Delivery Date: The date a building completes construction and receives a certificate of occupancy.
Developer: The company, entity or individual that transforms raw land to improved property by use of labor, capital and entrepre-neurial efforts.
Direct Space: Space that is being offered for lease directly from the landlord or owner of a building, as opposed to space being offered in a building by another tenant (or broker of a tenant) trying to sublet a space that has already been leased.
Existing Inventory: The square footage of buildings that have received a certificate of occupancy and are able to be occupied by tenants. It does not include space in buildings that are either planned, under construction or under renovation.
Flex Building: A type of building designed to be versatile, which may be used in combination with office (corporate headquarters), research and development, quasi-retail sales, and including but not limited to industrial, warehouse, and distribution uses. A typi-cal flex building will be one or two stories with at least half of the rentable area being used as office space, have ceiling heights of 16 feet or less, and have some type of drive-in door, even though the door may be glassed in or sealed off.
Full Service Rental Rate: Rental rates that include all operating expenses such as utilities, electricity, janitorial services, taxes and insurance.
Gross Absorption: The total change in occupied space over a given period of time, counting space that is occupied but not space that is vacated by tenants. Gross absorption differs from leasing Activity, which is the sum of all space leased over a certain period of time. Unless otherwise noted Gross Absorption includes direct and sublease space.
Growth in Inventory: The change in size of the existing square footage in a given area over a given period of time, generally due to the construction of new buildings.
Industrial Building: A type of building adapted for such uses as the assemblage, processing, and/or manufacturing of products from raw materials or fabricated parts. Additional uses include warehousing, distribution, and maintenance facilities. The pri-mary purpose of the space is for storing, producing, assembling, or distributing product.
Landlord Rep: (Landlord Representative) In a typical lease trans-action between an owner/landlord and tenant, the broker that represents the interests of the owner/landlord is referred to as the Landlord Rep.
Leased Space: All the space that has a financial lease obligation. It includes all leased space, regardless of whether the space is currently occupied by a tenant. Leased space also includes space being offered for sublease.
Leasing Activity: The volume of square footage that is commit-ted to and signed under a lease obligation for a specific building or market in a given period of time. It includes direct leases, subleases and renewals of existing leases. It also includes any pre-leasing activity in planned, under construction, or under renovation buildings.
Market: Geographic boundaries that serve to delineate core areas that are competitive with each other and constitute a generally accepted primary competitive set of areas. Markets are building-type specific, and are non-overlapping contiguous geographic designations having a cumulative sum that matches the boundar-ies of the entire Region (See also: Region). Markets can be further subdivided into Submarkets. (See also: Submarkets)

Houston Office Market
D THE COSTAR OFFICE REPORT ©2013 COSTAR GROUP, INC.
HOUSTON – YEAR-END 2012
Houston Office Market
©2013 COSTAR GROUP, INC. THE COSTAR OFFICE REPORT E
YEAR-END 2012 – HOUSTON
Multi-Tenant: Buildings that house more than one tenant at a given time. Usually, multi-tenant buildings were designed and built to accommodate many different floor plans and designs for different tenant needs. (See also: Tenancy).
Net Absorption: The net change in occupied space over a given period of time. Unless otherwise noted Net Absorption includes direct and sublease space.
Net Rental Rate: A rental rate that excludes certain expenses that a tenant could incur in occupying office space. Such expenses are expected to be paid directly by the tenant and may include janitorial costs, electricity, utilities, taxes, insurance and other related costs.
New Space: Sometimes called first generation space, refers to space that has never been occupied and/or leased by a tenant.
Occupied Space: Space that is physically occupied by a tenant. It does not include leased space that is not currently occupied by a tenant.
Office Building: A type of commercial building used exclusively or primarily for office use (business), as opposed to manufactur-ing, warehousing, or other uses. Office buildings may sometimes have other associated uses within part of the building, i.e., retail sales, financial, or restaurant, usually on the ground floor.
Owner: The company, entity, or individual that holds title on a given building or property.
Planned/Proposed: The status of a building that has been announced for future development but not yet started construction.
Preleased Space: The amount of space in a building that has been leased prior to its construction completion date, or certificate of occupancy date.
Price/SF: Calculated by dividing the price of a building (either sales price or asking sales price) by the Rentable Building Area (RBA).
Property Manager: The company and/or person responsible for the day-to-day operations of a building, such as cleaning, trash removal, etc. The property manager also makes sure that the vari-ous systems within the building, such as the elevators, HVAC, and electrical systems, are functioning properly.
Quoted Rental Rate: The asking rate per square foot for a par-ticular building or unit of space by a broker or property owner. Quoted rental rates may differ from the actual rates paid by tenants following the negotiation of all terms and conditions in a specific lease.
RBA: Abbreviation for Rentable Building Area. (See also: Rentable Building Area)
Region: Core areas containing a large population nucleus, that together with adjacent communities have a high degree of eco-nomic and social integration. Regions are further divided into market areas, called Markets. (See also: Markets)
Relet Space: Sometimes called second generation or direct space, refers to existing space that has previously been occupied by another tenant.
Rentable Building Area: (RBA) The total square footage of a building that can be occupied by, or assigned to a tenant for the purpose of determining a tenant’s rental obligation. Generally RBA includes a percentage of common areas including all hall-ways, main lobbies, bathrooms, and telephone closets.
Rental Rates: The annual costs of occupancy for a particular space quoted on a per square foot basis.
Sales Price: The total dollar amount paid for a particular property at a particular point in time.
Sales Volume: The sum of sales prices for a given group of build-ings in a given time period.
Seller: The individual, group, company, or entity that sells a par-ticular commercial real estate asset.
SF: Abbreviation for Square Feet.
Single-Tenant: Buildings that are occupied, or intended to be occupied by a single tenant. (See also: Build-to-suit and Tenancy)
Sublease Space: Space that has been leased by a tenant and is being offered for lease back to the market by the tenant with the lease obligation. Sublease space is sometimes referred to as sublet space.
Submarkets: Specific geographic boundaries that serve to delin-eate a core group of buildings that are competitive with each other and constitute a generally accepted primary competitive set, or peer group. Submarkets are building type specific (office, industrial, retail, etc.), with distinct boundaries dependent on different factors relevant to each building type. Submarkets are non-overlapping, contiguous geographic designations having a cumulative sum that matches the boundaries of the Market they are located within (See also: Market).
Suburban: The Suburban and Central Business District (CBD) designations refer to a particular geographic area within a metro-politan statistical area (MSA). Suburban is defined as including all office inventory not located in the CBD. (See also: CBD)
Tenancy: A term used to indicate whether or not a building is occupied by multiple tenants (See also: Multi-tenant) or a single tenant. (See also: Single-tenant)
Tenant Rep: Tenant Rep stands for Tenant Representative. In a typical lease transaction between an owner/landlord and tenant, the broker that represents the interests of the tenant is referred to as a Tenant Rep.
Time On Market: A measure of how long a currently available space has been marketed for lease, regardless of whether it is vacant or occupied.
Under Construction: The status of a building that is in the process of being developed, assembled, built or constructed. A building is considered to be under construction after it has begun construc-tion and until it receives a certificate of occupancy.
Vacancy Rate: A measurement expressed as a percentage of the total amount of physically vacant space divided by the total amount of existing inventory. Under construction space generally is not included in vacancy calculations.
Vacant Space: Space that is not currently occupied by a tenant, regardless of any lease obligation that may be on the space. Vacant space could be space that is either available or not avail-able. For example, sublease space that is currently being paid for by a tenant but not occupied by that tenant, would be considered vacant space. Likewise, space that has been leased but not yet occupied because of finish work being done, would also be con-sidered vacant space.
Weighted Average Rental Rate: Rental rates that are calculated by factoring in, or weighting, the square footage associated with each particular rental rate. This has the effect of causing rental rates on larger spaces to affect the average more than that of smaller spaces. The weighted average rental rate is calculated by taking the ratio of the square footage associated with the rental rate on each individual available space to the square footage associated with rental rates on all available spaces, multiplying the rental rate by that ratio, and then adding together all the resulting numbers. Unless specifically specified otherwise, rental rate averages include both Direct and Sublet available spaces.
Year Built: The year in which a building completed construction and was issued a certificate of occupancy.
YTD: Abbreviation for Year-to-Date. Describes statistics that are cumulative from the beginning of a calendar year through what-ever time period is being studied.
YEAR-END 2012 – HOUSTON
Houston Office Market
©2013 COSTAR GROUP, INC. THE COSTAR OFFICE REPORT 1
OVERVIEW
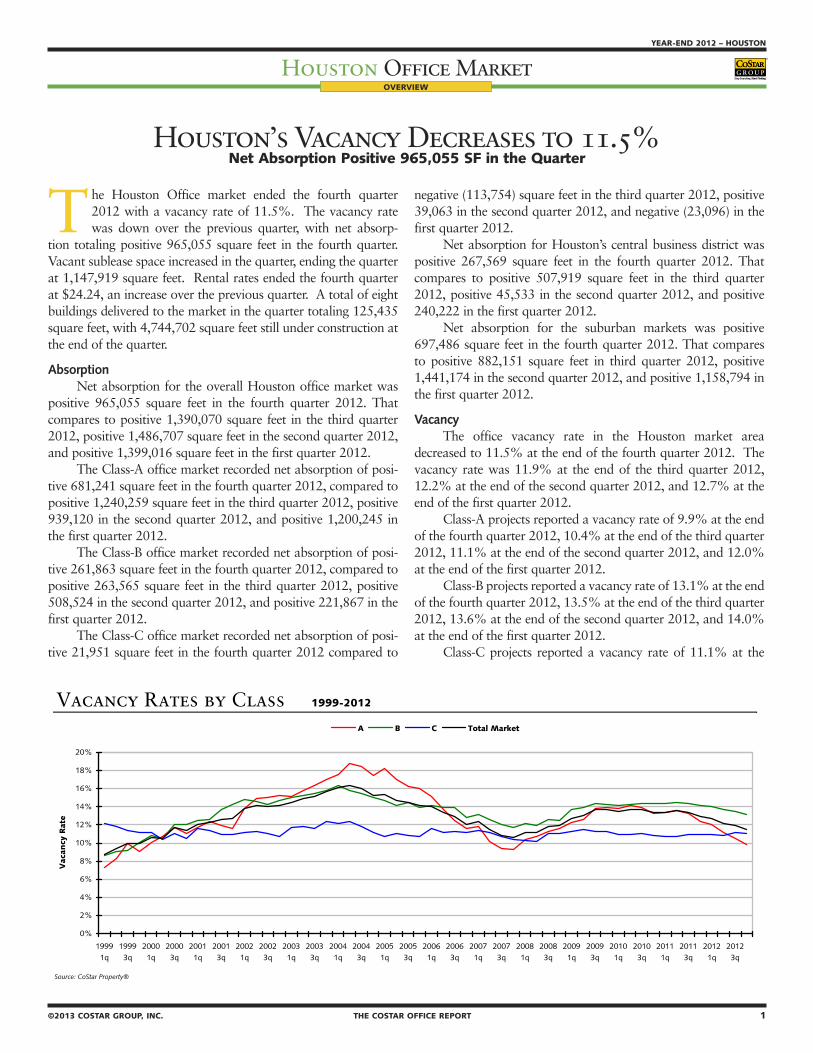
Houston’s Vacancy Decreases to 11.5% Net Absorption Positive 965,055 SF in the Quarter
The Houston Office market ended the fourth quarter 2012 with a vacancy rate of 11.5%. The vacancy rate was down over the previous quarter, with net absorp-
tion totaling positive 965,055 square feet in the fourth quarter. Vacant sublease space increased in the quarter, ending the quarter at 1,147,919 square feet. Rental rates ended the fourth quarter at $24.24, an increase over the previous quarter. A total of eight buildings delivered to the market in the quarter totaling 125,435 square feet, with 4,744,702 square feet still under construction at the end of the quarter.
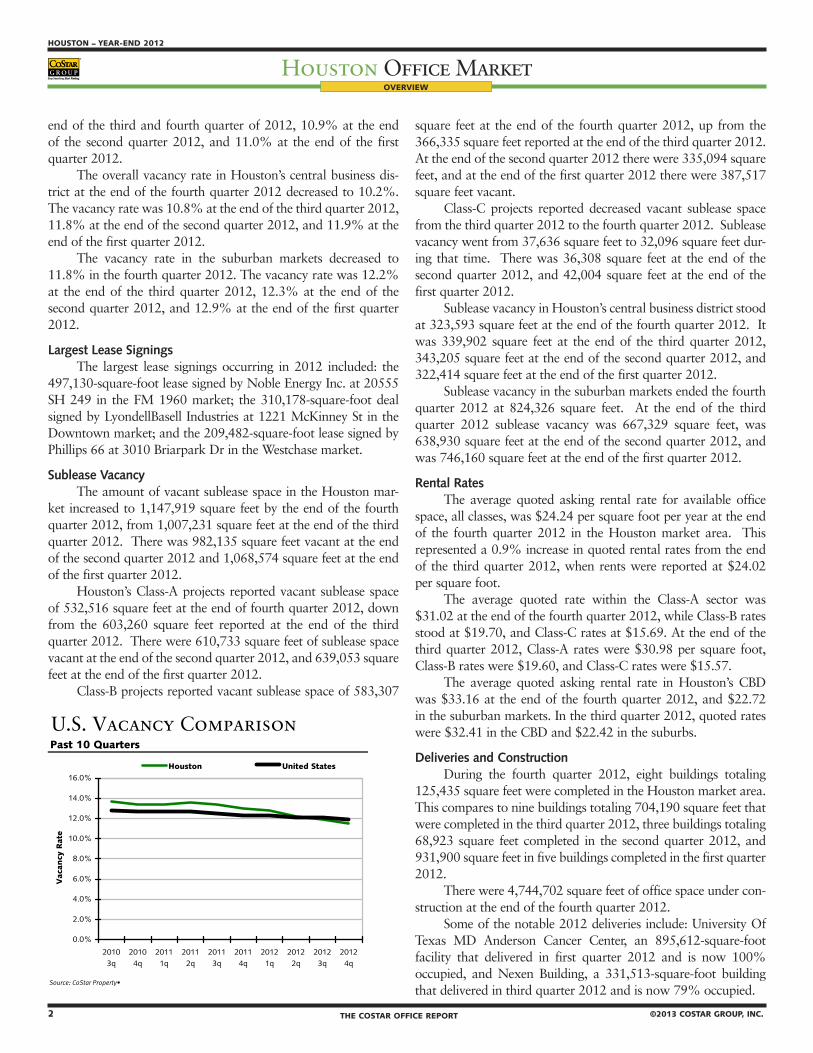
AbsorptionNet absorption for the overall Houston office market was
positive 965,055 square feet in the fourth quarter 2012. That compares to positive 1,390,070 square feet in the third quarter 2012, positive 1,486,707 square feet in the second quarter 2012, and positive 1,399,016 square feet in the first quarter 2012.
The Class-A office market recorded net absorption of posi-tive 681,241 square feet in the fourth quarter 2012, compared to positive 1,240,259 square feet in the third quarter 2012, positive 939,120 in the second quarter 2012, and positive 1,200,245 in the first quarter 2012.
The Class-B office market recorded net absorption of posi-tive 261,863 square feet in the fourth quarter 2012, compared to positive 263,565 square feet in the third quarter 2012, positive 508,524 in the second quarter 2012, and positive 221,867 in the first quarter 2012.
The Class-C office market recorded net absorption of posi-tive 21,951 square feet in the fourth quarter 2012 compared to
negative (113,754) square feet in the third quarter 2012, positive 39,063 in the second quarter 2012, and negative (23,096) in the first quarter 2012.
Net absorption for Houston’s central business district was positive 267,569 square feet in the fourth quarter 2012. That compares to positive 507,919 square feet in the third quarter 2012, positive 45,533 in the second quarter 2012, and positive 240,222 in the first quarter 2012.
Net absorption for the suburban markets was positive 697,486 square feet in the fourth quarter 2012. That compares to positive 882,151 square feet in third quarter 2012, positive 1,441,174 in the second quarter 2012, and positive 1,158,794 in the first quarter 2012.
VacancyThe office vacancy rate in the Houston market area
decreased to 11.5% at the end of the fourth quarter 2012. The vacancy rate was 11.9% at the end of the third quarter 2012, 12.2% at the end of the second quarter 2012, and 12.7% at the end of the first quarter 2012.
Class-A projects reported a vacancy rate of 9.9% at the end of the fourth quarter 2012, 10.4% at the end of the third quarter 2012, 11.1% at the end of the second quarter 2012, and 12.0% at the end of the first quarter 2012.
Class-B projects reported a vacancy rate of 13.1% at the end of the fourth quarter 2012, 13.5% at the end of the third quarter 2012, 13.6% at the end of the second quarter 2012, and 14.0% at the end of the first quarter 2012.
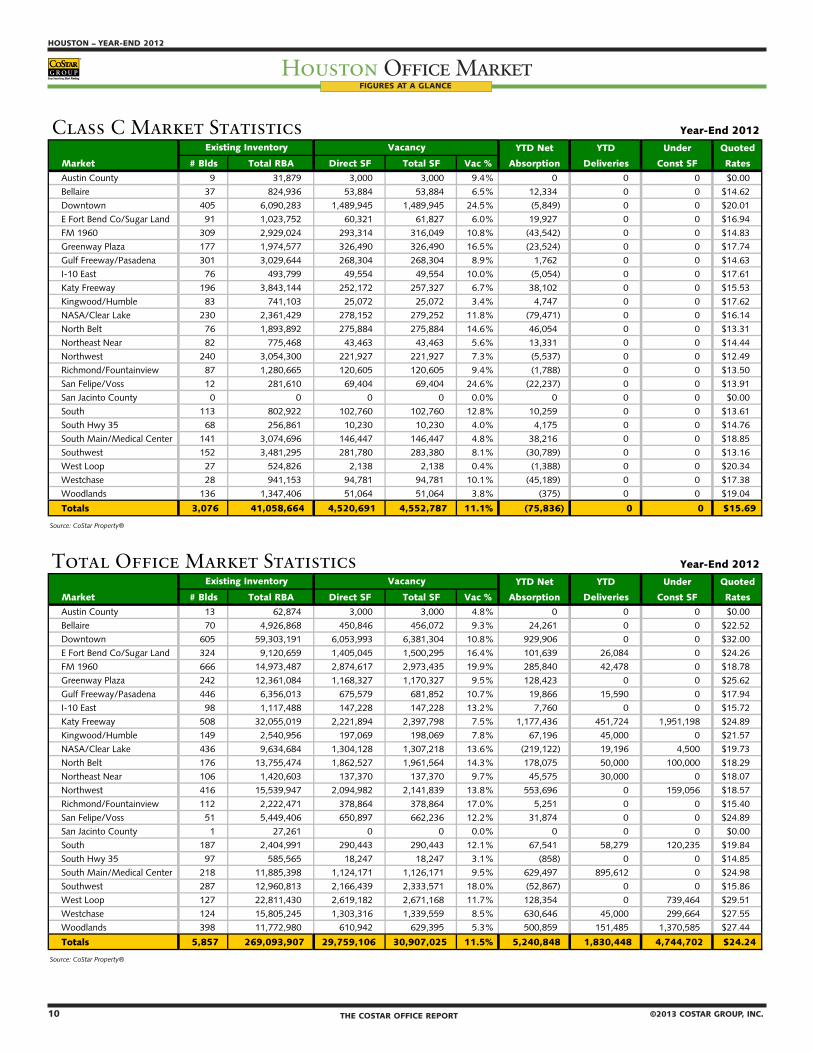
Class-C projects reported a vacancy rate of 11.1% at the
Vacancy Rates by Class 1999-2012
Source: CoStar Property®
Absorption & Deliveries U.S. Vacancy ComparisonPast 10 Quarters Past 10 Quarters
Source: CoStar Property• Source: CoStar Property•
0%
2%
4%
6%
8%
10%
12%
14%
16%
18%
20%
19991q
19993q
20001q
20003q
20011q
20013q
20021q
20023q
20031q
20033q
20041q
20043q
20051q
20053q
20061q
20063q
20071q
20073q
20081q
20083q
20091q
20093q
20101q
20103q
20111q
20113q
20121q
20123q
Vac
ancy
Rat
e
A B C Total Market
0.13
0.980.91
(0.29)
1.00
1.37 1.401.49
1.39
0.97
0.09
0.32
1.05
0.11
1.14
0.22
0.93
0.07
0.70
0.13
(0.4)
(0.2)
0.0
0.2
0.4
0.6
0.8
1.0
1.2
1.4
1.6
20103q
20104q
20111q
20112q
20113q
20114q
20121q
20122q
20123q
20124q
Millio
ns
SF
Net Absorption Deliveries
0.0%
2.0%
4.0%
6.0%
8.0%
10.0%
12.0%
14.0%
16.0%
20103q
20104q
20111q
20112q
20113q
20114q
20121q
20122q
20123q
20124q
Vac
ancy
Rat
e
Houston United States
2 THE COSTAR OFFICE REPORT ©2013 COSTAR GROUP, INC.
HOUSTON – YEAR-END 2012
Houston Office MarketYEAR-END 2012 – HOUSTON
Houston Office Market
©2013 COSTAR GROUP, INC. THE COSTAR OFFICE REPORT 3
OVERVIEW
end of the third and fourth quarter of 2012, 10.9% at the end of the second quarter 2012, and 11.0% at the end of the first quarter 2012.
The overall vacancy rate in Houston’s central business dis-trict at the end of the fourth quarter 2012 decreased to 10.2%. The vacancy rate was 10.8% at the end of the third quarter 2012, 11.8% at the end of the second quarter 2012, and 11.9% at the end of the first quarter 2012.
The vacancy rate in the suburban markets decreased to 11.8% in the fourth quarter 2012. The vacancy rate was 12.2% at the end of the third quarter 2012, 12.3% at the end of the second quarter 2012, and 12.9% at the end of the first quarter 2012.
Largest Lease SigningsThe largest lease signings occurring in 2012 included: the
497,130-square-foot lease signed by Noble Energy Inc. at 20555 SH 249 in the FM 1960 market; the 310,178-square-foot deal signed by LyondellBasell Industries at 1221 McKinney St in the Downtown market; and the 209,482-square-foot lease signed by Phillips 66 at 3010 Briarpark Dr in the Westchase market.
Sublease VacancyThe amount of vacant sublease space in the Houston mar-
ket increased to 1,147,919 square feet by the end of the fourth quarter 2012, from 1,007,231 square feet at the end of the third quarter 2012. There was 982,135 square feet vacant at the end of the second quarter 2012 and 1,068,574 square feet at the end of the first quarter 2012.
Houston’s Class-A projects reported vacant sublease space of 532,516 square feet at the end of fourth quarter 2012, down from the 603,260 square feet reported at the end of the third quarter 2012. There were 610,733 square feet of sublease space vacant at the end of the second quarter 2012, and 639,053 square feet at the end of the first quarter 2012.
Class-B projects reported vacant sublease space of 583,307
square feet at the end of the fourth quarter 2012, up from the 366,335 square feet reported at the end of the third quarter 2012. At the end of the second quarter 2012 there were 335,094 square feet, and at the end of the first quarter 2012 there were 387,517 square feet vacant.
Class-C projects reported decreased vacant sublease space from the third quarter 2012 to the fourth quarter 2012. Sublease vacancy went from 37,636 square feet to 32,096 square feet dur-ing that time. There was 36,308 square feet at the end of the second quarter 2012, and 42,004 square feet at the end of the first quarter 2012.
Sublease vacancy in Houston’s central business district stood at 323,593 square feet at the end of the fourth quarter 2012. It was 339,902 square feet at the end of the third quarter 2012, 343,205 square feet at the end of the second quarter 2012, and 322,414 square feet at the end of the first quarter 2012.
Sublease vacancy in the suburban markets ended the fourth quarter 2012 at 824,326 square feet. At the end of the third quarter 2012 sublease vacancy was 667,329 square feet, was 638,930 square feet at the end of the second quarter 2012, and was 746,160 square feet at the end of the first quarter 2012.
Rental RatesThe average quoted asking rental rate for available office
space, all classes, was $24.24 per square foot per year at the end of the fourth quarter 2012 in the Houston market area. This represented a 0.9% increase in quoted rental rates from the end of the third quarter 2012, when rents were reported at $24.02 per square foot.
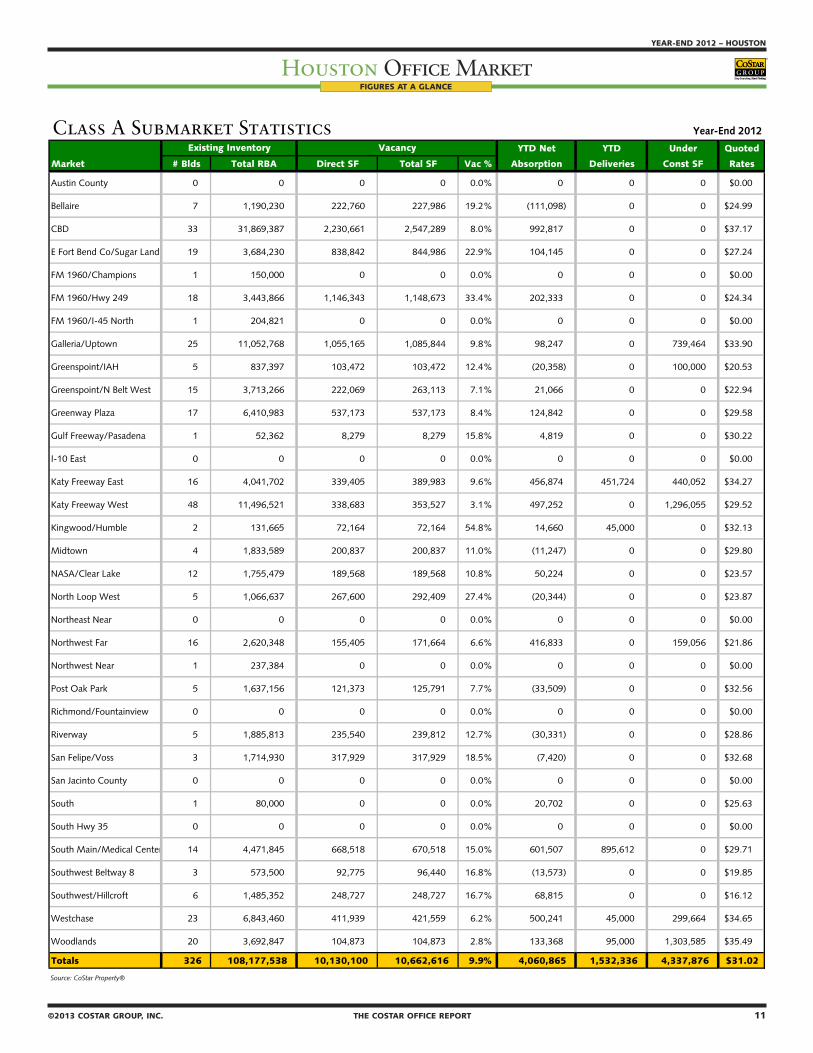
The average quoted rate within the Class-A sector was $31.02 at the end of the fourth quarter 2012, while Class-B rates stood at $19.70, and Class-C rates at $15.69. At the end of the third quarter 2012, Class-A rates were $30.98 per square foot, Class-B rates were $19.60, and Class-C rates were $15.57.
The average quoted asking rental rate in Houston’s CBD was $33.16 at the end of the fourth quarter 2012, and $22.72 in the suburban markets. In the third quarter 2012, quoted rates were $32.41 in the CBD and $22.42 in the suburbs.
Deliveries and ConstructionDuring the fourth quarter 2012, eight buildings totaling
125,435 square feet were completed in the Houston market area. This compares to nine buildings totaling 704,190 square feet that were completed in the third quarter 2012, three buildings totaling 68,923 square feet completed in the second quarter 2012, and 931,900 square feet in five buildings completed in the first quarter 2012.
There were 4,744,702 square feet of office space under con-struction at the end of the fourth quarter 2012.
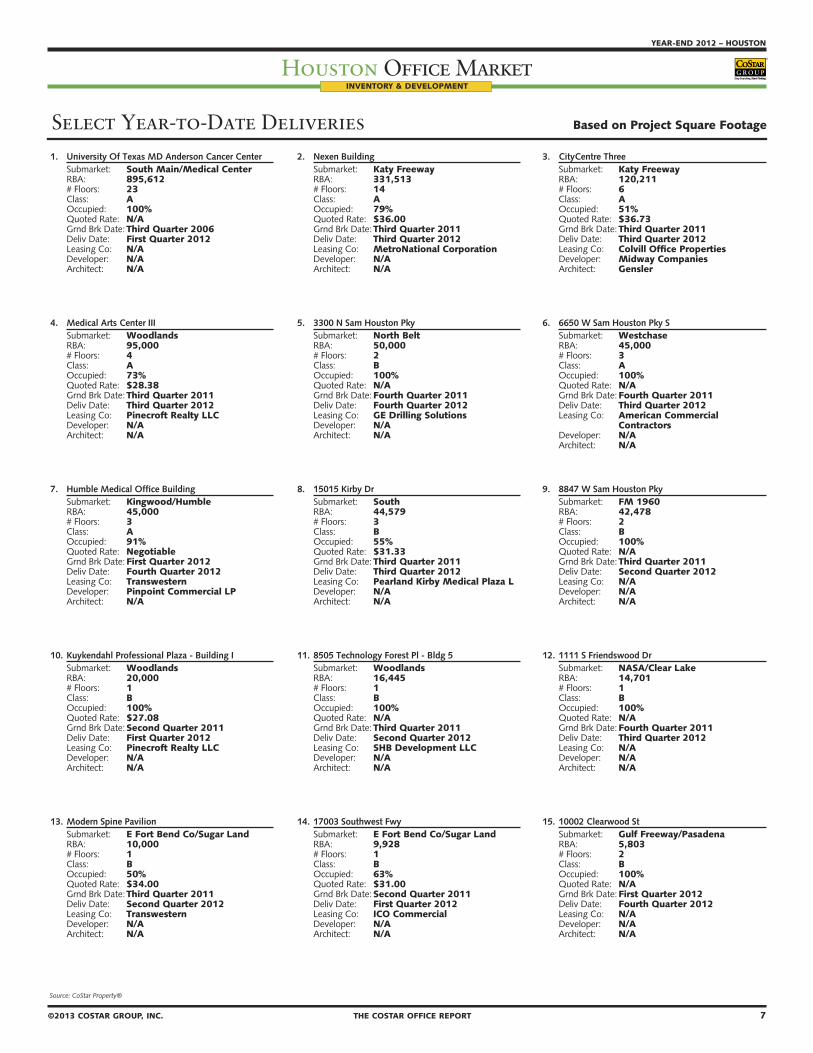
Some of the notable 2012 deliveries include: University Of Texas MD Anderson Cancer Center, an 895,612-square-foot facility that delivered in first quarter 2012 and is now 100% occupied, and Nexen Building, a 331,513-square-foot building that delivered in third quarter 2012 and is now 79% occupied.
Vacancy Rates by Class 1999-2012
Source: CoStar Property®
Absorption & Deliveries U.S. Vacancy ComparisonPast 10 Quarters Past 10 Quarters
Source: CoStar Property• Source: CoStar Property•
0%
2%
4%
6%
8%
10%
12%
14%
16%
18%
20%
19991q
19993q
20001q
20003q
20011q
20013q
20021q
20023q
20031q
20033q
20041q
20043q
20051q
20053q
20061q
20063q
20071q
20073q
20081q
20083q
20091q
20093q
20101q
20103q
20111q
20113q
20121q
20123q
Vac
ancy
Rat
e
A B C Total Market
0.13
0.980.91
(0.29)
1.00
1.37 1.401.49
1.39
0.97
0.09
0.32
1.05
0.11
1.14
0.22
0.93
0.07
0.70
0.13
(0.4)
(0.2)
0.0
0.2
0.4
0.6
0.8
1.0
1.2
1.4
1.6
20103q
20104q
20111q
20112q
20113q
20114q
20121q
20122q
20123q
20124q
Millio
ns
SF
Net Absorption Deliveries
0.0%
2.0%
4.0%
6.0%
8.0%
10.0%
12.0%
14.0%
16.0%
20103q
20104q
20111q
20112q
20113q
20114q
20121q
20122q
20123q
20124q
Vac
ancy
Rat
e
Houston United States
2 THE COSTAR OFFICE REPORT ©2013 COSTAR GROUP, INC.
HOUSTON – YEAR-END 2012
Houston Office MarketYEAR-END 2012 – HOUSTON
Houston Office Market
©2013 COSTAR GROUP, INC. THE COSTAR OFFICE REPORT 3
OVERVIEW
The largest projects underway at the end of fourth quarter 2012 were 1201 Lake Robbins Dr, a 550,000-square-foot build-ing with 100% of its space pre-leased, and Energy Tower III, a 428,831-square-foot facility that is 0% pre-leased.
InventoryTotal office inventory in the Houston market area amounted
to 269,093,907 square feet in 5,857 buildings as of the end of the fourth quarter 2012. The Class-A office sector consisted of 108,177,538 square feet in 326 projects. There were 2,455 Class-B buildings totaling 119,857,705 square feet, and the Class-C sector consisted of 41,058,664 square feet in 3,076 buildings. Within the Office market there were 492 owner-occupied build-ings accounting for 32,981,448 square feet of office space.
Sales ActivityTallying office building sales of 15,000 square feet or larger,
Houston office sales figures rose during the third quarter 2012 in terms of dollar volume compared to the second quarter of 2012.
In the third quarter, nine office transactions closed with a total volume of $860,687,000. The nine buildings totaled 3,995,602 square feet and the average price per square foot equated to $215.41 per square foot. That compares to seven transactions totaling $194,900,000 in the second quarter 2012. The total square footage in the second quarter was 1,561,764 square feet for an average price per square foot of $124.79.
Total office building sales activity in 2012 was up compared to 2011. In the first nine months of 2012, the market saw 28 office sales transactions with a total volume of $1,737,899,000. The price per square foot averaged $198.43. In the same first nine months of 2011, the market posted 40 transactions with a total volume of $1,194,515,575. The price per square foot averaged $143.63.
Cap rates have been lower in 2012, averaging 7.39% com-pared to the same period in 2011 when they averaged 8.43%.
One of the largest transactions that has occurred within the last four quarters in the Houston market is the sale of Shell Plaza in Houston. This 1,795,883-square-foot office building sold for $550,000,000, or $306.26 per square foot. The property sold on 8/10/2012, at a 6.50% cap rate.
Reports compiled by: Alfredo Negron, CoStar Senior Research Manager; Heather Berwanger, CoStar Senior Research Associate, Page Levendis, CoStar Research Associate II, Dennis Bozzell, CoStar Research Associate II and Claire Meyer, CoStar Research Associate II.
Vacancy Rates by Class 1999-2012
Source: CoStar Property®
Absorption & Deliveries U.S. Vacancy ComparisonPast 10 Quarters Past 10 Quarters
Source: CoStar Property• Source: CoStar Property•
0%
2%
4%
6%
8%
10%
12%
14%
16%
18%
20%
19991q
19993q
20001q
20003q
20011q
20013q
20021q
20023q
20031q
20033q
20041q
20043q
20051q
20053q
20061q
20063q
20071q
20073q
20081q
20083q
20091q
20093q
20101q
20103q
20111q
20113q
20121q
20123q
Vac
ancy
Rat
e
A B C Total Market
0.13
0.980.91
(0.29)
1.00
1.37 1.401.49
1.39
0.97
0.09
0.32
1.05
0.11
1.14
0.22
0.93
0.07
0.70
0.13
(0.4)
(0.2)
0.0
0.2
0.4
0.6
0.8
1.0
1.2
1.4
1.6
20103q
20104q
20111q
20112q
20113q
20114q
20121q
20122q
20123q
20124q
Millio
ns
SF
Net Absorption Deliveries
0.0%
2.0%
4.0%
6.0%
8.0%
10.0%
12.0%
14.0%
16.0%
20103q
20104q
20111q
20112q
20113q
20114q
20121q
20122q
20123q
20124q
Vac
ancy
Rat
e
Houston United States
4 THE COSTAR OFFICE REPORT ©2013 COSTAR GROUP, INC.
HOUSTON – YEAR-END 2012
Houston Office MarketYEAR-END 2012 – HOUSTON
Houston Office Market
©2013 COSTAR GROUP, INC. THE COSTAR OFFICE REPORT 5
CoStar Submarket Clusters & Submarkets
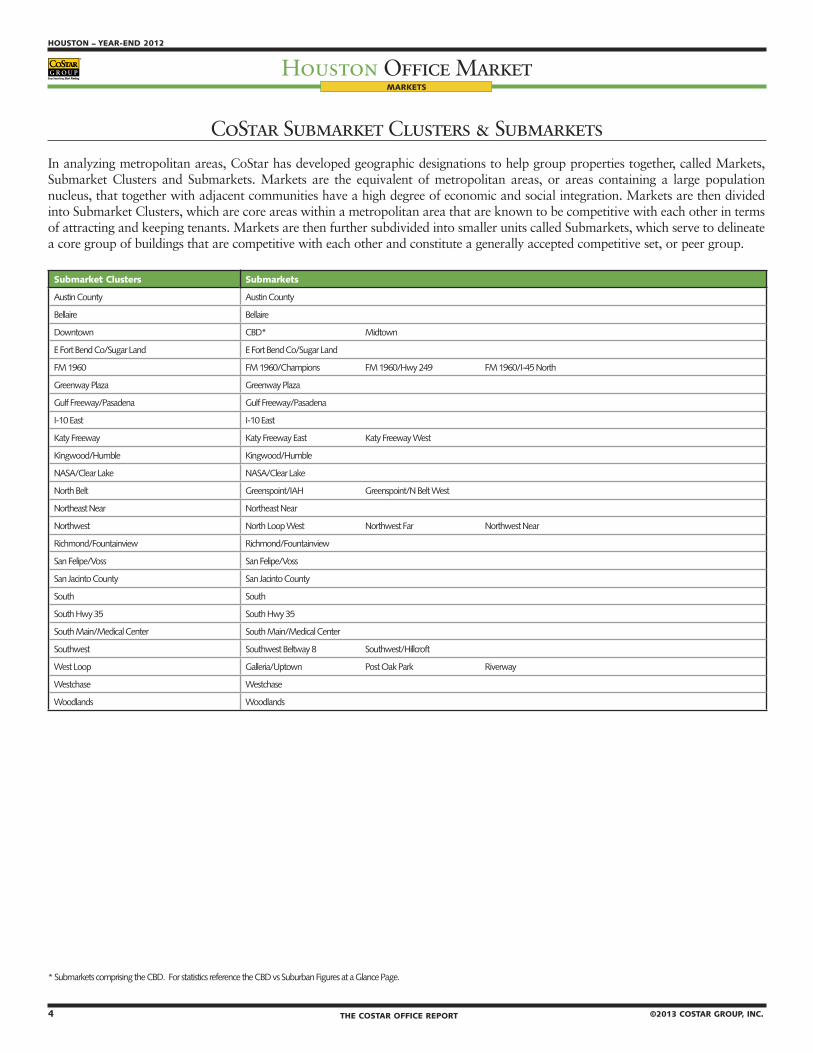
In analyzing metropolitan areas, CoStar has developed geographic designations to help group properties together, called Markets, Submarket Clusters and Submarkets. Markets are the equivalent of metropolitan areas, or areas containing a large population nucleus, that together with adjacent communities have a high degree of economic and social integration. Markets are then divided into Submarket Clusters, which are core areas within a metropolitan area that are known to be competitive with each other in terms of attracting and keeping tenants. Markets are then further subdivided into smaller units called Submarkets, which serve to delineate a core group of buildings that are competitive with each other and constitute a generally accepted competitive set, or peer group.
MARKETS
Submarket Clusters Submarkets
Austin County Austin County
Bellaire Bellaire
Downtown CBD* Midtown
E Fort Bend Co/Sugar Land E Fort Bend Co/Sugar Land
FM 1960 FM 1960/Champions FM 1960/Hwy 249 FM 1960/I-45 North
Greenway Plaza Greenway Plaza
Gulf Freeway/Pasadena Gulf Freeway/Pasadena
I-10 East I-10 East
Katy Freeway Katy Freeway East Katy Freeway West
Kingwood/Humble Kingwood/Humble
NASA/Clear Lake NASA/Clear Lake
North Belt Greenspoint/IAH Greenspoint/N Belt West
Northeast Near Northeast Near
Northwest North Loop West Northwest Far Northwest Near
Richmond/Fountainview Richmond/Fountainview
San Felipe/Voss San Felipe/Voss
San Jacinto County San Jacinto County
South South
South Hwy 35 South Hwy 35
South Main/Medical Center South Main/Medical Center
Southwest Southwest Beltway 8 Southwest/Hillcroft
West Loop Galleria/Uptown Post Oak Park Riverway
Westchase Westchase
Woodlands Woodlands
* Submarkets comprising the CBD. For statistics reference the CBD vs Suburban Figures at a Glance Page.
4 THE COSTAR OFFICE REPORT ©2013 COSTAR GROUP, INC.
HOUSTON – YEAR-END 2012
Houston Office MarketYEAR-END 2012 – HOUSTON
Houston Office Market
©2013 COSTAR GROUP, INC. THE COSTAR OFFICE REPORT 5
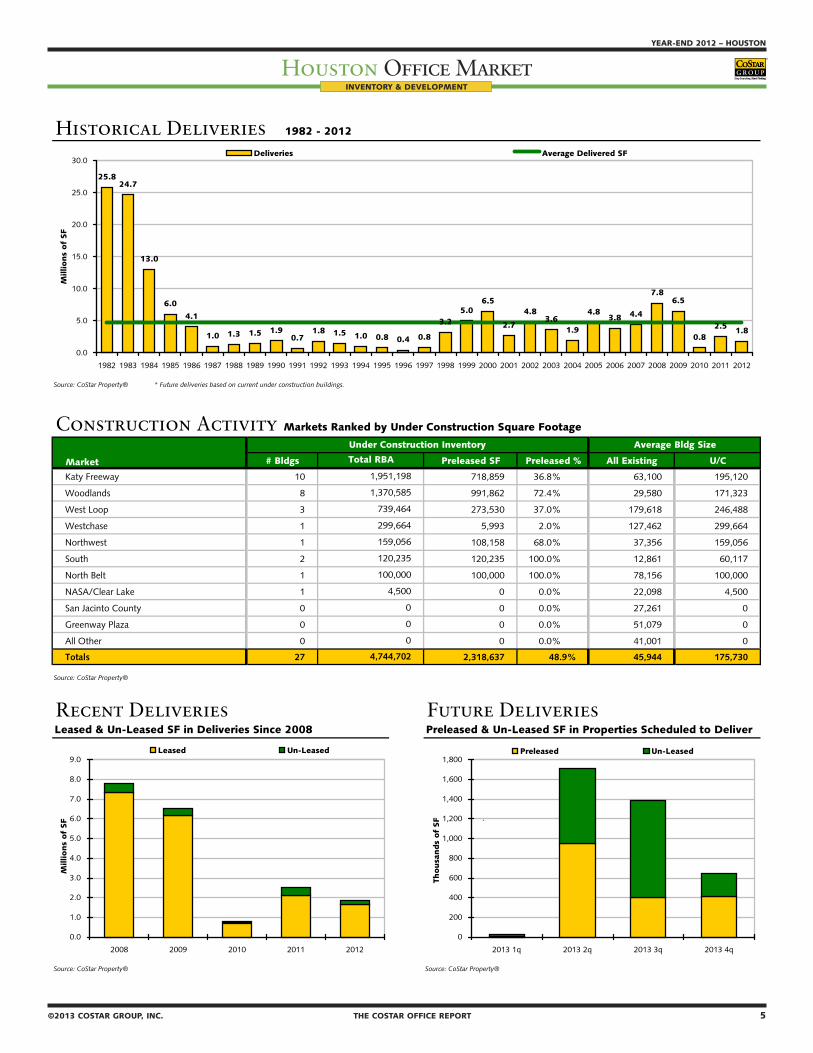
Historical Deliveries 1982 - 2012
Source: CoStar Property® * Future deliveries based on current under construction buildings.
Construction Activity Markets Ranked by Under Construction Square Footage
# Bldgs Preleased SF Preleased % All Existing U/C
Katy Freeway 10 718,859 36.8% 63,100 195,120
Woodlands 8 991,862 72.4% 29,580 171,323
West Loop 3 273,530 37.0% 179,618 246,488
Westchase 1 5,993 2.0% 127,462 299,664
Northwest 1 108,158 68.0% 37,356 159,056
South 2 120,235 100.0% 12,861 60,117
North Belt 1 100,000 100.0% 78,156 100,000
NASA/Clear Lake 1 0 0.0% 22,098 4,500
San Jacinto County 0 0 0.0% 27,261 0
Greenway Plaza 0 0 0.0% 51,079 0
All Other 0 0 0.0% 41,001 0
Totals 27 2,318,637 48.9% 45,944 175,730
Source: CoStar Property®
Recent Deliveries Future Deliveries Leased & Un-Leased SF in Deliveries Since 2008 Preleased & Un-Leased SF in Properties Scheduled to Deliver
Source: CoStar Property® Source: CoStar Property®
4,500
0
0
Market
Under Construction Inventory Average Bldg Size
Total RBA
0
1,951,198
4,744,702
1,370,585
739,464
299,664
159,056
120,235
100,000
25.824.7
13.0
6.0
4.1
1.0 1.3 1.5 1.90.7
1.8 1.5 1.0 0.8 0.4 0.8
3.25.0
6.5
2.7
4.83.6
1.9
4.83.8 4.4
7.86.5
0.82.5 1.8
0.0
5.0
10.0
15.0
20.0
25.0
30.0
1982 1983 1984 1985 1986 1987 1988 1989 1990 1991 1992 1993 1994 1995 1996 1997 1998 1999 2000 2001 2002 2003 2004 2005 2006 2007 2008 2009 2010 2011 2012
Millio
ns
of
SF
Deliveries Average Delivered SF
0.0
1.0
2.0
3.0
4.0
5.0
6.0
7.0
8.0
9.0
2008 2009 2010 2011 2012
Millio
ns
of
SF
Leased Un-Leased
0
200
400
600
800
1,000
1,200
1,400
1,600
1,800
2013 1q 2013 2q 2013 3q 2013 4q
T
Thousa
nds
of
SF
Preleased Un-Leased
INVENTORY & DEVELOPMENT
6 THE COSTAR OFFICE REPORT ©2013 COSTAR GROUP, INC.
HOUSTON – YEAR-END 2012
Houston Office MarketYEAR-END 2012 – HOUSTON
Houston Office Market
©2013 COSTAR GROUP, INC. THE COSTAR OFFICE REPORT 7
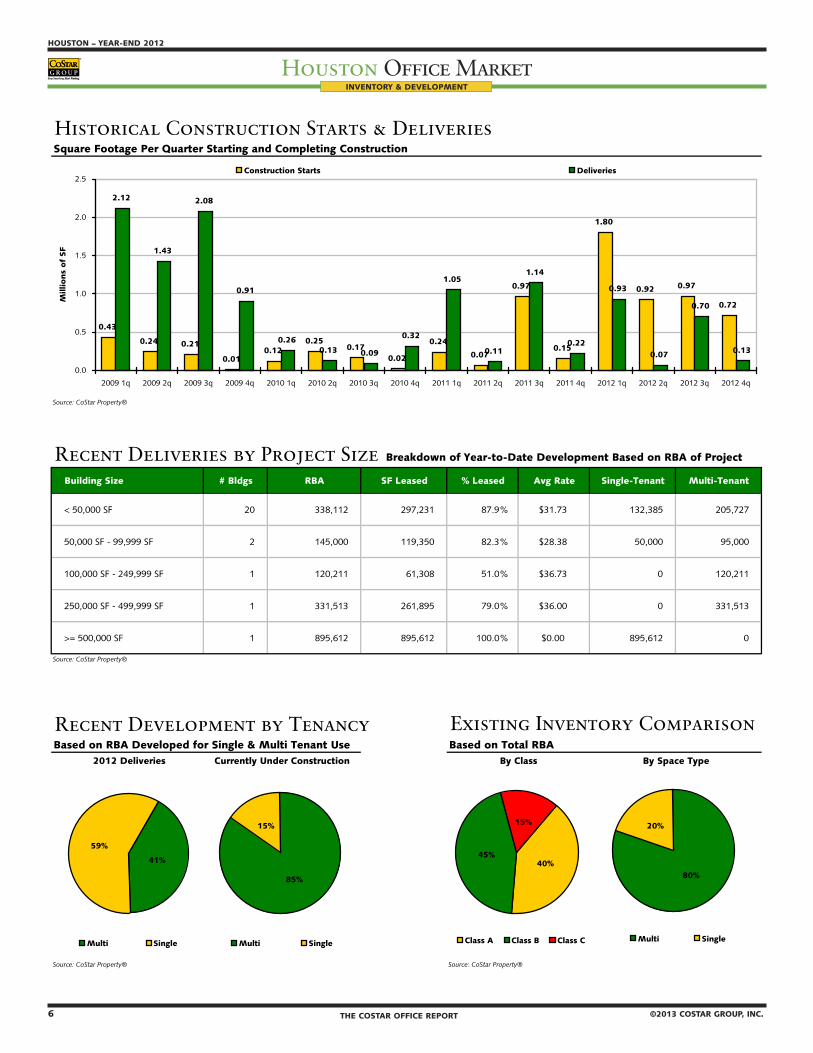
Historical Construction Starts & DeliveriesSquare Footage Per Quarter Starting and Completing Construction
Source: CoStar Property®
Recent Deliveries by Project Size Breakdown of Year-to-Date Development Based on RBA of Project
Building Size # Bldgs RBA SF Leased % Leased Avg Rate Single-Tenant Multi-Tenant
< 50,000 SF 20 338,112 297,231 87.9% $31.73 132,385 205,727
50,000 SF - 99,999 SF 2 145,000 119,350 82.3% $28.38 50,000 95,000
100,000 SF - 249,999 SF 1 120,211 61,308 51.0% $36.73 0 120,211
250,000 SF - 499,999 SF 1 331,513 261,895 79.0% $36.00 0 331,513
>= 500,000 SF 1 895,612 895,612 100.0% $0.00 895,612 0
Source: CoStar Property®
Recent Development by Tenancy Existing Inventory ComparisonBased on RBA Developed for Single & Multi Tenant Use Based on Total RBA
2012 Deliveries
Source: CoStar Property® Source: CoStar Property®
Currently Under Construction By Class By Space Type
0.43
0.24 0.21
0.010.12
0.250.17
0.02
0.24
0.07
0.97
0.15
1.80
0.92 0.97
0.72
2.12
1.43
2.08
0.91
0.260.13 0.09
0.32
1.05
0.11
1.14
0.22
0.93
0.07
0.70
0.13
0.0
0.5
1.0
1.5
2.0
2.5
2009 1q 2009 2q 2009 3q 2009 4q 2010 1q 2010 2q 2010 3q 2010 4q 2011 1q 2011 2q 2011 3q 2011 4q 2012 1q 2012 2q 2012 3q 2012 4q
Millio
ns
of
SF
Construction Starts Deliveries
85%
15%
Multi Single
59%
41%
Multi Single
15%
40%45%
Class A Class B Class C
20%
80%
Multi Single
INVENTORY & DEVELOPMENT
6 THE COSTAR OFFICE REPORT ©2013 COSTAR GROUP, INC.
HOUSTON – YEAR-END 2012
Houston Office MarketYEAR-END 2012 – HOUSTON
Houston Office Market
©2013 COSTAR GROUP, INC. THE COSTAR OFFICE REPORT 7
������������������������������ �������������������������������
������������������������
���� �������������������������������������������������������� ������������������������������ ����������������� ��������� ����������� ����������������� ������������������������������������������������ ������������������������������ �������������� �������������� ����
���� ������������������������� ����������������� ����������������� ��������� ����������� ���������������� ��������������������������������������������������� ������������������������������ ������������������������������������ �������������� ����
���� ��������������������������� ����������������� ����������������� �������� ����������� ���������������� ��������������������������������������������������� ������������������������������ ����������������������������������� ��������������������������� ��������
���� ���������������������������������� �������������� ���������������� �������� ����������� ���������������� ��������������������������������������������������� ������������������������������ ������������������������������� �������������� ����
���� ��������������������������������� ��������������� ���������������� �������� ����������� ����������������� ������������������������������������������������� ������������������������������� �������������������������������� �������������� ����
���� ����������������������������������� �������������� ���������������� �������� ����������� ����������������� ������������������������������������������������� ������������������������������ ��������������������
���������������������� �������������� ����
���� ���������������������������������������� �������������������� ���������������� �������� ����������� ���������������� ������������������������������������������������������� ������������������������������� ����������������������� ��������������������������������� ����
���� ������������������������� ���������� ���������������� �������� ����������� ���������������� ��������������������������������������������������� ������������������������������ ����������������������������������������� �������������� ����
���� ��������������������������������� ������������ ���������������� �������� ����������� ����������������� ������������������������������������������������ ������������������������������� �������������� �������������� ����
���������������������������������������������������������� �������������� ���������������� �������� ����������� ����������������� ���������������������������������������������������� ������������������������������ ������������������������������� �������������� ����
�������������������������������������������������� �������������� ���������������� �������� ����������� ����������������� ������������������������������������������������ ������������������������������� ������������������������������ �������������� ����
������������������������������������� �������������������� ���������������� �������� ����������� ����������������� ������������������������������������������������� ������������������������������ �������������� �������������� ����
������������������������������������� ������������������������������ ���������������� �������� ����������� ���������������� ��������������������������������������������������� ������������������������������� ����������������������� �������������� ����
����������������������������������� ������������������������������ ��������������� �������� ����������� ���������������� ���������������������������������������������������� ������������������������������ ������������������������� �������������� ����
���������������������������������� �������������������������� ��������������� �������� ����������� ����������������� ������������������������������������������������ ������������������������������� �������������� �������������� ����
INVENTORY & DEVELOPMENT

8 THE COSTAR OFFICE REPORT ©2013 COSTAR GROUP, INC.
HOUSTON – YEAR-END 2012
Houston Office MarketYEAR-END 2012 – HOUSTON
Houston Office Market
©2013 COSTAR GROUP, INC. THE COSTAR OFFICE REPORT 9
INVENTORY & DEVELOPMENT
���������������������������������������� �������������������������������
������������������������
���� ������������������������������� �������������� ����������������� ��������� ������������ ����������������� ������������������������������������������������ ������������������������������� �������������������
���������������������� �������������������
���������������������� ������������������������������
�����
���� ��������������������������� ����������������� ����������������� ��������� ������������ ��������������� ��������������������������������������������������� ������������������������������ ������������������������������ ������������������������������������ ������������������
���� ����������������������������� ����������������� ����������������� �������� ������������ ���������������� ���������������������������������������������������� ������������������������������ ����������������������������������� ��������������������������� �����������������������
���� ������������������������ ����������������� ����������������� ��������� ������������ ����������������� ������������������������������������������������� ������������������������������� �������������� �������������� ����
���� ����������������������������� �������������� ����������������� ��������� ������������ ���������������� ��������������������������������������������������� ������������������������������� ��������������������������������������� �������������� ����
���� ����������������������������� �������������� ����������������� ��������� ������������ ��������������� ��������������������������������������������������� ������������������������������ ��������������� �������������� ��������
���� ������������������������������������������������ �������������� ����������������� ��������� ������������ ���������������� ������������������������������������������������������� ������������������������������� ������������������������������ �������������� ����
���� ���������������������������������� �������������� ����������������� ��������� ������������ ��������������� ���������������������������������������������������� ������������������������������ ����������������������������� �������������������������������� �����
���� ���������������������������������� �������������� ����������������� ��������� ������������ ���������������� ��������������������������������������������������� ������������������������������� ��������������������������������� ��������������������������
������������������� ��������������������������
����������������������������� ����������������� ����������������� �������� ������������ ���������������� ��������������������������������������������������� ������������������������������ ��������������� �������������� ����
���������������������������������� �������������� ����������������� �������� ������������ ���������������� ���������������������������������������������������� ������������������������������ ��������������������������������� �������������� ����
������������������������������� ����������������� ����������������� �������� ������������ ��������������� ��������������������������������������������������� ������������������������������� ����������������������� �������������� ����
��������������������������������������������� �������������� ����������������� �������� ������������ ���������������� ���������������������������������������������������� ������������������������������� ���������������������� �������������� ����
���������������������������������������� ����������������� ����������������� �������� ������������ ��������������� ��������������������������������������������������� ������������������������������� ��������������������������������� �������������������������������� ����
������������������������������������� �������������� ����������������� �������� ������������ ���������������� ���������������������������������������������������� ������������������������������� ����������������������������������� �������������� ����

8 THE COSTAR OFFICE REPORT ©2013 COSTAR GROUP, INC.
HOUSTON – YEAR-END 2012
Houston Office MarketYEAR-END 2012 – HOUSTON
Houston Office Market
©2013 COSTAR GROUP, INC. THE COSTAR OFFICE REPORT 9
Class A Market Statistics Year-End 2012
YTD Net YTD Under Quoted
Market # Blds Total RBA Direct SF Total SF Vac % Absorption Deliveries Const SF Rates
Austin County 0 0 0 0 0.0% 0 0 0 $0.00 Bellaire 7 1,190,230 222,760 227,986 19.2% (111,098) 0 0 $24.99 Downtown 37 33,702,976 2,431,498 2,748,126 8.2% 981,570 0 0 $36.57 E Fort Bend Co/Sugar Land 19 3,684,230 838,842 844,986 22.9% 104,145 0 0 $27.24 FM 1960 20 3,798,687 1,146,343 1,148,673 30.2% 202,333 0 0 $24.34 Greenway Plaza 17 6,410,983 537,173 537,173 8.4% 124,842 0 0 $29.58 Gulf Freeway/Pasadena 1 52,362 8,279 8,279 15.8% 4,819 0 0 $30.22 I-10 East 0 0 0 0 0.0% 0 0 0 $0.00 Katy Freeway 64 15,538,223 678,088 743,510 4.8% 954,126 451,724 1,736,107 $30.26 Kingwood/Humble 2 131,665 72,164 72,164 54.8% 14,660 45,000 0 $32.13 NASA/Clear Lake 12 1,755,479 189,568 189,568 10.8% 50,224 0 0 $23.57 North Belt 20 4,550,663 325,541 366,585 8.1% 708 0 100,000 $22.66 Northeast Near 0 0 0 0 0.0% 0 0 0 $0.00 Northwest 22 3,924,369 423,005 464,073 11.8% 396,489 0 159,056 $22.80 Richmond/Fountainview 0 0 0 0 0.0% 0 0 0 $0.00 San Felipe/Voss 3 1,714,930 317,929 317,929 18.5% (7,420) 0 0 $32.68 San Jacinto County 0 0 0 0 0.0% 0 0 0 $0.00 South 1 80,000 0 0 0.0% 20,702 0 0 $25.63 South Hwy 35 0 0 0 0 0.0% 0 0 0 $0.00 South Main/Medical Center 14 4,471,845 668,518 670,518 15.0% 601,507 895,612 0 $29.71 Southwest 9 2,058,852 341,502 345,167 16.8% 55,242 0 0 $16.91 West Loop 35 14,575,737 1,412,078 1,451,447 10.0% 34,407 0 739,464 $33.14 Westchase 23 6,843,460 411,939 421,559 6.2% 500,241 45,000 299,664 $34.65 Woodlands 20 3,692,847 104,873 104,873 2.8% 133,368 95,000 1,303,585 $35.49
Totals 326 108,177,538 10,130,100 10,662,616 9.9% 4,060,865 1,532,336 4,337,876 $31.02
Source: CoStar Property®
Class B Market Statistics Year-End 2012
YTD Net YTD Under Quoted
Market # Blds Total RBA Direct SF Total SF Vac % Absorption Deliveries Const SF Rates
Austin County 4 30,995 0 0 0.0% 0 0 0 $0.00 Bellaire 26 2,911,702 174,202 174,202 6.0% 123,025 0 0 $20.48 Downtown 163 19,509,932 2,132,550 2,143,233 11.0% (45,815) 0 0 $24.63 E Fort Bend Co/Sugar Land 214 4,412,677 505,882 593,482 13.4% (22,433) 26,084 0 $21.55 FM 1960 337 8,245,776 1,434,960 1,508,713 18.3% 127,049 42,478 0 $16.34 Greenway Plaza 48 3,975,524 304,664 306,664 7.7% 27,105 0 0 $23.01 Gulf Freeway/Pasadena 144 3,274,007 398,996 405,269 12.4% 13,285 15,590 0 $20.07 I-10 East 22 623,689 97,674 97,674 15.7% 12,814 0 0 $15.22 Katy Freeway 248 12,673,652 1,291,634 1,396,961 11.0% 185,208 0 215,091 $20.10 Kingwood/Humble 64 1,668,188 99,833 100,833 6.0% 47,789 0 0 $20.01 NASA/Clear Lake 194 5,517,776 836,408 838,398 15.2% (189,875) 19,196 4,500 $19.46 North Belt 80 7,310,919 1,261,102 1,319,095 18.0% 131,313 50,000 0 $16.77 Northeast Near 24 645,135 93,907 93,907 14.6% 32,244 30,000 0 $21.34 Northwest 154 8,561,278 1,450,050 1,455,839 17.0% 162,744 0 0 $17.24 Richmond/Fountainview 25 941,806 258,259 258,259 27.4% 7,039 0 0 $16.18 San Felipe/Voss 36 3,452,866 263,564 274,903 8.0% 61,531 0 0 $20.75 San Jacinto County 1 27,261 0 0 0.0% 0 0 0 $0.00 South 73 1,522,069 187,683 187,683 12.3% 36,580 58,279 120,235 $24.77 South Hwy 35 29 328,704 8,017 8,017 2.4% (5,033) 0 0 $14.94 South Main/Medical Center 63 4,338,857 309,206 309,206 7.1% (10,226) 0 0 $23.16 Southwest 126 7,420,666 1,543,157 1,705,024 23.0% (77,320) 0 0 $16.17 West Loop 65 7,710,867 1,204,966 1,217,583 15.8% 95,335 0 0 $23.58 Westchase 73 8,020,632 796,596 823,219 10.3% 175,594 0 0 $18.26 Woodlands 242 6,732,727 455,005 473,458 7.0% 367,866 56,485 67,000 $23.34
Totals 2,455 119,857,705 15,108,315 15,691,622 13.1% 1,255,819 298,112 406,826 $19.70
Source: CoStar Property®
Existing Inventory Vacancy
Existing Inventory Vacancy
FIGURES AT A GLANCE
10 THE COSTAR OFFICE REPORT ©2013 COSTAR GROUP, INC.
HOUSTON – YEAR-END 2012
Houston Office MarketYEAR-END 2012 – HOUSTON
Houston Office Market
©2013 COSTAR GROUP, INC. THE COSTAR OFFICE REPORT 11
Class C Market Statistics Year-End 2012
YTD Net YTD Under Quoted
Market # Blds Total RBA Direct SF Total SF Vac % Absorption Deliveries Const SF Rates
Austin County 9 31,879 3,000 3,000 9.4% 0 0 0 $0.00 Bellaire 37 824,936 53,884 53,884 6.5% 12,334 0 0 $14.62 Downtown 405 6,090,283 1,489,945 1,489,945 24.5% (5,849) 0 0 $20.01 E Fort Bend Co/Sugar Land 91 1,023,752 60,321 61,827 6.0% 19,927 0 0 $16.94 FM 1960 309 2,929,024 293,314 316,049 10.8% (43,542) 0 0 $14.83 Greenway Plaza 177 1,974,577 326,490 326,490 16.5% (23,524) 0 0 $17.74 Gulf Freeway/Pasadena 301 3,029,644 268,304 268,304 8.9% 1,762 0 0 $14.63 I-10 East 76 493,799 49,554 49,554 10.0% (5,054) 0 0 $17.61 Katy Freeway 196 3,843,144 252,172 257,327 6.7% 38,102 0 0 $15.53 Kingwood/Humble 83 741,103 25,072 25,072 3.4% 4,747 0 0 $17.62 NASA/Clear Lake 230 2,361,429 278,152 279,252 11.8% (79,471) 0 0 $16.14 North Belt 76 1,893,892 275,884 275,884 14.6% 46,054 0 0 $13.31 Northeast Near 82 775,468 43,463 43,463 5.6% 13,331 0 0 $14.44 Northwest 240 3,054,300 221,927 221,927 7.3% (5,537) 0 0 $12.49 Richmond/Fountainview 87 1,280,665 120,605 120,605 9.4% (1,788) 0 0 $13.50 San Felipe/Voss 12 281,610 69,404 69,404 24.6% (22,237) 0 0 $13.91 San Jacinto County 0 0 0 0 0.0% 0 0 0 $0.00 South 113 802,922 102,760 102,760 12.8% 10,259 0 0 $13.61 South Hwy 35 68 256,861 10,230 10,230 4.0% 4,175 0 0 $14.76 South Main/Medical Center 141 3,074,696 146,447 146,447 4.8% 38,216 0 0 $18.85 Southwest 152 3,481,295 281,780 283,380 8.1% (30,789) 0 0 $13.16 West Loop 27 524,826 2,138 2,138 0.4% (1,388) 0 0 $20.34 Westchase 28 941,153 94,781 94,781 10.1% (45,189) 0 0 $17.38 Woodlands 136 1,347,406 51,064 51,064 3.8% (375) 0 0 $19.04
Totals 3,076 41,058,664 4,520,691 4,552,787 11.1% (75,836) 0 0 $15.69
Source: CoStar Property®
Total Office Market Statistics Year-End 2012
YTD Net YTD Under Quoted
Market # Blds Total RBA Direct SF Total SF Vac % Absorption Deliveries Const SF Rates
Austin County 13 62,874 3,000 3,000 4.8% 0 0 0 $0.00 Bellaire 70 4,926,868 450,846 456,072 9.3% 24,261 0 0 $22.52 Downtown 605 59,303,191 6,053,993 6,381,304 10.8% 929,906 0 0 $32.00 E Fort Bend Co/Sugar Land 324 9,120,659 1,405,045 1,500,295 16.4% 101,639 26,084 0 $24.26 FM 1960 666 14,973,487 2,874,617 2,973,435 19.9% 285,840 42,478 0 $18.78 Greenway Plaza 242 12,361,084 1,168,327 1,170,327 9.5% 128,423 0 0 $25.62 Gulf Freeway/Pasadena 446 6,356,013 675,579 681,852 10.7% 19,866 15,590 0 $17.94 I-10 East 98 1,117,488 147,228 147,228 13.2% 7,760 0 0 $15.72 Katy Freeway 508 32,055,019 2,221,894 2,397,798 7.5% 1,177,436 451,724 1,951,198 $24.89 Kingwood/Humble 149 2,540,956 197,069 198,069 7.8% 67,196 45,000 0 $21.57 NASA/Clear Lake 436 9,634,684 1,304,128 1,307,218 13.6% (219,122) 19,196 4,500 $19.73 North Belt 176 13,755,474 1,862,527 1,961,564 14.3% 178,075 50,000 100,000 $18.29 Northeast Near 106 1,420,603 137,370 137,370 9.7% 45,575 30,000 0 $18.07 Northwest 416 15,539,947 2,094,982 2,141,839 13.8% 553,696 0 159,056 $18.57 Richmond/Fountainview 112 2,222,471 378,864 378,864 17.0% 5,251 0 0 $15.40 San Felipe/Voss 51 5,449,406 650,897 662,236 12.2% 31,874 0 0 $24.89 San Jacinto County 1 27,261 0 0 0.0% 0 0 0 $0.00 South 187 2,404,991 290,443 290,443 12.1% 67,541 58,279 120,235 $19.84 South Hwy 35 97 585,565 18,247 18,247 3.1% (858) 0 0 $14.85 South Main/Medical Center 218 11,885,398 1,124,171 1,126,171 9.5% 629,497 895,612 0 $24.98 Southwest 287 12,960,813 2,166,439 2,333,571 18.0% (52,867) 0 0 $15.86 West Loop 127 22,811,430 2,619,182 2,671,168 11.7% 128,354 0 739,464 $29.51 Westchase 124 15,805,245 1,303,316 1,339,559 8.5% 630,646 45,000 299,664 $27.55 Woodlands 398 11,772,980 610,942 629,395 5.3% 500,859 151,485 1,370,585 $27.44
Totals 5,857 269,093,907 29,759,106 30,907,025 11.5% 5,240,848 1,830,448 4,744,702 $24.24
Source: CoStar Property®
Existing Inventory Vacancy
Existing Inventory Vacancy
FIGURES AT A GLANCE
10 THE COSTAR OFFICE REPORT ©2013 COSTAR GROUP, INC.
HOUSTON – YEAR-END 2012
Houston Office MarketYEAR-END 2012 – HOUSTON
Houston Office Market
©2013 COSTAR GROUP, INC. THE COSTAR OFFICE REPORT 11
FIGURES AT A GLANCE
Class A Submarket Statistics Year-End 2012
YTD Net YTD Under Quoted
Market # Blds Total RBA Direct SF Total SF Vac % Absorption Deliveries Const SF Rates
Austin County 0 0 0 0 0.0% 0 0 0 $0.00
Bellaire 7 1,190,230 222,760 227,986 19.2% (111,098) 0 0 $24.99
CBD 33 31,869,387 2,230,661 2,547,289 8.0% 992,817 0 0 $37.17
E Fort Bend Co/Sugar Land 19 3,684,230 838,842 844,986 22.9% 104,145 0 0 $27.24
FM 1960/Champions 1 150,000 0 0 0.0% 0 0 0 $0.00
FM 1960/Hwy 249 18 3,443,866 1,146,343 1,148,673 33.4% 202,333 0 0 $24.34
FM 1960/I-45 North 1 204,821 0 0 0.0% 0 0 0 $0.00
Galleria/Uptown 25 11,052,768 1,055,165 1,085,844 9.8% 98,247 0 739,464 $33.90
Greenspoint/IAH 5 837,397 103,472 103,472 12.4% (20,358) 0 100,000 $20.53
Greenspoint/N Belt West 15 3,713,266 222,069 263,113 7.1% 21,066 0 0 $22.94
Greenway Plaza 17 6,410,983 537,173 537,173 8.4% 124,842 0 0 $29.58
Gulf Freeway/Pasadena 1 52,362 8,279 8,279 15.8% 4,819 0 0 $30.22
I-10 East 0 0 0 0 0.0% 0 0 0 $0.00
Katy Freeway East 16 4,041,702 339,405 389,983 9.6% 456,874 451,724 440,052 $34.27
Katy Freeway West 48 11,496,521 338,683 353,527 3.1% 497,252 0 1,296,055 $29.52
Kingwood/Humble 2 131,665 72,164 72,164 54.8% 14,660 45,000 0 $32.13
Midtown 4 1,833,589 200,837 200,837 11.0% (11,247) 0 0 $29.80
NASA/Clear Lake 12 1,755,479 189,568 189,568 10.8% 50,224 0 0 $23.57
North Loop West 5 1,066,637 267,600 292,409 27.4% (20,344) 0 0 $23.87
Northeast Near 0 0 0 0 0.0% 0 0 0 $0.00
Northwest Far 16 2,620,348 155,405 171,664 6.6% 416,833 0 159,056 $21.86
Northwest Near 1 237,384 0 0 0.0% 0 0 0 $0.00
Post Oak Park 5 1,637,156 121,373 125,791 7.7% (33,509) 0 0 $32.56
Richmond/Fountainview 0 0 0 0 0.0% 0 0 0 $0.00
Riverway 5 1,885,813 235,540 239,812 12.7% (30,331) 0 0 $28.86
San Felipe/Voss 3 1,714,930 317,929 317,929 18.5% (7,420) 0 0 $32.68
San Jacinto County 0 0 0 0 0.0% 0 0 0 $0.00
South 1 80,000 0 0 0.0% 20,702 0 0 $25.63
South Hwy 35 0 0 0 0 0.0% 0 0 0 $0.00
South Main/Medical Center 14 4,471,845 668,518 670,518 15.0% 601,507 895,612 0 $29.71
Southwest Beltway 8 3 573,500 92,775 96,440 16.8% (13,573) 0 0 $19.85
Southwest/Hillcroft 6 1,485,352 248,727 248,727 16.7% 68,815 0 0 $16.12
Westchase 23 6,843,460 411,939 421,559 6.2% 500,241 45,000 299,664 $34.65
Woodlands 20 3,692,847 104,873 104,873 2.8% 133,368 95,000 1,303,585 $35.49
Totals 326 108,177,538 10,130,100 10,662,616 9.9% 4,060,865 1,532,336 4,337,876 $31.02
Source: CoStar Property®
Existing Inventory Vacancy

12 THE COSTAR OFFICE REPORT ©2013 COSTAR GROUP, INC.
HOUSTON – YEAR-END 2012
Houston Office MarketYEAR-END 2012 – HOUSTON
Houston Office Market
©2013 COSTAR GROUP, INC. THE COSTAR OFFICE REPORT 13
FIGURES AT A GLANCE
Class B Submarket Statistics Year-End 2012
YTD Net YTD Under Quoted
Market # Blds Total RBA Direct SF Total SF Vac % Absorption Deliveries Const SF Rates
Austin County 4 30,995 0 0 0.0% 0 0 0 $0.00
Bellaire 26 2,911,702 174,202 174,202 6.0% 123,025 0 0 $20.48
CBD 62 15,211,257 1,712,130 1,719,095 11.3% 58,782 0 0 $25.00
E Fort Bend Co/Sugar Land 214 4,412,677 505,882 593,482 13.4% (22,433) 26,084 0 $21.55
FM 1960/Champions 94 2,712,660 778,488 778,488 28.7% (18,611) 0 0 $13.13
FM 1960/Hwy 249 179 3,628,510 416,345 484,576 13.4% (6,616) 42,478 0 $19.97
FM 1960/I-45 North 64 1,904,606 240,127 245,649 12.9% 152,276 0 0 $17.29
Galleria/Uptown 27 4,018,349 418,360 424,742 10.6% 339,568 0 0 $24.03
Greenspoint/IAH 29 2,013,994 281,487 285,374 14.2% 76,410 50,000 0 $17.26
Greenspoint/N Belt West 51 5,296,925 979,615 1,033,721 19.5% 54,903 0 0 $16.65
Greenway Plaza 48 3,975,524 304,664 306,664 7.7% 27,105 0 0 $23.01
Gulf Freeway/Pasadena 144 3,274,007 398,996 405,269 12.4% 13,285 15,590 0 $20.07
I-10 East 22 623,689 97,674 97,674 15.7% 12,814 0 0 $15.22
Katy Freeway East 67 3,169,093 383,407 386,407 12.2% (18,359) 0 210,000 $21.37
Katy Freeway West 181 9,504,559 908,227 1,010,554 10.6% 203,567 0 5,091 $19.48
Kingwood/Humble 64 1,668,188 99,833 100,833 6.0% 47,789 0 0 $20.01
Midtown 101 4,298,675 420,420 424,138 9.9% (104,597) 0 0 $23.36
NASA/Clear Lake 194 5,517,776 836,408 838,398 15.2% (189,875) 19,196 4,500 $19.46
North Loop West 63 3,466,741 776,940 776,940 22.4% 156,673 0 0 $17.18
Northeast Near 24 645,135 93,907 93,907 14.6% 32,244 30,000 0 $21.34
Northwest Far 68 4,107,928 551,724 557,513 13.6% (7) 0 0 $17.65
Northwest Near 23 986,609 121,386 121,386 12.3% 6,078 0 0 $15.15
Post Oak Park 24 2,653,156 643,445 648,177 24.4% (263,800) 0 0 $23.56
Richmond/Fountainview 25 941,806 258,259 258,259 27.4% 7,039 0 0 $16.18
Riverway 14 1,039,362 143,161 144,664 13.9% 19,567 0 0 $22.25
San Felipe/Voss 36 3,452,866 263,564 274,903 8.0% 61,531 0 0 $20.75
San Jacinto County 1 27,261 0 0 0.0% 0 0 0 $0.00
South 73 1,522,069 187,683 187,683 12.3% 36,580 58,279 120,235 $24.77
South Hwy 35 29 328,704 8,017 8,017 2.4% (5,033) 0 0 $14.94
South Main/Medical Center 63 4,338,857 309,206 309,206 7.1% (10,226) 0 0 $23.16
Southwest Beltway 8 98 5,621,482 1,162,752 1,324,619 23.6% (100,228) 0 0 $16.51
Southwest/Hillcroft 28 1,799,184 380,405 380,405 21.1% 22,908 0 0 $14.61
Westchase 73 8,020,632 796,596 823,219 10.3% 175,594 0 0 $18.26
Woodlands 242 6,732,727 455,005 473,458 7.0% 367,866 56,485 67,000 $23.34
Totals 2,455 119,857,705 15,108,315 15,691,622 13.1% 1,255,819 298,112 406,826 $19.70
Source: CoStar Property®
Existing Inventory Vacancy
12 THE COSTAR OFFICE REPORT ©2013 COSTAR GROUP, INC.
HOUSTON – YEAR-END 2012
Houston Office MarketYEAR-END 2012 – HOUSTON
Houston Office Market
©2013 COSTAR GROUP, INC. THE COSTAR OFFICE REPORT 13
FIGURES AT A GLANCE
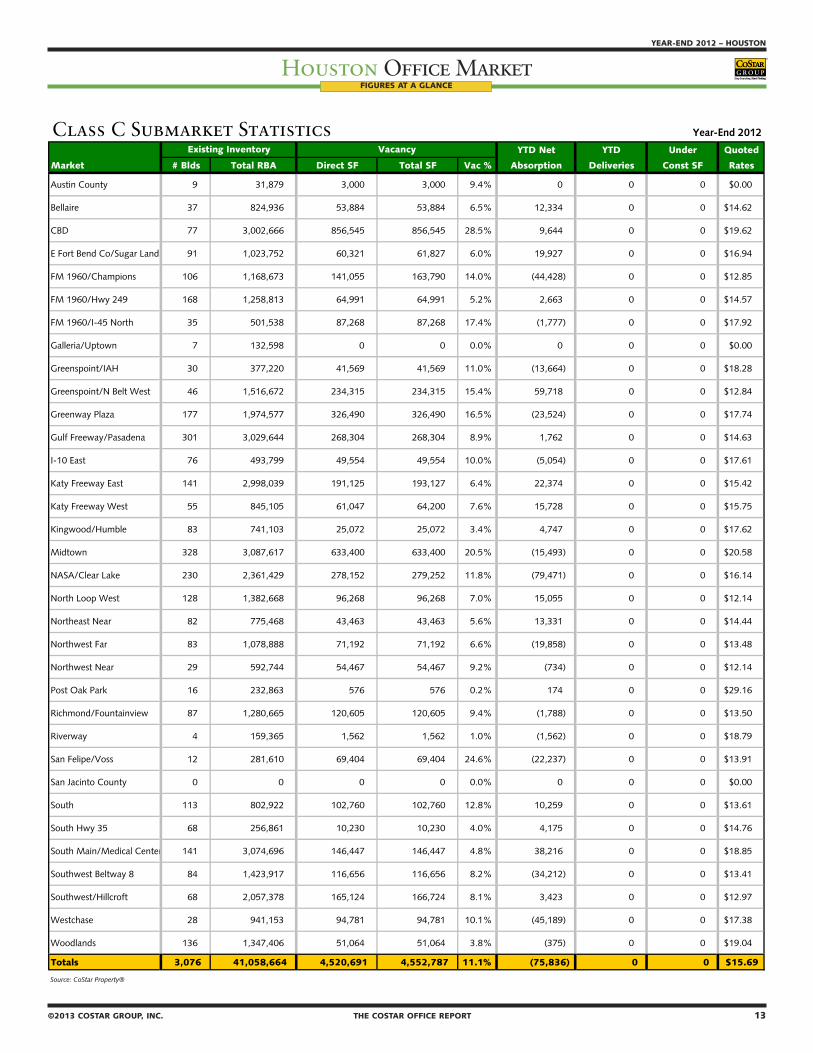
Class C Submarket Statistics Year-End 2012
YTD Net YTD Under Quoted
Market # Blds Total RBA Direct SF Total SF Vac % Absorption Deliveries Const SF Rates
Austin County 9 31,879 3,000 3,000 9.4% 0 0 0 $0.00
Bellaire 37 824,936 53,884 53,884 6.5% 12,334 0 0 $14.62
CBD 77 3,002,666 856,545 856,545 28.5% 9,644 0 0 $19.62
E Fort Bend Co/Sugar Land 91 1,023,752 60,321 61,827 6.0% 19,927 0 0 $16.94
FM 1960/Champions 106 1,168,673 141,055 163,790 14.0% (44,428) 0 0 $12.85
FM 1960/Hwy 249 168 1,258,813 64,991 64,991 5.2% 2,663 0 0 $14.57
FM 1960/I-45 North 35 501,538 87,268 87,268 17.4% (1,777) 0 0 $17.92
Galleria/Uptown 7 132,598 0 0 0.0% 0 0 0 $0.00
Greenspoint/IAH 30 377,220 41,569 41,569 11.0% (13,664) 0 0 $18.28
Greenspoint/N Belt West 46 1,516,672 234,315 234,315 15.4% 59,718 0 0 $12.84
Greenway Plaza 177 1,974,577 326,490 326,490 16.5% (23,524) 0 0 $17.74
Gulf Freeway/Pasadena 301 3,029,644 268,304 268,304 8.9% 1,762 0 0 $14.63
I-10 East 76 493,799 49,554 49,554 10.0% (5,054) 0 0 $17.61
Katy Freeway East 141 2,998,039 191,125 193,127 6.4% 22,374 0 0 $15.42
Katy Freeway West 55 845,105 61,047 64,200 7.6% 15,728 0 0 $15.75
Kingwood/Humble 83 741,103 25,072 25,072 3.4% 4,747 0 0 $17.62
Midtown 328 3,087,617 633,400 633,400 20.5% (15,493) 0 0 $20.58
NASA/Clear Lake 230 2,361,429 278,152 279,252 11.8% (79,471) 0 0 $16.14
North Loop West 128 1,382,668 96,268 96,268 7.0% 15,055 0 0 $12.14
Northeast Near 82 775,468 43,463 43,463 5.6% 13,331 0 0 $14.44
Northwest Far 83 1,078,888 71,192 71,192 6.6% (19,858) 0 0 $13.48
Northwest Near 29 592,744 54,467 54,467 9.2% (734) 0 0 $12.14
Post Oak Park 16 232,863 576 576 0.2% 174 0 0 $29.16
Richmond/Fountainview 87 1,280,665 120,605 120,605 9.4% (1,788) 0 0 $13.50
Riverway 4 159,365 1,562 1,562 1.0% (1,562) 0 0 $18.79
San Felipe/Voss 12 281,610 69,404 69,404 24.6% (22,237) 0 0 $13.91
San Jacinto County 0 0 0 0 0.0% 0 0 0 $0.00
South 113 802,922 102,760 102,760 12.8% 10,259 0 0 $13.61
South Hwy 35 68 256,861 10,230 10,230 4.0% 4,175 0 0 $14.76
South Main/Medical Center 141 3,074,696 146,447 146,447 4.8% 38,216 0 0 $18.85
Southwest Beltway 8 84 1,423,917 116,656 116,656 8.2% (34,212) 0 0 $13.41
Southwest/Hillcroft 68 2,057,378 165,124 166,724 8.1% 3,423 0 0 $12.97
Westchase 28 941,153 94,781 94,781 10.1% (45,189) 0 0 $17.38
Woodlands 136 1,347,406 51,064 51,064 3.8% (375) 0 0 $19.04
Totals 3,076 41,058,664 4,520,691 4,552,787 11.1% (75,836) 0 0 $15.69
Source: CoStar Property®
Existing Inventory Vacancy

14 THE COSTAR OFFICE REPORT ©2013 COSTAR GROUP, INC.
HOUSTON – YEAR-END 2012
Houston Office MarketYEAR-END 2012 – HOUSTON
Houston Office Market
©2013 COSTAR GROUP, INC. THE COSTAR OFFICE REPORT 15
FIGURES AT A GLANCE
Total Office Submarket Statistics Year-End 2012
YTD Net YTD Under Quoted
Market # Blds Total RBA Direct SF Total SF Vac % Absorption Deliveries Const SF Rates
Austin County 13 62,874 3,000 3,000 4.8% 0 0 0 $0.00
Bellaire 70 4,926,868 450,846 456,072 9.3% 24,261 0 0 $22.52
CBD 172 50,083,310 4,799,336 5,122,929 10.2% 1,061,243 0 0 $33.16
E Fort Bend Co/Sugar Land 324 9,120,659 1,405,045 1,500,295 16.4% 101,639 26,084 0 $24.26
FM 1960/Champions 201 4,031,333 919,543 942,278 23.4% (63,039) 0 0 $13.08
FM 1960/Hwy 249 365 8,331,189 1,627,679 1,698,240 20.4% 198,380 42,478 0 $22.29
FM 1960/I-45 North 100 2,610,965 327,395 332,917 12.8% 150,499 0 0 $17.41
Galleria/Uptown 59 15,203,715 1,473,525 1,510,586 9.9% 437,815 0 739,464 $31.61
Greenspoint/IAH 64 3,228,611 426,528 430,415 13.3% 42,388 50,000 100,000 $18.07
Greenspoint/N Belt West 112 10,526,863 1,435,999 1,531,149 14.5% 135,687 0 0 $18.33
Greenway Plaza 242 12,361,084 1,168,327 1,170,327 9.5% 128,423 0 0 $25.62
Gulf Freeway/Pasadena 446 6,356,013 675,579 681,852 10.7% 19,866 15,590 0 $17.94
I-10 East 98 1,117,488 147,228 147,228 13.2% 7,760 0 0 $15.72
Katy Freeway East 224 10,208,834 913,937 969,517 9.5% 460,889 451,724 650,052 $24.15
Katy Freeway West 284 21,846,185 1,307,957 1,428,281 6.5% 716,547 0 1,301,146 $25.15
Kingwood/Humble 149 2,540,956 197,069 198,069 7.8% 67,196 45,000 0 $21.57
Midtown 433 9,219,881 1,254,657 1,258,375 13.6% (131,337) 0 0 $25.17
NASA/Clear Lake 436 9,634,684 1,304,128 1,307,218 13.6% (219,122) 19,196 4,500 $19.73
North Loop West 196 5,916,046 1,140,808 1,165,617 19.7% 151,384 0 0 $18.82
Northeast Near 106 1,420,603 137,370 137,370 9.7% 45,575 30,000 0 $18.07
Northwest Far 167 7,807,164 778,321 800,369 10.3% 396,968 0 159,056 $18.98
Northwest Near 53 1,816,737 175,853 175,853 9.7% 5,344 0 0 $14.09
Post Oak Park 45 4,523,175 765,394 774,544 17.1% (297,135) 0 0 $25.99
Richmond/Fountainview 112 2,222,471 378,864 378,864 17.0% 5,251 0 0 $15.40
Riverway 23 3,084,540 380,263 386,038 12.5% (12,326) 0 0 $26.33
San Felipe/Voss 51 5,449,406 650,897 662,236 12.2% 31,874 0 0 $24.89
San Jacinto County 1 27,261 0 0 0.0% 0 0 0 $0.00
South 187 2,404,991 290,443 290,443 12.1% 67,541 58,279 120,235 $19.84
South Hwy 35 97 585,565 18,247 18,247 3.1% (858) 0 0 $14.85
South Main/Medical Center 218 11,885,398 1,124,171 1,126,171 9.5% 629,497 895,612 0 $24.98
Southwest Beltway 8 185 7,618,899 1,372,183 1,537,715 20.2% (148,013) 0 0 $16.39
Southwest/Hillcroft 102 5,341,914 794,256 795,856 14.9% 95,146 0 0 $14.79
Westchase 124 15,805,245 1,303,316 1,339,559 8.5% 630,646 45,000 299,664 $27.55
Woodlands 398 11,772,980 610,942 629,395 5.3% 500,859 151,485 1,370,585 $27.44
Totals 5,857 269,093,907 29,759,106 30,907,025 11.5% 5,240,848 1,830,448 4,744,702 $24.24
Source: CoStar Property®
Existing Inventory Vacancy

14 THE COSTAR OFFICE REPORT ©2013 COSTAR GROUP, INC.
HOUSTON – YEAR-END 2012
Houston Office MarketYEAR-END 2012 – HOUSTON
Houston Office Market
©2013 COSTAR GROUP, INC. THE COSTAR OFFICE REPORT 15
FIGURES AT A GLANCE
Class A Market Statistics Year-End 2012
YTD Net YTD Under Quoted
Market # Blds Total RBA Direct SF Total SF Vac % Absorption Deliveries Const SF Rates
CBD 33 31,869,387 2,230,661 2,547,289 8.0% 992,817 0 0 $37.17
Suburban 293 76,308,151 7,899,439 8,115,327 10.6% 3,068,048 1,532,336 4,337,876 $29.17
Totals 326 108,177,538 10,130,100 10,662,616 9.9% 4,060,865 1,532,336 4,337,876 $31.02
Source: CoStar Property®
Class B Market Statistics Year-End 2012
YTD Net YTD Under Quoted
Market # Blds Total RBA Direct SF Total SF Vac % Absorption Deliveries Const SF Rates
CBD 62 15,211,257 1,712,130 1,719,095 11.3% 58,782 0 0 $25.00
Suburban 2,393 104,646,448 13,396,185 13,972,527 13.4% 1,197,037 298,112 406,826 $19.23
Totals 2,455 119,857,705 15,108,315 15,691,622 13.1% 1,255,819 298,112 406,826 $19.70
Source: CoStar Property®
Class C Market Statistics Year-End 2012
YTD Net YTD Under Quoted
Market # Blds Total RBA Direct SF Total SF Vac % Absorption Deliveries Const SF Rates
CBD 77 3,002,666 856,545 856,545 28.5% 9,644 0 0 $19.62
Suburban 2,999 38,055,998 3,664,146 3,696,242 9.7% (85,480) 0 0 $15.40
Totals 3,076 41,058,664 4,520,691 4,552,787 11.1% (75,836) 0 0 $15.69
Source: CoStar Property®
Class A & B Market Statistics Year-End 2012
YTD Net YTD Under Quoted
Market # Blds Total RBA Direct SF Total SF Vac % Absorption Deliveries Const SF Rates
CBD 95 47,080,644 3,942,791 4,266,384 9.1% 1,051,599 0 0 $33.81
Suburban 2,686 180,954,599 21,295,624 22,087,854 12.2% 4,265,085 1,830,448 4,744,702 $23.57
Totals 2,781 228,035,243 25,238,415 26,354,238 11.6% 5,316,684 1,830,448 4,744,702 $25.14
Source: CoStar Property®
Total Office Market Statistics Year-End 2012
YTD Net YTD Under Quoted
Market # Blds Total RBA Direct SF Total SF Vac % Absorption Deliveries Const SF Rates
CBD 172 50,083,310 4,799,336 5,122,929 10.2% 1,061,243 0 0 $33.16
Suburban 5,685 219,010,597 24,959,770 25,784,096 11.8% 4,179,605 1,830,448 4,744,702 $22.72
Totals 5,857 269,093,907 29,759,106 30,907,025 11.5% 5,240,848 1,830,448 4,744,702 $24.24
Source: CoStar Property®
Existing Inventory Vacancy
Existing Inventory Vacancy
Existing Inventory Vacancy
Existing Inventory Vacancy
Existing Inventory Vacancy

16 THE COSTAR OFFICE REPORT ©2013 COSTAR GROUP, INC.
HOUSTON – YEAR-END 2012
Houston Office MarketYEAR-END 2012 – HOUSTON
Houston Office Market
©2013 COSTAR GROUP, INC. THE COSTAR OFFICE REPORT 17
FIGURES AT A GLANCE
Class A Market Statistics Year-End 2012
Net Quoted
Period # Blds Total RBA Direct SF Total SF Vac % Absorption # Blds Total RBA # Blds Total RBA Rates
2012 4q 326 108,177,538 10,130,100 10,662,616 9.9% 681,241 1 45,000 18 4,337,876 $31.02 2012 3q 325 108,132,538 10,695,597 11,298,857 10.4% 1,240,259 4 591,724 16 3,732,611 $30.98 2012 2q 321 107,540,814 11,336,659 11,947,392 11.1% 939,120 0 0 16 3,365,452 $30.91 2012 1q 321 107,540,814 12,247,459 12,886,512 12.0% 1,200,245 1 895,612 12 2,563,681 $30.41 2011 4q 320 106,645,202 12,537,551 13,191,145 12.4% 998,126 1 102,000 7 1,893,348 $29.73 2011 3q 319 106,543,202 13,401,779 14,087,271 13.2% 851,120 2 1,000,763 7 1,950,348 $29.20 2011 2q 318 105,961,926 13,706,990 14,357,115 13.5% (136,802) 0 0 5 2,098,375 $28.76 2011 1q 318 105,961,926 13,616,912 14,220,313 13.4% 720,162 1 972,474 5 2,098,375 $28.74
2010 317 104,989,452 13,347,732 13,968,001 13.3% 947,791 2 327,377 5 2,968,849 $28.99 2009 315 104,662,075 13,550,468 14,588,415 13.9% 1,899,063 21 4,943,600 5 3,040,226 $29.86 2008 294 99,718,475 10,695,964 11,543,878 11.6% 2,628,046 26 5,384,996 24 7,736,849 $29.32 2007 268 94,333,479 8,006,146 8,786,928 9.3% 4,203,158 14 2,321,336 34 8,452,882 $27.24 2006 254 92,012,143 9,518,357 10,668,750 11.6% 4,959,985 6 1,015,556 20 4,830,413 $23.69 2005 248 90,996,587 13,094,598 14,613,179 16.1% 2,635,230 12 1,668,345 8 1,614,689 $20.62 2004 236 89,328,242 13,832,672 15,580,064 17.4% (53,899) 3 413,955 13 2,210,198 $20.77 2003 233 88,914,287 12,980,438 15,112,210 17.0% 188,781 7 2,118,892 8 1,358,362 $20.50
Source: CoStar Property®
Class B Market Statistics Year-End 2012
Net Quoted
Period # Blds Total RBA Direct SF Total SF Vac % Absorption # Blds Total RBA # Blds Total RBA Rates
2012 4q 2,455 119,857,705 15,108,315 15,691,622 13.1% 261,863 7 80,435 9 406,826 $19.70 2012 3q 2,449 120,126,944 15,856,389 16,222,724 13.5% 263,565 5 112,466 13 420,261 $19.60 2012 2q 2,444 120,014,478 16,038,729 16,373,823 13.6% 508,524 3 68,923 16 522,071 $19.38 2012 1q 2,441 119,945,555 16,425,907 16,813,424 14.0% 221,867 4 36,288 16 468,168 $19.54 2011 4q 2,438 119,919,256 16,538,896 17,008,992 14.2% 339,555 9 118,668 13 267,677 $19.06 2011 3q 2,429 119,800,588 16,781,424 17,229,879 14.4% 259,240 8 143,210 18 277,944 $19.22 2011 2q 2,421 119,657,378 16,830,467 17,345,909 14.5% (130,488) 6 114,370 22 307,652 $19.08 2011 1q 2,415 119,543,008 16,555,102 17,101,051 14.3% 139,457 11 80,140 22 356,248 $18.95
2010 2,404 119,462,868 16,579,141 17,160,368 14.4% 205,976 37 468,550 21 299,420 $18.99 2009 2,368 119,003,221 16,062,340 16,906,697 14.2% (637,460) 93 1,576,732 35 466,085 $19.31 2008 2,275 117,426,489 13,897,464 14,692,505 12.5% 1,118,263 128 2,338,428 79 1,401,813 $19.98 2007 2,148 115,152,334 12,936,058 13,536,613 11.8% 2,695,149 123 2,032,879 116 2,338,669 $19.32 2006 2,029 113,525,959 14,017,818 14,605,387 12.9% 3,263,365 91 2,505,377 110 1,921,929 $17.26 2005 1,940 111,087,257 14,481,568 15,430,050 13.9% 3,698,126 105 2,885,661 83 2,691,165 $16.24 2004 1,835 108,201,596 14,943,821 16,242,515 15.0% 1,925,438 73 1,336,467 99 3,304,241 $15.89 2003 1,763 106,961,845 15,249,315 16,928,202 15.8% 10,670 67 1,409,184 64 2,229,791 $15.67
Source: CoStar Property®
Total Office Market Statistics Year-End 2012
Net Quoted
Period # Blds Total RBA Direct SF Total SF Vac % Absorption # Blds Total RBA # Blds Total RBA Rates
2012 4q 5,857 269,093,907 29,759,106 30,907,025 11.5% 965,055 8 125,435 27 4,744,702 $24.24 2012 3q 5,850 269,318,146 31,089,088 32,096,319 11.9% 1,390,070 9 704,190 29 4,152,872 $24.02 2012 2q 5,841 268,613,956 31,800,064 32,782,199 12.2% 1,486,707 3 68,923 32 3,887,523 $23.74 2012 1q 5,838 268,545,033 33,131,409 34,199,983 12.7% 1,399,016 5 931,900 28 3,031,849 $23.60 2011 4q 5,834 267,623,122 33,494,347 34,677,088 13.0% 1,365,267 10 220,668 20 2,161,025 $22.94 2011 3q 5,824 267,402,454 34,606,403 35,821,687 13.4% 1,001,792 10 1,143,973 25 2,228,292 $22.71 2011 2q 5,816 266,699,968 34,926,109 36,120,993 13.5% (291,052) 6 114,370 27 2,406,027 $22.48 2011 1q 5,811 266,588,007 34,544,521 35,717,980 13.4% 908,037 12 1,052,614 27 2,454,623 $22.54
2010 5,799 265,535,393 34,350,974 35,573,403 13.4% 1,347,344 39 795,927 26 3,268,269 $22.76 2009 5,761 264,748,369 34,234,130 36,133,723 13.6% 1,187,750 118 6,531,901 40 3,506,311 $23.60 2008 5,643 258,216,468 29,131,316 30,789,572 11.9% 3,399,027 163 7,772,873 105 9,143,312 $23.70 2007 5,484 250,652,052 25,196,059 26,624,183 10.6% 7,149,302 147 4,407,080 156 10,831,556 $22.29 2006 5,343 246,729,694 28,078,433 29,851,127 12.1% 8,170,550 113 3,848,603 140 6,805,207 $19.73 2005 5,236 243,171,816 31,969,103 34,463,799 14.2% 6,565,813 140 4,761,707 106 4,632,274 $18.02 2004 5,099 238,542,745 33,314,479 36,400,541 15.3% 2,456,720 117 1,911,112 130 5,898,996 $17.82 2003 4,986 236,793,679 33,241,000 37,108,195 15.7% (636,933) 86 3,634,001 107 3,734,675 $17.63
Source: CoStar Property®
Existing Inventory Vacancy Deliveries UC Inventory
Existing Inventory Vacancy Deliveries UC Inventory
Existing Inventory Vacancy Deliveries UC Inventory

16 THE COSTAR OFFICE REPORT ©2013 COSTAR GROUP, INC.
HOUSTON – YEAR-END 2012
Houston Office MarketYEAR-END 2012 – HOUSTON
Houston Office Market
©2013 COSTAR GROUP, INC. THE COSTAR OFFICE REPORT 17
Historical Rental RatesBased on Full-Service Equivalent Rental Rates
Source: CoStar Property®
Vacancy by Available Space Type Vacancy by ClassPercent of All Vacant Space in Direct vs. Sublet Percent of All Vacant Space by Class
Source: CoStar Property® Source: CoStar Property®
U.S. Rental Rate Comparison Future Space AvailableBased on Full-Service Equivalent Rental Rates Space Scheduled to be Available for Occupancy*
Source: CoStar Property® * Includes Under Construction Spaces Source: CoStar Property®
Houston United States Houston United States
$0.00
$5.00
$10.00
$15.00
$20.00
$25.00
$30.00
$35.00
1999
1q
1999
3q
2000
1q
2000
3q
2001
1q
2001
3q
2002
1q
2002
3q
2003
1q
2003
3q
2004
1q
2004
3q
2005
1q
2005
3q
2006
1q
2006
3q
2007
1q
2007
3q
2008
1q
2008
3q
2009
1q
2009
3q
2010
1q
2010
3q
2011
1q
2011
3q
2012
1q
2012
3q
Dollar
s/SF/Y
ear
A B C Total Market
$0.00
$5.00
$10.00
$15.00
$20.00
$25.00
$30.00
20103q
20104q
20111q
20112q
20113q
20114q
20121q
20122q
20123q
20124q
Dollar
s/SF/Y
ear
Houston United States
96%
4%
Direct Sublet
4%
96%
Direct Sublet
34%51%
15%
Class A Class B Class C
3.82
3.41
1.34
0.62
0.00 0.000.0
0.5
1.0
1.5
2.0
2.5
3.0
3.5
4.0
4.5
2013 1q 2013 2q 2013 3q 2013 4q 2014 1q 2014 2q
Mill
ions
17%
49% 34%
Class A Class B Class C
LEASING ACTIVITY
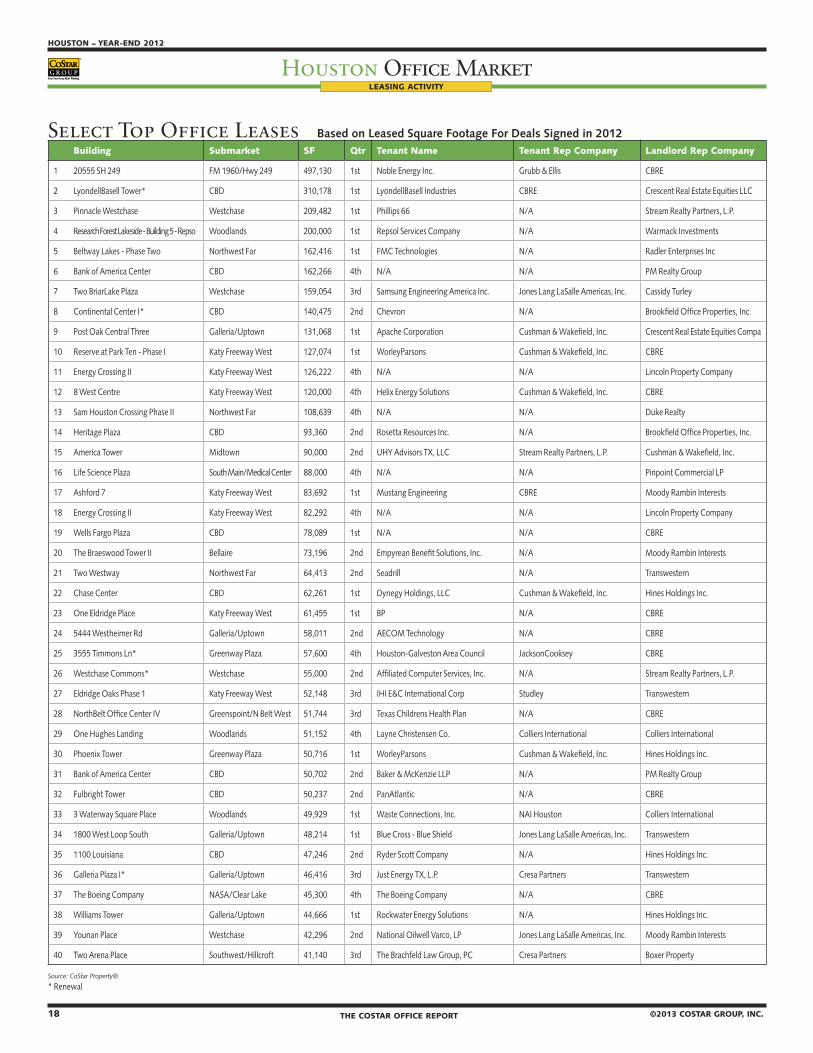
18 THE COSTAR OFFICE REPORT ©2013 COSTAR GROUP, INC.
HOUSTON – YEAR-END 2012
Houston Office MarketYEAR-END 2012 – HOUSTON
Houston Office Market
©2013 COSTAR GROUP, INC. THE COSTAR OFFICE REPORT 19
LEASING ACTIVITY
Source: CoStar Property®
* Renewal
Building Submarket SF Qtr Tenant Name Tenant Rep Company Landlord Rep Company
1 20555 SH 249 FM 1960/Hwy 249 497,130 1st Noble Energy Inc. Grubb & Ellis CBRE
2 LyondellBasell Tower* CBD 310,178 1st LyondellBasell Industries CBRE Crescent Real Estate Equities LLC
3 Pinnacle Westchase Westchase 209,482 1st Phillips 66 N/A Stream Realty Partners, L.P.
4 Research Forest Lakeside - Building 5 - Repso Woodlands 200,000 1st Repsol Services Company N/A Warmack Investments
5 Beltway Lakes - Phase Two Northwest Far 162,416 1st FMC Technologies N/A Radler Enterprises Inc
6 Bank of America Center CBD 162,266 4th N/A N/A PM Realty Group
7 Two BriarLake Plaza Westchase 159,054 3rd Samsung Engineering America Inc. Jones Lang LaSalle Americas, Inc. Cassidy Turley
8 Continental Center I* CBD 140,475 2nd Chevron N/A Brookfield Office Properties, Inc.
9 Post Oak Central Three Galleria/Uptown 131,068 1st Apache Corporation Cushman & Wakefield, Inc. Crescent Real Estate Equities Compa
10 Reserve at Park Ten - Phase I Katy Freeway West 127,074 1st WorleyParsons Cushman & Wakefield, Inc. CBRE
11 Energy Crossing II Katy Freeway West 126,222 4th N/A N/A Lincoln Property Company
12 8 West Centre Katy Freeway West 120,000 4th Helix Energy Solutions Cushman & Wakefield, Inc. CBRE
13 Sam Houston Crossing Phase II Northwest Far 108,639 4th N/A N/A Duke Realty
14 Heritage Plaza CBD 93,360 2nd Rosetta Resources Inc. N/A Brookfield Office Properties, Inc.
15 America Tower Midtown 90,000 2nd UHY Advisors TX, LLC Stream Realty Partners, L.P. Cushman & Wakefield, Inc.
16 Life Science Plaza South Main/Medical Center 88,000 4th N/A N/A Pinpoint Commercial LP
17 Ashford 7 Katy Freeway West 83,692 1st Mustang Engineering CBRE Moody Rambin Interests
18 Energy Crossing II Katy Freeway West 82,292 4th N/A N/A Lincoln Property Company
19 Wells Fargo Plaza CBD 78,089 1st N/A N/A CBRE
20 The Braeswood Tower II Bellaire 73,196 2nd Empyrean Benefit Solutions, Inc. N/A Moody Rambin Interests
21 Two Westway Northwest Far 64,413 2nd Seadrill N/A Transwestern
22 Chase Center CBD 62,261 1st Dynegy Holdings, LLC Cushman & Wakefield, Inc. Hines Holdings Inc.
23 One Eldridge Place Katy Freeway West 61,455 1st BP N/A CBRE
24 5444 Westheimer Rd Galleria/Uptown 58,011 2nd AECOM Technology N/A CBRE
25 3555 Timmons Ln* Greenway Plaza 57,600 4th Houston-Galveston Area Council JacksonCooksey CBRE
26 Westchase Commons* Westchase 55,000 2nd Affiliated Computer Services, Inc. N/A Stream Realty Partners, L.P.
27 Eldridge Oaks Phase 1 Katy Freeway West 52,148 3rd IHI E&C International Corp Studley Transwestern
28 NorthBelt Office Center IV Greenspoint/N Belt West 51,744 3rd Texas Childrens Health Plan N/A CBRE
29 One Hughes Landing Woodlands 51,152 4th Layne Christensen Co. Colliers International Colliers International
30 Phoenix Tower Greenway Plaza 50,716 1st WorleyParsons Cushman & Wakefield, Inc. Hines Holdings Inc.
31 Bank of America Center CBD 50,702 2nd Baker & McKenzie LLP N/A PM Realty Group
32 Fulbright Tower CBD 50,237 2nd PanAtlantic N/A CBRE
33 3 Waterway Square Place Woodlands 49,929 1st Waste Connections, Inc. NAI Houston Colliers International
34 1800 West Loop South Galleria/Uptown 48,214 1st Blue Cross - Blue Shield Jones Lang LaSalle Americas, Inc. Transwestern
35 1100 Louisiana CBD 47,246 2nd Ryder Scott Company N/A Hines Holdings Inc.
36 Galleria Plaza I* Galleria/Uptown 46,416 3rd Just Energy TX, L.P. Cresa Partners Transwestern
37 The Boeing Company NASA/Clear Lake 45,300 4th The Boeing Company N/A CBRE
38 Williams Tower Galleria/Uptown 44,666 1st Rockwater Energy Solutions N/A Hines Holdings Inc.
39 Younan Place Westchase 42,296 2nd National Oilwell Varco, LP Jones Lang LaSalle Americas, Inc. Moody Rambin Interests
40 Two Arena Place Southwest/Hillcroft 41,140 3rd The Brachfeld Law Group, PC Cresa Partners Boxer Property
Select Top Office Leases Based on Leased Square Footage For Deals Signed in 2012
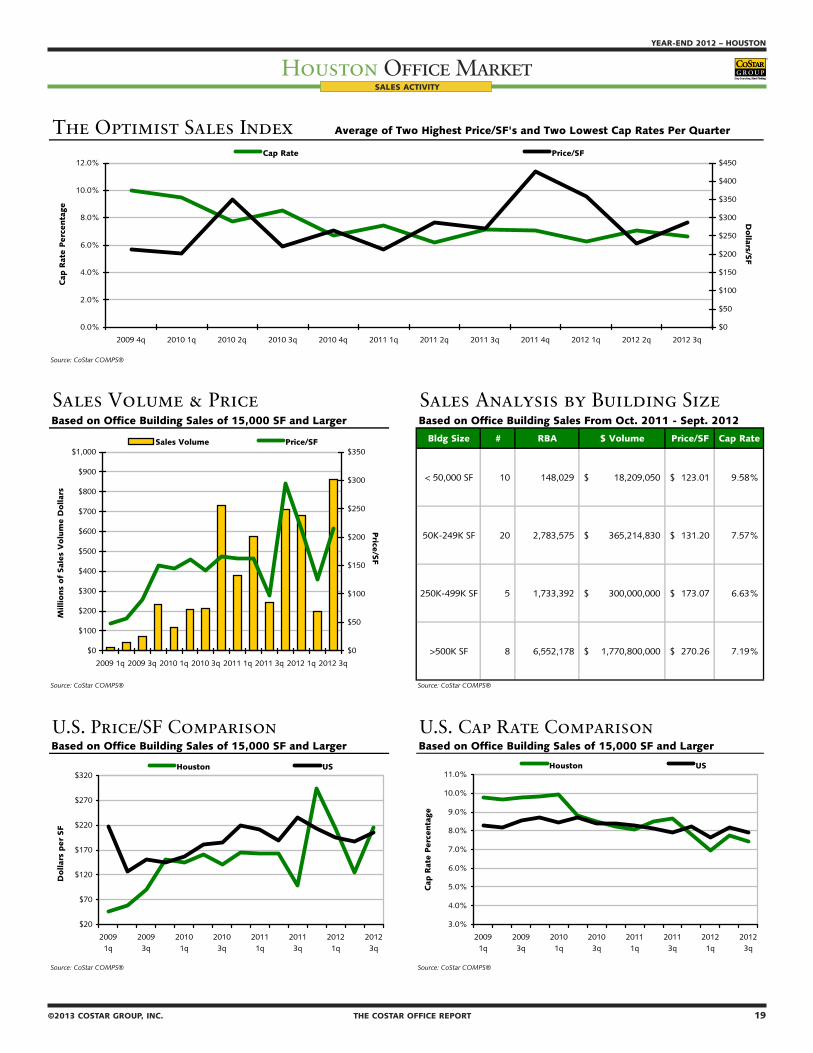
18 THE COSTAR OFFICE REPORT ©2013 COSTAR GROUP, INC.
HOUSTON – YEAR-END 2012
Houston Office MarketYEAR-END 2012 – HOUSTON
Houston Office Market
©2013 COSTAR GROUP, INC. THE COSTAR OFFICE REPORT 19
SALES ACTIVITY
The Optimist Sales Index Average of Two Highest Price/SF's and Two Lowest Cap Rates Per Quarter
Source: CoStar COMPS®
Sales Volume & Price Sales Analysis by Building SizeBased on Office Building Sales of 15,000 SF and Larger Based on Office Building Sales From Oct. 2011 - Sept. 2012
Bldg Size # RBA $ Volume Price/SF Cap Rate
< 50,000 SF 10 148,029 18,209,050$ 123.01$ 9.58%
50K-249K SF 20 2,783,575 365,214,830$ 131.20$ 7.57%
250K-499K SF 5 1,733,392 300,000,000$ 173.07$ 6.63%
>500K SF 8 6,552,178 1,770,800,000$ 270.26$ 7.19%
Source: CoStar COMPS® Source: CoStar COMPS®
U.S. Price/SF Comparison U.S. Cap Rate ComparisonBased on Office Building Sales of 15,000 SF and Larger Based on Office Building Sales of 15,000 SF and Larger
Source: CoStar COMPS® Source: CoStar COMPS®
$20
$70
$120
$170
$220
$270
$320
20091q
20093q
20101q
20103q
20111q
20113q
20121q
20123q
Dollar
s per
SF
Houston US
$0
$100
$200
$300
$400
$500
$600
$700
$800
$900
$1,000
2009 1q 2009 3q 2010 1q 2010 3q 2011 1q 2011 3q 2012 1q 2012 3q
Millio
ns
of
Sal
es V
olu
me
Do
llar
s
$0
$50
$100
$150
$200
$250
$300
$350
Price
/SF
Sales Volume Price/SF
0.0%
2.0%
4.0%
6.0%
8.0%
10.0%
12.0%
2009 4q 2010 1q 2010 2q 2010 3q 2010 4q 2011 1q 2011 2q 2011 3q 2011 4q 2012 1q 2012 2q 2012 3q
Cap
Rat
e P
erc
enta
ge
$0
$50
$100
$150
$200
$250
$300
$350
$400
$450
Dollars/S
F
Cap Rate Price/SF
3.0%
4.0%
5.0%
6.0%
7.0%
8.0%
9.0%
10.0%
11.0%
20091q
20093q
20101q
20103q
20111q
20113q
20121q
20123q
Cap
Rat
e P
erc
enta
ge
Houston US

20 THE COSTAR OFFICE REPORT ©2013 COSTAR GROUP, INC.
HOUSTON – YEAR-END 2012
Houston Office Market
©2013 COSTAR GROUP, INC. THE COSTAR OFFICE REPORT 21
YEAR-END 2012 – HOUSTON
Houston Office MarketMARKET HIGHLIGHTS – CLASS “A, B & C”
SALES ACTIVITY
���������������� ������������������������������������������������������
���������������������
���������������������������������������������������������
�����������������������������������������������������������������������������������
���������������
�������
���������������������������������������������������������
�������������������������������������������������������������������������������������������������
��������������
�������
���������������������������������������������������������
����������������������������������������������������������������������������������������
�������������
�������
���������������������������������������������������������
���������������������������������������������������������������������������������������������������������������������������
�������������
�������
���������������������������������������������������������
�������������������������������������������������������������������������������������������������������
�����������������
�������
���������������������������������������������������������
����������������������������������������������������������������������������
������������������������
�������
���������������������������������������������������������
���������������������������������������������������������������������������������������������������������
������������������������
�������
���������������������������������������������������������
�����������������������������������������������������������������������������������
������������������������
�������
���������������������������������������������������������
�������������������������������������������������������������������������������������������������
�������������������������������
�������������
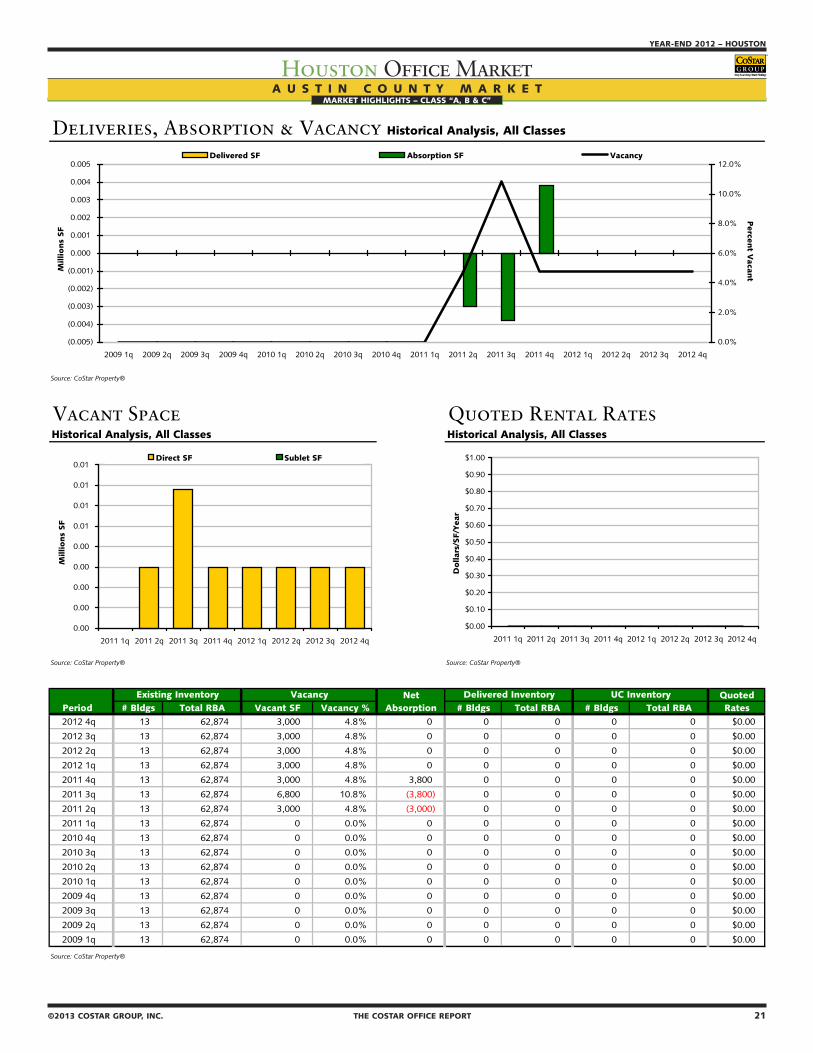
20 THE COSTAR OFFICE REPORT ©2013 COSTAR GROUP, INC.
HOUSTON – YEAR-END 2012
Houston Office Market
©2013 COSTAR GROUP, INC. THE COSTAR OFFICE REPORT 21
YEAR-END 2012 – HOUSTON
Houston Office MarketMARKET HIGHLIGHTS – CLASS “A, B & C”
A U S T I N C O U N T Y M A R K E T
Deliveries, Absorption & Vacancy Historical Analysis, All Classes
Source: CoStar Property®
Vacant Space Quoted Rental RatesHistorical Analysis, All Classes Historical Analysis, All Classes
Source: CoStar Property® Source: CoStar Property®
Net QuotedPeriod # Bldgs Total RBA Vacant SF Vacancy % Absorption # Bldgs Total RBA # Bldgs Total RBA Rates2012 4q 13 62,874 3,000 4.8% 0 0 0 0 0 $0.00
2012 3q 13 62,874 3,000 4.8% 0 0 0 0 0 $0.00
2012 2q 13 62,874 3,000 4.8% 0 0 0 0 0 $0.00
2012 1q 13 62,874 3,000 4.8% 0 0 0 0 0 $0.00
2011 4q 13 62,874 3,000 4.8% 3,800 0 0 0 0 $0.00
2011 3q 13 62,874 6,800 10.8% (3,800) 0 0 0 0 $0.00
2011 2q 13 62,874 3,000 4.8% (3,000) 0 0 0 0 $0.00
2011 1q 13 62,874 0 0.0% 0 0 0 0 0 $0.00
2010 4q 13 62,874 0 0.0% 0 0 0 0 0 $0.00
2010 3q 13 62,874 0 0.0% 0 0 0 0 0 $0.00
2010 2q 13 62,874 0 0.0% 0 0 0 0 0 $0.00
2010 1q 13 62,874 0 0.0% 0 0 0 0 0 $0.00
2009 4q 13 62,874 0 0.0% 0 0 0 0 0 $0.00
2009 3q 13 62,874 0 0.0% 0 0 0 0 0 $0.00
2009 2q 13 62,874 0 0.0% 0 0 0 0 0 $0.00
2009 1q 13 62,874 0 0.0% 0 0 0 0 0 $0.00
Source: CoStar Property®
UC InventoryDelivered InventoryExisting Inventory Vacancy
(0.005)
(0.004)
(0.003)
(0.002)
(0.001)
0.000
0.001
0.002
0.003
0.004
0.005
2009 1q 2009 2q 2009 3q 2009 4q 2010 1q 2010 2q 2010 3q 2010 4q 2011 1q 2011 2q 2011 3q 2011 4q 2012 1q 2012 2q 2012 3q 2012 4q
Millio
ns
SF
0.0%
2.0%
4.0%
6.0%
8.0%
10.0%
12.0%
Perce
nt V
acant
Delivered SF Absorption SF Vacancy
$0.00
$0.10
$0.20
$0.30
$0.40
$0.50
$0.60
$0.70
$0.80
$0.90
$1.00
2011 1q 2011 2q 2011 3q 2011 4q 2012 1q 2012 2q 2012 3q 2012 4q
Dollar
s/SF/Y
ear
0.00
0.00
0.00
0.00
0.00
0.01
0.01
0.01
0.01
2011 1q 2011 2q 2011 3q 2011 4q 2012 1q 2012 2q 2012 3q 2012 4q
Millio
ns
SF
Direct SF Sublet SF
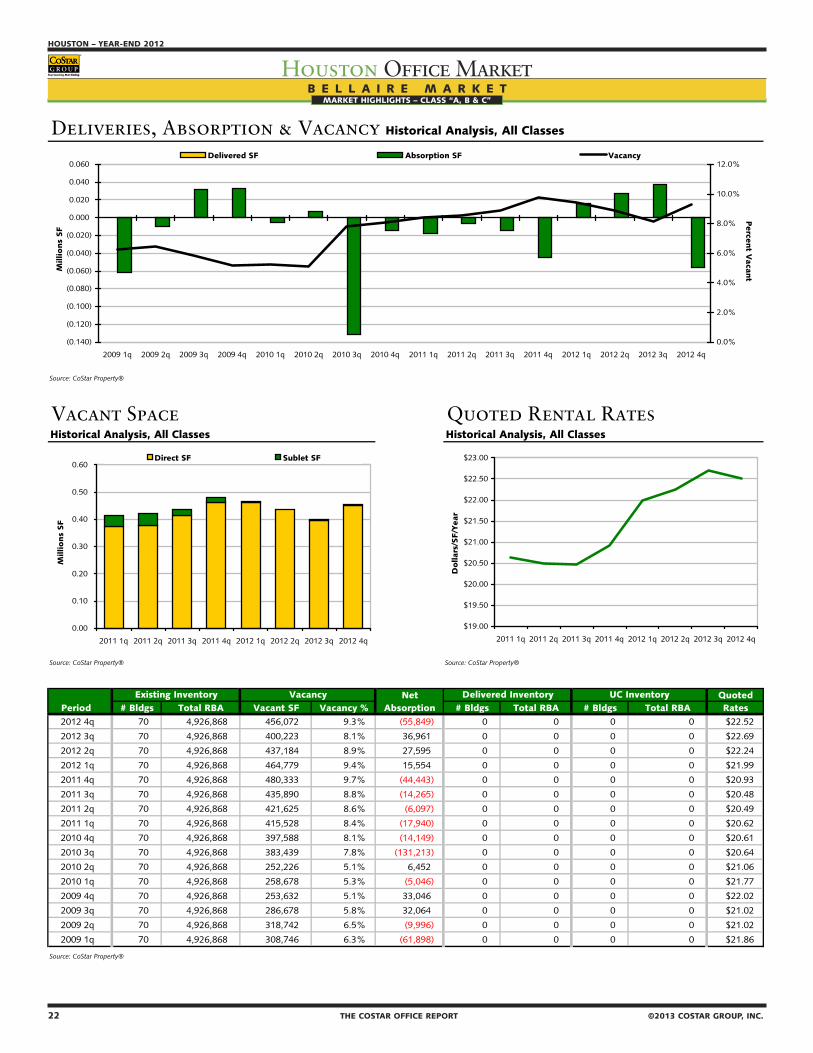
22 THE COSTAR OFFICE REPORT ©2013 COSTAR GROUP, INC.
HOUSTON – YEAR-END 2012
Houston Office MarketMARKET HIGHLIGHTS – CLASS “A, B & C”
©2013 COSTAR GROUP, INC. THE COSTAR OFFICE REPORT 23
YEAR-END 2012 – HOUSTON
Houston Office MarketMARKET HIGHLIGHTS – CLASS “A, B & C”
B E L L A I R E M A R K E T
Deliveries, Absorption & Vacancy Historical Analysis, All Classes
Source: CoStar Property®
Vacant Space Quoted Rental RatesHistorical Analysis, All Classes Historical Analysis, All Classes
Source: CoStar Property® Source: CoStar Property®
Net QuotedPeriod # Bldgs Total RBA Vacant SF Vacancy % Absorption # Bldgs Total RBA # Bldgs Total RBA Rates2012 4q 70 4,926,868 456,072 9.3% (55,849) 0 0 0 0 $22.52
2012 3q 70 4,926,868 400,223 8.1% 36,961 0 0 0 0 $22.69
2012 2q 70 4,926,868 437,184 8.9% 27,595 0 0 0 0 $22.24
2012 1q 70 4,926,868 464,779 9.4% 15,554 0 0 0 0 $21.99
2011 4q 70 4,926,868 480,333 9.7% (44,443) 0 0 0 0 $20.93
2011 3q 70 4,926,868 435,890 8.8% (14,265) 0 0 0 0 $20.48
2011 2q 70 4,926,868 421,625 8.6% (6,097) 0 0 0 0 $20.49
2011 1q 70 4,926,868 415,528 8.4% (17,940) 0 0 0 0 $20.62
2010 4q 70 4,926,868 397,588 8.1% (14,149) 0 0 0 0 $20.61
2010 3q 70 4,926,868 383,439 7.8% (131,213) 0 0 0 0 $20.64
2010 2q 70 4,926,868 252,226 5.1% 6,452 0 0 0 0 $21.06
2010 1q 70 4,926,868 258,678 5.3% (5,046) 0 0 0 0 $21.77
2009 4q 70 4,926,868 253,632 5.1% 33,046 0 0 0 0 $22.02
2009 3q 70 4,926,868 286,678 5.8% 32,064 0 0 0 0 $21.02
2009 2q 70 4,926,868 318,742 6.5% (9,996) 0 0 0 0 $21.02
2009 1q 70 4,926,868 308,746 6.3% (61,898) 0 0 0 0 $21.86
Source: CoStar Property®
UC InventoryDelivered InventoryExisting Inventory Vacancy
(0.140)
(0.120)
(0.100)
(0.080)
(0.060)
(0.040)
(0.020)
0.000
0.020
0.040
0.060
2009 1q 2009 2q 2009 3q 2009 4q 2010 1q 2010 2q 2010 3q 2010 4q 2011 1q 2011 2q 2011 3q 2011 4q 2012 1q 2012 2q 2012 3q 2012 4q
Millio
ns
SF
0.0%
2.0%
4.0%
6.0%
8.0%
10.0%
12.0%
Perce
nt V
acant
Delivered SF Absorption SF Vacancy
$19.00
$19.50
$20.00
$20.50
$21.00
$21.50
$22.00
$22.50
$23.00
2011 1q 2011 2q 2011 3q 2011 4q 2012 1q 2012 2q 2012 3q 2012 4q
Dollar
s/SF/Y
ear
0.00
0.10
0.20
0.30
0.40
0.50
0.60
2011 1q 2011 2q 2011 3q 2011 4q 2012 1q 2012 2q 2012 3q 2012 4q
Millio
ns
SF
Direct SF Sublet SF

22 THE COSTAR OFFICE REPORT ©2013 COSTAR GROUP, INC.
HOUSTON – YEAR-END 2012
Houston Office MarketMARKET HIGHLIGHTS – CLASS “A, B & C”
©2013 COSTAR GROUP, INC. THE COSTAR OFFICE REPORT 23
YEAR-END 2012 – HOUSTON
Houston Office MarketMARKET HIGHLIGHTS – CLASS “A, B & C”
D O W N T O W N M A R K E T
Deliveries, Absorption & Vacancy Historical Analysis, All Classes
Source: CoStar Property®
Vacant Space Quoted Rental RatesHistorical Analysis, All Classes Historical Analysis, All Classes
Source: CoStar Property® Source: CoStar Property®
Net QuotedPeriod # Bldgs Total RBA Vacant SF Vacancy % Absorption # Bldgs Total RBA # Bldgs Total RBA Rates2012 4q 605 59,303,191 6,381,304 10.8% 275,436 0 0 0 0 $32.00
2012 3q 605 59,303,191 6,656,740 11.2% 442,132 0 0 0 0 $31.47
2012 2q 605 59,303,191 7,098,872 12.0% 312 0 0 0 0 $31.55
2012 1q 605 59,303,191 7,099,184 12.0% 212,026 0 0 0 0 $30.86
2011 4q 605 59,303,191 7,311,210 12.3% 254,704 0 0 0 0 $29.97
2011 3q 605 59,303,191 7,565,914 12.8% 472,942 1 844,763 0 0 $29.09
2011 2q 605 58,480,428 7,216,093 12.3% 121,986 0 0 1 844,763 $28.85
2011 1q 605 58,480,428 7,338,079 12.5% 275,286 2 980,574 1 844,763 $28.37
2010 4q 603 57,499,854 6,632,791 11.5% 62,965 0 0 3 1,825,337 $28.88
2010 3q 603 57,499,854 6,695,756 11.6% (21,492) 0 0 3 1,825,337 $28.72
2010 2q 603 57,499,854 6,674,264 11.6% 4,186 1 5,768 3 1,825,337 $28.98
2010 1q 602 57,494,086 6,672,682 11.6% (165,356) 0 0 3 1,823,005 $29.28
2009 4q 602 57,494,086 6,507,326 11.3% 140,543 2 66,852 3 1,823,005 $30.86
2009 3q 600 57,427,234 6,581,017 11.5% (185,880) 1 19,006 5 1,889,857 $29.04
2009 2q 599 57,408,228 6,376,131 11.1% (174,372) 0 0 5 1,903,095 $29.89
2009 1q 599 57,408,228 6,201,759 10.8% (214,855) 2 59,462 3 1,836,243 $30.75
Source: CoStar Property®
UC InventoryDelivered InventoryExisting Inventory Vacancy
(0.400)
(0.200)
0.000
0.200
0.400
0.600
0.800
1.000
1.200
2009 1q 2009 2q 2009 3q 2009 4q 2010 1q 2010 2q 2010 3q 2010 4q 2011 1q 2011 2q 2011 3q 2011 4q 2012 1q 2012 2q 2012 3q 2012 4q
Millio
ns
SF
9.5%
10.0%
10.5%
11.0%
11.5%
12.0%
12.5%
13.0%
Perce
nt V
acant
Delivered SF Absorption SF Vacancy
$26.00
$27.00
$28.00
$29.00
$30.00
$31.00
$32.00
$33.00
2011 1q 2011 2q 2011 3q 2011 4q 2012 1q 2012 2q 2012 3q 2012 4q
Dollar
s/SF/Y
ear
0.00
1.00
2.00
3.00
4.00
5.00
6.00
7.00
8.00
2011 1q 2011 2q 2011 3q 2011 4q 2012 1q 2012 2q 2012 3q 2012 4q
Millio
ns
SF
Direct SF Sublet SF
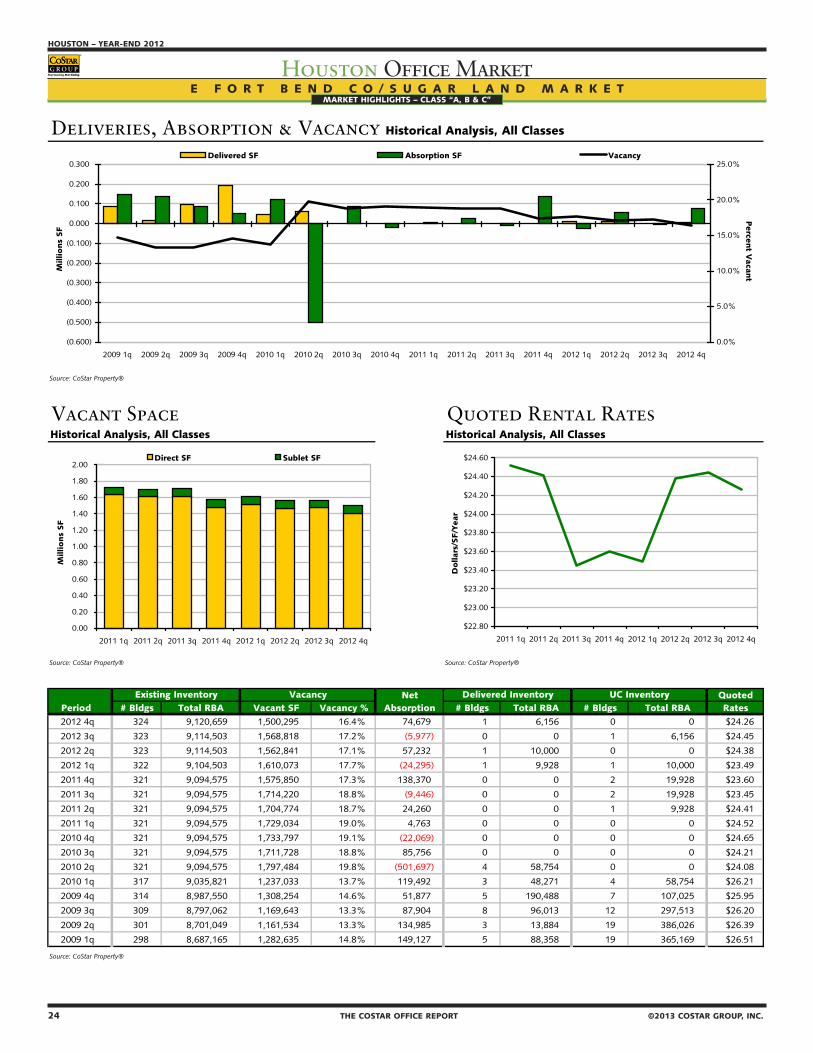
24 THE COSTAR OFFICE REPORT ©2013 COSTAR GROUP, INC.
HOUSTON – YEAR-END 2012
Houston Office MarketMARKET HIGHLIGHTS – CLASS “A, B & C”
©2013 COSTAR GROUP, INC. THE COSTAR OFFICE REPORT 25
YEAR-END 2012 – HOUSTON
Houston Office MarketMARKET HIGHLIGHTS – CLASS “A, B & C”
E F O R T B E N D C O / S U G A R L A N D M A R K E TMARKET HIGHLIGHTS – CLASS “A, B & C”
Deliveries, Absorption & Vacancy Historical Analysis, All Classes
Source: CoStar Property®
Vacant Space Quoted Rental RatesHistorical Analysis, All Classes Historical Analysis, All Classes
Source: CoStar Property® Source: CoStar Property®
Net QuotedPeriod # Bldgs Total RBA Vacant SF Vacancy % Absorption # Bldgs Total RBA # Bldgs Total RBA Rates2012 4q 324 9,120,659 1,500,295 16.4% 74,679 1 6,156 0 0 $24.26
2012 3q 323 9,114,503 1,568,818 17.2% (5,977) 0 0 1 6,156 $24.45
2012 2q 323 9,114,503 1,562,841 17.1% 57,232 1 10,000 0 0 $24.38
2012 1q 322 9,104,503 1,610,073 17.7% (24,295) 1 9,928 1 10,000 $23.49
2011 4q 321 9,094,575 1,575,850 17.3% 138,370 0 0 2 19,928 $23.60
2011 3q 321 9,094,575 1,714,220 18.8% (9,446) 0 0 2 19,928 $23.45
2011 2q 321 9,094,575 1,704,774 18.7% 24,260 0 0 1 9,928 $24.41
2011 1q 321 9,094,575 1,729,034 19.0% 4,763 0 0 0 0 $24.52
2010 4q 321 9,094,575 1,733,797 19.1% (22,069) 0 0 0 0 $24.65
2010 3q 321 9,094,575 1,711,728 18.8% 85,756 0 0 0 0 $24.21
2010 2q 321 9,094,575 1,797,484 19.8% (501,697) 4 58,754 0 0 $24.08
2010 1q 317 9,035,821 1,237,033 13.7% 119,492 3 48,271 4 58,754 $26.21
2009 4q 314 8,987,550 1,308,254 14.6% 51,877 5 190,488 7 107,025 $25.95
2009 3q 309 8,797,062 1,169,643 13.3% 87,904 8 96,013 12 297,513 $26.20
2009 2q 301 8,701,049 1,161,534 13.3% 134,985 3 13,884 19 386,026 $26.39
2009 1q 298 8,687,165 1,282,635 14.8% 149,127 5 88,358 19 365,169 $26.51
Source: CoStar Property®
UC InventoryDelivered InventoryExisting Inventory Vacancy
(0.600)
(0.500)
(0.400)
(0.300)
(0.200)
(0.100)
0.000
0.100
0.200
0.300
2009 1q 2009 2q 2009 3q 2009 4q 2010 1q 2010 2q 2010 3q 2010 4q 2011 1q 2011 2q 2011 3q 2011 4q 2012 1q 2012 2q 2012 3q 2012 4q
Millio
ns
SF
0.0%
5.0%
10.0%
15.0%
20.0%
25.0%
Perce
nt V
acant
Delivered SF Absorption SF Vacancy
$22.80
$23.00
$23.20
$23.40
$23.60
$23.80
$24.00
$24.20
$24.40
$24.60
2011 1q 2011 2q 2011 3q 2011 4q 2012 1q 2012 2q 2012 3q 2012 4q
Dollar
s/SF/Y
ear
0.00
0.20
0.40
0.60
0.80
1.00
1.20
1.40
1.60
1.80
2.00
2011 1q 2011 2q 2011 3q 2011 4q 2012 1q 2012 2q 2012 3q 2012 4q
Millio
ns
SF
Direct SF Sublet SF

24 THE COSTAR OFFICE REPORT ©2013 COSTAR GROUP, INC.
HOUSTON – YEAR-END 2012
Houston Office MarketMARKET HIGHLIGHTS – CLASS “A, B & C”
©2013 COSTAR GROUP, INC. THE COSTAR OFFICE REPORT 25
YEAR-END 2012 – HOUSTON
Houston Office MarketMARKET HIGHLIGHTS – CLASS “A, B & C”
F M 1 9 6 0 M A R K E TMARKET HIGHLIGHTS – CLASS “A, B & C”
Deliveries, Absorption & Vacancy Historical Analysis, All Classes
Source: CoStar Property®
Vacant Space Quoted Rental RatesHistorical Analysis, All Classes Historical Analysis, All Classes
Source: CoStar Property® Source: CoStar Property®
Net QuotedPeriod # Bldgs Total RBA Vacant SF Vacancy % Absorption # Bldgs Total RBA # Bldgs Total RBA Rates2012 4q 666 14,973,487 2,973,435 19.9% 102,632 0 0 0 0 $18.78
2012 3q 666 14,973,487 3,076,067 20.5% (119,676) 0 0 0 0 $18.67
2012 2q 666 14,973,487 2,956,391 19.7% 154,130 1 42,478 0 0 $18.08
2012 1q 665 14,931,009 3,068,043 20.5% 148,754 0 0 1 42,478 $18.38
2011 4q 665 14,931,009 3,216,797 21.5% 83,089 0 0 1 42,478 $18.75
2011 3q 665 14,931,009 3,299,886 22.1% 62,220 3 159,837 1 42,478 $18.79
2011 2q 663 15,190,659 3,621,756 23.8% (283,940) 2 71,559 3 159,837 $18.28
2011 1q 661 15,119,100 3,266,257 21.6% 59,810 1 9,599 5 231,396 $19.48
2010 4q 660 15,109,501 3,316,468 21.9% 32,277 1 2,337 6 240,995 $19.60
2010 3q 659 15,107,164 3,346,408 22.2% 5,097 2 9,558 5 239,495 $19.67
2010 2q 657 15,097,606 3,341,947 22.1% 152,337 2 29,296 5 177,494 $20.20
2010 1q 655 15,068,310 3,464,988 23.0% 18,058 0 0 5 41,191 $20.33
2009 4q 655 15,068,310 3,483,046 23.1% 708,202 2 9,166 2 29,296 $21.83
2009 3q 653 15,059,144 4,182,082 27.8% 116,234 1 55,468 4 38,462 $22.17
2009 2q 652 15,003,676 4,242,848 28.3% 47,542 0 0 5 93,930 $22.43
2009 1q 652 15,003,676 4,290,390 28.6% (34,040) 11 110,520 3 64,634 $22.38
Source: CoStar Property®
UC InventoryDelivered InventoryExisting Inventory Vacancy
(0.400)
(0.200)
0.000
0.200
0.400
0.600
0.800
2009 1q 2009 2q 2009 3q 2009 4q 2010 1q 2010 2q 2010 3q 2010 4q 2011 1q 2011 2q 2011 3q 2011 4q 2012 1q 2012 2q 2012 3q 2012 4q
Millio
ns
SF
0.0%
5.0%
10.0%
15.0%
20.0%
25.0%
30.0%
35.0%
Perce
nt V
acant
Delivered SF Absorption SF Vacancy
$17.00
$17.50
$18.00
$18.50
$19.00
$19.50
$20.00
2011 1q 2011 2q 2011 3q 2011 4q 2012 1q 2012 2q 2012 3q 2012 4q
Dollar
s/SF/Y
ear
0.00
0.50
1.00
1.50
2.00
2.50
3.00
3.50
4.00
2011 1q 2011 2q 2011 3q 2011 4q 2012 1q 2012 2q 2012 3q 2012 4q
Millio
ns
SF
Direct SF Sublet SF

26 THE COSTAR OFFICE REPORT ©2013 COSTAR GROUP, INC.
HOUSTON – YEAR-END 2012
Houston Office MarketMARKET HIGHLIGHTS – CLASS “A, B & C”
©2013 COSTAR GROUP, INC. THE COSTAR OFFICE REPORT 27
YEAR-END 2012 – HOUSTON
Houston Office MarketMARKET HIGHLIGHTS – CLASS “A, B & C”
G R E E N W A Y P L A Z A M A R K E T
Deliveries, Absorption & Vacancy Historical Analysis, All Classes
Source: CoStar Property®
Vacant Space Quoted Rental RatesHistorical Analysis, All Classes Historical Analysis, All Classes
Source: CoStar Property® Source: CoStar Property®
Net QuotedPeriod # Bldgs Total RBA Vacant SF Vacancy % Absorption # Bldgs Total RBA # Bldgs Total RBA Rates2012 4q 242 12,361,084 1,170,327 9.5% (49,955) 0 0 0 0 $25.62
2012 3q 242 12,361,084 1,120,372 9.1% 30,393 0 0 0 0 $25.23
2012 2q 242 12,361,084 1,150,765 9.3% 126,865 0 0 0 0 $25.27
2012 1q 242 12,361,084 1,277,630 10.3% 21,120 0 0 0 0 $24.90
2011 4q 242 12,361,084 1,298,750 10.5% 165,962 0 0 0 0 $24.59
2011 3q 242 12,361,084 1,464,712 11.8% 117,948 1 28,058 0 0 $24.73
2011 2q 241 12,333,026 1,554,602 12.6% 14,399 0 0 1 28,058 $24.68
2011 1q 242 12,335,435 1,571,410 12.7% (95,430) 0 0 1 28,058 $24.93
2010 4q 242 12,335,435 1,475,980 12.0% 99,442 0 0 1 28,058 $24.59
2010 3q 242 12,335,435 1,575,422 12.8% 26,612 0 0 1 28,058 $25.05
2010 2q 242 12,335,435 1,602,034 13.0% (86,066) 0 0 0 0 $25.14
2010 1q 242 12,335,435 1,515,968 12.3% (27,351) 0 0 0 0 $24.69
2009 4q 242 12,335,435 1,488,617 12.1% 114,163 0 0 0 0 $25.74
2009 3q 242 12,335,435 1,602,780 13.0% (59,944) 0 0 0 0 $26.01
2009 2q 242 12,335,435 1,542,836 12.5% 42,336 1 34,000 0 0 $26.35
2009 1q 241 12,301,435 1,551,172 12.6% (50,367) 0 0 1 34,000 $26.72
Source: CoStar Property®
UC InventoryDelivered InventoryExisting Inventory Vacancy
(0.150)
(0.100)
(0.050)
0.000
0.050
0.100
0.150
0.200
2009 1q 2009 2q 2009 3q 2009 4q 2010 1q 2010 2q 2010 3q 2010 4q 2011 1q 2011 2q 2011 3q 2011 4q 2012 1q 2012 2q 2012 3q 2012 4q
Millio
ns
SF
0.0%
2.0%
4.0%
6.0%
8.0%
10.0%
12.0%
14.0%
Perce
nt V
acant
Delivered SF Absorption SF Vacancy
$24.00
$24.20
$24.40
$24.60
$24.80
$25.00
$25.20
$25.40
$25.60
$25.80
2011 1q 2011 2q 2011 3q 2011 4q 2012 1q 2012 2q 2012 3q 2012 4q
Dollar
s/SF/Y
ear
0.00
0.20
0.40
0.60
0.80
1.00
1.20
1.40
1.60
1.80
2011 1q 2011 2q 2011 3q 2011 4q 2012 1q 2012 2q 2012 3q 2012 4q
Millio
ns
SF
Direct SF Sublet SF
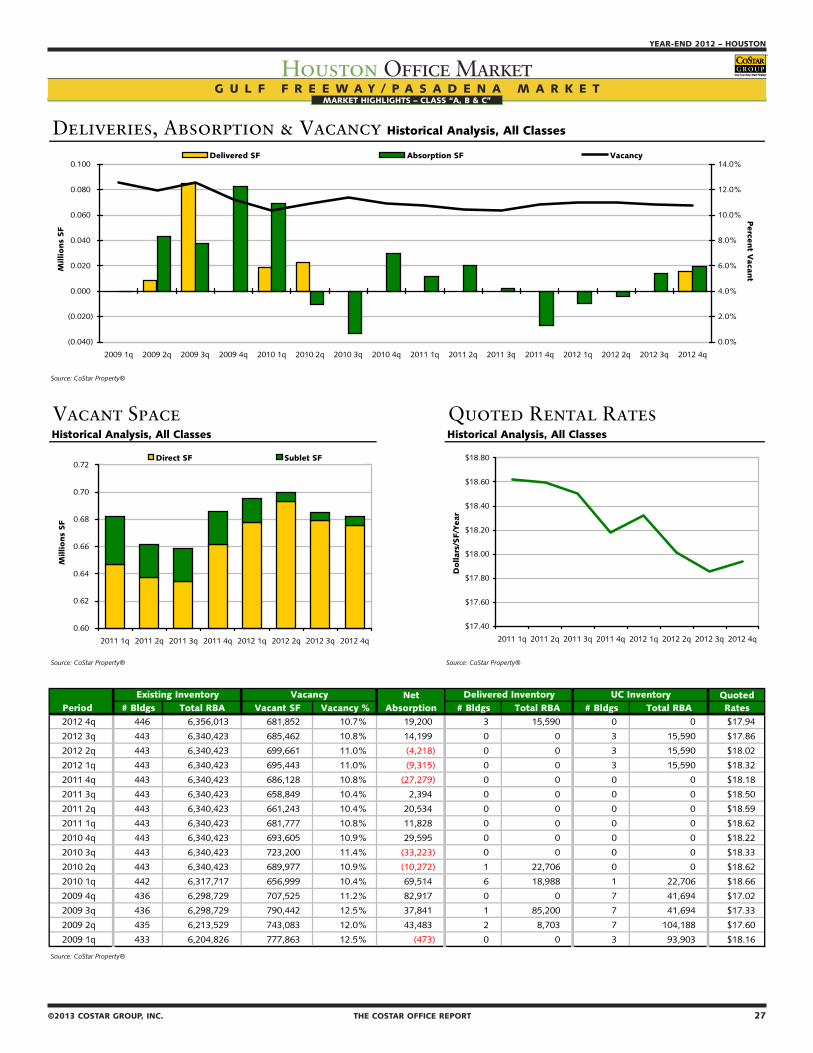
26 THE COSTAR OFFICE REPORT ©2013 COSTAR GROUP, INC.
HOUSTON – YEAR-END 2012
Houston Office MarketMARKET HIGHLIGHTS – CLASS “A, B & C”
©2013 COSTAR GROUP, INC. THE COSTAR OFFICE REPORT 27
YEAR-END 2012 – HOUSTON
Houston Office MarketMARKET HIGHLIGHTS – CLASS “A, B & C”
G U L F F R E E W A Y / P A S A D E N A M A R K E T
Deliveries, Absorption & Vacancy Historical Analysis, All Classes
Source: CoStar Property®
Vacant Space Quoted Rental RatesHistorical Analysis, All Classes Historical Analysis, All Classes
Source: CoStar Property® Source: CoStar Property®
Net QuotedPeriod # Bldgs Total RBA Vacant SF Vacancy % Absorption # Bldgs Total RBA # Bldgs Total RBA Rates2012 4q 446 6,356,013 681,852 10.7% 19,200 3 15,590 0 0 $17.94
2012 3q 443 6,340,423 685,462 10.8% 14,199 0 0 3 15,590 $17.86
2012 2q 443 6,340,423 699,661 11.0% (4,218) 0 0 3 15,590 $18.02
2012 1q 443 6,340,423 695,443 11.0% (9,315) 0 0 3 15,590 $18.32
2011 4q 443 6,340,423 686,128 10.8% (27,279) 0 0 0 0 $18.18
2011 3q 443 6,340,423 658,849 10.4% 2,394 0 0 0 0 $18.50
2011 2q 443 6,340,423 661,243 10.4% 20,534 0 0 0 0 $18.59
2011 1q 443 6,340,423 681,777 10.8% 11,828 0 0 0 0 $18.62
2010 4q 443 6,340,423 693,605 10.9% 29,595 0 0 0 0 $18.22
2010 3q 443 6,340,423 723,200 11.4% (33,223) 0 0 0 0 $18.33
2010 2q 443 6,340,423 689,977 10.9% (10,272) 1 22,706 0 0 $18.62
2010 1q 442 6,317,717 656,999 10.4% 69,514 6 18,988 1 22,706 $18.66
2009 4q 436 6,298,729 707,525 11.2% 82,917 0 0 7 41,694 $17.02
2009 3q 436 6,298,729 790,442 12.5% 37,841 1 85,200 7 41,694 $17.33
2009 2q 435 6,213,529 743,083 12.0% 43,483 2 8,703 7 104,188 $17.60
2009 1q 433 6,204,826 777,863 12.5% (473) 0 0 3 93,903 $18.16
Source: CoStar Property®
UC InventoryDelivered InventoryExisting Inventory Vacancy
(0.040)
(0.020)
0.000
0.020
0.040
0.060
0.080
0.100
2009 1q 2009 2q 2009 3q 2009 4q 2010 1q 2010 2q 2010 3q 2010 4q 2011 1q 2011 2q 2011 3q 2011 4q 2012 1q 2012 2q 2012 3q 2012 4q
Millio
ns
SF
0.0%
2.0%
4.0%
6.0%
8.0%
10.0%
12.0%
14.0%
Perce
nt V
acant
Delivered SF Absorption SF Vacancy
$17.40
$17.60
$17.80
$18.00
$18.20
$18.40
$18.60
$18.80
2011 1q 2011 2q 2011 3q 2011 4q 2012 1q 2012 2q 2012 3q 2012 4q
Dollar
s/SF/Y
ear
0.60
0.62
0.64
0.66
0.68
0.70
0.72
2011 1q 2011 2q 2011 3q 2011 4q 2012 1q 2012 2q 2012 3q 2012 4q
Millio
ns
SF
Direct SF Sublet SF

28 THE COSTAR OFFICE REPORT ©2013 COSTAR GROUP, INC.
HOUSTON – YEAR-END 2012
Houston Office MarketMARKET HIGHLIGHTS – CLASS “A, B & C”
©2013 COSTAR GROUP, INC. THE COSTAR OFFICE REPORT 29
YEAR-END 2012 – HOUSTON
Houston Office MarketMARKET HIGHLIGHTS – CLASS “A, B & C”
I - 1 0 E A S T M A R K E T
Deliveries, Absorption & Vacancy Historical Analysis, All Classes
Source: CoStar Property®
Vacant Space Quoted Rental RatesHistorical Analysis, All Classes Historical Analysis, All Classes
Source: CoStar Property® Source: CoStar Property®
Net QuotedPeriod # Bldgs Total RBA Vacant SF Vacancy % Absorption # Bldgs Total RBA # Bldgs Total RBA Rates2012 4q 98 1,117,488 147,228 13.2% 7,101 0 0 0 0 $15.72
2012 3q 98 1,117,488 154,329 13.8% (10,572) 0 0 0 0 $15.85
2012 2q 98 1,117,488 143,757 12.9% 1,709 0 0 0 0 $15.48
2012 1q 98 1,117,488 145,466 13.0% 9,522 0 0 0 0 $14.96
2011 4q 98 1,117,488 154,988 13.9% (12,261) 0 0 0 0 $14.93
2011 3q 98 1,117,488 142,727 12.8% 6,233 0 0 0 0 $14.65
2011 2q 98 1,117,488 148,960 13.3% (2,190) 0 0 0 0 $14.39
2011 1q 98 1,117,488 146,770 13.1% (3,905) 0 0 0 0 $14.35
2010 4q 98 1,117,488 142,865 12.8% (1,222) 0 0 0 0 $14.07
2010 3q 98 1,117,488 141,643 12.7% 7,465 0 0 0 0 $14.15
2010 2q 98 1,117,488 149,108 13.3% (3,500) 0 0 0 0 $14.27
2010 1q 98 1,117,488 145,608 13.0% 14,294 0 0 0 0 $14.93
2009 4q 98 1,117,488 159,902 14.3% (4,985) 1 1,919 0 0 $15.19
2009 3q 97 1,115,569 152,998 13.7% (11,680) 0 0 1 1,919 $15.60
2009 2q 97 1,115,569 141,318 12.7% 19,492 0 0 1 1,919 $14.85
2009 1q 97 1,115,569 160,810 14.4% (11,383) 0 0 1 1,919 $15.07
Source: CoStar Property®
UC InventoryDelivered InventoryExisting Inventory Vacancy
(0.015)
(0.010)
(0.005)
0.000
0.005
0.010
0.015
0.020
0.025
2009 1q 2009 2q 2009 3q 2009 4q 2010 1q 2010 2q 2010 3q 2010 4q 2011 1q 2011 2q 2011 3q 2011 4q 2012 1q 2012 2q 2012 3q 2012 4q
Millio
ns
SF
11.5%
12.0%
12.5%
13.0%
13.5%
14.0%
14.5%
15.0%
Perce
nt V
acant
Delivered SF Absorption SF Vacancy
$13.50
$14.00
$14.50
$15.00
$15.50
$16.00
2011 1q 2011 2q 2011 3q 2011 4q 2012 1q 2012 2q 2012 3q 2012 4q
Dollar
s/SF/Y
ear
0.13
0.13
0.14
0.14
0.15
0.15
0.16
0.16
2011 1q 2011 2q 2011 3q 2011 4q 2012 1q 2012 2q 2012 3q 2012 4q
Millio
ns
SF
Direct SF Sublet SF
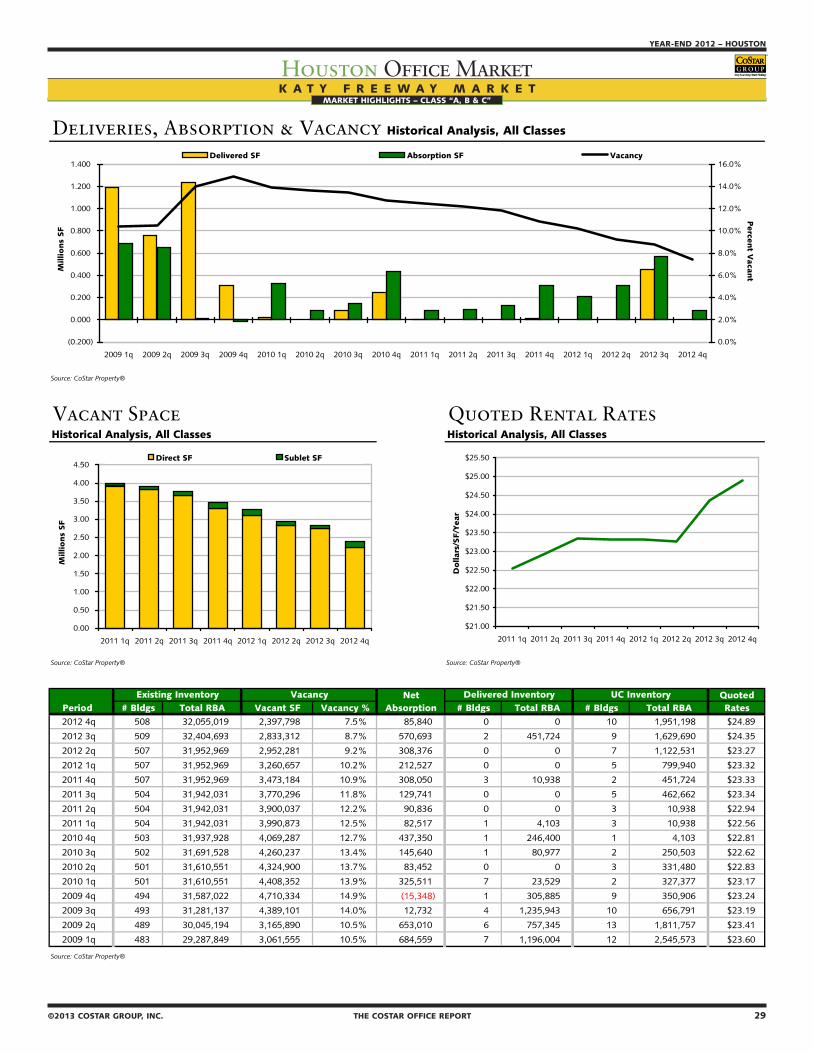
28 THE COSTAR OFFICE REPORT ©2013 COSTAR GROUP, INC.
HOUSTON – YEAR-END 2012
Houston Office MarketMARKET HIGHLIGHTS – CLASS “A, B & C”
©2013 COSTAR GROUP, INC. THE COSTAR OFFICE REPORT 29
YEAR-END 2012 – HOUSTON
Houston Office MarketMARKET HIGHLIGHTS – CLASS “A, B & C”
K A T Y F R E E W A Y M A R K E T
Deliveries, Absorption & Vacancy Historical Analysis, All Classes
Source: CoStar Property®
Vacant Space Quoted Rental RatesHistorical Analysis, All Classes Historical Analysis, All Classes
Source: CoStar Property® Source: CoStar Property®
Net QuotedPeriod # Bldgs Total RBA Vacant SF Vacancy % Absorption # Bldgs Total RBA # Bldgs Total RBA Rates2012 4q 508 32,055,019 2,397,798 7.5% 85,840 0 0 10 1,951,198 $24.89
2012 3q 509 32,404,693 2,833,312 8.7% 570,693 2 451,724 9 1,629,690 $24.35
2012 2q 507 31,952,969 2,952,281 9.2% 308,376 0 0 7 1,122,531 $23.27
2012 1q 507 31,952,969 3,260,657 10.2% 212,527 0 0 5 799,940 $23.32
2011 4q 507 31,952,969 3,473,184 10.9% 308,050 3 10,938 2 451,724 $23.33
2011 3q 504 31,942,031 3,770,296 11.8% 129,741 0 0 5 462,662 $23.34
2011 2q 504 31,942,031 3,900,037 12.2% 90,836 0 0 3 10,938 $22.94
2011 1q 504 31,942,031 3,990,873 12.5% 82,517 1 4,103 3 10,938 $22.56
2010 4q 503 31,937,928 4,069,287 12.7% 437,350 1 246,400 1 4,103 $22.81
2010 3q 502 31,691,528 4,260,237 13.4% 145,640 1 80,977 2 250,503 $22.62
2010 2q 501 31,610,551 4,324,900 13.7% 83,452 0 0 3 331,480 $22.83
2010 1q 501 31,610,551 4,408,352 13.9% 325,511 7 23,529 2 327,377 $23.17
2009 4q 494 31,587,022 4,710,334 14.9% (15,348) 1 305,885 9 350,906 $23.24
2009 3q 493 31,281,137 4,389,101 14.0% 12,732 4 1,235,943 10 656,791 $23.19
2009 2q 489 30,045,194 3,165,890 10.5% 653,010 6 757,345 13 1,811,757 $23.41
2009 1q 483 29,287,849 3,061,555 10.5% 684,559 7 1,196,004 12 2,545,573 $23.60
Source: CoStar Property®
UC InventoryDelivered InventoryExisting Inventory Vacancy
(0.200)
0.000
0.200
0.400
0.600
0.800
1.000
1.200
1.400
2009 1q 2009 2q 2009 3q 2009 4q 2010 1q 2010 2q 2010 3q 2010 4q 2011 1q 2011 2q 2011 3q 2011 4q 2012 1q 2012 2q 2012 3q 2012 4q
Millio
ns
SF
0.0%
2.0%
4.0%
6.0%
8.0%
10.0%
12.0%
14.0%
16.0%
Perce
nt V
acant
Delivered SF Absorption SF Vacancy
$21.00
$21.50
$22.00
$22.50
$23.00
$23.50
$24.00
$24.50
$25.00
$25.50
2011 1q 2011 2q 2011 3q 2011 4q 2012 1q 2012 2q 2012 3q 2012 4q
Dollar
s/SF/Y
ear
0.00
0.50
1.00
1.50
2.00
2.50
3.00
3.50
4.00
4.50
2011 1q 2011 2q 2011 3q 2011 4q 2012 1q 2012 2q 2012 3q 2012 4q
Millio
ns
SF
Direct SF Sublet SF

30 THE COSTAR OFFICE REPORT ©2013 COSTAR GROUP, INC.
HOUSTON – YEAR-END 2012
Houston Office MarketMARKET HIGHLIGHTS – CLASS “A, B & C”
©2013 COSTAR GROUP, INC. THE COSTAR OFFICE REPORT 31
YEAR-END 2012 – HOUSTON
Houston Office MarketMARKET HIGHLIGHTS – CLASS “A, B & C”
K I N G W O O D / H U M B L E M A R K E T
Deliveries, Absorption & Vacancy Historical Analysis, All Classes
Source: CoStar Property®
Vacant Space Quoted Rental RatesHistorical Analysis, All Classes Historical Analysis, All Classes
Source: CoStar Property® Source: CoStar Property®
Net QuotedPeriod # Bldgs Total RBA Vacant SF Vacancy % Absorption # Bldgs Total RBA # Bldgs Total RBA Rates2012 4q 149 2,540,956 198,069 7.8% 17,951 1 45,000 0 0 $21.57
2012 3q 148 2,495,956 171,020 6.9% 36,467 0 0 1 45,000 $21.51
2012 2q 148 2,495,956 207,487 8.3% (7,838) 0 0 1 45,000 $20.92
2012 1q 148 2,495,956 199,649 8.0% 20,616 0 0 1 45,000 $20.60
2011 4q 148 2,495,956 220,265 8.8% (10,451) 0 0 0 0 $20.51
2011 3q 148 2,495,956 209,814 8.4% 48,833 0 0 0 0 $20.78
2011 2q 148 2,495,956 258,647 10.4% 26,307 0 0 0 0 $19.40
2011 1q 148 2,495,956 284,954 11.4% 15,122 0 0 0 0 $19.49
2010 4q 148 2,495,956 300,076 12.0% 1,999 0 0 0 0 $19.66
2010 3q 148 2,495,956 302,075 12.1% (17,988) 0 0 0 0 $19.89
2010 2q 148 2,495,956 284,087 11.4% 39,431 0 0 0 0 $20.30
2010 1q 148 2,495,956 323,518 13.0% 14,730 1 22,929 0 0 $20.32
2009 4q 147 2,473,027 315,319 12.8% (7,714) 0 0 1 22,929 $20.32
2009 3q 147 2,473,027 307,605 12.4% 16,056 0 0 1 22,929 $20.34
2009 2q 147 2,473,027 323,661 13.1% 3,117 6 26,400 1 22,929 $21.03
2009 1q 141 2,446,627 300,378 12.3% 20,405 1 40,733 7 49,329 $21.53
Source: CoStar Property®
UC InventoryDelivered InventoryExisting Inventory Vacancy
(0.030)
(0.020)
(0.010)
0.000
0.010
0.020
0.030
0.040
0.050
0.060
2009 1q 2009 2q 2009 3q 2009 4q 2010 1q 2010 2q 2010 3q 2010 4q 2011 1q 2011 2q 2011 3q 2011 4q 2012 1q 2012 2q 2012 3q 2012 4q
Millio
ns
SF
0.0%
2.0%
4.0%
6.0%
8.0%
10.0%
12.0%
14.0%
Perce
nt V
acant
Delivered SF Absorption SF Vacancy
$18.00
$18.50
$19.00
$19.50
$20.00
$20.50
$21.00
$21.50
$22.00
2011 1q 2011 2q 2011 3q 2011 4q 2012 1q 2012 2q 2012 3q 2012 4q
Dollar
s/SF/Y
ear
0.00
0.05
0.10
0.15
0.20
0.25
0.30
2011 1q 2011 2q 2011 3q 2011 4q 2012 1q 2012 2q 2012 3q 2012 4q
Millio
ns
SF
Direct SF Sublet SF

30 THE COSTAR OFFICE REPORT ©2013 COSTAR GROUP, INC.
HOUSTON – YEAR-END 2012
Houston Office MarketMARKET HIGHLIGHTS – CLASS “A, B & C”
©2013 COSTAR GROUP, INC. THE COSTAR OFFICE REPORT 31
YEAR-END 2012 – HOUSTON
Houston Office MarketMARKET HIGHLIGHTS – CLASS “A, B & C”
N A S A / C L E A R L A K E M A R K E T
Deliveries, Absorption & Vacancy Historical Analysis, All Classes
Source: CoStar Property®
Vacant Space Quoted Rental RatesHistorical Analysis, All Classes Historical Analysis, All Classes
Source: CoStar Property® Source: CoStar Property®
Net QuotedPeriod # Bldgs Total RBA Vacant SF Vacancy % Absorption # Bldgs Total RBA # Bldgs Total RBA Rates2012 4q 436 9,634,684 1,307,218 13.6% 69,036 1 4,495 1 4,500 $19.73
2012 3q 435 9,630,189 1,371,759 14.2% (99,585) 1 14,701 2 8,995 $19.82
2012 2q 434 9,615,488 1,257,473 13.1% 27,363 0 0 2 19,196 $19.82
2012 1q 434 9,615,488 1,284,836 13.4% (215,936) 0 0 2 19,196 $20.17
2011 4q 434 9,615,488 1,068,900 11.1% 137,829 1 102,000 1 14,701 $20.46
2011 3q 433 9,513,488 1,104,729 11.6% (96,049) 0 0 1 102,000 $20.42
2011 2q 433 9,513,488 1,008,680 10.6% (252,292) 0 0 1 102,000 $20.41
2011 1q 433 9,513,488 756,388 8.0% 81,946 3 18,715 1 102,000 $20.26
2010 4q 430 9,494,773 819,619 8.6% 47,018 0 0 3 18,715 $19.78
2010 3q 430 9,494,773 866,637 9.1% 12,492 0 0 3 18,715 $20.04
2010 2q 430 9,494,773 879,129 9.3% 9,231 0 0 3 18,715 $19.98
2010 1q 430 9,494,773 888,360 9.4% 37,651 3 35,586 0 0 $20.33
2009 4q 427 9,459,187 890,425 9.4% 70,818 4 34,820 3 35,586 $20.49
2009 3q 423 9,424,367 926,423 9.8% 73,641 2 51,240 7 70,406 $20.57
2009 2q 421 9,373,127 948,824 10.1% 19,111 0 0 9 121,646 $20.93
2009 1q 421 9,373,127 967,935 10.3% (45,931) 4 16,542 6 86,060 $20.74
Source: CoStar Property®
UC InventoryDelivered InventoryExisting Inventory Vacancy
(0.300)
(0.250)
(0.200)
(0.150)
(0.100)
(0.050)
0.000
0.050
0.100
0.150
0.200
2009 1q 2009 2q 2009 3q 2009 4q 2010 1q 2010 2q 2010 3q 2010 4q 2011 1q 2011 2q 2011 3q 2011 4q 2012 1q 2012 2q 2012 3q 2012 4q
Millio
ns
SF
0.0%
2.0%
4.0%
6.0%
8.0%
10.0%
12.0%
14.0%
16.0%
Perce
nt V
acant
Delivered SF Absorption SF Vacancy
$19.20
$19.40
$19.60
$19.80
$20.00
$20.20
$20.40
$20.60
2011 1q 2011 2q 2011 3q 2011 4q 2012 1q 2012 2q 2012 3q 2012 4q
Dollar
s/SF/Y
ear
0.00
0.20
0.40
0.60
0.80
1.00
1.20
1.40
1.60
2011 1q 2011 2q 2011 3q 2011 4q 2012 1q 2012 2q 2012 3q 2012 4q
Millio
ns
SF
Direct SF Sublet SF

32 THE COSTAR OFFICE REPORT ©2013 COSTAR GROUP, INC.
HOUSTON – YEAR-END 2012
Houston Office MarketMARKET HIGHLIGHTS – CLASS “A, B & C”
©2013 COSTAR GROUP, INC. THE COSTAR OFFICE REPORT 33
YEAR-END 2012 – HOUSTON
Houston Office MarketMARKET HIGHLIGHTS – CLASS “A, B & C”
N O R T H B E L T M A R K E T
Deliveries, Absorption & Vacancy Historical Analysis, All Classes
Source: CoStar Property®
Vacant Space Quoted Rental RatesHistorical Analysis, All Classes Historical Analysis, All Classes
Source: CoStar Property® Source: CoStar Property®
Net QuotedPeriod # Bldgs Total RBA Vacant SF Vacancy % Absorption # Bldgs Total RBA # Bldgs Total RBA Rates2012 4q 176 13,755,474 1,961,564 14.3% 79,632 1 50,000 1 100,000 $18.29
2012 3q 175 13,705,474 1,991,196 14.5% 87,367 0 0 2 150,000 $17.75
2012 2q 175 13,705,474 2,078,563 15.2% (950) 0 0 2 150,000 $16.88
2012 1q 175 13,705,474 2,077,613 15.2% 12,026 0 0 2 150,000 $16.89
2011 4q 176 13,715,463 2,099,628 15.3% (82,439) 1 17,000 2 150,000 $16.40
2011 3q 175 13,698,463 2,000,189 14.6% (71,703) 0 0 2 117,000 $16.08
2011 2q 175 13,698,463 1,928,486 14.1% 47,152 0 0 2 117,000 $16.25
2011 1q 175 13,698,463 1,975,638 14.4% (32,318) 0 0 2 117,000 $15.98
2010 4q 175 13,698,463 1,943,320 14.2% 54,369 0 0 1 100,000 $15.89
2010 3q 175 13,698,463 1,997,689 14.6% (104,007) 0 0 1 100,000 $15.90
2010 2q 175 13,698,463 1,893,682 13.8% (24,081) 0 0 1 100,000 $16.14
2010 1q 175 13,698,463 1,869,601 13.6% (56,059) 0 0 1 100,000 $16.60
2009 4q 175 13,698,463 1,813,542 13.2% 100,368 0 0 0 0 $16.80
2009 3q 175 13,698,463 1,913,910 14.0% (240,974) 0 0 0 0 $17.32
2009 2q 175 13,698,463 1,672,936 12.2% (51,628) 1 63,621 0 0 $17.30
2009 1q 174 13,634,842 1,557,687 11.4% 7,012 0 0 1 63,621 $17.26
Source: CoStar Property®
UC InventoryDelivered InventoryExisting Inventory Vacancy
(0.300)
(0.250)
(0.200)
(0.150)
(0.100)
(0.050)
0.000
0.050
0.100
0.150
2009 1q 2009 2q 2009 3q 2009 4q 2010 1q 2010 2q 2010 3q 2010 4q 2011 1q 2011 2q 2011 3q 2011 4q 2012 1q 2012 2q 2012 3q 2012 4q
Millio
ns
SF
0.0%
2.0%
4.0%
6.0%
8.0%
10.0%
12.0%
14.0%
16.0%
18.0%
Perce
nt V
acant
Delivered SF Absorption SF Vacancy
$14.50
$15.00
$15.50
$16.00
$16.50
$17.00
$17.50
$18.00
$18.50
2011 1q 2011 2q 2011 3q 2011 4q 2012 1q 2012 2q 2012 3q 2012 4q
Dollar
s/SF/Y
ear
1.60
1.70
1.80
1.90
2.00
2.10
2.20
2011 1q 2011 2q 2011 3q 2011 4q 2012 1q 2012 2q 2012 3q 2012 4q
Millio
ns
SF
Direct SF Sublet SF

32 THE COSTAR OFFICE REPORT ©2013 COSTAR GROUP, INC.
HOUSTON – YEAR-END 2012
Houston Office MarketMARKET HIGHLIGHTS – CLASS “A, B & C”
©2013 COSTAR GROUP, INC. THE COSTAR OFFICE REPORT 33
YEAR-END 2012 – HOUSTON
Houston Office MarketMARKET HIGHLIGHTS – CLASS “A, B & C”
N O R T H E A S T N E A R M A R K E T
Deliveries, Absorption & Vacancy Historical Analysis, All Classes
Source: CoStar Property®
Vacant Space Quoted Rental RatesHistorical Analysis, All Classes Historical Analysis, All Classes
Source: CoStar Property® Source: CoStar Property®
Net QuotedPeriod # Bldgs Total RBA Vacant SF Vacancy % Absorption # Bldgs Total RBA # Bldgs Total RBA Rates2012 4q 106 1,420,603 137,370 9.7% 11,652 0 0 0 0 $18.07
2012 3q 106 1,420,603 149,022 10.5% 33,648 1 30,000 0 0 $17.76
2012 2q 105 1,390,603 152,670 11.0% 3,992 0 0 1 30,000 $17.75
2012 1q 105 1,390,603 156,662 11.3% (3,717) 0 0 1 30,000 $18.24
2011 4q 105 1,390,603 152,945 11.0% (3,939) 0 0 1 30,000 $18.16
2011 3q 105 1,390,603 149,006 10.7% (217) 0 0 0 0 $18.30
2011 2q 105 1,390,603 148,789 10.7% 1,791 0 0 0 0 $17.63
2011 1q 105 1,390,603 150,580 10.8% (285) 0 0 0 0 $17.78
2010 4q 105 1,390,603 150,295 10.8% 3,847 0 0 0 0 $18.08
2010 3q 105 1,390,603 154,142 11.1% (4,132) 0 0 0 0 $17.65
2010 2q 105 1,390,603 150,010 10.8% (25,994) 0 0 0 0 $16.51
2010 1q 105 1,390,603 124,016 8.9% 31,861 0 0 0 0 $16.76
2009 4q 105 1,390,603 155,877 11.2% 1,696 0 0 0 0 $16.83
2009 3q 105 1,390,603 157,573 11.3% 18,667 0 0 0 0 $16.83
2009 2q 105 1,390,603 176,240 12.7% 31,577 1 8,000 0 0 $16.84
2009 1q 104 1,382,603 199,817 14.5% (8,920) 0 0 1 8,000 $18.41
Source: CoStar Property®
UC InventoryDelivered InventoryExisting Inventory Vacancy
(0.030)
(0.020)
(0.010)
0.000
0.010
0.020
0.030
0.040
2009 1q 2009 2q 2009 3q 2009 4q 2010 1q 2010 2q 2010 3q 2010 4q 2011 1q 2011 2q 2011 3q 2011 4q 2012 1q 2012 2q 2012 3q 2012 4q
Millio
ns
SF
0.0%
2.0%
4.0%
6.0%
8.0%
10.0%
12.0%
14.0%
16.0%
Perce
nt V
acant
Delivered SF Absorption SF Vacancy
$17.20
$17.40
$17.60
$17.80
$18.00
$18.20
$18.40
2011 1q 2011 2q 2011 3q 2011 4q 2012 1q 2012 2q 2012 3q 2012 4q
Dollar
s/SF/Y
ear
0.13
0.13
0.14
0.14
0.15
0.15
0.16
0.16
2011 1q 2011 2q 2011 3q 2011 4q 2012 1q 2012 2q 2012 3q 2012 4q
Millio
ns
SF
Direct SF Sublet SF

34 THE COSTAR OFFICE REPORT ©2013 COSTAR GROUP, INC.
HOUSTON – YEAR-END 2012
Houston Office MarketMARKET HIGHLIGHTS – CLASS “A, B & C”
©2013 COSTAR GROUP, INC. THE COSTAR OFFICE REPORT 35
YEAR-END 2012 – HOUSTON
Houston Office MarketMARKET HIGHLIGHTS – CLASS “A, B & C”
N O R T H W E S T M A R K E T
Deliveries, Absorption & Vacancy Historical Analysis, All Classes
Source: CoStar Property®
Vacant Space Quoted Rental RatesHistorical Analysis, All Classes Historical Analysis, All Classes
Source: CoStar Property® Source: CoStar Property®
Net QuotedPeriod # Bldgs Total RBA Vacant SF Vacancy % Absorption # Bldgs Total RBA # Bldgs Total RBA Rates2012 4q 416 15,539,947 2,141,839 13.8% 118,251 0 0 1 159,056 $18.57
2012 3q 416 15,539,947 2,260,090 14.5% 193,481 0 0 1 159,056 $18.43
2012 2q 416 15,539,947 2,453,571 15.8% 86,382 0 0 1 159,056 $18.77
2012 1q 416 15,539,947 2,539,953 16.3% 155,582 0 0 0 0 $18.66
2011 4q 416 15,539,947 2,695,535 17.3% 114,496 0 0 0 0 $17.70
2011 3q 416 15,539,947 2,810,031 18.1% 115,862 0 0 0 0 $17.81
2011 2q 416 15,539,947 2,925,893 18.8% (119,228) 0 0 0 0 $18.19
2011 1q 416 15,539,947 2,806,665 18.1% 143,054 0 0 0 0 $19.12
2010 4q 416 15,539,947 2,949,719 19.0% (90,974) 0 0 0 0 $19.32
2010 3q 416 15,539,947 2,858,745 18.4% 101,634 0 0 0 0 $19.21
2010 2q 416 15,539,947 2,960,379 19.1% (56,424) 0 0 0 0 $19.28
2010 1q 416 15,539,947 2,903,955 18.7% 72,328 0 0 0 0 $19.27
2009 4q 416 15,539,947 2,976,283 19.2% (105,707) 3 271,935 0 0 $18.93
2009 3q 413 15,268,012 2,598,641 17.0% 31,510 0 0 3 271,935 $18.70
2009 2q 413 15,268,012 2,630,151 17.2% 201,171 2 243,223 3 271,935 $18.76
2009 1q 411 15,024,789 2,588,099 17.2% 45,389 3 294,852 5 515,158 $19.02
Source: CoStar Property®
UC InventoryDelivered InventoryExisting Inventory Vacancy
(0.150)
(0.100)
(0.050)
0.000
0.050
0.100
0.150
0.200
0.250
0.300
0.350
2009 1q 2009 2q 2009 3q 2009 4q 2010 1q 2010 2q 2010 3q 2010 4q 2011 1q 2011 2q 2011 3q 2011 4q 2012 1q 2012 2q 2012 3q 2012 4q
Millio
ns
SF
0.0%
5.0%
10.0%
15.0%
20.0%
25.0%
Perce
nt V
acant
Delivered SF Absorption SF Vacancy
$16.50
$17.00
$17.50
$18.00
$18.50
$19.00
$19.50
2011 1q 2011 2q 2011 3q 2011 4q 2012 1q 2012 2q 2012 3q 2012 4q
Dollar
s/SF/Y
ear
0.00
0.50
1.00
1.50
2.00
2.50
3.00
3.50
2011 1q 2011 2q 2011 3q 2011 4q 2012 1q 2012 2q 2012 3q 2012 4q
Millio
ns
SF
Direct SF Sublet SF

34 THE COSTAR OFFICE REPORT ©2013 COSTAR GROUP, INC.
HOUSTON – YEAR-END 2012
Houston Office MarketMARKET HIGHLIGHTS – CLASS “A, B & C”
©2013 COSTAR GROUP, INC. THE COSTAR OFFICE REPORT 35
YEAR-END 2012 – HOUSTON
Houston Office MarketMARKET HIGHLIGHTS – CLASS “A, B & C”
R I C H M O N D / F O U N T A I N V I E W M A R K E T
Deliveries, Absorption & Vacancy Historical Analysis, All Classes
Source: CoStar Property®
Vacant Space Quoted Rental RatesHistorical Analysis, All Classes Historical Analysis, All Classes
Source: CoStar Property® Source: CoStar Property®
Net QuotedPeriod # Bldgs Total RBA Vacant SF Vacancy % Absorption # Bldgs Total RBA # Bldgs Total RBA Rates2012 4q 112 2,222,471 378,864 17.0% (4,275) 0 0 0 0 $15.40
2012 3q 112 2,222,471 374,589 16.9% 11,813 0 0 0 0 $15.48
2012 2q 112 2,222,471 386,402 17.4% 253 0 0 0 0 $15.48
2012 1q 112 2,222,471 386,655 17.4% (2,540) 0 0 0 0 $18.07
2011 4q 112 2,222,471 384,115 17.3% (19,544) 0 0 0 0 $15.49
2011 3q 112 2,222,471 364,571 16.4% 2,145 0 0 0 0 $15.67
2011 2q 112 2,222,471 366,716 16.5% (21,822) 0 0 0 0 $15.17
2011 1q 112 2,222,471 344,894 15.5% (10,158) 0 0 0 0 $15.36
2010 4q 112 2,222,471 334,736 15.1% (22,454) 0 0 0 0 $15.34
2010 3q 112 2,222,471 312,282 14.1% 5,349 0 0 0 0 $15.72
2010 2q 112 2,222,471 317,631 14.3% 11,892 0 0 0 0 $14.74
2010 1q 112 2,222,471 329,523 14.8% 7,078 0 0 0 0 $14.52
2009 4q 112 2,222,471 336,601 15.1% 3,773 0 0 0 0 $14.43
2009 3q 112 2,222,471 340,374 15.3% 11,302 0 0 0 0 $14.61
2009 2q 112 2,222,471 351,676 15.8% 94 0 0 0 0 $14.73
2009 1q 112 2,222,471 351,770 15.8% 1,307 0 0 0 0 $14.33
Source: CoStar Property®
UC InventoryDelivered InventoryExisting Inventory Vacancy
(0.025)
(0.020)
(0.015)
(0.010)
(0.005)
0.000
0.005
0.010
0.015
2009 1q 2009 2q 2009 3q 2009 4q 2010 1q 2010 2q 2010 3q 2010 4q 2011 1q 2011 2q 2011 3q 2011 4q 2012 1q 2012 2q 2012 3q 2012 4q
Millio
ns
SF
0.0%
2.0%
4.0%
6.0%
8.0%
10.0%
12.0%
14.0%
16.0%
18.0%
20.0%
Perce
nt V
acant
Delivered SF Absorption SF Vacancy
$13.50
$14.00
$14.50
$15.00
$15.50
$16.00
$16.50
$17.00
$17.50
$18.00
$18.50
2011 1q 2011 2q 2011 3q 2011 4q 2012 1q 2012 2q 2012 3q 2012 4q
Dollar
s/SF/Y
ear
0.32
0.33
0.34
0.35
0.36
0.37
0.38
0.39
2011 1q 2011 2q 2011 3q 2011 4q 2012 1q 2012 2q 2012 3q 2012 4q
Millio
ns
SF
Direct SF Sublet SF

36 THE COSTAR OFFICE REPORT ©2013 COSTAR GROUP, INC.
HOUSTON – YEAR-END 2012
Houston Office MarketMARKET HIGHLIGHTS – CLASS “A, B & C”
©2013 COSTAR GROUP, INC. THE COSTAR OFFICE REPORT 37
YEAR-END 2012 – HOUSTON
Houston Office MarketMARKET HIGHLIGHTS – CLASS “A, B & C”
S A N F E L I P E / V O S S M A R K E T
Deliveries, Absorption & Vacancy Historical Analysis, All Classes
Source: CoStar Property®
Vacant Space Quoted Rental RatesHistorical Analysis, All Classes Historical Analysis, All Classes
Source: CoStar Property® Source: CoStar Property®
Net QuotedPeriod # Bldgs Total RBA Vacant SF Vacancy % Absorption # Bldgs Total RBA # Bldgs Total RBA Rates2012 4q 51 5,449,406 662,236 12.2% 60,169 0 0 0 0 $24.89
2012 3q 51 5,449,406 722,405 13.3% (70,645) 0 0 0 0 $24.32
2012 2q 51 5,449,406 651,760 12.0% (28,138) 0 0 0 0 $24.63
2012 1q 51 5,449,406 623,622 11.4% 70,488 0 0 0 0 $23.94
2011 4q 51 5,449,406 694,110 12.7% (89,426) 0 0 0 0 $23.90
2011 3q 51 5,449,406 604,684 11.1% (10,958) 0 0 0 0 $24.04
2011 2q 51 5,449,406 593,726 10.9% (32,306) 0 0 0 0 $23.62
2011 1q 51 5,449,406 561,420 10.3% 40,201 0 0 0 0 $23.05
2010 4q 51 5,449,406 601,621 11.0% 5,967 0 0 0 0 $23.09
2010 3q 51 5,449,406 607,588 11.1% 5,598 0 0 0 0 $23.09
2010 2q 51 5,449,406 613,186 11.3% 17,039 0 0 0 0 $22.58
2010 1q 51 5,449,406 630,225 11.6% (32,561) 0 0 0 0 $22.62
2009 4q 51 5,449,406 597,664 11.0% 5,359 0 0 0 0 $22.65
2009 3q 51 5,449,406 603,023 11.1% (75,018) 0 0 0 0 $23.11
2009 2q 51 5,449,406 528,005 9.7% 23,762 0 0 0 0 $23.50
2009 1q 51 5,449,406 551,767 10.1% (66,628) 0 0 0 0 $24.43
Source: CoStar Property®
UC InventoryDelivered InventoryExisting Inventory Vacancy
(0.100)
(0.080)
(0.060)
(0.040)
(0.020)
0.000
0.020
0.040
0.060
0.080
2009 1q 2009 2q 2009 3q 2009 4q 2010 1q 2010 2q 2010 3q 2010 4q 2011 1q 2011 2q 2011 3q 2011 4q 2012 1q 2012 2q 2012 3q 2012 4q
Millio
ns
SF
0.0%
2.0%
4.0%
6.0%
8.0%
10.0%
12.0%
14.0%
Perce
nt V
acant
Delivered SF Absorption SF Vacancy
$22.00
$22.50
$23.00
$23.50
$24.00
$24.50
$25.00
$25.50
2011 1q 2011 2q 2011 3q 2011 4q 2012 1q 2012 2q 2012 3q 2012 4q
Dollar
s/SF/Y
ear
0.00
0.10
0.20
0.30
0.40
0.50
0.60
0.70
0.80
2011 1q 2011 2q 2011 3q 2011 4q 2012 1q 2012 2q 2012 3q 2012 4q
Millio
ns
SF
Direct SF Sublet SF
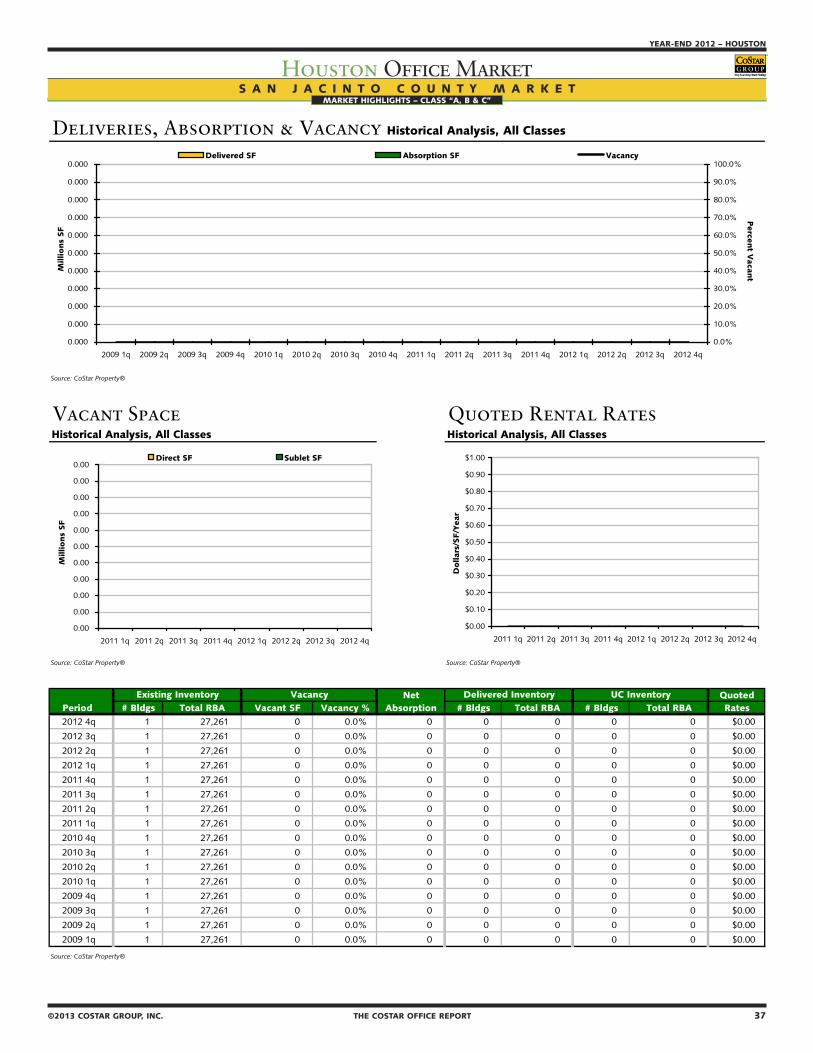
36 THE COSTAR OFFICE REPORT ©2013 COSTAR GROUP, INC.
HOUSTON – YEAR-END 2012
Houston Office MarketMARKET HIGHLIGHTS – CLASS “A, B & C”
©2013 COSTAR GROUP, INC. THE COSTAR OFFICE REPORT 37
YEAR-END 2012 – HOUSTON
Houston Office MarketMARKET HIGHLIGHTS – CLASS “A, B & C”
S A N J A C I N T O C O U N T Y M A R K E T
Deliveries, Absorption & Vacancy Historical Analysis, All Classes
Source: CoStar Property®
Vacant Space Quoted Rental RatesHistorical Analysis, All Classes Historical Analysis, All Classes
Source: CoStar Property® Source: CoStar Property®
Net QuotedPeriod # Bldgs Total RBA Vacant SF Vacancy % Absorption # Bldgs Total RBA # Bldgs Total RBA Rates2012 4q 1 27,261 0 0.0% 0 0 0 0 0 $0.00
2012 3q 1 27,261 0 0.0% 0 0 0 0 0 $0.00
2012 2q 1 27,261 0 0.0% 0 0 0 0 0 $0.00
2012 1q 1 27,261 0 0.0% 0 0 0 0 0 $0.00
2011 4q 1 27,261 0 0.0% 0 0 0 0 0 $0.00
2011 3q 1 27,261 0 0.0% 0 0 0 0 0 $0.00
2011 2q 1 27,261 0 0.0% 0 0 0 0 0 $0.00
2011 1q 1 27,261 0 0.0% 0 0 0 0 0 $0.00
2010 4q 1 27,261 0 0.0% 0 0 0 0 0 $0.00
2010 3q 1 27,261 0 0.0% 0 0 0 0 0 $0.00
2010 2q 1 27,261 0 0.0% 0 0 0 0 0 $0.00
2010 1q 1 27,261 0 0.0% 0 0 0 0 0 $0.00
2009 4q 1 27,261 0 0.0% 0 0 0 0 0 $0.00
2009 3q 1 27,261 0 0.0% 0 0 0 0 0 $0.00
2009 2q 1 27,261 0 0.0% 0 0 0 0 0 $0.00
2009 1q 1 27,261 0 0.0% 0 0 0 0 0 $0.00
Source: CoStar Property®
UC InventoryDelivered InventoryExisting Inventory Vacancy
0.000
0.000
0.000
0.000
0.000
0.000
0.000
0.000
0.000
0.000
0.000
2009 1q 2009 2q 2009 3q 2009 4q 2010 1q 2010 2q 2010 3q 2010 4q 2011 1q 2011 2q 2011 3q 2011 4q 2012 1q 2012 2q 2012 3q 2012 4q
Millio
ns
SF
0.0%
10.0%
20.0%
30.0%
40.0%
50.0%
60.0%
70.0%
80.0%
90.0%
100.0%
Perce
nt V
acant
Delivered SF Absorption SF Vacancy
$0.00
$0.10
$0.20
$0.30
$0.40
$0.50
$0.60
$0.70
$0.80
$0.90
$1.00
2011 1q 2011 2q 2011 3q 2011 4q 2012 1q 2012 2q 2012 3q 2012 4q
Dollar
s/SF/Y
ear
0.00
0.00
0.00
0.00
0.00
0.00
0.00
0.00
0.00
0.00
0.00
2011 1q 2011 2q 2011 3q 2011 4q 2012 1q 2012 2q 2012 3q 2012 4q
Millio
ns
SF
Direct SF Sublet SF
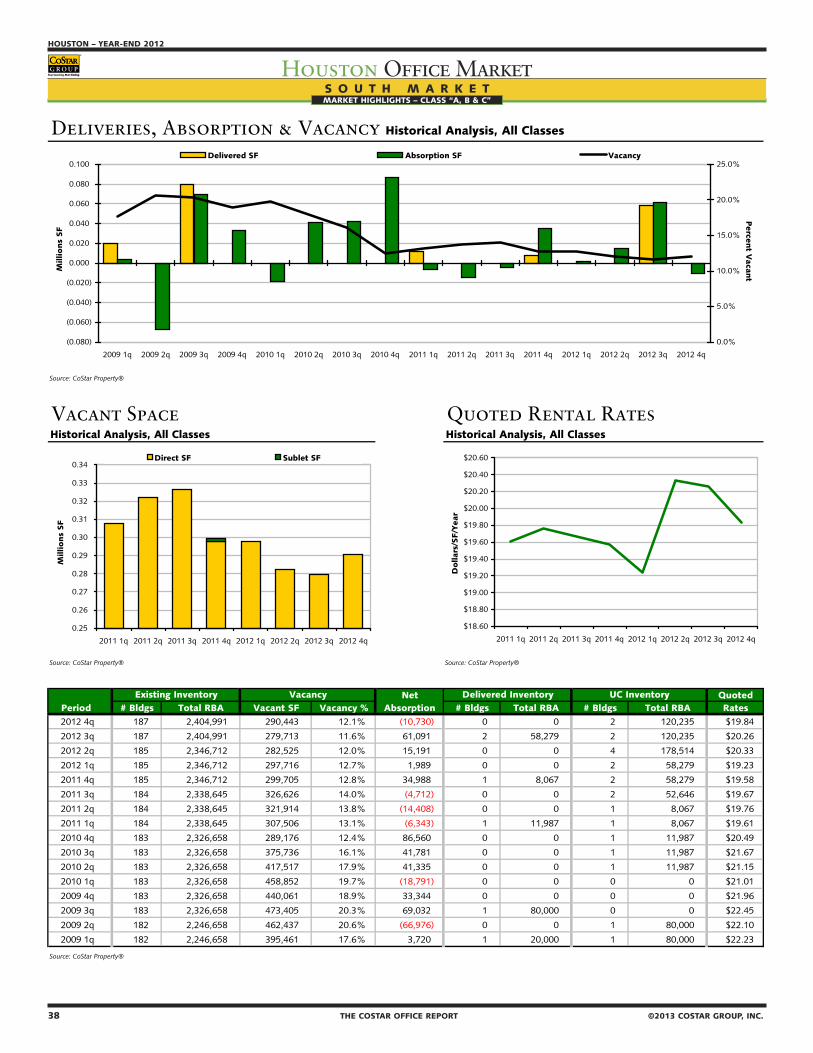
38 THE COSTAR OFFICE REPORT ©2013 COSTAR GROUP, INC.
HOUSTON – YEAR-END 2012
Houston Office MarketMARKET HIGHLIGHTS – CLASS “A, B & C”
©2013 COSTAR GROUP, INC. THE COSTAR OFFICE REPORT 39
YEAR-END 2012 – HOUSTON
Houston Office MarketMARKET HIGHLIGHTS – CLASS “A, B & C”
S O U T H M A R K E T
Deliveries, Absorption & Vacancy Historical Analysis, All Classes
Source: CoStar Property®
Vacant Space Quoted Rental RatesHistorical Analysis, All Classes Historical Analysis, All Classes
Source: CoStar Property® Source: CoStar Property®
Net QuotedPeriod # Bldgs Total RBA Vacant SF Vacancy % Absorption # Bldgs Total RBA # Bldgs Total RBA Rates2012 4q 187 2,404,991 290,443 12.1% (10,730) 0 0 2 120,235 $19.84
2012 3q 187 2,404,991 279,713 11.6% 61,091 2 58,279 2 120,235 $20.26
2012 2q 185 2,346,712 282,525 12.0% 15,191 0 0 4 178,514 $20.33
2012 1q 185 2,346,712 297,716 12.7% 1,989 0 0 2 58,279 $19.23
2011 4q 185 2,346,712 299,705 12.8% 34,988 1 8,067 2 58,279 $19.58
2011 3q 184 2,338,645 326,626 14.0% (4,712) 0 0 2 52,646 $19.67
2011 2q 184 2,338,645 321,914 13.8% (14,408) 0 0 1 8,067 $19.76
2011 1q 184 2,338,645 307,506 13.1% (6,343) 1 11,987 1 8,067 $19.61
2010 4q 183 2,326,658 289,176 12.4% 86,560 0 0 1 11,987 $20.49
2010 3q 183 2,326,658 375,736 16.1% 41,781 0 0 1 11,987 $21.67
2010 2q 183 2,326,658 417,517 17.9% 41,335 0 0 1 11,987 $21.15
2010 1q 183 2,326,658 458,852 19.7% (18,791) 0 0 0 0 $21.01
2009 4q 183 2,326,658 440,061 18.9% 33,344 0 0 0 0 $21.96
2009 3q 183 2,326,658 473,405 20.3% 69,032 1 80,000 0 0 $22.45
2009 2q 182 2,246,658 462,437 20.6% (66,976) 0 0 1 80,000 $22.10
2009 1q 182 2,246,658 395,461 17.6% 3,720 1 20,000 1 80,000 $22.23
Source: CoStar Property®
UC InventoryDelivered InventoryExisting Inventory Vacancy
(0.080)
(0.060)
(0.040)
(0.020)
0.000
0.020
0.040
0.060
0.080
0.100
2009 1q 2009 2q 2009 3q 2009 4q 2010 1q 2010 2q 2010 3q 2010 4q 2011 1q 2011 2q 2011 3q 2011 4q 2012 1q 2012 2q 2012 3q 2012 4q
Millio
ns
SF
0.0%
5.0%
10.0%
15.0%
20.0%
25.0%
Perce
nt V
acant
Delivered SF Absorption SF Vacancy
$18.60
$18.80
$19.00
$19.20
$19.40
$19.60
$19.80
$20.00
$20.20
$20.40
$20.60
2011 1q 2011 2q 2011 3q 2011 4q 2012 1q 2012 2q 2012 3q 2012 4q
Dollar
s/SF/Y
ear
0.25
0.26
0.27
0.28
0.29
0.30
0.31
0.32
0.33
0.34
2011 1q 2011 2q 2011 3q 2011 4q 2012 1q 2012 2q 2012 3q 2012 4q
Millio
ns
SF
Direct SF Sublet SF

38 THE COSTAR OFFICE REPORT ©2013 COSTAR GROUP, INC.
HOUSTON – YEAR-END 2012
Houston Office MarketMARKET HIGHLIGHTS – CLASS “A, B & C”
©2013 COSTAR GROUP, INC. THE COSTAR OFFICE REPORT 39
YEAR-END 2012 – HOUSTON
Houston Office MarketMARKET HIGHLIGHTS – CLASS “A, B & C”
S O U T H H W Y 3 5 M A R K E T
Deliveries, Absorption & Vacancy Historical Analysis, All Classes
Source: CoStar Property®
Vacant Space Quoted Rental RatesHistorical Analysis, All Classes Historical Analysis, All Classes
Source: CoStar Property® Source: CoStar Property®
Net QuotedPeriod # Bldgs Total RBA Vacant SF Vacancy % Absorption # Bldgs Total RBA # Bldgs Total RBA Rates2012 4q 97 585,565 18,247 3.1% (717) 0 0 0 0 $14.85
2012 3q 97 585,565 17,530 3.0% 1,775 0 0 0 0 $13.70
2012 2q 97 585,565 19,305 3.3% 3,584 0 0 0 0 $13.92
2012 1q 97 585,565 22,889 3.9% (5,500) 0 0 0 0 $14.98
2011 4q 97 585,565 17,389 3.0% 3,346 0 0 0 0 $14.98
2011 3q 97 585,565 20,735 3.5% 5,150 0 0 0 0 $14.59
2011 2q 97 585,565 25,885 4.4% (2,432) 0 0 0 0 $14.59
2011 1q 97 585,565 23,453 4.0% 2,997 0 0 0 0 $15.07
2010 4q 97 585,565 26,450 4.5% 0 0 0 0 0 $15.16
2010 3q 97 585,565 26,450 4.5% (1,844) 0 0 0 0 $15.16
2010 2q 97 585,565 24,606 4.2% (605) 0 0 0 0 $14.88
2010 1q 97 585,565 24,001 4.1% (2,300) 0 0 0 0 $15.91
2009 4q 97 585,565 21,701 3.7% 6,096 1 4,021 0 0 $17.05
2009 3q 96 581,544 23,776 4.1% (2,751) 0 0 1 4,021 $11.50
2009 2q 96 581,544 21,025 3.6% (4,800) 0 0 1 4,021 $10.25
2009 1q 96 581,544 16,225 2.8% (2,700) 0 0 1 4,021 $10.25
Source: CoStar Property®
UC InventoryDelivered InventoryExisting Inventory Vacancy
(0.008)
(0.006)
(0.004)
(0.002)
0.000
0.002
0.004
0.006
0.008
2009 1q 2009 2q 2009 3q 2009 4q 2010 1q 2010 2q 2010 3q 2010 4q 2011 1q 2011 2q 2011 3q 2011 4q 2012 1q 2012 2q 2012 3q 2012 4q
Millio
ns
SF
0.0%
0.5%
1.0%
1.5%
2.0%
2.5%
3.0%
3.5%
4.0%
4.5%
5.0%
Perce
nt V
acant
Delivered SF Absorption SF Vacancy
$13.00
$13.50
$14.00
$14.50
$15.00
$15.50
2011 1q 2011 2q 2011 3q 2011 4q 2012 1q 2012 2q 2012 3q 2012 4q
Dollar
s/SF/Y
ear
0.00
0.01
0.01
0.02
0.02
0.03
0.03
2011 1q 2011 2q 2011 3q 2011 4q 2012 1q 2012 2q 2012 3q 2012 4q
Millio
ns
SF
Direct SF Sublet SF
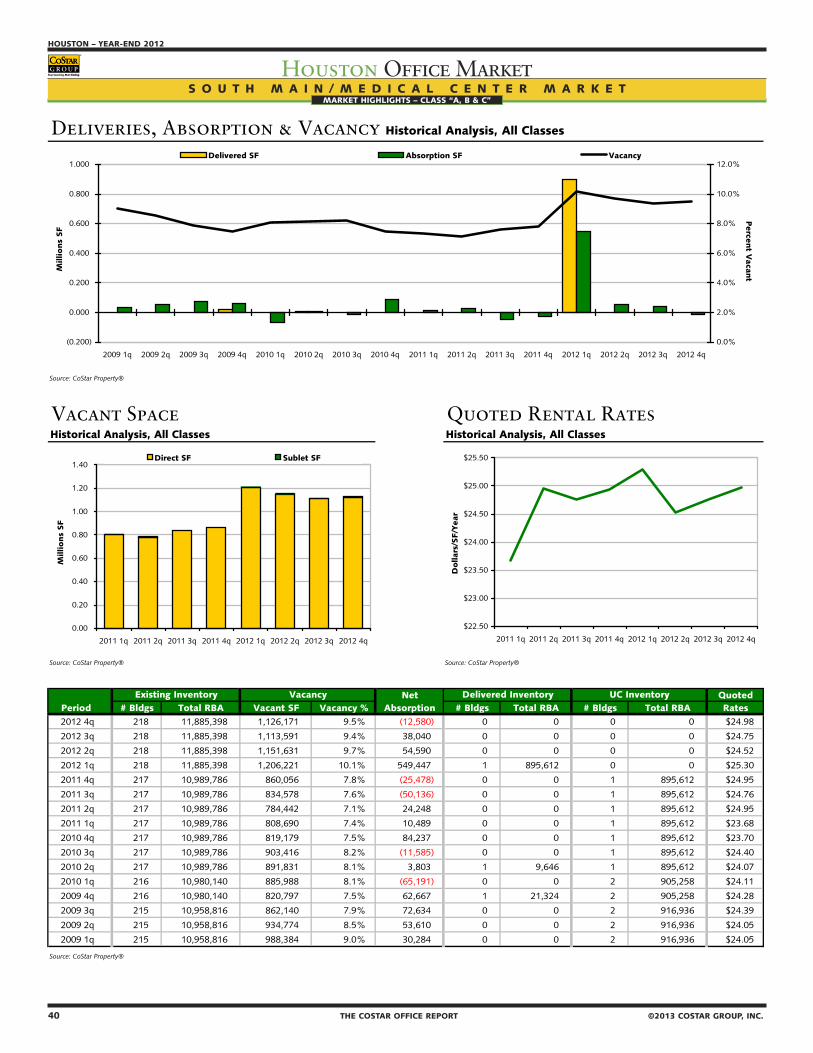
40 THE COSTAR OFFICE REPORT ©2013 COSTAR GROUP, INC.
HOUSTON – YEAR-END 2012
Houston Office MarketMARKET HIGHLIGHTS – CLASS “A, B & C”
©2013 COSTAR GROUP, INC. THE COSTAR OFFICE REPORT 41
YEAR-END 2012 – HOUSTON
Houston Office MarketMARKET HIGHLIGHTS – CLASS “A, B & C”
S O U T H M A I N / M E D I C A L C E N T E R M A R K E T
Deliveries, Absorption & Vacancy Historical Analysis, All Classes
Source: CoStar Property®
Vacant Space Quoted Rental RatesHistorical Analysis, All Classes Historical Analysis, All Classes
Source: CoStar Property® Source: CoStar Property®
Net QuotedPeriod # Bldgs Total RBA Vacant SF Vacancy % Absorption # Bldgs Total RBA # Bldgs Total RBA Rates2012 4q 218 11,885,398 1,126,171 9.5% (12,580) 0 0 0 0 $24.98
2012 3q 218 11,885,398 1,113,591 9.4% 38,040 0 0 0 0 $24.75
2012 2q 218 11,885,398 1,151,631 9.7% 54,590 0 0 0 0 $24.52
2012 1q 218 11,885,398 1,206,221 10.1% 549,447 1 895,612 0 0 $25.30
2011 4q 217 10,989,786 860,056 7.8% (25,478) 0 0 1 895,612 $24.95
2011 3q 217 10,989,786 834,578 7.6% (50,136) 0 0 1 895,612 $24.76
2011 2q 217 10,989,786 784,442 7.1% 24,248 0 0 1 895,612 $24.95
2011 1q 217 10,989,786 808,690 7.4% 10,489 0 0 1 895,612 $23.68
2010 4q 217 10,989,786 819,179 7.5% 84,237 0 0 1 895,612 $23.70
2010 3q 217 10,989,786 903,416 8.2% (11,585) 0 0 1 895,612 $24.40
2010 2q 217 10,989,786 891,831 8.1% 3,803 1 9,646 1 895,612 $24.07
2010 1q 216 10,980,140 885,988 8.1% (65,191) 0 0 2 905,258 $24.11
2009 4q 216 10,980,140 820,797 7.5% 62,667 1 21,324 2 905,258 $24.28
2009 3q 215 10,958,816 862,140 7.9% 72,634 0 0 2 916,936 $24.39
2009 2q 215 10,958,816 934,774 8.5% 53,610 0 0 2 916,936 $24.05
2009 1q 215 10,958,816 988,384 9.0% 30,284 0 0 2 916,936 $24.05
Source: CoStar Property®
UC InventoryDelivered InventoryExisting Inventory Vacancy
(0.200)
0.000
0.200
0.400
0.600
0.800
1.000
2009 1q 2009 2q 2009 3q 2009 4q 2010 1q 2010 2q 2010 3q 2010 4q 2011 1q 2011 2q 2011 3q 2011 4q 2012 1q 2012 2q 2012 3q 2012 4q
Millio
ns
SF
0.0%
2.0%
4.0%
6.0%
8.0%
10.0%
12.0%
Perce
nt V
acant
Delivered SF Absorption SF Vacancy
$22.50
$23.00
$23.50
$24.00
$24.50
$25.00
$25.50
2011 1q 2011 2q 2011 3q 2011 4q 2012 1q 2012 2q 2012 3q 2012 4q
Dollar
s/SF/Y
ear
0.00
0.20
0.40
0.60
0.80
1.00
1.20
1.40
2011 1q 2011 2q 2011 3q 2011 4q 2012 1q 2012 2q 2012 3q 2012 4q
Millio
ns
SF
Direct SF Sublet SF
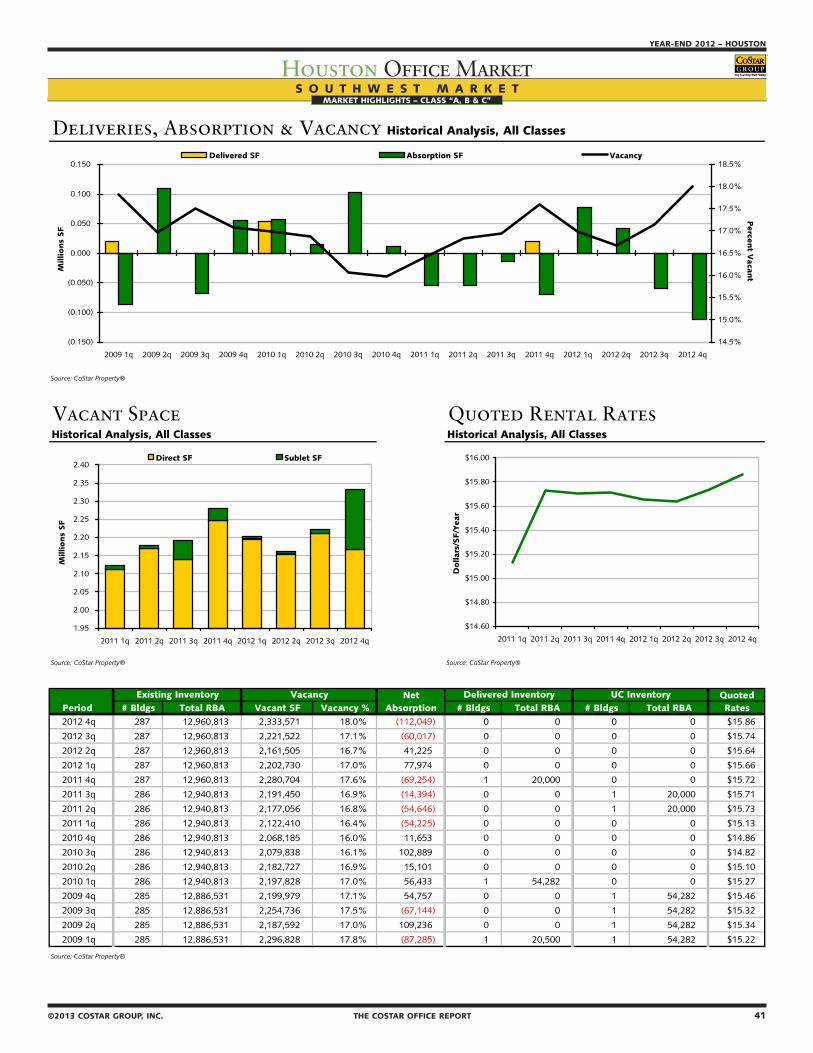
40 THE COSTAR OFFICE REPORT ©2013 COSTAR GROUP, INC.
HOUSTON – YEAR-END 2012
Houston Office MarketMARKET HIGHLIGHTS – CLASS “A, B & C”
©2013 COSTAR GROUP, INC. THE COSTAR OFFICE REPORT 41
YEAR-END 2012 – HOUSTON
Houston Office MarketMARKET HIGHLIGHTS – CLASS “A, B & C”
S O U T H W E S T M A R K E T
Deliveries, Absorption & Vacancy Historical Analysis, All Classes
Source: CoStar Property®
Vacant Space Quoted Rental RatesHistorical Analysis, All Classes Historical Analysis, All Classes
Source: CoStar Property® Source: CoStar Property®
Net QuotedPeriod # Bldgs Total RBA Vacant SF Vacancy % Absorption # Bldgs Total RBA # Bldgs Total RBA Rates2012 4q 287 12,960,813 2,333,571 18.0% (112,049) 0 0 0 0 $15.86
2012 3q 287 12,960,813 2,221,522 17.1% (60,017) 0 0 0 0 $15.74
2012 2q 287 12,960,813 2,161,505 16.7% 41,225 0 0 0 0 $15.64
2012 1q 287 12,960,813 2,202,730 17.0% 77,974 0 0 0 0 $15.66
2011 4q 287 12,960,813 2,280,704 17.6% (69,254) 1 20,000 0 0 $15.72
2011 3q 286 12,940,813 2,191,450 16.9% (14,394) 0 0 1 20,000 $15.71
2011 2q 286 12,940,813 2,177,056 16.8% (54,646) 0 0 1 20,000 $15.73
2011 1q 286 12,940,813 2,122,410 16.4% (54,225) 0 0 0 0 $15.13
2010 4q 286 12,940,813 2,068,185 16.0% 11,653 0 0 0 0 $14.86
2010 3q 286 12,940,813 2,079,838 16.1% 102,889 0 0 0 0 $14.82
2010 2q 286 12,940,813 2,182,727 16.9% 15,101 0 0 0 0 $15.10
2010 1q 286 12,940,813 2,197,828 17.0% 56,433 1 54,282 0 0 $15.27
2009 4q 285 12,886,531 2,199,979 17.1% 54,757 0 0 1 54,282 $15.46
2009 3q 285 12,886,531 2,254,736 17.5% (67,144) 0 0 1 54,282 $15.32
2009 2q 285 12,886,531 2,187,592 17.0% 109,236 0 0 1 54,282 $15.34
2009 1q 285 12,886,531 2,296,828 17.8% (87,285) 1 20,500 1 54,282 $15.22
Source: CoStar Property®
UC InventoryDelivered InventoryExisting Inventory Vacancy
(0.150)
(0.100)
(0.050)
0.000
0.050
0.100
0.150
2009 1q 2009 2q 2009 3q 2009 4q 2010 1q 2010 2q 2010 3q 2010 4q 2011 1q 2011 2q 2011 3q 2011 4q 2012 1q 2012 2q 2012 3q 2012 4q
Millio
ns
SF
14.5%
15.0%
15.5%
16.0%
16.5%
17.0%
17.5%
18.0%
18.5%
Perce
nt V
acant
Delivered SF Absorption SF Vacancy
$14.60
$14.80
$15.00
$15.20
$15.40
$15.60
$15.80
$16.00
2011 1q 2011 2q 2011 3q 2011 4q 2012 1q 2012 2q 2012 3q 2012 4q
Dollar
s/SF/Y
ear
1.95
2.00
2.05
2.10
2.15
2.20
2.25
2.30
2.35
2.40
2011 1q 2011 2q 2011 3q 2011 4q 2012 1q 2012 2q 2012 3q 2012 4q
Millio
ns
SF
Direct SF Sublet SF
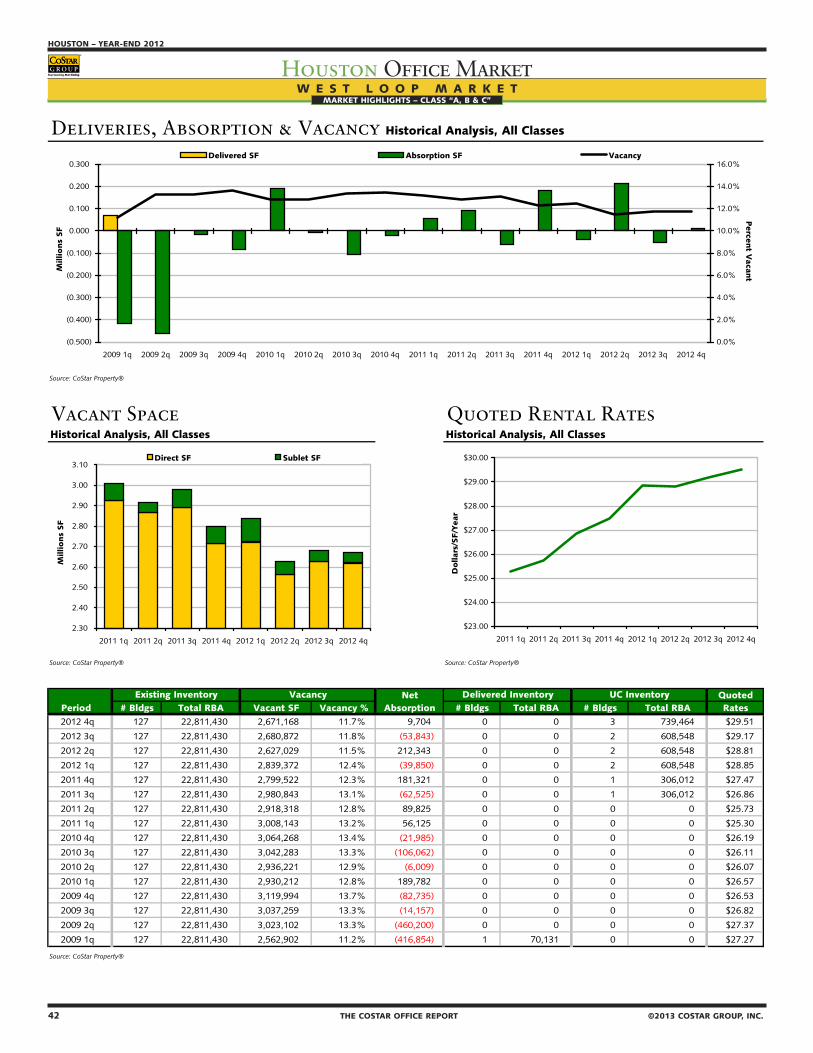
42 THE COSTAR OFFICE REPORT ©2013 COSTAR GROUP, INC.
HOUSTON – YEAR-END 2012
Houston Office MarketMARKET HIGHLIGHTS – CLASS “A, B & C”
©2013 COSTAR GROUP, INC. THE COSTAR OFFICE REPORT 43
YEAR-END 2012 – HOUSTON
Houston Office MarketMARKET HIGHLIGHTS – CLASS “A, B & C”
W E S T L O O P M A R K E T
Deliveries, Absorption & Vacancy Historical Analysis, All Classes
Source: CoStar Property®
Vacant Space Quoted Rental RatesHistorical Analysis, All Classes Historical Analysis, All Classes
Source: CoStar Property® Source: CoStar Property®
Net QuotedPeriod # Bldgs Total RBA Vacant SF Vacancy % Absorption # Bldgs Total RBA # Bldgs Total RBA Rates2012 4q 127 22,811,430 2,671,168 11.7% 9,704 0 0 3 739,464 $29.51
2012 3q 127 22,811,430 2,680,872 11.8% (53,843) 0 0 2 608,548 $29.17
2012 2q 127 22,811,430 2,627,029 11.5% 212,343 0 0 2 608,548 $28.81
2012 1q 127 22,811,430 2,839,372 12.4% (39,850) 0 0 2 608,548 $28.85
2011 4q 127 22,811,430 2,799,522 12.3% 181,321 0 0 1 306,012 $27.47
2011 3q 127 22,811,430 2,980,843 13.1% (62,525) 0 0 1 306,012 $26.86
2011 2q 127 22,811,430 2,918,318 12.8% 89,825 0 0 0 0 $25.73
2011 1q 127 22,811,430 3,008,143 13.2% 56,125 0 0 0 0 $25.30
2010 4q 127 22,811,430 3,064,268 13.4% (21,985) 0 0 0 0 $26.19
2010 3q 127 22,811,430 3,042,283 13.3% (106,062) 0 0 0 0 $26.11
2010 2q 127 22,811,430 2,936,221 12.9% (6,009) 0 0 0 0 $26.07
2010 1q 127 22,811,430 2,930,212 12.8% 189,782 0 0 0 0 $26.57
2009 4q 127 22,811,430 3,119,994 13.7% (82,735) 0 0 0 0 $26.53
2009 3q 127 22,811,430 3,037,259 13.3% (14,157) 0 0 0 0 $26.82
2009 2q 127 22,811,430 3,023,102 13.3% (460,200) 0 0 0 0 $27.37
2009 1q 127 22,811,430 2,562,902 11.2% (416,854) 1 70,131 0 0 $27.27
Source: CoStar Property®
UC InventoryDelivered InventoryExisting Inventory Vacancy
(0.500)
(0.400)
(0.300)
(0.200)
(0.100)
0.000
0.100
0.200
0.300
2009 1q 2009 2q 2009 3q 2009 4q 2010 1q 2010 2q 2010 3q 2010 4q 2011 1q 2011 2q 2011 3q 2011 4q 2012 1q 2012 2q 2012 3q 2012 4q
Millio
ns
SF
0.0%
2.0%
4.0%
6.0%
8.0%
10.0%
12.0%
14.0%
16.0%
Perce
nt V
acant
Delivered SF Absorption SF Vacancy
$23.00
$24.00
$25.00
$26.00
$27.00
$28.00
$29.00
$30.00
2011 1q 2011 2q 2011 3q 2011 4q 2012 1q 2012 2q 2012 3q 2012 4q
Dollar
s/SF/Y
ear
2.30
2.40
2.50
2.60
2.70
2.80
2.90
3.00
3.10
2011 1q 2011 2q 2011 3q 2011 4q 2012 1q 2012 2q 2012 3q 2012 4q
Millio
ns
SF
Direct SF Sublet SF

42 THE COSTAR OFFICE REPORT ©2013 COSTAR GROUP, INC.
HOUSTON – YEAR-END 2012
Houston Office MarketMARKET HIGHLIGHTS – CLASS “A, B & C”
©2013 COSTAR GROUP, INC. THE COSTAR OFFICE REPORT 43
YEAR-END 2012 – HOUSTON
Houston Office MarketMARKET HIGHLIGHTS – CLASS “A, B & C”
W E S T C H A S E M A R K E T
Deliveries, Absorption & Vacancy Historical Analysis, All Classes
Source: CoStar Property®
Vacant Space Quoted Rental RatesHistorical Analysis, All Classes Historical Analysis, All Classes
Source: CoStar Property® Source: CoStar Property®
Net QuotedPeriod # Bldgs Total RBA Vacant SF Vacancy % Absorption # Bldgs Total RBA # Bldgs Total RBA Rates2012 4q 124 15,805,245 1,339,559 8.5% 136,076 0 0 1 299,664 $27.55
2012 3q 124 15,805,245 1,475,635 9.3% 145,962 1 45,000 1 299,664 $27.57
2012 2q 123 15,760,245 1,576,597 10.0% 348,165 0 0 2 344,664 $25.31
2012 1q 123 15,760,245 1,924,762 12.2% 443 0 0 1 45,000 $23.14
2011 4q 123 15,760,245 1,925,205 12.2% 114,466 0 0 1 45,000 $21.73
2011 3q 123 15,760,245 2,039,671 12.9% 88,549 0 0 0 0 $22.27
2011 2q 123 15,760,245 2,128,220 13.5% (23,845) 0 0 0 0 $22.64
2011 1q 123 15,760,245 2,104,375 13.4% 249,246 0 0 0 0 $25.32
2010 4q 123 15,760,245 2,353,621 14.9% 101,252 0 0 0 0 $25.01
2010 3q 123 15,760,245 2,454,873 15.6% 76,459 0 0 0 0 $25.02
2010 2q 123 15,760,245 2,531,332 16.1% 23,048 0 0 0 0 $25.63
2010 1q 123 15,760,245 2,554,380 16.2% (13,757) 0 0 0 0 $24.53
2009 4q 123 15,760,245 2,540,623 16.1% (309,688) 0 0 0 0 $23.83
2009 3q 123 15,760,245 2,230,935 14.2% 24,537 1 272,361 0 0 $24.07
2009 2q 122 15,487,884 1,983,111 12.8% (170,553) 2 222,142 1 272,361 $24.00
2009 1q 120 15,265,742 1,590,416 10.4% (201,714) 1 12,321 3 494,503 $24.23
Source: CoStar Property®
UC InventoryDelivered InventoryExisting Inventory Vacancy
(0.400)
(0.300)
(0.200)
(0.100)
0.000
0.100
0.200
0.300
0.400
2009 1q 2009 2q 2009 3q 2009 4q 2010 1q 2010 2q 2010 3q 2010 4q 2011 1q 2011 2q 2011 3q 2011 4q 2012 1q 2012 2q 2012 3q 2012 4q
Millio
ns
SF
0.0%
2.0%
4.0%
6.0%
8.0%
10.0%
12.0%
14.0%
16.0%
18.0%
Perce
nt V
acant
Delivered SF Absorption SF Vacancy
$0.00
$5.00
$10.00
$15.00
$20.00
$25.00
$30.00
2011 1q 2011 2q 2011 3q 2011 4q 2012 1q 2012 2q 2012 3q 2012 4q
Dollar
s/SF/Y
ear
0.00
0.50
1.00
1.50
2.00
2.50
2011 1q 2011 2q 2011 3q 2011 4q 2012 1q 2012 2q 2012 3q 2012 4q
Millio
ns
SF
Direct SF Sublet SF
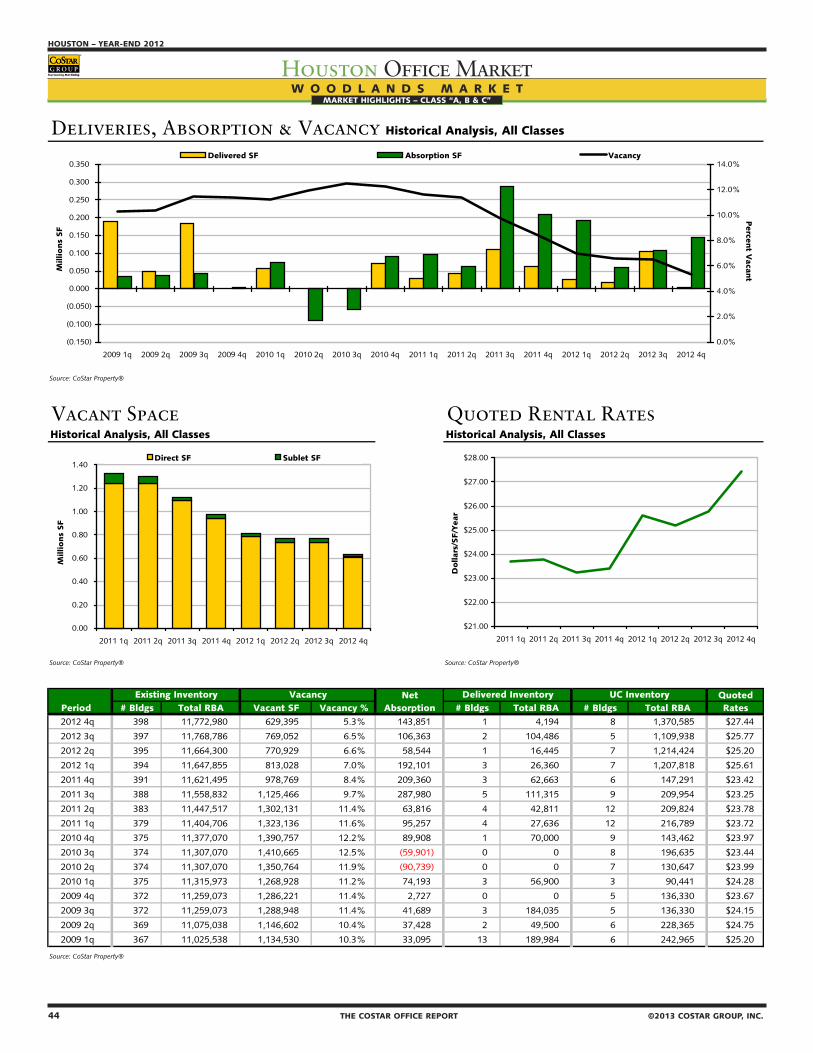
44 THE COSTAR OFFICE REPORT ©2013 COSTAR GROUP, INC.
HOUSTON – YEAR-END 2012
Houston Office MarketMARKET HIGHLIGHTS – CLASS “A, B & C”
W O O D L A N D S M A R K E T
Deliveries, Absorption & Vacancy Historical Analysis, All Classes
Source: CoStar Property®
Vacant Space Quoted Rental RatesHistorical Analysis, All Classes Historical Analysis, All Classes
Source: CoStar Property® Source: CoStar Property®
Net QuotedPeriod # Bldgs Total RBA Vacant SF Vacancy % Absorption # Bldgs Total RBA # Bldgs Total RBA Rates2012 4q 398 11,772,980 629,395 5.3% 143,851 1 4,194 8 1,370,585 $27.44
2012 3q 397 11,768,786 769,052 6.5% 106,363 2 104,486 5 1,109,938 $25.77
2012 2q 395 11,664,300 770,929 6.6% 58,544 1 16,445 7 1,214,424 $25.20
2012 1q 394 11,647,855 813,028 7.0% 192,101 3 26,360 7 1,207,818 $25.61
2011 4q 391 11,621,495 978,769 8.4% 209,360 3 62,663 6 147,291 $23.42
2011 3q 388 11,558,832 1,125,466 9.7% 287,980 5 111,315 9 209,954 $23.25
2011 2q 383 11,447,517 1,302,131 11.4% 63,816 4 42,811 12 209,824 $23.78
2011 1q 379 11,404,706 1,323,136 11.6% 95,257 4 27,636 12 216,789 $23.72
2010 4q 375 11,377,070 1,390,757 12.2% 89,908 1 70,000 9 143,462 $23.97
2010 3q 374 11,307,070 1,410,665 12.5% (59,901) 0 0 8 196,635 $23.44
2010 2q 374 11,307,070 1,350,764 11.9% (90,739) 0 0 7 130,647 $23.99
2010 1q 375 11,315,973 1,268,928 11.2% 74,193 3 56,900 3 90,441 $24.28
2009 4q 372 11,259,073 1,286,221 11.4% 2,727 0 0 5 136,330 $23.67
2009 3q 372 11,259,073 1,288,948 11.4% 41,689 3 184,035 5 136,330 $24.15
2009 2q 369 11,075,038 1,146,602 10.4% 37,428 2 49,500 6 228,365 $24.75
2009 1q 367 11,025,538 1,134,530 10.3% 33,095 13 189,984 6 242,965 $25.20
Source: CoStar Property®
UC InventoryDelivered InventoryExisting Inventory Vacancy
(0.150)
(0.100)
(0.050)
0.000
0.050
0.100
0.150
0.200
0.250
0.300
0.350
2009 1q 2009 2q 2009 3q 2009 4q 2010 1q 2010 2q 2010 3q 2010 4q 2011 1q 2011 2q 2011 3q 2011 4q 2012 1q 2012 2q 2012 3q 2012 4q
Millio
ns
SF
0.0%
2.0%
4.0%
6.0%
8.0%
10.0%
12.0%
14.0%
Perce
nt V
acant
Delivered SF Absorption SF Vacancy
$21.00
$22.00
$23.00
$24.00
$25.00
$26.00
$27.00
$28.00
2011 1q 2011 2q 2011 3q 2011 4q 2012 1q 2012 2q 2012 3q 2012 4q
Dollar
s/SF/Y
ear
0.00
0.20
0.40
0.60
0.80
1.00
1.20
1.40
2011 1q 2011 2q 2011 3q 2011 4q 2012 1q 2012 2q 2012 3q 2012 4q
Millio
ns
SF
Direct SF Sublet SF