costar office report - wordpress.com sound office market ©2013 costar group, inc. the costar office...
TRANSCRIPT

Seattle/Puget Sound Office Market
T H I R D Q U A R T E R 2 0 1 3
The CoStarOffice Report

Seattle/Puget Sound Office Market
©2013 COSTAR GROUP, INC. THE COSTAR OFFICE REPORT A
THIRD QUARTER 2013 – SEATTLE/PUGET SOUND
Table of ContentsTable of Contents . . . . . . . . . . . . . . . . . . . . . . . . . . . . . . . . . . . . . . . . . . . . . . . . . . . . . . . . . . . . . . . . . . . . A
Methodology. . . . . . . . . . . . . . . . . . . . . . . . . . . . . . . . . . . . . . . . . . . . . . . . . . . . . . . . . . . . . . . . . . . . . . . . B
Terms & Definitions. . . . . . . . . . . . . . . . . . . . . . . . . . . . . . . . . . . . . . . . . . . . . . . . . . . . . . . . . . . . . . . . . . C
Market Highlights & Overview. . . . . . . . . . . . . . . . . . . . . . . . . . . . . . . . . . . . . . . . . . . . . . . . . . . . . . . . . 1
CoStar Markets & Submarkets . . . . . . . . . . . . . . . . . . . . . . . . . . . . . . . . . . . . . . . . . . . . . . . . . . . . . . . . . 4
Inventory & Development Analysis. . . . . . . . . . . . . . . . . . . . . . . . . . . . . . . . . . . . . . . . . . . . . . . . . . . . . . 5Inventory & Development AnalysisSelect Top DeliveriesSelect Top Under Construction Properties
Figures at a Glance . . . . . . . . . . . . . . . . . . . . . . . . . . . . . . . . . . . . . . . . . . . . . . . . . . . . . . . . . . . . . . . . . . . 9Figures at a Glance by Class & MarketFigures at a Glance by Class & SubmarketFigures at a Glance Grouped by CBD vs SuburbanHistorical Figures at a Glance
Leasing Activity Analysis . . . . . . . . . . . . . . . . . . . . . . . . . . . . . . . . . . . . . . . . . . . . . . . . . . . . . . . . . . . . . 16Select Top Lease Transactions
Sales Activity Analysis . . . . . . . . . . . . . . . . . . . . . . . . . . . . . . . . . . . . . . . . . . . . . . . . . . . . . . . . . . . . . . . 18Sales Activity AnalysisSelect Top Sales Transactions
Analysis of Individual CoStar Submarket Clusters . . . . . . . . . . . . . . . . . . . . . . . . . . . . . . . . . . . . . . . . . 20Downtown Seattle MarketEastside MarketNorthend MarketSouthend MarketTacoma Market

Seattle/Puget Sound Office Market
B THE COSTAR OFFICE REPORT ©2013 COSTAR GROUP, INC.
SEATTLE/PUGET SOUND – THIRD QUARTER 2013
Seattle/Puget Sound Office Market
©2013 COSTAR GROUP, INC. THE COSTAR OFFICE REPORT C
THIRD QUARTER 2013 – SEATTLE/PUGET SOUND
Methodology
The CoStar Office Report, unless specifically stated otherwise, calculates office statistics using CoStar Group’s entire database of existing and under construction office buildings in each metropolitan area. Included are office, office condominium, office loft, office medical, all classes and all sizes, and both multi-tenant and single-tenant buildings, including owner-occupied buildings. CoStar Group's national database includes approximately 80.7 billion square feet of coverage in 3.5 million properties. All rental rates reported in the CoStar Office Report have been converted to a Full Service equivalent rental rate.
© Copyright 2013 CoStar Group, Inc. All Rights Reserved. Although CoStar makes efforts to ensure the accuracy and reliability of the information contained herein, CoStar makes no guarantee, representation or warranty regarding the quality, accuracy, timeliness or completeness of the information. The publication is provided ‘as is’ and CoStar expressly disclaims any guarantees, representations or warranties of any kind, including those of MERCHANTABILITY AND FITNESS FOR A PARTICULAR PURPOSE.
CoStar Group, Inc.
1331 L ST NW • Washington, DC 20005• (800) 204-5960 • www.costar.com • NASDAQ: CSGP
For information on subscribing to CoStar’s other products and services, please contact us at
1-877-7COSTAR, or visit our web site at www.costar.com
Seattle/Puget Sound Office Market
B THE COSTAR OFFICE REPORT ©2013 COSTAR GROUP, INC.
SEATTLE/PUGET SOUND – THIRD QUARTER 2013
Seattle/Puget Sound Office Market
©2013 COSTAR GROUP, INC. THE COSTAR OFFICE REPORT C
THIRD QUARTER 2013 – SEATTLE/PUGET SOUND
Terms & DefinitionsAvailability Rate: The ratio of available space to total rentable space, calculated by dividing the total available square feet by the total rentable square feet.
Available Space: The total amount of space that is currently being marketed as available for lease in a given time period. It includes any space that is available, regardless of whether the space is vacant, occupied, available for sublease, or available at a future date.
Build-to-Suit: A term describing a particular property, developed specifically for a certain tenant to occupy, with structural features, systems, or improvement work designed specifically for the needs of that tenant. A build-to-suit can be leased or owned by the ten-ant. In a leased build-to-suit, a tenant will usually have a long term lease on the space.
Buyer: The individual, group, company, or entity that has pur-chased a commercial real estate asset.
Cap Rate: Short for capitalization rate. The Cap Rate is a calcula-tion that reflects the relationship between one year’s net operating income and the current market value of a particular property. The Cap Rate is calculated by dividing the annual net operating income by the sales price (or asking sales price).
CBD: Abbreviation for Central Business District. (See also: Central Business District)
Central Business District: The designations of Central Business District (CBD) and Suburban refer to a particular geographic area within a metropolitan statistical area (MSA) describing the level of real estate development found there. The CBD is characterized by a high density, well organized core within the largest city of a given MSA.
Class A: A classification used to describe buildings that generally qualify as extremely desirable investment-grade properties and command the highest rents or sale prices compared to other buildings in the same market. Such buildings are well located and provide efficient tenant layouts as well as high quality, and in some buildings, one-of-a-kind floor plans. They can be an archi-tectural or historical landmark designed by prominent architects. These buildings contain a modern mechanical system, and have above-average maintenance and management as well as the best quality materials and workmanship in their trim and interior fit-tings. They are generally the most attractive and eagerly sought by investors willing to pay a premium for quality.
Class B: A classification used to describe buildings that generally qualify as a more speculative investment, and as such, command lower rents or sale prices compared to Class A properties. Such buildings offer utilitarian space without special attractions, and have ordinary design, if new or fairly new; good to excellent design if an older non-landmark building. These buildings typical-ly have average to good maintenance, management and tenants. They are less appealing to tenants than Class A properties, and may be deficient in a number of respects including floor plans, condition and facilities. They lack prestige and must depend chiefly on a lower price to attract tenants and investors.
Class C: A classification used to describe buildings that gener-ally qualify as no-frills, older buildings that offer basic space and command lower rents or sale prices compared to other buildings in the same market. Such buildings typically have below-average maintenance and management, and could have mixed or low tenant prestige, inferior elevators, and/or mechanical/electrical systems. These buildings lack prestige and must depend chiefly on a lower price to attract tenants and investors.
Construction Starts: Buildings that began construction during a specific period of time. (See also: Deliveries)
Contiguous Blocks of Space: Space within a building that is, or is able to be joined together into a single contiguous space.
Deliveries: Buildings that complete construction during a specified period of time. In order for space to be considered delivered, a certificate of occupancy must have been issued for the property.
Delivery Date: The date a building completes construction and receives a certificate of occupancy.
Developer: The company, entity or individual that transforms raw land to improved property by use of labor, capital and entrepre-neurial efforts.
Direct Space: Space that is being offered for lease directly from the landlord or owner of a building, as opposed to space being offered in a building by another tenant (or broker of a tenant) trying to sublet a space that has already been leased.
Existing Inventory: The square footage of buildings that have received a certificate of occupancy and are able to be occupied by tenants. It does not include space in buildings that are either planned, under construction or under renovation.
Flex Building: A type of building designed to be versatile, which may be used in combination with office (corporate headquarters), research and development, quasi-retail sales, and including but not limited to industrial, warehouse, and distribution uses. A typi-cal flex building will be one or two stories with at least half of the rentable area being used as office space, have ceiling heights of 16 feet or less, and have some type of drive-in door, even though the door may be glassed in or sealed off.
Full Service Rental Rate: Rental rates that include all operating expenses such as utilities, electricity, janitorial services, taxes and insurance.
Gross Absorption: The total change in occupied space over a given period of time, counting space that is occupied but not space that is vacated by tenants. Gross absorption differs from leasing Activity, which is the sum of all space leased over a certain period of time. Unless otherwise noted Gross Absorption includes direct and sublease space.
Growth in Inventory: The change in size of the existing square footage in a given area over a given period of time, generally due to the construction of new buildings.
Industrial Building: A type of building adapted for such uses as the assemblage, processing, and/or manufacturing of products from raw materials or fabricated parts. Additional uses include warehousing, distribution, and maintenance facilities. The pri-mary purpose of the space is for storing, producing, assembling, or distributing product.
Landlord Rep: (Landlord Representative) In a typical lease trans-action between an owner/landlord and tenant, the broker that represents the interests of the owner/landlord is referred to as the Landlord Rep.
Leased Space: All the space that has a financial lease obligation. It includes all leased space, regardless of whether the space is currently occupied by a tenant. Leased space also includes space being offered for sublease.
Leasing Activity: The volume of square footage that is commit-ted to and signed under a lease obligation for a specific building or market in a given period of time. It includes direct leases, subleases and renewals of existing leases. It also includes any pre-leasing activity in planned, under construction, or under renovation buildings.
Market: Geographic boundaries that serve to delineate core areas that are competitive with each other and constitute a generally accepted primary competitive set of areas. Markets are building-type specific, and are non-overlapping contiguous geographic designations having a cumulative sum that matches the boundar-ies of the entire Region (See also: Region). Markets can be further subdivided into Submarkets. (See also: Submarkets)

Seattle/Puget Sound Office Market
D THE COSTAR OFFICE REPORT ©2013 COSTAR GROUP, INC.
SEATTLE/PUGET SOUND – THIRD QUARTER 2013 THIRD QUARTER 2013 – SEATTLE/PUGET SOUND
Seattle/Puget Sound Office Market
©2013 COSTAR GROUP, INC. THE COSTAR OFFICE REPORT 1
Multi-Tenant: Buildings that house more than one tenant at a given time. Usually, multi-tenant buildings were designed and built to accommodate many different floor plans and designs for different tenant needs. (See also: Tenancy).
Net Absorption: The net change in occupied space over a given period of time. Unless otherwise noted Net Absorption includes direct and sublease space.
Net Rental Rate: A rental rate that excludes certain expenses that a tenant could incur in occupying office space. Such expenses are expected to be paid directly by the tenant and may include janitorial costs, electricity, utilities, taxes, insurance and other related costs.
New Space: Sometimes called first generation space, refers to space that has never been occupied and/or leased by a tenant.
Occupied Space: Space that is physically occupied by a tenant. It does not include leased space that is not currently occupied by a tenant.
Office Building: A type of commercial building used exclusively or primarily for office use (business), as opposed to manufactur-ing, warehousing, or other uses. Office buildings may sometimes have other associated uses within part of the building, i.e., retail sales, financial, or restaurant, usually on the ground floor.
Owner: The company, entity, or individual that holds title on a given building or property.
Planned/Proposed: The status of a building that has been announced for future development but not yet started construction.
Preleased Space: The amount of space in a building that has been leased prior to its construction completion date, or certificate of occupancy date.
Price/SF: Calculated by dividing the price of a building (either sales price or asking sales price) by the Rentable Building Area (RBA).
Property Manager: The company and/or person responsible for the day-to-day operations of a building, such as cleaning, trash removal, etc. The property manager also makes sure that the vari-ous systems within the building, such as the elevators, HVAC, and electrical systems, are functioning properly.
Quoted Rental Rate: The asking rate per square foot for a par-ticular building or unit of space by a broker or property owner. Quoted rental rates may differ from the actual rates paid by tenants following the negotiation of all terms and conditions in a specific lease.
RBA: Abbreviation for Rentable Building Area. (See also: Rentable Building Area)
Region: Core areas containing a large population nucleus, that together with adjacent communities have a high degree of eco-nomic and social integration. Regions are further divided into market areas, called Markets. (See also: Markets)
Relet Space: Sometimes called second generation or direct space, refers to existing space that has previously been occupied by another tenant.
Rentable Building Area: (RBA) The total square footage of a building that can be occupied by, or assigned to a tenant for the purpose of determining a tenant’s rental obligation. Generally RBA includes a percentage of common areas including all hall-ways, main lobbies, bathrooms, and telephone closets.
Rental Rates: The annual costs of occupancy for a particular space quoted on a per square foot basis.
Sales Price: The total dollar amount paid for a particular property at a particular point in time.
Sales Volume: The sum of sales prices for a given group of build-ings in a given time period.
Seller: The individual, group, company, or entity that sells a par-ticular commercial real estate asset.
SF: Abbreviation for Square Feet.
Single-Tenant: Buildings that are occupied, or intended to be occupied by a single tenant. (See also: Build-to-suit and Tenancy)
Sublease Space: Space that has been leased by a tenant and is being offered for lease back to the market by the tenant with the lease obligation. Sublease space is sometimes referred to as sublet space.
Submarkets: Specific geographic boundaries that serve to delin-eate a core group of buildings that are competitive with each other and constitute a generally accepted primary competitive set, or peer group. Submarkets are building type specific (office, industrial, retail, etc.), with distinct boundaries dependent on different factors relevant to each building type. Submarkets are non-overlapping, contiguous geographic designations having a cumulative sum that matches the boundaries of the Market they are located within (See also: Market).
Suburban: The Suburban and Central Business District (CBD) designations refer to a particular geographic area within a metro-politan statistical area (MSA). Suburban is defined as including all office inventory not located in the CBD. (See also: CBD)
Tenancy: A term used to indicate whether or not a building is occupied by multiple tenants (See also: Multi-tenant) or a single tenant. (See also: Single-tenant)
Tenant Rep: Tenant Rep stands for Tenant Representative. In a typical lease transaction between an owner/landlord and tenant, the broker that represents the interests of the tenant is referred to as a Tenant Rep.
Time On Market: A measure of how long a currently available space has been marketed for lease, regardless of whether it is vacant or occupied.
Under Construction: The status of a building that is in the process of being developed, assembled, built or constructed. A building is considered to be under construction after it has begun construc-tion and until it receives a certificate of occupancy.
Vacancy Rate: A measurement expressed as a percentage of the total amount of physically vacant space divided by the total amount of existing inventory. Under construction space generally is not included in vacancy calculations.
Vacant Space: Space that is not currently occupied by a tenant, regardless of any lease obligation that may be on the space. Vacant space could be space that is either available or not avail-able. For example, sublease space that is currently being paid for by a tenant but not occupied by that tenant, would be considered vacant space. Likewise, space that has been leased but not yet occupied because of finish work being done, would also be con-sidered vacant space.
Weighted Average Rental Rate: Rental rates that are calculated by factoring in, or weighting, the square footage associated with each particular rental rate. This has the effect of causing rental rates on larger spaces to affect the average more than that of smaller spaces. The weighted average rental rate is calculated by taking the ratio of the square footage associated with the rental rate on each individual available space to the square footage associated with rental rates on all available spaces, multiplying the rental rate by that ratio, and then adding together all the resulting numbers. Unless specifically specified otherwise, rental rate averages include both Direct and Sublet available spaces.
Year Built: The year in which a building completed construction and was issued a certificate of occupancy.
YTD: Abbreviation for Year-to-Date. Describes statistics that are cumulative from the beginning of a calendar year through what-ever time period is being studied.

Seattle/Puget Sound Office Market
D THE COSTAR OFFICE REPORT ©2013 COSTAR GROUP, INC.
SEATTLE/PUGET SOUND – THIRD QUARTER 2013 THIRD QUARTER 2013 – SEATTLE/PUGET SOUND
Seattle/Puget Sound Office Market
©2013 COSTAR GROUP, INC. THE COSTAR OFFICE REPORT 1
OVERVIEW
Seattle/Puget Sound’s Vacancy Decreases to 10.2% Net Absorption Positive 616,750 SF in the Quarter
Investor sentiment that Seattle is an improving office market is ringing true. Following a series of record prices paid in Downtown Seattle, Lake Union and Bellevue, vacancy is
falling and Class A rents are on the rise. The driving force has been rapid tech expansion, led foremost by Amazon.com, which continues to lease up and acquire space at a frenetic pace. By the time Amazon’s 3.3 MSF South Lake Union campus is completed in 2017 it is estimated that the dot.com giant will occupy 7.3 MSF across the Seattle office market. Other tech tenants including Google, Microsoft, and Zulily have been expanding as well, and as Seattle’s employment growth has outpaced national averages, the market has even seen the return of Class A speculative con-struction (357,425 SF Dexter Station, with an expected delivery of first quarter 2015).
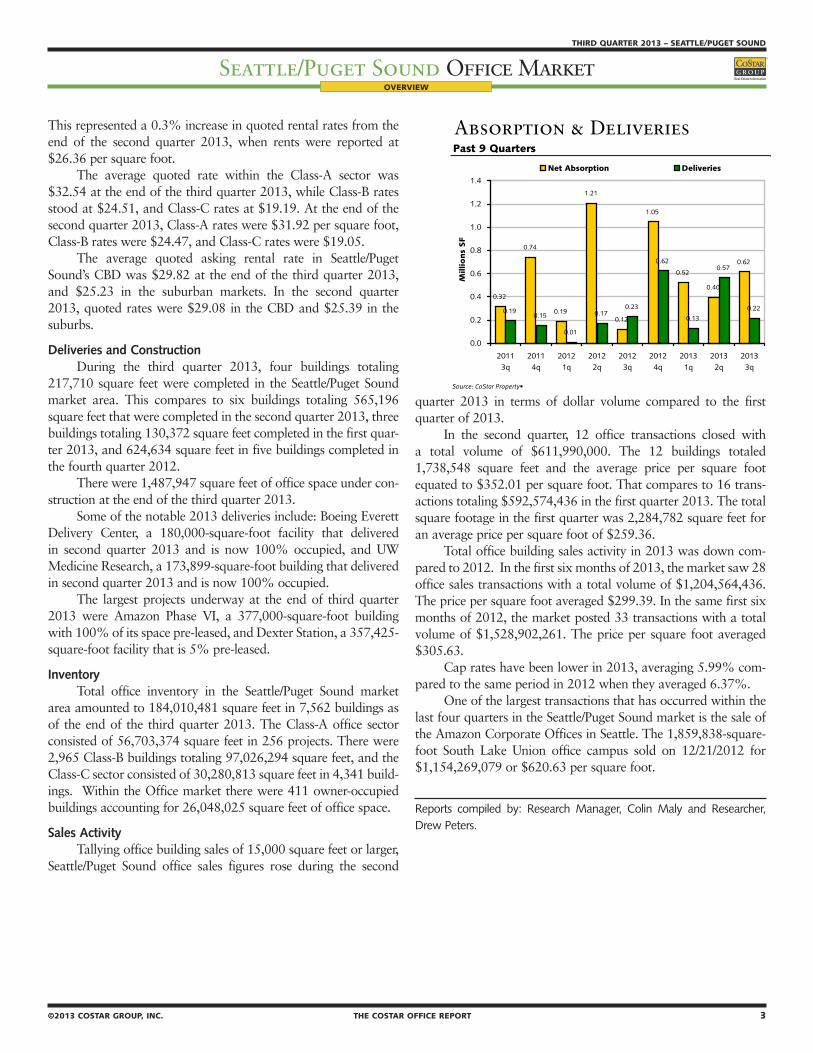
The Seattle/Puget Sound Office market ended the third quarter 2013 with a vacancy rate of 10.2%. The vacancy rate was down over the previous quarter, with net absorption totaling positive 616,750 square feet in the third quarter. Vacant sublease space decreased in the quarter, ending the quarter at 849,511 square feet. Rental rates ended the third quarter at $26.44, an increase over the previous quarter. A total of four buildings delivered to the market in the quarter totaling 217,710 square feet, with 1,487,947 square feet still under construction at the end of the quarter.
AbsorptionNet absorption for the overall Seattle/Puget Sound office
market was positive 616,750 square feet in the third quarter 2013. That compares to positive 397,655 square feet in the sec-ond quarter 2013, positive 523,328 square feet in the first quarter
2013, and positive 1,046,485 square feet in the fourth quarter 2012.
Tenants moving out of large blocks of space in 2013 include: RealNetworks, Inc. moving out of 174,470 square feet at 2601 Elliott (Seattle Trade & Technology Ctr); Dendreon Corporation moving out of 135,498 square feet at Russell Investments Center; and Federal Home Loan Bank of Seattle moving out of 106,651 square feet at Century Square.
Tenants moving into large blocks of space in 2013 include: UW School of Medicine moving into 197,616 square feet at UW Medicine Research; Davita moving into 186,612 square feet at 32275 32nd Ave S; and Amazon.com moving into 150,186 square feet at 1800 Ninth, as well as 110,000 square feet at 202 Westlake Ave N.
The Class-A office market recorded net absorption of posi-tive 646,986 square feet in the third quarter 2013, compared to positive 387,945 square feet in the second quarter 2013, positive 233,361 in the first quarter 2013, and positive 834,525 in the fourth quarter 2012.
The Class-B office market recorded net absorption of nega-tive (3,327) square feet in the third quarter 2013, compared to negative (50,269) square feet in the second quarter 2013, posi-tive 252,438 in the first quarter 2013, and positive 77,913 in the fourth quarter 2012.
The Class-C office market recorded net absorption of nega-tive (26,909) square feet in the third quarter 2013 compared to positive 59,979 square feet in the second quarter 2013, positive 37,529 in the first quarter 2013, and positive 134,047 in the fourth quarter 2012.
Vacancy Rates by Class 2000-2013
Source: CoStar Property®
Absorption & Deliveries U.S. Vacancy ComparisonPast 9 Quarters Past 9 Quarters
Source: CoStar Property• Source: CoStar Property•
0%
2%
4%
6%
8%
10%
12%
14%
16%
18%
20%
20001q
20003q
20011q
20013q
20021q
20023q
20031q
20033q
20041q
20043q
20051q
20053q
20061q
20063q
20071q
20073q
20081q
20083q
20091q
20093q
20101q
20103q
20111q
20113q
20121q
20123q
20131q
20133q
Vac
ancy
Rat
e
A B C Total Market
0.32
0.74
0.19
1.21
0.12
1.05
0.52
0.40
0.62
0.190.15
0.01
0.170.23
0.62
0.13
0.57
0.22
0.0
0.2
0.4
0.6
0.8
1.0
1.2
1.4
20113q
20114q
20121q
20122q
20123q
20124q
20131q
20132q
20133q
Millio
ns
SF
Net Absorption Deliveries
0.0%
2.0%
4.0%
6.0%
8.0%
10.0%
12.0%
14.0%
20113q
20114q
20121q
20122q
20123q
20124q
20131q
20132q
20133q
Vac
ancy
Rat
e
Seattle/Puget Sound United States

2 THE COSTAR OFFICE REPORT ©2013 COSTAR GROUP, INC.
SEATTLE/PUGET SOUND – THIRD QUARTER 2013
Seattle/Puget Sound Office MarketTHIRD QUARTER 2013 – SEATTLE/PUGET SOUND
Seattle/Puget Sound Office Market
©2013 COSTAR GROUP, INC. THE COSTAR OFFICE REPORT 3
OVERVIEW
Net absorption for Seattle/Puget Sound’s Central Business District (CBD) was positive 214,736 square feet in the third quar-ter 2013. That compares to negative (82,909) square feet in the second quarter 2013, negative (31,372) in the first quarter 2013, and positive 83,779 in the fourth quarter 2012.
Net absorption for the suburban markets was positive 402,014 square feet in the third quarter 2013. That compares to positive 480,564 square feet in second quarter 2013, positive 554,700 in the first quarter 2013, and positive 962,706 in the fourth quarter 2012.
VacancyThe office vacancy rate in the Seattle/Puget Sound market
area decreased to 10.2% at the end of the third quarter 2013. The vacancy rate was 10.5% at the end of the second quarter 2013, 10.4% at the end of the first quarter 2013, and 10.6% at the end of the fourth quarter 2012.
Class-A projects reported a vacancy rate of 11.7% at the end of the third quarter 2013, 12.6% at the end of the second quarter 2013, 12.5% at the end of the first quarter 2013, and 12.7% at the end of the fourth quarter 2012.
Class-B projects reported a vacancy rate of 10.5% at the end of the third quarter 2013, 10.5% at the end of the second quarter 2013, 10.4% at the end of the first quarter 2013, and 10.7% at the end of the fourth quarter 2012.
Class-C projects reported a vacancy rate of 6.4% at the end of the third quarter 2013, 6.4% at the end of second quarter 2013, 6.6% at the end of the first quarter 2013, and 6.8% at the end of the fourth quarter 2012.
The overall vacancy rate in Seattle/Puget Sound’s CBD at the end of the third quarter 2013 decreased to 12.3%. The vacancy rate was 12.8% at the end of the second quarter 2013, 12.4% at the end of the first quarter 2013, and 12.3% at the end of the fourth quarter 2012.
The vacancy rate in the suburban markets decreased to
9.5% in the third quarter 2013. The vacancy rate was 9.7% at the end of the second quarter 2013, 9.8% at the end of the first quarter 2013, and 10.1% at the end of the fourth quarter 2012.
Largest Lease SigningsThe largest lease signings occurring in 2013 included: the
218,900-square-foot lease signed by State Farm Insurance at The Russell Bldg in the Tacoma market; the 148,112-square-foot deal signed by Zulily at 2601 Elliott (Seattle Trade & Technology Ctr) in the Downtown Seattle market; and the 133,582-square-foot lease signed by Amazon.com, Inc. at Metropolitan Park North Tower in the Downtown Seattle market.
Sublease VacancyThe amount of vacant sublease space in the Seattle/Puget
Sound market decreased to 849,511 square feet by the end of the third quarter 2013, from 964,695 square feet at the end of the second quarter 2013. There was 1,065,432 square feet vacant at the end of the first quarter 2013 and 1,139,510 square feet at the end of the fourth quarter 2012.
Seattle/Puget Sound’s Class-A projects reported vacant sublease space of 565,831 square feet at the end of third quarter 2013, up from the 542,098 square feet reported at the end of the second quarter 2013. There were 526,151 square feet of sublease space vacant at the end of the first quarter 2013, and 585,830 square feet at the end of the fourth quarter 2012.
Class-B projects reported vacant sublease space of 243,027 square feet at the end of the third quarter 2013, down from the 391,986 square feet reported at the end of the second quarter 2013. At the end of the first quarter 2013 there were 512,896 square feet, and at the end of the fourth quarter 2012 there were 521,291 square feet vacant.
Class-C projects reported increased vacant sublease space from the second quarter 2013 to the third quarter 2013. Sublease vacancy went from 30,611 square feet to 40,653 square feet dur-ing that time. There was 26,385 square feet at the end of the first quarter 2013, and 32,389 square feet at the end of the fourth quarter 2012.
Sublease vacancy in Seattle/Puget Sound’s CBD stood at 487,564 square feet at the end of the third quarter 2013. It was 500,418 square feet at the end of the second quarter 2013, 530,531 square feet at the end of the first quarter 2013, and 589,520 square feet at the end of the fourth quarter 2012.
Sublease vacancy in the suburban markets ended the third quarter 2013 at 361,947 square feet. At the end of the second quarter 2013 sublease vacancy was 464,277 square feet, was 534,901 square feet at the end of the first quarter 2013, and was 549,990 square feet at the end of the fourth quarter 2012.
Rental RatesThe average quoted asking rental rate for available office
space, all classes, was $26.44 per square foot per year at the end of the third quarter 2013 in the Seattle/Puget Sound market area.
Vacancy Rates by Class 2000-2013
Source: CoStar Property®
Absorption & Deliveries U.S. Vacancy ComparisonPast 9 Quarters Past 9 Quarters
Source: CoStar Property• Source: CoStar Property•
0%
2%
4%
6%
8%
10%
12%
14%
16%
18%
20%
20001q
20003q
20011q
20013q
20021q
20023q
20031q
20033q
20041q
20043q
20051q
20053q
20061q
20063q
20071q
20073q
20081q
20083q
20091q
20093q
20101q
20103q
20111q
20113q
20121q
20123q
20131q
20133q
Vac
ancy
Rat
e
A B C Total Market
0.32
0.74
0.19
1.21
0.12
1.05
0.52
0.40
0.62
0.190.15
0.01
0.170.23
0.62
0.13
0.57
0.22
0.0
0.2
0.4
0.6
0.8
1.0
1.2
1.4
20113q
20114q
20121q
20122q
20123q
20124q
20131q
20132q
20133q
Millio
ns
SF
Net Absorption Deliveries
0.0%
2.0%
4.0%
6.0%
8.0%
10.0%
12.0%
14.0%
20113q
20114q
20121q
20122q
20123q
20124q
20131q
20132q
20133q
Vac
ancy
Rat
e
Seattle/Puget Sound United States
2 THE COSTAR OFFICE REPORT ©2013 COSTAR GROUP, INC.
SEATTLE/PUGET SOUND – THIRD QUARTER 2013
Seattle/Puget Sound Office MarketTHIRD QUARTER 2013 – SEATTLE/PUGET SOUND
Seattle/Puget Sound Office Market
©2013 COSTAR GROUP, INC. THE COSTAR OFFICE REPORT 3
OVERVIEW
This represented a 0.3% increase in quoted rental rates from the end of the second quarter 2013, when rents were reported at $26.36 per square foot.
The average quoted rate within the Class-A sector was $32.54 at the end of the third quarter 2013, while Class-B rates stood at $24.51, and Class-C rates at $19.19. At the end of the second quarter 2013, Class-A rates were $31.92 per square foot, Class-B rates were $24.47, and Class-C rates were $19.05.
The average quoted asking rental rate in Seattle/Puget Sound’s CBD was $29.82 at the end of the third quarter 2013, and $25.23 in the suburban markets. In the second quarter 2013, quoted rates were $29.08 in the CBD and $25.39 in the suburbs.
Deliveries and ConstructionDuring the third quarter 2013, four buildings totaling
217,710 square feet were completed in the Seattle/Puget Sound market area. This compares to six buildings totaling 565,196 square feet that were completed in the second quarter 2013, three buildings totaling 130,372 square feet completed in the first quar-ter 2013, and 624,634 square feet in five buildings completed in the fourth quarter 2012.
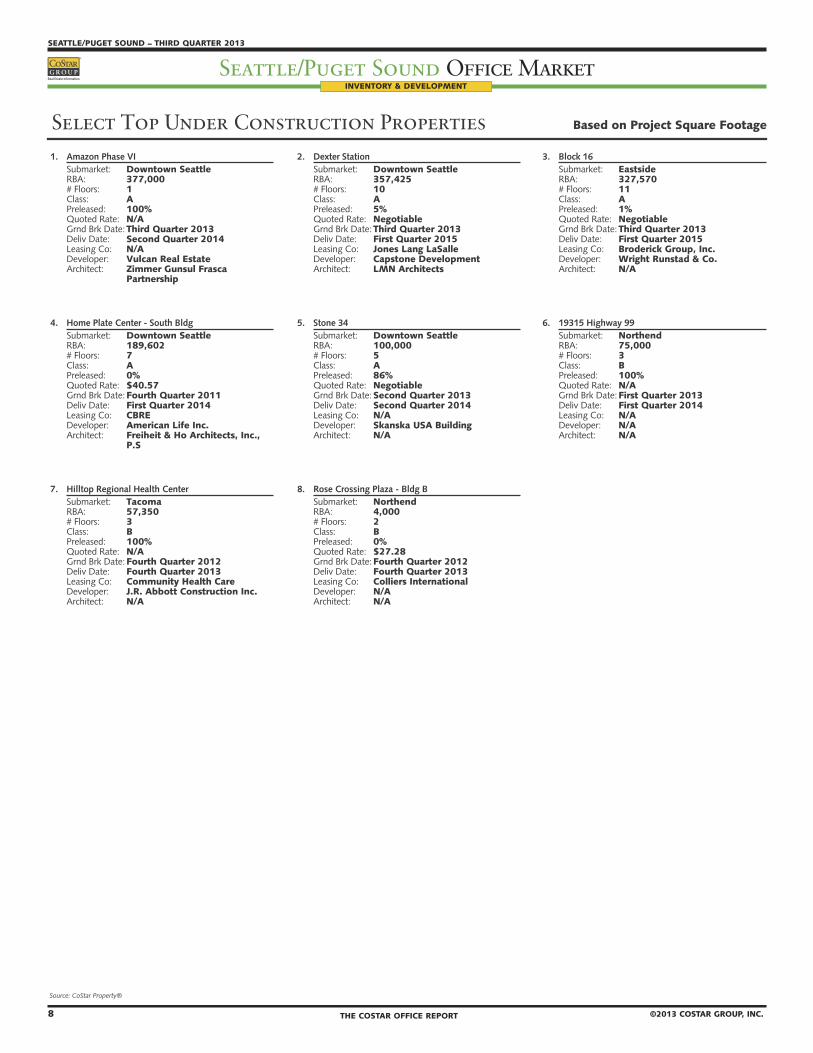
There were 1,487,947 square feet of office space under con-struction at the end of the third quarter 2013.
Some of the notable 2013 deliveries include: Boeing Everett Delivery Center, a 180,000-square-foot facility that delivered in second quarter 2013 and is now 100% occupied, and UW Medicine Research, a 173,899-square-foot building that delivered in second quarter 2013 and is now 100% occupied.
The largest projects underway at the end of third quarter 2013 were Amazon Phase VI, a 377,000-square-foot building with 100% of its space pre-leased, and Dexter Station, a 357,425-square-foot facility that is 5% pre-leased.
InventoryTotal office inventory in the Seattle/Puget Sound market
area amounted to 184,010,481 square feet in 7,562 buildings as of the end of the third quarter 2013. The Class-A office sector consisted of 56,703,374 square feet in 256 projects. There were 2,965 Class-B buildings totaling 97,026,294 square feet, and the Class-C sector consisted of 30,280,813 square feet in 4,341 build-ings. Within the Office market there were 411 owner-occupied buildings accounting for 26,048,025 square feet of office space.
Sales ActivityTallying office building sales of 15,000 square feet or larger,
Seattle/Puget Sound office sales figures rose during the second
quarter 2013 in terms of dollar volume compared to the first quarter of 2013.
In the second quarter, 12 office transactions closed with a total volume of $611,990,000. The 12 buildings totaled 1,738,548 square feet and the average price per square foot equated to $352.01 per square foot. That compares to 16 trans-actions totaling $592,574,436 in the first quarter 2013. The total square footage in the first quarter was 2,284,782 square feet for an average price per square foot of $259.36.
Total office building sales activity in 2013 was down com-pared to 2012. In the first six months of 2013, the market saw 28 office sales transactions with a total volume of $1,204,564,436. The price per square foot averaged $299.39. In the same first six months of 2012, the market posted 33 transactions with a total volume of $1,528,902,261. The price per square foot averaged $305.63.
Cap rates have been lower in 2013, averaging 5.99% com-pared to the same period in 2012 when they averaged 6.37%.
One of the largest transactions that has occurred within the last four quarters in the Seattle/Puget Sound market is the sale of the Amazon Corporate Offices in Seattle. The 1,859,838-square-foot South Lake Union office campus sold on 12/21/2012 for $1,154,269,079 or $620.63 per square foot.
Reports compiled by: Research Manager, Colin Maly and Researcher, Drew Peters.
Vacancy Rates by Class 2000-2013
Source: CoStar Property®
Absorption & Deliveries U.S. Vacancy ComparisonPast 9 Quarters Past 9 Quarters
Source: CoStar Property• Source: CoStar Property•
0%
2%
4%
6%
8%
10%
12%
14%
16%
18%
20%
20001q
20003q
20011q
20013q
20021q
20023q
20031q
20033q
20041q
20043q
20051q
20053q
20061q
20063q
20071q
20073q
20081q
20083q
20091q
20093q
20101q
20103q
20111q
20113q
20121q
20123q
20131q
20133q
Vac
ancy
Rat
e
A B C Total Market
0.32
0.74
0.19
1.21
0.12
1.05
0.52
0.40
0.62
0.190.15
0.01
0.170.23
0.62
0.13
0.57
0.22
0.0
0.2
0.4
0.6
0.8
1.0
1.2
1.4
20113q
20114q
20121q
20122q
20123q
20124q
20131q
20132q
20133q
Millio
ns
SF
Net Absorption Deliveries
0.0%
2.0%
4.0%
6.0%
8.0%
10.0%
12.0%
14.0%
20113q
20114q
20121q
20122q
20123q
20124q
20131q
20132q
20133q
Vac
ancy
Rat
e
Seattle/Puget Sound United States

4 THE COSTAR OFFICE REPORT ©2013 COSTAR GROUP, INC.
SEATTLE/PUGET SOUND – THIRD QUARTER 2013
Seattle/Puget Sound Office MarketTHIRD QUARTER 2013 – SEATTLE/PUGET SOUND
Seattle/Puget Sound Office Market
©2013 COSTAR GROUP, INC. THE COSTAR OFFICE REPORT 5
CoStar Submarket Clusters & Submarkets
In analyzing metropolitan areas, CoStar has developed geographic designations to help group properties together, called Markets, Submarket Clusters and Submarkets. Markets are the equivalent of metropolitan areas, or areas containing a large population nucleus, that together with adjacent communities have a high degree of economic and social integration. Markets are then divided into Submarket Clusters, which are core areas within a metropolitan area that are known to be competitive with each other in terms of attracting and keeping tenants. Markets are then further subdivided into smaller units called Submarkets, which serve to delineate a core group of buildings that are competitive with each other and constitute a generally accepted competitive set, or peer group.
MARKETS
Submarket Clusters Submarkets
Downtown Seattle Ballard/U Dist Belltown/Denny Regrade Capitol Hill/Central Dist Lake UnionPioneer Sq/Waterfront Queen Anne/Magnolia S Seattle Seattle CBD*
Eastside 520 Corridor Bellevue CBD* Coal Creek/Issaquah E King CountyI-90 Corridor Kirkland Mercer Island RedmondSuburban Bellevue
Northend Bothell/Kenmore Edmonds/Lynnwood Everett CBD* Mill Creek/WoodinvilleN Snohomish County Northgate/N Seattle S Everett/Harbor Point S Snohomish County
Southend Federal Way/Auburn Kent Valley Renton/Tukwila Seatac/Burien
Tacoma Dupont E Pierce County Fort Lewis Gig Harbor/W Pierce CoPuyallup Spanaway Tacoma CBD* Tacoma SuburbanUniv. Place/Lakewood
* Submarkets comprising the CBD. For statistics reference the CBD vs Suburban Figures at a Glance Page.

4 THE COSTAR OFFICE REPORT ©2013 COSTAR GROUP, INC.
SEATTLE/PUGET SOUND – THIRD QUARTER 2013
Seattle/Puget Sound Office MarketTHIRD QUARTER 2013 – SEATTLE/PUGET SOUND
Seattle/Puget Sound Office Market
©2013 COSTAR GROUP, INC. THE COSTAR OFFICE REPORT 5
Historical Deliveries 1982 - 2013
Source: CoStar Property® * Future deliveries based on current under construction buildings.
Construction Activity Markets Ranked by Under Construction Square Footage
# Bldgs Preleased SF Preleased % All Existing U/C
Downtown Seattle 4 480,871 47.0% 43,843 256,007
Eastside 1 3,276 1.0% 33,899 327,570
Northend 2 75,000 94.9% 14,194 39,500
Tacoma 1 57,350 100.0% 10,594 57,350
Southend 0 0 0.0% 19,149 0
Totals 8 616,497 41.4% 24,334 185,993
Source: CoStar Property®
Recent Deliveries Future Deliveries Leased & Un-Leased SF in Deliveries Since 2009 Preleased & Un-Leased SF in Properties Scheduled to Deliver
Source: CoStar Property® Source: CoStar Property®
1,024,027
1,487,947
327,570
79,000
57,350
0
Market
Under Construction Inventory Average Bldg Size
Total RBA
3.3
4.8
4.0
5.0
7.8
4.1
6.5
4.44.9
2.3
1.72.3
1.4
2.9
1.82.3
3.4
5.2
8.8
5.6
4.6
0.91.4
1.8 2.0
2.8
4.6
5.2
2.2 2.2
1.0 1.0
0.0
1.0
2.0
3.0
4.0
5.0
6.0
7.0
8.0
9.0
10.0
1982 1983 1984 1985 1986 1987 1988 1989 1990 1991 1992 1993 1994 1995 1996 1997 1998 1999 2000 2001 2002 2003 2004 2005 2006 2007 2008 2009 2010 2011 2012 2013
Millio
ns
of
SF
Deliveries Average Delivered SF
0.0
1.0
2.0
3.0
4.0
5.0
6.0
2009 2010 2011 2012 2013
Millio
ns
of
SF
Leased Un-Leased
0
100
200
300
400
500
600
700
800
2013 4q 2014 1q 2014 2q 2015 1q
T
Thousa
nds
of
SF
Preleased Un-Leased
INVENTORY & DEVELOPMENT

6 THE COSTAR OFFICE REPORT ©2013 COSTAR GROUP, INC.
SEATTLE/PUGET SOUND – THIRD QUARTER 2013
Seattle/Puget Sound Office MarketTHIRD QUARTER 2013 – SEATTLE/PUGET SOUND
Seattle/Puget Sound Office Market
©2013 COSTAR GROUP, INC. THE COSTAR OFFICE REPORT 7
Historical Construction Starts & DeliveriesSquare Footage Per Quarter Starting and Completing Construction
Source: CoStar Property®
Recent Deliveries by Project Size Breakdown of Year-to-Date Development Based on RBA of Project
Building Size # Bldgs RBA SF Leased % Leased Avg Rate Single-Tenant Multi-Tenant
< 50,000 SF 6 116,669 88,863 76.2% $27.72 0 116,669
50,000 SF - 99,999 SF 3 192,000 184,000 95.8% $36.55 0 192,000
100,000 SF - 249,999 SF 4 604,609 601,995 99.6% $0.00 353,899 250,710
250,000 SF - 499,999 SF 0 0 0 0.0% $0.00 0 0
>= 500,000 SF 0 0 0 0.0% $0.00 0 0
Source: CoStar Property®
Recent Development by Tenancy Existing Inventory ComparisonBased on RBA Developed for Single & Multi Tenant Use Based on Total RBA
2013 Deliveries
Source: CoStar Property® Source: CoStar Property®
Currently Under Construction By Class By Space Type
0.34
0.58
0.210.14
0.36
0.130.22
0.410.49
0.030.09 0.06
0.140.10
1.06
0.31
1.35
0.35
0.18
1.21
0.66
0.190.15
0.01
0.170.23
0.62
0.13
0.57
0.22
0.0
0.2
0.4
0.6
0.8
1.0
1.2
1.4
1.6
2010 1q 2010 2q 2010 3q 2010 4q 2011 1q 2011 2q 2011 3q 2011 4q 2012 1q 2012 2q 2012 3q 2012 4q 2013 1q 2013 2q 2013 3q
Millio
ns
of
SF
Construction Starts Deliveries
100%
0%
Multi Single
39%
61%
Multi Single
16%
31%53%
Class A Class B Class C
25%
75%
Multi Single
INVENTORY & DEVELOPMENT

6 THE COSTAR OFFICE REPORT ©2013 COSTAR GROUP, INC.
SEATTLE/PUGET SOUND – THIRD QUARTER 2013
Seattle/Puget Sound Office MarketTHIRD QUARTER 2013 – SEATTLE/PUGET SOUND
Seattle/Puget Sound Office Market
©2013 COSTAR GROUP, INC. THE COSTAR OFFICE REPORT 7
������������������������������ �������������������������������
������������������������
���� ����������������������������������������� ������������� ����������������� �������� ����������� ����������������� ������������������������������������������������ ������������������������������� �������������� �������������� ����
���� ������������������������������� ��������������������� ����������������� �������� ����������� ����������������� ������������������������������������������������ ������������������������������� ����������������������������� �������������� �������������������
���� ����������������������������� ��������������������� ����������������� �������� ����������� ���������������� ������������������������������������������������������� ������������������������������ ������������������������� ��������������������������
�������������������� ���������������������
���� �������������������������������������� ����������� ����������������� �������� ����������� ����������������� ������������������������������������������������� ������������������������������� ����������������������������������� �������������� ����
���� ���������������������� ��������������������� ���������������� �������� ����������� ����������������� ������������������������������������������������� ������������������������������ ������������������������������������� ����������������������������� ����
���� ������������������������������ ��������������������� ���������������� �������� ����������� ����������������� ������������������������������������������������ ������������������������������ ��������������������������������� �������������� ����
���� ������������������������� ��������������������� ���������������� �������� ����������� ���������������� ��������������������������������������������������� ������������������������������ ����������������������������������� ����������������������������������� ������������������������
���� ������������������������ ��������������������� ���������������� �������� ����������� ���������������� ������������������������������������������������������� ������������������������������� ���������������������� �������������� ����
���� ������������������������������� ������������� ���������������� �������� ����������� ���������������� ��������������������������������������������������� ������������������������������� ������������������������� �������������� ����
�������������������������� ������������� ���������������� �������� ����������� ����������������� ��������������������������������������������������� ������������������������������� ����������������������������� �������������� ����
������������������������������� ��������������������� ���������������� �������� ����������� ���������������� ���������������������������������������������������� ������������������������������ ����������������������������� �������������� ����
����������������������������� ������������� ��������������� �������� ����������� ����������������� ������������������������������������������������� ������������������������������ ������������������������������ �������������� ����
�������������������������������� ����������� ��������������� �������� ����������� ��������������� �������������������������������������������������������� ������������������������������ �������������� �������������� ����
INVENTORY & DEVELOPMENT
8 THE COSTAR OFFICE REPORT ©2013 COSTAR GROUP, INC.
SEATTLE/PUGET SOUND – THIRD QUARTER 2013
Seattle/Puget Sound Office MarketTHIRD QUARTER 2013 – SEATTLE/PUGET SOUND
Seattle/Puget Sound Office Market
©2013 COSTAR GROUP, INC. THE COSTAR OFFICE REPORT 9
INVENTORY & DEVELOPMENT
���������������������������������������� �������������������������������
������������������������
���� �������������������������� ��������������������� ����������������� �������� ������������ ����������������� ������������������������������������������������ ������������������������������� �������������� ����������������������������� ���������������������
������������
���� ������������������������� ��������������������� ����������������� ��������� ������������ ��������������� ������������������������������������������������������� ������������������������������ ����������������������������� ������������������������������� ���������������
���� ������������������� ������������� ����������������� ��������� ������������ ��������������� ������������������������������������������������������� ������������������������������ �������������������������������� ������������������������������� ����
���� ����������������������������������������� ��������������������� ����������������� �������� ������������ ��������������� ���������������������������������������������������� ������������������������������ ��������������� ����������������������������� ��������������������������������
����
���� ������������������� ��������������������� ����������������� �������� ������������ ���������������� �������������������������������������������������������� ������������������������������� �������������� ������������������������������� ����
���� ��������������������������� ������������� ���������������� �������� ������������ ����������������� ������������������������������������������������ ������������������������������ �������������� �������������� ����
���� ����������������������������������������� ����������� ���������������� �������� ������������ ����������������� ������������������������������������������������� ������������������������������� �������������������������������� ���������������������������������������� ����
���� ��������������������������������������� ������������� ��������������� �������� ������������ ��������������� ���������������������������������������������������� ������������������������������� ��������������������������������� �������������� ����

8 THE COSTAR OFFICE REPORT ©2013 COSTAR GROUP, INC.
SEATTLE/PUGET SOUND – THIRD QUARTER 2013
Seattle/Puget Sound Office MarketTHIRD QUARTER 2013 – SEATTLE/PUGET SOUND
Seattle/Puget Sound Office Market
©2013 COSTAR GROUP, INC. THE COSTAR OFFICE REPORT 9
Class A Market Statistics Third Quarter 2013
YTD Net YTD Under Quoted
Market # Blds Total RBA Direct SF Total SF Vac % Absorption Deliveries Const SF Rates
Downtown Seattle 114 34,144,001 4,207,433 4,444,656 13.0% 939,705 480,492 1,024,027 $32.73
Eastside 107 18,013,324 1,335,089 1,437,328 8.0% 23,027 0 327,570 $33.46
Northend 17 1,917,529 215,951 223,420 11.7% 167,913 180,000 0 $26.00
Southend 8 1,164,414 169,128 169,128 14.5% 17,354 0 0 $25.39
Tacoma 10 1,464,106 118,358 337,258 23.0% 120,293 120,000 0 $28.53
Totals 256 56,703,374 6,045,959 6,611,790 11.7% 1,268,292 780,492 1,351,597 $32.54
Source: CoStar Property®
Class B Market Statistics Third Quarter 2013
YTD Net YTD Under Quoted
Market # Blds Total RBA Direct SF Total SF Vac % Absorption Deliveries Const SF Rates
Downtown Seattle 583 30,417,056 2,784,287 2,837,989 9.3% 62,234 83,000 0 $27.55
Eastside 747 26,029,923 2,358,710 2,457,652 9.4% 6,236 18,414 0 $27.01
Northend 578 14,128,237 1,608,344 1,652,851 11.7% 3,908 28,000 79,000 $22.83
Southend 432 14,796,326 1,962,476 1,979,922 13.4% 93,047 0 0 $20.13
Tacoma 625 11,654,752 1,223,084 1,251,514 10.7% 33,417 3,372 57,350 $21.19
Totals 2,965 97,026,294 9,936,901 10,179,928 10.5% 198,842 132,786 136,350 $24.51
Source: CoStar Property®
Class C Market Statistics Third Quarter 2013
YTD Net YTD Under Quoted
Market # Blds Total RBA Direct SF Total SF Vac % Absorption Deliveries Const SF Rates
Downtown Seattle 1,000 9,839,908 406,731 434,331 4.4% (3,331) 0 0 $20.50
Eastside 565 4,059,805 294,926 303,126 7.5% (59,801) 0 0 $23.87
Northend 902 5,202,490 387,627 388,107 7.5% 7,770 0 0 $17.55
Southend 614 4,222,498 245,072 245,072 5.8% 45,364 0 0 $17.25
Tacoma 1,260 6,956,112 571,664 576,037 8.3% 80,597 0 0 $17.24
Totals 4,341 30,280,813 1,906,020 1,946,673 6.4% 70,599 0 0 $19.19
Source: CoStar Property®
Total Office Market Statistics Third Quarter 2013
YTD Net YTD Under Quoted
Market # Blds Total RBA Direct SF Total SF Vac % Absorption Deliveries Const SF Rates
Downtown Seattle 1,697 74,400,965 7,398,451 7,716,976 10.4% 998,608 563,492 1,024,027 $29.72
Eastside 1,419 48,103,052 3,988,725 4,198,106 8.7% (30,538) 18,414 327,570 $29.04
Northend 1,497 21,248,256 2,211,922 2,264,378 10.7% 179,591 208,000 79,000 $22.32
Southend 1,054 20,183,238 2,376,676 2,394,122 11.9% 155,765 0 0 $19.91
Tacoma 1,895 20,074,970 1,913,106 2,164,809 10.8% 234,307 123,372 57,350 $20.85
Totals 7,562 184,010,481 17,888,880 18,738,391 10.2% 1,537,733 913,278 1,487,947 $26.44
Source: CoStar Property®
Existing Inventory Vacancy
Vacancy
Existing Inventory Vacancy
Existing Inventory Vacancy
Existing Inventory
FIGURES AT A GLANCE

10 THE COSTAR OFFICE REPORT ©2013 COSTAR GROUP, INC.
SEATTLE/PUGET SOUND – THIRD QUARTER 2013
Seattle/Puget Sound Office MarketTHIRD QUARTER 2013 – SEATTLE/PUGET SOUND
Seattle/Puget Sound Office Market
©2013 COSTAR GROUP, INC. THE COSTAR OFFICE REPORT 11
FIGURES AT A GLANCE
Class A Submarket Statistics Third Quarter 2013
YTD Net YTD Under Quoted
Market # Blds Total RBA Direct SF Total SF Vac % Absorption Deliveries Const SF Rates
520 Corridor 23 3,301,625 54,042 54,042 1.6% 36,683 0 0 $26.34
Ballard/U Dist 3 211,108 17,296 17,296 8.2% 2,470 0 100,000 $35.37
Bellevue CBD 25 7,521,418 500,263 513,157 6.8% 27,512 0 0 $36.11
Belltown/Denny Regrade 13 2,782,267 366,153 368,528 13.2% 103,144 77,000 0 $26.84
Bothell/Kenmore 4 346,297 15,016 15,016 4.3% (15,016) 0 0 $0.00
Capitol Hill/Central Dist 3 307,648 47,540 52,740 17.1% 34,781 50,000 0 $36.20
Coal Creek/Issaquah 6 917,381 0 30,000 3.3% 0 0 0 $30.36
Dupont 1 48,000 3,400 3,400 7.1% 0 0 0 $0.00
E King County 0 0 0 0 0.0% 0 0 0 $0.00
E Pierce County 0 0 0 0 0.0% 0 0 0 $0.00
Edmonds/Lynnwood 8 833,356 184,305 191,774 23.0% 10,436 0 0 $26.00
Everett CBD 1 88,000 0 0 0.0% 0 0 0 $0.00
Federal Way/Auburn 1 88,000 6,500 6,500 7.4% 8,500 0 0 $33.33
Fort Lewis 0 0 0 0 0.0% 0 0 0 $0.00
Gig Harbor/W Pierce Co 1 85,903 28,051 28,051 32.7% 722 0 0 $32.63
I-90 Corridor 19 2,727,659 416,361 416,361 15.3% (89,192) 0 0 $30.16
Kent Valley 1 57,768 0 0 0.0% 0 0 0 $0.00
Kirkland 12 1,028,841 50,622 61,798 6.0% 23,158 0 0 $34.88
Lake Union 27 5,590,068 198,952 198,952 3.6% 258,315 304,609 734,425 $33.69
Mercer Island 1 105,796 21,266 21,266 20.1% 1,088 0 0 $34.44
Mill Creek/Woodinville 0 0 0 0 0.0% 0 0 0 $0.00
N Snohomish County 0 0 0 0 0.0% 0 0 0 $0.00
Northgate/N Seattle 2 205,361 16,630 16,630 8.1% (7,507) 0 0 $26.00
Pioneer Sq/Waterfront 9 1,793,709 102,277 105,231 5.9% 225,039 0 0 $31.56
Puyallup 1 83,268 17,720 17,720 21.3% 0 0 0 $42.50
Queen Anne/Magnolia 12 1,797,208 366,345 373,060 20.8% 36,543 48,883 0 $33.70
Redmond 19 2,176,604 119,109 167,278 7.7% (20,336) 0 0 $29.48
Renton/Tukwila 4 590,992 0 0 0.0% 0 0 0 $0.00
S Everett/Harbor Point 2 444,515 0 0 0.0% 180,000 180,000 0 $0.00
S Seattle 5 959,872 371,393 371,393 38.7% 85,899 0 189,602 $37.07
S Snohomish County 0 0 0 0 0.0% 0 0 0 $0.00
Seatac/Burien 2 427,654 162,628 162,628 38.0% 8,854 0 0 $24.43
Seattle CBD 42 20,702,121 2,737,477 2,957,456 14.3% 193,514 0 0 $32.68
Spanaway 0 0 0 0 0.0% 0 0 0 $0.00
Suburban Bellevue 2 234,000 173,426 173,426 74.1% 44,114 0 327,570 $45.54
Tacoma CBD 6 1,204,935 62,897 281,797 23.4% 125,861 120,000 0 $26.03
Tacoma Suburban 0 0 0 0 0.0% 0 0 0 $0.00
Univ. Place/Lakewood 1 42,000 6,290 6,290 15.0% (6,290) 0 0 $33.37
Totals 256 56,703,374 6,045,959 6,611,790 11.7% 1,268,292 780,492 1,351,597 $32.54
Source: CoStar Property®
Existing Inventory Vacancy

10 THE COSTAR OFFICE REPORT ©2013 COSTAR GROUP, INC.
SEATTLE/PUGET SOUND – THIRD QUARTER 2013
Seattle/Puget Sound Office MarketTHIRD QUARTER 2013 – SEATTLE/PUGET SOUND
Seattle/Puget Sound Office Market
©2013 COSTAR GROUP, INC. THE COSTAR OFFICE REPORT 11
FIGURES AT A GLANCE
Class B Submarket Statistics Third Quarter 2013
YTD Net YTD Under Quoted
Market # Blds Total RBA Direct SF Total SF Vac % Absorption Deliveries Const SF Rates
520 Corridor 101 5,155,380 187,813 196,715 3.8% 9,856 0 0 $24.25
Ballard/U Dist 108 3,479,900 80,291 80,291 2.3% 77,882 18,000 0 $24.29
Bellevue CBD 30 1,407,305 231,691 231,691 16.5% (6,170) 0 0 $31.19
Belltown/Denny Regrade 43 2,910,726 296,187 307,383 10.6% 83,052 0 0 $26.74
Bothell/Kenmore 95 4,373,890 577,021 620,794 14.2% 34,299 0 4,000 $24.60
Capitol Hill/Central Dist 85 4,016,892 300,942 306,576 7.6% (25,387) 0 0 $38.70
Coal Creek/Issaquah 58 1,372,284 107,355 109,591 8.0% 25,854 0 0 $30.77
Dupont 6 1,065,501 1,280 1,280 0.1% 0 0 0 $0.00
E King County 65 905,434 118,453 118,453 13.1% (27,089) 0 0 $23.46
E Pierce County 30 384,280 56,534 58,534 15.2% 5,122 0 0 $21.87
Edmonds/Lynnwood 137 2,894,930 317,693 318,427 11.0% 77,830 4,000 75,000 $21.35
Everett CBD 83 1,963,296 272,591 272,591 13.9% (134,707) 0 0 $20.91
Federal Way/Auburn 134 3,583,032 743,880 749,845 20.9% 173,499 0 0 $18.67
Fort Lewis 1 1,800 0 0 0.0% 0 0 0 $0.00
Gig Harbor/W Pierce Co 73 1,088,747 152,697 154,449 14.2% (23,752) 3,372 0 $21.81
I-90 Corridor 44 3,190,534 424,731 484,755 15.2% (200,089) 0 0 $28.77
Kent Valley 69 2,239,107 430,873 441,188 19.7% (70,011) 0 0 $21.72
Kirkland 137 3,570,277 403,954 416,149 11.7% 55,732 0 0 $26.08
Lake Union 89 5,418,920 372,411 398,170 7.3% 52,600 0 0 $27.33
Mercer Island 16 398,295 4,115 5,162 1.3% 2,667 0 0 $28.69
Mill Creek/Woodinville 43 808,955 85,869 85,869 10.6% 18,713 24,000 0 $26.83
N Snohomish County 62 600,417 69,061 69,061 11.5% 8,393 0 0 $16.49
Northgate/N Seattle 56 1,343,714 137,334 137,334 10.2% (12,351) 0 0 $23.45
Pioneer Sq/Waterfront 56 3,532,840 493,252 493,252 14.0% (54,354) 0 0 $25.42
Puyallup 60 1,149,915 320,877 320,877 27.9% (2,693) 0 0 $23.20
Queen Anne/Magnolia 65 2,647,818 210,681 210,681 8.0% 25,689 65,000 0 $22.50
Redmond 99 4,992,350 364,044 364,044 7.3% 94,756 0 0 $23.40
Renton/Tukwila 169 7,685,265 639,137 640,303 8.3% (32,587) 0 0 $21.22
S Everett/Harbor Point 81 1,887,662 130,611 130,611 6.9% 5,605 0 0 $23.39
S Seattle 83 2,439,894 274,811 274,811 11.3% 11,641 0 0 $23.48
S Snohomish County 21 255,373 18,164 18,164 7.1% 6,126 0 0 $22.40
Seatac/Burien 60 1,288,922 148,586 148,586 11.5% 22,146 0 0 $19.42
Seattle CBD 54 5,970,066 755,712 766,825 12.8% (108,889) 0 0 $28.84
Spanaway 56 593,152 85,344 85,344 14.4% 22,014 0 0 $19.66
Suburban Bellevue 197 5,038,064 516,554 531,092 10.5% 50,719 18,414 0 $27.12
Tacoma CBD 85 3,076,712 305,676 330,354 10.7% (15,925) 0 57,350 $20.65
Tacoma Suburban 225 3,189,587 216,828 216,828 6.8% 42,202 0 0 $20.14
Univ. Place/Lakewood 89 1,105,058 83,848 83,848 7.6% 6,449 0 0 $21.09
Totals 2,965 97,026,294 9,936,901 10,179,928 10.5% 198,842 132,786 136,350 $24.51
Source: CoStar Property®
Existing Inventory Vacancy

12 THE COSTAR OFFICE REPORT ©2013 COSTAR GROUP, INC.
SEATTLE/PUGET SOUND – THIRD QUARTER 2013
Seattle/Puget Sound Office MarketTHIRD QUARTER 2013 – SEATTLE/PUGET SOUND
Seattle/Puget Sound Office Market
©2013 COSTAR GROUP, INC. THE COSTAR OFFICE REPORT 13
FIGURES AT A GLANCE
Class C Submarket Statistics Third Quarter 2013
YTD Net YTD Under Quoted
Market # Blds Total RBA Direct SF Total SF Vac % Absorption Deliveries Const SF Rates
520 Corridor 18 293,006 37,155 37,155 12.7% (5,089) 0 0 $19.42
Ballard/U Dist 311 1,454,447 26,986 26,986 1.9% 1,601 0 0 $21.74
Bellevue CBD 32 289,806 16,714 16,714 5.8% (4,969) 0 0 $26.75
Belltown/Denny Regrade 54 747,279 47,647 47,647 6.4% (7,298) 0 0 $20.33
Bothell/Kenmore 100 387,350 16,756 16,756 4.3% (4,143) 0 0 $21.26
Capitol Hill/Central Dist 138 1,749,329 36,753 43,528 2.5% (30,700) 0 0 $24.74
Coal Creek/Issaquah 39 193,095 7,518 7,518 3.9% 3,632 0 0 $25.49
Dupont 0 0 0 0 0.0% 0 0 0 $0.00
E King County 87 412,569 20,277 20,277 4.9% (6,025) 0 0 $19.68
E Pierce County 42 123,917 7,400 7,400 6.0% (42) 0 0 $17.95
Edmonds/Lynnwood 174 1,132,490 88,517 88,517 7.8% 1,508 0 0 $19.10
Everett CBD 242 1,568,967 151,594 151,594 9.7% (7,507) 0 0 $16.80
Federal Way/Auburn 203 1,709,948 62,506 62,506 3.7% (9,380) 0 0 $18.30
Fort Lewis 8 28,094 0 0 0.0% 0 0 0 $0.00
Gig Harbor/W Pierce Co 86 451,291 41,779 41,779 9.3% 10,324 0 0 $17.86
I-90 Corridor 19 189,555 11,590 11,590 6.1% (3,488) 0 0 $19.43
Kent Valley 125 742,273 45,762 45,762 6.2% 39,559 0 0 $15.21
Kirkland 98 627,703 34,281 34,281 5.5% 4,549 0 0 $26.11
Lake Union 98 897,304 35,622 36,522 4.1% 39,462 0 0 $16.50
Mercer Island 18 144,566 25,271 25,271 17.5% 2,144 0 0 $24.58
Mill Creek/Woodinville 41 211,031 24,061 24,061 11.4% 5,162 0 0 $19.45
N Snohomish County 113 490,156 33,460 33,460 6.8% 5,411 0 0 $14.56
Northgate/N Seattle 121 723,410 35,602 35,602 4.9% (1,704) 0 0 $18.60
Pioneer Sq/Waterfront 46 1,141,615 69,209 75,367 6.6% (28,135) 0 0 $20.44
Puyallup 137 543,748 21,865 21,865 4.0% 4,277 0 0 $20.60
Queen Anne/Magnolia 127 1,072,435 99,757 108,048 10.1% 12,021 0 0 $21.77
Redmond 70 345,745 43,941 43,941 12.7% (8,155) 0 0 $26.46
Renton/Tukwila 145 995,468 77,052 77,052 7.7% 16,113 0 0 $20.84
S Everett/Harbor Point 76 484,663 28,606 28,606 5.9% 4,460 0 0 $14.62
S Seattle 207 1,962,816 75,716 81,192 4.1% 5,973 0 0 $16.83
S Snohomish County 35 204,423 9,031 9,511 4.7% 4,583 0 0 $14.87
Seatac/Burien 141 774,809 59,752 59,752 7.7% (928) 0 0 $14.65
Seattle CBD 19 814,683 15,041 15,041 1.8% 3,745 0 0 $24.06
Spanaway 138 519,540 25,412 27,690 5.3% (2,182) 0 0 $18.18
Suburban Bellevue 184 1,563,760 98,179 106,379 6.8% (42,400) 0 0 $23.98
Tacoma CBD 164 1,894,256 198,191 198,191 10.5% 27,990 0 0 $16.24
Tacoma Suburban 486 2,313,632 169,325 169,325 7.3% 44,174 0 0 $16.30
Univ. Place/Lakewood 199 1,081,634 107,692 109,787 10.2% (3,944) 0 0 $18.17
Totals 4,341 30,280,813 1,906,020 1,946,673 6.4% 70,599 0 0 $19.19
Source: CoStar Property®
Existing Inventory Vacancy

12 THE COSTAR OFFICE REPORT ©2013 COSTAR GROUP, INC.
SEATTLE/PUGET SOUND – THIRD QUARTER 2013
Seattle/Puget Sound Office MarketTHIRD QUARTER 2013 – SEATTLE/PUGET SOUND
Seattle/Puget Sound Office Market
©2013 COSTAR GROUP, INC. THE COSTAR OFFICE REPORT 13
FIGURES AT A GLANCE
Total Office Submarket Statistics Third Quarter 2013
YTD Net YTD Under Quoted
Market # Blds Total RBA Direct SF Total SF Vac % Absorption Deliveries Const SF Rates
520 Corridor 142 8,750,011 279,010 287,912 3.3% 41,450 0 0 $24.29
Ballard/U Dist 422 5,145,455 124,573 124,573 2.4% 81,953 18,000 100,000 $24.72
Bellevue CBD 87 9,218,529 748,668 761,562 8.3% 16,373 0 0 $34.44
Belltown/Denny Regrade 110 6,440,272 709,987 723,558 11.2% 178,898 77,000 0 $26.36
Bothell/Kenmore 199 5,107,537 608,793 652,566 12.8% 15,140 0 4,000 $24.51
Capitol Hill/Central Dist 226 6,073,869 385,235 402,844 6.6% (21,306) 50,000 0 $36.25
Coal Creek/Issaquah 103 2,482,760 114,873 147,109 5.9% 29,486 0 0 $30.46
Dupont 7 1,113,501 4,680 4,680 0.4% 0 0 0 $0.00
E King County 152 1,318,003 138,730 138,730 10.5% (33,114) 0 0 $22.97
E Pierce County 72 508,197 63,934 65,934 13.0% 5,080 0 0 $21.20
Edmonds/Lynnwood 319 4,860,776 590,515 598,718 12.3% 89,774 4,000 75,000 $22.40
Everett CBD 326 3,620,263 424,185 424,185 11.7% (142,214) 0 0 $19.65
Federal Way/Auburn 338 5,380,980 812,886 818,851 15.2% 172,619 0 0 $18.73
Fort Lewis 9 29,894 0 0 0.0% 0 0 0 $0.00
Gig Harbor/W Pierce Co 160 1,625,941 222,527 224,279 13.8% (12,706) 3,372 0 $22.35
I-90 Corridor 82 6,107,748 852,682 912,706 14.9% (292,769) 0 0 $29.29
Kent Valley 195 3,039,148 476,635 486,950 16.0% (30,452) 0 0 $20.28
Kirkland 247 5,226,821 488,857 512,228 9.8% 83,439 0 0 $27.95
Lake Union 214 11,906,292 606,985 633,644 5.3% 350,377 304,609 734,425 $28.27
Mercer Island 35 648,657 50,652 51,699 8.0% 5,899 0 0 $29.27
Mill Creek/Woodinville 84 1,019,986 109,930 109,930 10.8% 23,875 24,000 0 $25.37
N Snohomish County 175 1,090,573 102,521 102,521 9.4% 13,804 0 0 $16.09
Northgate/N Seattle 179 2,272,485 189,566 189,566 8.3% (21,562) 0 0 $22.55
Pioneer Sq/Waterfront 111 6,468,164 664,738 673,850 10.4% 142,550 0 0 $26.15
Puyallup 198 1,776,931 360,462 360,462 20.3% 1,584 0 0 $23.86
Queen Anne/Magnolia 204 5,517,461 676,783 691,789 12.5% 74,253 113,883 0 $27.16
Redmond 188 7,514,699 527,094 575,263 7.7% 66,265 0 0 $25.37
Renton/Tukwila 318 9,271,725 716,189 717,355 7.7% (16,474) 0 0 $21.18
S Everett/Harbor Point 159 2,816,840 159,217 159,217 5.7% 190,065 180,000 0 $22.27
S Seattle 295 5,362,582 721,920 727,396 13.6% 103,513 0 189,602 $28.03
S Snohomish County 56 459,796 27,195 27,675 6.0% 10,709 0 0 $20.68
Seatac/Burien 203 2,491,385 370,966 370,966 14.9% 30,072 0 0 $19.53
Seattle CBD 115 27,486,870 3,508,230 3,739,322 13.6% 88,370 0 0 $31.67
Spanaway 194 1,112,692 110,756 113,034 10.2% 19,832 0 0 $19.14
Suburban Bellevue 383 6,835,824 788,159 810,897 11.9% 52,433 18,414 327,570 $29.24
Tacoma CBD 255 6,175,903 566,764 810,342 13.1% 137,926 120,000 57,350 $20.95
Tacoma Suburban 711 5,503,219 386,153 386,153 7.0% 86,376 0 0 $18.80
Univ. Place/Lakewood 289 2,228,692 197,830 199,925 9.0% (3,785) 0 0 $19.66
Totals 7,562 184,010,481 17,888,880 18,738,391 10.2% 1,537,733 913,278 1,487,947 $26.44
Source: CoStar Property®
Existing Inventory Vacancy

14 THE COSTAR OFFICE REPORT ©2013 COSTAR GROUP, INC.
SEATTLE/PUGET SOUND – THIRD QUARTER 2013
Seattle/Puget Sound Office MarketTHIRD QUARTER 2013 – SEATTLE/PUGET SOUND
Seattle/Puget Sound Office Market
©2013 COSTAR GROUP, INC. THE COSTAR OFFICE REPORT 15
FIGURES AT A GLANCE
Class A Market Statistics Third Quarter 2013
YTD Net YTD Under Quoted
Market # Blds Total RBA Direct SF Total SF Vac % Absorption Deliveries Const SF Rates
CBD 74 29,516,474 3,300,637 3,752,410 12.7% 346,887 120,000 0 $33.03
Suburban 182 27,186,900 2,745,322 2,859,380 10.5% 921,405 660,492 1,351,597 $32.01
Totals 256 56,703,374 6,045,959 6,611,790 11.7% 1,268,292 780,492 1,351,597 $32.54
Source: CoStar Property®
Class B Market Statistics Third Quarter 2013
YTD Net YTD Under Quoted
Market # Blds Total RBA Direct SF Total SF Vac % Absorption Deliveries Const SF Rates
CBD 252 12,417,379 1,565,670 1,601,461 12.9% (265,691) 0 57,350 $25.95
Suburban 2,713 84,608,915 8,371,231 8,578,467 10.1% 464,533 132,786 79,000 $24.26
Totals 2,965 97,026,294 9,936,901 10,179,928 10.5% 198,842 132,786 136,350 $24.51
Source: CoStar Property®
Class C Market Statistics Third Quarter 2013
YTD Net YTD Under Quoted
Market # Blds Total RBA Direct SF Total SF Vac % Absorption Deliveries Const SF Rates
CBD 457 4,567,712 381,540 381,540 8.4% 19,259 0 0 $17.92
Suburban 3,884 25,713,101 1,524,480 1,565,133 6.1% 51,340 0 0 $19.40
Totals 4,341 30,280,813 1,906,020 1,946,673 6.4% 70,599 0 0 $19.19
Source: CoStar Property®
Class A & B Market Statistics Third Quarter 2013
YTD Net YTD Under Quoted
Market # Blds Total RBA Direct SF Total SF Vac % Absorption Deliveries Const SF Rates
CBD 326 41,933,853 4,866,307 5,353,871 12.8% 81,196 120,000 57,350 $30.52
Suburban 2,895 111,795,815 11,116,553 11,437,847 10.2% 1,385,938 793,278 1,430,597 $26.03
Totals 3,221 153,729,668 15,982,860 16,791,718 10.9% 1,467,134 913,278 1,487,947 $27.27
Source: CoStar Property®
Total Office Market Statistics Third Quarter 2013
YTD Net YTD Under Quoted
Market # Blds Total RBA Direct SF Total SF Vac % Absorption Deliveries Const SF Rates
CBD 783 46,501,565 5,247,847 5,735,411 12.3% 100,455 120,000 57,350 $29.82
Suburban 6,779 137,508,916 12,641,033 13,002,980 9.5% 1,437,278 793,278 1,430,597 $25.23
Totals 7,562 184,010,481 17,888,880 18,738,391 10.2% 1,537,733 913,278 1,487,947 $26.44
Source: CoStar Property®
Existing Inventory Vacancy
Existing Inventory Vacancy
Existing Inventory Vacancy
Existing Inventory Vacancy
Existing Inventory Vacancy
14 THE COSTAR OFFICE REPORT ©2013 COSTAR GROUP, INC.
SEATTLE/PUGET SOUND – THIRD QUARTER 2013
Seattle/Puget Sound Office MarketTHIRD QUARTER 2013 – SEATTLE/PUGET SOUND
Seattle/Puget Sound Office Market
©2013 COSTAR GROUP, INC. THE COSTAR OFFICE REPORT 15
FIGURES AT A GLANCE
Class A Market Statistics Third Quarter 2013
Net Quoted
Period # Blds Total RBA Direct SF Total SF Vac % Absorption # Blds Total RBA # Blds Total RBA Rates
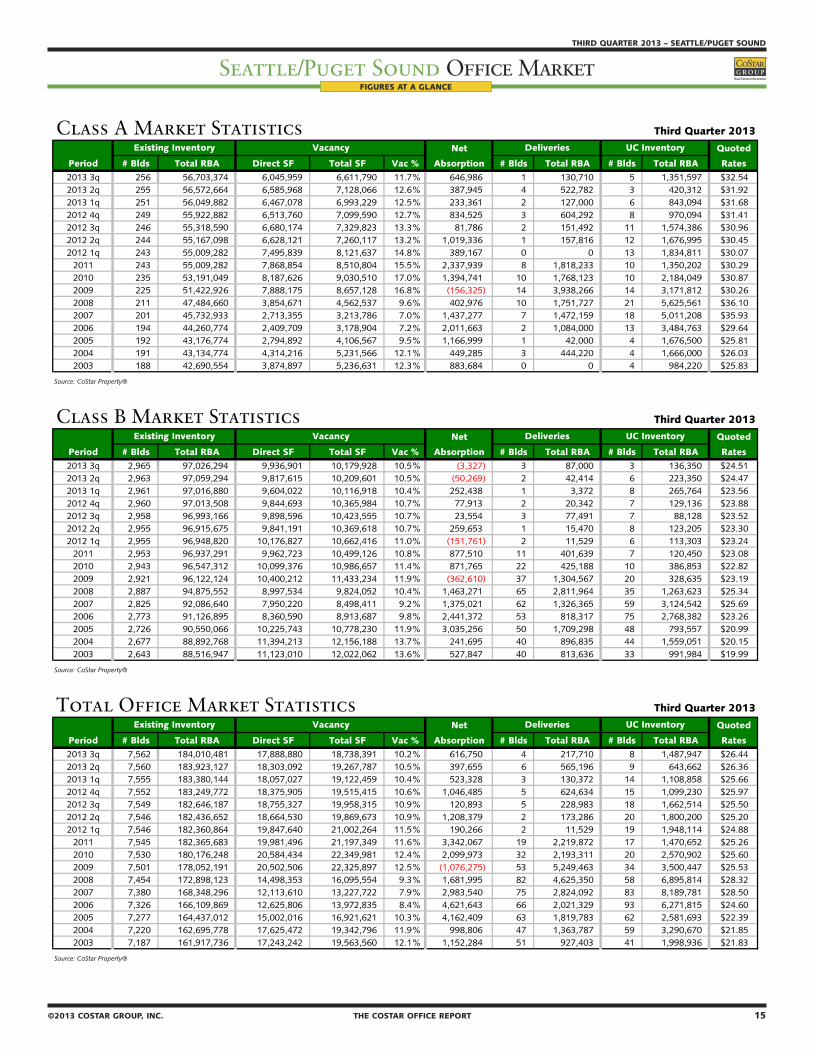
2013 3q 256 56,703,374 6,045,959 6,611,790 11.7% 646,986 1 130,710 5 1,351,597 $32.54 2013 2q 255 56,572,664 6,585,968 7,128,066 12.6% 387,945 4 522,782 3 420,312 $31.92 2013 1q 251 56,049,882 6,467,078 6,993,229 12.5% 233,361 2 127,000 6 843,094 $31.68 2012 4q 249 55,922,882 6,513,760 7,099,590 12.7% 834,525 3 604,292 8 970,094 $31.41 2012 3q 246 55,318,590 6,680,174 7,329,823 13.3% 81,786 2 151,492 11 1,574,386 $30.96 2012 2q 244 55,167,098 6,628,121 7,260,117 13.2% 1,019,336 1 157,816 12 1,676,995 $30.45 2012 1q 243 55,009,282 7,495,839 8,121,637 14.8% 389,167 0 0 13 1,834,811 $30.07
2011 243 55,009,282 7,868,854 8,510,804 15.5% 2,337,939 8 1,818,233 10 1,350,202 $30.29 2010 235 53,191,049 8,187,626 9,030,510 17.0% 1,394,741 10 1,768,123 10 2,184,049 $30.87 2009 225 51,422,926 7,888,175 8,657,128 16.8% (156,325) 14 3,938,266 14 3,171,812 $30.26 2008 211 47,484,660 3,854,671 4,562,537 9.6% 402,976 10 1,751,727 21 5,625,561 $36.10 2007 201 45,732,933 2,713,355 3,213,786 7.0% 1,437,277 7 1,472,159 18 5,011,208 $35.93 2006 194 44,260,774 2,409,709 3,178,904 7.2% 2,011,663 2 1,084,000 13 3,484,763 $29.64 2005 192 43,176,774 2,794,892 4,106,567 9.5% 1,166,999 1 42,000 4 1,676,500 $25.81 2004 191 43,134,774 4,314,216 5,231,566 12.1% 449,285 3 444,220 4 1,666,000 $26.03 2003 188 42,690,554 3,874,897 5,236,631 12.3% 883,684 0 0 4 984,220 $25.83
Source: CoStar Property®
Class B Market Statistics Third Quarter 2013
Net Quoted
Period # Blds Total RBA Direct SF Total SF Vac % Absorption # Blds Total RBA # Blds Total RBA Rates
2013 3q 2,965 97,026,294 9,936,901 10,179,928 10.5% (3,327) 3 87,000 3 136,350 $24.51 2013 2q 2,963 97,059,294 9,817,615 10,209,601 10.5% (50,269) 2 42,414 6 223,350 $24.47 2013 1q 2,961 97,016,880 9,604,022 10,116,918 10.4% 252,438 1 3,372 8 265,764 $23.56 2012 4q 2,960 97,013,508 9,844,693 10,365,984 10.7% 77,913 2 20,342 7 129,136 $23.88 2012 3q 2,958 96,993,166 9,898,596 10,423,555 10.7% 23,554 3 77,491 7 88,128 $23.52 2012 2q 2,955 96,915,675 9,841,191 10,369,618 10.7% 259,653 1 15,470 8 123,205 $23.30 2012 1q 2,955 96,948,820 10,176,827 10,662,416 11.0% (151,761) 2 11,529 6 113,303 $23.24
2011 2,953 96,937,291 9,962,723 10,499,126 10.8% 877,510 11 401,639 7 120,450 $23.08 2010 2,943 96,547,312 10,099,376 10,986,657 11.4% 871,765 22 425,188 10 386,853 $22.82 2009 2,921 96,122,124 10,400,212 11,433,234 11.9% (362,610) 37 1,304,567 20 328,635 $23.19 2008 2,887 94,875,552 8,997,534 9,824,052 10.4% 1,463,271 65 2,811,964 35 1,263,623 $25.34 2007 2,825 92,086,640 7,950,220 8,498,411 9.2% 1,375,021 62 1,326,365 59 3,124,542 $25.69 2006 2,773 91,126,895 8,360,590 8,913,687 9.8% 2,441,372 53 818,317 75 2,768,382 $23.26 2005 2,726 90,550,066 10,225,743 10,778,230 11.9% 3,035,256 50 1,709,298 48 793,557 $20.99 2004 2,677 88,892,768 11,394,213 12,156,188 13.7% 241,695 40 896,835 44 1,559,051 $20.15 2003 2,643 88,516,947 11,123,010 12,022,062 13.6% 527,847 40 813,636 33 991,984 $19.99
Source: CoStar Property®
Total Office Market Statistics Third Quarter 2013
Net Quoted
Period # Blds Total RBA Direct SF Total SF Vac % Absorption # Blds Total RBA # Blds Total RBA Rates
2013 3q 7,562 184,010,481 17,888,880 18,738,391 10.2% 616,750 4 217,710 8 1,487,947 $26.44 2013 2q 7,560 183,923,127 18,303,092 19,267,787 10.5% 397,655 6 565,196 9 643,662 $26.36 2013 1q 7,555 183,380,144 18,057,027 19,122,459 10.4% 523,328 3 130,372 14 1,108,858 $25.66 2012 4q 7,552 183,249,772 18,375,905 19,515,415 10.6% 1,046,485 5 624,634 15 1,099,230 $25.97 2012 3q 7,549 182,646,187 18,755,327 19,958,315 10.9% 120,893 5 228,983 18 1,662,514 $25.50 2012 2q 7,546 182,436,652 18,664,530 19,869,673 10.9% 1,208,379 2 173,286 20 1,800,200 $25.20 2012 1q 7,546 182,360,864 19,847,640 21,002,264 11.5% 190,266 2 11,529 19 1,948,114 $24.88
2011 7,545 182,365,683 19,981,496 21,197,349 11.6% 3,342,067 19 2,219,872 17 1,470,652 $25.26 2010 7,530 180,176,248 20,584,434 22,349,981 12.4% 2,099,973 32 2,193,311 20 2,570,902 $25.60 2009 7,501 178,052,191 20,502,506 22,325,897 12.5% (1,076,275) 53 5,249,463 34 3,500,447 $25.53 2008 7,454 172,898,123 14,498,353 16,095,554 9.3% 1,681,995 82 4,625,350 58 6,895,814 $28.32 2007 7,380 168,348,296 12,113,610 13,227,722 7.9% 2,983,540 75 2,824,092 83 8,189,781 $28.50 2006 7,326 166,109,869 12,625,806 13,972,835 8.4% 4,621,643 66 2,021,329 93 6,271,815 $24.60 2005 7,277 164,437,012 15,002,016 16,921,621 10.3% 4,162,409 63 1,819,783 62 2,581,693 $22.39 2004 7,220 162,695,778 17,625,472 19,342,796 11.9% 998,806 47 1,363,787 59 3,290,670 $21.85 2003 7,187 161,917,736 17,243,242 19,563,560 12.1% 1,152,284 51 927,403 41 1,998,936 $21.83
Source: CoStar Property®
Existing Inventory Vacancy Deliveries UC Inventory
Existing Inventory Vacancy Deliveries UC Inventory
Existing Inventory Vacancy Deliveries UC Inventory

16 THE COSTAR OFFICE REPORT ©2013 COSTAR GROUP, INC.
SEATTLE/PUGET SOUND – THIRD QUARTER 2013
Seattle/Puget Sound Office MarketTHIRD QUARTER 2013 – SEATTLE/PUGET SOUND
Seattle/Puget Sound Office Market
©2013 COSTAR GROUP, INC. THE COSTAR OFFICE REPORT 17
Historical Rental RatesBased on Full-Service Equivalent Rental Rates
Source: CoStar Property®
Vacancy by Available Space Type Vacancy by ClassPercent of All Vacant Space in Direct vs. Sublet Percent of All Vacant Space by Class
Source: CoStar Property® Source: CoStar Property®
U.S. Rental Rate Comparison Future Space AvailableBased on Full-Service Equivalent Rental Rates Space Scheduled to be Available for Occupancy*
Source: CoStar Property® * Includes Under Construction Spaces Source: CoStar Property®
Seattle/Puget Sound United States Seattle/Puget Sound United States
$0.00
$5.00
$10.00
$15.00
$20.00
$25.00
$30.00
$35.00
$40.00
2000
1q
2000
3q
2001
1q
2001
3q
2002
1q
2002
3q
2003
1q
2003
3q
2004
1q
2004
3q
2005
1q
2005
3q
2006
1q
2006
3q
2007
1q
2007
3q
2008
1q
2008
3q
2009
1q
2009
3q
2010
1q
2010
3q
2011
1q
2011
3q
2012
1q
2012
3q
2013
1q
2013
3q
Dollar
s/SF/Y
ear
A B C Total Market
$0.00
$5.00
$10.00
$15.00
$20.00
$25.00
$30.00
20113q
20114q
20121q
20122q
20123q
20124q
20131q
20132q
20133q
Dollar
s/SF/Y
ear
Seattle/Puget Sound United States
95%
5%
Direct Sublet
4%
96%
Direct Sublet
35%55%
10%
Class A Class B Class C
2.07
0.36
0.110.00 0.00
0.59
0.0
0.5
1.0
1.5
2.0
2.5
2013 4q 2014 1q 2014 2q 2014 3q 2014 4q 2015 1q
Mill
ions
17%
49%34%
Class A Class B Class C
LEASING ACTIVITY

16 THE COSTAR OFFICE REPORT ©2013 COSTAR GROUP, INC.
SEATTLE/PUGET SOUND – THIRD QUARTER 2013
Seattle/Puget Sound Office MarketTHIRD QUARTER 2013 – SEATTLE/PUGET SOUND
Seattle/Puget Sound Office Market
©2013 COSTAR GROUP, INC. THE COSTAR OFFICE REPORT 17
LEASING ACTIVITY
Source: CoStar Property®
* Renewal
Building Submarket SF Qtr Tenant Name Tenant Rep Company Landlord Rep Company
1 The Russell Bldg Tacoma CBD 218,900 2nd State Farm Insurance Flinn Ferguson Corporate R.E. Neil Walter Company
2 2601 Elliott (Seattle Trade & Technology Ctr) Belltown/Denny Regrade 148,112 2nd Zulily N/A Jones Lang LaSalle
3 Metropolitan Park North Tower Seattle CBD 133,582 2nd Amazon.com, Inc. N/A Colliers International
4 Millennium Corporate Park - Bldg C Redmond 99,945 2nd Microsoft CBRE Jones Lang LaSalle
5 Sammamish Park Place Coal Creek/Issaquah 95,600 1st Costco Colliers International Washington Partners Corporate Real
6 Home Plate Center - North Bldg S Seattle 85,676 2nd RealNetworks, Inc. Kidder Mathews CBRE
7 Columbia Bank Center Tacoma CBD 73,004 2nd State Farm Flinn Ferguson Corporate R.E. Neil Walter Company
8 One Union Square* Seattle CBD 71,461 3rd Stoel Rives LLP Cushman & Wakefield of Oregon, Inc. Direct Deal
9 Columbia Center Seattle CBD 64,838 3rd U.S. Department of Health and Human Services N/A The CAC Group
10 City Center Bellevue* Bellevue CBD 54,290 1st HDR Engineering N/A N/A
11 Second & Spring Bldg Seattle CBD 51,190 3rd N/A N/A Urbis Partners
12 705 Union Station Pioneer Sq/Waterfront 49,724 1st Intel Jones Lang LaSalle CBRE
13 Overlake Medical Pavilion Suburban Bellevue 47,427 2nd Overlake Hospital N/A CBRE
14 Russell Investments Center Seattle CBD 45,166 2nd Zillow, Inc. Flinn Ferguson Corporate R.E. CBRE
15 West Building Puyallup 44,661 3rd N/A N/A CBRE
16 4000 Carillon Point Kirkland 42,122 3rd N/A N/A Broderick Group, Inc.
17 Sixty 1 Hundred S Seattle 40,321 3rd N/A N/A The Andover Company, Inc.
18 Sunset Corporate Campus - Bldg 2 I-90 Corridor 37,468 3rd Booking.Com CBRE CBRE
19 One Bellevue Center Bellevue CBD 37,458 2nd EBay N/A Broderick Group, Inc.
20 Highlands Campus Tech Ctr - Bldg A Bothell/Kenmore 36,081 1st N/A N/A Broderick Group, Inc.
21 Laguna South 520 Corridor 34,738 3rd N/A N/A Colliers International
22 Zetron Headquarters Redmond 34,661 2nd N/A N/A Broderick Group, Inc.
23 Bdg A-2333 158th Court Suburban Bellevue 34,360 1st Trane CBRE Jones Lang LaSalle
24 Smith Tower Seattle CBD 32,593 2nd Dolce Vita Footwear, Inc N/A CBRE
25 51 University Pioneer Sq/Waterfront 32,000 1st Synapse N/A Kidder Mathews
26 Ranch Building Kent Valley 29,761 1st Puget Sound Energy N/A Hill-Raaum-Pietromonaco
27 Kirkland 405 Corporate Center - Bldg A2* Kirkland 28,941 2nd Market Leader, Inc. Washington Partners Corporate Real N/A
28 Kirkland 405 Corporate Center - Bldg A2* Kirkland 28,941 1st Market Leader, Inc. Direct Deal N/A
29 1441 North 34th Lake Union 25,761 1st Tableau Software Llc N/A Jones Lang LaSalle
30 IBM Building Seattle CBD 24,518 2nd University of Washington N/A Unico Properties LLC
31 Redmond Hilltop Bldg 19* Redmond 23,919 1st Microvision, Inc. Washington Partners Corporate Real Broderick Group, Inc.
32 Columbia Center Seattle CBD 23,761 3rd NBC News N/A The CAC Group
33 Overlake Medical Pavilion Suburban Bellevue 23,664 3rd Eating Recovery Center N/A CBRE
34 2601 Elliott (Seattle Trade & Technology Ctr) Belltown/Denny Regrade 22,905 3rd Zulily N/A Jones Lang LaSalle
35 5th & Bell Bldg Belltown/Denny Regrade 22,624 1st Institute for Health Metrics and Evaluation Kinzer Real Estate Services Broderick Group, Inc.
36 Ridgewood CS/Bldg G Suburban Bellevue 22,461 2nd Regus CBRE CBRE
37 Wells Fargo Center Seattle CBD 22,179 2nd Madrona Ventures N/A Jones Lang LaSalle
38 Smith Tower Seattle CBD 22,056 2nd N/A N/A CBRE
39 Ridgewood CS/Bldg G Suburban Bellevue 21,361 1st CompuCom N/A CBRE
40 Metropolitan Park West Seattle CBD 20,061 1st N/A N/A Broderick Group, Inc.
Select Top Office Leases Based on Leased Square Footage For Deals Signed in 2013

18 THE COSTAR OFFICE REPORT ©2013 COSTAR GROUP, INC.
SEATTLE/PUGET SOUND – THIRD QUARTER 2013
Seattle/Puget Sound Office MarketTHIRD QUARTER 2013 – SEATTLE/PUGET SOUND
Seattle/Puget Sound Office Market
©2013 COSTAR GROUP, INC. THE COSTAR OFFICE REPORT 19
SALES ACTIVITY
The Optimist Sales Index Average of Two Highest Price/SF's and Two Lowest Cap Rates Per Quarter
Source: CoStar COMPS®
Sales Volume & Price Sales Analysis by Building SizeBased on Office Building Sales of 15,000 SF and Larger Based on Office Building Sales From July 2012 - June 2013
Bldg Size # RBA $ Volume Price/SF Cap Rate
< 50,000 SF 146 1,534,183 270,454,033$ 176.29$ 6.36%
50K-249K SF 20 2,008,744 492,799,600$ 245.33$ 6.65%
250K-499K SF 9 3,315,873 1,223,121,936$ 368.87$ 5.72%
>500K SF 4 4,555,192 2,467,603,799$ 541.71$ 4.83%
Source: CoStar COMPS® Source: CoStar COMPS®
U.S. Price/SF Comparison U.S. Cap Rate ComparisonBased on Office Building Sales of 15,000 SF and Larger Based on Office Building Sales of 15,000 SF and Larger
Source: CoStar COMPS® Source: CoStar COMPS®
$20
$70
$120
$170
$220
$270
$320
$370
$420
$470
$520
20101q
20102q
20103q
20104q
20111q
20112q
20113q
20114q
20121q
20122q
20123q
20124q
20131q
20132q
Dollar
s per
SF
Seattle/Puget Sound US
$0
$500
$1,000
$1,500
$2,000
$2,500
$3,000
2010 1q 2010 3q 2011 1q 2011 3q 2012 1q 2012 3q 2013 1q
Millio
ns
of
Sal
es V
olu
me
Do
llar
s
$0
$100
$200
$300
$400
$500
$600
Price
/SF
Sales Volume Price/SF
0.0%
1.0%
2.0%
3.0%
4.0%
5.0%
6.0%
7.0%
8.0%
9.0%
2010 3q 2010 4q 2011 1q 2011 2q 2011 3q 2011 4q 2012 1q 2012 2q 2012 3q 2012 4q 2013 1q 2013 2q
Cap
Rat
e P
erc
enta
ge
$0
$100
$200
$300
$400
$500
$600
$700
Dollars/S
F
Cap Rate Price/SF
3.0%
4.0%
5.0%
6.0%
7.0%
8.0%
9.0%
20101q
20102q
20103q
20104q
20111q
20112q
20113q
20114q
20121q
20122q
20123q
20124q
20131q
20132q
Cap
Rat
e P
erc
enta
ge
Seattle/Puget Sound US
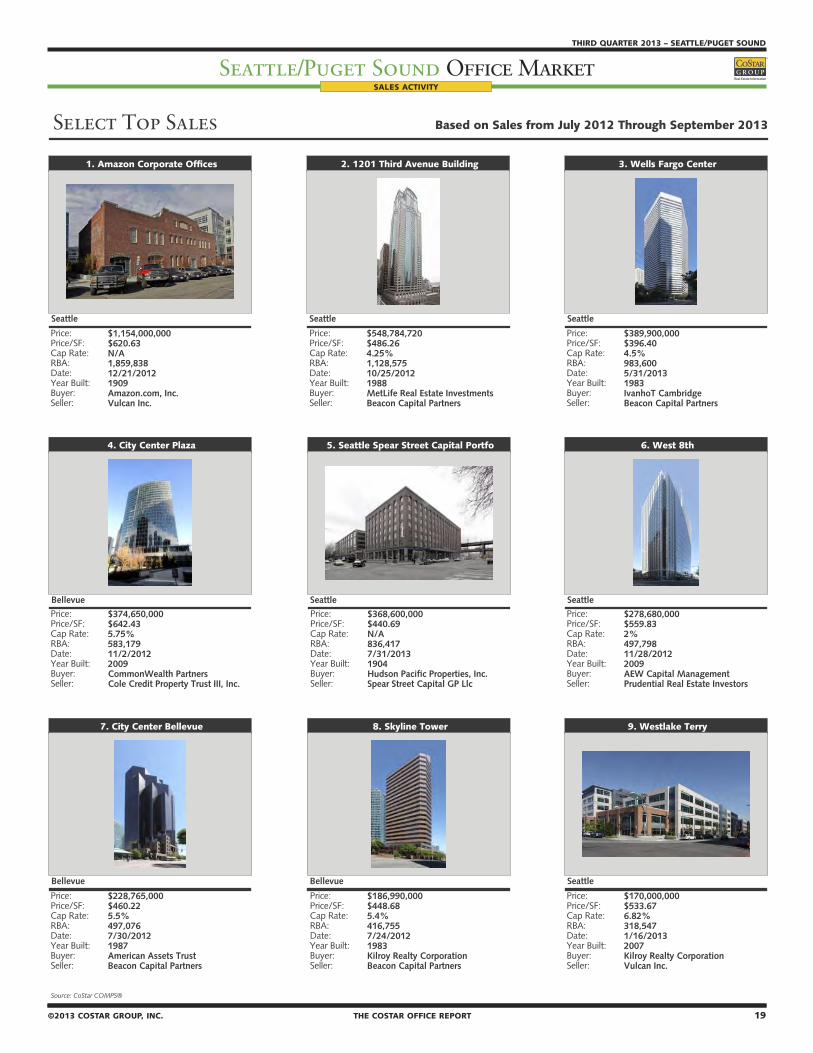
18 THE COSTAR OFFICE REPORT ©2013 COSTAR GROUP, INC.
SEATTLE/PUGET SOUND – THIRD QUARTER 2013
Seattle/Puget Sound Office MarketTHIRD QUARTER 2013 – SEATTLE/PUGET SOUND
Seattle/Puget Sound Office Market
©2013 COSTAR GROUP, INC. THE COSTAR OFFICE REPORT 19
SALES ACTIVITY
���������������� ����������������������������������������������������
���������������������
���������������������������������������������������������
��������������������������������������������������������������������������
���������������������������
�������
���������������������������������������������������������
�����������������������������������������������������������������������������������������������������
������������������������������
�������
���������������������������������������������������������
�����������������������������������������������������������������������������������
����������������������
�������
���������������������������������������������������������
�����������������������������������������������������������������������������������������������������
���������������������
��������
���������������������������������������������������������
���������������������������������������������������������������������������������������������������
���������������������������������������
�������
���������������������������������������������������������
������������������������������������������������������������������������������������������������
������������
�������
���������������������������������������������������������
���������������������������������������������������������������������������������������
������������������������
��������
���������������������������������������������������������
�������������������������������������������������������������������������������������������
�����������������
��������
���������������������������������������������������������
��������������������������������������������������������������������������������
������������������
�������

20 THE COSTAR OFFICE REPORT ©2013 COSTAR GROUP, INC.
SEATTLE/PUGET SOUND – THIRD QUARTER 2013
Seattle/Puget Sound Office MarketMARKET HIGHLIGHTS – CLASS “A, B & C”
©2013 COSTAR GROUP, INC. THE COSTAR OFFICE REPORT 21
THIRD QUARTER 2013 – SEATTLE/PUGET SOUND
Seattle/Puget Sound Office MarketMARKET HIGHLIGHTS – CLASS “A, B & C”
D O W N T O W N S E A T T L E M A R K E T
Deliveries, Absorption & Vacancy Historical Analysis, All Classes
Source: CoStar Property®
Vacant Space Quoted Rental RatesHistorical Analysis, All Classes Historical Analysis, All Classes
Source: CoStar Property® Source: CoStar Property®
Net QuotedPeriod # Bldgs Total RBA Vacant SF Vacancy % Absorption # Bldgs Total RBA # Bldgs Total RBA Rates2013 3q 1,697 74,400,965 7,716,976 10.4% 526,431 3 213,710 4 1,024,027 $29.72
2013 2q 1,695 74,197,611 8,040,053 10.8% 121,943 2 222,782 5 503,312 $29.51
2013 1q 1,694 73,997,042 7,961,427 10.8% 350,234 2 127,000 6 626,094 $28.98
2012 4q 1,692 73,870,042 8,184,661 11.1% 467,496 3 604,292 7 688,094 $28.72
2012 3q 1,689 73,265,750 8,047,865 11.0% (141,252) 1 70,000 10 1,292,386 $27.79
2012 2q 1,690 73,215,198 7,856,061 10.7% 1,035,135 1 157,816 10 1,313,503 $27.31
2012 1q 1,691 73,154,880 8,830,878 12.1% 97,022 0 0 10 1,453,319 $26.78
2011 4q 1,691 73,154,880 8,927,900 12.2% 315,720 0 0 8 1,148,710 $27.72
2011 3q 1,692 73,157,957 9,246,697 12.6% 175,099 0 0 5 826,379 $26.93
2011 2q 1,693 73,169,617 9,433,456 12.9% 978,575 2 600,000 3 706,379 $27.04
2011 1q 1,691 72,569,617 9,812,031 13.5% 401,820 5 914,419 5 1,306,379 $26.88
2010 4q 1,687 71,667,198 9,311,432 13.0% 554,165 2 92,177 9 1,880,235 $27.59
2010 3q 1,686 71,595,781 9,794,180 13.7% 318,872 3 177,741 11 1,972,412 $27.50
2010 2q 1,684 71,453,340 9,970,611 14.0% 403,317 6 788,962 13 1,942,153 $27.46
2010 1q 1,679 70,677,572 9,598,160 13.6% 410,341 3 292,142 16 2,546,077 $27.39
2009 4q 1,676 70,385,430 9,716,359 13.8% 72,336 4 1,071,861 16 2,742,272 $27.69
Source: CoStar Property®
UC InventoryDelivered InventoryExisting Inventory Vacancy
(0.400)
(0.200)
0.000
0.200
0.400
0.600
0.800
1.000
1.200
2010 1q 2010 2q 2010 3q 2010 4q 2011 1q 2011 2q 2011 3q 2011 4q 2012 1q 2012 2q 2012 3q 2012 4q 2013 1q 2013 2q 2013 3q
Millio
ns
SF
0.0%
2.0%
4.0%
6.0%
8.0%
10.0%
12.0%
14.0%
16.0%
Perce
nt V
acant
Delivered SF Absorption SF Vacancy
$25.00
$25.50
$26.00
$26.50
$27.00
$27.50
$28.00
$28.50
$29.00
$29.50
$30.00
2012 1q 2012 2q 2012 3q 2012 4q 2013 1q 2013 2q 2013 3q
Dollar
s/SF/Y
ear
6.50
7.00
7.50
8.00
8.50
9.00
2012 1q 2012 2q 2012 3q 2012 4q 2013 1q 2013 2q 2013 3q
Millio
ns
SF
Direct SF Sublet SF
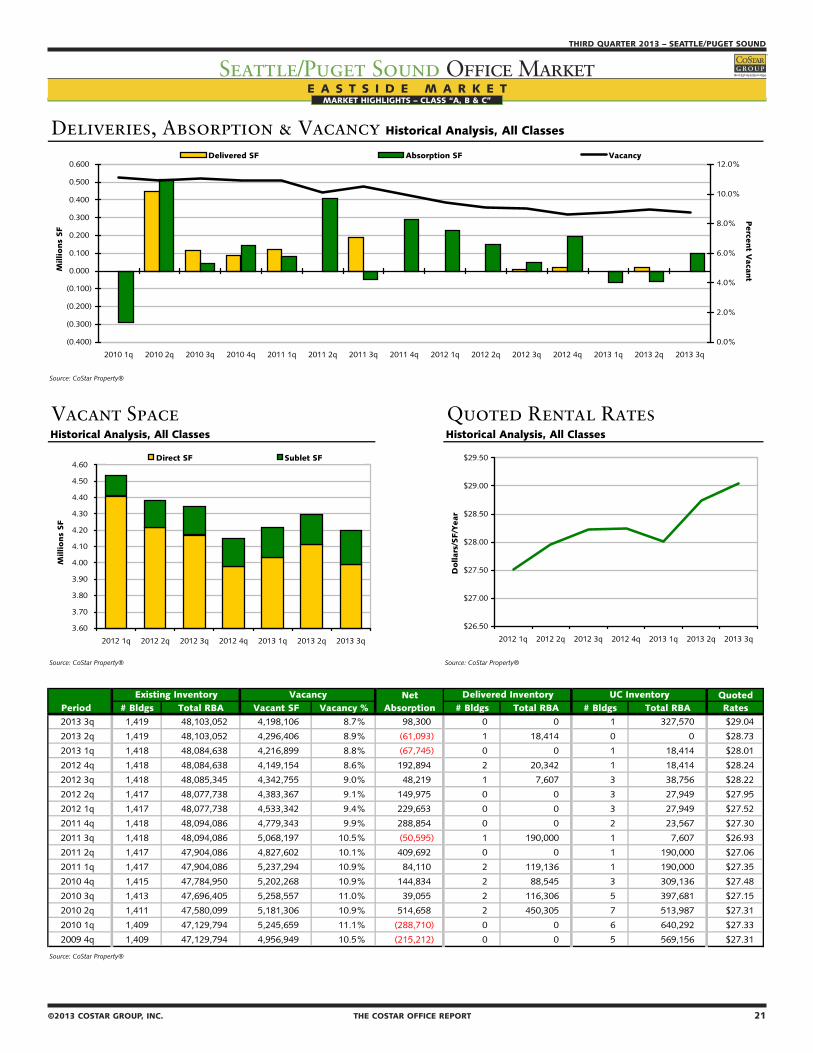
20 THE COSTAR OFFICE REPORT ©2013 COSTAR GROUP, INC.
SEATTLE/PUGET SOUND – THIRD QUARTER 2013
Seattle/Puget Sound Office MarketMARKET HIGHLIGHTS – CLASS “A, B & C”
©2013 COSTAR GROUP, INC. THE COSTAR OFFICE REPORT 21
THIRD QUARTER 2013 – SEATTLE/PUGET SOUND
Seattle/Puget Sound Office MarketMARKET HIGHLIGHTS – CLASS “A, B & C”
E A S T S I D E M A R K E T
Deliveries, Absorption & Vacancy Historical Analysis, All Classes
Source: CoStar Property®
Vacant Space Quoted Rental RatesHistorical Analysis, All Classes Historical Analysis, All Classes
Source: CoStar Property® Source: CoStar Property®
Net QuotedPeriod # Bldgs Total RBA Vacant SF Vacancy % Absorption # Bldgs Total RBA # Bldgs Total RBA Rates2013 3q 1,419 48,103,052 4,198,106 8.7% 98,300 0 0 1 327,570 $29.04
2013 2q 1,419 48,103,052 4,296,406 8.9% (61,093) 1 18,414 0 0 $28.73
2013 1q 1,418 48,084,638 4,216,899 8.8% (67,745) 0 0 1 18,414 $28.01
2012 4q 1,418 48,084,638 4,149,154 8.6% 192,894 2 20,342 1 18,414 $28.24
2012 3q 1,418 48,085,345 4,342,755 9.0% 48,219 1 7,607 3 38,756 $28.22
2012 2q 1,417 48,077,738 4,383,367 9.1% 149,975 0 0 3 27,949 $27.95
2012 1q 1,417 48,077,738 4,533,342 9.4% 229,653 0 0 3 27,949 $27.52
2011 4q 1,418 48,094,086 4,779,343 9.9% 288,854 0 0 2 23,567 $27.30
2011 3q 1,418 48,094,086 5,068,197 10.5% (50,595) 1 190,000 1 7,607 $26.93
2011 2q 1,417 47,904,086 4,827,602 10.1% 409,692 0 0 1 190,000 $27.06
2011 1q 1,417 47,904,086 5,237,294 10.9% 84,110 2 119,136 1 190,000 $27.35
2010 4q 1,415 47,784,950 5,202,268 10.9% 144,834 2 88,545 3 309,136 $27.48
2010 3q 1,413 47,696,405 5,258,557 11.0% 39,055 2 116,306 5 397,681 $27.15
2010 2q 1,411 47,580,099 5,181,306 10.9% 514,658 2 450,305 7 513,987 $27.31
2010 1q 1,409 47,129,794 5,245,659 11.1% (288,710) 0 0 6 640,292 $27.33
2009 4q 1,409 47,129,794 4,956,949 10.5% (215,212) 0 0 5 569,156 $27.31
Source: CoStar Property®
UC InventoryDelivered InventoryExisting Inventory Vacancy
(0.400)
(0.300)
(0.200)
(0.100)
0.000
0.100
0.200
0.300
0.400
0.500
0.600
2010 1q 2010 2q 2010 3q 2010 4q 2011 1q 2011 2q 2011 3q 2011 4q 2012 1q 2012 2q 2012 3q 2012 4q 2013 1q 2013 2q 2013 3q
Millio
ns
SF
0.0%
2.0%
4.0%
6.0%
8.0%
10.0%
12.0%
Perce
nt V
acant
Delivered SF Absorption SF Vacancy
$26.50
$27.00
$27.50
$28.00
$28.50
$29.00
$29.50
2012 1q 2012 2q 2012 3q 2012 4q 2013 1q 2013 2q 2013 3q
Dollar
s/SF/Y
ear
3.60
3.70
3.80
3.90
4.00
4.10
4.20
4.30
4.40
4.50
4.60
2012 1q 2012 2q 2012 3q 2012 4q 2013 1q 2013 2q 2013 3q
Millio
ns
SF
Direct SF Sublet SF
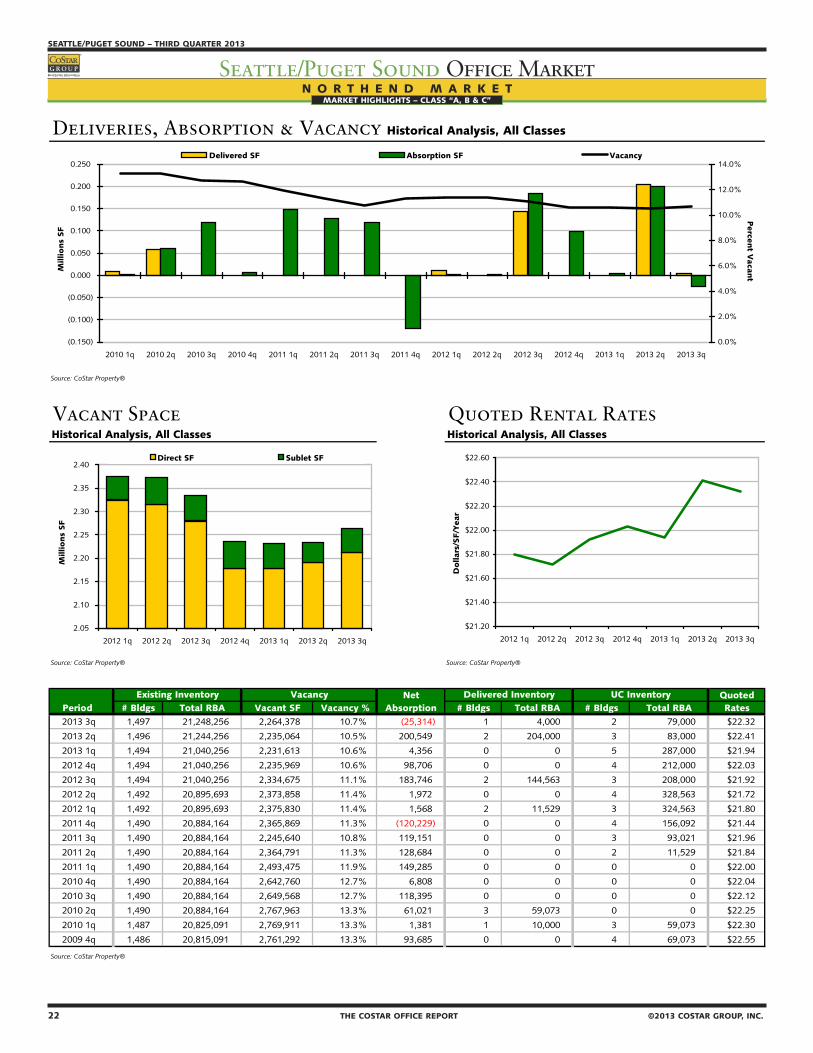
22 THE COSTAR OFFICE REPORT ©2013 COSTAR GROUP, INC.
SEATTLE/PUGET SOUND – THIRD QUARTER 2013
Seattle/Puget Sound Office MarketMARKET HIGHLIGHTS – CLASS “A, B & C”
©2013 COSTAR GROUP, INC. THE COSTAR OFFICE REPORT 23
THIRD QUARTER 2013 – SEATTLE/PUGET SOUND
Seattle/Puget Sound Office MarketMARKET HIGHLIGHTS – CLASS “A, B & C”
N O R T H E N D M A R K E T
Deliveries, Absorption & Vacancy Historical Analysis, All Classes
Source: CoStar Property®
Vacant Space Quoted Rental RatesHistorical Analysis, All Classes Historical Analysis, All Classes
Source: CoStar Property® Source: CoStar Property®
Net QuotedPeriod # Bldgs Total RBA Vacant SF Vacancy % Absorption # Bldgs Total RBA # Bldgs Total RBA Rates2013 3q 1,497 21,248,256 2,264,378 10.7% (25,314) 1 4,000 2 79,000 $22.32
2013 2q 1,496 21,244,256 2,235,064 10.5% 200,549 2 204,000 3 83,000 $22.41
2013 1q 1,494 21,040,256 2,231,613 10.6% 4,356 0 0 5 287,000 $21.94
2012 4q 1,494 21,040,256 2,235,969 10.6% 98,706 0 0 4 212,000 $22.03
2012 3q 1,494 21,040,256 2,334,675 11.1% 183,746 2 144,563 3 208,000 $21.92
2012 2q 1,492 20,895,693 2,373,858 11.4% 1,972 0 0 4 328,563 $21.72
2012 1q 1,492 20,895,693 2,375,830 11.4% 1,568 2 11,529 3 324,563 $21.80
2011 4q 1,490 20,884,164 2,365,869 11.3% (120,229) 0 0 4 156,092 $21.44
2011 3q 1,490 20,884,164 2,245,640 10.8% 119,151 0 0 3 93,021 $21.96
2011 2q 1,490 20,884,164 2,364,791 11.3% 128,684 0 0 2 11,529 $21.84
2011 1q 1,490 20,884,164 2,493,475 11.9% 149,285 0 0 0 0 $22.00
2010 4q 1,490 20,884,164 2,642,760 12.7% 6,808 0 0 0 0 $22.04
2010 3q 1,490 20,884,164 2,649,568 12.7% 118,395 0 0 0 0 $22.12
2010 2q 1,490 20,884,164 2,767,963 13.3% 61,021 3 59,073 0 0 $22.25
2010 1q 1,487 20,825,091 2,769,911 13.3% 1,381 1 10,000 3 59,073 $22.30
2009 4q 1,486 20,815,091 2,761,292 13.3% 93,685 0 0 4 69,073 $22.55
Source: CoStar Property®
UC InventoryDelivered InventoryExisting Inventory Vacancy
(0.150)
(0.100)
(0.050)
0.000
0.050
0.100
0.150
0.200
0.250
2010 1q 2010 2q 2010 3q 2010 4q 2011 1q 2011 2q 2011 3q 2011 4q 2012 1q 2012 2q 2012 3q 2012 4q 2013 1q 2013 2q 2013 3q
Millio
ns
SF
0.0%
2.0%
4.0%
6.0%
8.0%
10.0%
12.0%
14.0%
Perce
nt V
acant
Delivered SF Absorption SF Vacancy
$21.20
$21.40
$21.60
$21.80
$22.00
$22.20
$22.40
$22.60
2012 1q 2012 2q 2012 3q 2012 4q 2013 1q 2013 2q 2013 3q
Dollar
s/SF/Y
ear
2.05
2.10
2.15
2.20
2.25
2.30
2.35
2.40
2012 1q 2012 2q 2012 3q 2012 4q 2013 1q 2013 2q 2013 3q
Millio
ns
SF
Direct SF Sublet SF
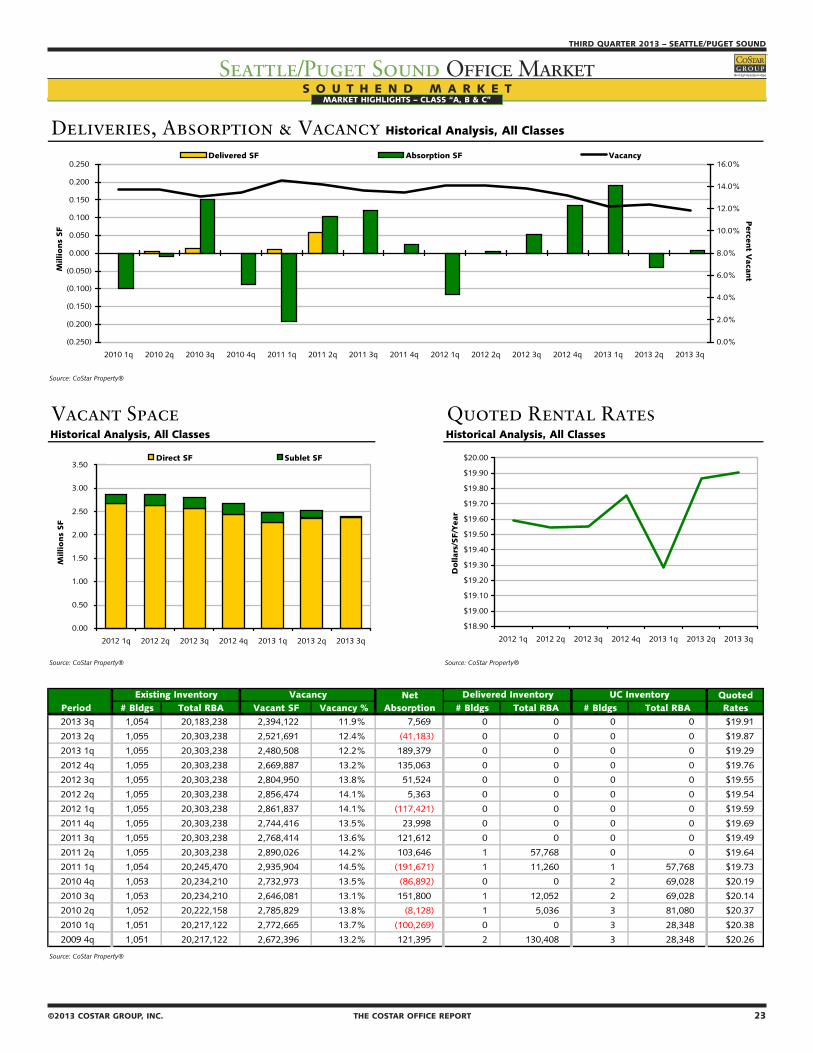
22 THE COSTAR OFFICE REPORT ©2013 COSTAR GROUP, INC.
SEATTLE/PUGET SOUND – THIRD QUARTER 2013
Seattle/Puget Sound Office MarketMARKET HIGHLIGHTS – CLASS “A, B & C”
©2013 COSTAR GROUP, INC. THE COSTAR OFFICE REPORT 23
THIRD QUARTER 2013 – SEATTLE/PUGET SOUND
Seattle/Puget Sound Office MarketMARKET HIGHLIGHTS – CLASS “A, B & C”
S O U T H E N D M A R K E TMARKET HIGHLIGHTS – CLASS “A, B & C”
Deliveries, Absorption & Vacancy Historical Analysis, All Classes
Source: CoStar Property®
Vacant Space Quoted Rental RatesHistorical Analysis, All Classes Historical Analysis, All Classes
Source: CoStar Property® Source: CoStar Property®
Net QuotedPeriod # Bldgs Total RBA Vacant SF Vacancy % Absorption # Bldgs Total RBA # Bldgs Total RBA Rates2013 3q 1,054 20,183,238 2,394,122 11.9% 7,569 0 0 0 0 $19.91
2013 2q 1,055 20,303,238 2,521,691 12.4% (41,183) 0 0 0 0 $19.87
2013 1q 1,055 20,303,238 2,480,508 12.2% 189,379 0 0 0 0 $19.29
2012 4q 1,055 20,303,238 2,669,887 13.2% 135,063 0 0 0 0 $19.76
2012 3q 1,055 20,303,238 2,804,950 13.8% 51,524 0 0 0 0 $19.55
2012 2q 1,055 20,303,238 2,856,474 14.1% 5,363 0 0 0 0 $19.54
2012 1q 1,055 20,303,238 2,861,837 14.1% (117,421) 0 0 0 0 $19.59
2011 4q 1,055 20,303,238 2,744,416 13.5% 23,998 0 0 0 0 $19.69
2011 3q 1,055 20,303,238 2,768,414 13.6% 121,612 0 0 0 0 $19.49
2011 2q 1,055 20,303,238 2,890,026 14.2% 103,646 1 57,768 0 0 $19.64
2011 1q 1,054 20,245,470 2,935,904 14.5% (191,671) 1 11,260 1 57,768 $19.73
2010 4q 1,053 20,234,210 2,732,973 13.5% (86,892) 0 0 2 69,028 $20.19
2010 3q 1,053 20,234,210 2,646,081 13.1% 151,800 1 12,052 2 69,028 $20.14
2010 2q 1,052 20,222,158 2,785,829 13.8% (8,128) 1 5,036 3 81,080 $20.37
2010 1q 1,051 20,217,122 2,772,665 13.7% (100,269) 0 0 3 28,348 $20.38
2009 4q 1,051 20,217,122 2,672,396 13.2% 121,395 2 130,408 3 28,348 $20.26
Source: CoStar Property®
UC InventoryDelivered InventoryExisting Inventory Vacancy
(0.250)
(0.200)
(0.150)
(0.100)
(0.050)
0.000
0.050
0.100
0.150
0.200
0.250
2010 1q 2010 2q 2010 3q 2010 4q 2011 1q 2011 2q 2011 3q 2011 4q 2012 1q 2012 2q 2012 3q 2012 4q 2013 1q 2013 2q 2013 3q
Millio
ns
SF
0.0%
2.0%
4.0%
6.0%
8.0%
10.0%
12.0%
14.0%
16.0%
Perce
nt V
acant
Delivered SF Absorption SF Vacancy
$18.90
$19.00
$19.10
$19.20
$19.30
$19.40
$19.50
$19.60
$19.70
$19.80
$19.90
$20.00
2012 1q 2012 2q 2012 3q 2012 4q 2013 1q 2013 2q 2013 3q
Dollar
s/SF/Y
ear
0.00
0.50
1.00
1.50
2.00
2.50
3.00
3.50
2012 1q 2012 2q 2012 3q 2012 4q 2013 1q 2013 2q 2013 3q
Millio
ns
SF
Direct SF Sublet SF

24 THE COSTAR OFFICE REPORT ©2013 COSTAR GROUP, INC.
SEATTLE/PUGET SOUND – THIRD QUARTER 2013
Seattle/Puget Sound Office MarketMARKET HIGHLIGHTS – CLASS “A, B & C”
T A C O M A M A R K E TMARKET HIGHLIGHTS – CLASS “A, B & C”
Deliveries, Absorption & Vacancy Historical Analysis, All Classes
Source: CoStar Property®
Vacant Space Quoted Rental RatesHistorical Analysis, All Classes Historical Analysis, All Classes
Source: CoStar Property® Source: CoStar Property®
Net QuotedPeriod # Bldgs Total RBA Vacant SF Vacancy % Absorption # Bldgs Total RBA # Bldgs Total RBA Rates2013 3q 1,895 20,074,970 2,164,809 10.8% 9,764 0 0 1 57,350 $20.85
2013 2q 1,895 20,074,970 2,174,573 10.8% 177,439 1 120,000 1 57,350 $21.53
2013 1q 1,894 19,954,970 2,232,012 11.2% 47,104 1 3,372 2 177,350 $19.93
2012 4q 1,893 19,951,598 2,275,744 11.4% 152,326 0 0 3 180,722 $21.47
2012 3q 1,893 19,951,598 2,428,070 12.2% (21,344) 1 6,813 2 123,372 $21.21
2012 2q 1,892 19,944,785 2,399,913 12.0% 15,934 1 15,470 3 130,185 $21.21
2012 1q 1,891 19,929,315 2,400,377 12.0% (20,556) 0 0 3 142,283 $20.80
2011 4q 1,891 19,929,315 2,379,821 11.9% 233,677 3 154,045 3 142,283 $20.86
2011 3q 1,888 19,775,270 2,459,453 12.4% (47,753) 1 3,600 5 289,515 $19.79
2011 2q 1,887 19,771,670 2,408,100 12.2% 86,258 0 0 5 277,645 $19.85
2011 1q 1,888 19,775,370 2,498,058 12.6% 132,134 3 169,644 4 157,645 $21.07
2010 4q 1,885 19,605,726 2,460,548 12.6% (65,461) 0 0 6 312,503 $20.63
2010 3q 1,885 19,605,726 2,395,087 12.2% (84,068) 3 45,031 3 169,644 $20.70
2010 2q 1,882 19,560,695 2,265,988 11.6% 8,040 1 48,341 6 214,675 $20.99
2010 1q 1,881 19,512,354 2,225,687 11.4% 814 2 7,600 6 253,088 $20.89
2009 4q 1,879 19,504,754 2,218,901 11.4% (5,993) 1 27,000 6 91,598 $21.12
Source: CoStar Property®
UC InventoryDelivered InventoryExisting Inventory Vacancy
(0.100)
(0.050)
0.000
0.050
0.100
0.150
0.200
0.250
2010 1q 2010 2q 2010 3q 2010 4q 2011 1q 2011 2q 2011 3q 2011 4q 2012 1q 2012 2q 2012 3q 2012 4q 2013 1q 2013 2q 2013 3q
Millio
ns
SF
9.5%
10.0%
10.5%
11.0%
11.5%
12.0%
12.5%
13.0%
Perce
nt V
acant
Delivered SF Absorption SF Vacancy
$19.00
$19.50
$20.00
$20.50
$21.00
$21.50
$22.00
2012 1q 2012 2q 2012 3q 2012 4q 2013 1q 2013 2q 2013 3q
Dollar
s/SF/Y
ear
0.00
0.50
1.00
1.50
2.00
2.50
3.00
2012 1q 2012 2q 2012 3q 2012 4q 2013 1q 2013 2q 2013 3q
Millio
ns
SF
Direct SF Sublet SF