cortical atrophy, reduced integrity of white matter and … · showed cortical atrophies in frontal...
TRANSCRIPT
Regular Article
Cortical atrophy, reduced integrity of white matter andcognitive impairment in subcortical vascular dementia ofBinswanger typeWon-Beom Jung, MS,1 Chi-Woong Mun, PhD,1 Young-Hoon Kim, MD,2
Je Min Park, MD, PhD,3,4 Byung Dae Lee, MD, PhD,3,4 Young Min Lee, MD,3,4*Eunsoo Moon, MD,3,4 Hee Jeong Jeong, MD3,4 and Young In Chung, MD, PhD5
1Department of Biomedical Engineering and FIRST, Inje University, Gimhae, 2Department of Psychiatry, Medical School,Haeundae Paik Hospital, Inje University, 3Department of Psychiatry, 4Medical Research Institute, Pusan NationalUniversity Hospital, Busan, and 5Department of Psychiatry, Pusan National University Yangsan Hospital, Yangsan, Korea
Aims: An association between white matterhyperintensities (WMH) and cognitive dysfunctionhas long been recognized. However, subjects withidentically appearing WMH on magnetic resonanceimaging present with a wide variance in cognitivefunction ranging from normal cognition to demen-tia. The aim of this study was to compare corticalatrophy and integrity of white matter of patients withsubcortical vascular dementia of Binswanger type(SVaD-BT) with those of the normal cognition groupwith WMH (ncWMH).
Methods: Eleven patients with SVaD-BT and 11 age-,sex-, education- and grade of WMH-matched ncWMHunderwent magnetic resonance imaging, including3-D volumetric images for cortical atrophy and diffu-sion tensor imaging for integrity of white matter.
Results: Compared to ncWMH, SVaD-BT patientsshowed cortical atrophies in frontal (i.e. frontal pole,
precentral gyrus and frontal medial cortex) andoccipital areas (i.e. lingual gyrus) followed by atro-phies in temporal (i.e. fusiform cortex and middletemporal gyrus) areas. Along with cortical atrophies,reduced integrity with low fractional anisotropy andhigh mean diffusivity values in genu and splenium ofthe corpus callosum were detected in SVaD-BTpatients.
Conclusions: Our findings suggest that cognitivedecline from ncWMH to SVaD-BT may be associatedwith cortical atrophy and reduced integrity of whitematter.
Key words: cortical atrophy, diffusion tensorimaging, integrity of white matter, magnetic reso-nance imaging, subcortical vascular dementia ofBinswanger type.
WHITE MATTER HYPERINTENSITIES (WMH) area frequent finding on magnetic resonance
imaging (MRI) scans of elderly people. It is knownthat WMH are associated with cognitive decline andneurobehavioral symptoms, such as apathy, abulia,
agitation, disinhibition, reduced mental speed,impaired executive functions, and relatively mildmemory dysfunction.1,2 Cognitive impairments inWMH are probably related to ischemic interruption offrontal subcortical circuits or disruption of cholinergicpathways that traverse the subcortical white matter(WM).2,3
However, subjects with identically appearingWMH on MRI present with a wide variance in cogni-tive function ranging from no complaints to demen-tia.4 It is now appreciated that these lesions areprevalent both in normal aging and in aging associ-
*Correspondence: Young Min Lee, MD, Department of Psychiatry,School of Medicine, Pusan National University, 305 Gudeok-Ro,Seo-Gu, Busan 602-739, Korea. Email: [email protected] 12 November 2013; revised 19 March 2014; accepted 23April 2014.
Psychiatry and Clinical Neurosciences 2014; 68: 821–832 doi:10.1111/pcn.12196
821© 2014 The AuthorsPsychiatry and Clinical Neurosciences © 2014 Japanese Society of Psychiatry and Neurology
ated with cognitive decline. It means that there arehidden factors that determine whether identicallyappearing WMH on MRI lead to cognitive decline inone person, while leaving others unaffected.
One of the hidden factors could be neuro-degenerative processes that are triggered by WMH.Previous studies have shown that neuronal degen-eration occurs when an axon in the brain isdamaged.5,6 This would eventually result in atrophyin cortical areas that are connected via damagedtracts.
Another explanation for the clinical variety due toWMH could be changes of microstructural integritythat are invisible on conventional MRI but are nev-ertheless expected to contribute substantially to clini-cal symptoms.7 Unfortunately, conventional MRIcommonly used in clinical practice are insufficientlysensitive and specific to detect all the WM changesrelated to small vessel diseases. These limitations ofconventional MRI can potentially be overcome withthe use of diffusion tensor imaging (DTI), which is asensitive tool for detecting microstructural changes inthe normally appearing WM on conventional MRI.8
The aim of this study was to compare the regionaldistribution of cortical atrophy of subcortical vascu-lar dementia of Binswanger type (SVaD-BT) with thatof the normal cognition group with WMH (ncWMH)using voxel-based morphometry (VBM). Another aimwas to compare the changes of microstructural WMintegrity in SVaD-BT with that of ncWMH using DTI.
METHODS
Subjects
This study involved 11 patients with SVaD-BT and 11age-, sex- and education-matched ncWMH. All sub-jects were recruited from the memory-impairmentclinics of Pusan National University Hospital inKorea from November 2010 to March 2012.
Patients with SVaD-BT met the criteria for VaDdescribed by the DSM-IV and also fulfilled the imagingcriteria proposed by Erkinjuntti et al.9 We applied thefollowing exclusion criteria to all subjects: (i) otherneurodegenerative or psychiatric diseases; (ii) intra-cranial space-occupying lesion; (iii) prominent visualor hearing impairment; (iv) aphasia or other languagebarrier; (v) MRI contraindications or known claustro-phobia; (vi) active substance abuse disorders; and(vii) severe systemic disease. Present or past use ofmedication to treat cognition and infarction was not
included in the exclusion criteria. The inclusion crite-ria for ncWMH were as follows: (i) subjective cognitivecomplaints but no abnormality (within −1.5 SD ofage- and education-adjusted norms) on standardizedneuropsychological tests; (ii) normal activities of dailyliving (ADL) as judged by both an interview with aclinician and the standardized ADL scale; and (iii)significant small vessel ischemic changes without ter-ritory infarction on MRI. The presence of significantsmall vessel ischemic changes was defined as WMH onfluid-attenuated inversion recovery (FLAIR) imagingthat fulfilled the following criteria: (i) periventricularWMH (caps or rim) longer than 10 mm; and (ii) deepWMH consistent with extensive WM lesion or dif-fusely confluent lesion ≥25 mm in maximum diam-eter. These imaging criteria indicate that our patientshad ischemia significant enough to meet at least grade3 of Fazekas’ ischemia criteria.10
We used the Korean version of the Consortiumto Establish a Registry for Alzheimer’s Disease(CERAD-K) neuropsychological battery to examinethe functional capacity of several cognitive domains:11
(i) memory (word list recall, constructional recall);(ii) language (the Korean version of the BostonNaming Test [K-BNT]); and (iii) visuospatial function(constructional apraxia). We also used the Koreanversion of the Frontal Assessment Battery (FAB-K)12 toexamine the frontal or executive function: the FAB-Kwas known as a valid and reliable instrument forevaluating frontal lobe function in the elderly.
Written informed consent was obtained from allsubjects, and this study was approved by the PusanNational University Hospital Institutional ReviewBoard. The demographic and clinical features of thesubjects are summarized in Table 1.
MRI data acquisition
All subjects underwent MR scans of T1-weightedimages (T1WI) and DTI on a Siemens (Erlangen,Germany) Trio TIM 3T scanner. T1WI were acquiredusing a 3-D magnetization-prepared rapid gradientecho (3D MPRAGE) sequence with the followingparameters: repetition time (TR) = 1800 ms, echotime (TE) = 2.07 ms, inversion time (TI) = 900 ms,flip angle = 12°, acquisition matrix = 256 × 256,field of view (FOV) = 250 × 250 mm2, slice thick-ness = 1 mm, and total number of slices = 256. DTIwere acquired with the following echo planar acqui-sition parameters: diffusion-weighted gradientsapplied in 30 non-linear directions, number of
822 W-B. Jung et al. Psychiatry and Clinical Neurosciences 2014; 68: 821–832
© 2014 The AuthorsPsychiatry and Clinical Neurosciences © 2014 Japanese Society of Psychiatry and Neurology
average = 2, TR = 6200 ms, TE = 85 ms, flip angle =90°, acquisition matrix = 128 × 128, FOV = 230 ×230 mm2, slice thickness = 3 mm, and b value =600 s/mm2. We ensured the same slice orientationparalleled with the anterior commissure and posteriorcommissure line in all image acquisitions.
MRI data analysis
Cortical volume atrophy: VBM analysis
The VBM 8 toolbox (http://dbm.neuro.uni-jena.de/vbm), which is incorporated in SPM8 (http://www.fil.ion.ucl.ac.uk/spm),13 was used to perform theanalysis of brain structural imaging. In this process, allimages were spatially normalized using combinationsof linear transform and non-linear registration to thestandard Montreal Neurological Institute (MNI) tem-plate and segmented into probabilistic gray matter(GM), WM and cerebrospinal fluid (CSF).14 BecauseWMH areas were represented in similar intensityranges with GM, segmentation processing was imple-mented by applying an adaptive maximum a posterioritechnique. This technique relied solely on intensitydifferences without requiring the a priori informationfor tissue class probabilities and by additionallyadapting the partial volume estimation with hidden
Markov random field approach.15–17 Addition-ally, FreeSurfer 5.1 (http://surfer.nmr.mgh.harvard.edu/)18,19 was applied to confirm the WMH and cere-bral cortex in T1WI. FreeSurfer is a highly automatictool for brain structural segmentation comparable inaccuracy to manual assessment. Briefly, the images areprocessed with motion correction, a non-uniformintensity correction, removal of non-brain tissues,Talairach registration, segmentation of cortical andsubcortical GM based on manually generated proba-bilistic atlas and construction of surface models withboundary tessellation and topological correction. Themore detailed procedures with Freesurfer have beendescribed in previous studies.18,19 WMH areas roughlyare labeled as hypointense areas in T1WI in subcorti-cal segmentation procedures. Although this perfor-mance was lower than that from manual or supervisedmethods, its usefulness was reported in previousstudies.20,21 To perform the statistical analysis only inthe cerebral cortex, the intersection between probabi-listic GM from VBM8 and cortical areas fromFreesurfer were estimated. Then, segmented GMimages were modulated to compensate the volumetriceffects of expansion or shrinking employed in spatialnormalization by multiplying the voxel intensity withthe Jacobian determinants. This reflected the param-
Table 1. Demographic information of the subjects
SVaD-BT (n = 11) ncWMH (n = 11) P-value
Age, years 73 ± 4.27 75 ± 1.41 0.834Sex, female, n (%) 9 9 1.000Education, years 7 ± 4.16 8 ± 6.36 0.833Hypertension, n (%) 5 (45.5) 6 (54.5) 0.670DM, n (%) 4 (36.4) 2 (18.2) 0.635Hyperlipidemia, n (%) 3 (27.3) 2 (18.2) 1.000Any APOE e4 allele, n (%) 2 (18.2) 3 (27.3) 1.000MMSE 16.82 ± 5.31 24.73 ± 4.41 0.003CERAD-K
Boston naming test 6.73 ± 2.94 9.45 ± 4.52 0.118Constructional apraxia 6.09 ± 2.66 9.63 ± 1.57 0.001Word list recall 1.27 ± 1.49 2.64 ± 2.38 0.152Constructional recall 0.72 ± 1.01 3.18 ± 2.71 0.018FAB 8.55 ± 3.14 11.91 ± 2.51 0.015
SIADL 22.73 ± 13.99 7.0 ± 4.75 0.005
Data are n (%) or means ± SD.CERAD-K, Korean version of Consortium to Establish a Registry for Alzheimer’s disease; DM, diabetes mellitus; FAB,Frontal Assessment Battery; MMSE, Mini Mental State Examination; ncWMH, normal cognition group with white matterhyperintensity; SIADL, Seoul-Instrumental Activities of Daily Living; SVaD-BT, subcortical vascular dementia ofBinswanger type.
Psychiatry and Clinical Neurosciences 2014; 68: 821–832 Cortical atrophy and reduced integrity 823
© 2014 The AuthorsPsychiatry and Clinical Neurosciences © 2014 Japanese Society of Psychiatry and Neurology
eters for fitting a voxel in native space to a correspond-ing voxel in MNI space. The processing foridentification of cortical areas is shown in Figure 1.The modulated images were then smoothed with an8-mm full-width half maximum (FWHM) isotropicGaussian kernel. Finally, statistical analysis wasdesigned using an independent two-sample t-test withgeneral linear model (GLM). Age, sex, education andintracranial volume were used as covariates to controlthese confounding factors. A statistically significantlevel was considered at false discovery rate (FDR)corrected P-values (q < 0.05) with the extent thresh-old of contiguous 500 voxels.
Microstructural integrity in white matter:TBSS analysis
DTI were entirely processed with the FMRIB Soft-ware Library (FSL, http://www.fmrib.ox.ac.uk/fsl)package.22 Image distortions induced by the effects ofhead movement and eddy currents were corrected byapplying an alignment of diffusion-weighted imagesto non-diffusion weighted images. After stripping theskull using brain extraction tool (BET), diffusiontensor was calculated at each voxel and then frac-tional anisotropy (FA), mean diffusivity (MD(λ1 + λ2 + λ3)/3), axial diffusivity (DA, λ1) andradial diffusivity (RD (λ2 + λ3)/2) images were gen-erated using the fMRIB diffusion toolbox (FDT).22,23
Voxel-wise statistical analysis of these DTI parameters
was performed using TBSS 1.2.24,25 First, all individualFA images were non-linearly aligned to the FA tem-plate in 1 × 1 × 1 mm3 MNI space using FMRIB’snon-linear registration tool (FNIRT).22 Second,aligned images were averaged and thinned to identifythe mean FA skeleton represented as the center ofcommon WM tracts.24 Third, mean FA skeleton wasrestricted with the thresholds 0.2 to exclude thevoxels of GM, CSF in skeleton. All of the subject’saligned FA images were projected onto the mean skel-eton tracks and the resulting data fed into voxel-wiseacross subject statistics. The registration and projec-tion vectors derived from DTI-FA processing wereapplied to other DTI parameters. Finally, voxel-wisedifferences of DTI parameters were statistically ana-lyzed by independent two-sample t-test with the GLMdesign controlling the effects of age, sex and educa-tion as covariates, setting the number of permuta-tions at 5000 based on the threshold-free clusterenhancement (TFCE) and taking into account resultsto be significant at P < 0.05 with correction for mul-tiple comparisons.26
Automatic region of interest analysis in cerebralcortex and corpus callosum
Following voxel-wise comparisons, we performedregion of interest (ROI) analysis based on the VBMand TBSS results. Cortical volumes were estimatedfrom segmentation in Freesurfer and WM integrities
(a) (b) (c) (d) (e) (f)
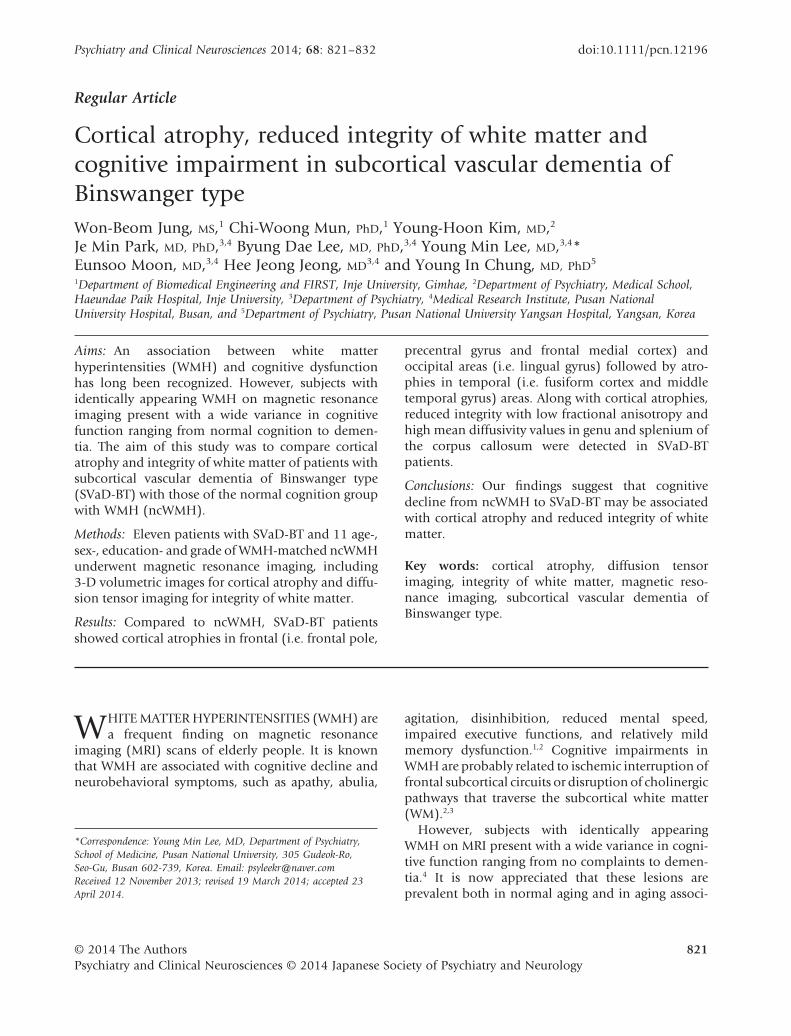
Figure 1. Identification of cortical areas. (a) Whole brain image in native space. (b) White matter hyperintense (blue) and corticalareas (red) from Freesurfer overlaid on (a). (c) Probabilistic gray matter from SPM. (d) Intersection gray matter between (c) andcortical areas from Freesurfer. (e) Normalized into Montreal Neurological Institute (MNI) space from (c). (f) Normalized into MNIspace from (d).
824 W-B. Jung et al. Psychiatry and Clinical Neurosciences 2014; 68: 821–832
© 2014 The AuthorsPsychiatry and Clinical Neurosciences © 2014 Japanese Society of Psychiatry and Neurology
based on DTI parameters were measured using skel-eton deprojection into the subject’s native space.Common areas showing statistical differencesbetween the two groups in TBSS analysis were iden-tified in reference to JHU ICBM-DTI-81 WM atlas.27
This atlas in standard space was labeled into sub-anatomical WM ROI and then these were trans-formed to all of the subject’s native spaces using theinverse normalization with both normalizationmatrix to standard space and skeleton projectionvectors applied in TBSS analysis. Back-transformedatlas masks were multiplied by the FA images andacquired the averaging FA values within the ROI. Thesame processing was conducted for other DTI param-eters to evaluate the original non-FA values. Afterassessing the normal distribution by Kolmogorov–Smirnov test, cortical volumes and mean DTI ROIvalues were compared using the Mann–WhitneyU-test with significance level of P < 0.05. We alsoperformed the correlation analysis between the sever-ity of clinical features and brain ROI values definedby VBM or TBSS.
RESULTS
Cortical gray matter volume: VBM analysis
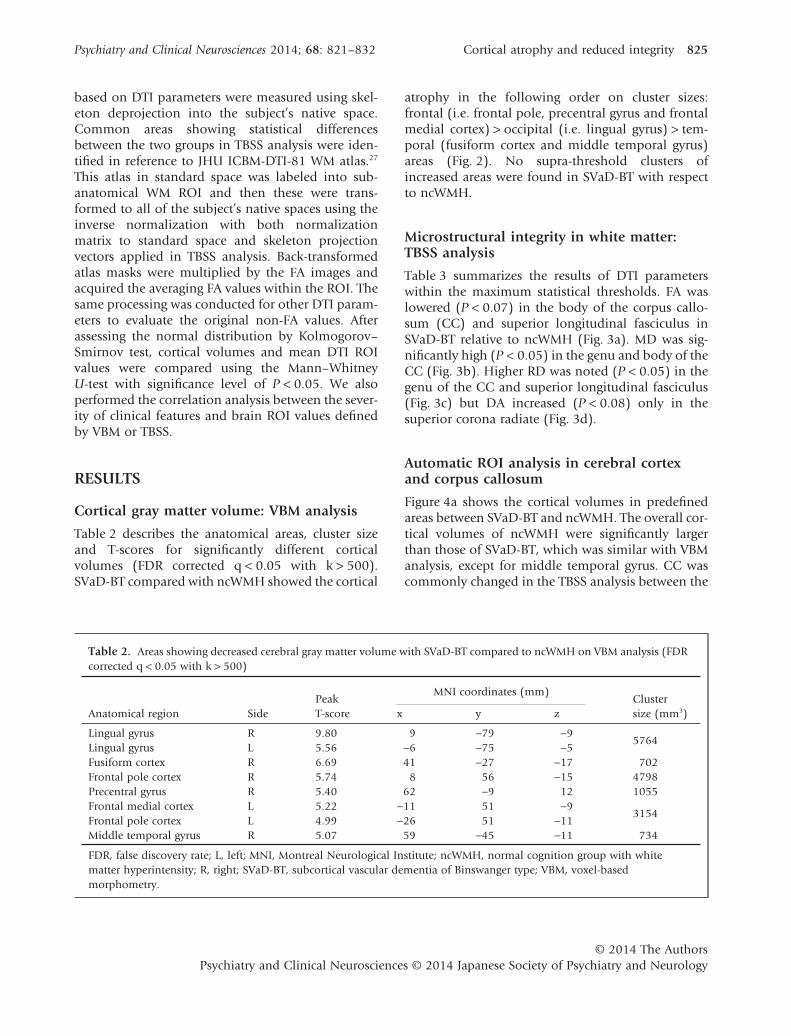
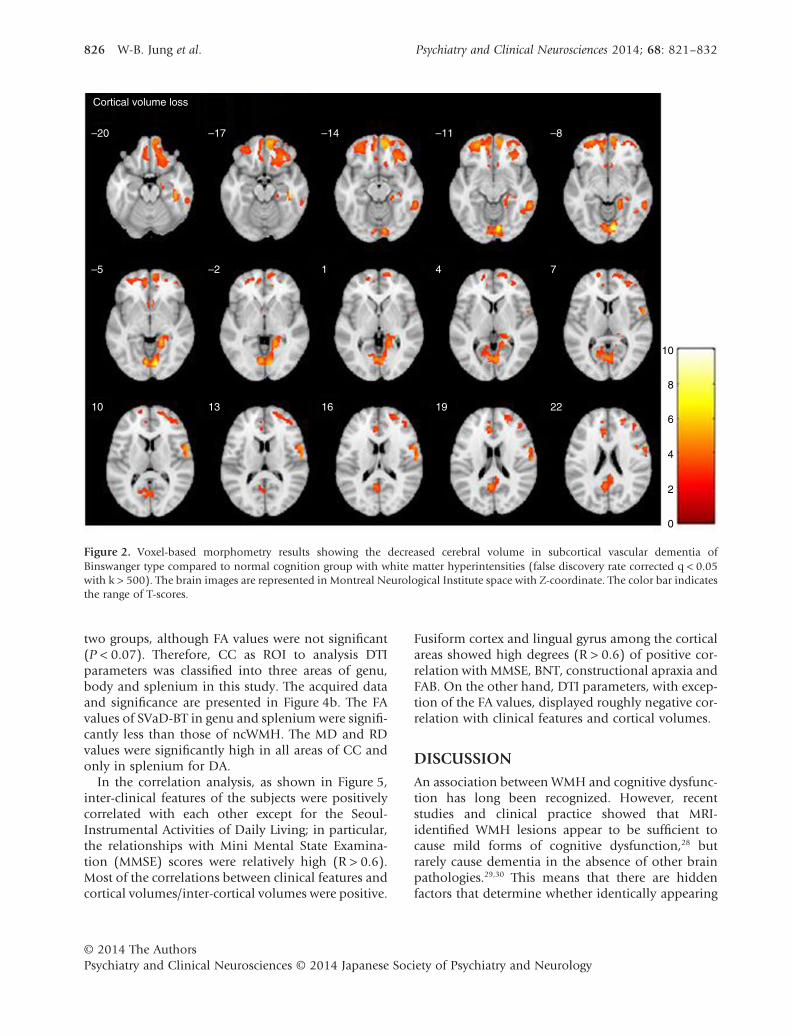
Table 2 describes the anatomical areas, cluster sizeand T-scores for significantly different corticalvolumes (FDR corrected q < 0.05 with k > 500).SVaD-BT compared with ncWMH showed the cortical
atrophy in the following order on cluster sizes:frontal (i.e. frontal pole, precentral gyrus and frontalmedial cortex) > occipital (i.e. lingual gyrus) > tem-poral (fusiform cortex and middle temporal gyrus)areas (Fig. 2). No supra-threshold clusters ofincreased areas were found in SVaD-BT with respectto ncWMH.
Microstructural integrity in white matter:TBSS analysis
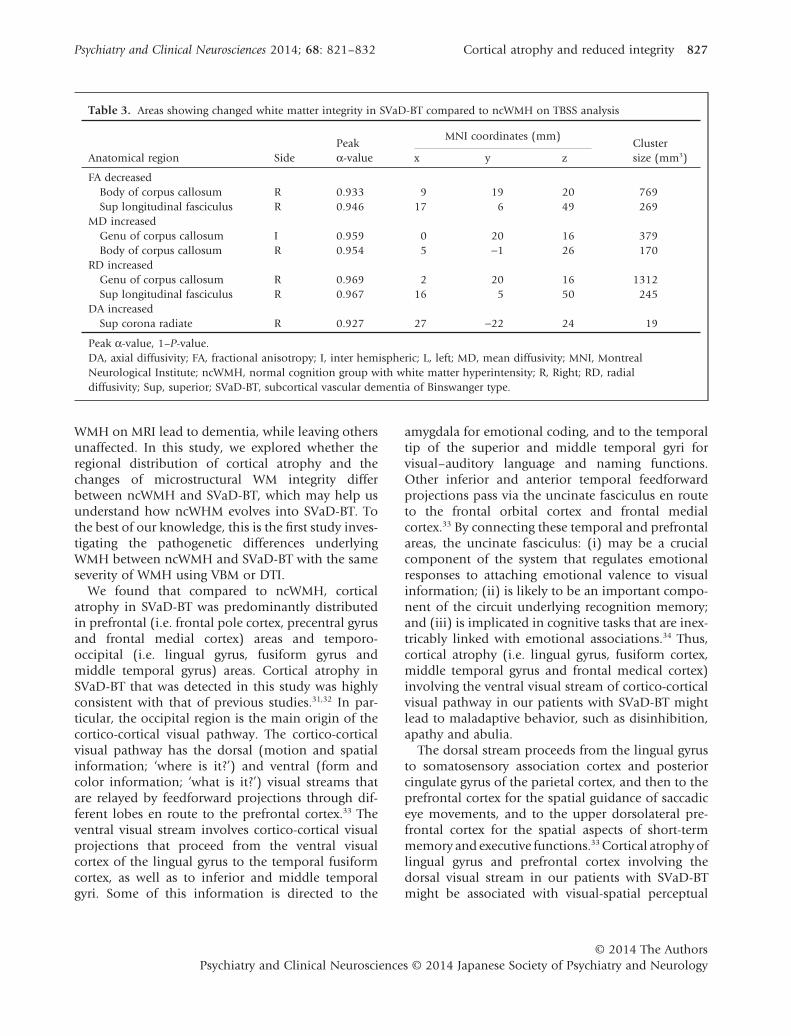
Table 3 summarizes the results of DTI parameterswithin the maximum statistical thresholds. FA waslowered (P < 0.07) in the body of the corpus callo-sum (CC) and superior longitudinal fasciculus inSVaD-BT relative to ncWMH (Fig. 3a). MD was sig-nificantly high (P < 0.05) in the genu and body of theCC (Fig. 3b). Higher RD was noted (P < 0.05) in thegenu of the CC and superior longitudinal fasciculus(Fig. 3c) but DA increased (P < 0.08) only in thesuperior corona radiate (Fig. 3d).
Automatic ROI analysis in cerebral cortexand corpus callosum
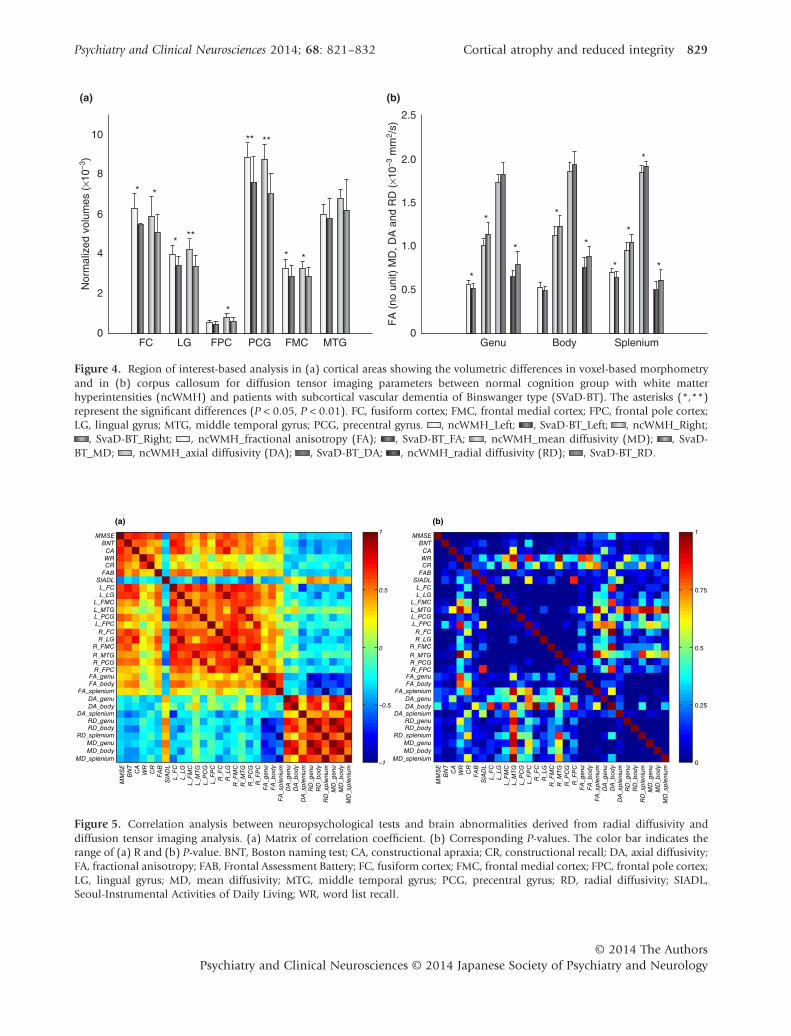
Figure 4a shows the cortical volumes in predefinedareas between SVaD-BT and ncWMH. The overall cor-tical volumes of ncWMH were significantly largerthan those of SVaD-BT, which was similar with VBManalysis, except for middle temporal gyrus. CC wascommonly changed in the TBSS analysis between the
Table 2. Areas showing decreased cerebral gray matter volume with SVaD-BT compared to ncWMH on VBM analysis (FDRcorrected q < 0.05 with k > 500)
Anatomical region SidePeakT-score
MNI coordinates (mm)Clustersize (mm3)x y z
Lingual gyrus R 9.80 9 −79 −95764
Lingual gyrus L 5.56 −6 −75 −5Fusiform cortex R 6.69 41 −27 −17 702Frontal pole cortex R 5.74 8 56 −15 4798Precentral gyrus R 5.40 62 −9 12 1055Frontal medial cortex L 5.22 −11 51 −9
3154Frontal pole cortex L 4.99 −26 51 −11Middle temporal gyrus R 5.07 59 −45 −11 734
FDR, false discovery rate; L, left; MNI, Montreal Neurological Institute; ncWMH, normal cognition group with whitematter hyperintensity; R, right; SVaD-BT, subcortical vascular dementia of Binswanger type; VBM, voxel-basedmorphometry.
Psychiatry and Clinical Neurosciences 2014; 68: 821–832 Cortical atrophy and reduced integrity 825
© 2014 The AuthorsPsychiatry and Clinical Neurosciences © 2014 Japanese Society of Psychiatry and Neurology
two groups, although FA values were not significant(P < 0.07). Therefore, CC as ROI to analysis DTIparameters was classified into three areas of genu,body and splenium in this study. The acquired dataand significance are presented in Figure 4b. The FAvalues of SVaD-BT in genu and splenium were signifi-cantly less than those of ncWMH. The MD and RDvalues were significantly high in all areas of CC andonly in splenium for DA.
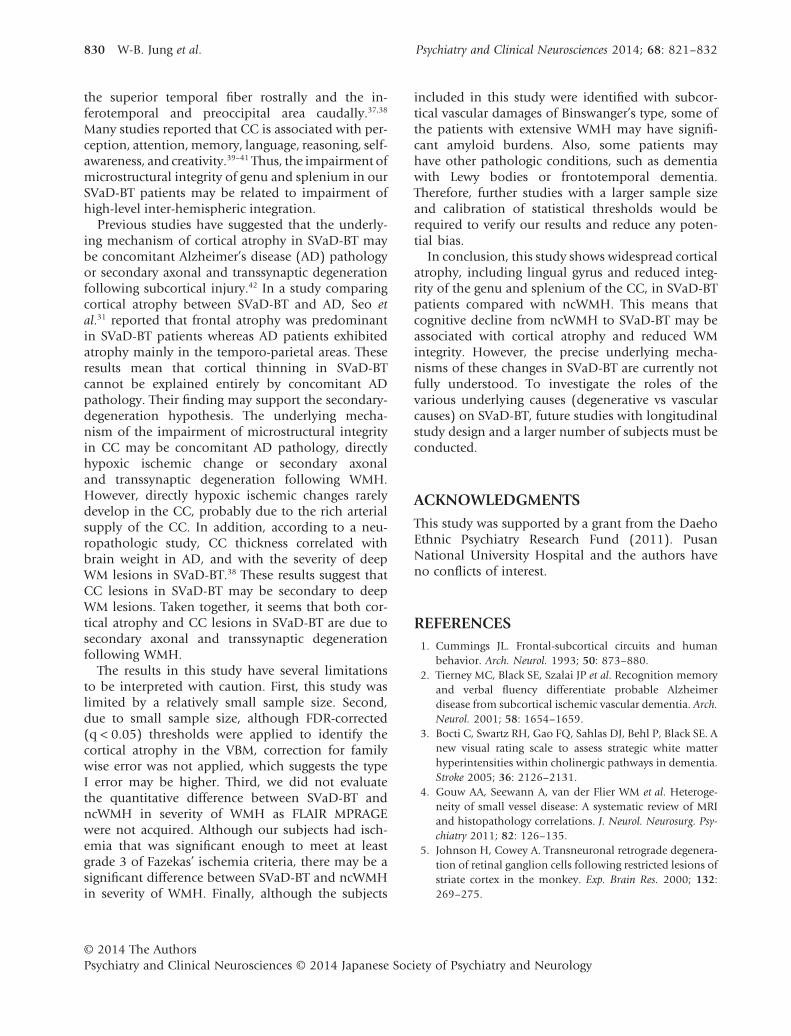
In the correlation analysis, as shown in Figure 5,inter-clinical features of the subjects were positivelycorrelated with each other except for the Seoul-Instrumental Activities of Daily Living; in particular,the relationships with Mini Mental State Examina-tion (MMSE) scores were relatively high (R > 0.6).Most of the correlations between clinical features andcortical volumes/inter-cortical volumes were positive.
Fusiform cortex and lingual gyrus among the corticalareas showed high degrees (R > 0.6) of positive cor-relation with MMSE, BNT, constructional apraxia andFAB. On the other hand, DTI parameters, with excep-tion of the FA values, displayed roughly negative cor-relation with clinical features and cortical volumes.
DISCUSSIONAn association between WMH and cognitive dysfunc-tion has long been recognized. However, recentstudies and clinical practice showed that MRI-identified WMH lesions appear to be sufficient tocause mild forms of cognitive dysfunction,28 butrarely cause dementia in the absence of other brainpathologies.29,30 This means that there are hiddenfactors that determine whether identically appearing
–20
Cortical volume loss
–17 –14 –8–11
–5 –2 1 74
10 13 16 22
10
8
6
4
2
0
19
Figure 2. Voxel-based morphometry results showing the decreased cerebral volume in subcortical vascular dementia ofBinswanger type compared to normal cognition group with white matter hyperintensities (false discovery rate corrected q < 0.05with k > 500). The brain images are represented in Montreal Neurological Institute space with Z-coordinate. The color bar indicatesthe range of T-scores.
826 W-B. Jung et al. Psychiatry and Clinical Neurosciences 2014; 68: 821–832
© 2014 The AuthorsPsychiatry and Clinical Neurosciences © 2014 Japanese Society of Psychiatry and Neurology
WMH on MRI lead to dementia, while leaving othersunaffected. In this study, we explored whether theregional distribution of cortical atrophy and thechanges of microstructural WM integrity differbetween ncWMH and SVaD-BT, which may help usunderstand how ncWHM evolves into SVaD-BT. Tothe best of our knowledge, this is the first study inves-tigating the pathogenetic differences underlyingWMH between ncWMH and SVaD-BT with the sameseverity of WMH using VBM or DTI.
We found that compared to ncWMH, corticalatrophy in SVaD-BT was predominantly distributedin prefrontal (i.e. frontal pole cortex, precentral gyrusand frontal medial cortex) areas and temporo-occipital (i.e. lingual gyrus, fusiform gyrus andmiddle temporal gyrus) areas. Cortical atrophy inSVaD-BT that was detected in this study was highlyconsistent with that of previous studies.31,32 In par-ticular, the occipital region is the main origin of thecortico-cortical visual pathway. The cortico-corticalvisual pathway has the dorsal (motion and spatialinformation; ‘where is it?’) and ventral (form andcolor information; ‘what is it?’) visual streams thatare relayed by feedforward projections through dif-ferent lobes en route to the prefrontal cortex.33 Theventral visual stream involves cortico-cortical visualprojections that proceed from the ventral visualcortex of the lingual gyrus to the temporal fusiformcortex, as well as to inferior and middle temporalgyri. Some of this information is directed to the
amygdala for emotional coding, and to the temporaltip of the superior and middle temporal gyri forvisual–auditory language and naming functions.Other inferior and anterior temporal feedforwardprojections pass via the uncinate fasciculus en routeto the frontal orbital cortex and frontal medialcortex.33 By connecting these temporal and prefrontalareas, the uncinate fasciculus: (i) may be a crucialcomponent of the system that regulates emotionalresponses to attaching emotional valence to visualinformation; (ii) is likely to be an important compo-nent of the circuit underlying recognition memory;and (iii) is implicated in cognitive tasks that are inex-tricably linked with emotional associations.34 Thus,cortical atrophy (i.e. lingual gyrus, fusiform cortex,middle temporal gyrus and frontal medical cortex)involving the ventral visual stream of cortico-corticalvisual pathway in our patients with SVaD-BT mightlead to maladaptive behavior, such as disinhibition,apathy and abulia.
The dorsal stream proceeds from the lingual gyrusto somatosensory association cortex and posteriorcingulate gyrus of the parietal cortex, and then to theprefrontal cortex for the spatial guidance of saccadiceye movements, and to the upper dorsolateral pre-frontal cortex for the spatial aspects of short-termmemory and executive functions.33 Cortical atrophy oflingual gyrus and prefrontal cortex involving thedorsal visual stream in our patients with SVaD-BTmight be associated with visual-spatial perceptual
Table 3. Areas showing changed white matter integrity in SVaD-BT compared to ncWMH on TBSS analysis
Anatomical region SidePeakα-value
MNI coordinates (mm)Clustersize (mm3)x y z
FA decreasedBody of corpus callosum R 0.933 9 19 20 769Sup longitudinal fasciculus R 0.946 17 6 49 269
MD increasedGenu of corpus callosum I 0.959 0 20 16 379Body of corpus callosum R 0.954 5 −1 26 170
RD increasedGenu of corpus callosum R 0.969 2 20 16 1312Sup longitudinal fasciculus R 0.967 16 5 50 245
DA increasedSup corona radiate R 0.927 27 −22 24 19
Peak α-value, 1–P-value.DA, axial diffusivity; FA, fractional anisotropy; I, inter hemispheric; L, left; MD, mean diffusivity; MNI, MontrealNeurological Institute; ncWMH, normal cognition group with white matter hyperintensity; R, Right; RD, radialdiffusivity; Sup, superior; SVaD-BT, subcortical vascular dementia of Binswanger type.
Psychiatry and Clinical Neurosciences 2014; 68: 821–832 Cortical atrophy and reduced integrity 827
© 2014 The AuthorsPsychiatry and Clinical Neurosciences © 2014 Japanese Society of Psychiatry and Neurology
abnormalities, working memory problems and execu-tive dysfunction.
Another main objective of our study was to comparethe changes of microstructural WM integrity betweenncWMH and SVaD-BT using DTI. The discrepancies ofresults between TBSS and ROI analysis currentlyemployed in imaging studies came from the method-ological differences. TBSS is the voxel-by-voxel com-parisons on WM skeleton-applied non-parametricpermutation testing for multiple comparisons tocontrol any false positives, whereas ROI analysis isdependent on single statistic value of DTI parametersby voxel averaged within ROI. In our results, we foundlower DTI-FA, higher DTI-MD and higher DTI-RDvalues of genu and splenium of CC in SVaD-BTpatients compared with ncWMH patients, which sug-gests a loss of the normal microstructural organization
within the genu and splenium. Few studies have beenconducted to compare the changes of microstructuralintegrity in WM areas between ncWMH and SVaD-BTusing DTI. Only a few studies comparing SVaD-BT andnormal controls without WMH have been con-ducted.35,36 Sugihara et al. reported that compared tonormal controls, the DTI-FA values of CC (genu andsplenium) in SVaD-BT were also significantly lower.35
CC, the largest main commissure fiber tract, estab-lishes inter-hemispheric connections in a topographi-cally organized way.37 It may be divided into threeareas: anterior (incorporating the genu), intermediary(body), and posterior (incorporating the splenium).The genu connects the prefrontal areas, rostralcingulated region and supplementary motor area. Thebody connects the posterior portion of the frontallobes and the parietal lobes. The splenium connects
(a) FA
(b) MD
(c) RD
(d) DA
X = 17
X = 0
X = 0
X = 27
Y = 7
Y = 15
Y = 15
Y = –22
Z = 16
Z = 16
Z = 16
Z = 24
1
α
Figure 3. Topology of TBSS analysisfor significantly changed diffusiontensor imaging parameters in patientswith subcortical vascular dementia ofBinswanger type (SVaD-BT) comparedto normal cognition group with whitematter hyperintensities (ncWMH):(a) ncWMH > SVaD-BT (P < 0.07),(b) SVaD-BT > ncWMH (P < 0.05),(c) SVaD-BT > ncWMH (P < 0.05),(d) SVaD-BT > ncWMH (P < 0.08),corrected for family wise errors. Thebrain images are represented in Mon-treal Neurological Institute space withX, Y and Z coordinates. The color barindicates the range of α-value (1-p).DA, axial diffusivity; FA, fractionalanisotropy; MD, mean diffusivity; RD,radial diffusivity.
828 W-B. Jung et al. Psychiatry and Clinical Neurosciences 2014; 68: 821–832
© 2014 The AuthorsPsychiatry and Clinical Neurosciences © 2014 Japanese Society of Psychiatry and Neurology
0
2
4
6
8
10
FC
(a) (b)
LG
Nor
mal
ized
vol
umes
(×1
0–3)
FPC
*
***
**
* *
****
PCG FMC MTG0
0.5
1.0
1.5
2.0
2.5
Genu Body Splenium
FA
(no
uni
t) M
D, D
A a
nd R
D (
×10–3
mm
2 /s)
**
* *
*
*
*
*
*
Figure 4. Region of interest-based analysis in (a) cortical areas showing the volumetric differences in voxel-based morphometryand in (b) corpus callosum for diffusion tensor imaging parameters between normal cognition group with white matterhyperintensities (ncWMH) and patients with subcortical vascular dementia of Binswanger type (SVaD-BT). The asterisks (*,**)represent the significant differences (P < 0.05, P < 0.01). FC, fusiform cortex; FMC, frontal medial cortex; FPC, frontal pole cortex;LG, lingual gyrus; MTG, middle temporal gyrus; PCG, precentral gyrus. , ncWMH_Left; , SvaD-BT_Left; , ncWMH_Right;
, SvaD-BT_Right; , ncWMH_fractional anisotropy (FA); , SvaD-BT_FA; , ncWMH_mean diffusivity (MD); , SvaD-BT_MD; , ncWMH_axial diffusivity (DA); , SvaD-BT_DA; , ncWMH_radial diffusivity (RD); , SvaD-BT_RD.
MD_splenium
MD_body
RD_splenium
MD_genu
FA_splenium
FA_body
FA_genu
DA_spleniumDA_body
DA_genu
R_FPC
R_PCG
R_MTG
R_FMC
R_LG
R_FC
L_FPC
L_PCGL_MTG
L_FMC
L_LG
L_FC
SIADLFAB
CRWR
CA
BNT
MMSE
RD_bodyRD_genu
MD_splenium
MD_body
RD_splenium
MD_genu
FA_splenium
FA_body
FA_genu
DA_spleniumDA_body
DA_genu
R_FPC
R_PCG
R_MTG
R_FMC
R_LG
R_FC
L_FPC
L_PCGL_MTG
L_FMC
L_LG
L_FC
SIADLFAB
CRWR
CA
BNT
MMSE1
0.5
–0.5
–1
0
1
(a) (b)
0.75
0.25
0
0.5
RD_bodyRD_genu
MD_splenium
MD_body
RD_splenium
MD_genu
FA_splenium
FA_body
FA_genu
DA_splenium
DA_body
DA_genu
R_FPC
R_PCG
R_MTG
R_FMC
R_LG
R_FC
L_FPC
L_PCG
L_MTG
L_FMC
L_LG
L_FC
SIADL
FAB
CR
WR
CA
BNT
MMSE
RD_body
RD_genu
MD_splenium
MD_body
RD_splenium
MD_genu
FA_splenium
FA_body
FA_genu
DA_splenium
DA_body
DA_genu
R_FPC
R_PCG
R_MTG
R_FMC
R_LG
R_FC
L_FPC
L_PCG
L_MTG
L_FMC
L_LG
L_FC
SIADL
FAB
CR
WR
CA
BNT
MMSE
RD_body
RD_genu
Figure 5. Correlation analysis between neuropsychological tests and brain abnormalities derived from radial diffusivity anddiffusion tensor imaging analysis. (a) Matrix of correlation coefficient. (b) Corresponding P-values. The color bar indicates therange of (a) R and (b) P-value. BNT, Boston naming test; CA, constructional apraxia; CR, constructional recall; DA, axial diffusivity;FA, fractional anisotropy; FAB, Frontal Assessment Battery; FC, fusiform cortex; FMC, frontal medial cortex; FPC, frontal pole cortex;LG, lingual gyrus; MD, mean diffusivity; MTG, middle temporal gyrus; PCG, precentral gyrus; RD, radial diffusivity; SIADL,Seoul-Instrumental Activities of Daily Living; WR, word list recall.
Psychiatry and Clinical Neurosciences 2014; 68: 821–832 Cortical atrophy and reduced integrity 829
© 2014 The AuthorsPsychiatry and Clinical Neurosciences © 2014 Japanese Society of Psychiatry and Neurology
the superior temporal fiber rostrally and the in-ferotemporal and preoccipital area caudally.37,38
Many studies reported that CC is associated with per-ception, attention, memory, language, reasoning, self-awareness, and creativity.39–41 Thus, the impairment ofmicrostructural integrity of genu and splenium in ourSVaD-BT patients may be related to impairment ofhigh-level inter-hemispheric integration.
Previous studies have suggested that the underly-ing mechanism of cortical atrophy in SVaD-BT maybe concomitant Alzheimer’s disease (AD) pathologyor secondary axonal and transsynaptic degenerationfollowing subcortical injury.42 In a study comparingcortical atrophy between SVaD-BT and AD, Seo etal.31 reported that frontal atrophy was predominantin SVaD-BT patients whereas AD patients exhibitedatrophy mainly in the temporo-parietal areas. Theseresults mean that cortical thinning in SVaD-BTcannot be explained entirely by concomitant ADpathology. Their finding may support the secondary-degeneration hypothesis. The underlying mecha-nism of the impairment of microstructural integrityin CC may be concomitant AD pathology, directlyhypoxic ischemic change or secondary axonaland transsynaptic degeneration following WMH.However, directly hypoxic ischemic changes rarelydevelop in the CC, probably due to the rich arterialsupply of the CC. In addition, according to a neu-ropathologic study, CC thickness correlated withbrain weight in AD, and with the severity of deepWM lesions in SVaD-BT.38 These results suggest thatCC lesions in SVaD-BT may be secondary to deepWM lesions. Taken together, it seems that both cor-tical atrophy and CC lesions in SVaD-BT are due tosecondary axonal and transsynaptic degenerationfollowing WMH.
The results in this study have several limitationsto be interpreted with caution. First, this study waslimited by a relatively small sample size. Second,due to small sample size, although FDR-corrected(q < 0.05) thresholds were applied to identify thecortical atrophy in the VBM, correction for familywise error was not applied, which suggests the typeI error may be higher. Third, we did not evaluatethe quantitative difference between SVaD-BT andncWMH in severity of WMH as FLAIR MPRAGEwere not acquired. Although our subjects had isch-emia that was significant enough to meet at leastgrade 3 of Fazekas’ ischemia criteria, there may be asignificant difference between SVaD-BT and ncWMHin severity of WMH. Finally, although the subjects
included in this study were identified with subcor-tical vascular damages of Binswanger’s type, some ofthe patients with extensive WMH may have signifi-cant amyloid burdens. Also, some patients mayhave other pathologic conditions, such as dementiawith Lewy bodies or frontotemporal dementia.Therefore, further studies with a larger sample sizeand calibration of statistical thresholds would berequired to verify our results and reduce any poten-tial bias.
In conclusion, this study shows widespread corticalatrophy, including lingual gyrus and reduced integ-rity of the genu and splenium of the CC, in SVaD-BTpatients compared with ncWMH. This means thatcognitive decline from ncWMH to SVaD-BT may beassociated with cortical atrophy and reduced WMintegrity. However, the precise underlying mecha-nisms of these changes in SVaD-BT are currently notfully understood. To investigate the roles of thevarious underlying causes (degenerative vs vascularcauses) on SVaD-BT, future studies with longitudinalstudy design and a larger number of subjects must beconducted.
ACKNOWLEDGMENTSThis study was supported by a grant from the DaehoEthnic Psychiatry Research Fund (2011). PusanNational University Hospital and the authors haveno conflicts of interest.
REFERENCES1. Cummings JL. Frontal-subcortical circuits and human
behavior. Arch. Neurol. 1993; 50: 873–880.2. Tierney MC, Black SE, Szalai JP et al. Recognition memory
and verbal fluency differentiate probable Alzheimerdisease from subcortical ischemic vascular dementia. Arch.Neurol. 2001; 58: 1654–1659.
3. Bocti C, Swartz RH, Gao FQ, Sahlas DJ, Behl P, Black SE. Anew visual rating scale to assess strategic white matterhyperintensities within cholinergic pathways in dementia.Stroke 2005; 36: 2126–2131.
4. Gouw AA, Seewann A, van der Flier WM et al. Heteroge-neity of small vessel disease: A systematic review of MRIand histopathology correlations. J. Neurol. Neurosurg. Psy-chiatry 2011; 82: 126–135.
5. Johnson H, Cowey A. Transneuronal retrograde degenera-tion of retinal ganglion cells following restricted lesions ofstriate cortex in the monkey. Exp. Brain Res. 2000; 132:269–275.
830 W-B. Jung et al. Psychiatry and Clinical Neurosciences 2014; 68: 821–832
© 2014 The AuthorsPsychiatry and Clinical Neurosciences © 2014 Japanese Society of Psychiatry and Neurology
6. Schallert T, Jones TA, Lindner MD. Multileveltransneuronal degeneration after brain damage. Behav-ioral events and effects of anticonvulsant gamma-aminobutyric acid-related drugs. Stroke 1990; 21:III143–III146.
7. Scheltens P, Barkhof F, Leys D, Wolters EC, Ravid R,Kamphorst W. Histopathologic correlates of white matterchanges on MRI in Alzheimer’s disease and normal aging.Neurology 1995; 45: 883–888.
8. Nitkunan A, McIntyre DJ, Barrick TR et al. Correlationsbetween MRS and DTI in cerebral small vessel disease.NMR Biomed. 2006; 19: 610–616.
9. Erkinjuntti T, Inzitari D, Pantoni L et al. Research criteriafor subcortical vascular dementia in clinical trials. J. NeuralTransm. Suppl. 2000; 59: 23–30.
10. Fazekas F, Chawluk JB, Alavi A, Hurtig H, Zimmerman R.MR signal abnormalities at 1.5 T in Alzheimer’s dementiaand normal aging. AJR Am. J. Roentgenol. 1987; 149: 351–356.
11. Lee JH, Lee KU, Lee DY et al. Development of the Koreanversion of the Consortium to Establish a Registry forAlzheimer’s disease assessment packet (CERAD-K): Clini-cal and neuropsychological assessment batteries. J.Gerontol. B Psychol. Sci. Soc. Sci. 2002; 57: 47–53.
12. Kim TH, Huh YS, Choe JY et al. Korean version of frontalassessment battery: Psychometric properties and norma-tive data. Dement. Geriatr. Cogn. Disord. 2010; 29: 363–370.
13. Ashburner J, Friston KJ. Voxel-based morphometry – themethods. Neuroimage 2000; 11: 805–821.
14. Mazziotta J, Toga A, Evans A et al. A probabilistic atlas andreference system for the human brain: International Con-sortium for Brain Mapping (ICBM). Philos. Trans. R. Soc.Lond. B. Biol Sci. 2001; 356: 1293–1322.
15. Felderhoff-Mueser U, Rutherford MA, Squier WV et al.Relationship between MR imaging and histopathologicfindings of the brain in extremely sick preterm infants.AJNR Am. J. Neuroradiol. 1999; 20: 1349–1357.
16. Rajapakse JC, Giedd JN, Rapoport JL. Statistical approachto segmentation of single-channel cerebral MR images.IEEE Trans. Med. Imaging 1997; 16: 176–186.
17. Tohka J, Zijdenbos A, Evans A. Fast and robust parameterestimation for statistical partial volume models in brainMRI. Neuroimage 2004; 23: 84–97.
18. Fischl B, Salat DH, Busa E et al. Whole brain segmentation:Automated labeling of neuroanatomical structures in thehuman brain. Neuron 2002; 33: 341–355.
19. Fischl B, Salat DH, van der Kouwe AJ et al. Sequence-independent segmentation of magnetic resonance images.Neuroimage 2004; 23: S69–S84.
20. Samaille T, Fillon L, Cuingnet R et al. Contrast-based fullyautomatic segmentation of white matter hyperintensities:Method and validation. PLoS ONE 2012; 7: e48953.
21. Olsson E, Klasson N, Berge J et al. White matter lesionassessment in patients with cognitive impairment and
healthy controls: Reliability comparisons between visualrating, a manual, and an automatic volumetrical MRImethod – the Gothenburg MCI study. J. Aging Res. 2013;2013: 198471.
22. Smith SM, Jenkinson M, Woolrich MW et al. Advances infunctional and structural MR image analysis and imple-mentation as FSL. Neuroimage 2004; 23: S208–S219.
23. Smith SM. BET: Brain extraction tool. Technical Report TR00S M S2a, Oxford Centre for Functional Magnetic Reso-nance Imaging of the Brain, Oxford University 2000.
24. Smith SM, Jenkinson M, Johansen-Berg H et al. Tract-based spatial statistics: Voxelwise analysis of multi-subjectdiffusion data. Neuroimage 2006; 31: 1487–1505.
25. Smith SM, Johansen-Berg H, Jenkinson M et al. Acquisi-tion and voxelwise analysis of multi-subject diffusion datawith tract-based spatial statistics. Nat. Protoc. 2007; 2:499–503.
26. Smith SM, Nichols TE. Threshold-free cluster enhance-ment: Addressing problems of smoothing, thresholddependence and localisation in cluster inference.Neuroimage 2009; 44: 83–98.
27. Mori S, Wakana S, Van Zijl PCM, Nagae-Poetscher L. MRIAtlas of Human White Matter. Elsevier, Amsterdam, 2005.
28. Lopez OL, Jagust WJ, Dulberg C et al. Risk factors for mildcognitive impairment in the Cardiovascular Health StudyCognition Study: Part 2. Arch. Neurol. 2003; 60: 1394–1399.
29. Smith EE, Egorova S, Blacker D et al. Magnetic resonanceimaging white matter hyperintensities and brain volumein the prediction of mild cognitive impairment anddementia. Arch. Neurol. 2008; 65: 94–100.
30. DeCarli C, Mungas D, Harvey D et al. Memory im-pairment, but not cerebrovascular disease, predictsprogression of MCI to dementia. Neurology 2004; 63: 220–227.
31. Seo SW, Ahn J, Yoon U et al. Cortical thinning in vascularmild cognitive impairment and vascular dementia of sub-cortical type. J. Neuroimaging 2010; 20: 37–45.
32. Seo SW, Lee JM, Im K et al. Cortical thinning related toperiventricular and deep white matter hyperintensities.Neurobiol. Aging 2012; 33: 1156–1167.
33. Schmahmann JD, Smith EE, Eichler FS, Filley CM. Cere-bral white matter: Neuroanatomy, clinical neurology, andneurobehavioral correlates. Ann. N. Y. Acad. Sci. 2008;1142: 266–309.
34. Ghashghaei HT, Barbas H. Pathways for emotion: Interac-tions of prefrontal and anterior temporal pathways in theamygdala of the rhesus monkey. Neuroscience 2002; 115:1261–1279.
35. Sugihara S, Kinoshita T, Matsusue E, Fujii S, Ogawa T.Usefulness of diffusion tensor imaging of white matter inAlzheimer disease and vascular dementia. Acta Radiol.2004; 45: 658–663.
36. Hanyu H, Imon Y, Sakurai H et al. Regional differences indiffusion abnormality in cerebral white matter lesions in
Psychiatry and Clinical Neurosciences 2014; 68: 821–832 Cortical atrophy and reduced integrity 831
© 2014 The AuthorsPsychiatry and Clinical Neurosciences © 2014 Japanese Society of Psychiatry and Neurology
patients with vascular dementia of the Binswanger typeand Alzheimer’s disease. Eur. J. Neurol. 1999; 6: 195–203.
37. Doron KW, Gazzaniga MS. Neuroimaging techniquesoffer new perspectives on callosal transfer and interhemi-spheric communication. Cortex 2008; 44: 1023–1029.
38. Tomimoto H, Lin JX, Matsuo A et al. Different mecha-nisms of corpus callosum atrophy in Alzheimer’s diseaseand vascular dementia. J. Neurol. 2004; 251: 398–406.
39. Gazzaniga MS. The human brain is actually two brains,each capable of advanced mental functions. When thecerebrum is divided surgically, it is as if the cranium
contained two separate spheres of consciousness. Sci. Am.1967; 217: 24–29.
40. Gazzaniga MS. Cerebral specialization and interhemi-spheric communication: Does the corpus callosum enablethe human condition? Brain 2000; 123 (Pt 7): 1293–1326.
41. Sperry R. Consciousness, personal identity and the dividedbrain. Neuropsychologia 1984; 22: 661–673.
42. Fein G, Di Sclafani V, Tanabe J et al. Hippocampal andcortical atrophy predict dementia in subcortical ischemicvascular disease. Neurology 2000; 55: 1626–1635.
832 W-B. Jung et al. Psychiatry and Clinical Neurosciences 2014; 68: 821–832
© 2014 The AuthorsPsychiatry and Clinical Neurosciences © 2014 Japanese Society of Psychiatry and Neurology