alternating activation of midline frontal and motor cortical networks
TRANSCRIPT

Regulating action:alternating activation of midline frontal and motor cortical networks
Phan Luua,b,*, Don M. Tuckera,b
aUniversity of Oregon, Eugene, OR, USAbElectrical Geodesics, Inc., Eugene, OR, USA
Accepted 30 March 2001
Abstract
Objectives: Focal electrical ®elds recorded over the midline prefrontal cortex have been found to index rapid evaluative decisions,
including the recognition of having made an error in a speeded response task. The nature of these electrical ®elds and how they are related to
cortical areas involved in response execution remains to be clari®ed.
Methods: As subjects performed a speeded response task the EEG was recorded with a 128-channel sensor array. By ®ltering out the large
slow waves of the event-related potential, we found that the error-related negativity (Ne/ERN) arises from a midline frontal oscillation that
alternates with oscillations over lateral sensorimotor cortex. Electrical source analyses were used to determine the brain sources involved in
the generation of these oscillations.
Results: The results show that the midline and lateral oscillations have a period of about 200 ms (theta), and they are present for both
correct and error responses. When an error is made, the midline error oscillation is recruited strongly, and it becomes correlated with the
motor oscillation. Source analyses localized the midline error oscillation to centromedial frontal cortex and the lateral oscillation to
sensorimotor cortices.
Conclusions: Because of the similarity between the midline oscillation observed in the present study and frontal midline theta, the nature
of the Ne/ERN may be clari®ed by the frontal midline theta literature. The correlation between the midline and sensorimotor oscillations
suggests a possible mechanism for how midline frontal evaluative and monitoring networks contribute to action regulation. q 2001 Elsevier
Science Ireland Ltd. All rights reserved.
Keywords: Anterior cingulate cortex; Supplementary motor area; Error-related negativity; Motor potentials; Event-related potentials; Theta; Oscillations
1. Introduction
When subjects must rapidly discriminate good from bad
targets in a video game, statistical contrasts of brain elec-
trical activity point to a region of midline frontal cortex that
appears to index this decision within 300±400 ms of the
target appearing on the screen (Tucker et al., 1994, 1999).
This evaluative response appears similar to negative event-
related potential (ERP) components observed after errors in
response-locked averages. The error-related negativity
(ERN), or error negativity (Ne), is an electrical wave that
appears approximately 80±100 ms after subjects make an
error (Falkenstein et al., 1991; Gehring et al., 1993). The
similarity of this effect to the evaluative discrimination of
good from bad targets is shown by the response to a feed-
back stimulus that signals whether the response was right or
wrong. A negative de¯ection over midline frontal cortex is
observed in response to an error feedback stimulus that
appears similar to the ERN (Miltner et al., 1997; Badgaiyan
and Posner, 1998).
Electrical source analysis of the Ne/ERN with dense-
sensor arrays has suggested that the effect is localized to
medial prefrontal cortex, including the anterior cingulate
gyrus and supplementary motor area (SMA) (Dehaene et
al., 1994; Holroyd et al., 1998; Luu et al., 2000a). This
localization is consistent with error-related activity recorded
from the anterior cingulate cortex (ACC) and the supple-
mentary eye ®elds in animal studies (Niki and Watanabe,
1979; Gemba et al., 1986; Stuphorn et al., 2000). In
monkeys, an Ne/ERN does not appear during early learning
trials when the animal appears unable to discriminate errors
from correct trials. This apparent requirement for a mental
representation of the correct response is consistent with
suggestions that the Ne/ERN indexes error monitoring
Clinical Neurophysiology 112 (2001) 1295±1306
1388-2457/01/$ - see front matter q 2001 Elsevier Science Ireland Ltd. All rights reserved.
PII: S1388-2457(01)00559-4
www.elsevier.com/locate/clinph
CLINPH 2000170
* Corresponding author. Department of Psychology, University of
Oregon, Eugene, OR 97403, USA. Tel.: 11-541-687-7962; fax: 11-541-
687-7963.
E-mail address: [email protected] (P. Luu).

(Falkenstein et al., 1991, 2000; Gehring et al., 1993).
Others, however, have argued that the Ne/ERN re¯ects
response competition, i.e. between alternative responses
(Carter et al., 1998).
Evidence that complicates the error monitoring view is
that an Ne/ERN-like electrical component may occur on
correct as well as error trials (Ford, 1999; Luu et al.,
2000b; Vidal et al., 2000). Ford refers to the smaller nega-
tivity seen after correct responses as correct-related nega-
tivity (CRN). There are con¯icting views about whether the
CRN and Ne/ERN are indeed the same component. Ford
showed that the CRN and Ne/ERN have different topogra-
phies whereas Luu et al. and Vidal et al. showed that they
have similar topographies. Scheffers and Coles (2000) have
shown that an Ne/ERN still appears in correct trials if
subjects report that they believed the response was in
error. They use this evidence to suggest that the negativity
seen in correct responses could be due to subjects believing
the correct response to be erroneous, suggesting that the
CRN and Ne/ERN are the same component.
Luu et al. (2000b) hypothesized that the Ne/ERN re¯ects
the role of the medial frontal lobe in subjective evaluation of
the action plan. This hypothesis is consistent with the ®nd-
ings on rapid evaluative decisions, and with the evidence
that motivation is essential to observe robust effects on
medial prefrontal electrical activity during error monitoring
(Gehring et al., 1993, 2000; Tucker et al., 1999; Dikman and
Allen, 2000; Luu et al., 2000a). The subjective evaluation of
action must occur for both correct and incorrect responses,
but it appears particularly strong, and thus easily measured,
when an error is detected.
Self-monitoring may be de®cient in certain personality
disorders, such as psychopathy, and it may be exaggerated
in others, such as obsessive-compulsive disorder (OCD).
Dikman and Allen (2000) found that subjects scoring low
on trait socialization (a normal analog of psychopathy)
exhibited smaller Ne/ERN amplitudes than control subjects
when errors were penalized. However, when errors
prevented acquisition of a reward, the low socialization
subjects showed similar Ne/ERNs as controls. These frontal
electrophysiological effects thus seem to parallel the learn-
ing biases (insensitivity to punishment but sensitivity to
reward) of psychopaths. At the other end of the self-moni-
toring spectrum, Gehring et al. (2000) found that OCD
patients had unusually large amplitude Ne/ERNs when
they made errors. Moreover, the amplitude of the Ne/ERN
correlated with OCD symptom severity.
These individual differences in frontal electrophysiology
of self-monitoring are consistent with the changes in beha-
vior after frontal lobe lesions. Patients with medial prefron-
tal lesions often appear unconcerned with the negative
consequences of their actions (Rylander, 1947; Tow and
Whitty, 1953; Tucker et al., 1995). These patients may
continue to make mistakes that seem obviously detrimental
to their goals and life plans (Eslinger and Damasio, 1985).
Nauta (1971) interpreted many of the de®cits of the frontal
lobe patient as `interoceptive agnosia', the faulty knowledge
of the internal feelings that should be an integral part of
evaluating events and action plans. Nauta proposed that
the frontal lobe's primary contribution to behavior is the
integration of motivation with the ongoing control of action.
In his view, the limbic connections of the frontal lobe
provide `set-points' or `navigational markers' for evaluating
the outcomes of actions. As actions are planned, a corollary
discharge from motor control networks not only prepares
sensory networks for the anticipated change in input, but
also limbic networks for the anticipated evaluative qualities
of the plan's outcomes.
If Nauta is correct, then the midline frontal activity in
error monitoring should be closely related to motor control.
In examining individual subjects' response-locked ERP
averages, we observed that the motor potential over the
cortex contralateral to the responding hand was easily
observed if the slow wave (P300 in response to the stimulus)
was eliminated with a high-pass ®lter. Remarkably, the Ne/
ERN then appeared in this ®ltered data set as one of a series
of midline oscillations at the theta (,6 Hz) frequency.
These midline theta waves were apparent on correct as
well as error trials. The present study was conducted to
examine the midline frontal oscillations systematically,
and to examine the hypothesis that they would show a
signi®cant correlation with the electrical activity over
sensorimotor cortex.
2. Method
2.1. Subjects
The data from these subjects have been reported in other
publications (Luu et al., 2000a,b) and are used in this study
to analyze oscillatory activities. The study and use of human
subjects were approved by the University of Oregon's Insti-
tutional Review Board. Twenty-one subjects participated in
the experiment. The subjects were recruited from the
psychology department's subject pool, and they participated
to ful®ll course requirement. The subjects were also offered
the opportunity to earn a monetary reward, the amount of
which was dependent upon their performance. All subjects
had normal or corrected to normal vision and were ¯uent in
English. They ranged in age from 18 to 26 years (mean 19.4
years, SD 1.9). Eight subjects were male and 19 subjects
were right-handed. None of the subjects were currently
taking prescription medications.
2.2. Task
The subjects performed the Eriksen ¯anker task (Eriksen
and Eriksen, 1979). In this task subjects respond with a left
or right hand response to a central target letter (e.g. H or S),
¯anked by letters requiring the same or con¯icting response.
Subjects were presented with a warning cue, an asterisk, at
the center of a screen above a ®xation mark, which was
P. Luu, D.M. Tucker / Clinical Neurophysiology 112 (2001) 1295±13061296

present for the entire experiment. The warning cue was
presented for 804 ms, after which it was replaced with
one of the following string of target letters: HHHHH,
SSHSS, SSSSS, HHSHH. The bottom of the letter strings
was 0.18 above the ®xation mark and each letter subtended
0.58. The probability of each string of letters was 0.25. The
target letter string was presented for 107 ms. The subject's
task was to indicate as quickly and as accurately as possible
which letter was in the center by pressing a key with one
hand if the center letter of the target string was an H and
another key with the opposite hand if the center letter was an
S (keys were counterbalanced across subjects). The timing
of the reaction time began with the presentation of the
target. After the response interval, a feedback signal inform-
ing the subject of the status of the response was presented
above the ®xation mark (Luu et al., 2000a).
2.3. EEG acquisition
EEG was recorded from 128 scalp sites using the 128-
channel Geodesic Sensor Net (Tucker, 1993). This device
arrays EEG electrodes in a regular distribution across the
head surface, with an approximately 3 cm inter-sensor
distance. The impedance of all electrodes was between 10
and 40 kV. All recordings were initially referenced to Cz
and subsequently re-referenced to the average reference
prior to data analysis. EEG was recorded using a 0.1±50
Hz bandpass (3 dB attenuation). The signals were sampled
at 125 samples per second and were digitized with a 12 bit
A/D converter. The EEG was then averaged and aligned
with the button press separately for correct and error
responses according to the response hand. The EEG was
then digitally ®ltered with a wide-band 4±12 Hz digital
®lter, which with these data has the primary effect of remov-
ing the large slow waves (e.g. contingent negative variation
and late positive complex) which masked the oscillatory
components seen in the present data. The digital ®lter that
was used is a ®nite impulse response (FIR) ®lter with zero
phase-shift.
2.4. Source analysis
The grand-averaged data were submitted to source
analyses using both spatiotemporal equivalent dipole
(MEGIS, 1999) and linear inverse (ANT, 2000) models.
The spatiotemporal equivalent dipole analysis began with
source locations indicated by the analysis of steady-state
movement potentials by Gerloff et al. (1998a). First, two
mirror dipoles were used and the search was constrained
to the motor peak (MP) window (248 ms to response
onset). This was accomplished separately for the left- and
right-hand correct responses. The resulting model was used
for the other movement-related potentials for both the
correct and error responses.
The analysis of the Ne/ERN generator was also guided by
the results of previous analyses (Dehaene et al., 1994;
Holroyd et al., 1998; Luu et al., 2000a). A single dipole
was used to model the 48±152 ms window. Once the posi-
tions of the movement-related and Ne/ERN dipoles were
obtained for each response hand, the positions were ®xed
(the orientations were free to vary). Examination of the
residual variance (RV) then showed that an additional
source was necessary to approximate the surface potentials
for the window spanning 120 ms before to 160 ms after the
response. Consistent with the focal frontal polar ®elds seen
in the scalp voltage maps, this fourth dipole source was ®t
by the inverse modeling to orbital frontal cortex.
These 4 dipoles constitute the hypothesized number of
generators, based upon surface topography. Moreover,
their locations were hypothesized on the basis of previous
results and known features of brain anatomy. The two
dipoles used to model the movement-related potentials
were expected to be located in regions adjacent to the
central gyri. The dipole sources representing the vertex
potentials (including the Ne/ERN) were expected to be
located in the dorsomedial, prefrontal cortex. Finally, the
scalp topography (focal gradients over the forehead) indi-
cated that an additional source was probably located in the
ventromedial, orbital frontal cortex. The utility of additional
sources was evaluated based on the ability of the additional
dipole(s) to account for additional variance, and upon the
stability of the solutions. In each model, a ®nal solution was
considered to be adequate when the RV for both correct and
error conditions of the same response hand was less than
20%.
For cross-validation of the equivalent dipole analysis, we
submitted the data to a linear inverse analysis. This
approach estimates the current density throughout the
volume of the head, avoiding the need to restrict the number
of active sources. Because the number of current sources
that must be solved is typically much greater than the
number of recording sensors, the problem is underdeter-
mined. Assumptions are therefore made about what can be
expected as the appropriate solution. A minimum norm
method gives a solution based upon the assumption of mini-
mal source moments. A weighted minimum norm, used
here, balances the solution against the inherent bias to
favor super®cial sources, which explain the scalp data
with less energy, i.e. a lower minimum norm, than deep
sources (KnoÈsche et al., 1996).
Whereas the equivalent dipole model (BESA) was based
on a spherical head model, the weighted minimum norm
analysis was based on a boundary element head model
(BEM). This model was derived from a typical subject
brain that has been transformed into Tailarach space (avail-
able from the Montreal Neurological Institute). The solution
was constrained to the cortical surface, allowing for the
source moments to be normal to the cortical surface.
Because the medial surface of the brain is not assessable
in our boundary element model, cortical sources in the
medial hemisphere can not be modeled accurately. There-
fore, the equivalent dipole model is required to identify deep
medial sources.
P. Luu, D.M. Tucker / Clinical Neurophysiology 112 (2001) 1295±1306 1297
2.5. Identifying the electrical components
Because of the similarity in wave shape between the elec-
trical components seen in the present analyses, the precise
spatiotemporal information gained from the dense-array
electrical ®eld animations (head surface potential map
movies) was crucial for the de®nition of each component.
We relied on the descriptions of motor potentials by Gerloff
et al. (1998a,b) to identify the components of the averaged
ERPs associated with motor areas. The pre-response motor
peak (pre-MP) was de®ned as an average of the negative
de¯ections occurring between 2110 and 250 ms prior to
response onset (0 ms in the average) at vertex (Cz) and Fz
sites. The MP potential was de®ned as the average of the
potentials over 4 contralateral central channels (one of
which was either C3 or C4, depending on the response
hand, and the other 3 were 3 cm caudal to these channels)
whose maximal latency was between 248 ms and response
onset. Using the same set of channels, the post-motor peak
(post-MPI) was de®ned as the average of the potentials
between 24 and 72 ms after response onset. The topography
of the Ne/ERN is similar to that of the pre-MP, but its
latency is approximately 80±100 ms after the button press.
Therefore, the Ne/ERN was de®ned as an average of the
potentials occurring in the same channels as the pre-MP,
but occurring within a window 48±152 ms post-response.
A second post-motor peak (post-MPII) can be observed in
all conditions. The post-MPII was de®ned, using the same
channels used for the MP, as the average negative peaks
between 88 and 160 ms after response onset. Finally, the
®rst negative peak of the orbital frontal potential was
de®ned as an average of the peaks at two recording sites 3
cm rostral to Fp1 and Fp2, whose latencies were between
response onset and 80 ms post-response.
The latency for each component was determined by using
the latency, averaged over channels, of the peaks identi®ed
in the amplitude analysis. The time of response onset was
used as the reference point for latency measures.
3. Results
3.1. Separating oscillations from slow waves
When an Ne/ERN-like de¯ection is observed in correct
trials, it is most prominent at mediofrontal recording sites
(e.g. Fcz). At midfrontal sites, negative de¯ections in the
ERP can be observed prior to the button press and after the
Ne/ERN for both correct and error responses (see Figs. 1
and 2). The sequence of these negative de¯ections appears
to be periodic, but it is swamped by the large slow waves of
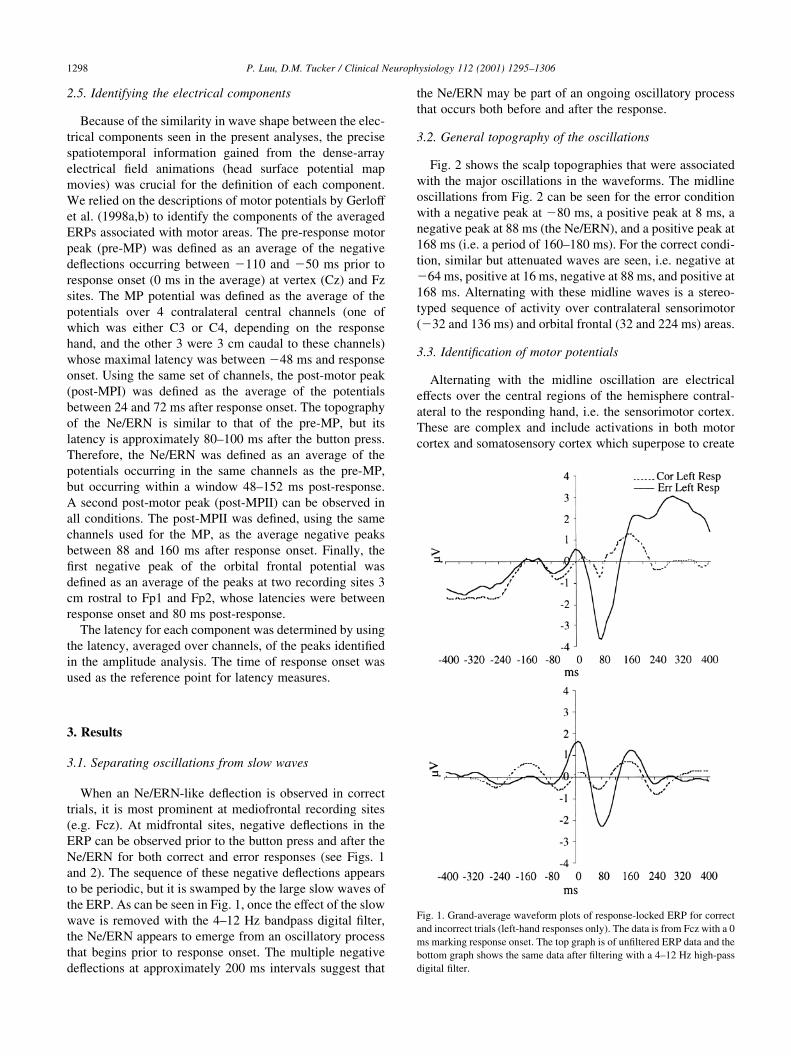
the ERP. As can be seen in Fig. 1, once the effect of the slow
wave is removed with the 4±12 Hz bandpass digital ®lter,
the Ne/ERN appears to emerge from an oscillatory process
that begins prior to response onset. The multiple negative
de¯ections at approximately 200 ms intervals suggest that
the Ne/ERN may be part of an ongoing oscillatory process
that occurs both before and after the response.
3.2. General topography of the oscillations
Fig. 2 shows the scalp topographies that were associated
with the major oscillations in the waveforms. The midline
oscillations from Fig. 2 can be seen for the error condition
with a negative peak at 280 ms, a positive peak at 8 ms, a
negative peak at 88 ms (the Ne/ERN), and a positive peak at
168 ms (i.e. a period of 160±180 ms). For the correct condi-
tion, similar but attenuated waves are seen, i.e. negative at
264 ms, positive at 16 ms, negative at 88 ms, and positive at
168 ms. Alternating with these midline waves is a stereo-
typed sequence of activity over contralateral sensorimotor
(232 and 136 ms) and orbital frontal (32 and 224 ms) areas.
3.3. Identi®cation of motor potentials
Alternating with the midline oscillation are electrical
effects over the central regions of the hemisphere contral-
ateral to the responding hand, i.e. the sensorimotor cortex.
These are complex and include activations in both motor
cortex and somatosensory cortex which superpose to create
P. Luu, D.M. Tucker / Clinical Neurophysiology 112 (2001) 1295±13061298
Fig. 1. Grand-average waveform plots of response-locked ERP for correct
and incorrect trials (left-hand responses only). The data is from Fcz with a 0
ms marking response onset. The top graph is of un®ltered ERP data and the
bottom graph shows the same data after ®ltering with a 4±12 Hz high-pass
digital ®lter.

the scalp electrical ®elds. To identify these from the scalp
maps, we will refer to the component nomenclature used by
Gerloff et al. (1998a).
Gerloff et al. (1998a) observed a centroparietal negativity
prior to EMG onset and referred to this component as the
pre-MP. This appears similar in latency, and in some topo-
graphic features, with the initial midline negativity (280
and 264 ms for the left hand in Fig. 2). The second compo-
nent is a negative de¯ection of the scalp potential over
central and parietal regions contralateral to the response
hand, peaking between 232 and 28 ms. This appears to
be the motor peak or MP reported by Gerloff et al. (1998a).
Roughly coincident with the parietal negativity of the MP
is a positivity over the vertex. This positivity gives the MP
the look of a tangentially-oriented, dipolar, potential ®eld
(see the 28 and 232 ms maps). However, inspection of the
scalp electrical ®eld animations indicates that the positivity
is most probably a separate electrical event from the MP.
When the electrical topographies are animated in sequence,
the time course (onset, peak, and offset) of the negativity is
dissociated from the time course of the positivity; if they
re¯ected a single dipolar source they would be exactly coin-
cident. The positivity seen at 28 and 232 ms continues to
develop until it takes the form of the midline positivity
peaking between 8 and 16 ms after the button press.
The next major event is seen over orbital frontal regions.
This negative peak begins as the vertex positivity fades,
such that its onset can be seen in the 8 ms map (Fig. 2)
for the error condition. The orbital frontal negativity is
well-developed by 56 ms (for both conditions). At this
time, it overlaps with a positivity over contralateral motor
cortex. This positivity was described as the post-MPI by
Gerloff et al. (1998a).
For the error responses, the Ne/ERN emerges during the
peak of the post-MPI and then reaches a maximum approxi-
mately 80±100 ms after the button press. For the correct
responses, an attenuated but similar component is seen at
88 ms.
The next component has a similar topography as the MP
but its latency is between 136 and 144 ms after the button
press. We refer to this second negative post-motor compo-
nent as the post-MPII. In the present data, the post-MPII is
different from the MP in that there is a smaller negative
de¯ection over the ipsilateral parietal regions for the correct
conditions than for the error condition. As with the MP, this
feature is also associated with a vertex positivity that peaks
slightly later (i.e. at 168 ms). After this point, there is a
suggestion that the midline oscillations continue brie¯y,
but there are no clear repetitions of the previous topographic
sequences.
3.4. Linear inverse estimation of cortical current density
Fig. 3 presents the results from the weighted minimum
P. Luu, D.M. Tucker / Clinical Neurophysiology 112 (2001) 1295±1306 1299
Fig. 2. Polar topographies of the oscillatory potentials. The view is down on the head with the nose at the top. The top row is the correct responses, and the
bottom row is the error responses, both shown only for the left hand.
Fig. 3. Source solutions derived from the weighted minimum norm method. Displayed solutions are for left-hand responses.

norm analysis for the left- and right-hand responses. These
cortical maps generally parallel the scalp surface maps in
Fig. 2, but with some important differences. Similar to the
surface midline oscillations, these analyses continue to
show the alternation of the current density sources and
sinks along the midline of the prefrontal cortex.
As with the scalp maps, the oscillation of the midline
current density can be observed for both correct and error
responses regardless of the response hand, but it is much
larger for the error responses. At approximately 88 ms after
response onset, the current sink is observed as the Ne/ERN.
In these source estimations, the biggest region of current
density is medial and just anterior to the central sulci of
both hemispheres, but there is also additional activity
along the rostral banks of the medial surface of the hemi-
spheres. This pattern is more revealing than the Ne/ERN
seen in the scalp maps.
The pre-MP appears to be modeled primarily by the
current density along the midline of the prefrontal lobe.
Because of the inaccessibility of the medial surface in the
BEM of the cortex, the actual distribution of the active
cortex is likely to be along the medial surface, perhaps in
the region of the ACC or SMA as identi®ed by the dipole
source analyses below.
The motor-related surface potentials can also be observed
in the cortical current density estimations. In Fig. 3, the MP
(28 and 232 ms) is seen as inward current ¯ows (sinks) in
cortical areas adjacent to the central sulcus of the contral-
ateral hemisphere for all the responses, although, interest-
ingly, it is more bilateral for the errors made with the left
hand. Outward current ¯ows (sources) over the same corti-
cal regions are observed for the post-MPI. During the post-
MPII interval, there is inward current ¯ow around the region
of the central gyrus. Finally, the orbital frontal negativity is
modeled by the linear inverse estimation as inward current
¯ow in orbital frontal and anterior temporal cortices (not
displayed by the views shown in Fig. 3).
3.5. Dipole source estimation of cortical activity
A converging perspective of the neural sources of the
scalp ®elds is provided by dipole source analysis. The
mirror dipoles (sources 1 and 2, see Fig. 4) situated anterior
to the central sulci are located slightly more medial in the
right-hand condition than in the left-hand condition. Source
3 is located in midline prefrontal cortex (around the region
of the ACC and/or SMA). It is located slightly left of
midline in the right-hand condition. Source 4 is located in
the ventromedial orbital frontal region. Its location is quite
similar between the two responses. This is a deep source,
and the dipole model may be trying to account for bilateral
temporal pole activity as well as orbital frontal activity. Fig.
4 illustrates the locations of the 4 dipoles for correct and
error responses made with the left hand. The 4 dipole model
serves as an adequate model for the entire epoch (left-hand
error RV � 10%, left-hand correct RV � 14%, right-hand
error RV � 13%, and right-hand correct RV � 10%).
Fig. 5 shows the relative contribution of each source to
the recorded scalp potential for the left- and right-hand
conditions. Unlike the report by Gerloff et al. (1998a), the
bilateral dipoles located adjacent to the central sulci were
unable to account for a signi®cant proportion of variance in
the pre-MP interval. Instead, the pre-MP is better modeled
by sources 4 (for the right-hand correct response) and 3 (for
the left-hand correct and error responses). This is expected
given the difference between the nature of the responses in
the Gerloff et al. report (fast steady-state movements) and
the present study (slower planned responses). In the present
study, it is likely that response preparation involves the
medial pre-motor areas (e.g. SMA). During the MP interval,
the bilateral sources adjacent to the central sulci contribute
substantially to the MP. The source on the contralateral side
is larger and reaches its peak as the correct button press
approaches. For the left-hand error response, there is bilat-
eral activity during the interval leading up to the button
press (similiar to the linear inverse solution), but the contral-
ateral source is more sustained and larger.
At the time of the button press, the contralateral source
adjacent to the central sulcus begins to wane, and source 3
begins to peak positively in all conditions. Consistent with
the oscillations seen in the scalp topographies, the orienta-
tion of source 3 during this time is in the opposite direction
(i.e. positive) from that during the pre-MP interval and is
clearly larger for error than for correct responses. Next, as
P. Luu, D.M. Tucker / Clinical Neurophysiology 112 (2001) 1295±13061300
Fig. 4. Intracranial locations of the equivalent dipole electrical sources for
correct and error responses made with the left hand.

source 3 begins to fade, source 4 becomes active. This acti-
vation of source 4 accounts for the appearance of the orbital
frontal negativity. As this source weakens, the contralateral
movement-related source becomes active again, but its
activity is in the opposite direction as it accounts for the
post-MPI. Source 3 becomes active during the time of the
post-MPI and peaks shortly thereafter. As can be seen in
Fig. 5, it is overwhelmingly larger for error conditions; this
is the standard Ne/ERN effect. The post-MPII is then
modeled by the activity of the contralateral, movement-
related source and is followed by source 3 peaking to
account for the vertex positivity.
In summary, the two source estimation approaches, with
differing assumptions and methods, converge to provide
similar views of brain activity. However, each approach
also gave a unique perspective on the data. For example,
the weighted minimum norm solution made the spatial
oscillations much more apparent and showed that the Ne/
ERN is made up of a distributed source along the midline
(suggesting that there may be two distinct regions of active
cortex). On the other hand, the equivalent dipole approach
was able to model activity on the medial surface of the
prefrontal lobe that could not be modeled using the current
BEM of the cortical surface.
3.6. Statistical analyses of midline and motor oscillations
To examine the stability of the amplitude differences
P. Luu, D.M. Tucker / Clinical Neurophysiology 112 (2001) 1295±1306 1301
Fig. 5. Waveforms illustrating the time course of each source for correct and error responses made with the left and right hand.

between the correct and error responses for each of the
components, paired t tests were conducted. Table 1 presents
the results of the paired t test for each component. Only the
pre-MP and orbital frontal negativity amplitudes failed to
show signi®cant differences between the correct and error
conditions. It should be noted that several components are
highly consistent across subjects, such that even small
differences were statistically signi®cant. Overall, the
components are ampli®ed for the error condition, with the
exception of the MP, which was attenuated.
Paired t tests were performed to assess differences in peak
latency between correct and error responses for each
component. Table 2 presents the results of the latency analy-
sis. Prior to the response, the pre-MP and the MP reach their
peaks substantially earlier for the error responses than the
correct responses. After the response, the peak of the post-
MPII is substantially earlier for the error condition.
Next, analyseswere completed to investigate the relationof
the Ne/ERN to the other oscillatory components. Table 3
presents the correlations between the Ne/ERN amplitude
and the other 5 peak events. It can be seen that for correct
responses there are no relations between the Ne/ERN and
any other component. For error responses, the Ne/ERN was
correlatedmoststronglywith thepre-MP,MP,andpost-MPII.
It was only weakly related to the orbital frontal negativity.
4. Discussion
In the response-locked averages of dense-array record-
ings, oscillatory-like dips and peaks often can be observed
at medial frontal recording sites. When an error is made, the
Ne/ERN becomes a prominent dip. Because most reaction
times fall within the stimulus-locked P300 window (300±
500 ms post-stimulus), response-related events are super-
imposed on the P300. The Ne/ERN is readily apparent in
response-locked averages because of its large amplitude.
However, because other response-related events are
comparatively smaller, they are either not visible because
of the superimposed P300, or they are only observed at
recording sites (e.g. frontal) where the P300 is minimal.
By removing the large amplitude of the P300 and other
slow potentials with a 4±12 Hz ®lter, we were able to
observe the oscillatory components of the ERP that re¯ect
both activity in lateral motor cortex and activity in midline
frontal and orbital frontal cortices.
4.1. The Ne/ERN and midline oscillations
Statistical analyses revealed that the amplitude of the Ne/
ERN component, the negative de¯ection about 80 ms post-
response, was greater following errors. The analysis also
demonstrated that there were no latency differences between
the Ne/ERN associated with correct or error responses.
These ®ndings replicate previous reports showing that the
Ne/ERN is present in both types of responses but is largest
when errors are committed (Luu et al., 2000b; Vidal et al.,
2000).
The ®nding that the Ne/ERN is present in both correct and
error responses has raised some questions about the nature
of the process(es) indexed by the Ne/ERN. To account for
this ®nding, some researchers have suggested the Ne/ERN
may re¯ect the response checking process rather than the
error detection process (Falkenstein et al., 2000; Vidal et al.,
2000). Others have argued that the Ne/ERN does indeed
re¯ect an error detection process, and that the Ne/ERN asso-
ciated with correct responses could be due to the fact that
correct trials can contain trials that subjects believe were
P. Luu, D.M. Tucker / Clinical Neurophysiology 112 (2001) 1295±13061302
Table 1
Paired t tests of amplitude differences
Correct mean
(mV)
Error mean
(mV)
t value P value
Pre-MP 22.2 22.4 0.5 NS
MP 21.8 21.5 2.1 ,0.05
Orbitofrontal negativity 22.7 23.2 0.8 NS
Post-MPI 0.4 0.6 22.5 ,0.03
Ne/ERN 1.3 23.8 5.2 ,0.001
Post-MPII 21.0 21.9 4.5 ,0.001
Table 2
Paired t tests of latency differences
Correct mean (ms) Error mean (ms) t value P value
Pre-MP 242.0 293.0 7.01 ,0.001
MP 225.0 232.0 2.1 ,0.05
Orbitofrontal negativity 47.0 42.0 1.46 NS
Post-MPI 60.0 60.0 0.11 NS
Ne/ERN 86.0 90.0 0.88 NS
Post-MPII 127.0 119.0 2.2 ,0.05
Table 3
Ne/ERN correlation with movement-related and orbitofrontal components
sorted by response type
Variable Correct Errors
r value P value r value P value
Pre-MP 0.12 NS 0.53 ,0.02
MP 20.32 NS 0.52 ,0.02
Orbitofrontal negativity 20.04 NS 0.39 ,0.09
Post-MPI 0.01 NS 20.28 NS
Post-MPII 0.30 NS 0.49 ,0.05

erroneous even when the trials were indeed correct (Schef-
fers and Coles, 2000). Another hypothesis put forth by Falk-
enstein et al. is that the Ne/ERN seen after correct trials
re¯ects response comparison processes and that the Ne/
ERN observed after error responses re¯ects the response
comparison plus an overlaid error signal. This latter hypoth-
esis relies on the assumption that response checking and the
error signaling processes temporally and spatially overlap,
because no differences in topography nor latency were
observed between the Ne/ERNs associated with correct or
error responses in the present study, which is consistent with
the reports of Vidal et al. (2000) and Luu et al. (2000b). It
should be noted, however, that Ford (1999) did ®nd a differ-
ent topography for correct responses.
Although the midline oscillation observed in the present
study is only a few cycles, it shows the periodicity (150±200
ms) of the frontal midline theta that has been described in
the ongoing EEG during mental effort (Schacter, 1977;
Mizuki et al., 1980; Sasaki et al., 1996). Moreover, the
functional nature of the frontal midline theta may be rele-
vant to functional interpretations of the Ne/ERN. In tasks in
which dif®culty is increased by inducing time pressures or
increasing demands on working memory, increases in fron-
tal midline theta are often observed (Gevins et al., 1997;
Slobounov et al., 2000). In a maze task in which subjects
have to navigate a ball through a maze while making sure
that the ball does not touch the walls of the maze, Slobounov
et al. (2000) found that successful trials were associated
with larger theta amplitudes than failed trials.
Frontal midline theta increases in infants have been
shown to be associated with emotion-related experience
such as tickling, kissing, and suckling (Maulsby, 1971).
More recent research with 2±11 month old infants has
also shown theta increases under similar conditions (Futagi
et al., 1998). However, Futagi et al. found theta distribution
to vary with each condition. In comparison to suckling and
crying, theta increases were largest over frontal midline
sites when infants handled an object. An increase in frontal
midline in infants has also been reported under conditions
that solicit emotional reactions and in which internal atten-
tional control is required (Stroganova et al., 1998). In adults,
decreased frontal midline theta is associated with increased
anxiety (Suetsugi et al., 1998). Suetsugi et al. found that
administration of anxiolytic drugs increases frontal midline
theta in anxious patients.
In the present study, the source of the centromedial oscil-
lation (including the Ne/ERN) was localized by both dipole
and cortically-constrained linear inverse analyses to the
ACC and or SMA, which is consistent with ®ndings
reported in previous EEG studies (Dehaene et al., 1994;
Miltner et al., 1997; Holroyd et al., 1998; Luu et al.,
2000a). In more recent analysis of both grand-averaged
and single subject data, we found the source of the Ne/
ERN to be consistent with an SMA location (Luu et al.,
2001). Given the scalp distribution of the frontal midline
theta, a source in the ACC would be expected. Using dense-
array EEG, Gevins et al. (1997) found that a source within
the ACC can generate the frontal midline theta. More recent
source analysis results identi®ed an additional source in the
region of the SMA (Asada et al., 1999). Asada et al. showed
that two sources, one in the ACC and the other in the region
of the SMA, were required to account for the frontal midline
theta activity. These sources were alternately activated
approximately 40±1208 out of phase for one theta cycle.
Although previous reports have not identi®ed two medial
sources for the generation of Ne/ERN, the ®nding that in
some studies the source of the Ne/ERN is located in the
SMA while in others it is in the ACC, coupled with the
®ndings reported by Asada et al. (1999), raises an interest-
ing possibility that two sources may be active during the
time of the Ne/ERN. Indeed, results from the cortically-
constrained linear inverse analysis in this study suggest
the involvement of a broader region in the generation of
the Ne/ERN that is more consistent with two sources than
one. In dipole models, an average of the two sources would
result in a single-source solution located half-way between
the two sources, as suggested by Asada et al. (1999). This
possibility has theoretical implications for the hypothesis
put forth by Falkenstein et al. (2000). It may be that
response checking processes are indexed by the activity of
one source and error output by the other. Additional experi-
ments will be required to investigate this possibility.
4.2. Alternating sensorimotor activations
In the present research, we observed that the sensorimotor
cortex activations associated with the response alternated
with the midline theta activity (Figs. 2 and 3). Although
there were several differences between the potentials in
the dense-array recording from earlier sparse-array studies
(Nagamine et al., 1994; Kristeva-Feige et al., 1997; Gerloff
et al., 1998b), such as for the pre-MP or pre-motor peak,
there was good agreement for the MP and post-MPI over
contralateral motor cortex just prior to the response.
The MP is thought to re¯ect motor cortex activation asso-
ciated with response execution (Nagamine et al., 1994; Kris-
teva-Feige et al., 1997; Gerloff et al., 1998b). After this the
post-MPI or post-motor ®eld (pMFI ± from magnetoence-
phalography (MEG)) is observed, which is thought to re¯ect
sensory afferents to somatosensory cortices or secondary
movements (Kristeva-Feige et al., 1997). In the MEG litera-
ture, there is another component referred to as the pMFII. In
the present results, this component (the post-MPII) appeared
to re¯ect an additional activation of motor cortex, about 140
ms after the response (see Figs. 3 and 4).
Results from the latency analysis suggest that the pre-MP
and MP occur much earlier relative to the button press in the
error condition than in the correct condition. In other words,
the response itself appears to be delayed in relation to both
the pre-MP and the MP for the error condition. The ampli-
tude analysis demonstrated that the amplitude of the MP is
smaller in the error condition than in the correct condition.
P. Luu, D.M. Tucker / Clinical Neurophysiology 112 (2001) 1295±1306 1303

Taken together, these ®ndings suggest that corrective
mechanisms may have already been initiated prior to the
button press and the appearance of the Ne/ERN in error
conditions. This ®nding is consistent with the ®ndings that
during error responses corrective EMG activations are
initiated prior to the button press and when the error
response is made the response force is signi®cantly weaker
(Gehring et al., 1993; Gehring and Fencsik, 1999).
4.3. Orbitofrontal activation
Previous studies have found a stimulus-locked frontal
polar potential that is related to motor responses. Makeig
et al. (1999) identi®ed a frontal polar component that is
related to response production. These researchers found
that this component's peak latency was nearly simultaneous
with subcortical motor commands in fast responders. Potts
and Tucker (2001) also observed a similar frontal polar
component that is correlated with reaction time. However,
this component is not necessarily dependent upon overt
responses. In a task in which subjects are required to
respond yes or no to the self-relevancy of trait descriptive
words, we have found that a frontal polar component
predicted whether a subject was going to endorse or reject
a trait word (Tucker et al., 2001). It should be noted that in
these studies the frontal polar components were observed in
stimulus-locked averages. In contrast, the frontal polar
component observed in the present study is synchronized
with the response. To investigate if the latency of the orbital
frontal component is related to reaction time, we conducted
a correlational analysis. The correlation with reaction time
was not signi®cant. This is not surprising given the fact that
the component peaks after response onset. However, as
shown by Potts and Tucker (2001) and Tucker et al.
(2001) the stimulus-locked frontal polar component is not
critically dependent upon the immediate response. Our
analysis did not reveal any amplitude or latency differences
between correct and error conditions for this component,
nor was it signi®cantly related to the Ne/ERN.
In a recent fMRI study, Menon et al. (2001) reported
bilateral activation in the anterior insula lateral orbital fron-
tal regions when subjects make an erroneous response.
These authors speculated that these regions may be involved
in articulation of action. It is likely that the orbital frontal
activation observed in the present study is a result of bilat-
eral orbital frontal or temporal/insula activities, as
suggested by the linear inverse solution. The functional
signi®cance of the orbital frontal component observed in
this study and its relation to medial frontal responses in
action evaluation remain to be clari®ed with additional
experiments.
4.4. Coupling of midline and motor activity
Statistical analyses revealed a number of signi®cant rela-
tions between the midline and sensorimotor oscillations
when an error was made. The correlation of component
peak latency revealed that the amplitudes of the move-
ment-related oscillations, such as the MP and post-MPII,
are signi®cantly correlated with the midline oscillations
(i.e. the Ne/ERN) only when errors are committed. It is
possible that the lack of correlation between the Ne/ERN
and sensorimotor oscillations for correct responses is due to
a poorer signal-to-noise ratio caused by smaller amplitudes
of the Ne/ERN, post-MP, and post-MPII in the correct
condition. However, for the pre-MP and orbital frontal
negativity, there were no amplitude differences. Moreover,
the MP amplitude is actually larger for correct responses.
Nevertheless, correlation analyses provide compelling
evidence for action regulation by means of interactions
between medial frontal limbic and sensorimotor areas.
Studies of hippocampal projections to the cingulate gyrus
in rabbits have suggested that as the animal prepares to
make a learned response, unit activity in the hippocampal-
cingulate projections becomes increasingly synchronized in
theta bursts (Gabriel et al., 1986; Gabriel, 1990). Although
the role of the cingulate gyrus in regulating response learn-
ing appears to be a complex one, depending on the animal's
evaluation of the behavioral context (Gabriel et al., 1986;
Freeman et al., 1996), the result appears to be a direct modu-
lation of the out¯ow to the corticostriatal motor control
circuits (Gabriel et al., 1986; Gabriel, 1990).
Each of the major sites of the response-locked oscillation
in the present data is a target of one of the corticostriatal
loops linking speci®c regions of the striatum and thalamus
with speci®c regions of frontal and motor cortex (Alexander
et al., 1986; Alexander, 1994; Groenewegen and Berendse,
1994; Groenewegen et al., 1997). Of the identi®ed corticos-
triatal loops, the anterior cingulate, the lateral orbital, and
the motor corticostriatal circuits (Alexander, 1994) are most
relevant to the present ®ndings, given the source locations of
the observed oscillations. It remains for future studies to
investigate how and under what conditions do midline fron-
tal structures interact with and regulate premotor and
sensorimotor cortices to produce learning and adaptive
behavior.
Acknowledgements
This research was supported by National Institutes of
Mental Health grants #MH42129, and #MH42669 and
National Institute on Aging grant #AG17399 to D.M.T.
We thank Thomas KnoÈsche for help with the linear inverse
method of source estimation and Douglas Derryberry,
Michael Posner, and the anonymous reviewers for their
insightful reviews.
References
Alexander GE. Basal ganglia-thalamocortical circuits: their role in control
of movements. J Clin Neurophysiol 1994;11:420±431.
Alexander GE, DeLong MR, Strick PL. Parallel organization of function-
P. Luu, D.M. Tucker / Clinical Neurophysiology 112 (2001) 1295±13061304

ally segregated circuits linking basal ganglia and cortex. Annu Rev
Neurosci 1986;9:357±381.
ANT. Advance source analysis. Enschede, 2000.
Asada H, Fukuda Y, Tsunoda S, Yamaguchi M, Tonoike M. Frontal
midline theta rhythms re¯ect alternative activation of prefrontal cortex
and anterior cingulate cortex in humans. Neurosci Lett 1999;274:29±32.
Badgaiyan RD, Posner MI. Mapping the cingulate cortex in response selec-
tion and monitoring. Neuroimage 1998;7:255±260.
Carter CS, Braver TS, Barch DM, Botvinick MM, Noll D, Cohen JD.
Anterior cingulate cortex, error detection, and the online monitoring
of performance. Science 1998;280:747±749.
Dehaene S, Posner MI, Tucker DM. Localization of a neural system for
error detection and compensation. Psychol Sci 1994;5:303±305.
Dikman ZV, Allen JJB. Error monitoring during reward and avoidance
learning in high and low-socialized individuals. Psychophysiology
2000;37:43±54.
Eriksen CW, Eriksen BA. Target redundancy in visual search: do repeti-
tions of the target within the display impair processing? Percept Psycho-
phys 1979;26:195±205.
Eslinger PJ, Damasio AR. Severe disturbance of higher cognition after
bilateral frontal lobe ablation. Neurology 1985;35:1731±1741.
Falkenstein M, Hohnsbein J, Hoormann J, Blanke L. Effects of crossmodal
divided attention on late ERP components. II. Error processing in choice
reaction tasks. Electroenceph clin Neurophysiol 1991;78:447±455.
Falkenstein M, Hoorman J, Christ S, Hohnbein J. ERP components on
reaction errors and their functional signi®cance: a tutorial. Biol Psychol
2000;51:87±107.
Ford JM. Schizophrenia: the broken P300 and beyond. Psychophysiology
1999;36:667±682.
Freeman Jr. JH, Cuppernell C, Flannery K, Gabriel M. Limbic thalamic,
cingulate cortical and hippocampal neuronal correlates of discrimina-
tive approach learning in rabbits. Behav Brain Res 1996;80:123±136.
Futagi Y, Ishihara T, Tsuda K, Suzuki Y, Goto M. Theta rhythms associated
sucking, crying, gazing and handling in infants. Electroenceph clin
Neurophysiol 1998;106:392±399.
Gabriel M. Functions of anterior and posterior cingulate cortex during
avoidance learning in rabbits. Prog Brain Res 1990;85:467±483.
Gabriel M, Sparenborg SP, Stolar N. An executive function of the hippo-
campus: pathway selection for thalamic neuronal signi®cance code. In:
Isaacson RL, Pribram KH, editors. The hippocampus. New York:
Plenum, 1986. pp. 1±39.
Gehring WJ, Fencsik D. Slamming on the brakes: an electrophysiological
study of error response inhibition. Poster presented at the Annual Meet-
ing of the Cognitive Neuroscience Society, Washington, DC, 1999.
Gehring WJ, Goss B, Coles MGH, Meyer DE, Donchin E. A neural system
for error detection and compensation. Psychol Sci 1993;4:385±390.
Gehring WJ, Himle J, Nisenson LG. Action monitoring dysfunction in
obsessive-compulsive disorder. Psychol Sci 2000;11:1±6.
Gemba H, Sasaki K, Brooks VB. ªErrorº potentials in limbic cortex (ante-
rior cingulate area 24) of monkeys during motor learning. Neurosci Lett
1986;70:223±227.
Gerloff C, Uenishi N, Hallet M. Cortical activation during fast repetitive
®nger movements in humans: dipole sources of steady-state movement-
related cortical potentials. J Clin Neurophysiol 1998a;15:502±513.
Gerloff C, Uenishi N, Nagamine T, Kunieda T, Hallett M, Shibasaki H.
Cortical activation during fast repetitive ®nger movements in humans:
steady-state movement-related magnetic ®elds and their cortical
generators. Electroenceph clin Neurophysiol 1998b;109:444±453.
Gevins A, Smith ME, McEvoy L, Yu D. High-resolution EEG mapping of
cortical activation related to working memory: effects of task dif®culty,
type of processing, and practice. Cereb Cortex 1997;7:374±385.
Groenewegen HJ, Berendse HW. Anatomical relationships between the
prefrontal cortex and the basal ganglia in the rat. In: Thierry A-M,
Glowinski J, Goldman-Rakic PS, Christen Y, editors. Motor and cogni-
tive functions of the prefrontal cortex. New York: Springer-Verlag,
1994. pp. 51±77.
Groenewegen HJ, Wright CI, Uylings HBM. The anatomical relationships
of the prefrontal cortex with limbic structures and basal ganglia. J
Psychopharmacol 1997;11:99±106.
Holroyd CB, Dien J, Coles MGH. Error-related scalp potentials elicited by
hand and foot movements: evidence for an output-independent error-
processing system in humans. Neurosci Lett 1998;242:65±68.
KnoÈsche T, Praamstra P, Stegeman D, Peters M. Linear estimation discri-
minates midline sources and a motor cortex contribution to the readi-
ness potential. Electroenceph clin Neurophysiol 1996;99:183±190.
Kristeva-Feige R, Rossi S, Feige B, Mergner T, LuÈcking CH, Rossini PM.
The bereitschaftspotential paradigm in investigating voluntary move-
ment organization in humans using magnetoencephalography (MEG).
Brain Res Protocols 1997;1:13±22.
Luu P, Collins P, Tucker DM. Mood, personality, and self-monitoring:
negative affect and emotionality in relation to frontal lobe mechanisms
of error monitoring. J Exp Psychol: General 2000a;129:43±60.
Luu P, Flaisch T, Tucker DM. Medial frontal cortex in action monitoring. J
Neurosci 2000b;20:464±469.
Luu P, Tucker DM, Derryberry D, Reed M, Poulsen C. Activity in human
medial frontal cortex in emotional evaluation and error monitoring,
2001, submitted for publication.
Makeig S, Wester®eld M, Jung T-P, Covington J, Townsend J, Sejnowski
TJ, Courchesne E. Functionally independent components of the late
positive event-related potential during visual spatial attention. J
Neurosci 1999;19:2665±2680.
Maulsby RL. An illustration of emotionally evoked theta rhythm in infancy:
hedonic hypersynchrony. Electroenceph clin Neurophysiol
1971;31:157±165.
MEGIS. BESA, 99 Edition, Munich, 1999.
Menon V, Adleman NE, White CD, Glover GH, Reiss AL. Error-related
brain activation during a go/nogo response inhibition task. Hum Brain
Mapp 2001;12:131±143.
Miltner WHR, Braun CH, Coles MGH. Event-related brain potentials
following incorrect feedback in a time-estimation task: evidence for a
ªgenericº neural system for error detection. J Cognitive Neurosci
1997;9:787±797.
Mizuki Y, Tanaka M, Isozaki H, Nishijima H, Inanaga K. Periodic appear-
ance of theta rhythm in the frontal midline area during performance of a
mental task. Electroenceph clin Neurophysiol 1980;49:345±351.
Nagamine T, Toro C, Balish M, Deuschl G, Wang B, Sato S, Shibasaki H,
Hallett M. Cortical magnetic and electric ®elds associated with volun-
tary ®nger movements. Brain Topogr 1994;6:175±183.
Nauta WJH. The problem of the frontal lobe: a reinterpretation. J Psychiatr
Res 1971;8:167±187.
Niki H, Watanabe M. Prefrontal and cingulate unit activity during timing
behavior in the monkey. Brain Res 1979;171:213±224.
Potts GF, Tucker DM. Frontal evaluation and posterior representation in
target detection. Cognitive Brain Res 2001;11:147±156.
Rylander G. Personality analysis before and after frontal lobotomy. In:
Fulton JF, Aring CD, Wortis BS, editors. Research publications asso-
ciation for research in nervous and mental disease: the frontal lobes.
Baltimore, MD: Williams & Wilkins, 1947. pp. 691±705.
Sasaki K, Tsujimoto T, Nishikawa S, Nishitani N, Ishihara T. Frontal
mental theta wave recorded simultaneously with magnetoencephalogra-
phy and electroencephalography. Neurosci Res 1996;26:79±81.
Schacter DL. EEG theta waves and psychological phenomena: a review and
analysis. Biol Psychol 1977;5:47±82.
Scheffers MK, Coles MGH. Performance monitoring in a confusing world:
error-related brain activity, judgments of response accuracy, and types
of errors. J Exp Psychol: Hum Percept Perform 2000;26:141±151.
Slobounov SM, Fukada K, Simon R, Rearick M, Ray W. Neurophysiolo-
gical and behavioral indices of time pressure effects on visuomotor task
performance. Cognitive Brain Res 2000;9:287±298.
Stroganova TA, Orekhova EV, Posikera IN. Externally and internally
controlled attention in infants: an EEG study. Int J Psychophysiol
1998;30:339±351.
Stuphorn V, Taylor TL, Schall JD. Performance monitoring by the supple-
mentary eye ®eld. Nature 2000;408:857±860.
P. Luu, D.M. Tucker / Clinical Neurophysiology 112 (2001) 1295±1306 1305

Suetsugi M, Mizuki Y, Ushijima I, Yamada M, Imaizumi J. Anxiolytic
effects of low-dose clomipramine in highly anxious healthy volunteers
assessed by frontal midline theta activity. Prog Neuropsychopharmacol
Biol Psychiatry 1998;22:97±112.
Tow PM, Whitty CW. Personality changes after operations on the cingulate
gyrus in man. J Neurol Neurosurg Psychiatry 1953;16:186±193.
Tucker DM. Spatial sampling of head electrical ®elds: the geodesic sensor
net. Electroenceph clin Neurophysiology 1993;87:145±163.
Tucker DM, Liotti M, Potts GF, Russell GS, Posner MI. Spatiotemporal
analysis of brain electrical ®elds. Hum Brain Mapp 1994;1:134±152.
Tucker DM, Luu P, Pribram KH. Social and emotional self-regulation. Ann
NY Acad Sci 1995;769:213±239.
Tucker DM, Hartry-Speiser A, McDougal L, Luu P, deGrandpre D. Mood
and spatial memory: emotion and the right hemisphere contribution to
spatial cognition. Biol Psychol 1999;50:103±125.
Tucker DM, Speiser A, MacDougal L, Desmond R, Luu P. Dynamics of
decisions in frontolimbic networks, 2001, submitted for publication.
Vidal F, Hasbroucq T, Grapperon J, Bonnet M. Is the ªerror negativityº
speci®c to errors? Biol Psychol 2000;51:109±128.
P. Luu, D.M. Tucker / Clinical Neurophysiology 112 (2001) 1295±13061306