corporate overview statutory reports financial statements
TRANSCRIPT

171Annual Report 2019-20
Statutory ReportsCorporate Overview Financial Statements
INDEPENDENT AUDITOR’S REPORT
To the Members of Apollo Tyres Limited
REPORT ON THE AUDIT OF THE STANDALONE FINANCIAL STATEMENTS
OPINION
1. We have audited the accompanying standalone financial statements of Apollo Tyres Limited (‘the Company’), which comprise the Balance Sheet as at 31 March 2020, the Statement of Profit and Loss (including Other Comprehensive Income), the Cash Flow Statement and the Statement of Changes in Equity for the year then ended, and a summary of the significant accounting policies and other explanatory information.
2. In our opinion and to the best of our information and according to the explanations given to us, the aforesaid standalone financial statements give the information required by the Companies Act, 2013 (‘Act’) in the manner so required and give a true and fair view in conformity with the accounting principles generally accepted in India including Indian Accounting Standards (‘Ind AS’) specified under section 133 of the Act, of the state of affairs of the Company as at 31 March 2020, and its profit (including other comprehensive income), its cash flows and the changes in equity for the year ended on that date.
BASIS FOR OPINION
3. We conducted our audit in accordance with the Standards on Auditing specified under section 143(10) of the Act. Our responsibilities under those standards are further described in the Auditor’s Responsibilities for the Audit of the Financial Statements section of our report. We are independent of the
Company in accordance with the Code of Ethics issued by the Institute of Chartered Accountants of India (‘ICAI’) together with the ethical requirements that are relevant to our audit of the financial statements under the provisions of the Act and the rules thereunder, and we have fulfilled our other ethical responsibilities in accordance with these requirements and the Code of Ethics. We believe that the audit evidence we have obtained is sufficient and appropriate to provide a basis for our opinion.
EMPHASIS OF MATTER
4. We draw attention to Note A3.27 of the standalone financial statements which describes the uncertainties due to the outbreak of Covid-19 pandemic and management’s evaluation of the impact on the standalone financial statements of the Company as at the balance sheet date. The impact of these uncertainties on the Company’s operations is significantly dependent on future developments.
Our opinion is not modified in respect of this matter.
KEY AUDIT MATTERS
5. Key audit matters are those matters that, in our professional judgment, were of most significance in our audit of the standalone financial statements of the current period. These matters were addressed in the context of our audit of the financial statements as a whole, and in forming our opinion thereon, and we do not provide a separate opinion on these matters.
6. We have determined the matters described below to be the key audit matters to be communicated in our report.
Key audit matter How our audit procedures addressed the key audit matterA. Provision for sales related obligations
As at 31 March 2020, the Company carries provisions for sales related obligations amounting to ` 1,388.91 million (Refer note C7).
Such provision is recognised based on past trends, frequency, expected cost of obligations, management estimates regarding possible future incidences and appropriate discount rates for non-current portion of the obligations.
These estimates require high degree of management judgement with respect to the underlying assumptions, thus giving rise to inherent subjectivity in determining the amounts to be recorded in the financial statements.
Considering the materiality of the above matter to the financial statements, complexities and judgement involved, and the significant auditor attention required to test such management’s judgement, we have identified this as a key audit matter for current year audit.
Our audit procedures included:
a) Obtained an understanding from the management with respect to process and controls followed by the Company to ensure appropriateness of recognition, measurement and completeness of the sales related obligations;
b) Tested the management’s computation of sales related obligations by evaluating the reasonability of the key assumptions, reviewing the contractual terms, comparing the assumptions to historical data and analysing the expected costs of incidences;
c) Traced the inputs used in the computations, to the relevant accounting records, including discussions with the relevant management personnel and tested the arithmetical accuracy of the computation;
d) Compared the amounts recognized as provision in the past years with the corresponding settlements and assessed whether the aggregate provisions recognized as at the current year-end were sufficient to cover expected costs in light of known and expected incidences;
e) Performed sensitivity analysis on the management’s computation by evaluating the impact of change on the obligation by changing certain key assumptions such as discount rates used; and
f) Assessed and validated the adequacy and appropriateness of the disclosures made by the management in the standalone financial statements.

172 Apollo Tyres Ltd.
INFORMATION OTHER THAN THE FINANCIAL STATEMENTS AND AUDITOR’S REPORT THEREON
7. The Company’s Board of Directors is responsible for the other information. The other information comprises the information included in the Management Discussion and Analysis, Report on Corporate Governance and Director’s Report, but does not include the standalone financial statements and our auditor’s report thereon.
Our opinion on the standalone financial statements does not cover the other information and we do not express any form of assurance conclusion thereon.
In connection with our audit of the standalone financial statements, our responsibility is to read the other information and, in doing so, consider whether the other information is materially inconsistent with the standalone financial statements or our knowledge obtained in the audit or otherwise appears to be materially misstated. If, based on the work we have performed, we conclude that there is a material misstatement of this other information, we are required to report that fact. We have nothing to report in this regard.
RESPONSIBILITIES OF MANAGEMENT AND THOSE CHARGED WITH GOVERNANCE FOR THE STANDALONE FINANCIAL STATEMENTS
8. The accompanying standalone financial statements have been approved by the Company’s Board of Directors. The Company’s Board of Directors is responsible for the matters stated in section 134(5) of the Act with respect to the preparation of these standalone financial statements that give a true and fair view of the financial position, financial performance including other comprehensive income, changes in equity and cash flows of the Company in accordance with the accounting principles generally accepted in India, including the Ind AS specified under section 133 of the Act. This responsibility also includes maintenance of adequate accounting records in accordance with the provisions of the Act for safeguarding of the assets of the Company and for preventing and detecting frauds and other irregularities; selection and application of appropriate accounting policies; making judgments and estimates that are reasonable and prudent; and design, implementation and maintenance of adequate internal financial controls, that were operating effectively for ensuring the accuracy and completeness of the accounting records, relevant to the preparation and presentation of the financial statements that give a true and fair view and are free from material misstatement, whether due to fraud or error.
Key audit matter How our audit procedures addressed the key audit matter
B. Litigations and claims: provisions and contingent liabilities
As included under Note C16 [contingent liability note] and Note C7 [Provision for contingencies note] to the standalone financial statements, the Company is involved in direct and indirect tax litigations (‘litigations’) amounting to ` 3,411.57 million that are pending with various tax authorities.
Whether a liability is recognised or disclosed as a contingent liability in the financial statements is inherently judgmental and dependent on a number of significant assumptions and assessments. These include assumptions relating to the likelihood and/or timing of the cash outflows from the business and the interpretation of local laws and pending assessments at various levels of the statute. We placed specific focus on the judgements in respect to these demands against the Company.
Determining the amount, if any, to be recognised or disclosed in the standalone financial statements, is inherently subjective. The amounts involved are potentially significant and due to the range of possible outcomes and considerable uncertainty around the various claims the determination of the need for creating a provision in the financial statements is inherently subjective and therefore is considered to be a key audit matter in the current year
Our procedures included, but were not limited to, the following:
a) Obtained an understanding from the management with respect to process and controls followed by the Company for identification and monitoring of significant developments in relation to the litigations, including completeness thereof;
b) Obtained the list of litigations from the management and reviewed their assessment of the likelihood of outflow of economic resources being probable, possible or remote in respect of the litigations. This involved assessing the probability of an unfavorable outcome of a given proceeding and the reliability of estimates of related amounts;
c) Performed substantive procedures including tracing from underlying documents / communications from the tax authorities and re-computation of the amounts involved;
d) Assessed management’s conclusions through discussions held with their in house tax experts and understanding precedents in similar cases;
e) Obtained and evaluated the independent confirmations from the consultants representing the Company before the various authorities;
f) Engaged auditor’s experts, who obtained an understanding of the current status of the litigations, conducted discussions with the management, reviewed independent legal advice received by the Company, if any and considered relevant legal provisions and available precedents to validate the conclusions made by the management; and
g) Assessed and validated the adequacy and appropriateness of the disclosures made by the management in the standalone financial statements.

173Annual Report 2019-20
Statutory ReportsCorporate Overview Financial Statements
9. In preparing the financial statements, management is responsible for assessing the Company’s ability to continue as a going concern, disclosing, as applicable, matters related to going concern and using the going concern basis of accounting unless management either intends to liquidate the Company or to cease operations, or has no realistic alternative but to do so.
10. Those Board of Directors is also responsible for overseeing the Company’s financial reporting process.
AUDITOR’S RESPONSIBILITIES FOR THE AUDIT OF THE FINANCIAL STATEMENTS
11. Our objectives are to obtain reasonable assurance about whether the financial statements as a whole are free from material misstatement, whether due to fraud or error, and to issue an auditor’s report that includes our opinion. Reasonable assurance is a high level of assurance, but is not a guarantee that an audit conducted in accordance with Standards on Auditing will always detect a material misstatement when it exists. Misstatements can arise from fraud or error and are considered material if, individually or in the aggregate, they could reasonably be expected to influence the economic decisions of users taken on the basis of these financial statements.
12. As part of an audit in accordance with Standards on Auditing, we exercise professional judgment and maintain professional skepticism throughout the audit. We also:
• Identify and assess the risks of material misstatement of the financial statements, whether due to fraud or error, design and perform audit procedures responsive to those risks, and obtain audit evidence that is sufficient and appropriate to provide a basis for our opinion. The risk of not detecting a material misstatement resulting from fraud is higher than for one resulting from error, as fraud may involve collusion, forgery, intentional omissions, misrepresentations, or the override of internal control;
• Obtain an understanding of internal control relevant to the audit in order to design audit procedures that are appropriate in the circumstances. Under section 143(3)(i) of the Act, we are also responsible for expressing our opinion on whether the Company has adequate internal financial controls with reference to financial statements in place and the operating effectiveness of such controls;
• Evaluate the appropriateness of accounting policies used and the reasonableness of accounting estimates and related disclosures made by management;
• Conclude on the appropriateness of management’s use of the going concern basis of accounting and, based on the audit evidence obtained, whether a material uncertainty
exists related to events or conditions that may cast significant doubt on the Company’s ability to continue as a going concern. If we conclude that a material uncertainty exists, we are required to draw attention in our auditor’s report to the related disclosures in the financial statements or, if such disclosures are inadequate, to modify our opinion. Our conclusions are based on the audit evidence obtained up to the date of our auditor’s report. However, future events or conditions may cause the Company to cease to continue as a going concern;
• Evaluate the overall presentation, structure and content of the financial statements, including the disclosures, and whether the financial statements represent the underlying transactions and events in a manner that achieves fair presentation;
13. We communicate with those charged with governance regarding, among other matters, the planned scope and timing of the audit and significant audit findings, including any significant deficiencies in internal control that we identify during our audit.
14. We also provide those charged with governance with a statement that we have complied with relevant ethical requirements regarding independence, and to communicate with them all relationships and other matters that may reasonably be thought to bear on our independence, and where applicable, related safeguards.
15. From the matters communicated with those charged with governance, we determine those matters that were of most significance in the audit of the financial statements of the current period and are therefore the key audit matters. We describe these matters in our auditor’s report unless law or regulation precludes public disclosure about the matter or when, in extremely rare circumstances, we determine that a matter should not be communicated in our report because the adverse consequences of doing so would reasonably be expected to outweigh the public interest benefits of such communication.
REPORT ON OTHER LEGAL AND REGULATORY REQUIREMENTS
16. As required by section 197(16) of the Act, based on our audit, we report that the Company has paid and provided for remuneration to its directors during the year in accordance with the provisions of and limits laid down under section 197 read with Schedule V to the Act.
17. As required by the Companies (Auditor’s Report) Order, 2016 (‘the Order’) issued by the Central Government of India in terms of section 143(11) of the Act, we give in the Annexure I a statement on the matters specified in paragraphs 3 and 4 of the Order.

174 Apollo Tyres Ltd.
18. Further to our comments in Annexure I, as required by section 143(3) of the Act, based on our audit, we report, to the extent applicable, that:
a) we have sought and obtained all the information and explanations which to the best of our knowledge and belief were necessary for the purpose of our audit of the accompanying standalone financial statements;
b) in our opinion, proper books of account as required by law have been kept by the Company so far as it appears from our examination of those books;
c) the standalone financial statements dealt with by this report are in agreement with the books of account;
d) in our opinion, the aforesaid standalone financial statements comply with Ind AS specified under section 133 of the Act;
e) on the basis of the written representations received from the directors and taken on record by the Board of Directors, none of the directors is disqualified as on 31 March 2020 from being appointed as a director in terms of section 164(2) of the Act;
f) we have also audited the internal financial controls with reference to financial statements of the Company as on 31 March 2020 in conjunction with our audit of the standalone financial statements of the Company for the year ended on that date and our report dated 19 May 2020 as per Annexure II expressed unmodified opinion; and
g) with respect to the other matters to be included in the Auditor’s Report in accordance with rule 11 of the Companies (Audit and Auditors) Rules, 2014 (as amended), in our opinion and to the best of our information and according to the explanations given to us:
i. the Company, as detailed in note C16 to the standalone financial statements, has disclosed the impact of pending litigations on its financial position as at 31 March 2020;
ii. the Company has made provision, as required under the applicable law or Ind AS, for material foreseeable losses, if any, on long-term contracts including derivative contracts;
iii. there has been no delay in transferring amounts, required to be transferred, to the Investor Education and Protection Fund by the Company other than ` 4.30 million (31 March 2019: ` 3.74 million) pertaining to amount of dividend which has not been transferred as per the orders/ instructions under the Special Court (Trial of Offences Relating to Transactions in Securities) Act, 1992; and
iv. the disclosure requirements relating to holdings as well as dealings in specified bank notes were applicable for the period from 8 November 2016 to 30 December 2016, which are not relevant to these standalone financial statements. Hence, reporting under this clause is not applicable.
For Walker Chandiok & Co LLPChartered AccountantsFirm’s Registration No.: 001076N/N500013
David JonesPartnerMembership No.: 98113UDIN: 20098113AAAAAF9181
Place: GurgaonDate: 19 May 2020

175Annual Report 2019-20
Statutory ReportsCorporate Overview Financial Statements
Based on the audit procedures performed for the purpose of reporting a true and fair view on the financial statements of the Company and taking into consideration the information and explanations given to us and the books of account and other records examined by us in the normal course of audit, and to the best of our knowledge and belief, we report that:
(i) (a) The Company has maintained proper records showing full particulars, including quantitative details and situation of property, plant and equipment.
(b) The Company has a regular program of physical verification of its property, plant and equipment under which property, plant and equipment are verified in a phased manner over a period of three years, which, in our opinion, is reasonable having regard to the size of the Company and the nature of its assets. In accordance with this program, certain property, plant and equipments were verified during the year and no material discrepancies were noticed on such verification.
(c) The title deeds of all the immovable properties are held in the name of the Company, except for certain lands included under the head ‘Capital work in progress’, {admeasuring 8,836,150 square feet and carrying a cost of ` 248 million}, the title deeds to which, according to the information and explanation given to us, are yet to be transferred in the name of the Company. Immovable properties in the nature of land whose title deeds have been pledged as security for loans are held in the name of the Company, which is verified from confirmations directly received by us from lenders. In respect of immovable properties in the nature of land and building that have been taken on lease and disclosed under the head property, plant and equipment in the standalone financial statements, the lease agreements are in the name of the Company, where the Company is the lessee as per the agreement.
(ii) In our opinion, the management has conducted physical verification of inventory at reasonable intervals during the year
and no material discrepancies between physical inventory and book records were noticed on physical verification.
(iii) The Company has not granted any loan, secured or unsecured to companies, firms, Limited Liability Partnerships (LLPs) or other parties covered in the register maintained under Section 189 of the Act. Accordingly, the provisions of clauses 3(iii)(a), 3(iii)(b) and 3(iii)(c) of the Order are not applicable.
(iv) In our opinion, the Company has complied with the provisions of Sections 185 and 186 of the Act in respect of investments and guarantees. There are no loans and security given by the Company.
(v) In our opinion, the Company has not accepted any deposits within the meaning of Sections 73 to 76 of the Act and the Companies (Acceptance of Deposits) Rules, 2014 (as amended). Accordingly, the provisions of clause 3(v) of the Order are not applicable.
(vi) We have broadly reviewed the books of account maintained by the Company pursuant to the Rules made by the Central Government for the maintenance of cost records under sub-section (1) of Section 148 of the Act in respect of Company’s products and are of the opinion that, prima facie, the prescribed accounts and records have been made and maintained. However, we have not made a detailed examination of the cost records with a view to determine whether they are accurate or complete.
(vii) (a) The Company is regular in depositing undisputed statutory dues including provident fund, employees’ state insurance, income-tax, sales-tax, service tax, duty of customs, duty of excise, value added tax, cess and other material statutory dues, as applicable, to the appropriate authorities. Further, no undisputed amounts payable in respect thereof were outstanding at the year-end for a period of more than six months from the date they become payable.
(b) The dues outstanding in respect of income-tax, sales-tax, service-tax, duty of customs, duty of excise and value added tax on account of any dispute, are as follows
ANNEXURE I
Statement of Disputed Dues
Name of the statute Nature of duesAmount
(` million)
Amount paid under protest
(` million)
Period to which the amount relates
Forum where dispute is pending
Sales Tax Act applicable to various states
Sales tax 566.70 149.40 1992-93 to 2017-18 Various appellate authorities/ Revenue board/ High Court
Central Excise Act, 1944 Excise duty and additional excise duty
567.92 11.48 2002-03 to 2018-19 Various appellate authorities/ Supreme Court
Finance Act, 1994 Service tax 528.59 33.80 2004-05 to 2015-16 Various appellate authorities
Income-tax Act, 1961 Income tax 1,748.36 110.71 1988-89 to 2013-14 Various appellate authorities/ High Court

176 Apollo Tyres Ltd.
(viii) The Company has not defaulted in repayment of loans or borrowings to any financial institution or a bank or any dues to debenture-holders during the year. The Company has no loans or borrowings payable to government.
(ix) The Company did not raise moneys by way of initial public offer or further public offer (including debt instruments). In our opinion, the term loans were applied for the purposes for which the loans were obtained, though idle/surplus funds which were not required for immediate utilisation have been invested in liquid investments, payable on demand.
(x) No fraud by the Company or on the company by its officers or employees has been noticed or reported during the period covered by our audit.
(xi) Managerial remuneration has been paid and provided for by the Company in accordance with the requisite approvals mandated by the provisions of Section 197 of the Act read with Schedule V to the Act.
(xii) In our opinion, the Company is not a Nidhi Company. Accordingly, provisions of clause 3(xii) of the Order are not applicable.
(xiii) In our opinion all transactions with the related parties are in compliance with Sections 177 and 188 of Act, where
applicable, and the requisite details have been disclosed in the financial statements etc., as required by the applicable Ind AS.
(xiv) During the year, the Company has not made any preferential allotment or private placement of shares or fully or partly convertible debentures.
(xv) In our opinion, the Company has not entered into any non-cash transactions with the directors or persons connected with them covered under Section 192 of the Act.
(xvi) The Company is not required to be registered under Section 45-IA of the Reserve Bank of India Act, 1934.
For Walker Chandiok & Co LLPChartered AccountantsFirm’s Registration No.: 001076N/N500013
David JonesPartnerMembership No.: 98113UDIN: 20098113AAAAAF9181
Place: GurgaonDate: 19 May 2020

177Annual Report 2019-20
Statutory ReportsCorporate Overview Financial Statements
1. In conjunction with our audit of the standalone financial statements of Apollo Tyres Limited (‘the Company’) as at and for the year ended 31 March 2020, we have audited the internal financial controls with reference to financial statements of the Company as at that date.
RESPONSIBILITIES OF MANAGEMENT AND THOSE CHARGED WITH GOVERNANCE FOR INTERNAL FINANCIAL CONTROLS
2. The Company’s Board of Directors is responsible for establishing and maintaining internal financial controls based on the internal control over financial reporting criteria established by the Company considering the essential components of internal control stated in the Guidance Note on Audit of Internal Financial Controls over Financial Reporting (‘the Guidance Note’) issued by the Institute of Chartered Accountants of India (‘ICAI’). These responsibilities include the design, implementation and maintenance of adequate internal financial controls that were operating effectively for ensuring the orderly and efficient conduct of the Company’s business, including adherence to the Company’s policies, the safeguarding of its assets, the prevention and detection of frauds and errors, the accuracy and completeness of the accounting records, and the timely preparation of reliable financial information, as required under the Act.
AUDITOR’S RESPONSIBILITY FOR THE AUDIT OF THE INTERNAL FINANCIAL CONTROLS WITH REFERENCE TO FINANCIAL STATEMENTS
3. Our responsibility is to express an opinion on the Company's internal financial controls with reference to financial statements based on our audit. We conducted our audit in accordance with the Standards on Auditing issued by the ICAI prescribed under Section 143(10) of the Act, to the extent applicable to an audit of internal financial controls with reference to financial statements, and the Guidance Note issued by the ICAI. Those Standards and the Guidance Note require that we comply with ethical requirements and plan and perform the audit to obtain reasonable assurance about whether adequate internal financial controls with reference to financial statements were established and maintained and if such controls operated effectively in all material respects.
4. Our audit involves performing procedures to obtain audit evidence about the adequacy of the internal financial controls with reference to financial statements and their operating effectiveness. Our audit of internal financial controls with reference to financial statements includes obtaining an understanding of such internal financial controls, assessing the risk that a material weakness exists, and testing and evaluating the design and operating effectiveness of internal control based on the assessed risk. The procedures selected depend on the auditor’s judgement, including the assessment of the risks of material misstatement of the financial statements, whether due to fraud or error.
5. We believe that the audit evidence we have obtained is sufficient and appropriate to provide a basis for our audit opinion on the Company’s internal financial controls with reference to financial statements.
MEANING OF INTERNAL FINANCIAL CONTROLS WITH REFERENCE TO FINANCIAL STATEMENTS
6. A company's internal financial controls with reference to financial statements is a process designed to provide reasonable assurance regarding the reliability of financial reporting and the preparation of financial statements for external purposes in accordance with generally accepted accounting principles. A company's internal financial controls with reference to financial statements include those policies and procedures that (1) pertain to the maintenance of records that, in reasonable detail, accurately and fairly reflect the transactions and dispositions of the assets of the company; (2) provide reasonable assurance that transactions are recorded as necessary to permit preparation of financial statements in accordance with generally accepted accounting principles, and that receipts and expenditures of the company are being made only in accordance with authorisations of management and directors of the company; and (3) provide reasonable assurance regarding prevention or timely detection of unauthorised acquisition, use, or disposition of the company's assets that could have a material effect on the financial statements.
INHERENT LIMITATIONS OF INTERNAL FINANCIAL CONTROLS WITH REFERENCE TO FINANCIAL STATEMENTS
7. Because of the inherent limitations of internal financial controls with reference to financial statements, including the possibility of collusion or improper management override of controls, material misstatements due to error or fraud may occur and not be detected. Also, projections of any evaluation of the internal financial controls with reference to financial statements to future periods are subject to the risk that the internal financial controls with reference to financial statements may become inadequate because of changes in conditions, or that the degree of compliance with the policies or procedures may deteriorate.
OPINION
8. In our opinion, the Company has, in all material respects, adequate internal financial controls with reference to financial statements and such controls were operating effectively as at 31 March 2020, based on internal control over financial reporting criteria established by the Company considering the essential components of internal control stated in the Guidance Note issued by the ICAI.
For Walker Chandiok & Co LLPChartered AccountantsFirm’s Registration No.: 001076N/N500013
David JonesPartnerMembership No.: 98113UDIN: 20098113AAAAAF9181
Place: GurgaonDate: 19 May 2020
ANNEXURE IIIndependent Auditor’s Report on the internal financial controls with reference to the standalone financial statements under Clause (i) of Sub-section 3 of Section 143 of the Companies Act, 2013 (‘the Act’)

BALANCE SHEET as on March 31, 2020
178 Apollo Tyres Ltd.
` Million
Particulars NotesAs on
March 31, 2020As on
March 31, 2019
A. ASSETS1. Non-current assets(a) Property, plant and equipment B1 92,531.56 63,680.79(b) Capital work-in-progress 12,720.71 6,549.00(c) Intangible assets B1 320.36 314.39(d) Financial assets
i. Investments B2 24,095.19 22,325.73ii. Other financial assets B3 2,326.12 1,210.57
(e) Other non-current assets B4 3,650.49 7,304.50Total non-current assets 135,644.43 101,384.98
2. Current assets(a) Inventories B5 18,082.51 20,514.79(b) Financial assets
i. Trade receivables B6 4,450.83 7,794.95ii. Cash and cash equivalents B7 2,256.26 2,103.80iii. Bank balances other than (ii) above B8 109.58 71.85iv. Other financial assets B9 99.57 283.38
(c) Other current assets B10 4,176.71 4,335.62Total current assets 29,175.46 35,104.39TOTAL ASSETS (1 + 2) 164,819.89 136,489.37
B. EQUITY AND LIABILITIES1. Equity(a) Equity share capital B11 572.05 572.05(b) Other equity 76,349.42 75,839.56
Total equity 76,921.47 76,411.61Liabilities
2. Non-current liabilities(a) Financial liabilities
i. Borrowings B12 32,083.24 24,438.55ii. Other financial liabilities B13 5,319.45 15.34
(b) Provisions B14 503.32 498.82(c) Deferred tax liabilities (net) C8 5,312.69 5,754.60(d) Other non-current liabilities B15 3,754.95 2,879.47
Total non-current liabilities 46,973.65 33,586.783. Current Liabilities(a) Financial liabilities
i. Borrowings B16 11,180.69 2,925.07ii. Trade payables - Total outstanding dues of micro enterprises and small enterprises C19 170.80 128.55 - Total outstanding dues of creditors other than micro enterprises and small
enterprisesB17 15,936.37 13,558.05
iii. Other financial liabilities B18 10,182.59 4,572.62(b) Other current liabilities B19 1,092.90 2,842.88(c) Provisions B20 1,801.91 1,659.79(d) Current tax liabilities (net) B21 559.51 804.02
Total current liabilities 40,924.77 26,490.98TOTAL EQUITY AND LIABILITIES (1 + 2 + 3) 164,819.89 136,489.37
See accompanying notes forming part of the financial statements
For and on behalf of the Board of Directors In terms of our report attached
ONKAR S. KANWAR NEERAJ KANWAR VINOD RAI For Walker Chandiok & Co LLPChairman & Managing Director Vice Chairman & Managing Director Director Chartered Accountants DIN 00058921 DIN 00058951 DIN 00041867 Firm’s Registration No. 001076N/N500013
GAURAV KUMAR SEEMA THAPAR David JonesChief Financial Officer Company Secretary Partner
New Delhi Membership No- FCS 6690 Membership No. 98113May 19, 2020

STATEMENT OF PROFIT AND LOSS for the year ended March 31, 2020
` Million
Particulars NotesYear ended
March 31, 2020Year ended
March 31, 2019
1. REVENUE FROM OPERATIONS:Sales 108,326.97 120,895.83
Other operating income B22 2,293.31 2,641.82
110,620.28 123,537.65
2. OTHER INCOME B23 348.98 1,114.70
3. TOTAL INCOME (1 + 2) 110,969.26 124,652.35
4. EXPENSES:(a) Cost of materials consumed B24 60,729.50 75,838.42
(b) Purchase of stock-in-trade B24 6,517.26 7,355.28
(c) Changes in inventories of finished goods, stock-in-trade and work-in-progress B25 1,128.28 (2,614.66)
(d) Employee benefits expense B24 8,261.17 7,372.42
(e) Finance costs B26 2,256.96 1,378.55
(f) Depreciation and amortisation expense B1 6,207.05 4,463.32
(g) Other expenses B24 20,055.19 20,795.10
Total expenses 105,155.41 114,588.43
5. PROFIT BEFORE EXCEPTIONAL ITEMS AND TAX (3 - 4) 5,813.85 10,063.92
6. EXCEPTIONAL ITEMS - 2,000.00
7. PROFIT BEFORE TAX (5 - 6) 5,813.85 8,063.92
8. TAX EXPENSE:(a) Current tax expense 1,026.56 1,806.52
(b) Deferred tax (298.95) 336.31
Total 727.61 2,142.83
9. NET PROFIT FOR THE YEAR (7 - 8) 5,086.24 5,921.09
10. OTHER COMPREHENSIVE INCOMEI i. Items that will not be reclassified to profit or loss
a. Remeasurements of the defined benefit plans (245.40) 27.94
ii. Income tax 85.75 (9.76)
(159.65) 18.18
II i. Items that may be reclassified to profit or loss
a. Effective portion of (loss) on designated portion of hedging instruments in a cash flow hedge
(163.71) (99.69)
ii. Income tax 57.21 34.83
(106.50) (64.86)
Other comprehensive (loss) (I + II) (266.15) (46.68)
Total comprehensive income for the year (9 + 10) 4,820.09 5,874.41
Earnings per share (of ` 1 each) C29
(a) Basic (`) 8.89 10.35
(b) Diluted (`) 8.89 10.35
See accompanying notes forming part of the financial statements
For and on behalf of the Board of Directors In terms of our report attached
ONKAR S. KANWAR NEERAJ KANWAR VINOD RAI For Walker Chandiok & Co LLPChairman & Managing Director Vice Chairman & Managing Director Director Chartered Accountants DIN 00058921 DIN 00058951 DIN 00041867 Firm’s Registration No. 001076N/N500013
GAURAV KUMAR SEEMA THAPAR David JonesChief Financial Officer Company Secretary Partner
New Delhi Membership No- FCS 6690 Membership No. 98113May 19, 2020
179Annual Report 2019-20
Statutory ReportsCorporate Overview Financial Statements

STA
TE
ME
NT
OF
CH
AN
GES
IN
EQ
UIT
Yfo
r th
e ye
ar e
nded
Mar
ch 3
1, 2
020
` M
illio
n
Res
erve
s an
d su
rplu
sIt
ems
of o
ther
co
mpr
ehen
sive
inco
me
Sec
urit
ies
prem
ium
Gen
eral
re
serv
e
Cap
ital
re
serv
e on
AM
HP
L m
erge
r
Deb
entu
re
rede
mpt
ion
rese
rve
Cap
ital
su
bsid
y
Cap
ital
re
dem
ptio
n re
serv
e
Cap
ital
re
serv
e on
fo
rfei
ture
of
sha
res
Ret
aine
d ea
rnin
gs
Eff
ecti
ve
port
ion
of
cash
flow
he
dge
Rev
alua
tion
su
rplu
sTo
tal
Bal
ance
as
on A
pril
01,
20
1820
,866
.72
13,0
06.
631,
383.
6862
9.31
25.5
04
4.4
00
.07
35,9
89.0
857
.45
31.2
272
,034
.06
Pro
fit fo
r th
e ye
ar5,
921.
09
5,92
1.0
9
Eff
ectiv
e po
rtio
n of
cas
h fl
ow h
edge
(99.
69)
(99.
69)
Inco
me
tax
on e
ffec
tive
port
ion
of c
ash
flow
hed
ge34
.83
34.8
3
Rem
easu
rem
ents
of t
he d
efine
d be
nefit
pla
ns27
.94
27.9
4
Inco
me
tax
on R
emea
sure
men
ts o
f the
defi
ned
bene
fit p
lans
(9.7
6)(9
.76)
Tota
l com
pre
hens
ive
inco
me
for
the
year
5,93
9.27
(64
.86)
5,87
4.4
1
Tran
sact
ion
with
ow
ners
in t
heir
cap
acit
y as
ow
ners
Pay
men
t of
div
iden
d (`
3 p
er s
hare
)(1
,716
.15)
(1,7
16.1
5)
Tax
on d
ivid
end
(352
.76)
(352
.76)
Tran
sfer
from
ret
aine
d ea
rnin
gs1,
00
0.0
041
0.1
9(1
,410
.19)
-
Bal
ance
as
on M
arch
31,
20
1920
,866
.72
14,0
06.
631,
383.
681,
039
.50
25.5
04
4.4
00
.07
38,4
49.
25(7
.41)
31.2
275
,839
.56
Pro
fit fo
r th
e ye
ar5,
086
.24
5,0
86.2
4
Eff
ectiv
e po
rtio
n of
cas
h fl
ow h
edge
(163
.71)
(163
.71)
Inco
me
tax
on e
ffec
tive
port
ion
of c
ash
flow
hed
ge57
.21
57.2
1
Rem
easu
rem
ents
of t
he d
efine
d be
nefit
pla
ns(2
45.4
0)
(245
.40
)
Inco
me
tax
on R
emea
sure
men
ts o
f the
defi
ned
bene
fit p
lans
85.7
585
.75
Tota
l com
pre
hens
ive
inco
me
for
the
year
4,9
26.5
9(1
06.
50)
4,8
20.0
9
Tran
sact
ion
with
ow
ners
in t
heir
cap
acit
y as
ow
ners
Pay
men
t of
div
iden
d (`
3.2
5 pe
r sh
are)
(1,8
59.1
6)(1
,859
.16)
Pay
men
t of
inte
rim
div
iden
d (`
3.0
0 pe
r sh
are)
(1,7
16.1
5)(1
,716
.15)
Tax
ther
e on
(div
iden
d an
d in
teri
m d
ivid
end)
(734
.92)
(734
.92)
Tran
sfer
from
ret
aine
d ea
rnin
gs1,
00
0.0
0(1
,00
0.0
0)
-
Bal
ance
as
on M
arch
31,
20
2020
,866
.72
15,0
06.
631,
383.
681,
039
.50
25.5
04
4.4
00
.07
38,0
65.6
1(1
13.9
1)31
.22
76,3
49.
42
For
and
on b
ehal
f of t
he B
oard
of D
irec
tors
In
ter
ms
of o
ur r
epor
t at
tach
ed
ON
KA
R S
. KA
NW
AR
NE
ER
AJ
KA
NW
AR
VIN
OD
RA
IFo
r W
alke
r C
hand
iok
& C
o LL
PC
hair
man
& M
anag
ing
Dir
ecto
rV
ice
Cha
irm
an &
Man
agin
g D
irec
tor
Dir
ecto
rC
hart
ered
Acc
ount
ants
D
IN 0
0058
921
DIN
000
5895
1D
IN 0
0041
867
Firm
’s R
egis
trat
ion
No.
001
076N
/N50
0013
GA
UR
AV
KU
MA
RS
EE
MA
TH
APA
RD
avid
Jon
esC
hief
Fin
anci
al O
ffice
rC
ompa
ny S
ecre
tary
Par
tner
New
Del
hiM
embe
rshi
p N
o- F
CS
669
0M
embe
rshi
p N
o. 9
8113
May
19,
202
0
180 Apollo Tyres Ltd.

181Annual Report 2019-20
Statutory ReportsCorporate Overview Financial Statements
CASH FLOW STATEMENTfor the year ended March 31, 2020
` Million
ParticularsYear ended
March 31, 2020Year ended
March 31, 2019
A CASH FLOW FROM OPERATING ACTIVITIES(i) Net profit before tax 5,813.85 8,063.92
Add: Adjustments for:
Depreciation and amortisation expenses 6,207.05 4,463.32
(Profit) on sale of property, plant and equipment (net) (0.32) (8.30)
Dividend from non-current and current investments (2.67) (50.83)
Provision for constructive liability 16.57 34.46
Provision for compensated absences 18.43 11.27
Provision for superannuation 3.02 2.50
Change in fair value of investments - (0.04)
Provisions/ Liabilities no longer required written back - (367.13)
Unwinding of deferred income (1,735.41) (1,438.44)
Finance cost 2,256.96 1,378.55
Interest income (38.01) (349.89)
Provision for Inter corporate deposit - 2,000.00
Provision for estimated loss on derivatives (79.83) (184.62)
Unrealised (gain)/loss on foreign exchange fluctuations 253.54 6,899.33 103.09 5,593.94
(ii) Operating profit before working capital changes 12,713.18 13,657.86
Changes in working capital
Adjustments for (increase) / decrease in operating assets:
Inventories 2,432.28 (3,299.88)
Trade receivables 3,420.61 (2,396.84)
Other financial assets (current and non current) (140.35) (63.62)
Other current assets (95.38) 5,617.16 (390.36) (6,150.70)
Adjustments for increase / (decrease) in operating liabilities:
Trade payables 2,090.54 (1,436.73)
Other financial liabilities 1,365.70 1,893.25
Other liabilities (current and non current) (1,670.37) 522.47
Provisions for contingencies - (365.00)
Provisions for sales related obligations 108.60 1,894.47 (261.51) 352.48
(iii) Cash generated from operations 20,224.81 7,859.64
Less: Direct taxes paid (net of refund) 1,271.07 1,932.92
Net cash generated from operating activities 18,953.74 5,926.72
B CASH FLOW FROM INVESTING ACTIVITIESPurchase of property, plant and equipment (25,340.32) (16,423.06)
Proceeds from sale of fixed assets 192.87 97.24
Proceeds from/ (Investments) in Mutual Funds - 3,640.48
Investment in non-current investment (1,769.46) (206.94)
Inter corporate deposits matured, net - 7,750.00
Dividends received from current and non-current investments 2.67 50.83
Interest received 162.89 524.31
Net cash used in investing activities (26,751.35) (4,567.14)

182 Apollo Tyres Ltd.
` Million
ParticularsYear ended
March 31, 2020Year ended
March 31, 2019
C CASH FLOW FROM FINANCING ACTIVITIESProceeds from non-current borrowings 7,318.75 5,438.31
Repayment of non-current borrowings (166.85) (256.87)
Proceeds from/ (Repayment) of Current borrowings (net) 8,378.10 (3,528.95)
Payment of dividend (including dividend tax) (4,310.23) (2,068.91)
Payment of Lease liabilities (1,358.86) -
Finance charges paid (1,788.36) (1,363.65)
Net cash generated from/ (used) financing activities 8,072.55 (1,780.07)
Net increase / (decrease) in cash and cash equivalents 274.94 (420.49)
Cash and cash equivalents as at the beginning of the year 2,103.80 2,544.51
Less: Cash credits as at the beginning of the year 123.17 143.39
Adjusted cash and cash equivalents as at beginning of the year 1,980.63 2,401.12
Cash and cash equivalents as at the end of the year 2,256.26 2,103.80
Less: Cash credits as at the end of the year 0.69 123.17
Adjusted cash and cash equivalents as at the end of the year 2,255.57 1,980.63
For and on behalf of the Board of Directors In terms of our report attached
ONKAR S. KANWAR NEERAJ KANWAR VINOD RAI For Walker Chandiok & Co LLPChairman & Managing Director Vice Chairman & Managing Director Director Chartered Accountants DIN 00058921 DIN 00058951 DIN 00041867 Firm’s Registration No. 001076N/N500013
GAURAV KUMAR SEEMA THAPAR David JonesChief Financial Officer Company Secretary Partner
New Delhi Membership No- FCS 6690 Membership No. 98113May 19, 2020
CASH FLOW STATEMENTfor the year ended March 31, 2020 (Contd.)

183Annual Report 2019-20
Statutory ReportsCorporate Overview Financial Statements
A. NOTESforming Part of the Financial Statements
1 CORPORATE INFORMATION
The principal business activity of Apollo Tyres Limited (‘the Company’) is manufacturing and sale of automotive tyres. The Company started its operations in 1972 with its first manufacturing plant at Perambra in Kerala.
The Company’s largest operations are in India and comprises four tyre manufacturing plants, two located in Cochin and one each at Vadodara and Chennai and various sales and marketing offices spread across the country. The Company’s European subsidiaries Apollo Vredestein BV (‘AVBV’) and Apollo Tyres (Hungary) Kft. have a manufacturing plant in the Netherlands and Hungary respectively and has sales and marketing subsidiaries all over Europe. The Company also has sales and marketing subsidiaries in Middle East, Africa and ASEAN region.
2 RECENT ACCOUNTING PROUNCEMENTS
Standards issued but not yet effective Ministry of Corporate Affairs (MCA) notifies new standard
or amendments to the existing standards. There is no such notification which would have been applicable from April 01, 2020
3 BASIS OF ACCOUNTING AND PREPARATION OF FINANCIAL STATEMENTS
3.1 Statement of Compliance The financial statements have been prepared to comply in
all material respects with the Indian Accounting Standards (Ind AS) as notified by Ministry of Corporate Affairs under Section 133 of the Companies Act, 2013 (‘the Act’) read with the Companies (Indian Accounting Standards) Rules, 2015, as amended and other relevant provisions of the Act.
The financial statements are presented in Indian Rupee (‘INR’), which is also the functional currency of the Company.
The financial statements for the year ended March 31, 2020 were authorised and approved for issue by the Board of Directors on May 19, 2020.
3.2 Basis of preparation and presentation The financial statements have been prepared on accrual
basis under the historical cost convention except for certain financial instruments that are measured at fair values at the end of each reporting period, as explained in the accounting policies below.
Historical cost is generally based on the fair value of the consideration given in exchange for goods and services.
Fair value is the price that would be received to sell an asset or paid to transfer a liability in an orderly transaction between market participants at the measurement date, regardless of whether that price is directly observable or estimated using another valuation technique. In estimating the fair value of an asset or a liability, the Company takes into account the characteristics of the asset or liability if market participants
would take those characteristics into account when pricing the asset or liability at the measurement date. Fair value for measurement and/or disclosure purposes in these financial statements is determined on above basis, except for share-based payment transactions that are within the scope of Ind AS 102 - Share Based Payment, and measurements that have some similarities to fair value but are not fair value, such as net realisable value in Ind AS 2 - Inventories or value in use in Ind AS 36 - Impairment of Assets.
In addition, for financial reporting purposes, fair value measurements are categorised into Level 1, 2 or 3 based on the degree to which the inputs to the fair value measurements are observable and the significance of the inputs to the fair value measurement in its entirety, which are described as follows:
• Level 1 inputs are quoted prices (unadjusted) in active markets for identical assets or liabilities that the entity can access at the measurement date;
• Level 2 inputs are inputs, other than quoted prices included within Level 1, that are observable for the asset or liability, either directly or indirectly; and
• Level 3 inputs are unobservable inputs for the asset or liability.
The principal accounting policies are set out below:
3.3 Business Combinations Common control business combinations includes
transactions, such as transfer of subsidiaries or businesses, between entities within a Company.
Business combinations involving entities or businesses under common control are accounted for using the pooling of interests method.
The pooling of interest method is considered to involve the following:
(i) The assets and liabilities of the combining entities are reflected at their carrying amounts.
(ii) No adjustments are made to reflect fair values, or recognise any new assets or liabilities. The only adjustments that are made are to harmonise accounting policies.
(iii) The financial information in the financial statements in respect of prior periods is restated as if the business combination had occurred from the beginning of the preceding period in the financial statements, irrespective of the actual date of the combination. However, if business combination had occurred after that date, the prior period information shall be restated only from that date.
(iv) The balance of the retained earnings appearing in the financial statements of the transferor is aggregated with thecorresponding balance appearing in the financial statements of the transferee.

184 Apollo Tyres Ltd.
3.4 Inventories Inventories are valued at the lower of cost and estimated
net realizable value (net of allowances) after providing for obsolescence and other losses, where considered necessary. The cost comprises cost of purchase, cost of conversion and other costs including appropriate production overheads in the case of finished goods and work in progress, incurred in bringing such inventories to their present location and condition. Trade discounts or rebates are deducted in determining the costs of purchase. Net realisable value represents the estimated selling price for inventories less all estimated costs of completion and costs necessary to make the sale.
In case of raw materials, stores and spares and traded goods, cost (net of tax credits wherever applicable) is determined on a moving weighted average basis, and, in case of work in progress and finished goods, cost is determined on a First In First Out basis.
3.5 Taxation Income tax expense recognised in Standalone Statement of
Profit and Loss comprised the sum of deferred tax and current tax except the ones recognised in other comprehensive income or directly in equity.
Current Tax Current tax is the amount of tax payable on the taxable income
for the year as determined in accordance with the applicable income tax laws of India. Taxable profit differs from ‘profit before tax’ as reported in the standalone statement of profit and loss because of items of income or expense that are taxable or deductible in other years and items that are never taxable or deductible. The current tax is calculated using tax rates that have been enacted or substantively enacted by the end of the reporting period.
Deferred tax Deferred tax is recognized on temporary differences between
the carrying amount of assets and liabilities in the financial statements and quantified using the tax rates and laws enacted or substantively enacted as on the Balance Sheet date. Deferred tax liabilities are recognised for all taxable temporary differences. Deferred tax assets are generally recognised for all deductible temporary differences to the extent that it is probable that taxable profits will be available against which those deductible temporary differences can be utilised. Such deferred tax assets and liabilities are not recognised if the temporary difference arises from the initial recognition of assets and liabilities in a transaction that affects neither the taxable profit nor the accounting profit.
The carrying amount of deferred tax assets is reviewed at the end of each reporting period and reduced to the extent that it is no longer probable that sufficient taxable profits will be available to allow all or part of the asset to be recovered.
Minimum alternate tax (‘MAT’) credit entitlement is recognised as an asset only when and to the extent there
is convincing evidence that normal income tax will be paid during the specified period. In the year in which MAT credit becomes eligible to be recognised as an asset is created by way of a credit to the Standalone Statement of Profit and Loss and shown as MAT credit entitlement. This is reviewed at each balance sheet date and the carrying amount of MAT credit entitlement is written down to the extent it is not reasonably certain that normal income tax will be paid during the specified period.
Deferred tax liabilities and assets are measured at the tax rates that are expected to apply in the period in which the liability is settled or the asset realised, based on tax rates (and tax laws) that have been enacted or substantively enacted by the end of the reporting period.
The measurement of deferred tax liabilities and assets reflects the tax consequences that would follow from the manner in which the Company expects, at the end of the reporting period, to recover or settle the carrying amount of its assets and liabilities.
Current and Deferred tax for the year Current and deferred tax are recognised in the Statement
of Profit and Loss, except when they relate to items that are recognised in other comprehensive income or directly in equity, in which case, the current and deferred tax are also recognised in other comprehensive income or directly in equity respectively. Where current tax or deferred tax arises from the initial accounting for a business combination, the tax effect is included in the accounting for the business combination.
3.6 Property, plant and equipment (‘PPE’) Land and buildings held for use in the production or supply of
goods or services, or for administrative purposes, are stated in the balance sheet at cost less accumulated depreciation and accumulated impairment losses. Freehold land is not depreciated.
Properties in the course of construction for production, supply or administrative purposes are carried at cost, less any recognised impairment loss. For qualifying assets, borrowing costs are capitalised in accordance with Ind AS 23 - Borrowing costs. Such properties are classified to the appropriate categories of property, plant and equipment when completed and ready for intended use. Depreciation of these assets, on the same basis as other property assets, commences when the assets are ready for their intended use.
Fixtures and equipment are stated at cost less accumulated depreciation and accumulated impairment losses.
Property, plant and equipment are capitalised at costs relating to the acquisition and installation (net of tax credits wherever applicable) and include finance cost on borrowed funds attributable to acquisition of qualifying fixed assets for the period up to the date when the asset is ready for its intended use, and adjustments arising from foreign exchange differences arising on foreign currency borrowings to the
185Annual Report 2019-20
Statutory ReportsCorporate Overview Financial Statements
extent they are regarded as an adjustment to interest costs. Other incidental expenditure attributable to bringing the fixed assets to their working condition for intended use are capitalized. Subsequent expenditure relating to fixed assets is capitalised only if such expenditure results in an increase in the future benefits from such asset beyond its previously assessed standard of performance.
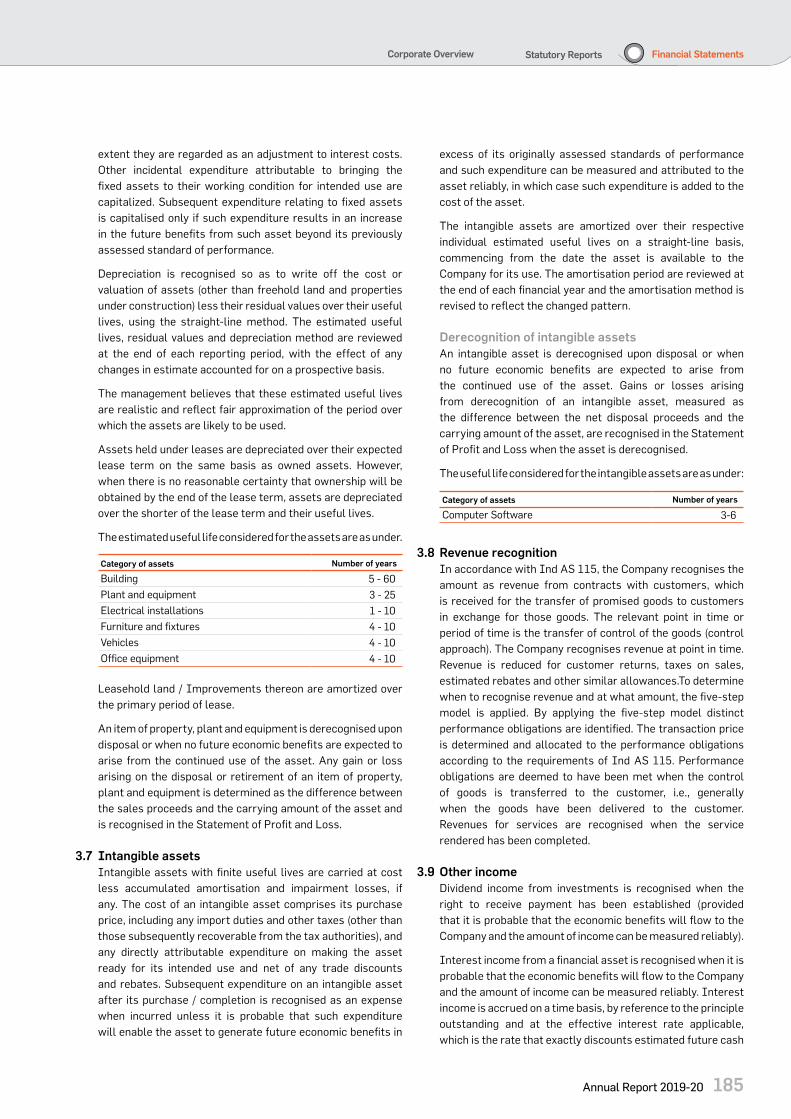
Depreciation is recognised so as to write off the cost or valuation of assets (other than freehold land and properties under construction) less their residual values over their useful lives, using the straight-line method. The estimated useful lives, residual values and depreciation method are reviewed at the end of each reporting period, with the effect of any changes in estimate accounted for on a prospective basis.
The management believes that these estimated useful lives are realistic and reflect fair approximation of the period over which the assets are likely to be used.
Assets held under leases are depreciated over their expected lease term on the same basis as owned assets. However, when there is no reasonable certainty that ownership will be obtained by the end of the lease term, assets are depreciated over the shorter of the lease term and their useful lives.
The estimated useful life considered for the assets are as under.
Category of assets Number of years
Building 5 - 60
Plant and equipment 3 - 25
Electrical installations 1 - 10
Furniture and fixtures 4 - 10
Vehicles 4 - 10
Office equipment 4 - 10
Leasehold land / Improvements thereon are amortized over the primary period of lease.
An item of property, plant and equipment is derecognised upon disposal or when no future economic benefits are expected to arise from the continued use of the asset. Any gain or loss arising on the disposal or retirement of an item of property, plant and equipment is determined as the difference between the sales proceeds and the carrying amount of the asset and is recognised in the Statement of Profit and Loss.
3.7 Intangible assets Intangible assets with finite useful lives are carried at cost
less accumulated amortisation and impairment losses, if any. The cost of an intangible asset comprises its purchase price, including any import duties and other taxes (other than those subsequently recoverable from the tax authorities), and any directly attributable expenditure on making the asset ready for its intended use and net of any trade discounts and rebates. Subsequent expenditure on an intangible asset after its purchase / completion is recognised as an expense when incurred unless it is probable that such expenditure will enable the asset to generate future economic benefits in
excess of its originally assessed standards of performance and such expenditure can be measured and attributed to the asset reliably, in which case such expenditure is added to the cost of the asset.
The intangible assets are amortized over their respective individual estimated useful lives on a straight-line basis, commencing from the date the asset is available to the Company for its use. The amortisation period are reviewed at the end of each financial year and the amortisation method is revised to reflect the changed pattern.
Derecognition of intangible assets An intangible asset is derecognised upon disposal or when
no future economic benefits are expected to arise from the continued use of the asset. Gains or losses arising from derecognition of an intangible asset, measured as the difference between the net disposal proceeds and the carrying amount of the asset, are recognised in the Statement of Profit and Loss when the asset is derecognised.
The useful life considered for the intangible assets are as under:
Category of assets Number of years
Computer Software 3-6
3.8 Revenue recognition In accordance with Ind AS 115, the Company recognises the
amount as revenue from contracts with customers, which is received for the transfer of promised goods to customers in exchange for those goods. The relevant point in time or period of time is the transfer of control of the goods (control approach). The Company recognises revenue at point in time. Revenue is reduced for customer returns, taxes on sales, estimated rebates and other similar allowances.To determine when to recognise revenue and at what amount, the five-step model is applied. By applying the five-step model distinct performance obligations are identified. The transaction price is determined and allocated to the performance obligations according to the requirements of Ind AS 115. Performance obligations are deemed to have been met when the control of goods is transferred to the customer, i.e., generally when the goods have been delivered to the customer. Revenues for services are recognised when the service rendered has been completed.
3.9 Other income Dividend income from investments is recognised when the
right to receive payment has been established (provided that it is probable that the economic benefits will flow to the Company and the amount of income can be measured reliably).
Interest income from a financial asset is recognised when it is probable that the economic benefits will flow to the Company and the amount of income can be measured reliably. Interest income is accrued on a time basis, by reference to the principle outstanding and at the effective interest rate applicable, which is the rate that exactly discounts estimated future cash
186 Apollo Tyres Ltd.
receipts through the expected life of the financial asset to that asset’s net carrying amount on initial recognition.
Royalty income is recognised on accrual basis in accordance with the substance of the relevant agreement (provided that it is probable that the economic benefits will flow to the Company and the amount of income can be measured reliably).
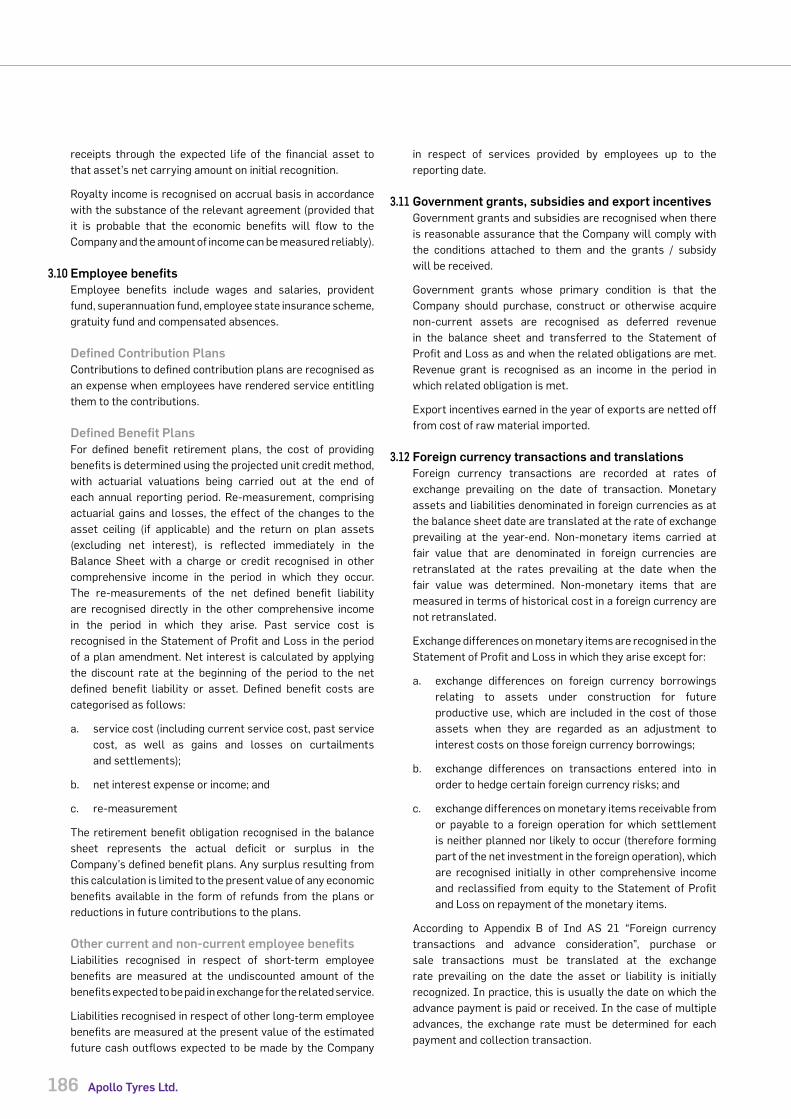
3.10 Employee benefits Employee benefits include wages and salaries, provident
fund, superannuation fund, employee state insurance scheme, gratuity fund and compensated absences.
Defined Contribution Plans Contributions to defined contribution plans are recognised as
an expense when employees have rendered service entitling them to the contributions.
Defined Benefit Plans For defined benefit retirement plans, the cost of providing
benefits is determined using the projected unit credit method, with actuarial valuations being carried out at the end of each annual reporting period. Re-measurement, comprising actuarial gains and losses, the effect of the changes to the asset ceiling (if applicable) and the return on plan assets (excluding net interest), is reflected immediately in the Balance Sheet with a charge or credit recognised in other comprehensive income in the period in which they occur. The re-measurements of the net defined benefit liability are recognised directly in the other comprehensive income in the period in which they arise. Past service cost is recognised in the Statement of Profit and Loss in the period of a plan amendment. Net interest is calculated by applying the discount rate at the beginning of the period to the net defined benefit liability or asset. Defined benefit costs are categorised as follows:
a. service cost (including current service cost, past service cost, as well as gains and losses on curtailments and settlements);
b. net interest expense or income; and
c. re-measurement
The retirement benefit obligation recognised in the balance sheet represents the actual deficit or surplus in the Company’s defined benefit plans. Any surplus resulting from this calculation is limited to the present value of any economic benefits available in the form of refunds from the plans or reductions in future contributions to the plans.
Other current and non-current employee benefits Liabilities recognised in respect of short-term employee
benefits are measured at the undiscounted amount of the benefits expected to be paid in exchange for the related service.
Liabilities recognised in respect of other long-term employee benefits are measured at the present value of the estimated future cash outflows expected to be made by the Company
in respect of services provided by employees up to the reporting date.
3.11 Government grants, subsidies and export incentives Government grants and subsidies are recognised when there
is reasonable assurance that the Company will comply with the conditions attached to them and the grants / subsidy will be received.
Government grants whose primary condition is that the Company should purchase, construct or otherwise acquire non-current assets are recognised as deferred revenue in the balance sheet and transferred to the Statement of Profit and Loss as and when the related obligations are met. Revenue grant is recognised as an income in the period in which related obligation is met.
Export incentives earned in the year of exports are netted off from cost of raw material imported.
3.12 Foreign currency transactions and translations Foreign currency transactions are recorded at rates of
exchange prevailing on the date of transaction. Monetary assets and liabilities denominated in foreign currencies as at the balance sheet date are translated at the rate of exchange prevailing at the year-end. Non-monetary items carried at fair value that are denominated in foreign currencies are retranslated at the rates prevailing at the date when the fair value was determined. Non-monetary items that are measured in terms of historical cost in a foreign currency are not retranslated.
Exchange differences on monetary items are recognised in the Statement of Profit and Loss in which they arise except for:
a. exchange differences on foreign currency borrowings relating to assets under construction for future productive use, which are included in the cost of those assets when they are regarded as an adjustment to interest costs on those foreign currency borrowings;
b. exchange differences on transactions entered into in order to hedge certain foreign currency risks; and
c. exchange differences on monetary items receivable from or payable to a foreign operation for which settlement is neither planned nor likely to occur (therefore forming part of the net investment in the foreign operation), which are recognised initially in other comprehensive income and reclassified from equity to the Statement of Profit and Loss on repayment of the monetary items.
According to Appendix B of Ind AS 21 “Foreign currency transactions and advance consideration”, purchase or sale transactions must be translated at the exchange rate prevailing on the date the asset or liability is initially recognized. In practice, this is usually the date on which the advance payment is paid or received. In the case of multiple advances, the exchange rate must be determined for each payment and collection transaction.

187Annual Report 2019-20
Statutory ReportsCorporate Overview Financial Statements
3.13 Employee share based payments Stock appreciation rights (Phantom stock units) are granted
to employees under the Cash-settled Employee Share-based Payment Plan (Phantom Stock Plan).
For cash-settled share-based payments, a liability is recognised for the goods or services acquired, measured initially at the fair value of the liability. At the end of each reporting period until the liability is settled, and at the date of settlement, the fair value of the liability is remeasured, with any changes in fair value recognised in the Statement of Profit and Loss.
3.14 Borrowing costs Borrowing costs directly attributable to the acquisition,
construction or production of qualifying assets, which are assets that necessarily take a substantial period of time to get ready for their intended use or sale, are added to the cost of those assets, until such time as the assets are substantially ready for their intended use or sale.
All other borrowing costs are recognised in the Statement of Profit and Loss in the period in which they are incurred. Other finance costs includes interest on other contractual obligations.
3.15 Leases The Company as lessee The Company’s lease asset classes primarily consist of
leases for Building and Plant machinery. The Company assesses whether a contract contains a lease, at inception of a contract. A contract is, or contains, a lease if the contract conveys the right to control the use of an identified asset for a period of time in exchange for consideration. To assess whether a contract conveys the right to control the use of an identified asset, the Company assesses whether: (1) the contract involves the use of an identified asset, (2) the Company has substantially all of the economic benefits from the use of the asset through the period of the lease, and (3) the Company has the right to direct the use of the asset.
At the date of commencement of the lease, the Company recognizes a Right of use (ROU) asset and a corresponding lease liability for all lease arrangements under which it is a lessee, except for short-term leases and low value leases. For short-term leases and low value leases, the Company recognizes the lease payments as an expense on a straight-line basis over the term of the lease.
Certain lease arrangements include options to extend or terminate the lease before the end of the lease term. ROU assets and lease liabilities include these options when it is reasonably certain that they will be exercised.
The ROU assets are initially recognized at cost, which comprises the initial amount of the lease liability adjusted for any lease payments made at or prior to the commencement date of the lease plus any initial direct costs less any lease
incentives. They are subsequently measured at cost less accumulated depreciation and impairment losses.
ROU assets are depreciated from the date of commencement of the lease on a straight -line basis over the shorter of the lease term and the useful life of the underlying asset.
The lease liability is initially measured at amortized cost at the present value of the future lease payments. For leases under which the rate implicit in the lease is not readily determinable, the Company uses its incremental borrowing rate based on the information available at the date of commencement of the lease in determining the present value of lease payments. Lease liabilities are re measured with a corresponding adjustment to the related ROU asset if the Company changes its assessment as to whether it will exercise an extension or a termination option.
Lease liability and ROU assets have been separately presented in the Balance sheet and the payment of principal portion of lease liabilities has been classified as financing cash flows.
Transition Effective April 01, 2019, the Company adopted Ind AS 116
“Leases” and applied the standard to all lease contracts existing on April 01, 2019 using the modified retrospective method, on the date of initial application. This new standard provides a comprehensive model for the identification of lease arrangements and their treatment in the financial statements of both lessees and lessors. Ind AS 116 supersedes Ind AS 17 and its associated interpretative guidance. Consequently, the Company recorded the lease liability at the present value of the lease payments discounted at the incremental borrowing rate and Right-of-use assets were measured at the amount of the lease liability (adjusted for any prepaid or accrued lease expenses). Comparatives as at and for the year ended March 31, 2019 have not been retrospectively adjusted and therefore will continue to be reported under the accounting policies included as part of our Annual Report for year ended March 31, 2019
On transition, the adoption of the new standard resulted in recognition of Right-of-Use asset (ROU) (an amount equal to the lease liability, adjusted by the prepaid lease rent) of ` 6,808.48 Million. The effect of this adoption is decrease in profit before tax by ` 274.13 Million for the year ended March 31, 2020.
The following is the summary of practical expedients elected on initial application:
1. Applied a single discount rate to a portfolio of leases of similar assets in similar economic environment with a similar end date
2. Applied the exemption not to recognize right-of-use assets and liabilities for leases with less than 12 months of lease term on the date of initial application
3. Excluded the initial direct costs from the measurement of the right-of-use asset at the date of initial application.

188 Apollo Tyres Ltd.
4. Applied the practical expedient to grandfather the assessment of which transactions are leases. Accordingly, Ind AS 116 is applied only to contracts that were previously identified as leases under Ind AS 17.
The weighted average incremental borrowing rate applied to lease liabilities as at April 01, 2019 is 8% p.a.
3.16 Earnings per share Basic earnings per share is computed by dividing the
profit / (loss) after tax (including the post tax effect of extraordinary items, if any) by the weighted average number of equity shares outstanding during the year. Diluted earnings per share is computed by dividing the profit / (loss) after tax (including the post tax effect of extraordinary items, if any) as adjusted for dividend, interest and other charges to expense or income (net of any attributable taxes) relating to the dilutive potential equity shares, by the weighted average number of equity shares considered for deriving basic earnings per share and the weighted average number of equity shares which could have been issued on the conversion of all dilutive potential equity shares. Potential equity shares are deemed to be dilutive only if their conversion to equity shares would decrease the net profit per share from continuing ordinary operations. Potential dilutive equity shares are deemed to be converted as at the beginning of the period, unless they have been issued at a later date. The dilutive potential equity shares are adjusted for the proceeds receivable had the shares been actually issued at fair value (i.e., average market value of the outstanding shares). Dilutive potential equity shares are determined independently for each period presented. The number of equity shares and potentially dilutive equity shares are adjusted for share splits / reverse share splits and bonus shares, as appropriate.
3.17 Impairment of tangible and intangible assets At the end of each reporting period, the Company reviews
the carrying amounts of its tangible and intangible assets or cash generating units to determine whether there is any indication that those assets have suffered an impairment loss. If any such indication exists, the recoverable amount of the asset is estimated in order to determine the extent of the impairment loss (if any). When it is not possible to estimate the recoverable amount of an individual asset, the Company estimates the recoverable amount of the cash-generating unit to which the asset belongs. When a reasonable and consistent basis of allocation can be identified, corporate assets are also allocated to individual cash-generating units, or otherwise they are allocated to the smallest Company of cash-generating units for which a reasonable and consistent allocation basis can be identified.
Intangible assets with indefinite useful lives and intangible assets not yet available for use are tested for impairment at least annually, or whenever there is an indication that the asset may be impaired.
Recoverable amount is the higher of fair value less costs of disposal and value in use. In assessing value in use, the estimated future cash flows are discounted to their present value using a pre-tax discount rate that reflects current market assessments of the time value of money and the risks specific to the asset for which the estimates of future cash flows have not been adjusted.
If the recoverable amount of an asset (or cash-generating unit) is estimated to be less than its carrying amount, the carrying amount of the asset (or cash-generating unit) is reduced to its recoverable amount. An impairment loss is recognised immediately in the Statement of Profit and Loss, unless the relevant asset is carried at a revalued amount, in which case the impairment loss is treated as a revaluation decrease.
When an impairment loss subsequently reverses, the carrying amount of the asset (or a cash-generating unit) is increased to the revised estimate of its recoverable amount, but so that the increased carrying amount does not exceed the carrying amount that would have been determined had no impairment loss been recognised for the asset (or cash-generating unit) in prior years. A reversal of an impairment loss is recognised immediately in the Statement of Profit and Loss, unless the relevant asset is carried at a revalued amount, in which case the reversal of the impairment loss is treated as a revaluation increase.
3.18 Provisions and contingencies A provision is recognized when the Company has a present
obligation (legal / constructive) as a result of past events and it is probable that an outflow of resources will be required to settle the obligation, in respect of which a reliable estimate can be made.
The amount recognised as a provision is the best estimate of the consideration required to settle the present obligation at the end of the reporting period, taking into account the risks and uncertainties surrounding the obligation. When a provision is measured using the cash flows estimated to settle the present obligation, its carrying amount is the present value of those cash flows (when the effect of the time value of money is material).
Contingent liability is disclosed for (i) Possible obligation which will be confirmed only by future events not wholly within the control of the Company or (ii) Present obligations arising from past events where it is not probable that an outflow of resources will be required to settle the obligation or a reliable estimate of the amount of the obligation cannot be made. When some or all of the economic benefits required to settle a provision are expected to be recovered from a third party, a receivable is recognised as an asset if it is virtually certain that reimbursement will be received and the amount of the receivable can be measured reliably.
Provisions for the expected cost of sales related obligations are recognised at the date of sale of the relevant products, at

189Annual Report 2019-20
Statutory ReportsCorporate Overview Financial Statements
the management’s best estimate of the expenditure required to settle the Company’s obligation.
3.19 Financial instruments Financial assets and financial liabilities are recognised when
an entity becomes a party to the contractual provisions of the instruments.
Financial assets and financial liabilities are initially measured at fair value. Transaction costs that are directly attributable to the acquisition or issue of financial assets and financial liabilities (other than financial assets and financial liabilities at fair value through profit and loss) are added to or deducted from the fair value of the financial assets or financial liabilities, as appropriate, on initial recognition. Transaction costs directly attributable to the acquisition of financial assets or financial liabilities at fair value through profit and loss are recognised immediately in the Statement of Profit and Loss.
3.20 Financial assets All regular way purchases or sales of financial assets are
recognised and derecognised on a trade date basis. Regular way purchases or sales are purchases or sales of financial assets that require delivery of assets within the time frame established by regulation or convention in the marketplace.
All recognised financial assets are subsequently measured in their entirety at either amortised cost or fair value, depending on the classification of the financial assets.
3.20.1 Classification of financial asseta. Loans and receivable Financial assets that meet the following conditions are
subsequently measured at amortised cost less impairment loss (except for investments that are designated as at FVTPL on initial recognition):
i. the asset is held within a business model whose objective is to hold assets in order to collect contractual cash flows; and
ii. the contractual terms of the instrument give rise on specified dates to cash flows that are solely payments of principal and interest on the principal amount outstanding.
The effective interest method is a method of calculating the amortised cost of a debt instrument and of allocating interest income over the relevant period. The effective interest rate is the rate that exactly discounts estimated future cash receipts (including all fees and points paid or received that form an integral part of the effective interest rate, transaction costs and other premiums or discounts) through the expected life of the debt instrument, or, where appropriate, a shorter period, to the net carrying amount on initial recognition.
Income is recognised on an effective interest basis for debt instruments other than those financial assets classified as at FVTPL. Interest income is recognised in the Statement of Profit and Loss and is included in the ‘Other Income’ line item.
b. Assets available for sale Financial assets that meet the following conditions
are subsequently measured at fair value through other comprehensive income (‘FVTOCI’) (except for investments that are designated as at FVTPL on initial recognition):
i. the asset is held within a business model whose objective is achieved both by collecting contractual cash flows and selling financial assets; and
ii. the contractual terms of the instrument give rise on specified dates to cash flows that are solely payments of principal and interest on the principal amount outstanding.
All other financial assets are subsequently measured at fair value.
c. Assets held for trading A financial asset is held for trading if:
i. it has been acquired principally for the purpose of selling it in the near term; or
ii. on initial recognition it is part of a portfolio of identified financial instruments that the Company manages together and has a recent actual pattern of short-term profit-taking; or
iii. it is a derivative that is not designated and effective as a hedging instrument or a financial guarantee.
Dividends on these investments in equity instruments are recognised in the Statement of Profit and Loss when the right to receive the dividends is established and it is probable that the economic benefits associated with the dividend will flow to the entity, the dividend does not represent a recovery of part of cost of the investment and the amount of dividend can be measured reliably.
d. Financial assets at fair value through profit and loss (‘FVTPL’)
Investments in equity instruments are classified as at FVTPL, unless the Company irrevocably elects on initial recognition to present subsequent changes in fair value in other comprehensive income for equity instruments which are not held for trading.
Debt instrument that do not meet the amortised cost criteria or fair value through other comprehensive income criteria (see above) are measured at FVTPL. In addition, debt instruments that meet the amortised cost criteria or the fair value through other comprehensive income criteria but are designated as at FVTPL are measured at FVTPL.
A financial asset may be designated as at FVTPL upon initial recognition if such designation eliminates or significantly reduces a measurement or recognition inconsistency that would arise from measuring assets or liabilities or recognising the gains and losses on them on different bases.
Financial assets at FVTPL are measured at fair value at the end of each reporting period, with any gains or losses arising

190 Apollo Tyres Ltd.
on re-measurement recognised in the Statement of Profit and Loss. The net gain or loss recognised in the Statement of Profit and Loss is included in the ‘other income’ line item. Dividend on financial assets at FVTPL is recognised when the Company’s right to receive the dividends is established, it is probable that the economic benefits associated with the dividend will flow to the entity, the dividend does not represent a recovery of part of cost of the investment and the amount of dividend can be measured reliably.
3.20.2 Impairment of financial assets The Company applies the expected credit loss model for
recognising impairment loss on financial assets measured at amortised cost, debt instruments at FVTOCI, lease receivables, trade receivables, other contractual rights to receive cash or other financial assets, and financials guarantees not designated as at FVTPL.
Expected credit losses are the weighted average of credit losses with the respective risks of default occurring as the weights. Credit loss is the difference between all contractual cash flows that are due to the Company in accordance with the contract and all the cash flows that the Company expects to receive (i.e., all cash shortfalls), discounted at the original effective interest rate (or credit-adjusted effective interest rate for purchased or originated credit-impaired financial assets). The Company estimates cash flows by considering all contractual terms of the financial instrument (for example, prepayment, extension, call and similar options) through the expected life of that financial instruments.
The Company measures the loss allowance for a financial instrument at an amount equal to the lifetime expected credit losses if the credit risk on that financial instrument has increased significantly since initial recognition. If the credit risk on a financial instrument has not increased significantly since initial recognition, the Company measures the loss allowance for that financial instrument at an amount equal to 12-month expected credit losses.12-month expected credit losses are portion of the life-time expected credit losses and represent the lifetime cash shortfalls that will result if default occurs within the 12 months after the reporting date and thus, are not cash shortfalls that are predicted over the next 12 months.
If the Company measured loss allowance for a financial instrument at lifetime expected credit loss model in the previous period, but determines at the end of a reporting period that the credit risk has not increased significantly since initial recognition due to improvement in credit quality as compared to the previous period, the Company again measures the loss allowance based on 12- month expected credit losses.
When making the assessment of whether there has been a significant increase in credit risk since initial recognition, the Company uses the change in the risk of a default occurring over the expected life of the financial instrument. To make that assessment, the Company compares the risk of a default
occurring on the financial instrument as at the reporting date with the risk of a default occurring on the financial instrument as at the date of initial recognition and considers reasonable and supportable information, that is available without undue cost or effort, that is indicative of significant increases in credit risk since initial recognition.
For trade receivables or any contractual right to receive cash or another financial asset that result from transactions that are within the scope of Ind AS 115 - Revenue from contracts with customers, the Company always measures the loss allowance at an amount equal to lifetime expected credit losses. Credit impaired balances are disclosed under provision for doubtful debts.
3.20.3 De-recognition of financial assets The Company derecognises a financial asset when the
contractual rights to the cash flows from the asset expire, or when it transfers the financial asset and substantially all the risks and rewards of ownership of the asset to another party. If the Company neither transfers nor retains substantially all the risks and rewards of ownership and continues to control the transferred asset, the Company recognises its retained interest in the asset and an associated liability for amounts it may have to pay. If the Company retains substantially all the risks and rewards of ownership of a transferred financial asset, the Company continues to recognise the financial asset and also recognises a collateralised borrowing for the proceeds received.
On de-recognition of a financial asset in its entirety, the difference between the asset’s carrying amount and the sum of the consideration received and receivable and the cumulative gain or loss that had been recognised in other comprehensive income and accumulated in equity is recognised in the Statement of Profit and Loss if such gain or loss would have otherwise been recognized in the Statement of Profit and Loss on disposal of that financial asset.
On de-recognition of a financial asset other than in its entirety (e.g. when the Company retains an option to repurchase part of a transferred asset), the Company allocates the previous carrying amount of the financial asset between the part it continues to recognise under continuing involvement, and the part it no longer recognises on the basis of the relative fair values of those parts on the date of the transfer. The difference between the carrying amount allocated to the part that is no longer recognised and the sum of the consideration received for the part no longer recognised and any cumulative gain or loss allocated to it that had been recognised in other comprehensive income is recognised in the Statement of Profit and Loss if such gain or loss would have otherwise been recognized in the Statement of Profit and Loss on disposal of that financial asset. A cumulative gain or loss that had been recognised in other comprehensive income is allocated between the part that continues to be recognised and the part that is no longer recognised on the basis of the relative fair values of those parts.

191Annual Report 2019-20
Statutory ReportsCorporate Overview Financial Statements
3.20.4 Foreign Exchange gains and losses The fair value of financial assets denominated in a foreign
currency is determined in that foreign currency and translated at the spot rate at the end of each reporting period.
For foreign currency denominated financial assets measured at amortised cost and FVTPL, the exchange differences are recognised in the Statement of Profit and Loss except for those which are designated as hedging instruments in hedging relationship.
3.21 Financial liabilities and equity instruments3.21.1 Classification as debt or equity Debt and equity instruments issued by the Company are
classified as either financial liabilities or as equity in accordance with the substance of the contractual arrangements and the definitions of a financial liability and an equity instrument.
3.21.2 Equity instruments An equity instrument is any contract that evidences a residual
interest in the assets of an entity after deducting all of its liabilities. Equity instruments issued by the Company are recognised at the proceeds received, net of direct issue costs.
3.21.3 Financial liabilities All financial liabilities are subsequently measured at amortised
cost using the effective interest method or at FVTPL. However, financial liabilities that arise when a transfer of a financial asset does not qualify for derecognition or when the continuing involvement approach applies, financial guarantee contracts issued by the Company are measured in accordance with the specific accounting policies set out below.
3.21.3.1 Financial liabilities at FVTPL Financial liabilities are classified as at FVTPL when
the financial liability is either held for trading or it is designated as at FVTPL.
A financial liability is classified as held for trading if:
i. it has been incurred principally for the purpose of repurchasing it in the near term; or
ii. on initial recognition it is part of a portfolio of identified financial instruments that the Company manages together and has a recent actual pattern of short-term profit-taking; or
iii. it is a derivative that is not designated and effective as a hedging instrument.
A financial liability other than a financial liability held for trading may be designated as at FVTPL upon initial recognition if:
i. such designation eliminates or significantly reduces a measurement or recognition inconsistency that would otherwise arise; or
ii. the financial liability forms part of a Company of financial assets or financial liabilities or both, which is managed
and its performance is evaluated on a fair value basis, in accordance with the Company’s documented risk management or investment strategy, and information about the Companying is provided internally on that basis; or
iii. it forms part of a contract containing one or more embedded derivatives, and Ind AS 109 - Financial Instruments permits the entire combined contract to be designated as at FVTPL in accordance with Ind AS 109.
Financial liabilities at FVTPL are stated at fair value, with any gains or losses arising on remeasurement recognised in the Statement of Profit and Loss.
3.21. 3.2 Financial liabilities subsequently measured at amortised cost
Financial liabilities that are not held-for-trading and are not designated as at FVTPL are measured at amortised cost at the end of subsequent accounting periods. The carrying amounts of financial liabilities that are subsequently measured at amortised cost are determined based on the effective interest method. Interest expense that is not capitalised as part of costs of an asset is included in the ‘finance costs’ line item.
The effective interest method is a method of calculating the amortised cost of a financial liability and of allocating interest expense over the relevant period. The effective interest rate is the rate that exactly discounts estimated future cash payments (including all fees and points paid or received that form an integral part of the effective interest rate, transaction costs and other premiums or discounts) through the expected life of the financial liability, or (where appropriate) a shorter period, to the net carrying amount on initial recognition.
3.21.3.3 Financial guarantee contracts A financial guarantee contract is a contract that requires
the issuer to make specified payments to reimburse the holder for a loss it incurs because a specified debtor fails to make payments when due in accordance with the terms of a debt instrument.
Financial guarantee contracts issued by the Company are initially measured at their fair values and, if not designated as at FVTPL, are subsequently measured at:
i. amount of loss allowance determined in accordance with impairment requirements of Ind AS 109 - Financial Instruments; and
ii. amount initially recognised less, where appropriate, cumulative amortisation recognised in accordance with the revenue recognition policies of Ind AS 115, Revenue from Contracts with Customers.
For financial liabilities that are denominated in a foreign currency and are measured at amortised cost at the end of each reporting period, the foreign exchange gains and losses are determined based on the amortised cost of the instruments and are recognised in the ‘Other Income’ line item.

192 Apollo Tyres Ltd.
The fair value of financial liabilities denominated in a foreign currency is determined in that foreign currency and translated at the spot rate at the end of the reporting period. For financial liabilities that are measured as at FVTPL, the foreign exchange component forms part of the fair value gains or losses and is recognised in the Statement of Profit and Loss.
3.21.3.4 Derecognition of financial liabilities The Company derecognises financial liabilities when, and only
when, the Company’s obligations are discharged, cancelled or they expire. The difference between the carrying amount of the financial liability derecognised and the consideration paid and payable is recognised in the Statement of Profit and Loss.
3.22 Derivative financial instruments The Company enters into a variety of derivative financial
instruments to manage its exposure to interest rate and foreign exchange rate risks, including options, foreign exchange forward contracts and cross currency swaps.
Derivatives are initially recognised at fair value at the date the derivative contracts are entered into and are subsequently remeasured to their fair value at the end of each reporting period. The resulting gain or loss is recognised in the Statement of Profit and Loss immediately unless the derivative is designated and effective as a hedging instrument, in which event the timing of the recognition in the Statement of Profit and Loss depends on the nature of the hedging relationship and the nature of the hedged item.
3.23 Hedge Accounting The Company designates certain hedging instruments,
which include derivatives, embedded derivatives and non-derivatives in respect of foreign currency risk, as either fair value hedges, cash flow hedges, or hedges of net investments in foreign operations. Hedges of foreign exchange risk on firm commitments are accounted for as cash flow hedges.
At the inception of the hedge relationship, the entity documents the relationship between the hedging instrument and the hedged item, along with its risk management objectives and its strategy for undertaking various hedge transactions. Furthermore, at the inception of the hedge and on an ongoing basis, the Company documents whether the hedging instrument is highly effective in offsetting changes in fair values or cash flows of the hedged item attributable to the hedged risk.
Fair Value hedges Changes in fair value of the designated portion of derivatives
that qualify as fair value hedges are recognised in profit or loss immediately, together with any changes in the fair value of the hedged asset or liability that are attributable to the hedged risk. The change in the fair value of the designated portion of hedging instrument and the change in fair value of the hedged item attributable to the hedged risk are recognised in the Statement of Profit and Loss in the line item relating to the hedged item. Hedge accounting is discontinued
when the hedging instrument expires or is sold, terminated, or exercised, or when it no longer qualifies for hedge accounting. The fair value adjustment to the carrying amount of the hedged item arising from the hedged risk is amortised to profit or loss from that date.
Cash flow hedges The effective portion of changes in the fair value of derivatives
that are designated and qualify as cash flow hedges is recognised in other comprehensive income and accumulated under the heading of cash flow hedging reserve. The gain or loss relating to the ineffective portion is recognised immediately in the Statement of Profit and Loss, and is included in the ‘Other income’/ ‘Other expense’ line item. Amounts previously recognised in other comprehensive income and accumulated in equity relating to (effective portion as described above) are reclassified to the Statement of Profit and Loss in the periods when the hedged item affects the Statement of Profit and Loss, in the same line as the recognised hedged item. However, when the hedged forecast transaction results in the recognition of a non-financial asset or a non-financial liability, such gains and losses are transferred from equity (but not as a reclassification adjustment) and included in the initial measurement of the cost of the non -financial asset or non-financial liability.
In cases where the designated hedging instruments are options and forward contracts, the Company has an option, for each designation, to designate on an instrument only the changes in intrinsic value of the options and spot element of forward contracts respectively as hedges. In such cases, the time value of the options is accounted based on the type of hedged item which those options hedge.
In case of transaction related hedged item in the above cases, the change in time value of the options is recognised in other comprehensive income to the extent it relates to the hedged item and accumulated in a separate component of equity, i.e., Reserve for time value of options and forward elements of forward contracts in hedging relationship. This separate component is removed and directly included in the initial cost or other carrying amount of the asset or the liability (i.e., not as a reclassification adjustment thus not affecting other comprehensive income) if the hedged item subsequently results in recognition of a non-financial asset or a non-financial liability. In other cases, the amount accumulated is reclassified to the Statement of Profit and Loss as a reclassification adjustment in the same period in which the hedged expected future cash flows affect the Statement of Profit and Loss.
In case of time-period related hedged item in the above cases, the change in time value of the options is recognised in other comprehensive income to the extent it relates to the hedged item and accumulated in a separate component of equity, i.e., Reserve for time value of options and forward elements of forward contracts in hedging relationship. The time value of options at the date of designation of the options in the hedging

193Annual Report 2019-20
Statutory ReportsCorporate Overview Financial Statements
relationships is amortised on a systematic and rational basis over the period during which the options’ intrinsic value could affect the Statement of Profit and Loss. This is done as a reclassification adjustment and hence affects other comprehensive income.
In cases where only the spot element of the forward contracts is designated in a hedging relationship and the forward element of the forward contract is not designated, the Company makes the choice for each designation whether to recognise the changes in forward element of fair value of the forward contracts in the Statement of Profit and Loss or to account for this element similar to the time value of an option. Hedge accounting is discontinued when the hedging instrument expires or is sold, terminated, or exercised, or when it no longer qualifies for hedge accounting. Any gain or loss recognised in other comprehensive income and accumulated in equity at that time remains in equity and is recognised when the forecast transaction is ultimately recognised in the Statement of Profit and Loss. When a forecast transaction is no longer expected to occur, the gain or loss accumulated in equity is recognised immediately in the Statement of Profit and Loss.
3.24 Cash and cash equivalents Cash comprises cash on hand and demand deposits with
banks. Cash equivalents are short-term balances (with an original maturity of three months or less from the date of acquisition), highly liquid investments that are readily convertible into known amounts of cash and which are subject to insignificant risk of changes in value.
For the purpose of the statement of cash flows, cash and cash equivalents consist of cash and short-term balances, as defined above, net of outstanding cash credits as they are considered an integral part of the Company’s cash management. The cash flow statement is prepared using indirect method.
3.25 Rounding off amounts All amounts disclosed in the financial statements and
notes have been rounded off to the nearest millions as per the requirements of Schedule III of the Act unless otherwise stated.
3.26 Critical accounting judgements and key sources of estimation uncertainty
The preparation of financial statements in conformity with Ind AS requires management to make certain judgements and estimates that may effect the application of accounting policies, reported amounts and related disclosures. These judgments and estimates may have an impact on the assets and liabilities, disclosure of contingent liabilities at the date of the financial statements, and income and expense items for the period under review. Actual results may differ from these judgements and estimates. All assumptions, expectations and forecasts that are
used as a basis for judgments and estimates in the financial statements represent as accurately an outlook as possible for the Company. These judgements and estimates only represent the interpretation of the Company as of the dates on which they were prepared. Important judgments and estimates relate largely to provisions, pensions, tangible and intangible assets (lives, residual values and impairment), deferred tax assets and liabilities and valuation of financial instruments.
3.27 Estimation of uncertainties relating to the global health pandemic from COVID-19
The outbreak of Coronavirus (COVID-19) pandemic is causing disturbance and slowdown of economic activity throughout the world and is impacting operations of the businesses, by way of interruption in production, supply chain disruption, unavailability of personnel, closure of production facilities etc. On March 23, 2020, the Government of India ordered a nationwide lockdown initially for 21 days which further got extended from time to time to prevent community spread of COVID-19 in India. The Company has considered the possible effects that may result from the pandemic relating to COVID-19 on the carrying amounts of property, plant and equipment, investments, inventories, receivables and other current assets. In developing the assumptions relating to the possible future uncertainties in the global economic conditions because of this pandemic, the Company, as at the date of approval of these financial statements has used internal and external sources on the expected future performance of the Company. The Company has performed sensitivity analysis on the assumptions used and based on current indicators of future economic conditions, the Company expects the carrying amount of these assets will be recovered and sufficient liquidity is available to fund the business operations for at least another 12 months. Given the uncertainty because of COVID-19, the final impact on the Company’s assets in future may differ from that estimated as at the date of approval of these financial statements.

B1
PR
OP
ER
TY,
PL
AN
T A
ND
EQ
UIP
ME
NT
AN
D I
NTA
NG
IBL
E A
SS
ET
S A
S O
N M
AR
CH
31,
202
0`
Mill
ion
Gro
ss B
lock
Acc
umul
ated
Dep
reci
atio
n /
Am
orti
sati
onN
et B
lock
As
onM
arch
31,
20
19A
ddit
ions
Dis
posa
lsA
s on
Mar
ch 3
1,
2020
As
onM
arch
31,
20
19
Dep
reci
atio
n /
amor
tisa
tion
ex
pens
e
Elim
inat
ed
on d
ispo
sal
of a
sset
s
As
onM
arch
31,
20
20
As
onM
arch
31,
20
20
As
onM
arch
31,
20
19
A.
Pro
pert
y, p
lant
and
equ
ipm
ent -
ow
ned
unle
ss
othe
rwis
e st
ated
La
nd:
Fr
eeho
ld la
nd17
5.14
-30
.50
144.
64-
--
-14
4.64
175.
14
Le
aseh
old
land
*19
6.0
9-
-19
6.0
922
.66
2.19
-24
.85
171.
2417
3.43
(a)
B
uild
ings
#13
,332
.05
13,7
02.
8795
.67
26,9
39.2
53,
287.
701,
594.
05
8.45
4,87
3.30
22,0
65.9
510
,044
.35
(b)
(d)
(d)
P
lant
and
equ
ipm
ent
** #
75,1
97.7
220
,017
.34
252.
6794
,962
.39
24,7
58.4
33,
743.
1523
0.8
128
,270
.77
66,6
91.6
250
,439
.29
(b)
E
lect
rica
l ins
tall
atio
ns2,
478.
06
690
.23
7.11
3,16
1.18
1,39
4.78
224.
376.
851,
612.
301,
548.
881,
083
.28
(b)
Fu
rnitu
re a
nd fi
xtur
es2,
221.
9522
4.56
8.18
2,43
8.33
1,28
2.64
260
.74
7.88
1,53
5.50
902.
8393
9.31
(b)
Ve
hicl
es80
5.61
271.
6819
8.22
879.
07
342.
9911
4.75
145.
9631
1.78
567.
2946
2.62
(b)
O
ffice
equ
ipm
ent
601.
2425
2.22
0.5
085
2.96
237.
8717
6.33
0.3
541
3.85
439.
1136
3.37
(b)
To
tal t
angi
ble
asse
ts95
,00
7.86
35,1
58.9
059
2.85
129,
573.
9131
,327
.07
6,11
5.58
40
0.3
037
,04
2.35
92,5
31.5
663
,680
.79
B.
Inta
ngib
le a
sset
s:
C
ompu
ter
soft
war
e77
7.47
97.4
4-
874.
9146
3.0
891
.47
-55
4.55
320
.36
314.
39
(b)
TO
TAL
(A +
B)
95,7
85.3
335
,256
.34
592.
8513
0,4
48.
8231
,790
.15
6,20
7.0
54
00
.30
37,5
96.9
092
,851
.92
63,9
95.1
8
(c)
194 Apollo Tyres Ltd.
B. NOTESforming Part of the Financial Statements

B1
PR
OP
ER
TY,
PL
AN
T A
ND
EQ
UIP
ME
NT
AN
D I
NTA
NG
IBL
E A
SS
ET
S A
S O
N M
AR
CH
31,
201
9`
Mill
ion
Gro
ss B
lock
Acc
umul
ated
Dep
reci
atio
n /
Am
orti
sati
onN
et B
lock
As
onM
arch
31,
20
18A
ddit
ions
Dis
posa
lsA
s on
Mar
ch 3
1,
2019
As
onM
arch
31,
20
18
Dep
reci
atio
n /
amor
tisa
tion
ex
pens
e
Elim
inat
ed
on d
ispo
sal
of a
sset
s
As
onM
arch
31,
20
19
As
onM
arch
31,
20
19
As
onM
arch
31,
20
18
A.
Pro
pert
y, p
lant
and
equ
ipm
ent -
ow
ned
unle
ss
othe
rwis
e st
ated
La
nd:
Fr
eeho
ld la
nd17
5.14
--
175.
14-
--
-17
5.14
175.
14
Le
aseh
old
land
*18
9.64
6.45
-19
6.0
920
.51
2.15
-22
.66
173.
4316
9.13
(a)
B
uild
ings
12,2
72.1
11,
061
.08
1.14
13,3
32.0
52,
892.
8639
4.84
(0.2
2)3,
287.
9210
,044
.13
9,37
9.25
(b)
(d)
(d)
P
lant
and
equ
ipm
ent
**66
,054
.11
9,36
1.27
217.
6675
,197
.72
21,6
27.1
03,
291.
3716
0.2
624
,758
.21
50,4
39.5
144
,427
.01
(b)
E
lect
rica
l ins
tall
atio
ns2,
281.
8720
8.0
611
.87
2,47
8.0
61,
171.
9223
4.73
11.8
71,
394.
781,
083
.28
1,10
9.95
(b)
Fu
rnitu
re a
nd fi
xtur
es1,
974.
1129
0.5
142
.67
2,22
1.95
1,10
9.43
214.
00
40.7
91,
282.
6493
9.31
864.
68
(b)
Ve
hicl
es67
0.8
720
4.71
69.9
780
5.61
282.
7410
2.54
42.2
934
2.99
462.
6238
8.13
(b)
O
ffice
equ
ipm
ent
378.
2322
4.29
1.28
601.
2498
.29
140
.24
0.6
623
7.87
363.
3727
9.94
(b)
To
tal t
angi
ble
asse
ts83
,996
.08
11,3
56.3
734
4.5
995
,00
7.86
27,2
02.
854
,379
.87
255.
6531
,327
.07
63,6
80.7
956
,793
.23
B.
Inta
ngib
le a
sset
s:
C
ompu
ter
soft
war
e72
5.0
852
.39
-77
7.47
379.
6383
.45
-46
3.0
831
4.39
345.
45
(b)
TO
TAL
(A +
B)
84,7
21.1
611
,40
8.76
344
.59
95,7
85.3
327
,582
.48
4,4
63.3
225
5.65
31,7
90.1
563
,995
.18
57,1
38.6
8
(c)
* Le
aseh
old
land
is n
et o
f ` 5
.39
Mill
ion
(` 5
.39
Mill
ion)
sub
leas
ed t
o C
lass
ic I
ndus
trie
s an
d E
xpor
ts L
imite
d, a
Com
pany
in w
hich
dir
ecto
rs a
re in
tere
sted
sin
ce t
he y
ear
ende
d 20
09-
10.
** P
lant
and
equ
ipm
ent
incl
ude
join
tly
owne
d as
sets
with
gro
ss b
ook
valu
e of
` 3
11.2
8 M
illio
n (`
311
.28
Mill
ion)
and
net
boo
k va
lue
of `
225
.62
Mill
ion
(` 2
38.1
5 M
illio
n) w
hich
rep
rese
nts
50%
ow
ners
hip
in t
he a
sset
.# I
nclu
des
righ
t of
use
ass
ets
w.r.
t gu
est
hous
e, s
ales
offi
ce, w
areh
ouse
and
pla
nt &
equ
ipm
ent
take
n on
leas
e. (r
efer
not
e C
6)(a
) R
epre
sent
s pr
opor
tiona
te le
ase
prem
ium
` 2
.19
Mill
ion
(` 2
.15
Mill
ion)
am
ortis
ed.
(b)
Bui
ldin
gs in
clud
e `
28.0
3 M
illio
n (`
20
5.0
6 M
illio
n), p
lant
and
equ
ipm
ent
incl
ude
` 33
9.78
Mill
ion
(` 2
53.9
9 M
illio
n), e
lect
rica
l ins
tall
atio
ns in
clud
e `
4.5
5 M
illio
n (`
18.
95 M
illio
n), f
urni
ture
and
fixt
ures
incl
ude
` 1.
49 M
illio
n (`
0.0
7 M
illio
n), v
ehic
les
incl
ude
` 14
.53
Mill
ion
(` 1
.59
Mill
ion)
, offi
ce e
quip
men
t in
clud
e `
0.0
1 M
illio
n (N
il) a
nd c
ompu
ter
soft
war
e in
clud
e `
11.7
8 M
illio
n (`
3.1
4 M
illio
n) r
elat
ing
to r
esea
rch
and
deve
lopm
ent
(ref
er n
ote
C15
).(c
) In
clud
es d
irec
tly
attr
ibut
able
exp
ense
s ca
pita
lised
to
the
exte
nt o
f ` 7
42.
72 M
illio
n (`
241
.28
Mill
ion)
incl
udin
g `
185.
30 M
illio
n (N
il) c
apita
lised
from
CW
IP o
f pre
viou
s ye
ar a
nd b
orro
win
g co
st c
apita
lised
to
the
exte
nt o
f `
1,54
9.0
6 M
illio
n (`
519
.11
Mill
ion)
incl
udin
g `
272.
04
Mill
ion
(Nil)
cap
italis
ed fr
om C
WIP
of p
revi
ous
year
.(d
) B
uild
ings
incl
ude
build
ings
con
stru
cted
on
leas
ehol
d la
nd w
ith g
ross
boo
k va
lue
of `
12,
717.
47
Mill
ion
(` 1
1,55
0.0
6 M
illio
n) a
nd n
et b
ook
valu
e of
` 9
,480
.86
Mill
ion
(` 8
,70
9.35
Mill
ion)
.(e
) C
arry
ing
amou
nt o
f tan
gibl
e as
sets
are
ple
dged
as
secu
rity
for
liabi
litie
s (r
efer
not
e B
12 (a
)).
(f)
Cap
ital w
ork-
in-p
rogr
ess
incl
udes
land
of `
24
8.0
0 M
illio
n (`
245
.35
Mill
ion)
acq
uire
d by
the
Com
pany
and
is in
the
pro
cess
of g
ettin
g th
e tit
le d
eeds
tra
nsfe
rred
to
its n
ame.
195Annual Report 2019-20
Statutory ReportsCorporate Overview Financial Statements

196 Apollo Tyres Ltd.
FINANCIAL ASSETS (NON-CURRENT)
B2 INVESTMENTS` Million
ParticularsAs on
March 31, 2020As on
March 31, 2019
I At fair value through profit and loss
A Quoted investments *
Investment in equity instruments:
Other companies:16,394 (16,394) equity shares of ` 10/- each in Bharat Gears Limited - fully paid up 0.42 2.79
B Unquoted investments **
Investment in equity instruments:
Other companies:312,000 (312,000) equity shares of ` 10 each in Green
Infra Wind Power Projects Limited - fully paid up 3.12 3.12
Nil (239,000) equity shares of ` 0.19 each in
Bhadreshwar Vidyut Private Limited - fully paid up - 0.05
Nil (399,100) equity shares of ` 10 each in NSL
Wind Power Company (Phoolwadi) Private Limited - fully paid up - 3.99
2,256,000 (6,000) equity shares of ` 30 each in Suryadev
Alloys and Power Private Limited - fully paid up 67.68 0.18
220,300 (292,000) equity shares of ` 11.50 each in
OPG Power Generation Private Limited - fully paid up 2.53 3.36
5,000 (5,000) equity shares of ` 100/- each in Apollo
Tyres Employees' Multipurpose Co-operative Society Limited - fully paid up 0.50 0.50
73.83 11.20
Investments carried at fair value through profit and loss 74.25 13.99
II At cost
Unquoted investments **
(a) Investment in equity instruments:
Subsidiary companies:50,001 (50,001) equity shares of EUR 0.72 each in Apollo
Tyres (Green Field) B. V. - fully paid up 2.74 2.74
Associate company:3,334 (3,334) equity shares of ` 10 each in KT
Telematic Solutions Private Limited - fully paid up 45.01 45.01
(b) Investment in membership interest:
Apollo Tyres Co-operatief U.A. - wholly owned subsidiary 23,973.19 22,263.99
Investments carried at cost 24,020.94 22,311.74
24,095.19 22,325.73
* Aggregate amount of quoted investments at cost 0.36 0.36
Aggregate amount of quoted investments at market value 0.42 2.79
**Aggregate amount of unquoted investments at cost 24,094.77 22,322.94

197Annual Report 2019-20
Statutory ReportsCorporate Overview Financial Statements
B3 OTHER FINANCIAL ASSETS` Million
ParticularsAs on
March 31, 2020As on
March 31, 2019
(Unsecured, considered good unless otherwise stated)
Employee advances - salary loan 25.17 14.03
Security deposits 200.42 175.87
Security deposits to related parties (refer note C 21) 253.33 230.81
Security deposits with statutory authorities 346.87 267.28
Derivative assets measured at fair value (refer note C 11) 1,500.33 522.58
2,326.12 1,210.57
B4 NON-FINANCIAL ASSETS (NON-CURRENT)` Million
ParticularsAs on
March 31, 2020As on
March 31, 2019
(Unsecured, considered good unless otherwise stated)
Capital advances 2,981.79 6,008.45
Capital advances to related parties (refer note C 21) 666.12 956.30
3,647.91 6,964.75
Statutory balances recoverable 2.58 2.58
Others - 337.17
3,650.49 7,304.50
CURRENT ASSETS
B5 INVENTORIES` Million
ParticularsAs on
March 31, 2020As on
March 31, 2019
(valued at lower of cost and net realizable value)
(i) Raw materials
- In hand 5,610.22 7,404.73
- In transit 825.97 491.38
6,436.19 7,896.11
(ii) Work-in-progress * 1,252.70 1,415.13
(iii) Finished goods
- In hand 7,986.38 8,267.55
- In transit 52.01 594.75
8,038.39 8,862.30
(iv) Stock-in-trade
- In hand 1,094.69 1,172.51
- In transit 2.41 66.53
1,097.10 1,239.04
(v) Stores and spares 1,258.13 1,102.21
18,082.51 20,514.79
* Work-in-progress consists of only automotive tyres.

198 Apollo Tyres Ltd.
FINANCIAL ASSETS (CURRENT)B6 TRADE RECEIVABLES
` Million
ParticularsAs on
March 31, 2020As on
March 31, 2019
(Unsecured)
Outstanding for a period exceeding six months from the date they were due for payment:
Considered good 1.41 1.91
Considered doubtful 24.40 24.40
Others - Considered Good * 4,449.42 7,793.04
4,475.23 7,819.35
Provision for doubtful trade receivables (24.40) (24.40)
4,450.83 7,794.95
* Includes balances with related parties (refer note C21)
B7 CASH AND CASH EQUIVALENTS` Million
ParticularsAs on
March 31, 2020As on
March 31, 2019
(i) Balances with banks:
Current accounts 1,376.43 425.14
Other deposit accounts
- original maturity of 3 months or less 600.00 462.41
(ii) Cheques on hand / remittances in transit 277.51 1,214.77
(iii) Cash on hand 2.32 1.48
2,256.26 2,103.80
B8 BANK BALANCES OTHER THAN CASH AND CASH EQUIVALENTS` Million
ParticularsAs on
March 31, 2020As on
March 31, 2019
Unpaid dividend accounts * 109.57 71.84
Deposits with maturity exceeding 3 months but less than 12 months 0.01 0.01
109.58 71.85
* These balances are not available for use by the Company and corresponding balance is disclosed as unclaimed dividend in note B 18.
B9 OTHER FINANCIAL ASSETS` Million
ParticularsAs on
March 31, 2020As on
March 31, 2019
Employee advances 46.32 33.34
Derivative assets measured at fair value (refer note C 11) 53.25 124.81
Interest accrued on deposits / loans - 124.88
Others - 0.35
99.57 283.38

199Annual Report 2019-20
Statutory ReportsCorporate Overview Financial Statements
NON-FINANCIAL ASSETS (CURRENT)
B10 OTHER CURRENT ASSETS` Million
ParticularsAs on
March 31, 2020As on
March 31, 2019
(Unsecured, considered good unless otherwise stated)
a. Advances given to related parties (refer note C 21) 493.82 439.90
b. Trade advances- considered good 508.14 542.26
Doubtful advances 20.56 20.56
Provision for doubtful advances (20.56) (20.56)
c. Employee advances 48.89 34.74
d. Investment promotion subsidy receivable 647.79 560.64
e. Export obligations - advance licence benefit 252.06 259.18
f. Export incentives recoverable 455.59 454.22
g. Balance with statutory authorities 1,241.36 1,860.73
h. Gratuity (refer note C 10) 199.27 44.36
i. Prepaid expenses 329.79 139.59
4,176.71 4,335.62
B11 EQUITY SHARE CAPITAL` Million
ParticularsAs on
March 31, 2020As on
March 31, 2019
(a) Authorised
750,000,000 Nos. (730,000,000 Nos.) equity shares of ` 1 each 750.00 730.00
150,000,000 Nos. (200,000 Nos.) cumulative redeemable preference shares of ` 100 each 15,000.00 20.00
15,750.00 750.00
(b) Issued, subscribed, called and fully paid up
Equity shares of ` 1 each:
572,049,980 Nos. (572,049,980 Nos.) equity shares 572.05 572.05
572.05 572.05
(c) Reconciliation of the number of equity shares and amount outstanding at the beginning and at the end of the year
Particulars
As on March 31, 2020 As on March 31, 2019
Number of sharesAmount in
` MillionNumber of shares
Amount in ` Million
Opening / Closing balance 572,049,980 572.05 572,049,980 572.05
(d) Details of shareholders holding more than 5% of the paid up equity share capital of the Company with voting rights *
Name of the ShareholderAs on March 31, 2020 As on March 31, 2019
Number of shares % age Number of shares % age
Neeraj Consultants Limited 73,827,161 12.91% 73,827,161 12.91%
White IRIS Investment Ltd. 51,054,445 8.92% - -
HDFC Trustee Company Ltd. - A/C its various Fund 41,273,025 7.21% 33,145,291 5.79%
Apollo Finance Limited 39,778,872 6.95% 39,381,872 6.88%
Sunrays Properties and Investment Company Private Limited 36,307,648 6.35% 36,307,648 6.35%
*As per the records of the Company including its register of member.

200 Apollo Tyres Ltd.
(e) The rights, preferences and restrictions attached to equity shares of the Company The Company has only one class of issued shares referred to as equity shares having a par value of ` 1 each. The holder of equity
shares are entitled to one vote per share.
(f) In the event of liquidation of the Company, the holders of equity shares will be entitled to receive remaining assets of the Company, after distribution of all preferential amounts. The distribution will be in proportion to the number of equity shares held by the shareholders.
(g) Over the period of five years immediately preceding March 31, 2020 and March 31, 2019, neither any bonus shares were issued nor any shares were allotted for consideration other than cash. Further, no shares were bought back during the said period.
NON - CURRENT LIABILITIES
B12 BORROWINGS` Million
ParticularsAs on
March 31, 2020As on
March 31, 2019
Measured at amortised cost
Secured *
(i) Debentures 10,742.62 10,740.25
(ii) Term loans
From banks:
External commercial borrowings (ECB) 10,913.99 9,967.35
Foreign currency non-resident term loan 1,143.80 1,693.68
Rupee term loan 9,246.85 1,995.58
(iii) Deferred payment liabilities
Deferred payment credit I 35.98 40.44
Deferred payment credit II - 35.98 1.25 41.69
Total borrowings 32,083.24 24,438.55
* For details regarding repayment terms, interest rate and nature of security on non current borrowings (Note B12 (a))

201Annual Report 2019-20
Statutory ReportsCorporate Overview Financial Statements
B12
(A) B
OR
RO
WIN
GS
` M
illio
n
Am
ount
out
stan
ding
as
on
Mar
ch 3
1, 2
020
A
mou
nt o
utst
andi
ng
as o
n M
arch
31,
20
19
Rat
e of
inte
rest
per
an
num
Term
s of
rep
aym
ent
Det
ails
of s
ecur
ity
offe
red
Non
cur
rent
bo
rrow
ings
Cur
rent
m
atur
itie
s of
no
n cu
rren
t bo
rrow
ings
Non
cur
rent
bo
rrow
ings
Cur
rent
m
atur
itie
s of
no
n cu
rren
t bo
rrow
ings
Non
-con
vert
ible
deb
entu
res
1,15
0 -
8.65
% N
on-c
onve
rtib
le d
eben
ture
s of
` 1
Mill
ion
each
1,15
0.0
0-
1,15
0.0
0-
8.65
%B
ulle
t pa
ymen
t on
Apr
il 30
, 202
6R
efer
not
e be
low
1,05
0 -
8.65
% N
on-c
onve
rtib
le d
eben
ture
s of
` 1
Mill
ion
each
1,0
50.0
0-
1,0
50.0
0-
8.65
%B
ulle
t pa
ymen
t on
Apr
il 30
, 202
5R
efer
not
e be
low
1,05
0 -
8.65
% N
on-c
onve
rtib
le d
eben
ture
s of
` 1
Mill
ion
each
1,0
50.0
0-
1,0
50.0
0-
8.65
%B
ulle
t pa
ymen
t on
Apr
il 30
, 202
4R
efer
not
e be
low
1,50
0 -
7.80
% N
on-c
onve
rtib
le d
eben
ture
s of
` 1
Mill
ion
each
1,49
7.54
-1,
496.
75-
7.80
%B
ulle
t pa
ymen
t on
Apr
il 30
, 202
4R
efer
not
e be
low
900
- 7.
50 %
Non
-con
vert
ible
deb
entu
res
of `
1 M
illio
n ea
ch90
0.0
0-
900
.00
-7.
50%
Bul
let
paym
ent
on O
ctob
er 2
0, 2
023
Ref
er n
ote
belo
w
1,50
0 -
7.80
% N
on-c
onve
rtib
le d
eben
ture
s of
` 1
Mill
ion
each
1,49
7.54
-1,
496.
75-
7.80
%B
ulle
t pa
ymen
t on
Apr
il 28
, 202
3R
efer
not
e be
low
1,05
0 -
7.50
% N
on-c
onve
rtib
le d
eben
ture
s of
` 1
Mill
ion
each
1,0
50.0
0-
1,0
50.0
0-
7.50
%B
ulle
t pa
ymen
t on
Oct
ober
21,
202
2R
efer
not
e be
low
1,50
0 -
7.80
% N
on-c
onve
rtib
le d
eben
ture
s of
` 1
Mill
ion
each
1,49
7.54
-1,
496.
75-
7.80
%B
ulle
t pa
ymen
t on
Apr
il 29
, 202
2R
efer
not
e be
low
1,05
0 -
7.50
% N
on-c
onve
rtib
le d
eben
ture
s of
` 1
Mill
ion
each
1,0
50.0
0-
1,0
50.0
0-
7.50
%B
ulle
t pa
ymen
t on
Oct
ober
21,
202
1R
efer
not
e be
low
Tota
l10
,74
2.62
-10
,74
0.2
5-
Ext
erna
l com
mer
cial
bor
row
ings
(EC
B) f
rom
ban
ks
Ban
k 1
- EC
B I
1,8
80.2
7 -
1
,717
.08
-
0-1%
abo
ve
US
D-L
IBO
R3
Equa
l ann
ual i
nsta
lmen
ts s
tart
ing
from
FY
202
2-23
Ref
er n
ote
belo
w
Ban
k 2
- EC
B I
1,8
79.9
7 -
1
,716
.74
-
0.25
-1.2
5% a
bove
U
SD
-LIB
OR
3 Eq
ual a
nnua
l ins
talm
ents
sta
rtin
g fr
om F
Y 2
022-
23R
efer
not
e be
low
Ban
k 3
- EC
B I
1,8
80.9
1 -
1
,717
.95
-
0-1%
abo
ve
US
D-L
IBO
R3
Equa
l ann
ual i
nsta
lmen
ts s
tart
ing
from
FY
202
2-23
Ref
er n
ote
belo
w
Ban
k 4
- EC
B I
1,5
03.
55
-
1,3
72.8
5 -
0.
25-1
.25%
abo
ve
US
D-L
IBO
R3
Equa
l ann
ual i
nsta
lmen
ts s
tart
ing
from
FY
202
2-23
Ref
er n
ote
belo
w
Ban
k 5
- EC
B I
3,7
69.2
9 -
3
,442
.73
-
0-1%
abo
ve
US
D-L
IBO
RB
ulle
t pa
ymen
t on
Mar
ch 2
1, 2
022
Ref
er n
ote
belo
w
Tota
l 1
0,9
13.9
9 -
9
,967
.35
-
Fore
ign
curr
ency
non
-res
iden
t (F
CN
R) t
erm
loan
Ban
k 1
- FC
NR
I 2
79.9
3 1
86.6
2 5
12.3
0
-
0-1%
abo
ve
US
D-L
IBO
RR
epay
men
t in
6 e
qual
sem
i-ann
ual
inst
alm
ents
sta
rtin
g fr
om D
ecem
ber
31, 2
019
Ref
er n
ote
belo
w
Ban
k 1
- FC
NR
II
281
.59
187
.73
515
.35
-
0-1%
abo
ve
US
D-L
IBO
RR
epay
men
t in
6 e
qual
sem
i-ann
ual
inst
alm
ents
sta
rtin
g fr
om J
anua
ry
15, 2
020
Ref
er n
ote
belo
w
Ban
k 1
- FC
NR
III
582
.28
291
.14
666
.03
133
.20
0-
1% a
bove
U
SD
-LIB
OR
Rep
aym
ent
in 6
equ
al s
emi-a
nnua
l in
stal
men
ts s
tart
ing
from
Sep
tem
ber
30, 2
020
Ref
er n
ote
belo
w
Tota
l 1
,14
3.80
6
65.4
9 1
,693
.68
133
.20

202 Apollo Tyres Ltd.
` M
illio
n
Am
ount
out
stan
ding
as
on
Mar
ch 3
1, 2
020
A
mou
nt o
utst
andi
ng
as o
n M
arch
31,
20
19
Rat
e of
inte
rest
per
an
num
Term
s of
rep
aym
ent
Det
ails
of s
ecur
ity
offe
red
Non
cur
rent
bo
rrow
ings
Cur
rent
m
atur
itie
s of
no
n cu
rren
t bo
rrow
ings
Non
cur
rent
bo
rrow
ings
Cur
rent
m
atur
itie
s of
no
n cu
rren
t bo
rrow
ings
Rup
ee te
rm lo
ans
Ban
k 1
- R
upee
Ter
m L
oan
2,96
4.92
-1,
495.
58-
0-1%
abo
ve O
ne
year
MC
LR28
str
uctu
red
quar
terl
y in
stal
men
ts
afte
r m
orat
oriu
m o
f 3 y
ears
from
the
da
te o
f firs
t di
sbur
sem
ent
Ref
er n
ote
belo
w
Ban
k 2
- R
upee
Ter
m L
oan
2,46
9.86
--
-0-
1% a
bove
One
ye
ar M
CLR
28 s
truc
ture
d qu
arte
rly
inst
alm
ents
af
ter
mor
ator
ium
of 3
yea
rs fr
om t
he
date
of fi
rst
disb
urse
men
t
Ref
er n
ote
belo
w
Ban
k 3
- R
upee
Ter
m L
oan
1,96
8.75
--
-0-
1% a
bove
One
ye
ar M
CLR
28 s
truc
ture
d qu
arte
rly
inst
alm
ents
af
ter
mor
ator
ium
of 3
yea
rs fr
om t
he
date
of fi
rst
disb
urse
men
t
Ref
er n
ote
belo
w
Ban
k 4
- R
upee
Ter
m L
oan
996.
60-
--
6 m
onth
s M
CLR
32 s
truc
ture
d qu
arte
rly
inst
alm
ents
af
ter
mor
ator
ium
of 2
yea
rs fr
om t
he
date
of fi
rst
disb
urse
men
t
Ref
er n
ote
belo
w
Ban
k 5
- R
upee
Ter
m L
oan
146.
72-
--
0-2%
abo
ve o
ne
year
T-b
illB
ulle
t pa
ymen
t on
Jun
e 27
, 202
2R
efer
not
e be
low
Ban
k 6
- R
upee
Ter
m L
oan
200
.00
--
-0-
2% a
bove
one
ye
ar T
-bill
Bul
let
paym
ent
on M
arch
27,
202
3R
efer
not
e be
low
Ban
k 7
- R
upee
Ter
m L
oan
500
.00
-50
0.0
0-
0-2%
abo
ve o
ne
year
T-b
illB
ulle
t pa
ymen
t on
Mar
ch 2
9, 2
022
Ref
er n
ote
belo
w
Tota
l9,
246.
85-
1,99
5.58
-
Non
-con
vert
ible
deb
entu
res
Def
erre
d pa
ymen
t cr
edit
I 3
5.98
4
.46
40
.44
4.1
3 7-
8%R
epay
men
t al
ong
with
inte
rest
in 2
40
cons
ecut
ive
mon
thly
inst
alm
ents
st
arte
d fr
om M
ay 1
5, 2
007
Win
d M
ills
purc
hase
d un
der
the
defe
rred
con
side
ratio
n pa
ymen
t pl
an
Def
erre
d pa
ymen
t cr
edit
II -
1
.47
1.2
5 1
.83
8-9%
Rep
aym
ent
alon
g w
ith I
nter
est
in 2
0 eq
ual q
uart
erly
inst
alm
ents
sta
rted
fr
om J
anua
ry 3
1, 2
011
Eng
inee
ring
mat
eria
ls
purc
hase
d un
der
the
Par
ts
Man
agem
ent
Agr
eem
ent
(PM
A) s
chem
e
Tota
l 3
5.98
5
.93
41.
69
5.9
6
Det
ails
of s
ecur
itie
s of
fere
d to
exi
stin
g le
nder
s
Not
e: A
par
i pas
su fi
rst
char
ge b
y w
ay o
f hyp
othe
cati
on o
ver
the
mov
able
fixe
d as
sets
(inc
ludi
ng p
lant
and
equ
ipm
ent)
of t
he C
ompa
ny, b
oth
pres
ent
and
futu
re.

203Annual Report 2019-20
Statutory ReportsCorporate Overview Financial Statements
B 13 OTHER FINANCIAL LIABILITIES` Million
ParticularsAs on
March 31, 2020As on
March 31, 2019
Derivative liabilities measured at fair value (refer note C 11) 26.59 15.34
Lease liability (refer note C 6) 5,292.86 -
5,319.45 15.34
B14 PROVISIONS` Million
ParticularsAs on
March 31, 2020As on
March 31, 2019
Provision for constructive liability (refer note C 7) 184.29 169.29
Provision for sales related obligations (refer note C 7) 319.03 329.53
503.32 498.82
B15 OTHER NON CURRENT LIABILITIES` Million
ParticularsAs on
March 31, 2020As on
March 31, 2019
Provision for constructive liability (refer note C 7) 184.29 169.29
Provision for sales related obligations (refer note C 7) 319.03 329.53
503.32 498.82
CURRENT LIABILITIES
B16 BORROWINGS *` Million
ParticularsAs on
March 31, 2020As on
March 31, 2019
At amortised cost
Secured **
From banks - cash credit 0.69 123.17
- Working capital demand loan 2,330.00 900.00
Unsecured
From banks - packing credit - 1,901.90
- Working capital demand loan 8,850.00 -
11,180.69 2,925.07
* Cash credits and working capital demand loans are repayable on demand. The interest rate on these loans are in the range of 6.00 % p.a. to 9.00 % p.a. (1.29% p.a. to 11.00 % p.a.)
** Secured by a first charge on raw materials, work-in-progress, stocks, stores and book debts and by a second charge on the Company’s land at village Kodakara in Kerala, at Oragadam and Mathur village in Tamil Nadu and at head office in Gurgaon, Haryana together with the factory buildings, plant and machinery and equipment, both present and future.
B17 TRADE PAYABLES*` Million
ParticularsAs on
March 31, 2020As on
March 31, 2019
Trade payables (other than micro and small enterprises) 10,098.26 7,826.06
Employee related payable 1,173.51 1,139.42
Payable to related parties (refer note C 21) 4,664.60 4,592.57
15,936.37 13,558.05
* Incude commission on net profit payable to Key managerial personnel (KMP) ` 257.26 Million (` 552.10 Million).
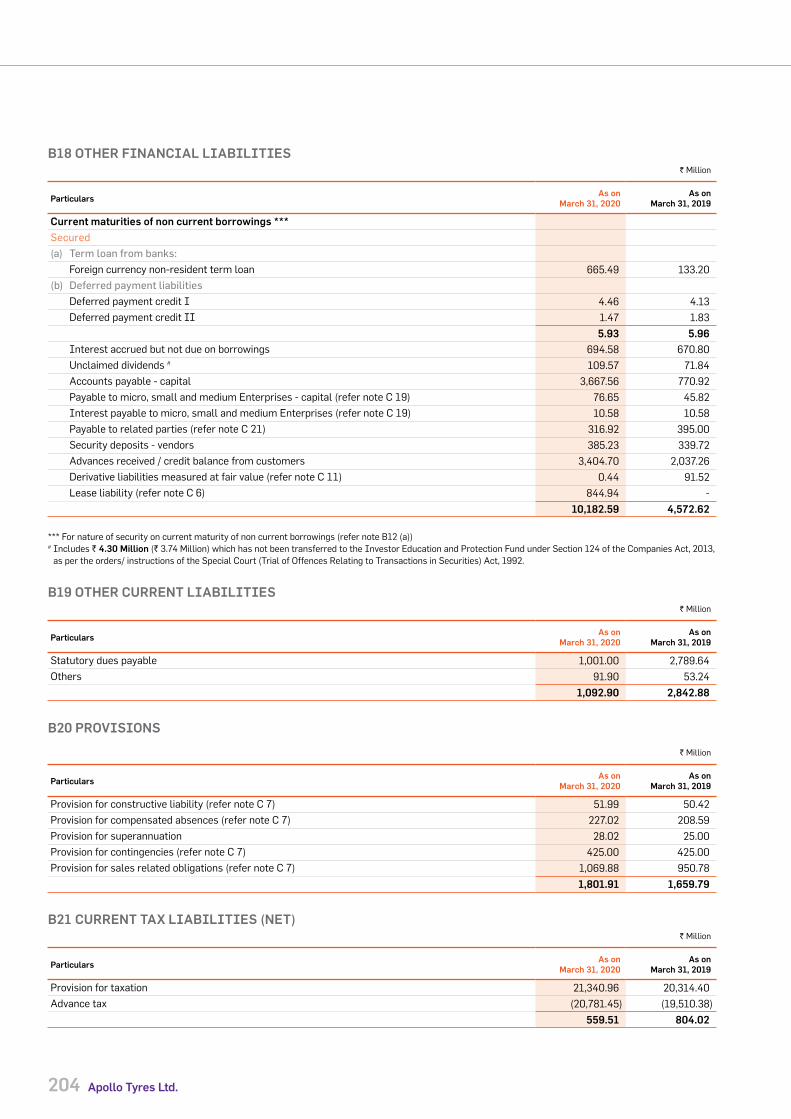
204 Apollo Tyres Ltd.
B18 OTHER FINANCIAL LIABILITIES` Million
ParticularsAs on
March 31, 2020As on
March 31, 2019
Current maturities of non current borrowings ***
Secured
(a) Term loan from banks:
Foreign currency non-resident term loan 665.49 133.20
(b) Deferred payment liabilities
Deferred payment credit I 4.46 4.13
Deferred payment credit II 1.47 1.83
5.93 5.96
Interest accrued but not due on borrowings 694.58 670.80
Unclaimed dividends # 109.57 71.84
Accounts payable - capital 3,667.56 770.92
Payable to micro, small and medium Enterprises - capital (refer note C 19) 76.65 45.82
Interest payable to micro, small and medium Enterprises (refer note C 19) 10.58 10.58
Payable to related parties (refer note C 21) 316.92 395.00
Security deposits - vendors 385.23 339.72
Advances received / credit balance from customers 3,404.70 2,037.26
Derivative liabilities measured at fair value (refer note C 11) 0.44 91.52
Lease liability (refer note C 6) 844.94 -
10,182.59 4,572.62
*** For nature of security on current maturity of non current borrowings (refer note B12 (a))# Includes ` 4.30 Million (` 3.74 Million) which has not been transferred to the Investor Education and Protection Fund under Section 124 of the Companies Act, 2013,
as per the orders/ instructions of the Special Court (Trial of Offences Relating to Transactions in Securities) Act, 1992.
B19 OTHER CURRENT LIABILITIES` Million
ParticularsAs on
March 31, 2020As on
March 31, 2019
Statutory dues payable 1,001.00 2,789.64
Others 91.90 53.24
1,092.90 2,842.88
B20 PROVISIONS
` Million
ParticularsAs on
March 31, 2020As on
March 31, 2019
Provision for constructive liability (refer note C 7) 51.99 50.42
Provision for compensated absences (refer note C 7) 227.02 208.59
Provision for superannuation 28.02 25.00
Provision for contingencies (refer note C 7) 425.00 425.00
Provision for sales related obligations (refer note C 7) 1,069.88 950.78
1,801.91 1,659.79
B21 CURRENT TAX LIABILITIES (NET)` Million
ParticularsAs on
March 31, 2020As on
March 31, 2019
Provision for taxation 21,340.96 20,314.40
Advance tax (20,781.45) (19,510.38)
559.51 804.02

205Annual Report 2019-20
Statutory ReportsCorporate Overview Financial Statements
B22 OTHER OPERATING INCOME` Million
ParticularsAs on
March 31, 2020As on
March 31, 2019
Investment promotion subsidy (refer note C 9(a)) 87.15 235.93
Unwinding of deferred income (refer note C 9(b)) 1,735.41 1,438.44
Sale of raw material scrap 396.67 532.23
Provisions/ liabilities no longer required written back - 367.13
Others 74.08 68.09
2,293.31 2,641.82
B23 OTHER INCOME` Million
ParticularsAs on
March 31, 2020As on
March 31, 2019
(a) Interest earned on deposits
- Bank 1.87 22.16
- Inter corporate deposit - 173.41
- Others 36.14 38.01 154.32 349.89
(b) Dividend income from current investments - Fair value through profit and loss
Mutual funds - 50.83
(c) Others
Profit on sale of property, plant and equipment (net) 0.32 8.30
Gain on foreign currency transactions and translations (net) 112.41 589.78
Gain on fair value change in investments - 0.04
Miscellaneous 198.24 310.97 115.86 713.98
348.98 1,114.70
B24 MANUFACTURING AND OTHER EXPENSES` Million
ParticularsYear ended
March 31, 2020Year ended
March 31, 2019
Cost of materials consumed *
Opening stock 7,404.73 6,424.57
Add: Purchases 58,934.99 76,818.58
Less: Closing stock 5,610.22 7,404.73
60,729.50 75,838.42
Purchase of stock-in-trade:
Purchase of finished goods - tyres, tubes and flaps 6,517.26 7,355.28
Employee benefits expense: *
Salaries and wages 6,819.60 5,929.25
Contribution to provident and other funds (refer note C 10) 411.88 476.61
Staff welfare 1,029.69 966.56
8,261.17 7,372.42
Other expenses: *
Consumption of stores and spare parts 900.98 999.43
Power and fuel 3,469.33 4,041.37
Conversion charges 632.55 808.25
Repairs and maintenance
- Machinery 259.54 204.14
- Buildings 8.85 42.37
- Others 1,609.00 1,372.87
Rent (refer note C 6) 22.69 633.01
Lease rent - factory - 633.29
Insurance 292.06 119.94

206 Apollo Tyres Ltd.
` Million
ParticularsYear ended
March 31, 2020Year ended
March 31, 2019
Rates and taxes 64.51 67.08
Sitting fees to non-executive directors (refer note C 21) 8.05 10.25
Commission to non-executive directors (refer note C 21) 40.00 60.00
Travelling, conveyance and vehicle 1,553.87 1,253.97
Postage, telephone and stationery 98.31 105.82
Conference 173.26 108.48
Royalty (refer note C 21) 47.83 53.36
Freight and forwarding 3,923.68 4,101.72
Commission on sales 130.08 199.41
Sales promotion 537.17 824.77
Advertisement and publicity 2,513.84 1,955.52
Corporate social responsibility (refer note C 20) 183.70 213.83
Bank charges 37.51 36.74
Statutory auditors' remuneration (refer note C 14) 13.00 12.05
Legal and professional 1,074.13 940.88
Miscellaneous# 2461.25 1,996.55
20,055.19 20,795.10
95,563.12 111,361.22
* Includes expense towards research and development.# Includes donation to electoral trust ` 300 Million (Nil)
B25 CHANGES IN INVENTORIES OF FINISHED GOODS, STOCK-IN-TRADE AND WORK-IN-PROGRESS` Million
ParticularsYear ended
March 31, 2020Year ended
March 31, 2019
OPENING STOCK
Work in progress 1,415.13 1,069.24
Finished goods 8,862.30 7,628.25
Stock-in-trade 1,239.04 204.32
11,516.47 8,901.81
Less:
CLOSING STOCK
Work in progress 1,252.70 1,415.13
Finished goods 8,038.39 8,862.30
Stock-in-trade 1,097.10 1,239.04
10,388.19 11,516.47
1,128.28 (2,614.66)
B 26 FINANCE COSTS` Million
ParticularsYear ended
March 31, 2020Year ended
March 31, 2019
(a) Interest expense:
Interest on fixed-term loans 159.91 145.70
Interest on debentures 575.22 516.59
Interest on current loans 430.04 171.87
Others * 1,048.13 525.87
(b) Other borrowing costs 43.66 18.52
2,256.96 1,378.55
* Includes interest expense pertaining to leasing arrangements during the current year amounting to ` 499.75 Million

207Annual Report 2019-20
Statutory ReportsCorporate Overview Financial Statements
1 DIRECTLY ATTRIBUTABLE EXPENSES CAPITALIZED / INCLUDED IN CAPITAL WORK IN PROGRESS
` Million
Particulars 2019-20 2018-19
Raw material consumed 22.95 98.07 Salaries, wages and bonus 352.22 228.87 Welfare expenses 22.61 18.11 Rent 11.18 0.66 Travelling, conveyance and vehicle expenses 36.22 12.10 Postage, telephone and stationery 6.66 2.02 Power and fuel 22.77 19.44 Insurance 7.37 10.85 Legal and professional 64.80 7.67 Miscellaneous. 26.02 28.80 Total 572.80 426.59
2 Borrowing costs capitalized / transferred to capital work in progress during the year is ` 1,349.26 Million (` 791.15 Million) and the capitalisation rate used to determine the amount of borrowing costs to be capitalised is the weighted average interest rate applicable to the Company’s general borrowings during the year, in this case 7.38% p.a. (7.20% p.a.).
3 INVENTORIES
i. Out of the total inventories ` 18,082.51 Million (` 20,514.79 Million), the carrying amount of inventories carried at fair value less costs to sell amounted to ` 140.06 Million (`197.27 Million).
ii. The amount of write-down of inventories to net realizable value recognized as an expense was ` 124.72 Million (` 92.75 Million).
iii. The cost of inventories recognised as an expense during the year in respect of continuing operations was ` 69,276.02 Million (` 81,578.47 Million).
4 DESCRIPTION OF NATURE AND PURPOSE OF EACH RESERVE
i. Securities premium reserve Securities premium reserve is used to record the premium
on issue of shares. The reserve will be utilised in accordance with provisions of the Act.
ii. General reserve General reserve is created from time to time by way of
transfer of profits from retained earnings for appropriation purpose. General reserve is created by transfer from one component of equity to another and is not an item of other comprehensive income.
iii. Capital reserve on Apollo (Mauritius) Holdings Private Limited (“AMHPL”) merger
AMHPL erstwhile (subsidiary company) was merged with the Company resulting in a capital reserve.
iv. Debenture redemption reserve The Company is required to create a debenture redemption
reserve out of the profits which are available for redemption of debentures.
v. Capital subsidy This balance represents subsidy received under New
Industrial Policy 2007 of the Government of Tamil Nadu for expansion and employment generation within SIPCOT Industrial park.
vi. Capital redemption reserve This balance has been created in accordance with provision of
the Act for the buy back of equity shares from the market.
vii. Capital reserve on forfeiture of shares This reserve was created on forfeiture of shares by the
Company. The reserve is not available for the distribution to the shareholders.
viii. Retained earnings Retained earnings are created from the profit of the Company,
as adjusted for distribution to owners, transfer to other reserve, remeasurement of defined benefit plan, etc.
5 The Board of Directors have recommended a final dividend of Nil (` 3.25) per share amounting to Nil (` 1,859.16 Million) on Equity Shares of ` 1/- each for the year, subject to approval from Shareholders. Dividend distribution tax on such dividend amounts to Nil (` 382.16 Million).
6 LEASESi Nature of leasing activities The Company has entered into lease arrangements for
various warehouses, plant and equipments, and offices that are renewable on a periodic basis with approval of both lessor and lessee.
ii The Company does not have any lease commitments towards variable rent as per the contract.
iii Each lease generally imposes a restriction that, unless there is a contractual right for the Company to sublet the asset to another party, the right-of-use asset can only be used by the Company. Leases are either non-cancellable or may only be cancelled by incurring a substantive termination fee. The Company is prohibited from selling or pledging the underlying leased assets as security. For leases over office buildings and factory premises the Company must keep those properties in a good state of repair and return the properties in their original condition at the end of the lease.
C. OTHER NOTESforming Part of the Financial Statements

208 Apollo Tyres Ltd.
iv Lease liabilities are presented in the statement of financial position as follows:` Million
ParticularsAs on
March 31, 2020
Non current 5,292.86
Current 844.94
Total 6,137.80
v Future minimum lease payments as on March 31, 2020 are as follows:` Million
ParticularsAs on March 31, 2020
Lease payments Finance charges Net present values
Minimum lease payments due
Within 1 year 1,289.84 (444.89) 844.95
1-2 years 1,102.25 (384.14) 718.11
2-3years 966.22 (330.74) 635.48
3-4 years 854.93 (283.48) 571.45
4-5 years 759.00 (240.06) 518.94
After 5 years 3,416.61 (567.74) 2,848.87
Total 8,388.85 (2,251.05) 6,137.80
vi Lease payments not recognised as a liability The expense relating to payments not included in the measurement of the lease liability is as follows:
` Million
ParticularsAs on
March 31, 2020
Short term leases 22.69
Leases of low value assets -
Variable lease payments -
Total 22.69
vii. Reconciliation of total lease commitments as on March 31, 2019 to the lease liabilities recognised at April 01, 2019:` Million
Particulars Amount
Total operating lease commitments disclosed as on March 31, 2019 6,763.79
Recognition exemptions:
- Leases with remaining lease term of less than 12 months 0.33
Operating lease liabilities before discounting 6,763.46
Discounted using incremental borrowing rate 2,594.77
Operating lease liabilities 4,168.69
Reasonably certain extension options/ other adjustments 2,304.35
Total lease liabilities recognised under Ind AS 116 at April 01, 2019 6,473.04
viii. Additional information on the right-of-use assets by class of assets is as follows:` Million
ParticularsCarrying amount
(Net block)Depreciation
expense
As on March 31, 2020Building 6,094.23 1,093.32 Plant & equipment 115.50 39.92 Total right-of-use assets 6,209.73 1,133.24
ix Total Cash outflow pertaining to leases during the year ended March 31, 2020 is ` 1,358.86 Million.
x As on March 31, 2020 Company has committed short term leases and total commitment at that date is ` 7.79 Million.

209Annual Report 2019-20
Statutory ReportsCorporate Overview Financial Statements
7 PROVISIONS - NON CURRENT / CURRENT
` Million
Particulars
Non current Current
Provision for sales related
obligation *
Provision for constructive
liability**
Provision for compensated
absences
Provision for sales related
obligation *
Provision for constructive
liability**
Provision for contingencies
As on March 31, 2018 304.03 146.70 197.32 1,602.79 38.55 790.00
Addition during the year 25.50 22.59 208.59 - 11.87 -
Utilisation/ reversal during the year - - 197.32 652.01 - 365.00
As on March 31, 2019 329.53 169.29 208.59 950.78 50.42 425.00
Addition during the year - 15.00 227.02 119.10 1.57 -
Utilisation/ reversal during the year 10.50 - 208.59 - - -
As on March 31, 2020 319.03 184.29 227.02 1,069.88 51.99 425.00
* Represents estimates for payments to be made in future for sales related obligations (including warranties). ** Includes post-employment benefit obligation for the employees of related party engaged at its Kalamassery plant taken on lease.
8 INCOME TAXES
i. Reconciliation between average effective tax rate and applicable tax rate` Million
Particulars2019-20 2018-19
` Million Rate (%) ` Million Rate (%)
Profit before tax 5,813.85 8,063.92
Income tax using the Company's domestic tax rate 2,031.36 34.94% 2,817.53 34.94%
Tax effect of:
Non deductible expenses 228.52 3.93% 132.66 1.65%
Tax exempt income (608.06) -10.46% (515.93) -6.40%
Tax incentives and concessions (924.21) -15.90% (182.87) -2.27%
Others - 0.00% (108.56) -1.35%
Income tax expenses recognised in the statement of profit and loss
727.61 12.52% 2,142.83 26.57%
ii. Components of deferred tax liability (net)` Million
Particulars
As on March 31, 2020 As on March 31, 2019
Opening Balance
Recognised in statement of Profit and
Loss
Recognised in other
comprehensive income
Closing Balance
Opening Balance
Recognised in statement of Profit and
Loss
Recognised in other
comprehensive income
Closing Balance
Tax effect of items constituting deferred tax liabilities
Employee benefits 26.62 - - 26.62 16.86 - 9.76 26.62
Depreciation and amortisation 8,188.16 1,893.71 - 10,081.87 7,074.62 1,113.54 - 8,188.16
Others 514.28 162.20 - 676.48 264.39 249.89 - 514.28
Gross deferred tax liabilities (a) 8,729.06 2,055.91 - 10,784.97 7,355.87 1,363.43 9.76 8,729.06
Tax effect of items constituting deferred tax assets
Employee benefits 203.72 8.65 85.75 298.12 187.76 15.96 - 203.72
Provision for doubtful debts / advances
141.89 - - 141.89 141.89 - - 141.89
Minimum alternate tax entitlement 2,152.77 1,026.56 - 3,179.33 1,147.95 1,004.82 - 2,152.77
Carry Forward of Losses - 1,135.68 - 1,135.68 - - - -
Others 476.08 183.97 57.21 717.26 434.91 6.34 34.83 476.08
Gross deferred tax assets (b) 2,974.46 2,354.86 142.96 5,472.28 1,912.51 1,027.12 34.83 2,974.46
Net deferred tax liability (a - b) 5,754.60 (298.95) (142.96) 5,312.69 5,443.36 336.31 (25.07) 5,754.60

210 Apollo Tyres Ltd.
iii. Pursuant to the Taxation Laws (Amendment) Ordinance, 2019 issued on September 20, 2019, corporate assesses have been given the option to apply lower income tax rate with effect from April 01, 2019, subject to certain conditions specified therein. The Company has carried out an evaluation and based on its forecasted profits, believes it will not be beneficial for the Company to choose the lower tax rate option in the near future. Accordingly, no effect in this regard has been considered in measurement of tax expense for the year ended March 31, 2020. Management, however, will continue to review its profitability forecast at regular intervals and make necessary adjustments to tax expense when there is reasonable certainty to avail the beneficial (lower) rate of tax.
iv. The Company has concluded that the deferred tax assets will be recoverable using the estimated future taxable income based on the business plans and budgets for the Company.
9 GOVERNMENT GRANTS
(a) Investment promotion subsidy from Government of Tamil Nadu
Pursuant to the Memorandum of Understanding (MoU) executed between the Government of Tamil Nadu (GoTN) and the Company, the Company is entitled, interalia, for refund of an amount equal to Net Output (VAT + CST) / GST paid by the Company to GoTN in the form of Investment Promotion Subsidy.
As the Company has fulfilled the relevant obligations, the Company has recognized subsidy income of ` 87.15 Million (` 235.93 Million) as other operating income, being the eligible amount of refund of Net Output (VAT + CST) / GST paid by the Company to GoTN.
(b) Export Promotion Capital Goods The Company had imported Property, plant and equipment
under the Export Promotion Capital Goods (EPCG) scheme wherein the Company is allowed to import capital goods including spares without payment of customs duty, subject to certain export obligations which should be fulfilled within specified time period. During the year, the custom duty benefit received amounts to ` 2,531.28 Million (` 890.91 Million)
with a corresponding increase in the value of property, plant and equipment and Capital Work in Progress. The grant amounting to ` 1,735.41 Million (` 1,438.44 Million) where export obligations have been met, have been recognized in Statement of Profit and Loss as other operating income. At the year end, the portion of grant for which the export obligation has not been met is retained in deferred revenue under other non current liabilities.
10 EMPLOYEE BENEFIT LIABILITY
A. Defined contribution plans a. Superannuation plan: The Company contributes a sum
equivalent to 15% of the eligible employees’ basic salary to a superannuation fund administered and maintained by the Life Insurance Corporation of India (LIC). The Company has no liability for future superannuation fund benefits other than its annual contribution and recognizes such contributions as an expense in the year incurred. The amount of contribution paid by the Company to Superannuation Fund is ` 103.69 Million (` 89.03 Million).
b. Provident fund: Contributions are made to the Company’s employees’ provident fund trust / regional provident fund in accordance with the fund rules. The interest rate payable to the beneficiaries every year is being notified by the Government.
In the case of contributions to the trust, the Company has an obligation to make good the shortfall, if any, between the return from the investments of the trust and the notified interest rate and recognises such obligation as an expense.
The amount of contributions made by the Company to employees’ provident fund trust / regional provident fund is ` 308.19 Million (`256.47 Million).
B. Defined benefit plans Gratuity The Company operates a defined benefit gratuity plan. Every
employee who has completed five years or more of service receives gratuity on leaving the Company as per the Payments of Gratuity Act, 1972. The scheme is funded with LIC.
The following table summarizes the components of net benefit expense recognized in the Statement of Profit and Loss and the funded status and amounts recognized in the balance sheet for the respective plan:
Statement of profit and loss:` Million
Particulars 2019-20 2018-19
Current service cost ^ 110.25 83.42 Interest cost on benefit obligation * 88.92 86.86 Actual return on plan assets* (77.31) (79.14)Expense recognized in the statement of profit and loss 121.86 91.14
^ Included in employee benefit expense * Included in finance cost

211Annual Report 2019-20
Statutory ReportsCorporate Overview Financial Statements
Other comprehensive income (experience adjustment)` Million
Particulars 2019-20 2018-19
Actuarial (gain)/loss for the year on defined benefit obligation 230.40 (23.94)
Actuarial (gain)/loss for the year on plan asset 15.00 (4.00)
Total 245.40 (27.94)
Balance sheet:Net asset / (liability) recognised in the balance sheet
` Million
ParticularsAs on
March 31, 2020As on
March 31, 2019
Fair value of plan assets at the end of the year (a) 1,696.22 1,206.66
Present value of defined benefit obligation at the end of the year (b) 1,496.95 1,162.30
Asset / (liability) recognized in the balance sheet (a - b) 199.27 44.36
Changes in the present value of the defined benefit obligation` Million
ParticularsAs on
March 31, 2020As on
March 31, 2019
Present value of obligations as at the beginning of the year 1,162.30 1,128.09
Interest cost 88.92 86.86
Current service cost 110.25 83.42
Benefits paid (94.92) (112.13)
Actuarial loss/(gain) on obligation 230.40 (23.94)
Present value of obligations as at the end of the year 1,496.95 1,162.30
Changes in the fair value of plan assets` Million
ParticularsAs on
March 31, 2020As on
March 31, 2019
Fair value of plan assets at beginning of the year 1,206.66 969.30
Actual return on plan assets 77.31 79.14
Contributions 522.17 266.35
Benefits paid (94.92) (112.13)
Actuarial (loss)/gain on plan assets (15.00) 4.00
Fair value of plan assets as at the end of the year 1,696.22 1,206.66
The Company’s gratuity funds are managed by the LIC and therefore the composition of the fund assets is not presently ascertained.
Maturity Profile of Defined Benefit Obligation` Million
ParticularsAs on
March 31, 2020As on
March 31, 2019
0 to 1 year 179.02 196.33
1 to 2 year 63.86 17.11
2 to 3 year 62.70 17.06
3 to 4 year 65.81 16.80
4 to 5 year 70.90 38.57
More than 5 years 1,054.66 876.43
Total 1,496.95 1,162.30

212 Apollo Tyres Ltd.
Principal assumptions for gratuity
ParticularsAs on
March 31, 2020 Rate (%)
As on March 31, 2019
Rate (%)
a) Discount rate 6.88 7.65
b) Future salary increase* 6.00 6.00
c) Expected rate of return on plan assets 7.43 7.85
d) Retirement age (years) 58.00 58.00
e) Mortality table IALM (2012-2014) IALM (2006-2008)
f) Ages (withdrawal rate %)
Up to 30 Years 3.00 3.00
From 31 to 44 Years 2.00 2.00
Above 44 Years 1.00 1.00
* The estimates of future salary increase take into account inflation, seniority, promotion and other relevant factors.
Estimated amount of contribution in the immediate next year is ` 123.32 Million (` 86.94 Million).
Sensitivity analysis of the defined benefit obligation` Million
Impact of change in Discount rate Salary increase Attrition rate
Present value of obligation as on March 31, 2020 1,496.95 1,496.95 1,496.95
Impact due to increase of 0.50% (69.34) 75.62 (9.92)
Impact due to decrease of 0.50% 75.34 (70.21) 10.67
` Million
Impact of change in Discount rate Salary increase Attrition rate
Present value of obligation as on March 31, 2019 1,162.30 1,162.30 1,162.30
Impact due to increase of 0.50% (49.39) 54.13 11.59
Impact due to decrease of 0.50% 53.52 (50.36) (12.98)
C. Other long term employee benefitsLong term compensated absencesPrincipal assumptions for long term compensated absences
ParticularsAs on
March 31, 2020 Rate (%)
As on March 31, 2019
Rate (%)
a) Discount rate 6.88 7.65
b) Future salary increase* 6.00 6.00
d) Retirement age (years) 58.00 58.00
e) Mortality table IALM (2012-2014) IALM (2006-2008)
f) Ages (withdrawal rate %)
Up to 30 Years 3.00 3.00
From 31 to 44 Years 2.00 2.00
Above 44 Years 1.00 1.00
* The estimates of future salary increase take into account inflation, seniority, promotion and other relevant factors.

213Annual Report 2019-20
Statutory ReportsCorporate Overview Financial Statements
11 FINANCIAL INSTRUMENT
A. Capital risk management The capital structure of the Company consists of debt, cash and cash equivalents and equity attributable to equity shareholders of
the Company which comprises issued share capital (including premium) and accumulated reserves disclosed in the Statement of Changes in Equity.
The Company’s capital management objective is to achieve an optimal weighted average cost of capital while continuing to safeguard the Company’s ability to meet its liquidity requirements (including its commitments in respect of capital expenditure) and repay loans as they fall due.
The Company manages its capital structure and makes adjustments in light of changes in economic conditions and the requirements of the financial covenants. To maintain or adjust the capital structure, the Company may adjust the dividend payment to shareholders, return capital to shareholders or issue new shares. The Company monitors capital using a gearing ratio, which is debt divided by total equity. The Company’s policy is to keep an optimum gearing ratio. The Company includes within debt, interest bearing loans and borrowings.
` Million
ParticularsAs on
March 31, 2020As on
March 31, 2019
Borrowings (refer note B12 and B16) 43,263.93 27,363.62
Current maturities of non current borrowings (refer note B18) 671.42 139.16
Sub total (a) 43,935.35 27,502.78
Equity (refer note B11) 572.05 572.05
Other equity 76,349.42 75,839.56
Sub total (b) 76,921.47 76,411.61
Capital gearing ratio ((a) / (b)) 0.57 0.36
B. Financial risk management
a. Market risk The Company’s activities expose it primarily to the financial risk of changes in foreign currency exchange rates and changes in
interest rates. The Company enters into a variety of derivate financial instrument to manage its exposure to foreign currency and interest rates. There have been no changes to the Company’s exposure to market risk or the manner in which it manages and measures the risk in recent past.
i) Currency risk The Company’s exposure arises mainly on import (of raw material and capital items) and export (of finished goods). The Company
follows a policy of matching of import and export exposures (natural hedge) to reduce the net exposure in any foreign currency. Whenever the natural hedge is not available or is not fully covering the foreign currency exposure of the Company, management uses certain derivative instruments to manage its exposure to the foreign currency risk. Foreign currency transactions are managed within approved policy parameters.
Currency wise net exposure of the Company` Million
CurrencyAs on
March 31, 2020Sensitivity + 1% Sensitivity -1%
As on March 31, 2019
Sensitivity + 1% Sensitivity -1%
USD 9,872.99 98.73 (98.73) (15,668.88) (156.69) 156.69
Euro (861.13) (8.61) 8.61 3,492.70 34.93 (34.93)
GBP (85.32) (0.85) 0.85 (80.38) (0.80) 0.80
Others 203.21 2.03 (2.03) 329.14 3.29 (3.29)
ii) Interest rate risk The Company is exposed to interest rate risk as the Company borrows funds at both fixed and floating interest rates. The risk
is managed by the Company by maintaining an appropriate mix between fixed and floating rate borrowings. The use of interest rate swaps are also entered into, especially to hedge the floating rate borrowings or to convert the foreign currency floating interest rates to the domestic currency floating interest rates.
Interest on variable rate borrowings are converted at fixed rate since company has hedged interest rate risk fully and effectively with the hedging instruments.

214 Apollo Tyres Ltd.
b) Credit risk Credit risk is the risk that counterparty will default on its contractual obligations resulting in financial loss to the Company. The
Company has adopted a policy of only dealing with creditworthy customers.
In many cases an appropriate advance or letter of credit / bank guarantee is taken from the customers to cover the risk. In other cases credit limit is granted to customer after assessing the credit worthiness based on the information supplied by credit rating agencies, publicly available financial information or its own past trading records and trends.
At the year end, the Company did not consider there to be any significant concentration of credit risk which had not been adequately provided for. The carrying amount of the financial assets recorded in the financial statements, grossed up for any allowances for losses, represents the maximum exposure to credit risk.
c) Liquidity risk The Company manages liquidity risk by maintaining adequate reserves and banking facilities, by continuously monitoring forecast
and actual cash flows and by matching the maturity profiles of financial assets and liabilities for the Company.
The Company has established an appropriate liquidity risk management framework for it’s short term, medium term and long term funding requirement.
The below tables summarise the maturity profile of the Company’s financial assets and financial liabilitiesi. Non derivative financial assets
` Million
Particulars
As on March 31, 2020 As on March 31, 2019
Less than 1 year
1 to 5 years5 years
and aboveLess than
1 year1 to 5 years
5 years and above
Non-interest bearing 6,262.98 582.01 24,338.97 7,944.79 687.99 22,325.73
Fixed interest rate instruments 600.01 - - 587.30 - -
ii. Non derivative financial liabilities` Million
Particulars
As on March 31, 2020 As on March 31, 2019
Less than 1 year
1 to 5 years5 years
and aboveLess than
1 year1 to 5 years
5 years and above
Non-interest bearing 24,078.38 - - 14,979.58 - -
Variable interest rate instruments 1,360.07 14,126.86 7,177.78 2,705.90 10,138.97 3,517.64
Lease liability 844.95 2,443.98 2,848.87 - - -
Fixed interest rate instruments 11,186.61 8,564.33 2,214.26 1,810.56 8,561.60 2,220.34
iii. Derivative assets / (liabilities)` Million
Particulars
As on March 31, 2020 As on March 31, 2019
Less than 1 year
1 to 5 years5 years
and aboveLess than
1 year1 to 5 years
5 years and above
Net settled:
Foreign currency forward contracts, futures and options (0.44) (26.59) - (91.52) - -
Foreign currency forward contracts, futures and options 53.25 - - 124.81 - -
Gross settled:
Cross currency interest rate swaps - - - - (15.34) -
Cross currency interest rate swaps - 1,500.33 - - 34.20 488.38
Total 52.81 1,473.74 - 33.29 18.86 488.38

215Annual Report 2019-20
Statutory ReportsCorporate Overview Financial Statements
d) The below tables summarise the fair value of the financial assets / liabilitiesi. Fair value of derivative instruments carried at fair value
` Million
ParticularsAs on
March 31, 2020As on
March 31, 2019Fair value hierarchy
(Level 1, 2 or 3) *
Derivative financial assets (a) - Foreign currency forward contracts, futures and options 53.25 124.81 2 - Cross currency interest rate swaps 1,500.33 522.58 2Total 1,553.58 647.39 Derivative financial liabilities (b) - Foreign currency forward contracts 27.03 91.52 - Cross currency interest rate swaps - 15.34 2Total 27.03 106.86 2Net derivate financial assets (a - b) 1,526.55 540.53
ii. Fair value of financial assets (other than derivative instruments) carried at fair value` Million
ParticularsAs on
March 31, 2020As on
March 31, 2019Fair value hierarchy
(Level 1, 2 or 3) *
Financial assets– Non current investments - quoted 0.42 2.79 1– Non current investments - unquoted 73.83 11.20 3Total 74.25 13.99
iii. Fair value of financial assets / liabilities (other than investment in subsidiaries) that are not measured at fair value The management considers that the carrying amount of financial assets and financial liabilities recognised at amortised cost in the
balance sheet approximates their fair value.
* Level 1 - Quoted price in an active market.
* Level 2 - Inputs other than quoted prices included within liability Level 1 that are observable or the asset or liability, either directly or indirectly.
* Level 3 - Unobservable inputs for asset or liability.
e) Details of outstanding contracts #
Currency pair CurrencyCurrency value
(Million)Exchange rate
Nominal value (Million)
Buy/Sell
As on March 31, 2020Foreign currency forward contractsUSD / INR US Dollar 56.80 75.58 4,292.64 BuyUSD / THB US Dollar 6.00 32.84 197.03 BuyUSD / ZAR US Dollar 2.25 17.89 40.26 BuyEUR / INR Euro 30.99 83.14 2,576.16 BuyFutures and optionsUSD / INR US Dollar 19.00 75.58 1,436.02 BuyCross currency interest swapsUSD / INR US Dollar 168.94 75.58 12,768.39 BuyAs on March 31, 2019Foreign currency forward contractsUSD / INR US Dollar 37.26 69.16 2,576.85 BuyUSD / THB US Dollar 6.00 31.71 190.24 BuyUSD / ZAR US Dollar 2.25 14.48 32.57 BuyFutures and optionsUSD / INR US Dollar 8.00 69.16 553.28 BuyCross currency interest swapsUSD / INR US Dollar 171.42 69.16 11,855.08 Buy
# For fair value of outstanding contracts, refer note C11 (d)(i).

216 Apollo Tyres Ltd.
f) Impact of hedging activities(1) Disclosures of effects of hedge accounting on balance sheet:
Type of hedge and risksNotional amount (Million)
Carrying amount of hedging instruments
(` Million) Maturity datesHedge ratio
Strike price range
Change in fair value of hedging
instruments (` Million)
Change in value of hedged item used
as the basis for recognising hedge
effectiveness (` Million)Assets Liabilities
As on March 31, 2020
Cash flow hedge
Foreign exchange and interest rate risk
(i) Cross Currency Swaps
USD / INR USD 168.94
1,423.51 - March-2022 to September-2024
1:1 69.17 to 75.24
496.04 (496.04)
Fair value hedge
Foreign exchange risk
(i) Foreign currency forward contracts
EUR / INR EUR 30.99
37.26 (26.59) April-2020 to June-2020
1:1 82.20 to 88.90
10.67 (10.67)
USD / INR USD 20.56
39.56 - April-2020 to June-2020
1:1 72.25 to 75.04
39.56 (39.56)
[Carrying value of firm Commitments for capital assets is ` 50.22 million and is recognised in Other Non-Current liabilities as others]
(2) Disclosure of effects of hedge accounting on statement of profit and loss
Type of hedge
Change in value of hedging instrument recognised in other
comprehensive income
Hedge ineffectiveness
recognised
Amount reclassified
from cash flow hedge reserve
Line item affected on reclassification
For the year ended March 31, 2020
Cash flow hedge
Foreign exchange and interest rate risk 496.04 - (429.43) Finance Cost
1,089.18 Gain on foreign currency transactions and translations
Fair value hedge
Foreign exchange risk - 0.63 - Gain on foreign currency transactions and translations
(3) Movement in cash flow hedging reserve` Million
ParticularsForeign currency
and interest rate risk
Cash flow hedge reserve
Balance as on April 01, 2019 (7.41)
Add: Changes in fair value of cross currency swaps 496.04
Less: Amount reclassified to Profit and loss (659.75)
Less: Deferred tax relating to above (net) 57.21
Balance as on March 31, 2020 (113.91)

217Annual Report 2019-20
Statutory ReportsCorporate Overview Financial Statements
Type of hedge and risksNotional amount (Million)
Carrying amount of hedging instruments
(` Million) Maturity datesHedge ratio
Strike price range
Change in fair value of hedging
instruments (` Million)
Change in value of hedged item used
as the basis for recognising hedge
effectiveness (` Million)Assets Liabilities
As on March 31, 2020
Cash flow hedge
Foreign exchange and interest rate risk
(i) Cross Currency Swaps
USD / INR USD 171.42
522.58 15.34 March-2022 to September-2024
1:1 69.17 to 75.24
17.29 (17.29)
(4) Disclosure of effects of hedge accounting on statement of profit and loss
Type of hedge
Change in value of hedging instrument recognised in other
comprehensive income
Hedge ineffectiveness
recognised
Amount reclassified
from cash flow hedge reserve
Line item affected on reclassification
For the year ended March 31, 2019
Cash flow hedge
Foreign exchange and interest rate risk 17.29 - (286.83) Finance Cost
403.81 Gain on foreign currency transactions and translations
(5) Movement in cash flow hedging reserve` Million
ParticularsForeign currency
and interest rate risk
Cash flow hedge reserve
Balance as on April 01, 2018 57.45
Add: Changes in fair value of cross currency swaps 17.29
Less: Amount reclassified to Profit and loss (116.98)
Less: Deferred tax relating to above (net) 34.83
Balance as on March 31, 2019 (7.41)
12 (A) Turnover and stock of finished goods and stock in trade` Million
ParticularsOpening Stock Turnover Closing Stock
2019-20 2018-19 2019-20 2018-19 2019-20 2018-19
Automobile tyres, tubes and flaps 9,979.13 7,647.29 107,692.18 120,131.25 9,023.32 9,979.13
Others 122.21 185.28 634.79 764.58 112.17 122.21
Total 10,101.34 7,832.57 108,326.97 120,895.83 9,135.49 10,101.34
(B) Raw materials consumed` Million
Particulars 2019-20 2018-19
Fabric 6,657.00 10,163.66
Rubber 28,769.82 37,205.99
Chemicals 6,991.80 9,558.48
Carbon black 9,430.13 12,210.30
Others 8,880.75 6,699.99
Total 60,729.50 75,838.42

218 Apollo Tyres Ltd.
(C) Break-up of consumption
Particulars2019-20 2018-19
% ` Million % ` Million
Raw material - Imported 37.00% 22,471.34 43.31% 32,842.32
- Indigenous 63.00% 38,258.16 56.69% 42,996.10
100.00% 60,729.50 100.00% 75,838.42
Stores and spares - Imported 7.11% 64.10 8.07% 80.61
- Indigenous 92.89% 836.88 91.93% 918.82
100.00% 900.98 100.00% 999.43
(D) C.I.F. value of imports` Million
Particulars 2019-20 2018-19
Raw material 21,266.05 33,401.43
Stores and spares 111.41 106.95
Capital goods 13,351.81 1,719.55
(E) Expenditure in foreign currency (remitted) (Excluding value of imports)
` Million
Particulars 2019-20 2018-19
Interest 831.08 595.68
Dividend for the year 2018-19 (2017-18)* - 5.93
Royalty 53.23 41.17
Others (including cross-charge of research and development expenses and management expenses paid to foreign subsidiary companies)
3,700.94 3,522.70
* Number of non-resident shareholders – 1 (1), Number of shares held by non resident shareholders - 1,977,000 (1,977,000) and current year dividend is paid in INR.
13 EARNINGS IN FOREIGN EXCHANGE (GROSS)` Million
Particulars 2019-20 2018-19
FOB value of exports 11,169.91 10,689.95
Interest received - 121.14
Royalty received 62.90 60.78
Cross charge of management expenses 161.02 84.91
Reimbursement of expenses received 516.29 601.27
14 STATUTORY AUDITORS’ REMUNERATION` Million
Particulars 2019-20 2018-19
For audits and quarterly reviews 9.50 8.50
For taxation matters - 0.37
For other services 3.50 3.18
Total 13.00 12.05

219Annual Report 2019-20
Statutory ReportsCorporate Overview Financial Statements
15 RESEARCH AND DEVELOPMENT EXPENDITURE
` Million
Particulars 2019-20 2018-19
(A) Revenue expenditure
Materials 3.10 1.53
Employee benefits expense 392.76 313.66
Travelling, conveyance and vehicle expense 110.57 108.21
Others 1,047.59 1,287.46
Total 1,554.02 1,710.86
(B) Capital expenditure 400.17 482.80
Total (A + B) 1,954.19 2,193.66
16 CONTINGENT LIABILITIES` Million
ParticularsAs on
March 31, 2020As on
March 31, 2019
Sales tax 417.30 174.97
Income tax # 708.90 784.80
Claims against the Company not acknowledged as debts – employee related 166.31 158.93
– others 29.30 30.60
Excise duty and service tax * 626.23 581.62
# Excludes amount of ` 1,039.46 Million (` 442.43 Million) in appeals which have been decided by Appellate authorities in the Company’s favour but on which the department has gone for further appeal and a demand of ` Nil (` 671.71 Million) relating to the adjustments made in MAT computation, which in the opinion of the Company, is not sustainable and the probability of cash outflow is considered remote.
* Show-cause notices received from various Government Agencies pending formal demand notices have not been considered as contingent liabilities.
In the opinion of the management, no provision is considered necessary for the disputes mentioned above on the ground that there are fair chances of successful outcome of appeals.
17 CAPITAL AND OTHER COMMITMENTS` Million
ParticularsAs on
March 31, 2020As on
March 31, 2019
A Capital commitments
Estimated amount of contracts remaining to be executed on capital account and not provided for 19,115.04 39,958.30
B Other commitments
Corporate guarantee given* (refer note C 25) 5,985.86 3,290.41
* The company has provided corporate guarantee on behalf of its wholly owned subsidiary Apollo Tyres Cooperatief U.A..
18 The Company conducts international transactions with associated enterprises. For the current year, the management maintained necessary documents as prescribed by the Income tax Act, 1961 to establish that these international transactions are at arm’s length and the aforesaid legislation will not have any impact on the financial statements, particularly on the amount of tax expense and that of provision for taxation.

220 Apollo Tyres Ltd.
19 DISCLOSURES REQUIRED UNDER SECTION 22 OF THE MICRO, SMALL AND MEDIUM ENTERPRISES DEVELOPMENT ACT, 2006
` Million
ParticularsAs on
March 31, 2020As on
March 31, 2019
(i) Principal amount remaining unpaid to any supplier as at the end of the accounting year 247.45 174.37
(ii) Interest due thereon remaining unpaid to any supplier as at the end of the accounting year 10.58 10.58
(iii) The amount of interest paid along with the amounts of the payment made to the supplier beyond the appointed day
- -
(iv) The amount of interest due and payable for the year - -
(v) The amount of interest accrued and remaining unpaid at the end of the accounting year 10.58 10.58
(vi) The amount of further interest due and payable even in the succeeding year, until such date when the interest dues as above are actually paid
10.58 10.58
Dues to Micro and Small Enterprises have been determined to the extent such parties have been identified on the basis of information collected by the Management. This has been relied upon by the auditors.
20 EXPENDITURE TOWARDS CORPORATE SOCIAL RESPONSIBILITY (CSR) ACTIVITIES -
In accordance with the provisions of section 135 of the Act, the Board of Directors of the Company had constituted a CSR committee. The details for CSR activities are as follows:
` Million
Particulars 2019-20 2018-19
i) Gross amount required to be spent by the Company during the year 183.70 213.83
ii) Amount spent during the year on the following:
(a) Construction/acquisition of any asset - -
(b) On purposes other than (a) above 183.70 213.83
Total 183.70 213.83
21 DISCLOSURE OF RELATED PARTY TRANSACTIONS IN ACCORDANCE WITH IND AS 24 - RELATED PARTY DISCLOSURES
Name of the Related Parties
Particulars 2019-20 2018-19
Subsidiaries Apollo Tyres Cooperatief U.A.,(AT Coop), Netherlands Apollo Tyres Cooperatief U.A.,(AT Coop), Netherlands
N.A. Apollo Tyres (Cyprus) Private Limited (ATCPL), Cyprus (note (a))
Apollo Tyres (Greenfield) B.V., Netherlands Apollo Tyres (Greenfield) B.V., Netherlands
Apollo (South Africa) Holdings (Pty) Ltd. (ASHPL) (Subsidiary through AT Coop)
Apollo (South Africa) Holdings (Pty) Ltd. (ASHPL) (Subsidiary through AT Coop)
Apollo Tyres Africa (Pty) Ltd. (Subsidiary through ASHPL) Apollo Tyres Africa (Pty) Ltd. (Subsidiary through ASHPL)
Apollo Tyres (Thailand) Limited, Thailand (Subsidiary through AT Coop)
Apollo Tyres (Thailand) Limited, Thailand (Subsidiary through AT Coop)
Apollo Tyres (Middle East) FZE (ATFZE), Dubai (Subsidiary through AT Coop)
Apollo Tyres (Middle East) FZE (ATFZE), Dubai (Subsidiary through AT Coop)
Apollo Tyres Holdings (Singapore) Pte. Ltd., (ATHS), Singapore (Subsidiary through AT Coop)
Apollo Tyres Holdings (Singapore) PTE. Ltd., (ATHS), Singapore (Subsidiary through AT Coop)
Apollo Tyres (Malaysia) SDN. BHD (Subsidiary through ATHS) Apollo Tyres (Malaysia) SDN. BHD (Subsidiary through ATHS)
Apollo Tyres (UK) Pvt. Ltd. (Subsidiary through AT Coop) Apollo Tyres (UK) Pvt. Ltd., United Kingdom (Subsidiary through AT Coop)
Apollo Tyres (London) Pvt. Ltd. (Subsidiary through ATUK) Apollo Tyres (London) Pvt. Ltd. (Subsidiary through ATUK)
Apollo Tyres Global R&D B.V. (Subsidiary through AT Coop) Apollo Tyres Global R&D B.V., Netherlands (Subsidiary through AT Coop)
Apollo Tyres (Germany) GmbH (Subsidiary through AT Coop) Apollo Tyres (Germany) GmbH (Subsidiary through AT Coop)
Apollo Tyres AG, Switzerland (AT AG) (Subsidiary through AT Coop)
Apollo Tyres AG, Switzerland (AT AG) (Subsidiary through AT Coop)

221Annual Report 2019-20
Statutory ReportsCorporate Overview Financial Statements
Particulars 2019-20 2018-19
Apollo Tyres do (Brasil) LTDA (Subsidiary through ATCoop and ATBV)
Apollo Tyres do (Brasil) LTDA, Brazil (Subsidiary through AT Coop and ATBV)
Apollo Tyres B.V. (ATBV), Netherlands (Subsidiary through AT Coop)
Apollo Tyres B.V. (ATBV), Netherlands (Subsidiary through AT Coop)
Apollo Tyres (Hungary) Kft (Subsidiary through ATBV) Apollo Tyres (Hungary) Kft (Subsidiary through ATBV)
N.A. Reifencom GmbH, Bielefeld (now Reifencom GmbH, Hannover) (Subsidiary through AT Coop) (note (d))
Reifencom GmbH, Hannover (Subsidiary through AT Coop) Reifencom GmbH, Hannover (Subsidiary through Reifencom GmbH, Bielefeld) (note (d))
N.A. Reifencom Einkaufsgesellschaft, mbH & Co. OHG, Hannover (note (d))
Reifencom Tyre (Qingdao) Co., Ltd. (Subsidiary through Reifencom GmbH, Hannover)
Reifencom Tyre (Qingdao) Co., Ltd. (Subsidiary through Reifencom GmbH, Hannover) (note (e))
Saturn F1 Pvt Ltd (Subsidiary through AT Coop) Saturn F1 Pvt Ltd (Subsidiary through AT Coop)
N.A. Retail Distribution Holding B.V. (Subsidiary through AT Coop) (note (a))
Rubber Research LLC (Subsidiary through AT Coop) (Note f) Rubber Research LLC (Subsidiary through AT Coop)
ATL Singapore Pte Limited ATL Singapore Pte Limited
Apollo Vredestein Tires Inc., USA (Subsidiary through AT Coop) Apollo Vredestein Tires Inc., USA (Subsidiary through AT Coop)
Apollo Vredestein B.V., Netherlands (AVBV) (Subsidiary through ATBV)
Apollo Vredestein B.V., Netherlands (AVBV) (Subsidiary through ATBV)
Subsidiaries of Apollo Vredestein B.V (AVBV): Subsidiaries of Apollo Vredestein B.V (AVBV):
Apollo Vredestein GmbH, Germany Apollo Vredestein GmbH, Germany
N.A. Vredestein Marketing B.V. & Co. KG, Germany (Subsidiary through Apollo Vredestein GmbH) (note (c))
Apollo Vredestein Nordic A.B., Sweden Apollo Vredestein Nordic A.B., Sweden
Apollo Vredestein U.K. Limited, United Kingdom Apollo Vredestein U.K. Limited, United Kingdom
Apollo Vredestein SAS, France Apollo Vredestein SAS, France
Apollo Vredestein Belux, Belgium Apollo Vredestein Belux, Belgium
Apollo Vredestein Gesellschaft m.b.H., Austria Apollo Vredestein Gesellschaft m.b.H., Austria
Apollo Vredestein Schweiz AG, Switzerland Apollo Vredestein Schweiz AG, Switzerland
Apollo Vredestein Srl, Italy (note (a)) Apollo Vredestein Srl, Italy
Apollo Vredestein Iberica SA, Spain Apollo Vredestein Iberica SA, Spain
Apollo Vredestein Kft, Hungary Apollo Vredestein Kft, Hungary
S.C. Vredesetin R.O. Srl, Romania (Subsidiary through Apollo Vredestein Kft, Hungary)
S.C. Vredesetin R.O. Srl, Romania (Subsidiary through Apollo Vredestein Kft, Hungary)
Apollo Vredestein Opony Polska Sp. Zo.o., Poland Apollo Vredestein Opony Polska Sp. Zo.o., Poland
Vredestein Consulting B.V.,Netherlands Vredestein Consulting B.V.,Netherlands
Finlo B.V. Netherlands Finlo B.V. Netherlands
Vredestein Marketing B.V., Netherlands Vredestein Marketing B.V., Netherlands
Associates Pressurerite (Pty) Limited, South Africa (note (b)) Pressurerite (Pty) Limited, South Africa
KT Telematic Solutions Private Limited KT Telematic Solutions Private Limited
Joint venture PanAridus LLC, USA (JV through ATHS) PanAridus LLC, USA (JV through ATHS)
The Companies in which directors are interested
Apollo International Limited Apollo International Limited
Apollo International Trading LLC, Middle East Apollo International Trading LLC, Middle East
Apollo International FZC Apollo International FZC
Landmark Farms & Housing Pvt. Ltd. Landmark Farms & Housing Pvt. Ltd.
SunLife Tradelinks (P) Ltd. SunLife Tradelinks (P) Ltd.
Classic Industries and Exports Limited (formerly known as Classic Auto Tubes Ltd.)
Classic Auto Tubes Ltd.
PTL Enterprises Ltd. PTL Enterprises Ltd.
Artemis Medicare Services Ltd. Artemis Medicare Services Ltd.
Shardul Amarchand Mangaldas & Co. Shardul Amarchand Mangaldas & Co.
Regent Properties Regent Properties
Milers Global Pvt. Ltd. Milers Global Pvt. Ltd.

222 Apollo Tyres Ltd.
Particulars 2019-20 2018-19
Key management personnel
Mr. Onkar S. Kanwar Mr. Onkar S. Kanwar
Mr. Neeraj Kanwar Mr. Neeraj Kanwar
Mr. Satish Sharma ** N.A.
Mr. Akshay Chudasama Mr. Akshay Chudasama
N.A. Mr. A.K. Purwar
Gen. Bikram Singh (Retd.) Gen. Bikram Singh (Retd.)
Mr. Francesco Gori Mr. Francesco Gori
Mr. Nimesh N. Kampani* Mr. Nimesh N. Kampani
Ms. Pallavi Shroff Ms. Pallavi Shroff
Mr. Robert Steinmetz Mr. Robert Steinmetz
Mr. Sunam Sarkar Mr. Sunam Sarkar
Dr. S. Narayan* Dr. S. Narayan
Mr. Vikram S. Mehta Mr. Vikram S. Mehta
Mr. Vinod Rai Mr. Vinod Rai
Ms. Anjali Bansal Ms. Anjali Bansal
N.A. Dr. M Beena
Notes: Related parties and their relationships are as identified by the management and relied upon by the auditors. All transactions are conducted in the ordinary course of business and at arm’s length.(a) Liquidated during the previous year(b) Apollo (South Africa) Holdings (Pty) Ltd has executed a sale of shares agreement with Tacoma Foods (Pty) Ltd to sell its entire stake in Pressurerite (Pty) Limited
effective from May 31, 2019. Pressurerite (Pty) Limited was not an associate of Apollo (South Africa) Holdings (Pty) Ltd as on March 31, 2020.(c) Merged with Apollo Vredestein GmbH.(d) During the previous year, Reifencom GmbH, Hannover (RCH), a wholly owned step down subsidiary was merged into its parent company, Reifencom GmbH,
Bielefeld (RCB) with effect from August 16, 2018. Pursuant to the merger, the name of RCB was changed to Reifencom GmbH, Hannover. Also Reifencom Einkaufsgesellschaft, mbH & Co. OHG, Hannover (equally owned by RCH and RCB) was merged with RCB.
(e) Subsequent to the merger as per (d) above, Reifencom Tyre (Qingdao) Co., Ltd. became a wholly owned subsidiary of Reifencom GmbH, Hannover (formerly Reifencom GmbH, Bielefeld).
(f) Liquidated during the year* Ceased to be director during the year** Appointed during the year
Transactions and balances with Related Parties:FY 2019-20
` Million
Particulars SubsidiariesCompanies in
which Directors are interested
AssociateKey
Management Personnel
Total
Description of Transactions:
Sales: Finished Goods
Apollo Vredestein B.V. 1,921.74 1,921.74
Apollo Tyres Middle East Fze. 2,832.00 2,832.00
Apollo Tyres Thailand Ltd. 1,698.01 1,698.01
Apollo Tyres Africa (Pty) Ltd 814.21 814.21
Apollo Tyres (Malaysia) Sdn Bhd 335.42 335.42
Apollo Tyres (Hungary) Kft 19.17 19.17
Apollo International FZC 660.04 660.04
Apollo International Ltd. 13.39 13.39
Apollo Tyres Global R&D B.V 3.45 3.45
Apollo International Trading LLC, Middle East 2.94 2.94
Apollo Vredestein Tires Inc. 0.04 0.04
7,624.04 676.37 8,300.41
Sales: Raw Materials
Classic Industries and Exports Ltd. 390.72 390.72
Sales: Semi Finished Goods
Apollo Vredestein B.V. 1.90 1.90

223Annual Report 2019-20
Statutory ReportsCorporate Overview Financial Statements
` Million
Particulars SubsidiariesCompanies in
which Directors are interested
AssociateKey
Management Personnel
Total
Investments Made:
Apollo Tyres Co-Operatief U.A 1,709.20 1,709.20
Royalty Income:
Apollo Tyres Middle East Fze. 17.34 17.34
Apollo Tyres Thailand Ltd. 13.50 13.50
Apollo Tyres Africa (Pty) Ltd 31.49 31.49
Apollo Tyres (Malaysia) Sdn Bhd 0.57 0.57
62.90 62.90
Cross Charge of Management & Other Expenses Received #:
Apollo Vredestein B.V. 75.23 75.23
Apollo Tyres Middle East Fze. 2.44 2.44
Apollo Tyres Global R & D B.V. 3.23 3.23
Apollo Tyres (UK) Pvt. Ltd. 2.40 2.40
Apollo Tyres Thailand Ltd. 2.82 2.82
PTL Enterprises Ltd. 0.85 0.85
Classic Industries and Exports Ltd. 1.69 1.69
Apollo Tyres Africa (Pty) Ltd 2.11 2.11
Apollo Tyres (Hungary) Kft 28.09 28.09
Apollo Tyres Holdings (Singapore) Pte Ltd. 43.79 43.79
Apollo Tyres (Malaysia) Sdn Bhd 0.91 0.91
161.02 2.54 163.56
Rent Received:
PTL Enterprises Ltd. 0.39 0.39
Classic Industries and Exports Ltd. 1.06 1.06
1.45 1.45
Reimbursement of Expenses Received:
Apollo Vredestein B.V. 106.93 106.93
Apollo Tyres Middle East Fze. 2.58 2.58
Apollo Tyres Global R & D B.V. 14.82 14.82
Apollo Tyres Thailand Ltd. 3.42 3.42
Apollo Tyres (UK) Pvt. Ltd. 15.31 15.31
Classic Industries and Exports Ltd. - 10.04 10.04
Apollo Tyres Africa (Pty) Ltd 1.94 1.94
Apollo Tyres (Hungary) Kft 138.82 138.82
Apollo Tyres Holdings (Singapore) Pte Ltd. 137.92 137.92
Apollo Tyres AG, Switzerland 90.52 90.52
Apollo Tyres (Malaysia) Sdn Bhd 2.27 2.27
Reifencom GmbH 0.65 0.65
Apollo Vredestein Tires Inc. 1.11 1.11
516.29 10.04 526.33
Freight & Insurance recovered:
Apollo International Ltd. FZC 0.04 0.04
Apollo Tyres Middle East Fze. 69.22 69.22
Apollo Tyres Thailand Ltd. 14.33 14.33
Apollo Tyres Africa (Pty) Ltd 30.46 30.46
Apollo Vredestein B.V. 71.48 71.48
Apollo Tyres Global R&D B.V 2.80 2.80
Apollo Tyres (Hungary) Kft 0.76 0.76
Apollo Tyres (Malaysia) Sdn Bhd 1.69 1.69
Apollo Vredestein Tires Inc. 0.13 0.13
190.87 0.04 190.91

224 Apollo Tyres Ltd.
` Million
Particulars SubsidiariesCompanies in
which Directors are interested
AssociateKey
Management Personnel
Total
Royalty Paid:
Apollo Tyres AG, Switzerland 47.83 47.83
Purchase of raw material
Apollo Tyres Holdings (Singapore) Pte Ltd. 22,939.51 22,939.51
Purchase of stock in trade:
Classic Industries and Exports Ltd. 3,171.61 3,171.61
Apollo Vredestein B.V. 120.44 120.44
120.44 3,171.61 3,292.05
Purchase of asset:
Classic Industries and Exports Ltd. 1,326.08 1,326.08
Artemis Medicare Services Ltd. 59.63 59.63
Apollo Vredestein B.V. 39.76 39.76
Apollo Tyres (Hungary) Kft 53.41 53.41
93.17 1,385.71 1,478.88
Legal and Professional Charges Paid:
Shardul Amarchand Mangaldas & Co 3.00 3.00
Reimbursement of Expenses paid:
PTL Enterprises Ltd. 645.64 645.64
Classic Industries and Exports Ltd. 7.80 7.80
Apollo Vredestein B.V. 28.15 28.15
Apollo Tyres Thailand Ltd. 95.69 95.69
Apollo Tyres Middle East Fze. 51.86 51.86
Apollo Tyres (UK) Pvt. Ltd. 12.89 12.89
Apollo Tyres Global R & D B.V. 78.67 78.67
Apollo Tyres Africa (Pty) Ltd 11.38 11.38
Apollo Tyres Holdings (Singapore) Pte Ltd. 0.16 0.16
Apollo Tyres (Malaysia) Sdn Bhd 25.06 25.06
Apollo Tyres (Hungary) Kft 22.88 22.88
Apollo Vredestein Tires Inc. 0.34 0.34
327.08 653.44 980.52
Payment for Services Received:
Artemis Medicare Services Ltd. 20.78 20.78
Classic Industries and Exports Ltd. 9.91 9.91
30.69 30.69
Cross Charge of R & D Expenses paid:
Apollo Tyres Global R & D B.V. 654.40 654.40
Cross Charge of Other Expenses paid:
Apollo Tyres (UK) Pvt. Ltd. 806.99 806.99
Apollo Tyres Holdings (Singapore) Pte Ltd. 211.40 211.40
1,018.39 1,018.39
Lease Rent paid:
PTL Enterprises Ltd. 600.00 600.00
Rent Paid:
Sunlife Tradelinks (P) Ltd. 30.99 30.99
Regent Properties 23.76 23.76
Classic Industries and Exports Ltd. 0.12 0.12
54.87 54.87
Mixing Charges Paid:
Classic Industries and Exports Ltd. 143.44 143.44
Commssion on Sales paid
Apollo Tyres Thailand Ltd. 58.95 58.95
Apollo Tyres Middle East Fze. 19.24 19.24
78.19 78.19
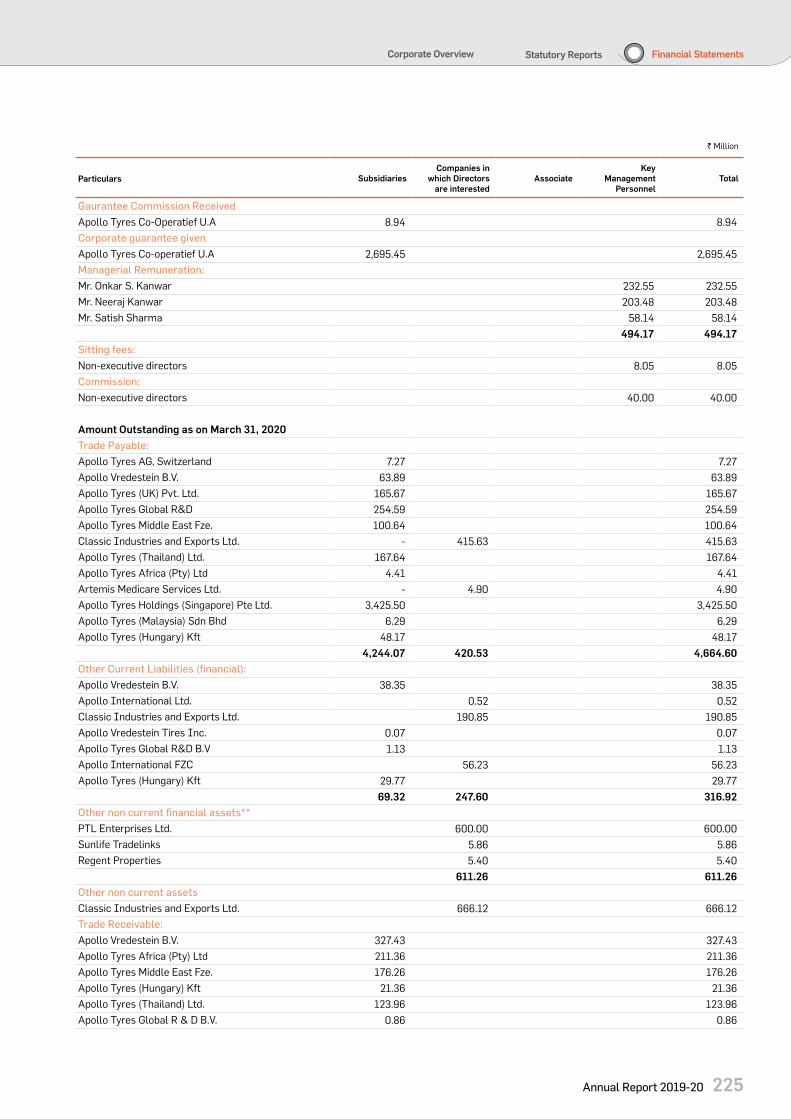
225Annual Report 2019-20
Statutory ReportsCorporate Overview Financial Statements
` Million
Particulars SubsidiariesCompanies in
which Directors are interested
AssociateKey
Management Personnel
Total
Gaurantee Commission Received
Apollo Tyres Co-Operatief U.A 8.94 8.94
Corporate guarantee given
Apollo Tyres Co-operatief U.A 2,695.45 2,695.45
Managerial Remuneration:
Mr. Onkar S. Kanwar 232.55 232.55
Mr. Neeraj Kanwar 203.48 203.48
Mr. Satish Sharma 58.14 58.14
494.17 494.17
Sitting fees:
Non-executive directors 8.05 8.05
Commission:
Non-executive directors 40.00 40.00
Amount Outstanding as on March 31, 2020
Trade Payable:
Apollo Tyres AG, Switzerland 7.27 7.27
Apollo Vredestein B.V. 63.89 63.89
Apollo Tyres (UK) Pvt. Ltd. 165.67 165.67
Apollo Tyres Global R&D 254.59 254.59
Apollo Tyres Middle East Fze. 100.64 100.64
Classic Industries and Exports Ltd. - 415.63 415.63
Apollo Tyres (Thailand) Ltd. 167.64 167.64
Apollo Tyres Africa (Pty) Ltd 4.41 4.41
Artemis Medicare Services Ltd. - 4.90 4.90
Apollo Tyres Holdings (Singapore) Pte Ltd. 3,425.50 3,425.50
Apollo Tyres (Malaysia) Sdn Bhd 6.29 6.29
Apollo Tyres (Hungary) Kft 48.17 48.17
4,244.07 420.53 4,664.60
Other Current Liabilities (financial):
Apollo Vredestein B.V. 38.35 38.35
Apollo International Ltd. 0.52 0.52
Classic Industries and Exports Ltd. 190.85 190.85
Apollo Vredestein Tires Inc. 0.07 0.07
Apollo Tyres Global R&D B.V 1.13 1.13
Apollo International FZC 56.23 56.23
Apollo Tyres (Hungary) Kft 29.77 29.77
69.32 247.60 316.92
Other non current financial assets**
PTL Enterprises Ltd. 600.00 600.00
Sunlife Tradelinks 5.86 5.86
Regent Properties 5.40 5.40
611.26 611.26
Other non current assets
Classic Industries and Exports Ltd. 666.12 666.12
Trade Receivable:
Apollo Vredestein B.V. 327.43 327.43
Apollo Tyres Africa (Pty) Ltd 211.36 211.36
Apollo Tyres Middle East Fze. 176.26 176.26
Apollo Tyres (Hungary) Kft 21.36 21.36
Apollo Tyres (Thailand) Ltd. 123.96 123.96
Apollo Tyres Global R & D B.V. 0.86 0.86

226 Apollo Tyres Ltd.
` Million
Particulars SubsidiariesCompanies in
which Directors are interested
AssociateKey
Management Personnel
Total
Apollo Tyres (Malaysia) Sdn Bhd 82.28 82.28
Apollo Vredestein Tires Inc. 0.17 0.17
943.68 943.68
Other current assets
Apollo Tyres Africa (Pty) Ltd 46.07 46.07
Apollo Vredestein B.V. 58.72 58.72
Apollo Tyres Thailand Ltd. 72.25 72.25
PTL Enterprises Ltd. 65.79 65.79
Apollo International Ltd 3.02 3.02
Classic Industries and Exports Ltd. 90.04 90.04
Apollo Tyres (Hungary) Kft 46.92 46.92
Apollo Tyres Middle East Fze. 29.68 29.68
Apollo Tyres Co-Operatief U.A 11.88 11.88
Apollo Tyres (UK) Pvt. Ltd. 6.66 6.66
Apollo Tyres Global R&D B.V 35.24 35.24
Apollo Vredestein Tires Inc. 2.08 2.08
Apollo Tyres Holdings (Singapore) Pte Ltd. 21.87 21.87
Apollo Tyres (Malaysia) Sdn Bhd 0.99 0.99
Reifencom GmbH 2.61 2.61
334.98 158.85 493.82
Transactions and balances with Related Parties:
FY 2018-19Description of Transactions:
Sales: Finished Goods
Apollo Vredestein B.V. 2,414.72 2,414.72
Apollo Tyres (Middle East) FZE 2,044.59 2,044.59
Apollo Tyres (Thailand) Limited 1,878.56 1,878.56
Apollo Tyres Africa (Pty) Ltd. 789.04 789.04
Apollo International Ltd. 631.97 631.97
Apollo Tyres (Malaysia) SDN. BHD 368.11 368.11
Apollo International Trading LLC, Middle East 39.53 39.53
Apollo International FZC 24.63 24.63
Apollo Tyres Global R&D B.V. 2.98 2.98
7,498.00 696.13 8,194.13
Sales: Raw Materials
Classic Auto Tubes Ltd. 1,200.93 1,200.93
Apollo Tyres (Hungary) Kft 12.74 12.74
12.74 1,200.93 1,213.67
Sales: Semi Finished Goods
Apollo Vredestein B.V. 36.61 36.61
Royalty Income:
Apollo Tyres (Middle East) FZE 15.83 15.83
Apollo Tyres (Thailand) Limited 15.58 15.58
Apollo Tyres Africa (Pty) Ltd. 28.45 28.45
Apollo Tyres (Malaysia) SDN. BHD 0.92 0.92
60.78 60.78
Cross Charge of Management & Other Expenses Received #:
Apollo Tyres Holdings (Singapore) Pte. Ltd. 29.98 29.98
Apollo Vredestein B.V. 28.46 28.46
Apollo Tyres (Hungary) Kft 13.15 13.15
Apollo Tyres Global R&D B.V. 3.09 3.09
Apollo Tyres (Thailand) Limited 2.98 2.98

227Annual Report 2019-20
Statutory ReportsCorporate Overview Financial Statements
` Million
Particulars SubsidiariesCompanies in
which Directors are interested
AssociateKey
Management Personnel
Total
Apollo Tyres (UK) Pvt. Ltd. 2.30 2.30
Apollo Tyres (Middle East) FZE 2.20 2.20
Apollo Tyres Africa (Pty) Ltd. 1.91 1.91
Classic Auto Tubes Ltd. 1.69 1.69
PTL Enterprises Ltd. 0.85 0.85
Apollo Tyres (Malaysia) SDN. BHD 0.84 0.84
Artemis Medicare Services Ltd. 0.60 0.60
84.91 3.14 88.05
Rent Received:
Classic Auto Tubes Ltd. 1.06 1.06
PTL Enterprises Ltd. 0.37 0.37
1.43 1.43
Interest income:
Apollo Tyres Cooperatief U.A. 115.88 115.88
Apollo Tyres (Greenfield) B.V. 5.26 5.26
121.14 121.14
Reimbursement of Expenses Received:
Apollo Tyres (Hungary) Kft 263.97 263.97
Apollo Vredestein B.V. 154.70 154.70
Apollo Tyres AG, Switzerland 120.62 120.62
Apollo Tyres Global R&D B.V. 31.52 31.52
Apollo Tyres (UK) Pvt. Ltd. 12.99 12.99
Classic Auto Tubes Ltd. 12.40 12.40
Apollo Tyres (Thailand) Limited 5.75 5.75
Apollo Tyres Holdings (Singapore) Pte. Ltd. 5.07 5.07
Reifencom GmbH 2.11 2.11
Apollo Tyres Africa (Pty) Ltd. 1.96 1.96
Apollo Tyres (Middle East) FZE 1.41 1.41
Apollo Tyres (Malaysia) SDN. BHD 0.94 0.94
PTL Enterprises Ltd. 0.82 0.82
Apollo Vredestein Tires Inc. 0.23 0.23
601.27 13.22 614.49
Freight and insurance recovered:
Apollo Vredestein B.V. 94.12 94.12
Apollo Tyres (Middle East) FZE 33.23 33.23
Apollo Tyres Africa (Pty) Ltd. 27.78 27.78
Apollo Tyres (Thailand) Limited 15.08 15.08
Apollo Tyres Global R&D B.V 4.06 4.06
Apollo Tyres (Malaysia) SDN. BHD 1.75 1.75
176.02 176.02
Guarantee commission received
Apollo Tyres Co-Operatief U.A 2.75 2.75
Royalty Paid:
Apollo Tyres AG, Switzerland 53.36 53.36
Purchase of raw material / bought out
Apollo Tyres Holdings (Singapore) Pte. Ltd. 33,264.95 33,264.95
Classic Auto Tubes Ltd. 3,268.10 3,268.10
Apollo Vredestein B.V. 158.34 158.34
Apollo Tyres (Hungary) Kft 60.72 60.72
33,484.01 3,268.10 36,752.11
Legal and professional charges paid:
Shardul Amarchand Mangaldas & Co 8.81 8.81

228 Apollo Tyres Ltd.
` Million
Particulars SubsidiariesCompanies in
which Directors are interested
AssociateKey
Management Personnel
Total
Reimbursement of expenses paid:
PTL Enterprises Ltd. 691.93 691.93
Apollo Tyres (Thailand) Limited 77.39 77.39
Apollo Tyres (Hungary) Kft 61.57 61.57
Apollo Tyres Global R&D B.V 35.32 35.32
Apollo Tyres (Middle East) FZE 34.73 34.73
Apollo Tyres (Malaysia) SDN. BHD 27.13 27.13
Apollo Tyres Africa (Pty) Ltd. 9.71 9.71
Apollo Vredestein Tires Inc. 7.70 7.70
Apollo Vredestein B.V. 7.39 7.39
Classic Auto Tubes Ltd. 6.84 6.84
Apollo Tyres (UK) Pvt. Ltd. 1.60 1.60
Reifencom GmbH 0.80 0.80
Milers Global Pvt. Ltd. 0.43 0.43
263.34 699.20 962.54
Payment for services received:
Artemis Medicare Services Ltd. 21.32 21.32
Cross Charge of R & D expenses paid:
Apollo Tyres Global R&D B.V 788.48 788.48
Cross charge of other expenses paid:
Apollo Tyres (UK) Pvt. Ltd. 705.97 705.97
Apollo Tyres Holdings (Singapore) Pte. Ltd. 204.38 204.38
910.35 910.35
Lease rent paid:
PTL Enterprises Ltd. 600.00 600.00
Rent paid:
Sunlife Tradelinks (P) Ltd. 27.62 27.62
Land Mark Farms & Housing (P) Ltd. 19.80 19.80
Regent Properties 23.76 23.76
Classic Auto Tubes Ltd. 0.12 0.12
Milers Global Pvt. Ltd. 2.25 2.25
73.55 73.55
Conversion charges paid:
Classic Auto Tubes Ltd. 273.18 273.18
Mixing charges Paid:
Classic Auto Tubes Ltd. 294.13 294.13
Commission on Sales paid
Apollo Tyres (Thailand) Limited 66.11 66.11
Apollo Tyres (Middle East) FZE 84.51 84.51
150.62 150.62
Refund of Security Deposits Given:
Land Mark Farms & Housing 6.00 6.00
Milers Global Pvt. Ltd. 0.75 0.75
6.75 6.75
Purchase of assets
Classic Auto Tubes Ltd. 775.53 775.53
Artemis Medicare Services Ltd. 43.78 43.78
819.31 819.31
Sale of assets
Apollo Tyres (Hungary) Kft 41.08 41.08
Loan given
Apollo Tyres Cooperatief U.A 1,490.69 1,490.69
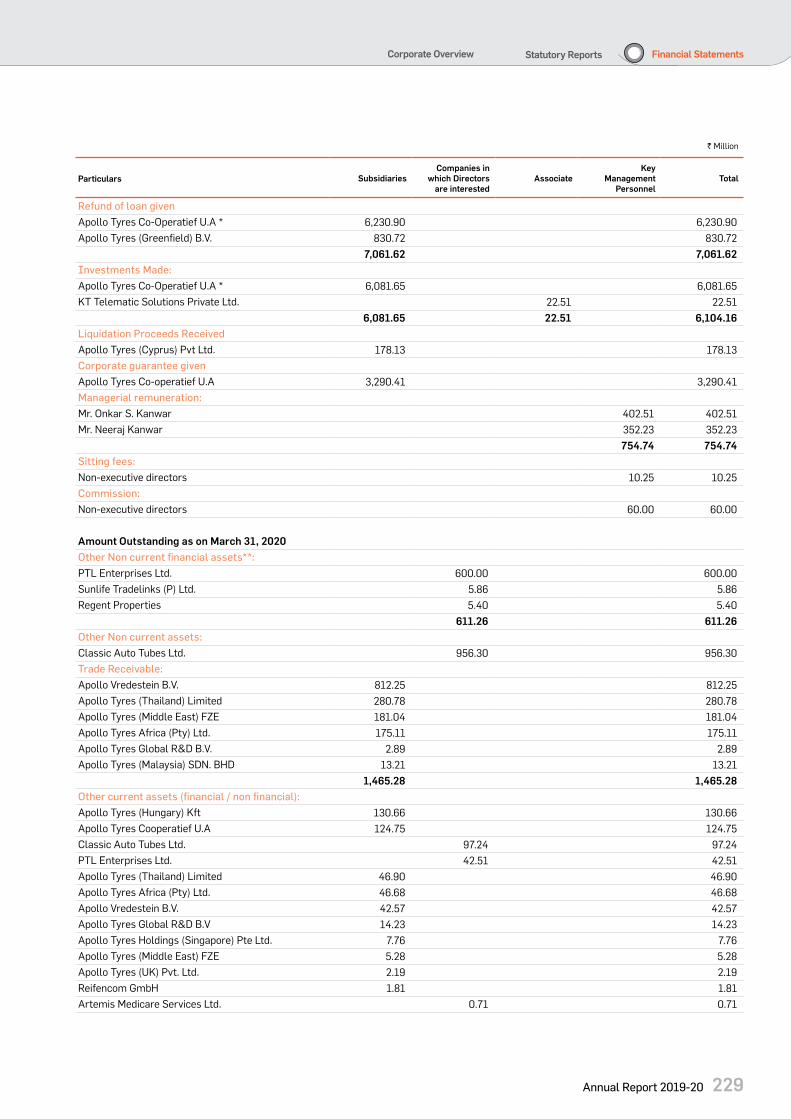
229Annual Report 2019-20
Statutory ReportsCorporate Overview Financial Statements
` Million
Particulars SubsidiariesCompanies in
which Directors are interested
AssociateKey
Management Personnel
Total
Refund of loan given
Apollo Tyres Co-Operatief U.A * 6,230.90 6,230.90
Apollo Tyres (Greenfield) B.V. 830.72 830.72
7,061.62 7,061.62
Investments Made:
Apollo Tyres Co-Operatief U.A * 6,081.65 6,081.65
KT Telematic Solutions Private Ltd. 22.51 22.51
6,081.65 22.51 6,104.16
Liquidation Proceeds Received
Apollo Tyres (Cyprus) Pvt Ltd. 178.13 178.13
Corporate guarantee given
Apollo Tyres Co-operatief U.A 3,290.41 3,290.41
Managerial remuneration:
Mr. Onkar S. Kanwar 402.51 402.51
Mr. Neeraj Kanwar 352.23 352.23
754.74 754.74
Sitting fees:
Non-executive directors 10.25 10.25
Commission:
Non-executive directors 60.00 60.00
Amount Outstanding as on March 31, 2020
Other Non current financial assets**:
PTL Enterprises Ltd. 600.00 600.00
Sunlife Tradelinks (P) Ltd. 5.86 5.86
Regent Properties 5.40 5.40
611.26 611.26
Other Non current assets:
Classic Auto Tubes Ltd. 956.30 956.30
Trade Receivable:
Apollo Vredestein B.V. 812.25 812.25
Apollo Tyres (Thailand) Limited 280.78 280.78
Apollo Tyres (Middle East) FZE 181.04 181.04
Apollo Tyres Africa (Pty) Ltd. 175.11 175.11
Apollo Tyres Global R&D B.V. 2.89 2.89
Apollo Tyres (Malaysia) SDN. BHD 13.21 13.21
1,465.28 1,465.28
Other current assets (financial / non financial):
Apollo Tyres (Hungary) Kft 130.66 130.66
Apollo Tyres Cooperatief U.A 124.75 124.75
Classic Auto Tubes Ltd. 97.24 97.24
PTL Enterprises Ltd. 42.51 42.51
Apollo Tyres (Thailand) Limited 46.90 46.90
Apollo Tyres Africa (Pty) Ltd. 46.68 46.68
Apollo Vredestein B.V. 42.57 42.57
Apollo Tyres Global R&D B.V 14.23 14.23
Apollo Tyres Holdings (Singapore) Pte Ltd. 7.76 7.76
Apollo Tyres (Middle East) FZE 5.28 5.28
Apollo Tyres (UK) Pvt. Ltd. 2.19 2.19
Reifencom GmbH 1.81 1.81
Artemis Medicare Services Ltd. 0.71 0.71

230 Apollo Tyres Ltd.
` Million
Particulars SubsidiariesCompanies in
which Directors are interested
AssociateKey
Management Personnel
Total
Apollo International Ltd 0.67 0.67
Apollo Tyres (Malaysia) SDN. BHD 0.45 0.45
Apollo Vredestein Tires Inc. 0.24 0.24
423.52 141.13 564.65
Trade Payable:
Apollo Tyres Holdings (Singapore) Pte. Ltd. 3,544.90 3,544.90
Classic Auto Tubes Ltd. 411.66 411.66
Apollo Tyres (Thailand) Limited 192.41 192.41
Apollo Tyres Global R&D B.V. 123.21 123.21
Apollo Tyres (UK) Pvt. Ltd. 115.22 115.22
Apollo Tyres (Hungary) Kft 90.99 90.99
Apollo Tyres (Middle East) FZE 58.92 58.92
Apollo Tyres (Malaysia) SDN. BHD 13.50 13.50
Apollo Tyres AG, Switzerland 13.36 13.36
Apollo Vredestein B.V. 12.30 12.30
Apollo Tyres Africa (Pty) Ltd. 9.29 9.29
Apollo Vredestein Tires Inc. 6.58 6.58
4,180.68 411.66 4,592.34
Other Current Liabilities (Financial):
Classic Auto Tubes Ltd. 349.39 349.39
Apollo International FZC 35.36 35.36
Apollo International Trading LLC 8.73 8.73
Apollo Tyres Global R&D B.V. 0.93 0.93
Apollo International Ltd. 0.52 0.52
Apollo Vredestein Tires Inc. 0.07 0.07
1.00 394.00 395.00
Certain KMPs also participate in post employment benefits plans provided by the Company. The amount in respect of these towards the KMPs can not be segregated as these are based on actuarial valuation for all employees of the Company.* Refund of loan given to Apollo Tyres Co-Operatief U.A includes ` 6,081.65 Million converted to investments during the previous year.**This represents undiscounted value.
22 DISCLOSURE REQUIRED BY REGULATION 34 OF SEBI (LISTING OBLIGATIONS & DISCLOSURE REQUIREMENTS) REGULATIONS, 2015 REGARDING THE RELATED PARTIES
Amount of loans / advances in the nature of loans outstanding from Subsidiaries and Companies in which Directors are interested
` Million
ParticularsOutstanding
as at the end of the year
Maximum amount outstanding
during the year
Investments outstanding and
maximum balance during the year
Subsidiaries
2019-20
Apollo Tyres Cooperatief U.A - - 23,973.19
Apollo Tyres (Green Field) B.V. - - 2.74
2018-19
Apollo Tyres Cooperatief U.A - 5,907.91 22,263.99
Apollo Tyres (Green Field) B.V. - 917.75 2.74
Associates
2019-20
KT Telematic Solutions Private Limited - - 45.01
2018-19
KT Telematic Solutions Private Limited - - 45.01

231Annual Report 2019-20
Statutory ReportsCorporate Overview Financial Statements
23 SEGMENT REPORTING
The Company has opted to provide segment information in its consolidated Ind AS financial statements in accordance with para 4 of Ind AS 108 - Operating Segments.
24 EVENTS AFTER THE BALANCE SHEET DATE
During the current year, the Company has entered into an agreement with Emerald Sage Investment Ltd (an affiliate of Warburg Pincus LLC) to issue 108,000,000 6.34% Compulsorily Convertible Preference Shares (CCPS) having a face value of ` 100 each, at par, for cash, by way of preferential allotment on a private placement basis. The Members of the Company approved the issue of CCPS through its Extraordinary General Meeting held on March 23, 2020. Subsequent to year end, the Company has allotted 54,000,000 CCPS (Tranche 1) and the balance 54,000,000 CCPS (Tranche 2) will be issued on or before October 07, 2020.
25 INFORMATION ON DETAILS OF LOANS, GUARANTEES AND INVESTMENTS UNDER SECTION 186 OF THE ACT READ WITH COMPANIES (MEETINGS OF BOARD AND ITS POWERS) RULES, 2014
i) Details of investments made are given in note B2.*
ii) Corporate guarantees issued for the loan taken by the subsidiary company and outstanding in accordance with Section 186 of the Act read with rules issued thereunder.
` Million
Particulars 2019-20 2018-19
Apollo Tyres Cooperatief U.A 5,985.86 3,290.41
Total 5,985.86 3,290.41
* All transactions are in the ordinary course of business
26 RECONCILIATION OF LIABILITIES FROM FINANCING ACTIVITIES
Effective April 01, 2017, the Company adopted the amendment to Ind AS-7, which require the entities to provide disclosures that enable users of financial statements to evaluate changes in liabilities arising from financing activities, including both changes arising from cash flows and non-cash changes, suggesting inclusion of a reconciliation between the opening and closing balances in the Balance Sheet for liabilities arising from financing activities, to meet the disclosure requirements. The required disclosure are presented below:
` Million
ParticularsAs on
April 01, 2019
Cash flows
Non cash changesAs on
March 31, 2020
Foreign exchange
movement*
Interest expense
New leases Others
Non-current borrowings (including current maturities)
24,577.71 7,151.90 1,079.98 - - (54.93) 32,754.66
Current borrowings 2,925.07 8,255.62 - - - - 11,180.69
Lease liability 6,473.04 (1,358.54) - 499.75 594.00 (70.45) 6,137.80
` Million
ParticularsAs on
April 01, 2018
Cash flows
Non cash changesAs on
March 31, 2019
Foreign exchange
movement*
Interest expense
New leases Others
Non-current borrowings (including current maturities)
18,975.21 5,181.44 411.02 - - 10.04 24,577.71
Current borrowings 6,474.24 (3,549.17) - - - - 2,925.07
* Foreign exchange movement is covered by derivative instrument.
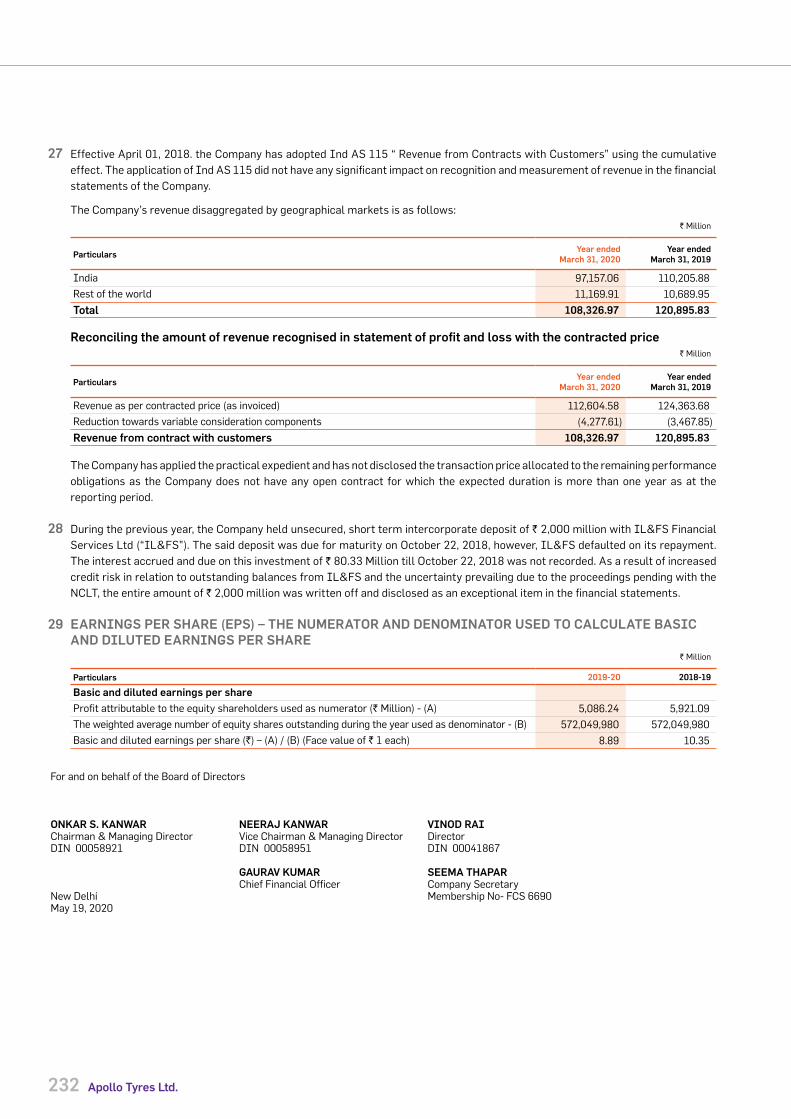
232 Apollo Tyres Ltd.
27 Effective April 01, 2018. the Company has adopted Ind AS 115 “ Revenue from Contracts with Customers” using the cumulative effect. The application of Ind AS 115 did not have any significant impact on recognition and measurement of revenue in the financial statements of the Company.
The Company’s revenue disaggregated by geographical markets is as follows:` Million
ParticularsYear ended
March 31, 2020Year ended
March 31, 2019
India 97,157.06 110,205.88
Rest of the world 11,169.91 10,689.95
Total 108,326.97 120,895.83
Reconciling the amount of revenue recognised in statement of profit and loss with the contracted price` Million
ParticularsYear ended
March 31, 2020Year ended
March 31, 2019
Revenue as per contracted price (as invoiced) 112,604.58 124,363.68
Reduction towards variable consideration components (4,277.61) (3,467.85)
Revenue from contract with customers 108,326.97 120,895.83
The Company has applied the practical expedient and has not disclosed the transaction price allocated to the remaining performance obligations as the Company does not have any open contract for which the expected duration is more than one year as at the reporting period.
28 During the previous year, the Company held unsecured, short term intercorporate deposit of ` 2,000 million with IL&FS Financial Services Ltd (“IL&FS”). The said deposit was due for maturity on October 22, 2018, however, IL&FS defaulted on its repayment. The interest accrued and due on this investment of ` 80.33 Million till October 22, 2018 was not recorded. As a result of increased credit risk in relation to outstanding balances from IL&FS and the uncertainty prevailing due to the proceedings pending with the NCLT, the entire amount of ` 2,000 million was written off and disclosed as an exceptional item in the financial statements.
29 EARNINGS PER SHARE (EPS) – THE NUMERATOR AND DENOMINATOR USED TO CALCULATE BASIC AND DILUTED EARNINGS PER SHARE
` Million
Particulars 2019-20 2018-19
Basic and diluted earnings per share
Profit attributable to the equity shareholders used as numerator (` Million) - (A) 5,086.24 5,921.09
The weighted average number of equity shares outstanding during the year used as denominator - (B) 572,049,980 572,049,980
Basic and diluted earnings per share (`) – (A) / (B) (Face value of ` 1 each) 8.89 10.35
For and on behalf of the Board of Directors
ONKAR S. KANWAR NEERAJ KANWAR VINOD RAIChairman & Managing Director Vice Chairman & Managing Director DirectorDIN 00058921 DIN 00058951 DIN 00041867
GAURAV KUMAR SEEMA THAPARChief Financial Officer Company Secretary
New Delhi Membership No- FCS 6690May 19, 2020