consolidated financial statements - investors · 114 registration document 2011 capgemini statutory...
TRANSCRIPT
http://www.capgemini.com/investor/welcome/
113
6.
6. CONSOLIDATED FINANCIAL STATEMENTS 113
6.1 Statutory auditors’ report
on the consolidated fi nancial statements 114
6.2 Consolidated income statement 115
6.3 Statement of income and expense
recognized in equity 116
6.4 Consolidated statement of fi nancial position 1 1 7
6.5 Consolidated statement of cash fl ows 118
6.6 Consolidated statement of changes in equity 119
6.7 Notes to the consolidated fi nancial statements 120
CONSOLIDATED FINANCIAL STATEMENTS
REGISTRATION DOCUMENT 2011 CAPGEMINI114
Statutory auditor’s report
6. CONSOLIDATED FINANCIAL STATEMENTS
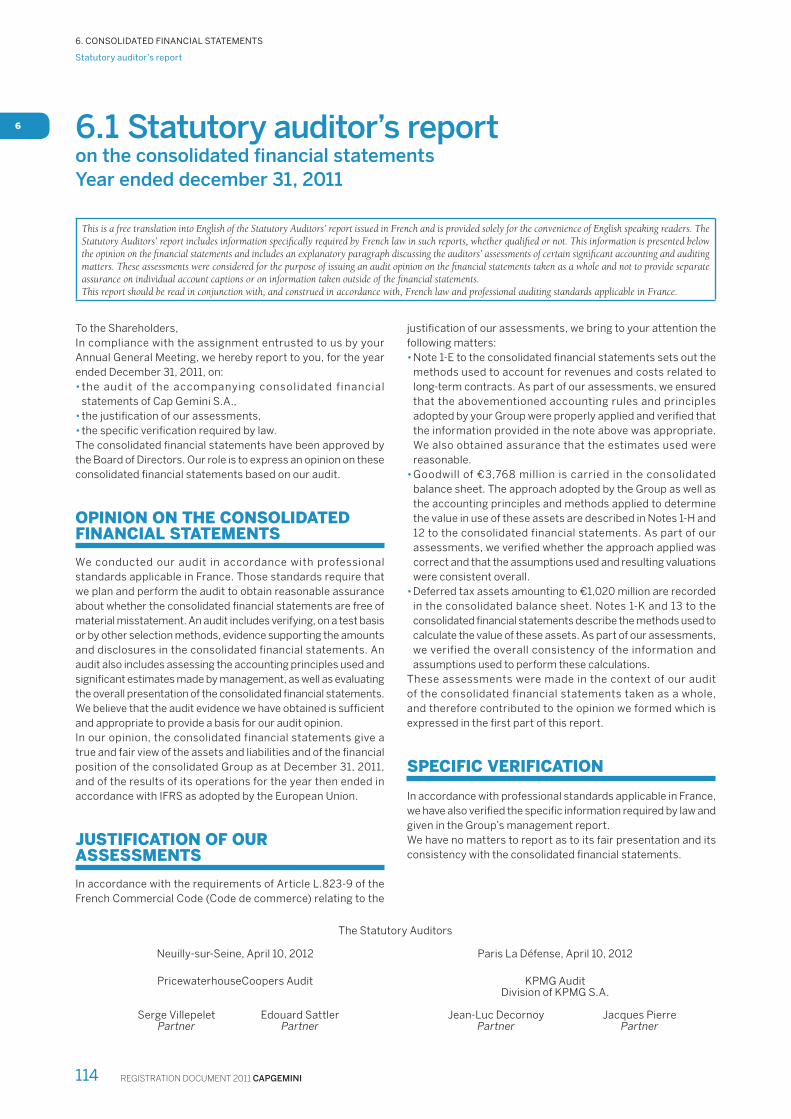
6 6.1 Statutory auditor’s report on the consolidated fi nancial statements
Year ended december 31, 2011
This is a free translation into English of the Statutory Auditors’ report issued in French and is provided solely for the convenience of English speaking readers. The Statutory Auditors’ report includes information specifi cally required by French law in such reports, whether qualifi ed or not. This information is presented below the opinion on the fi nancial statements and includes an explanatory paragraph discussing the auditors’ assessments of certain signifi cant accounting and auditing matters. These assessments were considered for the purpose of issuing an audit opinion on the fi nancial statements taken as a whole and not to provide separate assurance on individual account captions or on information taken outside of the fi nancial statements. This report should be read in conjunction with, and construed in accordance with, French law and professional auditing standards applicable in France.
To the Shareholders,
In compliance with the assignment entrusted to us by your
Annual General Meeting, we hereby report to you, for the year
ended December 31, 2011, on:
• the audit of the accompanying consolidated financial
statements of Cap Gemini S.A.,
• the justifi cation of our assessments,
• the specifi c verifi cation required by law.
The consolidated fi nancial statements have been approved by
the Board of Directors. Our role is to express an opinion on these
consolidated fi nancial statements based on our audit.
OPINION ON THE CONSOLIDATED FINANCIAL STATEMENTS
We conducted our audit in accordance with professional
standards applicable in France. Those standards require that
we plan and perform the audit to obtain reasonable assurance
about whether the consolidated fi nancial statements are free of
material misstatement. An audit includes verifying, on a test basis
or by other selection methods, evidence supporting the amounts
and disclosures in the consolidated financial statements. An
audit also includes assessing the accounting principles used and
signifi cant estimates made by management, as well as evaluating
the overall presentation of the consolidated fi nancial statements.
We believe that the audit evidence we have obtained is suffi cient
and appropriate to provide a basis for our audit opinion.
In our opinion, the consolidated financial statements give a
true and fair view of the assets and liabilities and of the fi nancial
position of the consolidated Group as at December 31, 2011,
and of the results of its operations for the year then ended in
accordance with IFRS as adopted by the European Union.
JUSTIFICATION OF OUR ASSESSMENTS
In accordance with the requirements of Article L.823-9 of the
French Commercial Code (Code de commerce) relating to the
justifi cation of our assessments, we bring to your attention the
following matters:
• Note 1-E to the consolidated fi nancial statements sets out the
methods used to account for revenues and costs related to
long-term contracts. As part of our assessments, we ensured
that the abovementioned accounting rules and principles
adopted by your Group were properly applied and verifi ed that
the information provided in the note above was appropriate.
We also obtained assurance that the estimates used were
reasonable.
• Goodwill of €3,768 million is carried in the consolidated
balance sheet. The approach adopted by the Group as well as
the accounting principles and methods applied to determine
the value in use of these assets are described in Notes 1-H and
12 to the consolidated financial statements. As part of our
assessments, we verifi ed whether the approach applied was
correct and that the assumptions used and resulting valuations
were consistent overall.
• Deferred tax assets amounting to €1,020 million are recorded
in the consolidated balance sheet. Notes 1-K and 13 to the
consolidated fi nancial statements describe the methods used to
calculate the value of these assets. As part of our assessments,
we verified the overall consistency of the information and
assumptions used to perform these calculations.
These assessments were made in the context of our audit
of the consolidated financial statements taken as a whole,
and therefore contributed to the opinion we formed which is
expressed in the fi rst part of this report.
SPECIFIC VERIFICATION
In accordance with professional standards applicable in France,
we have also verifi ed the specifi c information required by law and
given in the Group’s management report.
We have no matters to report as to its fair presentation and its
consistency with the consolidated fi nancial statements.
The Statutory Auditors
Neuilly-sur-Seine, April 10, 2012 Paris La Défense, April 10, 2012
PricewaterhouseCoopers Audit KPMG AuditDivision of KPMG S.A.
Serge Villepelet Edouard Sattler Jean-Luc Decornoy Jacques Pierre Partner Partner Partner Partner

CAPGEMINI REGISTRATION DOCUMENT 2011 115
Consolidated income statement
6. CONSOLIDATED FINANCIAL STATEMENTS
6 6.2 Consolidated income statement
Note 2009 2010 2011
in millions of euros Amount % Amount % Amount %
Revenues 3 8,371 100 8,697 100 9,693 100
Cost of services rendered 4 (6,366) (76.1) (6,631) (76.2) (7,425) (76.6)
Selling expenses 4 (629) (7.5) (680) (7.8) (746) (7.7)
General and administrative expenses 4 (781) (9.3) (799) (9.2) (809) (8.3)
Operating margin 595 7.1 587 6.8 713 7.4
Other operating income 5 7 0.1 6 0.1 - -
Other operating expenses 5 (269) (3.2) (104) (1.3) (118) (1.3)
Operating profit 333 4.0 489 5.6 595 6.1
Income from cash equivalents and cash management assets
6 22 0.3 20 0.3 23 0.2
Gross finance costs 6 (65) (0.8) (74) (0.9) (88) (0.9)
Net finance costs 6 (43) (0.5) (54) (0.6) (65) (0.7)
Other financial income 6 75 0.9 22 0.2 64 0.7
Other financial expense 6 (125) (1.6) (55) (0.6) (104) (1.1)
Net financial expense (93) (1.2) (87) (1.0) (105) (1.1)
Income tax expense 7 (61) (0.7) (124) (1.4) (101) (1.0)
Share of profit of associates (1) - - - - -
PROFIT FOR THE YEAR 178 2.1 278 3.2 389 4.0
Attributable to: Owners of the Company 178 2.1 280 3.2 404 4.2
Non-controlling interests - - (2) - (15) (0.2)
EARNINGS PER SHARE (in euros)
Basic earnings per share 8 1.23 1.83 2.63
Diluted earnings per share 8 1.22 1.74 2.49
REGISTRATION DOCUMENT 2011 CAPGEMINI116
Statement of income and expense recognized in equity
6. CONSOLIDATED FINANCIAL STATEMENTS
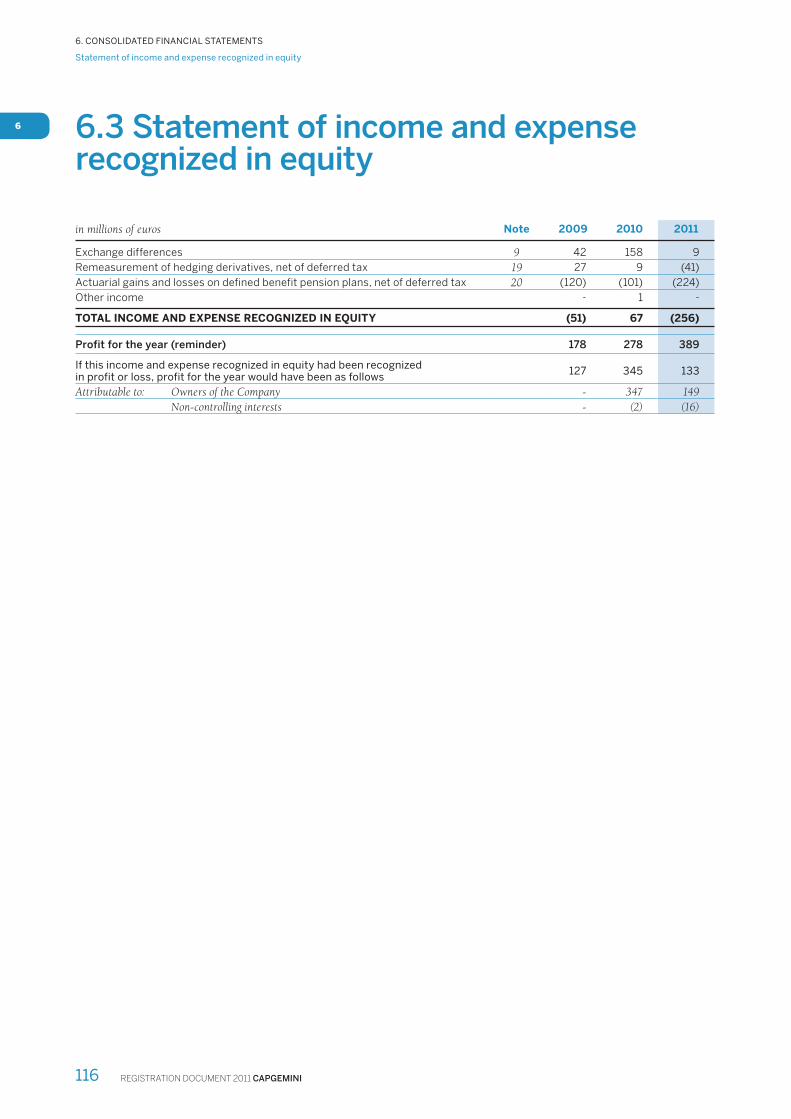
6 6.3 Statement of income and expense recognized in equity
in millions of euros Note 2009 2010 2011
Exchange differences 9 42 158 9
Remeasurement of hedging derivatives, net of deferred tax 19 27 9 (41)
Actuarial gains and losses on defined benefit pension plans, net of deferred tax 20 (120) (101) (224)
Other income - 1 -
TOTAL INCOME AND EXPENSE RECOGNIZED IN EQUITY (51) 67 (256)
Profit for the year (reminder) 178 278 389
If this income and expense recognized in equity had been recognized in profit or loss, profit for the year would have been as follows
127 345 133
Attributable to: Owners of the Company - 347 149
Non-controlling interests - (2) (16)
CAPGEMINI REGISTRATION DOCUMENT 2011 117
Consolidated statement of fi nancial position
6. CONSOLIDATED FINANCIAL STATEMENTS
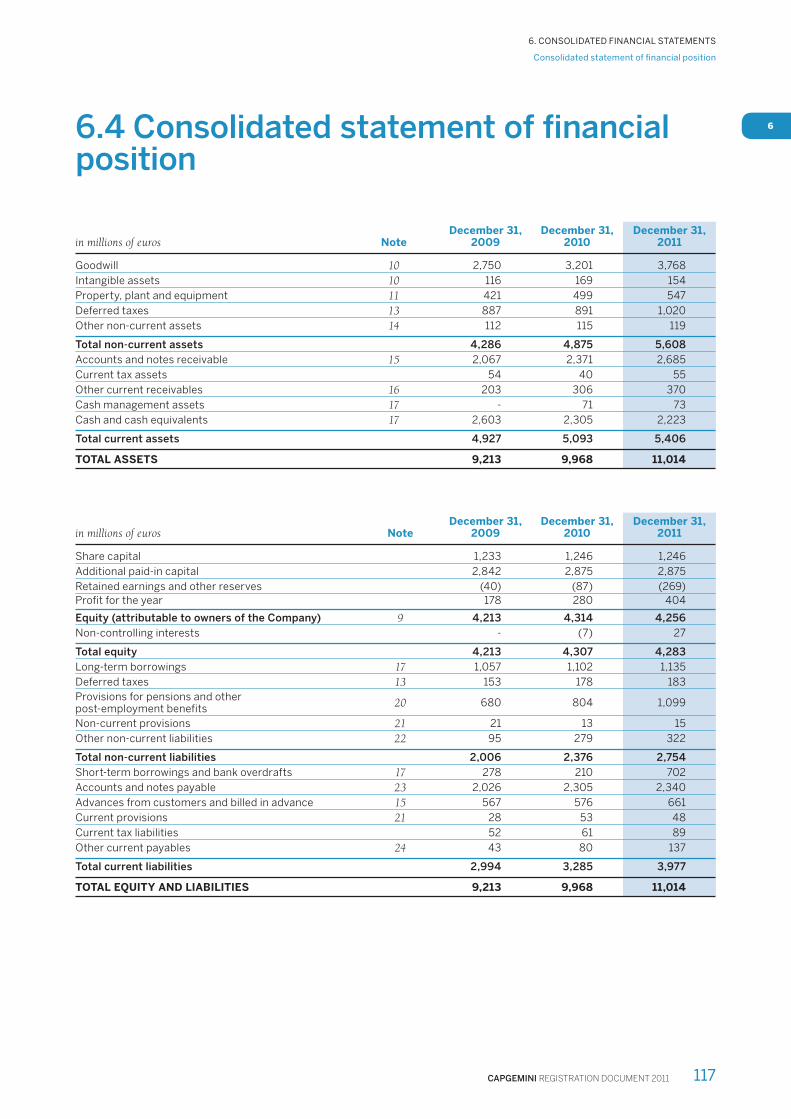
66.4 Consolidated statement of fi nancial position
in millions of euros NoteDecember 31,
2009December 31,
2010December 31,
2011
Goodwill 10 2,750 3,201 3,768
Intangible assets 10 116 169 154
Property, plant and equipment 11 421 499 547
Deferred taxes 13 887 891 1,020
Other non-current assets 14 112 115 119
Total non-current assets 4,286 4,875 5,608
Accounts and notes receivable 15 2,067 2,371 2,685
Current tax assets 54 40 55
Other current receivables 16 203 306 370
Cash management assets 17 - 71 73
Cash and cash equivalents 17 2,603 2,305 2,223
Total current assets 4,927 5,093 5,406
TOTAL ASSETS 9,213 9,968 11,014
in millions of euros NoteDecember 31,
2009December 31,
2010December 31,
2011
Share capital 1,233 1,246 1,246
Additional paid-in capital 2,842 2,875 2,875
Retained earnings and other reserves (40) (87) (269)Profit for the year 178 280 404
Equity (attributable to owners of the Company) 9 4,213 4,314 4,256
Non-controlling interests - (7) 27
Total equity 4,213 4,307 4,283
Long-term borrowings 17 1,057 1,102 1,135
Deferred taxes 13 153 178 183
Provisions for pensions and other post-employment benefits
20 680 804 1,099
Non-current provisions 21 21 13 15
Other non-current liabilities 22 95 279 322
Total non-current liabilities 2,006 2,376 2,754
Short-term borrowings and bank overdrafts 17 278 210 702
Accounts and notes payable 23 2,026 2,305 2,340
Advances from customers and billed in advance 15 567 576 661
Current provisions 21 28 53 48
Current tax liabilities 52 61 89
Other current payables 24 43 80 137
Total current liabilities 2,994 3,285 3,977
TOTAL EQUITY AND LIABILITIES 9,213 9,968 11,014
REGISTRATION DOCUMENT 2011 CAPGEMINI118
Consolidated statement of cash fl ows
6. CONSOLIDATED FINANCIAL STATEMENTS
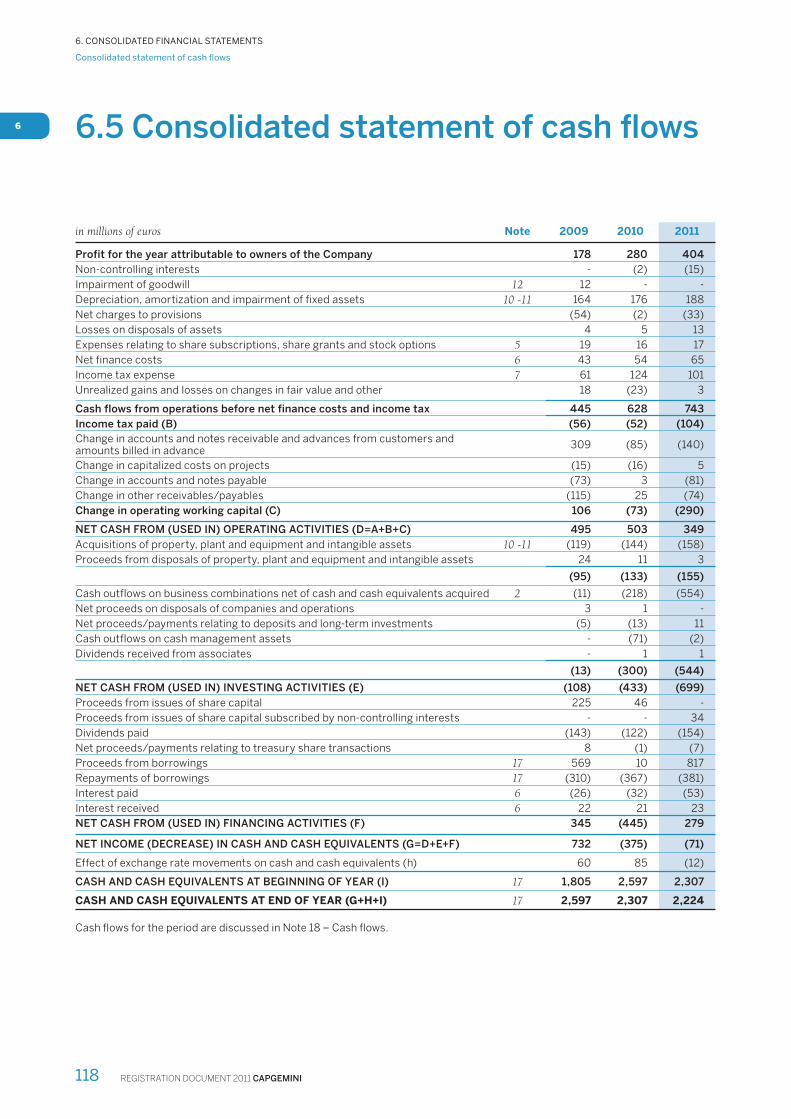
6 6.5 Consolidated statement of cash fl ows
in millions of euros Note 2009 2010 2011
Profit for the year attributable to owners of the Company 178 280 404
Non-controlling interests - (2) (15)
Impairment of goodwill 12 12 - -
Depreciation, amortization and impairment of fixed assets 10 -11 164 176 188
Net charges to provisions (54) (2) (33)
Losses on disposals of assets 4 5 13
Expenses relating to share subscriptions, share grants and stock options 5 19 16 17
Net finance costs 6 43 54 65
Income tax expense 7 61 124 101
Unrealized gains and losses on changes in fair value and other 18 (23) 3
Cash flows from operations before net finance costs and income tax 445 628 743
Income tax paid (B) (56) (52) (104)
Change in accounts and notes receivable and advances from customers and amounts billed in advance
309 (85) (140)
Change in capitalized costs on projects (15) (16) 5
Change in accounts and notes payable (73) 3 (81)
Change in other receivables/payables (115) 25 (74)
Change in operating working capital (C) 106 (73) (290)
NET CASH FROM (USED IN) OPERATING ACTIVITIES (D=A+B+C) 495 503 349
Acquisitions of property, plant and equipment and intangible assets 10 -11 (119) (144) (158)
Proceeds from disposals of property, plant and equipment and intangible assets 24 11 3
(95) (133) (155)
Cash outflows on business combinations net of cash and cash equivalents acquired 2 (11) (218) (554)
Net proceeds on disposals of companies and operations 3 1 -
Net proceeds/payments relating to deposits and long-term investments (5) (13) 11
Cash outflows on cash management assets - (71) (2)
Dividends received from associates - 1 1
(13) (300) (544)
NET CASH FROM (USED IN) INVESTING ACTIVITIES (E) (108) (433) (699)
Proceeds from issues of share capital 225 46 -
Proceeds from issues of share capital subscribed by non-controlling interests - - 34
Dividends paid (143) (122) (154)
Net proceeds/payments relating to treasury share transactions 8 (1) (7)
Proceeds from borrowings 17 569 10 817
Repayments of borrowings 17 (310) (367) (381)
Interest paid 6 (26) (32) (53)
Interest received 6 22 21 23
NET CASH FROM (USED IN) FINANCING ACTIVITIES (F) 345 (445) 279
NET INCOME (DECREASE) IN CASH AND CASH EQUIVALENTS (G=D+E+F) 732 (375) (71)
Effect of exchange rate movements on cash and cash equivalents (h) 60 85 (12)
CASH AND CASH EQUIVALENTS AT BEGINNING OF YEAR (I) 17 1,805 2,597 2,307
CASH AND CASH EQUIVALENTS AT END OF YEAR (G+H+I) 17 2,597 2,307 2,224
Cash fl ows for the period are discussed in Note 18 – Cash fl ows.

CAPGEMINI REGISTRATION DOCUMENT 2011 119
Consolidated statement of changes in equity
6. CONSOLIDATED FINANCIAL STATEMENTS
6 6.6 Consolidated statement of changes in equity
in millions of euros Note
Number of
shares
Share
capital
Additional
paid-in
capital
Treasury
shares
Con-
solidated
retained
earnings
and other
reserves
Total income and
expense recognized
in equity
Equity
(attribut-
able to
owners
of the
Com-
pany)
Non-
controlling
interests (1)
Total
equity
Translation
adjust-
ments Other
At January 1, 2009 145,844,938 1,167 2,689 (84) 628 (277) (184) 3,939 - 3,939
Dividends paid out for 2008
- - - - (143) - - (143) - (143)
OCEANE bonds 17 - - - - 39 - - 39 - 39
Incentive instruments and employee share ownership
9 8,332,458 66 153 - 25 - - 244 - 244
Treasury shares 9 - - - 5 2 - - 7 - 7
Transactions with shareholders
8,332,458 66 153 5 (77) - - 147 - 147
Income and expense recognized in equity
- - - - - 42 (93) (51) - (51)
Profit for the year - - - - 178 - - 178 - 178
At December 31, 2009 154,177,396 1,233 2,842 (79) 729 (235) (277) 4,213 - 4,213
Dividends paid out for 2009
- - - - (122) - - (122) - (122)
Incentive instruments and employee share ownership
9 1,592,966 13 33 - 15 - - 61 - 61
Put option granted to CPM Braxis minority shareholders (43.94%)
2 - - - - (185) - - (185) (5) (190)
Treasury shares 9 - - - (2) 2 - - - - -Transactions with shareholders
- 13 33 (2) (290) - - (246) (5) (251)
Income and expense recognized in equity
- - - - - 158 (91) 67 - 67
Profit for the year - - - - 280 - - 280 (2) 278
At December 31, 2010 155,770,362 1,246 2,875 (81) 719 (77) (368) 4,314 (7) 4,307
Dividends paid out for 2010
- - - - (154) - - (154) - (154)
Incentive instruments and employee share ownership
9 - - - - 17 - - 17 - 17
Adjustments to the put option granted to CPM Braxis minority shareholders and changes in percentage interest
2 - - - - (64) - - (64) 50 (14)
Treasury shares 9 - - - (3) (3) - - (6) - (6)Transactions with shareholders
- - - (3) (204) - - (207) 50 (157)
Income and expense recognized in equity
- - - - - 10 (265) (255) (1) (256)
Profit for the year - - - - 404 - - 404 (15) 389
At December 31, 2011 155,770,362 1,246 2,875 (84) 919 (67) (633) 4,256 27 4,283
(1) In 2009, non-controlling interests were negligible. The main movements in 2010 and 2011 concern non–controlling interests in CPM Braxis, acquired on October 6, 2010. See Note 2 – Changes in Group structure.
REGISTRATION DOCUMENT 2011 CAPGEMINI120
Notes to the consolidated fi nancial statements
6. CONSOLIDATED FINANCIAL STATEMENTS
6
6.7 Notes to the consolidated fi nancial statements for the year ended december 31, 2011
Note 1 – Accounting policies ................................................ 120
Note 2 – Changes in group structure .................................... 128
Note 3 – Revenues................................................................ 131
Note 4 – Operating expenses by nature ............................... 131
Note 5 – Other operating income and expense ..................... 132
Note 6 – Net fi nancial expense ............................................ 132
Note 7 – Income tax expense ............................................... 133
Note 8 – Earnings per share ................................................. 134
Note 9 – Equity .................................................................... 135
Note 10 – Goodwill and intangible assets ............................. 140
Note 11 – Property, plant and equipment .............................141
Note 12 - Asset impairment tests ......................................... 142
Note 13 – Deferred taxes ..................................................... 143
Note 14 – Other non-current assets ..................................... 145
Note 15 – Accounts and notes receivable .............................. 146
Note 16 – Other current receivables ......................................147
Note 17 – Net cash and cash equivalents ...............................147
Note 18 – Cash fl ows ........................................................... 152
Note 19 – Derivative instruments and currency
and interest rate risk management....................... 154
Note 20 – Provisions for pensions and other
post-employment benefi ts .................................... 157
Note 21 – Current and non-current provisions .................... 162
Note 22 – Other non-current liabilities ................................ 162
Note 23 – Accounts and notes payable ................................. 163
Note 24 – Other current payables ........................................ 163
Note 25 – Operating segments ............................................. 163
Note 26 – Number of employees ...........................................170
Note 27 – Off-balance sheet commitments ............................170
Note 28 – Related-party transactions .................................. 172
Note 29 – Subsequent events ................................................ 172
Note 30 – List of the main consolidated companies
by country ........................................................... 173
NOTE 1 – ACCOUNTING POLICIES
The consolidated financial statements for the year ended
December 31, 2011 and the notes thereto were approved by
the Board of Directors on February 15, 2012. The consolidated
fi nancial statements become defi nitive after their approval by
the Combined Shareholders’ Meeting, scheduled for May 24,
2012.
Accounting basis
IFRS standards-base
Pursuant to European Commission Regulation No.1606/2002
of July 19, 2002, the 2011 consolidated financial statements
have been prepared in accordance with international accounting
standards (IFRS, International Financial Reporting Standards)
issued by the International Accounting Standards Board (IASB),
endorsed by the European Union at December 31, 2011 and
published in the Offi cial Journal of the European Union.
The Group also takes account of the positions adopted by Syntec
Informatique, an organization representing major consulting
and computer services companies in France, regarding the
application of certain IFRSs.
New standards and interpretations applicable in 2011
New standards, amendments and interpretations of mandatory
application (published by the IASB, endorsed by the EU, entered
into effect on January 1, 2011)
The accounting policies applied by the Group are unchanged
on those applied for the preparation of the 2010 consolidated
financial statements, with the exception of new standards,
amendments and interpretations which entered into effect on
January 1, 2011.
These standards, amendments and interpretations of
mandatory effect did not impact the Group fi nancial statements.
New standards, amendments and interpretations not adopted
early (published by the IASB, endorsed by the EU, not yet in
effect at January 1, 2011)
During fiscal year 2011, no new standard, amendment or
interpretation was published by the IASB, endorsed by the
European Union and entered into effect at January 1, 2011.
New standards, amendments and interpretations not yet
endorsed (published by the IASB, not yet endorsed by the EU,
not yet in effect at January 1, 2011)
The Group did not elect to adopt early the standards,
amendments, and interpretations published by the IASB but
not yet endorsed by the European Union at December 31, 2011
or in effect at January 1, 2011.
In June 2011, the IASB published amendments to IAS 19,
Employee Benefi ts, which include, in particular, the requirement
to measure the expected return on plan assets on a standardized
base (through the discount rate used to measure the obligation),
which will impact the net financial expense. In addition, the
impact of past services costs will be recognized in profi t or loss
in the year of the plan amendment and/or the arrival of new
participants.
The suppression of the “corridor” method by the amendment will
not impact the Group fi nancial statements, as net actuarial gains
and losses of the period are already recorded in the amount of
the provision for pensions through an adjustment to equity.
The early adoption of the other standards, amendments and
interpretations would not have had a material impact on the 2011
consolidated fi nancial statements.

CAPGEMINI REGISTRATION DOCUMENT 2011 121
Notes to the consolidated fi nancial statements
6. CONSOLIDATED FINANCIAL STATEMENTS
6
Use of estimates
The preparation of fi nancial statements involves the use of estimates
and assumptions which may have an impact on the reported values
of assets and liabilities at the period end or on certain items of either
the net profi t or the income and expenses recognized directly in
equity for the year. Estimates are based on economic data and
assumptions which are likely to vary over time and are subject to a
degree of uncertainty. They mainly concern revenue recognition on
fi xed-price contracts accounted for on a percentage-of-completion
basis, recognition of deferred tax assets, measurement of the
recoverable amount of assets, pensions and other post-employment
benefi t obligations, the fair value of derivatives, and current and
non-current provisions.
Overview of the main accounting policies adopted by Capgemini Group
A) Consolidation methods
The accounts of companies directly or indirectly controlled
by Cap Gemini S.A. are fully consolidated. Cap Gemini S.A. is
deemed to exercise control over an entity when it has the power
to govern the fi nancial and operating policies of the entity so as
to obtain benefi ts from its activities.
Investments in companies which Cap Gemini S.A. directly
or indirectly controls jointly with a limited number of other
shareholders are accounted for by the method of proportionate
consolidation. This method consists of consolidating the income
and expenses and assets and liabilities of jointly-controlled
companies on a line-by-line basis, based on the Group’s
percentage interest in their capital.
Investments in associates over whose management Cap Gemini
S.A. directly or indirectly exercises signifi cant infl uence, without
however exercising full or joint control, are accounted for by
the equity method. This method consists of recording the
Group’s share in profi t for the year of the associate in the Income
Statement. The Group’s share in net assets of the associate is
recorded under “Other non-current assets” in the Consolidated
Statement of Financial Position.
Details of the scope of consolidation are provided in Note 30 –
List of the main consolidated companies by country.
All consolidated companies prepared their accounts at
December 31, 2011 in accordance with the accounting policies
adopted by the Group.
Inter-company transactions are eliminated on consolidation, as
well as inter-company profi ts.
The Group does not control any special purpose entities that
have not been consolidated.
B) Foreign currency translation
The consolidated fi nancial statements presented in this report
have been prepared in euros.
The Consolidated Statements of Financial Position of
subsidiaries denominated in foreign currencies are translated
into euros at year-end rates of exchange with the exception of
equity accounts, which are carried at their historical values.
Income statements denominated in foreign currencies are
translated into euros at the average rates of exchange for the
year. However, for certain material transactions, it may be
relevant to use a specifi c rate of exchange. Differences arising
from translation at these different rates are recognized directly
in equity under “Translation reserves” and have no impact on
the Income Statement.
Exchange differences arising on monetary items which form
an integral part of the net investment in foreign subsidiaries
are recognized in equity under “Translation reserves” for their
net-of- tax amount.
Exchange differences on receivables and payables denominated
in a foreign currency are recorded in operating income or
expense or fi nancial income or expense, depending on the type
of transaction concerned.
The exchange rates used to translate the fi nancial statements of the Group’s main subsidiaries into euros are as follows:
Average exchange rates Year-end exchange rates
2009 2010 2011 2009 2010 2011
US dollar 0.71958 0.75513 0.71920 0.69745 0.75301 0.77286
Pound sterling 1.12282 1 . 16610 1 .1 5272 1.10619 1.16252 1 .19717
Canadian dollar 0.6 3110 0.7 3312 0.72716 0.66494 0.75330 0.75672
Swedish krona 0.09423 0.10485 0. 1 1079 0.09713 0.11095 0. 1 1221
Australian dollar 0.56623 0.69368 0.74193 0.62360 0.76458 0.78598
Norwegian krona 0.1 1465 0.1 2492 0.1 2832 0.12016 0.12789 0.12897
Indian rupee 0.01487 0.01652 0.01544 0.01491 0.01676 0.01455
Polish zloty 0.23133 0.25039 0.24340 0.24243 0.25221 0.22432
Brazilian real 0.36233 0.42919 0.43031 0.40106 0.45082 0.41392

REGISTRATION DOCUMENT 2011 CAPGEMINI122
Notes to the consolidated fi nancial statements
6. CONSOLIDATED FINANCIAL STATEMENTS
6
C) Consolidated income statement
Income and expense are presented in the Consolidated Income
Statement by function to reflect the specific nature of the
Group’s business more accurately. Operating expenses are
broken down into cost of services rendered (corresponding
to costs incurred for the execution of client projects), selling
expenses, and general and administrative expenses.
These three captions represent ordinary operating expenses
which are deducted from revenues to obtain operating margin,
one of the main Group business performance indicators.
Operating profit is obtained by deducting other operating
income and expenses from operating margin. Other operating
income and expenses include the charge resulting from the
deferred recognition of the fair value of shares and stock
options granted to employees, and non-recurring revenues
and expenses, notably impairment of goodwill, capital gains or
losses on disposals of consolidated companies or businesses,
restructuring costs incurred under a detailed formal plan
approved by the Group’s management, the cost of acquiring
and integrating companies acquired by the Group, and the
effects of curtailments and settlements relating to defined
benefi t pension plans.
Profi t for the year is then obtained by taking into account the
following items:
• net fi nance costs, including interest on borrowings calculated
using the effective interest rate, less income from cash and
cash equivalents;
• other f inancial income and expense, which primarily
correspond to the impact of remeasuring fi nancial instruments
at fair value when these relate to items of a fi nancial nature,
disposal gains and losses and the impairment of investments
in non-consolidated companies, net interest costs on
defi ned benefi t pension plans, exchange gains and losses on
financial items, and other financial income and expense on
miscellaneous fi nancial assets and liabilities calculated using
the effective interest rate;
• current and deferred income tax expense;
• share of profi t of associates;
• share of non-controlling interests.
D) Earnings per share
Earnings per share are measured as follows:
• basic earnings per share are calculated by dividing profi t or loss
attributable to owners of the Company by the weighted average
number of ordinary shares outstanding during the period,
excluding treasury shares. The weighted average number
of ordinary shares outstanding is adjusted by the number of
ordinary shares bought back or issued during the period and
is calculated by reference to the date of redemption or issue of
shares during the year;
• diluted earnings per share are calculated by dividing profi t or
loss attributable to owners of the Company by the weighted
average number of ordinary shares outstanding as used to
calculate basic earnings per share, both items being adjusted,
where appropriate, for the effects of all potential dilutive
fi nancial instruments corresponding to (i) stock subscription
options, (ii) bonds convertible/exchangeable into new or
existing Cap Gemini S.A. shares, (iii) redeemable share
subscription or purchase warrants and (iv) performance shares.
E) Recognition of revenues and the cost of services
rendered
The method for recognizing revenues and costs depends on the
nature of the services rendered:
a) Time and materials contracts
Revenues and cost of services are recognized as services are
rendered.
b) Long-term fi xed-price contracts
Revenues, including systems development and integration
contracts, are recognized using the “percentage-of-completion”
method. Costs are recognized as they are incurred.
c) Outsourcing contracts
Revenues from outsourcing agreements are recognized over
the term of the contract as the services are rendered. When the
services are made up of different components which are not
separately identifi able, the related revenues are recognized on
a straight-line basis over the term of the contract.
The related costs are recognized as they are incurred. However,
a portion of costs incurred in the initial phase of outsourcing
contracts (transition and/or transformation costs) may be
deferred when they are specific to a given contract, relate
to future activity on the contract and/or will generate future
economic benefits, and are recoverable. These costs are
allocated to work-in-progress and any reimbursement by the
client is recorded as a deduction from the costs incurred.
When the projected cost of the contract exceeds contract
revenues, a loss to completion is recognized in the amount of
the difference.
Revenues receivable from these contracts are recognized
in the Consolidated Statement of Financial Position under
“Accounts and notes receivable” when invoiced to customers
and “Accrued income” when they are not yet invoiced. Advances
from customers and billed in advance are included in current
liabilities.
F) Goodwill and intangible assets
a) Goodwill and business combinations
Since January 1, 2010, business combinations are accounted for
using the acquisition method. Under this method, the identifi able
assets acquired and liabilities assumed are recognized at fair
value at the acquisition date and may be adjusted during the
12 months following this date.
Goodwill represents the excess of the acquisition price over the
net fair value of the identifi able assets and liabilities assumed of
the acquiree (revalued net assets). Where an acquisition confers
control with remaining non-controlling interests (acquisition of
CAPGEMINI REGISTRATION DOCUMENT 2011 123
Notes to the consolidated fi nancial statements
6. CONSOLIDATED FINANCIAL STATEMENTS
6
less than 100%), the Group elects either to recognize goodwill
on the full amount of revalued net assets, including the share
attributable to non-controlling interests (full goodwill method,
in force since January 1, 2010) or on the share in revalued net
assets effectively acquired only (partial goodwill method).
When a business combination with residual non-controlling
interests provides for the grant of a put option to these non-
controlling interests, an operating liability is recognized in this
respect in the Consolidated Statement of Financial Position
through a reduction in reserves. Changes in this put option
resulting from any changes in estimates or the unwinding of the
discount will also be recognized through reserves. Any additional
acquisitions of non-controlling interests are considered a
transaction with shareholders and, as such, are not remeasured.
When the cost of a business combination is less than the
fair value of the assets acquired and liabilities assumed, the
difference is recognized immediately in the Income Statement.
Acquisition-related costs are expensed in the Income Statement
in the year incurred in “Other operating expenses”.
Goodwill is not amortized but tested for impairment at least
annually, or more frequently when events or changes in
circumstances indicate that it may be impaired.
b) Intangible assets
Computer software and user rights acquired on an unrestricted
ownership basis, as well as software developed for internal use
which has a positive, lasting and quantifiable effect on future
results, are capitalized and amortized over three to fi ve years.
The capitalized costs of software developed for internal use
represent costs that relate directly to its production, i.e. the salary
costs of the staff that developed the relevant software.
Finally, on certain business combinations, where the nature
of the customer portfolio held by the entity and the nature of
the business performed, should enable the entity to continue
commercial relations with its customers as a result of efforts
to build customer loyalty, customer relationships are valued in
intangible assets and amortized over the known term of contracts
held in portfolio at the acquisition date.
G) Property, plant and equipment
The carrying amount of property, plant and equipment is
recorded in assets in the Consolidated Statement of Financial
Position and corresponds to the historical cost of these items,
less accumulated depreciation and any impairment. No items
of property, plant and equipment have been revalued. Buildings
owned by the Group are measured based on the components
approach.
Subsequent expenditure (costs of replacing and/or bringing
assets into compliance) are capitalized and depreciated over
the remaining useful lives of the relevant assets. Ongoing
maintenance costs are expensed as incurred.
Depreciation is calculated on a straight-line basis over the
estimated useful lives of the relevant assets. It is calculated
based on acquisition cost less any residual value.
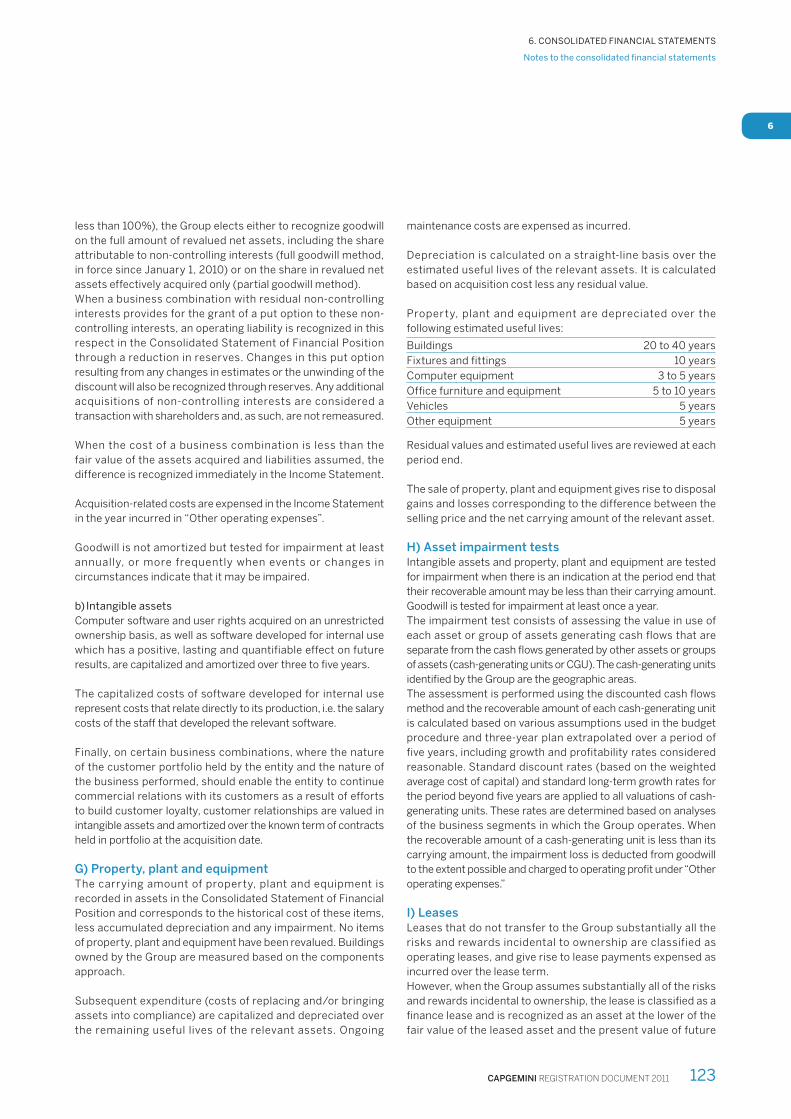
Property, plant and equipment are depreciated over the
following estimated useful lives:
Buildings 20 to 40 years
Fixtures and fittings 10 years
Computer equipment 3 to 5 years
Office furniture and equipment 5 to 10 years
Vehicles 5 years
Other equipment 5 years
Residual values and estimated useful lives are reviewed at each
period end.
The sale of property, plant and equipment gives rise to disposal
gains and losses corresponding to the difference between the
selling price and the net carrying amount of the relevant asset.
H) Asset impairment tests
Intangible assets and property, plant and equipment are tested
for impairment when there is an indication at the period end that
their recoverable amount may be less than their carrying amount.
Goodwill is tested for impairment at least once a year.
The impairment test consists of assessing the value in use of
each asset or group of assets generating cash flows that are
separate from the cash fl ows generated by other assets or groups
of assets (cash-generating units or CGU). The cash-generating units
identifi ed by the Group are the geographic areas.
The assessment is performed using the discounted cash flows
method and the recoverable amount of each cash-generating unit
is calculated based on various assumptions used in the budget
procedure and three-year plan extrapolated over a period of
five years, including growth and profitability rates considered
reasonable. Standard discount rates (based on the weighted
average cost of capital) and standard long-term growth rates for
the period beyond fi ve years are applied to all valuations of cash-
generating units. These rates are determined based on analyses
of the business segments in which the Group operates. When
the recoverable amount of a cash-generating unit is less than its
carrying amount, the impairment loss is deducted from goodwill
to the extent possible and charged to operating profi t under “Other
operating expenses.”
I) Leases
Leases that do not transfer to the Group substantially all the
risks and rewards incidental to ownership are classified as
operating leases, and give rise to lease payments expensed as
incurred over the lease term.
However, when the Group assumes substantially all of the risks
and rewards incidental to ownership, the lease is classifi ed as a
fi nance lease and is recognized as an asset at the lower of the
fair value of the leased asset and the present value of future
REGISTRATION DOCUMENT 2011 CAPGEMINI124
Notes to the consolidated fi nancial statements
6. CONSOLIDATED FINANCIAL STATEMENTS
6
minimum lease payments, with the related obligation recorded
in liabilities within borrowings. The asset is depreciated over the
period during which it is expected to be used by the Group and
the obligation is amortized over the lease term. Deferred tax is
recognized as appropriate.
J) Treasury shares
Cap Gemini S.A. shares held by the Company or by any
consolidated companies are shown as a deduction from equity,
at cost. Any proceeds from sales of treasury shares are taken
directly to equity, net of the tax effect, so that the gain or loss on
the sale has no impact on the Income Statement for the period.
K) Deferred taxes
Deferred taxes are:
• recorded to take account of temporary differences between
the carrying amounts of certain assets and liabilities and their
tax basis;
• recognized in income or expenses in the Income Statement,
in income and expense recognized in equity, or directly in
reserves in the period, depending on the underlying to which
they relate;
• measured taking account of known changes in tax rates (and
tax regulations) adopted or practically adopted at the year-
end. Adjustments for changes in tax rates to deferred taxes
previously recognized in the Income Statement, in income
and expense recognized in equity or directly in reserves are
recognized in the Income Statement, in income and expense
recognized in equity or directly in reserves, respectively, in the
period in which these changes become effective.
Deferred tax assets are recognized when it is probable that
taxable profi ts will be available against which the recognized tax
asset can be utilized. The carrying amount of deferred tax assets
is reviewed at each period end. This amount is reduced to the
extent that it is no longer probable that suffi cient taxable profi t
will be available against which to offset all or part of the deferred
tax asset to be utilized. Any such reduction is reversed when it
becomes probable that suffi cient taxable profi t will be available.
Deferred tax assets and liabilities are offset if, and only if, the
subsidiaries have a legally enforceable right to offset current tax
assets against current tax liabilities, and when the deferred taxes
relate to income taxes levied by the same taxation authority.
L) Financial instruments
Financial instruments consist of:
• fi nancial assets, including certain other non-current assets,
accounts receivable, certain other current receivables, cash
management assets and cash and cash equivalents;
• fi nancial liabilities, including long- and short-term borrowings
and bank overdrafts, certain accounts payable, and certain
other current payables and non-current liabilities.
a) Recognition of fi nancial instruments
Financial instruments are recognized at inception and on
subsequent dates in accordance with the methods described
below. These methods draw on the following interest rate
defi nitions:
• the coupon interest rate or coupon, which is the nominal
interest rate on borrowings;
• the effective interest rate, which is the rate that exactly
discounts the estimated cash fl ows through the expected term
of the instrument, or, where appropriate, a shorter period to the
net carrying amount of the fi nancial asset or liability at initial
recognition. The effective interest rate takes into account all
fees paid or received, transaction costs, and, where applicable,
premiums to be paid and received;
• the market interest rate, which refl ects the effective interest
rate recalculated at the measurement date based on current
market parameters.
Financial instruments (assets and liabilities) are initially
recognized in the Consolidated Statement of Financial Position
at their initial fair value.
The subsequent measurement of fi nancial assets and liabilities
is based on either their fair value or amortized cost depending
on their classifi cation in the Consolidated Statement of Financial
Position. Financial assets measured at amortized cost are
subject to impairment tests as soon as there are indicators of
a loss in value. Any loss in value is recognized in the Income
Statement.
The fair value of a fi nancial instrument is the amount for which
an asset could be exchanged, or a liability settled, between
knowledgeable, willing parties in an arm’s length transaction.
Amortized cost corresponds to the initial carrying amount (net
of transaction costs), plus interest calculated using the effective
interest rate, less cash outflows (coupon interest payments
and repayments of principal, and redemption premiums where
applicable). Accrued interest (income and expense) is not
recorded on the basis of the financial instrument’s nominal
interest rate, but on the basis of its effective interest rate.
Financial instruments (assets and liabilities) are derecognized
when the related risks and rewards of ownership have been
transferred, and when the Group no longer exercises control
over the instruments.
b) Derivative instruments
Derivative instruments mainly comprise forward foreign exchange
contracts and interest rate swaps.
Derivative instruments are initially recognized at fair value. Except
as described below in the case of instruments designated as cash
fl ow hedges, changes in the fair value of derivative instruments,
estimated based on market rates or data provided by bank
counterparties, are recognized in the Income Statement at the
period end.
CAPGEMINI REGISTRATION DOCUMENT 2011 125
Notes to the consolidated fi nancial statements
6. CONSOLIDATED FINANCIAL STATEMENTS
6
When cash fl ow hedges are eligible for hedge accounting, changes
in the fair value of the hedging instruments are recognized fi rstly
in “Income and expense recognized in equity” and subsequently
taken to operating profi t when the hedged item itself impacts the
Income Statement.
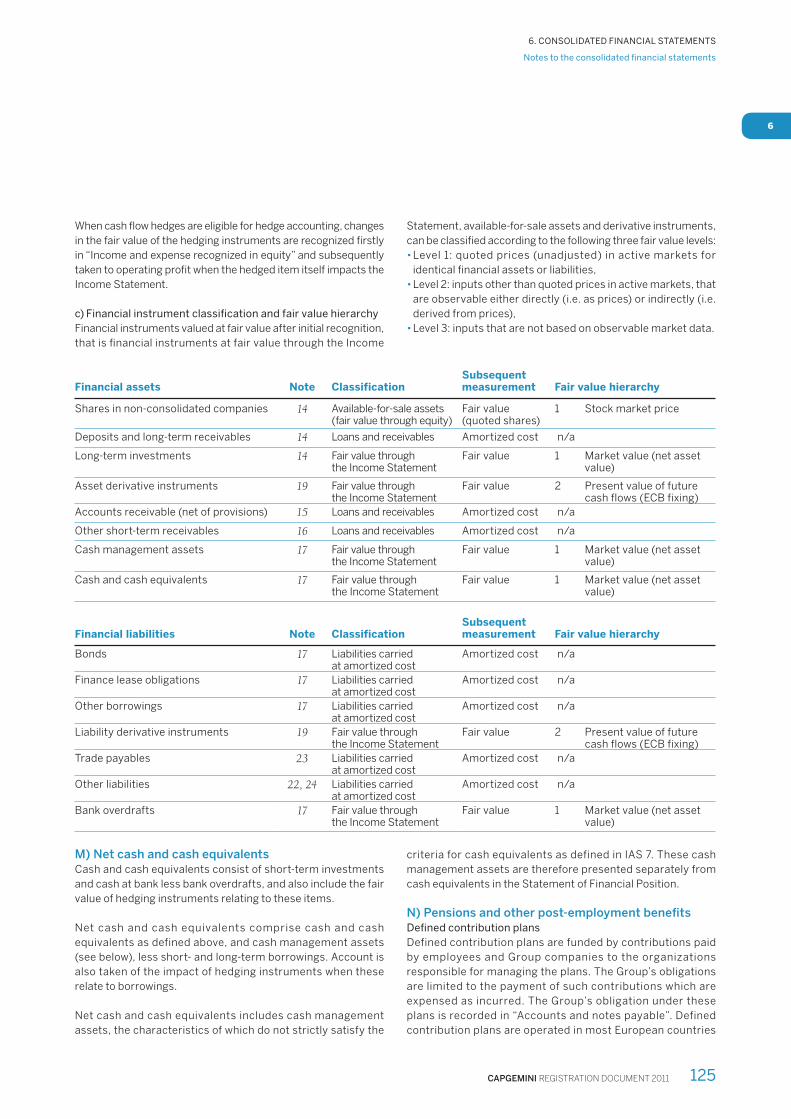
c) Financial instrument classifi cation and fair value hierarchy
Financial instruments valued at fair value after initial recognition,
that is fi nancial instruments at fair value through the Income
Statement, available-for-sale assets and derivative instruments,
can be classifi ed according to the following three fair value levels:
• Level 1: quoted prices (unadjusted) in active markets for
identical fi nancial assets or liabilities,
• Level 2: inputs other than quoted prices in active markets, that
are observable either directly (i.e. as prices) or indirectly (i.e.
derived from prices),
• Level 3: inputs that are not based on observable market data.
Financial assets Note ClassificationSubsequent measurement Fair value hierarchy
Shares in non-consolidated companies 14 Available-for-sale assets(fair value through equity)
Fair value (quoted shares)
1 Stock market price
Deposits and long-term receivables 14 Loans and receivables Amortized cost n/a
Long-term investments 14 Fair value through the Income Statement
Fair value 1 Market value (net asset value)
Asset derivative instruments 19 Fair value through the Income Statement
Fair value 2 Present value of future cash flows (ECB fixing)
Accounts receivable (net of provisions) 15 Loans and receivables Amortized cost n/a
Other short-term receivables 16 Loans and receivables Amortized cost n/a
Cash management assets 17 Fair value through the Income Statement
Fair value 1 Market value (net asset value)
Cash and cash equivalents 17 Fair value through the Income Statement
Fair value 1 Market value (net asset value)
Financial liabilities Note ClassificationSubsequent measurement Fair value hierarchy
Bonds 17 Liabilities carried at amortized cost
Amortized cost n/a
Finance lease obligations 17 Liabilities carried at amortized cost
Amortized cost n/a
Other borrowings 17 Liabilities carried at amortized cost
Amortized cost n/a
Liability derivative instruments 19 Fair value through the Income Statement
Fair value 2 Present value of future cash flows (ECB fixing)
Trade payables 23 Liabilities carried at amortized cost
Amortized cost n/a
Other liabilities 22, 24 Liabilities carried at amortized cost
Amortized cost n/a
Bank overdrafts 17 Fair value through the Income Statement
Fair value 1 Market value (net asset value)
M) Net cash and cash equivalents
Cash and cash equivalents consist of short-term investments
and cash at bank less bank overdrafts, and also include the fair
value of hedging instruments relating to these items.
Net cash and cash equivalents comprise cash and cash
equivalents as defined above, and cash management assets
(see below), less short- and long-term borrowings. Account is
also taken of the impact of hedging instruments when these
relate to borrowings.
Net cash and cash equivalents includes cash management
assets, the characteristics of which do not strictly satisfy the
criteria for cash equivalents as defined in IAS 7. These cash
management assets are therefore presented separately from
cash equivalents in the Statement of Financial Position.
N) Pensions and other post-employment benefi ts
Defi ned contribution plans
Defined contribution plans are funded by contributions paid
by employees and Group companies to the organizations
responsible for managing the plans. The Group’s obligations
are limited to the payment of such contributions which are
expensed as incurred. The Group’s obligation under these
plans is recorded in “Accounts and notes payable”. Defined
contribution plans are operated in most European countries
REGISTRATION DOCUMENT 2011 CAPGEMINI126
Notes to the consolidated fi nancial statements
6. CONSOLIDATED FINANCIAL STATEMENTS
6
(France, the United Kingdom, the Netherlands, Germany and
Central Europe, Nordic countries, Italy and Spain), in the United
States and in the Asia-Pacifi c region.
Defi ned benefi t pension plans
Defi ned benefi t pension plans consist of either:
• unfunded plans, where benefits are paid directly by the
Group and the related obligation is covered by a provision
corresponding to the present value of future benefi t payments.
Estimates are based on regularly reviewed internal and external
assumptions. These unfunded plans correspond mainly to
retirement termination payments and healthcare assistance;
• funded plans, where the benefit obligation is covered by
external funds. Group contributions to these external funds
are made in accordance with the specifi c regulations in force
in each country.
Obligations under these plans are generally determined by
independent actuaries using the projected unit credit method.
Under this method, each period of service gives rise to an
additional unit of benefi t entitlement and each of these units is
valued separately in order to obtain the amount of the Group’s
fi nal obligation.
The resulting obligation is discounted by reference to market
yields on high quality corporate bonds, of a currency and term
consistent with the currency and term of the post-employment
benefi t obligation.
For funded plans, only the estimated funding short-fall is covered
by a provision.
Current and past service costs –corresponding to an increase
in the obligation– are recorded within operating expenses,
respectively on an as-incurred basis in the period and over the
residual vesting period of the relevant rights.
Gains or losses on the curtailment or settlement of defined
benefit pension plans are recognized in “Other operating
income” or “Other operating expenses.”
The impact of discounting pension benefi t obligations as well
as the expected return on plan assets is recorded net in “Other
fi nancial income” or “Other fi nancial expense.”
Actuarial gains and losses correspond to the effect of changes
in actuarial assumptions and experience adjustments (i.e.
differences between projected actuarial assumptions and
actual data) on the amount of the defi ned benefi t obligation or
the value of plan assets. They are recognized in full in “Income
and expense recognized directly in equity” in the year in which
they arise.
O) Incentive instruments and employee share ownership
a) Instruments granted to employees
Stock options
Stock options have been granted to certain Group employees
entitling them to purchase Cap Gemini S.A. shares over a period
of fi ve years, at a strike price set when the options are granted.
Stock options are measured at fair value, corresponding to the
value of the benefi t granted to the employee at the grant date. This
amount is recognized in “Other operating expenses” in the Income
Statement on a straight-line basis over the vesting period, with a
corresponding adjustment to equity.
The fair value of stock options is calculated using the “Black &
Scholes” model, which incorporates assumptions concerning
the option strike price and term, implicit share price volatility and
the risk-free interest rate. The expense recognized also takes into
account staff attrition rates for eligible employee categories which
are reviewed each year.
Performance shares
Performance shares were granted to a certain number of Group
employees, subject to performance and continued employment
conditions, as set out in Note 9 – Equity. Share grants become
defi nitive after a vesting period of two or four years, depending
on the geographic location of the subsidiaries employing the
benefi ciaries.
The shares are measured at fair value, corresponding to the
value of the benefi t granted to the employee at the grant date.
This amount is recognized in “Other operating expenses” in the
Income Statement on a straight-line basis over the vesting period,
with a corresponding adjustment to equity.
The fair value of performance shares is calculated using
the “Monte Carlo” model, which incorporates assumptions
concerning the share price at the grant date, implicit share price
volatility, the risk-free interest rate, the expected dividend yield
and external performance conditions (market conditions).
The expense recognized also takes into account staff attrition
rates for eligible employee categories, which are reviewed
each year, and internal performance conditions (non-market
conditions).
b) Instruments proposed to employees
Redeemable share subscription or purchase warrants (BSAAR)
Redeemable share subscription or purchase warrants were
proposed to employees and corporate officers of the Group.
They confer entitlement to subscribe for Cap Gemini S.A. shares
at a strike price determined at their date of acquisition by the
employees and corporate officers of the Group. The exercise
period commences the date of listing of the BSAAR warrants
on the Euronext Paris market and terminates on the seventh
anniversary of the issue date.
The issue price of these BSAAR warrants is equal to their market
value and no benefi t granted to benefi ciaries is recognized in the
consolidated fi nancial statements of the Company.
CAPGEMINI REGISTRATION DOCUMENT 2011 127
Notes to the consolidated fi nancial statements
6. CONSOLIDATED FINANCIAL STATEMENTS
6
Employee savings plan
A leveraged employee share ownership plan offering the possibility
to subscribe for shares at a discounted preferential rate was
set up by the Group. When determining the IFRS 2 expense
measuring the benefi t granted to employees, the Group adjusts
the amount of the discount granted by the Group to employees on
the subscription price based on the following two items:
• the cost of the non-transferability of shares granted to
employees during a period of fi ve years. This cost is measured
taking account of the fi ve-year lock-in period. It corresponds
to the cost of a two-stage strategy under which the market
participant enters into a forward sale effective at the end of the
fi ve-year lock-in period and simultaneously borrows the amount
necessary to buy a share available for immediate transfer. This
borrowing is fi nanced with the proceeds from the forward sale
of the share and the dividends received during the lock-in period.
This cost is calculated based on the following assumptions:
- the subscription price is set by the Chief Executive Officer
pursuant to the powers delegated by the Board of Directors.
This subscription price is equal to the average Cap Gemini S.A.
share price, adjusted for volume, during the twenty trading days
preceding the decision of the Chief Executive Offi cer, to which
a discount is applied;
- the grant date is the date at which employees are fully informed
of the specifi c characteristics and terms and conditions of the
offer and particularly the subscription price;
- the loan rate granted to employees and used to determine the
cost of the non-transferability of shares, is the rate at which
a bank would grant a consumer loan repayable on maturity
without allocation, to a private individual with an average risk
profi le, for a term corresponding to the term of the plan;
• the opportunity benefit reflecting the possibility granted
to employees to benefit from market terms and conditions
identical to those of the Group.
In those countries where an Employee Savings Mutual Fund
(Fonds Commun de Placement Entreprise) cannot be set up or
is not relevant, the employee share ownership plan (@ESOP)
includes a Stock Appreciation Rights (SAR) mechanism. The
benefi t offered by the Group corresponds to the amount of the
discount on the share subscription price.
P) Provisions
A provision is recognized in the Consolidated Statement of
Financial Position at the year-end if, and only if, (i) the Group has
a present obligation (legal or constructive) as a result of a past
event; (ii) it is probable that an outfl ow of resources embodying
economic benefi ts will be required to settle the obligation; and (iii)
a reliable estimate can be made of the amount of the obligation.
Provisions are discounted when the impact of the time value of
money is material.
Q) Consolidated statement of cash fl ows
The Consolidated Statement of Cash Flows analyzes the year-on-
year change in cash fl ows from operating, investing and fi nancing
activities.
Foreign currency cash flows are translated into euros at the
average exchange rate for the year. Exchange gains or losses
resulting from the translation of cash flows relating to foreign
currency assets and liabilities at the year-end exchange rate are
shown in “Effect of exchange rate movements on cash and cash
equivalents” in the Statement of Cash Flows.
R) Operating segments
Group Management analyzes and measures activity performance:
• in the different businesses (Consulting Services, Technology
Services, Local Professional Services and Outsourcing
Services) and
• in the geographic areas where the Group is present.
The business analysis enables the transversal management
and monitoring of resources and service production in 2011 in
the seven strategic business units and therefore the roll-out of
uniform expertise and know-how in all countries and regions.
The geographic analysis enables management to monitor the
performance:
• of commercial development: it focuses on trends in major
contracts and clients in Group markets across all its
businesses. This monitoring seeks to coordinate the service
offering of the different businesses in the territories, given their
considerable interaction and to measure the services rendered.
These analyses are performed by Group Management within
the Coordination Committee of the geographic area, which
brings together the business managers operating in a given
area;
• at operational and financial level: management of treasury
and suppor t ser vices, the operating investment and
fi nancing policies and the acquisition policy are decided and
implemented by geographic area.
This led the Group to present its segment reporting for the
8 geographic areas grouping together the countries where it is
located.
Costs relating to operations and incurred by Group holding
companies on behalf of geographic areas are allocated to the
relevant segments either directly or on the basis of an allocation
key. Items not allocated correspond to headquarter expenses.
Inter-segment transactions are carried out on an arm’s length
basis.
S) Exchange gains and losses on inter-company
transactions
The results and financial position of a foreign subsidiary are
included in the Group’s consolidated fi nancial statements using
consolidation procedures, such as the elimination of inter-
company balances and transactions. However, an intercompany
short- or long-term monetary asset (or liability) cannot be
eliminated against the corresponding inter-company liability
(or asset) without showing the results of currency fl uctuations
REGISTRATION DOCUMENT 2011 CAPGEMINI128
Notes to the consolidated fi nancial statements
6. CONSOLIDATED FINANCIAL STATEMENTS
6
in the consolidated fi nancial statements. This is because the
monetary item represents a commitment to convert one
currency into another and exposes the Group to a gain or loss
through currency fl uctuations. Accordingly, in the consolidated
fi nancial statements, these exchange differences continue to be
recognized in the Income statement or in Income and expense
recognized directly in equity, if the underlying forms an integral
part of the net investment in the foreign operation.
NOTE 2 – CHANGES IN GROUP STRUCTURE
Acquisitions during fi scal year 2011
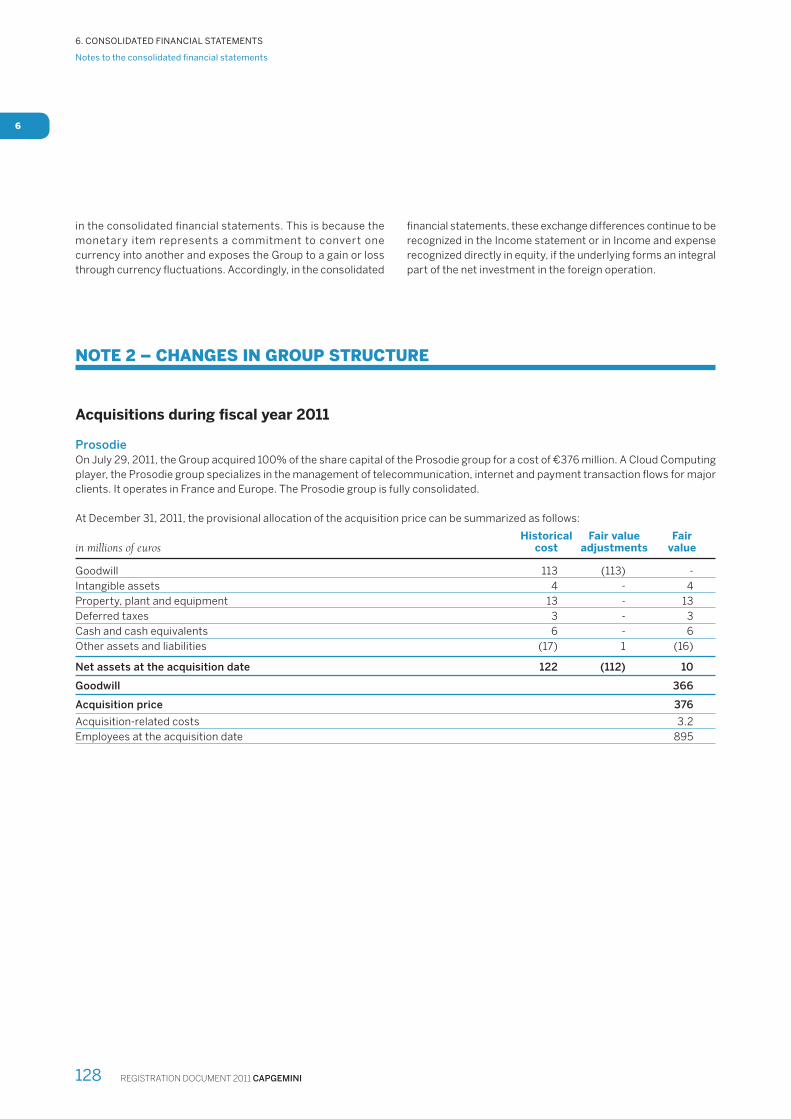
Prosodie
On July 29, 2011, the Group acquired 100% of the share capital of the Prosodie group for a cost of €376 million. A Cloud Computing
player, the Prosodie group specializes in the management of telecommunication, internet and payment transaction fl ows for major
clients. It operates in France and Europe. The Prosodie group is fully consolidated.
At December 31, 2011, the provisional allocation of the acquisition price can be summarized as follows:
in millions of eurosHistorical
costFair value
adjustmentsFair
value
Goodwill 113 (113) -
Intangible assets 4 - 4
Property, plant and equipment 13 - 13
Deferred taxes 3 - 3
Cash and cash equivalents 6 - 6
Other assets and liabilities (17) 1 (16)
Net assets at the acquisition date 122 (112) 10
Goodwill 366
Acquisition price 376
Acquisition-related costs 3.2
Employees at the acquisition date 895
CAPGEMINI REGISTRATION DOCUMENT 2011 129
Notes to the consolidated fi nancial statements
6. CONSOLIDATED FINANCIAL STATEMENTS
6
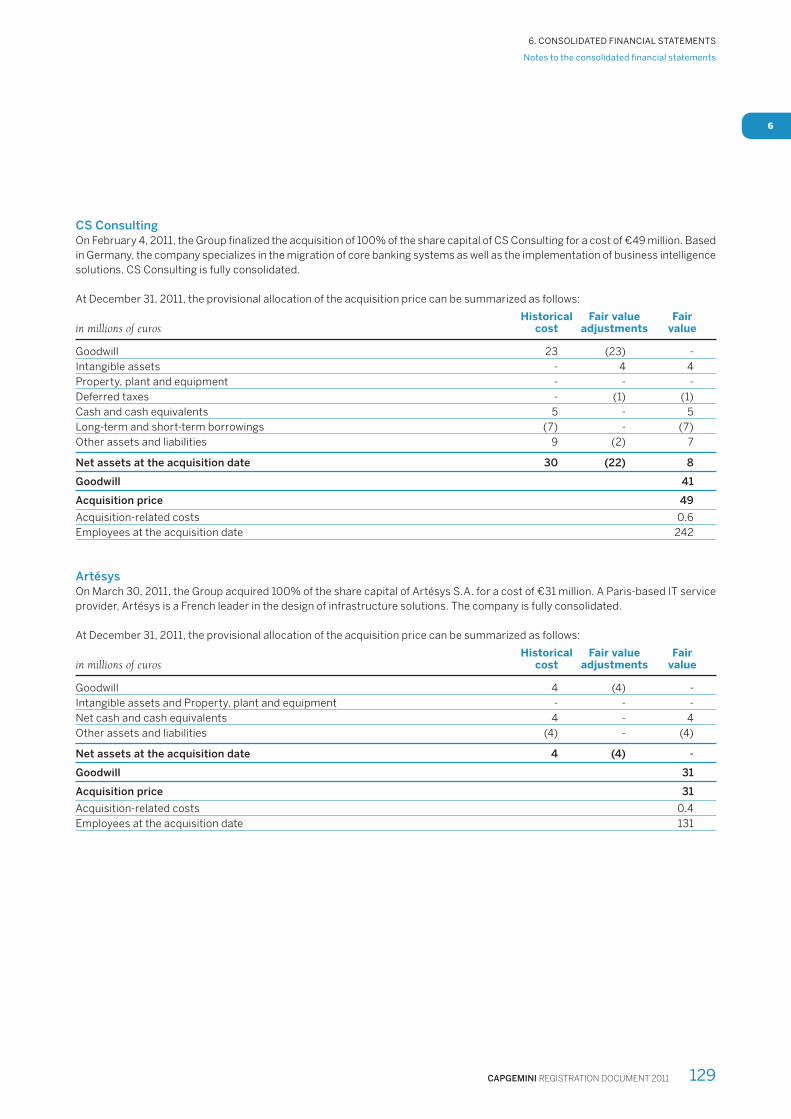
CS Consulting
On February 4, 2011, the Group fi nalized the acquisition of 100% of the share capital of CS Consulting for a cost of €49 million. Based
in Germany, the company specializes in the migration of core banking systems as well as the implementation of business intelligence
solutions. CS Consulting is fully consolidated.
At December 31, 2011, the provisional allocation of the acquisition price can be summarized as follows:
in millions of eurosHistorical
costFair value
adjustmentsFair
value
Goodwill 23 (23) -
Intangible assets - 4 4
Property, plant and equipment - - -
Deferred taxes - (1) (1)
Cash and cash equivalents 5 - 5
Long-term and short-term borrowings (7) - (7)
Other assets and liabilities 9 (2) 7
Net assets at the acquisition date 30 (22) 8
Goodwill 41
Acquisition price 49
Acquisition-related costs 0.6
Employees at the acquisition date 242
Artésys
On March 30, 2011, the Group acquired 100% of the share capital of Artésys S.A. for a cost of €31 million. A Paris-based IT service
provider, Artésys is a French leader in the design of infrastructure solutions. The company is fully consolidated.
At December 31, 2011, the provisional allocation of the acquisition price can be summarized as follows:
in millions of eurosHistorical
costFair value
adjustmentsFair
value
Goodwill 4 (4) -
Intangible assets and Property, plant and equipment - - -
Net cash and cash equivalents 4 - 4
Other assets and liabilities (4) - (4)
Net assets at the acquisition date 4 (4) -
Goodwill 31
Acquisition price 31
Acquisition-related costs 0.4
Employees at the acquisition date 131

REGISTRATION DOCUMENT 2011 CAPGEMINI130
Notes to the consolidated fi nancial statements
6. CONSOLIDATED FINANCIAL STATEMENTS
6
AIVE Group
The Group acquired 100% of the share capital of AIVE (in Italy) on August 31, 2011 for a total consideration of €40 million. The
company is fully consolidated from September 1, 2011.
At December 31, 2011, the provisional allocation of the acquisition price can be summarized as follows:
in millions of eurosHistorical
costFair value
adjustments Fair value
Goodwill 2 (2) -
Intangible assets 1 (1) -
Property, plant and equipment 1 - 1
Deferred taxes 1 - 1
Cash and cash equivalents - - -
Long-term and short-term borrowings (6) - (6)
Other assets and liabilities 7 - 7
Net assets at the acquisition date 6 (3) 3
Goodwill 37
Acquisition price (paid in full in cash and cash equivalents) 40
Acquisition-related costs 0.9
Employees at the acquisition date 623
Other acquisitions during fi scal year 2011
The Group acquired Avantias, Backelite and Level IP in France,
BI Consulting Group in the United States, Praxis in China and
the activities of Vengroff Williams Associates Inc. (primarily
located in the United States), representing a total headcount
of 729 employees. The total cost of these acquisitions was
€78 million. Acquisition-related costs in respect of these
transactions totaled €2 million. These entities are fully
consolidated and generated provisional goodwill of €72 million.
Contribution of acquisitions during fi scal year 2011
The companies acquired in 2011 contributed €162 million to
Group revenues, including €83 million for Prosodie (estimated
at €309 million if the companies had been acquired on January
1, 2011, including €161 million for Prosodie).
Their contribution to Group operating margin in 2011 was
€19 million, including €12 million for Prosodie (estimated at
€28 million if the companies had been acquired on January 1,
2011, including €18 million for Prosodie).
Their contribution to Group net profi t in 2011 was €9 million,
including €5 million for Prosodie (estimated at €8 million if the
companies had been acquired on January 1, 2011, including
€4 million for Prosodie).
Overview of major acquisitions in previous fi scal years
CPM Braxis
On October 6, 2010, the Group acquired 56.06% of the
share capital of the number one IT service provider in Brazil,
CPM Braxis S.A. which is fully consolidated since this date. The
future acquisition of the residual 43.94% of share capital is
covered by a put option granted to minority shareholders. This
put option, which may be exercised between October 2013 and
October 2015, was recognized in liabilities through a reduction
in reserves (attributable to owners of the Company).
The put option was partially hedged in fi scal year 2011 to limit the
Group’s exposure to fl uctuations in the Brazilian real exchange
rate up to its exercise date.
At the end of the acquisition price allocation period, the acquisition
price was BRL 489 million (€202 million at December 31,
2011), compared to BRL 519 million (€224 million at the
acquisition date). The goodwill recognized on initial consolidation
nonetheless remains unchanged at BRL 525 million (€226 million
at the acquisition date).
On December 27, 2011, the Group, through the intermediary of
its subsidiary Capgemini do Brasil Consultoria e Participações
Ltda, participated in the share capital increase performed by
CPM Braxis S.A. subscribing for ordinary shares with a total
value of BRL 250 million. The minority shareholder, Uñiao
Participações Ltda, a subsidiary of the Brazilian bank, Banco
Bradesco S.A., also subscribed for new shares under this share
capital increase in the amount of BRL 80 million, increasing its
investment to 10.81%. Following completion of this transaction,
the Group’s investment in CPM Braxis S.A. increased from
56.06% to 61.10%. The new shares subscribed during this
share capital increase by the minority shareholder, Uñiao
Participações Ltda, a subsidiary of the Brazilian bank Banco
Bradesco S.A, are covered by a put option that may be exercised
between October 2013 and October 2015, and were recognized
in liabilities in the amount of €33 million through a reduction in
reserves (attributable to owners of the Company).
CAPGEMINI REGISTRATION DOCUMENT 2011 131
Notes to the consolidated fi nancial statements
6. CONSOLIDATED FINANCIAL STATEMENTS
6
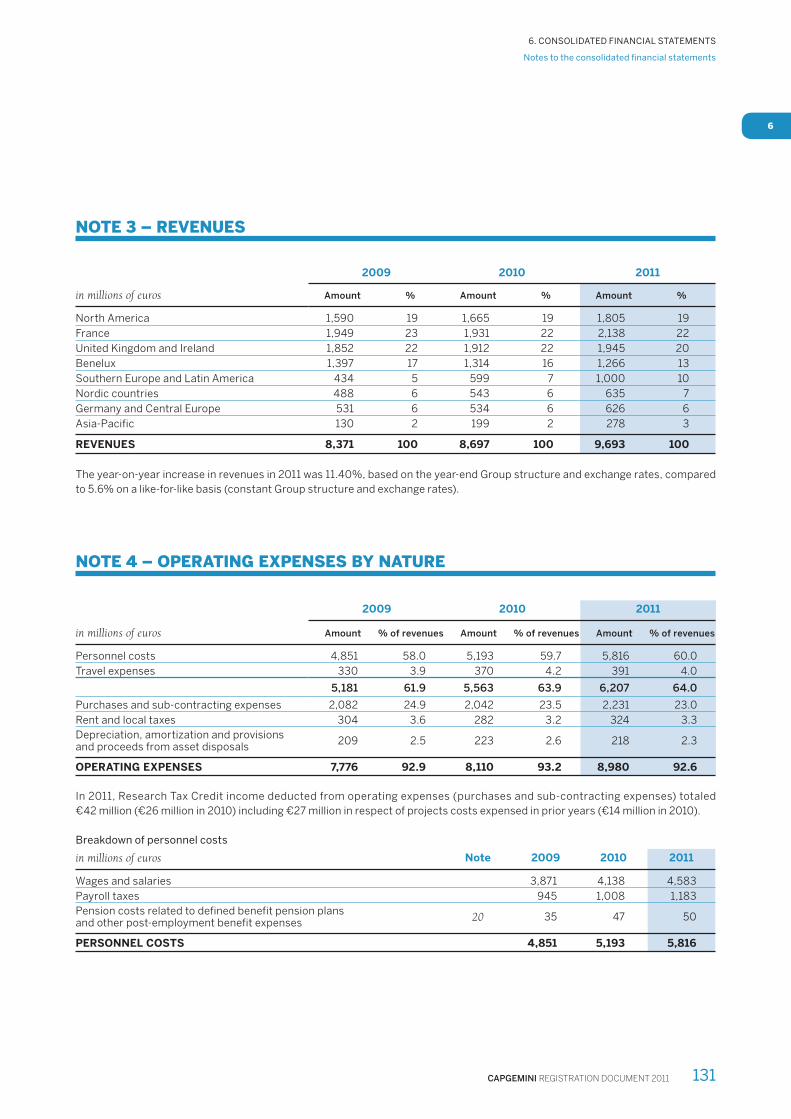
NOTE 3 – REVENUES
in millions of euros
2009 2010 2011
Amount % Amount % Amount %
North America 1,590 19 1,665 19 1,805 19
France 1,949 23 1,931 22 2,138 22
United Kingdom and Ireland 1,852 22 1,912 22 1,945 20
Benelux 1,397 17 1,314 16 1,266 13
Southern Europe and Latin America 434 5 599 7 1,000 10
Nordic countries 488 6 543 6 635 7
Germany and Central Europe 531 6 534 6 626 6
Asia-Pacific 130 2 199 2 278 3
REVENUES 8,371 100 8,697 100 9,693 100
The year-on-year increase in revenues in 2011 was 11.40%, based on the year-end Group structure and exchange rates, compared
to 5.6% on a like-for-like basis (constant Group structure and exchange rates).
NOTE 4 – OPERATING EXPENSES BY NATURE
2009 2010 2011
in millions of euros Amount % of revenues Amount % of revenues Amount % of revenues
Personnel costs 4,851 58.0 5,193 59.7 5,816 60.0
Travel expenses 330 3.9 370 4.2 391 4.0
5,181 61.9 5,563 63.9 6,207 64.0
Purchases and sub-contracting expenses 2,082 24.9 2,042 23.5 2,231 23.0
Rent and local taxes 304 3.6 282 3.2 324 3.3
Depreciation, amortization and provisions and proceeds from asset disposals
209 2.5 223 2.6 218 2.3
OPERATING EXPENSES 7,776 92.9 8,110 93.2 8,980 92.6
In 2011, Research Tax Credit income deducted from operating expenses (purchases and sub-contracting expenses) totaled
€42 million (€26 million in 2010) including €27 million in respect of projects costs expensed in prior years (€14 million in 2010).
Breakdown of personnel costs
in millions of euros Note 2009 2010 2011
Wages and salaries 3,871 4,138 4,583
Payroll taxes 945 1,008 1,183
Pension costs related to defined benefit pension plans and other post-employment benefit expenses
20 35 47 50
PERSONNEL COSTS 4,851 5,193 5,816

REGISTRATION DOCUMENT 2011 CAPGEMINI132
Notes to the consolidated fi nancial statements
6. CONSOLIDATED FINANCIAL STATEMENTS
6
NOTE 5 – OTHER OPERATING INCOME AND EXPENSE
in millions of euros Note 2009 2010 2011
Restructuring costs (213) (71) (81)
o/w Workforce reduction (151) (44) (74)
o/w Real estate assets streamlining (52) (19) (4)
o/w Rightshoring (10) (8) (3)
Integration cost relating to acquired companies (16) (11) (9)
Acquisition-related costs 2 n/a (4) (7)
Expenses relating to share subscriptions, share grants and stock options 9 (19) (16) (17)
Impairment of goodwill 12 (12) - -
Other operating income 7 6 -
Other operating expenses (9) (2) (4)
OTHER OPERATING INCOME AND EXPENSE (262) (98) (118)
Restructuring costs
2011 restructuring costs primarily concern workforce reduction
measures and the streamlining of real estate assets, particularly
in the Netherlands.
Integration cost relating to acquired companies
In 2011, these costs relate to the integration of the activities of
CPM Braxis acquired at the end of 2010 and integration costs
relating to acquisitions of the period.
NOTE 6 – NET FINANCIAL EXPENSE
in millions of euros Note 2009 2010 2011
Income from cash equivalents and cash management assets 22 20 23
Interest on borrowings (31) (42) (54)
Finance costs at the nominal interest rate (9) (22) (31)
Impact of amortized cost on borrowings (34) (32) (34)
Finance costs at the effective interest rate (43) (54) (65)
Net interest cost on defined benefit pension plans 20 (42) (28) (25)
Exchange gains (losses) on financial transactions 19 (66) 2 2
Currency derivative instruments on financial transactions 19 63 (2) (4)
Interest rate derivative instruments 19 (2) - -
Other (3) (5) (13)
Other financial income and expense (50) (33) (40)
o/w fi nancial expense (125) (55) (104)
o/w fi nancial income 75 22 64
NET FINANCIAL EXPENSE (93) (87) (105)
Net fi nance costs mainly comprise:
• the coupons on OCEANE bonds convertible/exchangeable
into new or existing Cap Gemini S.A. shares issued on June 16,
2005 (OCEANE 2005) and April 20, 2009 (OCEANE 2009)
of €24 million, plus an amortized cost accounting impact of
€34 million,
• the coupons on the new bond issue issued on November 29,
2011 of €2 million,
• interest on fi nance leases of €8 million (primarily in the United
Kingdom, France and the United States);
• interest on CPM Braxis group bank loans of €16 million,
• income from cash and cash equivalents of €23 million, the
increase in which is due to improved returns on short-term
investments.
CAPGEMINI REGISTRATION DOCUMENT 2011 133
Notes to the consolidated fi nancial statements
6. CONSOLIDATED FINANCIAL STATEMENTS
6
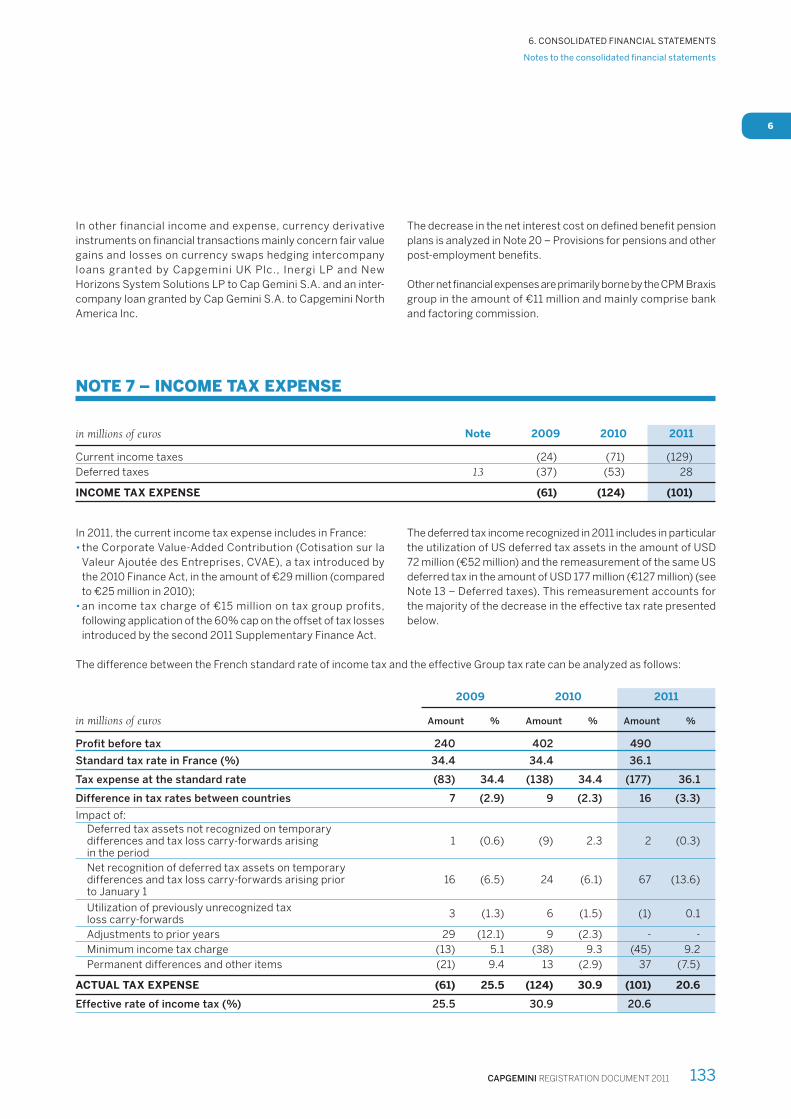
In other financial income and expense, currency derivative
instruments on fi nancial transactions mainly concern fair value
gains and losses on currency swaps hedging intercompany
loans granted by Capgemini UK Plc., Inergi LP and New
Horizons System Solutions LP to Cap Gemini S.A. and an inter-
company loan granted by Cap Gemini S.A. to Capgemini North
America Inc.
The decrease in the net interest cost on defi ned benefi t pension
plans is analyzed in Note 20 – Provisions for pensions and other
post-employment benefi ts.
Other net fi nancial expenses are primarily borne by the CPM Braxis
group in the amount of €11 million and mainly comprise bank
and factoring commission.
NOTE 7 – INCOME TAX EXPENSE
in millions of euros Note 2009 2010 2011
Current income taxes (24) (71) (129)
Deferred taxes 13 (37) (53) 28
INCOME TAX EXPENSE (61) (124) (101)
In 2011, the current income tax expense includes in France:
• the Corporate Value-Added Contribution (Cotisation sur la
Valeur Ajoutée des Entreprises, CVAE), a tax introduced by
the 2010 Finance Act, in the amount of €29 million (compared
to €25 million in 2010);
• an income tax charge of €15 million on tax group profits,
following application of the 60% cap on the offset of tax losses
introduced by the second 2011 Supplementary Finance Act.
The deferred tax income recognized in 2011 includes in particular
the utilization of US deferred tax assets in the amount of USD
72 million (€52 million) and the remeasurement of the same US
deferred tax in the amount of USD 177 million (€127 million) (see
Note 13 – Deferred taxes). This remeasurement accounts for
the majority of the decrease in the effective tax rate presented
below.
The difference between the French standard rate of income tax and the effective Group tax rate can be analyzed as follows:
2009 2010 2011
in millions of euros Amount % Amount % Amount %
Profit before tax 240 402 490
Standard tax rate in France (%) 34.4 34.4 36.1
Tax expense at the standard rate (83) 34.4 (138) 34.4 (177) 36.1
Difference in tax rates between countries 7 (2.9) 9 (2.3) 16 (3.3)
Impact of: Deferred tax assets not recognized on temporary differences and tax loss carry-forwards arisingin the period
1 (0.6) (9) 2.3 2 (0.3)
Net recognition of deferred tax assets on temporary differences and tax loss carry-forwards arising prior to January 1
16 (6.5) 24 (6.1) 67 (13.6)
Utilization of previously unrecognized tax loss carry-forwards
3 (1.3) 6 (1.5) (1) 0.1
Adjustments to prior years 29 (12.1) 9 (2.3) - -
Minimum income tax charge (13) 5.1 (38) 9.3 (45) 9.2
Permanent differences and other items (21) 9.4 13 (2.9) 37 (7.5)
ACTUAL TAX EXPENSE (61) 25.5 (124) 30.9 (101) 20.6
Effective rate of income tax (%) 25.5 30.9 20.6
REGISTRATION DOCUMENT 2011 CAPGEMINI134
Notes to the consolidated fi nancial statements
6. CONSOLIDATED FINANCIAL STATEMENTS
6
The fourth 2011 Supplementary Finance Act, published in the
Offi cial Journal on December 29, 2011, introduced an additional
income tax contribution in respect of fi scal years ending from
December 31, 2011 to December 30, 2013.
This exceptional contribution is limited in time and should only
concern, for companies whose fiscal year is aligned with the
calendar year, fi scal years 2011 and 2012. It is equal to 5% of
the income tax charge and is payable by companies reporting
revenues in excess of €250 million. In the case of a tax group
election, the revenues of all member companies of the tax group
are added together when assessing whether the group is liable
for this contribution.
Consequently, the standard tax rate applicable to the Group
for fi scal year 2011 is 36.10% compared to 34.43% previously.
NOTE 8 – EARNINGS PER SHARE
Basic earnings per share
2009 2010 2011
Profit for the year (in millions of euros) 178 280 404
Weighted average number of ordinary shares 145,153,387 152,979,307 153,595,650
BASIC EARNINGS PER SHARE (IN EUROS) 1.23 1.83 2.63
The marginal year-on-year increase in the average number
of shares between 2010 and 2011 reflects in reality the near
stability in the number of shares since December 31, 20.
Diluted earnings per share
Diluted earnings per share are calculated by assuming
conversion into ordinary shares of all dilutive instruments
outstanding at the period end. The average share price in 2011
was €33.95.
At December 31, 2011, instruments considered dilutive for the
purpose of calculating diluted earnings per share include:
• shares fall ing within the scope of the 2009 and 2010
performance share plans and not subject to any performance
conditions;
• performance shares subject to market performance conditions
contained in the 2010 plan. As the performance of the
Cap Gemini S.A. share since the grant date, at December 31,
2011, is between 90% and 91% of the performance of the
reference basket, 493,560 performance shares would have
been granted at December 31 if the performance measurement
period ended at that date;
• the performance shares subject to internal performance
conditions contained in the 2010 plan. At December 31, 2011,
as the increase in the operating margin of Capgemini Group
in 2011 at constant Group structure and exchange rates, was
greater than 15%, 401,850 performance shares could have
been granted at December 31 if the performance measurement
period ended at that date;
• the 16,911,765 “OCEANE 2009” convertible bonds issued on
April 20, 2009, as the €23 million interest expense recorded
(net of taxes) on the bonds is lower per bond than basic
earnings per share. These bonds are convertible at any time
until the seventh business day preceding January 1, 2014, when
they will be redeemable at par.
Conversely, the following financial instruments are not
considered dilutive:
• employee stock options, as the average price of ordinary
shares during the period is inferior to the strike price of the
options;
• the Redeemable Share Subscription or Purchase Warrants, as
the aggregate of the €34 strike price and €3.22 issue premium
is higher than the average market price of the Cap Gemini
share in 2011;
• the “OCEANE 2005” convertible bonds issued on June 16,
2005, not converted and as such redeemed in full on January 2,
2012 (see Note 17 – Net cash and cash equivalents).
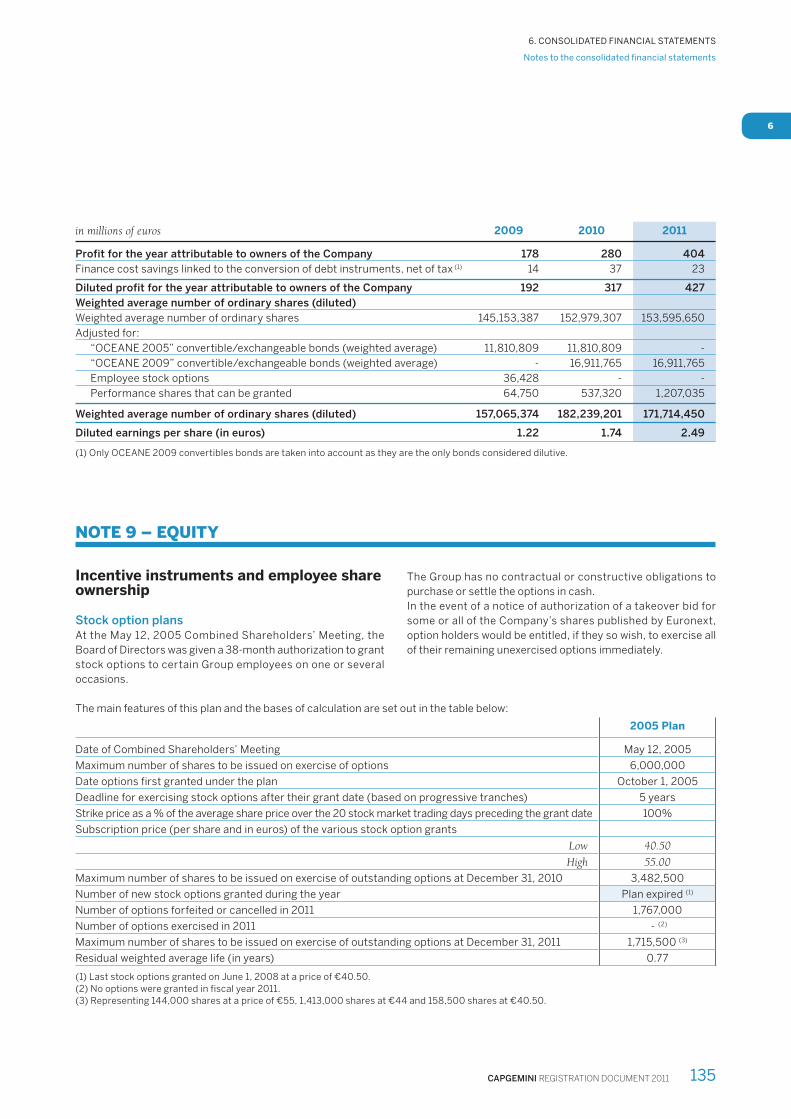
CAPGEMINI REGISTRATION DOCUMENT 2011 135
Notes to the consolidated fi nancial statements
6. CONSOLIDATED FINANCIAL STATEMENTS
6
in millions of euros 2009 2010 2011
Profit for the year attributable to owners of the Company 178 280 404
Finance cost savings linked to the conversion of debt instruments, net of tax (1) 14 37 23
Diluted profit for the year attributable to owners of the Company 192 317 427
Weighted average number of ordinary shares (diluted)
Weighted average number of ordinary shares 145,153,387 152,979,307 153,595,650
Adjusted for:
“OCEANE 2005” convertible/exchangeable bonds (weighted average) 11,810,809 11,810,809 -
“OCEANE 2009” convertible/exchangeable bonds (weighted average) - 16,911,765 16,911,765
Employee stock options 36,428 - -
Performance shares that can be granted 64,750 537,320 1,207,035
Weighted average number of ordinary shares (diluted) 157,065,374 182,239,201 171,714,450
Diluted earnings per share (in euros) 1.22 1.74 2.49
(1) Only OCEANE 2009 convertibles bonds are taken into account as they are the only bonds considered dilutive.
NOTE 9 – EQUITY
Incentive instruments and employee share ownership
Stock option plans
At the May 12, 2005 Combined Shareholders’ Meeting, the
Board of Directors was given a 38-month authorization to grant
stock options to certain Group employees on one or several
occasions.
The Group has no contractual or constructive obligations to
purchase or settle the options in cash.
In the event of a notice of authorization of a takeover bid for
some or all of the Company’s shares published by Euronext,
option holders would be entitled, if they so wish, to exercise all
of their remaining unexercised options immediately.
The main features of this plan and the bases of calculation are set out in the table below:
2005 Plan
Date of Combined Shareholders’ Meeting May 12, 2005
Maximum number of shares to be issued on exercise of options 6,000,000
Date options first granted under the plan October 1, 2005
Deadline for exercising stock options after their grant date (based on progressive tranches) 5 years
Strike price as a % of the average share price over the 20 stock market trading days preceding the grant date 100%
Subscription price (per share and in euros) of the various stock option grants
Low 40.50
High 55.00
Maximum number of shares to be issued on exercise of outstanding options at December 31, 2010 3,482,500
Number of new stock options granted during the year Plan expired (1)
Number of options forfeited or cancelled in 2011 1,767,000
Number of options exercised in 2011 - (2)
Maximum number of shares to be issued on exercise of outstanding options at December 31, 2011 1,715,500 (3)
Residual weighted average life (in years) 0.77
(1) Last stock options granted on June 1, 2008 at a price of €40.50.(2) No options were granted in fiscal year 2011.(3) Representing 144,000 shares at a price of €55, 1,413,000 shares at €44 and 158,500 shares at €40.50.
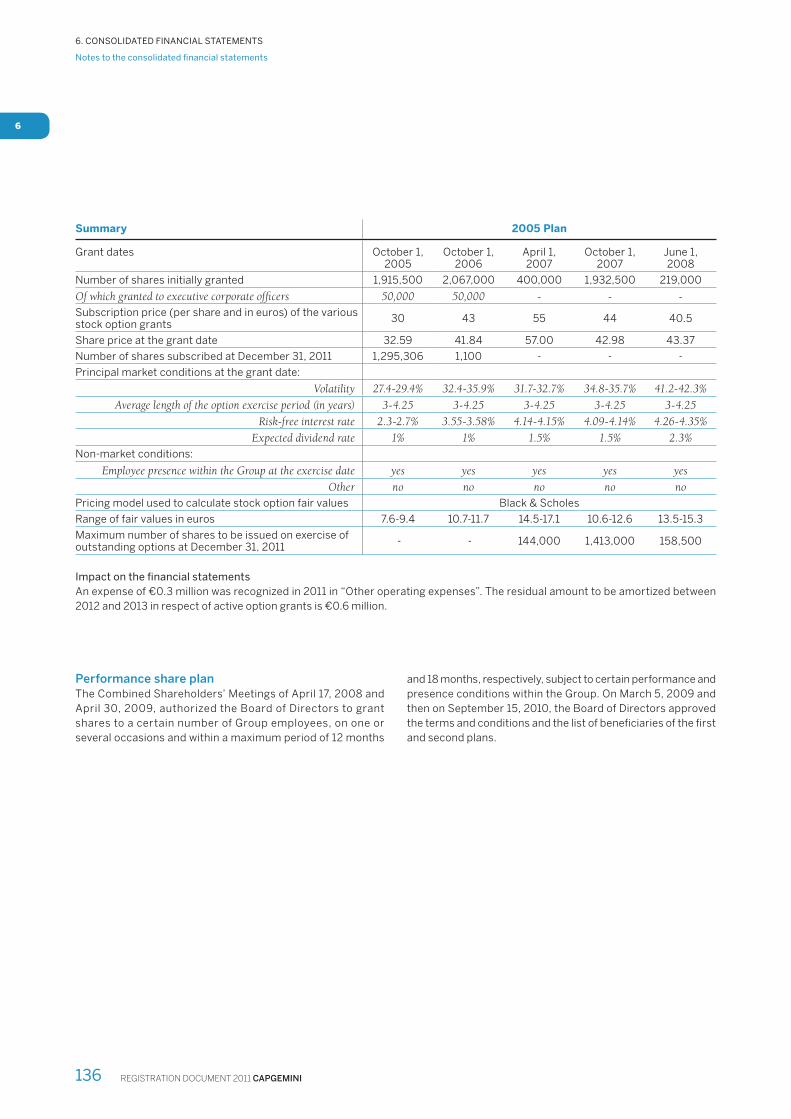
REGISTRATION DOCUMENT 2011 CAPGEMINI136
Notes to the consolidated fi nancial statements
6. CONSOLIDATED FINANCIAL STATEMENTS
6
Summary 2005 Plan
Grant dates October 1, 2005
October 1, 2006
April 1, 2007
October 1, 2007
June 1, 2008
Number of shares initially granted 1,915,500 2,067,000 400,000 1,932,500 219,000
Of which granted to executive corporate offi cers 50,000 50,000 - - -
Subscription price (per share and in euros) of the various stock option grants
30 43 55 44 40.5
Share price at the grant date 32.59 41.84 57.00 42.98 43.37
Number of shares subscribed at December 31, 2011 1,295,306 1,100 - - -
Principal market conditions at the grant date:
Volatility 27.4-29.4% 32.4-35.9% 31.7-32.7% 34.8-35.7% 41.2-42.3%
Average length of the option exercise period (in years) 3-4.25 3-4.25 3-4.25 3-4.25 3-4.25
Risk-free interest rate 2.3-2.7% 3.55-3.58% 4.14-4.15% 4.09-4.14% 4.26-4.35%
Expected dividend rate 1% 1% 1.5% 1.5% 2.3%
Non-market conditions:
Employee presence within the Group at the exercise date yes yes yes yes yes
Other no no no no no
Pricing model used to calculate stock option fair values Black & Scholes
Range of fair values in euros 7.6-9.4 10.7-11.7 14.5-17.1 10.6-12.6 13.5-15.3
Maximum number of shares to be issued on exercise of outstanding options at December 31, 2011
- - 144,000 1,413,000 158,500
Impact on the fi nancial statements
An expense of €0.3 million was recognized in 2011 in “Other operating expenses”. The residual amount to be amortized between
2012 and 2013 in respect of active option grants is €0.6 million.
Performance share plan
The Combined Shareholders’ Meetings of April 17, 2008 and
April 30, 2009, authorized the Board of Directors to grant
shares to a certain number of Group employees, on one or
several occasions and within a maximum period of 12 months
and 18 months, respectively, subject to certain performance and
presence conditions within the Group. On March 5, 2009 and
then on September 15, 2010, the Board of Directors approved
the terms and conditions and the list of benefi ciaries of the fi rst
and second plans.

CAPGEMINI REGISTRATION DOCUMENT 2011 137
Notes to the consolidated fi nancial statements
6. CONSOLIDATED FINANCIAL STATEMENTS
6
The main features of these plans are set out in the table below:
Summary 2009 Plan
Of which corporate officers 2010 Plan
Of which corporate officers
Date of Combined Shareholders’ Meeting April 17, 2008 April 30, 2009
Total number of shares to be granted 1% of the share capital on the date of the Board of Directors’ decision, i.e. a maximum of 1,458,860
shares
1% of the share capital on the date of the Board of Directors' decision, i.e. a maximum of 1,557,703
shares
Total number of shares granted 1,148,250 (1) 1,555,000 (3)
Date of the Board of Directors’ decision March 5, 2009 October 1, 2010
Performance assessment datesAt the end of the first and
second years following the grant date
At the end of the first and second years following
the grant date
Vesting period Two years as from the grant date (France)
or four years as from the grant date (other
countries)
Two years as from the grant date (France)
or four years as from the grant date (other
countries)
Mandatory lock-in period effective as from the vesting date (France only)
Two years, or five years in the event of departure
from the Group during the two years following
the vesting date
Two years, or five years in the event of departure
from the Group during the two years following
the vesting date
Number of shares subject to performance and presence conditions granted during the year
- - - - (5)
Number of options forfeited or canceled during the year534,125 25,000 94,000
Number of shares definitively allocated at December 31, 2011
200,250 25,000
Number of shares at December 31, 2011 that may be definitively allocated under this plan in respect of shares previously granted, subject to performance and presence conditions
311,625 (2) - 1,458,000 (4)
Share price at the grant date (in euros) 23.30 37.16
Main market conditions at the grant date:
VolatilityRisk-free interest rate
Expected dividend rate
42.7%1.4%3.0%
42.8%1.67%3.0%
Other conditions:
Performance conditionsEmployee presence within the Group at the vesting date
Yes (see below)Yes
Yes (see below)Yes
Pricing model used to calculate the fair values of shares
- Monte Carlo for performance shares-
Black& Scholes for bonus shares
- Monte Carlo for performance shares
with external (market) conditions
- Black& Scholes for shares granted without
conditions or with internal performance
conditions
Range of fair values in euros:
Bonus shares (per share and in euros)Performance shares (per share and in euros)
20.7 - 21.916.51 - 17.53
17.5332.32 - 32.9621.54 - 21.97
n/a
(1) Of which 64,750 shares granted without performance conditions (5.6% of the total) pursuant to the relevant resolution (authorization capped at 15% of the total).
(2) Balance on the “foreign” plan that may be allocated on March 5, 2013, subject to conditions of presence.
(3) Of which 124,000 shares granted without performance conditions (8% of the total) pursuant to the relevant resolution (authorization capped at 15% of the total).
(4) Of which 118,500 shares granted without performance conditions.(5) No performance shares were granted in 2011.
REGISTRATION DOCUMENT 2011 CAPGEMINI138
Notes to the consolidated fi nancial statements
6. CONSOLIDATED FINANCIAL STATEMENTS
6
Performance conditions of the 2009 plan
The exact number of shares vesting at the end of the vesting
period will be equal to the maximum number of shares initially
granted, multiplied by a percentage (from 0% to 100%)
corresponding to the chosen performance measurement criteria.
The performance of the Cap Gemini S.A. share, measured over
the fi rst two years, compared to the average performance of a
basket of ten securities of listed companies, measured over the
same period and representative of the Group’s business sector in
at least fi ve countries in which the Group is fi rmly established, will
ultimately condition the vesting of the shares.
The defi nitive allocation depends on the relative performance of
the Cap Gemini S.A. share in relation to the basket of comparable
securities. In each period, the number of shares that ultimately
vested:
• was equal to 60% of the number of shares initially allocated
if the performance of the Cap Gemini S.A. share was equal to
90% of the basket;
• varied on a straight-line basis between 60% and 100% of the
initial allocation, based on a predefi ned schedule, where the
performance of the Cap Gemini S.A. share was between 90%
and 110% of the basket;
• was equal to 100% of the number of shares initially allocated if
the performance of the Cap Gemini S.A. share was higher than
or equal to 110% of the basket.
The definitive calculation led to the grant of only 50% of
performance shares initially allocated, which after adding shares
granted subject to conditions of presence, represents a maximum
of 534,750 shares granted. This includes 200,250 shares for grant
to members of the French plan which are defi nitively vested and
delivered subject to a 2-year lock-in period and 334,500 shares for
grant to members of the foreign plan, of which only 311,625 shares
remain, which will be delivered on March 5, 2013 subject to
compliance with conditions of presence at this date.
Performance conditions of the 2010 plan
In accordance with the AMF recommendation of December 8,
2009 regarding the inclusion of internal and ex ternal
performance conditions when granting performance shares,
the Board of Directors decided to add an internal condition to
the external condition initially planned.
External performance condition:
The external performance condition is calculated in the same
way as under the fi rst plan, except for the grant thresholds which
have been tightened compared to the fi rst plan. As such:
• no shares will be granted if the performance of the Cap Gemini
S.A. share during the period in question is less than 90% of
the average performance of the basket of securities over the
same period;
• the number of shares that will ultimately vest:
- will be equal to 40% of the number of shares initially allocated
if the performance of the Cap Gemini S.A. share is at least
equal to 90% of the basket;
- will be equal to 60% of the number of shares initially allocated
if the performance of the Cap Gemini S.A. share is equal to
100% of the basket;
- will vary on a straight-line basis between 40% and 60% and
between 60% and 100% of the initial allocation, based on
a predefined schedule, where the performance of the Cap
Gemini S.A. share is between 90% and 100% of the basket
in the first case and 100% and 110% of the basket in the
second case;
- will be equal to 100% of the number of shares initially allocated
if the relative performance of the Cap Gemini S.A. share is
higher than or equal to 110% of the basket.
Under these conditions, if the performance of the Cap Gemini
S.A. share is in line with that of the basket of comparable shares,
only 60% of the initial allocation will be granted compared to
80% under the fi rst plan.
The external performance condition accounts for 70% of the
grant calculation.
Internal performance condition:
The internal performance condition is based on the progression
in the 2011 audited and published operating margin of Capgemini
Group compared with the 2010 operating margin at constant
Group structure and exchange rates.
The performance calculation will be performed once the 2011
accounts have been approved, by comparing the percentage
increase in the 2011 audited and published operating margin
of Capgemini Group compared with the 2010 audited and
published operating margin at constant Group structure and
exchange rates. Based on the percentage increase calculated
in this way:
• no shares will be granted in respect of the internal performance
condition if the increase in the operating margin thus calculated
is less than 12%;
• the number of shares that will ultimately vest:
- will be equal to 40% of the number of shares initially allocated
if the increase is between 12% and 13.5%;
- will be equal to 60% of the number of shares initially allocated
if the increase is between 13.5% and 15%;
- will be equal to 100% of the number of shares initially allocated
if the increase is greater than or equal to 15%.
The internal performance condition accounts for 30% of the
grant calculation.
The fair value of shares subject to external performance
conditions was adjusted for a discount calculated in accordance
with the Monte Carlo model, together with a discount for non-
transferability for the shares granted in France.
The fair value of shares subject to internal performance
conditions is taken into account assuming 100% realization, to
which an adjustment may be applied depending on the effective
realization or not of this performance condition, and together
with a discount for non-transferability for the shares granted
in France.

CAPGEMINI REGISTRATION DOCUMENT 2011 139
Notes to the consolidated fi nancial statements
6. CONSOLIDATED FINANCIAL STATEMENTS
6
Impact on the fi nancial statements
An expense of €15.7 million was recognized in 2011 in “Other
operating expenses” in respect of performance shares
(including employer contributions). The residual amount to be
amortized between 2012 and 2015 in respect of these two plans
is €24.5 million.
Redeemable share subscription or purchase warrants
(bons de souscription et / ou d’acquisition d’actions
remboursables – bsaar) (reminder 2009)
During 2009, 2,999,000 warrants were subscribed by
employees and corporate officers of the Group (at a price
of €3.22 per warrant), generating income net of issue costs
of €9 million. The exercise period commences the date of
listing of the BSAAR warrants on the Euronext Paris market and
terminates on the seventh anniversary of the issue date. The
warrants will be listed on July 23, 2013. Between July 23, 2009
and the date the warrants are admitted to trading on Euronext
Paris, they may not be exercised or transferred except under
the conditions specifi ed in the issue agreement (namely in the
event of a takeover bid for Cap Gemini S.A. shares). The issue
was disclosed in a prospectus approved by the AMF on May 14,
2009 under reference number 09-140.
Employee share ownership plan – @ESOP
(recap 2009)
In the second half of 2009, the Group set-up an employee
share ownership plan (@ESOP). On December 16, 2009, the
Group issued 5,999,999 new shares reserved for employees
with a par value of €8, representing a share capital increase of
€164 million.
The total cost of this employee share ownership plan in 2009
was €1 million and was the result of a mechanism granting
employees entitlement to capital gains on shares in countries
where the set-up of an Employees Savings Mutual Fund (FCPE)
was not possible or appropriate.
Treasury shares and management of share capital and market risks
The Group does not hold any shares for fi nancial investment
purposes and does not have any interests in listed companies.
However, at December 31, 2011, under the share buyback
program Cap Gemini S.A. holds:
• 403,500 treasury shares following the implementation of a
liquidity agreement (the associated liquidity line amounts to
€10 million), pursuant to the related share buyback program
described in a prospectus published on May 12, 2011;
• 1,799,750 treasury shares representing 1.2% of the share
capital at December 31, 2011, purchased between January 17
and 25, 2008, at an average price of €34.48, representing a
decrease of 200,250 in the number of shares available.
At December 31, 2011, the value of these treasury shares was
deducted from consolidated equity in the amount of €84 million.
In view of the small number of treasury shares held, the Group
is not therefore exposed to significant equity risk. Finally, as
the value of treasury shares is deducted from equity, changes
in the share price have no impact on the Consolidated Income
Statement.
The Group’s capital management strateg y is designed
to maintain a strong capital base in view of supporting the
continued development of its business activities and delivering
a return to shareholders, while adopting a prudent approach to
debt as evidenced by the use of the debt-to-equity ratio as a key
performance indicator. At December 31, 2009, 2010 and 2011,
the Group had a positive net cash position. In order to preserve
and control the structure of its capital, the Group can issue new
shares, buy back its own shares or adjust the dividend paid to
shareholders.
Currency risk and translation gains and losses on the accounts of subsidiaries with a functional currency other than the euro
Regarding risks arising on the translation of the foreign
currency accounts of consolidated subsidiaries, as a substantial
proportion of the Group’s consolidated revenues are generated
in the UK and the US (20% and 16% respectively in 2011),
fluctuations in the pound sterling and the US dollar against
the euro may have an impact on the consolidated financial
statements. The positive impact on translation reserves is
mainly due to the appreciation of the US dollar against the euro
during 2011.
For example, a 10% fluctuation in the pound sterling-euro
exchange rate would trigger a corresponding 2% change in
revenues and 2% change in operating margin. Similarly, a 10%
fl uctuation in the US dollar-euro exchange rate would trigger a
corresponding 1.6% change in revenues and a 1.7% change in
operating margin.
The Group does not hedge risks arising on the translation of
the foreign currency accounts of consolidated subsidiaries
whose functional currency is not the euro. The main exchange
rates used for the preparation of the fi nancial statements are
presented in Note 1-B – Accounting policies: Foreign currency
translation.
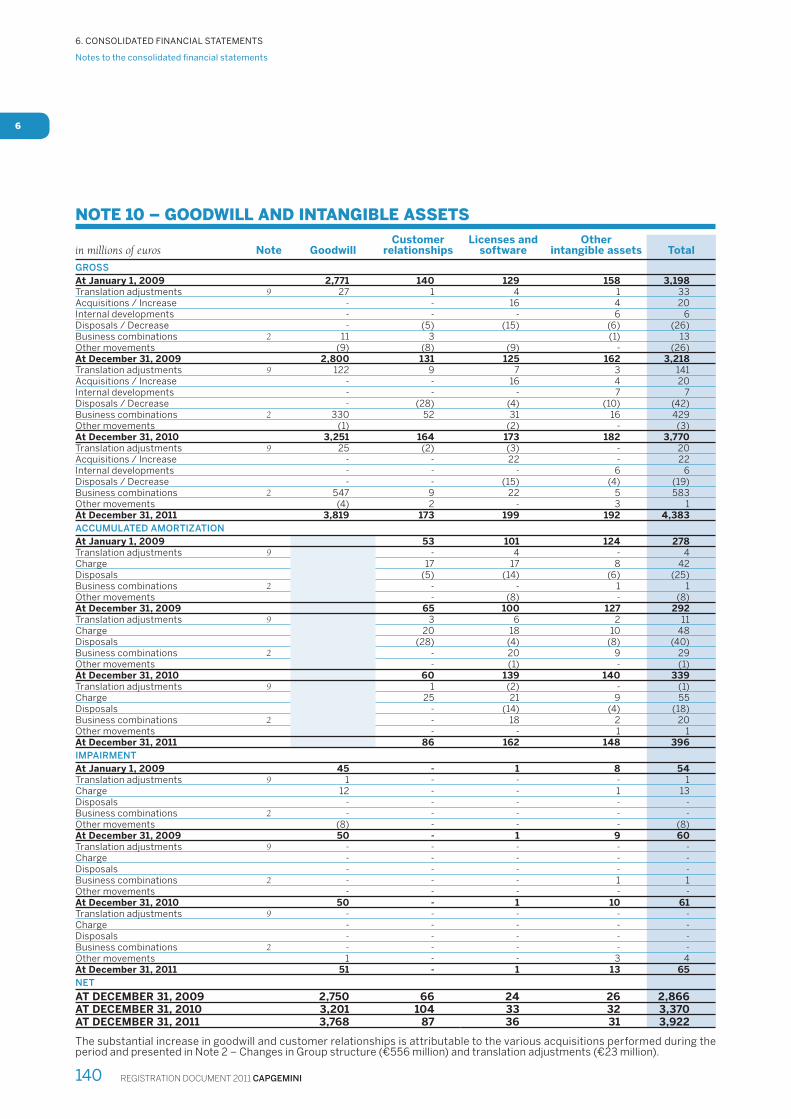
REGISTRATION DOCUMENT 2011 CAPGEMINI140
Notes to the consolidated fi nancial statements
6. CONSOLIDATED FINANCIAL STATEMENTS
6
NOTE 10 – GOODWILL AND INTANGIBLE ASSETS
in millions of euros Note GoodwillCustomer
relationshipsLicenses and
softwareOther
intangible assets Total
GROSS
At January 1, 2009 2,771 140 129 158 3,198Translation adjustments 9 27 1 4 1 33Acquisitions / Increase - - 16 4 20Internal developments - - - 6 6Disposals / Decrease - (5) (15) (6) (26)Business combinations 2 11 3 (1) 13Other movements (9) (8) (9) - (26)At December 31, 2009 2,800 131 125 162 3,218Translation adjustments 9 122 9 7 3 141Acquisitions / Increase - - 16 4 20Internal developments - - - 7 7Disposals / Decrease - (28) (4) (10) (42)Business combinations 2 330 52 31 16 429Other movements (1) (2) - (3)At December 31, 2010 3,251 164 173 182 3,770Translation adjustments 9 25 (2) (3) - 20Acquisitions / Increase - - 22 - 22Internal developments - - - 6 6Disposals / Decrease - - (15) (4) (19)Business combinations 2 547 9 22 5 583Other movements (4) 2 - 3 1At December 31, 2011 3,819 173 199 192 4,383
ACCUMULATED AMORTIZATION
At January 1, 2009 53 101 124 278Translation adjustments 9 - 4 - 4Charge 17 17 8 42Disposals (5) (14) (6) (25)Business combinations 2 - - 1 1Other movements - (8) - (8)At December 31, 2009 65 100 127 292Translation adjustments 9 3 6 2 11Charge 20 18 10 48Disposals (28) (4) (8) (40)Business combinations 2 - 20 9 29Other movements - (1) - (1)At December 31, 2010 60 139 140 339Translation adjustments 9 1 (2) - (1)Charge 25 21 9 55Disposals - (14) (4) (18)Business combinations 2 - 18 2 20Other movements - - 1 1At December 31, 2011 86 162 148 396
IMPAIRMENT
At January 1, 2009 45 - 1 8 54Translation adjustments 9 1 - - - 1Charge 12 - - 1 13Disposals - - - - -Business combinations 2 - - - - -Other movements (8) - - - (8)At December 31, 2009 50 - 1 9 60Translation adjustments 9 - - - - -Charge - - - - -Disposals - - - - -Business combinations 2 - - - 1 1Other movements - - - - -At December 31, 2010 50 - 1 10 61Translation adjustments 9 - - - - -Charge - - - - -Disposals - - - - -Business combinations 2 - - - - -Other movements 1 - - 3 4At December 31, 2011 51 - 1 13 65
NET
AT DECEMBER 31, 2009 2,750 66 24 26 2,866 AT DECEMBER 31, 2010 3,201 104 33 32 3,370AT DECEMBER 31, 2011 3,768 87 36 31 3,922
The substantial increase in goodwill and customer relationships is attributable to the various acquisitions performed during the period and presented in Note 2 – Changes in Group structure (€556 million) and translation adjustments (€23 million).
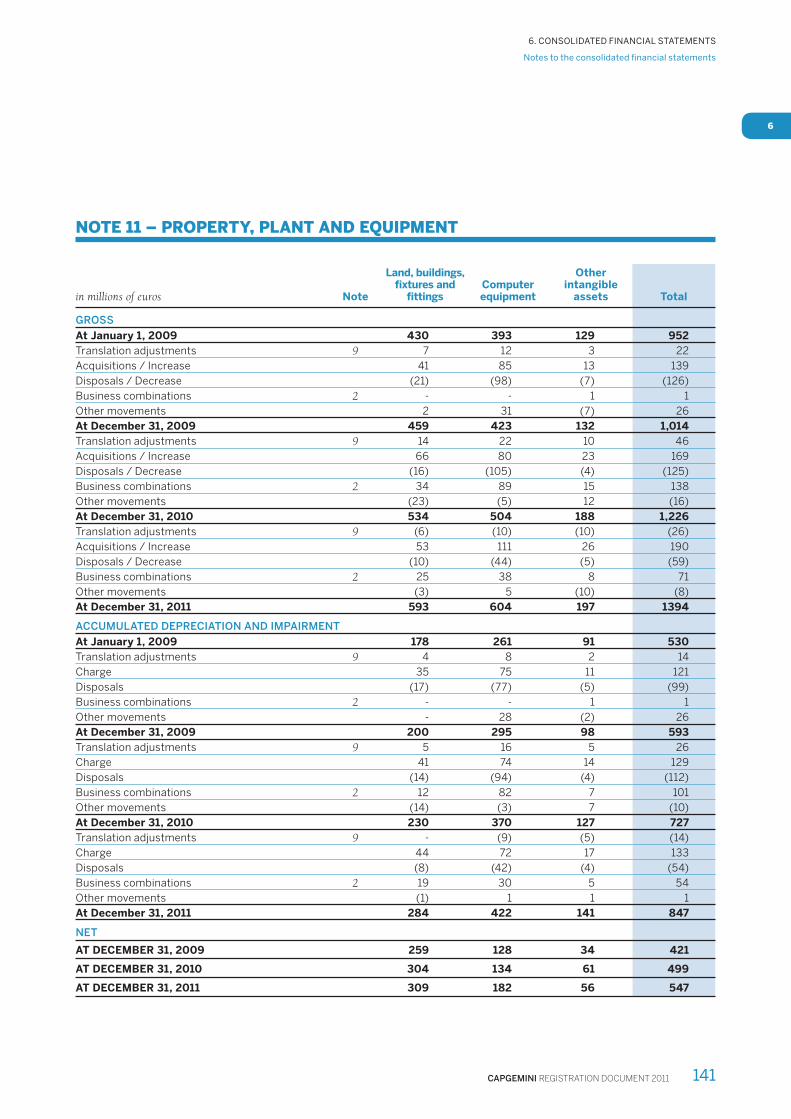
CAPGEMINI REGISTRATION DOCUMENT 2011 141
Notes to the consolidated fi nancial statements
6. CONSOLIDATED FINANCIAL STATEMENTS
6
NOTE 11 – PROPERTY, PLANT AND EQUIPMENT
in millions of euros Note
Land, buildings, fixtures and
fittingsComputer equipment
Other intangible
assets Total
GROSS
At January 1, 2009 430 393 129 952
Translation adjustments 9 7 12 3 22
Acquisitions / Increase 41 85 13 139
Disposals / Decrease (21) (98) (7) (126)
Business combinations 2 - - 1 1
Other movements 2 31 (7) 26
At December 31, 2009 459 423 132 1,014
Translation adjustments 9 14 22 10 46
Acquisitions / Increase 66 80 23 169
Disposals / Decrease (16) (105) (4) (125)
Business combinations 2 34 89 15 138
Other movements (23) (5) 12 (16)
At December 31, 2010 534 504 188 1,226
Translation adjustments 9 (6) (10) (10) (26)
Acquisitions / Increase 53 111 26 190
Disposals / Decrease (10) (44) (5) (59)
Business combinations 2 25 38 8 71
Other movements (3) 5 (10) (8)
At December 31, 2011 593 604 197 1394
ACCUMULATED DEPRECIATION AND IMPAIRMENT
At January 1, 2009 178 261 91 530
Translation adjustments 9 4 8 2 14
Charge 35 75 11 121
Disposals (17) (77) (5) (99)
Business combinations 2 - - 1 1
Other movements - 28 (2) 26
At December 31, 2009 200 295 98 593
Translation adjustments 9 5 16 5 26
Charge 41 74 14 129
Disposals (14) (94) (4) (112)
Business combinations 2 12 82 7 101
Other movements (14) (3) 7 (10)
At December 31, 2010 230 370 127 727
Translation adjustments 9 - (9) (5) (14)
Charge 44 72 17 133
Disposals (8) (42) (4) (54)
Business combinations 2 19 30 5 54
Other movements (1) 1 1 1
At December 31, 2011 284 422 141 847
NET
AT DECEMBER 31, 2009 259 128 34 421
AT DECEMBER 31, 2010 304 134 61 499
AT DECEMBER 31, 2011 309 182 56 547
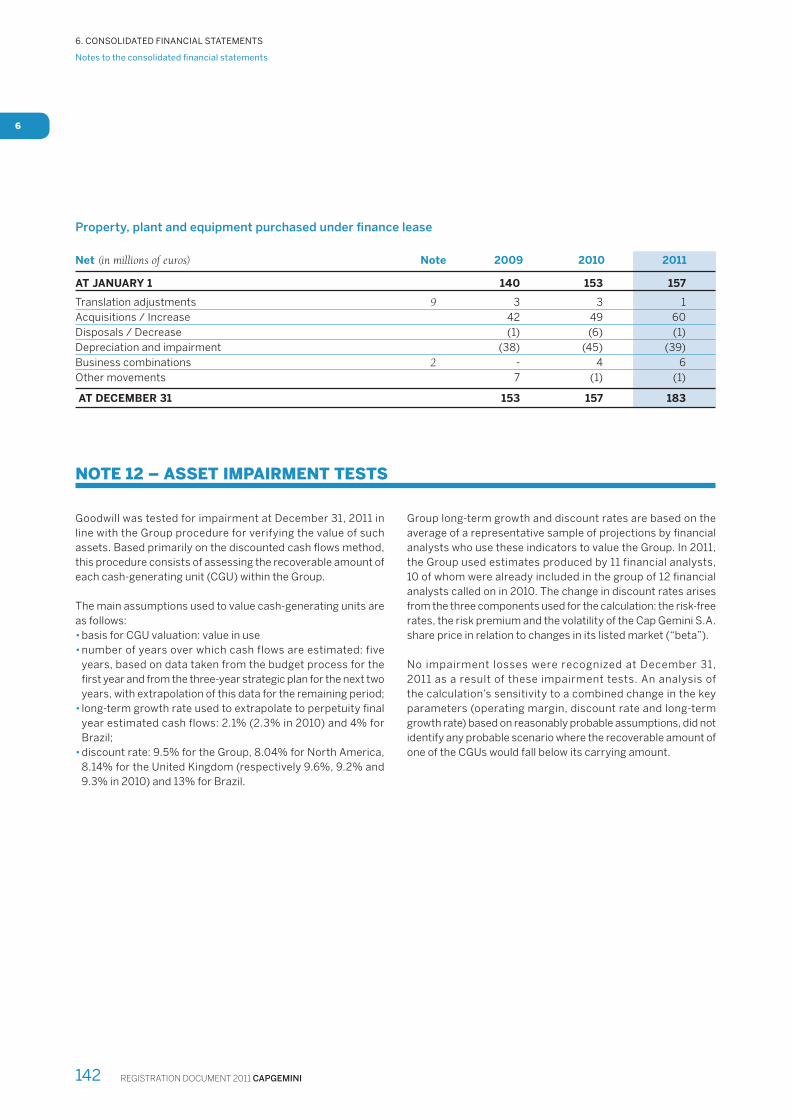
REGISTRATION DOCUMENT 2011 CAPGEMINI142
Notes to the consolidated fi nancial statements
6. CONSOLIDATED FINANCIAL STATEMENTS
6
Property, plant and equipment purchased under fi nance lease
Net (in millions of euros) Note 2009 2010 2011
AT JANUARY 1 140 153 157
Translation adjustments 9 3 3 1
Acquisitions / Increase 42 49 60
Disposals / Decrease (1) (6) (1)
Depreciation and impairment (38) (45) (39)
Business combinations 2 - 4 6
Other movements 7 (1) (1)
AT DECEMBER 31 153 157 183
NOTE 12 – ASSET IMPAIRMENT TESTS
Goodwill was tested for impairment at December 31, 2011 in
line with the Group procedure for verifying the value of such
assets. Based primarily on the discounted cash fl ows method,
this procedure consists of assessing the recoverable amount of
each cash-generating unit (CGU) within the Group.
The main assumptions used to value cash-generating units are
as follows:
• basis for CGU valuation: value in use
• number of years over which cash flows are estimated: five
years, based on data taken from the budget process for the
fi rst year and from the three-year strategic plan for the next two
years, with extrapolation of this data for the remaining period;
• long-term growth rate used to extrapolate to perpetuity fi nal
year estimated cash flows: 2.1% (2.3% in 2010) and 4% for
Brazil;
• discount rate: 9.5% for the Group, 8.04% for North America,
8.14% for the United Kingdom (respectively 9.6%, 9.2% and
9.3% in 2010) and 13% for Brazil.
Group long-term growth and discount rates are based on the
average of a representative sample of projections by fi nancial
analysts who use these indicators to value the Group. In 2011,
the Group used estimates produced by 11 financial analysts,
10 of whom were already included in the group of 12 fi nancial
analysts called on in 2010. The change in discount rates arises
from the three components used for the calculation: the risk-free
rates, the risk premium and the volatility of the Cap Gemini S.A.
share price in relation to changes in its listed market (“beta”).
No impairment losses were recognized at December 31,
2011 as a result of these impairment tests. An analysis of
the calculation’s sensitivity to a combined change in the key
parameters (operating margin, discount rate and long-term
growth rate) based on reasonably probable assumptions, did not
identify any probable scenario where the recoverable amount of
one of the CGUs would fall below its carrying amount.
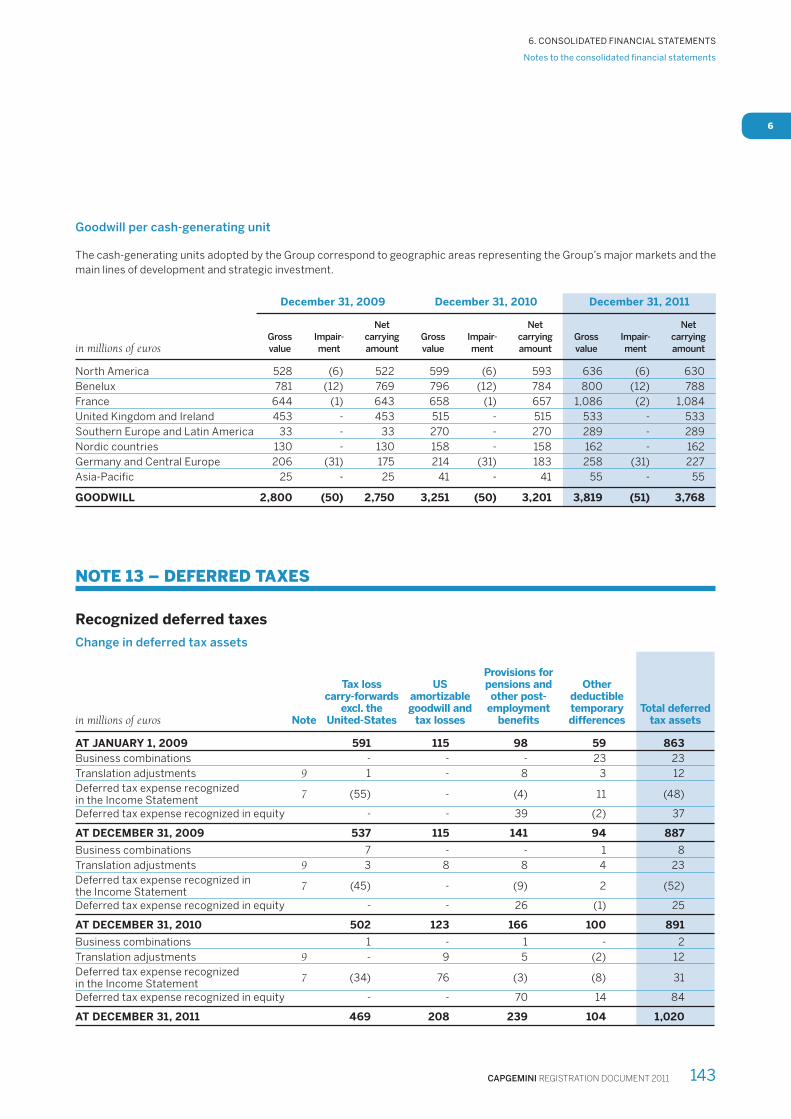
CAPGEMINI REGISTRATION DOCUMENT 2011 143
Notes to the consolidated fi nancial statements
6. CONSOLIDATED FINANCIAL STATEMENTS
6
Goodwill per cash-generating unit
The cash-generating units adopted by the Group correspond to geographic areas representing the Group’s major markets and the
main lines of development and strategic investment.
December 31, 2009 December 31, 2010 December 31, 2011
in millions of eurosGross
value
Impair-
ment
Net
carrying
amount
Gross
value
Impair-
ment
Net
carrying
amount
Gross
value
Impair-
ment
Net
carrying
amount
North America 528 (6) 522 599 (6) 593 636 (6) 630
Benelux 781 (12) 769 796 (12) 784 800 (12) 788
France 644 (1) 643 658 (1) 657 1,086 (2) 1,084
United Kingdom and Ireland 453 - 453 515 - 515 533 - 533
Southern Europe and Latin America 33 - 33 270 - 270 289 - 289
Nordic countries 130 - 130 158 - 158 162 - 162
Germany and Central Europe 206 (31) 175 214 (31) 183 258 (31) 227
Asia-Pacific 25 - 25 41 - 41 55 - 55
GOODWILL 2,800 (50) 2,750 3,251 (50) 3,201 3,819 (51) 3,768
NOTE 13 – DEFERRED TAXES
Recognized deferred taxes
Change in deferred tax assets
in millions of euros Note
Tax loss carry-forwards
excl. the United-States
US amortizable goodwill and
tax losses
Provisions for pensions and other post-
employment benefits
Other deductible temporary differences
Total deferred tax assets
AT JANUARY 1, 2009 591 115 98 59 863
Business combinations - - - 23 23
Translation adjustments 9 1 - 8 3 12
Deferred tax expense recognized in the Income Statement
7 (55) - (4) 11 (48)
Deferred tax expense recognized in equity - - 39 (2) 37
AT DECEMBER 31, 2009 537 115 141 94 887
Business combinations 7 - - 1 8
Translation adjustments 9 3 8 8 4 23
Deferred tax expense recognized in the Income Statement
7 (45) - (9) 2 (52)
Deferred tax expense recognized in equity - - 26 (1) 25
AT DECEMBER 31, 2010 502 123 166 100 891
Business combinations 1 - 1 - 2
Translation adjustments 9 - 9 5 (2) 12
Deferred tax expense recognized in the Income Statement
7 (34) 76 (3) (8) 31
Deferred tax expense recognized in equity - - 70 14 84
AT DECEMBER 31, 2011 469 208 239 104 1,020
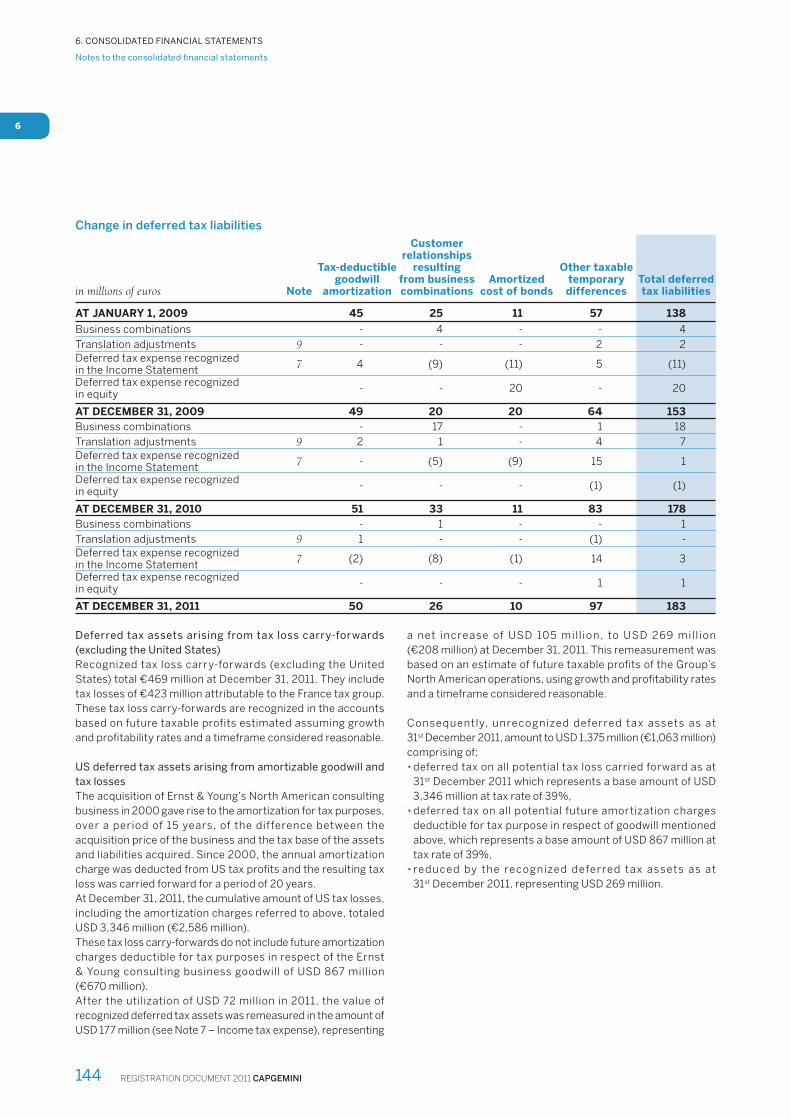
REGISTRATION DOCUMENT 2011 CAPGEMINI144
Notes to the consolidated fi nancial statements
6. CONSOLIDATED FINANCIAL STATEMENTS
6
Change in deferred tax liabilities
in millions of euros Note
Tax-deductible goodwill
amortization
Customer relationships
resulting from business combinations
Amortized cost of bonds
Other taxable temporary differences
Total deferred tax liabilities
AT JANUARY 1, 2009 45 25 11 57 138
Business combinations - 4 - - 4
Translation adjustments 9 - - - 2 2Deferred tax expense recognized in the Income Statement
7 4 (9) (11) 5 (11)
Deferred tax expense recognized in equity
- - 20 - 20
AT DECEMBER 31, 2009 49 20 20 64 153
Business combinations - 17 - 1 18
Translation adjustments 9 2 1 - 4 7Deferred tax expense recognized in the Income Statement
7 - (5) (9) 15 1
Deferred tax expense recognized in equity
- - - (1) (1)
AT DECEMBER 31, 2010 51 33 11 83 178
Business combinations - 1 - - 1
Translation adjustments 9 1 - - (1) -Deferred tax expense recognized in the Income Statement
7 (2) (8) (1) 14 3
Deferred tax expense recognized in equity
- - - 1 1
AT DECEMBER 31, 2011 50 26 10 97 183
Deferred tax assets arising from tax loss carry-forwards
(excluding the United States)
Recognized tax loss carry-forwards (excluding the United
States) total €469 million at December 31, 2011. They include
tax losses of €423 million attributable to the France tax group.
These tax loss carry-forwards are recognized in the accounts
based on future taxable profits estimated assuming growth
and profi tability rates and a timeframe considered reasonable.
US deferred tax assets arising from amortizable goodwill and
tax losses
The acquisition of Ernst & Young’s North American consulting
business in 2000 gave rise to the amortization for tax purposes,
over a period of 15 years, of the difference between the
acquisition price of the business and the tax base of the assets
and liabilities acquired. Since 2000, the annual amortization
charge was deducted from US tax profi ts and the resulting tax
loss was carried forward for a period of 20 years.
At December 31, 2011, the cumulative amount of US tax losses,
including the amortization charges referred to above, totaled
USD 3,346 million (€2,586 million).
These tax loss carry-forwards do not include future amortization
charges deductible for tax purposes in respect of the Ernst
& Young consulting business goodwill of USD 867 million
(€670 million).
After the utilization of USD 72 million in 2011, the value of
recognized deferred tax assets was remeasured in the amount of
USD 177 million (see Note 7 – Income tax expense), representing
a net increase of USD 105 mil l ion, to USD 269 mil l ion
(€208 million) at December 31, 2011. This remeasurement was
based on an estimate of future taxable profi ts of the Group’s
North American operations, using growth and profi tability rates
and a timeframe considered reasonable.
Consequently, unrecognized deferred tax assets as at
31st December 2011, amount to USD 1,375 million (€1,063 million)
comprising of:
• deferred tax on all potential tax loss carried forward as at
31st December 2011 which represents a base amount of USD
3,346 million at tax rate of 39%,
• deferred tax on all potential future amortization charges
deductible for tax purpose in respect of goodwill mentioned
above, which represents a base amount of USD 867 million at
tax rate of 39%,
• reduced by the recognized deferred tax assets as at
31st December 2011, representing USD 269 million.
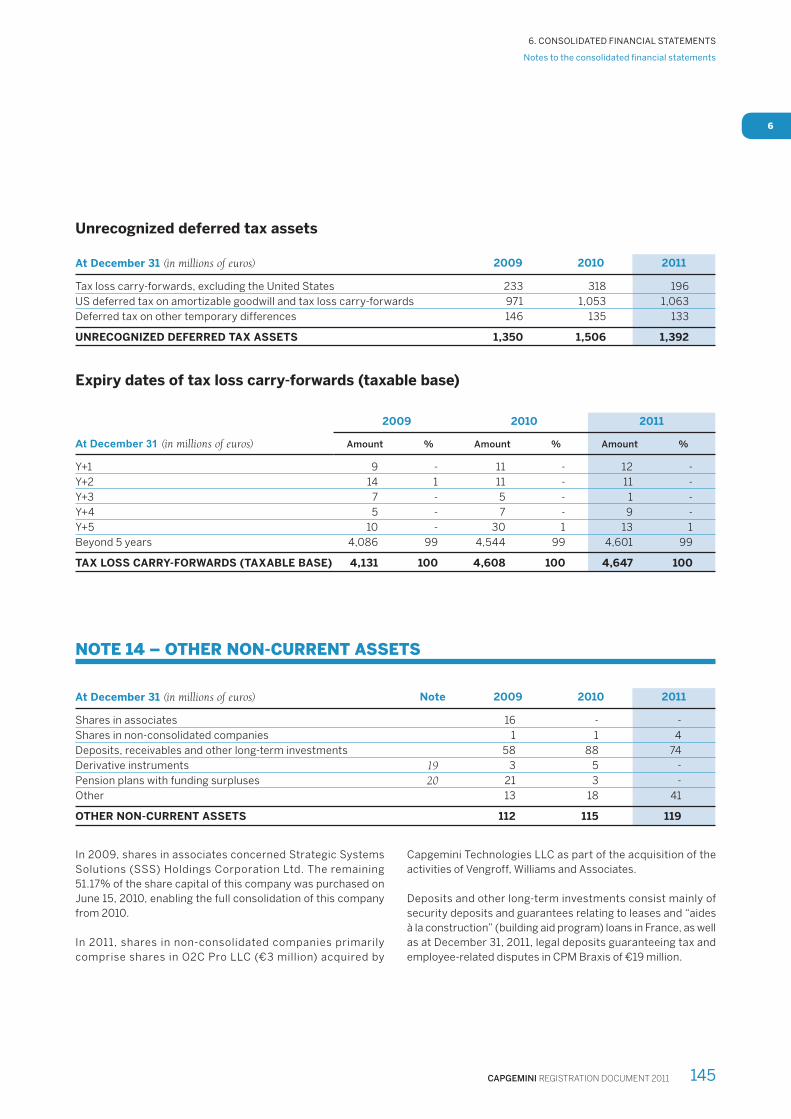
CAPGEMINI REGISTRATION DOCUMENT 2011 145
Notes to the consolidated fi nancial statements
6. CONSOLIDATED FINANCIAL STATEMENTS
6
Unrecognized deferred tax assets
At December 31 (in millions of euros) 2009 2010 2011
Tax loss carry-forwards, excluding the United States 233 318 196
US deferred tax on amortizable goodwill and tax loss carry-forwards 971 1,053 1,063
Deferred tax on other temporary differences 146 135 133
UNRECOGNIZED DEFERRED TAX ASSETS 1,350 1,506 1,392
Expiry dates of tax loss carry-forwards (taxable base)
At December 31 (in millions of euros)
2009 2010 2011
Amount % Amount % Amount %
Y+1 9 - 11 - 12 -
Y+2 14 1 11 - 11 -
Y+3 7 - 5 - 1 -
Y+4 5 - 7 - 9 -
Y+5 10 - 30 1 13 1
Beyond 5 years 4,086 99 4,544 99 4,601 99
TAX LOSS CARRY-FORWARDS (TAXABLE BASE) 4,131 100 4,608 100 4,647 100
NOTE 14 – OTHER NON-CURRENT ASSETS
At December 31 (in millions of euros) Note 2009 2010 2011
Shares in associates 16 - -
Shares in non-consolidated companies 1 1 4
Deposits, receivables and other long-term investments 58 88 74
Derivative instruments 19 3 5 -
Pension plans with funding surpluses 20 21 3 -
Other 13 18 41
OTHER NON-CURRENT ASSETS 112 115 119
In 2009, shares in associates concerned Strategic Systems
Solutions (SSS) Holdings Corporation Ltd. The remaining
51.17% of the share capital of this company was purchased on
June 15, 2010, enabling the full consolidation of this company
from 2010.
In 2011, shares in non-consolidated companies primarily
comprise shares in O2C Pro LLC (€3 million) acquired by
Capgemini Technologies LLC as part of the acquisition of the
activities of Vengroff, Williams and Associates.
Deposits and other long-term investments consist mainly of
security deposits and guarantees relating to leases and “aides
à la construction” (building aid program) loans in France, as well
as at December 31, 2011, legal deposits guaranteeing tax and
employee-related disputes in CPM Braxis of €19 million.
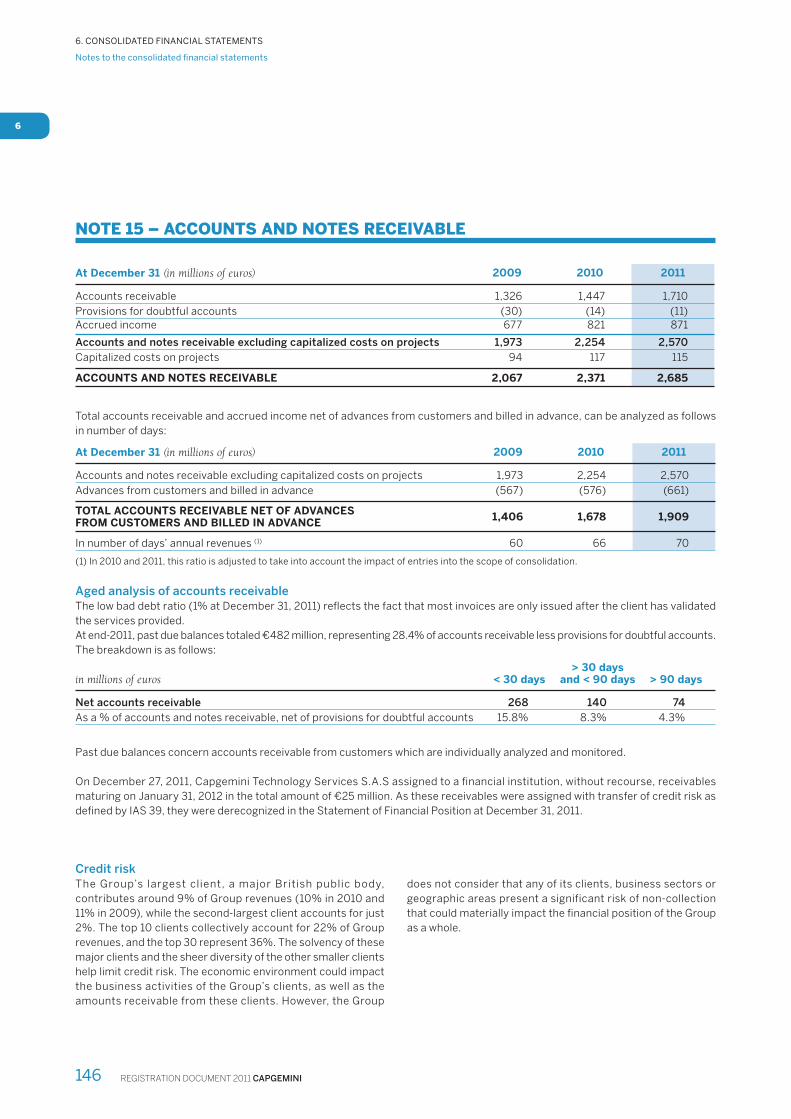
REGISTRATION DOCUMENT 2011 CAPGEMINI146
Notes to the consolidated fi nancial statements
6. CONSOLIDATED FINANCIAL STATEMENTS
6
NOTE 15 – ACCOUNTS AND NOTES RECEIVABLE
At December 31 (in millions of euros) 2009 2010 2011
Accounts receivable 1,326 1,447 1,710
Provisions for doubtful accounts (30) (14) (11)Accrued income 677 821 871
Accounts and notes receivable excluding capitalized costs on projects 1,973 2,254 2,570
Capitalized costs on projects 94 117 115
ACCOUNTS AND NOTES RECEIVABLE 2,067 2,371 2,685
Total accounts receivable and accrued income net of advances from customers and billed in advance, can be analyzed as follows
in number of days:
At December 31 (in millions of euros) 2009 2010 2011
Accounts and notes receivable excluding capitalized costs on projects 1,973 2,254 2,570
Advances from customers and billed in advance (567) (576) (661)
TOTAL ACCOUNTS RECEIVABLE NET OF ADVANCES FROM CUSTOMERS AND BILLED IN ADVANCE
1,406 1,678 1,909
In number of days’ annual revenues (1) 60 66 70
(1) In 2010 and 2011, this ratio is adjusted to take into account the impact of entries into the scope of consolidation.
Aged analysis of accounts receivable
The low bad debt ratio (1% at December 31, 2011) refl ects the fact that most invoices are only issued after the client has validated
the services provided.
At end-2011, past due balances totaled €482 million, representing 28.4% of accounts receivable less provisions for doubtful accounts.
The breakdown is as follows:
in millions of euros < 30 days> 30 days
and < 90 days > 90 days
Net accounts receivable 268 140 74
As a % of accounts and notes receivable, net of provisions for doubtful accounts 15.8% 8.3% 4.3%
Past due balances concern accounts receivable from customers which are individually analyzed and monitored.
On December 27, 2011, Capgemini Technology Services S.A.S assigned to a fi nancial institution, without recourse, receivables
maturing on January 31, 2012 in the total amount of €25 million. As these receivables were assigned with transfer of credit risk as
defi ned by IAS 39, they were derecognized in the Statement of Financial Position at December 31, 2011.
Credit risk
The Group’s largest client, a major British public body,
contributes around 9% of Group revenues (10% in 2010 and
11% in 2009), while the second-largest client accounts for just
2%. The top 10 clients collectively account for 22% of Group
revenues, and the top 30 represent 36%. The solvency of these
major clients and the sheer diversity of the other smaller clients
help limit credit risk. The economic environment could impact
the business activities of the Group’s clients, as well as the
amounts receivable from these clients. However, the Group
does not consider that any of its clients, business sectors or
geographic areas present a significant risk of non-collection
that could materially impact the fi nancial position of the Group
as a whole.

CAPGEMINI REGISTRATION DOCUMENT 2011 147
Notes to the consolidated fi nancial statements
6. CONSOLIDATED FINANCIAL STATEMENTS
6
NOTE 16 – OTHER CURRENT RECEIVABLES
At December 31 (in millions of euros) Note 2009 2010 2011
Social security and tax-related receivables, other than income tax 79 126 171
Prepaid expenses 106 119 154
Derivative instruments 19 7 22 12
Other 11 39 33
OTHER CURRENT RECEIVABLES 203 306 370
At December 31, 2011, “Social security and tax-related receivables, other than income tax” include research tax credit receivables
in the amount of €53 million (€26 million at December 31, 2010, deducted from amounts due to employees).
NOTE 17 – NET CASH AND CASH EQUIVALENTS
At December 31 (in millions of euros) Note 2009 2010 2011
Cash management assets - 71 73
Short-term investments 2,109 1,912 1,877
Cash at bank 494 393 346
Asset/liability derivative instruments on cash items 19 1 8 10
Bank overdrafts (liability) (7) (6) (9)
Cash and cash equivalents 18 2,597 2,307 2,224
Bonds (969) (1,001) (1,036)
Obligations under finance leases (87) (88) (96)
Draw-downs on bank and similar facilities - (8) (2)
Other borrowings (1) (5) (1)
Long-term borrowings (1,057) (1,102) (1,135)
Bonds (211) (24) (422)
Obligations under finance leases (42) (51) (51)
Draw-downs on bank and similar facilities (8) (85) (209)Other borrowings 19 (10) (44) (11)
Short-term borrowings (271) (204) (693)
Borrowings (1,328) (1,306) (1,828)
Derivative instruments on borrowings - (9) (15)
NET CASH AND CASH EQUIVALENTS 1,269 1,063 454
Cash management assets
In 2010, Cap Gemini S.A. invested in capitalization contracts as
part of the active management of its cash and cash equivalents.
These contracts are presented in “Cash management assets”
(see Note 1-M – Accounting policies: Net Cash and cash
equivalents) and may be cancelled by the Company at any time
without penalty.
Cash and cash equivalents
At December 31, 2011, cash equivalents mainly consist of money
market mutual funds (FCP and SICAV), certifi cates of deposit,
commercial paper and term bank deposits.
Derivative instruments on cash items represent a receivable
of €10 million at December 31, 2011, corresponding to the fair
value of hedging instruments taken out in connection with
inter-company fi nancing transactions at Cap Gemini S.A. This
receivable is classifi ed under “Other current receivables” in the
Consolidated Statement of Financial Position (compared to a
receivable of €8 million at December 31, 2010).

REGISTRATION DOCUMENT 2011 CAPGEMINI148
Notes to the consolidated fi nancial statements
6. CONSOLIDATED FINANCIAL STATEMENTS
6
Borrowings
Bonds
2011 Bond issue
On November 18, 2011, Cap Gemini S.A. performed a euro
bond issue maturing on November 29, 2016 (2011 Bond issue).
Bondholders enjoy all rights from November 29, 2011.
The total amount of the issue was €500 million, comprising
5,000 bonds with a nominal value of €100,000 each. The bonds
bear interest at 5.25% per year, potentially increasing to 6.50%
in the event of a down-grading of Cap Gemini S.A.’s credit rating.
The terms and conditions of this issue were set out in the
prospectus approved by the AMF on November 25, 2011 under
reference number 11-546.
The Bond issue is redeemable in full on November 29, 2016.
Summary of the main terms and conditions of the 2011
bond issue
Redemption at maturity
The bonds are redeemable in full on November 29, 2016.
Early redemption at the Company’s option
The bonds are redeemable at the Company’s option under
cer tain conditions set out in the issue prospectus and
particularly concerning the minimum redemption price.
Early redemption at the option of bondholders
Bondholders may request the early redemption of all or
part of their bonds in the event of a change in control of the
Company, provided this change in control is accompanied by a
downgrading of the Company’s fi nancial rating.
Early repayment
At the initiative of a majority of bondholders, particularly in
the event of a failure to pay sums due or to comply with other
obligations set out in the documentation (beyond any “grace”
periods, if applicable), cross default (in excess of a minimum
threshold), liquidation, dissolution or sale of all of the Company’s
assets.
An upgrade or downgrade in Cap Gemini S.A.’s credit rating
would not constitute an early redemption event.
Pari passu status
Cap Gemini S.A. has undertaken that the bonds will rank pari
passu with all other bonds issued by the Company.
OCEANE 2009” convertible bonds
On April 8, 2009, Cap Gemini S.A. issued bonds convertible/
exchangeable into new or existing Cap Gemini S.A. shares,
maturing on January 1, 2014 (“OCEANE 2009”). Bondholders
enjoy all rights from April 20, 2009.
The total amount of the issue was €575 million, comprising
16,911,765 bonds with a nominal value of €34 each, resulting in
an issue premium of 35% compared to the Company benchmark
share price. The bonds bear interest at 3.5% per year. They
may be converted at any time commencing April 20, 2009 and
are redeemable at par on January 1, 2014 if not converted. The
terms and conditions of this issue were set out in the prospectus
approved by the AMF on April 8, 2009 under reference number
09-084.
OCEANE 2005” convertible bonds and partial redemption
On June 16, 2005, Cap Gemini S.A. issued bonds convertible/
exchangeable into new or existing Cap Gemini S.A. shares,
maturing on January 1, 2012 (“OCEANE 2005”). Bondholders
enjoy all rights from June 24, 2005.
The total amount of the issue was €437 million, comprising
11,810,810 bonds with a nominal value of €37 each. The bonds
bear interest at 1% per year. They may be converted at any
time commencing June 24, 2005 and are redeemable at a
price of €41.90 per bond, representing approximately 113.2%
of their nominal unit value, on January 1, 2012 if not converted.
The terms and conditions of this issue were set out in the
prospectus approved by the AMF on June 16, 2005 under
reference number 05-564.
In November 2011, Cap Gemini S.A. redeemed a total of
2,350,000 bonds in a number of transactions for an amount of
€99 million, at an average price of €42.18 per bond. Redeemed
bonds were cancelled pursuant to the provisions set-out in the
prospectus. At December 31, 2011, 9,460,810 OCEANE 2005
bonds remained outstanding, representing 80.1% of the number
of bonds initially issued. The remaining bonds were redeemed
in full on January 2, 2012.
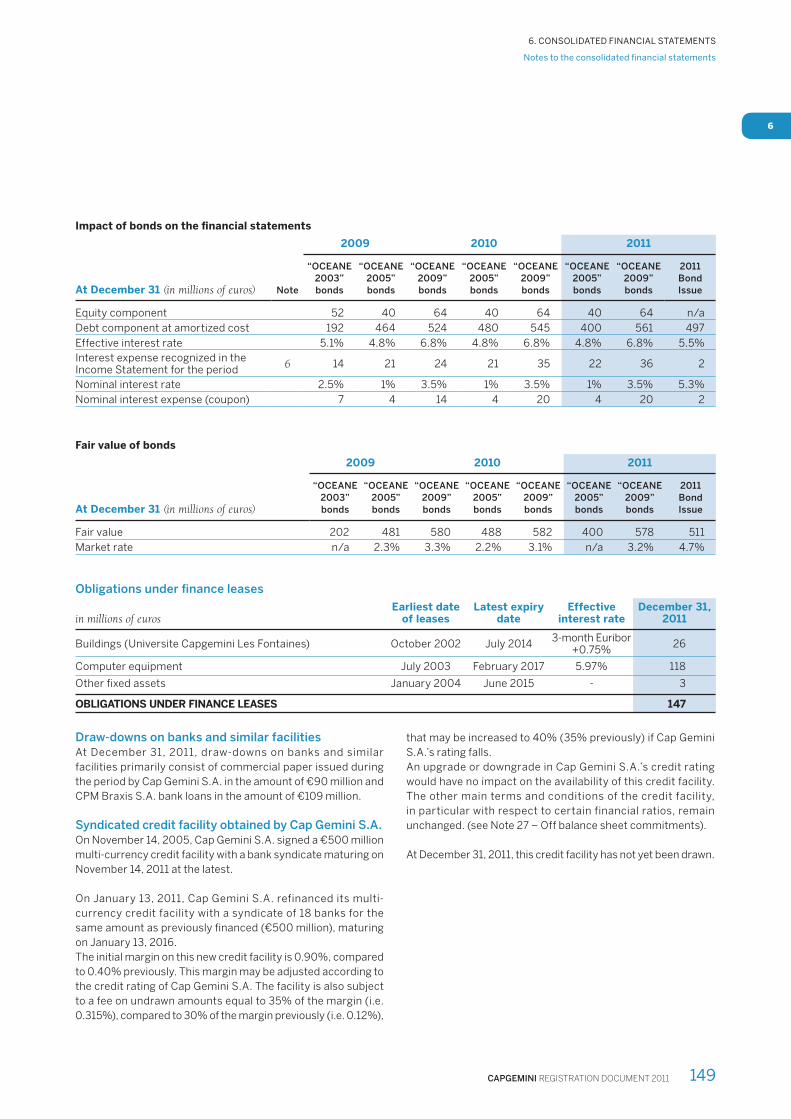
CAPGEMINI REGISTRATION DOCUMENT 2011 149
Notes to the consolidated fi nancial statements
6. CONSOLIDATED FINANCIAL STATEMENTS
6
Impact of bonds on the fi nancial statements
2009 2010 2011
At December 31 (in millions of euros) Note
“OCEANE
2003”
bonds
“OCEANE
2005”
bonds
“OCEANE
2009”
bonds
“OCEANE
2005”
bonds
“OCEANE
2009”
bonds
“OCEANE
2005”
bonds
“OCEANE
2009”
bonds
2011
Bond
Issue
Equity component 52 40 64 40 64 40 64 n/a
Debt component at amortized cost 192 464 524 480 545 400 561 497
Effective interest rate 5.1% 4.8% 6.8% 4.8% 6.8% 4.8% 6.8% 5.5%
Interest expense recognized in the Income Statement for the period
6 14 21 24 21 35 22 36 2
Nominal interest rate 2.5% 1% 3.5% 1% 3.5% 1% 3.5% 5.3%
Nominal interest expense (coupon) 7 4 14 4 20 4 20 2
Fair value of bonds
2009 2010 2011
At December 31 (in millions of euros)
“OCEANE
2003”
bonds
“OCEANE
2005”
bonds
“OCEANE
2009”
bonds
“OCEANE
2005”
bonds
“OCEANE
2009”
bonds
“OCEANE
2005”
bonds
“OCEANE
2009”
bonds
2011
Bond
Issue
Fair value 202 481 580 488 582 400 578 511
Market rate n/a 2.3% 3.3% 2.2% 3.1% n/a 3.2% 4.7%
Obligations under fi nance leases
in millions of eurosEarliest date
of leasesLatest expiry
dateEffective
interest rateDecember 31,
2011
Buildings (Universite Capgemini Les Fontaines) October 2002 July 20143-month Euribor
+0.75%26
Computer equipment July 2003 February 2017 5.97% 118
Other fixed assets January 2004 June 2015 - 3
OBLIGATIONS UNDER FINANCE LEASES 147
Draw-downs on banks and similar facilities
At December 31, 2011, draw-downs on banks and similar
facilities primarily consist of commercial paper issued during
the period by Cap Gemini S.A. in the amount of €90 million and
CPM Braxis S.A. bank loans in the amount of €109 million.
Syndicated credit facility obtained by Cap Gemini S.A.
On November 14, 2005, Cap Gemini S.A. signed a €500 million
multi-currency credit facility with a bank syndicate maturing on
November 14, 2011 at the latest.
On January 13, 2011, Cap Gemini S.A. refinanced its multi-
currency credit facility with a syndicate of 18 banks for the
same amount as previously fi nanced (€500 million), maturing
on January 13, 2016.
The initial margin on this new credit facility is 0.90%, compared
to 0.40% previously. This margin may be adjusted according to
the credit rating of Cap Gemini S.A. The facility is also subject
to a fee on undrawn amounts equal to 35% of the margin (i.e.
0.315%), compared to 30% of the margin previously (i.e. 0.12%),
that may be increased to 40% (35% previously) if Cap Gemini
S.A.’s rating falls.
An upgrade or downgrade in Cap Gemini S.A.’s credit rating
would have no impact on the availability of this credit facility.
The other main terms and conditions of the credit facility,
in particular with respect to certain financial ratios, remain
unchanged. (see Note 27 – Off balance sheet commitments).
At December 31, 2011, this credit facility has not yet been drawn.
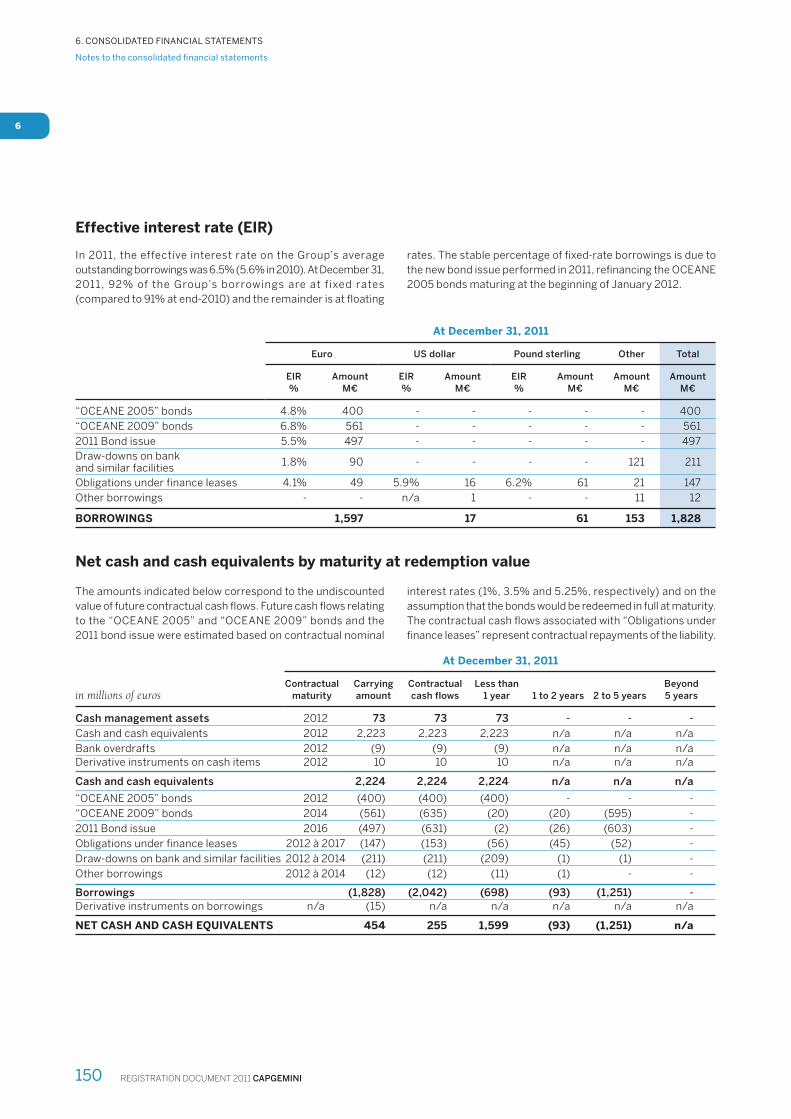
REGISTRATION DOCUMENT 2011 CAPGEMINI150
Notes to the consolidated fi nancial statements
6. CONSOLIDATED FINANCIAL STATEMENTS
6
Effective interest rate (EIR)
In 2011, the effective interest rate on the Group’s average
outstanding borrowings was 6.5% (5.6% in 2010). At December 31,
2011, 92% of the Group’s borrowings are at fixed rates
(compared to 91% at end-2010) and the remainder is at fl oating
rates. The stable percentage of fi xed-rate borrowings is due to
the new bond issue performed in 2011, refi nancing the OCEANE
2005 bonds maturing at the beginning of January 2012.
At December 31, 2011
Euro US dollar Pound sterling Other Total
EIR
%
Amount
M€
EIR
%
Amount
M€
EIR
%
Amount
M€
Amount
M€
Amount
M€
“OCEANE 2005” bonds 4.8% 400 - - - - - 400
“OCEANE 2009” bonds 6.8% 561 - - - - - 561
2011 Bond issue 5.5% 497 - - - - - 497
Draw-downs on bank and similar facilities
1.8% 90 - - - - 121 211
Obligations under finance leases 4.1% 49 5.9% 16 6.2% 61 21 147
Other borrowings - - n/a 1 - - 11 12
BORROWINGS 1,597 17 61 153 1,828
Net cash and cash equivalents by maturity at redemption value
The amounts indicated below correspond to the undiscounted
value of future contractual cash fl ows. Future cash fl ows relating
to the “OCEANE 2005” and “OCEANE 2009” bonds and the
2011 bond issue were estimated based on contractual nominal
interest rates (1%, 3.5% and 5.25%, respectively) and on the
assumption that the bonds would be redeemed in full at maturity.
The contractual cash fl ows associated with “Obligations under
fi nance leases” represent contractual repayments of the liability.
in millions of euros
At December 31, 2011
Contractual
maturity
Carrying
amount
Contractual
cash flows
Less than
1 year 1 to 2 years 2 to 5 years
Beyond
5 years
Cash management assets 2012 73 73 73 - - -
Cash and cash equivalents 2012 2,223 2,223 2,223 n/a n/a n/a
Bank overdrafts 2012 (9) (9) (9) n/a n/a n/aDerivative instruments on cash items 2012 10 10 10 n/a n/a n/a
Cash and cash equivalents 2,224 2,224 2,224 n/a n/a n/a
“OCEANE 2005” bonds 2012 (400) (400) (400) - - -
“OCEANE 2009” bonds 2014 (561) (635) (20) (20) (595) -
2011 Bond issue 2016 (497) (631) (2) (26) (603) -
Obligations under finance leases 2012 à 2017 (147) (153) (56) (45) (52) -
Draw-downs on bank and similar facilities 2012 à 2014 (211) (211) (209) (1) (1) -
Other borrowings 2012 à 2014 (12) (12) (11) (1) - -
Borrowings (1,828) (2,042) (698) (93) (1,251) -
Derivative instruments on borrowings n/a (15) n/a n/a n/a n/a n/a
NET CASH AND CASH EQUIVALENTS 454 255 1,599 (93) (1,251) n/a
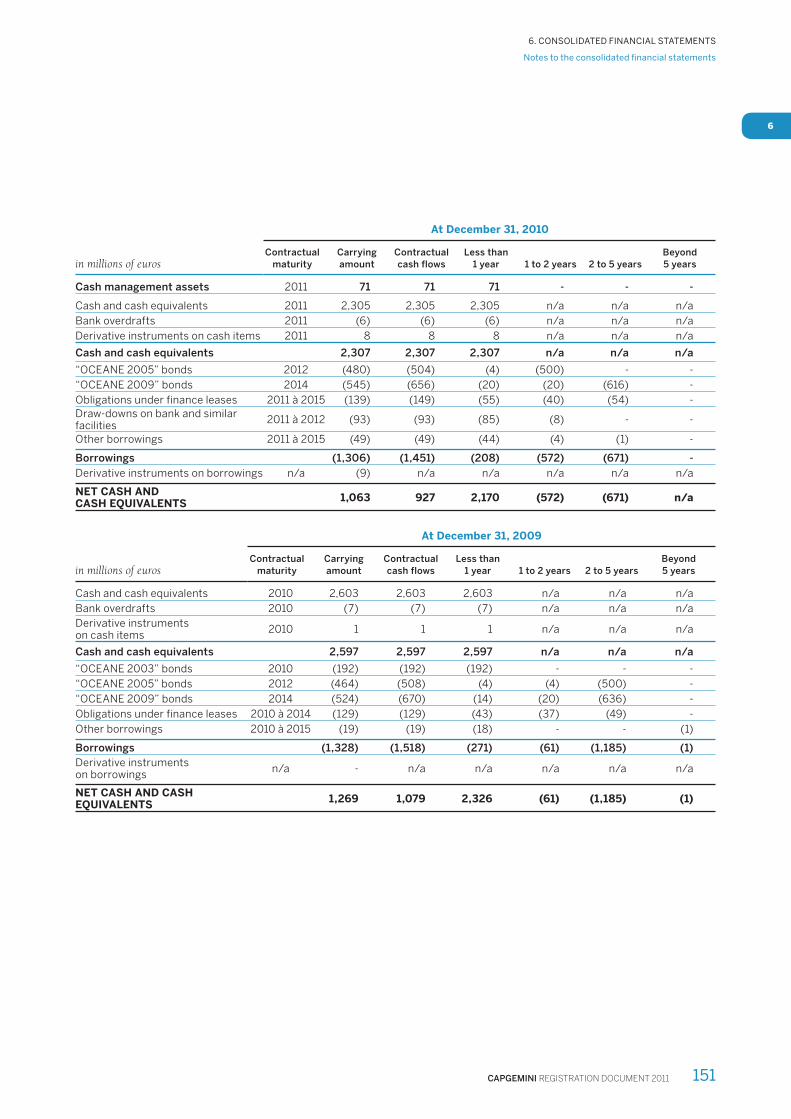
CAPGEMINI REGISTRATION DOCUMENT 2011 151
Notes to the consolidated fi nancial statements
6. CONSOLIDATED FINANCIAL STATEMENTS
6
in millions of euros
At December 31, 2010
Contractual
maturity
Carrying
amount
Contractual
cash flows
Less than
1 year 1 to 2 years 2 to 5 years
Beyond
5 years
Cash management assets 2011 71 71 71 - - -
Cash and cash equivalents 2011 2,305 2,305 2,305 n/a n/a n/a
Bank overdrafts 2011 (6) (6) (6) n/a n/a n/a
Derivative instruments on cash items 2011 8 8 8 n/a n/a n/a
Cash and cash equivalents 2,307 2,307 2,307 n/a n/a n/a
“OCEANE 2005” bonds 2012 (480) (504) (4) (500) - -
“OCEANE 2009” bonds 2014 (545) (656) (20) (20) (616) -
Obligations under finance leases 2011 à 2015 (139) (149) (55) (40) (54) -Draw-downs on bank and similar facilities
2011 à 2012 (93) (93) (85) (8) - -
Other borrowings 2011 à 2015 (49) (49) (44) (4) (1) -
Borrowings (1,306) (1,451) (208) (572) (671) -
Derivative instruments on borrowings n/a (9) n/a n/a n/a n/a n/a
NET CASH AND CASH EQUIVALENTS
1,063 927 2,170 (572) (671) n/a
in millions of euros
At December 31, 2009
Contractual
maturity
Carrying
amount
Contractual
cash flows
Less than
1 year 1 to 2 years 2 to 5 years
Beyond
5 years
Cash and cash equivalents 2010 2,603 2,603 2,603 n/a n/a n/a
Bank overdrafts 2010 (7) (7) (7) n/a n/a n/a
Derivative instruments on cash items
2010 1 1 1 n/a n/a n/a
Cash and cash equivalents 2,597 2,597 2,597 n/a n/a n/a
“OCEANE 2003” bonds 2010 (192) (192) (192) - - -
“OCEANE 2005” bonds 2012 (464) (508) (4) (4) (500) -
“OCEANE 2009” bonds 2014 (524) (670) (14) (20) (636) -
Obligations under finance leases 2010 à 2014 (129) (129) (43) (37) (49) -
Other borrowings 2010 à 2015 (19) (19) (18) - - (1)
Borrowings (1,328) (1,518) (271) (61) (1,185) (1)
Derivative instruments on borrowings
n/a - n/a n/a n/a n/a n/a
NET CASH AND CASH EQUIVALENTS
1,269 1,079 2,326 (61) (1,185) (1)

REGISTRATION DOCUMENT 2011 CAPGEMINI152
Notes to the consolidated fi nancial statements
6. CONSOLIDATED FINANCIAL STATEMENTS
6
Net cash and cash equivalents and liquidity risk
The financial liabilities whose repayability could expose the
Group to liquidity risk are mainly the two convertible bonds
(“OCEANE 2005” and “OCEANE 2009”) and the new 2011
bond issue. However, the OCEANE 2005 bond was defi nitively
redeemed on January 2, 2012.
To manage the liquidity risk that may arise on repayability of
fi nancial liabilities, the Group has implemented a conservative
fi nancing policy mainly based on:
• prudent use of debt leveraging, coupled with limited use of
any clauses that could lead to early repayment of borrowings;
• maintaining a high level of available funds at all times
(€2,297 million at December 31, 2011), which could be
increased by a multi-currency syndicated line of credit of
€500 million (undrawn to date);
• actively managing the due dates of fi nancial liabilities in order
to limit the concentration of borrowings maturities;
• using diverse sources of financing, allowing the Group to
reduce its reliance on certain categories of lenders.
Net cash and cash equivalents and credit risk
Financial assets which could expose the Group to a credit or
counterparty risk mainly consists of fi nancial investments: in
accordance with Group policy, cash balances are not invested
in equity-linked products, but in (i) negotiable debt securities
(certificates of deposit and commercial paper), (ii) deposits
and accounts, (iii) capitalization contracts or (iv) short-term
money market mutual funds, subject to minimum credit rating
and diversifi cation rules.
At December 31, 2011, shor t-term investments totaled
€1,877 million and comprise mainly (i) money market mutual
funds meeting the criteria defi ned by the AMF for classifi cation
in the “monetary category”; and (ii) negotiable debt securities
maturing within three months or immediately available, issued
by highly rated companies or fi nancial institutions (minimum
rating of A2/P2 or equivalent). Consequently, these short-term
investments do not expose the Group to any material credit risk.
NOTE 18 – CASH FLOWS
At December 31, 2011, cash and cash equivalents totaled
€2,224 million (see Note 17 – Net cash and cash equivalents),
down €83 million on December 31, 2010 (€2,307 million).
Excluding the impact of exchange rate fluctuations on cash
and cash equivalents (€12 million), this decrease is €71 million.
Cash fl ow impacts are shown in the Consolidated Statement of
Cash Flows.
Net cash from (used in) operating activities
In 2011, net cash from operating activities totaled €349 million
(compared to €503 million in 2010) and resulted from:
• cash flows from operations before net finance costs and
income tax in the amount of €743 million,
• payment of income taxes in the amount of €104 million,
• an increase in working capital requirements, generating a
negative cash impact of €290 million.
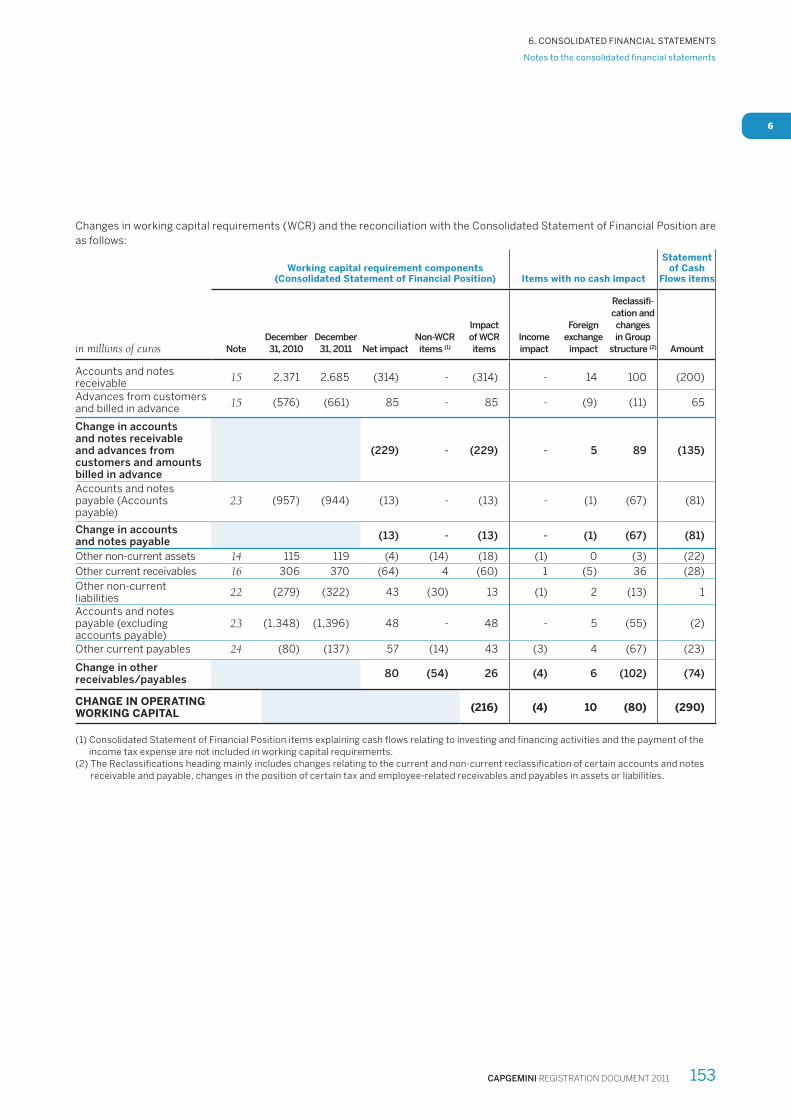
CAPGEMINI REGISTRATION DOCUMENT 2011 153
Notes to the consolidated fi nancial statements
6. CONSOLIDATED FINANCIAL STATEMENTS
6
Changes in working capital requirements (WCR) and the reconciliation with the Consolidated Statement of Financial Position are
as follows:
in millions of euros
Working capital requirement components
(Consolidated Statement of Financial Position) Items with no cash impact
Statement of Cash
Flows items
Note
December
31, 2010
December
31, 2011 Net impact
Non-WCR
items (1)
Impact
of WCR
items
Income
impact
Foreign
exchange
impact
Reclassifi-
cation and
changes
in Group
structure (2) Amount
Accounts and notes receivable
15 2,371 2,685 (314) - (314) - 14 100 (200)
Advances from customers and billed in advance
15 (576) (661) 85 - 85 - (9) (11) 65
Change in accounts and notes receivable and advances from customers and amounts billed in advance
(229) - (229) - 5 89 (135)
Accounts and notes payable (Accounts payable)
23 (957) (944) (13) - (13) - (1) (67) (81)
Change in accounts and notes payable
(13) - (13) - (1) (67) (81)
Other non-current assets 14 115 119 (4) (14) (18) (1) 0 (3) (22)
Other current receivables 16 306 370 (64) 4 (60) 1 (5) 36 (28)
Other non-current liabilities
22 (279) (322) 43 (30) 13 (1) 2 (13) 1
Accounts and notes payable (excluding accounts payable)
23 (1,348) (1,396) 48 - 48 - 5 (55) (2)
Other current payables 24 (80) (137) 57 (14) 43 (3) 4 (67) (23)
Change in other receivables/payables
80 (54) 26 (4) 6 (102) (74)
CHANGE IN OPERATING WORKING CAPITAL
(216) (4) 10 (80) (290)
(1) Consolidated Statement of Financial Position items explaining cash flows relating to investing and financing activities and the payment of the income tax expense are not included in working capital requirements.
(2) The Reclassifications heading mainly includes changes relating to the current and non-current reclassification of certain accounts and notes receivable and payable, changes in the position of certain tax and employee-related receivables and payables in assets or liabilities.
REGISTRATION DOCUMENT 2011 CAPGEMINI154
Notes to the consolidated fi nancial statements
6. CONSOLIDATED FINANCIAL STATEMENTS
6
Net cash from (used in) investing activities
The main components of net cash used in investing activities of
€699 million (compared to €433 million in 2010) refl ect:
• cash outfl ows of €554 million on business combinations, net
of cash and cash equivalents acquired, including primarily the
acquisition of Prosodie for €366 million (acquisition price of
€376 million, cash and cash equivalents acquired of €6 million
and an earn-out of €4 million), CS consulting (€44 million), AIVE
Group (€40 million) and Artésys (€27 million). Acquisition-
related costs disbursed in the year totaled €7 million;
• cash outfl ows of €28 million relating to acquisitions of intangible
assets, net of disposals, mainly involving software for customer
projects or for internal use and internally generated intangible
assets (see Note 10 – Goodwill and intangible assets);
• cash outflows of €127 million relating to acquisitions of
property, plant and equipment, net of disposals, mainly
involving computer purchases for projects or relating to the
partial renewal of IT installations and the renovation, extension
and refurbishment of offi ce space (see Note 11 – Property, plant
and equipment).
Net cash from (used in) fi nancing activities
Net cash inflows as a result of financing activities totaled
€279 million (compared to an outflow €445 million in 2010)
and mainly comprised:
• payment of the 2010 dividend of €154 million;
• a cash inflow of €495 million following the new bond issue
performed in November 2011;
• a cash outflow of €99 million for the partial redemption
of OCEANE 2005 bonds in November 2011;
• a cash infl ow of €90 million in respect of issues of commercial
paper;
• a cash outflow of €54 million in respect of repayments
of obligations under fi nance leases;
• the receipt of €34 million from CPM Braxis non-controlling
interests following their subscription of the December 2011
share capital issue in the amount of BRL 80 million;
• interest paid net of interest received of €30 million.
NOTE 19 – DERIVATIVE INSTRUMENTS AND CURRENCY AND INTEREST RATE RISK MANAGEMENT
Currency risk management
Currency risk management policy
Currency risk and hedging operating transactions
The growing use of offshore production centers located in
India, but also in Poland and Latin America, exposes the Group
to currency risk with respect to some of its production costs.
The Group has therefore implemented a policy aimed at
minimizing and managing these currency risks, mainly due to
internal fl ows with India. The hedging policy is defi ned by the
Group based on periodic reports and implemented primarily
through forward foreign exchange contracts.
These transaction are recognized in accordance with accounting
rules applicable to cash fl ow hedges.
Currency risk and hedging fi nancial transactions
The Group is exposed to the risk of exchange rate fl uctuations
in respect of:
• inter-company financing transactions, mainly within Cap
Gemini S.A.: as inter-company lending and borrowing is
systematically hedged (in particular using forward foreign
exchange contracts), the impact of changes in exchange rates
on the Income Statement is negligible.
• fees paid to Cap Gemini S.A. by subsidiaries whose functional
currency is not the euro. As the majority of these flows are
hedged, the impact of changes in exchange rates on the Income
Statement is not signifi cant.
Currency risk and hedging of other non-current liabilities
During the fi scal year, the Group hedged part of its exposure
to currency risk on the call-put option held respectively by
Capgemini Group and the other shareholders of CPM Braxis
over the share capital not yet held by the Group.
The sensitivity of translation reserves to currency risk is
analyzed in Note 9 - Equity.
Exposure to currency risk
Amounts hedged at December 31, 2011 and detailed below
mainly concern Cap Gemini S.A. for inter-company fi nancing
transactions, and the subsidiary Capgemini India Private Ltd. for
sub-contracting activities performed for other Group regions.
As Capgemini India Private Ltd. invoices its services to Group
ordering entities in US dollar, pound sterling and euro, the
currency risk in respect of production incurred in Indian rupee
is refl ected by exposure to these three currencies.
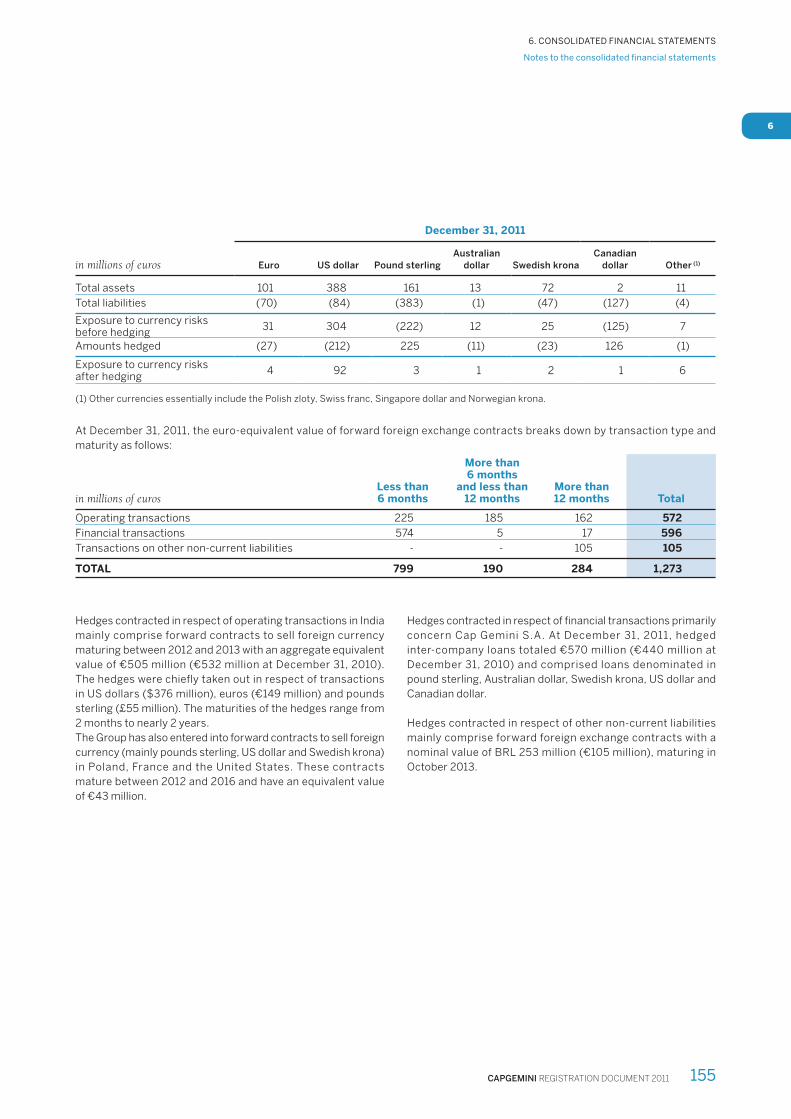
CAPGEMINI REGISTRATION DOCUMENT 2011 155
Notes to the consolidated fi nancial statements
6. CONSOLIDATED FINANCIAL STATEMENTS
6
December 31, 2011
in millions of euros Euro US dollar Pound sterling
Australian
dollar Swedish krona
Canadian
dollar Other (1)
Total assets 101 388 161 13 72 2 11
Total liabilities (70) (84) (383) (1) (47) (127) (4)
Exposure to currency risks before hedging
31 304 (222) 12 25 (125) 7
Amounts hedged (27) (212) 225 (11) (23) 126 (1)
Exposure to currency risks after hedging
4 92 3 1 2 1 6
(1) Other currencies essentially include the Polish zloty, Swiss franc, Singapore dollar and Norwegian krona.
At December 31, 2011, the euro-equivalent value of forward foreign exchange contracts breaks down by transaction type and
maturity as follows:
in millions of eurosLess than 6 months
More than 6 months
and less than 12 months
More than 12 months Total
Operating transactions 225 185 162 572
Financial transactions 574 5 17 596
Transactions on other non-current liabilities - - 105 105
TOTAL 799 190 284 1,273
Hedges contracted in respect of operating transactions in India
mainly comprise forward contracts to sell foreign currency
maturing between 2012 and 2013 with an aggregate equivalent
value of €505 million (€532 million at December 31, 2010).
The hedges were chiefl y taken out in respect of transactions
in US dollars ($376 million), euros (€149 million) and pounds
sterling (£55 million). The maturities of the hedges range from
2 months to nearly 2 years.
The Group has also entered into forward contracts to sell foreign
currency (mainly pounds sterling, US dollar and Swedish krona)
in Poland, France and the United States. These contracts
mature between 2012 and 2016 and have an equivalent value
of €43 million.
Hedges contracted in respect of fi nancial transactions primarily
concern Cap Gemini S.A. At December 31, 2011, hedged
inter-company loans totaled €570 million (€440 million at
December 31, 2010) and comprised loans denominated in
pound sterling, Australian dollar, Swedish krona, US dollar and
Canadian dollar.
Hedges contracted in respect of other non-current liabilities
mainly comprise forward foreign exchange contracts with a
nominal value of BRL 253 million (€105 million), maturing in
October 2013.
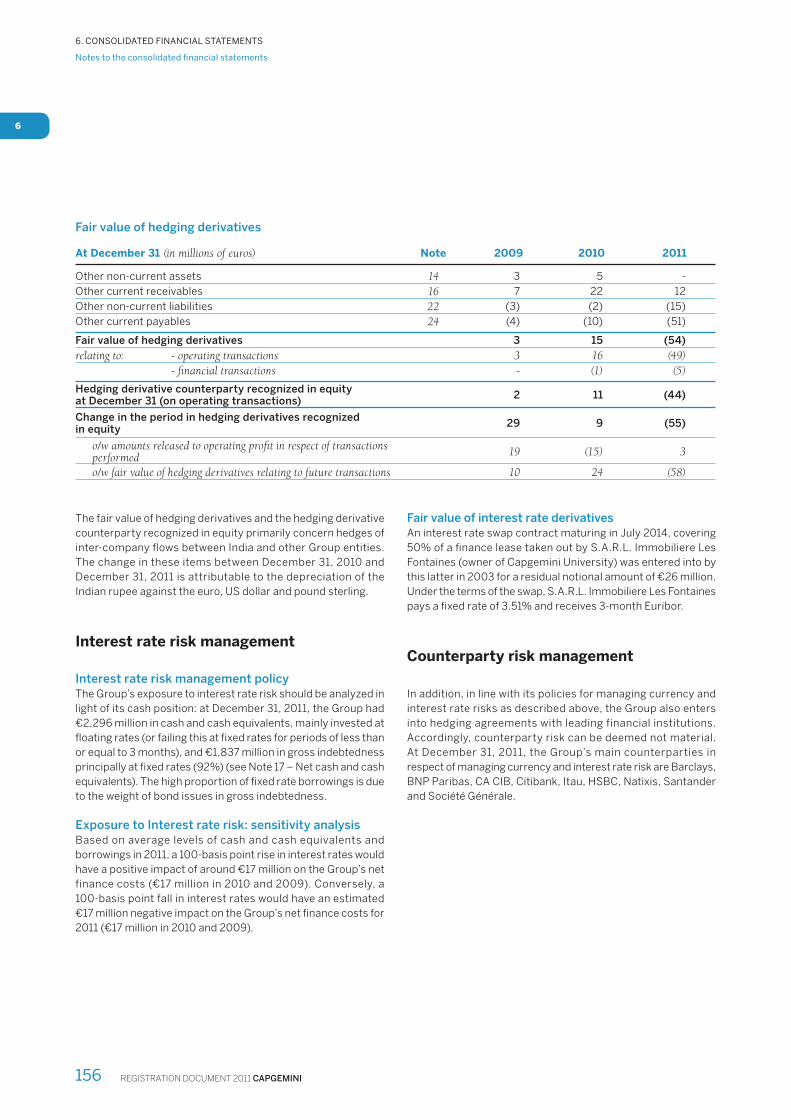
REGISTRATION DOCUMENT 2011 CAPGEMINI156
Notes to the consolidated fi nancial statements
6. CONSOLIDATED FINANCIAL STATEMENTS
6
Fair value of hedging derivatives
At December 31 (in millions of euros) Note 2009 2010 2011
Other non-current assets 14 3 5 -
Other current receivables 16 7 22 12
Other non-current liabilities 22 (3) (2) (15)
Other current payables 24 (4) (10) (51)
Fair value of hedging derivatives 3 15 (54)
relating to: - operating transactions 3 16 (49)
- fi nancial transactions - (1) (5)
Hedging derivative counterparty recognized in equity at December 31 (on operating transactions)
2 11 (44)
Change in the period in hedging derivatives recognized in equity
29 9 (55)
o/w amounts released to operating profi t in respect of transactions performed
19 (15) 3
o/w fair value of hedging derivatives relating to future transactions 10 24 (58)
The fair value of hedging derivatives and the hedging derivative
counterparty recognized in equity primarily concern hedges of
inter-company fl ows between India and other Group entities.
The change in these items between December 31, 2010 and
December 31, 2011 is attributable to the depreciation of the
Indian rupee against the euro, US dollar and pound sterling.
Interest rate risk management
Interest rate risk management policy
The Group’s exposure to interest rate risk should be analyzed in
light of its cash position: at December 31, 2011, the Group had
€2,296 million in cash and cash equivalents, mainly invested at
fl oating rates (or failing this at fi xed rates for periods of less than
or equal to 3 months), and €1,837 million in gross indebtedness
principally at fi xed rates (92%) (see Note 17 – Net cash and cash
equivalents). The high proportion of fi xed rate borrowings is due
to the weight of bond issues in gross indebtedness.
Exposure to Interest rate risk: sensitivity analysis
Based on average levels of cash and cash equivalents and
borrowings in 2011, a 100-basis point rise in interest rates would
have a positive impact of around €17 million on the Group’s net
finance costs (€17 million in 2010 and 2009). Conversely, a
100-basis point fall in interest rates would have an estimated
€17 million negative impact on the Group’s net fi nance costs for
2011 (€17 million in 2010 and 2009).
Fair value of interest rate derivatives
An interest rate swap contract maturing in July 2014, covering
50% of a fi nance lease taken out by S.A.R.L. Immobiliere Les
Fontaines (owner of Capgemini University) was entered into by
this latter in 2003 for a residual notional amount of €26 million.
Under the terms of the swap, S.A.R.L. Immobiliere Les Fontaines
pays a fi xed rate of 3.51% and receives 3-month Euribor.
Counterparty risk management
In addition, in line with its policies for managing currency and
interest rate risks as described above, the Group also enters
into hedging agreements with leading financial institutions.
Accordingly, counterparty risk can be deemed not material.
At December 31, 2011, the Group’s main counterparties in
respect of managing currency and interest rate risk are Barclays,
BNP Paribas, CA CIB, Citibank, Itau, HSBC, Natixis, Santander
and Société Générale.
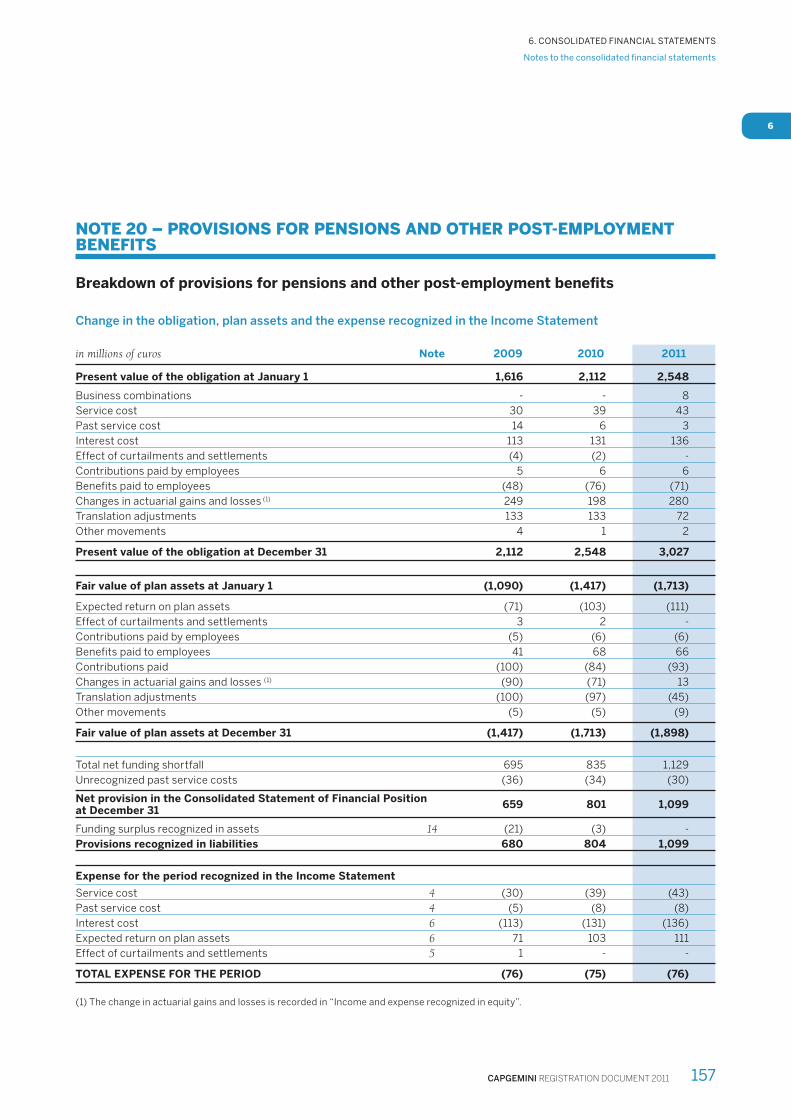
CAPGEMINI REGISTRATION DOCUMENT 2011 157
Notes to the consolidated fi nancial statements
6. CONSOLIDATED FINANCIAL STATEMENTS
6
NOTE 20 – PROVISIONS FOR PENSIONS AND OTHER POST-EMPLOYMENT BENEFITS
Breakdown of provisions for pensions and other post-employment benefi ts
Change in the obligation, plan assets and the expense recognized in the Income Statement
in millions of euros Note 2009 2010 2011
Present value of the obligation at January 1 1,616 2,112 2,548
Business combinations - - 8
Service cost 30 39 43
Past service cost 14 6 3
Interest cost 113 131 136
Effect of curtailments and settlements (4) (2) -
Contributions paid by employees 5 6 6
Benefits paid to employees (48) (76) (71)
Changes in actuarial gains and losses (1) 249 198 280
Translation adjustments 133 133 72
Other movements 4 1 2
Present value of the obligation at December 31 2,112 2,548 3,027
Fair value of plan assets at January 1 (1,090) (1,417) (1,713)
Expected return on plan assets (71) (103) (111)
Effect of curtailments and settlements 3 2 -
Contributions paid by employees (5) (6) (6)
Benefits paid to employees 41 68 66
Contributions paid (100) (84) (93)
Changes in actuarial gains and losses (1) (90) (71) 13
Translation adjustments (100) (97) (45)
Other movements (5) (5) (9)
Fair value of plan assets at December 31 (1,417) (1,713) (1,898)
Total net funding shortfall 695 835 1,129
Unrecognized past service costs (36) (34) (30)
Net provision in the Consolidated Statement of Financial Position at December 31
659 801 1,099
Funding surplus recognized in assets 14 (21) (3) -
Provisions recognized in liabilities 680 804 1,099
Expense for the period recognized in the Income Statement
Service cost 4 (30) (39) (43)
Past service cost 4 (5) (8) (8)
Interest cost 6 (113) (131) (136)
Expected return on plan assets 6 71 103 111
Effect of curtailments and settlements 5 1 - -
TOTAL EXPENSE FOR THE PERIOD (76) (75) (76)
(1) The change in actuarial gains and losses is recorded in “Income and expense recognized in equity”.

REGISTRATION DOCUMENT 2011 CAPGEMINI158
Notes to the consolidated fi nancial statements
6. CONSOLIDATED FINANCIAL STATEMENTS
6
Breakdown of the change by main benefi ciary country
in millions of eurosUnited
Kingdom Canada Other Total
At December 31, 2009
Present value of obligations under funded plans 1,525 305 130 1,960
Fair value of plan assets (1,024) (289) (104) (1,417)
Funding shortfall under funded plans 501 16 26 543
o/w actuarial gains and losses recognized in equity (1) 297 56 8 361
Funding shortfall under unfunded plans - 37 115 152
o/w actuarial gains and losses recognized in equity (1) - (5) 18 13
Total net funding shortfall 501 53 141 695
Unrecognized past service costs - - (36) (36)
Net provision in the Consolidated Statement of Financial Position 501 53 105 659
Funding surplus recognized in assets - (5) (16) (21)
Provisions recognized in liabilities 501 58 121 680
At December 31, 2010
Present value of obligations under funded plans 1,827 368 167 2,362
Fair value of plan assets (1,251) (341) (121) (1,713)
Funding shortfall under funded plans 576 27 46 649
o/w actuarial gains and losses recognized in equity (1) 398 75 13 486
Funding shortfall under unfunded plans - 58 128 186
o/w actuarial gains and losses recognized in equity (1) - 6 25 31
Total net funding shortfall 576 85 174 835
Unrecognized past service costs - - (34) (34)
Net provision in the Consolidated Statement of Financial Position 576 85 140 801
Funding surplus recognized in assets - - (3) (3)
Provisions recognized in liabilities 576 85 143 804
At December 31, 2011
Present value of obligations under funded plans 2,187 425 180 2,792
Fair value of plan assets (1,428) (345) (125) (1,898)
Funding shortfall under funded plans 759 80 55 894
o/w actuarial gains and losses recognized in equity (1) 619 141 20 780
Funding shortfall under unfunded plans 85 150 235
o/w actuarial gains and losses recognized in equity (1) 27 28 55
Total net funding shortfall 759 165 205 1,129
Unrecognized past service costs - - (30) (30)
Net provision in the Consolidated Statement of Financial Position 759 165 175 1,099
Funding surplus recognized in assets - - - -
Provisions recognized in liabilities 759 165 175 1,099
(1) Actuarial gains and losses are recorded in “Income and expense recognized in equity.
The countries included in the “Other” column are the United States, Sweden, Norway, France, Germany, Austria, Switzerland, the
Netherlands, Italy and India. These countries represent 16% of net provisions in the Consolidated Statement of Financial Position.

CAPGEMINI REGISTRATION DOCUMENT 2011 159
Notes to the consolidated fi nancial statements
6. CONSOLIDATED FINANCIAL STATEMENTS
6
Principal actuarial assumptions
Discount rate and salary infl ation rate
%
2009 2010 2011
United Kingdom Canada Other
Discount rate 3.3 - 8.3 2.4 - 8.4 4.7 5.2 2.9 - 8.8
Salary inflation rate 1.0 - 7.0 1.0 - 7.0 3.9 3.3 1.5 - 10.0
In 2011, the benchmark indexes used to calculate discount rates were identical to those used in previous years.
Plan assets and the expected and actual return on plan assets
Expected return Actual return
in millions of euros Amount %
United
Kingdom Canada Other
United
Kingdom Canada Other
At December 31, 2009
Shares 841 59 8.0 8.5 6.3 - 8.3 17.6 - 26.6 11.6 - 12.2 (2.5) - 32.2
Bonds 509 36 5.9 4.0 2.1 - 4.7 7.0 - 9.2 7.1 (2.5) - 23.3
Real estate assets 14 1 6.5 - 3.9 (6.1) - (2.5) - 9.8
Cash and cash equivalents 31 2 3.8 1.0 3.9 0.8 (1.5) - (1.1) 0.2
Other 22 2 - - (6.6) - 12.2 - - (12.3) - 9.8
TOTAL 1,417 100
At December 31, 2010
Shares 1,015 59 8.0 8.5 3.0 - 8.7 12.8 - 16.3 8.6 - 8.8 0.9 - 13.5Bonds 595 35 5.5 4.0 1.5 - 4.5 9.4 - 11.0 9.0 - 9.2 0.9 - 8.5
Real estate assets 3 - - - 3.0 - 3.9 - - 0.9 - 8.5
Cash and cash equivalents 71 4 3.8 1.0 0.8 - 3.0 1.3 (1.4) - (1.3) 0.1 - 8.5
Other 29 2 - - 3.8 - 5.9 - - 0.9 - 24.3
TOTAL 1,713 100
At December 31, 2011
Shares 1,068 56 8.0 7.5 4.3 - 10.1 (5.7) - (4.8) (4.1) - (4.0) 1.5 - 3.3
Bonds 752 40 4.7 4.0 2.0 - 4.6 15.3 - 15.8 10.8 1.5 - 6.2
Real estate assets 3 - 6.5 - 3.0 - 4.0 - - 1.5 - 3.0
Cash and cash equivalents 44 2 3.8 1.0 0.5 - 4.0 0.5 (1.2) - (0.8) -
Other 31 2 - - (2.3) - 9.4 - - 0.9 - 9.4
TOTAL 1,898 100
In the United Kingdom, expected rates of returns are validated
by experts. For shares, the expected rate of return is based on a
study of a selection of leading companies in the United Kingdom
which takes account of the maturity of obligations hedged and
forecast expected returns based on past trends. The expected
rate of return on bonds is determined based on the discount
rate used for the obligation, that is, the expected rate of return
on corporate bonds rated AA.
In Canada, expected rates of return are determined in
accordance with a model based on economic data observable
in fi nancial markets (assumptions on the profi tability of shares
and bonds, validated by expert analyses).

REGISTRATION DOCUMENT 2011 CAPGEMINI160
Notes to the consolidated fi nancial statements
6. CONSOLIDATED FINANCIAL STATEMENTS
6
Employees covered by pension plans
2009 2010 2011
At December 31 Total Total
United
Kingdom Canada Other Total
Current employees – accruing pensionable service
44,626 54,284 1,160 2,697 57,581 61,438
Former and current employees – not accruing pensionable service
12,101 12,014 8,607 225 3,047 11,879
Retirees 2,288 2,538 1,843 639 338 2,820
TOTAL 59,015 68,836 11,610 3,561 60,966 76,137
The increase in employees in 2011 is chiefl y attributable to the
expansion of Group operations in India. At December 31, 2011, a
total of 35,932 employees were eligible for these pension plans
in India, versus 30,621 employees at December 31, 2010.
Analysis of the change in provisions for pensions and other post-employment benefi ts
Change in regulatory context: pension reform
in France
The pension reforms adopted in France and resulting in the
lengthening of the period of activity, did not have a material
impact on the amount of retirement termination payments.
Impact on the Income Statement: change in the
service cost and the interest cost
In 2011, the expense recognized in operating margin in respect
of the service cost and the past service cost is €51 million and
mainly concerns France (€16 million), Canada (€14 million) and
the United Kingdom (€12 million). The increase in the service
cost in 2011 compared to 2010 (€4 million) was mainly due to
the decrease in discount rates between 2009 and 2010 in the
majority of regions and particularly Canada.
The net impact of the interest cost (discounting of the obligation)
and the expected return on plan assets was a fi nancial expense
of €25 million (mainly concerning the United Kingdom for
€15 million). The decrease in this financial expense in 2011
compared to 2010 (€3 million) was due to:
• the increase in the fair value of plan assets as a result of the
rise in contributions paid by the Group, as well as the positive
impact of the slight increase in the expected average rate of
return for the main pension regime in the United Kingdom.
The overall impact was a decrease in the net fi nancial expense
of €8 million,
• the favorable impact tied to the fall in interest rates in the
majority of regions was nonetheless more than offset by the
increase in the net present value of obligations, particularly in
the United Kingdom, resulting in an increase in the net fi nancial
expense of €5 million.
Impact on equity: change in actuarial gains and
losses
Actuarial gains and losses reflect increases or decreases
in the present value of the obligation or the fair value of the
related plan assets. Actuarial gains and losses include (i) the
impact of changes in actuarial assumptions and (ii) experience
adjustments, refl ecting differences between projected actuarial
assumptions and what has actually occurred.
2009 2010 2011
At December 31 Total Total
United
Kingdom Canada Other Total
Impact of changes in actuarial assumptions 257 186 240 61 5 306Experience adjustments, o/w: (98) (59) (39) 22 4 (13)
Adjustment on liabilities (1) (8) 12 (29) 2 1 (26)
Adjustment on assets (2) (90) (71) (10) 20 3 13
IMPACT ON INCOME AND EXPENSE RECOGNIZED IN EQUITY
159 127 201 83 9 293
(1) +: increase in liabilities / -: decrease in liabilities(2) -: increase in assets / +: decrease in assets

CAPGEMINI REGISTRATION DOCUMENT 2011 161
Notes to the consolidated fi nancial statements
6. CONSOLIDATED FINANCIAL STATEMENTS
6
Impact of changes in actuarial assumptions
Changes in actuarial assumptions (essentially the discount rate
and the expected rate of return on plan assets) generated an
actuarial loss in 2011 of €293 million. This loss is attributable
to changes in actuarial assumptions between 2010 and 2011,
particularly in the United Kingdom and Canada where discount
rates dropped by 83 and 45 basis points, respectively.
Experience adjustments
Experience adjustments result from differences between
projected actuarial assumptions and what has actually occurred
during the fi scal year. The impact of experiences adjustments
on the value of plan assets was an actuarial loss of €13 million,
primarily due to an actuarial loss of €20 million in Canada (as
actual rates of return were lower than expected rates of return)
partially offset by an actuarial gain of €10 million in the UK (as
actual rates of return were higher than expected rates of return).
Other impacts on the statement of fi nancial position:
contributions, benefi ts and translation adjustments
Contributions paid by the Group totaled €93 million in 2011,
including €61 million in the United Kingdom and €24 million in
Canada.
The benefi ts paid to employees of €71 million mainly involved
the United Kingdom (€30 million) and Canada (€26 million).
The €27 million increase in provisions for pensions for translation
adjustments, was due to the appreciation, in particular, of the
pound sterling (€23 million) and the Canadian dollar (€3 million)
during the period.
In the United Kingdom, the defi ned benefi t section of the main
Capgemini UK Plc. pension plan terminated on March 31, 2008
for the large majority of beneficiaries. In exchange, these
individuals were given the opportunity to join the defined
contribution section of this plan. In accordance with the
recommendations put forward by the UK Pensions Regulator,
Capgemini UK Plc. has committed to fund the shortfall identifi ed
at the last three-year valuation up to July 2018.
Sensitivity analysis
Analysis of the sensitivity of the present value of the obligation in the United Kingdom
The impact of a change of 50 basis points in the discount rate and the infl ation rate on the present value of the obligation in the United
Kingdom, which represents 72% of the total Group obligation at December 31, 2011, is presented below:
in millions of euros ImpactPresent value of obligation
Present value of the obligation at December 31, 2011 2,187
Increase of 50 basis points in the discount rate (204) 1,983
Decrease of 50 basis points in the discount rate 236 2,423
Increase of 50 basis points in the inflation rate 194 2,381
Decrease of 50 basis points in the inflation rate (200) 1,987
Analysis of the sensitivity of healthcare assistance
costs
Healthcare assistance costs exclusively concern Canada. For
2009, 2010 and 2011, a 1% change in healthcare assistance
costs would have an impact of plus or minus €2 million in the
Consolidated Income Statement (service cost and interest
cost). The impact of this 1% change would range from negative
€13 million to positive €16 million in the Consolidated Statement
of Financial Position at December 31, 2011.
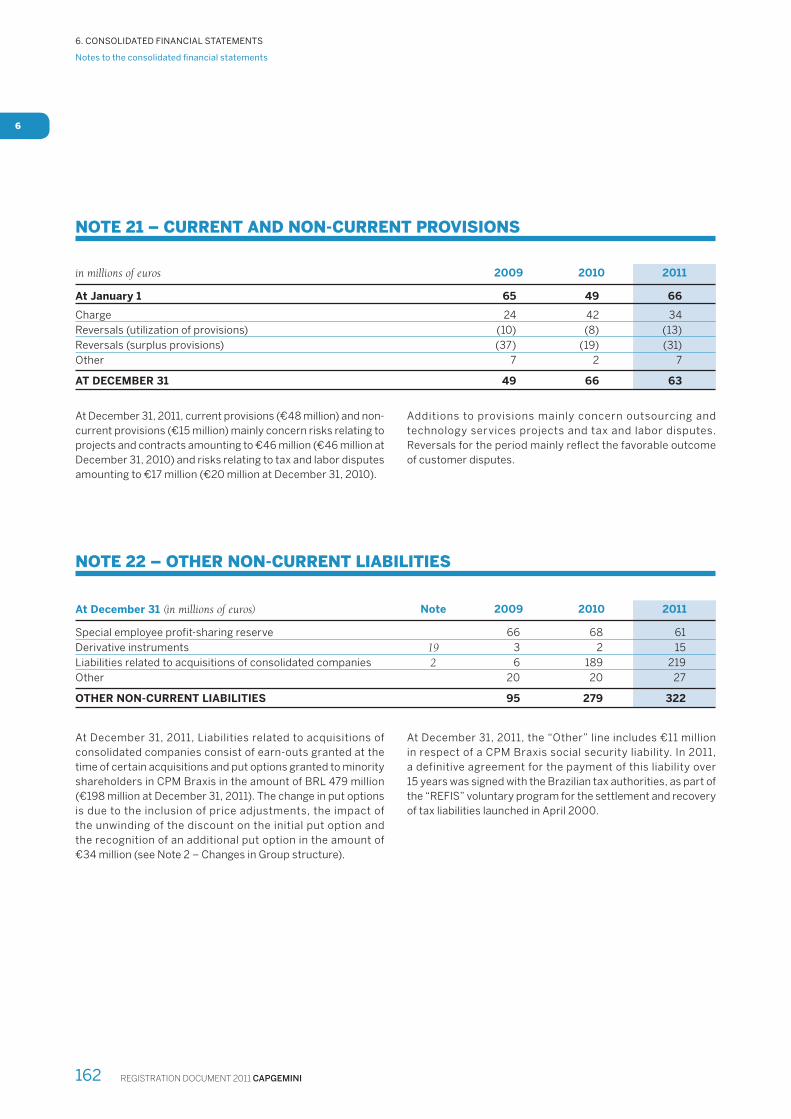
REGISTRATION DOCUMENT 2011 CAPGEMINI162
Notes to the consolidated fi nancial statements
6. CONSOLIDATED FINANCIAL STATEMENTS
6
NOTE 21 – CURRENT AND NON-CURRENT PROVISIONS
in millions of euros 2009 2010 2011
At January 1 65 49 66
Charge 24 42 34
Reversals (utilization of provisions) (10) (8) (13)
Reversals (surplus provisions) (37) (19) (31)
Other 7 2 7
AT DECEMBER 31 49 66 63
At December 31, 2011, current provisions (€48 million) and non-
current provisions (€15 million) mainly concern risks relating to
projects and contracts amounting to €46 million (€46 million at
December 31, 2010) and risks relating to tax and labor disputes
amounting to €17 million (€20 million at December 31, 2010).
Additions to provisions mainly concern outsourcing and
technology services projects and tax and labor disputes.
Reversals for the period mainly refl ect the favorable outcome
of customer disputes.
NOTE 22 – OTHER NON-CURRENT LIABILITIES
At December 31 (in millions of euros) Note 2009 2010 2011
Special employee profit-sharing reserve 66 68 61
Derivative instruments 19 3 2 15
Liabilities related to acquisitions of consolidated companies 2 6 189 219
Other 20 20 27
OTHER NON-CURRENT LIABILITIES 95 279 322
At December 31, 2011, Liabilities related to acquisitions of
consolidated companies consist of earn-outs granted at the
time of certain acquisitions and put options granted to minority
shareholders in CPM Braxis in the amount of BRL 479 million
(€198 million at December 31, 2011). The change in put options
is due to the inclusion of price adjustments, the impact of
the unwinding of the discount on the initial put option and
the recognition of an additional put option in the amount of
€34 million (see Note 2 – Changes in Group structure).
At December 31, 2011, the “Other” line includes €11 million
in respect of a CPM Braxis social security liability. In 2011,
a definitive agreement for the payment of this liability over
15 years was signed with the Brazilian tax authorities, as part of
the “REFIS” voluntary program for the settlement and recovery
of tax liabilities launched in April 2000.
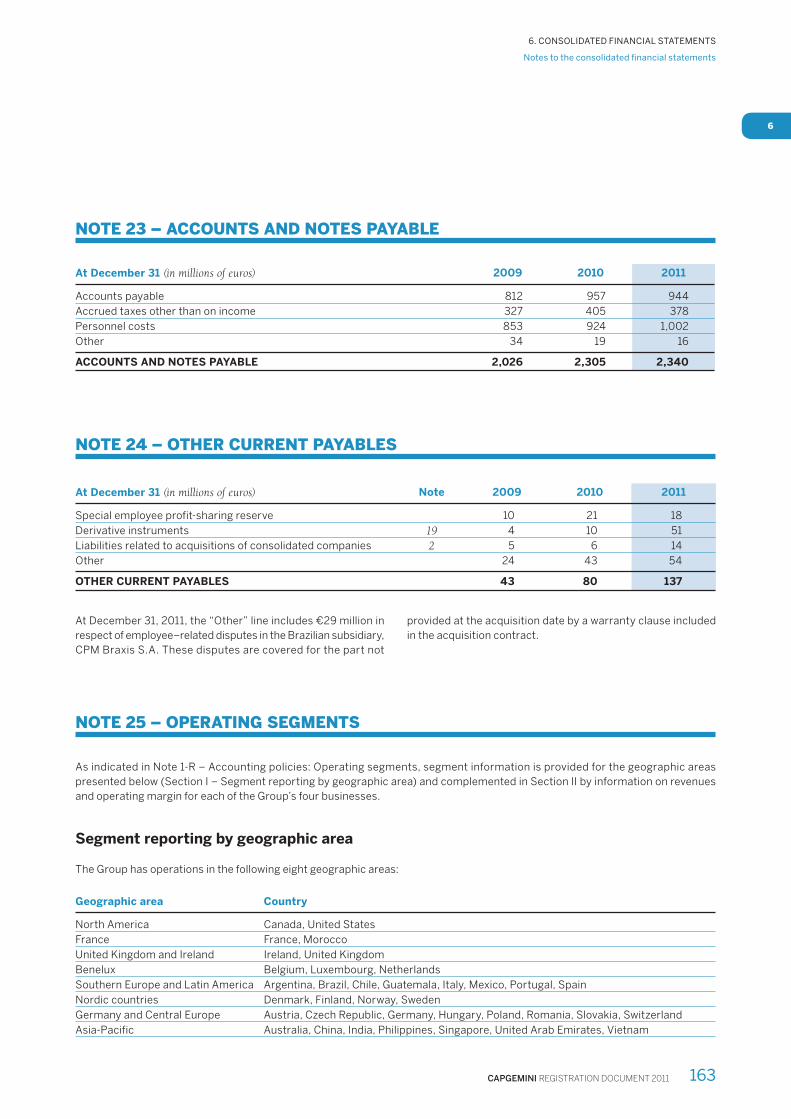
CAPGEMINI REGISTRATION DOCUMENT 2011 163
Notes to the consolidated fi nancial statements
6. CONSOLIDATED FINANCIAL STATEMENTS
6
NOTE 23 – ACCOUNTS AND NOTES PAYABLE
At December 31 (in millions of euros) 2009 2010 2011
Accounts payable 812 957 944
Accrued taxes other than on income 327 405 378
Personnel costs 853 924 1,002
Other 34 19 16
ACCOUNTS AND NOTES PAYABLE 2,026 2,305 2,340
NOTE 24 – OTHER CURRENT PAYABLES
At December 31 (in millions of euros) Note 2009 2010 2011
Special employee profit-sharing reserve 10 21 18
Derivative instruments 19 4 10 51
Liabilities related to acquisitions of consolidated companies 2 5 6 14
Other 24 43 54
OTHER CURRENT PAYABLES 43 80 137
At December 31, 2011, the “Other” line includes €29 million in
respect of employee–related disputes in the Brazilian subsidiary,
CPM Braxis S.A. These disputes are covered for the part not
provided at the acquisition date by a warranty clause included
in the acquisition contract.
NOTE 25 – OPERATING SEGMENTS
As indicated in Note 1-R – Accounting policies: Operating segments, segment information is provided for the geographic areas
presented below (Section I – Segment reporting by geographic area) and complemented in Section II by information on revenues
and operating margin for each of the Group’s four businesses.
Segment reporting by geographic area
The Group has operations in the following eight geographic areas:
Geographic area Country
North America Canada, United States
France France, Morocco
United Kingdom and Ireland Ireland, United Kingdom
Benelux Belgium, Luxembourg, Netherlands
Southern Europe and Latin America Argentina, Brazil, Chile, Guatemala, Italy, Mexico, Portugal, Spain
Nordic countries Denmark, Finland, Norway, Sweden
Germany and Central Europe Austria, Czech Republic, Germany, Hungary, Poland, Romania, Slovakia, Switzerland
Asia-Pacific Australia, China, India, Philippines, Singapore, United Arab Emirates, Vietnam
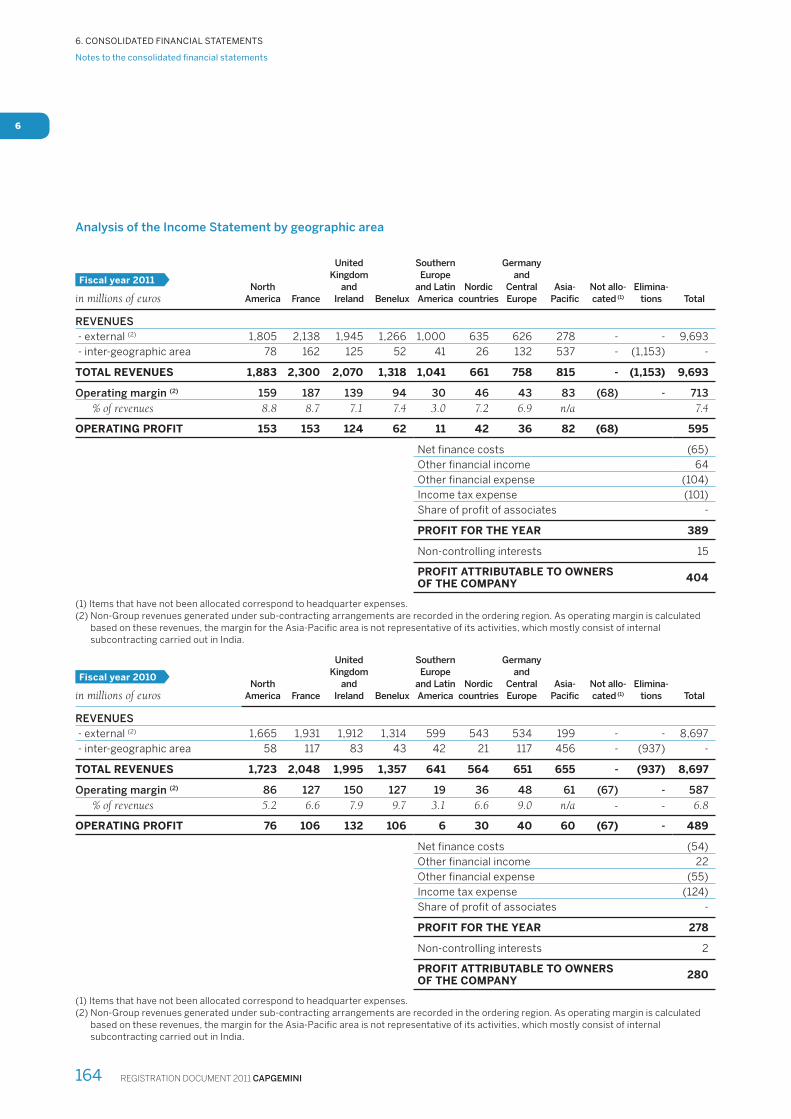
REGISTRATION DOCUMENT 2011 CAPGEMINI164
Notes to the consolidated fi nancial statements
6. CONSOLIDATED FINANCIAL STATEMENTS
6
Analysis of the Income Statement by geographic area
Fiscal year 2011
in millions of eurosNorth
America France
United
Kingdom
and
Ireland Benelux
Southern
Europe
and Latin
America
Nordic
countries
Germany
and
Central
Europe
Asia-
Pacific
Not allo-
cated (1)
Elimina-
tions Total
REVENUES
- external (2) 1,805 2,138 1,945 1,266 1,000 635 626 278 - - 9,693
- inter-geographic area 78 162 125 52 41 26 132 537 - (1,153) -
TOTAL REVENUES 1,883 2,300 2,070 1,318 1,041 661 758 815 - (1,153) 9,693
Operating margin (2) 159 187 139 94 30 46 43 83 (68) - 713
% of revenues 8.8 8.7 7.1 7.4 3.0 7.2 6.9 n/a 7.4
OPERATING PROFIT 153 153 124 62 11 42 36 82 (68) 595
Net finance costs (65)
Other financial income 64
Other financial expense (104)
Income tax expense (101)
Share of profit of associates -
PROFIT FOR THE YEAR 389
Non-controlling interests 15
PROFIT ATTRIBUTABLE TO OWNERS OF THE COMPANY
404
(1) Items that have not been allocated correspond to headquarter expenses.(2) Non-Group revenues generated under sub-contracting arrangements are recorded in the ordering region. As operating margin is calculated
based on these revenues, the margin for the Asia-Pacific area is not representative of its activities, which mostly consist of internal subcontracting carried out in India.
Fiscal year 2010
in millions of eurosNorth
America France
United
Kingdom
and
Ireland Benelux
Southern
Europe
and Latin
America
Nordic
countries
Germany
and
Central
Europe
Asia-
Pacific
Not allo-
cated (1)
Elimina-
tions Total
REVENUES
- external (2) 1,665 1,931 1,912 1,314 599 543 534 199 - - 8,697
- inter-geographic area 58 117 83 43 42 21 117 456 - (937) -
TOTAL REVENUES 1,723 2,048 1,995 1,357 641 564 651 655 - (937) 8,697
Operating margin (2) 86 127 150 127 19 36 48 61 (67) - 587
% of revenues 5.2 6.6 7.9 9.7 3.1 6.6 9.0 n/a - - 6.8
OPERATING PROFIT 76 106 132 106 6 30 40 60 (67) - 489
Net finance costs (54)
Other financial income 22
Other financial expense (55)
Income tax expense (124)
Share of profit of associates -
PROFIT FOR THE YEAR 278
Non-controlling interests 2
PROFIT ATTRIBUTABLE TO OWNERS OF THE COMPANY
280
(1) Items that have not been allocated correspond to headquarter expenses.(2) Non-Group revenues generated under sub-contracting arrangements are recorded in the ordering region. As operating margin is calculated
based on these revenues, the margin for the Asia-Pacific area is not representative of its activities, which mostly consist of internal subcontracting carried out in India.
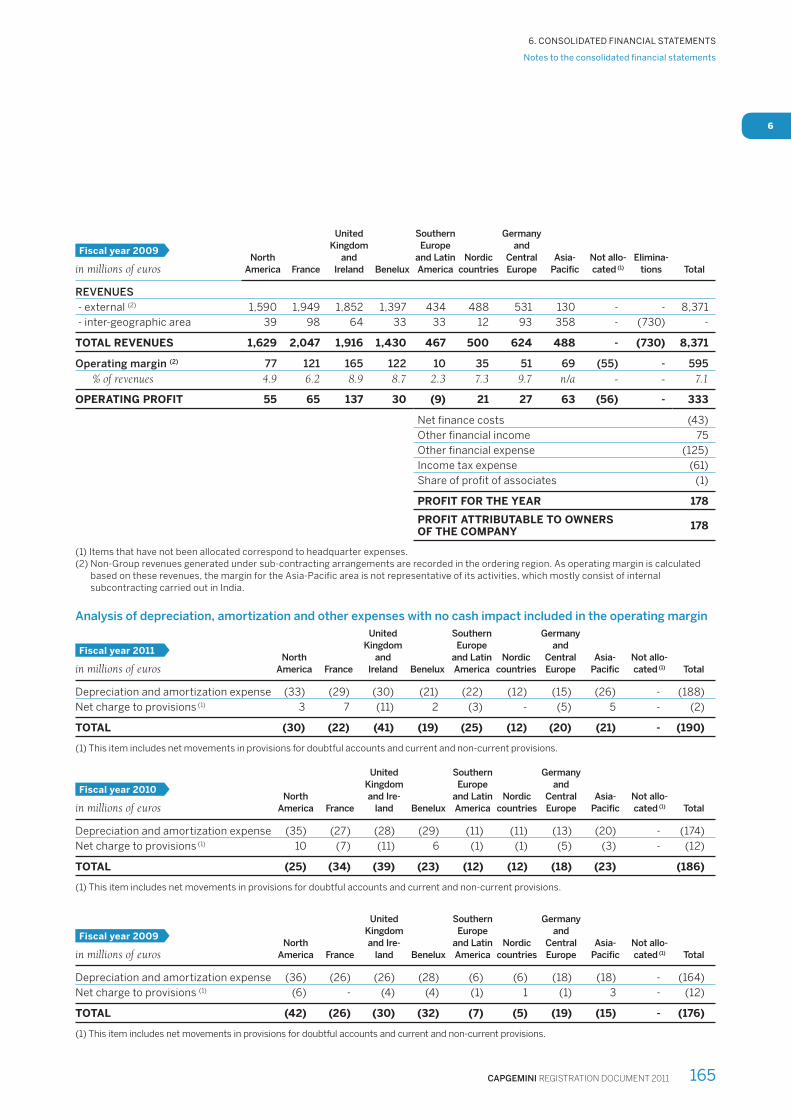
CAPGEMINI REGISTRATION DOCUMENT 2011 165
Notes to the consolidated fi nancial statements
6. CONSOLIDATED FINANCIAL STATEMENTS
6
Fiscal year 2009
in millions of eurosNorth
America France
United
Kingdom
and
Ireland Benelux
Southern
Europe
and Latin
America
Nordic
countries
Germany
and
Central
Europe
Asia-
Pacific
Not allo-
cated (1)
Elimina-
tions Total
REVENUES
- external (2) 1,590 1,949 1,852 1,397 434 488 531 130 - - 8,371
- inter-geographic area 39 98 64 33 33 12 93 358 - (730) -
TOTAL REVENUES 1,629 2,047 1,916 1,430 467 500 624 488 - (730) 8,371
Operating margin (2) 77 121 165 122 10 35 51 69 (55) - 595
% of revenues 4.9 6.2 8.9 8.7 2.3 7.3 9.7 n/a - - 7.1
OPERATING PROFIT 55 65 137 30 (9) 21 27 63 (56) - 333
Net finance costs (43)
Other financial income 75
Other financial expense (125)
Income tax expense (61)
Share of profit of associates (1)
PROFIT FOR THE YEAR 178
PROFIT ATTRIBUTABLE TO OWNERS OF THE COMPANY
178
(1) Items that have not been allocated correspond to headquarter expenses.(2) Non-Group revenues generated under sub-contracting arrangements are recorded in the ordering region. As operating margin is calculated
based on these revenues, the margin for the Asia-Pacific area is not representative of its activities, which mostly consist of internal subcontracting carried out in India.
Analysis of depreciation, amortization and other expenses with no cash impact included in the operating margin
Fiscal year 2011
in millions of eurosNorth
America France
United
Kingdom
and
Ireland Benelux
Southern
Europe
and Latin
America
Nordic
countries
Germany
and
Central
Europe
Asia-
Pacific
Not allo-
cated (1) Total
Depreciation and amortization expense (33) (29) (30) (21) (22) (12) (15) (26) - (188)
Net charge to provisions (1) 3 7 (11) 2 (3) - (5) 5 - (2)
TOTAL (30) (22) (41) (19) (25) (12) (20) (21) - (190)
(1) This item includes net movements in provisions for doubtful accounts and current and non-current provisions.
Fiscal year 2010
in millions of eurosNorth
America France
United
Kingdom
and Ire-
land Benelux
Southern
Europe
and Latin
America
Nordic
countries
Germany
and
Central
Europe
Asia-
Pacific
Not allo-
cated (1) Total
Depreciation and amortization expense (35) (27) (28) (29) (11) (11) (13) (20) - (174)
Net charge to provisions (1) 10 (7) (11) 6 (1) (1) (5) (3) - (12)
TOTAL (25) (34) (39) (23) (12) (12) (18) (23) (186)
(1) This item includes net movements in provisions for doubtful accounts and current and non-current provisions.
Fiscal year 2009
in millions of eurosNorth
America France
United
Kingdom
and Ire-
land Benelux
Southern
Europe
and Latin
America
Nordic
countries
Germany
and
Central
Europe
Asia-
Pacific
Not allo-
cated (1) Total
Depreciation and amortization expense (36) (26) (26) (28) (6) (6) (18) (18) - (164)
Net charge to provisions (1) (6) - (4) (4) (1) 1 (1) 3 - (12)
TOTAL (42) (26) (30) (32) (7) (5) (19) (15) - (176)
(1) This item includes net movements in provisions for doubtful accounts and current and non-current provisions.

REGISTRATION DOCUMENT 2011 CAPGEMINI166
Notes to the consolidated fi nancial statements
6. CONSOLIDATED FINANCIAL STATEMENTS
6
Analysis of assets and liabilities by geographic area
The location of assets corresponds to the location of the Group’s clients, except for outsourcing centers such as in India.
At December 31, 2011
in millions of eurosNorth
America France
United
Kingdom
and
Ireland Benelux
Southern
Europe
and Latin
America
Nordic
countries
Germany
and
Central
Europe
Asia-
Pacific
Not
allocated
Elimina-
tions Total
Assets by geographic area:
- external 1,154 2,081 1,184 1,146 857 380 464 314 51 - 7,631
- inter-geographic area 38 101 52 23 24 11 36 106 35 (426) -
TOTAL ASSETS BY GEOGRAPHIC AREA
1,192 2,182 1,236 1,169 881 391 500 420 86 (426) 7,631
Deferred tax assets 1,020
Current income tax receivable 55
Cash management assets 73
Cash and cash equivalents 2,223
Derivative instruments 12
TOTAL ASSETS 11,014
Liabilities by geographic area:
- external 607 1,053 1,388 336 554 207 218 186 7 4,556
- inter-geographic area 78 84 71 47 18 19 28 42 32 (419) -
TOTAL EQUITY AND LIABILITIES BY GEOGRAPHIC AREA
685 1,137 1,459 383 572 226 246 228 39 (419) 4,556
Total equity 4,283
Deferred tax liabilities 183
Current income tax payable 89
Borrowings and bank overdrafts 1,837
Derivative instruments 66
TOTAL EQUITY AND LIABILITIES 11,014
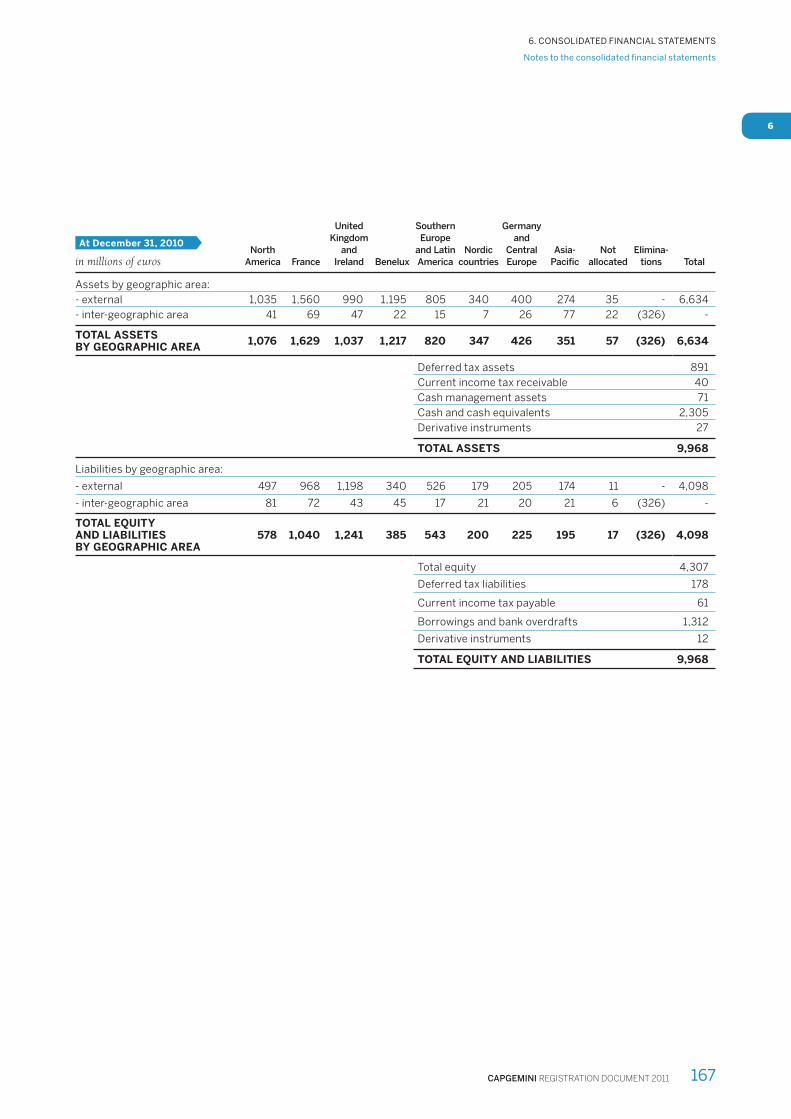
CAPGEMINI REGISTRATION DOCUMENT 2011 167
Notes to the consolidated fi nancial statements
6. CONSOLIDATED FINANCIAL STATEMENTS
6
At December 31, 2010
in millions of eurosNorth
America France
United
Kingdom
and
Ireland Benelux
Southern
Europe
and Latin
America
Nordic
countries
Germany
and
Central
Europe
Asia-
Pacific
Not
allocated
Elimina-
tions Total
Assets by geographic area:
- external 1,035 1,560 990 1,195 805 340 400 274 35 - 6,634
- inter-geographic area 41 69 47 22 15 7 26 77 22 (326) -
TOTAL ASSETS BY GEOGRAPHIC AREA
1,076 1,629 1,037 1,217 820 347 426 351 57 (326) 6,634
Deferred tax assets 891
Current income tax receivable 40
Cash management assets 71
Cash and cash equivalents 2,305
Derivative instruments 27
TOTAL ASSETS 9,968
Liabilities by geographic area:
- external 497 968 1,198 340 526 179 205 174 11 - 4,098
- inter-geographic area 81 72 43 45 17 21 20 21 6 (326) -
TOTAL EQUITY AND LIABILITIES BY GEOGRAPHIC AREA
578 1,040 1,241 385 543 200 225 195 17 (326) 4,098
Total equity 4,307
Deferred tax liabilities 178
Current income tax payable 61
Borrowings and bank overdrafts 1,312
Derivative instruments 12
TOTAL EQUITY AND LIABILITIES 9,968

REGISTRATION DOCUMENT 2011 CAPGEMINI168
Notes to the consolidated fi nancial statements
6. CONSOLIDATED FINANCIAL STATEMENTS
6
At December 31, 2009
in millions of eurosNorth
America France
United
Kingdom
and
Ireland Benelux
Southern
Europe
and Latin
America
Nordic
countries
Germany
and
Central
Europe
Asia-
Pacific
Not
allocated
Elimina-
tions Total
Assets by geographic area:
- external 931 1,493 899 1,203 242 278 372 203 38 - 5,659
- inter-geographic area 37 61 29 21 10 7 24 47 10 (246) -
TOTAL ASSETS BY GEOGRAPHIC AREA
968 1,554 928 1,224 252 285 396 250 48 (246) 5,659
Deferred tax assets 887
Current income tax receivable 54
Cash and cash equivalents 2,603
Derivative instruments 10
TOTAL ASSETS 9,213
Liabilities by geographic area:
- external 472 931 1,087 358 163 148 167 121 6 - 3,453
- inter-geographic area 54 53 30 36 13 18 20 14 8 (246) -
TOTAL EQUITY AND LIABILITIES BY GEOGRAPHIC AREA
526 984 1,117 394 176 166 187 135 14 (246) 3,453
Total equity 4,213
Deferred tax liabilities 153
Current income tax payable 52
Borrowings and bank overdrafts 1,335
Derivative instruments 7
TOTAL EQUITY AND LIABILITIES 9,213
Analysis of acquisitions of intangible assets and property, plant and equipment
At December 31 (in millions of euros) 2009 2010 2011
North America 36 31 18
France 37 22 33
United Kingdom and Ireland 23 50 46
Benelux 26 13 13
Southern Europe and Latin America 8 14 29
Nordic countries 3 14 20
Germany and Central Europe 11 15 17
Asia-Pacific 17 37 42
ACQUISITIONS OF INTANGIBLE ASSETS AND PROPERTY, PLANT AND EQUIPMENT
161 196 218
Total acquisitions of intangible assets and property, plant and equipment reported in the Consolidated Statement of Financial
Position is different from the fi gure provided in the Statement of Cash Flows (€158 million), which excludes acquisitions of assets
held under fi nance leases (€60 million).
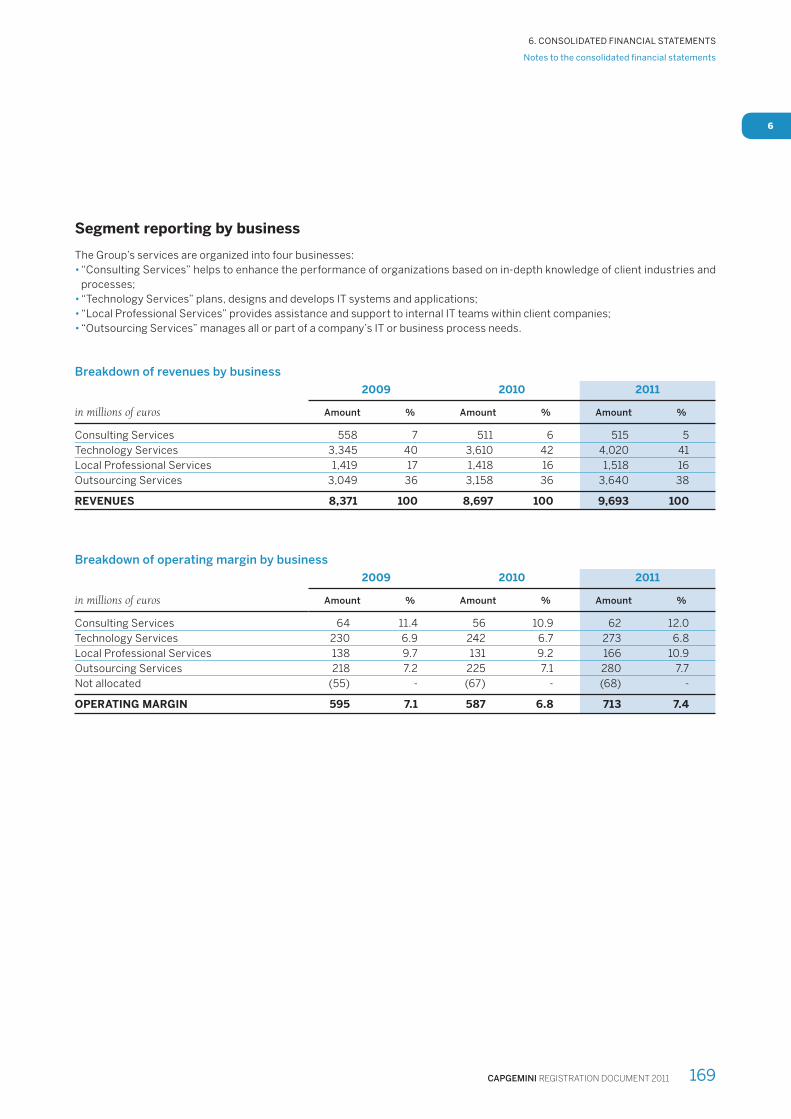
CAPGEMINI REGISTRATION DOCUMENT 2011 169
Notes to the consolidated fi nancial statements
6. CONSOLIDATED FINANCIAL STATEMENTS
6
Segment reporting by business
The Group’s services are organized into four businesses:
• “Consulting Services” helps to enhance the performance of organizations based on in-depth knowledge of client industries and
processes;
• “Technology Services” plans, designs and develops IT systems and applications;
• “Local Professional Services” provides assistance and support to internal IT teams within client companies;
• “Outsourcing Services” manages all or part of a company’s IT or business process needs.
Breakdown of revenues by business
in millions of euros
2009 2010 2011
Amount % Amount % Amount %
Consulting Services 558 7 511 6 515 5
Technology Services 3,345 40 3,610 42 4,020 41
Local Professional Services 1,419 17 1,418 16 1,518 16
Outsourcing Services 3,049 36 3,158 36 3,640 38
REVENUES 8,371 100 8,697 100 9,693 100
Breakdown of operating margin by business
in millions of euros
2009 2010 2011
Amount % Amount % Amount %
Consulting Services 64 11.4 56 10.9 62 12.0
Technology Services 230 6.9 242 6.7 273 6.8
Local Professional Services 138 9.7 131 9.2 166 10.9
Outsourcing Services 218 7.2 225 7.1 280 7.7
Not allocated (55) - (67) - (68) -
OPERATING MARGIN 595 7.1 587 6.8 713 7.4
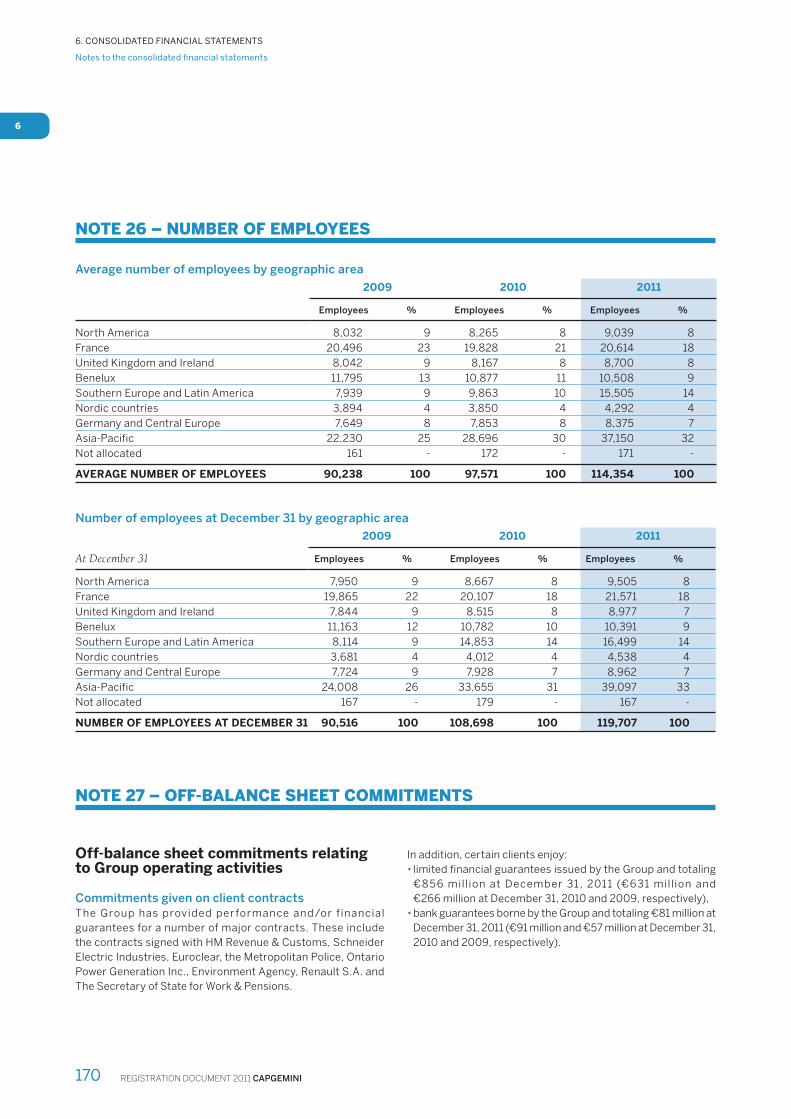
REGISTRATION DOCUMENT 2011 CAPGEMINI170
Notes to the consolidated fi nancial statements
6. CONSOLIDATED FINANCIAL STATEMENTS
6
NOTE 26 – NUMBER OF EMPLOYEES
Average number of employees by geographic area
2009 2010 2011
Employees % Employees % Employees %
North America 8,032 9 8,265 8 9,039 8
France 20,496 23 19,828 21 20,614 18
United Kingdom and Ireland 8,042 9 8,167 8 8,700 8
Benelux 11,795 13 10,877 11 10,508 9
Southern Europe and Latin America 7,939 9 9,863 10 15,505 14
Nordic countries 3,894 4 3,850 4 4,292 4
Germany and Central Europe 7,649 8 7,853 8 8,375 7
Asia-Pacific 22,230 25 28,696 30 37,150 32
Not allocated 161 - 172 - 171 -
AVERAGE NUMBER OF EMPLOYEES 90,238 100 97,571 100 114,354 100
Number of employees at December 31 by geographic area
At December 31
2009 2010 2011
Employees % Employees % Employees %
North America 7,950 9 8,667 8 9,505 8
France 19,865 22 20,107 18 21,571 18
United Kingdom and Ireland 7,844 9 8,515 8 8,977 7
Benelux 11,163 12 10,782 10 10,391 9
Southern Europe and Latin America 8,114 9 14,853 14 16,499 14
Nordic countries 3,681 4 4,012 4 4,538 4
Germany and Central Europe 7,724 9 7,928 7 8,962 7
Asia-Pacific 24,008 26 33,655 31 39,097 33
Not allocated 167 - 179 - 167 -
NUMBER OF EMPLOYEES AT DECEMBER 31 90,516 100 108,698 100 119,707 100
NOTE 27 – OFF-BALANCE SHEET COMMITMENTS
Off-balance sheet commitments relating to Group operating activities
Commitments given on client contracts
The Group has provided per formance and/or f inancial
guarantees for a number of major contracts. These include
the contracts signed with HM Revenue & Customs, Schneider
Electric Industries, Euroclear, the Metropolitan Police, Ontario
Power Generation Inc., Environment Agency, Renault S.A. and
The Secretary of State for Work & Pensions.
In addition, certain clients enjoy:
• limited fi nancial guarantees issued by the Group and totaling
€856 mill ion at December 31, 2011 (€631 mill ion and
€266 million at December 31, 2010 and 2009, respectively),
• bank guarantees borne by the Group and totaling €81 million at
December 31, 2011 (€91 million and €57 million at December 31,
2010 and 2009, respectively).

CAPGEMINI REGISTRATION DOCUMENT 2011 171
Notes to the consolidated fi nancial statements
6. CONSOLIDATED FINANCIAL STATEMENTS
6
Commitments given on non-cancellable leases
in millions of euros Computer equipment Offices
Vehicles and other non-cancellable
leases Total
Y+1 14 171 63 248
Y+2 5 135 45 185
Y+3 2 104 27 133
Y+4 1 76 10 87
Y+5 - 54 - 54
Y+6 and beyond - 111 - 111
December 31 , 2011 22 651 145 818
December 31, 2010 32 633 140 805
December 31, 2009 36 687 142 865
Lease payments recognized in the Income Statement in
2011 totaled €307 million (€267 million and €262 million at
December 31, 2010 and 2009, respectively).
Other commitments given
Other commitments given total €121 million at December 31,
2011 (€50 million and €53 million in 2010 and 2009, respectively)
and comprise:
• bank guarantees given to the tax authorities in connection with
tax disputes in France, India and Spain,
• fi rm purchase commitments relating to goods or services in
India and France.
Commitments received on client contracts
Pursuant to a contract signed in 2010, Capgemini Group received
a limited fi nancial guarantee of €67.5 million from the client.
Off-balance sheet commitments relating to Group fi nancing
Bond issues
With regard to the OCEANE 2005 and 2009 bonds and the
new 2011 bond issue detailed in Note 17 – Net cash and cash
equivalents, Cap Gemini S.A. has committed to standard
obligations and particularly to maintain pari passu status with
all other negotiable bonds that may be issued by the Company.
Syndicated credit facility obtained by Cap Gemini S.A.
and not drawn to date
Cap Gemini S.A. has agreed to comply with the following
fi nancial ratios (as defi ned in IFRS) in respect of the credit facility
disclosed in Note 17 – Net cash and cash equivalents:
• the net debt to consolidated equity ratio must be less than 1
at all times,
• the interest coverage ratio (the extent to which net finance
costs are covered by consolidated operating margin) must be
equal to or greater than 3 at December 31 and June 30 of each
year (based on the 12 months then ended).
At December 31, 2009, 2010 and 2011 the Group complied with
these fi nancial ratios.
The facility agreement includes covenants restricting the
Company’s ability to carry out certain operations. These
covenants also apply to Group subsidiaries. They include
restrictions primarily relating to pledging assets as collateral,
asset sales, mergers and similar transactions. Cap Gemini S.A.
also committed to standard obligations, including an agreement
to maintain pari passu status.
Borrowings secured by assets
Some borrowings are secured by assets recorded in the
Consolidated Statement of Financial Position. At December 31,
2011, these related to f inance leases for an amount of
€132 million.
Contingent liabilities
During 2011 and in previous f iscal years, some Group
companies underwent tax audits leading in some cases to tax
reassessments. A number of these reassessments have been
challenged and some litigation proceedings were in progress at
the period end. In general, no provisions have been set aside for
these disputes in the consolidated fi nancial statements.
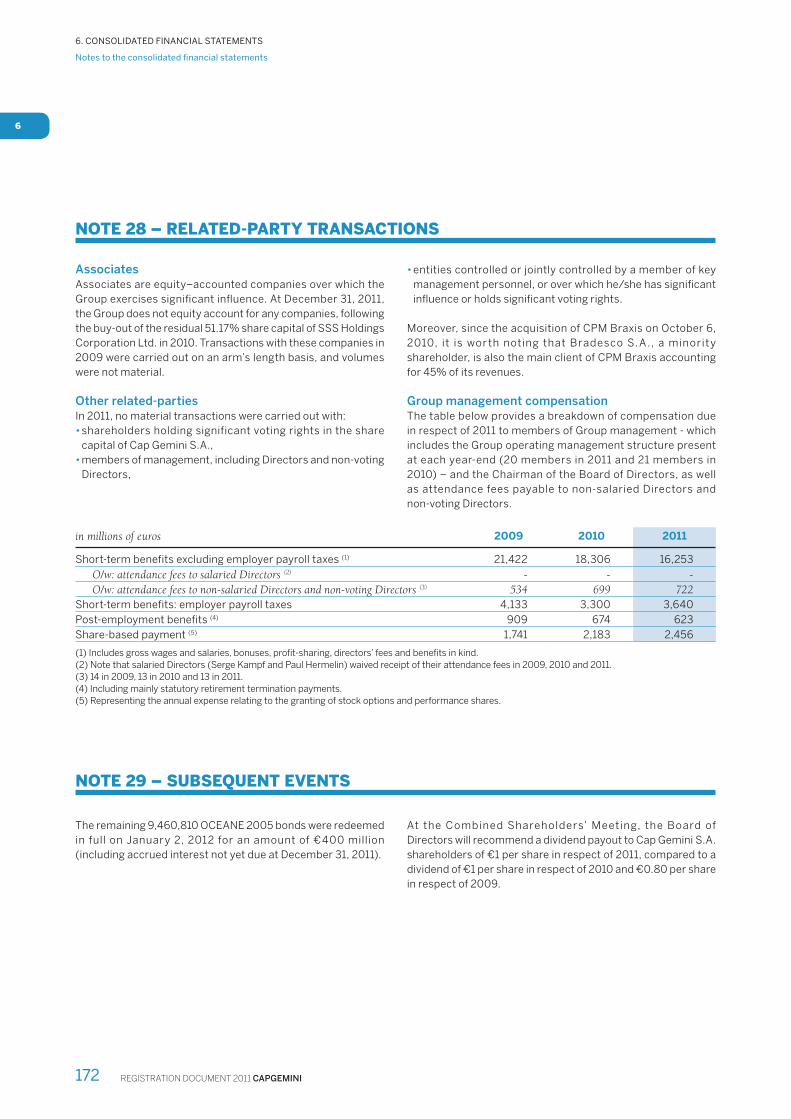
REGISTRATION DOCUMENT 2011 CAPGEMINI172
Notes to the consolidated fi nancial statements
6. CONSOLIDATED FINANCIAL STATEMENTS
6
NOTE 28 – RELATED-PARTY TRANSACTIONS
Associates
Associates are equity–accounted companies over which the
Group exercises signifi cant infl uence. At December 31, 2011,
the Group does not equity account for any companies, following
the buy-out of the residual 51.17% share capital of SSS Holdings
Corporation Ltd. in 2010. Transactions with these companies in
2009 were carried out on an arm’s length basis, and volumes
were not material.
Other related-parties
In 2011, no material transactions were carried out with:
• shareholders holding significant voting rights in the share
capital of Cap Gemini S.A.,
• members of management, including Directors and non-voting
Directors,
• entities controlled or jointly controlled by a member of key
management personnel, or over which he/she has signifi cant
infl uence or holds signifi cant voting rights.
Moreover, since the acquisition of CPM Braxis on October 6,
2010, it is wor th noting that Bradesco S.A., a minority
shareholder, is also the main client of CPM Braxis accounting
for 45% of its revenues.
Group management compensation
The table below provides a breakdown of compensation due
in respect of 2011 to members of Group management - which
includes the Group operating management structure present
at each year-end (20 members in 2011 and 21 members in
2010) – and the Chairman of the Board of Directors, as well
as attendance fees payable to non-salaried Directors and
non-voting Directors.
in millions of euros 2009 2010 2011
Short-term benefits excluding employer payroll taxes (1) 21,422 18,306 16,253
O/w: attendance fees to salaried Directors (2) - - -
O/w: attendance fees to non-salaried Directors and non-voting Directors (3) 534 699 722
Short-term benefits: employer payroll taxes 4,133 3,300 3,640
Post-employment benefits (4) 909 674 623
Share-based payment (5) 1,741 2,183 2,456
(1) Includes gross wages and salaries, bonuses, profit-sharing, directors’ fees and benefits in kind.(2) Note that salaried Directors (Serge Kampf and Paul Hermelin) waived receipt of their attendance fees in 2009, 2010 and 2011.(3) 14 in 2009, 13 in 2010 and 13 in 2011.(4) Including mainly statutory retirement termination payments.(5) Representing the annual expense relating to the granting of stock options and performance shares.
NOTE 29 – SUBSEQUENT EVENTS
The remaining 9,460,810 OCEANE 2005 bonds were redeemed
in full on January 2, 2012 for an amount of €400 million
(including accrued interest not yet due at December 31, 2011).
At the Combined Shareholders’ Meeting, the Board of
Directors will recommend a dividend payout to Cap Gemini S.A.
shareholders of €1 per share in respect of 2011, compared to a
dividend of €1 per share in respect of 2010 and €0.80 per share
in respect of 2009.
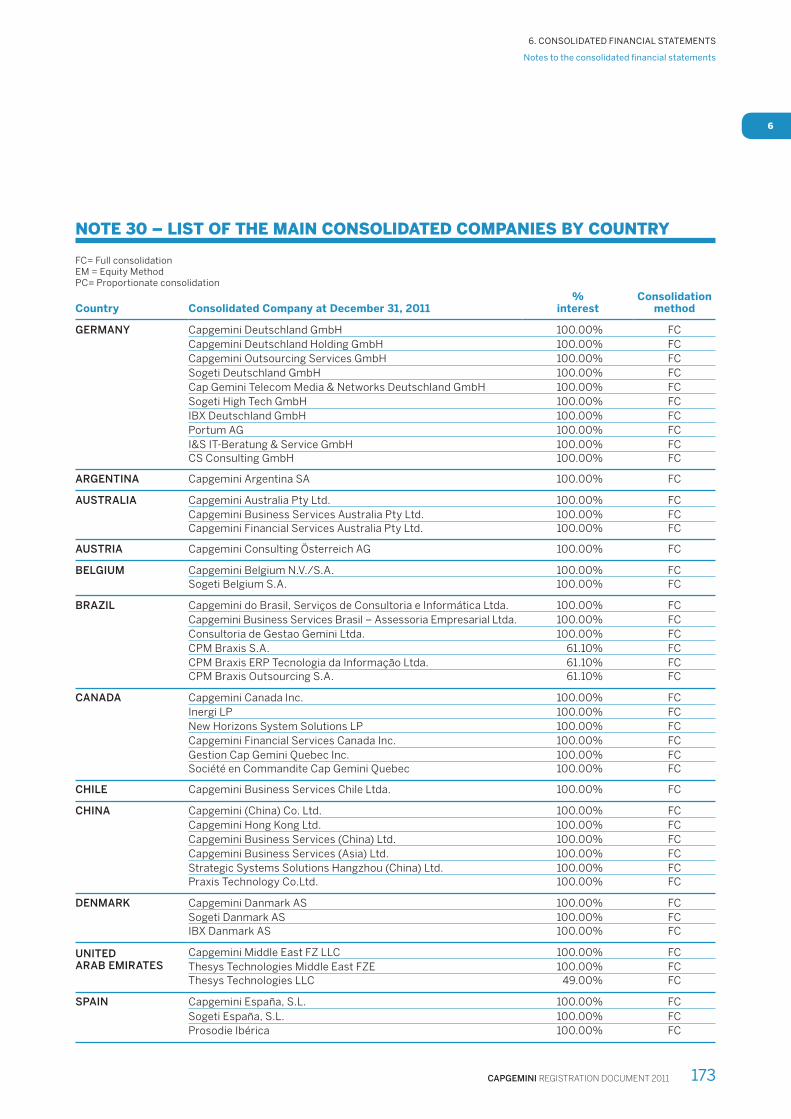
CAPGEMINI REGISTRATION DOCUMENT 2011 173
Notes to the consolidated fi nancial statements
6. CONSOLIDATED FINANCIAL STATEMENTS
6
NOTE 30 – LIST OF THE MAIN CONSOLIDATED COMPANIES BY COUNTRY
FC= Full consolidationEM = Equity MethodPC= Proportionate consolidation
Country Consolidated Company at December 31, 2011%
interestConsolidation
method
GERMANY Capgemini Deutschland GmbH 100.00% FC
Capgemini Deutschland Holding GmbH 100.00% FC
Capgemini Outsourcing Services GmbH 100.00% FC
Sogeti Deutschland GmbH 100.00% FC
Cap Gemini Telecom Media & Networks Deutschland GmbH 100.00% FC
Sogeti High Tech GmbH 100.00% FC
IBX Deutschland GmbH 100.00% FC
Portum AG 100.00% FC
I&S IT-Beratung & Service GmbH 100.00% FC CS Consulting GmbH 100.00% FC
ARGENTINA Capgemini Argentina SA 100.00% FC
AUSTRALIA Capgemini Australia Pty Ltd. 100.00% FC
Capgemini Business Services Australia Pty Ltd. 100.00% FC Capgemini Financial Services Australia Pty Ltd. 100.00% FC
AUSTRIA Capgemini Consulting Österreich AG 100.00% FC
BELGIUM Capgemini Belgium N.V./S.A. 100.00% FCSogeti Belgium S.A. 100.00% FC
BRAZIL Capgemini do Brasil, Serviços de Consultoria e Informática Ltda. 100.00% FC
Capgemini Business Services Brasil – Assessoria Empresarial Ltda. 100.00% FC
Consultoria de Gestao Gemini Ltda. 100.00% FC
CPM Braxis S.A. 61.10% FC
CPM Braxis ERP Tecnologia da Informação Ltda. 61.10% FCCPM Braxis Outsourcing S.A. 61.10% FC
CANADA Capgemini Canada Inc. 100.00% FC
Inergi LP 100.00% FC
New Horizons System Solutions LP 100.00% FC
Capgemini Financial Services Canada Inc. 100.00% FC
Gestion Cap Gemini Quebec Inc. 100.00% FCSociété en Commandite Cap Gemini Quebec 100.00% FC
CHILE Capgemini Business Services Chile Ltda. 100.00% FC
CHINA Capgemini (China) Co. Ltd. 100.00% FC
Capgemini Hong Kong Ltd. 100.00% FC
Capgemini Business Services (China) Ltd. 100.00% FC
Capgemini Business Services (Asia) Ltd. 100.00% FC
Strategic Systems Solutions Hangzhou (China) Ltd. 100.00% FCPraxis Technology Co.Ltd. 100.00% FC
DENMARK Capgemini Danmark AS 100.00% FC
Sogeti Danmark AS 100.00% FCIBX Danmark AS 100.00% FC
UNITED ARAB EMIRATES
Capgemini Middle East FZ LLC 100.00% FC
Thesys Technologies Middle East FZE 100.00% FC Thesys Technologies LLC 49.00% FC
SPAIN Capgemini España, S.L. 100.00% FC
Sogeti España, S.L. 100.00% FC Prosodie Ibérica 100.00% FC

REGISTRATION DOCUMENT 2011 CAPGEMINI174
Notes to the consolidated fi nancial statements
6. CONSOLIDATED FINANCIAL STATEMENTS
6
FC= Full consolidationEM = Equity MethodPC= Proportionate consolidation
Country Consolidated Company at December 31, 2011%
interestConsolidation
method
UNITED STATES Capgemini America Inc. 100.00% FC
Capgemini US LLC 100.00% FC
Capgemini North America Inc. 100.00% FC
Capgemini Technologies LLC 100.00% FC
Capgemini Government Solutions LLC 100.00% FC
Sogeti USA LLC 100.00% FC
Capgemini Energy LP 100.00% FC
Capgemini Financial Services International Inc. 100.00% FC
Capgemini Financial Services USA Inc. 100.00% FC
Capgemini Financial Services Europe Inc. 100.00% FC
Capgemini Financial Services Japan Inc. 100.00% FC
IBX North America Inc. 100.00% FC
CPM Braxis USA Corp. 61.10% FCCapgemini Business Services USA LLC 100.00% FC
FINLAND Capgemini Finland Oy 100.00% FC
Sogeti Finland Oy 100.00% FC IBX Finland Oy 100.00% FC
FRANCE Cap Gemini S.A. Parent Company FC
Capgemini France S.A.S. 100.00% FC
Capgemini Gouvieux S.A.S. 100.00% FC
Capgemini Service S.A.S. 100.00% FC
Capgemini Université S.A.S. 100.00% FC
Immobilière Les Fontaines S.A.R.L. 100.00% FC
SCI Paris Etoile 100.00% FC
Capgemini Consulting S.A.S. 100.00% FC
Capgemini Technology Services S.A.S. 100.00% FC
Capgemini Outsourcing Services S.A.S. 100.00% FC
Capgemini OS Electric S.A.S. 100.00% FC
Plaisir Informatique S.A.R.L. 100.00% FC
Cap Sogeti 2005 S.A.S. 100.00% FC
IBX France S.A.R.L. 100.00% FC
Sogeti S.A.S. 100.00% FC
Sogeti France S.A.S. 100.00% FC
Sogeti Corporate Services SAS 100.00% FC
Sogeti High Tech S.A.S. 100.00% FC
Artésys SA 100.00% FC
Prosodie France S.A. 100.00% FCInternet FR 100.00% FC
GUATEMALA Capgemini Business Services Guatemala S.A. 100.00% FC
HUNGARY Capgemini Magyarorszag Kft 100.00% FC
INDIA Capgemini Business Services (India) Ltd. 100.00% FCCapgemini India Private Ltd. 100.00% FC
IRELAND Sogeti Ireland Ltd. 100.00% FC
ITALY Capgemini Italia S.p.A. 100.00% FC
AIVE SPA 100.00% FC
AIVEBS SPA 100.00% FC
AIVE BST SPA 100.00% FC
ENTERPRIME CONSULTING SPA 81.00% FC
ENTERPRIME FINANCE SRL 51.00% FCREALTA' INFORMATCA SRL 51.00% FC

CAPGEMINI REGISTRATION DOCUMENT 2011 175
Notes to the consolidated fi nancial statements
6. CONSOLIDATED FINANCIAL STATEMENTS
6
FC= Full consolidationEM = Equity MethodPC= Proportionate consolidation
Country Consolidated Company at December 31, 2011%
interestConsolidation
method
LUXEMBOURG Sogeti Luxembourg S.A. 100.00% FC
Sogeti PSF S.A. 100.00% FC
Capgemini Reinsurance International 100.00% FC Capgemini Reinsurance Company S.A. 100.00% FC
MALAYSIA Capgemini Services Malaysia Sdn Bhd 100.00% FC
MOROCCO Capgemini Technology Services Maroc S.A. 100.00% FC
MEXICO Capgemini Mexico S. de R.L. de C.V. 100.00% FC
NORWAY Capgemini Norge AS 100.00% FC
Sogeti Norge AS 100.00% FC IBX Norge AS 100.00% FC
NETHERLANDS Capgemini Interim Management B.V. 100.00% FC
Capgemini Nederland B.V. 100.00% FC
Capgemini Educational Services B.V. 100.00% FC
Capgemini N.V. 100.00% FC
Sogeti Nederland B.V. 100.00% FC
Capgemini Retail Solutions B.V. 100.00% FCIndependent Interim v.o.f 50.00% PC
PHILIPPINES Capgemini Phillipines SBOS 100.00% FC
POLAND Capgemini Polska Sp z.o.o. 100.00% FC
PORTUGAL Capgemini Portugal, Serviços de Consultoria e Informatica S.A. 100.00% FC
CZECH REPUBLIC Capgemini Czech Republic S.r.o. 100.00% FC
ROMANIA Capgemini Services Romania s.r.l. 100.00% FC IBX Software Development s.r.l. 100.00% FC
UNITED KINGDOM Capgemini UK Plc. 100.00% FC
Capgemini Financial Services UK Ltd. 100.00% FC
Strategic Systems Solutions Ltd. 100.00% FC
Sogeti UK Ltd. 100.00% FCIBX UK Ltd. 100.00% FC
SINGAPORE Capgemini Singapore Pte Ltd. 100.00% FC
SLOVAKIA Capgemini Slovensko, S.r.o. 100.00% FC
SWEDEN Capgemini AB 100.00% FC
Capgemini Sverige AB 100.00% FC
Sogeti Sverige AB 100.00% FC
IBX Group AB 100.00% FC
Skvader Systems AB 100.00% FC Sogeti Sverige Mitt AB 100.00% FC
SWITZERLAND Capgemini Suisse S.A. 100.00% FC
Capgemini SD&M Schweiz AG 100.00% FC Sogeti Suisse S.A. 100.00% FC
VIETNAM IACP Asia 100.00% FC

REGISTRATION DOCUMENT 2011 CAPGEMINI176