independent auditor’s report · act. our responsibilities under those standards are further...
TRANSCRIPT
Sun Pharmaceutical Industries Ltd.
Specialty in progress
156
INDEPENDENT AUDITOR’S REPORTTo the Members of Sun Pharmaceutical Industries Limited
REPORT ON THE AUDIT OF THE CONSOLIDATED IND AS FINANCIAL STATEMENTS
OPINIONWe have audited the accompanying consolidated Ind AS financial statements of Sun Pharmaceutical Industries Limited (hereinafter referred to as “the Holding Company”), its subsidiaries (the Holding Company and its subsidiaries together referred to as “the Group”) its associates and joint ventures comprising of the consolidated Balance sheet as at March 31, 2019, the consolidated Statement of Profit and Loss, including Statement of other comprehensive income, the consolidated Cash Flow Statement and the consolidated Statement of Changes in Equity for the year then ended, and notes to the consolidated Ind AS financial statements, including a summary of significant accounting policies and other explanatory information (hereinafter referred to as “the consolidated Ind AS financial statements”).
In our opinion and to the best of our information and according to the explanations given to us, the aforesaid consolidated Ind AS financial statements give the information required by the Companies Act, 2013, as amended (“the Act”) in the manner so required and give a true and fair view in conformity with the accounting principles generally accepted in India, of the consolidated state of affairs of the Group, its associates and joint ventures as at March 31, 2019, their consolidated profit including other comprehensive income, their consolidated cash flows and the consolidated statement of changes in equity for the year ended on that date.
BASIS FOR OPINIONWe conducted our audit of the consolidated Ind AS financial statements in accordance with the Standards on Auditing (SAs), as specified under section 143(10) of the Act. Our responsibilities under those Standards are further described in the ‘Auditor’s Responsibilities for the Audit of the Consolidated Ind AS Financial Statements’ section of our report. We are independent of the Group in accordance with the ‘Code of Ethics’ issued by the Institute of Chartered
Accountants of India together with the ethical requirements that are relevant to our audit of the financial statements under the provisions of the Act and the Rules thereunder, and we have fulfilled our other ethical responsibilities in accordance with these requirements and the Code of Ethics. We believe that the audit evidence we have obtained is sufficient and appropriate to provide a basis for our audit opinion on the consolidated Ind AS financial statements.
KEY AUDIT MATTERS Key audit matters are those matters that, in our professional judgment, were of most significance in our audit of the consolidated Ind AS financial statements for the financial year ended March 31, 2019. These matters were addressed in the context of our audit of the consolidated Ind AS financial statements as a whole and in forming our opinion thereon and we do not provide a separate opinion on these matters. For each key audit matter below, our description of how our audit addressed the matter is provided in that context.
We have determined the matters described below to be the key audit matters to be communicated in our report. We have fulfilled the responsibilities described in the ‘Auditor’s responsibilities for the audit of the consolidated Ind AS financial statements’ section of our report, including in relation to these matters. Accordingly, our audit included the performance of procedures designed to respond to our assessment of the risks of material misstatement of the consolidated Ind AS financial statements. The results of our audit procedures, including the procedures performed to address the matters below, provide the basis for our audit opinion on the accompanying consolidated Ind AS financial statements.
The results of audit procedures performed by us and by other auditors of components not audited by us, as reported by them in their audit reports furnished to us, including those procedures performed to address the matters below, provide the basis for our audit opinion on the accompanying consolidated Ind AS financial statements.
Key audit matter How our audit addressed the key audit matterLitigations (as described in note 40 of the consolidated Ind AS financial statements)The Group is involved in various legal proceedings including product liability, contracts, employment claims, anti-trust and other regulatory matters relating to conduct of its business.
The Group assesses the need to make provision or to disclose a contingent liability on a case-to-case basis considering the underlying facts of each litigation.
The eventual outcome of the litigations is uncertain and estimation at balance sheet date involves extensive judgement of management including input from legal counsel due to complexity of each litigation. Adverse outcomes could significantly impact the Group's reported profit and balance sheet position.
Our audit procedures and procedures performed by component auditors amongst others included the following:
• Evaluated the design and tested the operating effectiveness of controls in respect of the identification, evaluation of litigations, the recording / re-assessment of the related liabilities, provisions and disclosures.
• Obtained a list of litigations from the Group's in-house legal counsel; identified material litigations from the aforementioned list and performed inquiries with the said counsel; obtained and read the underlying documents to assess the assumptions used by management in arriving at the conclusions.

FINANCIAL STATEMENTS
Annual Report 2018-19
157Consolidated
Key audit matter How our audit addressed the key audit matterConsidering the judgement involved in determining the need to make a provision or disclose as contingent liability, the matter is considered a key audit matter.
• Read legal confirmations from Group’s external legal counsels in respect of material litigations and considered that in our assessment.
• Read the disclosures related to provisions and contingent liabilities in the consolidated Ind AS financial statements to assess consistency with underlying documents.
Rebates, discounts, chargebacks, returns and other allowances (as described in note 54 of the consolidated Ind AS financial statements)The Group generates revenue across various geographies through commercial arrangements prevalent in those geographies. These commercial arrangements involve rebates, discounts, chargebacks, right to return and other allowances, which are deducted from the gross revenue to arrive at Revenue from Operations.
These deductions involve significant judgement and estimation, in particular the accruals associated with the revenue transactions pertaining to the generics business of United States and is hence considered as a key audit matter.
Our audit procedures and procedures performed by component auditors amongst others included the following:
• Assessed and tested the design and operating effectiveness of the Group’s controls over the completeness, recognition and measurement of accrual.
• Obtained management’s computations for accruals under respective contractual arrangements.
• Evaluated the key assumptions used by the Group by comparing it with prior years.
• Analysed the historical pattern of chargebacks, the inventory information and performed retrospective reviews in order to validate management’s assumption.
• Compared the assumptions in respect of rebates, discounts, allowances and returns to current payment trends.
Goodwill and other intangible assets (as described in note 3b and 48 of the consolidated Ind AS financial statements)The Group has significant intangible assets, comprising acquired trademarks, product intangibles and goodwill. The Group conducts an annual impairment testing of goodwill and intangible assets using discounted cash flow method.
Significant judgements are used to estimate the recoverable amount of these intangible assets and goodwill. The determination of recoverable amounts involves use of several key assumptions, including estimates of future sales volume, and prices, operating costs, terminal value growth rates and the weighted average cost of capital (discount rate) and is hence considered as a key audit matter.
Our audit procedures and procedures performed by component auditors amongst others included the following:
• Evaluated the design and tested the operating effectiveness of management’s controls in assessing the carrying value of goodwill and intangible assets.
• Obtained the Group’s computation of recoverable amount and tested the reasonableness of key assumptions, including profit and cash flow forecast, terminal values, potential product obsolescence and the discount rates.
• Obtained and evaluated management’s sensitivity analysis to ascertain the impact of changes in key assumptions and performed our own independent sensitivity calculations to quantify the downside impact to determination of recoverable amount.
Tax litigations and recognition of deferred tax assets (as described in note 40 and 51 of the consolidated Ind AS financial statements)The Group has significant tax litigations for which the Group assesses the outcome on a case-to-case basis considering the underlying facts of each tax litigation. Adverse outcomes could significantly impact the Group’s reported profit and balance sheet position.
The assessment of outcome of litigations involves significant judgement which is dependent on the facts of each case, supporting judicial precedents and legal opinions of external and internal legal counsels.
Also, recognition of deferred tax assets is a key audit matter as the assessment of its recoverability within the allowed time frame involves significant estimate of the financial projections, availability of sufficient taxable income in the future and also involves significant judgements in the interpretation of tax regulations and tax positions adopted by the Group.
Our audit procedures and procedures performed by component auditors amongst others included the following:
• Evaluated the design and tested the operating effectiveness of controls in respect of the identification and evaluation of tax litigations/deferred tax and the recording and re-assessment of the related liabilities/assets and provisions and disclosures.
• Engaged tax specialists, to evaluate management’s assessment of the outcome of these litigations.
• Our specialists considered legal precedence and other rulings in evaluating management's position on these tax litigations.

Sun Pharmaceutical Industries Ltd.
Specialty in progress
158
Key audit matter How our audit addressed the key audit matter• Tested management’s assumptions including forecasts and
sensitivity analysis in respect of recoverability of deferred taxes on unabsorbed depreciation/carry forward losses.
• Evaluated disclosures of the tax positions, tax loss carry forwards and tax litigations in the consolidated Ind AS financial statements.
Application of Ind AS 115 (as described in note 54 of the consolidated Ind AS financial statements)The Group adopted Ind AS 115 Revenue from Contracts with Customers with effect from April 01, 2018.
We focused on this area as the adoption of Ind AS-115 was a significant event that had a significant effect on the consolidated Ind AS financial statements of the Group requiring significant auditor attention.
Our audit procedures and procedures performed by component auditors amongst others included the following:
• Evaluated the design and tested the operating effectiveness of management’s controls in assessing the change in accounting policies on account of implementation of new standards.
• Assessed whether the adjustments to the respective account balances have been made in accordance with the requirements set out in the new standard.
• Engaged Ind AS specialists, to evaluate management’s assessment of the impact of Ind AS 115, including disclosures.
• Evaluated the adequacy of financial statement disclosures, including disclosures of key assumptions and judgements.
Identification and disclosure of related parties (as described in note 75 of the consolidated Ind AS financial statements)The Group has related party transactions which include, amongst others, sale and purchase of goods/services to its associates, joint ventures and other related parties and lending and borrowing to its associates and joint ventures.
We focused on identification and disclosure of related parties in accordance with relevant accounting standards as a key audit matter.
Our audit procedures and procedures performed by component auditors amongst others included the following:
• Evaluated the design and tested the operating effectiveness of controls over identification and disclosure of related party transactions.
• Obtained a list of related parties from the Group’s management and traced the related parties to declarations given by directors, where applicable, and to note 75 of the consolidated Ind AS financial statements.
• Read minutes of the meetings of the Board of Directors and Audit Committee.
• Tested material creditors/debtors, loan outstanding/loans taken to evaluate existence of any related party relationships; tested transactions based on declarations of related party transactions given to the Board of Directors and Audit Committee.
• Evaluated the disclosures in the consolidated Ind AS financial statements for compliance with Ind AS 24.
Transition of business from Aditya Medisales Limited (as described in note 64 of the consolidated Ind AS financial statements)The Group has announced transition of the Indian Domestic Formulation distribution business from Aditya Medisales Limited (“AML”), a related party, to a wholly owned subsidiary of the Group. As part of the transition, the Group has taken back its unsold inventory lying with AML as on March 31, 2019.
We focused on this area considering that this was a significant event during the year and being a transaction with a related party.
Our audit procedures amongst others included the following:
• Evaluated the design and tested the operating effectiveness of the controls over the accounting of this transaction.
• Performed count of the physical inventory taken back from AML by the Group as at March 31, 2019 on a test check basis.
• Tested the working for valuation of such inventory on a sample basis.
• Traced the closing receivable balance with the confirmation received from AML.
• Tested supporting workings and evidences related to accounting.
• Evaluated the disclosures in the consolidated Ind AS financial statements.
FINANCIAL STATEMENTS
Annual Report 2018-19
159Consolidated
Other InformationThe Holding Company’s Board of Directors is responsible for the other information. The other information comprises the information included in the Annual report, but does not include the consolidated Ind AS financial statements and our auditor’s report thereon.
Our opinion on the consolidated Ind AS financial statements does not cover the other information and we do not express any form of assurance conclusion thereon.
In connection with our audit of the consolidated Ind AS financial statements, our responsibility is to read the other information and in doing so consider whether such other information is materially inconsistent with the consolidated Ind AS financial statements or our knowledge obtained in the audit or otherwise appears to be materially misstated. If, based on the work we have performed, we conclude that there is a material misstatement of this other information, we are required to report that fact. We have nothing to report in this regard.
RESPONSIBILITIES OF MANAGEMENT FOR THE CONSOLIDATED IND AS FINANCIAL STATEMENTSThe Holding Company’s Board of Directors is responsible for the preparation and presentation of these consolidated Ind AS financial statements in terms of the requirements of the Act that give a true and fair view of the consolidated financial position, consolidated financial performance including other comprehensive income, consolidated cash flows and consolidated statement of changes in equity of the Group including its associates and joint ventures in accordance with the accounting principles generally accepted in India, including the Indian Accounting Standards (Ind AS) specified under section 133 of the Act read with the Companies (Indian Accounting Standards) Rules, 2015, as amended . The respective Board of Directors of the companies included in the Group and of its associates and joint ventures are responsible for maintenance of adequate accounting records in accordance with the provisions of the Act for safeguarding of the assets of the Group and of its associates and joint ventures and for preventing and detecting frauds and other irregularities; selection and application of appropriate accounting policies; making judgments and estimates that are reasonable and prudent; and the design, implementation and maintenance of adequate internal financial controls, that were operating effectively for ensuring the accuracy and completeness of the accounting records, relevant to the preparation and presentation of the consolidated Ind AS financial statements that give a true and fair view and are free from material misstatement, whether due to fraud or error, which have been used for the purpose of preparation of the consolidated Ind AS financial statements by the Directors of the Holding Company, as aforesaid.
In preparing the consolidated Ind AS financial statements, the respective Board of Directors of the companies included in the Group and of its associates and joint ventures are responsible for assessing the ability of the Group and of its associates and joint ventures to continue as a going concern, disclosing, as applicable, matters related to going concern
and using the going concern basis of accounting unless management either intends to liquidate the Group or to cease operations, or has no realistic alternative but to do so.
The respective Board of Directors of the companies included in the Group and of its associates and joint venture are also responsible for overseeing the financial reporting process of the Group and of its associates and joint ventures.
AUDITOR’S RESPONSIBILITIES FOR THE AUDIT OF THE CONSOLIDATED IND AS FINANCIAL STATEMENTSOur objectives are to obtain reasonable assurance about whether the consolidated Ind AS financial statements as a whole are free from material misstatement, whether due to fraud or error, and to issue an auditor’s report that includes our opinion. Reasonable assurance is a high level of assurance, but is not a guarantee that an audit conducted in accordance with SAs will always detect a material misstatement when it exists. Misstatements can arise from fraud or error and are considered material if, individually or in the aggregate, they could reasonably be expected to influence the economic decisions of users taken on the basis of these consolidated Ind AS financial statements.
As part of an audit in accordance with SAs, we exercise professional judgment and maintain professional skepticism throughout the audit. We also:
• Identify and assess the risks of material misstatement of the consolidated Ind AS financial statements, whether due to fraud or error, design and perform audit procedures responsive to those risks and obtain audit evidence that is sufficient and appropriate to provide a basis for our opinion. The risk of not detecting a material misstatement resulting from fraud is higher than for one resulting from error, as fraud may involve collusion, forgery, intentional omissions, misrepresentations, or the override of internal control.
• Obtain an understanding of internal control relevant to the audit in order to design audit procedures that are appropriate in the circumstances. Under section 143(3)(i) of the Act, we are also responsible for expressing our opinion on whether the Holding Company has adequate internal financial controls system in place and the operating effectiveness of such controls.
• Evaluate the appropriateness of accounting policies used and the reasonableness of accounting estimates and related disclosures made by management.
• Conclude on the appropriateness of management’s use of the going concern basis of accounting and based on the audit evidence obtained, whether a material uncertainty exists related to events or conditions that may cast significant doubt on the ability of the Group and its associates and joint ventures to continue as a going concern. If we conclude that a material uncertainty exists, we are required to draw attention in our auditor’s report to the related disclosures in the consolidated Ind AS financial statements or, if such disclosures are inadequate, to modify our opinion. Our conclusions are
Sun Pharmaceutical Industries Ltd.
Specialty in progress
160
based on the audit evidence obtained up to the date of our auditor’s report. However, future events or conditions may cause the Group and its associates and joint ventures to cease to continue as a going concern.
• Evaluate the overall presentation, structure and content of the consolidated Ind AS financial statements, including the disclosures, and whether the consolidated Ind AS financial statements represent the underlying transactions and events in a manner that achieves fair presentation.
• Obtain sufficient appropriate audit evidence regarding the financial information of the entities or business activities within the Group and its associates and joint ventures of which we are the independent auditors and whose financial information we have audited, to express an opinion on the consolidated Ind AS financial statements. We are responsible for the direction, supervision and performance of the audit of the financial statements of such entities included in the consolidated Ind AS financial statements of which we are the independent auditors. For the other entities included in the consolidated financial statements, which have been audited by other auditors, such other auditors remain responsible for the direction, supervision and performance of the audits carried out by them. We remain solely responsible for our audit opinion.
We communicate with those charged with governance of the Holding Company and such other entities included in the consolidated Ind AS financial statements of which we are the independent auditors regarding, among other matters, the planned scope and timing of the audit and significant audit findings, including any significant deficiencies in internal control that we identify during our audit.
We also provide those charged with governance with a statement that we have complied with relevant ethical requirements regarding independence and to communicate with them all relationships and other matters that may reasonably be thought to bear on our independence and where applicable, related safeguards.
From the matters communicated with those charged with governance, we determine those matters that were of most significance in the audit of the consolidated Ind AS financial statements for the financial year ended March 31, 2019 and are therefore the key audit matters. We describe these matters in our auditor’s report unless law or regulation precludes public disclosure about the matter or when, in extremely rare circumstances, we determine that a matter should not be communicated in our report because the adverse consequences of doing so would reasonably be expected to outweigh the public interest benefits of such communication.
OTHER MATTER(a) We did not audit the financial statements and other
financial information, in respect of 28 subsidiaries, whose Ind AS financial statements, without giving the effect to elimination of intra group transactions, include total assets of ` 594,405.9 million as at March 31,
2019, and total revenues of ` 211,955.5 million and net cash outflows of ` 28,919.5 million for the year ended on that date. These Ind AS financial statement and other financial information have been audited by other auditors, whose financial statements, other financial information and auditor’s reports have been furnished to us by management. The consolidated Ind AS financial statements also include the Group’s share of net loss of ` 14.6 million for the year ended March 31, 2019, as considered in the consolidated Ind AS financial statements, in respect of 5 associates and joint ventures, whose financial statements, other financial information have been audited by other auditors and whose reports have been furnished to us by management. Our opinion on the consolidated Ind AS financial statements, in so far as it relates to the amounts and disclosures included in respect of these subsidiaries, joint ventures and associates, and our report in terms of sub-sections (3) of Section 143 of the Act, in so far as it relates to the aforesaid subsidiaries, joint ventures and associates, is based solely on the reports of such other auditors.
Certain of these subsidiaries are located outside India whose financial statements and other financial information have been prepared in accordance with accounting principles generally accepted in their respective countries and which have been audited by other auditors under generally accepted auditing standards applicable in their respective countries. The Company’s management has converted the financial statements of such subsidiaries located outside India from accounting principles generally accepted in their respective countries to accounting principles generally accepted in India. We have audited these conversion adjustments made by the Company’s management. Our opinion in so far as it relates to the balances and affairs of such subsidiaries located outside India is based on the report of other auditors and the conversion adjustments prepared by the management of the Company and audited by us.
(b) The accompanying consolidated Ind AS financial statements include unaudited financial statements and other unaudited financial information in respect of 30 subsidiaries, whose financial statements and other financial information, without giving effect to elimination of intra group transactions, reflect total assets of ` 226,010.9 million as at March 31, 2019, and total revenues of ` 5,846.8 million and net cash outflows of ` 322.2 million for the year ended on that date. These unaudited financial statements and other unaudited financial information have been furnished to us by management. Our opinion, in so far as it relates amounts and disclosures included in respect of these subsidiaries and our report in terms of sub-sections (3) of Section 143 of the Act in so far as it relates to the aforesaid subsidiaries is based solely on such unaudited financial statement and other unaudited financial information. In our opinion and according to the information and explanations given to us by management, these financial statements and other financial information are not material to the Group.

FINANCIAL STATEMENTS
Annual Report 2018-19
161Consolidated
Our opinion above on the consolidated Ind AS financial statements, and our report on Other Legal and Regulatory Requirements below, is not modified in respect of the above matters with respect to our reliance on the work done and the reports of the other auditors and the financial statements and other financial information certified by management.
REPORT ON OTHER LEGAL AND REGULATORY REQUIREMENTSAs required by Section 143(3) of the Act, based on our audit and on the consideration of report of the other auditors on separate financial statements and the other financial information of subsidiaries, associates and joint ventures, as noted in the ‘Other matter’ paragraph we report, to the extent applicable, that:
(a) We/the other auditors whose report we have relied upon have sought and obtained all the information and explanations which to the best of our knowledge and belief were necessary for the purposes of our audit of the aforesaid consolidated Ind AS financial statements;
(b) In our opinion, proper books of account as required by law relating to preparation of the aforesaid consolidation of the financial statements have been kept so far as it appears from our examination of those books and reports of the other auditors;
(c) The consolidated Balance Sheet, the consolidated Statement of Profit and Loss including the Statement of Other Comprehensive Income, the consolidated Cash Flow Statement and consolidated Statement of Changes in Equity dealt with by this Report are in agreement with the books of account maintained for the purpose of preparation of the consolidated Ind AS financial statements;
(d) In our opinion, the aforesaid consolidated Ind AS financial statements comply with the Accounting Standards specified under Section 133 of the Act, read with Companies (Indian Accounting Standards) Rules, 2015, as amended;
(e) On the basis of the written representations received from the directors of the Holding Company as on March 31, 2019 taken on record by the Board of Directors of the Holding Company and the reports of the statutory auditors who are appointed under Section 139 of the Act, of its subsidiary companies, associate companies and joint ventures, none of the directors of the Group’s companies, its associates and joint ventures incorporated in India is disqualified as on March 31, 2019 from being appointed as a director in terms of Section 164 (2) of the Act;
(f) With respect to the adequacy and the operating effectiveness of the internal financial controls over financial reporting with reference to these consolidated Ind AS financial statements of the Holding Company
and its subsidiary companies, associate companies and joint ventures incorporated in India, refer to our separate Report in “Annexure 1” to this report;
(g) In our opinion and based on the consideration of reports of other statutory auditors of the subsidiaries, associates and joint ventures, the managerial remuneration for the year ended March 31, 2019 has been paid / provided by the Holding Company, its subsidiaries, associates and joint ventures incorporated in India to their directors in accordance with the provisions of section 197 read with Schedule V to the Act;
(h) With respect to the other matters to be included in the Auditor’s Report in accordance with Rule 11 of the Companies (Audit and Auditors) Rules, 2014, as amended, in our opinion and to the best of our information and according to the explanations given to us and based on the consideration of the report of the other auditors on separate financial statements as also the other financial information of the subsidiaries, associates and joint ventures, as noted in the ‘Other matter’ paragraph:
i. The consolidated Ind AS financial statements disclose the impact of pending litigations on its consolidated financial position of the Group, its associates and joint ventures in its consolidated Ind AS financial statements – Refer note 40 to the consolidated Ind AS financial statements;
ii. Provision has been made in the consolidated Ind AS financial statements, as required under the applicable law or accounting standards, for material foreseeable losses, if any, on long-term contracts including derivative contracts – Refer (a) note 23 and 29 to the consolidated Ind AS financial statements in respect of such items as it relates to the Group, its associates and joint ventures and (b) the Group’s share of net profit/loss in respect of its associates;
iii. There has been no delay in transferring amounts, required to be transferred, to the Investor Education and Protection Fund by the Holding Company, its subsidiaries, associates and joint ventures incorporated in India, except a sum of ` 3.2 million, which is held in abeyance due to pending legal cases.
For S R B C & CO LLPChartered AccountantsICAI Firm Registration No. : 324982E/E300003
per PAUL ALVARESPartnerMembership No. : 105754
Place of Signature: MumbaiDate: May 28, 2019

Sun Pharmaceutical Industries Ltd.
Specialty in progress
162
REPORT ON THE INTERNAL FINANCIAL CONTROLS UNDER CLAUSE (I) OF SUB-SECTION 3 OF SECTION 143 OF THE COMPANIES ACT, 2013 (“THE ACT”)In conjunction with our audit of the consolidated Ind AS financial statements of Sun Pharmaceutical Industries Limited as of and for the year ended March 31, 2019, we have audited the internal financial controls over financial reporting of Sun Pharmaceutical Industries Limited (hereinafter referred to as the “Holding Company”) and its subsidiary companies, which are companies incorporated in India, as of that date.
MANAGEMENT’S RESPONSIBILITY FOR INTERNAL FINANCIAL CONTROLSThe respective Board of Directors of the Holding Company, its subsidiary companies, which are companies incorporated in India, are responsible for establishing and maintaining internal financial controls based on the internal control over financial reporting criteria established by the Holding Company considering the essential components of internal control stated in the Guidance Note on Audit of Internal Financial Controls Over Financial Reporting issued by the Institute of Chartered Accountants of India. These responsibilities include the design, implementation and maintenance of adequate internal financial controls that were operating effectively for ensuring the orderly and efficient conduct of its business, including adherence to the respective company’s policies, the safeguarding of its assets, the prevention and detection of frauds and errors, the accuracy and completeness of the accounting records, and the timely preparation of reliable financial information, as required under the Act.
AUDITOR’S RESPONSIBILITYOur responsibility is to express an opinion on the company's internal financial controls over financial reporting with reference to these consolidated Ind AS financial statements based on our audit. We conducted our audit in accordance with the Guidance Note on Audit of Internal Financial Controls Over Financial Reporting (the “Guidance Note”) and the Standards on Auditing, both, issued by Institute of Chartered Accountants of India, and deemed to be prescribed under section 143(10) of the Act, to the extent applicable to an audit of internal financial controls. Those Standards and the Guidance Note require that we comply with ethical requirements and plan and perform the audit to obtain reasonable assurance about whether adequate internal financial controls over financial reporting with reference to these consolidated Ind AS financial
Annexure 1 to the Independent Auditors Report of even date on the Consolidated Ind AS Financial Statements of Sun Pharmaceutical Industries Limited
statements was established and maintained and if such controls operated effectively in all material respects.
Our audit involves performing procedures to obtain audit evidence about the adequacy of the internal financial controls over financial reporting with reference to these consolidated Ind AS financial statements and their operating effectiveness. Our audit of internal financial controls over financial reporting included obtaining an understanding of internal financial controls over financial reporting with reference to these consolidated Ind AS financial statements, assessing the risk that a material weakness exists, and testing and evaluating the design and operating effectiveness of internal control based on the assessed risk. The procedures selected depend on the auditor’s judgement, including the assessment of the risks of material misstatement of the financial statements, whether due to fraud or error.
We believe that the audit evidence we have obtained and the audit evidence obtained by the other auditors in terms of their reports referred to in the Other Matters paragraph below, is sufficient and appropriate to provide a basis for our audit opinion on the internal financial controls over financial reporting with reference to these consolidated Ind AS financial statements.
MEANING OF INTERNAL FINANCIAL CONTROLS OVER FINANCIAL REPORTING WITH REFERENCE TO THESE CONSOLIDATED FINANCIAL STATEMENTSA company's internal financial control over financial reporting with reference to these consolidated Ind AS financial statements is a process designed to provide reasonable assurance regarding the reliability of financial reporting and the preparation of financial statements for external purposes in accordance with generally accepted accounting principles. A company's internal financial control over financial reporting with reference to these consolidated financial statements includes those policies and procedures that (1) pertain to the maintenance of records that, in reasonable detail, accurately and fairly reflect the transactions and dispositions of the assets of the company; (2) provide reasonable assurance that transactions are recorded as necessary to permit preparation of financial statements in accordance with generally accepted accounting principles, and that receipts and expenditures of the company are being made only in accordance with authorisations of management and directors of the company; and (3) provide reasonable assurance regarding prevention or timely detection of unauthorised acquisition, use, or disposition of the company's assets that could have a material effect on the financial statements.

FINANCIAL STATEMENTS
Annual Report 2018-19
163Consolidated
INHERENT LIMITATIONS OF INTERNAL FINANCIAL CONTROLS OVER FINANCIAL REPORTING WITH REFERENCE TO THESE CONSOLIDATED IND AS FINANCIAL STATEMENTSBecause of the inherent limitations of internal financial controls over financial reporting with reference to these consolidated Ind AS financial statements, including the possibility of collusion or improper management override of controls, material misstatements due to error or fraud may occur and not be detected. Also, projections of any evaluation of the internal financial controls over financial reporting with reference to these consolidated Ind AS financial statements to future periods are subject to the risk that the internal financial control over financial reporting with reference to these consolidated Ind AS financial statements may become inadequate because of changes in conditions, or that the degree of compliance with the policies or procedures may deteriorate.
OPINIONIn our opinion, the Holding Company and its subsidiary companies, which are companies incorporated in India, have, maintained in all material respects, adequate internal financial controls over financial reporting with reference to these consolidated Ind AS financial statements and such internal financial controls over financial reporting with reference to these consolidated Ind AS financial statements were operating effectively as at March 31,
2019, based on the internal control over financial reporting criteria established by the Holding Company considering the essential components of internal control stated in the Guidance Note on Audit of Internal Financial Controls Over Financial Reporting issued by the Institute of Chartered Accountants of India.
OTHER MATTERSOur report under Section 143(3)(i) of the Act on the adequacy and operating effectiveness of the internal financial controls over financial reporting with reference to these consolidated Ind AS financial statements of the Holding Company, insofar as it relates to 1 subsidiary company, which is company incorporated in India, is based on the corresponding reports of the auditors of such subsidiary incorporated in India.
For S R B C & CO LLPChartered AccountantsICAI Firm Registration No. : 324982E/E300003
per PAUL ALVARESPartnerMembership No. : 105754
Place of Signature: MumbaiDate: May 28, 2019
Sun Pharmaceutical Industries Ltd.
Specialty in progress
164
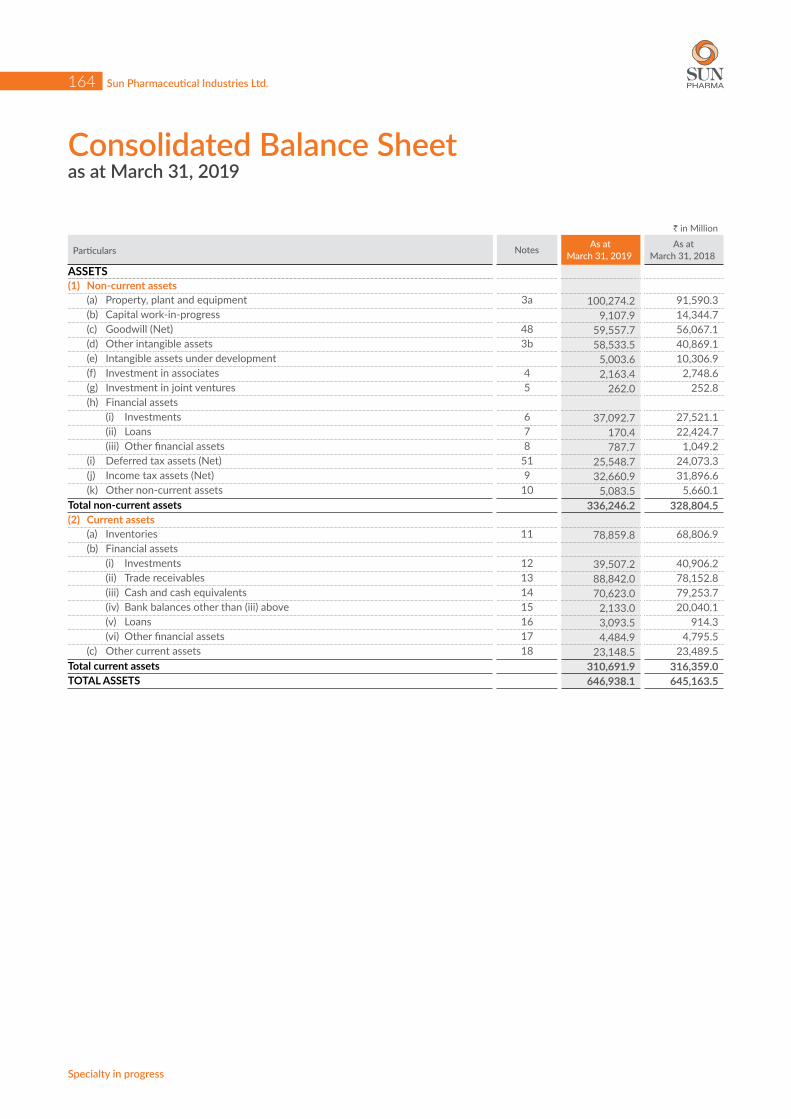
Consolidated Balance Sheet as at March 31, 2019
` in Million
Particulars Notes As at March 31, 2019
As at March 31, 2018
ASSETS(1) Non-current assets (a) Property, plant and equipment 3a 100,274.2 91,590.3 (b) Capital work-in-progress 9,107.9 14,344.7 (c) Goodwill (Net) 48 59,557.7 56,067.1 (d) Other intangible assets 3b 58,533.5 40,869.1 (e) Intangible assets under development 5,003.6 10,306.9 (f) Investment in associates 4 2,163.4 2,748.6 (g) Investment in joint ventures 5 262.0 252.8 (h) Financial assets (i) Investments 6 37,092.7 27,521.1 (ii) Loans 7 170.4 22,424.7 (iii) Other financial assets 8 787.7 1,049.2 (i) Deferred tax assets (Net) 51 25,548.7 24,073.3 (j) Income tax assets (Net) 9 32,660.9 31,896.6 (k) Other non-current assets 10 5,083.5 5,660.1 Total non-current assets 336,246.2 328,804.5 (2) Current assets (a) Inventories 11 78,859.8 68,806.9 (b) Financial assets (i) Investments 12 39,507.2 40,906.2 (ii) Trade receivables 13 88,842.0 78,152.8 (iii) Cash and cash equivalents 14 70,623.0 79,253.7 (iv) Bank balances other than (iii) above 15 2,133.0 20,040.1 (v) Loans 16 3,093.5 914.3 (vi) Other financial assets 17 4,484.9 4,795.5 (c) Other current assets 18 23,148.5 23,489.5 Total current assets 310,691.9 316,359.0 TOTAL ASSETS 646,938.1 645,163.5

FINANCIAL STATEMENTS
Annual Report 2018-19
165Consolidated
Consolidated Balance Sheet as at March 31, 2019
` in Million
Particulars Notes As at March 31, 2019
As at March 31, 2018
EQUITY AND LIABILITIESEquity (a) Equity share capital 19 2,399.3 2,399.3 (b) Other equity 20 411,691.3 380,741.8 Equity attributable to the equity shareholders of the Company 414,090.6 383,141.1 Non-controlling interests 72 33,135.4 38,841.6 Total equity 447,226.0 421,982.7 Liabilities(1) Non-current liabilities (a) Financial liabilities (i) Borrowings 21 15,226.1 17,720.9 (ii) Other financial liabilities 22 30.6 316.5 (b) Provisions 23 4,303.9 4,044.6 (c) Deferred tax liabilities (Net) 51 1,042.8 2,189.6 (d) Other non-current liabilities 24 5,712.5 266.0 Total non-current liabilities 26,315.9 24,537.6 (2) Current liabilities (a) Financial liabilities (i) Borrowings 25 83,707.6 79,797.0 (ii) Trade payables 26 41,478.7 47,662.0 (iii) Other financial liabilities 27 10,273.2 13,377.2 (b) Other current liabilities 28 7,344.0 5,382.1 (c) Provisions 29 29,323.3 51,096.6 (d) Current tax liabilities (Net) 30 1,269.4 1,328.3 Total current liabilities 173,396.2 198,643.2 Total liabilities 199,712.1 223,180.8 TOTAL EQUITY AND LIABILITIES 646,938.1 645,163.5
The accompanying notes are an integral part of the consolidated financial statements
As per our report of even date
For S R B C & CO LLP For and on behalf of the Board of Directors of Chartered Accountants Sun Pharmaceutical Industries LimitedICAI Firm Registration No. : 324982E/E300003
per PAUL ALVARES DILIP S. SHANGHVIPartner Managing DirectorMembership No. : 105754Mumbai, May 28, 2019
C. S. MURALIDHARAN SUDHIR V. VALIA Chief Financial Officer Wholetime Director
SUNIL R. AJMERA SAILESH T. DESAI Company Secretary Wholetime Director
Mumbai, May 28, 2019
Sun Pharmaceutical Industries Ltd.
Specialty in progress
166
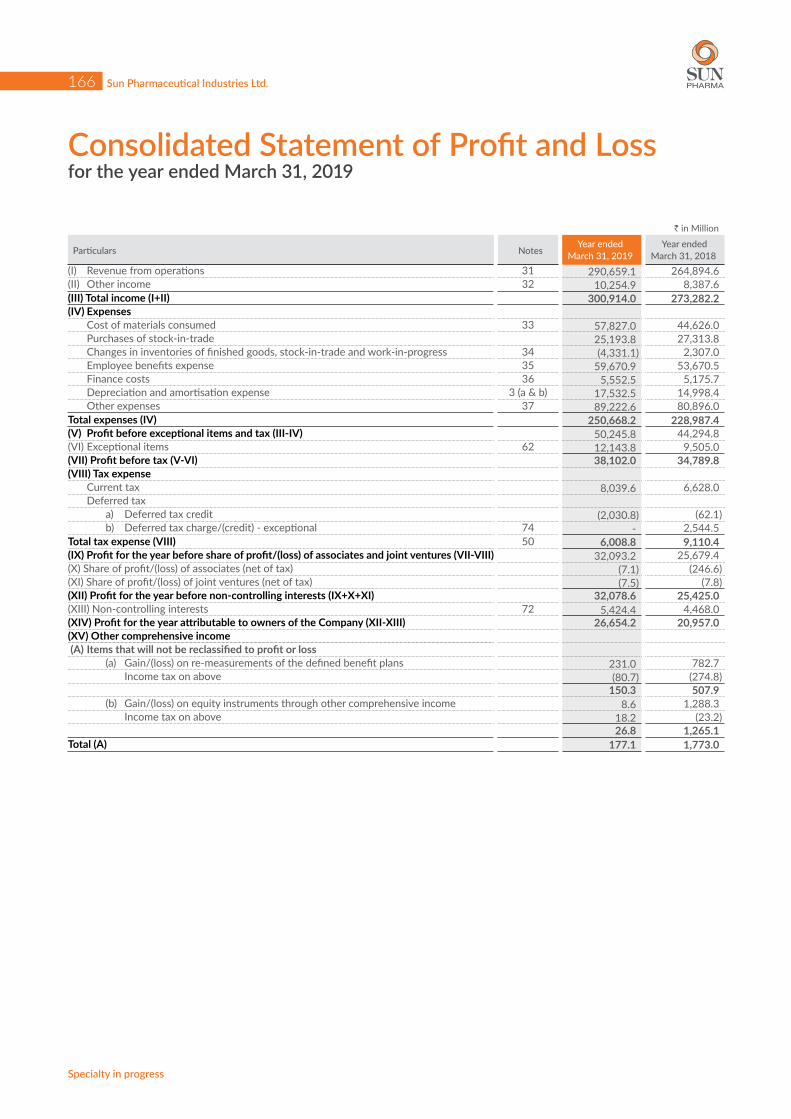
Consolidated Statement of Profit and Loss for the year ended March 31, 2019
` in Million
Particulars Notes Year ended
March 31, 2019 Year ended
March 31, 2018(I) Revenue from operations 31 290,659.1 264,894.6 (II) Other income 32 10,254.9 8,387.6 (III) Total income (I+II) 300,914.0 273,282.2 (IV) Expenses Cost of materials consumed 33 57,827.0 44,626.0 Purchases of stock-in-trade 25,193.8 27,313.8 Changes in inventories of finished goods, stock-in-trade and work-in-progress 34 (4,331.1) 2,307.0 Employee benefits expense 35 59,670.9 53,670.5 Finance costs 36 5,552.5 5,175.7 Depreciation and amortisation expense 3 (a & b) 17,532.5 14,998.4 Other expenses 37 89,222.6 80,896.0 Total expenses (IV) 250,668.2 228,987.4 (V) Profit before exceptional items and tax (III-IV) 50,245.8 44,294.8 (VI) Exceptional items 62 12,143.8 9,505.0(VII) Profit before tax (V-VI) 38,102.0 34,789.8 (VIII) Tax expense Current tax 8,039.6 6,628.0 Deferred tax a) Deferred tax credit (2,030.8) (62.1) b) Deferred tax charge/(credit) - exceptional 74 - 2,544.5 Total tax expense (VIII) 50 6,008.8 9,110.4 (IX) Profit for the year before share of profit/(loss) of associates and joint ventures (VII-VIII) 32,093.2 25,679.4 (X) Share of profit/(loss) of associates (net of tax) (7.1) (246.6)(XI) Share of profit/(loss) of joint ventures (net of tax) (7.5) (7.8)(XII) Profit for the year before non-controlling interests (IX+X+XI) 32,078.6 25,425.0 (XIII) Non-controlling interests 72 5,424.4 4,468.0 (XIV) Profit for the year attributable to owners of the Company (XII-XIII) 26,654.2 20,957.0 (XV) Other comprehensive income (A) Items that will not be reclassified to profit or loss (a) Gain/(loss) on re-measurements of the defined benefit plans 231.0 782.7 Income tax on above (80.7) (274.8)
150.3 507.9 (b) Gain/(loss) on equity instruments through other comprehensive income 8.6 1,288.3 Income tax on above 18.2 (23.2)
26.8 1,265.1 Total (A) 177.1 1,773.0
FINANCIAL STATEMENTS
Annual Report 2018-19
167Consolidated
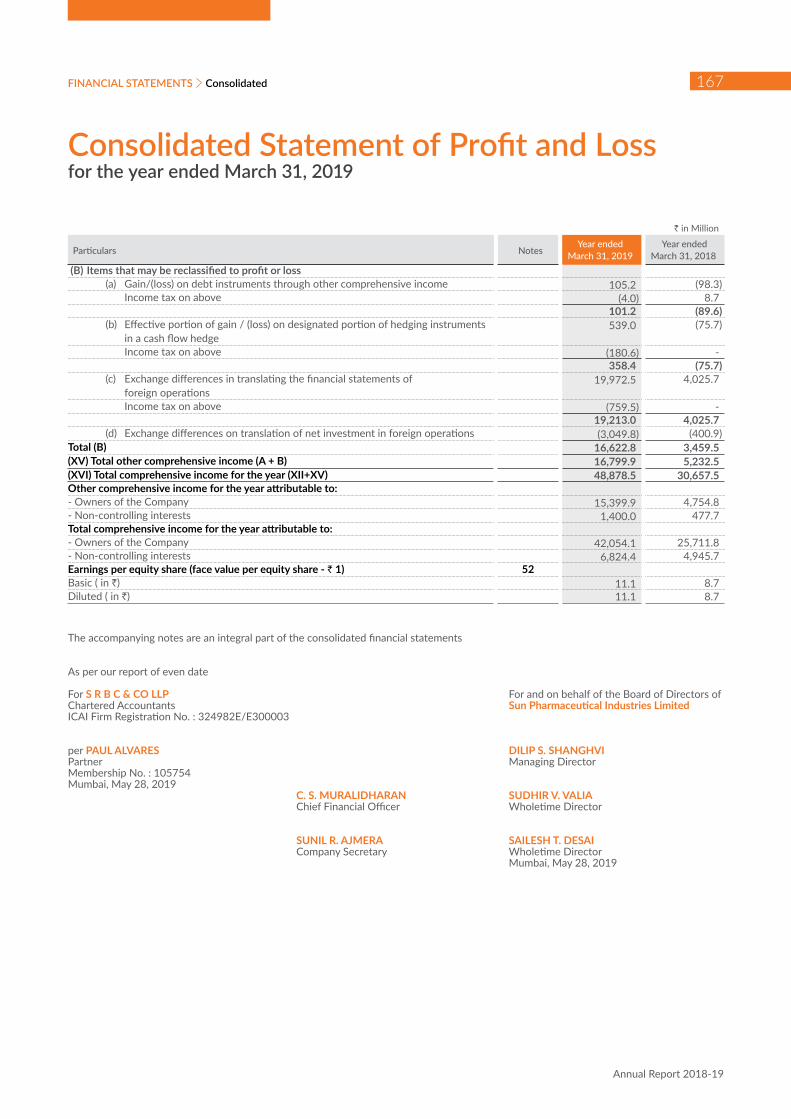
Consolidated Statement of Profit and Loss for the year ended March 31, 2019
The accompanying notes are an integral part of the consolidated financial statements
As per our report of even date
For S R B C & CO LLP For and on behalf of the Board of Directors of Chartered Accountants Sun Pharmaceutical Industries LimitedICAI Firm Registration No. : 324982E/E300003
per PAUL ALVARES DILIP S. SHANGHVIPartner Managing DirectorMembership No. : 105754Mumbai, May 28, 2019
C. S. MURALIDHARAN SUDHIR V. VALIA Chief Financial Officer Wholetime Director
SUNIL R. AJMERA SAILESH T. DESAI Company Secretary Wholetime Director
Mumbai, May 28, 2019
` in Million
Particulars Notes Year ended
March 31, 2019 Year ended
March 31, 2018 (B) Items that may be reclassified to profit or loss (a) Gain/(loss) on debt instruments through other comprehensive income 105.2 (98.3) Income tax on above (4.0) 8.7
101.2 (89.6) (b) Effective portion of gain / (loss) on designated portion of hedging instruments
in a cash flow hedge 539.0 (75.7)
Income tax on above (180.6) - 358.4 (75.7)
(c) Exchange differences in translating the financial statements of foreign operations
19,972.5 4,025.7
Income tax on above (759.5) - 19,213.0 4,025.7
(d) Exchange differences on translation of net investment in foreign operations (3,049.8) (400.9)Total (B) 16,622.8 3,459.5 (XV) Total other comprehensive income (A + B) 16,799.9 5,232.5 (XVI) Total comprehensive income for the year (XII+XV) 48,878.5 30,657.5 Other comprehensive income for the year attributable to:- Owners of the Company 15,399.9 4,754.8 - Non-controlling interests 1,400.0 477.7 Total comprehensive income for the year attributable to:- Owners of the Company 42,054.1 25,711.8 - Non-controlling interests 6,824.4 4,945.7 Earnings per equity share (face value per equity share - ` 1) 52Basic ( in `) 11.1 8.7 Diluted ( in `) 11.1 8.7
Sun Pharmaceutical Industries Ltd.
Specialty in progress
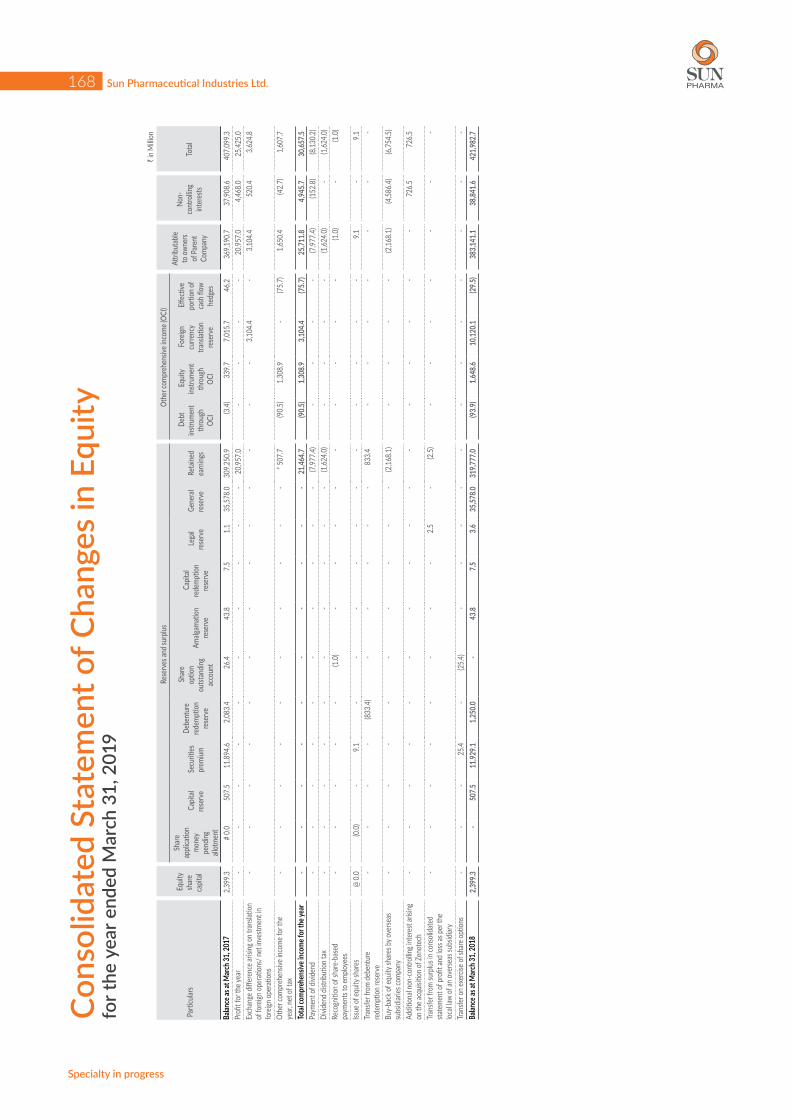
168Co
nsol
idat
ed S
tate
men
t of C
hang
es in
Equ
ity
fo
r the
yea
r end
ed M
arch
31,
201
9
` in M
illion
Parti
cular
s Eq
uity
share
ca
pital
Rese
rves
and s
urplu
s O
ther
comp
rehe
nsive
inco
me (O
CI)
Attrib
utab
le to
owne
rs of
Pare
nt
Comp
any
Non-
cont
rollin
g int
eres
ts To
tal
Share
ap
plica
tion
mone
y pe
nding
all
otme
nt
Cap
ital
rese
rve
Secu
rities
pr
emium
Debe
ntur
e re
demp
tion
rese
rve
Share
op
tion
outst
andin
g ac
coun
t
Am
algam
ation
re
serv
e
Cap
ital
rede
mptio
n re
serv
e
Lega
l re
serv
e G
ener
al re
serv
e R
etain
ed
earn
ings
Deb
t ins
trume
nt
thro
ugh
OCI
Equit
y ins
trume
nt
thro
ugh
OCI
Fore
ign
curre
ncy
trans
lation
re
serv
e
Effec
tive
porti
on of
ca
sh flo
w he
dges
Balan
ce as
at M
arch 3
1, 20
17 2,
399.3
#
0.0
507.5
11
,894.6
2,
083.4
26
.4 43
.8 7.
5 1.
1 35
,578.0
30
9,250
.9 (3
.4) 33
9.7
7,01
5.7
46.2
369,1
90.7
37,90
8.6
407,0
99.3
Profi
t for
the y
ear
- -
- -
- -
- -
- -
20,95
7.0
- -
- -
20,95
7.0
4,46
8.0
25,42
5.0
Exch
ange
diffe
renc
e aris
ing on
tran
slatio
n of
fore
ign op
erati
ons/
net i
nves
tmen
t in
fore
ign op
erati
ons
- -
- -
- -
- -
- -
- -
- 3,
104.4
-
3,10
4.4
520.4
3,
624.8
Othe
r com
preh
ensiv
e inc
ome f
or th
e ye
ar, ne
t of t
ax -
- -
- -
- -
- -
- *
507.7
(9
0.5)
1,30
8.9
- (7
5.7)
1,65
0.4
(42.7
) 1,
607.7
Tota
l com
preh
ensiv
e inc
ome f
or th
e yea
r -
- -
- -
- -
- -
- 21
,464.7
(9
0.5)
1,30
8.9
3,10
4.4
(75.7
) 25
,711.8
4,
945.7
30
,657.5
Pa
ymen
t of d
ivide
nd -
- -
- -
- -
- -
- (7
,977.4
) -
- -
- (7
,977.4
) (1
52.8)
(8,13
0.2)
Divid
end d
istrib
ution
tax
- -
- -
- -
- -
- -
(1,62
4.0)
- -
- -
(1,62
4.0)
- (1
,624.0
)Re
cogn
ition
of sh
are-b
ased
pa
ymen
ts to
emplo
yees
- -
- -
- (1
.0) -
- -
- -
- -
- -
(1.0)
- (1
.0)
Issue
of eq
uity s
hare
s@
0.0
(0.0)
- 9.
1 -
- -
- -
- -
- -
- -
9.1
- 9.
1 Tra
nsfe
r fro
m de
bent
ure
rede
mptio
n res
erve
- -
- -
(833
.4) -
- -
- -
833.4
-
- -
- -
- -
Buy-
back
of eq
uity s
hare
s by o
verse
as
subs
idiar
ies co
mpan
y -
- -
- -
- -
- -
- (2
,168.1
) -
- -
- (2
,168.1
) (4
,586.4
) (6
,754.5
)
Additi
onal
non-
cont
rollin
g int
eres
t aris
ing
on th
e acq
uisiti
on of
Zeno
tech
- -
- -
- -
- -
- -
- -
- -
- -
726.5
72
6.5
Trans
fer f
rom
surp
lus in
cons
olida
ted
state
ment
of pr
ofit a
nd lo
ss as
per t
he
local
law of
an ov
erse
as su
bsidi
ary
- -
- -
- -
- -
2.5
- (2
.5) -
- -
- -
- -
Trans
fer o
n exe
rcise
of sh
are op
tions
- -
- 25
.4 -
(25.4
) -
- -
- -
- -
- -
- -
- Ba
lance
as at
Marc
h 31,
2018
2,39
9.3
- 50
7.5
11,92
9.1
1,25
0.0
- 43
.8 7.
5 3.
6 35
,578.0
31
9,777
.0 (9
3.9)
1,64
8.6
10,12
0.1
(29.5
) 38
3,141
.1 38
,841.6
42
1,982
.7

FINANCIAL STATEMENTS
Annual Report 2018-19
169ConsolidatedCo
nsol
idat
ed S
tate
men
t of C
hang
es in
Equ
ity
fo
r the
yea
r end
ed M
arch
31,
201
9
` in M
illion
Parti
cular
s Eq
uity
share
ca
pital
Rese
rves
and s
urplu
s O
ther
comp
rehe
nsive
inco
me (O
CI)
Attrib
utab
le to
owne
rs of
Pare
nt
Comp
any
Non-
cont
rollin
g int
eres
ts To
tal
Share
ap
plica
tion
mone
y pe
nding
all
otme
nt
Cap
ital
rese
rve
Secu
rities
pr
emium
Debe
ntur
e re
demp
tion
rese
rve
Share
op
tion
outst
andin
g ac
coun
t
Am
algam
ation
re
serv
e
Cap
ital
rede
mptio
n re
serv
e
Lega
l re
serv
e G
ener
al re
serv
e R
etain
ed
earn
ings
Deb
t ins
trume
nt
thro
ugh
OCI
Equit
y ins
trume
nt
thro
ugh
OCI
Fore
ign
curre
ncy
trans
lation
re
serv
e
Effec
tive
porti
on of
ca
sh flo
w he
dges
Profi
t for
the y
ear
- -
- -
- -
- -
- -
26,65
4.2
- -
- -
26,65
4.2
5,42
4.4
32,07
8.6
Exch
ange
diffe
renc
e aris
ing on
tran
slatio
n of
fore
ign op
erati
ons/
net i
nves
tmen
t in
fore
ign op
erati
ons,
net o
f tax
- -
- -
- -
- -
- -
- -
- 14
,816.6
-
14,81
6.6
1,34
6.6
16,16
3.2
Othe
r com
preh
ensiv
e inc
ome f
or th
e ye
ar, ne
t of t
ax -
- -
- -
- -
- -
- *
150.2
82
.7 (1
5.7)
- 36
6.1
583.3
53
.4 63
6.7
Tota
l com
preh
ensiv
e inc
ome f
or th
e yea
r -
- -
- -
- -
- -
- 26
,804.4
82
.7 (1
5.7)
14,81
6.6
366.1
42
,054.1
6,
824.4
48
,878.5
Pa
ymen
t of d
ivide
nd -
- -
- -
- -
- -
- (4
,791.6
) -
- -
- (4
,791.6
) (8
,455.5
) (1
3,247
.1)Di
viden
d dist
ributi
on ta
x -
- -
- -
- -
- -
- (9
84.9)
- -
- -
(984
.9) -
(984
.9)On
acqu
isitio
n of s
ubsid
iary
(Ref
er no
te 76
) -
- 3,
174.2
-
- -
- -
- -
- -
- -
- 3,
174.2
-
3,17
4.2
Trans
fer f
rom
debe
ntur
e re
demp
tion r
eser
ve -
- -
- (1
,250.0
) -
- -
- -
1,25
0.0
- -
- -
- -
-
Buy-
back
/ pu
rchas
e of e
quity
share
s by
over
seas
subs
idiar
ies co
mpan
y -
- -
- -
- -
- -
- (2
,013.1
) -
- -
- (2
,013.1
) (4
,075.1
) (6
,088.2
)
Adjus
tmen
t on a
ccou
nt of
Ind A
S 115
- -
- -
- -
- -
- -
(6,49
3.0)
- -
- -
(6,49
3.0)
- (6
,493.0
)Tra
nsfe
r fro
m su
rplus
in co
nsoli
date
d sta
teme
nt of
profi
t and
loss
as pe
r the
loc
al law
of an
over
seas
subs
idiar
y
- -
- -
- -
- -
203.9
43
.0 (2
46.9)
- -
- -
- -
-
Issue
of eq
uity s
hare
s ^
0.0
- -
3.8
- -
- -
- -
- -
- -
- 3.
8 -
3.8
Balan
ce as
at M
arch 3
1, 20
19 2,
399.3
-
3,68
1.7
11,93
2.9
- -
43.8
7.5
207.5
35
,621.0
33
3,301
.9 (1
1.2)
1,63
2.9
24,93
6.7
336.6
41
4,090
.6 33
,135.4
44
7,226
.0
* Re
pres
ents
re-m
easu
rem
ents
of t
he d
efine
d be
nefit
pla
ns
# (M
arch
31,
201
7 : `
7,1
77)
@ (M
arch
31,
201
8 : `
62,
365)
^
(Mar
ch 3
1, 2
019
: ` 1
1,79
0)
The
acco
mpa
nyin
g no
tes
are
an in
tegr
al p
art o
f the
con
solid
ated
fina
ncia
l sta
tem
ents
As
per o
ur re
port
of e
ven
date
For S
R B
C &
CO
LLP
For a
nd o
n be
half
of th
e Bo
ard
of D
irect
ors
of
Char
tere
d Ac
coun
tant
sSu
n Ph
arm
aceu
tical
Indu
strie
s Lim
ited
ICA
I Firm
Reg
istra
tion
No.
: 32
4982
E/E3
0000
3
per P
AUL
ALV
ARE
SD
ILIP
S. S
HA
NG
HV
IPa
rtne
rM
anag
ing
Dire
ctor
Mem
bers
hip
No.
: 10
5754
Mum
bai,
May
28,
201
9C.
S. M
URA
LID
HA
RAN
SU
DH
IR V
. VA
LIA
Ch
ief F
inan
cial
Offi
cer
Who
letim
e D
irect
or
SUN
IL R
. AJM
ERA
SAIL
ESH
T. D
ESA
I Co
mpa
ny S
ecre
tary
Who
letim
e D
irect
or
Mum
bai,
May
28,
201
9

Sun Pharmaceutical Industries Ltd.
Specialty in progress
170
Consolidated Cash Flow Statement for the year ended March 31, 2019
` in Million
Particulars Year ended
March 31, 2019 Year ended
March 31, 2018
A. CASH FLOW FROM OPERATING ACTIVITIESProfit before tax 38,102.0 34,789.8 Adjustments for:
Depreciation and amortisation expense 17,532.5 14,998.4 Impairment of property, plant and equipment, goodwill and other intangible assets 12.9 26.7 Loss on sale / write off of property, plant and equipment and other intangible assets, net 665.6 201.6 Finance costs 5,552.5 5,175.7 Interest income (6,692.1) (5,197.6)Dividend income on investments (223.8) (371.6)Net (gain) / loss arising on financial assets measured at fair value through profit or loss (1,433.6) (1,236.6)Net gain on sale of financial assets measured at fair value through profit or loss (180.3) (234.0)Net loss on sale of financial assets measured at fair value through other comprehensive income 0.1 7.5 Provision / write off / (reversal) for doubtful trade receivables / advances (339.4) 1,095.9 Sundry balances written back, net (64.5) (170.6)Income recognised in respect of share based payments to employees - (1.0)Impairment in value of investments, net - (725.7)Effect of exchange rate changes 4,856.7 253.5
Operating profit before working capital changes 57,788.6 48,612.0 Movements in working capital:
(Increase) / Decrease in inventories (7,090.0) (40.0)(Increase) / Decrease in trade receivables (8,578.4) (7,730.1)(Increase) / Decrease in other assets 993.7 (1,163.3)Increase / (Decrease) in trade payables (8,544.6) 3,830.4 Increase / (Decrease) in other liabilities 137.2 (217.4)Increase / (Decrease) in provisions (3,877.9) 3,197.3
Cash generated from operations 30,828.6 46,488.9 Income tax paid (net of refund) (8,864.1) (7,417.4)
Net cash generated from operating activities (A) 21,964.5 39,071.5 B. CASH FLOW FROM INVESTING ACTIVITIES
Payments for purchase of property, plant and equipment (including capital work-in-progress, other intangible assets and intangible assets under development)
(32,128.2) (19,607.8)
Proceeds from disposal of property, plant and equipment and other intangible assets
504.7 664.9
Loans / inter corporate deposits Given / placed (783.3) (25,847.2) Received back / matured 1,230.7 13,230.0 Purchase of investments (353,957.3) (405,866.8)Proceeds from sale of investments 352,070.3 349,923.7 Bank balances not considered as cash and cash equivalents Fixed deposits / margin money placed (4,486.1) (16,812.3) Fixed deposits / margin money matured 23,897.5 65,987.1 Net cash outflow on acquisition of subsidiary (Refer note 76) (228.0) (855.0)Interest received 6,843.4 5,103.7 Dividend received 223.8 371.6
Net cash used in investing activities (B) (6,812.5) (33,708.1)C. CASH FLOW FROM FINANCING ACTIVITIES
Proceeds from borrowings 176,975.2 122,061.7 Repayment of borrowings (168,073.7) (127,811.2)Payment for buy-back of equity shares of parent and buy-back of equity shares held by non-controlling interests of subsidiaries
(6,088.2) (6,754.5)
Dividend payment to non-controlling interests (8,455.5) (152.8)Net increase / (decrease) in working capital demand loans (11,273.5) 11,625.7 Proceeds from issue of equity shares on exercise of stock options / share application money received
3.8 9.1
FINANCIAL STATEMENTS
Annual Report 2018-19
171Consolidated
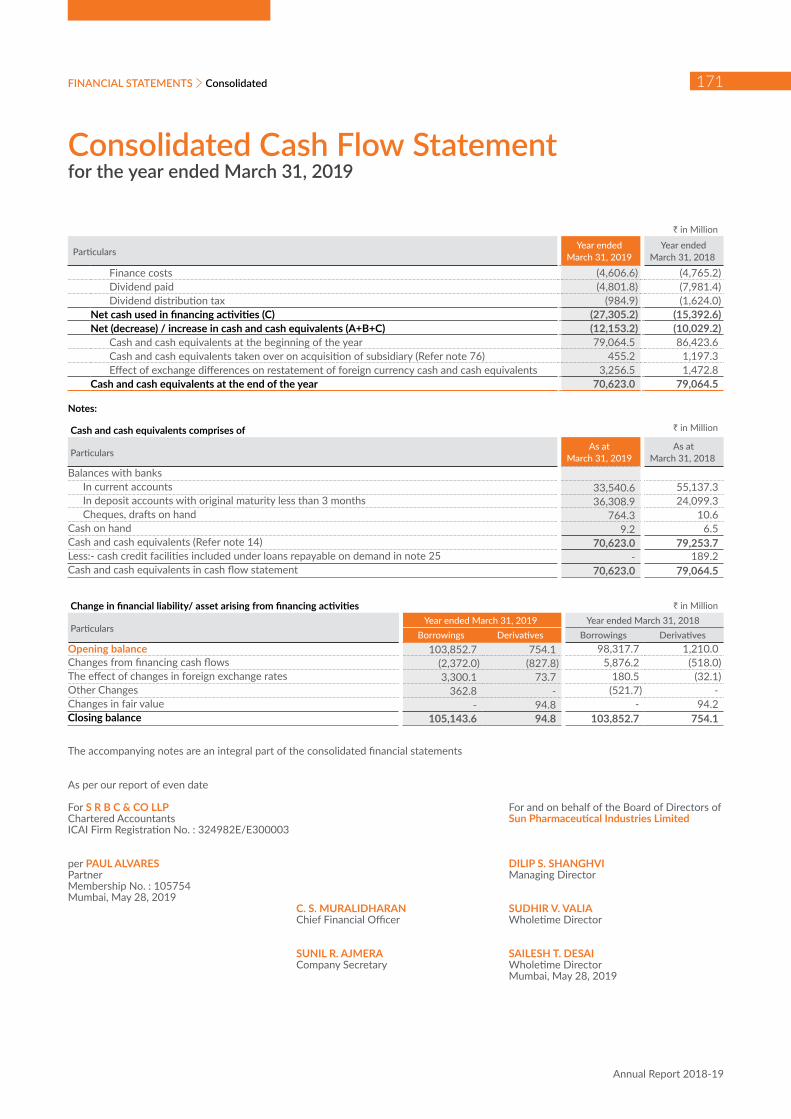
Consolidated Cash Flow Statement for the year ended March 31, 2019
` in Million
Particulars Year ended
March 31, 2019 Year ended
March 31, 2018
Finance costs (4,606.6) (4,765.2)Dividend paid (4,801.8) (7,981.4)Dividend distribution tax (984.9) (1,624.0)
Net cash used in financing activities (C) (27,305.2) (15,392.6)Net (decrease) / increase in cash and cash equivalents (A+B+C) (12,153.2) (10,029.2)
Cash and cash equivalents at the beginning of the year 79,064.5 86,423.6 Cash and cash equivalents taken over on acquisition of subsidiary (Refer note 76) 455.2 1,197.3 Effect of exchange differences on restatement of foreign currency cash and cash equivalents 3,256.5 1,472.8
Cash and cash equivalents at the end of the year 70,623.0 79,064.5
Notes:
Cash and cash equivalents comprises of ` in Million
ParticularsAs at
March 31, 2019 As at
March 31, 2018 Balances with banks
In current accounts 33,540.6 55,137.3 In deposit accounts with original maturity less than 3 months 36,308.9 24,099.3 Cheques, drafts on hand 764.3 10.6
Cash on hand 9.2 6.5 Cash and cash equivalents (Refer note 14) 70,623.0 79,253.7 Less:- cash credit facilities included under loans repayable on demand in note 25 - 189.2 Cash and cash equivalents in cash flow statement 70,623.0 79,064.5
Change in financial liability/ asset arising from financing activities ` in Million
ParticularsYear ended March 31, 2019 Year ended March 31, 2018
Borrowings Derivatives Borrowings DerivativesOpening balance 103,852.7 754.1 98,317.7 1,210.0 Changes from financing cash flows (2,372.0) (827.8) 5,876.2 (518.0)The effect of changes in foreign exchange rates 3,300.1 73.7 180.5 (32.1)Other Changes 362.8 - (521.7) - Changes in fair value - 94.8 - 94.2 Closing balance 105,143.6 94.8 103,852.7 754.1
The accompanying notes are an integral part of the consolidated financial statements
As per our report of even date
For S R B C & CO LLP For and on behalf of the Board of Directors of Chartered Accountants Sun Pharmaceutical Industries LimitedICAI Firm Registration No. : 324982E/E300003
per PAUL ALVARES DILIP S. SHANGHVIPartner Managing DirectorMembership No. : 105754Mumbai, May 28, 2019
C. S. MURALIDHARAN SUDHIR V. VALIA Chief Financial Officer Wholetime Director
SUNIL R. AJMERA SAILESH T. DESAI Company Secretary Wholetime Director
Mumbai, May 28, 2019
Notes to the Consolidated Financial Statementsfor the year ended March 31, 2019
Sun Pharmaceutical Industries Ltd.
Specialty in progress
172
NOTE : 1 GENERAL INFORMATION Sun Pharmaceutical Industries Limited (“the Parent
Company”) is a public limited company incorporated and domiciled in India, having its registered office at Vadodara, Gujarat, India and has its listing on the Bombay Stock Exchange Limited and National Stock Exchange of India Limited. The Company is in the business of manufacturing, developing and marketing a wide range of branded and generic formulations and Active Pharmaceutical Ingredients (APIs). The Parent Company and its subsidiaries (hereinafter referred to as “the Company” or “the Group”) have various manufacturing locations spread across the world with trading and other incidental and related activities extending to the global markets.
The consolidated financial statement were authorised for issue in accordance with a resolution of the directors on May 28, 2019.
NOTE : 2 SIGNIFICANT ACCOUNTING POLICIES2.1 Statement of compliance The Group has prepared its consolidated financial
statements for the year ended March 31, 2019 in accordance with Indian Accounting Standards (Ind AS) notified under the Companies (Indian Accounting Standards) Rules, 2015 (as amended) together with the comparative period data as at and for the year ended March 31, 2018.
2.2 Basis of preparation and presentation The consolidated financial statements have been
prepared on the historical cost basis, except for: (i) certain financial instruments that are measured at fair values at the end of each reporting period; (ii) Non-current assets classified as held for sale which are measured at the lower of their carrying amount and fair value less costs to sell; (iii) derivative financial instrument and (iv) defined benefit plans – plan assets that are measured at fair values at the end of each reporting period, as explained in the accounting policies below:
Historical cost is generally based on the fair value of the consideration given in exchange for goods and services.
The consolidated financial statements are presented in ` and all values are rounded to the nearest Million (`000,000) upto one decimal, except when otherwise indicated.
Fair value is the price that would be received to sell an asset or paid to transfer a liability in an orderly transaction between market participants at the measurement date, regardless of whether that price is directly observable or estimated using another valuation technique. In estimating the fair value of an asset or a
liability, the Group takes into account the characteristics of the asset or liability if market participants would take those characteristics into account when pricing the asset or liability at the measurement date. Fair value for measurement and/or disclosure purposes in these consolidated financial statements is determined on such a basis, except for share-based payment transactions that are within the scope of Ind AS 102, leasing transactions that are within the scope of Ind AS 17, and measurements that have some similarities to fair value but are not fair value, such as net realisable value in Ind AS 2 or value in use in Ind AS 36.
In addition, for financial reporting purposes, fair value measurements are categorised into Level 1, 2, or 3 based on the degree to which the inputs to the fair value measurements are observable and the significance of the inputs to the fair value measurement in its entirety, which are described as follows:
• Level 1 inputs are quoted prices (unadjusted) in active markets for identical assets or liabilities that the entity can access at the measurement date;
• Level 2 inputs are inputs, other than quoted prices included within Level 1, that are observable for the asset or liability, either directly or indirectly; and
• Level 3 inputs are unobservable inputs for the asset or liability.
The Group has consistently applied the following accounting policies to all periods presented in these consolidated financial statements.
a. Basis of consolidation The consolidated financial statements comprise the
financial statements of the Parent Company and its subsidiaries as disclosed in Note 39. Control exists when the parent has power over the entity, is exposed, or has rights, to variable returns from its involvement with the entity and has the ability to affect those returns by using its power over the entity. Power is demonstrated through existing rights that give the ability to direct relevant activities, those which significantly affect the entity’s returns. Subsidiaries are consolidated from the date control commences until the date control ceases.
Profit or loss and each component of other comprehensive income are attributed to the owners of the Company and to the non-controlling interests. Total comprehensive income of subsidiaries is attributed to the owners of the Company and to the non-controlling interests even if this results in the non-controlling interests having a deficit balance.
Notes to the Consolidated Financial Statementsfor the year ended March 31, 2019
FINANCIAL STATEMENTS
Annual Report 2018-19
173Consolidated
The financial statements of the Group companies are consolidated on a line-by-line basis and intra-Group balances, transactions including unrealised gain / loss from such transactions and cash flows relating to transactions between members of the Group are eliminated upon consolidation. These financial statements are prepared by applying uniform accounting policies in use at the Group.
Changes in the Group’s ownership interests in existing subsidiaries
Changes in the Group’s ownership interests in subsidiaries that do not result in the Group losing control over the subsidiaries are accounted for as equity transactions. The carrying amounts of the Group’s interests and the non-controlling interests are adjusted to reflect the changes in their relative interests in the subsidiaries. Any difference between the amount by which the non-controlling interests are adjusted and the fair value of the consideration paid or received is recognised directly in equity and attributed to owners of the Company.
When the Group loses control of a subsidiary, a gain or loss is recognised in profit or loss and is calculated as the difference between (i) the aggregate of the fair value of the consideration received and the fair value of any retained interest and (ii) the previous carrying amount of the assets (including goodwill) and liabilities of the subsidiary and any non-controlling interests. All amounts previously recognised in other comprehensive income in relation to that subsidiary are accounted for as if the Group had directly disposed off the related assets or liabilities of the subsidiary (i.e. reclassified to profit or loss or transferred to another category of equity as specified/ permitted by applicable Ind AS). The fair value of any investment retained in the former subsidiary at the date when control is lost is regarded as the fair value on initial recognition for subsequent accounting under Ind AS 109, or, when applicable, the cost on initial recognition of an investment in an associate or a joint venture.
Investment in Associates and Joint Ventures Associates are those entities over which the Group
has significant influence. Significant influence is the power to participate in the financial and operating policy decisions of the entities but is not control or joint control of those policies.
A joint venture is a joint arrangement whereby the parties that have joint control of the arrangement have rights to the net assets of the joint arrangement. Joint control is the contractually agreed sharing of control of an arrangement, which exists only when
decisions about the relevant activities require unanimous consent of the parties sharing control.
The results and assets and liabilities of associates or joint ventures are incorporated in these consolidated financial statements using the equity method of accounting, except when the investment, or a portion thereof, is classified as held for sale, in which case it is accounted for in accordance with Ind AS 105. Under the equity method, an investment in an associate or a joint venture is initially recognised in the consolidated balance sheet at cost and adjusted thereafter to recognise the Group’s share of the profit or loss and other comprehensive income of the associate or joint venture. Distributions received from an associate or a joint venture reduce the carrying amount of the investment. The carrying value of the Group’s investment includes goodwill identified on acquisition, net of any accumulated impairment losses. When the Group’s share of losses of an associate or a joint venture exceeds its interest in that associate or joint venture, the carrying amount of that interest (including any long-term investments) is reduced to zero and the recognition of further losses is discontinued except to the extent that the Group has obligations or has made payments on behalf of the associate or joint venture.
An investment in an associate or a joint venture is accounted for using the equity method from the date on which the investee becomes an associate or a joint venture and discontinues from the date when the investment ceases to be an associate or a joint venture, or when the investment is classified as held for sale.
The difference between the carrying amount of the associate or joint venture at the date the equity method was discontinued, and the fair value of any retained interest and any proceeds from disposing of a part interest in the associate or joint venture is included in the determination of the gain or loss on disposal of the associate or joint venture. In addition, the Group accounts for all amounts previously recognised in other comprehensive income in relation to that associate or joint venture on the same basis as would be required if that associate or joint venture had directly disposed off the related assets or liabilities.
When a Group entity transacts with an associate or a joint venture of the Group, profits and losses resulting from the transactions with the associate or joint venture are recognised in the Group’s consolidated financial statements only to the extent of interest in the associate or joint venture that are not related to the Group.

Notes to the Consolidated Financial Statementsfor the year ended March 31, 2019
Sun Pharmaceutical Industries Ltd.
Specialty in progress
174
b. Current vs. Non-current The Group presents assets and liabilities in the
balance sheet based on current / non-current classification. An asset is treated as current when it is:
• Expected to be realised or intended to be sold or consumed in normal operating cycle
• Held primarily for the purpose of trading
• Expected to be realised within twelve months after the reporting period, or
• Cash or cash equivalent unless restricted from being exchanged or used to settle a liability for at least twelve months after the reporting period
All other assets are classified as non-current.
A liability is current when:• It is expected to be settled in normal operating
cycle
• It is held primarily for the purpose of trading
• It is due to be settled within twelve months after the reporting period, or
• There is no unconditional right to defer the settlement of the liability for at least twelve months after the reporting period
The Group classifies all other liabilities as non-current.
Deferred tax assets and liabilities are classified as non-current assets and liabilities.
The operating cycle is the time between the acquisition of assets for processing and their realisation in cash and cash equivalents. The Group has identified twelve months as its operating cycle.
c. Business combinations The Group uses the acquisition method of accounting
to account for business combinations that occurred on or after April 01, 2015. The acquisition date is generally the date on which control is transferred to the acquirer. Judgment is applied in determining the acquisition date and determining whether control is transferred from one party to another. Control exists when the Group is exposed to, or has rights to, variable returns from its involvement with the entity and has the ability to affect those returns through power over the entity. In assessing control, potential voting rights are considered only if the rights are substantive. The Group measures goodwill as of the applicable acquisition date at the fair value of the consideration transferred, including the recognised amount of any non-controlling interest in the acquiree and the fair value of the acquirer’s previously held equity interest in the acquiree (if any),
less the net recognised amount of the identifiable assets acquired and liabilities assumed. When the fair value of the net identifiable assets acquired and liabilities assumed exceeds the consideration transferred, a bargain purchase gain is recognised immediately in the OCI and accumulates the same in equity as capital reserve where there exists clear evidence of the underlying reasons for classifying the business combination as a bargain purchase else the gain is directly recognised in equity as capital reserve. Consideration transferred includes the fair values of the assets transferred, liabilities incurred by the Group to the previous owners of the acquiree, and equity interests issued by the Group. Consideration transferred also includes the fair value of any contingent consideration. Changes in the fair value of the contingent consideration that qualify as measurement period adjustments are adjusted retrospectively, with corresponding adjustments against goodwill or capital reserve, as the case maybe. The subsequent accounting for changes in the fair value of the contingent consideration that do not qualify as measurement period adjustments depends on how the contingent consideration is classified. Contingent consideration that is classified as equity is not remeasured at subsequent reporting dates and its subsequent settlement is accounted for within equity. Contingent consideration that is classified as an asset or a liability is remeasured at fair value at subsequent reporting dates with the corresponding gain or loss being recognised in profit or loss. Consideration transferred does not include amounts related to settlement of pre-existing relationships.
A contingent liability of the acquiree is assumed in a business combination only if such a liability represents a present obligation and arises from a past event and its fair value can be measured reliably. On an acquisition-by-acquisition basis, the Group recognises any non-controlling interest in the acquiree either at fair value or at the non-controlling interest’s proportionate share of the acquiree’s identifiable net assets. Transaction costs that the Group incurs in connection with a business combination, such as finder’s fees, legal fees, due diligence fees and other professional and consulting fees, are expensed as incurred.
If the business combination is achieved in stages, any previously held equity interest is re-measured at its acquisition date fair value and any resulting gain or loss is recognised in profit or loss or OCI, as appropriate.
If the initial accounting for a business combination is incomplete by the end of the reporting period in which

Notes to the Consolidated Financial Statementsfor the year ended March 31, 2019
FINANCIAL STATEMENTS
Annual Report 2018-19
175Consolidated
the combination occurs, the Group reports provisional amounts for the items for which the accounting is incomplete. Those provisional amounts are adjusted during the measurement period (see above), or additional assets or liabilities are recognised, to reflect new information obtained about facts and circumstances that existed at the acquisition date that, if known, would have affected the amounts recognised at that date.
d. Foreign currency Foreign currency transactions In preparing the financial statements of each
individual Group entity, transactions in currencies other than the entity’s functional currency (foreign currencies) are translated at exchange rates at the dates of the transactions. Monetary assets and liabilities denominated in foreign currencies at the reporting date are translated into the functional currency at the exchange rate at that date. Exchange differences arising on the settlement of monetary items or on translating monetary items at rates different from those at which they were translated on initial recognition during the period or in previous period are recognised in profit or loss in the period in which they arise except for:
• exchange differences on foreign currency borrowings relating to assets under construction for future productive use, which are included in the cost of those assets when they are regarded as an adjustment to interest costs on those foreign currency borrowings (see note 2.2.s).
• exchange differences on transactions entered into in order to hedge certain foreign currency risks (see note 2.2.j below for hedging accounting policies).
• exchange differences on monetary items receivable from or payable to a foreign operation for which settlement is neither planned nor likely to occur (therefore forming part of the net investment in the foreign operation), which are recognised in other comprehensive income and presented within equity as a part of Foreign Currency Translation Reserve. On disposal of the foreign operation, the relevant amount in the Foreign Currency Translation Reserve is reclassified to profit or loss.
Non-monetary items that are measured in terms of historical cost in foreign currency are measured using the exchange rates at the date of initial transaction.
Foreign operations For the purposes of presenting these consolidated
financial statements, the assets and liabilities of Group’s foreign operations, are translated to the
Indian Rupees at exchange rates at the end of each reporting period. The income and expenses of such foreign operations are translated at the average exchange rates for the period. Resulting foreign currency differences are recognised in other comprehensive income and presented within equity as part of Foreign Currency Translation Reserve (and attributed to non-controlling interests as appropriate). When a foreign operation is disposed off, the relevant amount in the Foreign Currency Translation Reserve is reclassified to profit or loss.
In addition, in relation to a partial disposal of a subsidiary that includes a foreign operation that does not result in the Group losing control over the subsidiary, the proportionate share of accumulated exchange differences are re-attributed to non-controlling interests and are not recognised in profit or loss. For all other partial disposals (i.e. partial disposals of associates or joint arrangements that do not result in the Group losing significant influence or joint control), the proportionate share of the accumulated exchange differences is reclassified to profit or loss.
Goodwill and fair value adjustments to identifiable assets acquired and liabilities assumed through acquisition of a foreign operation are treated as assets and liabilities of the foreign operation and translated at the rate of exchange prevailing at the end of each reporting period. Exchange differences arising are recognised in other comprehensive income.
e. Segment reporting Operating segments are reported in a manner
consistent with the internal reporting provided to the chief operating decision maker. The chief operating decision maker of the Company is responsible for allocating resources and assessing performance of the operating segments.
f. Property, plant and equipment Items of property, plant and equipment are stated in
consolidated balance sheet at cost less accumulated depreciation and accumulated impairment losses, if any. Freehold land is not depreciated.
Assets in the course of construction for production, supply or administrative purposes are carried at cost, less any recognised impairment loss. Cost includes purchase price, borrowing costs if capitalisation criteria are met and directly attributable cost of bringing the asset to its working condition for the intended use. Subsequent expenditures are capitalised only when they increase the future economic benefits embodied in the specific asset to which they relate. Such assets are classified to the appropriate

Notes to the Consolidated Financial Statementsfor the year ended March 31, 2019
Sun Pharmaceutical Industries Ltd.
Specialty in progress
176
categories of property, plant and equipment when completed and ready for intended use. Depreciation of these assets, on the same basis as other assets, commences when the assets are ready for their intended use. When parts of an item of property, plant and equipment have different useful lives, they are accounted for as separate items (major components) of property, plant and equipment.
An item of property, plant and equipment is derecognised upon disposal or when no future economic benefits are expected to arise from the continued use of the asset. Any gain or loss arising on the disposal or retirement of an item of property, plant and equipment is determined as the difference between the sales proceeds and the carrying amount of property, plant and equipment and is recognised in profit or loss.
Items of property, plant and equipment acquired through exchange of non-monetary assets are measured at fair value, unless the exchange transaction lacks commercial substance or the fair value of either the asset received or asset given up is not reliably measurable, in which case the acquired asset is measured at the carrying amount of the asset given up.
Depreciation is recognised on the cost of assets (other than freehold land and Capital work-in-progress) less their residual values on straight-line method over their useful lives. Leasehold improvements are depreciated over period of the lease agreement or the useful life, whichever is shorter. Depreciation methods, useful lives and residual values are reviewed at the end of each reporting period, with the effect of any changes in estimate accounted for on a prospective basis.
The estimated useful lives are as follows:
Asset Category No. of yearsLeasehold land 50-196Leasehold improvements 3-10Buildings including factory buildings* 5-100Plant and equipment* 2-25Vehicles* 3-15Office equipment* 2-21Furniture and fixtures* 2-17
*Includes assets taken/given under operating/finance lease
Software for internal use, which is primarily acquired from third-party vendors and which is an integral part of a tangible asset, including consultancy charges for implementing the software, is capitalised as part of the related tangible asset. Subsequent costs associated with maintaining such software are
recognised as expense as incurred. The capitalised costs are amortised over the lower of the estimated useful life of the software and the remaining useful life of the tangible fixed asset.
g. Goodwill and other intangible assets Goodwill Goodwill represents the excess of consideration
transferred, together with the amount of non-controlling interest in the acquiree, over the fair value of the Group’s share of identifiable net assets acquired. Goodwill is measured at cost less accumulated impairment losses. A cash-generating unit to which goodwill has been allocated is tested for impairment annually, or more frequently when there is an indication that the unit may be impaired. The goodwill acquired in a business combination is, for the purpose of impairment testing, allocated to cash-generating units that are expected to benefit from the synergies of the combination. Any impairment loss for goodwill is recognised directly in profit or loss. An impairment loss recognised for goodwill is not reversed in subsequent periods.
On disposal of a cash-generating unit to which goodwill is allocated, the goodwill associated with the disposed cash-generating unit is included in the carrying amount of the cash-generating unit when determining the gain or loss on disposal.
Other intangible assets Other intangible assets that are acquired by the Group
and that have finite useful lives are measured at cost less accumulated amortisation and accumulated impairment losses, if any. Subsequent expenditures are capitalised only when they increase the future economic benefits embodied in the specific asset to which they relate.
Research and development Expenditure on research activities undertaken with
the prospect of gaining new scientific or technical knowledge and understanding are recognised as an expense when incurred. Development activities involve a plan or design for the production of new or substantially improved products and processes. An internally-generated intangible asset arising from development is recognised if and only if all of the following have been demonstrated:
• development costs can be measured reliably;
• the product or process is technically and commercially feasible;
• future economic benefits are probable; and

Notes to the Consolidated Financial Statementsfor the year ended March 31, 2019
FINANCIAL STATEMENTS
Annual Report 2018-19
177Consolidated
• the Group intends to and has sufficient resources/ability to complete development and to use or sell the asset.
The expenditure to be capitalised include the cost of materials and other costs directly attributable to preparing the asset for its intended use. Other development expenditure is recognised in profit or loss as incurred.
Payments to third parties that generally take the form of up-front payments and milestones for in-licensed products, compounds and intellectual property are capitalised since the probability of expected future economic benefits criterion is always considered to be satisfied for separately acquired intangible assets.
Acquired research and development intangible assets which are under development, are recognised as In-Process Research and Development assets (“IPR&D”). IPR&D assets are not amortised, but evaluated for potential impairment on an annual basis or when there are indications that the carrying value may not be recoverable. Any impairment charge on such IPR&D assets is recognised in profit or loss. Intangible assets relating to products under development, other intangible assets not available for use and intangible assets having indefinite useful life are tested for impairment annually, or more frequently when there is an indication that the assets may be impaired. All other intangible assets are tested for impairment when there are indications that the carrying value may not be recoverable.
The consideration for acquisition of intangible asset which is based on reaching specific milestone that are dependent on the Group’s future activity is recognised only when the activity requiring the payment is performed.
Subsequent expenditures are capitalised only when they increase the future economic benefits embodied in the specific asset to which they relate. All other expenditures, including expenditures on internally generated goodwill and brands, are recognised in the statement of profit and loss as incurred.
Amortisation is recognised on a straight-line basis over the estimated useful lives of intangible assets. Intangible assets that are not available for use are amortised from the date they are available for use.
The estimated useful lives for Product related intangibles and Other intangibles ranges from 3 to 20 years.
The estimated useful life and the amortisation method for intangible assets with a finite useful life are
reviewed at the end of each reporting period, with the effect of any changes in estimate being accounted for on a prospective basis.
The estimated useful life and amortisation method are reviewed at the end of each reporting period, with the effect of any changes in estimate being accounted for on a prospective basis.
De-recognition of intangible assets Intangible assets are de-recognised either on their
disposal or where no future economic benefits are expected from their use. Gain or loss arising on such de-recognition is recognised in profit or loss, and are measured as the difference between the net disposal proceeds, if any, and the carrying amount of respective intangible assets as on the date of de-recognition.
h. Impairment of non-financial assets other than goodwill
The carrying amounts of the Group’s non-financial assets are reviewed at each reporting date to determine whether there is any indication of impairment. If any such indication exists, then the asset’s recoverable amount is estimated in order to determine the extent of the impairment loss, if any.
The recoverable amount of an asset or cash-generating unit (as defined below) is the greater of its value in use and its fair value less costs to sell. In assessing value in use, the estimated future cash flows are discounted to their present value using a pre-tax discount rate that reflects current market assessments of the time value of money and the risks specific to the asset or the cash-generating unit for which the estimates of future cash flows have not been adjusted. For the purpose of impairment testing, assets are grouped together into the smallest group of assets that generates cash inflows from continuing use that are largely independent of the cash inflows of other assets or groups of assets (the “cash-generating unit”).
An impairment loss is recognised in the profit or loss if the estimated recoverable amount of an asset or its cash generating unit is lower than its carrying amount. Impairment losses recognised in respect of cash-generating units are allocated first to reduce the carrying amount of any goodwill allocated to the units and then to reduce the carrying amount of the other assets in the unit on a pro-rata basis.
In respect of assets other than goodwill, impairment losses recognised in prior periods are assessed at each reporting date for any indications that the loss has decreased or no longer exists. An impairment loss is reversed if there has been a change in the

Notes to the Consolidated Financial Statementsfor the year ended March 31, 2019
Sun Pharmaceutical Industries Ltd.
Specialty in progress
178
estimates used to determine the recoverable amount. An impairment loss is reversed only to the extent that the asset’s carrying amount does not exceed the carrying amount that would have been determined, net of depreciation or amortisation, if no impairment loss had been recognised.
i. Non-current assets held for sale Non-current assets and disposal groups are classified
as held for sale if their carrying amount will be recovered principally through a sale transaction rather than through continuing use. This condition is regarded as met only when the asset (or disposal group) is available for immediate sale in its present condition subject only to terms that are usual and customary for sales of such asset (or disposal group) and its sale is highly probable. Management must be committed to the sale, which should be expected to qualify for recognition as a completed sale within one year from the date of classification.
When the Group is committed to a sale plan involving loss of control of a subsidiary, all of the assets and liabilities of that subsidiary are classified as held for sale when the criteria described above are met, regardless of whether the Group will retain a non-controlling interest in its former subsidiary after the sale.
When the Group is committed to a sale plan involving disposal of an investment, or a portion of an investment, in an associate or joint venture, the investment or the portion of the investment that will be disposed off is classified as held for sale when the criteria described above are met, and the Group discontinues the use of the equity method in relation to the portion that is classified as held for sale.
Any retained portion of an investment in an associate or a joint venture that has not been classified as held for sale continues to be accounted for using the equity method. The Group discontinues the use of the equity method at the time of disposal when the disposal results in the Group losing significant influence over the associate or joint venture.
After the disposal takes place, the Group accounts for any retained interest in the associate or joint venture in accordance with Ind AS 109 unless the retained interest continues to be an associate or a joint venture, in which case the Group uses the equity method (see the accounting policy regarding investments in associates or joint ventures above).
Non-current assets (and disposal groups) classified as held for sale are measured at the lower of their
carrying amount and fair value less costs to sell. Non-current assets are not depreciated or amortised.
j. Financial instruments A financial instrument is any contract that gives rise to
a financial asset of one entity and a financial liability or equity instrument of another entity.
Financial assets Initial recognition and measurement
All financial assets are recognised initially at fair value plus, in the case of financial assets not recorded at fair value through profit or loss, transaction costs that are attributable to the acquisition of the financial asset. Purchases or sales of financial assets that require delivery of assets within a time frame established by regulation or convention in the market place (regular way trades) are recognised on the date the group commits to purchase or sale the financial assets.
Subsequent measurement
For purposes of subsequent measurement, financial assets are classified in four categories:
• Debt instruments at amortised cost
• Debt instruments at fair value through other comprehensive income (FVTOCI)
• Debt instruments and equity instruments at fair value through profit or loss (FVTPL)
• Equity instruments measured at fair value through other comprehensive income (FVTOCI)
Debt instruments at amortised cost A ‘debt instrument’ is measured at the amortised cost
if both the following conditions are met:
a) The asset is held within a business model whose objective is to hold assets for collecting contractual cash flows, and
b) Contractual terms of the asset give rise on specified dates to cash flows that are solely payments of principal and interest (SPPI) on the principal amount outstanding.
After initial measurement, such financial assets are subsequently measured at amortised cost using the effective interest rate (EIR) method. Amortised cost is calculated by taking into account any discount or premium on acquisition and fees or costs that are an integral part of the EIR. The EIR amortisation is included in Other Income in the profit or loss. The losses arising from impairment are recognised in the profit or loss.
Notes to the Consolidated Financial Statementsfor the year ended March 31, 2019
FINANCIAL STATEMENTS
Annual Report 2018-19
179Consolidated
Debt instrument at FVTOCI A ‘debt instrument’ is measured as at FVTOCI if both
of the following criteria are met:
a) The objective of the business model is achieved both by collecting contractual cash flows and selling the financial assets, and
b) The contractual terms of the instrument give rise on specified dates to cash flows that are SPPI on the principal amount outstanding.
Debt instruments included within the FVTOCI category are measured initially as well as at each reporting date at fair value. Fair value movements are recognised in the other comprehensive income (OCI). However, the Group recognises interest income, impairment losses and reversals and foreign exchange gain or loss in the profit or loss. On derecognition of the asset, cumulative gain or loss previously recognised in OCI is reclassified from the equity to profit or loss. Interest earned whilst holding FVTOCI debt instrument is reported as interest income using the EIR method.
Debt instrument at FVTPL FVTPL is a residual category for debt instruments.
Any debt instrument, which does not meet the criteria for categorisation as at amortised cost or as FVTOCI, is classified as at FVTPL.
In addition, the Group may elect to designate a debt instrument, which otherwise meets amortised cost or FVTOCI criteria, as at FVTPL. However, such election is allowed only if doing so reduces or eliminates a measurement or recognition inconsistency (referred to as ‘accounting mismatch’).
Debt instruments included within the FVTPL category are measured at fair value with all the changes in the profit or loss.
Equity instruments All equity instruments in scope of Ind AS 109 are
measured at fair value. Equity instruments which are held for trading and contingent consideration recognised by an acquirer in a business combination to which Ind AS103 applies are classified as at FVTPL. For all other equity instruments, the Group may make an irrevocable election to present subsequent changes in the fair value in OCI. The Group makes such election on an instrument-by-instrument basis. The classification is made on initial recognition and is irrevocable.
If the Group decides to classify an equity instrument as at FVTOCI, then all fair value changes on the instrument, including foreign exchange gain or
loss and excluding dividends, are recognised in the OCI. There is no recycling of the amounts from OCI to profit or loss, even on sale of investment. However, the Group may transfer the cumulative gain or loss within equity.
Equity instruments included within the FVTPL category are measured at fair value with all changes recognised in the profit or loss.
Derecognition A financial asset (or, where applicable, a part of a
financial asset or part of a group of similar financial assets) is primarily derecognised (i.e. removed from the Group’s consolidated balance sheet) when:
• The contractual rights to receive cash flows from the asset have expired, or
• The Group has transferred its rights to receive contractual cash flows from the asset or has assumed an obligation to pay the received cash flows in full without material delay to a third party under a ‘pass-through’ arrangement; and either (a) the Group has transferred substantially all the risks and rewards of the asset, or (b) the Group has neither transferred nor retained substantially all the risks and rewards of the asset, but has transferred control of the asset.
When the Group has transferred its rights to receive cash flows from an asset or has entered into a pass-through arrangement, it evaluates if and to what extent it has retained the risks and rewards of ownership. When it has neither transferred nor retained substantially all of the risks and rewards of the asset, nor transferred control of the asset, the Group continues to recognise the transferred asset to the extent of the Group’s continuing involvement. In that case, the Group also recognises an associated liability. The transferred asset and the associated liability are measured on a basis that reflects the rights and obligations that the Group has retained.
On derecognition of a financial asset in its entirety, the difference between the asset’s carrying amount and the sum of the consideration received and receivable and the cumulative gain or loss that had been recognised in OCI and accumulated in equity is recognised in profit or loss if such gain or loss would have otherwise been recognised in profit or loss on disposal of that financial asset.
Impairment of financial assets In accordance with Ind AS 109, the Group applies
expected credit loss (ECL) model for measurement and recognition of impairment loss on the Trade receivables or any contractual right to receive cash or
Notes to the Consolidated Financial Statementsfor the year ended March 31, 2019
Sun Pharmaceutical Industries Ltd.
Specialty in progress
180
another financial asset that result from transactions that are within the scope of Ind AS 115.
The Group follows ‘simplified approach’ for recognition of impairment loss allowance on trade receivables or any contractual right to receive cash or another financial asset. The application of simplified approach does not require the Group to track changes in credit risk. Rather, it recognises impairment loss allowance based on lifetime ECLs at each reporting date, right from its initial recognition.
As a practical expedient, the Group uses a provision matrix to determine impairment loss allowance on portfolio of its trade receivables. The provision matrix is based on its historically observed default rates over the expected life of the trade receivables and is adjusted for forward-looking estimates. At every reporting date, the historical observed default rates are updated and changes in the forward-looking estimates are analysed.
Financial liabilities and equity instruments Classification as debt or equity Debt and equity instruments issued by a Group entity
are classified as either financial liabilities or as equity in accordance with the substance of the contractual arrangements and the definitions of a financial liability and an equity instrument.
Equity instruments An equity instrument is any contract that evidences
a residual interest in the assets of an entity after deducting all of its liabilities. Equity instruments issued by a Group entity are recognised at the proceeds received, net of direct issue costs.
Repurchase of the Parent Company’s own equity instruments is recognised and deducted directly in equity. No gain or loss is recognised in profit or loss on the purchase, sale, issue or cancellation of the Parent Company’s own equity instruments.
Compound financial instruments The component parts of compound financial
instruments (convertible notes) issued by the Group are classified separately as financial liabilities and equity in accordance with the substance of the contractual arrangements and the definitions of a financial liability and an equity instrument.
Initial recognition and measurement All financial liabilities are recognised initially at fair
value and, in the case of loans and borrowings and payables, net of directly attributable transaction costs.
The Company’s financial liabilities include trade and other payables, loans and borrowings including
bank overdrafts, financial guarantee contracts and derivative financial instruments.
Subsequent measurement All financial liabilities are subsequently measured
at amortised cost using the effective interest method or at FVTPL.
Financial liabilities at fair value through profit or loss Financial liabilities are classified as at FVTPL when the
financial liability is either contingent consideration recognised by the Group as an acquirer in a business combination to which Ind AS 103 applies or is held for trading or is designated upon initial recognition as at fair value through profit or loss. Financial liabilities are classified as held for trading if they are incurred principally for the purpose of repurchasing in the near term or on initial recognition it is part of a portfolio of identified financial instruments that the Group manages together and has a recent actual pattern of short-term profit-taking. This category also includes derivative financial instruments that are not designated as hedging instruments in hedge relationships as defined by Ind AS 109. Gains or losses on liabilities held for trading are recognised in the profit or loss.
Financial liabilities designated upon initial recognition at fair value through profit or loss are designated as such at the initial date of recognition, and only if the criteria in Ind AS 109 are satisfied. For instruments not held-for-trading financial liabilities designated as at FVTPL, fair value gains/ losses attributable to changes in own credit risk are recognised in OCI, unless the recognition of the effects of changes in the liability’s credit risk in OCI would create or enlarge an accounting mismatch in profit or loss, in which case these effects of changes in credit risk are recognised in profit or loss. These gains/ loss are not subsequently transferred to profit or loss. All other changes in fair value of such liability are recognised in the consolidated statement of profit or loss.
Financial liabilities subsequently measured at amortised cost
Financial liabilities that are not held-for-trading and are not designated as at FVTPL are measured at amortised cost in subsequent accounting periods. The carrying amounts of financial liabilities that are subsequently measured at amortised cost are determined based on the effective interest rate (EIR) method. Interest expense that is not capitalised as part of costs of an asset is included in the ‘Finance costs’ line item in the profit or loss.
After initial recognition, such financial liabilities are subsequently measured at amortised cost using the
Notes to the Consolidated Financial Statementsfor the year ended March 31, 2019
FINANCIAL STATEMENTS
Annual Report 2018-19
181Consolidated
EIR method. Amortised cost is calculated by taking into account any discount or premium on acquisition and fees or costs that are an integral part of the EIR. The EIR amortisation is included as finance costs in the profit or loss.
Financial guarantee contracts Financial guarantee contracts are those contracts
that require a payment to be made to reimburse the holder for a loss it incurs because the specified debtor fails to make a payment when due in accordance with the terms of a debt instrument. Financial guarantee contracts are recognised initially as a liability at fair value, adjusted for transaction costs that are directly attributable to the issuance of the guarantee. If not designated as at FVTPL, are subsequently measured at the higher of the amount of loss allowance determined as per impairment requirements of Ind AS 109 and the amount initially recognised less cumulative amount of income recognised.
Derecognition A financial liability is derecognised when the
obligation under the liability is discharged or cancelled or expires. When an existing financial liability is replaced by another from the same lender on substantially different terms, or the terms of an existing liability are substantially modified, such an exchange or modification is treated as the derecognition of the original liability and the recognition of a new liability. The difference between the carrying amount of the financial liability derecognised and the consideration paid and payable is recognised in profit or loss.
Embedded derivatives Derivatives embedded in non-derivative host
contracts that are not financial assets within the scope of Ind AS 109 are accounted for as separate derivatives and recorded at fair value if their economic characteristics and risks are not closely related to those of the host contracts and the host contracts are not held for trading or designated at fair value though profit or loss. These embedded derivatives are measured at fair value with changes in fair value recognised in profit or loss, unless designated as effective hedging instruments.
Reclassification of financial assets The Group determines classification of financial
assets and liabilities on initial recognition. After initial recognition, no reclassification is made for financial assets which are equity instruments and financial liabilities. For financial assets which are debt instruments, a reclassification is made only if there is a change in the business model for managing those
assets. Changes to the business model are expected to be infrequent. The Group’s senior management determines change in the business model as a result of external or internal changes which are significant to the Group’s operations. Such changes are evident to external parties. A change in the business model occurs when the Group either begins or ceases to perform an activity that is significant to its operations. If the Group reclassifies financial assets, it applies the reclassification prospectively from the reclassification date which is the first day of the immediately next reporting period following the change in business model. The Group does not restate any previously recognised gains, losses (including impairment gains or losses) or interest.
Derivative financial instruments and hedge accounting Initial recognition and subsequent measurement
The Group uses derivative financial instruments, such as forward currency contracts, full currency swap, options and interest rate swaps to hedge its foreign currency risks and interest rate risks respectively. Such derivative financial instruments are initially recognised at fair value on the date on which a derivative contract is entered into and are subsequently re-measured at fair value at the end of each reporting period. Derivatives are carried as financial assets when the fair value is positive and as financial liabilities when the fair value is negative.
Any gains or losses arising from changes in the fair value of derivatives are taken directly to profit or loss, except for the effective portion of cash flow hedges, which is recognised in OCI and later reclassified to profit or loss when the hedge item affects profit or loss or treated as basis adjustment if a hedged forecast transaction subsequently results in the recognition of a non-financial asset or non-financial liability.
For the purpose of hedge accounting, hedges are classified as:
• Fair value hedges when hedging the exposure to changes in the fair value of a recognised asset or liability or an unrecognised firm commitment.
• Cash flow hedges when hedging the exposure to variability in cash flows that is either attributable to a particular risk associated with a recognised asset or liability or a highly probable forecast transaction or the foreign currency risk in an unrecognised firm commitment
• Hedges of a net investment in a foreign operation.
At the inception of a hedge relationship, the Group formally designates and documents the

Notes to the Consolidated Financial Statementsfor the year ended March 31, 2019
Sun Pharmaceutical Industries Ltd.
Specialty in progress
182
hedge relationship to which the Group wishes to apply hedge accounting and the risk management objective and strategy for undertaking the hedge. The documentation includes the Group’s risk management objective and strategy for undertaking hedge, the hedging/economic relationship, the hedged item or transaction, the nature of the risk being hedged, hedge ratio and how the entity will assess the effectiveness of changes in the hedging instrument’s fair value in offsetting the exposure to changes in the hedged item’s fair value or cash flows attributable to the hedged risk. Such hedges are expected to be highly effective in achieving offsetting changes in fair value or cash flows and are assessed on an ongoing basis to determine that they actually have been highly effective throughout the financial reporting periods for which they were designated.
Hedges that meet the strict criteria for hedge accounting are accounted for, as described below:
(i) Fair value hedges
Changes in fair value of the designated portion of derivatives that qualify as fair value hedges are recognised in profit or loss immediately, together with any changes in the fair value of the hedged asset or liability that are attributable to the hedged risk.
(ii) Cash flow hedges
The effective portion of changes in the fair value of the hedging instrument is recognised in OCI in the cash flow hedge reserve, while any ineffective portion is recognised immediately in profit or loss. The Group uses forward currency contracts as hedges of its exposure to foreign currency risk in forecast transactions and firm commitments. Amounts recognised as OCI are transferred to profit or loss when the hedged transaction affects profit or loss, such as when a forecast sale occurs. When the hedged item is the cost of a non-financial asset or non-financial liability, the amounts recognised as OCI are transferred to the initial carrying amount of the non-financial asset or liability.
If the hedging instrument expires or is sold, terminated or exercised or if its designation as a hedge is revoked, or when the hedge no longer meets the criteria for hedge accounting, any cumulative gain or loss previously recognised in OCI remains separately in equity until the forecast transaction occurs or the foreign currency firm commitment is met. When a forecast transaction is no longer expected to occur, the gain or loss accumulated in equity is recognised immediately in profit or loss.
(iii) Net Investment Hedge
The group designates certain foreign currency liability as hedge against certain net investment in foreign subsidiaries. Hedges of net investments in foreign operations are accounted similar to cash flow hedges. Any gain or loss on the hedging instrument relating to the effective portion of the hedge is recognised in other comprehensive income and held in foreign currency translation reserve (‘FCTR’)- a component of equity. The ineffective portion of the gain or loss on these hedges is immediately recognised in the consolidated statement of profit and loss. The amounts accumulated in equity are included in the consolidated statement of profit and loss when the foreign operation is disposed or partially disposed.
Treasury shares The Group has created an Employee Benefit Trust
(EBT) for providing share-based payment to its employees. The Group uses EBT as a vehicle for distributing shares to employees under the employee remuneration schemes. The Group treats EBT as its extension and shares held by EBT are treated as treasury shares.
Own equity instruments that are reacquired (treasury shares) are deducted from equity. No gain or loss is recognised in profit or loss on the purchase, sale, issue or cancellation of the Group’s own equity instruments. Consideration paid or received shall be recognised directly in equity.
Dividend distribution to equity holders of the Parent The Parent Company recognises a liability to make
dividend distributions to equity holders of the parent when the distribution is authorised and the distribution is no longer at the discretion of the Parent Company. As per the corporate laws in India, a distribution is authorised when it is approved by the shareholders. A corresponding amount is recognised directly in equity.
k. Leases A lease that transfers substantially all the risks
and rewards incidental to ownership to the lessee is classified as a finance lease. All other leases are classified as operating leases.
Group as a lessee Finance leases are capitalised at the commencement
of the lease at the inception date fair value of the leased assets or, if lower, at the present value of the minimum lease payments. The corresponding liability to the lessor is included in the consolidated balance sheet as a finance lease obligation. Lease payments are apportioned between finance charges and reduction
Notes to the Consolidated Financial Statementsfor the year ended March 31, 2019
FINANCIAL STATEMENTS
Annual Report 2018-19
183Consolidated
of the lease liability so as to achieve a constant rate of interest on the remaining balance of the liability. Finance charges are recognised in profit or loss as finance costs. Contingent rentals are recognised as expenses in the periods in which they are incurred. A leased asset is depreciated over the useful life of the asset. However, if there is no reasonable certainty that the Company will obtain ownership by the end of the lease term, the asset is depreciated over the shorter of the estimated useful life of the asset and the lease term.
Operating lease payments are generally recognised as an expense in the profit or loss on a straight-line basis over the lease term. Where the rentals are structured solely to increase in line with expected general inflation to compensate for the lessor’s expected inflationary cost increases, such increases are recognised in the year in which such benefits accrue. Contingent rentals arising under operating leases are also recognised as expenses in the periods in which they are incurred.
Group as a lessor Rental income from operating lease is generally
recognised on a straight-line basis over the term of the relevant lease. Where the rentals are structured solely to increase in line with expected general inflation to compensate for the Group’s expected inflationary cost increases, such increases are recognised in the year in which such benefits accrue. Initial direct costs incurred in negotiating and arranging an operating lease are added to the carrying amount of the leased asset and recognised over the lease term on the same basis as rental income. Contingent rents are recognised as revenue in the period in which they are earned.
Amounts due from lessees under finance leases are recorded as receivables at the Group’s net investment in the leases. Finance lease income is allocated to accounting periods so as to reflect a constant periodic rate of return on the Group’s net investment outstanding in respect of the leases.
l. Inventories Inventories consisting of raw materials and packing
materials, work-in-progress, stock-in-trade, stores and spares and finished goods are measured at the lower of cost and net realisable value. The cost of all categories of inventories is based on the weighted average method. Cost of raw materials and packing materials, stock-in-trade, stores and spares includes cost of purchases and other costs incurred in bringing the inventories to their present location and condition. Cost of work-in-progress and finished
goods comprises direct material, direct labour and an appropriate proportion of variable and fixed overhead expenditure.
Net realisable value is the estimated selling price in the ordinary course of business, less the estimated costs of completion and costs necessary to make the sale.
The factors that the Company considers in determining the allowance for slow moving, obsolete and other non-saleable inventory include estimated shelf life, planned product discontinuances, price changes, ageing of inventory and introduction of competitive new products, to the extent each of these factors impact the Company’s business and markets. The Company considers all these factors and adjusts the inventory provision to reflect its actual experience on a periodic basis.
m. Cash and cash equivalents Cash and cash equivalent in the consolidated balance
sheet comprise cash at banks and on hand and short-term deposits with an original maturity of three months or less, which are subject to an insignificant risk of changes in value.
For the purpose of the consolidated statement of cash flow, cash and cash equivalents consist of cash and short-term deposits, as defined above, net of outstanding bank overdrafts as they are considered an integral part of the Company’s cash management.
n. Provisions, contingent liabilities and contingent assets
Provisions are recognised when the Group has a present obligation (legal or constructive) as a result of past event, it is probable that an outflow of resources embodying economic benefits will be required to settle the obligation and a reliable estimate can be made of the amount of obligation. When the Company expects some or all of a provision to be reimbursed, for example, under an insurance contract, the reimbursement is recognised as a separate asset, but only when the reimbursement is certain. The expense relating to a provision is presented in the consolidated statement of profit and loss net of any reimbursement.
If the effect of the time value of money is material, provisions are determined by discounting the expected future cash flows at a pre-tax rate that reflects current market assessments of the time value of money and the risks specific to the liability. Where discounting is used, the increase in the provision due to the passage of time is recognised as a finance cost.

Notes to the Consolidated Financial Statementsfor the year ended March 31, 2019
Sun Pharmaceutical Industries Ltd.
Specialty in progress
184
Restructuring A provision for restructuring is recognised when
the Group has a detailed formal restructuring plan and has raised a valid expectation in those affected that it will carry out the restructuring by starting to implement the plan or announcing its main features to those affected by it. The measurement of a restructuring provision includes only the direct expenditure arising from the restructuring, which are those amounts that are both necessarily entailed by the restructuring and not associated with the ongoing activities of the entity.
Onerous contracts Present obligations arising under onerous contracts
are recognised and measured as provisions. An onerous contract is considered to exist where the Group has a contract under which the unavoidable costs of meeting the obligations under the contract exceed the economic benefit expected to be received from the contract.
Contingent liabilities and contingent assets Contingent liability is disclosed for,
(i) Possible obligations which will be confirmed only by future events not wholly within the control of the Company, or
(ii) Present obligations arising from past events where it is not probable that an outflow of resources will be required to settle the obligation or a reliable estimate of the amount of the obligation cannot be made.
Contingent assets are not recognised in the consolidated financial statements.
o. Revenue Sale of goods Revenue from contracts with customers is recognised
when control of the goods or services are transferred to the customer at an amount that reflects the consideration to which the Group expects to be entitled in exchange for those goods or services. The Group has generally concluded that it is the principal in its revenue arrangements, since it is the primary obligor in all of its revenue arrangement, as it has pricing latitude and is exposed to inventory and credit risks. Revenue is stated net of goods and service tax and net of returns, chargebacks, rebates and other similar allowances. These are calculated on the basis of historical experience and the specific terms in the individual contracts.
In determining the transaction price, the Group considers the effects of variable consideration,
the existence of significant financing components, non-cash consideration, and consideration payable to the customer (if any). The Group estimates variable consideration at contract inception until it is highly probable that a significant revenue reversal in the amount of cumulative revenue recognised will not occur when the associated uncertainty with the variable consideration is subsequently resolved.
Sales returns The Group accounts for sales returns accrual by
recording an allowance for sales returns concurrent with the recognition of revenue at the time of a product sale. This allowance is based on the Group’s estimate of expected sales returns. With respect to established products, the Group considers its historical experience of sales returns, levels of inventory in the distribution channel, estimated shelf life, product discontinuances, price changes of competitive products, and the introduction of competitive new products, to the extent each of these factors impact the Group’s business and markets. With respect to new products introduced by the Group, such products have historically been either extensions of an existing line of product where the Group has historical experience or in therapeutic categories where established products exist and are sold either by the Company or the Company’s competitors.
Contract balances Contract assets A contract asset is the right to consideration in
exchange for goods or services transferred to the customer. If the Group performs by transferring goods or services to a customer before the customer pays consideration or before payment is due, a contract asset is recognised for the earned consideration that is conditional.
Trade receivables A receivable represents the Group’s right to an
amount of consideration that is unconditional (i.e., only the passage of time is required before payment of the consideration is due).
Contract liabilities A contract liability is the obligation to transfer
goods or services to a customer for which the Group has received consideration (or an amount of consideration is due) from the customer. If a customer pays consideration before the Group transfers goods or services to the customer, a contract liability is recognised when the payment is made or the payment is due (whichever is earlier). Contract liabilities are recognised as revenue when the Group performs under the contract.
Notes to the Consolidated Financial Statementsfor the year ended March 31, 2019
FINANCIAL STATEMENTS
Annual Report 2018-19
185Consolidated
Rendering of services Revenue from services rendered is recognised in the
profit or loss as the underlying services are performed. Upfront non-refundable payments received are deferred and recognised as revenue over the expected period over which the related services are expected to be performed.
Royalties Royalty revenue is recognised on an accrual basis
in accordance with the substance of the relevant agreement (provided that it is probable that economic benefits will flow to the Group and the amount of revenue can be measured reliably). Royalty arrangements that are based on production, sales and other measures are recognised by reference to the underlying arrangement.
p. Dividend and interest income Dividend income is recognised when the Group’s
right to receive the payment is established, which is generally when shareholders approve the dividend.
Interest income from a financial asset is recognised when it is probable that the economic benefits will flow to the Group and the amount of income can be measured reliably. Interest income is accrued on a time basis, by reference to the principal outstanding and at the effective interest rate applicable, which is the rate that exactly discounts estimated future cash receipts through the expected life of the financial asset to that asset’s net carrying amount on initial recognition.
q. Government grants The Group recognises government grants only when
there is reasonable assurance that the conditions attached to them will be complied with, and the grants will be received. When the grant relates to an expense item, it is recognised as income on a systematic basis over the periods that the related costs, for which it is intended to compensate, are expensed. When the grant relates to an asset, the Company deducts such grant amount from the carrying amount of the asset.
r. Employee benefits Defined benefit plans The Company operates a defined benefit gratuity
plan which requires contribution to be made to a separately administered fund.
The liability in respect of defined benefit plans is calculated using the projected unit credit method with actuarial valuations being carried out at the end of each annual reporting period. The present value of the defined benefit obligation is determined by
discounting the estimated future cash outflows by reference to market yields at the end of the reporting period on government bonds. The currency and term of the government bonds shall be consistent with the currency and estimated term of the post-employment benefit obligations. The current service cost of the defined benefit plan, recognised in the profit or loss as employee benefits expense, reflects the increase in the defined benefit obligation resulting from employee service in the current year, benefit changes, curtailments and settlements. Past service costs are recognised in profit or loss in the period of a plan amendment. The net interest cost is calculated by applying the discount rate to the net balance of the defined benefit obligation and the fair value of plan assets. This cost is included in employee benefits expense in profit or loss. Actuarial gains and losses arising from experience adjustments and changes in actuarial assumptions are charged or credited to OCI in the period in which they arise and is reflected immediately in retained earnings and is not reclassified to profit or loss.
Termination benefits Termination benefits are recognised as an expense
at the earlier of the date when the Group can no longer withdraw the offer of those benefits and when the entity recognises costs for a restructuring that is within the scope of Ind AS 37 and involves the payment of termination benefits.
Short-term and Other long-term employee benefits Accumulated leave, which is expected to be utilised
within the next 12 months, is treated as short-term employee benefit. The Company measures the expected cost of such absences as the additional amount that it expects to pay as a result of the unused entitlement that has accumulated at the reporting date.
The Group treats accumulated leave expected to be carried forward beyond twelve months, as long-term employee benefit for measurement purposes. Such long-term compensated absences are provided for based on the actuarial valuation using the projected unit credit method at the year-end. Actuarial gains/losses are immediately taken to the consolidated statement of profit and loss and are not deferred.
The Group’s net obligation in respect of other long term employee benefits is the amount of future benefit that employees have earned in return for their service in the current and previous periods. That benefit is discounted to determine its present value.

Notes to the Consolidated Financial Statementsfor the year ended March 31, 2019
Sun Pharmaceutical Industries Ltd.
Specialty in progress
186
Defined contribution plans The Group’s contributions to defined contribution
plans are recognised as an expense as and when the services are received from the employees entitling them to the contributions. The Group does not have any obligation other than the contribution made.
Share-based payment arrangements The grant date fair value of options granted to
employees is recognised as an employee expense, with a corresponding increase in equity, on a straight line basis, over the vesting period, based on the Group’s estimate of equity instruments that will eventually vest. At the end of each reporting period, the Group revises its estimate of the number of equity instruments expected to vest. The impact of the revision of the original estimates, if any, is recognised in profit or loss such that the cumulative expense reflects the revised estimate, with a corresponding adjustment to the equity-settled employee benefits reserve.
For cash-settled share-based payments, a liability is recognised for the goods or services acquired, measured initially at the fair value of the liability. At the end of each reporting period until the liability is settled, and at the date of settlement, the fair value of the liability is remeasured, with any changes in fair value recognised in profit or loss for the year.
s. Borrowing costs Borrowing costs that are directly attributable to the
construction or production of a qualifying asset are capitalised as part of the cost of that asset. All other borrowing costs are expensed in the period in which they occur. Borrowing costs consist of interest and other costs that an entity incurs in connection with the borrowing of funds. Borrowing costs also includes exchange differences to the extent regarded as an adjustment to the borrowing costs. A qualifying asset is one that necessarily takes substantial period of time to get ready for its intended use.
t. Income tax Income tax expense consists of current and deferred
tax. Income tax expense is recognised in profit or loss except to the extent that it relates to items recognised in OCI or directly in equity, in which case it is recognised in OCI or directly in equity respectively. Current tax is the expected tax payable on the taxable profit for the year, using tax rates enacted or substantively enacted by the end of the reporting period, and any adjustment to tax payable in respect of previous years. Current tax assets and tax
liabilities are offset where the Company has a legally enforceable right to offset and intends either to settle on a net basis, or to realise the asset and settle the liability simultaneously.
Deferred tax is recognised on temporary differences between the carrying amounts of assets and liabilities in the consolidated financial statements and the corresponding tax bases used in the computation of taxable profit. Deferred tax is not recognised for the temporary differences that arise on the initial recognition of assets or liabilities in a transaction that is not a business combination and that affects neither accounting nor taxable profits and taxable temporary differences arising upon the initial recognition of goodwill.
Deferred tax is measured at the tax rates that are expected to be applied to the temporary differences when they reverse, based on the laws that have been enacted or substantively enacted by the end of the reporting period. Deferred tax assets and liabilities are offset if there is a legally enforceable right to set off corresponding current tax assets against current tax liabilities and the deferred tax assets and deferred tax liabilities relate to income taxes levied by the same tax authority on the Company.
A deferred tax asset is recognised to the extent that it is probable that future taxable profits will be available against which the temporary difference can be utilised. Deferred tax assets are reviewed at each reporting date and are reduced to the extent that it is no longer probable that the related tax benefit will be realised. Withholding tax arising out of payment of dividends to shareholders under the Indian Income tax regulations is not considered as tax expense for the Company and all such taxes are recognised in the consolidated statement of changes in equity as part of the associated dividend payment.
Minimum Alternate Tax (‘MAT’) credit is recognised as deferred tax asset only when and to the extent there is convincing evidence that the Company will pay normal income tax during the period for which the MAT credit can be carried forward for set-off against the normal tax liability. MAT credit recognised as an asset is reviewed at each Balance Sheet date and written down to the extent the aforesaid convincing evidence no longer exists.
u. Earnings per share The Parent Company presents basic and diluted
earnings per share (“EPS”) data for its equity shares. Basic EPS is calculated by dividing the profit or loss

Notes to the Consolidated Financial Statementsfor the year ended March 31, 2019
FINANCIAL STATEMENTS
Annual Report 2018-19
187Consolidated
attributable to equity shareholders of the Parent Company by the weighted average number of equity shares outstanding during the period. Diluted EPS is determined by adjusting the profit or loss attributable to equity shareholders and the weighted average number of equity shares outstanding for the effects of all dilutive potential ordinary shares, which includes all stock options granted to employees.
The number of equity shares and potentially dilutive equity shares are adjusted retrospectively for all periods presented for any share splits and bonus shares issues including for changes effected prior to the approval of the financial statements by the Board of Directors.
v. Recent Accounting pronouncements Standards issued but not yet effective and not early
adopted by the Company The Ministry of Corporate Affairs (MCA) has issued
the Companies (Indian Accounting Standards) Amendment Rules, 2019 and Companies (Indian Accounting Standards) Second Amendment Rules, 2019 introducing /amending the following standards:
Ind AS 116, Leases Ind AS 116 Leases has been notified on March 30,
2019 and it replaces Ind AS 17 Leases, including appendices thereto. Ind AS 116 is effective for annual periods beginning on or after April 01, 2019. Ind AS 116 sets out the principles for the recognition, measurement, presentation and disclosure of leases and requires lessees to account for all leases under a single on-balance sheet model similar to the accounting for finance leases under Ind AS 17. The standard includes two recognition exemptions for lessees – leases of ‘low-value’ assets (e.g., personal computers) and short-term leases (i.e., leases with a lease term of 12 months or less). At the commencement date of a lease, a lessee will recognise a liability to make lease payments (i.e., the lease liability) and an asset representing the right to use the underlying asset during the lease term (i.e., the right-of-use asset). Lessees will be required to separately recognise the interest expense on the lease liability and the depreciation expense on the right-of-use asset.
Lessees will be also required to re-measure the lease liability upon the occurrence of certain events (e.g., a change in the lease term, a change in future lease payments resulting from a change in an index or rate used to determine those payments). The lessee will generally recognise the amount of the re-measurement of the lease liability as an adjustment to the right-of-use asset.
Lessor accounting under Ind AS 116 is substantially unchanged from today’s accounting under Ind AS 17. Lessors will continue to classify all leases using the same classification principle as in Ind AS 17 and distinguish between two types of leases: operating and finance leases.
Ind AS 116, which is effective for annual periods beginning on or after April 01, 2019, requires lessees and lessors to make more extensive disclosures than under Ind AS 17. The Group is evaluating the requirements of the standard and its effect on the consolidated financial statements.
Ind AS 12 – Income taxes (amendments relating uncertainty over income tax treatments)
The amendment to Appendix C of Ind AS 12 specifies that the amendment is to be applied to the determination of taxable profit (tax loss), tax bases, unused tax losses, unused tax credits and tax rates, when there is uncertainty over income tax treatments under Ind AS 12. It outlines the following: (1) the entity has to use judgement, to determine whether each tax treatment should be considered separately or whether some can be considered together. The decision should be based on the approach which provides better predictions of the resolution of the uncertainty (2) the entity is to assume that the taxation authority will have full knowledge of all relevant information while examining any amount (3) entity has to consider the probability of the relevant taxation authority accepting the tax treatment and the determination of taxable profit (tax loss), tax bases, unused tax losses, unused tax credits and tax rates would depend upon the probability. The Group is evaluating the requirements of the standard and its effect on the consolidated financial statements.
Ind AS 109: Prepayment Features with Negative Compensation
Under Ind AS 109, a debt instrument can be measured at amortised cost or at fair value through other comprehensive income, provided that the contractual cash flows are ‘solely payments of principal and interest on the principal amount outstanding’ (the SPPI criterion) and the instrument is held within the appropriate business model for that classification. The amendments to Ind AS 109 clarify that a financial asset passes the SPPI criterion regardless of the event or circumstance that causes the early termination of the contract and irrespective of which party pays or receives reasonable compensation for the early termination of the contract.
The amendments should be applied retrospectively and are effective for annual periods beginning on

Notes to the Consolidated Financial Statementsfor the year ended March 31, 2019
Sun Pharmaceutical Industries Ltd.
Specialty in progress
188
or after April 01, 2019. The Group is evaluating the requirements of the standard and its effect on the consolidated financial statements.
Ind AS 19 – Plan Amendment, Curtailment or Settlement
The amendments clarify that if a plan amendment, curtailment or settlement occurs, it is mandatory that the current service cost and the net interest for the period after the re-measurement are determined using the assumptions used for the re-measurement. In addition, amendments have been included to clarify the effect of a plan amendment, curtailment or settlement on the requirements regarding the asset ceiling. The group is evaluating the impact if any on its consolidated financial statements.
Annual amendments to Ind AS Ind AS 23 – Borrowing Costs The amendments clarify that if any specific borrowing
remains outstanding after the related asset is ready for its intended use or sale, that borrowing becomes part of the funds that an entity borrows generally
when calculating the capitalisation rate on general borrowings. The Group is evaluating the impact if any on its consolidated financial statements.
Ind AS 12: Income Taxes (amendments relating to income tax consequences of dividend)
The amendment relating to income tax consequences of dividend clarify that an entity shall recognise the income tax consequences of dividends in profit or loss, other comprehensive income or equity according to where the entity originally recognised those past transactions or events. It is relevant to note that the amendment does not amend situations where the entity pays a tax on dividend which is effectively a portion of dividends paid to taxation authorities on behalf of shareholders. Such amount paid or payable to taxation authorities continues to be charged to equity as part of dividend, in accordance with Ind AS 12. The Group is evaluating the impact if any on its consolidated financial statements.

Notes to the Consolidated Financial Statementsfor the year ended March 31, 2019
FINANCIAL STATEMENTS
Annual Report 2018-19
189ConsolidatedN
OTE
: 3a
PRO
PERT
Y, P
LAN
T A
ND
EQ
UIP
MEN
T`
in M
illio
n
Fre
ehol
d la
nd
Lea
se-
hold
land
Bui
ldin
gs B
uild
ings
ta
ken
unde
r fin
ance
le
ase*
Lea
se-
hold
im
prov
e-m
ent o
n bu
ildin
g
Bui
ldin
gs
give
n un
der
oper
ating
le
ase
*
Pla
nt a
nd
equi
p-m
ent
Pla
nt a
nd
equi
p-m
ent
give
n un
der
oper
ating
le
ase
*
Pla
nt a
nd
equi
p-m
ent
take
n un
der
finan
ce
leas
e *
Fur
nitu
re
and
fixtu
res
Fur
nitu
re
and
Fixt
ures
gi
ven
unde
r op
erati
ng
leas
e *
Fur
nitu
re
and
fixtu
res
give
n un
der
finan
ce
leas
e *
Veh
icle
s
Veh
icle
s ta
ken
unde
r fin
ance
le
ase
*
Offi
ce
equi
p-m
ent
Offi
ce
equi
p-m
ent
take
n un
der
finan
ce
leas
e *
Tota
l
At co
st o
r dee
med
cost
As at
Apr
il 01,
201
7 2
,902
.9
1,8
46.2
44
,835
.0
1,5
67.4
2
48.5
7
72.1
75
,542
.9
20.
8 -
3,4
86.0
0
.4
- 1
,074
.7
- 1
,697
.3
- 1
33,9
94.2
Cons
olid
ation
adju
stm
ents
61.
2 1
.8
334
.2
248
.0
(248
.5)
- 6
65.9
-
- 4
6.7
- 1
.9
11.
7 6
.3
54.
3 -
1,1
83.5
Ta
ken
over
on
acqu
isitio
n 3
87.5
-
392
.2
- -
- 7
33.3
-
- 1
3.7
- -
7.7
-
1.0
-
1,5
35.4
Ad
ditio
ns 1
13.1
-
3,5
86.8
0
.1
- -
11,
247.
9 0
.3
- 2
12.6
-
0.8
1
37.3
7
15.1
2
16.6
-
16,
230.
6 Di
spos
als (8
1.0)
- (2
,192
.5)
(770
.3)
- -
(977
.2)
- -
(29.
0) -
- (1
08.4
) -
(20.
8) -
(4,1
79.2
)As
at M
arch
31,
201
8 3
,383
.7
1,8
48.0
46
,955
.7
1,0
45.2
-
772
.1 8
7,21
2.8
21.
1 -
3,7
30.0
0
.4
2.7
1
,123
.0
721
.4
1,9
48.4
-
148
,764
.5
Cons
olid
ation
adju
stm
ents
(46.
8) 7
3.4
1,3
06.7
7
2.4
- (2
74.5
) 1
,325
.9
1.4
(0
.2)
54.
3 -
- 0
.8
36.
0 3
4.3
(2.9
) 2
,580
.8
Take
n ov
er o
n ac
quisi
tion
^ 7
80.8
-
1,8
86.9
-
- -
1,6
94.1
-
- -
- -
- -
- 1
13.0
4
,474
.8
Addi
tions
106
.5
434
.1
3,1
49.0
-
- 2
1.6
12,
059.
4 -
8.5
3
00.0
-
- 1
45.0
7
04.4
3
40.5
-
17,
269.
0 Di
spos
als (7
2.7)
- (5
75.2
) (2
24.7
) -
- (4
,184
.8)
(0.9
) -
(90.
7) -
- (1
69.5
) (1
03.3
) (1
12.6
) -
(5,5
34.4
)As
at M
arch
31,
201
9 4
,151
.5
2,3
55.5
52
,723
.1
892
.9
- 5
19.2
98,
107.
4 2
1.6
8.3
3
,993
.6
0.4
2
.7
1,0
99.3
1
,358
.5
2,2
10.6
1
10.1
16
7,55
4.7
Accu
mul
ated
de
prec
iation
and
impa
irmen
tAs
at A
pril 0
1, 2
017
22.
5 2
36.1
10
,825
.9
932
.4
41.
0 2
30.8
33
,401
.4
20.
2 -
1,8
80.7
0
.4
- 5
34.6
-
915
.3
- 4
9,04
1.3
Cons
olid
ation
adju
stm
ents
2.2
0
.6
182
.6
44.
7 (4
1.0)
- 5
68.1
-
- 4
8.5
- 0
.3
10.
4 1
.5
16.
8 -
834
.7
Take
n ov
er o
n ac
quisi
tion
- -
77.
2 -
- -
298
.0
- -
12.
6 -
- 6
.9
- 0
.9
- 3
95.6
De
prec
iation
expe
nse
- 2
3.0
1,7
70.3
6
85.1
-
59.
2 6
,854
.1
0.5
-
272
.6
- 0
.4
186
.7
174
.9
254
.4
- 1
0,28
1.2
Elim
inat
ed o
n di
spos
als o
f ass
ets
(24.
7) -
(1,7
34.5
) (7
70.3
) -
- (7
24.1
) -
- (3
5.7)
- -
(70.
1) -
(19.
2) -
(3,3
78.6
)
As at
Mar
ch 3
1, 2
018
- 2
59.7
11
,121
.5
891
.9
- 2
90.0
40,
397.
5 2
0.7
- 2
,178
.7
0.4
0
.7
668
.5
176
.4
1,1
68.2
-
57,
174.
2 Co
nsol
idati
on ad
just
men
ts -
14.
0 4
49.9
6
3.0
- (1
55.3
) 9
89.9
1
.0
- 2
6.4
- -
(1.9
) 1
5.4
22.
7 (0
.2)
1,4
24.9
Ta
ken
over
on
acqu
isitio
n ^
- -
1,4
58.2
-
- -
1,2
04.6
-
- -
- -
- -
- -
2,6
62.8
De
prec
iation
expe
nse
- 2
8.9
1,8
67.4
5
4.4
- 6
5.2
7,5
31.7
-
0.4
3
07.3
-
0.4
1
70.8
2
14.1
2
88.7
8
.9
10,
538.
2 Im
pairm
ent l
osse
s rec
ogni
sed
in p
rofit
or l
oss
- -
7.7
-
- -
4.5
-
- 0
.7
- -
- -
- -
12.
9
Elim
inat
ed o
n di
spos
als o
f ass
ets
- -
(397
.4)
(176
.3)
- -
(3,6
27.0
) (0
.9)
- (6
9.5)
- -
(123
.1)
(37.
7) (1
00.6
) -
(4,5
32.5
)
As at
Mar
ch 3
1, 2
019
- 3
02.6
14
,507
.3
833
.0
- 1
99.9
46,
501.
2 2
0.8
0.4
2
,443
.6
0.4
1
.1
714
.3
368
.2
1,3
79.0
8
.7
67,
280.
5 Ca
rryin
g am
ount
As at
Mar
ch 3
1, 2
018
3,3
83.7
1
,588
.3
35,8
34.2
1
53.3
-
482
.1 4
6,81
5.3
0.4
-
1,5
51.3
-
2.0
4
54.5
5
45.0
7
80.2
-
91,
590.
3
As a
t Mar
ch 3
1, 2
019
4,1
51.5
2,0
52.9
38,
215.
8 5
9.9
- 3
19.3
51,
606.
2 0
.8
7.9
1,5
50.0
-
1.6
3
85.0
9
90.3
8
31.6
1
01.4
100
,274
.2

Notes to the Consolidated Financial Statementsfor the year ended March 31, 2019
Sun Pharmaceutical Industries Ltd.
Specialty in progress
190
NOTE : 3b OTHER INTANGIBLE ASSETSOther than internally generated ` in Million
Computer Software
Trademarks and Designs Total
At cost or deemed costAs at April 01, 2017 1,415.6 53,892.2 55,307.8 Consolidation adjustments 14.1 653.1 667.2 Taken over on acquisition - 550.0 550.0 Additions 332.6 8,150.8 8,483.4 Eliminated on disposals of assets (8.7) (343.2) (351.9)As at March 31, 2018 1,753.6 62,902.9 64,656.5 Consolidation adjustments 21.6 2,793.3 2,814.9 Taken over on acquisition^ 4.4 - 4.4 Additions 763.9 22,251.6 23,015.5 Eliminated on disposals of assets (10.3) (723.0) (733.3)As at March 31, 2019 2,533.2 87,224.8 89,758.0 Accumulated amortisation and impairmentAs at April 01, 2017 912.3 17,958.9 18,871.2 Consolidation adjustments 9.8 541.1 550.9 Amortisation expense 219.7 4,497.5 4,717.2 Eliminated on disposals of assets (8.6) (343.4) (352.0)As at March 31, 2018 1,133.2 22,654.1 23,787.3 Consolidation adjustments 17.5 989.1 1,006.6 Taken over on acquisition^ 1.2 - 1.2 Amortisation expense 303.2 6,691.1 6,994.3 Eliminated on disposals of assets (10.2) (554.7) (564.9)As at March 31, 2019 1,444.9 29,779.6 31,224.5
Carrying amountAs at March 31, 2018 620.4 40,248.8 40,869.1 As at March 31, 2019 1,088.3 57,445.2 58,533.5
Footnotes: (a) Buildings include ` 8,620 (March 31, 2018: ` 8,620) towards cost of shares in a co-operative housing society and also includes ` 4.5
Million (March 31, 2018 : ` 4.5 Million towards cost of flats not registered in the name of the Parent company but is entitled to right of use and occupancy.
(b) For details of assets pledged as security refer note 67.
(c) Other intangible assets consisting of trademarks, brands acquired, research and development, designs, technical know-how, licences, non-compete fees and other intangible assets are available to the Group in perpetuity. The amortisable amount of intangible assets is arrived at, based on the management’s best estimates of useful lives of such assets after due consideration as regards their expected usage, the product life cycles, technical and technological obsolescence, market demand for products, competition and their expected future benefits to the Group.
d) The aggregate amortisation has been included under depreciation and amortisation expense in the consolidated statement of profit and loss.
* Refer note 55^ Refer note 76
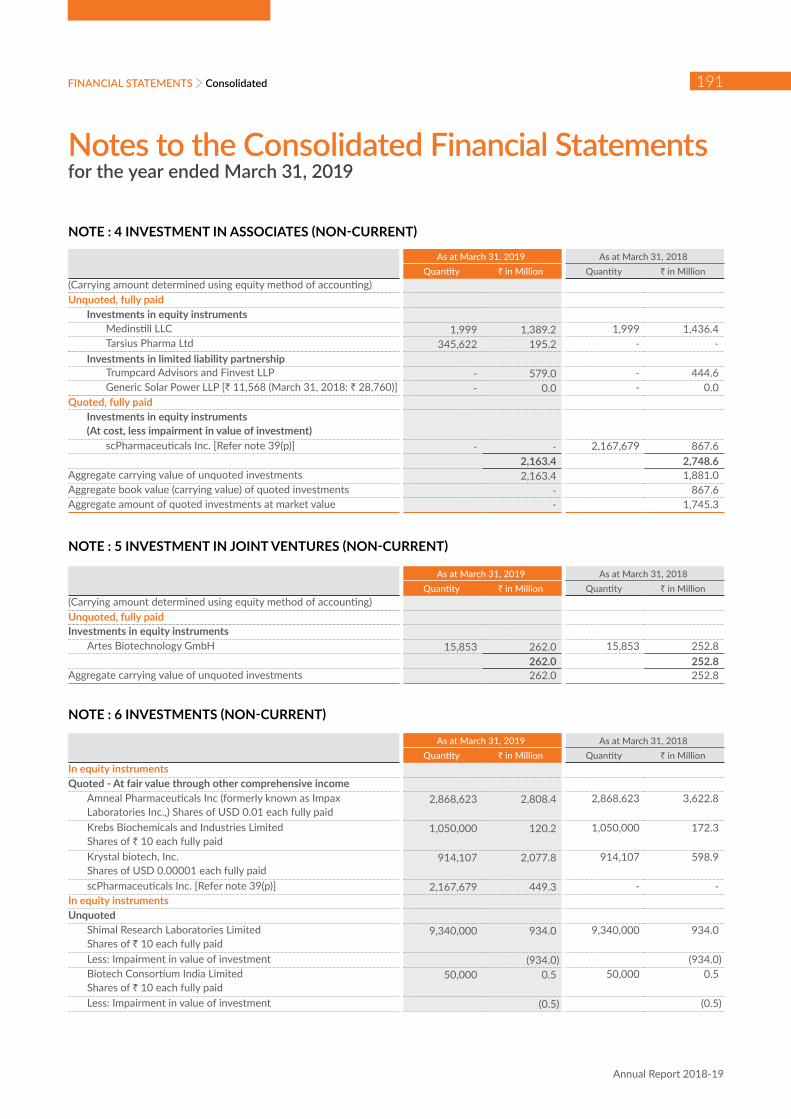
Notes to the Consolidated Financial Statementsfor the year ended March 31, 2019
FINANCIAL STATEMENTS
Annual Report 2018-19
191Consolidated
NOTE : 4 INVESTMENT IN ASSOCIATES (NON-CURRENT)
As at March 31, 2019 As at March 31, 2018Quantity ` in Million Quantity ` in Million
(Carrying amount determined using equity method of accounting)Unquoted, fully paid
Investments in equity instruments Medinstill LLC 1,999 1,389.2 1,999 1,436.4 Tarsius Pharma Ltd 345,622 195.2 - - Investments in limited liability partnership Trumpcard Advisors and Finvest LLP - 579.0 - 444.6 Generic Solar Power LLP [` 11,568 (March 31, 2018: ` 28,760)] - 0.0 - 0.0
Quoted, fully paidInvestments in equity instruments (At cost, less impairment in value of investment) scPharmaceuticals Inc. [Refer note 39(p)] - - 2,167,679 867.6
2,163.4 2,748.6 Aggregate carrying value of unquoted investments 2,163.4 1,881.0 Aggregate book value (carrying value) of quoted investments - 867.6 Aggregate amount of quoted investments at market value - 1,745.3
NOTE : 5 INVESTMENT IN JOINT VENTURES (NON-CURRENT)
As at March 31, 2019 As at March 31, 2018Quantity ` in Million Quantity ` in Million
(Carrying amount determined using equity method of accounting)Unquoted, fully paidInvestments in equity instruments Artes Biotechnology GmbH 15,853 262.0 15,853 252.8
262.0 252.8 Aggregate carrying value of unquoted investments 262.0 252.8
NOTE : 6 INVESTMENTS (NON-CURRENT)
As at March 31, 2019 As at March 31, 2018Quantity ` in Million Quantity ` in Million
In equity instrumentsQuoted - At fair value through other comprehensive income Amneal Pharmaceuticals Inc (formerly known as Impax
Laboratories Inc.,) Shares of USD 0.01 each fully paid 2,868,623 2,808.4 2,868,623 3,622.8
Krebs Biochemicals and Industries Limited Shares of ` 10 each fully paid
1,050,000 120.2 1,050,000 172.3
Krystal biotech, Inc. Shares of USD 0.00001 each fully paid
914,107 2,077.8 914,107 598.9
scPharmaceuticals Inc. [Refer note 39(p)] 2,167,679 449.3 - - In equity instrumentsUnquoted Shimal Research Laboratories Limited
Shares of ` 10 each fully paid 9,340,000 934.0 9,340,000 934.0
Less: Impairment in value of investment (934.0) (934.0) Biotech Consortium India Limited
Shares of ` 10 each fully paid 50,000 0.5 50,000 0.5
Less: Impairment in value of investment (0.5) (0.5)

Notes to the Consolidated Financial Statementsfor the year ended March 31, 2019
Sun Pharmaceutical Industries Ltd.
Specialty in progress
192
As at March 31, 2019 As at March 31, 2018Quantity ` in Million Quantity ` in Million
Reanal Finomvegyszergyar Zrt. (Reanal Ltd) 38,894 177.9 38,894 168.2 Less: Impairment in value of investment (177.9) (168.2) Others 71.9 20.2 In government securitiesQuoted - At fair value through other comprehensive income 7.86% Government of Rajasthan UDAY 2019
Bond of ` 1 each fully paid maturing June 23, 2019 - - 27,400,000 27.1
8.01% Government of Rajasthan UDAY 2020 Bond of ` 1 each fully paid maturing June 23, 2020
27,400,000 27.1 27,400,000 27.2
7.62% Government of Telangana UDAY 2026 Bond of ` 1 each fully paid maturing March 07, 2026
100,000,000 98.4 100,000,000 96.5
7.98% Government of Telangana UDAY 2030 Bond of ` 1 each fully paid maturing March 07, 2030
100,000,000 100.1 100,000,000 97.6
8.24% Government of Tamil Nadu UDAY 2028 Bond of ` 1 each fully paid maturing March 22, 2028
50,000,000 50.8 50,000,000 51.0
8.11% Government of Chhattisgarh SDL 2028 Bond of ` 1 each fully paid maturing January 31, 2028
200,000,000 202.2 - -
8.29% Government of West Bengal SDL 2028 Bond of ` 1 each fully paid maturing February 21, 2028
50,000,000 51.4 - -
Unquoted National savings certificates [` 10,000 (March 31, 2018: ` 10,000)] - 0.0 - 0.0 Quoted - At fair value through other comprehensive income Others * - 3,286.4 - 3,310.2 In debentures/bondsQuoted - At fair value through other comprehensive income Housing Development Finance Corporation Ltd - 9.9% Non-
convertible Debentures of ` 1,000,000 each fully paid matured during the year
- - 250 253.5
National Highways Authority of India - 8.2% Bonds of ` 1,000 each fully paid maturing on January 25, 2022
61,809 64.6 61,809 66.1
Power Finance Corporation Ltd (Series I) -8.2% Bonds of ` 1,000 each fully paid maturing on February 01, 2022
142,393 149.0 142,393 152.2
Indian Railway Finance Corporation Ltd - 8/8.15% Bonds of ` 1,000 each fully paid maturing on February 23, 2022
163,131 170.0 163,131 173.5
Investment in Bonds (various small value investments) - 17,686.6 - 11,340.5 ONGC Videsh 4.625% Regd. Notes 16,000,000 1,149.7 16,000,000 1,067.4 NTPC 4.375% Regd. Euro Medium Term Notes 10,000,000 712.7 10,000,000 661.4 State Bank of India 4.875% 700,000 507.0 700,000 476.1 Other investments - Unquoted 7,309.1 5,306.6
37,092.7 27,521.1 Aggregate book value (carrying value) of quoted investments 29,711.7 22,194.3 Aggregate amount of quoted investments at market value 29,711.7 22,194.3 Aggregate amount of unquoted investments before impairment 8,493.4 6,429.5 Aggregate amount of impairment in value of investments 1,112.4 1,102.7
*includes investment in various small denomination U.S Treasuries, brokered cash deposits and commercial papers

Notes to the Consolidated Financial Statementsfor the year ended March 31, 2019
FINANCIAL STATEMENTS
Annual Report 2018-19
193Consolidated
NOTE : 7 LOANS (NON-CURRENT)
` in Million
As at March 31, 2019
As at March 31, 2018
Loans to employees/others * Secured, considered good 3.1 10.2 Unsecured, considered good 167.3 22,414.5
170.4 22,424.7 * Others: Loans given to various parties at prevailing market interest rate.
NOTE : 8 OTHER FINANCIAL ASSETS (NON-CURRENT)
` in Million
As at March 31, 2019
As at March 31, 2018
Deposits 1.4 1.0 Margin money/ security against guarantees/ commitments 2.6 2.2 Security deposits - unsecured, considered good 638.6 653.8 Derivatives designated as hedges 24.4 - Derivatives not designated as hedges 120.7 82.8 Others# - 309.4
787.7 1,049.2 # includes receivable towards sale of manufacturing facility
NOTE : 9 INCOME TAX ASSET (NET) [NON-CURRENT]
` in Million
As at March 31, 2019
As at March 31, 2018
Advance income tax (net of provisions)* 32,660.9 31,896.6 32,660.9 31,896.6
* includes amount paid under protest
NOTE : 10 OTHER NON-CURRENT ASSETS
` in Million
As at March 31, 2019
As at March 31, 2018
Capital advances 3,894.8 4,430.3 Prepaid expenses 70.2 91.0 Balances with government authorities* 1,116.8 1,122.1 Other assets 1.7 16.7
5,083.5 5,660.1 * includes amount paid under protest

Notes to the Consolidated Financial Statementsfor the year ended March 31, 2019
Sun Pharmaceutical Industries Ltd.
Specialty in progress
194
NOTE : 11 INVENTORIES
` in Million
As at March 31, 2019
As at March 31, 2018
Lower of cost and net realisable value Raw materials and packing materials 27,530.2 24,360.1 Goods in transit 307.6 261.1
27,837.8 24,621.2 Work-in-progress 18,337.1 14,514.2 Finished goods 24,430.7 22,429.0 Stock-in-trade 7,151.3 6,217.1 Goods in transit 83.8 25.5
7,235.1 6,242.6 Stores and spares 1,019.1 999.0 Goods in transit - 0.9
1,019.1 999.9 78,859.8 68,806.9
(i) Inventory write downs are accounted, considering the nature of inventory, estimated shelf life, planned product discontinuances, price changes, ageing of inventory and introduction of competitive new products. Write downs of inventories amounted to ` 16,690.2 Million (March 31, 2018: ` 14,291.3 Million). The changes in write downs are recognised as an expense in the consolidated statement of profit and loss.
(ii) The cost of inventories recognised as an expense is disclosed in notes 33, 34 and 37 and as purchases of stock-in-trade in the consolidated statement of profit and loss.
NOTE : 12 INVESTMENTS (CURRENT)
As at March 31, 2019 As at March 31, 2018Quantity ` in Million Quantity ` in Million
In Government securitiesQuoted (Fair value through other comprehensive income) 7.75% Government of Rajasthan UDAY 2018
Bond of ` 1 each fully paid matured on June 23, 2018 - - 27,400,000 26.9
7.86% Government of Rajasthan UDAY 2019 Bond of ` 1 each fully paid maturing June 23, 2019
27,400,000 26.9 - -
Investment in others @ 18,812.5 22,087.4 In bonds/debenturesQuoted (Fair value through other comprehensive income) ONGC Videsh Limited 200,000 13.8 - - JSW Steel Limited 7,000,000 483.0 - - Oil India Limited 1,000,000 69.0 - - Investment in bonds (various small denomination investments) - 14,480.8 - 13,612.4
In mutual funds *Unquoted 5,621.2 5177.2In equity instrumentsUnquoted - - - 2.3
39,507.2 40,906.2 * Investments in mutual funds have been fair valued at closing net asset value (NAV).@ includes investment in various small denomination U.S Treasuries, brokered cash deposits, money market funds and commercial papers

Notes to the Consolidated Financial Statementsfor the year ended March 31, 2019
FINANCIAL STATEMENTS
Annual Report 2018-19
195Consolidated
` in Million
As at March 31, 2019
As at March 31, 2018
Aggregate book value (carrying value) of quoted investments 33,886.0 35,726.7 Aggregate amount of quoted investments at market value 33,886.0 35,726.7 Aggregate amount of unquoted investments before impairment 5,621.2 5,179.5Aggregate amount of impairment in value of investments - -
NOTE : 13 TRADE RECEIVABLES
` in Million
As at March 31, 2019
As at March 31, 2018
Unsecured, considered good 88,842.0 78,152.8 Credit impaired 2,246.1 3,142.9
91,088.1 81,295.7 Less : Allowance for credit impaired (expected credit loss allowance) (2,246.1) (3,142.9)
88,842.0 78,152.8
NOTE : 14 CASH AND CASH EQUIVALENTS
` in Million
As at March 31, 2019
As at March 31, 2018
Balance with banks In current accounts 33,540.6 55,137.3 In deposit accounts with original maturity less than 3 months 36,308.9 24,099.3 Cheques, drafts on hand 764.3 10.6 Cash on hand 9.2 6.5
70,623.0 79,253.7
NOTE : 15 BANK BALANCES OTHER THAN DISCLOSED IN NOTE 14 ABOVE
` in Million
As at March 31, 2019
As at March 31, 2018
Deposit accounts (*) 1,696.9 19,610.3 Earmarked balances with banks Unpaid dividend accounts 90.7 73.0 Balances held as margin money or security against guarantees and other commitments (*) 345.4 356.8
2,133.0 20,040.1 (*) Other bank balances include deposits amounting to ` Nil (March 31, 2018: ` 115.8 Million) and margin monies amounting to ` 38.3 Million (March 31, 2018: ` 327.7 Million) which have an original maturity of more than 12 months.
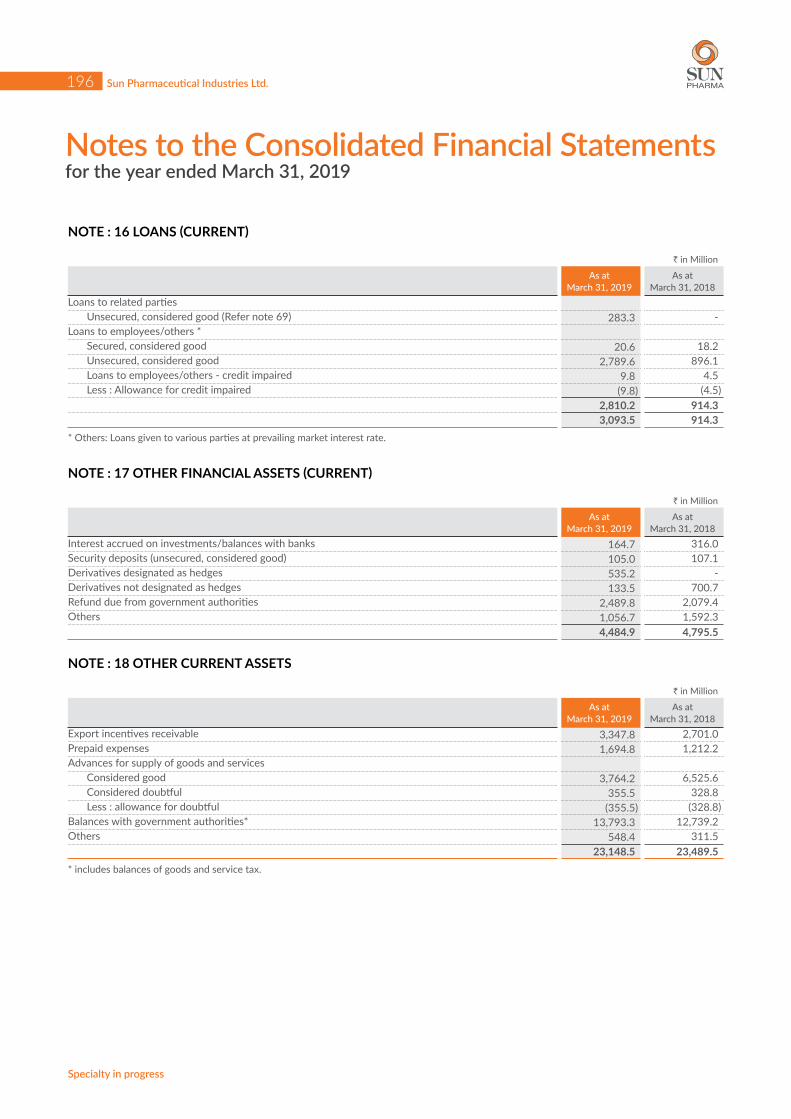
Notes to the Consolidated Financial Statementsfor the year ended March 31, 2019
Sun Pharmaceutical Industries Ltd.
Specialty in progress
196
NOTE : 16 LOANS (CURRENT)
` in Million
As at March 31, 2019
As at March 31, 2018
Loans to related parties Unsecured, considered good (Refer note 69) 283.3 - Loans to employees/others * Secured, considered good 20.6 18.2 Unsecured, considered good 2,789.6 896.1 Loans to employees/others - credit impaired 9.8 4.5 Less : Allowance for credit impaired (9.8) (4.5)
2,810.2 914.3 3,093.5 914.3
* Others: Loans given to various parties at prevailing market interest rate.
NOTE : 17 OTHER FINANCIAL ASSETS (CURRENT)
` in Million
As at March 31, 2019
As at March 31, 2018
Interest accrued on investments/balances with banks 164.7 316.0 Security deposits (unsecured, considered good) 105.0 107.1 Derivatives designated as hedges 535.2 - Derivatives not designated as hedges 133.5 700.7 Refund due from government authorities 2,489.8 2,079.4 Others 1,056.7 1,592.3
4,484.9 4,795.5
NOTE : 18 OTHER CURRENT ASSETS
` in Million
As at March 31, 2019
As at March 31, 2018
Export incentives receivable 3,347.8 2,701.0 Prepaid expenses 1,694.8 1,212.2 Advances for supply of goods and services Considered good 3,764.2 6,525.6 Considered doubtful 355.5 328.8 Less : allowance for doubtful (355.5) (328.8)Balances with government authorities* 13,793.3 12,739.2 Others 548.4 311.5
23,148.5 23,489.5 * includes balances of goods and service tax.

Notes to the Consolidated Financial Statementsfor the year ended March 31, 2019
FINANCIAL STATEMENTS
Annual Report 2018-19
197Consolidated
NOTE : 19 EQUITY SHARE CAPITAL
As at March 31, 2019 As at March 31, 2018
Number of shares ` in Million Number of
shares ` in Million
Authorised Equity shares of ` 1 each 5,990,000,000 5,990.0 5,990,000,000 5,990.0 Cumulative preference shares of ` 100 each 100,000 10.0 100,000 10.0
5,990,100,000 6,000.0 5,990,100,000 6,000.0 Issued, subscribed and fully paid up Equity shares of ` 1 each (Refer note 42) 2,399,334,970 2,399.3 2,399,323,180 2,399.3
2,399,334,970 2,399.3 2,399,323,180 2,399.3
NOTE : 20 OTHER EQUITY
` in Million
As at March 31, 2019
As at March 31, 2018
A) Share application money pending allotment - - B) Reserves and surplus Capital reserve 3,681.7 507.5 Securities premium 11,932.9 11,929.1 Debenture redemption reserve - 1,250.0 Share options outstanding account - - Amalgamation reserve 43.8 43.8 Capital redemption reserve 7.5 7.5 Legal reserve 207.5 3.6 General reserve 35,621.0 35,578.0 Retained earnings 333,301.9 319,777.0 C) Items of other comprehensive income (OCI) Debt instrument through other comprehensive income (11.2) (93.9) Equity instrument through other comprehensive income 1,632.9 1,648.6 Foreign currency translation reserve 24,936.7 10,120.1 Effective portion of cash flow hedges 336.6 (29.5)
411,691.3 380,741.8 Refer statement of changes in equity for detailed movement in other equity balances
Nature and purpose of each reserve Capital reserve - During amalgamation / merger / acquisition, the excess of net assets taken, over the consideration paid, if any, is treated as capital reserve.
Securities premium - The amount received in excess of face value of the equity shares is recognised in securities premium. In case of equity-settled share based payment transactions, the difference between fair value on grant date and nominal value of share is accounted as securities premium. It is utilised in accordance with the provisions of the Companies Act, 2013.
Debenture redemption reserve - The Company is required to create a debenture redemption reserve out of the profits which are available for payment of dividend. This reserve has been transferred to retained earning on redemption of debentures.
Share options outstanding account - The fair value of the equity settled share based payment transactions is recognised to share options outstanding account.
Amalgamation reserve - The reserve was created pursuant to scheme of amalgamation in earlier years.
Capital redemption reserve - The Company has recognised capital redemption reserve on buyback of equity shares from its retained earnings. The amount in capital redemption reserve is equal to nominal amount of the equity shares bought back.
Legal reserve - The reserve has been created by an overseas subsidiary in compliance with requirements of local laws.
General reserve: The reserve arises on transfer portion of the net profit pursuant to the earlier provisions of Companies Act, 1956. Mandatory transfer to general reserve is not required
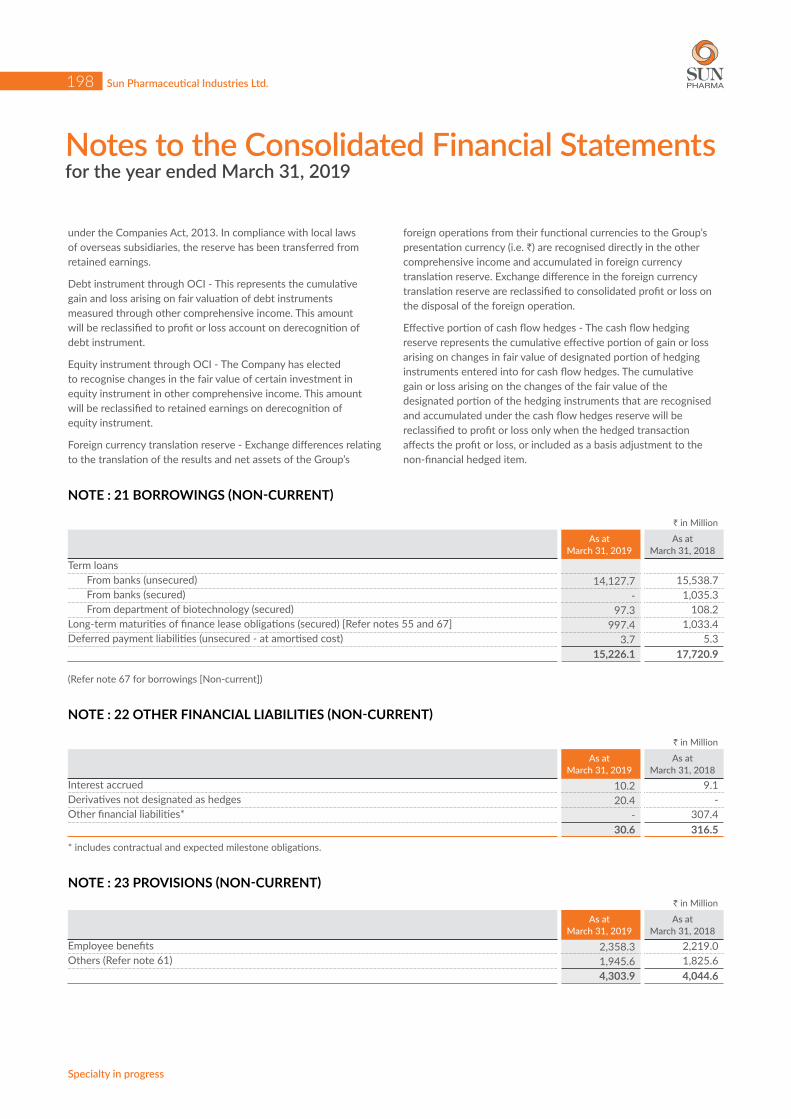
Notes to the Consolidated Financial Statementsfor the year ended March 31, 2019
Sun Pharmaceutical Industries Ltd.
Specialty in progress
198
under the Companies Act, 2013. In compliance with local laws of overseas subsidiaries, the reserve has been transferred from retained earnings.
Debt instrument through OCI - This represents the cumulative gain and loss arising on fair valuation of debt instruments measured through other comprehensive income. This amount will be reclassified to profit or loss account on derecognition of debt instrument.
Equity instrument through OCI - The Company has elected to recognise changes in the fair value of certain investment in equity instrument in other comprehensive income. This amount will be reclassified to retained earnings on derecognition of equity instrument.
Foreign currency translation reserve - Exchange differences relating to the translation of the results and net assets of the Group’s
foreign operations from their functional currencies to the Group’s presentation currency (i.e. `) are recognised directly in the other comprehensive income and accumulated in foreign currency translation reserve. Exchange difference in the foreign currency translation reserve are reclassified to consolidated profit or loss on the disposal of the foreign operation.
Effective portion of cash flow hedges - The cash flow hedging reserve represents the cumulative effective portion of gain or loss arising on changes in fair value of designated portion of hedging instruments entered into for cash flow hedges. The cumulative gain or loss arising on the changes of the fair value of the designated portion of the hedging instruments that are recognised and accumulated under the cash flow hedges reserve will be reclassified to profit or loss only when the hedged transaction affects the profit or loss, or included as a basis adjustment to the non-financial hedged item.
NOTE : 21 BORROWINGS (NON-CURRENT)
` in Million
As at March 31, 2019
As at March 31, 2018
Term loans From banks (unsecured) 14,127.7 15,538.7 From banks (secured) - 1,035.3 From department of biotechnology (secured) 97.3 108.2 Long-term maturities of finance lease obligations (secured) [Refer notes 55 and 67] 997.4 1,033.4 Deferred payment liabilities (unsecured - at amortised cost) 3.7 5.3
15,226.1 17,720.9
(Refer note 67 for borrowings [Non-current])
NOTE : 22 OTHER FINANCIAL LIABILITIES (NON-CURRENT)
` in Million
As at March 31, 2019
As at March 31, 2018
Interest accrued 10.2 9.1 Derivatives not designated as hedges 20.4 - Other financial liabilities* - 307.4
30.6 316.5 * includes contractual and expected milestone obligations.
NOTE : 23 PROVISIONS (NON-CURRENT)` in Million
As at March 31, 2019
As at March 31, 2018
Employee benefits 2,358.3 2,219.0 Others (Refer note 61) 1,945.6 1,825.6
4,303.9 4,044.6
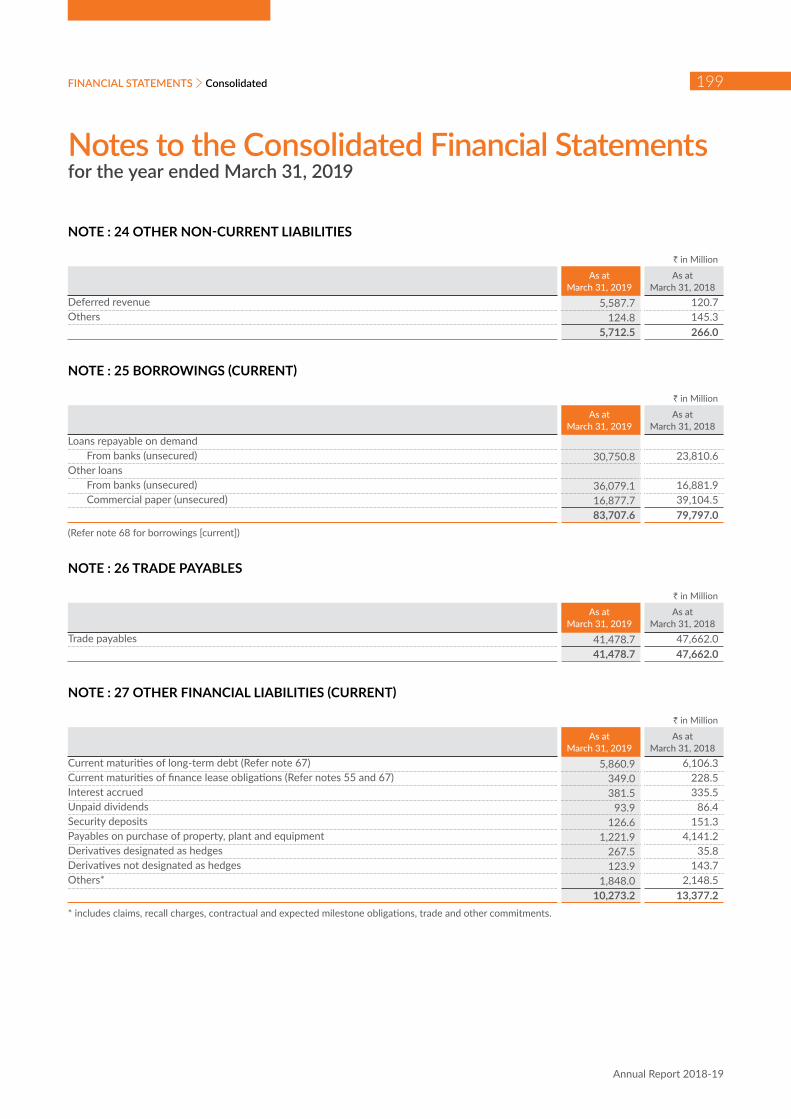
Notes to the Consolidated Financial Statementsfor the year ended March 31, 2019
FINANCIAL STATEMENTS
Annual Report 2018-19
199Consolidated
NOTE : 24 OTHER NON-CURRENT LIABILITIES
` in Million
As at March 31, 2019
As at March 31, 2018
Deferred revenue 5,587.7 120.7 Others 124.8 145.3
5,712.5 266.0
NOTE : 25 BORROWINGS (CURRENT)
` in Million
As at March 31, 2019
As at March 31, 2018
Loans repayable on demand From banks (unsecured) 30,750.8 23,810.6 Other loans From banks (unsecured) 36,079.1 16,881.9 Commercial paper (unsecured) 16,877.7 39,104.5
83,707.6 79,797.0 (Refer note 68 for borrowings [current])
NOTE : 26 TRADE PAYABLES
` in Million
As at March 31, 2019
As at March 31, 2018
Trade payables 41,478.7 47,662.0 41,478.7 47,662.0
NOTE : 27 OTHER FINANCIAL LIABILITIES (CURRENT)
` in Million
As at March 31, 2019
As at March 31, 2018
Current maturities of long-term debt (Refer note 67) 5,860.9 6,106.3 Current maturities of finance lease obligations (Refer notes 55 and 67) 349.0 228.5 Interest accrued 381.5 335.5 Unpaid dividends 93.9 86.4 Security deposits 126.6 151.3 Payables on purchase of property, plant and equipment 1,221.9 4,141.2 Derivatives designated as hedges 267.5 35.8 Derivatives not designated as hedges 123.9 143.7 Others* 1,848.0 2,148.5
10,273.2 13,377.2 * includes claims, recall charges, contractual and expected milestone obligations, trade and other commitments.
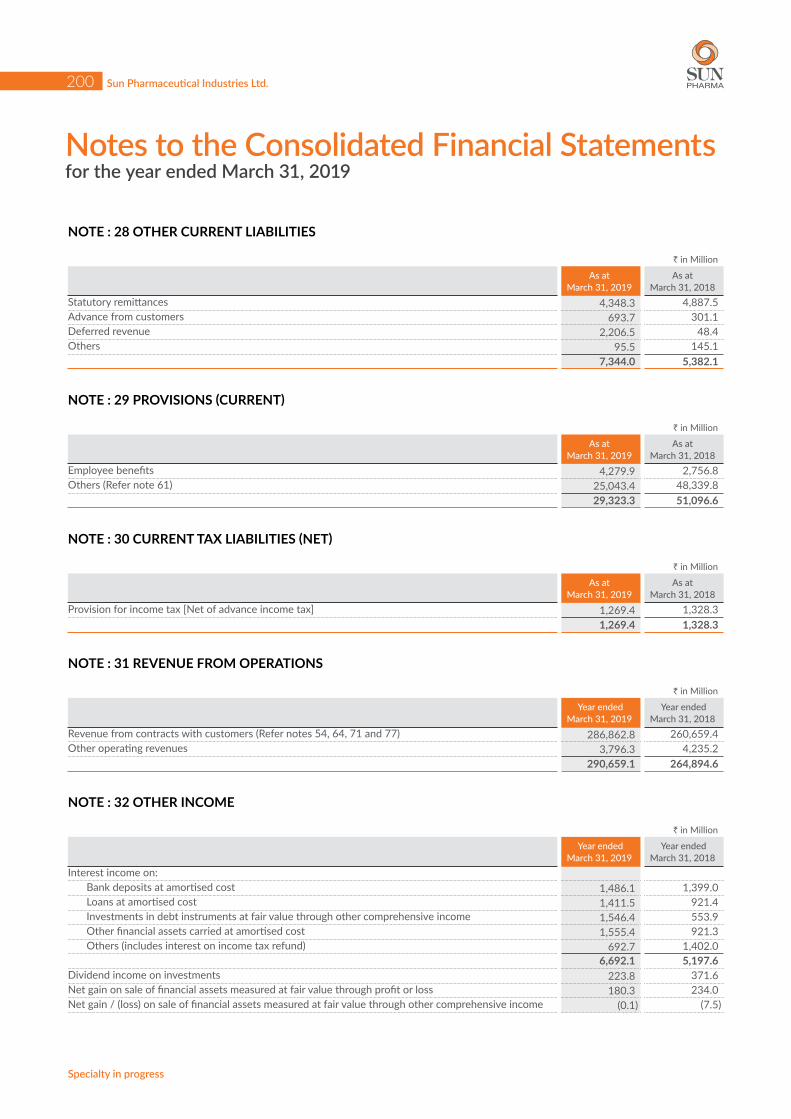
Notes to the Consolidated Financial Statementsfor the year ended March 31, 2019
Sun Pharmaceutical Industries Ltd.
Specialty in progress
200
NOTE : 28 OTHER CURRENT LIABILITIES
` in Million
As at March 31, 2019
As at March 31, 2018
Statutory remittances 4,348.3 4,887.5 Advance from customers 693.7 301.1 Deferred revenue 2,206.5 48.4 Others 95.5 145.1
7,344.0 5,382.1
NOTE : 29 PROVISIONS (CURRENT)
` in Million
As at March 31, 2019
As at March 31, 2018
Employee benefits 4,279.9 2,756.8 Others (Refer note 61) 25,043.4 48,339.8
29,323.3 51,096.6
NOTE : 30 CURRENT TAX LIABILITIES (NET)
` in Million
As at March 31, 2019
As at March 31, 2018
Provision for income tax [Net of advance income tax] 1,269.4 1,328.3 1,269.4 1,328.3
NOTE : 31 REVENUE FROM OPERATIONS
` in Million
Year ended March 31, 2019
Year ended March 31, 2018
Revenue from contracts with customers (Refer notes 54, 64, 71 and 77) 286,862.8 260,659.4 Other operating revenues 3,796.3 4,235.2
290,659.1 264,894.6
NOTE : 32 OTHER INCOME
` in Million
Year ended March 31, 2019
Year ended March 31, 2018
Interest income on:Bank deposits at amortised cost 1,486.1 1,399.0 Loans at amortised cost 1,411.5 921.4 Investments in debt instruments at fair value through other comprehensive income 1,546.4 553.9 Other financial assets carried at amortised cost 1,555.4 921.3 Others (includes interest on income tax refund) 692.7 1,402.0
6,692.1 5,197.6 Dividend income on investments 223.8 371.6 Net gain on sale of financial assets measured at fair value through profit or loss 180.3 234.0 Net gain / (loss) on sale of financial assets measured at fair value through other comprehensive income (0.1) (7.5)

Notes to the Consolidated Financial Statementsfor the year ended March 31, 2019
FINANCIAL STATEMENTS
Annual Report 2018-19
201Consolidated
` in Million
Year ended March 31, 2019
Year ended March 31, 2018
Net gain arising on financial assets measured at fair value through profit or loss 1,433.6 1,236.6 Net gain on disposal of property, plant and equipment and other intangible assets 28.3 31.3 Sundry balances written back, net 64.5 170.6 Insurance claims 156.1 258.6 Lease rental and hire charges 173.1 296.1 Miscellaneous income 1,303.2 598.7
10,254.9 8,387.6
NOTE : 33 COST OF MATERIALS CONSUMED
` in Million
Year ended March 31, 2019
Year ended March 31, 2018
Raw materials and packing materials Inventories at the beginning of the year 24,621.2 21,811.0 Inventories acquired on acquisition (Refer note 76) 340.6 17.5 Purchases during the year 60,339.9 47,327.2 Foreign currency translation difference 363.1 91.5 Inventories at the end of the year (27,837.8) (24,621.2)
57,827.0 44,626.0
NOTE : 34 CHANGES IN INVENTORIES OF FINISHED GOODS, STOCK-IN-TRADE AND WORK-IN-PROGRESS
` in Million
Year ended March 31, 2019
Year ended March 31, 2018
Inventories at the beginning of the year 43,185.8 45,163.0 Inventories acquired on acquisition (Refer note 76) 1,121.8 - Foreign currency translation difference 1,364.2 329.8 Inventories at the end of the year (50,002.9) (43,185.8)
(4,331.1) 2,307.0
NOTE : 35 EMPLOYEE BENEFITS EXPENSE
` in Million
Year ended March 31, 2019
Year ended March 31, 2018
Salaries, wages and bonus 52,699.4 47,082.9 Contribution to provident and other funds* 3,944.7 3,903.7 Share based payments to employees - (1.0)Staff welfare expenses 3,026.8 2,684.9
59,670.9 53,670.5 * includes gratuity expense of ` 372.8 Million (March 31, 2018: ` 450.4 Million)
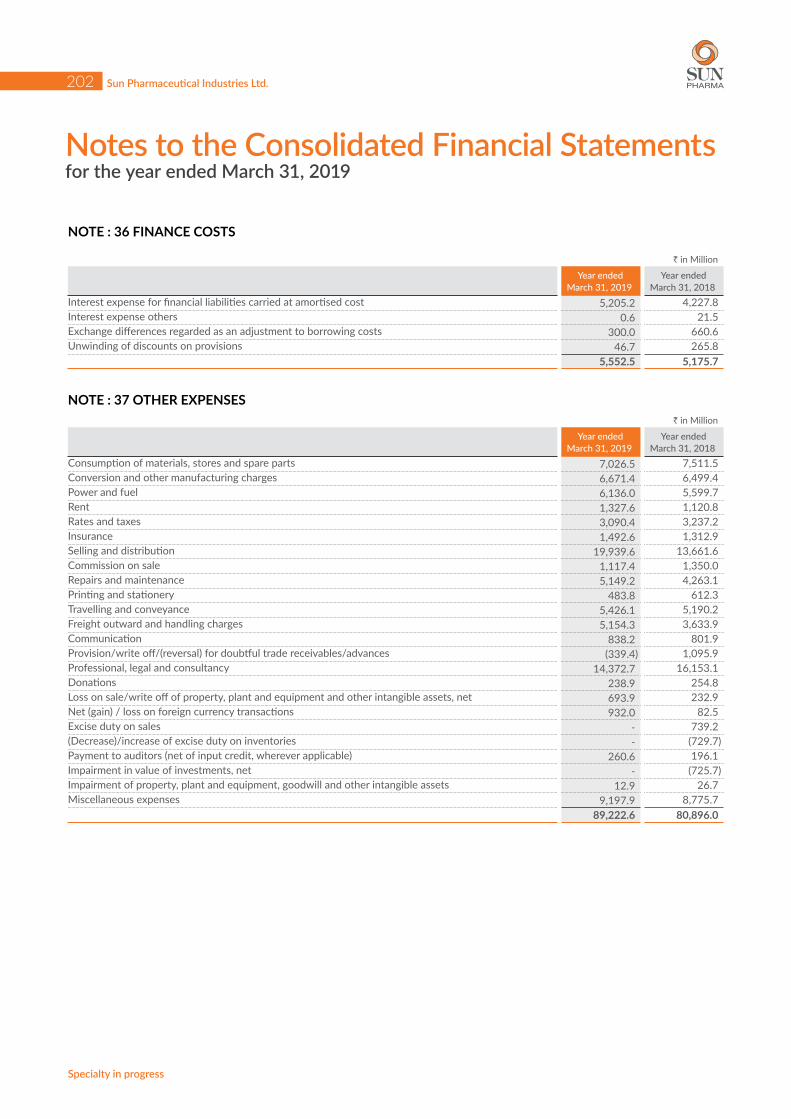
Notes to the Consolidated Financial Statementsfor the year ended March 31, 2019
Sun Pharmaceutical Industries Ltd.
Specialty in progress
202
NOTE : 36 FINANCE COSTS
` in Million
Year ended March 31, 2019
Year ended March 31, 2018
Interest expense for financial liabilities carried at amortised cost 5,205.2 4,227.8 Interest expense others 0.6 21.5 Exchange differences regarded as an adjustment to borrowing costs 300.0 660.6 Unwinding of discounts on provisions 46.7 265.8
5,552.5 5,175.7
NOTE : 37 OTHER EXPENSES` in Million
Year ended March 31, 2019
Year ended March 31, 2018
Consumption of materials, stores and spare parts 7,026.5 7,511.5 Conversion and other manufacturing charges 6,671.4 6,499.4 Power and fuel 6,136.0 5,599.7 Rent 1,327.6 1,120.8 Rates and taxes 3,090.4 3,237.2 Insurance 1,492.6 1,312.9 Selling and distribution 19,939.6 13,661.6 Commission on sale 1,117.4 1,350.0 Repairs and maintenance 5,149.2 4,263.1 Printing and stationery 483.8 612.3 Travelling and conveyance 5,426.1 5,190.2 Freight outward and handling charges 5,154.3 3,633.9 Communication 838.2 801.9 Provision/write off/(reversal) for doubtful trade receivables/advances (339.4) 1,095.9 Professional, legal and consultancy 14,372.7 16,153.1 Donations 238.9 254.8 Loss on sale/write off of property, plant and equipment and other intangible assets, net 693.9 232.9 Net (gain) / loss on foreign currency transactions 932.0 82.5 Excise duty on sales - 739.2 (Decrease)/increase of excise duty on inventories - (729.7)Payment to auditors (net of input credit, wherever applicable) 260.6 196.1 Impairment in value of investments, net - (725.7)Impairment of property, plant and equipment, goodwill and other intangible assets 12.9 26.7 Miscellaneous expenses 9,197.9 8,775.7
89,222.6 80,896.0
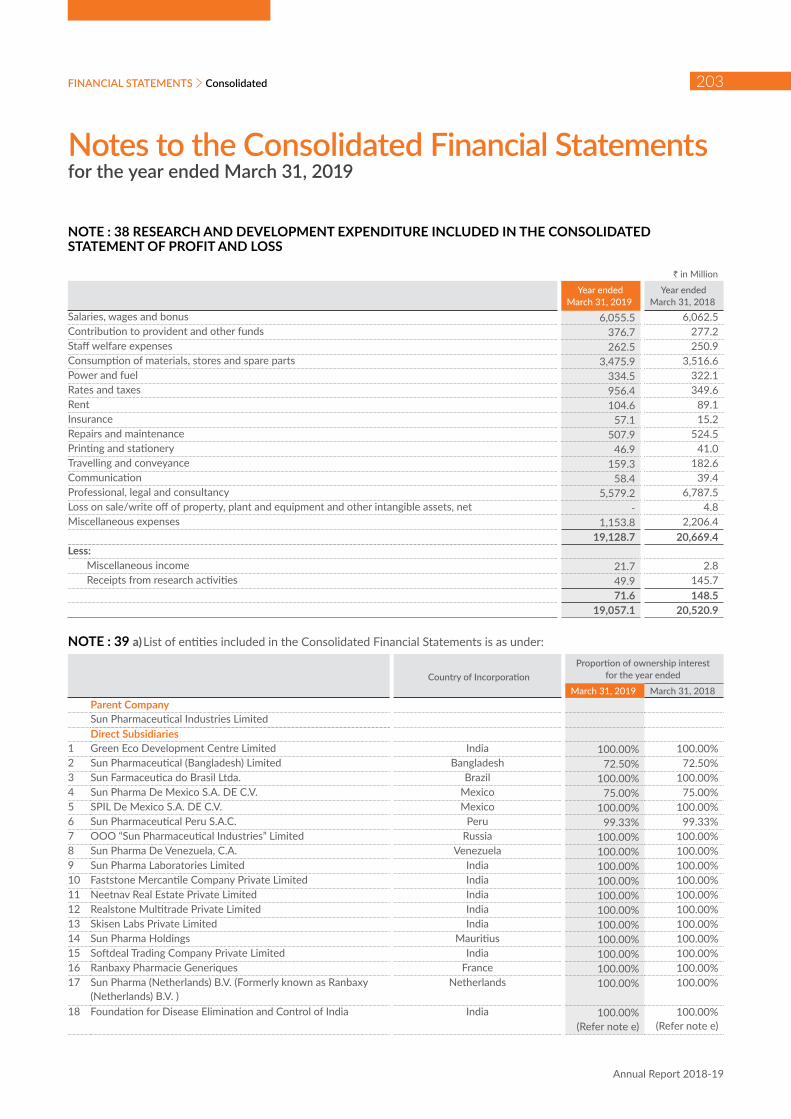
Notes to the Consolidated Financial Statementsfor the year ended March 31, 2019
FINANCIAL STATEMENTS
Annual Report 2018-19
203Consolidated
NOTE : 38 RESEARCH AND DEVELOPMENT EXPENDITURE INCLUDED IN THE CONSOLIDATED STATEMENT OF PROFIT AND LOSS
` in Million
Year ended March 31, 2019
Year ended March 31, 2018
Salaries, wages and bonus 6,055.5 6,062.5 Contribution to provident and other funds 376.7 277.2 Staff welfare expenses 262.5 250.9 Consumption of materials, stores and spare parts 3,475.9 3,516.6 Power and fuel 334.5 322.1 Rates and taxes 956.4 349.6 Rent 104.6 89.1 Insurance 57.1 15.2 Repairs and maintenance 507.9 524.5 Printing and stationery 46.9 41.0 Travelling and conveyance 159.3 182.6 Communication 58.4 39.4 Professional, legal and consultancy 5,579.2 6,787.5 Loss on sale/write off of property, plant and equipment and other intangible assets, net - 4.8 Miscellaneous expenses 1,153.8 2,206.4
19,128.7 20,669.4 Less: Miscellaneous income 21.7 2.8 Receipts from research activities 49.9 145.7
71.6 148.5 19,057.1 20,520.9
NOTE : 39 a) List of entities included in the Consolidated Financial Statements is as under:
Country of IncorporationProportion of ownership interest
for the year ended
March 31, 2019 March 31, 2018Parent CompanySun Pharmaceutical Industries LimitedDirect Subsidiaries
1 Green Eco Development Centre Limited India 100.00% 100.00%2 Sun Pharmaceutical (Bangladesh) Limited Bangladesh 72.50% 72.50%3 Sun Farmaceutica do Brasil Ltda. Brazil 100.00% 100.00%4 Sun Pharma De Mexico S.A. DE C.V. Mexico 75.00% 75.00%5 SPIL De Mexico S.A. DE C.V. Mexico 100.00% 100.00%6 Sun Pharmaceutical Peru S.A.C. Peru 99.33% 99.33%7 OOO “Sun Pharmaceutical Industries” Limited Russia 100.00% 100.00%8 Sun Pharma De Venezuela, C.A. Venezuela 100.00% 100.00%9 Sun Pharma Laboratories Limited India 100.00% 100.00%10 Faststone Mercantile Company Private Limited India 100.00% 100.00%11 Neetnav Real Estate Private Limited India 100.00% 100.00%12 Realstone Multitrade Private Limited India 100.00% 100.00%13 Skisen Labs Private Limited India 100.00% 100.00%14 Sun Pharma Holdings Mauritius 100.00% 100.00%15 Softdeal Trading Company Private Limited India 100.00% 100.00%16 Ranbaxy Pharmacie Generiques France 100.00% 100.00%17 Sun Pharma (Netherlands) B.V. (Formerly known as Ranbaxy
(Netherlands) B.V. )Netherlands 100.00% 100.00%
18 Foundation for Disease Elimination and Control of India India 100.00% (Refer note e)
100.00% (Refer note e)
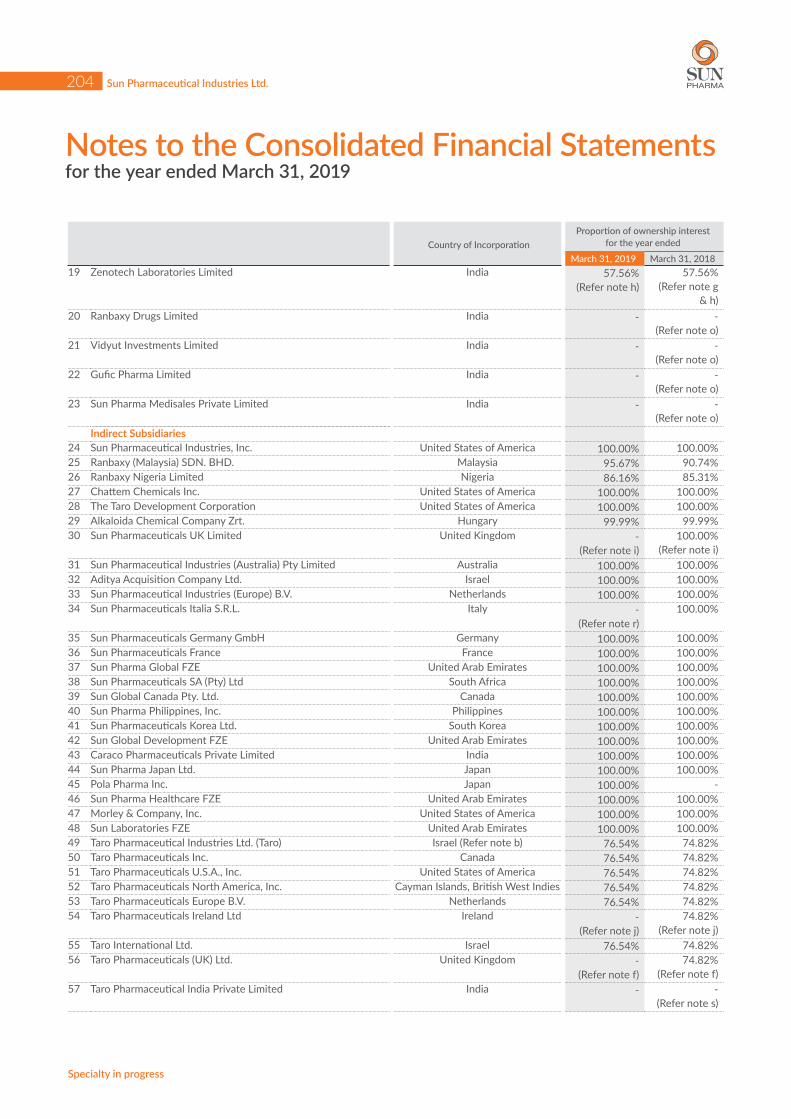
Notes to the Consolidated Financial Statementsfor the year ended March 31, 2019
Sun Pharmaceutical Industries Ltd.
Specialty in progress
204
Country of IncorporationProportion of ownership interest
for the year ended
March 31, 2019 March 31, 201819 Zenotech Laboratories Limited India 57.56%
(Refer note h)57.56%
(Refer note g & h)
20 Ranbaxy Drugs Limited India - - (Refer note o)
21 Vidyut Investments Limited India - - (Refer note o)
22 Gufic Pharma Limited India - - (Refer note o)
23 Sun Pharma Medisales Private Limited India - - (Refer note o)
Indirect Subsidiaries24 Sun Pharmaceutical Industries, Inc. United States of America 100.00% 100.00%25 Ranbaxy (Malaysia) SDN. BHD. Malaysia 95.67% 90.74%26 Ranbaxy Nigeria Limited Nigeria 86.16% 85.31%27 Chattem Chemicals Inc. United States of America 100.00% 100.00%28 The Taro Development Corporation United States of America 100.00% 100.00%29 Alkaloida Chemical Company Zrt. Hungary 99.99% 99.99%30 Sun Pharmaceuticals UK Limited United Kingdom -
(Refer note i)100.00%
(Refer note i)31 Sun Pharmaceutical Industries (Australia) Pty Limited Australia 100.00% 100.00%32 Aditya Acquisition Company Ltd. Israel 100.00% 100.00%33 Sun Pharmaceutical Industries (Europe) B.V. Netherlands 100.00% 100.00%34 Sun Pharmaceuticals Italia S.R.L. Italy -
(Refer note r)100.00%
35 Sun Pharmaceuticals Germany GmbH Germany 100.00% 100.00%36 Sun Pharmaceuticals France France 100.00% 100.00%37 Sun Pharma Global FZE United Arab Emirates 100.00% 100.00%38 Sun Pharmaceuticals SA (Pty) Ltd South Africa 100.00% 100.00%39 Sun Global Canada Pty. Ltd. Canada 100.00% 100.00%40 Sun Pharma Philippines, Inc. Philippines 100.00% 100.00%41 Sun Pharmaceuticals Korea Ltd. South Korea 100.00% 100.00%42 Sun Global Development FZE United Arab Emirates 100.00% 100.00%43 Caraco Pharmaceuticals Private Limited India 100.00% 100.00%44 Sun Pharma Japan Ltd. Japan 100.00% 100.00%45 Pola Pharma Inc. Japan 100.00% -46 Sun Pharma Healthcare FZE United Arab Emirates 100.00% 100.00%47 Morley & Company, Inc. United States of America 100.00% 100.00%48 Sun Laboratories FZE United Arab Emirates 100.00% 100.00%49 Taro Pharmaceutical Industries Ltd. (Taro) Israel (Refer note b) 76.54% 74.82%50 Taro Pharmaceuticals Inc. Canada 76.54% 74.82%51 Taro Pharmaceuticals U.S.A., Inc. United States of America 76.54% 74.82%52 Taro Pharmaceuticals North America, Inc. Cayman Islands, British West Indies 76.54% 74.82%53 Taro Pharmaceuticals Europe B.V. Netherlands 76.54% 74.82%54 Taro Pharmaceuticals Ireland Ltd Ireland -
(Refer note j)74.82%
(Refer note j)55 Taro International Ltd. Israel 76.54% 74.82%56 Taro Pharmaceuticals (UK) Ltd. United Kingdom -
(Refer note f)74.82%
(Refer note f)57 Taro Pharmaceutical India Private Limited India - -
(Refer note s)
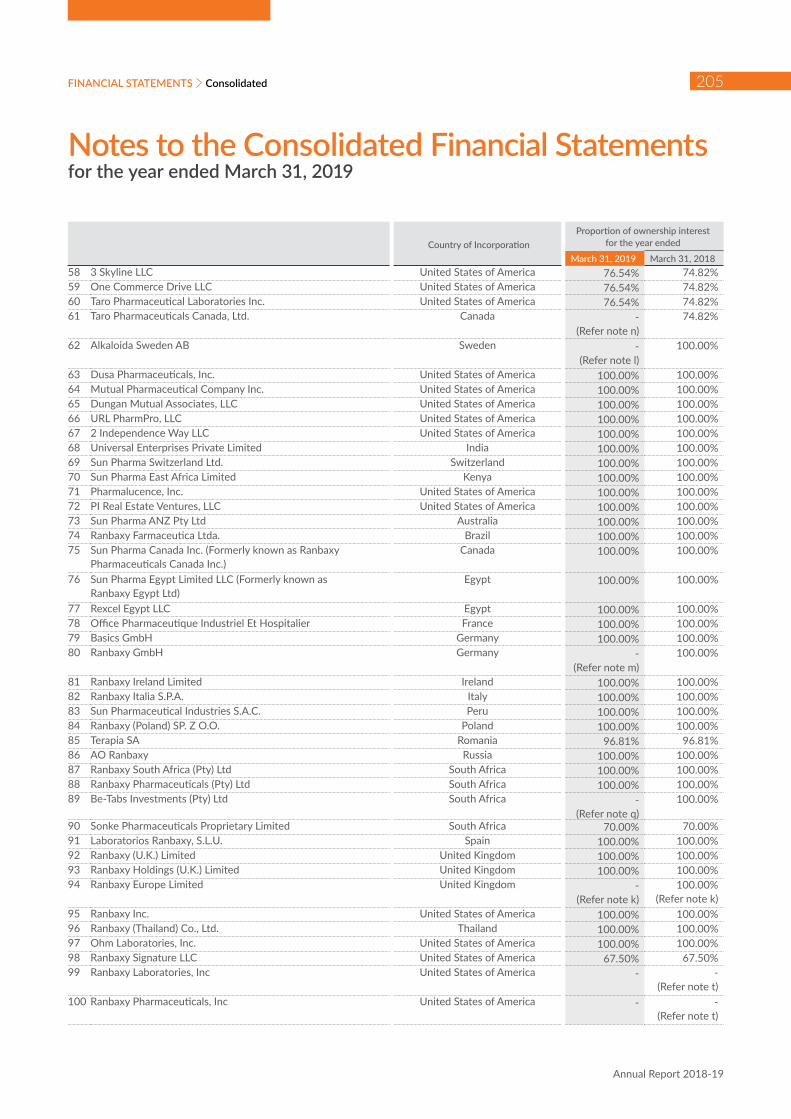
Notes to the Consolidated Financial Statementsfor the year ended March 31, 2019
FINANCIAL STATEMENTS
Annual Report 2018-19
205Consolidated
Country of IncorporationProportion of ownership interest
for the year ended
March 31, 2019 March 31, 201858 3 Skyline LLC United States of America 76.54% 74.82%59 One Commerce Drive LLC United States of America 76.54% 74.82%60 Taro Pharmaceutical Laboratories Inc. United States of America 76.54% 74.82%61 Taro Pharmaceuticals Canada, Ltd. Canada -
(Refer note n)74.82%
62 Alkaloida Sweden AB Sweden - (Refer note l)
100.00%
63 Dusa Pharmaceuticals, Inc. United States of America 100.00% 100.00%64 Mutual Pharmaceutical Company Inc. United States of America 100.00% 100.00%65 Dungan Mutual Associates, LLC United States of America 100.00% 100.00%66 URL PharmPro, LLC United States of America 100.00% 100.00%67 2 Independence Way LLC United States of America 100.00% 100.00%68 Universal Enterprises Private Limited India 100.00% 100.00%69 Sun Pharma Switzerland Ltd. Switzerland 100.00% 100.00%70 Sun Pharma East Africa Limited Kenya 100.00% 100.00%71 Pharmalucence, Inc. United States of America 100.00% 100.00%72 PI Real Estate Ventures, LLC United States of America 100.00% 100.00%73 Sun Pharma ANZ Pty Ltd Australia 100.00% 100.00%74 Ranbaxy Farmaceutica Ltda. Brazil 100.00% 100.00%75 Sun Pharma Canada Inc. (Formerly known as Ranbaxy
Pharmaceuticals Canada Inc.)Canada 100.00% 100.00%
76 Sun Pharma Egypt Limited LLC (Formerly known as Ranbaxy Egypt Ltd)
Egypt 100.00% 100.00%
77 Rexcel Egypt LLC Egypt 100.00% 100.00%78 Office Pharmaceutique Industriel Et Hospitalier France 100.00% 100.00%79 Basics GmbH Germany 100.00% 100.00%80 Ranbaxy GmbH Germany -
(Refer note m)100.00%
81 Ranbaxy Ireland Limited Ireland 100.00% 100.00%82 Ranbaxy Italia S.P.A. Italy 100.00% 100.00%83 Sun Pharmaceutical Industries S.A.C. Peru 100.00% 100.00%84 Ranbaxy (Poland) SP. Z O.O. Poland 100.00% 100.00%85 Terapia SA Romania 96.81% 96.81%86 AO Ranbaxy Russia 100.00% 100.00%87 Ranbaxy South Africa (Pty) Ltd South Africa 100.00% 100.00%88 Ranbaxy Pharmaceuticals (Pty) Ltd South Africa 100.00% 100.00%89 Be-Tabs Investments (Pty) Ltd South Africa -
(Refer note q)100.00%
90 Sonke Pharmaceuticals Proprietary Limited South Africa 70.00% 70.00%91 Laboratorios Ranbaxy, S.L.U. Spain 100.00% 100.00%92 Ranbaxy (U.K.) Limited United Kingdom 100.00% 100.00%93 Ranbaxy Holdings (U.K.) Limited United Kingdom 100.00% 100.00%94 Ranbaxy Europe Limited United Kingdom -
(Refer note k)100.00%
(Refer note k)95 Ranbaxy Inc. United States of America 100.00% 100.00%96 Ranbaxy (Thailand) Co., Ltd. Thailand 100.00% 100.00%97 Ohm Laboratories, Inc. United States of America 100.00% 100.00%98 Ranbaxy Signature LLC United States of America 67.50% 67.50%99 Ranbaxy Laboratories, Inc United States of America - -
(Refer note t)100 Ranbaxy Pharmaceuticals, Inc United States of America - -
(Refer note t)

Notes to the Consolidated Financial Statementsfor the year ended March 31, 2019
Sun Pharmaceutical Industries Ltd.
Specialty in progress
206
Country of IncorporationProportion of ownership interest
for the year ended
March 31, 2019 March 31, 2018101 Sun Pharmaceuticals Morocco LLC Morocco 100.00% 100.00%102 “Ranbaxy Pharmaceuticals Ukraine” LLC Ukraine 100.00% 100.00%103 Insite Vision Incorporated United States of America 100.00% 100.00%104 Insite Vision Ltd. United Kingdom - -
(Refer note u)105 Ocular Technologies SARL Switzerland - -
(Refer note v)106 Sun Pharmaceutical Medicare Limited India 100.00% 100.00%107 JSC Biosintez Russia 96.96% 85.10%108 Sun Pharmaceuticals Holdings USA, Inc. United States of America 100.00% 100.00%109 Zenotech Laboratories Nigeria Limited Nigeria 57.50%
(Refer note h)57.50%
(Refer note h)110 Zenotech Inc United States of America 57.56%
(Refer note h)57.56%
(Refer note h)111 Zenotech Farmaceutica Do Brasil Ltda Brazil 38.21%
(Refer note h)38.21%
(Refer note h)112 Kayaku Co., Ltd. Japan 100.00% -113 Sun Pharma Distributors Limited India 100.00% -
Name of Joint Venture Entities114 Artes Biotechnology GmbH Germany 45.00% 45.00%115 MSD - Sun LLC United States of America - -
(Refer note w)116 S & I Ophthalmic LLC United States of America - -
(Refer note x)Name of Associates
117 Medinstill LLC United States of America 19.99% 19.99%118 Generic Solar Power LLP India 28.76% 28.76%119 scPharmaceuticals Inc. United States of America -
(Refer note p)11.69%
120 Trumpcard Advisors and Finvest LLP India 40.61% 40.61%121 Tarsius Pharma Ltd. Israel 18.33% -122 Zenotech Laboratories Limited India - -
(Refer note g)Name of Subsidiary of Associates
123 Composite Power Generation LLP India 36.90% 36.90%124 Vintage Power Generation LLP India 39.41% 39.41%125 Vento Power Generation LLP India 40.55% 40.55%126 HRE LLC United States of America 19.99% 19.99%127 HRE II LLC United States of America 19.99% 19.99%128 HRE III LLC United States of America 19.99% 19.99%129 Dr. Py Institute LLC United States of America 19.99% 19.99%130 Medinstill Development LLC United States of America 19.99% 19.99%131 ALPS LLC United States of America 19.99% 19.99%132 Intact Pharmaceuticals LLC United States of America 19.99% 19.99%133 Intact Media LLC (Formerly known as Intact Skin Care LLC) United States of America 19.99% 19.99%
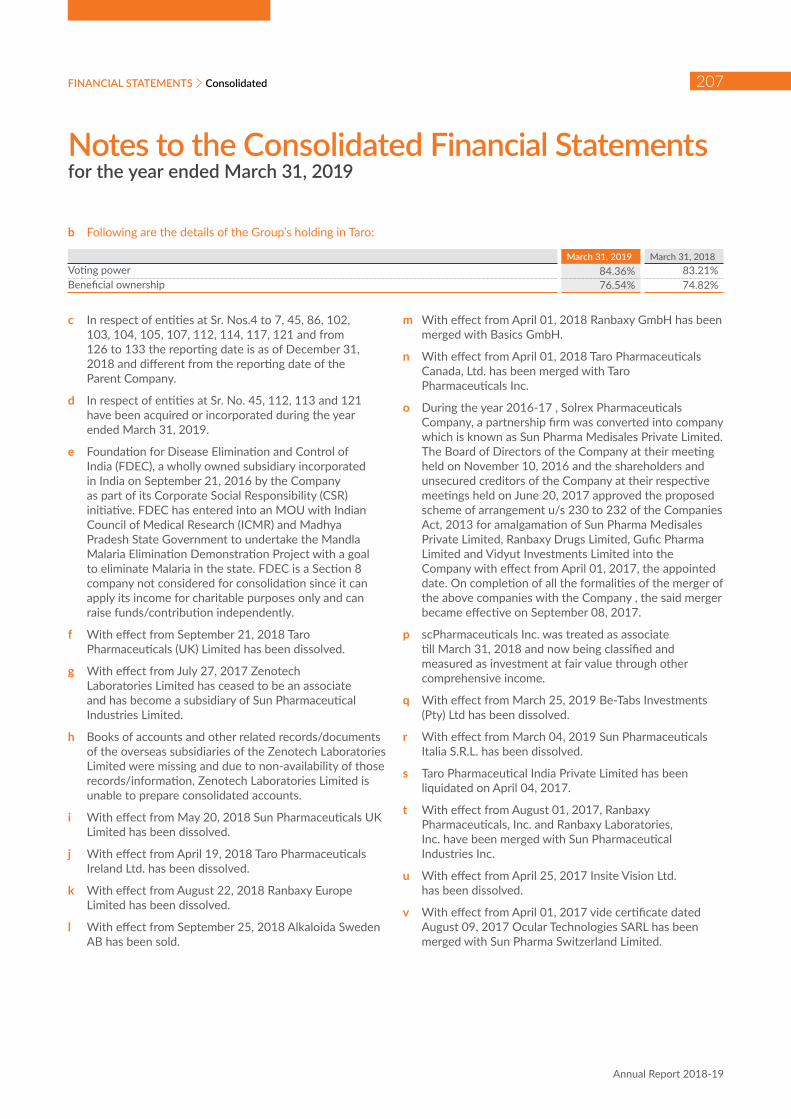
Notes to the Consolidated Financial Statementsfor the year ended March 31, 2019
FINANCIAL STATEMENTS
Annual Report 2018-19
207Consolidated
b Following are the details of the Group’s holding in Taro:
March 31, 2019 March 31, 2018 Voting power 84.36% 83.21%Beneficial ownership 76.54% 74.82%
c In respect of entities at Sr. Nos.4 to 7, 45, 86, 102, 103, 104, 105, 107, 112, 114, 117, 121 and from 126 to 133 the reporting date is as of December 31, 2018 and different from the reporting date of the Parent Company.
d In respect of entities at Sr. No. 45, 112, 113 and 121 have been acquired or incorporated during the year ended March 31, 2019.
e Foundation for Disease Elimination and Control of India (FDEC), a wholly owned subsidiary incorporated in India on September 21, 2016 by the Company as part of its Corporate Social Responsibility (CSR) initiative. FDEC has entered into an MOU with Indian Council of Medical Research (ICMR) and Madhya Pradesh State Government to undertake the Mandla Malaria Elimination Demonstration Project with a goal to eliminate Malaria in the state. FDEC is a Section 8 company not considered for consolidation since it can apply its income for charitable purposes only and can raise funds/contribution independently.
f With effect from September 21, 2018 Taro Pharmaceuticals (UK) Limited has been dissolved.
g With effect from July 27, 2017 Zenotech Laboratories Limited has ceased to be an associate and has become a subsidiary of Sun Pharmaceutical Industries Limited.
h Books of accounts and other related records/documents of the overseas subsidiaries of the Zenotech Laboratories Limited were missing and due to non-availability of those records/information, Zenotech Laboratories Limited is unable to prepare consolidated accounts.
i With effect from May 20, 2018 Sun Pharmaceuticals UK Limited has been dissolved.
j With effect from April 19, 2018 Taro Pharmaceuticals Ireland Ltd. has been dissolved.
k With effect from August 22, 2018 Ranbaxy Europe Limited has been dissolved.
l With effect from September 25, 2018 Alkaloida Sweden AB has been sold.
m With effect from April 01, 2018 Ranbaxy GmbH has been merged with Basics GmbH.
n With effect from April 01, 2018 Taro Pharmaceuticals Canada, Ltd. has been merged with Taro Pharmaceuticals Inc.
o During the year 2016-17 , Solrex Pharmaceuticals Company, a partnership firm was converted into company which is known as Sun Pharma Medisales Private Limited. The Board of Directors of the Company at their meeting held on November 10, 2016 and the shareholders and unsecured creditors of the Company at their respective meetings held on June 20, 2017 approved the proposed scheme of arrangement u/s 230 to 232 of the Companies Act, 2013 for amalgamation of Sun Pharma Medisales Private Limited, Ranbaxy Drugs Limited, Gufic Pharma Limited and Vidyut Investments Limited into the Company with effect from April 01, 2017, the appointed date. On completion of all the formalities of the merger of the above companies with the Company , the said merger became effective on September 08, 2017.
p scPharmaceuticals Inc. was treated as associate till March 31, 2018 and now being classified and measured as investment at fair value through other comprehensive income.
q With effect from March 25, 2019 Be-Tabs Investments (Pty) Ltd has been dissolved.
r With effect from March 04, 2019 Sun Pharmaceuticals Italia S.R.L. has been dissolved.
s Taro Pharmaceutical India Private Limited has been liquidated on April 04, 2017.
t With effect from August 01, 2017, Ranbaxy Pharmaceuticals, Inc. and Ranbaxy Laboratories, Inc. have been merged with Sun Pharmaceutical Industries Inc.
u With effect from April 25, 2017 Insite Vision Ltd. has been dissolved.
v With effect from April 01, 2017 vide certificate dated August 09, 2017 Ocular Technologies SARL has been merged with Sun Pharma Switzerland Limited.
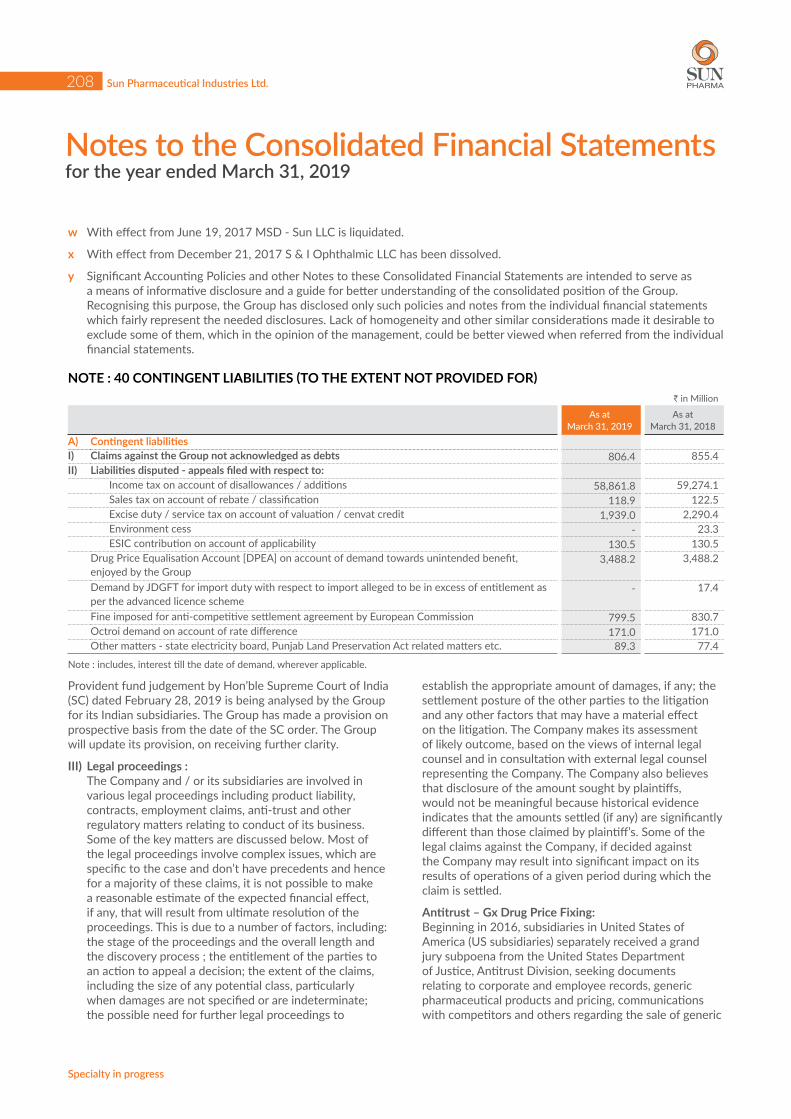
Notes to the Consolidated Financial Statementsfor the year ended March 31, 2019
Sun Pharmaceutical Industries Ltd.
Specialty in progress
208
w With effect from June 19, 2017 MSD - Sun LLC is liquidated.
x With effect from December 21, 2017 S & I Ophthalmic LLC has been dissolved.
y Significant Accounting Policies and other Notes to these Consolidated Financial Statements are intended to serve as a means of informative disclosure and a guide for better understanding of the consolidated position of the Group. Recognising this purpose, the Group has disclosed only such policies and notes from the individual financial statements which fairly represent the needed disclosures. Lack of homogeneity and other similar considerations made it desirable to exclude some of them, which in the opinion of the management, could be better viewed when referred from the individual financial statements.
NOTE : 40 CONTINGENT LIABILITIES (TO THE EXTENT NOT PROVIDED FOR)` in Million
As at March 31, 2019
As at March 31, 2018
A) Contingent liabilities I) Claims against the Group not acknowledged as debts 806.4 855.4 II) Liabilities disputed - appeals filed with respect to:
Income tax on account of disallowances / additions 58,861.8 59,274.1 Sales tax on account of rebate / classification 118.9 122.5 Excise duty / service tax on account of valuation / cenvat credit 1,939.0 2,290.4 Environment cess - 23.3 ESIC contribution on account of applicability 130.5 130.5
Drug Price Equalisation Account [DPEA] on account of demand towards unintended benefit, enjoyed by the Group
3,488.2 3,488.2
Demand by JDGFT for import duty with respect to import alleged to be in excess of entitlement as per the advanced licence scheme
- 17.4
Fine imposed for anti-competitive settlement agreement by European Commission 799.5 830.7 Octroi demand on account of rate difference 171.0 171.0 Other matters - state electricity board, Punjab Land Preservation Act related matters etc. 89.3 77.4
Note : includes, interest till the date of demand, wherever applicable.
Provident fund judgement by Hon’ble Supreme Court of India (SC) dated February 28, 2019 is being analysed by the Group for its Indian subsidiaries. The Group has made a provision on prospective basis from the date of the SC order. The Group will update its provision, on receiving further clarity.
III) Legal proceedings : The Company and / or its subsidiaries are involved in
various legal proceedings including product liability, contracts, employment claims, anti-trust and other regulatory matters relating to conduct of its business. Some of the key matters are discussed below. Most of the legal proceedings involve complex issues, which are specific to the case and don’t have precedents and hence for a majority of these claims, it is not possible to make a reasonable estimate of the expected financial effect, if any, that will result from ultimate resolution of the proceedings. This is due to a number of factors, including: the stage of the proceedings and the overall length and the discovery process ; the entitlement of the parties to an action to appeal a decision; the extent of the claims, including the size of any potential class, particularly when damages are not specified or are indeterminate; the possible need for further legal proceedings to
establish the appropriate amount of damages, if any; the settlement posture of the other parties to the litigation and any other factors that may have a material effect on the litigation. The Company makes its assessment of likely outcome, based on the views of internal legal counsel and in consultation with external legal counsel representing the Company. The Company also believes that disclosure of the amount sought by plaintiffs, would not be meaningful because historical evidence indicates that the amounts settled (if any) are significantly different than those claimed by plaintiff’s. Some of the legal claims against the Company, if decided against the Company may result into significant impact on its results of operations of a given period during which the claim is settled.
Antitrust – Gx Drug Price Fixing: Beginning in 2016, subsidiaries in United States of
America (US subsidiaries) separately received a grand jury subpoena from the United States Department of Justice, Antitrust Division, seeking documents relating to corporate and employee records, generic pharmaceutical products and pricing, communications with competitors and others regarding the sale of generic
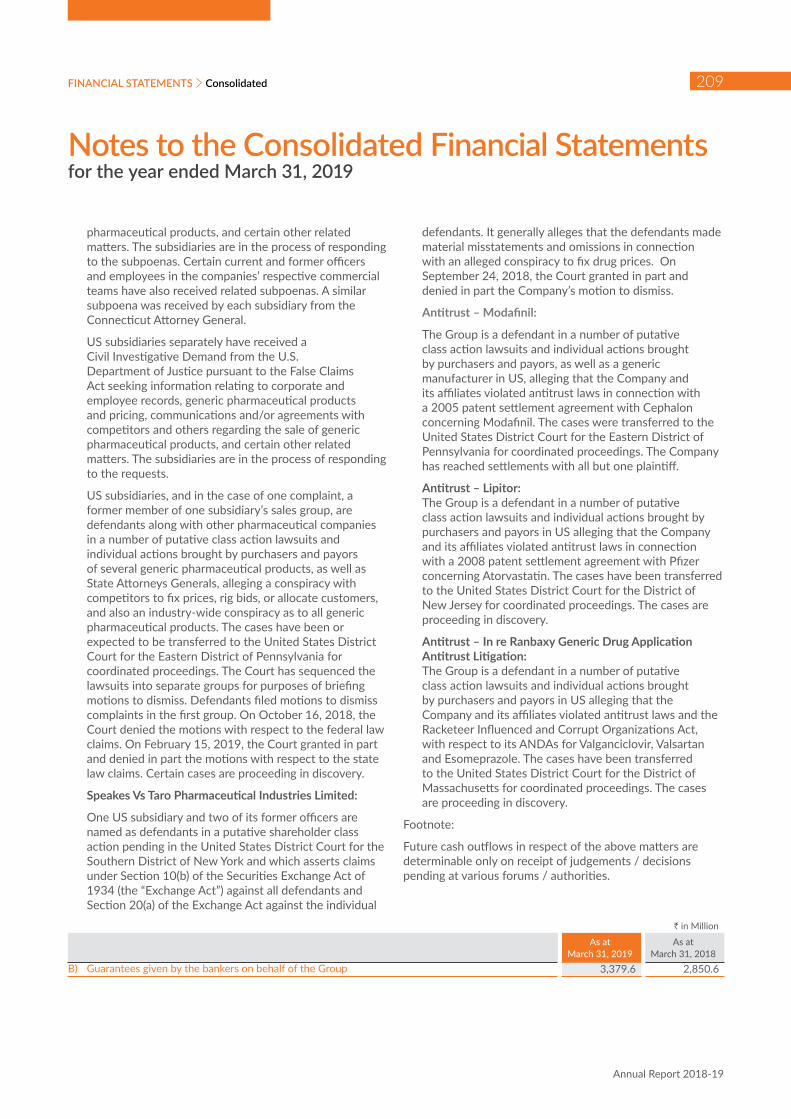
Notes to the Consolidated Financial Statementsfor the year ended March 31, 2019
FINANCIAL STATEMENTS
Annual Report 2018-19
209Consolidated
pharmaceutical products, and certain other related matters. The subsidiaries are in the process of responding to the subpoenas. Certain current and former officers and employees in the companies’ respective commercial teams have also received related subpoenas. A similar subpoena was received by each subsidiary from the Connecticut Attorney General.
US subsidiaries separately have received a Civil Investigative Demand from the U.S. Department of Justice pursuant to the False Claims Act seeking information relating to corporate and employee records, generic pharmaceutical products and pricing, communications and/or agreements with competitors and others regarding the sale of generic pharmaceutical products, and certain other related matters. The subsidiaries are in the process of responding to the requests.
US subsidiaries, and in the case of one complaint, a former member of one subsidiary’s sales group, are defendants along with other pharmaceutical companies in a number of putative class action lawsuits and individual actions brought by purchasers and payors of several generic pharmaceutical products, as well as State Attorneys Generals, alleging a conspiracy with competitors to fix prices, rig bids, or allocate customers, and also an industry-wide conspiracy as to all generic pharmaceutical products. The cases have been or expected to be transferred to the United States District Court for the Eastern District of Pennsylvania for coordinated proceedings. The Court has sequenced the lawsuits into separate groups for purposes of briefing motions to dismiss. Defendants filed motions to dismiss complaints in the first group. On October 16, 2018, the Court denied the motions with respect to the federal law claims. On February 15, 2019, the Court granted in part and denied in part the motions with respect to the state law claims. Certain cases are proceeding in discovery.
Speakes Vs Taro Pharmaceutical Industries Limited:
One US subsidiary and two of its former officers are named as defendants in a putative shareholder class action pending in the United States District Court for the Southern District of New York and which asserts claims under Section 10(b) of the Securities Exchange Act of 1934 (the “Exchange Act”) against all defendants and Section 20(a) of the Exchange Act against the individual
defendants. It generally alleges that the defendants made material misstatements and omissions in connection with an alleged conspiracy to fix drug prices. On September 24, 2018, the Court granted in part and denied in part the Company’s motion to dismiss.
Antitrust – Modafinil:
The Group is a defendant in a number of putative class action lawsuits and individual actions brought by purchasers and payors, as well as a generic manufacturer in US, alleging that the Company and its affiliates violated antitrust laws in connection with a 2005 patent settlement agreement with Cephalon concerning Modafinil. The cases were transferred to the United States District Court for the Eastern District of Pennsylvania for coordinated proceedings. The Company has reached settlements with all but one plaintiff.
Antitrust – Lipitor: The Group is a defendant in a number of putative
class action lawsuits and individual actions brought by purchasers and payors in US alleging that the Company and its affiliates violated antitrust laws in connection with a 2008 patent settlement agreement with Pfizer concerning Atorvastatin. The cases have been transferred to the United States District Court for the District of New Jersey for coordinated proceedings. The cases are proceeding in discovery.
Antitrust – In re Ranbaxy Generic Drug Application Antitrust Litigation:
The Group is a defendant in a number of putative class action lawsuits and individual actions brought by purchasers and payors in US alleging that the Company and its affiliates violated antitrust laws and the Racketeer Influenced and Corrupt Organizations Act, with respect to its ANDAs for Valganciclovir, Valsartan and Esomeprazole. The cases have been transferred to the United States District Court for the District of Massachusetts for coordinated proceedings. The cases are proceeding in discovery.
Footnote:
Future cash outflows in respect of the above matters are determinable only on receipt of judgements / decisions pending at various forums / authorities.
` in Million
As at March 31, 2019
As at March 31, 2018
B) Guarantees given by the bankers on behalf of the Group 3,379.6 2,850.6
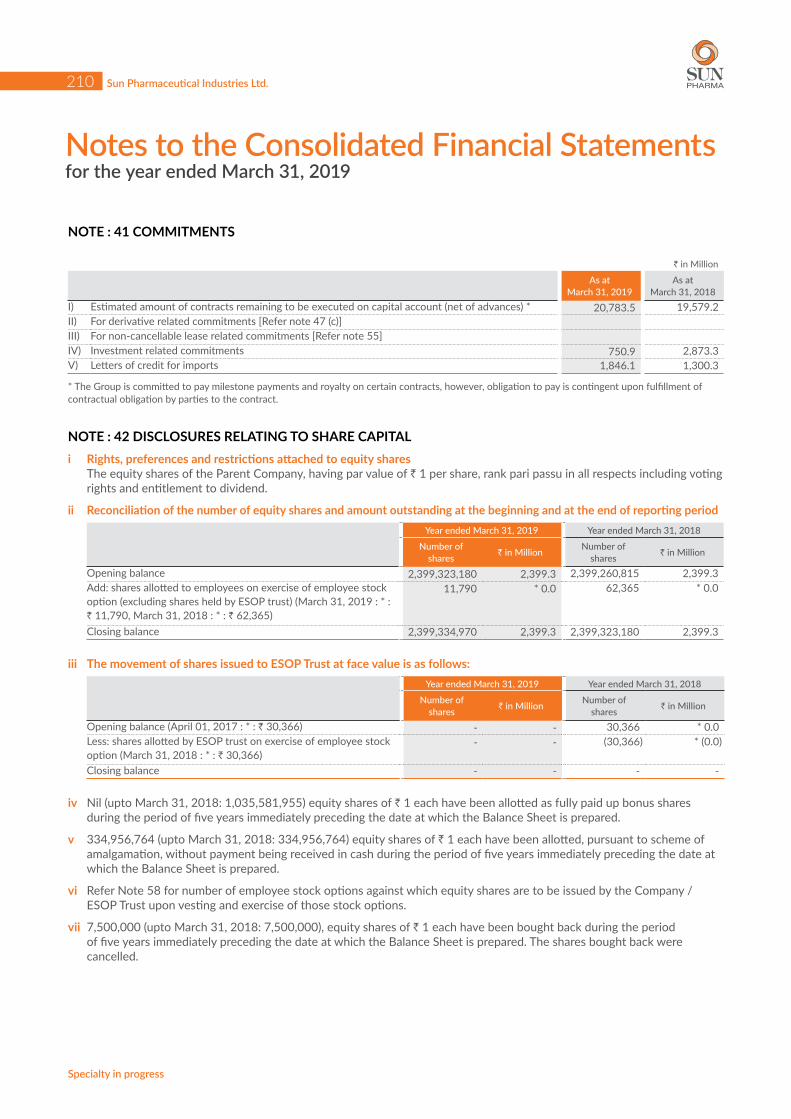
Notes to the Consolidated Financial Statementsfor the year ended March 31, 2019
Sun Pharmaceutical Industries Ltd.
Specialty in progress
210
NOTE : 41 COMMITMENTS
` in Million
As at March 31, 2019
As at March 31, 2018
I) Estimated amount of contracts remaining to be executed on capital account (net of advances) * 20,783.5 19,579.2 II) For derivative related commitments [Refer note 47 (c)]III) For non-cancellable lease related commitments [Refer note 55]IV) Investment related commitments 750.9 2,873.3 V) Letters of credit for imports 1,846.1 1,300.3
* The Group is committed to pay milestone payments and royalty on certain contracts, however, obligation to pay is contingent upon fulfillment of contractual obligation by parties to the contract.
NOTE : 42 DISCLOSURES RELATING TO SHARE CAPITALi Rights, preferences and restrictions attached to equity shares The equity shares of the Parent Company, having par value of ` 1 per share, rank pari passu in all respects including voting
rights and entitlement to dividend.
ii Reconciliation of the number of equity shares and amount outstanding at the beginning and at the end of reporting period Year ended March 31, 2019 Year ended March 31, 2018
Number of shares ` in Million Number of
shares ` in Million
Opening balance 2,399,323,180 2,399.3 2,399,260,815 2,399.3 Add: shares allotted to employees on exercise of employee stock option (excluding shares held by ESOP trust) (March 31, 2019 : * : ` 11,790, March 31, 2018 : * : ` 62,365)
11,790 * 0.0 62,365 * 0.0
Closing balance 2,399,334,970 2,399.3 2,399,323,180 2,399.3
iii The movement of shares issued to ESOP Trust at face value is as follows: Year ended March 31, 2019 Year ended March 31, 2018
Number of shares ` in Million Number of
shares ` in Million
Opening balance (April 01, 2017 : * : ` 30,366) - - 30,366 * 0.0 Less: shares allotted by ESOP trust on exercise of employee stock option (March 31, 2018 : * : ` 30,366)
- - (30,366) * (0.0)
Closing balance - - - -
iv Nil (upto March 31, 2018: 1,035,581,955) equity shares of ` 1 each have been allotted as fully paid up bonus shares during the period of five years immediately preceding the date at which the Balance Sheet is prepared.
v 334,956,764 (upto March 31, 2018: 334,956,764) equity shares of ` 1 each have been allotted, pursuant to scheme of amalgamation, without payment being received in cash during the period of five years immediately preceding the date at which the Balance Sheet is prepared.
vi Refer Note 58 for number of employee stock options against which equity shares are to be issued by the Company / ESOP Trust upon vesting and exercise of those stock options.
vii 7,500,000 (upto March 31, 2018: 7,500,000), equity shares of ` 1 each have been bought back during the period of five years immediately preceding the date at which the Balance Sheet is prepared. The shares bought back were cancelled.
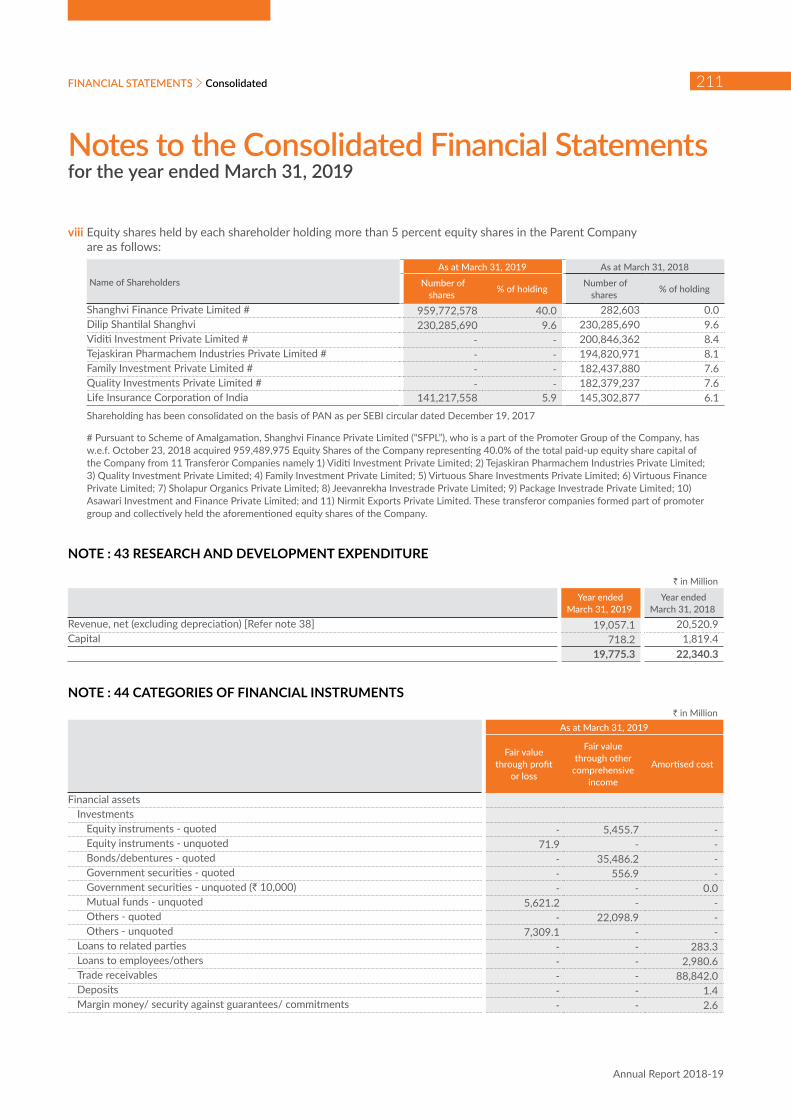
Notes to the Consolidated Financial Statementsfor the year ended March 31, 2019
FINANCIAL STATEMENTS
Annual Report 2018-19
211Consolidated
viii Equity shares held by each shareholder holding more than 5 percent equity shares in the Parent Company are as follows:
Name of Shareholders As at March 31, 2019 As at March 31, 2018
Number of shares % of holding Number of
shares % of holding
Shanghvi Finance Private Limited # 959,772,578 40.0 282,603 0.0 Dilip Shantilal Shanghvi 230,285,690 9.6 230,285,690 9.6 Viditi Investment Private Limited # - - 200,846,362 8.4 Tejaskiran Pharmachem Industries Private Limited # - - 194,820,971 8.1 Family Investment Private Limited # - - 182,437,880 7.6 Quality Investments Private Limited # - - 182,379,237 7.6 Life Insurance Corporation of India 141,217,558 5.9 145,302,877 6.1
Shareholding has been consolidated on the basis of PAN as per SEBI circular dated December 19, 2017
# Pursuant to Scheme of Amalgamation, Shanghvi Finance Private Limited (“SFPL”), who is a part of the Promoter Group of the Company, has w.e.f. October 23, 2018 acquired 959,489,975 Equity Shares of the Company representing 40.0% of the total paid-up equity share capital of the Company from 11 Transferor Companies namely 1) Viditi Investment Private Limited; 2) Tejaskiran Pharmachem Industries Private Limited; 3) Quality Investment Private Limited; 4) Family Investment Private Limited; 5) Virtuous Share Investments Private Limited; 6) Virtuous Finance Private Limited; 7) Sholapur Organics Private Limited; 8) Jeevanrekha Investrade Private Limited; 9) Package Investrade Private Limited; 10) Asawari Investment and Finance Private Limited; and 11) Nirmit Exports Private Limited. These transferor companies formed part of promoter group and collectively held the aforementioned equity shares of the Company.
NOTE : 43 RESEARCH AND DEVELOPMENT EXPENDITURE
` in Million
Year ended March 31, 2019
Year ended March 31, 2018
Revenue, net (excluding depreciation) [Refer note 38] 19,057.1 20,520.9 Capital 718.2 1,819.4
19,775.3 22,340.3
NOTE : 44 CATEGORIES OF FINANCIAL INSTRUMENTS` in Million
As at March 31, 2019
Fair value through profit
or loss
Fair value through other
comprehensive income
Amortised cost
Financial assetsInvestments
Equity instruments - quoted - 5,455.7 - Equity instruments - unquoted 71.9 - - Bonds/debentures - quoted - 35,486.2 - Government securities - quoted - 556.9 - Government securities - unquoted (` 10,000) - - 0.0 Mutual funds - unquoted 5,621.2 - - Others - quoted - 22,098.9 - Others - unquoted 7,309.1 - -
Loans to related parties - - 283.3 Loans to employees/others - - 2,980.6 Trade receivables - - 88,842.0 Deposits - - 1.4 Margin money/ security against guarantees/ commitments - - 2.6

Notes to the Consolidated Financial Statementsfor the year ended March 31, 2019
Sun Pharmaceutical Industries Ltd.
Specialty in progress
212
` in Million As at March 31, 2019
Fair value through profit
or loss
Fair value through other
comprehensive income
Amortised cost
Security deposits - - 743.6 Cash and cash equivalents - - 70,623.0 Bank balances other than cash and cash equivalents - - 2,133.0 Interest accrued on investments / balances with banks - - 164.7 Refund due from government authorities - - 2,489.8 Derivatives designated as hedges - 559.6 - Other financial assets - - 1,056.7
Mandatorily measured :Derivatives not designated as hedges 254.2 - -
Total 13,256.4 64,157.3 169,320.7 Financial liabilities
Borrowings - - 98,933.7 Current maturities of long-term debt and finance lease obligations - - 6,209.9 Trade payables - - 41,478.7 Interest accrued - - 391.7 Unpaid dividends - - 93.9 Security deposits - - 126.6 Payable on purchase of property, plant and equipment - - 1,221.9 Derivatives designated as hedges - 267.5 - Other financial liabilities - - 1,848.0
Mandatorily measured :Derivatives not designated as hedges 144.3 - -
Total 144.3 267.5 150,304.4
` in Million As at March 31, 2018
Fair value through profit
or loss
Fair value through other
comprehensive income
Amortised cost
Financial assetsInvestments
Equity instruments - quoted - 4,394.0 - Equity instruments - unquoted 22.5 - - Bonds/debentures - quoted - 27,803.1 - Government securities - quoted - 326.3 - Government securities - unquoted (` 10,000) - - 0.0 Mutual funds - unquoted 5,177.2 - - Others - quoted - 25,397.6 - Others - unquoted 5,306.6 - -
Loans to employees/others - - 23,339.0 Trade receivables - - 78,152.8 Deposits - - 1.0 Margin money/ security against guarantees/ commitments - - 2.2 Security deposits - - 760.9 Cash and cash equivalents - - 79,253.7 Bank balances other than cash and cash equivalents - - 20,040.1 Interest accrued on investments / balances with banks - - 316.0

Notes to the Consolidated Financial Statementsfor the year ended March 31, 2019
FINANCIAL STATEMENTS
Annual Report 2018-19
213Consolidated
` in Million As at March 31, 2018
Fair value through profit
or loss
Fair value through other
comprehensive income
Amortised cost
Refund due from government authorities - - 2,079.4 Derivatives designated as hedges - - - Other financial assets - - 1,901.7
Mandatorily measured :Derivatives not designated as hedges 783.5 - -
Total 11,289.8 57,921.0 205,846.8 Financial liabilities
Borrowings - - 97,517.9 Current maturities of long-term debt and finance lease obligations - - 6,334.8 Trade payables - - 47,662.0 Interest accrued - - 344.6 Unpaid dividends - - 86.4 Security deposits - - 151.3 Payable on purchase of property, plant and equipment - - 4,141.2 Derivatives designated as hedges - 35.8 - Other financial liabilities - - 2,455.9
Mandatorily measured :Derivatives not designated as hedges 143.7 - -
Total 143.7 35.8 158,694.1
NOTE : 45 FAIR VALUE HIERARCHY
Financial assets and liabilities measured at fair value on a recurring basis at the end of each reporting period ` in Million
As at March 31, 2019Level 1 Level 2 Level 3
Financial assetsInvestments
Equity instruments - quoted # 5,455.7 - - Equity instruments - unquoted - - 71.9 Bonds/debentures - quoted 35,486.2 - - Government securities - quoted 556.9 - - Mutual funds - unquoted 5,621.2 - - Others - quoted 22,098.9 - - Others - unquoted - 7,309.1 -
Derivatives designated as hedges - 559.6 - Derivatives not designated as hedges - 254.2 -
Total 69,218.9 8,122.9 71.9 Financial liabilities
Derivatives not designated as hedges - 144.3 - Derivatives designated as hedges - 267.5 -
Total - 411.8 -
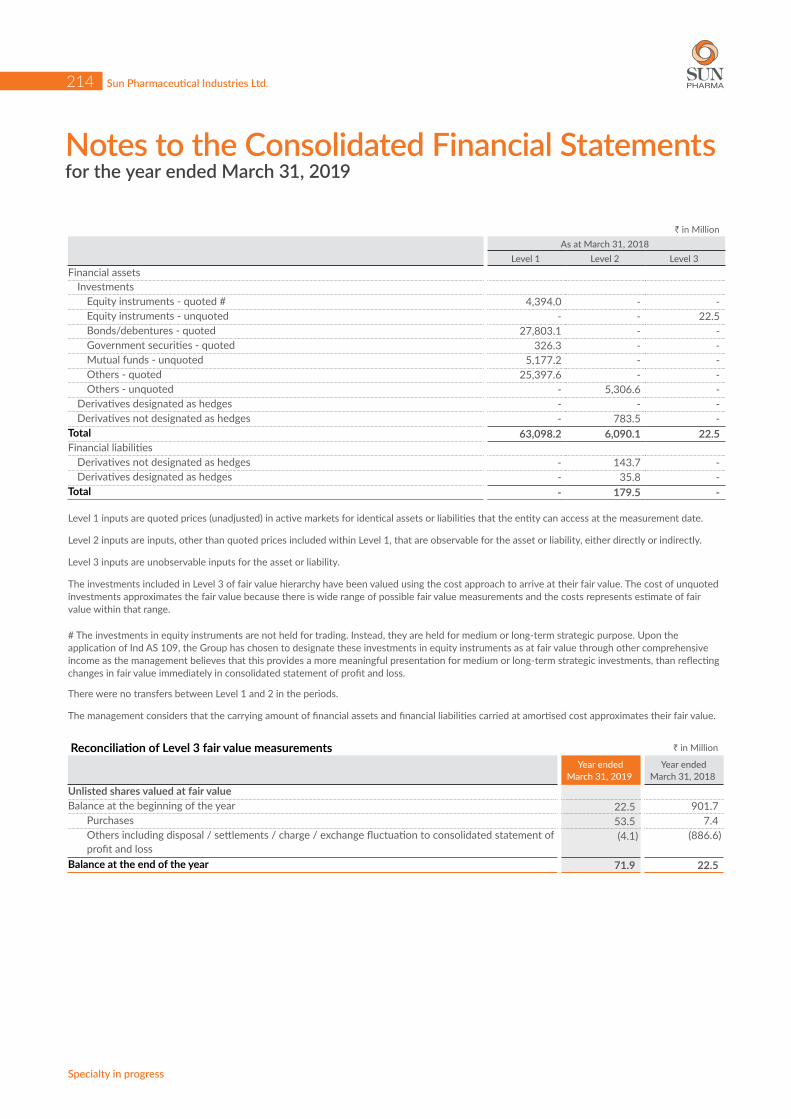
Notes to the Consolidated Financial Statementsfor the year ended March 31, 2019
Sun Pharmaceutical Industries Ltd.
Specialty in progress
214
` in MillionAs at March 31, 2018
Level 1 Level 2 Level 3Financial assets
Investments Equity instruments - quoted # 4,394.0 - - Equity instruments - unquoted - - 22.5 Bonds/debentures - quoted 27,803.1 - - Government securities - quoted 326.3 - - Mutual funds - unquoted 5,177.2 - - Others - quoted 25,397.6 - - Others - unquoted - 5,306.6 -
Derivatives designated as hedges - - - Derivatives not designated as hedges - 783.5 -
Total 63,098.2 6,090.1 22.5 Financial liabilities
Derivatives not designated as hedges - 143.7 - Derivatives designated as hedges - 35.8 -
Total - 179.5 -
Level 1 inputs are quoted prices (unadjusted) in active markets for identical assets or liabilities that the entity can access at the measurement date.
Level 2 inputs are inputs, other than quoted prices included within Level 1, that are observable for the asset or liability, either directly or indirectly.
Level 3 inputs are unobservable inputs for the asset or liability.
The investments included in Level 3 of fair value hierarchy have been valued using the cost approach to arrive at their fair value. The cost of unquoted investments approximates the fair value because there is wide range of possible fair value measurements and the costs represents estimate of fair value within that range.
# The investments in equity instruments are not held for trading. Instead, they are held for medium or long-term strategic purpose. Upon the application of Ind AS 109, the Group has chosen to designate these investments in equity instruments as at fair value through other comprehensive income as the management believes that this provides a more meaningful presentation for medium or long-term strategic investments, than reflecting changes in fair value immediately in consolidated statement of profit and loss.
There were no transfers between Level 1 and 2 in the periods.
The management considers that the carrying amount of financial assets and financial liabilities carried at amortised cost approximates their fair value.
Reconciliation of Level 3 fair value measurements ` in Million
Year ended March 31, 2019
Year ended March 31, 2018
Unlisted shares valued at fair value Balance at the beginning of the year 22.5 901.7 Purchases 53.5 7.4 Others including disposal / settlements / charge / exchange fluctuation to consolidated statement of
profit and loss (4.1) (886.6)
Balance at the end of the year 71.9 22.5

Notes to the Consolidated Financial Statementsfor the year ended March 31, 2019
FINANCIAL STATEMENTS
Annual Report 2018-19
215Consolidated
NOTE : 46 CAPITAL MANAGEMENT The Group’s capital management objectives are:
- to ensure the Group’s ability to continue as a going concern; and - to provide an adequate return to shareholders through optimisation of debts and equity balance.
The Group monitors capital on the basis of the carrying amount of debt less cash and cash equivalents, bank balances (excluding earmarked balances with banks) and current investments as presented on the face of the consolidated financial
statements. The Group’s objective for capital management is to maintain an optimum overall financial structure.
(i) Debt equity ratio ` in Million
As at March 31, 2019
As at March 31, 2018
Debt (includes non-current borrowings, current borrowings, current maturities of finance lease obligations and current maturities of long-term debt)
105,143.6 103,852.7
Less : cash and cash equivalents, bank balances (excluding earmarked balances with banks) and current investments
111,827.1 139,770.2
Net debt (6,683.5) (35,917.5)Total equity, including reserves 447,226.0 421,982.7 Net debt to total equity ratio N.A. N.A.
(ii) Dividend on equity shares paid during the year ` in Million
Year ended March 31, 2019
Year ended March 31, 2018
Dividend on equity sharesFinal dividend for the year ended March 31, 2018 of ` 2.0 (year ended March 31, 2017: ` 3.5) per fully paid share
4,791.6 7,977.4
Dividend distribution tax on above 984.9 1,624.0
Dividends not recognised at the end of the reporting period The Board of Directors at it’s meeting held on May 28, 2019 have recommended payment of final dividend of ` 2.75 per
share of face value of ` 1 each for the year ended March 31, 2019. The same amounts to ` 6,598.2 Million.
This proposed dividend is subject to the approval of shareholders in the ensuing annual general meeting and hence not recognised as liability.
NOTE : 47 FINANCIAL RISK MANAGEMENT The Group’s activities expose it to a variety of financial risks, including market risk, credit risk and liquidity risk. The Group’s risk management assessment and policies and processes are established to identify and analyse the risks faced by the Group, to set appropriate risk limits and controls, and to monitor such risks and compliance with the same. Risk assessment and management policies and processes are reviewed regularly to reflect changes in market conditions and the Group’s activities.
Credit risk Credit risk is the risk of financial loss to the Group if a customer or counterparty to a financial instrument fails to meet its contractual obligations and arises principally from the Group’s receivables from customers, loans and investments. Credit risk is managed through credit approvals, establishing credit limits and continuously monitoring the creditworthiness of counterparty to which the Group grants credit terms in the normal course of business.

Notes to the Consolidated Financial Statementsfor the year ended March 31, 2019
Sun Pharmaceutical Industries Ltd.
Specialty in progress
216
InvestmentsThe Group limits its exposure to credit risk by generally investing in liquid securities and only with counterparties that have a good credit rating. The Group does not expect significant any losses from non-performance by these counter-parties, and does not have any significant concentration of exposures to specific industry sectors or specific country risks.
Trade receivables The Group has used expected credit loss (ECL) model for assessing the impairment loss. For this purpose, the Group uses a provision matrix to compute the expected credit loss amount. The provision matrix takes into account external and internal risk factors and historical data of credit losses from various customers.
` in Million
As at March 31, 2019
As at March 31, 2018
Financial assets for which loss allowances is measured using the expected credit loss Trade receivables less than 180 days 86,212.4 75,974.0 180 - 365 days 976.4 2,781.2 beyond 365 days 3,899.3 2,540.5
91,088.1 81,295.7
` in Million
Year ended March 31, 2019
Year ended March 31, 2018
Movement in the expected credit loss allowance on trade receivablesBalance at the beginning of the year 3,142.9 2,109.9 Addition 268.2 1,358.0 Recoveries / reversals (1,165.0) (325.0)Balance at the end of the year 2,246.1 3,142.9
Other than trade receivables, the Group has no significant class of financial assets that is past due but not impaired. The Group has recognised an allowance of ` 9.8 Million (March 31, 2018 : ` 4.5 Million) against a past due loan including interest.
Liquidity risk Liquidity risk is the risk that the Group will not be able to meet its financial obligations as they become due. The Group manages its liquidity risk by ensuring, as far as possible, that it will always have sufficient liquidity to meet its liabilities when due, under both normal and stressed conditions, without incurring unacceptable losses or risk to the Group’s reputation.
The Group had unutilised working capital lines from banks of ` 42,377.3 Million as on March 31, 2019, ` 47,081.4 Million as on March 31, 2018.
The table below provides details regarding the contractual maturities of significant undiscounted financial liabilities: ` in Million
Less than 1 year 1 - 3 years More than 3 years
Total as at March 31, 2019
Non derivative Borrowings 90,062.3 13,238.6 2,023.2 105,324.1 Trade payables 41,478.7 - - 41,478.7 Other financial liabilities 3,671.9 10.2 - 3,682.1
135,212.9 13,248.8 2,023.2 150,484.9 Derivatives 391.4 20.4 - 411.8
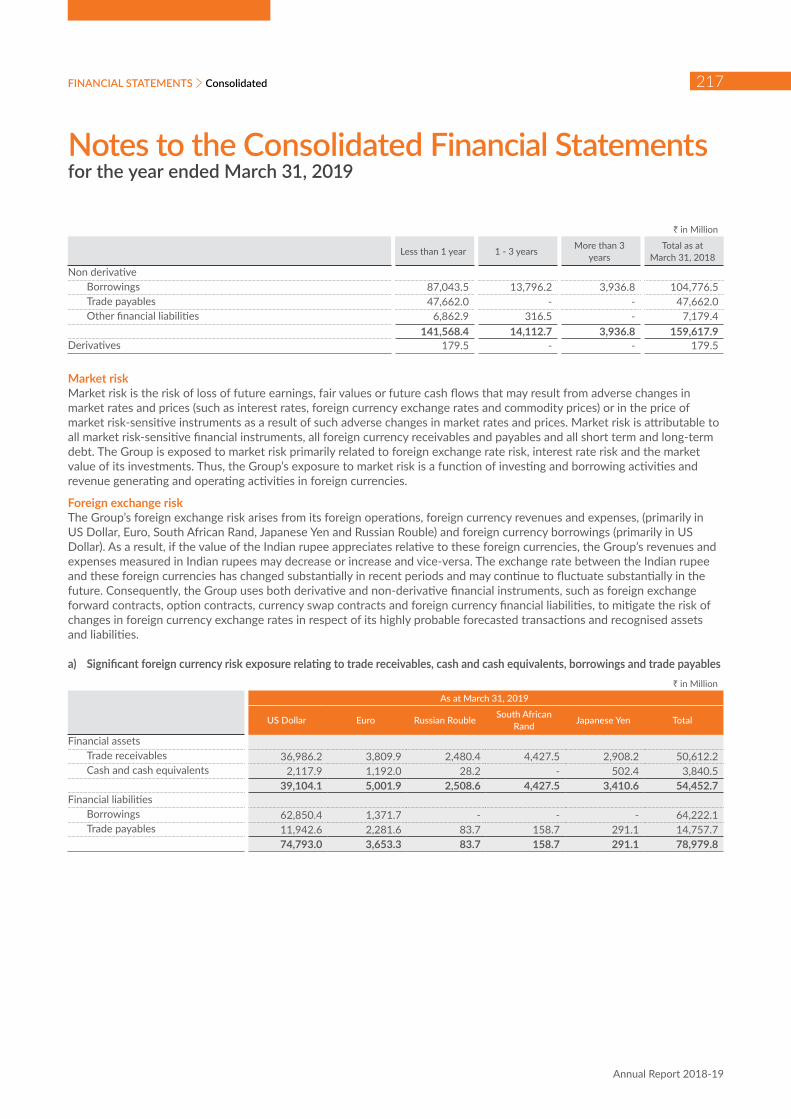
Notes to the Consolidated Financial Statementsfor the year ended March 31, 2019
FINANCIAL STATEMENTS
Annual Report 2018-19
217Consolidated
` in Million
Less than 1 year 1 - 3 years More than 3 years
Total as at March 31, 2018
Non derivative Borrowings 87,043.5 13,796.2 3,936.8 104,776.5 Trade payables 47,662.0 - - 47,662.0 Other financial liabilities 6,862.9 316.5 - 7,179.4
141,568.4 14,112.7 3,936.8 159,617.9 Derivatives 179.5 - - 179.5
Market risk Market risk is the risk of loss of future earnings, fair values or future cash flows that may result from adverse changes in market rates and prices (such as interest rates, foreign currency exchange rates and commodity prices) or in the price of market risk-sensitive instruments as a result of such adverse changes in market rates and prices. Market risk is attributable to all market risk-sensitive financial instruments, all foreign currency receivables and payables and all short term and long-term debt. The Group is exposed to market risk primarily related to foreign exchange rate risk, interest rate risk and the market value of its investments. Thus, the Group’s exposure to market risk is a function of investing and borrowing activities and revenue generating and operating activities in foreign currencies.
Foreign exchange risk The Group’s foreign exchange risk arises from its foreign operations, foreign currency revenues and expenses, (primarily in US Dollar, Euro, South African Rand, Japanese Yen and Russian Rouble) and foreign currency borrowings (primarily in US Dollar). As a result, if the value of the Indian rupee appreciates relative to these foreign currencies, the Group’s revenues and expenses measured in Indian rupees may decrease or increase and vice-versa. The exchange rate between the Indian rupee and these foreign currencies has changed substantially in recent periods and may continue to fluctuate substantially in the future. Consequently, the Group uses both derivative and non-derivative financial instruments, such as foreign exchange forward contracts, option contracts, currency swap contracts and foreign currency financial liabilities, to mitigate the risk of changes in foreign currency exchange rates in respect of its highly probable forecasted transactions and recognised assets and liabilities.
a) Significant foreign currency risk exposure relating to trade receivables, cash and cash equivalents, borrowings and trade payables` in Million
As at March 31, 2019
US Dollar Euro Russian Rouble South African Rand Japanese Yen Total
Financial assets Trade receivables 36,986.2 3,809.9 2,480.4 4,427.5 2,908.2 50,612.2 Cash and cash equivalents 2,117.9 1,192.0 28.2 - 502.4 3,840.5
39,104.1 5,001.9 2,508.6 4,427.5 3,410.6 54,452.7 Financial liabilities Borrowings 62,850.4 1,371.7 - - - 64,222.1 Trade payables 11,942.6 2,281.6 83.7 158.7 291.1 14,757.7
74,793.0 3,653.3 83.7 158.7 291.1 78,979.8
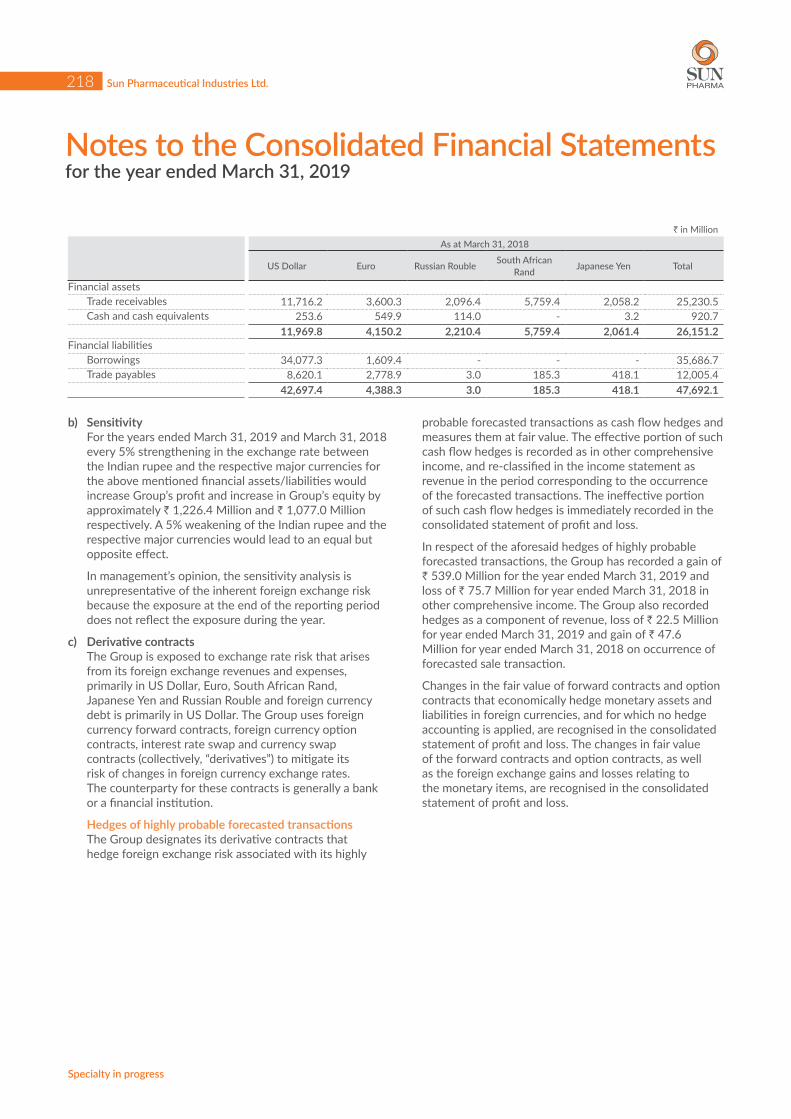
Notes to the Consolidated Financial Statementsfor the year ended March 31, 2019
Sun Pharmaceutical Industries Ltd.
Specialty in progress
218
` in MillionAs at March 31, 2018
US Dollar Euro Russian Rouble South African Rand Japanese Yen Total
Financial assets Trade receivables 11,716.2 3,600.3 2,096.4 5,759.4 2,058.2 25,230.5 Cash and cash equivalents 253.6 549.9 114.0 - 3.2 920.7
11,969.8 4,150.2 2,210.4 5,759.4 2,061.4 26,151.2 Financial liabilities Borrowings 34,077.3 1,609.4 - - - 35,686.7 Trade payables 8,620.1 2,778.9 3.0 185.3 418.1 12,005.4
42,697.4 4,388.3 3.0 185.3 418.1 47,692.1
b) Sensitivity For the years ended March 31, 2019 and March 31, 2018
every 5% strengthening in the exchange rate between the Indian rupee and the respective major currencies for the above mentioned financial assets/liabilities would increase Group’s profit and increase in Group’s equity by approximately ` 1,226.4 Million and ` 1,077.0 Million respectively. A 5% weakening of the Indian rupee and the respective major currencies would lead to an equal but opposite effect.
In management’s opinion, the sensitivity analysis is unrepresentative of the inherent foreign exchange risk because the exposure at the end of the reporting period does not reflect the exposure during the year.
c) Derivative contracts The Group is exposed to exchange rate risk that arises
from its foreign exchange revenues and expenses, primarily in US Dollar, Euro, South African Rand, Japanese Yen and Russian Rouble and foreign currency debt is primarily in US Dollar. The Group uses foreign currency forward contracts, foreign currency option contracts, interest rate swap and currency swap contracts (collectively, “derivatives”) to mitigate its risk of changes in foreign currency exchange rates. The counterparty for these contracts is generally a bank or a financial institution.
Hedges of highly probable forecasted transactions The Group designates its derivative contracts that
hedge foreign exchange risk associated with its highly
probable forecasted transactions as cash flow hedges and measures them at fair value. The effective portion of such cash flow hedges is recorded as in other comprehensive income, and re-classified in the income statement as revenue in the period corresponding to the occurrence of the forecasted transactions. The ineffective portion of such cash flow hedges is immediately recorded in the consolidated statement of profit and loss.
In respect of the aforesaid hedges of highly probable forecasted transactions, the Group has recorded a gain of ` 539.0 Million for the year ended March 31, 2019 and loss of ` 75.7 Million for year ended March 31, 2018 in other comprehensive income. The Group also recorded hedges as a component of revenue, loss of ` 22.5 Million for year ended March 31, 2019 and gain of ` 47.6 Million for year ended March 31, 2018 on occurrence of forecasted sale transaction.
Changes in the fair value of forward contracts and option contracts that economically hedge monetary assets and liabilities in foreign currencies, and for which no hedge accounting is applied, are recognised in the consolidated statement of profit and loss. The changes in fair value of the forward contracts and option contracts, as well as the foreign exchange gains and losses relating to the monetary items, are recognised in the consolidated statement of profit and loss.

Notes to the Consolidated Financial Statementsfor the year ended March 31, 2019
FINANCIAL STATEMENTS
Annual Report 2018-19
219Consolidated
The following table gives details in respect of the notional amount of outstanding foreign exchange derivative contracts:Amount in Million
Currency Buy / Sell Cross Currency As at March 31, 2019
As at March 31, 2018
Derivatives designated as hedges Forward contracts ZAR Sell INR ZAR 480.0 - Forward contracts USD Sell INR USD 120.5 - Forward contracts USD Buy JPY USD 17.4 USD 31.7 Forward contracts USD Sell NIS USD 57.0 - Derivatives not designated as hedges Forward contracts USD Buy INR USD 27.3 USD 18.2 Forward contracts AUD Sell USD USD 7.4 USD 8.2 Forward contracts RUB Sell USD USD 4.5 USD 5.0 Forward contracts GBP Sell USD USD 4.9 USD 2.8 Forward contracts EUR Sell USD USD 9.8 - Forward contracts ZAR Sell USD - USD 21.0 Forward contracts CAD Sell USD - USD 3.6 Currency cum interest rate swaps USD Buy INR USD 50.0 USD 50.0 Currency options USD Buy INR - USD 100.0 Interest rate swaps (Floating to fixed) USD Buy USD USD 50.0 USD 150.0 Interest rate swaps (Floating to fixed) USD Buy USD USD 125.0 - Forward contracts USD Sell NIS USD 6.8 USD 52.2 Forward contracts USD Sell CAD USD 69.5 USD 53.4 Forward contracts USD Sell HUF USD 4.2 USD 4.5 Forward contracts RUB Sell RON RON 15.2 RON 4.8 Forward contracts RON Buy RUB RON 6.9 - Forward contracts USD Sell RON USD 20.0 - Currency swaps USD Sell RON USD 9.1 -
Interest rate risk The Group has loan facilities on floating interest rate, which exposes the Group to risk of changes in interest rates. The Group monitors the interest rate movement and manages the interest rate risk by evaluating interest rate swaps etc. based on the market / risk perception.
For the year ended March 31, 2019 and March 31, 2018, every 50 basis point decrease in the floating interest rate component applicable to its loans and borrowings would increase the Group’s profit by approximately ` 330.7 Million and ` 162.2 Million respectively. A 50 basis point increase in floating interest rate would have led to an equal but opposite effect.
Commodity rate risk Exposure to market risk with respect to commodity prices primarily arises from the Group’s purchases and sales of active pharmaceutical ingredients, including the raw material components for such active pharmaceutical ingredients. These are commodity products, whose prices may fluctuate significantly over short periods of time. The prices of the Group’s raw materials generally fluctuate in line with commodity cycles, although the prices of raw materials used in the Group’s active pharmaceutical ingredients business are generally more volatile. Cost of raw materials forms the largest portion of the Group’s cost of revenues. Commodity price risk exposure is evaluated and managed through operating procedures and sourcing policies. As of March 31, 2019, the Group had not entered into any material derivative contracts to hedge exposure to fluctuations in commodity prices.

Notes to the Consolidated Financial Statementsfor the year ended March 31, 2019
Sun Pharmaceutical Industries Ltd.
Specialty in progress
220
NOTE : 48 GOODWILL (NET): Goodwill acquired in business combination is allocated, at acquisition, to the cash generating units (CGUs) that are expected to benefit from that business combination. The carrying amount of goodwill has been allocated as follows:
` in Millioni) As at
March 31, 2019 As at
March 31, 2018 Goodwill in respect of: Sun Pharmaceutical Industries, Inc. 25,594.4 23,564.4 Sun Farmaceutica do Brasil Ltda. 387.4 427.1 Sun Pharma Japan Ltd. 128.2 125.5 Taro Pharmaceutical Industries Ltd. 13,098.5 12,311.0 Terapia SA 18,425.9 17,361.5 Ranbaxy Farmaceutica Ltda. 382.3 359.3 Basics GmbH 355.9 362.1 Insite Vision Incorporated - 435.8 Zenotech Laboratories Limited 595.4 595.4 Sun Pharmaceutical Industries Limited 1,677.4 1,677.4 Ranbaxy South Africa (Pty) Ltd 3.3 3.8 JSC Biosintez 234.0 247.0 Sun Pharmaceutical Medicare Limited 1.0 1.0 Total (A) 60,883.7 57,471.3 Less: Capital reserve in respect of : Alkaloida Chemical Company Zrt. 1,237.3 1,319.2 Ranbaxy Nigeria Limited 1.5 1.4 Sun Pharmaceutical Industries Limited 27.5 27.5 Ranbaxy Malaysia SDN. BHD. 59.7 56.1 Total (B) 1,326.0 1,404.2 Total (A-B) 59,557.7 56,067.1
ii) Below is the reconciliation of the carrying amount of goodwill:` in Million
Year ended March 31, 2019
Year ended March 31, 2018
Opening balance 56,067.1 55,362.2 Add: Due to acquisitions during the year - 595.4 Add/ (less): Foreign currency translation difference 3,490.6 109.5 Closing balance 59,557.7 56,067.1
The carrying amount of goodwill are stated above. The recoverable amounts have been determined based on value in use calculations which uses cash flow projections covering generally a period of five years (which are based on key assumptions such as margins, expected growth rates based on past experience and Management’s expectations/ extrapolation of normal increase/ steady terminal growth rate) and appropriate discount rates that reflects current market assessments of time value of money and risks specific to these investments. The cash flow projections included estimates for five years developed using internal forecasts and terminal growth rate thereafter. The planning horizon reflects the assumptions for short to mid-term market developments. The average growth rate used in extrapolating cash flows beyond the planning period ranged from -10.0% to 5.5% for the year ended March 31, 2019. Discount rate reflects the current market assessment of the risks specific to a CGU or group of CGUs. The discount rate is estimated on the weighted average cost of capital for respective CGU or group of CGUs. Discount rate used ranged from 2.6% to 7.9% for the year ended March 31, 2019. The management believes that any reasonable possible change in key assumptions on which recoverable amount is based is not expected to cause the aggregate carrying amount to exceed the aggregate recoverable amount of the cash generating unit. Goodwill of Insite vision incorporated has been reallocated to Sun pharmaceuticals industries Inc. and now considered as a single CGU. Based on the impairment assessment, the Management has determined no impairment loss in the value of goodwill.
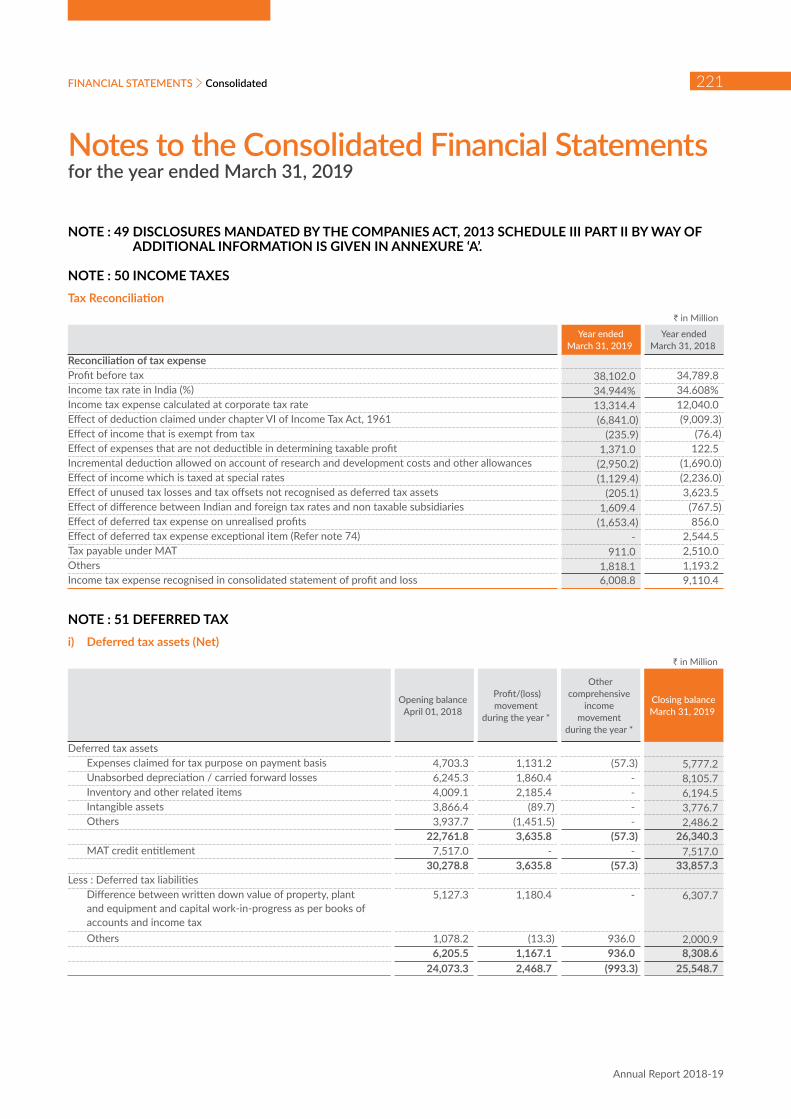
Notes to the Consolidated Financial Statementsfor the year ended March 31, 2019
FINANCIAL STATEMENTS
Annual Report 2018-19
221Consolidated
NOTE : 49 DISCLOSURES MANDATED BY THE COMPANIES ACT, 2013 SCHEDULE III PART II BY WAY OF ADDITIONAL INFORMATION IS GIVEN IN ANNEXURE ‘A’.
NOTE : 50 INCOME TAXESTax Reconciliation
` in Million
Year ended March 31, 2019
Year ended March 31, 2018
Reconciliation of tax expenseProfit before tax 38,102.0 34,789.8 Income tax rate in India (%) 34.944% 34.608%Income tax expense calculated at corporate tax rate 13,314.4 12,040.0 Effect of deduction claimed under chapter VI of Income Tax Act, 1961 (6,841.0) (9,009.3)Effect of income that is exempt from tax (235.9) (76.4)Effect of expenses that are not deductible in determining taxable profit 1,371.0 122.5 Incremental deduction allowed on account of research and development costs and other allowances (2,950.2) (1,690.0)Effect of income which is taxed at special rates (1,129.4) (2,236.0)Effect of unused tax losses and tax offsets not recognised as deferred tax assets (205.1) 3,623.5 Effect of difference between Indian and foreign tax rates and non taxable subsidiaries 1,609.4 (767.5)Effect of deferred tax expense on unrealised profits (1,653.4) 856.0 Effect of deferred tax expense exceptional item (Refer note 74) - 2,544.5 Tax payable under MAT 911.0 2,510.0 Others 1,818.1 1,193.2 Income tax expense recognised in consolidated statement of profit and loss 6,008.8 9,110.4
NOTE : 51 DEFERRED TAX i) Deferred tax assets (Net)
` in Million
Opening balance April 01, 2018
Profit/(loss) movement
during the year *
Other comprehensive
income movement
during the year *
Closing balance March 31, 2019
Deferred tax assets Expenses claimed for tax purpose on payment basis 4,703.3 1,131.2 (57.3) 5,777.2 Unabsorbed depreciation / carried forward losses 6,245.3 1,860.4 - 8,105.7 Inventory and other related items 4,009.1 2,185.4 - 6,194.5 Intangible assets 3,866.4 (89.7) - 3,776.7 Others 3,937.7 (1,451.5) - 2,486.2
22,761.8 3,635.8 (57.3) 26,340.3 MAT credit entitlement 7,517.0 - - 7,517.0
30,278.8 3,635.8 (57.3) 33,857.3 Less : Deferred tax liabilities Difference between written down value of property, plant
and equipment and capital work-in-progress as per books of accounts and income tax
5,127.3 1,180.4 - 6,307.7
Others 1,078.2 (13.3) 936.0 2,000.9 6,205.5 1,167.1 936.0 8,308.6
24,073.3 2,468.7 (993.3) 25,548.7

Notes to the Consolidated Financial Statementsfor the year ended March 31, 2019
Sun Pharmaceutical Industries Ltd.
Specialty in progress
222
ii) Deferred tax liabilities (Net) ` in Million
Opening balance April 01, 2018
Profit/(loss) movement
during the year *
Other comprehensive
income movement
during the year *
Closing balance March 31, 2019
Deferred tax liabilities Difference between written down value of property, plant and
equipment and capital work-in-progress as per books of accounts and income tax and others
1,881.3 (285.7) - 1,595.6
Undistributed profits 984.5 (984.5) - - 2,865.8 (1,270.2) - 1,595.6
Less : Deferred tax assets Expenses claimed for tax purpose on payment basis 267.5 (128.0) (22.5) 117.0 Others 408.7 (274.2) 9.1 143.7
676.2 (402.2) (13.3) 260.7 MAT credit entitlement - 292.2 - 292.2
676.2 (110.0) (13.3) 552.9 2,189.6 (1,160.2) 13.3 1,042.8
* Movement during the year includes foreign currency translation difference amounting to ` 1,598.1 Million gain for the year ended March 31, 2019.
iii) Deductible temporary differences, unused tax losses and unused tax credits for which no deferred tax assets have been recognised are attributable to the following :
` in Million
As at March 31, 2019
As at March 31, 2018
Tax losses (includes capital in nature) 88,027.8 93,120.3 Unabsorbed depreciation 38,885.4 31,260.2 Unused tax credits (including MAT credit entitlement) 8,034.7 7,606.1 Deductible temporary differences 20,881.4 22,933.0
155,829.3 154,919.6
The unused tax credits will expire from financial year 2022-23 to financial year 2033-34 and unused tax losses will expire from financial year 2019-20 to 2031-32. In case of certain overseas subsidiaries which have tax losses and unused tax credits, the amount is not material and there is no expiry period for tax losses and unused tax credits.
NOTE : 52 EARNINGS PER SHARE
Year ended March 31, 2019
Year ended March 31, 2018
Profit for the year (` in Million) - used as numerator for calculating earnings per share 26,654.2 20,957.0 Weighted average number of shares used in computing basic earnings per share (A) 2,399,326,681 2,399,296,653 Add: Dilution effect of employee stock option (B) 3,575 65,420 Weighted average number of shares used in computing diluted earnings per share (A+B) 2,399,330,257 2,399,362,073 Nominal value per share (in `) 1 1 Basic earnings per share (in `) 11.1 8.7 Diluted earnings per share (in `) 11.1 8.7

Notes to the Consolidated Financial Statementsfor the year ended March 31, 2019
FINANCIAL STATEMENTS
Annual Report 2018-19
223Consolidated
NOTE : 53 SEGMENT REPORTINGThe Chief Operating Decision Maker (‘CODM’) evaluates the Group’s performance and allocates resources based on an analysis of various performance indicators by reportable segments. The Group’s reportable segments are as follows:
1. India
2. United States of America
3. Emerging markets
4. Rest of world
The reportable segments derives their revenues from the sale of pharmaceuticals products (generics, speciality, API, etc.). The CODM reviews revenue as the performance indicator. The measurement of each segment’s revenues, expenses and assets is consistent with the accounting policies that are used in preparation of the Group’s consolidated financial statements.
Revenue by Geography ` in Million
Year ended March 31, 2019
Year ended March 31, 2018
India 78,166.7 84,102.0 United States of America 109,360.1 88,635.4 Emerging markets 58,698.0 52,221.6 Rest of world 40,638.0 35,700.4
286,862.8 260,659.4
In view of the interwoven / intermix nature of business and manufacturing facility, other segmental information is not ascertainable.
Concentration of revenues from one customer of the Group was 25.7% and 30.6% of total revenue for the year ended March 31, 2019 and March 31, 2018 respectively.
NOTE : 54 REVENUE FROM CONTRACTS WITH CUSTOMERSInd AS 115 “Revenue from Contracts with Customers” was issued on March 28, 2018 and supersedes Ind AS 11 “Construction Contracts” and Ind AS 18 “Revenue” and it applies, with limited exceptions, to all revenue arising from contracts with its customers. The Company adopted Ind AS 115 using the modified retrospective method of adoption with the date of initial application of April 01, 2018 which does not require restatement of comparative period. The Company elected to apply the standard to all contracts as at April 01, 2018. Accordingly, an adjustment of ` 6,493.0 Million was recognised to retained earnings as on April 01, 2018. Further, during the financial year 2018-19 the Group has recorded an additional amount of ` 493.7 Million as deferred revenue pursuant to the requirements of Ind AS 115. The performance obligation in respect of amount recorded in retained earnings and for amount recognised as deferred revenue is yet to be completed. Revenue of ` 628.9 Million has been recognised as Revenue from contract with customer in financial year 2018-2019 pursuant to completion of performance obligation in respect of the above contracts.
The reconciling items of revenue recognised in the consolidated statement of profit and loss with the contracted price are as follows:
` in Million
Year endedMarch 31, 2019
Year ended March 31, 2018
Revenue as per contracted price, net of returns 559,578.1 507,767.1Less : Provision for sales return (7,664.8) (7,758.4)Chargebacks, Rebates, discounts and others (265,050.5) (239,349.3)
(272,715.3) (247,107.7)Revenue from contracts with customers 286,862.8 260,659.4
Revenue from contracts with customers include sales made to Aditya Medisales Limited amounting to ` 73,609.2 Million (March 31, 2018: ` 79,765.6 Million).

Notes to the Consolidated Financial Statementsfor the year ended March 31, 2019
Sun Pharmaceutical Industries Ltd.
Specialty in progress
224
` in Million
As at March 31, 2019
As at March 31, 2018
Contract balances Trade receivables 88,842.0 78,152.8 Contract assets - - Contract liabilities 8,487.9 470.2
Contract assets are initially recognised for revenue from sale of goods. Contract liabilities are on account of the upfront revenue received from customer for which performance obligation has not yet been completed. The performance obligation is satisfied when control of the goods or services are transferred to the customers based on the contractual terms. Payment terms with customers vary depending upon the contractual terms of each contract.
NOTE : 55 LEASES(a) The Group has given certain premises and plant and machinery under operating lease or leave and license
agreements. Periods range between 11 months to 10 years under leave and license and include both cancellable and non-cancellable. The Group has received refundable interest free security deposits, where applicable, in accordance with agreed terms.
(b) The Group has obtained certain premises for its business operations (including furniture and fittings, therein as applicable) under operating lease or leave and license agreements. Periods range between 11 months to 10 years under leave and license and include both cancellable and non-cancellable. The Group has given refundable interest free security deposits in accordance with the agreed terms. These refundable security deposits have been valued at amortised cost under relevant Ind AS.
(c) Lease receipts/payments are recognised in the consolidated statement of profit and loss under “Lease rental and hire charges” and “Rent” in note 32 and note 37 respectively.
(d) Operating lease` in Million
Year ended March 31, 2019
Year ended March 31, 2018
(i) Group as lessee The future minimum lease payments under non-cancellable operating lease not later than one year 261.9 317.4 later than one year and not later than five years 617.3 725.5 later than five years 458.4 80.7 (ii) Group as lessor The future minimum lease payments under non-cancellable operating lease not later than one year 155.5 143.0 later than one year and not later than five years 338.3 401.1 later than five years - 58.4

Notes to the Consolidated Financial Statementsfor the year ended March 31, 2019
FINANCIAL STATEMENTS
Annual Report 2018-19
225Consolidated
(e) Finance lease` in Million
Year ended March 31, 2019
Year ended March 31, 2018
(i) Group as lessee The future minimum lease payments under non-cancellable finance lease not later than one year 434.3 317.1 later than one year and not later than five years 1,256.7 1,003.7 later than five years - 341.6 Less: Unearned finance charges 344.7 400.6 Present value of minimum lease payments payable not later than one year 349.0 228.5 later than one year and not later than five years 997.4 740.3 later than five years - 293.1
NOTE : 56 EMPLOYEE BENEFITS PLANSDefined contribution planContributions are made to Regional Provident Fund (RPF), Family Pension Fund, Employees State Insurance Corporation (ESIC) and other Funds which covers all regular employees of the Parent and Indian subsidiaries. While the employees and the Parent and Indian subsidiaries make predetermined contributions to the Provident Fund and ESIC, contribution to the Family Pension Fund and other statutory funds are made only by the Parent and Indian subsidiaries. The contributions are normally based on a certain percentage of the employee’s salary. Amount recognised as expense in respect of these defined contribution plans, aggregate to ` 947.7 Million (March 31, 2018 : ` 886.6 Million).
` in Million
Year ended March 31, 2019
Year ended March 31, 2018
Contribution to Provident Fund and Family Pension Fund 838.8 764.5 Contribution to Superannuation Fund 64.9 72.7 Contribution to ESIC and Employees Deposit Linked Insurance (EDLI) 43.1 48.7 Contribution to Labour Welfare Fund 0.9 0.7

Notes to the Consolidated Financial Statementsfor the year ended March 31, 2019
Sun Pharmaceutical Industries Ltd.
Specialty in progress
226
Defined benefit plan a) Gratuity In respect of Gratuity, a defined benefit plan,
contributions are made to LIC’s Recognised Group Gratuity Fund Scheme. It is governed by the Payment of Gratuity Act, 1972. Under the Gratuity Act, employees are entitled to specific benefit at the time of retirement or termination of the employment on completion of five years or death while in employment. The level of benefit provided depends on the member’s length of service and salary at the time of retirement/termination age. Provision for gratuity is based on actuarial valuation done by an independent actuary as at the year end. Each year, the Parent and Indian subsidiaries reviews the level of funding in gratuity fund. The Parent and Indian subsidiaries decides its contribution based on the results of its annual review. The Parent and Indian subsidiaries aims to keep annual contributions relatively stable at a level such that the fund assets meets the requirements of gratuity payments in short to medium term.
b) Pension fund The Parent and Indian subsidiaries has an obligation
towards pension, a defined benefit retirement plan, with respect to certain employees, who had already retired before March 01, 2013, will continue to receive the pension as per the pension plan.
Risks These plans typically expose the Parent and Indian
subsidiaries to actuarial risks such as: investment risk, interest rate risk, longevity risk and salary risk.
i) Investment risk - The present value of the defined benefit plan liability is calculated using a discount rate determined by reference to the market yields on government bonds denominated in Indian Rupees. If the actual return on plan asset is below this rate, it
will create a plan deficit. However, the risk is partially mitigated by investment in LIC managed fund.
ii) Interest rate risk - A decrease in the bond interest rate will increase the plan liability. However, this will be partially offset by an increase in the return on the plan’s debt investments.
iii) Longevity risk - The present value of the defined benefit plan liability is calculated by reference to the best estimate of the mortality of plan participants both during and after their employment. An increase in the life expectancy of the plan participants will increase the plan’s liability.
iv) Salary risk - The present value of the defined benefit plan liability is calculated by reference to the future salaries of plan participants. As such, an increase in the salary of the plan participants will increase the plan’s liability.
Other long term benefit plan Actuarial valuation for compensated absences is done
as at the year end and the provision is made as per the Parent and Indian subsidiaries rules with corresponding charge to the consolidated statement of profit and loss amounting to ` 446.7 Million (March 31, 2018 gain of ` 51.4 Million) and it covers all regular employees. Major drivers in actuarial assumptions, typically, are years of service and employee compensation.
Obligation in respect of defined benefit plan and other long term employee benefit plans are actuarially determined as at the year end using the ‘Projected Unit Credit’ method. Gains and losses on changes in actuarial assumptions relating to defined benefit obligation are recognised in other comprehensive income whereas gains and losses in respect of other long term employee benefit plans are recognised in the consolidated statement of profit and loss.

Notes to the Consolidated Financial Statementsfor the year ended March 31, 2019
FINANCIAL STATEMENTS
Annual Report 2018-19
227Consolidated
` in MillionYear ended March 31, 2019 Year ended March 31, 2018
Pension Fund (Unfunded)
Gratuity (Funded)
Pension Fund (Unfunded)
Gratuity (Funded)
Expense recognised in the consolidated statement of profit and loss (Refer note 35) Current service cost - 345.9 - 360.6 Interest cost 67.7 256.8 66.0 251.0 Expected return on plan assets - (229.9) - (161.2) Expense charged to the consolidated statement of profit and loss 67.7 372.8 66.0 450.4 Remeasurement of defined benefit obligation recognised in other comprehensive income Actuarial loss / (gain) on defined benefit obligation 64.9 (322.6) (44.4) (695.7) Actuarial loss / (gain) on plan assets - 26.7 - (42.6) Expense/(income) charged to other comprehensive income 64.9 (295.9) (44.4) (738.3)Reconciliation of defined benefit obligations Obligations as at the beginning of the year 903.7 3,426.2 969.5 3,682.3 Current service cost - 345.9 - 360.6 Interest cost 67.7 256.8 66.0 251.0 Liability transferred in/ acquisitions - - - 1.6 Benefits paid (87.0) (291.0) (87.4) (173.6) Actuarial (gains)/losses on obligations due to change in demographic assumptions - (17.8) - (160.9) due to change in financial assumptions 35.7 (223.6) (50.0) (575.4) due to experience 29.2 (81.2) 5.6 40.6 Obligation as at the year end 949.3 3,415.3 903.7 3,426.2
` in Million
As at March 31, 2019
As at March 31, 2018
Gratuity (Funded)
Gratuity (Funded)
Reconciliation of liability/(asset) recognised in the consolidated balance sheet Present value of commitments (as per actuarial valuation) 3,415.3 3,426.2 Fair value of plan assets (3,385.7) (3,068.8) Net liability recognised in the consolidated financial statement 29.6 357.4
` in Million
Year ended March 31, 2019
Year ended March 31, 2018
Gratuity (Funded)
Gratuity (Funded)
Reconciliation of plan assets Plan assets as at the beginning of the year 3,068.8 2,365.4 Expected return 229.9 161.2 Actuarial gain/(loss) (26.7) 42.6 Employer's contribution during the year 404.7 673.2 Benefits paid (291.0) (173.6) Plan assets as at the year end 3,385.7 3,068.8
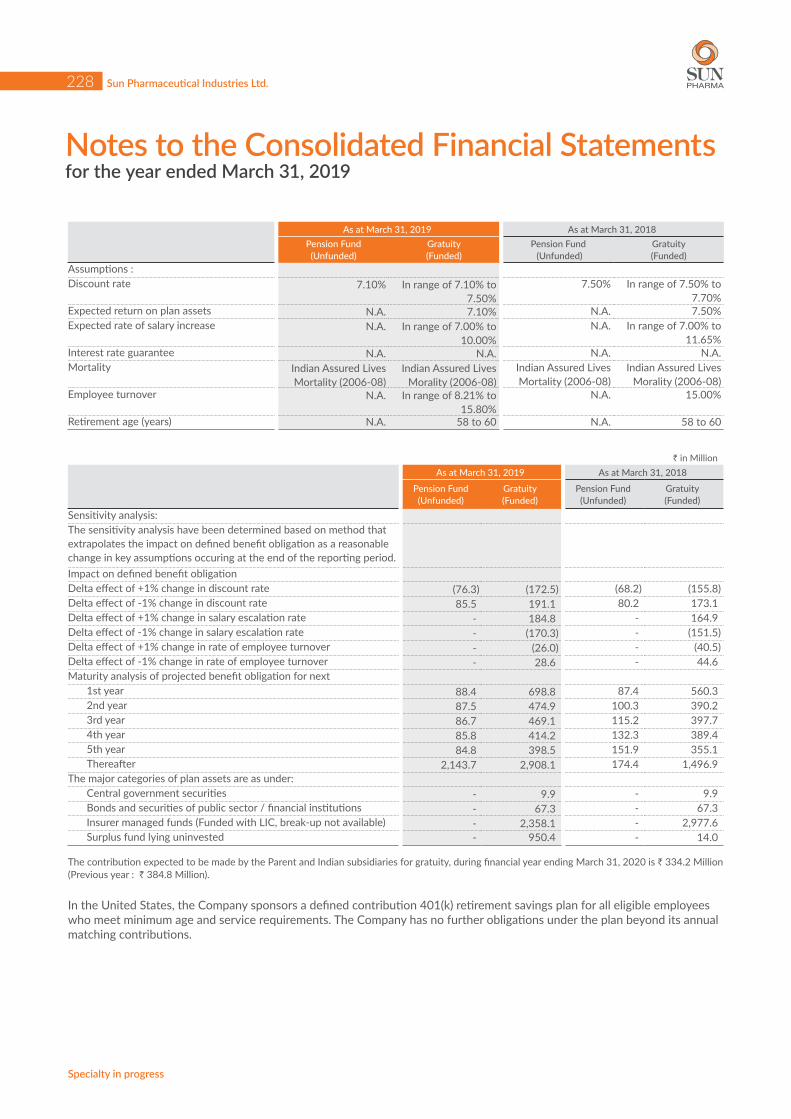
Notes to the Consolidated Financial Statementsfor the year ended March 31, 2019
Sun Pharmaceutical Industries Ltd.
Specialty in progress
228
As at March 31, 2019 As at March 31, 2018Pension Fund (Unfunded)
Gratuity (Funded)
Pension Fund (Unfunded)
Gratuity (Funded)
Assumptions :Discount rate 7.10% In range of 7.10% to
7.50%7.50% In range of 7.50% to
7.70%Expected return on plan assets N.A. 7.10% N.A. 7.50%Expected rate of salary increase N.A. In range of 7.00% to
10.00%N.A. In range of 7.00% to
11.65%Interest rate guarantee N.A. N.A. N.A. N.A.Mortality Indian Assured Lives
Mortality (2006-08)Indian Assured Lives
Morality (2006-08)Indian Assured Lives Mortality (2006-08)
Indian Assured Lives Morality (2006-08)
Employee turnover N.A. In range of 8.21% to 15.80%
N.A. 15.00%
Retirement age (years) N.A. 58 to 60 N.A. 58 to 60
` in MillionAs at March 31, 2019 As at March 31, 2018
Pension Fund (Unfunded)
Gratuity (Funded)
Pension Fund (Unfunded)
Gratuity (Funded)
Sensitivity analysis:The sensitivity analysis have been determined based on method that extrapolates the impact on defined benefit obligation as a reasonable change in key assumptions occuring at the end of the reporting period.Impact on defined benefit obligationDelta effect of +1% change in discount rate (76.3) (172.5) (68.2) (155.8)Delta effect of -1% change in discount rate 85.5 191.1 80.2 173.1 Delta effect of +1% change in salary escalation rate - 184.8 - 164.9 Delta effect of -1% change in salary escalation rate - (170.3) - (151.5)Delta effect of +1% change in rate of employee turnover - (26.0) - (40.5)Delta effect of -1% change in rate of employee turnover - 28.6 - 44.6 Maturity analysis of projected benefit obligation for next 1st year 88.4 698.8 87.4 560.3 2nd year 87.5 474.9 100.3 390.2 3rd year 86.7 469.1 115.2 397.7 4th year 85.8 414.2 132.3 389.4 5th year 84.8 398.5 151.9 355.1 Thereafter 2,143.7 2,908.1 174.4 1,496.9 The major categories of plan assets are as under: Central government securities - 9.9 - 9.9 Bonds and securities of public sector / financial institutions - 67.3 - 67.3 Insurer managed funds (Funded with LIC, break-up not available) - 2,358.1 - 2,977.6 Surplus fund lying uninvested - 950.4 - 14.0
The contribution expected to be made by the Parent and Indian subsidiaries for gratuity, during financial year ending March 31, 2020 is ` 334.2 Million (Previous year : ` 384.8 Million).
In the United States, the Company sponsors a defined contribution 401(k) retirement savings plan for all eligible employees who meet minimum age and service requirements. The Company has no further obligations under the plan beyond its annual matching contributions.

Notes to the Consolidated Financial Statementsfor the year ended March 31, 2019
FINANCIAL STATEMENTS
Annual Report 2018-19
229Consolidated
NOTE : 57 Taro Pharmaceutical Industries Ltd and its Israeli subsidiaries are required to make severance or pension payments to dismissed employees and to employees terminating employment under certain other circumstances. Deposits are made with a pension fund or other insurance plans to secure pension and severance rights for the employees in Israel.
NOTE : 58 EMPLOYEE SHARE-BASED PAYMENT PLANS The Company operates employee stock option scheme namely, SUN Employee Stock Option Scheme-2015 (SUN-ESOS 2015) for the grant of stock options to the eligible personnel. Options are granted at the discretion of the Committee to selected employees depending upon certain criterion. Each option comprises one underlying equity share.
The movement of the options (post split) granted under SUN-ESOS 2015March 31, 2019
Stock options (numbers)
Range of exercise prices
(`)
Weighted-average exercise
prices (`)
Weighted-average
remaining contractual life
(years)
Outstanding at the commencement of the year 263,680 270.0-562.5 450.3 1.5 Exercised during the year $ (11,790) 270.0-562.5 324.9 - Lapsed during the year (93,151) 270.0-562.5 275.0 - Outstanding at the end of the year * 158,739 562.5 562.5 0.9 Exercisable at the end of the year * 158,739 562.5 562.5 0.9
* Includes options exercised, pending allotment $ Weighted average share price on the date of exercise ` 492.6
March 31, 2018
Stock options (numbers)
Range of exercise prices
(`)
Weighted-average exercise
prices (`)
Weighted-average
remaining contractual life
(years)
Outstanding at the commencement of the year 401,678 270.0-562.5 462.9 1.9 Exercised during the year $ (18,893) 270.0-562.5 480.5 - Lapsed during the year (119,105) 270.0-562.5 488.1 - Outstanding at the end of the year * 263,680 270.0-562.5 450.3 1.5 Exercisable at the end of the year * 263,680 270.0-562.5 450.3 1.5
* Includes options exercised, pending allotment $ Weighted average share price on the date of exercise ` 565.1
NOTE : 59 Expenditure related to Corporate Social Responsibility as per Section 135 of the Companies Act, 2013 read with Schedule VII thereof: ` 241.5 Million (March 31,2018 : ` 209.6 Million).
NOTE : 60 The Group does not have any material associates or joint ventures warranting a disclosure in respect of individual associate or joint venture. The Group’s share of other comprehensive income is ` Nil (March 31, 2018: ` Nil) in respect of such associates and joint ventures. The unrecognised share of loss of ` Nil (March 31, 2018: ` Nil) in respect of such associates and joint ventures.
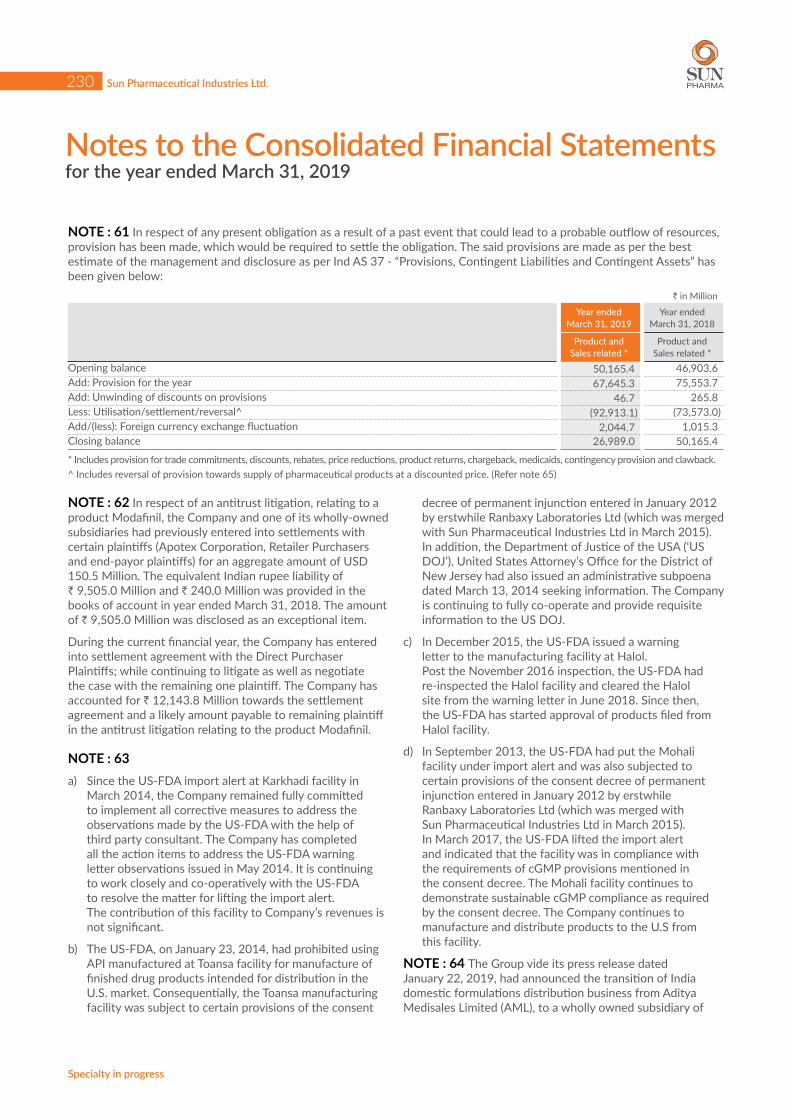
Notes to the Consolidated Financial Statementsfor the year ended March 31, 2019
Sun Pharmaceutical Industries Ltd.
Specialty in progress
230
NOTE : 61 In respect of any present obligation as a result of a past event that could lead to a probable outflow of resources, provision has been made, which would be required to settle the obligation. The said provisions are made as per the best estimate of the management and disclosure as per Ind AS 37 - “Provisions, Contingent Liabilities and Contingent Assets” has been given below:
` in Million
Year ended March 31, 2019
Year ended March 31, 2018
Product and Sales related *
Product and Sales related *
Opening balance 50,165.4 46,903.6 Add: Provision for the year 67,645.3 75,553.7 Add: Unwinding of discounts on provisions 46.7 265.8 Less: Utilisation/settlement/reversal^ (92,913.1) (73,573.0)Add/(less): Foreign currency exchange fluctuation 2,044.7 1,015.3 Closing balance 26,989.0 50,165.4
* Includes provision for trade commitments, discounts, rebates, price reductions, product returns, chargeback, medicaids, contingency provision and clawback.^ Includes reversal of provision towards supply of pharmaceutical products at a discounted price. (Refer note 65)
NOTE : 62 In respect of an antitrust litigation, relating to a product Modafinil, the Company and one of its wholly-owned subsidiaries had previously entered into settlements with certain plaintiffs (Apotex Corporation, Retailer Purchasers and end-payor plaintiffs) for an aggregate amount of USD 150.5 Million. The equivalent Indian rupee liability of ` 9,505.0 Million and ` 240.0 Million was provided in the books of account in year ended March 31, 2018. The amount of ` 9,505.0 Million was disclosed as an exceptional item.
During the current financial year, the Company has entered into settlement agreement with the Direct Purchaser Plaintiffs; while continuing to litigate as well as negotiate the case with the remaining one plaintiff. The Company has accounted for ` 12,143.8 Million towards the settlement agreement and a likely amount payable to remaining plaintiff in the antitrust litigation relating to the product Modafinil.
NOTE : 63a) Since the US-FDA import alert at Karkhadi facility in
March 2014, the Company remained fully committed to implement all corrective measures to address the observations made by the US-FDA with the help of third party consultant. The Company has completed all the action items to address the US-FDA warning letter observations issued in May 2014. It is continuing to work closely and co-operatively with the US-FDA to resolve the matter for lifting the import alert. The contribution of this facility to Company’s revenues is not significant.
b) The US-FDA, on January 23, 2014, had prohibited using API manufactured at Toansa facility for manufacture of finished drug products intended for distribution in the U.S. market. Consequentially, the Toansa manufacturing facility was subject to certain provisions of the consent
decree of permanent injunction entered in January 2012 by erstwhile Ranbaxy Laboratories Ltd (which was merged with Sun Pharmaceutical Industries Ltd in March 2015). In addition, the Department of Justice of the USA (‘US DOJ’), United States Attorney’s Office for the District of New Jersey had also issued an administrative subpoena dated March 13, 2014 seeking information. The Company is continuing to fully co-operate and provide requisite information to the US DOJ.
c) In December 2015, the US-FDA issued a warning letter to the manufacturing facility at Halol. Post the November 2016 inspection, the US-FDA had re-inspected the Halol facility and cleared the Halol site from the warning letter in June 2018. Since then, the US-FDA has started approval of products filed from Halol facility.
d) In September 2013, the US-FDA had put the Mohali facility under import alert and was also subjected to certain provisions of the consent decree of permanent injunction entered in January 2012 by erstwhile Ranbaxy Laboratories Ltd (which was merged with Sun Pharmaceutical Industries Ltd in March 2015). In March 2017, the US-FDA lifted the import alert and indicated that the facility was in compliance with the requirements of cGMP provisions mentioned in the consent decree. The Mohali facility continues to demonstrate sustainable cGMP compliance as required by the consent decree. The Company continues to manufacture and distribute products to the U.S from this facility.
NOTE : 64 The Group vide its press release dated January 22, 2019, had announced the transition of India domestic formulations distribution business from Aditya Medisales Limited (AML), to a wholly owned subsidiary of
Notes to the Consolidated Financial Statementsfor the year ended March 31, 2019
FINANCIAL STATEMENTS
Annual Report 2018-19
231Consolidated
Sun Pharma Laboratories Limited. Accordingly, a new wholly owned subsidiary, Sun Pharma Distributors Limited (SPDL), was incorporated on March 19, 2019. The phased transition to SPDL will be completed post receipt of all requisite regulatory approvals. During the quarter ended March 31, 2019 , the Group pursuant to this decision has taken over its unsold inventory amounting to ` 7161.5 Million from AML. The above-mentioned transition and change in distribution arrangement has led to one-time reduction in sales and consequent reduction in profit for the year ended on March 31, 2019. Pending receipt of regulatory approvals by SPDL in different jurisdictions for sale of pharmaceutical products, AML would act as an agent for the India domestic formulation business.
NOTE : 65 On February 14, 2014, an agreement (“supply contract”) was entered with Atlas Global Trading (“Atlas”), wherein, in lieu of Atlas agreeing to bear damages to the tune of USD 400 Million on account of patent infringement of generic version of “Protonix”, the Company agreed to supply pharmaceutical products at a discounted price for a specified period. Accordingly, a provision towards estimated liability was accounted for in FY 2013-14.
However, due to US-FDA cGMP issues at SPIL’s Halol facility, the Company was not able to adhere to the agreed supply schedule. Therefore, in FY 2017-18, Sun Pharma Global FZE, a wholly owned subsidiary, had funded Atlas towards this non-fulfilment of supply obligations. The said funding was included in Loans schedule of the Group’s FY 2017-18 consolidated financial statements.
During the current financial year, the parties agreed that Atlas would assign the rights and obligation under the supply contract to Sun Laboratories FZE, wholly owned subsidiary. Consequently, on March 27, 2019, Atlas assigned its rights and obligations arising from this supply contract to a wholly owned subsidiary of the Company on the same terms and conditions and settled the loan. Accordingly, provision towards supply of pharmaceutical products at a discounted price and the rights and obligations acquired by the subsidiary has been eliminated in the consolidated financial statements.
NOTE : 66 Pursuant to the scheme of arrangement, as approved by the National Company Law Tribunal, Ahmedabad Bench on October 31, 2018, unbranded generic pharmaceutical undertaking of Sun Pharma Global FZE, a wholly owned subsidiary, has been transferred to the Company w.e.f April 01, 2017. Consequently, effect of the scheme including the tax impact has been given in the consolidated financial statements in accordance with Ind AS 103 – Business Combinations. The comparatives have been restated to give effect to the merger.
NOTE : 67 DETAILS OF LONG-TERM BORROWINGS AND CURRENT MATURITIES OF LONG-TERM DEBT AND FINANCE LEASE OBLIGATIONS [INCLUDED UNDER OTHER FINANCIAL LIABILITIES (CURRENT)]A Secured term loan from other parties: Secured term loan from department of biotechnology
of ` 108.2 Million (March 31, 2018: ` 108.2 Million) has been secured by hypothecation of movable assets of the Parent Company. The loan is repayable in 10 equal half yearly installments commencing from December 14, 2019, last installment is due on June 14, 2024.
B Lease obligations of ` 1,346.4 Million (March 31, 2018: ` 1,261.9 Million) [included in non-current borrowing March 31, 2019: ` 997.4 Million (March 31, 2018: ` 1,033.4 Million) and March 31, 2019: ` 349.0 Million (March 31, 2018: ` 228.5 Million) in current maturities of long term finance lease obligations] repayable by FY 2020-24 is secured against assets taken on finance lease.
C Term loan from banks: Secured (i) Loan of USD Nil equivalent to ` Nil (March 31,
2018: USD 16.7 Million equivalent ` 1,086.5 Million [Included in non-current borrowing March 31, 2019: ` Nil (March 31, 2018: ` 1,035.3 Million) and March 31, 2019: ` Nil (March 31, 2018: ` 51.2 Million) in current maturities of long term debt], which has been repaid in current year.
Unsecured (i) Unsecured External Commercial Borrowings
(ECBs) has 6 loans aggregating of USD 290 Million (March 31, 2018: USD 256 Million) equivalent to ` 20,036.1 Million (March 31, 2018: ` 16,622.1 Million). For the ECB loans outstanding as at March 31, 2019, the terms of repayment for borrowings are as follows:
a) USD 50 Million (March 31, 2018 : USD 50 Million) equivalent to ` 3,454.5 Million (March 31, 2018 : ` 3,246.5 Million). The loan was taken on September 20, 2012 and is repayable in 2 equal installments of USD 25 Million each. The first installment of USD 25 Million is due on September 20, 2019 and last installment of USD 25 Million is due on September 18, 2020.
b) USD 100 Million (March 31, 2018 : USD 100 Million) equivalent to ` 6,909.0 Million (March 31, 2018 : ` 6,493.0 Million). The loan was taken on June 04, 2013 and is repayable in 3 installments viz., the first installment of USD 30 Million is due on May 31, 2020, second installment of USD 30 Million is due on November 30, 2020 and last installment of USD 40 Million is due on November 30, 2021.
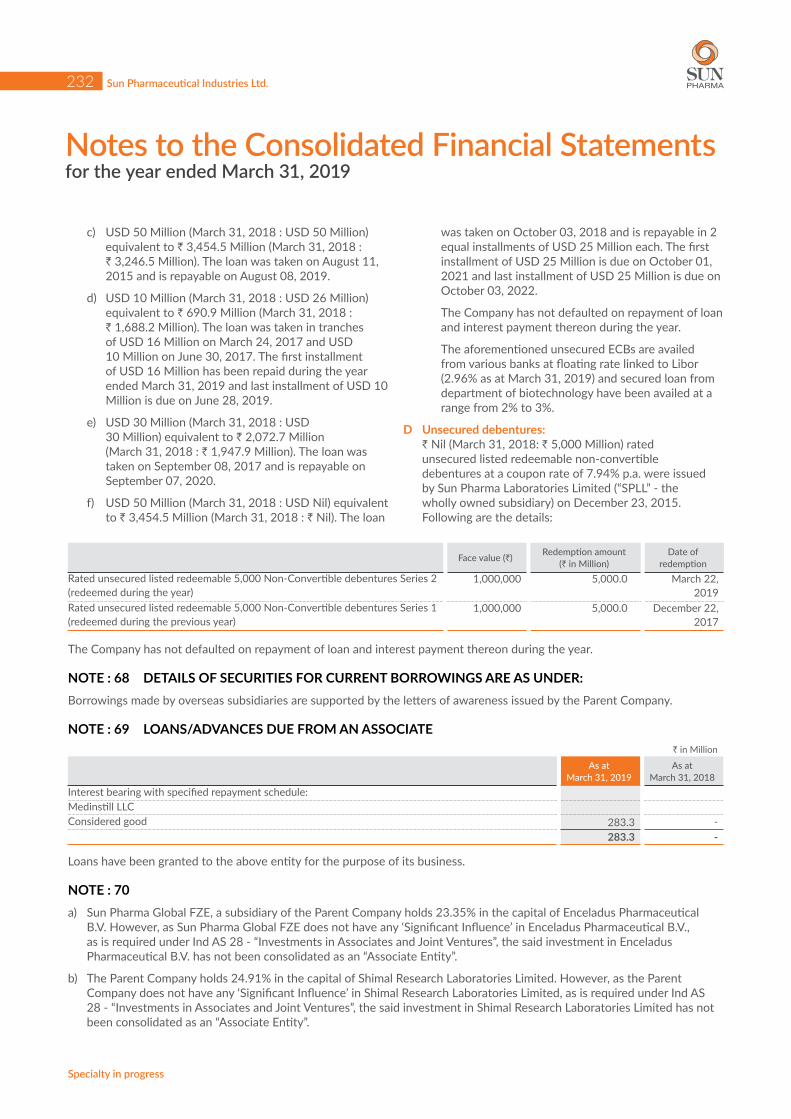
Notes to the Consolidated Financial Statementsfor the year ended March 31, 2019
Sun Pharmaceutical Industries Ltd.
Specialty in progress
232
c) USD 50 Million (March 31, 2018 : USD 50 Million) equivalent to ` 3,454.5 Million (March 31, 2018 : ` 3,246.5 Million). The loan was taken on August 11, 2015 and is repayable on August 08, 2019.
d) USD 10 Million (March 31, 2018 : USD 26 Million) equivalent to ` 690.9 Million (March 31, 2018 : ` 1,688.2 Million). The loan was taken in tranches of USD 16 Million on March 24, 2017 and USD 10 Million on June 30, 2017. The first installment of USD 16 Million has been repaid during the year ended March 31, 2019 and last installment of USD 10 Million is due on June 28, 2019.
e) USD 30 Million (March 31, 2018 : USD 30 Million) equivalent to ` 2,072.7 Million (March 31, 2018 : ` 1,947.9 Million). The loan was taken on September 08, 2017 and is repayable on September 07, 2020.
f) USD 50 Million (March 31, 2018 : USD Nil) equivalent to ` 3,454.5 Million (March 31, 2018 : ` Nil). The loan
was taken on October 03, 2018 and is repayable in 2 equal installments of USD 25 Million each. The first installment of USD 25 Million is due on October 01, 2021 and last installment of USD 25 Million is due on October 03, 2022.
The Company has not defaulted on repayment of loan and interest payment thereon during the year.
The aforementioned unsecured ECBs are availed from various banks at floating rate linked to Libor (2.96% as at March 31, 2019) and secured loan from department of biotechnology have been availed at a range from 2% to 3%.
D Unsecured debentures: Nil (March 31, 2018: ` 5,000 Million) rated
unsecured listed redeemable non-convertible debentures at a coupon rate of 7.94% p.a. were issued by Sun Pharma Laboratories Limited (“SPLL” - the wholly owned subsidiary) on December 23, 2015. Following are the details:
Face value (`) Redemption amount (` in Million)
Date of redemption
Rated unsecured listed redeemable 5,000 Non-Convertible debentures Series 2 (redeemed during the year)
1,000,000 5,000.0 March 22, 2019
Rated unsecured listed redeemable 5,000 Non-Convertible debentures Series 1 (redeemed during the previous year)
1,000,000 5,000.0 December 22, 2017
The Company has not defaulted on repayment of loan and interest payment thereon during the year.
NOTE : 68 DETAILS OF SECURITIES FOR CURRENT BORROWINGS ARE AS UNDER:Borrowings made by overseas subsidiaries are supported by the letters of awareness issued by the Parent Company.
NOTE : 69 LOANS/ADVANCES DUE FROM AN ASSOCIATE` in Million
As at March 31, 2019
As at March 31, 2018
Interest bearing with specified repayment schedule:Medinstill LLCConsidered good 283.3 -
283.3 -
Loans have been granted to the above entity for the purpose of its business.
NOTE : 70 a) Sun Pharma Global FZE, a subsidiary of the Parent Company holds 23.35% in the capital of Enceladus Pharmaceutical
B.V. However, as Sun Pharma Global FZE does not have any ‘Significant Influence’ in Enceladus Pharmaceutical B.V., as is required under Ind AS 28 - “Investments in Associates and Joint Ventures”, the said investment in Enceladus Pharmaceutical B.V. has not been consolidated as an “Associate Entity”.
b) The Parent Company holds 24.91% in the capital of Shimal Research Laboratories Limited. However, as the Parent Company does not have any ‘Significant Influence’ in Shimal Research Laboratories Limited, as is required under Ind AS 28 - “Investments in Associates and Joint Ventures”, the said investment in Shimal Research Laboratories Limited has not been consolidated as an “Associate Entity”.
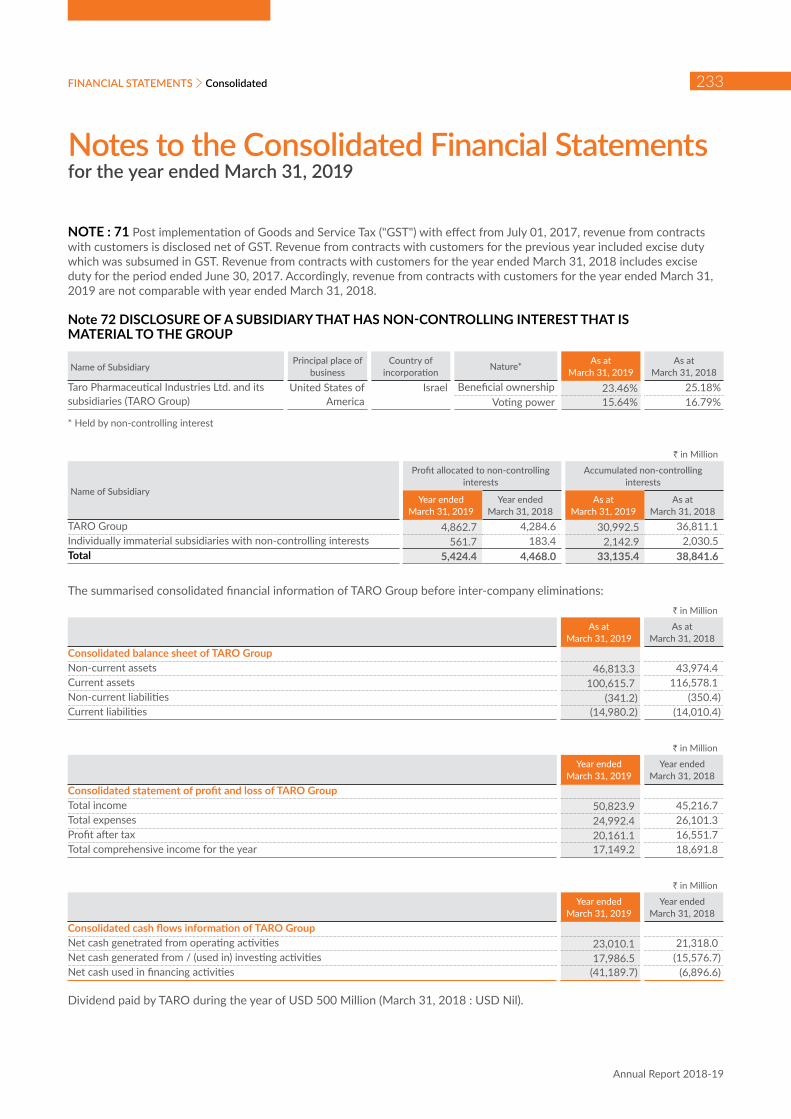
Notes to the Consolidated Financial Statementsfor the year ended March 31, 2019
FINANCIAL STATEMENTS
Annual Report 2018-19
233Consolidated
NOTE : 71 Post implementation of Goods and Service Tax ("GST") with effect from July 01, 2017, revenue from contracts with customers is disclosed net of GST. Revenue from contracts with customers for the previous year included excise duty which was subsumed in GST. Revenue from contracts with customers for the year ended March 31, 2018 includes excise duty for the period ended June 30, 2017. Accordingly, revenue from contracts with customers for the year ended March 31, 2019 are not comparable with year ended March 31, 2018.
Note 72 DISCLOSURE OF A SUBSIDIARY THAT HAS NON-CONTROLLING INTEREST THAT IS MATERIAL TO THE GROUP
Name of SubsidiaryPrincipal place of
businessCountry of
incorporation Nature* As at March 31, 2019
As at March 31, 2018
Taro Pharmaceutical Industries Ltd. and its subsidiaries (TARO Group)
United States of America
Israel Beneficial ownership 23.46% 25.18%Voting power 15.64% 16.79%
* Held by non-controlling interest
` in Million
Name of Subsidiary
Profit allocated to non-controlling interests
Accumulated non-controlling interests
Year ended March 31, 2019
Year ended March 31, 2018
As at March 31, 2019
As at March 31, 2018
TARO Group 4,862.7 4,284.6 30,992.5 36,811.1 Individually immaterial subsidiaries with non-controlling interests 561.7 183.4 2,142.9 2,030.5 Total 5,424.4 4,468.0 33,135.4 38,841.6
The summarised consolidated financial information of TARO Group before inter-company eliminations:` in Million
As at March 31, 2019
As at March 31, 2018
Consolidated balance sheet of TARO GroupNon-current assets 46,813.3 43,974.4 Current assets 100,615.7 116,578.1 Non-current liabilities (341.2) (350.4)Current liabilities (14,980.2) (14,010.4)
` in Million
Year ended March 31, 2019
Year ended March 31, 2018
Consolidated statement of profit and loss of TARO GroupTotal income 50,823.9 45,216.7 Total expenses 24,992.4 26,101.3 Profit after tax 20,161.1 16,551.7 Total comprehensive income for the year 17,149.2 18,691.8
` in Million
Year ended March 31, 2019
Year ended March 31, 2018
Consolidated cash flows information of TARO GroupNet cash genetrated from operating activities 23,010.1 21,318.0 Net cash generated from / (used in) investing activities 17,986.5 (15,576.7)Net cash used in financing activities (41,189.7) (6,896.6)
Dividend paid by TARO during the year of USD 500 Million (March 31, 2018 : USD Nil).
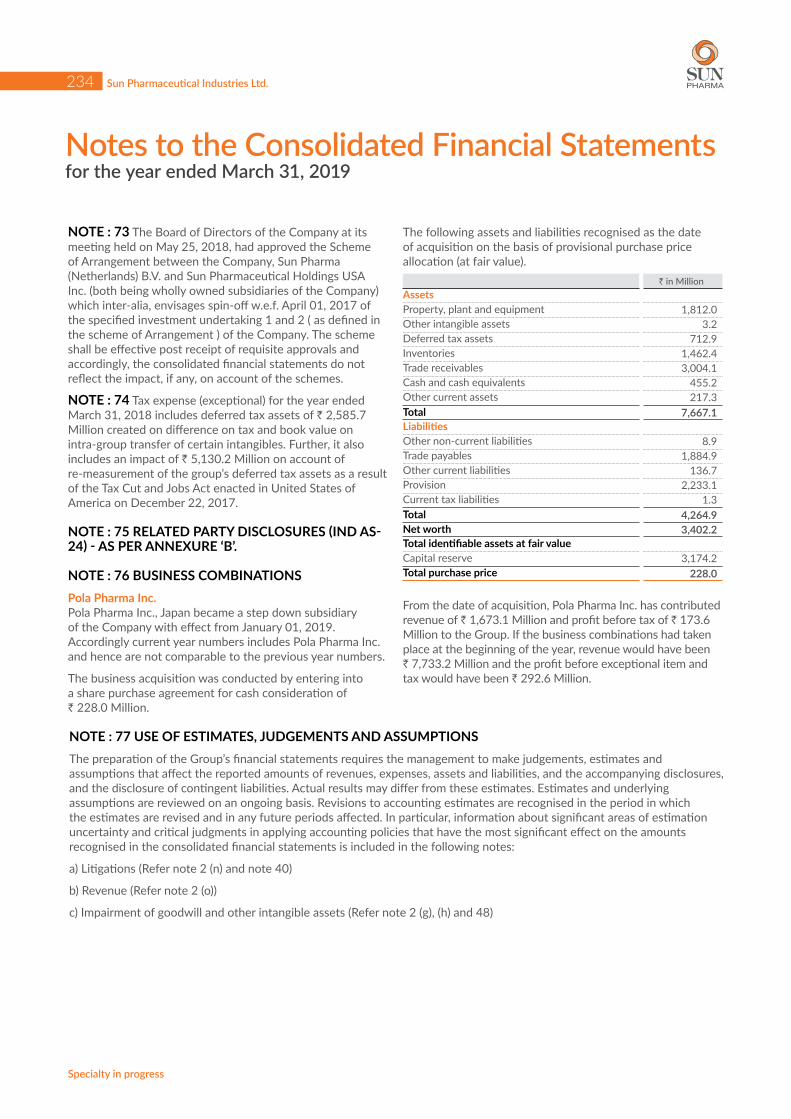
Notes to the Consolidated Financial Statementsfor the year ended March 31, 2019
Sun Pharmaceutical Industries Ltd.
Specialty in progress
234
NOTE : 73 The Board of Directors of the Company at its meeting held on May 25, 2018, had approved the Scheme of Arrangement between the Company, Sun Pharma (Netherlands) B.V. and Sun Pharmaceutical Holdings USA Inc. (both being wholly owned subsidiaries of the Company) which inter-alia, envisages spin-off w.e.f. April 01, 2017 of the specified investment undertaking 1 and 2 ( as defined in the scheme of Arrangement ) of the Company. The scheme shall be effective post receipt of requisite approvals and accordingly, the consolidated financial statements do not reflect the impact, if any, on account of the schemes.
NOTE : 74 Tax expense (exceptional) for the year ended March 31, 2018 includes deferred tax assets of ` 2,585.7 Million created on difference on tax and book value on intra-group transfer of certain intangibles. Further, it also includes an impact of ` 5,130.2 Million on account of re-measurement of the group’s deferred tax assets as a result of the Tax Cut and Jobs Act enacted in United States of America on December 22, 2017.
NOTE : 75 RELATED PARTY DISCLOSURES (IND AS-24) - AS PER ANNEXURE ‘B’.
NOTE : 76 BUSINESS COMBINATIONS Pola Pharma Inc.Pola Pharma Inc., Japan became a step down subsidiary of the Company with effect from January 01, 2019. Accordingly current year numbers includes Pola Pharma Inc. and hence are not comparable to the previous year numbers.
The business acquisition was conducted by entering into a share purchase agreement for cash consideration of ` 228.0 Million.
The following assets and liabilities recognised as the date of acquisition on the basis of provisional purchase price allocation (at fair value).
` in MillionAssetsProperty, plant and equipment 1,812.0 Other intangible assets 3.2 Deferred tax assets 712.9 Inventories 1,462.4 Trade receivables 3,004.1 Cash and cash equivalents 455.2 Other current assets 217.3 Total 7,667.1 LiabilitiesOther non-current liabilities 8.9 Trade payables 1,884.9 Other current liabilities 136.7 Provision 2,233.1 Current tax liabilities 1.3 Total 4,264.9 Net worth 3,402.2 Total identifiable assets at fair valueCapital reserve 3,174.2 Total purchase price 228.0
From the date of acquisition, Pola Pharma Inc. has contributed revenue of ` 1,673.1 Million and profit before tax of ` 173.6 Million to the Group. If the business combinations had taken place at the beginning of the year, revenue would have been ` 7,733.2 Million and the profit before exceptional item and tax would have been ` 292.6 Million.
NOTE : 77 USE OF ESTIMATES, JUDGEMENTS AND ASSUMPTIONSThe preparation of the Group’s financial statements requires the management to make judgements, estimates and assumptions that affect the reported amounts of revenues, expenses, assets and liabilities, and the accompanying disclosures, and the disclosure of contingent liabilities. Actual results may differ from these estimates. Estimates and underlying assumptions are reviewed on an ongoing basis. Revisions to accounting estimates are recognised in the period in which the estimates are revised and in any future periods affected. In particular, information about significant areas of estimation uncertainty and critical judgments in applying accounting policies that have the most significant effect on the amounts recognised in the consolidated financial statements is included in the following notes:
a) Litigations (Refer note 2 (n) and note 40)
b) Revenue (Refer note 2 (o))
c) Impairment of goodwill and other intangible assets (Refer note 2 (g), (h) and 48)
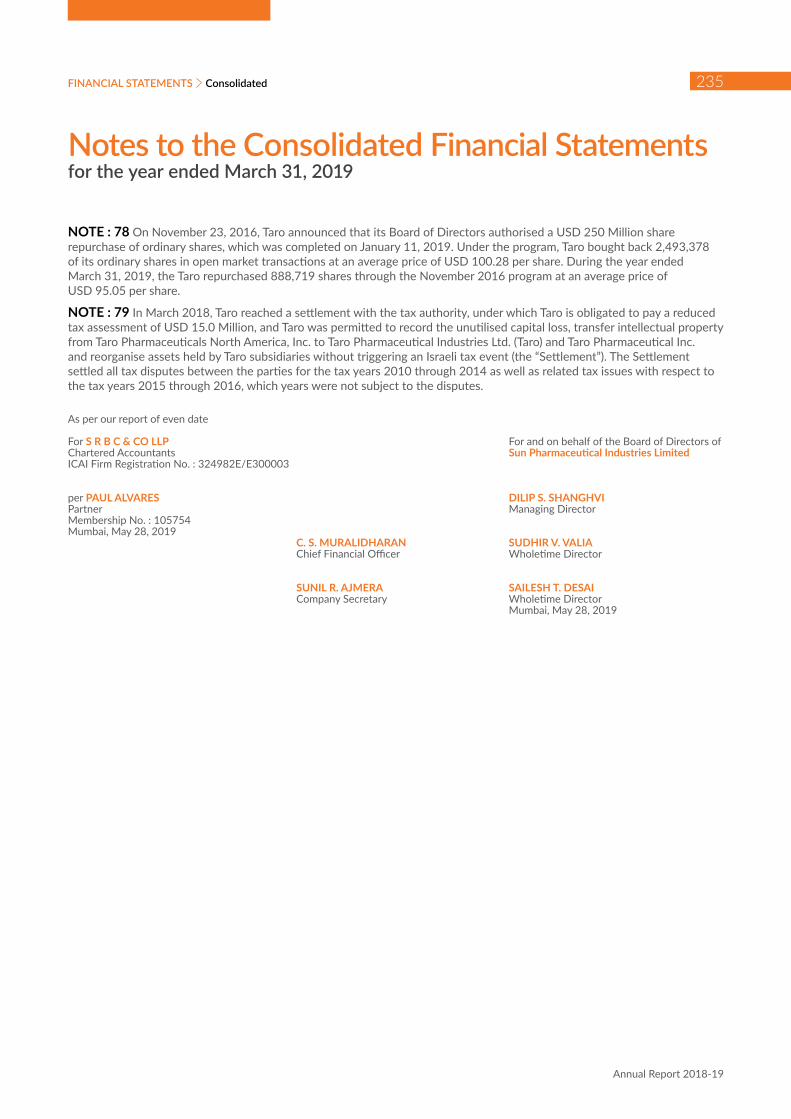
Notes to the Consolidated Financial Statementsfor the year ended March 31, 2019
FINANCIAL STATEMENTS
Annual Report 2018-19
235Consolidated
NOTE : 78 On November 23, 2016, Taro announced that its Board of Directors authorised a USD 250 Million share repurchase of ordinary shares, which was completed on January 11, 2019. Under the program, Taro bought back 2,493,378 of its ordinary shares in open market transactions at an average price of USD 100.28 per share. During the year ended March 31, 2019, the Taro repurchased 888,719 shares through the November 2016 program at an average price of USD 95.05 per share.
NOTE : 79 In March 2018, Taro reached a settlement with the tax authority, under which Taro is obligated to pay a reduced tax assessment of USD 15.0 Million, and Taro was permitted to record the unutilised capital loss, transfer intellectual property from Taro Pharmaceuticals North America, Inc. to Taro Pharmaceutical Industries Ltd. (Taro) and Taro Pharmaceutical Inc. and reorganise assets held by Taro subsidiaries without triggering an Israeli tax event (the “Settlement”). The Settlement settled all tax disputes between the parties for the tax years 2010 through 2014 as well as related tax issues with respect to the tax years 2015 through 2016, which years were not subject to the disputes.
As per our report of even date
For S R B C & CO LLP For and on behalf of the Board of Directors of Chartered Accountants Sun Pharmaceutical Industries LimitedICAI Firm Registration No. : 324982E/E300003
per PAUL ALVARES DILIP S. SHANGHVIPartner Managing DirectorMembership No. : 105754Mumbai, May 28, 2019
C. S. MURALIDHARAN SUDHIR V. VALIA Chief Financial Officer Wholetime Director
SUNIL R. AJMERA SAILESH T. DESAI Company Secretary Wholetime Director
Mumbai, May 28, 2019
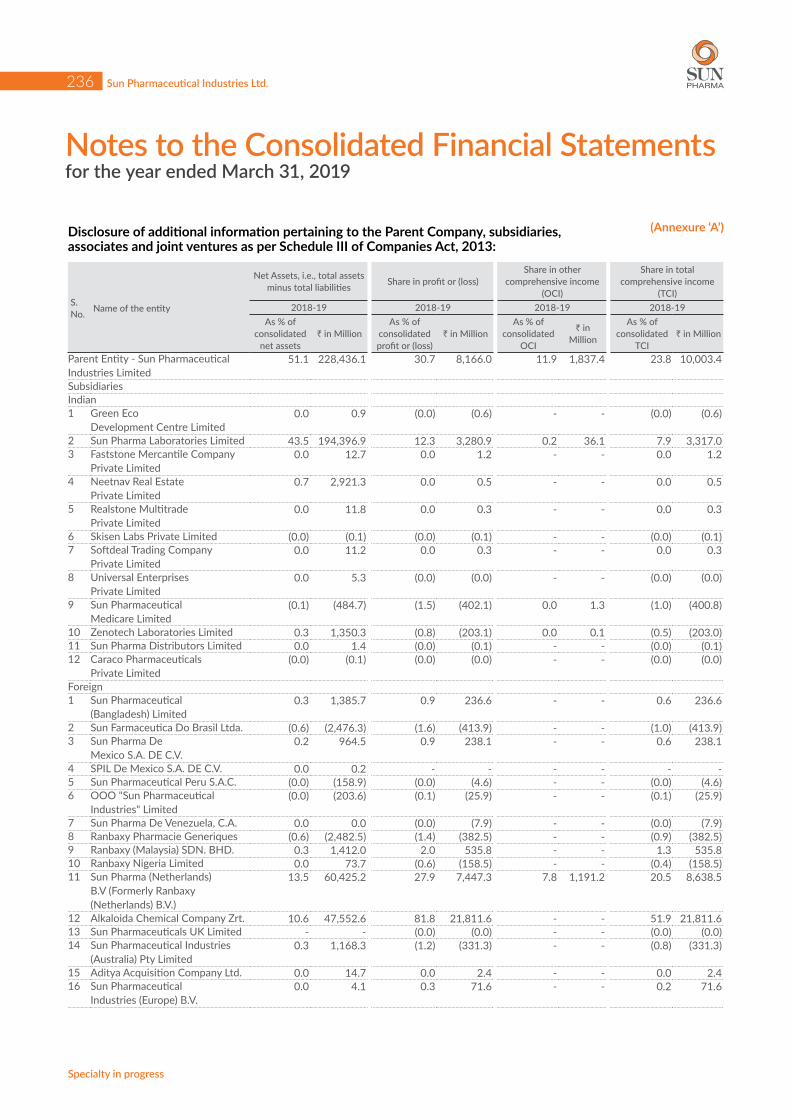
Notes to the Consolidated Financial Statementsfor the year ended March 31, 2019
Sun Pharmaceutical Industries Ltd.
Specialty in progress
236
Disclosure of additional information pertaining to the Parent Company, subsidiaries, associates and joint ventures as per Schedule III of Companies Act, 2013:
(Annexure ‘A’)
S. No. Name of the entity
Net Assets, i.e., total assets minus total liabilities Share in profit or (loss)
Share in other comprehensive income
(OCI)
Share in total comprehensive income
(TCI)2018-19 2018-19 2018-19 2018-19
As % of consolidated
net assets` in Million
As % of consolidated profit or (loss)
` in MillionAs % of
consolidated OCI
` in Million
As % of consolidated
TCI` in Million
Parent Entity - Sun Pharmaceutical Industries Limited
51.1 228,436.1 30.7 8,166.0 11.9 1,837.4 23.8 10,003.4
Subsidiaries Indian 1 Green Eco
Development Centre Limited 0.0 0.9 (0.0) (0.6) - - (0.0) (0.6)
2 Sun Pharma Laboratories Limited 43.5 194,396.9 12.3 3,280.9 0.2 36.1 7.9 3,317.0 3 Faststone Mercantile Company
Private Limited 0.0 12.7 0.0 1.2 - - 0.0 1.2
4 Neetnav Real Estate Private Limited
0.7 2,921.3 0.0 0.5 - - 0.0 0.5
5 Realstone Multitrade Private Limited
0.0 11.8 0.0 0.3 - - 0.0 0.3
6 Skisen Labs Private Limited (0.0) (0.1) (0.0) (0.1) - - (0.0) (0.1)7 Softdeal Trading Company
Private Limited 0.0 11.2 0.0 0.3 - - 0.0 0.3
8 Universal Enterprises Private Limited
0.0 5.3 (0.0) (0.0) - - (0.0) (0.0)
9 Sun Pharmaceutical Medicare Limited
(0.1) (484.7) (1.5) (402.1) 0.0 1.3 (1.0) (400.8)
10 Zenotech Laboratories Limited 0.3 1,350.3 (0.8) (203.1) 0.0 0.1 (0.5) (203.0)11 Sun Pharma Distributors Limited 0.0 1.4 (0.0) (0.1) - - (0.0) (0.1)12 Caraco Pharmaceuticals
Private Limited (0.0) (0.1) (0.0) (0.0) - - (0.0) (0.0)
Foreign 1 Sun Pharmaceutical
(Bangladesh) Limited 0.3 1,385.7 0.9 236.6 - - 0.6 236.6
2 Sun Farmaceutica Do Brasil Ltda. (0.6) (2,476.3) (1.6) (413.9) - - (1.0) (413.9)3 Sun Pharma De
Mexico S.A. DE C.V. 0.2 964.5 0.9 238.1 - - 0.6 238.1
4 SPIL De Mexico S.A. DE C.V. 0.0 0.2 - - - - - - 5 Sun Pharmaceutical Peru S.A.C. (0.0) (158.9) (0.0) (4.6) - - (0.0) (4.6)6 OOO "Sun Pharmaceutical
Industries" Limited (0.0) (203.6) (0.1) (25.9) - - (0.1) (25.9)
7 Sun Pharma De Venezuela, C.A. 0.0 0.0 (0.0) (7.9) - - (0.0) (7.9)8 Ranbaxy Pharmacie Generiques (0.6) (2,482.5) (1.4) (382.5) - - (0.9) (382.5)9 Ranbaxy (Malaysia) SDN. BHD. 0.3 1,412.0 2.0 535.8 - - 1.3 535.8 10 Ranbaxy Nigeria Limited 0.0 73.7 (0.6) (158.5) - - (0.4) (158.5)11 Sun Pharma (Netherlands)
B.V (Formerly Ranbaxy (Netherlands) B.V.)
13.5 60,425.2 27.9 7,447.3 7.8 1,191.2 20.5 8,638.5
12 Alkaloida Chemical Company Zrt. 10.6 47,552.6 81.8 21,811.6 - - 51.9 21,811.6 13 Sun Pharmaceuticals UK Limited - - (0.0) (0.0) - - (0.0) (0.0)14 Sun Pharmaceutical Industries
(Australia) Pty Limited 0.3 1,168.3 (1.2) (331.3) - - (0.8) (331.3)
15 Aditya Acquisition Company Ltd. 0.0 14.7 0.0 2.4 - - 0.0 2.4 16 Sun Pharmaceutical
Industries (Europe) B.V. 0.0 4.1 0.3 71.6 - - 0.2 71.6
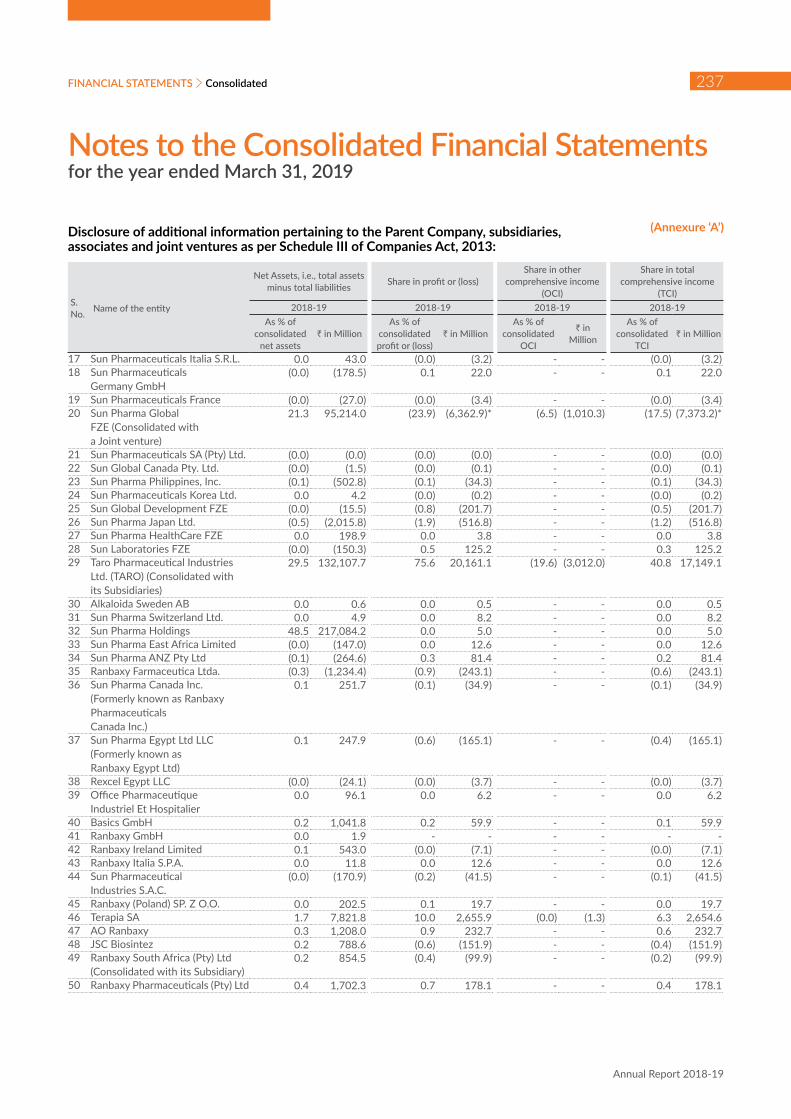
Notes to the Consolidated Financial Statementsfor the year ended March 31, 2019
FINANCIAL STATEMENTS
Annual Report 2018-19
237Consolidated
Disclosure of additional information pertaining to the Parent Company, subsidiaries, associates and joint ventures as per Schedule III of Companies Act, 2013:
(Annexure ‘A’)
S. No. Name of the entity
Net Assets, i.e., total assets minus total liabilities Share in profit or (loss)
Share in other comprehensive income
(OCI)
Share in total comprehensive income
(TCI)2018-19 2018-19 2018-19 2018-19
As % of consolidated
net assets` in Million
As % of consolidated profit or (loss)
` in MillionAs % of
consolidated OCI
` in Million
As % of consolidated
TCI` in Million
17 Sun Pharmaceuticals Italia S.R.L. 0.0 43.0 (0.0) (3.2) - - (0.0) (3.2)18 Sun Pharmaceuticals
Germany GmbH (0.0) (178.5) 0.1 22.0 - - 0.1 22.0
19 Sun Pharmaceuticals France (0.0) (27.0) (0.0) (3.4) - - (0.0) (3.4)20 Sun Pharma Global
FZE (Consolidated with a Joint venture)
21.3 95,214.0 (23.9) (6,362.9)* (6.5) (1,010.3) (17.5) (7,373.2)*
21 Sun Pharmaceuticals SA (Pty) Ltd. (0.0) (0.0) (0.0) (0.0) - - (0.0) (0.0)22 Sun Global Canada Pty. Ltd. (0.0) (1.5) (0.0) (0.1) - - (0.0) (0.1)23 Sun Pharma Philippines, Inc. (0.1) (502.8) (0.1) (34.3) - - (0.1) (34.3)24 Sun Pharmaceuticals Korea Ltd. 0.0 4.2 (0.0) (0.2) - - (0.0) (0.2)25 Sun Global Development FZE (0.0) (15.5) (0.8) (201.7) - - (0.5) (201.7)26 Sun Pharma Japan Ltd. (0.5) (2,015.8) (1.9) (516.8) - - (1.2) (516.8)27 Sun Pharma HealthCare FZE 0.0 198.9 0.0 3.8 - - 0.0 3.8 28 Sun Laboratories FZE (0.0) (150.3) 0.5 125.2 - - 0.3 125.2 29 Taro Pharmaceutical Industries
Ltd. (TARO) (Consolidated with its Subsidiaries)
29.5 132,107.7 75.6 20,161.1 (19.6) (3,012.0) 40.8 17,149.1
30 Alkaloida Sweden AB 0.0 0.6 0.0 0.5 - - 0.0 0.5 31 Sun Pharma Switzerland Ltd. 0.0 4.9 0.0 8.2 - - 0.0 8.2 32 Sun Pharma Holdings 48.5 217,084.2 0.0 5.0 - - 0.0 5.0 33 Sun Pharma East Africa Limited (0.0) (147.0) 0.0 12.6 - - 0.0 12.6 34 Sun Pharma ANZ Pty Ltd (0.1) (264.6) 0.3 81.4 - - 0.2 81.4 35 Ranbaxy Farmaceutica Ltda. (0.3) (1,234.4) (0.9) (243.1) - - (0.6) (243.1)36 Sun Pharma Canada Inc.
(Formerly known as Ranbaxy Pharmaceuticals Canada Inc.)
0.1 251.7 (0.1) (34.9) - - (0.1) (34.9)
37 Sun Pharma Egypt Ltd LLC (Formerly known as Ranbaxy Egypt Ltd)
0.1 247.9 (0.6) (165.1) - - (0.4) (165.1)
38 Rexcel Egypt LLC (0.0) (24.1) (0.0) (3.7) - - (0.0) (3.7)39 Office Pharmaceutique
Industriel Et Hospitalier 0.0 96.1 0.0 6.2 - - 0.0 6.2
40 Basics GmbH 0.2 1,041.8 0.2 59.9 - - 0.1 59.9 41 Ranbaxy GmbH 0.0 1.9 - - - - - - 42 Ranbaxy Ireland Limited 0.1 543.0 (0.0) (7.1) - - (0.0) (7.1)43 Ranbaxy Italia S.P.A. 0.0 11.8 0.0 12.6 - - 0.0 12.6 44 Sun Pharmaceutical
Industries S.A.C. (0.0) (170.9) (0.2) (41.5) - - (0.1) (41.5)
45 Ranbaxy (Poland) SP. Z O.O. 0.0 202.5 0.1 19.7 - - 0.0 19.7 46 Terapia SA 1.7 7,821.8 10.0 2,655.9 (0.0) (1.3) 6.3 2,654.6 47 AO Ranbaxy 0.3 1,208.0 0.9 232.7 - - 0.6 232.7 48 JSC Biosintez 0.2 788.6 (0.6) (151.9) - - (0.4) (151.9)49 Ranbaxy South Africa (Pty) Ltd
(Consolidated with its Subsidiary) 0.2 854.5 (0.4) (99.9) - - (0.2) (99.9)
50 Ranbaxy Pharmaceuticals (Pty) Ltd 0.4 1,702.3 0.7 178.1 - - 0.4 178.1

Notes to the Consolidated Financial Statementsfor the year ended March 31, 2019
Sun Pharmaceutical Industries Ltd.
Specialty in progress
238
S. No. Name of the entity
Net Assets, i.e., total assets minus total liabilities Share in profit or (loss)
Share in other comprehensive income
(OCI)
Share in total comprehensive income
(TCI)2018-19 2018-19 2018-19 2018-19
As % of consolidated
net assets` in Million
As % of consolidated profit or (loss)
` in MillionAs % of
consolidated OCI
` in Million
As % of consolidated
TCI` in Million
51 Be- Tabs Investments (Pty) Ltd
- - (0.0) (0.0) - - (0.0) (0.0)
52 Laboratorios Ranbaxy, S.L.U. 0.1 415.5 0.3 77.4 - - 0.2 77.4 53 Ranbaxy (U.K.) Limited 0.3 1,414.1 0.2 60.1 - - 0.1 60.1 54 Ranbaxy Holdings (U.K.) Limited 0.6 2,775.3 0.0 0.6 - - 0.0 0.6 55 Ranbaxy Europe Limited - - (0.0) (0.0) - - (0.0) (0.0)56 Sun Pharmaceutical Holding
USA Inc (Consolidated with its Subsidiaries and its Associate)
12.9 57,593.1 21.5 5,741.5# (1.5) (230.9) 13.1 5,510.6#
57 Ranbaxy (Thailand) Co., Ltd. 0.0 219.1 0.0 3.2 - - 0.0 3.2 58 Sun Pharmaceuticals
Morocco LLC (0.0) (39.8) 0.1 33.5 - - 0.1 33.5
59 "Ranbaxy Pharmaceuticals Ukraine" LLC
0.1 245.8 0.3 82.4 - - 0.2 82.4
60 Pola Pharma Inc. (Consolidated with its Subsidiary)
0.8 3,514.2 0.6 154.8 - - 0.4 154.8
Non controlling interest in all subsidiaries
7.4 33,135.4 (20.4) (5,424.4) (9.1) (1,400.0) (16.2) (6,824.4)
Intercompany Elimination and Consolidation Adjustments
(143.3) (641,086.2) (111.1) (29,652.0) 116.8 17,988.3 (27.7) (11,663.7)
Total 100.0 447,226.0 100.0 26,654.2 100.0 15,399.9 100.0 42,054.1
# Includes share of loss and share of TCI, from its associate of ` 140.5 Million* Includes share of loss and share of TCI, from a joint venture of ` 7.5 MillionNote: The above amounts / percentage of net assets and net profit or (loss) in respect of the Parent Company, its subsidiaries, associates and joint ventures are determined based on the amounts of the respective entities included in consolidated financial statements before inter-company eliminations / consolidation adjustments.
Disclosure of additional information pertaining to the Parent Company, subsidiaries, associates and joint ventures as per Schedule III of Companies Act, 2013:
(Annexure ‘A’)

Notes to the Consolidated Financial Statementsfor the year ended March 31, 2019
FINANCIAL STATEMENTS
Annual Report 2018-19
239Consolidated
Disclosure of additional information pertaining to the Parent Company, subsidiaries, associates and joint ventures as per Schedule III of Companies Act, 2013:
(Annexure ‘A’)
S. No. Name of the entity
Net Assets, i.e., total assets minus total liabilities Share in profit or (loss)
Share in other comprehensive income
(OCI)
Share in total comprehensive income
(TCI)2017-18 2017-18 2017-18 2017-18
As % of consolidated
net assets` in Million
As % of consolidated profit or (loss)
` in MillionAs % of
consolidated OCI
` in Million
As % of consolidated
TCI` in Million
Parent Entity - Sun Pharmaceutical Industries Limited
52.9 223,226.1 14.6 3,056.4 11.9 566.9 14.1 3,623.3
Subsidiaries Indian1 Green Eco Development
Centre Limited 0.0 1.6 (0.0) (0.1) - - (0.0) (0.1)
2 Sun Pharma Laboratories Limited 46.6 196,823.7 41.8 8,762.2 1.6 78.1 34.4 8,840.3 3 Faststone Mercantile Company
Private Limited 0.0 11.5 0.0 0.4 - - 0.0 0.4
4 Neetnav Real Estate Private Limited
0.7 2,920.9 0.0 0.6 - - 0.0 0.6
5 Realstone Multitrade Private Limited
0.0 11.5 0.0 0.4 - - 0.0 0.4
6 Skisen Labs Private Limited 0.0 0.0 0.0 0.0 - - 0.0 0.0 7 Softdeal Trading Company
Private Limited 0.0 11.0 0.0 0.4 - - 0.0 0.4
8 Universal Enterprises Private Limited
0.0 5.3 0.0 0.0 - - 0.0 0.0
9 Sun Pharmaceutical Medicare Limited
(0.0) (83.9) (0.3) (61.4) (0.2) (11.5) (0.3) (72.9)
10 Zenotech Laboratories Limited 0.4 1,553.4 (0.8) (159.0)** 0.0 0.5 (0.6) (158.5) **Foreign1 Sun Pharmaceutical
(Bangladesh) Limited 0.3 1,084.7 0.9 187.8 - - 0.7 187.8
2 Sun Farmaceutica Do Brasil Ltda. (0.5) (2,289.9) (1.0) (199.1) - - (0.8) (199.1)3 Sun Pharma De
Mexico S.A. DE C.V. 0.2 717.1 1.1 223.5 - - 0.9 223.5
4 SPIL De Mexico S.A. DE C.V. 0.0 0.2 - - - - - - 5 Sun Pharmaceutical Peru S.A.C. (0.0) (149.3) 0.0 1.8 - - 0.0 1.8 6 OOO "Sun Pharmaceutical
Industries" Limited (0.0) (187.8) (0.1) (10.0) - - (0.0) (10.0)
7 Sun Pharma De Venezuela, C.A. (0.0) (2.6) (0.0) (0.7) - - (0.0) (0.7)8 Ranbaxy Pharmacie Generiques (0.5) (2,199.2) (1.2) (257.9) - - (1.0) (257.9)9 Ranbaxy (Malaysia) SDN. BHD. 0.2 877.7 2.2 455.7 - - 1.8 455.7 10 Ranbaxy Nigeria Limited 0.1 211.2 (1.6) (343.5) - - (1.4) (343.5)11 Sun Pharma (Netherlands)
B.V (Formerly Ranbaxy (Netherlands) B.V.)
12.5 52,694.6 (5.1) (1,077.4) 3.0 143.1 (3.6) (934.3)
12 Alkaloida Chemical Company Zrt. 5.8 24,387.2 (0.8) (163.4) - - (0.6) (163.4)13 Sun Pharmaceuticals UK Limited 0.0 0.0 0.5 95.2 - - 0.4 95.2 14 Sun Pharmaceutical Industries
(Australia) Pty Limited 0.4 1,512.7 (5.8) (1,220.1) - - (4.7) (1,220.1)
15 Aditya Acquisition Company Ltd. 0.0 12.0 0.0 5.6 - - 0.0 5.6 16 Sun Pharmaceutical
Industries (Europe) B.V. (0.0) (66.0) 0.3 62.0 - - 0.2 62.0
17 Sun Pharmaceuticals Italia S.R.L. 0.0 46.1 (0.0) (0.9) - - (0.0) (0.9)18 Sun Pharmaceuticals
Germany GmbH (0.0) (207.2) 0.1 15.0 - - 0.1 15.0
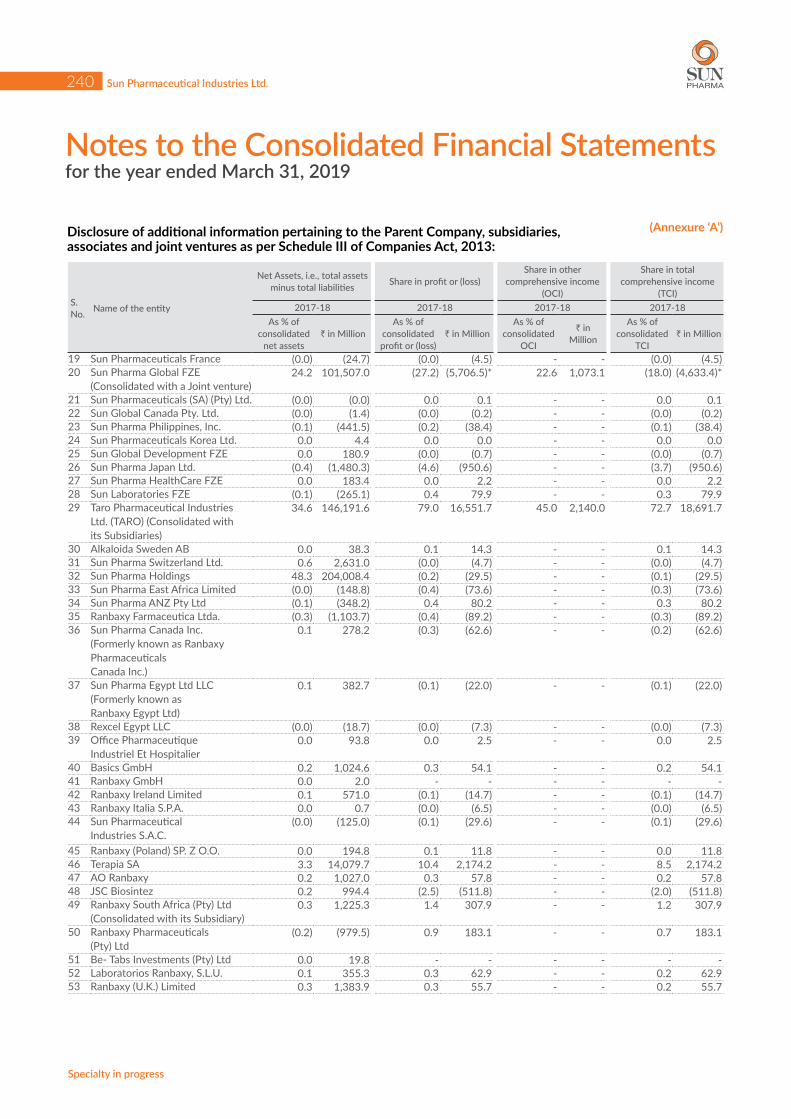
Notes to the Consolidated Financial Statementsfor the year ended March 31, 2019
Sun Pharmaceutical Industries Ltd.
Specialty in progress
240
S. No. Name of the entity
Net Assets, i.e., total assets minus total liabilities Share in profit or (loss)
Share in other comprehensive income
(OCI)
Share in total comprehensive income
(TCI)2017-18 2017-18 2017-18 2017-18
As % of consolidated
net assets` in Million
As % of consolidated profit or (loss)
` in MillionAs % of
consolidated OCI
` in Million
As % of consolidated
TCI` in Million
19 Sun Pharmaceuticals France (0.0) (24.7) (0.0) (4.5) - - (0.0) (4.5)20 Sun Pharma Global FZE
(Consolidated with a Joint venture) 24.2 101,507.0 (27.2) (5,706.5)* 22.6 1,073.1 (18.0) (4,633.4)*
21 Sun Pharmaceuticals (SA) (Pty) Ltd. (0.0) (0.0) 0.0 0.1 - - 0.0 0.1 22 Sun Global Canada Pty. Ltd. (0.0) (1.4) (0.0) (0.2) - - (0.0) (0.2)23 Sun Pharma Philippines, Inc. (0.1) (441.5) (0.2) (38.4) - - (0.1) (38.4)24 Sun Pharmaceuticals Korea Ltd. 0.0 4.4 0.0 0.0 - - 0.0 0.0 25 Sun Global Development FZE 0.0 180.9 (0.0) (0.7) - - (0.0) (0.7)26 Sun Pharma Japan Ltd. (0.4) (1,480.3) (4.6) (950.6) - - (3.7) (950.6)27 Sun Pharma HealthCare FZE 0.0 183.4 0.0 2.2 - - 0.0 2.2 28 Sun Laboratories FZE (0.1) (265.1) 0.4 79.9 - - 0.3 79.9 29 Taro Pharmaceutical Industries
Ltd. (TARO) (Consolidated with its Subsidiaries)
34.6 146,191.6 79.0 16,551.7 45.0 2,140.0 72.7 18,691.7
30 Alkaloida Sweden AB 0.0 38.3 0.1 14.3 - - 0.1 14.3 31 Sun Pharma Switzerland Ltd. 0.6 2,631.0 (0.0) (4.7) - - (0.0) (4.7)32 Sun Pharma Holdings 48.3 204,008.4 (0.2) (29.5) - - (0.1) (29.5)33 Sun Pharma East Africa Limited (0.0) (148.8) (0.4) (73.6) - - (0.3) (73.6)34 Sun Pharma ANZ Pty Ltd (0.1) (348.2) 0.4 80.2 - - 0.3 80.2 35 Ranbaxy Farmaceutica Ltda. (0.3) (1,103.7) (0.4) (89.2) - - (0.3) (89.2)36 Sun Pharma Canada Inc.
(Formerly known as Ranbaxy Pharmaceuticals Canada Inc.)
0.1 278.2 (0.3) (62.6) - - (0.2) (62.6)
37 Sun Pharma Egypt Ltd LLC (Formerly known as Ranbaxy Egypt Ltd)
0.1 382.7 (0.1) (22.0) - - (0.1) (22.0)
38 Rexcel Egypt LLC (0.0) (18.7) (0.0) (7.3) - - (0.0) (7.3)39 Office Pharmaceutique
Industriel Et Hospitalier 0.0 93.8 0.0 2.5 - - 0.0 2.5
40 Basics GmbH 0.2 1,024.6 0.3 54.1 - - 0.2 54.1 41 Ranbaxy GmbH 0.0 2.0 - - - - - - 42 Ranbaxy Ireland Limited 0.1 571.0 (0.1) (14.7) - - (0.1) (14.7)43 Ranbaxy Italia S.P.A. 0.0 0.7 (0.0) (6.5) - - (0.0) (6.5)44 Sun Pharmaceutical
Industries S.A.C. (0.0) (125.0) (0.1) (29.6) - - (0.1) (29.6)
45 Ranbaxy (Poland) SP. Z O.O. 0.0 194.8 0.1 11.8 - - 0.0 11.8 46 Terapia SA 3.3 14,079.7 10.4 2,174.2 - - 8.5 2,174.2 47 AO Ranbaxy 0.2 1,027.0 0.3 57.8 - - 0.2 57.8 48 JSC Biosintez 0.2 994.4 (2.5) (511.8) - - (2.0) (511.8)49 Ranbaxy South Africa (Pty) Ltd
(Consolidated with its Subsidiary) 0.3 1,225.3 1.4 307.9 - - 1.2 307.9
50 Ranbaxy Pharmaceuticals (Pty) Ltd
(0.2) (979.5) 0.9 183.1 - - 0.7 183.1
51 Be- Tabs Investments (Pty) Ltd 0.0 19.8 - - - - - - 52 Laboratorios Ranbaxy, S.L.U. 0.1 355.3 0.3 62.9 - - 0.2 62.9 53 Ranbaxy (U.K.) Limited 0.3 1,383.9 0.3 55.7 - - 0.2 55.7
Disclosure of additional information pertaining to the Parent Company, subsidiaries, associates and joint ventures as per Schedule III of Companies Act, 2013:
(Annexure ‘A’)
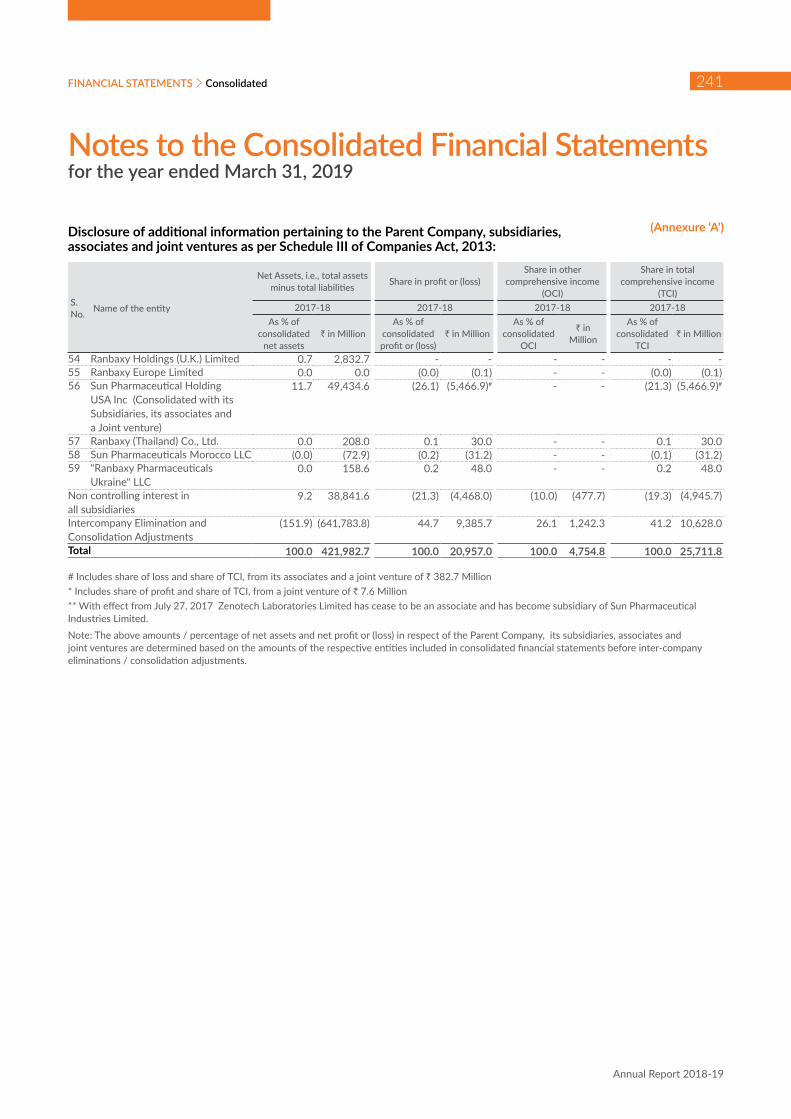
Notes to the Consolidated Financial Statementsfor the year ended March 31, 2019
FINANCIAL STATEMENTS
Annual Report 2018-19
241Consolidated
S. No. Name of the entity
Net Assets, i.e., total assets minus total liabilities Share in profit or (loss)
Share in other comprehensive income
(OCI)
Share in total comprehensive income
(TCI)2017-18 2017-18 2017-18 2017-18
As % of consolidated
net assets` in Million
As % of consolidated profit or (loss)
` in MillionAs % of
consolidated OCI
` in Million
As % of consolidated
TCI` in Million
54 Ranbaxy Holdings (U.K.) Limited 0.7 2,832.7 - - - - - - 55 Ranbaxy Europe Limited 0.0 0.0 (0.0) (0.1) - - (0.0) (0.1)56 Sun Pharmaceutical Holding
USA Inc (Consolidated with its Subsidiaries, its associates and a Joint venture)
11.7 49,434.6 (26.1) (5,466.9)# - - (21.3) (5,466.9)#
57 Ranbaxy (Thailand) Co., Ltd. 0.0 208.0 0.1 30.0 - - 0.1 30.0 58 Sun Pharmaceuticals Morocco LLC (0.0) (72.9) (0.2) (31.2) - - (0.1) (31.2)59 "Ranbaxy Pharmaceuticals
Ukraine" LLC 0.0 158.6 0.2 48.0 - - 0.2 48.0
Non controlling interest in all subsidiaries
9.2 38,841.6 (21.3) (4,468.0) (10.0) (477.7) (19.3) (4,945.7)
Intercompany Elimination and Consolidation Adjustments
(151.9) (641,783.8) 44.7 9,385.7 26.1 1,242.3 41.2 10,628.0
Total 100.0 421,982.7 100.0 20,957.0 100.0 4,754.8 100.0 25,711.8
# Includes share of loss and share of TCI, from its associates and a joint venture of ` 382.7 Million* Includes share of profit and share of TCI, from a joint venture of ` 7.6 Million** With effect from July 27, 2017 Zenotech Laboratories Limited has cease to be an associate and has become subsidiary of Sun Pharmaceutical Industries Limited.Note: The above amounts / percentage of net assets and net profit or (loss) in respect of the Parent Company, its subsidiaries, associates and joint ventures are determined based on the amounts of the respective entities included in consolidated financial statements before inter-company eliminations / consolidation adjustments.
Disclosure of additional information pertaining to the Parent Company, subsidiaries, associates and joint ventures as per Schedule III of Companies Act, 2013:
(Annexure ‘A’)
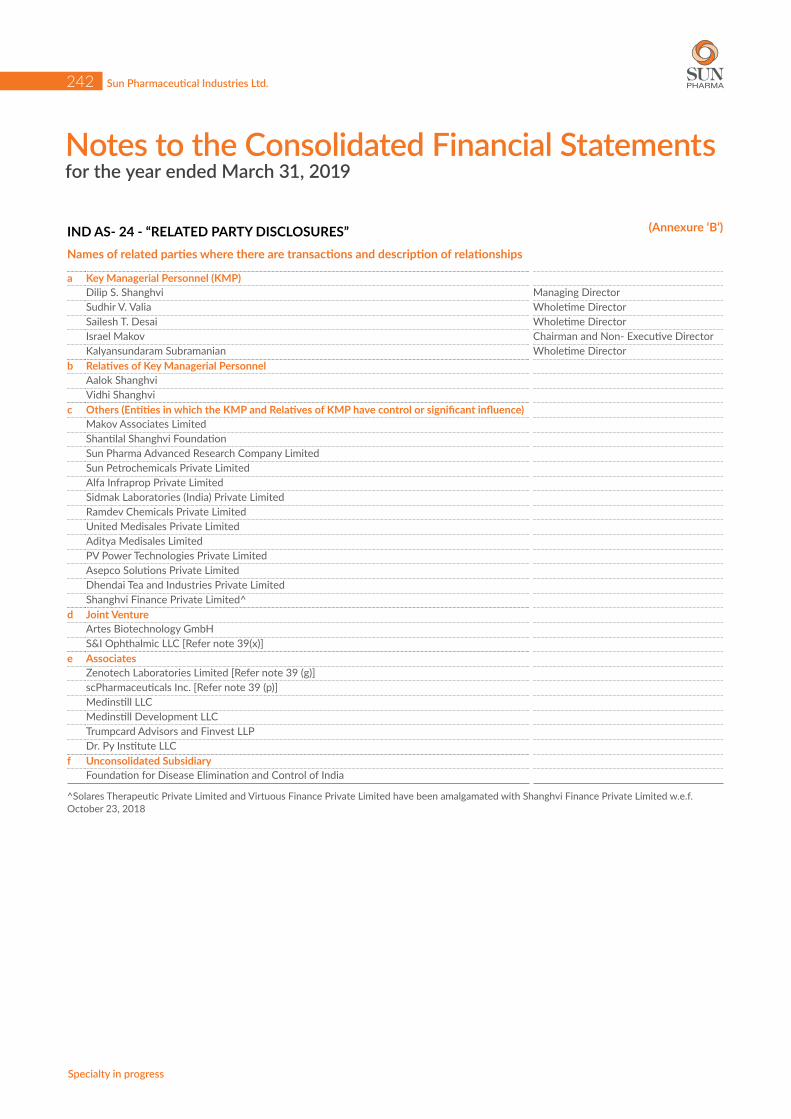
Notes to the Consolidated Financial Statementsfor the year ended March 31, 2019
Sun Pharmaceutical Industries Ltd.
Specialty in progress
242
IND AS- 24 - “RELATED PARTY DISCLOSURES”Names of related parties where there are transactions and description of relationships
a Key Managerial Personnel (KMP)Dilip S. Shanghvi Managing DirectorSudhir V. Valia Wholetime DirectorSailesh T. Desai Wholetime DirectorIsrael Makov Chairman and Non- Executive DirectorKalyansundaram Subramanian Wholetime Director
b Relatives of Key Managerial Personnel Aalok ShanghviVidhi Shanghvi
c Others (Entities in which the KMP and Relatives of KMP have control or significant influence)Makov Associates LimitedShantilal Shanghvi FoundationSun Pharma Advanced Research Company LimitedSun Petrochemicals Private LimitedAlfa Infraprop Private LimitedSidmak Laboratories (India) Private LimitedRamdev Chemicals Private LimitedUnited Medisales Private LimitedAditya Medisales Limited PV Power Technologies Private LimitedAsepco Solutions Private Limited Dhendai Tea and Industries Private LimitedShanghvi Finance Private Limited^
d Joint VentureArtes Biotechnology GmbHS&I Ophthalmic LLC [Refer note 39(x)]
e AssociatesZenotech Laboratories Limited [Refer note 39 (g)]scPharmaceuticals Inc. [Refer note 39 (p)]Medinstill LLCMedinstill Development LLCTrumpcard Advisors and Finvest LLP Dr. Py Institute LLC
f Unconsolidated SubsidiaryFoundation for Disease Elimination and Control of India
^Solares Therapeutic Private Limited and Virtuous Finance Private Limited have been amalgamated with Shanghvi Finance Private Limited w.e.f. October 23, 2018
(Annexure ‘B’)
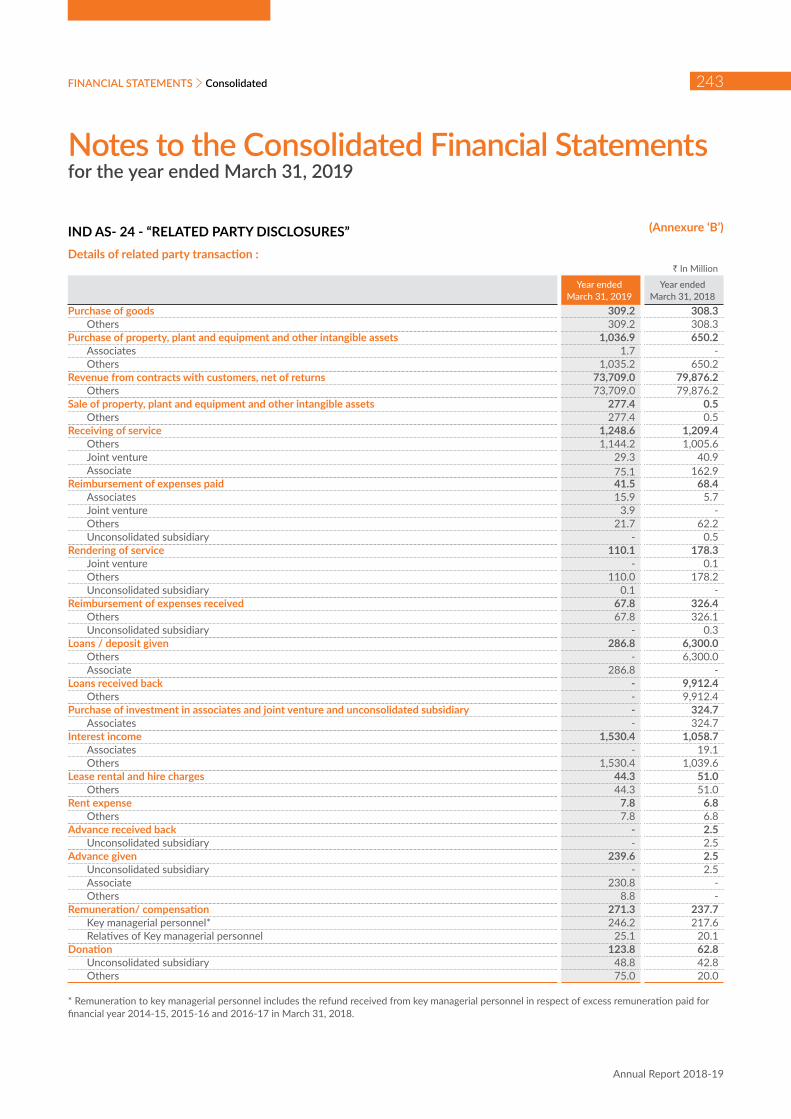
Notes to the Consolidated Financial Statementsfor the year ended March 31, 2019
FINANCIAL STATEMENTS
Annual Report 2018-19
243Consolidated
(Annexure ‘B’) IND AS- 24 - “RELATED PARTY DISCLOSURES”Details of related party transaction :
` In Million
Year ended March 31, 2019
Year ended March 31, 2018
Purchase of goods 309.2 308.3 Others 309.2 308.3 Purchase of property, plant and equipment and other intangible assets 1,036.9 650.2 Associates 1.7 - Others 1,035.2 650.2 Revenue from contracts with customers, net of returns 73,709.0 79,876.2 Others 73,709.0 79,876.2 Sale of property, plant and equipment and other intangible assets 277.4 0.5 Others 277.4 0.5 Receiving of service 1,248.6 1,209.4 Others 1,144.2 1,005.6 Joint venture 29.3 40.9 Associate 75.1 162.9 Reimbursement of expenses paid 41.5 68.4 Associates 15.9 5.7 Joint venture 3.9 - Others 21.7 62.2 Unconsolidated subsidiary - 0.5 Rendering of service 110.1 178.3 Joint venture - 0.1 Others 110.0 178.2 Unconsolidated subsidiary 0.1 - Reimbursement of expenses received 67.8 326.4 Others 67.8 326.1 Unconsolidated subsidiary - 0.3 Loans / deposit given 286.8 6,300.0 Others - 6,300.0 Associate 286.8 - Loans received back - 9,912.4 Others - 9,912.4 Purchase of investment in associates and joint venture and unconsolidated subsidiary - 324.7 Associates - 324.7 Interest income 1,530.4 1,058.7 Associates - 19.1 Others 1,530.4 1,039.6 Lease rental and hire charges 44.3 51.0 Others 44.3 51.0 Rent expense 7.8 6.8 Others 7.8 6.8 Advance received back - 2.5 Unconsolidated subsidiary - 2.5 Advance given 239.6 2.5 Unconsolidated subsidiary - 2.5 Associate 230.8 - Others 8.8 - Remuneration/ compensation 271.3 237.7 Key managerial personnel* 246.2 217.6 Relatives of Key managerial personnel 25.1 20.1 Donation 123.8 62.8 Unconsolidated subsidiary 48.8 42.8 Others 75.0 20.0
* Remuneration to key managerial personnel includes the refund received from key managerial personnel in respect of excess remuneration paid for financial year 2014-15, 2015-16 and 2016-17 in March 31, 2018.
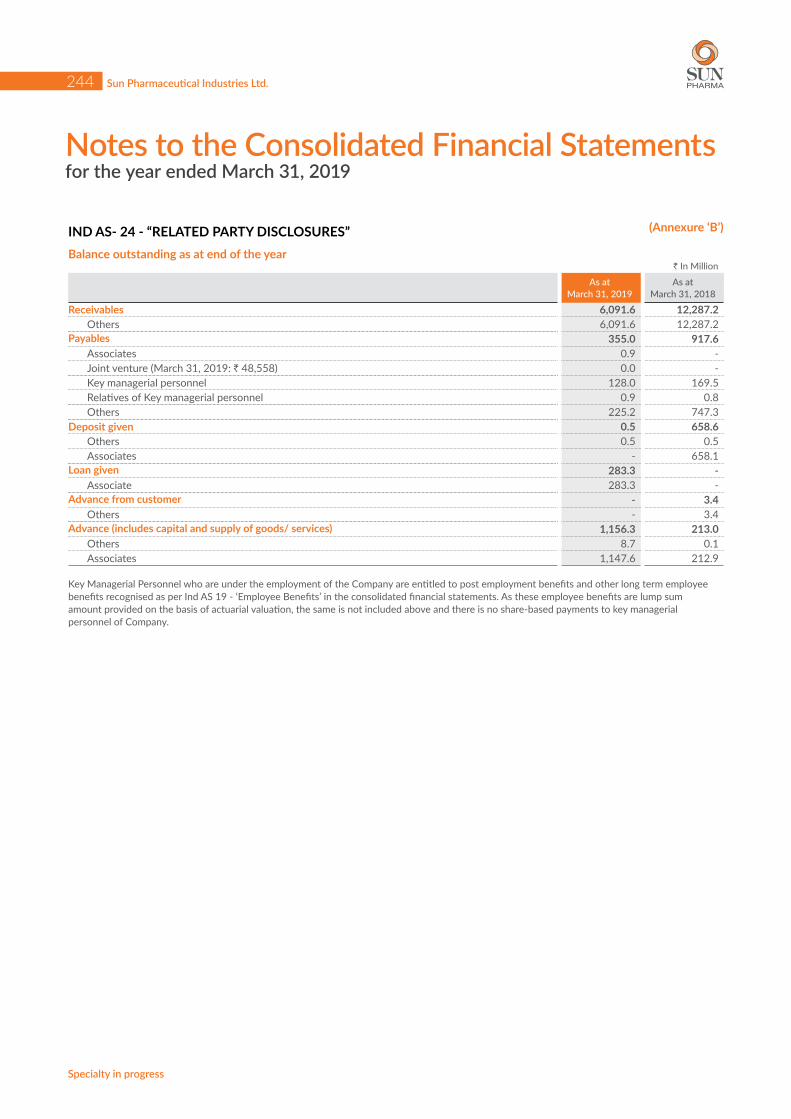
Notes to the Consolidated Financial Statementsfor the year ended March 31, 2019
Sun Pharmaceutical Industries Ltd.
Specialty in progress
244
(Annexure ‘B’)
` In Million
As at March 31, 2019
As at March 31, 2018
Receivables 6,091.6 12,287.2 Others 6,091.6 12,287.2 Payables 355.0 917.6 Associates 0.9 - Joint venture (March 31, 2019: ` 48,558) 0.0 - Key managerial personnel 128.0 169.5 Relatives of Key managerial personnel 0.9 0.8 Others 225.2 747.3 Deposit given 0.5 658.6 Others 0.5 0.5 Associates - 658.1 Loan given 283.3 - Associate 283.3 - Advance from customer - 3.4 Others - 3.4 Advance (includes capital and supply of goods/ services) 1,156.3 213.0 Others 8.7 0.1 Associates 1,147.6 212.9
Key Managerial Personnel who are under the employment of the Company are entitled to post employment benefits and other long term employee benefits recognised as per Ind AS 19 - ‘Employee Benefits’ in the consolidated financial statements. As these employee benefits are lump sum amount provided on the basis of actuarial valuation, the same is not included above and there is no share-based payments to key managerial personnel of Company.
IND AS- 24 - “RELATED PARTY DISCLOSURES”Balance outstanding as at end of the year