2015 tiaa audited statutory basis financial statements · pdf file2015 tiaa audited statutory...
TRANSCRIPT

TEACHERS INSURANCE ANDANNUITY ASSOCIATION OF AMERICA
Audited Statutory – Basis Financial Statements as of December 31, 2015 and 2014 and for the three years ended December 31, 2015

1
TEACHERS INSURANCE AND ANNUITY ASSOCIATION OF AMERICAINDEX OF AUDITED STATUTORY - BASIS FINANCIAL STATEMENTS
DECEMBER 31, 2015
Page
Report of Management Responsibility .............................................................................Independent Auditor’s Report ..........................................................................................Statutory - Basis Financial Statements: Statements of Admitted Assets, Liabilities and Capital and Contingency Reserves ...... Statements of Operations ............................................................................................. Statements of Changes in Capital and Contingency Reserves ..................................... Statements of Cash Flows ............................................................................................ Notes to Financial Statements ......................................................................................
24
7891011

2
REPORT OF MANAGEMENT RESPONSIBILITY
April 4, 2016
To the Policyholders ofTeachers Insurance and AnnuityAssociation of America:
Financial Statements
The accompanying statutory-basis financial statements of Teachers Insurance and Annuity Association of America (“TIAA”) are the responsibility of management. They have been prepared on the basis of statutory accounting principles, a comprehensive basis of accounting comprised of accounting principles prescribed or permitted by the New York State Department of Financial Services. The financial statements of TIAA have been presented fairly and objectively in accordance with such statutory accounting principles.
In addition, TIAA’s internal audit personnel provide regular reviews and assessments of the internal controls and operations of TIAA, and the Senior Managing Director, Chief Auditor regularly reports to the Audit Committee of the TIAA Board of Trustees.
The independent auditors of PricewaterhouseCoopers LLP have audited the accompanying statutory-basis financial statements of TIAA for the years ended December 31, 2015, 2014 and 2013. To maintain auditor independence and avoid even the appearance of a conflict of interest, it continues to be TIAA’s policy that any management advisory or consulting service, which is not in accordance with TIAA’s specific auditor independence policies designed to avoid such conflicts, be obtained from a firm other than the independent auditor. The independent auditors’ report expresses an opinion in all material respects on the fairness of presentation of these statutory-basis financial statements.
The Audit Committee of the TIAA Board of Trustees, comprised entirely of independent, non-management trustees, meets regularly with management, representatives of the independent auditor and internal audit personnel to review matters relating to financial reporting, internal controls and auditing. In addition to the annual independent audit of the TIAA statutory-basis financial statements, the New York State Department of Financial Services and other state insurance departments regularly examine the operations and financial statements of TIAA as part of their periodic corporate examinations.
Internal Control over Financial Reporting
TIAA’s internal control over financial reporting is a process effected by those charged with governance, management and other personnel, designed to provide reasonable assurance regarding the preparation of reliable financial statements in accordance with statutory accounting principles. TIAA’s internal control over financial reporting includes those policies and procedures that (1) pertain to the maintenance of records that, in reasonable detail, accurately and fairly reflect the transactions and dispositions of the assets of the entity; (2) provide reasonable assurance that transactions are recorded as necessary to permit preparation of financial statements in accordance with statutory accounting principles, and the receipts and expenditures of the entity are being made only in accordance with authorizations of management and those charged with governance; and (3) provide reasonable assurance regarding prevention, or timely detection and correction of unauthorized acquisition, use, or disposition of the entity’s assets that could have a material effect on the financial statements.
Management is responsible for establishing and maintaining effective internal control over financial reporting. Management assessed the effectiveness of the entity’s internal control over financial reporting as of December 31, 2015, based on the framework set forth by the Committee of Sponsoring Organizations of the Treadway Commission in Internal Control-Integrated Framework (2013 Framework). Based on that

3
assessment, management concluded that, as of December 31, 2015, TIAA’s internal control over financial reporting is effective based on the criteria established in Internal Control-Integrated Framework (2013 Framework).
Management’s assessment of the effectiveness of internal control over financial reporting as of December 31, 2015 has been audited by PricewaterhouseCoopers LLP, an independent public accounting firm, as stated in their report dated April 4, 2016.
Roger W. Ferguson, Jr.
President and Chief Executive Officer
Virginia M. Wilson
Executive Vice President and ChiefFinancial Officer

PricewaterhouseCoopers LLP, PricewaterhouseCoopers Center, 300 Madison Avenue, New York, NY 10017 T: (646) 471 3000, F: (813) 286 6000, www.pwc.com/us
Independent Auditor’s Report
To the Board of Trustees of Teachers Insurance and Annuity Association of America We have audited the accompanying statutory-basis financial statements of Teachers Insurance and Annuity Association of America, which comprise the statutory-basis statements of admitted assets, liabilities, and capital and contingency reserves as of December 31, 2015 and 2014 and the related statutory-basis statements of operations, of changes in capital and contingency reserves and of cash flows for each of the three years in the period ended December 31, 2015. We also have audited Teachers Insurance and Annuity Association of America’s internal control over financial reporting as of December 31, 2015, based on criteria established in Internal Control - Integrated Framework (2013) issued by the Committee of Sponsoring Organizations of the Treadway Commission (“COSO”).
Management’s Responsibility for the Financial Statements
Management is responsible for the preparation and fair presentation of the statutory-basis financial statements in accordance with the accounting practices prescribed or permitted by the New York State Department of Financial Services; this includes the design, implementation, and maintenance of effective internal control over financial reporting relevant to the preparation and fair presentation of the statutory-basis financial statements that are free from material misstatement, whether due to error or fraud. Management is also responsible for its assertion about the effectiveness of internal control over financial reporting, included in the accompanying Report of Management Responsibility – Internal Control over Financial Reporting.
Auditor’s Responsibility Our responsibility is to express an opinion on the statutory-basis financial statements and an opinion on the Company's internal control over financial reporting based on our audits. We conducted our audits of the statutory-basis financial statements in accordance with auditing standards generally accepted in the United States of America and our audit of internal control over financial reporting in accordance with attestation standards established by the American Institute of Certified Public Accountants. Those standards require that we plan and perform the audits to obtain reasonable assurance about whether the statutory-basis financial statements are free from material misstatement and whether effective internal control over financial reporting was maintained in all material respects.
An audit of financial statements involves performing procedures to obtain audit evidence about the amounts and disclosures in the financial statements. The procedures selected depend on our judgment, including assessment of the risks of material misstatement of the financial statements, whether due to fraud or error. In making those risk assessments, we consider internal control relevant to the company's preparation and fair presentation of the financial statements in order to design audit procedures that are appropriate in the circumstances. An audit of financial statements also includes evaluating the appropriateness of accounting policies used and the reasonableness of significant accounting estimates made by management, as well as evaluating the overall presentation of the financial statements. An audit

5
of internal control over financial reporting involves obtaining an understanding of internal control over financial reporting, assessing the risk that a material weakness exists, and testing and evaluating the design and operating effectiveness of internal control over financial reporting based on the assessed risk, and performing such other procedures as we considered necessary in the circumstances. We believe that the audit evidence we obtained is sufficient and appropriate to provide a basis for our opinions.
Definitions and Inherent Limitations of Internal Control Over Financial Reporting
A company’s internal control over financial reporting is a process effected by those charged with governance, management, and other personnel, designed to provide reasonable assurance regarding the preparation of reliable statutory-basis financial statements in accordance with accounting practices prescribed or permitted by the New York State Department of Financial Services. A company’s internal control over financial reporting includes those policies and procedures that (i) pertain to the maintenance of records that, in reasonable detail, accurately and fairly reflect the transactions and dispositions of the assets of the company; (ii) provide reasonable assurance that transactions are recorded as necessary to permit preparation of statutory-basis financial statements in accordance with accounting practices prescribed or permitted by the New York State Department of Financial Services, and that receipts and expenditures of the company are being made only in accordance with authorizations of management and those charged with governance; and (iii) provide reasonable assurance regarding prevention or timely detection and correction of unauthorized acquisition, use, or disposition of the company’s assets that could have a material effect on the statutory-basis financial statements.
Because of its inherent limitations, internal control over financial reporting may not prevent, or detect and correct misstatements. Also, projections of any evaluation of effectiveness to future periods are subject to the risk that controls may become inadequate because of changes in conditions, or that the degree of compliance with the policies or procedures may deteriorate.
Basis for Adverse Opinion on U.S. Generally Accepted Accounting Principles
As described in Note 2 to the statutory-basis financial statements, the statutory-basis financial statements are prepared by the Company on the basis of the accounting practices prescribed or permitted by the New York State Department of Financial Services, which is a basis of accounting other than accounting principles generally accepted in the United States of America.
The effects on the statutory-basis financial statements of the variances between the statutory basis of accounting described in Note 2 and accounting principles generally accepted in the United States of America, although not reasonably determinable, are presumed to be material.
Adverse Opinion on U.S. Generally Accepted Accounting Principles
In our opinion, because of the significance of the matter discussed in the Basis for Adverse Opinion on U.S. Generally Accepted Accounting Principles section, the statutory-basis financial statements referred to above do not present fairly, in accordance with accounting principles generally accepted in the United States of America, the financial position of the Company as of December 31, 2015 and 2014, or the results of its operations or its cash flows thereof for each of the three years in the period ended December 31, 2015.

6
Opinions on Statutory-Basis of Accounting and Internal Control over Financial Reporting In our opinion, the statutory-basis financial statements referred to above present fairly, in all material respects, the admitted assets, liabilities, and capital and contingency reserves of Teachers Insurance and Annuity Association of America as of December 31, 2015 and 2014, and the results of its operations and its cash flows for each of the three years in the period ended December 31, 2015 in accordance with the accounting practices prescribed or permitted by the New York State Department of Financial Services described in Note 2. Also in our opinion, the Company maintained, in all material respects, effective internal control over financial reporting as of December 31, 2015, based on criteria established in Internal Control - Integrated Framework (2013) issued by COSO.
New York, New York April 4, 2016

TEACHERS INSURANCE AND ANNUITY ASSOCIATION OF AMERICASTATUTORY - BASIS STATEMENTS OF ADMITTED ASSETS, LIABILITIES AND CAPITAL AND
CONTINGENCY RESERVES
See notes to statutory - basis financial statements7
December 31,2015 2014
ADMITTED ASSETS (in millions)Bonds .................................................................................................................... $ 181,247 $ 180,086Preferred stocks .................................................................................................... 195 100Common stocks .................................................................................................... 3,076 2,903Mortgage loans ..................................................................................................... 19,046 15,613Real estate ............................................................................................................ 1,938 1,966Cash, cash equivalents and short-term investments ............................................. 533 1,542Contract loans ....................................................................................................... 1,591 1,555Derivatives ............................................................................................................ 268 218Securities lending collateral assets ....................................................................... 827 614Other long-term investments ................................................................................. 25,998 26,018Investment income due and accrued .................................................................... 1,765 1,756Federal income taxes recoverable ........................................................................ — 5Net deferred federal income tax asset .................................................................. 3,209 3,221Other assets .......................................................................................................... 504 506Separate account assets ....................................................................................... 29,897 26,531TOTAL ADMITTED ASSETS ................................................................................ $ 270,094 $ 262,634
LIABILITIES, CAPITAL AND CONTINGENCY RESERVESLiabilitiesReserves for life and health insurance, annuities and deposit-type contracts....... $ 194,057 $ 189,956Dividends due to policyholders ............................................................................. 1,908 1,942Interest maintenance reserve ................................................................................ 1,927 2,106Federal income taxes payable .............................................................................. 19 —Asset valuation reserve ......................................................................................... 3,910 5,020Derivatives ............................................................................................................ 42 123Payable for collateral for securities loaned ............................................................ 827 614Other liabilities ....................................................................................................... 2,786 2,431Separate account liabilities ................................................................................... 29,883 26,522TOTAL LIABILITIES ............................................................................................. 235,359 228,714
Capital and Contingency ReservesCapital (2,500 shares of $1,000 par value common stock issued and
outstanding and $550,000 paid-in capital) ......................................................... 3 3Surplus notes ........................................................................................................ 4,000 4,000Contingency reserves:
For investment losses, annuity and insurance mortality, and other risks ........... 30,732 29,917TOTAL CAPITAL AND CONTINGENCY RESERVES .......................................... 34,735 33,920
TOTAL LIABILITIES, CAPITAL AND CONTINGENCY RESERVES.................... $ 270,094 $ 262,634

TEACHERS INSURANCE AND ANNUITY ASSOCIATION OF AMERICASTATUTORY - BASIS STATEMENTS OF OPERATIONS
See notes to statutory - basis financial statements8
For the Years Ended December 31,2015 2014 2013
(in millions)REVENUESInsurance and annuity premiums and other considerations............................. $ 13,659 $ 12,910 $ 14,395Annuity dividend additions ............................................................................... 1,574 1,783 1,585Net investment income .................................................................................... 11,335 11,253 11,274Other revenue .................................................................................................. 289 251 242
TOTAL REVENUES ........................................................................................ $ 26,857 $ 26,197 $ 27,496
BENEFITS AND EXPENSESPolicy and contract benefits ............................................................................. $ 14,575 $ 13,992 $ 13,136Dividends to policyholders ............................................................................... 3,334 3,589 3,409Increase in policy and contract reserves .......................................................... 3,922 3,927 5,749Net operating expenses ................................................................................... 1,643 1,689 1,183Net transfers to separate accounts .................................................................. 1,725 1,676 1,879
TOTAL BENEFITS AND EXPENSES .............................................................. $ 25,199 $ 24,873 $ 25,356
Income before federal income taxes and net realized capital gains (losses) ......................................................................................................... $ 1,658 $ 1,324 $ 2,140
Federal income tax (benefit) ......................................................................... (83) (37) (28)
Net realized capital gains (losses) less capital gains taxes, after transfers to the interest maintenance reserve ......................................... (487) (377) (417)
NET INCOME .................................................................................................. $ 1,254 $ 984 $ 1,751

TEACHERS INSURANCE AND ANNUITY ASSOCIATION OF AMERICASTATUTORY - BASIS STATEMENTS OF CHANGES IN CAPITAL AND CONTINGENCY RESERVES
See notes to statutory - basis financial statements9
Capital Stock and Additional Paid-in Capital
Contingency Reserves Total
(in millions)
Balance, December 31, 2012 ............................................................. $ 3 $ 29,306 $ 29,309
Net income ........................................................................................... — 1,751 1,751Net unrealized capital gains on investments ........................................ — 1,193 1,193Change in asset valuation reserve ....................................................... — (1,209) (1,209)Change in surplus of separate accounts .............................................. — (18) (18)Change in net deferred income tax ...................................................... — (1,083) (1,083)Change in post-retirement benefit liability ............................................ — (11) (11)Change in non-admitted assets:
Deferred federal income tax asset .................................................... — 937 937Other assets ..................................................................................... — (90) (90)
Balance, December 31, 2013 ............................................................. $ 3 $ 30,776 $ 30,779
Net income ........................................................................................... — 984 984Net unrealized capital gains on investments ........................................ — 337 337Change in asset valuation reserve ....................................................... — (387) (387)Change in net deferred income tax ...................................................... — (447) (447)Change in post-retirement benefit liability ............................................ — 60 60Change in non-admitted assets:
Deferred federal income tax asset .................................................... — 579 579Other assets ..................................................................................... — 15 15
Issuance of surplus notes .................................................................... — 2,000 2,000Balance, December 31, 2014 ............................................................. $ 3 $ 33,917 $ 33,920
Net income ........................................................................................... — 1,254 1,254Net unrealized capital losses on investments ...................................... — (1,433) (1,433)Change in asset valuation reserve ....................................................... — 1,110 1,110Change in net deferred income tax ...................................................... — (160) (160)Change in post-retirement benefit liability ............................................ — 1 1Change in non-admitted assets:
Deferred federal income tax asset .................................................... — 147 147Other assets ..................................................................................... — (104) (104)
Balance, December 31, 2015 ............................................................. $ 3 $ 34,732 $ 34,735
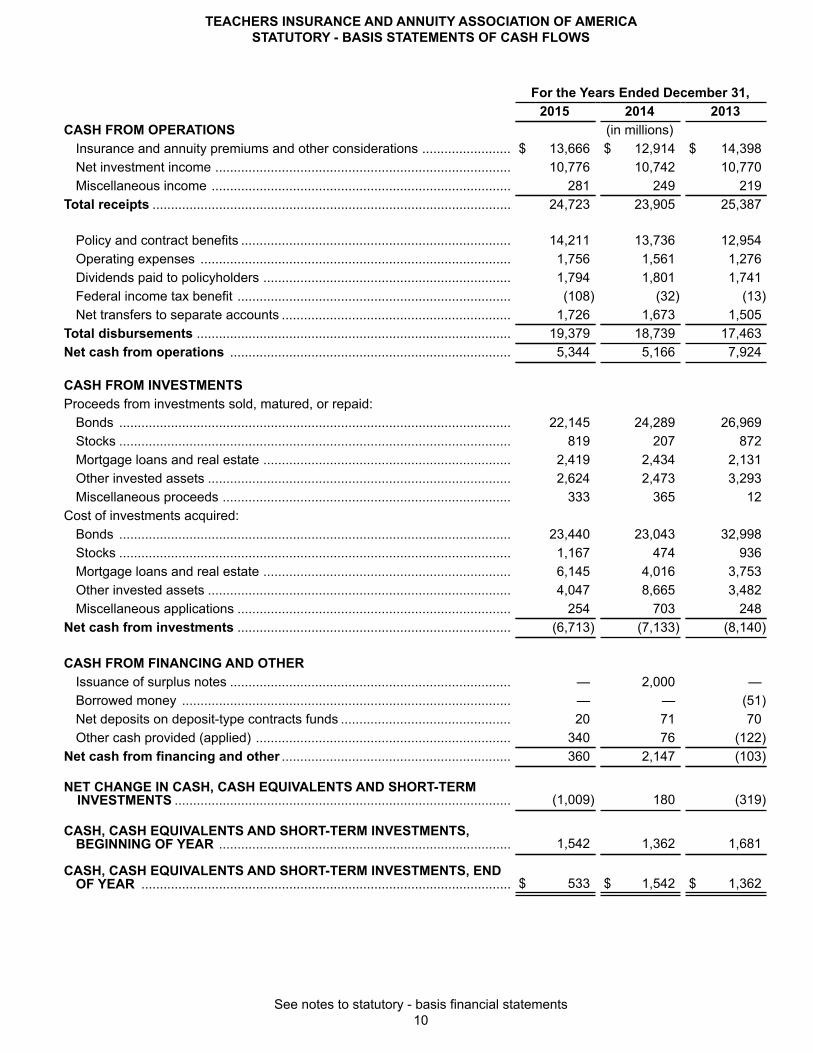
TEACHERS INSURANCE AND ANNUITY ASSOCIATION OF AMERICASTATUTORY - BASIS STATEMENTS OF CASH FLOWS
See notes to statutory - basis financial statements10
For the Years Ended December 31,2015 2014 2013
CASH FROM OPERATIONS (in millions)Insurance and annuity premiums and other considerations ........................ $ 13,666 $ 12,914 $ 14,398Net investment income ................................................................................ 10,776 10,742 10,770Miscellaneous income ................................................................................. 281 249 219
Total receipts ................................................................................................. 24,723 23,905 25,387
Policy and contract benefits ......................................................................... 14,211 13,736 12,954Operating expenses .................................................................................... 1,756 1,561 1,276Dividends paid to policyholders ................................................................... 1,794 1,801 1,741Federal income tax benefit .......................................................................... (108) (32) (13)Net transfers to separate accounts .............................................................. 1,726 1,673 1,505
Total disbursements ..................................................................................... 19,379 18,739 17,463Net cash from operations ............................................................................ 5,344 5,166 7,924
CASH FROM INVESTMENTSProceeds from investments sold, matured, or repaid:
Bonds .......................................................................................................... 22,145 24,289 26,969Stocks .......................................................................................................... 819 207 872Mortgage loans and real estate ................................................................... 2,419 2,434 2,131Other invested assets .................................................................................. 2,624 2,473 3,293Miscellaneous proceeds .............................................................................. 333 365 12
Cost of investments acquired:Bonds .......................................................................................................... 23,440 23,043 32,998Stocks .......................................................................................................... 1,167 474 936Mortgage loans and real estate ................................................................... 6,145 4,016 3,753Other invested assets .................................................................................. 4,047 8,665 3,482Miscellaneous applications .......................................................................... 254 703 248
Net cash from investments .......................................................................... (6,713) (7,133) (8,140)
CASH FROM FINANCING AND OTHERIssuance of surplus notes ............................................................................ — 2,000 —Borrowed money ......................................................................................... — — (51)Net deposits on deposit-type contracts funds .............................................. 20 71 70Other cash provided (applied) ..................................................................... 340 76 (122)
Net cash from financing and other .............................................................. 360 2,147 (103)
NET CHANGE IN CASH, CASH EQUIVALENTS AND SHORT-TERM INVESTMENTS ........................................................................................... (1,009) 180 (319)
CASH, CASH EQUIVALENTS AND SHORT-TERM INVESTMENTS, BEGINNING OF YEAR ............................................................................... 1,542 1,362 1,681
CASH, CASH EQUIVALENTS AND SHORT-TERM INVESTMENTS, END OF YEAR .................................................................................................... $ 533 $ 1,542 $ 1,362

TEACHERS INSURANCE AND ANNUITY ASSOCIATION OF AMERICANOTES TO STATUTORY - BASIS FINANCIAL STATEMENTS
DECEMBER 31, 2015
11
Note 1 – Organization
Teachers Insurance and Annuity Association of America ("TIAA" or the “Company”) was established in 1918 as a legal reserve life insurance company under the insurance laws of the State of New York. All of the outstanding common stock of TIAA is held by the TIAA Board of Overseers (“Board of Overseers”), a not-for-profit corporation incorporated in the State of New York originally created for the purpose of holding the stock of TIAA.
The Company’s primary purpose is to aid and strengthen non-profit educational and research organizations, governmental entities and other non-profit institutions by providing retirement and insurance benefits for their employees and their families and by counseling such organizations and their employees on benefit plans and other measures of economic security.
Note 2 – Significant Accounting Policies
Basis of Presentation:
The accompanying financial statements have been prepared on the basis of statutory accounting principles prescribed or permitted by the New York State Department of Financial Services (“NYDFS” or the “Department”); a comprehensive basis of accounting that differs from accounting principles generally accepted in the United States (“GAAP”). The Department requires insurance companies domiciled in the State of New York to prepare their statutory-basis financial statements in accordance with the National Association of Insurance Commissioners’ (“NAIC”) Accounting Practices and Procedures Manual (“NAIC SAP”), subject to any deviation prescribed or permitted by the Department (“New York SAP”).
The table below provides a reconciliation of the Company’s net income and capital and contingency reserves between NAIC SAP and the New York SAP annual statement filed with the Department. The primary differences arise because the Company maintains more conservative reserves, as prescribed or permitted by New York SAP, under which annuity reserves are generally discounted on the basis of mortality tables and contractually guaranteed interest rates.
The additional reserve for the term conversions results from the Department requiring in Regulation No. 147 (11NYCRR 98) Valuation of Life Insurance Reserves Section 98.4 for any policy which guarantees renewal, or conversion to another policy, without evidence of insurability, additional reserves shall be held that account for excess mortality due to anti-selection with appropriate margins to cover expenses and risk of moderately adverse deviations in experience.
For the Years Ended December 31,2015 2014 2013
(in millions)Net income, New York SAP................................................ $ 1,254 $ 984 $ 1,751
New York SAP prescribed practices:Additional reserves for:
Term conversions......................................................... — — 2Deferred and payout annuities issued after 2000......... 25 94 73
Net income, NAIC SAP ...................................................... $ 1,279 $ 1,078 $ 1,826
Capital and contingency reserves, New York SAP............. 34,735 33,920 30,779
New York SAP prescribed practices:Additional reserves for:
Term conversions......................................................... 20 20 20Deferred and payout annuities issued after 2000......... 4,109 4,084 3,990
Capital and contingency reserves, NAIC SAP.................... $ 38,864 $ 38,024 $ 34,789

TEACHERS INSURANCE AND ANNUITY ASSOCIATION OF AMERICANOTES TO STATUTORY - BASIS FINANCIAL STATEMENTS (continued)
DECEMBER 31, 2015
12
Accounting Principles Generally Accepted in the United States: The Financial Accounting Standards Board ("FASB") dictates the accounting principles for financial statements that are prepared in conformity with GAAP with applicable authoritative accounting pronouncements. As a result, the Company cannot refer to financial statements prepared in accordance with NAIC SAP and New York SAP as having been prepared in accordance with GAAP.
The primary differences between GAAP and NAIC SAP can be summarized as follows:
Under GAAP:
• Investments in bonds considered to be “available for sale” are carried at fair value under GAAP rather than at amortized cost under NAIC SAP;
• Impairments on securities (other than loan-backed and structured securities) due to credit losses are recorded as other-than-temporary impairments (“OTTI”) through earnings for the difference between amortized cost and discounted cash flows when a security is deemed impaired. Other declines in fair value related to factors other than credit are recorded as other comprehensive income, which is a separate component of stockholder’s equity. Under NAIC SAP, an impairment for such securities is recorded through earnings for the difference between amortized cost and fair value;
• For loan-backed and structured securities that are other-than-temporarily impaired, declines in fair value related to factors other than credit are recorded as other comprehensive income, which is a separate component of stockholder’s equity. Under NAIC SAP, such declines in fair value are not recorded until a credit loss occurs;
• Changes in the allowance for estimated uncollectible amounts related to mortgage loans are recorded through earnings under GAAP rather than as unrealized losses on impairments included in the Asset Valuation Reserve, which is a component of surplus under NAIC SAP;
• Changes in the value of certain other long-term investments accounted for under the equity method of accounting are recorded through earnings under GAAP rather than as unrealized gains (losses), which is a component of surplus under NAIC SAP;
• Investments in wholly-owned subsidiaries, other entities under the control of the parent, and certain variable interest entities are consolidated in the parent’s financial statements rather than being carried at the parent’s share of the underlying GAAP equity or statutory surplus of a domestic insurance subsidiary;
• Contracts that contain an embedded derivative are not bifurcated between components and are accounted for as part of the host contract, whereas under GAAP, the embedded derivative would be bifurcated from the host contract and accounted for separately;
• Certain assets designated as “non-admitted assets” and excluded from assets in the statutory balance sheet are included in the GAAP balance sheet;
• Surplus notes are reported as a liability rather than a component of capital and contingency reserves;
• The Asset Valuation Reserve (“AVR”) is eliminated as it is not recognized under GAAP. The AVR is established under NAIC SAP with changes recorded as a direct charge to surplus;
• The Interest Maintenance Reserve (“IMR”) is eliminated as it is not recognized under GAAP. The realized gains and losses resulting from changes in interest rates are reported as a component of net income under GAAP rather than being deferred and subsequently amortized into income over the remaining expected life of the investment sold;
• Dividends on participating policies are accrued when earned under GAAP rather than being recognized for the year when they are approved;

TEACHERS INSURANCE AND ANNUITY ASSOCIATION OF AMERICANOTES TO STATUTORY - BASIS FINANCIAL STATEMENTS (continued)
DECEMBER 31, 2015
13
• Policy acquisition costs, such as commissions, and other costs incurred in connection with acquiring new business, are deferred and amortized over the expected lives of the policies issued under GAAP rather than being expensed when incurred;
• Policy and contract reserves are based on management's best estimates of expected mortality, morbidity, persistency and interest under GAAP rather than being based on statutory mortality, morbidity and interest requirements;
• Deferred income taxes, subject to valuation allowance, include federal and state income taxes and changes in the deferred tax are reflected in earnings. Under NAIC SAP, deferred taxes exclude state income taxes and are admitted to the extent they can be realized within three years subject to a 15% limitation of capital and surplus with changes in the net deferred tax reflected as a component of surplus;
• Contracts that do not subject the Company to risks arising from policyholder mortality or morbidity are reported as a deposit liability. Under NAIC SAP, contracts that have any mortality and morbidity risk, regardless of significance, and contracts with life contingent annuity purchase rate guarantees are classified as insurance contracts and amounts received under these contracts are reported as revenue;
• Assets and liabilities are reported gross of reinsurance under GAAP and net of reinsurance under NAIC SAP. Certain reinsurance transactions are accounted for as financing transactions under GAAP and as reinsurance under NAIC SAP. Transactions recorded as financing have no impact on premiums or losses incurred, while under NAIC SAP, premiums paid to the reinsurer are recorded as ceded premiums (a reduction in revenue) and expected reimbursement for losses from the reinsurer are recorded as a reduction in losses;
• When reserves ceded to an unauthorized reinsurer exceed the assets or letters of credit supporting the reserves no liability is established under GAAP. Under NAIC SAP, a liability is established and changes to these amounts are credited or charged directly to unassigned surplus (deficit).
The effects of these differences, while not determined, are presumed to be material.
Reclassifications: Certain amounts in the 2014 and 2013 statutory financial statements have been reclassified to conform with the 2015 presentation.
Use of Estimates: The preparation of statutory-basis financial statements requires management to make estimates and assumptions that impact the reported amounts of assets and liabilities at the date of the financial statements. Management is also required to disclose contingent assets and liabilities at the date of the financial statements and the reported amounts of revenues and expenses during the reporting periods. Actual results may differ from those estimates.
The most significant estimates include those used in the recognition of other-than-temporary impairments, reserves for life and health insurance, annuities and deposit-type contracts and the valuation of deferred tax assets.
Accounting Policies:
The following is a summary of the significant accounting policies followed by the Company:
Investments: Publicly traded securities are accounted for as of the date the investments are purchased or sold (trade date). Other investments are recorded on the settlement date. Realized capital gains and losses on investment transactions are accounted for under the specific identification method. A realized loss is recorded when an impairment is considered to be other-than-temporary.
Bonds: Bonds are stated at amortized cost using the current effective interest method. Bonds in or near default (rated NAIC 6) are stated at the lower of amortized cost or fair value. Bonds the Company intends to sell prior to maturity (“held for sale”) are stated at the lower of amortized cost or fair value.

TEACHERS INSURANCE AND ANNUITY ASSOCIATION OF AMERICANOTES TO STATUTORY - BASIS FINANCIAL STATEMENTS (continued)
DECEMBER 31, 2015
14
Included within bonds are loan-backed and structured securities. Estimated future cash flows and expected prepayment speeds are used to determine the amortization of loan-backed and structured securities under the prospective method. Expected future cash flows and prepayment speeds are evaluated quarterly. Certain loan-backed and structured securities are reported at the lower of amortized cost or fair value as a result of the NAIC modeling process.
If it is determined that a decline in the fair value of a bond, excluding loan-backed and structured securities, is other-than-temporary, the cost basis of the bond is written down to fair value and the amount of the write down is accounted for as a realized loss. The new cost basis is not changed for subsequent recoveries in fair value. Future declines in fair value which are determined to be other-than-temporary are recorded as realized losses.
For loan-backed and structured securities, which the Company has the intent and ability to hold for a period of time sufficient to recover the amortized cost basis, when an OTTI has occurred because the Company does not expect to recover the entire amortized cost basis of the security, the amount of the OTTI recognized as a realized loss is the difference between the security’s amortized cost basis and the present value of cash flows expected to be collected, discounted at the loan-backed or structured security’s effective interest rate.
For loan-backed and structured securities, when an OTTI has occurred because the Company intends to sell the security or the Company does not have the intent and ability to retain the security for a period of time sufficient to recover the amortized cost basis, the amount of the OTTI realized is the difference between the security’s amortized cost basis and fair value at the balance sheet date.
In periods subsequent to the recognition of an OTTI loss for a loan-backed or structured security, the Company accounts for the other-than-temporarily impaired security as if the security had been purchased on the measurement date of the impairment. The difference between the new amortized cost basis and the cash flows expected to be collected is accreted as interest income in future periods based on prospective changes in cash flow estimates.
Preferred Stocks: Preferred stocks are stated at amortized cost unless they have an NAIC rating designation of 4, 5, or 6 which are stated at the lower of amortized cost or fair value. The fair values of preferred stocks are determined using prices provided by third party pricing services or valuations from the NAIC. When it is determined that a decline in fair value of an investment is other-than-temporary, the cost basis of the investment is reduced to its fair value and the amount of the reduction is accounted for as a realized loss.
Common Stocks: Unaffiliated common stocks are stated at fair value, which is based on quoted market prices, where available. Changes in fair value are recorded through surplus as an unrealized gain or loss. For common stocks without quoted market prices, fair value is estimated using independent pricing services or internally developed pricing models. When it is determined that a decline in fair value of an investment is other-than-temporary, the cost basis of the investment is reduced to its fair value and the amount of the reduction is accounted for as a realized loss.
Mortgage Loans: Mortgage loans are stated at amortized cost, net of valuation allowances. Mortgage loans held for sale are stated at the lower of amortized cost or fair value. Mortgage loans are evaluated for impairment when it is probable that the receipt of contractual payments of principal and interest may not occur when scheduled. If the impairment is considered to be temporary, a valuation allowance is established for the excess of the carrying value of the mortgage over its estimated fair value. Changes in valuation allowance for mortgage loans are included in net unrealized capital gains and losses on investments. When an event occurs resulting in an impairment that is other-than-temporary, a direct write-down is recorded as a realized loss and a new cost basis is established. The fair value of mortgage loans is generally determined using a discounted cash flow methodology based on coupon rates, maturity provisions and credit assumptions.
Real Estate: Real estate occupied by the Company and real estate held for the production of income is carried at depreciated cost, less encumbrances. Real estate held for sale is carried at the lower of depreciated cost or fair value, less encumbrances, and estimated costs to sell. The Company utilizes the straight-line method of depreciation on real estate and it is generally computed over a forty-year period. A real estate property may be considered impaired when events or circumstances indicate that the carrying value may not be recoverable. When the Company determines that an investment in real estate is impaired, a direct write-down is made to reduce the carrying value of the property to its estimated fair value based on an external appraisal, net of encumbrances, and a realized loss is recorded.

TEACHERS INSURANCE AND ANNUITY ASSOCIATION OF AMERICANOTES TO STATUTORY - BASIS FINANCIAL STATEMENTS (continued)
DECEMBER 31, 2015
15
The Company makes investments in commercial real estate directly, through wholly owned subsidiaries and through real estate limited partnerships. The Company monitors the effects of current and expected market conditions and other factors on its real estate investments to identify and quantify any impairment in value. The Company assesses assets to determine if events or changes in circumstances indicate that the carrying amount of the asset may not be recoverable. The Company evaluates the recoverability of income producing investments based on undiscounted cash flows and then reviews the results of an independent third party appraisal to determine the fair value and if an impairment is required.
Other Long-term Investments: Other long-term investments primarily include investments in joint ventures, partnerships, and limited liability companies which are stated at cost adjusted for the Company’s percentage of the most recent available financial statements based on the underlying U.S. GAAP, International Financial Reporting Standards or U.S. Tax basis equity as reflected on the respective entity’s financial statements.
The Company monitors the effects of current and expected market conditions and other factors on these investments to identify and quantify any impairment in value. The Company assesses the investments for potential impairment by performing analysis between the fair value and the cost basis of the investments. The Company evaluates recoverability of the asset to determine if OTTI is warranted. When it is determined that a decline in fair value of an investment is other-than-temporary, the cost basis of the investment is reduced to its fair value and the amount of the reduction is accounted for as a realized loss.
Investments in wholly-owned subsidiaries are stated at the value of their underlying net assets as follows: (1) domestic insurance subsidiaries are stated at the value of their underlying statutory surplus and (2) non-insurance subsidiaries are stated at the value of their underlying audited GAAP equity. Dividends and distributions from subsidiaries are recorded in investment income to the extent they are not in excess of the investee’s undistributed accumulated earnings and changes in the equity of subsidiaries are recorded directly to surplus as unrealized gains or losses.
Other long-term investments include the Company’s investments in surplus notes, which are stated at amortized cost. All of the Company’s investments in surplus notes have an NAIC 1 rating designation.
Cash and Cash Equivalents: Cash includes cash on deposit and cash equivalents. Cash equivalents are short-term, highly liquid investments, with original maturities of three months or less at the date of purchase and are stated at amortized cost.
Short-Term Investments: Short-term investments (investments with remaining maturities of one year or less at the time of acquisition, excluding those investments classified as cash equivalents) that are not impaired are stated at amortized cost using the straight line interest method. Short-term investments that are impaired are stated at the lower of amortized cost or fair value.
Contract Loans: Contract loans are stated at outstanding principal balances. The excess of unpaid contract loan balances over the cash surrender value, if any, is non-admitted and reflected as an adjustment to surplus. Interest income on such contract loans is recorded as earned using the contractually agreed upon interest rate.
Derivative Instruments: The Company has filed a Derivatives Use Plan with the Department. This plan details the Company’s derivative policy objectives, strategies, controls and any restrictions placed on various derivative types. The plan also specifies the procedures and systems that the Company has established to evaluate, monitor and report on the derivative portfolio in terms of valuation, hedge effectiveness and counterparty credit quality. The Company may use derivative instruments for hedging, income generation, or asset replication purposes.
Derivatives used by the Company may include swaps, forwards, futures or options.
The carrying value of a derivative position may be at cost or fair value, depending on the type of instrument and accounting status. Hedge accounting is applied for some foreign currency swaps that hedge fixed income investments carried at amortized cost. A currency translation adjustment computed at the spot rate is recorded for these foreign currency swaps as an unrealized gain or loss. The derivative component of a Replication (Synthetic Asset) Transaction (“RSAT”) is carried at unamortized premiums received or paid, adjusted for any impairments. The cash component

TEACHERS INSURANCE AND ANNUITY ASSOCIATION OF AMERICANOTES TO STATUTORY - BASIS FINANCIAL STATEMENTS (continued)
DECEMBER 31, 2015
16
of a RSAT is classified as a bond on the Company’s balance sheet and carried at amortized cost. Derivatives used in hedging transactions where hedge accounting is not being utilized are carried at fair value. The Company does not offset the carrying value amounts recognized for derivatives executed with the same counterparty under a netting agreement.
Investment Income Due and Accrued: Investment income due is investment income earned and legally due to be paid to the Company at the reporting date. Investment income accrued is investment income earned but not legally due to be paid to the Company until subsequent to the reporting date. The Company writes off amounts deemed uncollectible as a charge against investment income in the period such determination is made. Amounts deemed collectible, but over 90 days past due for any invested asset except mortgage loans in default are non-admitted. Amounts deemed collectible, but over 180 days past due for mortgage loans in default are non-admitted. The Company accrues interest income on impaired loans to the extent it is deemed collectible.
Separate Accounts: Separate Accounts are established in conformity with insurance laws, are segregated from the Company's general account and are maintained for the benefit of separate account contract holders. Separate accounts are accounted for at fair value, except the TIAA Stable Value Separate Account ("TSV"), which supports book value separate account agreements, in which case the assets are accounted for at amortized cost in accordance with NYDFS guidance. Separate account liabilities reflect the contractual obligations of the insurer arising out of the provisions of the insurance contract.
Foreign Currency Transactions and Translation: Investments denominated in foreign currencies and foreign currency contracts are valued in U.S. dollars, based on exchange rates at the end of the relevant period. Investment transactions in foreign currencies are recorded at the exchange rates prevailing on the respective transaction dates. All other asset and liability accounts denominated in foreign currencies are adjusted to reflect exchange rates at the end of the relevant period. Realized and unrealized gains and losses due to foreign exchange transactions and translation adjustments are not separately reported but are collectively included in realized and unrealized capital gains and losses, respectively.
Non-Admitted Assets: For statutory accounting purposes, certain assets are designated as non-admitted assets. Changes in non-admitted assets are reported as a direct adjustment to surplus.
At December 31, the major categories of assets that are non-admitted are as follows (in millions):
2015 2014 ChangeNet deferred federal income tax asset ......................... $ 7,301 $ 7,448 $ (147)Furniture and electronic data processing equipment ... 578 494 84Other long-term investments ....................................... 191 188 3Receivable from parent, subsidiaries and affiliates...... 118 113 5Other ............................................................................ 185 173 12Total ............................................................................. $ 8,373 $ 8,416 $ (43)
Electronic Data Processing Equipment, Computer Software, Furniture and Equipment and Leasehold Improvements: Electronic data processing (“EDP”) equipment, computer software and furniture and equipment which qualify for capitalization are depreciated over the lesser of useful life or 3 years. Office alterations and leasehold tenant improvements which qualify for capitalization are depreciated over the lesser of useful life or 5 years or the remaining life of the lease, respectively.
At December 31, the accumulated depreciation on EDP equipment, computer software, furniture and equipment and leasehold improvements is as follows (in millions):
2015 2014EDP equipment and computer software .............................. $ 1,324 $ 1,075Furniture and equipment and leasehold improvements ...... $ 448 $ 435

TEACHERS INSURANCE AND ANNUITY ASSOCIATION OF AMERICANOTES TO STATUTORY - BASIS FINANCIAL STATEMENTS (continued)
DECEMBER 31, 2015
17
At December 31, the related depreciation expenses are as follows (in millions):
2015 2014 2013EDP equipment and computer software ............................ $ 136 $ 122 $ 77Furniture and equipment and leasehold improvements..... $ 12 $ 8 $ 10
Insurance and Annuity Premiums: Life insurance premiums are recognized as revenue over the premium-paying period of the related policies. Annuity considerations are recognized as revenue when received. Deposits on deposit-type contracts are recorded directly as a liability when received. Expenses incurred when acquiring new business are charged to operations as incurred.
Reserves for Life and Health Insurance, Annuities and Deposit-type Contracts: Policy and contract reserves are determined in accordance with standard valuation methods approved by the Department and are computed in accordance with standard actuarial methodology. The reserves established utilize assumptions for interest, mortality and other risks insured. Such reserves are established to provide for adequate contractual benefits guaranteed under policy and contract provisions.
Liabilities for deposit-type contracts, which do not contain any life contingencies, are equal to deposits received and interest credited to the benefit of contract holders, less surrenders or withdrawals (that represent a return to the contract holders) plus additional reserves (if any) necessitated by actuarial regulations.
The Company performed Asset Adequacy Analysis in order to test the adequacy of its reserves in light of the assets supporting such reserves, and determined that its reserves are sufficient to meet its obligations.
Reinsurance: The Company enters into reinsurance agreements in the normal course of its insurance business to reduce overall risk. The Company remains liable for reinsurance ceded if the reinsurer fails to meet its obligation on the business assumed. All reinsurance is placed with unaffiliated reinsurers. A liability is established for reserves ceded to unauthorized reinsurers which are not secured by or in excess of letters of credit or trust agreements. The Company does not have reinsurance agreements in effect under which the reinsurer may unilaterally cancel the agreement. Amounts shown in the financial statements are reported net of the impact of reinsurance.
Asset Valuation Reserve (“AVR”) and Interest Maintenance Reserve (“IMR”): Mandatory reserves have been established for the General Account and Separate Account investments, where required. Such reserves consist of the AVR for potential credit-related losses on applicable General Account and Separate Account invested assets. Changes to the AVR are reported as direct additions to or deductions from surplus. An IMR is established for interest-related realized capital gains (losses) resulting from changes in the general level of interest rates for the General Account, as well as any Separate Accounts, not carried at fair value. Transfers to the IMR are deducted from realized capital gains and losses and are net of related federal income tax. IMR amortization, as calculated under the grouped method as specified by NY SAP, is included in net investment income. Net realized capital gains (losses) are presented net of federal income tax expense or benefit and IMR transfer.
Repurchase Agreement: Repurchase agreements are agreements between a seller and a buyer, whereby the seller of securities sells and simultaneously agrees to repurchase the same or substantially the same securities from the buyer at a stated price on a specified date. Repurchase agreements are generally accounted for as secured borrowings. The assets transferred are not removed from the balance sheet; the cash collateral received is reported on the balance sheet with an offsetting liability reported in “Other liabilities”.
Securities Lending Program: The Company has a securities lending program whereby it may lend securities to qualified institutional borrowers to earn additional income. The Company receives collateral (in the form of cash) against the loaned securities and maintains collateral in an amount not less than 102% of the market value of loaned securities during the period of the loan. The cash collateral received is reported in “Securities lending collateral assets” with an offsetting collateral liability included in “Payable for collateral for securities loaned". Securities lending income is recorded in the accompanying Statements of Operations as net investment income.
Dividends Due to Policyholders: Dividends on insurance policies and pension annuity contracts in the payout phase are declared by the TIAA Board of Trustees (the "Board") in the fourth quarter of each year, and such dividends are

TEACHERS INSURANCE AND ANNUITY ASSOCIATION OF AMERICANOTES TO STATUTORY - BASIS FINANCIAL STATEMENTS (continued)
DECEMBER 31, 2015
18
credited to policyholders in the following calendar year. Dividends on pension annuity contracts in the accumulation phase are declared by the Board in February of each year, and such dividends on the various existing vintages of pension annuity contracts in the accumulation phase are credited to policyholders during the ensuing twelve month period beginning March 1.
Statements of Cash Flows: Noncash activities are excluded from the Statutory - Basis Statements of Cash Flows. These noncash activities for the years ended December 31 include the following (in millions):
2015 2014 2013Exchange/transfer/conversion/distribution of invested assets .................. $ 4,302 $ 2,797 $ 5,523Capitalized interest ................................................................................... 308 304 341Total ......................................................................................................... $ 4,610 $ 3,101 $ 5,864
Application of New Accounting Pronouncements:
Effective January 1, 2015, the Company adopted SSAP No. 40R - Wholly-Owned Single Real Estate Investments held in an LLC effective for the quarter and annual reporting periods beginning January 1, 2015. This adopted guidance incorporates wholly-owned, single real estate held in an LLC into the scope of SSAP No. 40R, and clarifies in SSAP No. 48 that these types of investments are within the scope of SSAP No. 40R. This guidance allows an entity that holds real estate investments through an LLC, to separately report each investment on Schedule A - Real Estate, and code the real estate as wholly owned through an LLC. All real estate owned through an LLC meeting the criteria of SSAP No. 40R are required to be captured within this statement, and are subject to this statement's requirements for valuation and admittance. Adoption of SSAP No. 40R did not have a material impact on the Company's financial statements in 2015.
Note 3 – Long-Term Bonds, Preferred Stocks, and Unaffiliated Common Stocks
The book/adjusted carrying value, estimated fair value, excess of fair value over book/adjusted carrying value and excess of book/adjusted carrying value over fair value of long-term bonds at December 31, is shown below (in millions):
2015Excess of
Book/Adjusted Carrying
Value
Fair ValueOver Book/AdjustedCarrying
Value
Book/Adjusted Carrying
Value Over Fair Value
EstimatedFair Value
Bonds:U.S. governments ................................................... $ 38,816 $ 3,876 $ (63) $ 42,629All other governments ............................................. 4,815 412 $ (103) 5,124
States, territories and possessions ......................... 715 63 (8) 770Political subdivisions of states, territories, and possessions ........................................................... 720 32 (19) 733
Special revenue and special assessment, non-guaranteed agencies and government .................. 17,397 1,261 (122) 18,536
Credit tenant loans .................................................. 7,171 479 (60) 7,590Industrial and miscellaneous ................................... 110,024 5,598 (2,522) 113,100Hybrids .................................................................... 666 58 (15) 709Parent, subsidiaries and affiliates............................ 923 — — 923Total ...................................................................... $ 181,247 $ 11,779 $ (2,912) $ 190,114

TEACHERS INSURANCE AND ANNUITY ASSOCIATION OF AMERICANOTES TO STATUTORY - BASIS FINANCIAL STATEMENTS (continued)
DECEMBER 31, 2015
19
2014Excess of
Book/Adjusted Carrying
Value
Fair ValueOver Book/AdjustedCarrying
Value
Book/Adjusted Carrying
Value Over Fair Value
EstimatedFair Value
Bonds: (in millions)U.S. governments ................................................... $ 39,309 $ 4,567 $ (63) $ 43,813All other governments ............................................. 4,379 548 (20) 4,907
States, territories and possessions ......................... 700 87 (1) 786Political subdivisions of states, territories, and possessions ........................................................... 558 36 (5) 589
Special revenue and special assessment, non-guaranteed agencies and government .................. 18,372 1,532 (81) 19,823
Credit tenant loans .................................................. 6,493 527 (13) 7,007Industrial and miscellaneous ................................... 107,462 8,550 (607) 115,405Hybrids .................................................................... 918 78 (12) 984Parent, subsidiaries and affiliates............................ 1,895 23 (1) 1,917Total ...................................................................... $ 180,086 $ 15,948 $ (803) $ 195,231
Impairment Review Process: All securities are subjected to the Company’s process for identifying OTTI. The Company writes down securities it deems to have an OTTI in value during the period the securities are deemed to be impaired, based on management's case-by-case evaluation of the decline in value and prospects for recovery. Management considers a wide range of factors in the impairment evaluation process, including, but not limited to, the following: (a) the length of time the fair value has been below amortized cost; (b) the financial condition and near-term prospects of the issuer; (c) whether the debtor is current on contractually obligated interest and principal payments; (d) the intent and ability of the Company to retain the investment for a period of time sufficient to allow for any anticipated recovery in fair value or repayment; (e) information obtained from regulators and ratings agencies; (f) the potential for impairments in an entire industry sector or sub-sector; (g) the potential for impairments in certain economically-depressed geographic locations and (h) the potential for impairment based on an estimated discounted cash flow analysis for structured and loan-backed securities. Where impairment is considered to be other-than-temporary, the Company recognizes a write-down as a realized loss and adjusts the cost basis of the security accordingly. The Company does not change the revised cost basis for subsequent recoveries in value. Once an impairment write-down is recorded, the Company continues to review the impaired security for potential impairment on an ongoing basis.
Unrealized Losses on Bonds, Preferred Stocks and Unaffiliated Common Stocks: The gross unrealized losses and estimated fair values for securities by the length of time that individual securities are in a continuous unrealized loss position are shown in the table below (in millions):
Less than twelve months Twelve months or more
AmortizedCost
GrossUnrealized
LossEstimatedFair Value
AmortizedCost
GrossUnrealized
LossEstimatedFair Value
December 31, 2015
Loan-backed and structured bonds .............................. $ 10,961 $ (216) $ 10,745 $ 3,320 $ (192) $ 3,128
All other bonds .............................................................. 33,040 (1,648) 31,392 6,482 (860) 5,622
Total bonds ............................................................ $ 44,001 $ (1,864) $ 42,137 $ 9,802 $ (1,052) $ 8,750
Unaffiliated common stocks .......................................... 297 (17) 280 14 (2) 12
Preferred stocks ........................................................... 10 (1) 9 — — —
Total bonds and stocks ....................................... $ 44,308 $ (1,882) $ 42,426 $ 9,816 $ (1,054) $ 8,762

TEACHERS INSURANCE AND ANNUITY ASSOCIATION OF AMERICANOTES TO STATUTORY - BASIS FINANCIAL STATEMENTS (continued)
DECEMBER 31, 2015
20
Less than twelve months Twelve months or more
AmortizedCost
GrossUnrealized
LossEstimatedFair Value
AmortizedCost
GrossUnrealized
LossEstimatedFair Value
December 31, 2014
Loan-backed and structured bonds .............................. $ 1,796 $ (22) $ 1,774 $ 6,182 $ (256) $ 5,926
All other bonds .............................................................. 7,657 (254) 7,403 8,691 (291) 8,400
Total bonds ............................................................ $ 9,453 $ (276) $ 9,177 $ 14,873 $ (547) $ 14,326
Unaffiliated common stocks .......................................... 29 (4) 25 — — —
Preferred stocks ........................................................... 11 — 11 — — —
Total bonds and stocks ....................................... $ 9,493 $ (280) $ 9,213 $ 14,873 $ (547) $ 14,326
Based upon the Company’s current evaluation of these securities in accordance with its impairment policy, the Company has concluded that these securities are not other–than-temporarily impaired. Additionally, the Company currently intends and has the ability to hold the securities with unrealized losses for a period of time sufficient for them to recover.
Scheduled Maturities of Bonds: The carrying value and estimated fair value of bonds, categorized by contractual maturity, are shown below. Bonds not due at a single maturity date have been included in the following table based on the year of final maturity. Actual maturities may differ from contractual maturities because borrowers may prepay obligations with or without call or prepayment penalties. Mortgage-backed and asset-backed securities are shown separately in the table below, as they are not due at a single maturity date (in millions):
December 31, 2015 December 31, 2014Book/
AdjustedCarrying
ValueEstimatedFair Value
Book/AdjustedCarrying
ValueEstimatedFair Value
Due in one year or less .............................. $ 3,642 $ 3,711 $ 4,160 $ 4,253Due after one year through five years ....... 18,613 19,544 17,676 19,152Due after five years through ten years ....... 40,593 40,503 38,670 40,121Due after ten years .................................... 51,039 54,672 47,779 54,838
Subtotal ................................................. 113,887 118,430 108,285 118,364Residential mortgage-backed securities .... 39,379 42,485 44,187 47,745Commercial mortgage-backed securities .. 10,669 10,831 10,817 11,191Asset-backed securities ............................. 17,312 18,368 16,797 17,931
Subtotal ................................................. 67,360 71,684 71,801 76,867Total ..................................................... $ 181,247 $ 190,114 $ 180,086 $ 195,231

TEACHERS INSURANCE AND ANNUITY ASSOCIATION OF AMERICANOTES TO STATUTORY - BASIS FINANCIAL STATEMENTS (continued)
DECEMBER 31, 2015
21
Bond Diversification: The carrying values of long-term bond investments are diversified by the following classification at December 31 as follows:
2015 2014
Residential mortgage-backed securities ......... 21.7% 24.5%U.S. and other governments ........................... 11.4 11.1Manufacturing ................................................. 11.2 10.8Asset-backed securities .................................. 9.6 9.3Public utilities .................................................. 9.6 9.3Finance and financial services ........................ 6.1 5.8Commercial mortgage-backed securities ........ 5.9 6.0Services .......................................................... 5.4 4.5Oil and gas ...................................................... 5.2 5.2Revenue and special obligations .................... 4.2 3.6Communications ............................................. 3.0 3.1Other ............................................................... 6.7 6.8
Total ......................................................... 100.0% 100.0%
The following table presents the carrying value of the long-term bond portfolio by investment grade as of December 31, (dollars in millions):
2015 2014NAIC 1 and 2 ..................................................................... $ 167,506 92.4% $ 167,857 93.2%NAIC 3 through 6 ............................................................... 13,741 7.6 12,229 6.8
Total ........................................................................... $ 181,247 100% $ 180,086 100%
Sub-prime exposure: The following table presents the carrying value of the sub-prime residential mortgage-backed securities by investment grade as of December 31, (dollars in millions):
2015 2014NAIC 1 and 2 ..................................................................... $ 2,316 97.4% $ 2,552 93.8%NAIC 3 through 6 ............................................................... 61 2.6% 169 6.2%
Total ........................................................................... $ 2,377 100% $ 2,721 100%
Loan-backed and Structured Securities: The near-term prepayment assumptions for loan-backed and structured securities are based on historical averages drawing from performance experience for a particular transaction and may vary by security type. The long-term assumptions are adjusted based on expected performance.

TEACHERS INSURANCE AND ANNUITY ASSOCIATION OF AMERICANOTES TO STATUTORY - BASIS FINANCIAL STATEMENTS (continued)
DECEMBER 31, 2015
22
The following table represents OTTI on securities with the intent to sell for the years ended December 31, (in millions):
2015 1 2 3
Amortized Cost Basis Before
OTTI
OTTI Recognized in LossFair Value 1-(2a+2b)2a
Interest2b
Non-interestOTTI recognized 1st Quarter
a. Intent to sell ........... $ 35 $ — * $ — * $ 35Total 1st Quarter ... $ 35 $ — * $ — * $ 35
OTTI recognized 2nd Quartera. Intent to sell ........... $ 2 $ — * $ — * $ 2
Total 2nd Quarter .. $ 2 $ — * $ — * $ 2
OTTI recognized 3rd Quartera. Intent to sell ........... $ 105 $ 1 $ 1 $ 103
Total 3rd Quarter ... $ 105 $ 1 $ 1 $ 103
OTTI recognized 4th Quartera. Intent to sell ........... $ 138 $ 4 $ — * $ 134
Total 4th Quarter ... $ 138 $ 4 $ — * $ 134
Annual Aggregate Total ............ $ 5 $ 1
2014 1 2 3
Amortized Cost Basis Before
OTTI
OTTI Recognized in LossFair Value 1-(2a+2b)2a
Interest2b
Non-interestOTTI recognized 1st Quarter
a. Intent to sell ........... $ 370 $ 79 $ (20) $ 311Total 1st Quarter ... $ 370 $ 79 $ (20) $ 311
OTTI recognized 2nd Quartera. Intent to sell ........... $ 115 $ 16 $ 1 $ 98
Total 2nd Quarter .. $ 115 $ 16 $ 1 $ 98
OTTI recognized 3rd Quarter
a. Intent to sell ........... $ 1,588 $ 40 $ 3 $ 1,545Total 3rd Quarter ... $ 1,588 $ 40 $ 3 $ 1,545
OTTI recognized 4th Quartera. Intent to sell ........... $ 40 $ — $ — * $ 40
Total 4th Quarter ... $ 40 $ — $ — * $ 40
Annual Aggregate Total ............ $ 135 $ (16)* Aggregate total less than $1 million
For the years ended December 31, 2015 and 2014, the Company did not recognize OTTI on loan-backed and structured securities where it lacked the ability to retain for a period of time sufficient to recover the amortized cost basis.
For the years ended December 31, 2015 and 2014, the Company recognized OTTI on loan-backed and structured securities of $12 million and $66 million, respectively, where the present value of cash flows expected to be collected was less than the amortized cost basis of the security.

TEACHERS INSURANCE AND ANNUITY ASSOCIATION OF AMERICANOTES TO STATUTORY - BASIS FINANCIAL STATEMENTS (continued)
DECEMBER 31, 2015
23
Other Disclosures: The following table represents the carrying amount of bonds and stocks denominated in a foreign currency as of December 31, (in millions):
2015 2014Carrying amount of bonds and stocks denominated in foreign currency ......................... $ 2,175 $ 3,247
Carrying amount of bonds and stocks denominated in foreign currency which are collateralized by real estate ............................................................................................. $ 923 $ 1,895
Note 4 – Mortgage Loans
The Company originates mortgage loans that are principally collateralized by commercial real estate. The composition of the mortgage loan portfolio as of December 31, is as follows (in millions):
Loan Type 2015 2014Commercial loans .................................. $ 16,696 $ 14,869Mezzanine loans .................................... 1,486 658Residential loans.................................... 864 86
The maximum and minimum lending rates for mortgage loans originated or purchased during 2015 and 2014 are as follows:
2015 2014Loan Type Maximum Minimum Maximum Minimum
Commercial loans ...................................... 5.65% 3.50% 5.20% 3.00%Mezzanine loans ....................................... 5.52% 4.65% 5.38% 5.25%Residential loans ....................................... 4.88% 3.50% 4.50% 3.75%
The maximum percentage of any one loan to the value ("LTV") of the property at the time of the loan, exclusive of insured, guaranteed or purchase money mortgages, originated or purchased during 2015 and 2014 are as follows:
Maximum LTVLoan Type 2015 2014
Commercial loans .............................................................................. 69.9% 99.4%Mezzanine loans ............................................................................... 65.1% 73.7%Residential loans ............................................................................... 80.0% 80.0%
Impairment Review Process: The Company monitors the effects of current and expected market conditions and other factors on the collectability of mortgage loans to identify and quantify any impairment in value. Impairments are classified as either temporary, for which a recovery is anticipated, or other-than-temporary. Mortgage loans held to maturity with other-than-temporarily impaired values at December 31, 2015 and 2014 have been written down to net realizable values based upon independent appraisals of the collateral. For impaired mortgage loans where the impairments are deemed to be temporary, an allowance for credit losses is established.
Mortgage loans held for sale are written down to the current fair value of the loan. There are no held for sale mortgage loans as of December 31, 2015 or 2014.
Credit Quality
For commercial mortgage loans, the primary credit quality indicators are the loan-to-value ratio, debt service coverage ratio and delinquency. Loan-to-value-ratios compare the unpaid principal balance of the loan to the estimated fair value of the underlying collateral. Generally, the higher the loan-to-value ratio, the higher the risk of experiencing a credit loss. Debt service coverage compares a property’s net operating income to amounts needed to service the principal and interest due under the loan. Generally, the lower the debt service coverage ratio, the higher the risk of experiencing a credit loss. The debt service coverage ratio and the loan-to-value ratio, as well as the values utilized

TEACHERS INSURANCE AND ANNUITY ASSOCIATION OF AMERICANOTES TO STATUTORY - BASIS FINANCIAL STATEMENTS (continued)
DECEMBER 31, 2015
24
in calculating these ratios, are updated quarterly, with a portion of the loan portfolio updated annually. Delinquency is defined as a commercial mortgage loan which is past due. Commercial mortgage loans more than 30 days past due are considered delinquent.
For residential mortgage loans, the Company's primary credit quality indicator is performance versus non-performance. The Company generally defines nonperforming residential mortgage loans as those that are 90 or more days past due and/or on non-accrual status. Generally, nonperforming residential loans have a higher risk of experiencing a credit loss. The Company has no residential mortgage loans which are non-performing as of December 31, 2015 or 2014.
The credit quality of commercial mortgage loans held-for-investment at December 31, are as follows (dollars in millions):
Recorded Investment - CommercialLoan-to-value Ratios
2015 > 70% < 70% Total % of TotalDebt service coverage ratios:Greater than 1.20x .................................................. $ 1,081 $ 15,782 $ 16,863 92.5%Less than 1.20x ....................................................... 227 1,059 1,286 7.0%Construction ............................................................ 90 — 90 0.5%
Total ................................................................ $ 1,398 $ 16,841 $ 18,239 100.0%
Recorded Investment - CommercialLoan-to-value Ratios
2014 > 70% < 70% Total % of TotalDebt service coverage ratios:Greater than 1.20x .................................................. $ 193 $ 14,109 $ 14,302 91.8%Less than 1.20x ....................................................... 275 695 970 6.3%Agriculture and Construction ................................... 40 265 305 1.9%
Total ................................................................ $ 508 $ 15,069 $ 15,577 100.0%
Mortgage Loan Age Analysis: The following table sets forth an age analysis of mortgage loans as of December 31, (dollars in millions):
Residential Commercial
2015 Farm Insured All Other Insured All Other Mezzanine TotalRecorded investment
Current ............................... $ — $ — $ 865 $ — $ 16,748 $ 1,491 $ 19,10430-59 days past due ........... $ — $ — $ 2 $ — $ — $ — $ 2
Interest reducedRecorded investment ......... $ — $ — $ — $ — $ — $ — $ —Number of loans ................. — — — — — — —Percent reduced ................. — % — % — % — % — % — % — %
Residential Commercial
2014 Farm Insured All Other Insured All Other Mezzanine TotalRecorded investment
During 2014 ........................ $ 265 $ — $ 86 $ — $ 14,652 $ 660 $ 15,663
Interest reducedRecorded investment .......... $ — $ — $ — $ — $ 38 $ — $ 38Number of loans ................. — — — — 1 — 1Percent reduced ................. — % — % — % — % 1.64 % — % 1.64 %

TEACHERS INSURANCE AND ANNUITY ASSOCIATION OF AMERICANOTES TO STATUTORY - BASIS FINANCIAL STATEMENTS (continued)
DECEMBER 31, 2015
25
There was no interest accrued on mortgage loans past due as of December 31, 2015 and 2014, respectively.
Mortgage Loan Diversification: The following tables set forth the mortgage loan portfolio by property type and geographic distribution as of December 31:
Mortgage Loans by Property Type (Commercial & Residential)2015 2014
% of Total % of TotalOffice buildings .............................................................................................. 34.3% 37.5%Shopping centers ........................................................................................... 29.3 31.5Industrial buildings ......................................................................................... 13.9 10.7Apartments ..................................................................................................... 12.6 12.6Other - commercial ........................................................................................ 5.4 7.1Residential ..................................................................................................... 4.5 0.6
Total ........................................................................................................... 100.0% 100.0%
Mortgage Loans by Geographic Distribution2015 2014
% of Total % of TotalCommercial Residential Commercial Residential
South Atlantic ............................................................. 23.3% 18.6% 22.0% 11.6%South Central ............................................................. 18.5 8.1 18.0 10.5Middle Atlantic ............................................................ 18.2 20.0 17.6 17.4Pacific ......................................................................... 17.8 32.2 23.4 37.2North Central .............................................................. 8.4 5.4 9.7 4.7New England .............................................................. 7.1 6.0 3.3 16.3Other .......................................................................... 6.7 9.7 6.0 2.3
Total ........................................................................ 100.0% 100.0% 100.0% 100.0%
Regional classification is based on American Council of Life Insurers regional chart. See below for details of regions.
South Atlantic states are DE, DC, FL, GA, MD, NC, SC, VA and WVSouth Central states are AL, AR, KY, LA, MS, OK, TN and TXMiddle Atlantic states are PA, NJ and NYPacific states are AK, CA, HI, OR and WANorth Central states are IA, IL, IN, KS, MI, MN, MO, NE, ND, OH, SD and WINew England states are CT, MA, ME, NH, RI and VTOther comprises investments in Mountain states (AZ, CO, ID, MT, NV, NM, UT, and WY), Australia, Canada and United Kingdom.
Scheduled Mortgage Loan Maturities: At December 31, contractual maturities for mortgage loans are as follows (in millions):
2015 2014Carrying Value Carrying Value
Due in one year or less ........................................................................ $ 1,191 $ 1,117Due after one year through five years .................................................. 2,216 3,604Due after five years through ten years ................................................. 9,752 7,811Due after ten years .............................................................................. 5,887 3,081
Total ................................................................................................ $ 19,046 $ 15,613
Actual maturities may differ from contractual maturities because borrowers may have the right to prepay mortgages, although prepayment premiums may be applicable.

TEACHERS INSURANCE AND ANNUITY ASSOCIATION OF AMERICANOTES TO STATUTORY - BASIS FINANCIAL STATEMENTS (continued)
DECEMBER 31, 2015
26
There were no mortgage troubled debt restructurings during the periods ended December 31, 2015 or 2014. When restructuring mortgage loans, the Company generally requires participation features, yield maintenance stipulations, and/or the establishment of property-specific escrow accounts funded by the borrowers. With respect to impaired loans, the Company accrues interest income to the extent it is deemed collectible. Cash received on impaired mortgage loans that are performing according to their contractual terms is applied in accordance with those terms. For mortgage loans in the process of foreclosure, cash received is initially held in suspense and applied as a return of principal at the time that the foreclosure process is completed, or the mortgage is otherwise disposed. There are no mortgage loans with interest more than 180 days past due at December 31, 2015 or 2014.
Note 5 – Real Estate
At December 31, 2015 and 2014, the Company’s directly owned real estate investments were carried net of third party mortgage encumbrances. There are no third party mortgage encumbrances as of December 31, 2015 and 2014.
The directly owned real estate portfolio is diversified by property type and geographic region based on carrying value at December 31 as follows:
2015 2014Directly Owned Real Estate by Property Type: % of Total % of TotalIndustrial buildings ........................................................... 42.0% 39.9%Office buildings ................................................................ 29.0 35.4Mixed-use projects .......................................................... 13.7 9.3Apartments ...................................................................... 8.0 8.0Retail ............................................................................... 6.6 6.6Land under development ................................................. 0.7 0.8
Total ............................................................................. 100.0% 100.0%
2015 2014Directly Owned Real Estate by Geographic Region: % of Total % of TotalPacific .............................................................................. 57.5% 54.2%South Atlantic .................................................................. 29.8 36.9North Central ................................................................... 5.4 1.0Middle Atlantic ................................................................. 4.9 4.9South Central .................................................................. 2.4 3.0
Total ............................................................................. 100.0% 100.0%
The Company monitors the effects of current and expected market conditions and other factors on its real estate investments to identify and quantify any impairment in value. The Company assesses assets to determine if events or changes in circumstances indicate that the carrying amount of the asset may not be recoverable. The Company evaluates the recoverability of income producing investments based on undiscounted cash flows and then reviews the results of an independent third party appraisal to determine the fair value and if an adjustment is warranted.
Note 6 - Subsidiaries and Affiliates
The Company holds interests in subsidiaries and affiliates which are reported as common stock or other long-term investments. The carrying value of investments in subsidiaries and affiliates at December 31 are shown below (in millions):
2015 2014Net carrying value of the subsidiaries and affiliates
Reported as common stock ......................................................... $ 1,828 $ 1,558Reported as other long-term investments .................................... 19,111 18,573
Total net carrying value ...................................................................... $ 20,939 $ 20,131

TEACHERS INSURANCE AND ANNUITY ASSOCIATION OF AMERICANOTES TO STATUTORY - BASIS FINANCIAL STATEMENTS (continued)
DECEMBER 31, 2015
27
The gross, non-admitted, and admitted value of the Company's significant investment in a non-insurance subsidiary reported as common stock, as well as information received from the NAIC in response to the filing of the common stock investment, is as follows as of December 31, 2015 (in millions):
Description ofInvestment in
Subsidiary Gross
Amount
Non-admittedAmount
AdmittedAsset
Date ofFiling to
NAIC
Type of NAIC Filing
(Sub-1, Sub-2, or Resubmission of Disallowed Filing)
NAICResponseReceived
(Y/N)
NAICValuation(Amount)
NAIC DisallowedEntity's Valuation
Method,ResubmissionRequired (Y/N)
ND Properties, Inc. $ 750 $ — $ 750 9/2/2015 Sub-2 Y $ 1,968 N
The Company held bonds of affiliates at December 31, 2015 and 2014 of $923 million and $1,895 million, respectively.
As of December 31, 2015 and 2014, no investment in a subsidiary or affiliate exceeded 10% of the Company’s admitted assets, and the Company does not have any investment in foreign insurance subsidiaries.
There are no guarantees or undertakings, written or otherwise, for the benefit of an affiliate or a related party that resulted in a material contingent exposure of the reporting entity's or any related party's assets or liabilities.
The Company holds investments in downstream non-insurance holding companies, which are valued by the Company utilizing the look-through approach as defined in SSAP 97. The financial statements for the downstream non-insurance holding companies are not audited and the Company has limited the value of its investment in these non-insurance holding companies to the value contained in the audited financial statements of the underlying investments and unamortized goodwill resulting from the statutory purchase method of accounting. All liabilities, commitments, contingencies, guarantees or obligations of these subsidiaries, which are required to be recorded as liabilities, commitments, contingencies, guarantees or obligations under applicable accounting guidance, are reflected in the Company’s determination of the carrying value of the investment in these subsidiaries, if not already recorded in the subsidiaries’ financial statements.
The Company's carrying value in downstream non-insurance holding companies is $9,763 million and $10,050 million as of December 31, 2015 and 2014, respectively. Significant holdings as of December 31, are as follows (in millions):
2015 2014
SubsidiaryCarrying
ValueCarrying
ValueTIAA Asset Management, LLC *.................................... $ 4,783 $ 4,751TIAA Oil and Gas Investments, LLC............................... 890 1,051TIAA Global Ag Holdco, LLC .......................................... 803 823TIAA Super Regional Mall Member Sub, LLC ................ 647 635Occator Agricultural Properties, LLC .............................. 469 449TIAA Infrastructure Investments, LLC ............................ 382 238TIAA-Stonepeak Investments I, LLC .............................. 237 79Infra Alpha, LLC ............................................................. 226 615Dionysus Properties, LLC............................................... 225 327Mansilla Participacoes LTDA.......................................... 210 294
* TIAA Asset Management, LLC (“TAM”) was formed on July 17, 2014 as a wholly-owned subsidiary of the Company. On October 1, 2014, a newly formed wholly-owned subsidiary of TAM, TIAA Asset Management Finance Company, LLC (“TAMF”), indirectly acquired 100% of the equity interests in Nuveen Investments Inc. (“Nuveen”) from an investor group led by Madison Dearborn Partners for an enterprise value of approximately $6.25 billion, inclusive of Nuveen’s outstanding debt (the “Acquisition”). In connection with the transaction, Nuveen’s outstanding term loans, totaling approximately $3.1 billion, were repaid in full. Also, at the time of closing, Nuveen’s senior secured notes, totaling approximately $1.4 billion in principal amount, remained outstanding. On September 18, 2014, the Company issued an aggregate of $2.0 billion in surplus notes, the proceeds of which were used to fund a portion of the acquisition price and for general corporate purposes.
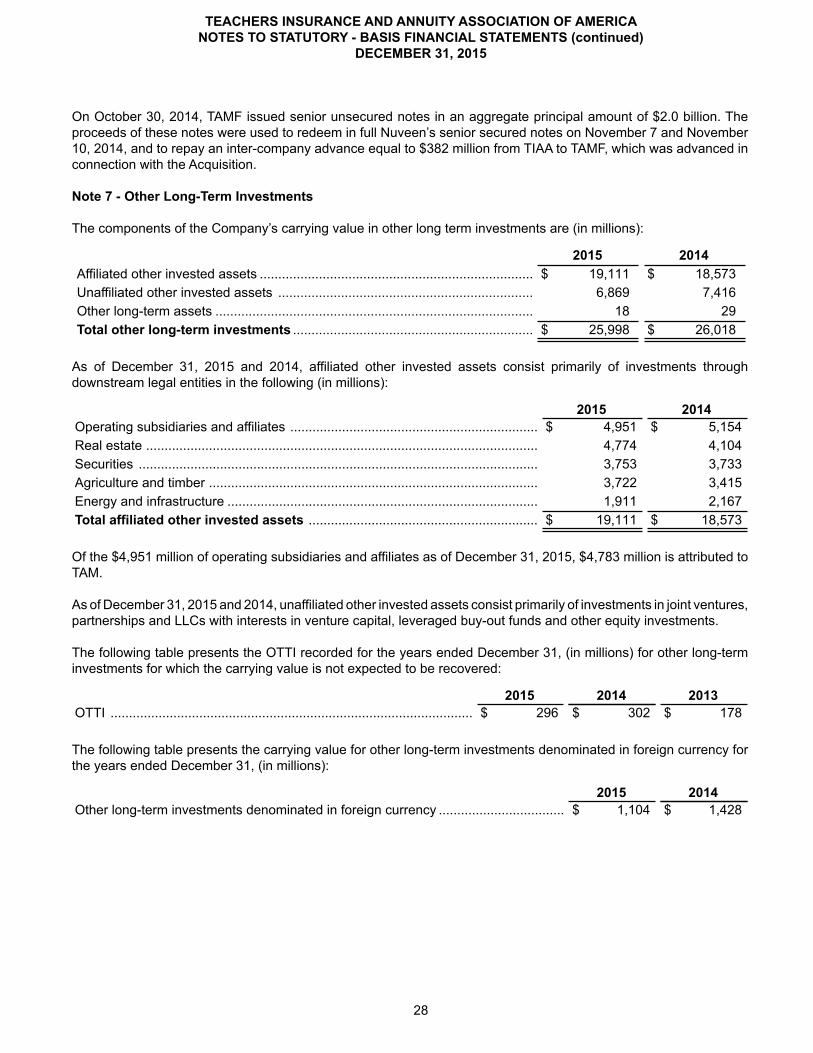
TEACHERS INSURANCE AND ANNUITY ASSOCIATION OF AMERICANOTES TO STATUTORY - BASIS FINANCIAL STATEMENTS (continued)
DECEMBER 31, 2015
28
On October 30, 2014, TAMF issued senior unsecured notes in an aggregate principal amount of $2.0 billion. The proceeds of these notes were used to redeem in full Nuveen’s senior secured notes on November 7 and November 10, 2014, and to repay an inter-company advance equal to $382 million from TIAA to TAMF, which was advanced in connection with the Acquisition.
Note 7 - Other Long-Term Investments
The components of the Company’s carrying value in other long term investments are (in millions):
2015 2014Affiliated other invested assets .......................................................................... $ 19,111 $ 18,573Unaffiliated other invested assets ..................................................................... 6,869 7,416Other long-term assets ...................................................................................... 18 29Total other long-term investments ................................................................. $ 25,998 $ 26,018
As of December 31, 2015 and 2014, affiliated other invested assets consist primarily of investments through downstream legal entities in the following (in millions):
2015 2014Operating subsidiaries and affiliates ................................................................... $ 4,951 $ 5,154Real estate .......................................................................................................... 4,774 4,104Securities ............................................................................................................ 3,753 3,733Agriculture and timber ......................................................................................... 3,722 3,415Energy and infrastructure .................................................................................... 1,911 2,167Total affiliated other invested assets .............................................................. $ 19,111 $ 18,573
Of the $4,951 million of operating subsidiaries and affiliates as of December 31, 2015, $4,783 million is attributed to TAM.
As of December 31, 2015 and 2014, unaffiliated other invested assets consist primarily of investments in joint ventures, partnerships and LLCs with interests in venture capital, leveraged buy-out funds and other equity investments.
The following table presents the OTTI recorded for the years ended December 31, (in millions) for other long-term investments for which the carrying value is not expected to be recovered:
2015 2014 2013OTTI .................................................................................................. $ 296 $ 302 $ 178
The following table presents the carrying value for other long-term investments denominated in foreign currency for the years ended December 31, (in millions):
2015 2014Other long-term investments denominated in foreign currency .................................. $ 1,104 $ 1,428

TEACHERS INSURANCE AND ANNUITY ASSOCIATION OF AMERICANOTES TO STATUTORY - BASIS FINANCIAL STATEMENTS (continued)
DECEMBER 31, 2015
29
Note 8 - Investments Commitments
The outstanding obligation for future investments at December 31, 2015, is shown below by asset category (in millions):
2016 In later yearsTotal
CommitmentsBonds ...................................................................... $ 236 $ 87 $ 323Stocks ..................................................................... 141 164 305Mortgage loans ....................................................... 410 — 410Real estate .............................................................. 88 — 88Other long-term investments ................................... 1,226 3,329 4,555Total ........................................................................ $ 2,101 $ 3,580 $ 5,681
The funding of bond commitments is contingent upon the continued favorable financial performance of the potential borrowers, funding of stock commitments is contingent upon their continued favorable financial performance and the funding of real estate commitments and commercial mortgage commitments is generally contingent upon the underlying properties meeting specified requirements, including construction, leasing and occupancy. The funding of residential mortgage loan commitments is contingent upon the loan meeting specified guidelines including property appraisal reviews and confirmation of borrower credit. For other long–term investments, primarily fund investments, there are scheduled capital calls that extend into future years.
Note 9 – Investment Income and Capital Gains and Losses
Net Investment Income: The components of net investment income for the years ended December 31 are as follows (in millions):
2015 2014 2013Bonds ........................................................................................... $ 8,823 $ 9,050 $ 9,206Stocks ........................................................................................... 76 34 61Mortgage loans ............................................................................. 846 787 772Real estate ................................................................................... 236 219 203Derivatives .................................................................................... 17 10 (8)Other long-term investments ........................................................ 1,753 1,526 1,430Cash, cash equivalents and short-term investments .................... 3 2 7Total gross investment income ..................................................... 11,754 11,628 11,671
Less investment expenses ........................................................... (685) (557) (542)Net investment income before amortization of IMR ...................... 11,069 11,071 11,129Plus amortization of IMR .............................................................. 266 182 145
Net investment income ........................................................... $ 11,335 $ 11,253 $ 11,274

TEACHERS INSURANCE AND ANNUITY ASSOCIATION OF AMERICANOTES TO STATUTORY - BASIS FINANCIAL STATEMENTS (continued)
DECEMBER 31, 2015
30
Realized Capital Gains and Losses: The net realized capital gains (losses) on sales, redemptions and write-downs due to OTTI for the years ended December 31 are as follows (in millions):
2015 2014 2013Bonds ........................................................................................... $ (380) $ 78 $ 604Stocks ........................................................................................... (85) (135) (50)Mortgage loans ............................................................................. 14 22 ---Real estate ................................................................................... 83 (1) 30Derivatives .................................................................................... 324 (19) (24)Other long-term investments ........................................................ (320) (291) (115)Cash, cash equivalents and short-term investments .................... (36) (26) (121)Total before capital gains taxes and transfers to IMR ................... (400) (372) 324Transfers to IMR ........................................................................... (87) (5) (741)Net realized capital losses less capital gains taxes, after
transfers to IMR ........................................................................ $ (487) $ (377) $ (417)
Write-downs of investments resulting from OTTI, included in the preceding table, are as follows for the years ended December 31, (in millions):
2015 2014 2013Other-than-temporary impairments:
Bonds ....................................................................................... $ 274 $ 223 $ 281Stocks ...................................................................................... 284 158 77Other long-term investments .................................................... 296 302 178
Total ............................................................................................. $ 854 $ 683 $ 536
Information related to the sales of long term bonds for the years ended December 31, 2015, 2014 and 2013 are as follows (in millions):
2015 2014 2013Proceeds from sales .................................................................... $ 6,249 $ 8,544 $ 8,949Gross gains on sales .................................................................... $ 120 $ 334 $ 835Gross losses on sales .................................................................. $ 58 $ 79 $ 17
The Company generally holds its investments until maturity. The Company performs periodic reviews of its portfolio to identify investments which may have deteriorated in credit quality to determine if any are candidates for sale in order to maintain a quality portfolio of investments. Investments which are deemed candidates for sale are continually monitored until sold and carried at the lower of amortized cost or fair value. In accordance with the Company’s valuation and impairment process, the investment will be monitored quarterly for further declines in fair value at which point an OTTI will be recorded until actual disposal of the investment.
Note 10 – Disclosures about Fair Value of Financial Instruments
Fair Value of Financial Instruments
Included in the Company’s financial statements are certain financial instruments carried at fair value. Other financial instruments are periodically measured at fair value, such as when impaired, or for certain bonds and preferred stocks when carried at the lower of cost or fair value.
Fair value is the price that would be received to sell an asset or paid to transfer a liability in an orderly transaction between market participants at the measurement date.
Fair values of financial instruments are based on quoted market prices when available. When market prices are not available, fair values are primarily provided by a third party-pricing service for identical or comparable assets, or

TEACHERS INSURANCE AND ANNUITY ASSOCIATION OF AMERICANOTES TO STATUTORY - BASIS FINANCIAL STATEMENTS (continued)
DECEMBER 31, 2015
31
through the use of valuation methodologies using observable market inputs. These fair values are generally estimated using a discounted cash flow analysis, incorporating current market inputs for similar financial instruments with comparable terms and credit quality. In instances where there is little or no market activity for the same or similar instruments, the Company estimates fair value using methods, models and assumptions that management believes market participants would use to determine a current transaction price in a hypothetical market. These valuation techniques involve management estimation and judgment for many factors including market bid/ask spreads, and such estimations may become significant with increasingly complex instruments or pricing models.
The Company’s financial assets and liabilities are classified, for disclosure purposes, based on a hierarchy defined by SSAP No. 100, Fair Value Measurements. The fair value hierarchy prioritizes the inputs to valuation techniques used to measure fair value into three broad levels. The hierarchy gives the highest ranking to fair values determined using unadjusted quoted prices in active markets for identical assets and liabilities (Level 1) and the lowest ranking to fair values determined using methodologies and models with unobservable inputs (Level 3). An asset’s or a liability’s classification is based on the lowest level input that is significant to its measurement. For example, a Level 3 fair value measurement may include inputs that are both observable (Levels 1 and Level 2) and unobservable (Level 3). The levels of the fair value hierarchy are as follows:
Level 1 – Inputs are unadjusted quoted prices in active markets for identical assets and liabilities that the Company has the ability to access at the measurement date.
Level 2 – Other than quoted prices within Level 1 inputs are observable for the asset or liability, either directly or indirectly.

TEACHERS INSURANCE AND ANNUITY ASSOCIATION OF AMERICANOTES TO STATUTORY - BASIS FINANCIAL STATEMENTS (continued)
DECEMBER 31, 2015
32
Level 2 inputs include:• Quoted prices for similar assets or liabilities in active markets, • Quoted prices for identical or similar assets or liabilities in markets that are not active, • Inputs other than quoted prices that are observable for the asset or liability,• Inputs that are derived principally from or corroborated by observable market data by correlation
or other means.
Level 3 - Inputs are unobservable inputs for the asset or liability supported by little or no market activity. Unobservable inputs reflect the Company’s own assumptions about the assumptions that market participants would use in pricing the asset or liability. The Company’s data used to develop unobservable inputs is adjusted if information is reasonably available without undue cost and effort that indicates that market participants would use different assumptions.
The following table provides information about the aggregate fair value for all financial instruments and the level within the fair value hierarchy at December 31, 2015 (in millions):
AggregateFair Value
AdmittedAssets Level 1 Level 2 Level 3
Assets:Bonds ..................................................................... $ 190,114 $ 181,247 $ — $ 186,381 $ 3,733Common stock ........................................................ 1,248 1,248 742 4 502Preferred stock ....................................................... 212 195 14 92 106Mortgage loans ....................................................... 19,567 19,046 — — 19,567Derivatives .............................................................. 276 268 — 268 8Contract loans ........................................................ 1,591 1,591 — — 1,591Separate account assets ........................................ 29,896 29,897 7,975 4,600 17,321Cash, cash equivalents & short term investments .. 533 533 490 12 31
Total ................................................................... $ 243,437 $ 234,025 $ 9,221 $ 191,357 $ 42,859
AggregateFair Value
StatementValue Level 1 Level 2 Level 3
Liabilities:Deposit-type contracts ............................................ $ 994 $ 994 $ — $ — $ 994Separate account liabilities ..................................... 29,883 29,883 — — 29,883Derivatives ............................................................. 49 42 — 49 —
Total .................................................................. $ 30,926 $ 30,919 $ — $ 49 $ 30,877
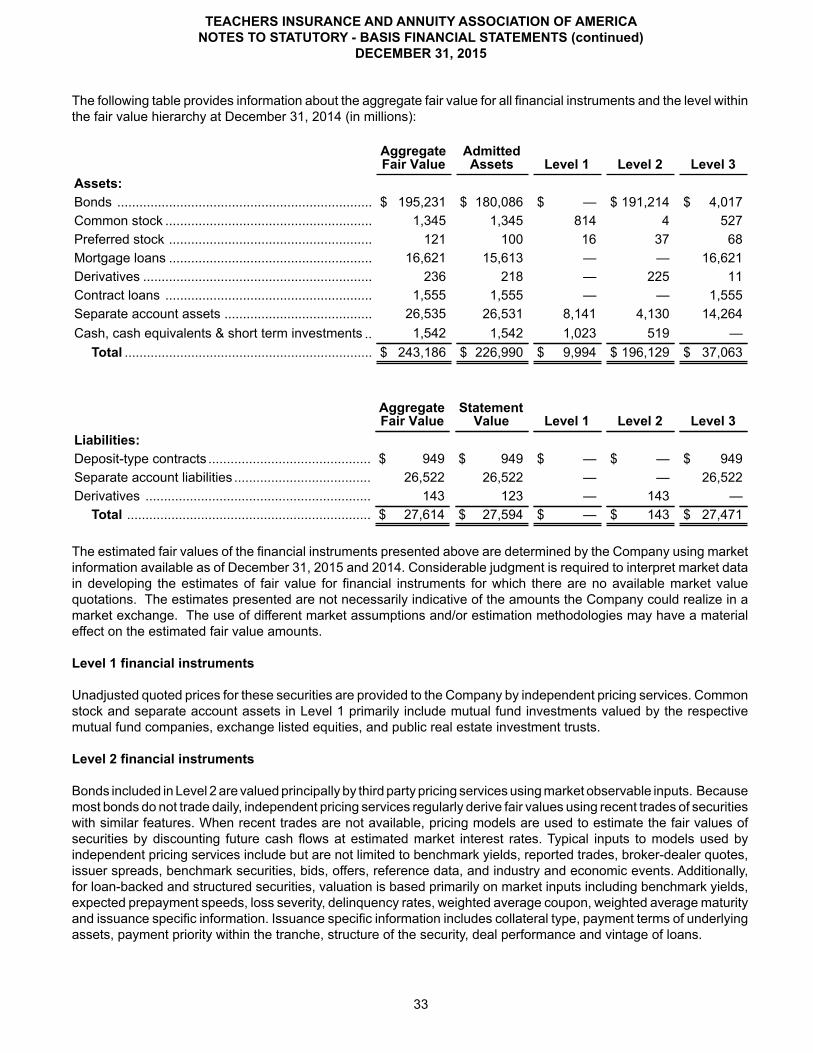
TEACHERS INSURANCE AND ANNUITY ASSOCIATION OF AMERICANOTES TO STATUTORY - BASIS FINANCIAL STATEMENTS (continued)
DECEMBER 31, 2015
33
The following table provides information about the aggregate fair value for all financial instruments and the level within the fair value hierarchy at December 31, 2014 (in millions):
AggregateFair Value
AdmittedAssets Level 1 Level 2 Level 3
Assets:Bonds ..................................................................... $ 195,231 $ 180,086 $ — $ 191,214 $ 4,017Common stock ........................................................ 1,345 1,345 814 4 527Preferred stock ....................................................... 121 100 16 37 68Mortgage loans ....................................................... 16,621 15,613 — — 16,621Derivatives .............................................................. 236 218 — 225 11Contract loans ........................................................ 1,555 1,555 — — 1,555Separate account assets ........................................ 26,535 26,531 8,141 4,130 14,264Cash, cash equivalents & short term investments .. 1,542 1,542 1,023 519 —
Total ................................................................... $ 243,186 $ 226,990 $ 9,994 $ 196,129 $ 37,063
AggregateFair Value
StatementValue Level 1 Level 2 Level 3
Liabilities:Deposit-type contracts ............................................ $ 949 $ 949 $ — $ — $ 949Separate account liabilities ..................................... 26,522 26,522 — — 26,522Derivatives ............................................................. 143 123 — 143 —
Total .................................................................. $ 27,614 $ 27,594 $ — $ 143 $ 27,471 The estimated fair values of the financial instruments presented above are determined by the Company using market information available as of December 31, 2015 and 2014. Considerable judgment is required to interpret market data in developing the estimates of fair value for financial instruments for which there are no available market value quotations. The estimates presented are not necessarily indicative of the amounts the Company could realize in a market exchange. The use of different market assumptions and/or estimation methodologies may have a material effect on the estimated fair value amounts.
Level 1 financial instruments
Unadjusted quoted prices for these securities are provided to the Company by independent pricing services. Common stock and separate account assets in Level 1 primarily include mutual fund investments valued by the respective mutual fund companies, exchange listed equities, and public real estate investment trusts.
Level 2 financial instruments
Bonds included in Level 2 are valued principally by third party pricing services using market observable inputs. Because most bonds do not trade daily, independent pricing services regularly derive fair values using recent trades of securities with similar features. When recent trades are not available, pricing models are used to estimate the fair values of securities by discounting future cash flows at estimated market interest rates. Typical inputs to models used by independent pricing services include but are not limited to benchmark yields, reported trades, broker-dealer quotes, issuer spreads, benchmark securities, bids, offers, reference data, and industry and economic events. Additionally, for loan-backed and structured securities, valuation is based primarily on market inputs including benchmark yields, expected prepayment speeds, loss severity, delinquency rates, weighted average coupon, weighted average maturity and issuance specific information. Issuance specific information includes collateral type, payment terms of underlying assets, payment priority within the tranche, structure of the security, deal performance and vintage of loans.

TEACHERS INSURANCE AND ANNUITY ASSOCIATION OF AMERICANOTES TO STATUTORY - BASIS FINANCIAL STATEMENTS (continued)
DECEMBER 31, 2015
34
Common stocks included in Level 2 include those which are traded in an inactive market or for which prices for identical securities are not available. Valuations are based principally on observable inputs including quoted prices in markets that are not considered active.
Derivative assets and liabilities classified in Level 2 represent over-the-counter instruments that include, but are not limited to, fair value hedges using foreign currency swaps, foreign currency forwards, interest rate swaps and credit default swaps. Fair values for these instruments are determined internally using market observable inputs that include, but are not limited to, forward currency rates, interest rates, credit default rates and published observable market indices.
Separate account assets in Level 2 consist principally of short term government agency notes and commercial paper.
Level 3 financial instruments
Valuation techniques for bonds included in Level 3 are generally the same as those described in Level 2 except that the techniques utilize inputs that are not readily observable in the market, including illiquidity premiums and spread adjustments to reflect industry trends or specific credit-related issues. The Company assesses the significance of unobservable inputs for each security and classifies that security in Level 3 as a result of the significance of unobservable inputs.
Estimated fair value for privately traded equity securities are principally determined using valuation and discounted cash flow models that require a substantial level of judgment.
Separate account assets classified as Level 3 primarily include directly owned real estate properties, real estate joint ventures and real estate limited partnerships. Directly owned real estate properties are valued on a quarterly basis based on independent third party appraisals. Real estate joint venture interests are valued based on the fair value of the underlying real estate, any related mortgage loans payable and other factors such as ownership percentage, ownership rights, buy/sell agreements, distribution provisions and capital call obligations. Real estate limited partnership interests are valued based on the most recent net asset value of the partnership.

TEACHERS INSURANCE AND ANNUITY ASSOCIATION OF AMERICANOTES TO STATUTORY - BASIS FINANCIAL STATEMENTS (continued)
DECEMBER 31, 2015
35
Assets and Liabilities Measured and Reported at Fair Value
The following table provides information about the Company’s financial assets and liabilities measured and reported at fair value as of December 31, (in millions):
2015Level 1 Level 2 Level 3 Total
Assets at fair value:Bonds
Industrial and miscellaneous ................................. $ — $ 23 $ 33 $ 56Total bonds............................................................ $ — $ 23 $ 33 $ 56
Common stockIndustrial and miscellaneous ................................. $ 742 $ 4 $ 502 $ 1,248Total common stocks............................................. $ 742 $ 4 $ 502 $ 1,248
Preferred stock $ — $ — $ 9 $ 9
DerivativesInterest rate contracts............................................ $ — $ 8 $ — $ 8Foreign exchange contracts .................................. — 248 — 248Total derivatives .................................................... $ — $ 256 $ — $ 256
Separate accounts assets......................................... $ 7,957 $ 4,207 $ 17,321 $ 29,485
Total assets at fair value ..................................... $ 8,699 $ 4,490 $ 17,865 $ 31,054
Liabilities at fair value:Derivatives
Foreign exchange contracts .................................. $ — $ 15 $ — $ 15Credit default swaps .............................................. — 14 — 14Total liabilities at fair value ................................. $ — $ 29 $ — $ 29

TEACHERS INSURANCE AND ANNUITY ASSOCIATION OF AMERICANOTES TO STATUTORY - BASIS FINANCIAL STATEMENTS (continued)
DECEMBER 31, 2015
36
2014Level 1 Level 2 Level 3 Total
Assets at fair value:Bonds
Industrial and miscellaneous........................... $ — $ 95 $ 15 $ 110Total bonds ..................................................... $ — $ 95 $ 15 $ 110
Common stockIndustrial and miscellaneous........................... $ 814 $ 4 $ 527 $ 1,345Total common stocks ...................................... $ 814 $ 4 $ 527 $ 1,345
DerivativesForeign exchange contracts............................ $ — $ 199 $ — $ 199Interest rate contracts ..................................... — 17 — 17Total derivatives .............................................. $ — $ 216 $ — $ 216
Separate accounts assets .................................. $ 8,124 $ 3,831 $ 14,264 $ 26,219
Total assets at fair value .............................. $ 8,938 $ 4,146 $ 14,806 $ 27,890
Liabilities at fair value:Derivatives
Foreign exchange contracts............................ $ — $ 51 $ — $ 51Credit default swaps ....................................... — 22 — 22Total liabilities at fair value .......................... $ — $ 73 $ — $ 73
Transfers between Level 1 and Level 2
Periodically, the Company has transfers between Level 1 and Level 2 due to the availability of quoted prices for identical assets in active markets at the measurement date. The Company’s policy is to recognize transfers between levels as of the actual date of the event or change in circumstances that caused the transfer.
As of December 31, 2015, the Company had no transfers between Level 1 and Level 2 of the fair value hierarchy. As of December 31, 2014, the Company transferred a small denomination of common stock from Level 2 to Level 1 due to changes in the availability of quoted prices in active markets for identical assets at the quarterly measurement dates throughout the year.
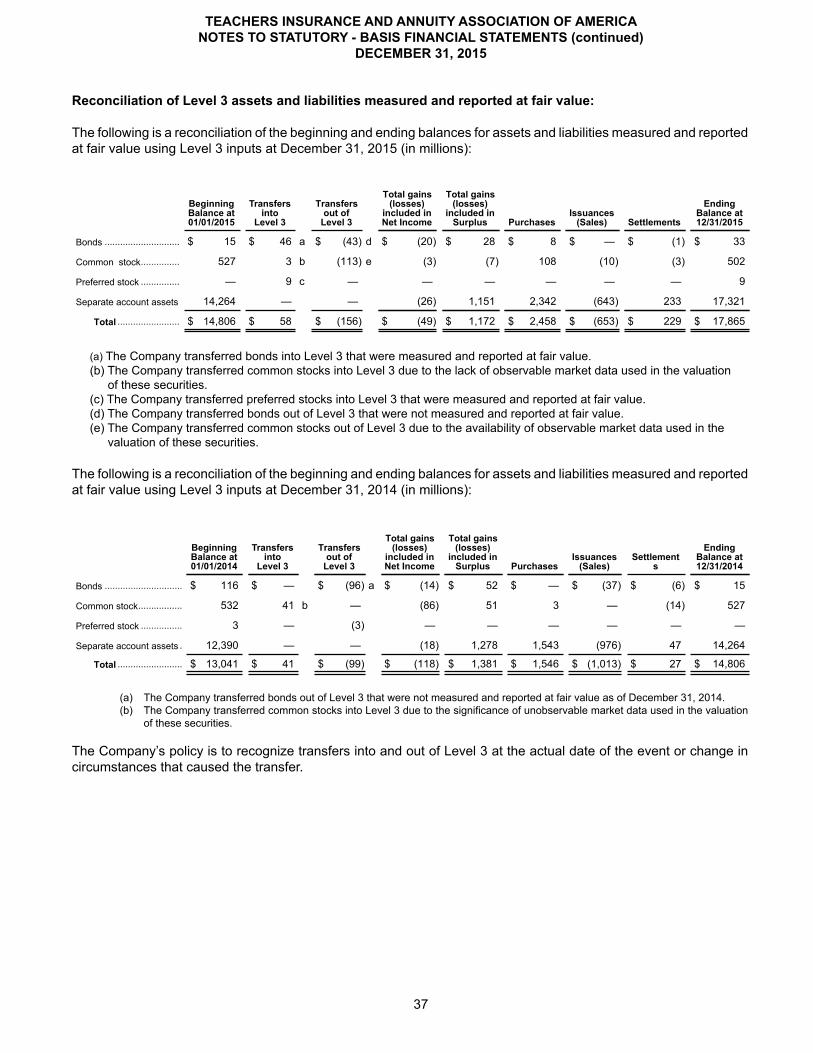
TEACHERS INSURANCE AND ANNUITY ASSOCIATION OF AMERICANOTES TO STATUTORY - BASIS FINANCIAL STATEMENTS (continued)
DECEMBER 31, 2015
37
Reconciliation of Level 3 assets and liabilities measured and reported at fair value:
The following is a reconciliation of the beginning and ending balances for assets and liabilities measured and reported at fair value using Level 3 inputs at December 31, 2015 (in millions):
BeginningBalance at01/01/2015
Transfers into
Level 3
Transfersout of
Level 3
Total gains(losses)
included inNet Income
Total gains(losses)
included inSurplus Purchases
Issuances(Sales) Settlements
EndingBalance at12/31/2015
Bonds ............................. $ 15 $ 46 a $ (43) d $ (20) $ 28 $ 8 $ — $ (1) $ 33
Common stock............... 527 3 b (113) e (3) (7) 108 (10) (3) 502
Preferred stock ............... — 9 c — — — — — — 9
Separate account assets 14,264 — — (26) 1,151 2,342 (643) 233 17,321
Total ........................ $ 14,806 $ 58 $ (156) $ (49) $ 1,172 $ 2,458 $ (653) $ 229 $ 17,865
(a) The Company transferred bonds into Level 3 that were measured and reported at fair value.(b) The Company transferred common stocks into Level 3 due to the lack of observable market data used in the valuation
of these securities.(c) The Company transferred preferred stocks into Level 3 that were measured and reported at fair value.(d) The Company transferred bonds out of Level 3 that were not measured and reported at fair value.(e) The Company transferred common stocks out of Level 3 due to the availability of observable market data used in the
valuation of these securities.
The following is a reconciliation of the beginning and ending balances for assets and liabilities measured and reported at fair value using Level 3 inputs at December 31, 2014 (in millions):
BeginningBalance at01/01/2014
Transfers into
Level 3
Transfersout of
Level 3
Total gains(losses)
included inNet Income
Total gains(losses)
included inSurplus Purchases
Issuances(Sales)
Settlements
EndingBalance at12/31/2014
Bonds .............................. $ 116 $ — $ (96) a $ (14) $ 52 $ — $ (37) $ (6) $ 15
Common stock................. 532 41 b — (86) 51 3 — (14) 527
Preferred stock ................ 3 — (3) — — — — — —
Separate account assets . 12,390 — — (18) 1,278 1,543 (976) 47 14,264
Total ......................... $ 13,041 $ 41 $ (99) $ (118) $ 1,381 $ 1,546 $ (1,013) $ 27 $ 14,806
(a) The Company transferred bonds out of Level 3 that were not measured and reported at fair value as of December 31, 2014.(b) The Company transferred common stocks into Level 3 due to the significance of unobservable market data used in the valuation
of these securities.
The Company’s policy is to recognize transfers into and out of Level 3 at the actual date of the event or change in circumstances that caused the transfer.

TEACHERS INSURANCE AND ANNUITY ASSOCIATION OF AMERICANOTES TO STATUTORY - BASIS FINANCIAL STATEMENTS (continued)
DECEMBER 31, 2015
38
Quantitative Information Regarding Level 3 Fair Value Measurements
The following table provides quantitative information on significant unobservable inputs (Level 3) used in the fair value measurement of assets that are measured and reported at fair value at December 31, 2015 (dollars in millions):
Financial InstrumentFair
ValueValuation
TechniquesSignificant
Unobservable InputsRange of
InputsWeighted Average
Fixed maturity securities:RMBS $ 11 Discounted cash Flow Discount rate 4.7% - 15.0% 5.4%
Market comparable Credit analysis/market comparable
$92.50 -100.50 $95.14
Corporate and other bonds $ 22 Discounted cash flow Discount rate 11.5% 11.5%
Market comparableCredit analysis/market comparable $7.38 $7.38
Equity securities:Common stock1 $ 502 Market comparable EBITDA multiple 7.0x – 11.8x 9.3x
Equity method Book value multiple 1.0x 1.0x
Preferred stock $ 9 Market comparable EBITDA multiple 9.5x 9.5x
1 Included in Level 3 Common Stock is the Company's holdings in FHLB of NY's stock as described in Note 20 - FHLBNY Membership and Borrowings. As prescribed in the FHLB of NY's capital plan, the par value of the capital stock is $100 and all capital stock is issued, redeemed, repurchased, or transferred at par value. Since there is not an observable market for the FHLB of NY stock, these securities have been classified as Level 3.
Financial Instrument Fair Value Valuation TechniquesSignificant Unobservable
InputsRange of
InputsWeighted Average
Separate account assets:Real estate properties and
real estate joint ventures $ 19,015Office properties Income approach -
discounted cash flow Discount rate 6.0% - 8.3% 6.5%Terminal capitalization rate 4.3% - 7.5% 5.5%
Income approach - direct capitalization Overall capitalization rate 3.8% - 7.3% 4.7%
Industrial properties Income approach - discounted cash flow Discount rate 5.7% - 8.8% 6.8%
Terminal capitalization rate 4.9% - 7.3% 5.7%Income approach - direct capitalization Overall capitalization rate 4.0% - 6.3% 5.1%
Residential properties Income approach - discounted cash flow Discount rate 5.3% - 7.3% 6.2%
Terminal capitalization rate 4.0% - 5.8% 4.8%Income approach - direct capitalization Overall capitalization rate 3.3% - 5.3% 4.1%
Retail properties Income approach - discounted cash flow Discount rate 5.0% - 10.4% 6.8%
Terminal capitalization rate 4.8% - 9.5% 5.8%Income approach - direct capitalization Overall capitalization rate 4.3% - 8.5% 5.2%

TEACHERS INSURANCE AND ANNUITY ASSOCIATION OF AMERICANOTES TO STATUTORY - BASIS FINANCIAL STATEMENTS (continued)
DECEMBER 31, 2015
39
Separate account real estate assets include the values of the related mortgage loans payable in the table below.
Financial Instrument Fair Value Valuation TechniquesSignificant Unobservable
Inputs Range of InputsWeighted Average
Mortgage loans payable $ (1,795)Office and industrial properties Discounted cash flow Loan to value ratio 31.0% - 47.5% 41.0%
Equivalency rate 2.7% - 3.8% 3.6%
Net present value Loan to value ratio 31.0% - 47.5% 41.0%Weighted average cost of capital risk premium multiple 1.2 - 1.3 1.3
Residential properties Discounted cash flow Loan to value ratio 30.6% - 63.2% 44.0%Equivalency rate 2.7% - 3.5% 3.2%
Net present value Loan to value ratio 30.6% - 63.2% 44.0%Weighted average cost of capital risk premium multiple 1.2 – 1.5 1.3
Retail properties Discounted cash flow Loan to value ratio 21.0% - 49.4% 37.8%Equivalency rate 2.4% - 4.0% 3.3%
Net present value Loan to value ratio 21.0% - 49.4% 37.8%Weighted average cost of capital risk premium multiple 1.1 – 1.3 1.2
Separate account real estate assets include the values of the related loan receivable in the table below.
Financial Instrument Fair Value Valuation TechniquesSignificant Unobservable
InputsRange of
InputsWeightedAverage
Loan receivable $ 101
Office properties Discounted cash flow Loan to value ratio 76.1% 76.1%
Equivalency rate 6.1% 6.1%
Additional Qualitative Information on Fair Valuation Process
The Company has various processes and controls in place to ensure that fair value is reasonably estimated. The Risk Management Valuation group, which reports to the Chief Credit Risk Officer, sets the valuation policies for fixed income and equity securities and is responsible for the determination of fair value. The policies and framework for fair value methodologies are approved by the TIAA Valuation Committee.
Risk Management Valuation (1) compares price changes between periods to current market conditions, (2) compares trade prices of securities to fair value estimates, (3) compares prices from multiple pricing sources, and (4) performs ongoing vendor due diligence to confirm that independent pricing services use market-based parameters for valuation. Internal and vendor valuation methodologies are reviewed on an ongoing basis and revised as necessary based on changing market conditions to ensure values represent a reasonable exit price.
Markets in which the Company’s fixed income securities trade are monitored by surveying the Company’s traders. Risk Management Valuation determines if liquidity is active enough to support a Level 2 classification. Use of independent non-binding broker quotations may indicate a lack of liquidity or the general lack of transparency in the process to develop these price estimates, causing them to be considered Level 3.
Level 3 equity investments generally include private equity co-investments along with general and limited partnership interests. Values are derived by the general partners. The partners generally fair value these instruments based on projected net earnings, earnings before interest, taxes depreciation and amortization, discounted cash flow, public or private market transactions, or valuations of comparable companies. When using market comparable, certain

TEACHERS INSURANCE AND ANNUITY ASSOCIATION OF AMERICANOTES TO STATUTORY - BASIS FINANCIAL STATEMENTS (continued)
DECEMBER 31, 2015
40
adjustments may be made for differences between the reference comparable and the investment, such as liquidity. Investments may also be valued at cost for a period of time after an acquisition, as the best indication of fair value.
With respect to real property investments in TIAA’s Real Estate Account, each property is appraised, and each mortgage loan is valued, at least once every calendar quarter. Each property is appraised by an independent, third party appraiser, reviewed by the Company’s internal appraisal staff and as applicable, the Real Estate Account’s independent fiduciary. Any differences in the conclusions of the Company’s internal appraisal staff and the independent appraiser are reviewed by the independent fiduciary, who will make a final determination. The independent fiduciary was appointed by a special subcommittee of the Investment Committee of TIAA Board of Trustees to, among other things, oversee the appraisal process. The independent fiduciary must approve all independent appraisers used by the Real Estate Account.
Mortgage loans payable are valued internally by the Company’s valuation department, and reviewed by the Real Estate Account’s independent fiduciary, at least quarterly based on market factors, such as market interest rates and spreads for comparable loans, the performance of the underlying collateral (such as the loan-to-value ratio and the cash flow of the underlying collateral), the liquidity for mortgage loans of similar characteristics, the maturity date of the loan, the return demands of the market.
The loan receivable is valued internally by the Company’s valuation department, and reviewed by the Real Estate Account’s independent fiduciary, at least quarterly based on market factors, such as market interest rates and spreads for comparable loans, the liquidity for loans of similar characteristics, the performance of the underlying collateral (such as the loan-to-value ratio and the cash flow of the underlying collateral) and the credit quality of the counterparty. The Real Estate Account continues to use the revised value after valuation adjustments for the loan receivable to calculate the Account’s daily net asset value until the next valuation review.
Note 11 – Restricted Assets
The following tables provide information on the amounts and nature of assets pledged to others as collateral or otherwise restricted by the Company as of December 31, (dollars in millions):
Gross Restricted12/31/2015 Percentage
1 2 3 4 5 6 7 8 9 10
RestrictedAsset Category
TotalGeneralAccount
(G/A)
G/ASupporting
(S/A)Activity
TotalSeparateAccount
(S/A)Restricted
Assets
S/A AssetsSupporting
G/AActivity
Total (1 plus 3)
TotalFrom
Prior Year
Increase /(Decrease)(5 minus
6)
TotalCurrent
YearAdmitted
Restricted
GrossRestricted
to TotalAssets
AdmittedRestricted
to TotalAdmittedAssets
Collateral heldunder securitylendingagreements. .... $ 827 $ — $ — $ — $ 827 $ 614 $ 213 $ 827 0.297% 0.306%
FHLB capitalstock ............... $ 97 $ — $ — $ — $ 97 $ — $ 97 $ 97 0.035% 0.036%
On deposit withstates .............. $ 6 $ — $ — $ — $ 6 $ 7 $ (1) $ 6 0.002% 0.002%
Pledged ascollateral notcaptured inothercategories(derivativecollateral) ........ $ 14 $ — $ — $ — $ 14 $ 30 $ (16) $ 14 0.005% 0.005%
Total restrictedassets............. $ 944 $ — $ — $ — $ 944 $ 651 $ 293 $ 944 0.339% 0.349%

TEACHERS INSURANCE AND ANNUITY ASSOCIATION OF AMERICANOTES TO STATUTORY - BASIS FINANCIAL STATEMENTS (continued)
DECEMBER 31, 2015
41
Gross Restricted
12/31/2014 Percentage
1 2 3 4 5 6 7 8 9 10
RestrictedAsset
Category
TotalGeneralAccount
(G/A)
G/ASupporting
(S/A)Activity
TotalSeparateAccount
(S/A)Restricted
Assets
S/A AssetsSupporting
G/AActivity
Total (1 plus 3)
TotalFrom
Prior Year
Increase /(Decrease)(5 minus 6)
TotalCurrent
YearAdmitted
Restricted
GrossRestricted
to TotalAssets
AdmittedRestricted
to TotalAdmittedAssets
Subject torepurchaseagreements .... $ — $ — $ — $ — $ — $ 471 $ (471) $ — 0.000% 0.000%
Collateral heldunder securitylendingagreements. ... $ 614 $ — $ — $ — $ 614 $ — $ 614 $ 614 0.226% 0.234%
On deposit withstates.............. $ 7 $ — $ — $ — $ 7 $ 7 $ — $ 7 0.003% 0.003%
Pledged ascollateral notcaptured inothercategories(derivativecollateral)........ $ 30 $ — $ — $ — $ 30 $ 113 $ (83) $ 30 0.011% 0.011%
Total restrictedassets ............ $ 651 $ — $ — $ — $ 651 $ 591 $ 60 $ 651 0.240% 0.248%
Note 12 – Derivative Financial Instruments
The Company uses derivative instruments for economic hedging, income generation, and asset replication purposes. The Company does not engage in derivative financial instrument transactions for speculative purposes. Derivative financial instruments used by the Company may be exchange-traded or contracted in the over-the-counter market (“OTC”). The Company’s OTC derivative transactions are cleared and settled through central clearing counterparties (“OTC-cleared”) or through bilateral contracts with other counterparties (“OTC-bilateral”). Should an OTC-bilateral counterparty fail to perform its obligations under contractual terms, the Company may be exposed to credit-related losses. The current credit exposure of the Company’s derivatives is limited to the net positive fair value of derivatives at the reporting date, after taking into consideration the existence of netting agreements and any collateral received. All of the credit exposure for the Company from OTC-bilateral contracts is with investment grade counterparties. The Company also monitors its counterparty credit quality on an ongoing basis. The NAIC has also adopted disclosure requirements included within Accounting Standards Codification 815, “Derivatives and Hedging” (“ASC 815”) and Accounting Standards Codification 460, “Guarantees” (“ASC 460”), for annual audited statements in accordance with guidelines provided by the Statutory Accounting Principles Working Group.
Collateral: The Company currently has International Swaps and Derivatives Association (“ISDA”) master swap agreements in place with each derivative counterparty relating to over-the-counter transactions. In addition to the ISDA agreement, Credit Support Annexes (“CSA”), which are bilateral collateral agreements, are put in place with thirteen of the Company’s seventeen derivative OTC-bilateral counterparties. The CSA’s allow TIAA’s mark-to-market exposure to a counterparty to be collateralized by the posting of cash or highly liquid U.S. government securities. The Company also exchanges cash and securities margin for derivatives traded through a central clearinghouse. As of December 31, 2015, TIAA holds the following collateral from its counterparties, (in millions):
Cash collateral ............................... $ 180Securities collateral ........................ $ 18
The Company must also post collateral or margin to the extent its net position with a given counterparty or clearinghouse is at a loss relative to the counterparty. As of December 31, 2015, the Company pledged the following collateral or margin to its counterparties, (in millions):
Cash collateral or margin ............... $ 11Securities collateral or margin........ $ 3

TEACHERS INSURANCE AND ANNUITY ASSOCIATION OF AMERICANOTES TO STATUTORY - BASIS FINANCIAL STATEMENTS (continued)
DECEMBER 31, 2015
42
The amount of accounting loss the Company will incur if any party to the derivative contract fails completely to perform according to the terms of the contract and the collateral or other security, if any, for the amount due proved to be of no value to the Company is equal to the gross asset value of all derivative contracts which, as of December 31, 2015, is $276 million.
Contingent Features: Certain of the Company’s master swap agreements governing its derivative instruments contain provisions that require the Company to maintain a minimum credit rating from two of the major credit rating agencies. If the Company’s credit rating falls below the specified minimum, each of the counterparties to agreements with such requirements could terminate all outstanding derivative transactions between such counterparty and the Company. The termination requires immediate payment of amounts expected to approximate the net liability positions of such transactions with such counterparty. The aggregate fair value of all derivative instruments with credit-risk-related contingent features in a liability position on December 31, 2015 is $12 million for which the Company posted collateral of $11 million in the normal course of business.
Foreign Currency Swap Contracts: The Company enters into foreign currency swap contracts to exchange fixed and variable amounts of foreign currency at specified future dates and at specified rates (in U.S. dollars) as a cash flow hedge to manage currency risks on investments denominated in foreign currencies. This type of derivative instrument is traded OTC-bilateral, and the Company is exposed to both market and counterparty risk. The changes in the carrying value of foreign currency exchange rates are recognized as unrealized gains or losses. Derivative instruments used in hedging transactions that do not qualify for hedge accounting treatment are accounted for at fair value.
Foreign Currency Forward Contracts: The Company enters into foreign currency forward contracts to exchange foreign currency at specified future dates and at specified rates (in U.S. dollars) to manage currency risks on investments denominated in foreign currencies. This type of derivative instrument is traded OTC-bilateral, and the Company is exposed to both market and counterparty risk. The changes in the carrying value of foreign currency exchange rates are recognized as unrealized gains or losses. Derivative instruments used in hedging transactions that do not qualify for hedge accounting treatment are accounted for at fair value.
Interest Rate Swap Contracts: The Company enters into interest rate swap contracts to hedge against the effect of interest rate fluctuations on certain variable interest rate bonds. These contracts allow the Company to lock in a fixed interest rate and to transfer the risk of higher or lower interest rates. This type of derivative instrument may be traded OTC-cleared or OTC-bilateral, and the Company is exposed to both market and counterparty risk. Generally, no cash is exchanged at the outset of the contract and no principal payments are made by either party. These transactions are entered into pursuant to master agreements that provide for a single net payment to be made by one counterparty at each due date. Net payments received and net payments made or accrued under interest rate swap contracts are included in net investment income. Derivative instruments used in hedging transactions that do not qualify for hedge accounting treatment are accounted for at fair value.
Purchased Credit Default Swap Contracts: The Company uses credit default swaps to hedge against unexpected credit events on selective investments in the Company’s portfolio. This type of derivative is traded OTC-bilateral and is exposed to market, credit and counterparty risk. The premium payment to the counterparty on these contracts is expensed as incurred. Derivative instruments used in hedging transactions that do not qualify for hedge accounting treatment are accounted for at fair value.
Written Credit Default Swaps used in Replication Transactions: A replication synthetic asset transaction is a derivative transaction (the derivative component) established concurrently with another fixed income instrument (the cash component) in order to “replicate” the investment characteristics of another instrument (the reference entity). As part of a strategy to replicate desired credit exposure in conjunction with high-rated host securities, the Company writes or sells credit default swaps on either single name corporate credits or credit indices and provides credit default protection to the buyer. This type of derivative instrument is traded OTC-bilateral, and the Company is exposed to market, credit and counterparty risk. The carrying value of credit default swaps used in RSATs represents the unamortized premium received/(paid) for selling the default protection. This premium is amortized into investment income over the life of the swap. The Company has negligible counterparty credit risk with the buyer.
The table below illustrates the effect of unrealized and realized gains and losses from derivative instruments in the Statements of Operations. Instruments utilizing hedge accounting treatment are shown as Qualifying Hedge

TEACHERS INSURANCE AND ANNUITY ASSOCIATION OF AMERICANOTES TO STATUTORY - BASIS FINANCIAL STATEMENTS (continued)
DECEMBER 31, 2015
43
Relationships. Instruments that utilize fair value accounting are shown as Non-qualifying Hedge Relationships. Derivatives used in Replication strategies are shown as Derivatives used for other than Hedging Purposes (in millions):
December 31, 2015 December 31, 2014
Unrealized Gain (Loss)
Recognized in Surplus
Gain (Loss) Recognized in Net Realized Capital Gain
(Loss)
Unrealized Gain (Loss)
Recognized in Surplus
Gain (Loss) Recognized in Net Realized Capital Gain
(Loss)Qualifying hedge relationships
Foreign currency swap contract ............. $ 45 $ (1) $ 30 $ (2)Non-qualifying hedge relationships
Foreign currency swaps ......................... 162 86 211 (32)Foreign currency forwards ..................... (77) 233 102 15Interest rate contracts ............................ (9) 4 (1) —Purchased credit default swaps ............. 6 — 5 —
Total non-qualifying hedge relationships $ 82 $ 323 $ 317 $ (17)Derivatives used for other than hedging purposes ................................................... — 2 — —
Total derivatives $ 127 $ 324 $ 347 $ (19)
Events or circumstances that would require the Company to perform under a written credit derivative position may include, but are not limited to, bankruptcy, failure to pay, debt moratorium, debt repudiation, restructuring of debt and acceleration, or default. The maximum potential amount of future payments (undiscounted) the Company could be required to make under the credit derivative is represented by the notional amount of the contract. Should a credit event occur, the amounts owed to a counterparty by the Company may be subject to recovery provisions that include, but are not limited to:
1. Notional amount payment by the Company to Counterparty and/or delivery of physical security by Counterparty to the Company.
2. Notional amount payment by the Company to Counterparty net of contractual recovery fee.3. Notional amount payment by the Company to Counterparty net of auction determined recovery fee.
The Company will record an impairment (realized loss) on a derivative position if an existing condition or set of circumstances indicates there is a limited ability to recover an unrealized loss.
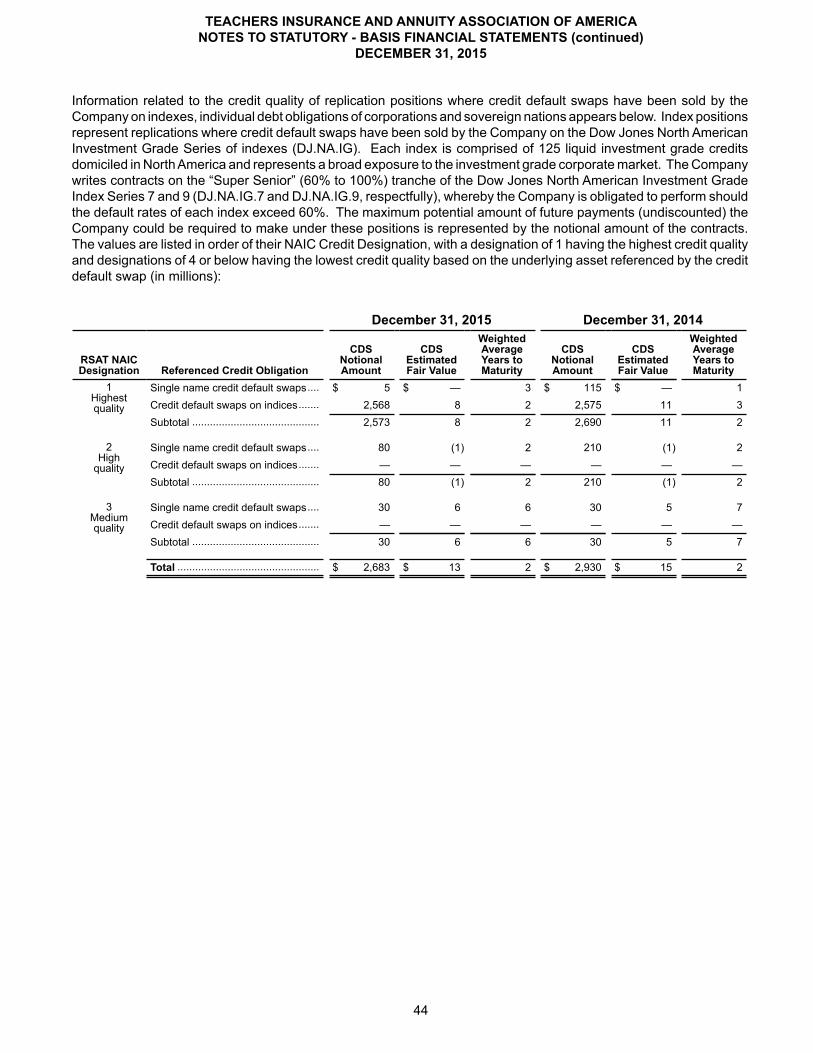
TEACHERS INSURANCE AND ANNUITY ASSOCIATION OF AMERICANOTES TO STATUTORY - BASIS FINANCIAL STATEMENTS (continued)
DECEMBER 31, 2015
44
Information related to the credit quality of replication positions where credit default swaps have been sold by the Company on indexes, individual debt obligations of corporations and sovereign nations appears below. Index positions represent replications where credit default swaps have been sold by the Company on the Dow Jones North American Investment Grade Series of indexes (DJ.NA.IG). Each index is comprised of 125 liquid investment grade credits domiciled in North America and represents a broad exposure to the investment grade corporate market. The Company writes contracts on the “Super Senior” (60% to 100%) tranche of the Dow Jones North American Investment Grade Index Series 7 and 9 (DJ.NA.IG.7 and DJ.NA.IG.9, respectfully), whereby the Company is obligated to perform should the default rates of each index exceed 60%. The maximum potential amount of future payments (undiscounted) the Company could be required to make under these positions is represented by the notional amount of the contracts. The values are listed in order of their NAIC Credit Designation, with a designation of 1 having the highest credit quality and designations of 4 or below having the lowest credit quality based on the underlying asset referenced by the credit default swap (in millions):
December 31, 2015 December 31, 2014
RSAT NAIC Designation Referenced Credit Obligation
CDS Notional Amount
CDS Estimated Fair Value
Weighted Average Years to Maturity
CDS Notional Amount
CDS Estimated Fair Value
Weighted Average Years to Maturity
1Highestquality
Single name credit default swaps.... $ 5 $ — 3 $ 115 $ — 1Credit default swaps on indices....... 2,568 8 2 2,575 11 3Subtotal ........................................... 2,573 8 2 2,690 11 2
2High
quality
Single name credit default swaps.... 80 (1) 2 210 (1) 2Credit default swaps on indices....... — — — — — —Subtotal ........................................... 80 (1) 2 210 (1) 2
3Mediumquality
Single name credit default swaps.... 30 6 6 30 5 7Credit default swaps on indices....... — — — — — —Subtotal ........................................... 30 6 6 30 5 7
Total ................................................ $ 2,683 $ 13 2 $ 2,930 $ 15 2

TEACHERS INSURANCE AND ANNUITY ASSOCIATION OF AMERICANOTES TO STATUTORY - BASIS FINANCIAL STATEMENTS (continued)
DECEMBER 31, 2015
45
The table below illustrates derivative asset and liability positions held by the Company, including notional amounts, carrying values and estimated fair values. Instruments utilizing hedge accounting treatment are shown as qualifying hedge relationships. Hedging instruments that utilize fair value accounting are shown as non-qualifying hedge relationships. Derivatives used in Replication strategies are shown as Derivatives used for other than hedging Purposes. The fair value of derivative assets and liabilities appear in the Statements of Admitted Assets, Liabilities and Capital and Contingency Reserves (in millions):
Summary of Derivative PositionsDecember 31, 2015 December 31, 2014
NotionalCarrying
ValueEstimated
FV NotionalCarrying
ValueEstimated
FVQualifying hedge relationships
Foreign currency swap contractsAssets ........................................................................... $ 161 $ 11 $ 6 $ 70 $ 2 $ 3Liabilities ........................................................................ 84 (11) (19) 183 (46) (69)
Total qualifying hedge relationships ............................. $ 245 $ — * $ (13) $ 253 $ (44) $ (66)
Non-qualifying hedge relationships
Interest rate contractsAssets ........................................................................... $ 173 $ 8 $ 8 308 $ 17 $ 17Liabilities ........................................................................ — — — — — —
Foreign currency swapsAssets ........................................................................... 2,710 227 227 1,655 101 101Liabilities ........................................................................ 187 (14) (14) 599 (51) (50)
Foreign currency forwardsAssets ........................................................................... 831 22 22 1,430 98 98Liabilities ........................................................................ 95 (2) (2) 139 (1) (1)
Purchased credit default swapsAssets ........................................................................... 10 — — 43 — —Liabilities ........................................................................ 638 (14) (14) 923 (22) (22)
Total non-qualifying hedge relationships .................. $ 4,645 $ 227 $ 227 $ 5,097 $ 142 $ 143
Derivatives used for other-than-hedging purposes
Written credit default swapsAssets ........................................................................... $ 2,598 $ — $ 14 $ 2,790 $ — $ 16Liabilities ........................................................................ 85 (1) (1) 140 (3) (1)
Total derivatives used for other-than-hedging purposes .........................................................................
$ 2,683 $ (1) $ 13 $ 2,930 $ (3) $ 15
Total derivatives ............................................................. $ 7,572 $ 226 $ 226 $ 8,280 $ 95 $ 92
* Total less than $1 million
Note 13 – Separate Accounts
Separate Accounts are established in conformity with insurance laws, are segregated from the Company's general account and are maintained for the benefit of separate account contract holders. Separate accounts are generally accounted for at fair value, except the TIAA Stable Value Separate Account ("TSV") products which are accounted for at book value in accordance with NYDFS guidance.
The TIAA Separate Account VA-1 ("VA-1") is a segregated investment account established on February 16, 1994 under the insurance laws of the State of New York for the purpose of issuing and funding after-tax variable annuity contracts for employees of non-profit institutions organized in the United States, including governmental institutions. VA-1 is registered with the Securities and Exchange Commission, (the “Commission”) effective November 1, 1994 as an open-end, diversified management investment company under the Investment Company Act of 1940. VA-1
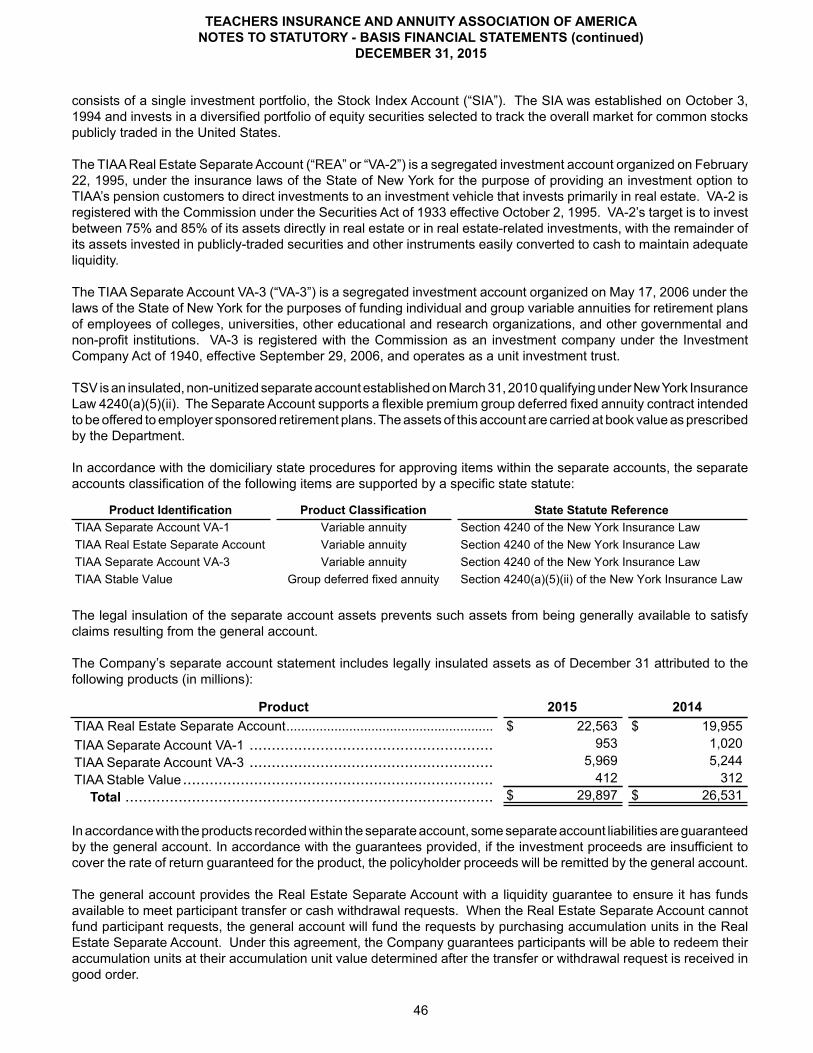
TEACHERS INSURANCE AND ANNUITY ASSOCIATION OF AMERICANOTES TO STATUTORY - BASIS FINANCIAL STATEMENTS (continued)
DECEMBER 31, 2015
46
consists of a single investment portfolio, the Stock Index Account (“SIA”). The SIA was established on October 3, 1994 and invests in a diversified portfolio of equity securities selected to track the overall market for common stocks publicly traded in the United States.
The TIAA Real Estate Separate Account (“REA” or “VA-2”) is a segregated investment account organized on February 22, 1995, under the insurance laws of the State of New York for the purpose of providing an investment option to TIAA’s pension customers to direct investments to an investment vehicle that invests primarily in real estate. VA-2 is registered with the Commission under the Securities Act of 1933 effective October 2, 1995. VA-2’s target is to invest between 75% and 85% of its assets directly in real estate or in real estate-related investments, with the remainder of its assets invested in publicly-traded securities and other instruments easily converted to cash to maintain adequate liquidity.
The TIAA Separate Account VA-3 (“VA-3”) is a segregated investment account organized on May 17, 2006 under the laws of the State of New York for the purposes of funding individual and group variable annuities for retirement plans of employees of colleges, universities, other educational and research organizations, and other governmental and non-profit institutions. VA-3 is registered with the Commission as an investment company under the Investment Company Act of 1940, effective September 29, 2006, and operates as a unit investment trust.
TSV is an insulated, non-unitized separate account established on March 31, 2010 qualifying under New York Insurance Law 4240(a)(5)(ii). The Separate Account supports a flexible premium group deferred fixed annuity contract intended to be offered to employer sponsored retirement plans. The assets of this account are carried at book value as prescribed by the Department.
In accordance with the domiciliary state procedures for approving items within the separate accounts, the separate accounts classification of the following items are supported by a specific state statute:
Product Identification Product Classification State Statute ReferenceTIAA Separate Account VA-1 Variable annuity Section 4240 of the New York Insurance LawTIAA Real Estate Separate Account Variable annuity Section 4240 of the New York Insurance LawTIAA Separate Account VA-3 Variable annuity Section 4240 of the New York Insurance LawTIAA Stable Value Group deferred fixed annuity Section 4240(a)(5)(ii) of the New York Insurance Law
The legal insulation of the separate account assets prevents such assets from being generally available to satisfy claims resulting from the general account.
The Company’s separate account statement includes legally insulated assets as of December 31 attributed to the following products (in millions):
Product 2015 2014TIAA Real Estate Separate Account........................................................ $ 22,563 $ 19,955TIAA Separate Account VA-1 ....................................................... 953 1,020TIAA Separate Account VA-3 ....................................................... 5,969 5,244TIAA Stable Value ...................................................................... 412 312
Total ................................................................................... $ 29,897 $ 26,531
In accordance with the products recorded within the separate account, some separate account liabilities are guaranteed by the general account. In accordance with the guarantees provided, if the investment proceeds are insufficient to cover the rate of return guaranteed for the product, the policyholder proceeds will be remitted by the general account.
The general account provides the Real Estate Separate Account with a liquidity guarantee to ensure it has funds available to meet participant transfer or cash withdrawal requests. When the Real Estate Separate Account cannot fund participant requests, the general account will fund the requests by purchasing accumulation units in the Real Estate Separate Account. Under this agreement, the Company guarantees participants will be able to redeem their accumulation units at their accumulation unit value determined after the transfer or withdrawal request is received in good order.

TEACHERS INSURANCE AND ANNUITY ASSOCIATION OF AMERICANOTES TO STATUTORY - BASIS FINANCIAL STATEMENTS (continued)
DECEMBER 31, 2015
47
Additional information regarding separate accounts of the Company is as follows for the years ended December 31, (in millions):
2015Non-indexedGuaranteeless than/
equal to 4%
Non-indexedGuaranteemore than
4%
Non-guaranteed
SeparateAccounts Total
Premiums, considerations or deposits.............. $ 156 $ — $ 4,102 $ 4,258
Reserves .........................................................For accounts with assets at:
Fair value ................................................... $ — $ — $ 29,258 $ 29,258Amortized cost ........................................... 394 — — 394Total reserves ............................................ $ 394 $ — $ 29,258 $ 29,652
By withdrawal characteristics:Subject to discretionary withdrawal: At book value without market value
adjustment and with surrender charge ofless than 5% ........................................... $ 394 $ — $ — $ 394
At fair value............................................... — — 29,258 29,258Total reserves........................................... $ 394 $ — $ 29,258 $ 29,652
2014Non-indexedGuaranteeless than/
equal to 4%
Non-indexedGuaranteemore than
4%
Non-guaranteed
SeparateAccounts Total
Premiums, considerations or deposits.............. $ 129 $ — $ 3,562 $ 3,691
Reserves .........................................................For accounts with assets at: .............................
Fair value ................................................... $ — $ — $ 26,065 $ 26,065Amortized cost ........................................... 302 — — 302Total reserves ............................................ $ 302 $ — $ 26,065 $ 26,367
By withdrawal characteristics:Subject to discretionary withdrawal: At book value without market value
adjustment and with surrender charge ofless than 5% ........................................... $ 302 $ — $ — $ 302
At fair value............................................... — — 26,065 26,065Total reserves........................................... $ 302 $ — $ 26,065 $ 26,367

TEACHERS INSURANCE AND ANNUITY ASSOCIATION OF AMERICANOTES TO STATUTORY - BASIS FINANCIAL STATEMENTS (continued)
DECEMBER 31, 2015
48
2013Non-indexedGuaranteeless than/
equal to 4%
Non-indexedGuaranteemore than
4%
Non-guaranteed
SeparateAccounts Total
Premiums, considerations or deposits.............. $ 121 $ — $ 3,415 $ 3,536
Reserves .........................................................For accounts with assets at: .............................
Fair value ................................................... $ — $ — $ 21,975 $ 21,975Amortized cost ........................................... 228 — — 228
Total reserves ............................................ $ 228 $ — $ 21,975 $ 22,203
By withdrawal characteristics:Subject to discretionary withdrawal: At book value without market value
adjustment and with surrender charge ofless than 5% ........................................... $ 228 $ — $ — $ 228
At fair value............................................... — — 21,975 21,975
Total reserves........................................... $ 228 $ — $ 21,975 $ 22,203
The following is a reconciliation of transfers to (from) the Company to the Separate Accounts for the years ended December 31, (in millions):
2015 2014 2013Transfers reported in the Summary of Operations of the
separate accounts statement:Transfers to separate accounts .......................................... $ 4,539 $ 3,944 $ 3,852Transfers from separate accounts ...................................... (2,814) (2,268) (1,973)
Transfers reported in the Summary of Operations of theLife, Accident & Health Annual Statement ........................ $ 1,725 $ 1,676 $ 1,879
Note 14 – Policy and Contract Reserves
Policy and contract reserves are determined in accordance with standard valuation methods approved by the Department and are computed in accordance with standard actuarial methodology. The reserves are based on assumptions for interest, mortality and other risks insured.
For annuities and supplementary contracts, policy and contract reserves are calculated using Commissioner’s Annuity Reserve Valuation Method (“CARVM”) in accordance with New York State Regulation 151, Actuarial Guideline 43 for variable annuity products and Actuarial Guideline 33 for all other products.
The Company performed Asset Adequacy Analysis in order to test the adequacy of its reserves in light of the assets supporting such reserves, and determined that its reserves are sufficient to meet its obligations.
For Ordinary and Collective Life Insurance, reserves for all policies are calculated in accordance with New York State Insurance Regulation 147. Reserves for regular life insurance policies are computed by the Net Level Premium method for issues prior to January 1, 1990, and by the Commissioner's Reserve Valuation Method for the vast majority of issues on and after such date. Five-year renewable term policies issued on or after January 1, 1994 uses the greater of unitary and segmented reserves, where each segment is equal to the term period. Annual Renewable Term policies and Cost of Living riders issued on and after January 1, 1994 uses the segmented reserves, where each segment is equal to one year in length.

TEACHERS INSURANCE AND ANNUITY ASSOCIATION OF AMERICANOTES TO STATUTORY - BASIS FINANCIAL STATEMENTS (continued)
DECEMBER 31, 2015
49
Liabilities for incurred but not reported life insurance claims and disability waiver of premium claims are based on historical experience and set equal to a percentage of paid claims. Reserves for amounts not yet due for incurred but not reported disability waiver of premium claims are a percentage of the total Active Lives Disability Waiver of Premium Reserve. The Company waives deduction of deferred fractional premiums upon death of the insured and returns any portion of the final premium beyond the date of death. As of December 31, 2015 and 2014, the Company had $460 million and $518 million, respectively, of insurance in force for which the gross premiums were less than the net premiums according to the standard of valuation set by the Department.
The Tabular Interest, Tabular Less Actual Reserve Released and Tabular Cost are determined by formulae as prescribed by the NAIC except for deferred annuities, for which tabular interest is determined from the basic data.
Withdrawal characteristics of annuity actuarial reserves and deposit-type contract funds for the years ended December 31, are as follows (dollars in millions):
2015
GeneralAccount
SeparateAccount withGuarantees
SeparateAccount
Nonguaranteed Total % of TotalSubject to discretionary withdrawal:
At fair value ....................................................... $ — $ — $ 29,258 $ 29,258 13.2%Total with adjustment or at fair value ................. $ — $ — $ 29,258 $ 29,258 13.2%At book value without adjustment (minimal orno charge or adjustment) ................................... 49,721 394 — 50,115 22.5%
Not subject to discretionary withdrawal ..................... 143,104 — — 143,104 64.3%Total (gross) ............................................................. $ 192,825 $ 394 $ 29,258 $ 222,477 100.0%Reinsurance ceded .................................................... — — — —Total (net) ................................................................. $ 192,825 $ 394 $ 29,258 $ 222,477
2014
GeneralAccount
SeparateAccount withGuarantees
SeparateAccount
Nonguaranteed Total % of TotalSubject to discretionary withdrawal:
At fair value ....................................................... $ — $ — $ 26,065 $ 26,065 12.1%Total with adjustment or at fair value ................. $ — $ — $ 26,065 $ 26,065 12.1%At book value without adjustment (minimal orno charge or adjustment) ................................... 47,830 302 — 48,132 22.4%
Not subject to discretionary withdrawal ..................... 141,029 — — 141,029 65.5%Total (gross) ............................................................. $ 188,859 $ 302 $ 26,065 $ 215,226 100%Reinsurance ceded .................................................... — — — —Total (net) ................................................................. $ 188,859 $ 302 $ 26,065 $ 215,226
Note 15 – Management Agreements
Under Cash Disbursement and Reimbursement Agreements, the Company serves as the common pay-agent for its subsidiaries and affiliates. The Company allocated expenses of $2,083 million, $1,990 million and $1,719 million to its various subsidiaries and affiliates for the years ended December 31, 2015, 2014 and 2013, respectively. In addition, under management agreements, the Company provides investment advisory and administrative services for TIAA-CREF Life and administrative services to the TIAA-CREF Trust Company FSB and VA-1.
The expense allocation process determines the portion of the total investment and operating expenses that is attributable to each legal entity and to each line of business within an entity. Every month the Company allocates incurred expenses to each line of business supported by the Company and its affiliated companies. As part of this allocation process, every department with personnel and every vendor related expense is allocated to lines of business

TEACHERS INSURANCE AND ANNUITY ASSOCIATION OF AMERICANOTES TO STATUTORY - BASIS FINANCIAL STATEMENTS (continued)
DECEMBER 31, 2015
50
based on defined allocation methodologies. These methodologies represent either shared or direct costs depending on the nature of the service provided. At the completion of the allocation process all expenses are assigned to a line of business and legal entity.
Activities necessary for the operation of the College Retirement Equities Fund (“CREF”), a companion organization, are provided at-cost by the Company and two of its subsidiaries. Such services are provided in accordance with an Investment Management Services Agreement, dated as of January 2, 2008, between CREF and TIAA-CREF Investment Management, LLC (“Investment Management”), and in accordance with a Principal Underwriting and Distribution Services Agreement for CREF, dated as of January 1, 2009, between CREF and TIAA-CREF Individual and Institutional Services, LLC (“Services”). The Company also performs administrative services for CREF, on an at-cost basis. The fees collected under these agreements and the equivalent allocated expenses, which amounted to approximately $971 million, $981 million, and $967 million for the years ended December 31, 2015, 2014 and 2013, respectively, are not included in the statement of operations and have no effect on the Company's operations.
Advisors provide investment advisory services for VA-1, certain proprietary funds and other separately managed portfolios in accordance with investment management agreements. Teachers Personal Investors Services, Inc. (“TPIS”) and Services distribute variable annuity contracts for VA-1, REA and VA-3 as well as registered securities for certain proprietary funds and non-proprietary mutual funds.
All services necessary for the operation of REA are provided at-cost by the Company and Services. The Company provides investment management and administrative services for REA. Distribution services for REA are provided in accordance with a Distribution Agreement among Services, the Company and REA. The Company and Services receive fee payments from REA on a daily basis according to formulae established annually and adjusted periodically. The daily fee is based on an estimate of the at-cost expenses necessary to operate REA and is based on projected REA expense and asset levels, with the objective of keeping the fees as close as possible to actual expenses attributable to operating REA. At the end of each quarter, any differences between the daily fees paid and actual expenses for the quarter are added to or deducted from REA’s fee in equal daily installments over the remaining days in the immediately following quarter.
Note 16 - Federal Income Taxes
By charter, the Company is a stock life insurance company operating on a non-profit basis and through December 31, 1997 was exempt from federal income taxation under the Internal Revenue Code. Any non-pension income, however, is subject to federal income taxation as unrelated business income. Effective January 1, 1998, as a result of federal legislation, the Company is no longer exempt from federal income taxation and is taxed as a stock life insurance company.
The application of SSAP No. 101 requires a company to evaluate the recoverability of deferred tax assets and to establish a valuation allowance if necessary to reduce the deferred tax asset to an amount which is more likely than not to be realized. Based on the weight of all available evidence, as of December 31, 2015, the Company released the valuation allowance held on foreign tax credit carry-forwards of $16.6 million at December 31, 2014.

TEACHERS INSURANCE AND ANNUITY ASSOCIATION OF AMERICANOTES TO STATUTORY - BASIS FINANCIAL STATEMENTS (continued)
DECEMBER 31, 2015
51
Components of the net deferred tax asset/(liability) are as follows (in millions):
(1) 12/31/2015 12/31/2014 Change
(1) (2) (3) (4) (5) (6) (7) (8) (9)(Col 1+2) (Col 4+5) (Col 1–4) (Col 2–5) (Col 7+8)
Ordinary Capital Total Ordinary Capital Total Ordinary Capital Totala) Gross deferred tax
assets $ 11,051 $ 651 $ 11,702 $ 11,175 $ 1,177 $ 12,352 $ (124) $ (526) $ (650)b) Statutory valuation
allowance adjustments — — — 17 — 17 (17) — (17)c) Adjusted gross deferred
tax assets (a–b) 11,051 651 11,702 11,158 1,177 12,335 (107) (526) (633)d) Deferred tax assets non-
admitted 7,301 — 7,301 7,449 — 7,449 (148) — (148)e) Subtotal net admitted
deferred tax asset (c-d) 3,750 651 4,401 3,709 1,177 4,886 41 (526) (485)f) Deferred tax liabilities 200 992 1,192 248 1,417 1,665 (48) (425) (473)
g) Net admitted deferred tax assets/(net deferred tax liability) (e–f) $ 3,550 $ (341) $ 3,209 $ 3,461 $ (240) $ 3,221 $ 89 $ (101) $ (12)
(2) 12/31/2015 12/31/2014 Change(1) (2) (3) (4) (5) (6) (7) (8) (9)
(Col 1+2) (Col 4+5) (Col 1–4) (Col 2–5) (Col 7+8)Ordinary Capital Total Ordinary Capital Total Ordinary Capital Total
Admission Calculation Components SSAP No. 101
a) Federal income taxes paid in prior years recoverable through loss carrybacks $ — $ — $ — $ — $ — $ — $ — $ — $ —
b) Adjusted gross DTA expected to be realized (excluding the amount of DTA from 2(a) above after application of the threshold limitation.(The lesser of (b)1 and (b)2 below) $ 3,122 $ 87 $ 3,209 $ 3,135 $ 86 $ 3,221 $ (13) $ 1 $ (12)1. Adjusted gross DTA expected to be realized following the balance sheet date $ 3,122 $ 87 $ 3,209 $ 3,135 $ 86 $ 3,221 $ (13) $ 1 $ (12)2. Adjusted gross DTA allowed per limitation threshold XXX XXX $ 4,723 XXX XXX $ 4,599 XXX XXX $ 99
c) Adjusted gross DTA (excluding the amount of DTA from (a) and (b) above) offset by gross DTL $ 628 $ 564 $ 1,192 $ 574 $ 1,091 $ 1,665 $ 54 $ (527) $ (473)
d) DTA admitted as the result of application of SSAP No. 101. Total ((a)+(b)+(c)) $ 3,750 $ 651 $ 4,401 $ 3,709 $ 1,177 $ 4,886 $ 41 $ (526) $ (485)
2015 2014Ratio percentage used to determine recovery period and threshold limitation amount ....................................... 1,021% 1,043%
Amount of adjusted capital and surplus used to determine the threshold limitation in (b)2 above (in millions) ... $31,485 $30,657

TEACHERS INSURANCE AND ANNUITY ASSOCIATION OF AMERICANOTES TO STATUTORY - BASIS FINANCIAL STATEMENTS (continued)
DECEMBER 31, 2015
52
12/31/2015 12/31/2014 Change(1)
Ordinary
(2)
Capital
(3)
Ordinary
(4)
Capital
(5)(Col 1–3)Ordinary
(6)(Col 2–4)Capital
Impact of Tax Planning Strategies (dollars in millions):
Determination of adjusted gross DTAs and netadmitted DTAs, by tax character as a percentage .
Adjusted gross DTAs amount from note 17(1)(c) ......... $ 11,051 $ 651 $ 11,158 $ 1,177 $ (107) $ (526)Percentage of adjusted gross DTAs by tax character
attributable to the impact of tax planning strategies ... 3.60% —% 2.50% —% 1.10% —%Net admitted adjusted gross DTAs amount from note
17(1)(e) ...................................................................... $ 3,750 $ 651 $ 3,709 $ 1,177 $ 41 $ (526)Percentage of net admitted adjusted gross DTAs by
tax character admitted because of the impact of taxplanning strategies ..................................................... 10.60% —% 9.00% —% 1.60% —%
The Company does not have tax-planning strategies that include the use of reinsurance.
The Company has no temporary differences for which deferred tax liabilities are not recognized.

TEACHERS INSURANCE AND ANNUITY ASSOCIATION OF AMERICANOTES TO STATUTORY - BASIS FINANCIAL STATEMENTS (continued)
DECEMBER 31, 2015
53
Income taxes incurred consist of the following major components (in millions):
12/31/2015 12/31/2014 12/31/20131. Current Income Tax:a) Federal tax benefit ......................................................................................... $ (603) $ (478) $ (307)b) Foreign taxes ................................................................................................. — — 5c) Subtotal ......................................................................................................... $ (603) $ (478) $ (302)d) Federal income taxes expense on net capital gains ...................................... 405 378 701e) Generation/(utilization) of loss carry-forwards ............................................... 115 63 (427)f) Other ............................................................................................................. — — —
g) Federal and foreign income taxes incurred .................................................... $ (83) $ (37) $ (28)
12/31/2015 12/31/2014 Change2. Deferred Tax Assets:
(a) Ordinary:1) Policyholder reserves .......................................................................... 280 311 (31)2) Investments ......................................................................................... 1,091 881 2103) Deferred acquisition costs ................................................................... 25 26 (1)4) Policyholder dividends accrual ............................................................ 667 679 (12)5) Fixed assets ........................................................................................ 326 244 826) Compensation and benefits accrual .................................................... 217 326 (109)7) Receivables – non-admitted ................................................................ 51 90 (39)8) Net operating loss carry-forward ......................................................... 1,841 1,728 1139) Tax credit carry-forward ....................................................................... 77 64 13
10) Other (including items < 5% of total ordinary tax assets) .................... 635 606 2911) Intangible assets – business in force and software ............................. 5,841 6,220 (379)
Subtotal ............................................................................................... $ 11,051 $ 11,175 $ (124)
(b) Statutory valuation allowance adjustment ...................................................... — 17 (17)(c) Non-admitted ................................................................................................. 7,301 7,449 (148)(d) Admitted ordinary deferred tax assets (2a-2b-2c) .......................................... $ 3,750 $ 3,709 $ 41
(e) Capital:
1) Investments ......................................................................................... $ 588 $ 1,114 $ (526)2) Real estate .......................................................................................... 63 63 —
Subtotal ............................................................................................... $ 651 $ 1,177 $ (526)
(f) Statutory valuation allowance adjustment ...................................................... — — —(g) Non-admitted ................................................................................................. — — —(h) Admitted capital deferred tax assets(2e-2f-2g) .............................................. 651 1,177 (526)(i) Admitted deferred tax assets(2d+2h) ............................................................. $ 4,401 $ 4,886 $ (485)

TEACHERS INSURANCE AND ANNUITY ASSOCIATION OF AMERICANOTES TO STATUTORY - BASIS FINANCIAL STATEMENTS (continued)
DECEMBER 31, 2015
54
12/31/2015 12/31/2014 Change3. Deferred Tax Liabilities:
(a) Ordinary:1) Investments ......................................................................................... $ 200 $ 243 $ (43)2) Other (including items < 5% of total ordinary tax liabilities) ................. — 5 (5)
Subtotal ............................................................................................. $ 200 $ 248 $ (48)
(b) Capital:1) Investments ......................................................................................... 992 1,417 (425)
Subtotal ............................................................................................ $ 992 $ 1,417 $ (425)
(c) Deferred tax liabilities (3a+3b) ....................................................................... $ 1,192 $ 1,665 $ (473)
4. Net Deferred Tax:Assets/Liabilities (2i–3c) ................................................................................ $ 3,209 $ 3,221 $ (12)
The provision for federal and foreign income taxes incurred differs from the amount obtained by applying the statutory federal income tax rate to income before income taxes. The significant items causing this difference at December 31, 2015 are as follows (dollars in millions):
Description Amount Tax EffectEffective Tax
Rate
Provision computed at statutory rate $ 1,258 $ 440 35 %
Dividends received deduction (52) (18) (1.44)%
Amortization of interest maintenance reserve (266) (93) (7.4)%
Statutory impairment of affiliated common stock 242 85 6.74 %
Prior year true-ups 586 205 16.29 %
Current year deferred only adjustments - deferred affiliate gains, credit carryovers, nonadmitted assets (178) (62) (4.95)%
Change in statutory valuation allowance (47) (16) (1.32)%
Other (12) (5) (0.34)%
Total statutory income taxes $ 1,531 $ 536 42.58 %
Federal and foreign income tax incurred (benefit) expense ........................................ $ (83) (6.56)%
Change in net deferred income tax charge (benefit) ................................................... 160 12.71 %
Tax effect of unrealized capital (loss) gain .................................................................. 459 36.43 %
Total statutory income taxes .................................................................................... $ 536 42.58 %
At December 31, 2015, the Company has net operating loss carry forwards expiring through the year 2030 (in millions):
Year IncurredOperating
LossYear of
Expiration2002 $ 669 2017
2003 467 2018
2004 356 2019
2008 1,017 2023
2012 2,030 2027
2014 344 2029
2015 377 2030
Total ............... $ 5,260

TEACHERS INSURANCE AND ANNUITY ASSOCIATION OF AMERICANOTES TO STATUTORY - BASIS FINANCIAL STATEMENTS (continued)
DECEMBER 31, 2015
55
At December 31, 2015, the Company has no capital loss carry forwards.
At December 31, 2015, the Company has foreign tax credits of $48 million generated during the years 2006 to 2015 and expiring between 2016 and 2025.
At December 31, 2015, the Company has general business credits of $29 million generated during the years 2004 to 2014 and expiring between 2024 to 2034.
The Company did not incur federal income taxes expense for 2015 or preceding years that would be available for recoupment in the event of future net losses.
The Company does not have any protective tax deposits on deposit with the Internal Revenue Service under IRC Section 6603.
Beginning in 1998, the Company filed a consolidated federal income tax return with its includable affiliates (the “consolidating companies”). The consolidating companies participate in tax-sharing agreements. Under the general agreement, which applies to all of the below listed entities except those denoted with an asterisk (*), current federal income tax expense (benefit) is computed on a separate return basis and provides that members shall make payments or receive reimbursements to the extent their income (loss) contributes to or reduces consolidated federal tax expense. The consolidating companies are reimbursed for net operating losses or other tax attributes generated when utilized in the consolidated return.
1) 730 Texas Forest Holdings, Inc. 18) T-C Sport Co., Inc.2) Covariance Capital Management, Inc. 19) TCT Holdings, Inc.3) GreenWood Resources, Inc. 20) Teachers Advisors, Inc.4) JWL Properties, Inc. 21) Teachers Personal Investors Service, Inc.5) ND Properties, Inc. 22) Terra Land Company6) Nuveen Asia Investments, Inc. * 23) TIAA Asset Management Finance Company, LLC *7) Nuveen Holdings, Inc. * 24) TIAA Board of Overseers8) Nuveen Investment Solutions, Inc. * 25) TIAA-CREF Life Insurance Company9) Nuveen Investments Advisers Inc. * 26) TIAA-CREF Trust Company, FSB10) Nuveen Investments Holdings, Inc. * 27) TIAA-CREF Tuition Financing, Inc.11) Nuveen Investments Institutional Services Group, LLC * 28) T-Investment Properties Corp.12) Nuveen Investments, Inc. * 29) Westchester Group Asset Management, Inc.13) Nuveen Securities, LLC * 30) Westchester Group Farm Management, Inc.14) Oleum Holding Company, Inc. 31) Westchester Group Investment Management Holding Company Inc.15) Rittenhouse Asset Management, Inc. * 32) Westchester Group Investment Management, Inc.16) T-C Europe Holding, Inc. 33) Westchester Group Real Estate, Inc.17) T-C SP, Inc.
The companies denoted with an asterisk above (collectively, "TAMF subgroup"), are subject to a separate tax sharing agreement, under which current federal income tax expense (benefit) is computed on a separate subgroup return basis. Under the Agreement, TIAA Asset Management Finance Company, LLC ("TAMF") makes payments to TIAA for amounts equal to the federal income payments that the TAMF subgroup would be obliged to pay the federal government if the TAMF subgroup had actually filed a separate consolidated tax return. TAMF is reimbursed for the subgroup losses to the extent that the subgroup tax return reflects a tax benefit that the TAMF subgroup could have carried back to a prior consolidated return year. However, in the event the TIAA consolidated group owes Alternative Minimum Tax ("AMT") in a given year, TAMF will pay or receive reimbursements for its allocable share of tax, in an amount equal to the ratio that its standalone AMT liability bears to that of the consolidated group's liability.
Amounts receivable from / (payable to) the Company's subsidiaries for federal income taxes are ($19) million and $5 million at December 31, 2015 and 2014, respectively.
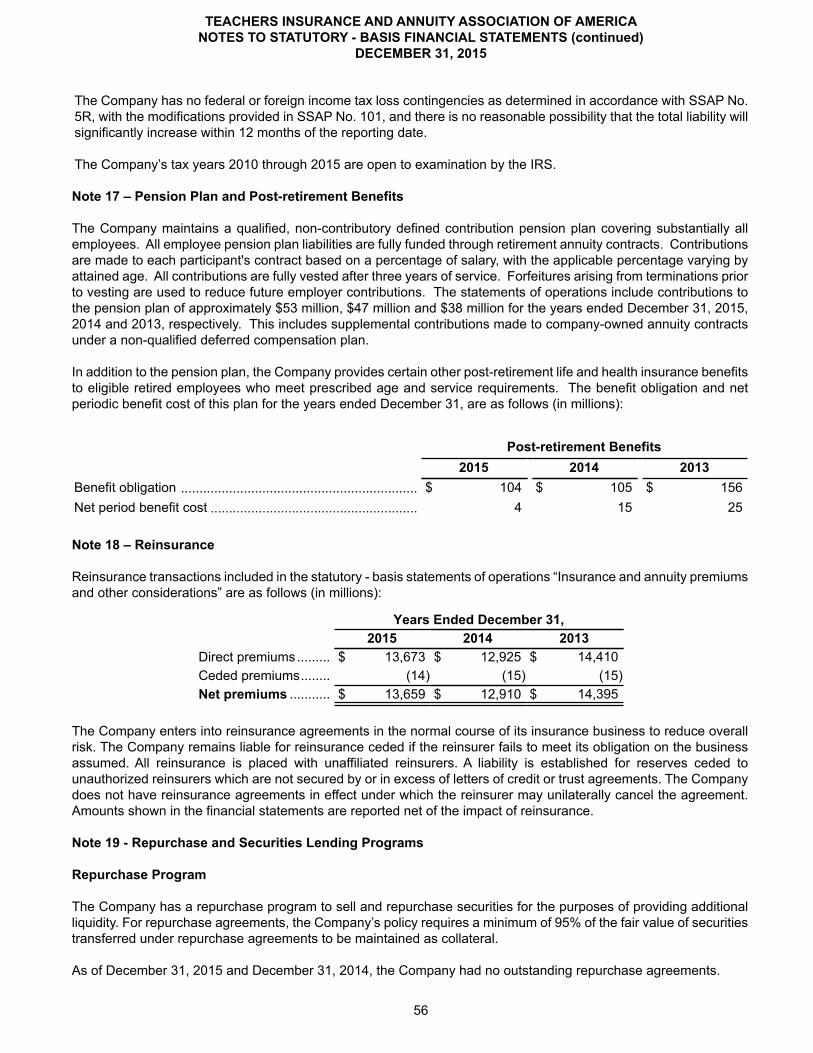
TEACHERS INSURANCE AND ANNUITY ASSOCIATION OF AMERICANOTES TO STATUTORY - BASIS FINANCIAL STATEMENTS (continued)
DECEMBER 31, 2015
56
The Company has no federal or foreign income tax loss contingencies as determined in accordance with SSAP No. 5R, with the modifications provided in SSAP No. 101, and there is no reasonable possibility that the total liability will significantly increase within 12 months of the reporting date.
The Company’s tax years 2010 through 2015 are open to examination by the IRS.
Note 17 – Pension Plan and Post-retirement Benefits
The Company maintains a qualified, non-contributory defined contribution pension plan covering substantially all employees. All employee pension plan liabilities are fully funded through retirement annuity contracts. Contributions are made to each participant's contract based on a percentage of salary, with the applicable percentage varying by attained age. All contributions are fully vested after three years of service. Forfeitures arising from terminations prior to vesting are used to reduce future employer contributions. The statements of operations include contributions to the pension plan of approximately $53 million, $47 million and $38 million for the years ended December 31, 2015, 2014 and 2013, respectively. This includes supplemental contributions made to company-owned annuity contracts under a non-qualified deferred compensation plan.
In addition to the pension plan, the Company provides certain other post-retirement life and health insurance benefits to eligible retired employees who meet prescribed age and service requirements. The benefit obligation and net periodic benefit cost of this plan for the years ended December 31, are as follows (in millions):
Post-retirement Benefits2015 2014 2013
Benefit obligation ................................................................ $ 104 $ 105 $ 156Net period benefit cost ........................................................ 4 15 25
Note 18 – Reinsurance
Reinsurance transactions included in the statutory - basis statements of operations “Insurance and annuity premiums and other considerations” are as follows (in millions):
Years Ended December 31,2015 2014 2013
Direct premiums ......... $ 13,673 $ 12,925 $ 14,410Ceded premiums ........ (14) (15) (15)Net premiums ........... $ 13,659 $ 12,910 $ 14,395
The Company enters into reinsurance agreements in the normal course of its insurance business to reduce overall risk. The Company remains liable for reinsurance ceded if the reinsurer fails to meet its obligation on the business assumed. All reinsurance is placed with unaffiliated reinsurers. A liability is established for reserves ceded to unauthorized reinsurers which are not secured by or in excess of letters of credit or trust agreements. The Company does not have reinsurance agreements in effect under which the reinsurer may unilaterally cancel the agreement. Amounts shown in the financial statements are reported net of the impact of reinsurance.
Note 19 - Repurchase and Securities Lending Programs
Repurchase Program
The Company has a repurchase program to sell and repurchase securities for the purposes of providing additional liquidity. For repurchase agreements, the Company’s policy requires a minimum of 95% of the fair value of securities transferred under repurchase agreements to be maintained as collateral.
As of December 31, 2015 and December 31, 2014, the Company had no outstanding repurchase agreements.

TEACHERS INSURANCE AND ANNUITY ASSOCIATION OF AMERICANOTES TO STATUTORY - BASIS FINANCIAL STATEMENTS (continued)
DECEMBER 31, 2015
57
Securities Lending Program
The Company has a securities lending program whereby it may lend securities to qualified institutional borrowers to earn additional income. The Company receives collateral (in the form of cash) against the loaned securities and maintains collateral in an amount not less than 102% of the market value of loaned securities during the period of the loan; any additional collateral required due to changes in security values is delivered to the Company the next business day. Cash collateral received by the Company will generally be invested in high-quality short-term instruments or bank deposits.
As of December 31, 2015, the estimated fair value of the Company’s securities on loan under the program was $808 million. The estimated fair value of collateral held by the Company for the bonds on loan as of December 31, 2015, was reported in “Securities lending collateral assets” with an offsetting collateral liability of $827 million included in “Payable for collateral for securities loaned”. This collateral received is cash and has not been sold or re-pledged as of December 31, 2015.
Of the cash collateral from the program, $357 million is held as cash as of December 31, 2015, with the remaining $470 million invested in overnight Treasury reverse repurchase agreements. Thus, the collateral remains liquid and could be returned in the event of a collateral call. The amortized cost and fair value of the reinvested cash collateral by the maturity date of the invested asset is as follows (in millions):
Amortized Cost Fair Value
Open ......................................... $ 357 $ 357 30 Days or less ................................. 470 470 Total collateral reinvested .............. $ 827 $ 827
As of December 31, 2014, the estimated fair value of the Company’s securities on loan under the program was $599 million. The estimated fair value of collateral held by the Company for the bonds on loan as of December 31, 2014, was reported in “Securities lending collateral assets” with an offsetting collateral liability of $614 million in “Payable for collateral for securities loaned". This collateral received was cash and had not been sold or re-pledged as of December 31, 2014.
Of the cash collateral received from the program, $394 million was held as cash as of December 31, 2014, with the remaining $220 million invested in overnight Treasury reverse repurchase agreements. Thus, the collateral was liquid and could have been returned in the event of a collateral call. The amortized cost and fair value of the reinvested cash collateral by the maturity date of the invested asset is as follows (in millions):
Amortized Cost Fair Value
Open ......................................... $ 394 $ 394 30 Days or less ................................. 220 220 Total collateral reinvested .............. $ 614 $ 614
Note 20 - Federal Home Loan Bank of New York Membership and Borrowings
The Company is a member of the Federal Home Loan Bank of New York (FHLBNY). Through its membership, the Company has the ability to conduct business activity (advances) with the FHLBNY. It is part of the Company’s strategy to utilize these funds to provide TIAA with additional liquidity to supplement existing sources, and can also be a source of contingent liquidity to meet other requirements. The Company has determined the estimated maximum borrowing capacity as 2% of total net admitted assets at the current reporting date.

TEACHERS INSURANCE AND ANNUITY ASSOCIATION OF AMERICANOTES TO STATUTORY - BASIS FINANCIAL STATEMENTS (continued)
DECEMBER 31, 2015
58
The following table shows the FHLB capital stock held as of December 31, 2015, (in millions):
TotalGeneralAccount
SeparateAccount
Membership stock - class A................... $ — $ — $ —Membership stock - class B................... 96 96 —Activity stock .......................................... — — —Excess stock.......................................... — — —Total ...................................................... $ 96 $ 96 $ —
The Company became a member of the FHLBNY during 2015. Therefore, no capital stock was held as of December 31, 2014.
The capital stock held by the Company as of December 31, 2015 is eligible for redemption as follows:
Eligible for Redemption
Membership StockCurrent Year
Total
Not Eligiblefor
RedemptionLess than 6
Months
6 Months orLess Than 1
Year
1 to LessThan 3Years 3 to 5 Years
Class A.................... $ — $ — $ — $ — $ — $ —Class B.................... $ 96 $ 96 $ — $ — $ — $ —
The Company did not conduct any borrowings from the FHLBNY for the year-ended December 31, 2015. Therefore, no collateral was pledged by the Company to the FHLBNY at any point during the year.
Note 21 – Capital and Contingency Reserves and Shareholders’ Dividends Restrictions
The portion of contingency reserves represented or reduced by each item below for the years ended December 31 are as follows (in millions):
2015 2014Net unrealized capital gains (losses) ............ $ (1,433) $ 337Change in asset valuation reserve ................ 1,110 (387)Change in net deferred income tax ............... (160) (447)Change in non-admitted assets .................... 43 594Issuance of surplus notes ............................. — 2,000Change in post-retirement benefit liability ..... 1 60
Capital: The Company has 2,500 shares of Class A common stock authorized, issued and outstanding. All of the outstanding common stock of the Company is held by the TIAA Board of Overseers, a not-for-profit corporation created for the purpose of holding the common stock of the Company. By charter, the Company operates without profit to its sole shareholder.
Surplus Notes: The following table provides information related to the Company’s outstanding surplus notes as of December 31, 2015 (in millions):
DateIssued
InterestRate
Par Value(Face Amount
of Notes)Carrying
Value of NoteInterest PaidYear to Date
Total Principaland / or
Interest PaidDate ofMaturity
12/16/2009 6.850% $ 2,000 $ 2,000 $ 137 $ 822 12/16/203909/15/2014 4.900% $ 1,650 $ 1,650 $ 80 $ 80 09/15/204409/15/2014 4.375% $ 350 $ 350 $ 15 $ 15 09/15/2054

TEACHERS INSURANCE AND ANNUITY ASSOCIATION OF AMERICANOTES TO STATUTORY - BASIS FINANCIAL STATEMENTS (continued)
DECEMBER 31, 2015
59
The instruments listed in the above table, are unsecured debt obligations of the type generally referred to as “surplus notes” and are issued in accordance with Section 1307 of the New York Insurance Law. The surplus notes are subordinated in right of payment to all present and future indebtedness, policy claims and other creditor claims of the Company and rank pari passu with any future surplus notes of the Company and with any other similarly subordinated obligations.
The notes were issued in a transaction pursuant to Rule 144A under the Securities Act of 1933, as amended, and the notes are evidenced by one or more global notes deposited with a custodian for, and registered in the name of a nominee of, The Depository Trust Company.
No subsidiary or affiliate of the Company is an obligor or guarantor of the notes, which are solely obligations of the Company. No affiliates of the Company hold any portion of the notes.
The notes are unsecured and subordinated to all present and future indebtedness, policy claims and other creditor claims of the Company. Under New York Insurance Law, the notes are not part of the legal liabilities of the Company. The notes are not scheduled to repay any principal prior to maturity. Each payment of interest and principal may be made only with the prior approval of the Superintendent and only out of the Company’s surplus funds, which the Superintendent of the Department determines to be available for such payments under New York Insurance Law. In addition, provided that approval is granted by the Superintendent of the Department, the notes may be redeemed at the option of the Company at any time at the “make-whole” redemption price equal to the greater of the principal amount of the notes to be redeemed, or the sum of the present values of the remaining scheduled interest and principal payments, excluding accrued interest as of the redemption date, discounted to the redemption date on a semi-annual basis at the adjusted Treasury rate plus 40 basis points, plus in each case, accrued and unpaid interest payments on the notes to be redeemed to the redemption date.
Dividend Restrictions: Under the New York Insurance Law, the Company is permitted without prior insurance regulatory clearance to pay a stockholder dividend as long as the aggregated amount of all such dividends in any calendar year does not exceed the lesser of (i) 10% of its surplus to policyholders as of the immediately preceding calendar year and (ii) its net gain from operations for the immediately preceding calendar year (excluding realized investment gains). The Company has not paid dividends to its shareholder.
Note 22 – Contingencies and Guarantees
Subsidiary and Affiliate Guarantees:
At December 31, 2015, the Company was obligor under the following guarantees, indemnities and support obligations:
Nature and circumstances of guarantee and key attributes, including date and duration of
agreement.
Liability recognition of guarantee.
(Include amount recognized at
inception. If no initialrecognition, document
exception allowed under
SSAP No. 5R.)
Ultimate financial
statement impact if
action under the guarantee
is required.
Maximum potential amount of future
payments (undiscounted) the guarantor could be
required to make under the guarantee. If unable to develop an estimate,
this should be specifically noted.
Current status of payment or
performance risk of guarantee. Also
provide additional discussion as
warranted.
Financial support agreement withTIAA-CREF Life Insurance
Company to have (i) capital andsurplus of $250.0 million; (ii) theamount of capital and surplusnecessary to maintain TIAA-
CREF Life’s capital and surplusat a level not less than 150% of
the NAIC RBC model; or (iii)such other amounts as
necessary to maintain TIAA-CREF Life’s financial strengthrating the same or better than
the Company’s rating at all times.
Guarantee made to/oron behalf of a wholly-owned subsidiary andas such are excluded
from recognition.
Investmentin
Subsidiary,Controlled,or Affiliated
("SCA")
Since this obligation isnot subject to limitations,the Company does not
believe that it is possibleto determine the
maximum potentialamount that could
become due under theseguarantees in the future.
At December 31, 2015,the capital and surplus
of TIAA-CREF LifeInsurance Companywas in excess of theminimum capital and
surplus amountreferenced, and its
total adjusted capitalwas in excess of the
referenced RBC-basedamount calculated atDecember 31, 2015.

TEACHERS INSURANCE AND ANNUITY ASSOCIATION OF AMERICANOTES TO STATUTORY - BASIS FINANCIAL STATEMENTS (continued)
DECEMBER 31, 2015
60
The Company has agreed that it will cause TIAA-CREF Life to be sufficiently funded at all times in order to meet all its contractual obligations on a timely basis including, but not limited to, obligations to pay policy benefits and to provide policyholder services. This agreement is not an evidence of indebtedness or an obligation or liability of the Company and does not provide any creditor of TIAA-CREF Life with recourse to or against any of the assets of the Company.
Related to the 2014 acquisition of Nuveen Investments, TAM Finance Company, LLC, the Acquirer and an indirectly owned subsidiary of TIAA, recorded purchase related liabilities at a fair value of $319 million which could be payable according to facts and circumstances in 2017. The Company has agreed to fund these obligations in the event required payments to the Seller are not made by TAM Finance Company, LLC.
The Company also provides a $100 million committed 364-day revolving line of credit arrangement with Nuveen Investments, Inc. This line has an expiration date of December 29, 2016. During the period ending December 31, 2015, there were no draw-downs made under this line of credit arrangement.
The Company provides a $100 million unsecured 364-day revolving line of credit arrangement with TIAA-CREF Life. This line has an expiration date of July 11, 2016. As of December 31, 2015, $30 million of this facility was maintained on a committed basis for which TIAA-CREF Life paid a commitment fee of 7.0 basis points on the unused committed amount. During the period ending December 31, 2015, 28 draw-downs totaling $51.5 million were made under this line of credit arrangement of which none were outstanding as of December 31, 2015.
The Company also provides a $1,000 million uncommitted line of credit to certain accounts of College Retirement Equities Funds (“CREF”) and certain TIAA-CREF Funds (“Funds”). Loans under this revolving credit facility are for a maximum of 60 days and are made solely at the discretion of the Company to fund shareholder redemption requests or other temporary or emergency needs of CREF and the Funds. It is the intent of the Company, CREF and the Funds to use this facility as a supplemental liquidity facility, which would only be used after CREF and the Funds have exhausted the availability of the current $1,500 million committed credit facility maintained with a group of banks.
The Company guarantees CREF transfers to the Company for the immediate purchase of lifetime payout annuities will produce guaranteed payments that will never be less than the amounts calculated at the stipulated interest rate and mortality defined in the applicable CREF contract.
The Company provides a $300 million unsecured and uncommitted 364-day revolving line of credit arrangement with TIAA-CREF Trust Company, FSB. This line has an expiration date of September 14, 2016. During the period ending December 31, 2015, there were no draw-downs made under this line of credit arrangement.
Separate Account Guarantees: The Company provides mortality and expense guarantees to VA-1, for which it is compensated. The Company guarantees, at death, the total death benefit payable from the fixed and variable accounts will be at least a return of total premiums paid less any previous withdrawals. The Company also guarantees expense charges to VA-1 participants will never rise above the maximum amount stipulated in the contract.
The Company provides mortality, expense and liquidity guarantees to REA and is compensated for these guarantees. The Company guarantees once REA participants begin receiving lifetime annuity income benefits, monthly payments will never be reduced as a result of adverse mortality experience. The Company also guarantees expense charges to REA participants will never rise above the maximum amount stipulated in the contract. The Company provides REA with a liquidity guarantee to ensure it has funds available to meet participant transfer or cash withdrawal requests. If REA cannot fund participant requests, TIAA’s general account will fund them by purchasing accumulation units. Under this agreement, TIAA guarantees that participants will be able to redeem their accumulation units at the accumulation unit value next determined after the transfer or withdrawal request is received in good order.
As of December 31, 2015, there are no outstanding liquidity units under the liquidity guarantee provided to REA by the Company.
The Company provides mortality and expense guarantees to VA-3 and is compensated for these guarantees. The Company guarantees once VA-3 participants begin receiving lifetime annuity income benefits, monthly payments will never be reduced as a result of adverse mortality experience. The Company also guarantees expense charges to VA-3 participants will never rise above the maximum amount stipulated in the contract.

TEACHERS INSURANCE AND ANNUITY ASSOCIATION OF AMERICA NOTES TO STATUTORY - BASIS FINANCIAL STATEMENTS (concluded)
DECEMBER 31, 2015
61
Other Contingencies:
In the ordinary conduct of certain of its investment activities, the Company provides standard indemnities covering a variety of potential exposures. For instance, the Company provides indemnifications in connection with site access agreements relating to due diligence review for real estate acquisitions, and the Company provides indemnification to underwriters in connection with the issuance of securities by or on behalf of the Company or its subsidiaries. It is the Company management’s opinion that the fair value of such indemnifications are negligible and do not materially affect the Company's financial position, results of operations or liquidity.
Other contingent liabilities arising from litigation and other matters over and above amounts already provided for in the financial statements or disclosed elsewhere in these notes are not considered material in relation to the Company’s financial position or the results of its operations.
The Company receives and responds to subpoenas or other inquiries from state regulators, including state insurance commissioners; state attorneys general and other state governmental authorities; Federal regulators, including the SEC; Federal governmental authorities; and the Financial Industry Regulatory Authority (“FINRA”) seeking a broad range of information. The Company cooperates in these inquiries.
Note 23 – Subsequent Events
In preparing these financial statements, the Company has evaluated events and transactions for potential recognition or disclosure through April 4, 2016, the date the financial statements were available to be issued. No such items were identified by the Company.