tiaa real estate account 10-q
TRANSCRIPT

1
UNITED STATESSECURITIES AND EXCHANGE COMMISSION
Washington, D.C. 20549FORM 10-Q
(Mark One)
QUARTERLY REPORT PURSUANT TO SECTION 13 OR 15(d) OF THE SECURITIES EXCHANGE ACT OF 1934 For the quarterly period ended September 30, 2017
OR
TRANSITION REPORT PURSUANT TO SECTION 13 OR 15(d) OF THE SECURITIES EXCHANGE ACT OF 1934
For the transition period from__________to __________
Commission file number: 33-92990; 333-216849
TIAA REAL ESTATE ACCOUNT(Exact name of registrant as specified in its charter)
NEW YORK(State or other jurisdiction
of incorporation or organization)
NOT APPLICABLE(I.R.S. Employer Identification No.)
C/O TEACHERS INSURANCE ANDANNUITY ASSOCIATION OF AMERICA
730 THIRD AVENUENEW YORK, NEW YORK 10017-3206
(Address of principal executive offices, including zip code)Registrant’s telephone number, including area code: (212) 490-9000
Indicate by check mark whether the Registrant (1) has filed all reports required to be filed by Section 13 or 15(d) of the Securities Exchange Act of 1934 during the preceding 12 months (or for such shorter period that the Registrant was required to file such reports), and (2) has been subject to such filing requirements for the past 90 days.
YES NO
Indicate by check mark whether the registrant has submitted electronically and posted on its corporate Web site, if any, every Interactive Data File required to be submitted and posted pursuant to Rule 405 of Regulation S-T (§232.405 of this chapter) during the preceding 12 months (or for such shorter period that the registrant was required to submit and post such files).
YES NO
Indicate by check mark whether the registrant is a large accelerated filer, an accelerated filer, a non-accelerated filer, smaller reporting company or emerging growth company. See the definitions of “large accelerated filer,” “accelerated filer,” “smaller reporting company” and "emerging growth company" in Rule 12b-2 of the Exchange Act.
Large accelerated filer Accelerated filer Non-accelerated filer (Do not check if a smaller reporting company) Smaller Reporting Company
Emerging Growth Company
If an emerging growth company, indicate by check mark if the registrant has elected not to use the extended transition period for complying with any new or revised financial accounting standards provided pursuant to Section 13(a) of the Exchange Act.
Indicate by check mark whether the registrant is a shell company (as defined in Rule 12b-2 of the Exchange Act).
YES NO

2
TABLE OF CONTENTS
PagePart I Financial Information
Item 1. Unaudited Consolidated Financial Statements Consolidated Statements of Assets and Liabilities 3 Consolidated Statements of Operations 4 Consolidated Statements of Changes in Net Assets 5 Consolidated Statements of Cash Flows 6 Notes to the Consolidated Financial Statements 7 Consolidated Schedules of Investments 24
Item 2. Management's Discussion and Analysis of the Account's Financial Condition andResults of Operations 39
Item 3. Quantitative and Qualitative Disclosures about Market Risk 59Item 4. Controls and Procedures 60
Part II Other InformationItem 1. Legal Proceedings 61Item 1A. Risk Factors 61Item 2. Unregistered Sales of Equity Securities and Use of Proceeds 61Item 3. Defaults Upon Senior Securities 61Item 4. Mine Safety Disclosures 61Item 5. Other Information 61Item 6. Exhibits 62
Signatures 63

3
PART I. FINANCIAL INFORMATION
ITEM 1. UNAUDITED CONSOLIDATED FINANCIAL STATEMENTS
TIAA REAL ESTATE ACCOUNTCONSOLIDATED STATEMENTS OF ASSETS AND LIABILITIES
(In millions, except per accumulation unit amounts)
September 30, December 31,2017 2016
(Unaudited)ASSETS
Investments, at fair value:Real estate properties(cost: $12,944.7 and $12,818.1) $ 15,654.2 $ 15,452.8
Real estate joint ventures and limited partnerships(cost: $4,540.2 and $4,530.4) 5,816.1 5,759.9Marketable securities:
Real estate-related(cost: $889.5 and $883.9) 1,121.0
(1)
1,081.5(1)
Other(cost: $4,293.3 and $4,054.0) 4,293.4 4,053.8
Loans receivable(cost: $296.5 and $294.8) 298.8 295.7
Total investments(cost: $22,964.2 and $22,581.2) 27,183.5 26,643.7
Cash and cash equivalents 6.8 3.0Due from investment manager 4.8 5.9Other 227.6 (2) 332.6 (2)
TOTAL ASSETS 27,422.7 26,985.2LIABILITIES Mortgage loans payable, at fair value
(principal outstanding: $2,284.8 and $2,316.5) 2,311.0 2,332.1Accrued real estate property expenses 211.7 202.2Payable for collateral for securities loaned 5.6 93.0Other 54.6 53.2
TOTAL LIABILITIES 2,582.9 2,680.5COMMITMENTS AND CONTINGENCIESNET ASSETS
Accumulation Fund 24,333.5 23,813.5Annuity Fund 506.3 491.2
TOTAL NET ASSETS $ 24,839.8 $ 24,304.7NUMBER OF ACCUMULATION UNITS OUTSTANDING 61.9 62.4NET ASSET VALUE, PER ACCUMULATION UNIT $ 393.257 $ 381.636
(1) Includes securities loaned of $5.5 million at September 30, 2017 and $91.2 million at December 31, 2016.(2) Includes cash collateral for securities loaned of $5.6 million at September 30, 2017 and $93.0 million at December 31, 2016.
See notes to the consolidated financial statements
4
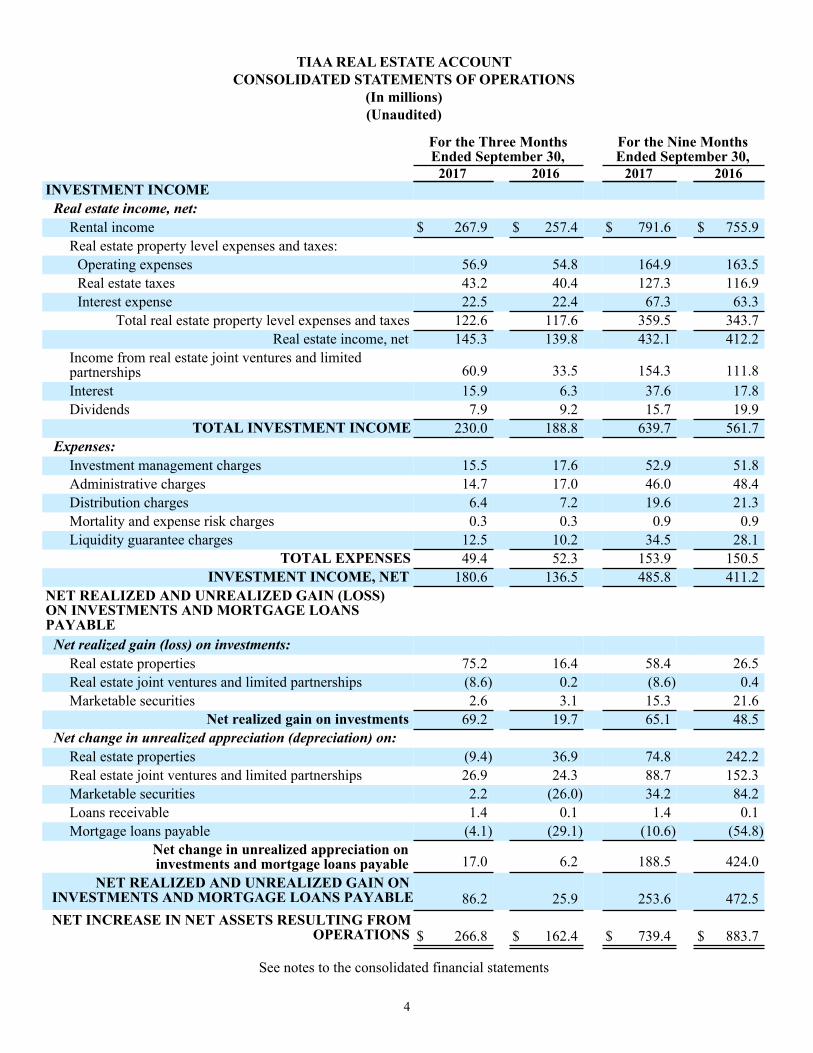
TIAA REAL ESTATE ACCOUNTCONSOLIDATED STATEMENTS OF OPERATIONS
(In millions)(Unaudited)
For the Three MonthsEnded September 30,
For the Nine MonthsEnded September 30,
2017 2016 2017 2016INVESTMENT INCOME
Real estate income, net:Rental income $ 267.9 $ 257.4 $ 791.6 $ 755.9Real estate property level expenses and taxes:
Operating expenses 56.9 54.8 164.9 163.5Real estate taxes 43.2 40.4 127.3 116.9Interest expense 22.5 22.4 67.3 63.3
Total real estate property level expenses and taxes 122.6 117.6 359.5 343.7Real estate income, net 145.3 139.8 432.1 412.2
Income from real estate joint ventures and limitedpartnerships 60.9 33.5 154.3 111.8Interest 15.9 6.3 37.6 17.8Dividends 7.9 9.2 15.7 19.9
TOTAL INVESTMENT INCOME 230.0 188.8 639.7 561.7Expenses:
Investment management charges 15.5 17.6 52.9 51.8Administrative charges 14.7 17.0 46.0 48.4Distribution charges 6.4 7.2 19.6 21.3Mortality and expense risk charges 0.3 0.3 0.9 0.9Liquidity guarantee charges 12.5 10.2 34.5 28.1
TOTAL EXPENSES 49.4 52.3 153.9 150.5INVESTMENT INCOME, NET 180.6 136.5 485.8 411.2
NET REALIZED AND UNREALIZED GAIN (LOSS)ON INVESTMENTS AND MORTGAGE LOANSPAYABLE
Net realized gain (loss) on investments:Real estate properties 75.2 16.4 58.4 26.5Real estate joint ventures and limited partnerships (8.6) 0.2 (8.6) 0.4Marketable securities 2.6 3.1 15.3 21.6
Net realized gain on investments 69.2 19.7 65.1 48.5Net change in unrealized appreciation (depreciation) on:
Real estate properties (9.4) 36.9 74.8 242.2Real estate joint ventures and limited partnerships 26.9 24.3 88.7 152.3Marketable securities 2.2 (26.0) 34.2 84.2Loans receivable 1.4 0.1 1.4 0.1Mortgage loans payable (4.1) (29.1) (10.6) (54.8)
Net change in unrealized appreciation oninvestments and mortgage loans payable 17.0 6.2 188.5 424.0
NET REALIZED AND UNREALIZED GAIN ONINVESTMENTS AND MORTGAGE LOANS PAYABLE 86.2 25.9 253.6 472.5NET INCREASE IN NET ASSETS RESULTING FROM
OPERATIONS $ 266.8 $ 162.4 $ 739.4 $ 883.7
See notes to the consolidated financial statements

5
TIAA REAL ESTATE ACCOUNTCONSOLIDATED STATEMENTS OF CHANGES IN NET ASSETS
(In millions)(Unaudited)
For the Three MonthsEnded September 30,
For the Nine MonthsEnded September 30,
2017 2016 2017 2016FROM OPERATIONS
Investment income, net $ 180.6 $ 136.5 $ 485.8 $ 411.2Net realized gain on investments 69.2 19.7 65.1 48.5Net change in unrealized appreciation on investmentsand mortgage loans payable 17.0 6.2 188.5 424.0
NET INCREASE IN NET ASSETS RESULTINGFROM OPERATIONS 266.8 162.4 739.4 883.7
FROM PARTICIPANT TRANSACTIONSPremiums 552.4 757.8 1,980.6 2,349.2Annuity payments (10.8) (10.3) (32.3) (30.3)Withdrawals and death benefits (777.5) (576.6) (2,152.6) (1,551.1)
NET INCREASE (DECREASE) IN NET ASSETSRESULTING FROM PARTICIPANT
TRANSACTIONS (235.9) 170.9 (204.3) 767.8NET INCREASE IN NET ASSETS 30.9 333.3 535.1 1,651.5
NET ASSETSBeginning of period 24,808.9 23,678.2 24,304.7 22,360.0End of period $ 24,839.8 $ 24,011.5 $ 24,839.8 $ 24,011.5
See notes to the consolidated financial statements

6
TIAA REAL ESTATE ACCOUNTCONSOLIDATED STATEMENTS OF CASH FLOWS
(In millions)(Unaudited)
For the Nine MonthsEnded September 30,2017 2016
CASH FLOWS FROM OPERATING ACTIVITIESNet increase in net assets resulting from operations $ 739.4 $ 883.7Adjustments to reconcile net changes in net assets resulting from operations to netcash provided by (used in) operating activities:
Net realized gain on investments (65.1) (48.5)Net change in unrealized appreciation on investmentsand mortgage loans payable (188.5) (424.0)Purchase of real estate properties (298.4) (378.0)Capital improvements on real estate properties (95.0) (125.2)Proceeds from sale of real estate properties 340.7 152.9Purchases of long term investments (342.5) (1,134.0)Proceeds from long term investments 376.3 51.6Increase in loans receivable (1.7) (69.0)Increase in other investments (239.3) (203.8)Change in due to (from) investment manager 1.1 (4.9)(Increase) decrease in other assets 105.0 (121.4)Increase (decrease) in other liabilities (74.5) 141.3
NET CASH PROVIDED BY (USED IN) OPERATING ACTIVITIES 257.5 (1,279.3)CASH FLOWS FROM FINANCING ACTIVITIES
Mortgage loan proceeds received — 563.5Payments of mortgage loans (49.4) (34.7)Premiums 1,980.6 2,349.2Annuity payments (32.3) (30.3)Withdrawals and death benefits (2,152.6) (1,551.1)
NET CASH (USED IN) PROVIDED BY FINANCING ACTIVITIES (253.7) 1,296.6NET INCREASE IN CASH AND CASH EQUIVALENTS 3.8 17.3CASH AND CASH EQUIVALENTS
Beginning of period 3.0 11.9End of period $ 6.8 $ 29.2
SUPPLEMENTAL DISCLOSURES:Cash paid for interest $ 67.3 $ 61.6Debt assumed as part of real estate acquisition $ 17.7 $ —
See notes to the consolidated financial statements

7
TIAA REAL ESTATE ACCOUNTNOTES TO THE CONSOLIDATED FINANCIAL STATEMENTS
Note 1—Organization and Significant Accounting Policies
Business: The TIAA Real Estate Account (“Account”) is an insurance separate account of Teachers Insurance and Annuity Association of America (“TIAA”) and was established by resolution of TIAA’s Board of Trustees (the “Board”) on February 22, 1995, under the insurance laws of the State of New York, for the purpose of funding variable annuity contracts issued by TIAA. The Account offers individual and group accumulating annuity contracts (with contributions made on a pre-tax or after-tax basis), as well as individual lifetime and term-certain variable payout annuity contracts (including the payment of death benefits to beneficiaries). Investors are entitled to transfer funds to or from the Account, and make withdrawals from the Account on a daily basis, under certain circumstances. Funds invested in the Account for each category of contract are expressed in terms of units, and unit values will fluctuate depending on the Account’s performance.
The investment objective of the Account is to seek favorable long-term returns primarily through rental income and appreciation of real estate and real estate-related investments owned by the Account. The Account holds real estate properties directly and through subsidiaries wholly-owned by TIAA for the benefit of the Account. The Account also holds limited interests in real estate joint ventures and limited partnerships, as well as investments in loans receivable with commercial real estate properties as underlying collateral. Additionally, the Account invests in real estate-related and non-real estate-related publicly traded securities, cash and other instruments to maintain adequate liquidity levels for operating expenses, capital expenditures and to fund benefit payments (withdrawals, transfers and related transactions).
The Consolidated Financial Statements were prepared in accordance with accounting principles generally accepted in the United States of America, which requires the use of estimates made by management. Actual results may vary from those estimates and such differences may be material. The following is a summary of the significant accounting policies of the Account.
Basis of Presentation: The accompanying Consolidated Financial Statements include the Account and those subsidiaries wholly-owned by TIAA for the benefit of the Account. All significant intercompany accounts and transactions between the Account and such subsidiaries have been eliminated.
The Accumulation Unit Value (“AUV”) used for financial reporting purposes may differ from the AUV used for processing transactions. The AUV used for financial reporting purposes includes security and participant transactions effective through the period end date to which this report relates. Total return is computed based on the AUV used for processing transactions.
Determination of Investments at Fair Value: The Account reports all investments at fair value in accordance with the Financial Accounting Standards Board (“FASB”) Accounting Standards Codification (“ASC”) 946, Financial Services—Investment Companies. Further in accordance with the adoption of the fair value option allowed under ASC 825, Financial Instruments, and at the election of Account management, mortgage loans payable are reported at fair value. The FASB has defined fair value as the price that would be received to sell an asset or paid to transfer a liability in an orderly transaction between market participants.
The following is a description of the valuation methodologies used to determine the fair value of the Account’s investments and investment related mortgage loans payable.
Valuation of Real Estate Properties—Investments in real estate properties are stated at fair value, as determined in accordance with policies and procedures reviewed by the Investment Committee of the Board and in accordance with the responsibilities of the Board as a whole. Accordingly, the Account does not record depreciation. Determination of fair value involves significant levels of judgment because the actual fair value of real estate can be determined only by negotiation between the parties in a sales transaction.
8
The Account’s primary objective when valuing its real estate investments will be to produce a valuation that represents a reasonable estimate of the fair value of its investments. Implicit in the Account’s definition of fair value are the consummation of a sale as of a specified date and the passing of title from seller to buyer under conditions whereby:
• Buyer and seller are typically motivated;• Both parties are well informed or well advised, and acting in what they consider their best interests;• A reasonable time is allowed for exposure in the open market;• Payment is made in terms of cash or in terms of financial arrangements comparable thereto; and• The price represents the normal consideration for the property sold unaffected by special or creative
financing or sales concessions granted by anyone associated with the sale.
Property and investment values are affected by, among other things, the availability of capital, occupancy rates, rental rates, and interest and inflation rates. As a result, determining real estate and investment values involves many assumptions. Key inputs and assumptions include rental income and expense amounts, related rental income and expense growth rates, capital expenditures, discount rates and capitalization rates. Valuation techniques include discounted cash flow analysis, prevailing market capitalization rates or multiples applied to earnings from the property, analysis of recent comparable sales transactions, actual sale negotiations and bona fide purchase offers received from third parties. Amounts ultimately realized from each investment may vary significantly from the fair value presented.
Real estate properties owned by the Account are initially valued based on an independent third party appraisal, as reviewed by TIAA’s internal appraisal staff and as applicable by the Account’s independent fiduciary at the time of the closing of the purchase. Such initial valuation may result in a potential unrealized gain or loss reflecting the difference between an investment’s fair value (i.e., exit price) and its cost basis (which is inclusive of transaction costs).
Subsequently, each property is appraised each quarter by an independent third party appraiser, reviewed by TIAA’s internal appraisal staff and as applicable the Account’s independent fiduciary. In general, the Account obtains appraisals of its real estate properties spread out throughout the quarter, which is intended to result in appraisal adjustments, and thus, adjustments to the valuations of its holdings (to the extent such adjustments are made) that happen regularly throughout each quarter and not on one specific day or month in each period.
Further, management reserves the right to order an appraisal and/or conduct another valuation outside of the normal quarterly process when facts or circumstances at a specific property change. For example, under certain circumstances a valuation adjustment could be made when the account receives a bona fide bid for the sale of a property held within the Account or one of the Account’s joint ventures. Adjustments may be made for events or circumstances indicating an impairment of a tenant’s ability to pay amounts due to the Account under a lease (including due to a bankruptcy filing of that tenant). Alternatively, adjustments may be made to reflect the execution or renewal of a significant lease. Also, adjustments may be made to reflect factors (such as sales values for comparable properties or local employment rate) bearing uniquely on a particular region in which the Account holds properties. TIAA’s internal appraisal staff oversees the entire appraisal process, in conjunction with the Account’s independent fiduciary (the independent fiduciary is more fully described in the following paragraph). Any differences in the conclusions of TIAA’s internal appraisal staff and the independent appraiser will be reviewed by the independent fiduciary, which will make a final determination on the matter (which may include ordering a subsequent independent appraisal).
The independent fiduciary, RERC, LLC, has been appointed by a special subcommittee of the Investment Committee of the Board to, among other things, oversee the entire appraisal process. The independent fiduciary must approve all independent appraisers used by the Account. All appraisals are performed in accordance with Uniform Standards of Professional Appraisal Practices, the real estate appraisal industry standards created by The Appraisal Foundation. Real estate appraisals are estimates of property values based on a professional’s opinion. Appraisals of properties held outside of the U.S. are performed in accordance with industry standards commonly applied in the applicable jurisdiction. These independent appraisers are always expected to be MAI-designated members of the Appraisal Institute (or its European equivalent, Royal Institute of Chartered Surveyors) and state certified appraisers from national or regional firms with relevant property type experience and market knowledge. Under the Account’s current procedures, each independent appraisal firm will be rotated off of a particular property at least every three years, although such appraisal firm may perform appraisals of other Account properties subsequent to such rotation.

9
Also, the independent fiduciary may require additional appraisals if factors or events have occurred that could materially change a property’s value (including those identified previously) and such change is not reflected in the quarterly valuation review, or otherwise to ensure that the Account is valued appropriately. The independent fiduciary must also approve any valuation change of real estate-related assets where a property’s value changed by more than 6% from the most recent independent annual appraisal, or if the value of the Account would change by more than 4% within any calendar quarter or more than 2% since the prior calendar month. When a real estate property is subject to a mortgage, the property is valued independently of the mortgage and the property and mortgage fair values are reported separately (see Valuation of Mortgage Loans Payable). The independent fiduciary reviews and approves all mortgage valuation adjustments before such adjustments are recorded by the Account. The Account continues to use the revised value for each real estate property and mortgage loan payable to calculate the Account’s daily net asset value until the next valuation review or appraisal.
Valuation of Real Estate Joint Ventures—Real estate joint ventures are stated at the fair value of the Account’s ownership interests of the underlying entities. The Account’s ownership interests are valued based on the fair value of the underlying real estate, any related mortgage loans payable, and other factors, such as ownership percentage, ownership rights, buy/sell agreements, distribution provisions and capital call obligations. Upon the disposition of all real estate investments by an investee entity, the Account will continue to state its equity in the remaining net assets of the investee entity during the wind down period, if any, which occurs prior to the dissolution of the investee entity.
Valuation of Real Estate Limited Partnerships—Limited partnership interests are stated at the fair value of the Account’s ownership in the partnership which are recorded based upon the changes in the net asset values of the limited partnerships as determined from the financial statements of the limited partnerships when received by the Account. Prior to the receipt of the financial statements from the limited partnerships, the Account estimates the value of its interest in good faith and will from time to time seek input from the issuer or the sponsor of the investments. Since market quotations are not readily available, the limited partnership interests are valued at fair value as determined in good faith by management under the direction of the Investment Committee of the Board and in accordance with the responsibilities of the Board as a whole.
Valuation of Marketable Securities—Equity securities listed or traded on any national market or exchange are valued at the last sale price as of the close of the principal securities market or exchange on which such securities are traded or, if there is no sale, at the mean of the last bid and asked prices on such market or exchange, exclusive of transaction costs.
Debt securities with readily available market quotations, other than money market instruments, are generally valued at the most recent bid price or the equivalent quoted yield for such securities (or those of comparable maturity, quality and type). Debt securities for which market quotations are not readily available, are valued at fair value as determined in good faith by the Investment Committee of the Board and in accordance with the responsibilities of the Board as a whole.
Short-term investments are valued in the same manner as debt securities, as described above.
Money market instruments are valued at amortized cost, which approximates fair value.
Equity and fixed income securities traded on a foreign exchange or in foreign markets are valued using their closing values under the valuation methods generally accepted in the country where traded, as of the valuation date. This value is converted to U.S. dollars at the exchange rate in effect on the valuation day. Under certain circumstances (for example, if there are significant movements in the U.S. markets and there is an expectation the securities traded on foreign markets will adjust based on such movements when the foreign markets open the next day), the Account may adjust the value of equity or fixed income securities that trade on a foreign exchange or market after the foreign exchange or market has closed.
Valuation of Loans Receivable (i.e., the Account as a creditor)—Loans receivable are stated at fair value and are initially valued at the face amount of the loan funding. Subsequently, loans receivable are valued at least quarterly by TIAA’s internal valuation department based on market factors, such as market interest rates and spreads for comparable loans, the liquidity for loans of similar characteristics, the performance of the underlying collateral (such as the loan-to-value ratio and the cash flow of the underlying collateral) and the credit quality of the counterparty. The independent

10
fiduciary reviews and approves all loan receivable valuation adjustments before such adjustments are recorded by the Account. The Account continues to use the revised value for each loan receivable to calculate the Account’s daily net asset value until the next valuation review.
Valuation of Mortgage Loans Payable (i.e., the Account as a debtor)—Mortgage loans payable are stated at fair value. The estimated fair values of mortgage loans payable are based on the amount at which the liability could be transferred to a third party exclusive of transaction costs. Mortgage loans payable are valued internally by TIAA’s internal valuation department, as reviewed by the Account’s independent fiduciary, at least quarterly based on market factors, such as market interest rates and spreads for comparable loans, the performance of the underlying collateral (such as the loan-to-value ratio and the cash flow of the underlying collateral), the liquidity for mortgage loans of similar characteristics, the maturity date of the loan, the credit quality of the Account and the return demands of the market.
See Note 4—Assets and Liabilities Measured at Fair Value on a Recurring Basis for further discussion and disclosure regarding the determination of the fair value of the Account’s investments.
Foreign Currency Transactions and Translation: Portfolio investments and other assets and liabilities denominated in foreign currencies are translated into U.S. dollars at the exchange rates prevailing at the end of the period. Purchases and sales of securities, income receipts and expense payments made in foreign currencies are translated into U.S. dollars at the exchange rates prevailing on the respective dates of the transactions. The effect of any changes in foreign currency exchange rates on portfolio investments and mortgage loans payable are included in net realized and unrealized gains and losses on real estate properties and mortgage loans payable. Net realized gains and losses on foreign currency transactions include disposition of foreign currencies, and currency gains and losses between the accrual and receipt dates of portfolio investment income and between the trade and settlement dates of portfolio investment transactions.
Accumulation and Annuity Funds: The accumulation fund represents the net assets attributable to participants in the accumulation phase of their investment (“Accumulation Fund”). The annuity fund represents the net assets attributable to the participants currently receiving annuity payments (“Annuity Fund”). The net increase or decrease in net assets from investment operations is apportioned between the funds based upon their relative daily net asset values. Once an Account participant begins receiving lifetime annuity income benefits, payment levels cannot be reduced as a result of the Account’s actual mortality experience. In addition, the contracts pursuant to which the Account is offered are required to stipulate the maximum expense charge for all Account level expenses that can be assessed, which is not to exceed 2.5% of average net assets per year. The Account pays a fee to TIAA to assume mortality and expense risks.
Accounting for Investments: The investments held by the Account are accounted for as follows:
Real Estate Properties—Rent from real estate properties consists of all amounts earned under tenant operating leases, including base rent, recoveries of real estate taxes and other expenses and charges for miscellaneous services provided to tenants. Rental income is recognized in accordance with the billing terms of the lease agreements. The Account bears the direct expenses of the real estate properties owned. These expenses include, but are not limited to, fees to local property management companies, property taxes, utilities, maintenance, repairs, insurance, and other operating and administrative costs. An estimate of the net operating income earned from each real estate property is accrued by the Account on a daily basis and such estimates are adjusted when actual operating results are determined.
Real Estate Joint Ventures—The Account has ownership interests in various real estate joint ventures (collectively, the “joint ventures”). The Account records its contributions as increases to its investments in the joint ventures, and distributions from the joint ventures are treated as income within income from real estate joint ventures and limited partnerships in the Account’s consolidated statements of operations. Distributions that are identified as returns of capital are recorded as a reduction to the cost basis of the investment, whereas distributions identified as capital gains or losses are recorded as realized gains or losses. Income distributions from the joint ventures are recorded based on the Account’s proportional interest of the income distributed by the joint ventures. Income earned but not yet distributed to the Account by the joint ventures is recorded as unrealized gains and losses.
Limited Partnerships—The Account has ownership interests in various private real estate funds (primarily limited partnerships) and a private real estate investment trust (collectively, the “limited partnerships”). The Account records its contributions as increases to the investments, and distributions from the investments are treated as income within

11
income from real estate joint ventures and limited partnerships in the Account’s consolidated statements of operations. Distributions that are identified as returns of capital are recorded as a reduction to the cost basis of the investment, whereas distributions identified as capital gains or losses are recorded as realized gains or losses. Unrealized gains and losses are recorded based upon the changes in the net asset values of the limited partnerships as determined from the financial statements of the limited partnerships when received by the Account. Prior to the receipt of the financial statements from the limited partnerships, the Account estimates the value of its interest in good faith and will from time to time seek input from the issuer or the sponsor of the investments. Changes in value based on such estimates are recorded by the Account as unrealized gains and losses.
Marketable Securities—Transactions in marketable securities are accounted for as of the date the securities are purchased or sold (trade date). Interest income is recorded as earned. Dividend income is recorded on the ex-dividend date within dividend income. Dividends that are identified as returns of capital are recorded as a reduction to the cost basis of the investment, whereas dividends identified as capital gains or losses are recorded as realized gains or losses. Realized gains and losses on securities transactions are accounted for on the specific identification method.
Loans Receivable—The Account has ownership interests in loans receivable. Loans receivable are stated at fair value and are initially valued at the face amount of the loan funding. Subsequently, loans receivable are valued at least quarterly by TIAA’s internal valuation department with changes in fair value flowing through unrealized gain (loss). Interest income from loans receivable is recognized using the effective interest method over the expected life of the loan. All loans receivable held to date were originated directly by the Account.
Realized and Unrealized Gains and Losses—Realized gains and losses are recorded at the time an investment is sold or a distribution is received in relation to an investment sale from a joint venture or limited partnership. Real estate transactions are accounted for as of the date on which the purchase or sale transactions for the real estate properties close (settlement date). The Account recognizes a realized gain on the sale of a real estate property to the extent that the contract sales price exceeds the cost-to-date of the property being sold. A realized loss occurs when the cost-to-date exceeds the sales price.
Unrealized gains and losses are recorded as the fair values of the Account’s investments are adjusted, and as discussed within the Real Estate Joint Ventures and Limited Partnerships sections above.
Net Assets—The Account’s net assets as of the close of each valuation day are valued by taking the sum of:• the value of the Account’s cash; cash equivalents, and short-term and other debt instruments;• the value of the Account’s other securities and other non-real estate assets;• the value of the individual real properties (based on the most recent valuation of that property) and other
real estate-related investments owned by the Account;• an estimate of the net operating income accrued by the Account from its properties, other real estate-related
investments and non-real estate-related investments (including short-term marketable securities) since the end of the prior valuation day; and
• actual net operating income earned from the Account’s properties, other real estate-related investments and non-real estate-related investments (but only to the extent any such item of income differs from the estimated income accrued for on such investments),
and then reducing the sum by liabilities held within the Account, including the daily investment management fee, administration and distribution fees, mortality and expense fees, and the liquidity guarantee fee, and certain other expenses attributable to operating the Account. Daily estimates of net operating income are adjusted to reflect actual net operating income on a monthly basis, at which time such adjustments (if any) are reflected in the Account’s unit value.
After the end of every quarter, the Account reconciles the amount of expenses deducted from the Account (which is established in order to approximate the costs that the Account will incur) with the expenses the Account actually incurred. If there is a difference, the Account adds it to or deducts it from the Account in equal daily installments over the remaining days of the following quarter. Material differences may be repaid in the current calendar quarter. The Account’s at cost deductions are based on projections of Account assets and overall expenses, and the size of any

12
adjusting payments will be directly affected by the difference between management’s projections and the Account’s actual assets or expenses.
Income from Securities Lending: The Account may lend securities to qualified borrowers to generate additional income. When loaning securities, the Account retains the benefits of owning the securities, including the economic equivalent of dividends or interest generated by the securities. Cash collateral received for securities on loan is maintained exclusively in an interest-bearing deposit account. All income generated by the securities lending program is reflected within interest income on the consolidated statements of operations.
Cash and Cash Equivalents: Cash and cash equivalents are balances held by the Account in bank deposit accounts which, at times, exceed federally insured limits. The Account’s management monitors these balances to mitigate the exposure of risk due to concentration and has not experienced any losses from such concentration.
Other Assets and Other Liabilities: Other assets and other liabilities consist of operating assets and liabilities utilized and held at each individual real estate property investment. Other assets consist of, among other items, cash, tenant receivables and prepaid expenses; whereas other liabilities primarily consist of security deposits. Other assets also include cash collateral held for securities on loan.
Federal Income Taxes: Based on provisions of the Internal Revenue Code, Section 817, the Account is taxed as a segregated asset account of TIAA and as such, the Account incurs no material federal income tax attributable to the net investment activity of the Account. The Account’s federal income tax return is generally subject to examination for a period of three years after it is filed. State and local tax returns may be subject to examination for an additional period of time depending on the jurisdiction. Management has analyzed the Account’s tax positions taken for all open federal income tax years and has concluded that no provision for federal income tax is required in the Account’s Consolidated Financial Statements.
Restricted Cash: The Account held $41.8 million and $45.8 million as of September 30, 2017 and December 31, 2016, respectively, in escrow accounts for security deposits, as required by certain states, as well as property taxes, insurance, and various other property related matters as required by certain creditors related to outstanding mortgage loans payable collateralized by certain real estate investments. These amounts are recorded within other assets on the consolidated statements of assets and liabilities. See Note 6—Mortgage Loans Payable for additional information regarding the Account’s outstanding mortgage loans payable.
Changes in Net Assets: Premiums include premiums paid by existing accumulation unit holders in the Account and transfers into the Account. Withdrawals and death benefits include withdrawals out of the Account which include transfers out of the Account and required minimum distributions.
Due to/from Investment Manager: Due to/from investment manager represents amounts that are to be paid or received by TIAA on behalf of the Account. Amounts generally are paid or received by the Account within one or two business days and no interest is contractually charged on these amounts.
New Accounting Pronouncements: In May 2014, the FASB issued Accounting Standard Update 2014-09, Revenue from Contracts with Customers (“ASU 2014-09”). ASU 2014-09 supersedes all existing revenue recognition guidance and establishes a five-step model to measure and recognize revenue. ASU 2014-09 will be effective for fiscal years beginning after December 15, 2017 and the Account plans to adopt the new revenue guidance as of January 1, 2018. The Account has completed its initial scoping for the adoption of ASU 2014-09 and has determined that a limited number of asset management agreements will be in the scope of the new guidance. However, the revenue recognition patterns related to the services performed under the asset management agreements are not expected to be significantly different from the revenue recognition pattern under existing GAAP. For the adoption of ASU 2014-09, the Account is planning to utilize the modified retrospective adoption approach. Management is currently in the process of evaluating the final impact of the new standard.
In January 2016, the FASB issued ASU 2016-1 Financial Instruments (Topic 825)—Recognition and Measurement of Financial Assets and Financial Liabilities (“ASU 2016-1”). This ASU amends, among other items, certain aspects of the recognition, measurement, presentation, and disclosure of financial instruments. These amendments are effective for public business entities for fiscal years and interim periods within those fiscal years beginning after December 15,

13
2017. Management is currently assessing the impact of ASU 2016-1 on the Account’s Consolidated Financial Statements.
In February 2016, the FASB issued ASU 2016-2 Leases (Topic 842) (“ASU 2016-2”) which will supersede Topic 840, Leases. This ASU applies to all entities that enter into a lease. Lessees will be required to report assets and liabilities that arise from leases. Lessor accounting is expected to remain unchanged except in certain circumstances. This ASU is effective for public business entities for fiscal years beginning after December 15, 2018, including all interim periods within those fiscal years. Management is currently assessing the impact of ASU 2016-2 on the Account’s Consolidated Financial Statements.
In August 2016, the FASB issued Accounting Standards Update 2016-15, Statement of Cash Flows (Topic 230) - Classification of Certain Cash Receipts and Cash Payments (“ASU 2016-15”). ASU 2016-15 clarifies how to present cash receipts and cash payments for certain activity in the Statement of Cash Flows. These amendments are effective for public business entities within those fiscal years beginning after December 15, 2017, and interim periods within those fiscal years and should be applied using a retrospective transition method to each period presented. Management is currently assessing the impact of ASU 2016-15 on the Account's Consolidated Financial Statements.
In November 2016, FASB issued Accounting Standards Update 2016-18, Statement of Cash Flows (Topic 230): Restricted Cash ("ASU 2016-18"). The statement of cash flows should present beginning-of-period and end-of-period total amounts that include cash and restricted cash. Transfers between cash and restricted cash will no longer be presented as operating, investing, or financing activities within the statement of cash flows. ASU 2016-18 is effective for annual financial statements issued for fiscal years beginning after December 15, 2017 and should be applied using a retrospective transition method to each period presented. Management is currently assessing the impact of ASU 2016-18 on the Account's Consolidated Financial Statements.
In March 2017, the FASB issued ASU 2017-05, Other Income-Gains and Losses from the Derecognition of Nonfinancial Assets (Subtopic 610-20): Clarifying the Scope of Asset Derecognition Guidance and Accounting for Partial Sales of Nonfinancial Assets. The amendments in ASU 2017-05 clarify the scope and application of ASC 610-20 on the sale or transfer of nonfinancial assets and in substance nonfinancial assets to noncustomers, including partial sales. ASU 2017-05 is effective for public business entities for annual periods beginning after December 15, 2017, including interim periods within those annual periods. The amendments may be either retrospectively applied to each period presented within the financial statements or by a cumulative-effect adjustment to retained earnings or net assets as of the beginning of the fiscal year of adoption. Management is currently assessing the impact of ASU 2017-05 on the Account’s Consolidated Financial Statements.
Note 2—Management Agreements, Arrangements and Related Party Transactions
Investment advisory services for the Account are provided by TIAA officers, under the direction and control of the Board, pursuant to investment management procedures adopted by TIAA for the Account. TIAA’s investment management decisions for the Account are subject to review by the Account’s independent fiduciary. TIAA also provides various portfolio accounting and related services for the Account.
The Account is a party to the Distribution Agreement for the Contracts Funded by the TIAA Real Estate Account (the “Distribution Agreement”), dated January 1, 2008, by and among TIAA, for itself and on behalf of the Account, and TIAA-CREF Individual and Institutional Services, LLC (“Services”), a wholly-owned subsidiary of TIAA, a registered broker-dealer and a member of the Financial Industry Regulatory Authority. Pursuant to the Distribution Agreement, Services performs distribution services for the Account which include, among other things, (i) distributing of annuity contracts issued by TIAA and funded by the Account, (ii) advising existing annuity contract owners in connection with their accumulations and (iii) helping employers implement and manage retirement plans. In addition, TIAA performs administrative functions for the Account, which include, among other things, (i) maintaining accounting records and performing accounting services, (ii) receiving and allocating premiums, (iii) calculating and making annuity payments, (iv) processing withdrawal requests, (v) providing regulatory compliance and reporting services, (vi) maintaining the Account’s records of contract ownership and (vii) otherwise assisting generally in all aspects of the Account’s operations. Both distribution services (pursuant to the Distribution Agreement) and administrative services are provided to the Account by Services and TIAA, as applicable, on an at cost basis.
14
The Distribution Agreement is terminable by either party upon 60 days written notice and terminates automatically upon any assignment thereof.
TIAA and Services provide investment management, administrative and distribution services at cost. TIAA and Services receive payments from the Account on a daily basis according to formulas established each year and adjusted periodically with the objective of keeping the payments as close as possible to the Account’s expenses actually incurred. Any differences between actual expenses and the amounts paid by the Account are adjusted quarterly.
TIAA also provides a liquidity guarantee to the Account, for a fee, to ensure that sufficient funds are available to meet participant transfer and cash withdrawal requests in the event that the Account’s cash flows and liquid investments are insufficient to fund such requests. TIAA ensures sufficient funds are available for such transfer and withdrawal requests by purchasing accumulation units of the Account.
To the extent TIAA owns accumulation units issued pursuant to the liquidity guarantee, the independent fiduciary monitors and oversees, among other things, TIAA’s ownership interest in the Account and may require TIAA to eventually redeem some of its units, particularly when the Account has un-invested cash or liquid investments available. TIAA also receives a fee for assuming certain mortality and expense risks.
The expenses for the services noted above that are provided to the Account by TIAA and Services are identified in the accompanying consolidated statements of operations and are reflected in Note 7—Financial Highlights.
Note 3—Credit Risk Concentrations
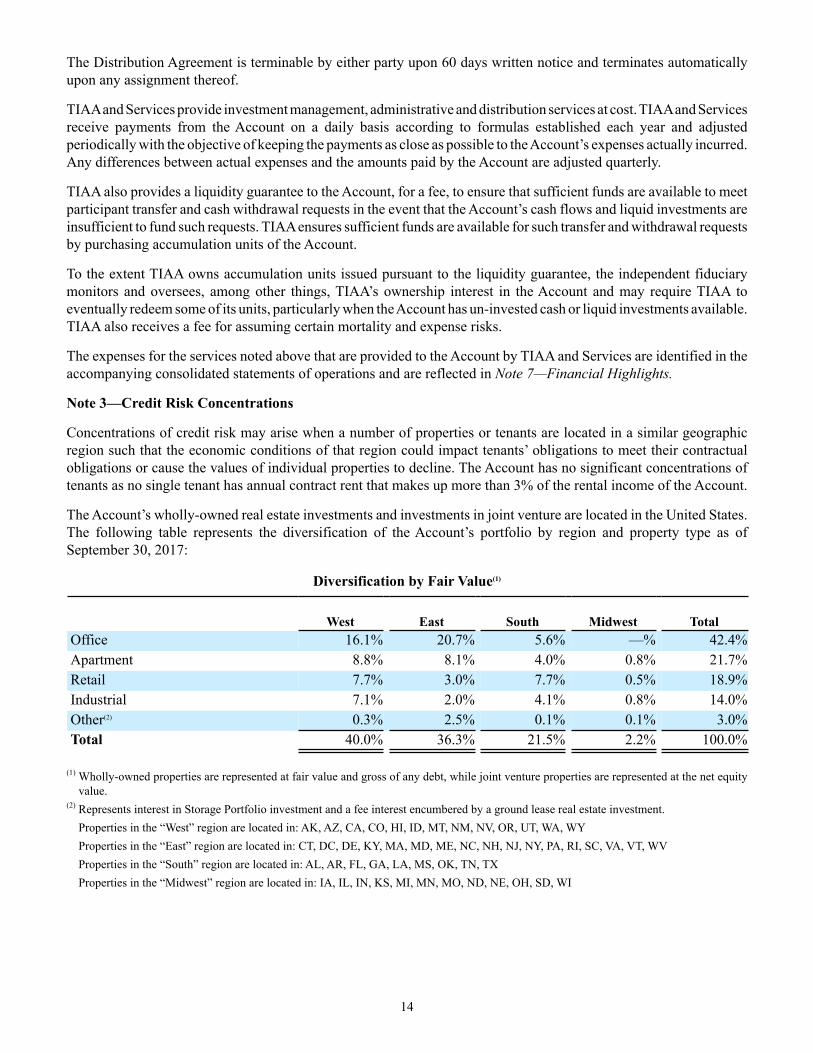
Concentrations of credit risk may arise when a number of properties or tenants are located in a similar geographic region such that the economic conditions of that region could impact tenants’ obligations to meet their contractual obligations or cause the values of individual properties to decline. The Account has no significant concentrations of tenants as no single tenant has annual contract rent that makes up more than 3% of the rental income of the Account.
The Account’s wholly-owned real estate investments and investments in joint venture are located in the United States. The following table represents the diversification of the Account’s portfolio by region and property type as of September 30, 2017:
Diversification by Fair Value(1)
West East South Midwest TotalOffice 16.1% 20.7% 5.6% —% 42.4%Apartment 8.8% 8.1% 4.0% 0.8% 21.7%Retail 7.7% 3.0% 7.7% 0.5% 18.9%Industrial 7.1% 2.0% 4.1% 0.8% 14.0%Other(2) 0.3% 2.5% 0.1% 0.1% 3.0%Total 40.0% 36.3% 21.5% 2.2% 100.0%
(1) Wholly-owned properties are represented at fair value and gross of any debt, while joint venture properties are represented at the net equity value.
(2) Represents interest in Storage Portfolio investment and a fee interest encumbered by a ground lease real estate investment.Properties in the “West” region are located in: AK, AZ, CA, CO, HI, ID, MT, NM, NV, OR, UT, WA, WYProperties in the “East” region are located in: CT, DC, DE, KY, MA, MD, ME, NC, NH, NJ, NY, PA, RI, SC, VA, VT, WVProperties in the “South” region are located in: AL, AR, FL, GA, LA, MS, OK, TN, TXProperties in the “Midwest” region are located in: IA, IL, IN, KS, MI, MN, MO, ND, NE, OH, SD, WI
15
Note 4—Assets and Liabilities Measured at Fair Value on a Recurring Basis
Valuation Hierarchy: The Account’s fair value measurements are grouped categorically into three levels, as defined by the FASB. The levels are defined as follows:
Level 1—Valuations using unadjusted quoted prices for assets traded in active markets, such as stocks listed on the New York Stock Exchange. Active markets are defined as having the following characteristics for the measured asset or liability: (i) many transactions, (ii) current prices, (iii) price quotes not varying substantially among market makers, (iv) narrow bid/ask spreads and (v) most information regarding the issuer is publicly available. Level 1 assets held by the Account are generally marketable equity securities.
Level 2—Valuations for assets and liabilities traded in less active, dealer or broker markets. Fair values are primarily obtained from third party pricing services for identical or comparable assets or liabilities. Level 2 inputs for fair value measurements are inputs, other than quoted prices included within Level 1, that are observable for the asset or liability, either directly or indirectly. Level 2 inputs include:
a. Quoted prices for similar assets or liabilities in active markets;b. Quoted prices for identical or similar assets or liabilities in markets that are not active (that is, markets in
which there are few transactions for the asset (or liability), the prices are not current, price quotations vary substantially either over time or among market makers (for example, some brokered markets), or in which little information is released publicly);
c. Inputs other than quoted prices that are observable within the market for the asset (or liability) (for example, interest rates and yield curves, implied volatilities, prepayment speeds, loss severities, credit risks, and default rates that are observable at commonly quoted intervals); and
d. Inputs that are derived principally from or corroborated by observable market data by correlation or other means (for example, market-corroborated inputs).
Examples of securities which may be held by the Account and included in Level 2 include certificates of deposit, commercial paper, government agency notes, variable notes, United States Treasury securities, and debt securities.
Level 3—Valuations for assets and liabilities that are derived from other valuation methodologies, including pricing models, discounted cash flow models and similar techniques, and are not based on market exchange, dealer, or broker-traded transactions. Level 3 valuations incorporate certain assumptions and projections that are not observable in the market, and require significant professional judgment in determining the fair value assigned to such assets or liabilities. Examples of Level 3 assets and liabilities which may be held by the Account from time to time include investments in real estate, investments in joint ventures, and loans receivable and payable.
An investment’s categorization within the valuation hierarchy described above is based upon the lowest level of input that is significant to the fair value measurement. The Account’s limited partnership investments are valued using the net asset value per share as a practical expedient, which excludes the investments from the valuation hierarchy.
The Account’s determination of fair value is based upon quoted market prices, where available. If listed prices or quotes are not available, fair value is based upon vendor-provided, evaluated prices or internally developed models that primarily use market-based or independently sourced market data, including interest rate yield curves, market spreads, and currency rates. Valuation adjustments will be made to reflect changes in credit quality, counterparty’s creditworthiness, the Account’s creditworthiness, liquidity, and other observable and unobservable inputs that are applied consistently over time.
The methods described above are considered to produce fair values that represent a good faith estimate of what an unaffiliated buyer in the marketplace would pay to purchase the asset or would receive to transfer the liability. Since fair value calculations involve significant professional judgment in the application of both observable and unobservable attributes, actual realizable values or future fair values may differ from amounts reported. Furthermore, while the Account believes its valuation methods are appropriate and consistent with other market participants, the use of different methodologies or assumptions to determine the fair value of certain financial instruments, while reasonable, could result in different estimates of fair value at the reporting date. As discussed in Note 1—Organization and Significant

16
Accounting Policies in more detail, the Account generally obtains independent third party appraisals on a quarterly basis; there may be circumstances in the interim in which the true realizable value of a property is not reflected in the Account’s daily net asset value calculation or in the Account’s periodic Consolidated Financial Statements. This disparity may be more apparent when the commercial and/or residential real estate markets experience an overall and possibly dramatic decline (or increase) in property values in a relatively short period of time between appraisals.
The following tables show the major categories of assets and liabilities measured at fair value on a recurring basis as of September 30, 2017 (unaudited) and December 31, 2016, using unadjusted quoted prices in active markets for identical assets (Level 1); significant other observable inputs (Level 2); and significant unobservable inputs (Level 3); and practical expedient (in millions):
Description
Level 1: QuotedPrices in Active
Markets forIdentical Assets
Level 2:Significant Other
ObservableInputs
Level 3:Significant
UnobservableInputs
Fair ValueUsing
PracticalExpedient
Total atSeptember 30,
2017Real estate properties $ — $ — $ 15,654.2 $ — $ 15,654.2Real estate joint ventures — — 5,675.4 — 5,675.4Limited partnerships — — — 140.7 140.7Marketable securities:
Real estate-related 1,121.0 — — — 1,121.0Government agency notes — 3,276.1 — — 3,276.1United States Treasurysecurities — 1,017.3 — — 1,017.3
Loans receivable — — 298.8 — 298.8Total Investments atSeptember 30, 2017 $ 1,121.0 $ 4,293.4 $ 21,628.4 $ 140.7 $ 27,183.5
Mortgage loans payable $ — $ — $ (2,311.0) $ — $ (2,311.0)
Description
Level 1: QuotedPrices in Active
Markets forIdentical Assets
Level 2:Significant Other
ObservableInputs
Level 3:Significant
UnobservableInputs
Fair ValueUsing
PracticalExpedient
Total atDecember 31,
2016Real estate properties $ — $ — $ 15,452.8 $ — $ 15,452.8Real estate joint ventures — — 5,622.4 — 5,622.4Limited partnerships — — — 137.5 137.5Marketable securities:
Real estate-related 1,081.5 — — — 1,081.5Government agency notes — 2,308.9 — — 2,308.9United States Treasurysecurities — 1,744.9 — — 1,744.9
Loans receivable — — 295.7 — 295.7Total Investments at
December 31, 2016 $ 1,081.5 $ 4,053.8 $ 21,370.9 $ 137.5 $ 26,643.7Mortgage loans payable $ — $ — $ (2,332.1) $ — $ (2,332.1)
17
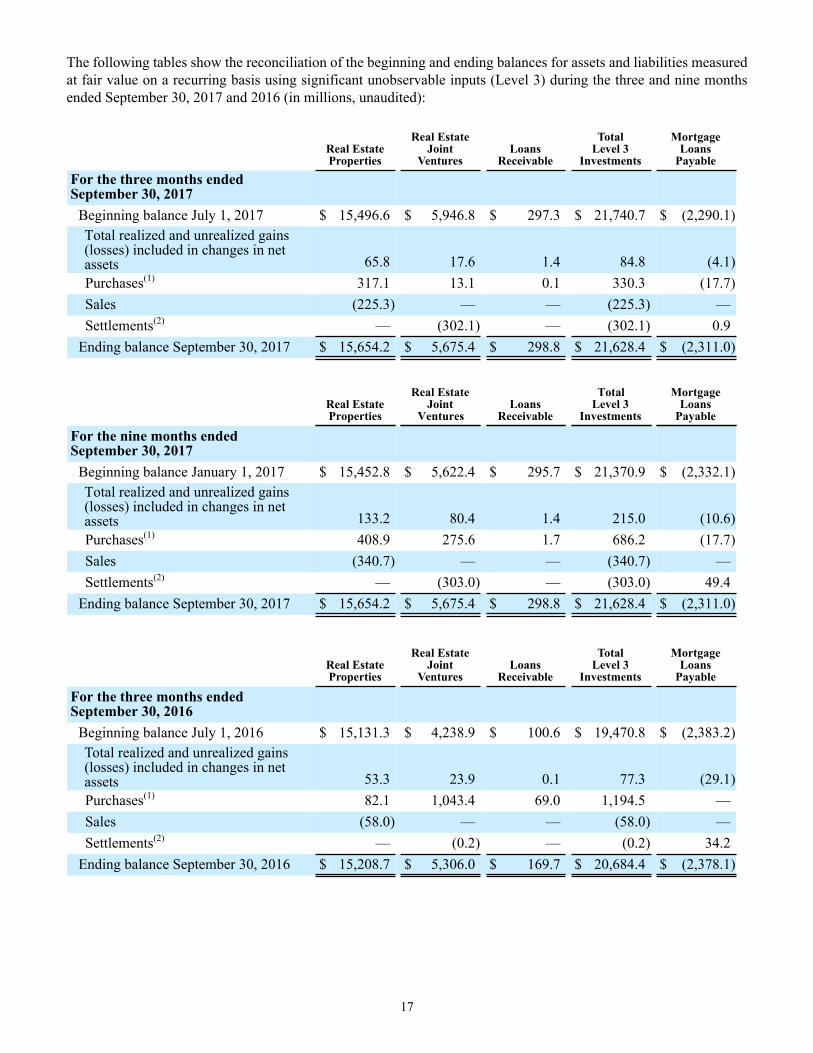
The following tables show the reconciliation of the beginning and ending balances for assets and liabilities measured at fair value on a recurring basis using significant unobservable inputs (Level 3) during the three and nine months ended September 30, 2017 and 2016 (in millions, unaudited):
Real EstateProperties
Real EstateJoint
VenturesLoans
Receivable
TotalLevel 3
Investments
MortgageLoans
PayableFor the three months endedSeptember 30, 2017
Beginning balance July 1, 2017 $ 15,496.6 $ 5,946.8 $ 297.3 $ 21,740.7 $ (2,290.1)Total realized and unrealized gains(losses) included in changes in netassets 65.8 17.6 1.4 84.8 (4.1)
Purchases(1) 317.1 13.1 0.1 330.3 (17.7) Sales (225.3) — — (225.3) — Settlements(2) — (302.1) — (302.1) 0.9
Ending balance September 30, 2017 $ 15,654.2 $ 5,675.4 $ 298.8 $ 21,628.4 $ (2,311.0)
Real EstateProperties
Real EstateJoint
VenturesLoans
Receivable
TotalLevel 3
Investments
MortgageLoans
Payable
For the nine months endedSeptember 30, 2017
Beginning balance January 1, 2017 $ 15,452.8 $ 5,622.4 $ 295.7 $ 21,370.9 $ (2,332.1)Total realized and unrealized gains(losses) included in changes in netassets 133.2 80.4 1.4 215.0 (10.6)
Purchases(1) 408.9 275.6 1.7 686.2 (17.7) Sales (340.7) — — (340.7) — Settlements(2) — (303.0) — (303.0) 49.4
Ending balance September 30, 2017 $ 15,654.2 $ 5,675.4 $ 298.8 $ 21,628.4 $ (2,311.0)
Real EstateProperties
Real EstateJoint
VenturesLoans
Receivable
TotalLevel 3
Investments
MortgageLoans
Payable
For the three months endedSeptember 30, 2016
Beginning balance July 1, 2016 $ 15,131.3 $ 4,238.9 $ 100.6 $ 19,470.8 $ (2,383.2)Total realized and unrealized gains (losses) included in changes in net assets 53.3 23.9 0.1 77.3 (29.1)
Purchases(1) 82.1 1,043.4 69.0 1,194.5 — Sales (58.0) — — (58.0) — Settlements(2) — (0.2) — (0.2) 34.2
Ending balance September 30, 2016 $ 15,208.7 $ 5,306.0 $ 169.7 $ 20,684.4 $ (2,378.1)

18
Real EstateProperties
Real EstateJoint
VenturesLoans
Receivable
TotalLevel 3
Investments
MortgageLoans
Payable
For the nine months endedSeptember 30, 2016
Beginning balance January 1, 2016 $ 14,606.2 $ 4,068.4 $ 100.6 $ 18,775.2 $ (1,794.4)Total realized and unrealized gains(losses) included in changes in netassets 268.7 157.4 0.1 426.2 (54.8)
Purchases(1) 486.7 1,082.1 69.0 1,637.8 (563.5) Sales (152.9) — — (152.9) — Settlements(2) — (1.9) — (1.9) 34.6
Ending balance September 30, 2016 $ 15,208.7 $ 5,306.0 $ 169.7 $ 20,684.4 $ (2,378.1)
(1) Includes purchases, contributions for joint ventures, capital expenditures, lending for loans receivable and debt assumed as part of a real estate transaction.
(2) Includes operating income for real estate joint ventures, net of distributions, and principal payments and extinguishment of mortgage loans payable.
19
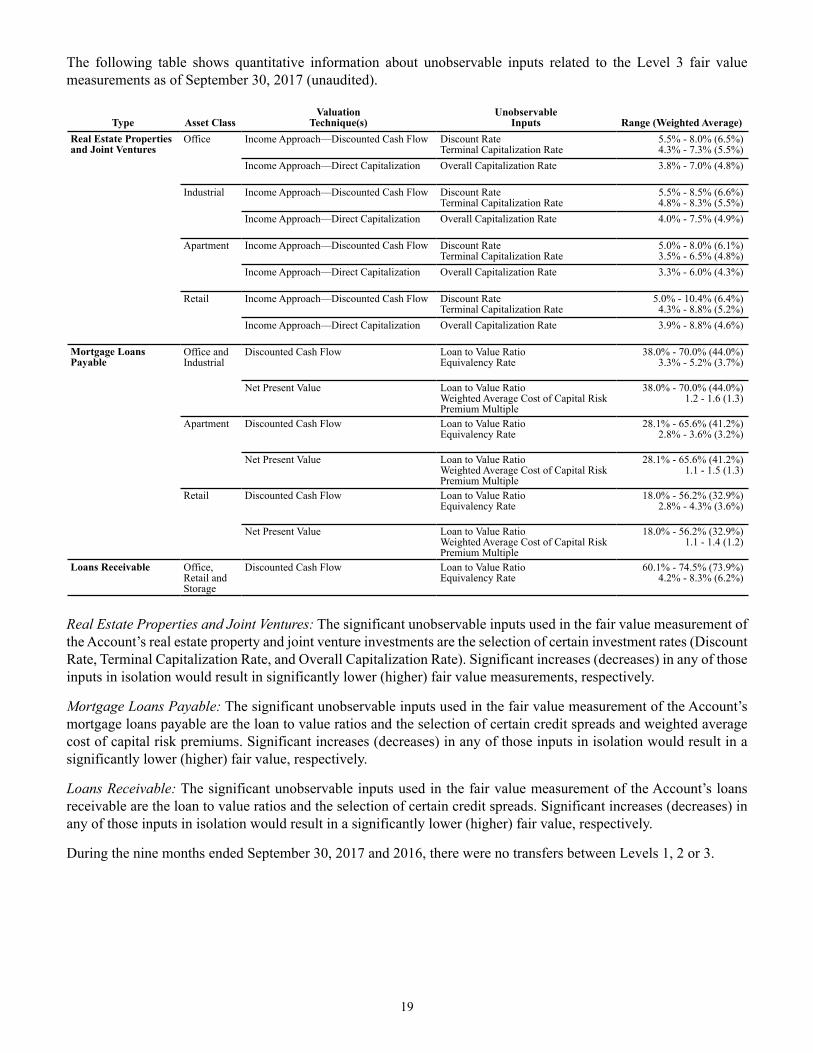
The following table shows quantitative information about unobservable inputs related to the Level 3 fair value measurements as of September 30, 2017 (unaudited).
Type Asset ClassValuation
Technique(s)Unobservable
Inputs Range (Weighted Average)Real Estate Properties and Joint Ventures
Office Income Approach—Discounted Cash Flow Discount RateTerminal Capitalization Rate
5.5% - 8.0% (6.5%)4.3% - 7.3% (5.5%)
Income Approach—Direct Capitalization Overall Capitalization Rate 3.8% - 7.0% (4.8%)
Industrial Income Approach—Discounted Cash Flow Discount RateTerminal Capitalization Rate
5.5% - 8.5% (6.6%)4.8% - 8.3% (5.5%)
Income Approach—Direct Capitalization Overall Capitalization Rate 4.0% - 7.5% (4.9%)
Apartment Income Approach—Discounted Cash Flow Discount RateTerminal Capitalization Rate
5.0% - 8.0% (6.1%)3.5% - 6.5% (4.8%)
Income Approach—Direct Capitalization Overall Capitalization Rate 3.3% - 6.0% (4.3%)
Retail Income Approach—Discounted Cash Flow Discount RateTerminal Capitalization Rate
5.0% - 10.4% (6.4%)4.3% - 8.8% (5.2%)
Income Approach—Direct Capitalization Overall Capitalization Rate 3.9% - 8.8% (4.6%)
Mortgage Loans Payable
Office and Industrial
Discounted Cash Flow Loan to Value RatioEquivalency Rate
38.0% - 70.0% (44.0%)3.3% - 5.2% (3.7%)
Net Present Value Loan to Value RatioWeighted Average Cost of Capital RiskPremium Multiple
38.0% - 70.0% (44.0%)1.2 - 1.6 (1.3)
Apartment Discounted Cash Flow Loan to Value RatioEquivalency Rate
28.1% - 65.6% (41.2%)2.8% - 3.6% (3.2%)
Net Present Value Loan to Value RatioWeighted Average Cost of Capital RiskPremium Multiple
28.1% - 65.6% (41.2%)1.1 - 1.5 (1.3)
Retail Discounted Cash Flow Loan to Value RatioEquivalency Rate
18.0% - 56.2% (32.9%)2.8% - 4.3% (3.6%)
Net Present Value Loan to Value RatioWeighted Average Cost of Capital RiskPremium Multiple
18.0% - 56.2% (32.9%)1.1 - 1.4 (1.2)
Loans Receivable Office, Retail and Storage
Discounted Cash Flow Loan to Value RatioEquivalency Rate
60.1% - 74.5% (73.9%)4.2% - 8.3% (6.2%)
Real Estate Properties and Joint Ventures: The significant unobservable inputs used in the fair value measurement of the Account’s real estate property and joint venture investments are the selection of certain investment rates (Discount Rate, Terminal Capitalization Rate, and Overall Capitalization Rate). Significant increases (decreases) in any of those inputs in isolation would result in significantly lower (higher) fair value measurements, respectively.
Mortgage Loans Payable: The significant unobservable inputs used in the fair value measurement of the Account’s mortgage loans payable are the loan to value ratios and the selection of certain credit spreads and weighted average cost of capital risk premiums. Significant increases (decreases) in any of those inputs in isolation would result in a significantly lower (higher) fair value, respectively.
Loans Receivable: The significant unobservable inputs used in the fair value measurement of the Account’s loans receivable are the loan to value ratios and the selection of certain credit spreads. Significant increases (decreases) in any of those inputs in isolation would result in a significantly lower (higher) fair value, respectively.
During the nine months ended September 30, 2017 and 2016, there were no transfers between Levels 1, 2 or 3.

20
The amount of total net unrealized gains (losses) included in changes in net assets attributable to the change in net unrealized gains (losses) relating to Level 3 investments and mortgage loans payable using significant unobservable inputs still held as of the reporting date is as follows (in millions, unaudited):
Real EstateProperties
Real EstateJoint
VenturesLoans
Receivable
TotalLevel 3
Investments
MortgageLoans
Payable
For the three months ended September 30, 2017 $ 68.0 $ 17.9 $ 1.4 $ 87.3 $ (4.1)For the nine months ended September 30, 2017 $ 139.0 $ 80.7 $ 1.4 $ 221.1 $ (10.6)For the three months ended September 30, 2016 $ 53.9 $ 23.7 $ 0.1 $ 77.7 $ (29.1)For the nine months ended September 30, 2016 $ 270.1 $ 157.2 $ 0.1 $ 427.4 $ (54.8)
As of September 30, 2017, two of the limited partnership investments were in dissolution. Colony Realty Partners LP began liquidation in May 2014, with final dissolution anticipated during 2017. Lion Gables Apartment Fund began liquidation in February 2015 and has sold all of the Fund’s assets. Final dissolution of the entity is anticipated during 2017.
Transwestern Mezzanine Realty Partners III, LLC (“Transwestern”) may engage in liquidation activities in 2017 based on the terms of its partnership agreement. The Account may elect to sell or transfer its ownership units by giving notice and acquiring consent from the management committee of Transwestern, which requires approval by a majority of the members. Redemption of the Account’s interest in Transwestern prior to liquidation is prohibited, unless a supermajority of the members approves the redemption request.
Clarion Gables Multi-Family Trust LP allows redemptions with an advanced notice of three months or more. Redemptions are funded using the partnership’s available cash, which may not immediately be in excess of the redemption amount, and may not be sufficient to fund the redemption amount for several months. The general partner has sole discretion in identifying how much cash is available to process redemptions. The partnership allows the Account to sell its interest in the partnership, subject to the consent and approval of the general partner.
Taconic New York City GP Fund, LP prohibits redemptions in the partnership prior to liquidation. Liquidation of the partnership is estimated to begin no earlier than 2024. The partnership allows the Account to sell its interest in the partnership, subject to the consent and approval of the general partner.
Note 5—Investments in Joint Ventures
The Account owns interests in several real estate properties through joint ventures and receives distributions and allocations of profits and losses from the joint ventures based on the Account’s ownership interest in those investments. Several of these joint ventures have mortgage loans payable collateralized by the properties owned by the aforementioned joint ventures. At September 30, 2017, the Account held investments in joint ventures with ownership interest percentages that ranged from 33.3% to 97.5%. Certain joint ventures are subject to adjusted distribution percentages when earnings in the investment reach a pre-determined threshold. The fair value of the Account’s equity interest in these joint ventures was $5.7 billion and $5.6 billion at September 30, 2017 and December 31, 2016, respectively.
A condensed summary of the results of operations of the joint ventures are shown below (in millions, unaudited):
For the Three Months EndedSeptember 30,
For the Nine Months EndedSeptember 30,
2017 2016 2017 2016Operating Revenue and Expenses
Revenues $ 218.0 $ 190.5 $ 645.0 $ 509.4Expenses 108.3 94.6 315.0 259.5
Excess of revenues over expenses $ 109.7 $ 95.9 $ 330.0 $ 249.9
21
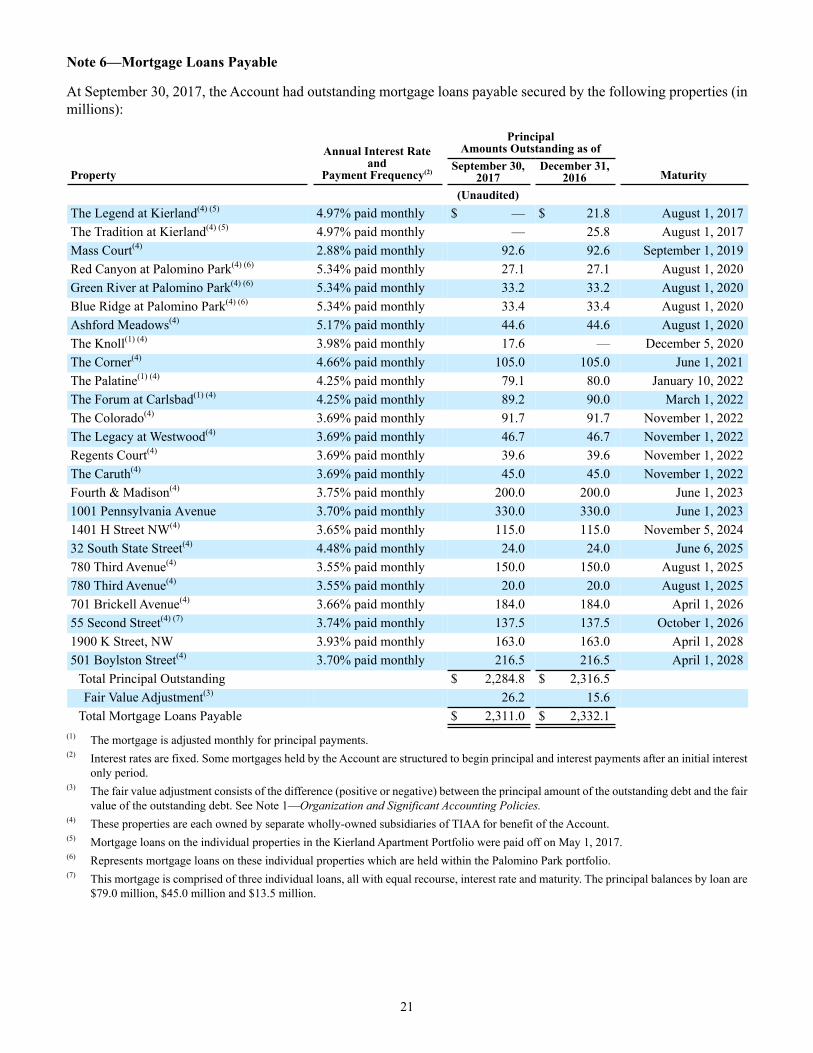
Note 6—Mortgage Loans Payable
At September 30, 2017, the Account had outstanding mortgage loans payable secured by the following properties (in millions):
Property
Annual Interest Rate and
Payment Frequency(2)
PrincipalAmounts Outstanding as of
MaturitySeptember 30,
2017December 31,
2016(Unaudited)
The Legend at Kierland(4) (5) 4.97% paid monthly $ — $ 21.8 August 1, 2017The Tradition at Kierland(4) (5) 4.97% paid monthly — 25.8 August 1, 2017Mass Court(4) 2.88% paid monthly 92.6 92.6 September 1, 2019Red Canyon at Palomino Park(4) (6) 5.34% paid monthly 27.1 27.1 August 1, 2020Green River at Palomino Park(4) (6) 5.34% paid monthly 33.2 33.2 August 1, 2020Blue Ridge at Palomino Park(4) (6) 5.34% paid monthly 33.4 33.4 August 1, 2020Ashford Meadows(4) 5.17% paid monthly 44.6 44.6 August 1, 2020The Knoll(1) (4) 3.98% paid monthly 17.6 — December 5, 2020The Corner(4) 4.66% paid monthly 105.0 105.0 June 1, 2021The Palatine(1) (4) 4.25% paid monthly 79.1 80.0 January 10, 2022The Forum at Carlsbad(1) (4) 4.25% paid monthly 89.2 90.0 March 1, 2022The Colorado(4) 3.69% paid monthly 91.7 91.7 November 1, 2022The Legacy at Westwood(4) 3.69% paid monthly 46.7 46.7 November 1, 2022Regents Court(4) 3.69% paid monthly 39.6 39.6 November 1, 2022The Caruth(4) 3.69% paid monthly 45.0 45.0 November 1, 2022Fourth & Madison(4) 3.75% paid monthly 200.0 200.0 June 1, 20231001 Pennsylvania Avenue 3.70% paid monthly 330.0 330.0 June 1, 20231401 H Street NW(4) 3.65% paid monthly 115.0 115.0 November 5, 202432 South State Street(4) 4.48% paid monthly 24.0 24.0 June 6, 2025780 Third Avenue(4) 3.55% paid monthly 150.0 150.0 August 1, 2025780 Third Avenue(4) 3.55% paid monthly 20.0 20.0 August 1, 2025701 Brickell Avenue(4) 3.66% paid monthly 184.0 184.0 April 1, 202655 Second Street(4) (7) 3.74% paid monthly 137.5 137.5 October 1, 20261900 K Street, NW 3.93% paid monthly 163.0 163.0 April 1, 2028501 Boylston Street(4) 3.70% paid monthly 216.5 216.5 April 1, 2028
Total Principal Outstanding $ 2,284.8 $ 2,316.5Fair Value Adjustment(3) 26.2 15.6
Total Mortgage Loans Payable $ 2,311.0 $ 2,332.1(1) The mortgage is adjusted monthly for principal payments.(2) Interest rates are fixed. Some mortgages held by the Account are structured to begin principal and interest payments after an initial interest
only period. (3) The fair value adjustment consists of the difference (positive or negative) between the principal amount of the outstanding debt and the fair
value of the outstanding debt. See Note 1—Organization and Significant Accounting Policies.(4) These properties are each owned by separate wholly-owned subsidiaries of TIAA for benefit of the Account. (5) Mortgage loans on the individual properties in the Kierland Apartment Portfolio were paid off on May 1, 2017.(6) Represents mortgage loans on these individual properties which are held within the Palomino Park portfolio.(7) This mortgage is comprised of three individual loans, all with equal recourse, interest rate and maturity. The principal balances by loan are
$79.0 million, $45.0 million and $13.5 million.

22
Note 7—Financial Highlights
Selected condensed financial information for an Accumulation Unit of the Account is presented below. Per Accumulation Unit data is calculated on average units outstanding.
For the NineMonths EndedSeptember 30,
2017
Years Ended December 31,
2016 2015 2014(Unaudited)
Per Accumulation Unit Data:Rental income $ 12.737 $ 16.433 $ 15.538 $ 15.862Real estate property level expenses and taxes 5.784 7.534 7.319 7.788
Real estate income, net 6.953 8.899 8.219 8.074Other income 3.340 3.594 3.342 3.459
Total income 10.293 12.493 11.561 11.533Expense charges(1) 2.476 3.290 3.092 2.880
Investment income, net 7.817 9.203 8.469 8.653Net realized and unrealized gain on investmentsand mortgage loans payable 3.804 9.660 18.911 27.868Net increase in Accumulation Unit Value 11.621 18.863 27.380 36.521
Accumulation Unit Value:Beginning of period 381.636 362.773 335.393 298.872End of period $ 393.257 $ 381.636 $ 362.773 $ 335.393
Total return(3) 3.04% 5.20% 8.16% 12.22%Ratios to Average net assets(2):
Expenses(1) 0.83% 0.86% 0.86% 0.89%Investment income, net 2.63% 2.41% 2.37% 2.68%
Portfolio turnover rate(3):Real estate properties(4) 1.6% 1.3% 5.7% 6.5%Marketable securities(5) 5.2% 3.5% 10.0% 15.9%
Accumulation Units outstanding at end of period (inmillions) 61.9 62.4 60.4 57.9
Net assets end of period (in millions) $ 24,839.8 $ 24,304.7 $ 22,360.0 $ 19,829.0(1) Expense charges per Accumulation Unit and the Ratio of Expenses to average net assets reflect the year to date Account level expenses
and exclude real estate property level expenses which are included in real estate income, net.(2) Percentages for the nine months ended September 30, 2017 are annualized.(3) Percentages for the nine months ended September 30, 2017 are not annualized.(4) Real estate investment portfolio turnover rate is calculated by dividing the lesser of purchases or sales of real estate property investments
(including contributions to, or return of capital distributions received from, existing joint venture and limited partnership investments) by the average value of the portfolio of real estate investments held during the period.
(5) Marketable securities portfolio turnover rate is calculated by dividing the lesser of purchases or sales of securities, excluding securities having maturity dates at acquisition of one year or less, by the average value of the portfolio securities held during the period.

23
Note 8—Accumulation Units
Changes in the number of Accumulation Units outstanding were as follows (in millions):
For the NineMonths EndedSeptember 30,
2017
For the YearEnded
December 31,2016
(Unaudited)Outstanding:
Beginning of period 62.4 60.4Credited for premiums 5.1 8.2Annuity, other periodic payments, withdrawals and death benefits (5.6) (6.2)
End of period 61.9 62.4
Note 9—Commitments and Contingencies
Commitments—The Account had $32.0 million and $39.0 million of outstanding immediately callable commitments to purchase additional interests in its limited partnership investments as of September 30, 2017 and December 31, 2016, respectively. The commitment at September 30, 2017 and December 31, 2016 is related to the Taconic New York City GP Fund, LP, in which the Account has entered into an agreement to provide funding. As of September 30, 2017, $13.0 million of the commitment has been funded. Once the remaining commitment is funded, the Account anticipates holding a 60%-90% interest in the fund.
Contingencies—The Account is party to various claims and routine litigation arising in the ordinary course of business. Management of the Account does not believe the results of any such claims or litigation, individually or in the aggregate, will have a material effect on the Account’s business, financial position, or results of operations.
Note 10—Securities Lending
The Account may lend securities to qualified borrowers to earn additional income. The Account receives cash collateral against the loaned securities and maintains cash collateral in an amount not less than 100% of the market value of loaned securities during the period of the loan; any additional collateral required due to changes in security values is delivered to the Account the next business day. Cash collateral received by the Account is invested exclusively in an interest-bearing deposit account. The value of the loaned securities and the liability to return the cash collateral received are reflected in the consolidated statements of assets and liabilities.
As of September 30, 2017, securities lending transactions are for real-estate related equity securities, and the resulting loans are continuous, can be recalled at any time, and have no set maturity. Securities lending income recognized by the Account consists of interest earned on cash collateral and lending fees, net of any rebates to the borrower and compensation to the agent. Such income is reflected within interest income on the consolidated statements of operations. In lending its securities, the Account bears the market risk with respect to the investment of collateral and the risk that the agent may default on its contractual obligations to the Account. The agent bears the risk that the borrower may default on its obligation to return the loaned securities as the agent is contractually obligated to indemnify the Account if at the time of a default by a borrower some or all of the loan securities have not been returned.

24
REAL ESTATE PROPERTIES—57.6% and 58.0%
Location/Description Type
Fair Value atSeptember 30,
2017December 31,
2016(Unaudited)
Arizona:Camelback Center Office $ 58.4 $ 56.4Kierland Apartment Portfolio Apartments 147.7 127.9 (1)
California:55 Second Street Office 353.1 (1) 335.0 (1)
88 Kearny Street Office 177.6 172.3200 Middlefield Road Office 61.2 60.5BLVD63 Apartments 162.0 157.0Castro Station Office 163.0 158.2Centre Pointe and Valley View Industrial 43.9 42.8Cerritos Industrial Park Industrial 140.0 126.3Charleston Plaza Retail 93.0 92.0Great West Industrial Portfolio Industrial 160.9 166.1Holly Street Village Apartments 148.0 146.0Larkspur Courts Apartments 141.4 140.5Northern CA RA Industrial Portfolio Industrial 87.0 76.7Oakmont IE West Portfolio Industrial 87.2 82.7Oceano at Warner Center Apartments 89.0 88.3Ontario Industrial Portfolio Industrial 397.4 (11) 438.0Ontario Mills Industrial Portfolio Industrial 55.9 52.0Pacific Plaza Office 115.2 115.0Rancho Cucamonga Industrial Portfolio Industrial 70.9 (11) 174.2Regents Court Apartments 95.4 (1) 89.9 (1)
Southern CA RA Industrial Portfolio Industrial 136.2 135.0Stella Apartments 178.9 173.1Stevenson Point Industrial 49.9 49.3The Forum at Carlsbad Retail 220.0 (1) 221.5 (1)
The Legacy at Westwood Apartments 143.0 (1) 142.1 (1)
Township Apartments Apartments 89.8 89.6West Lake North Business Park Office 60.4 60.0Westcreek Apartments 51.1 48.2Westwood Marketplace Retail 131.8 125.0Wilshire Rodeo Plaza Office 326.7 320.7
Colorado:Palomino Park Apartments 327.9 (1) 314.1 (1)
South Denver Marketplace Retail 72.7 73.0Connecticut:
Wilton Woods Corporate Campus Office 134.0 141.9Florida:
701 Brickell Avenue Office 362.6 (1) 380.7 (1)
Broward Industrial Portfolio Industrial 54.1 —Casa Palma Apartments 95.0 97.0Orion on Orpington Apartments 42.1 —Publix at Weston Commons Retail 74.1 73.0Seneca Industrial Park Industrial 106.4 102.7South Florida Apartment Portfolio Apartments 105.0 104.1

25
Location/Description Type
Fair Value atSeptember 30,
2017December 31,
2016(Unaudited)
The Manor Apartments Apartments 52.8 53.6The Manor at Flagler Village Apartments 148.0 150.8The Residences at the Village of Merrick Park Apartments 75.0 74.1Urban Centre Office 138.8 121.4Weston Business Center Industrial 92.8 92.7
Georgia:Atlanta Industrial Portfolio Industrial 31.6 (6) 62.8Shawnee Ridge Industrial Portfolio Industrial 89.6 86.7
Illinois:32 South State Street Retail 47.7 (1) 46.5 (1)
803 Corday Apartments 92.5 —Chicago Caleast Industrial Portfolio Industrial 80.3 81.8Chicago Industrial Portfolio Industrial 96.6 85.5
Maryland:Landover Logistics Center Industrial 43.1 39.8The Shops at Wisconsin Place Retail 91.0 92.8
Massachusetts:99 High Street Office 504.0 514.1501 Boylston Street Office 506.3 (1) 490.3 (1)
Fort Point Creative Exchange Portfolio Office 217.9 223.0Northeast RA Industrial Portfolio Industrial 40.2 41.3One Beeman Road Industrial 33.7 —
Minnesota:The Bridges Apartments 62.1 —The Knoll Apartments 33.3 (1) —
New Jersey:200 Milik Street Industrial 52.1 51.2Marketfair Retail 105.0 104.2Amazon Distribution Center Industrial 110.0 101.0South River Road Industrial Industrial 87.2 71.9
New York:21 Penn Plaza Office 266.3 275.2250 North 10th Street Apartments 166.0 162.0425 Park Avenue Ground Lease 454.0 450.0430 West 15th Street Office 140.5 116.1780 Third Avenue Office 429.0 (1) 425.0 (1)
837 Washington Street Office 209.0 215.0The Colorado Apartments 256.0 (1) 258.1 (1)
The Corner Apartments 253.1 (1) 250.0 (1)
Oregon:The Cordelia Apartments 49.0 50.0
Pennsylvania:1619 Walnut Street Retail 23.4 23.4The Pepper Building Apartments — 52.9
South Carolina:Greene Crossing Apartments 65.8 65.8
Tennessee:Southside at McEwen Retail 48.2 48.8

26
Location/Description Type
Fair Value atSeptember 30,
2017December 31,
2016(Unaudited)
Texas:Beltway North Commerce Center Industrial 19.2 19.5Cliffs at Barton Creek Apartments 45.7 45.8Dallas Industrial Portfolio Industrial 210.5 201.3Houston Apartment Portfolio Apartments 159.3 159.3Lincoln Centre Office 353.0 347.0Northwest Houston Industrial Portfolio Industrial 70.0 68.2Park 10 Distribution Industrial 10.3 11.3Pinnacle Industrial Portfolio Industrial 53.4 52.8Pinto Business Park Industrial 130.8 134.2The Caruth Apartments 82.7 (1) 84.3 (1)
The Maroneal Apartments 54.5 52.1Virginia:
8270 Greensboro Drive Office 47.3 47.6Ashford Meadows Apartments Apartments 106.6 (1) 107.2 (1)
Plaza America Retail 115.0 109.0The Ellipse at Ballston Office 84.4 79.8The Palatine Apartments 121.1 (1) 130.9 (1)
Washington:Circa Green Lake Apartments 94.4 92.5Fourth and Madison Office 527.0 (1) 521.0 (1)
Millennium Corporate Park Office 182.1 190.1Northwest RA Industrial Portfolio Industrial 38.2 31.7Pacific Corporate Park Industrial 44.5 42.0Prescott Wallingford Apartments Apartments 62.0 58.8Rainier Corporate Park Industrial 114.7 104.0Regal Logistics Campus Industrial 97.8 83.1Union - South Lake Union Apartments 109.1 105.3
Washington DC:1001 Pennsylvania Avenue Office 810.0 (1) 810.0 (1)
1401 H Street, NW Office 203.1 (1) 230.0 (1)
1900 K Street, NW Office 330.2 (1) 335.0 (1)
Mass Court Apartments 171.0 (1) 169.0 (1)
Mazza Gallerie Retail — 78.0The Ashton Apartments 38.5 39.2The Louis at 14th Apartments 175.0 183.2The Woodley Apartments 191.0 203.0
TOTAL REAL ESTATE PROPERTIES(Cost $12,944.7 and $12,818.1) $ 15,654.2 $ 15,452.8

27
REAL ESTATE JOINT VENTURES AND LIMITED PARTNERSHIPS—21.4% and 21.6%REAL ESTATE JOINT VENTURES—20.9% and 21.1%
Location/Description Type
Fair Value atSeptember 30,
2017December 31,
2016(Unaudited)
California:CA—Colorado Center LP
Colorado Center (50% Account Interest) Office $ 355.1 (2) $ 567.8PC Borrower, LLC
Pacific City (70% Account Interest) Retail 133.8 128.5TREA Campus Pointe 1, LLC Campus Pointe 1 (45% Account Interest) Office 139.4 137.5TREA Campus Pointe 2, LLC Campus Pointe 2 (43.16% Account Interest) Office 104.2 85.7T-C 1500 Owens, LLC
1500 Owens Street (49.9% Account Interest) Office 77.0 74.8T-C Foundry Square II Venture LLC
Foundry Square II (50.1% Account Interest) Office 257.4 200.1(2)
T-C Illinois Street, LLC409-499 Illinois Street (40% Account Interest) Office 206.3 196.8
Valencia Town Center Associates LPValencia Town Center (50% Account Interest) Retail 137.5
(2)
128.0(2)
Florida:Florida Mall Associates, Ltd
The Florida Mall (50% Account Interest) Retail 754.8(2)
755.8(2)
TREA Florida Retail, LLCFlorida Retail Portfolio (80% Account Interest) Retail 150.0 147.6
West Dade County AssociatesMiami International Mall (50% Account Interest) Retail 164.2
(2)
161.1(2)
Maryland:WP Project Developer
The Shops at Wisconsin Place (33.33% Account Interest) Retail 21.0 19.4Massachusetts:One Boston Place REIT
One Boston Place (50.25% Account Interest) Office 238.8 224.2T-C 225 Binney, LLC
225 Binney Street (70% Account Interest) Office 195.7 194.9Nevada:Fashion Show Holding I, LLC
Fashion Show (50% Account Interest) Retail 837.9(2)
839.1(2)
New York:401 West 14th Street, LLC
401 West 14th Street (42.19% Account Interest) Retail 45.5(2)
41.1(2)
817 Broadway Owner, LLC817 Broadway (61.46% Account Interest) Office 23.3
(2)
20.8(2)
MRA Hub 34 Holding, LLCThe Hub (95% Account Interest) Office 57.1
(2)
54.9(2)
RGM 42, LLCMiMA (70% Account Interest) Apartments 188.0
(2)
194.7(2)
TREA 35th Street LIC Investor Member, LLC Commerce LIC (97.5% Account Interest) Industrial 57.9 —
Tennessee:West Town Mall, LLC
West Town Mall (50% Account Interest) Retail 137.1(2)
154.4(2)

28
Location/Description Type
Fair Value atSeptember 30,
2017December 31,
2016(Unaudited)
Texas:Four Oaks Venture LP
Four Oaks Place LP (51% Account Interest) Office 341.6(2)
342.3(2)
Washington:T-C REA 400 Fairview Investor, LLC
400 Fairview (90% Account Interest) Office 262.4 243.6Various:DDRTC Core Retail Fund, LLC
DDR Joint Venture (85% Account Interest) Retail 615.8(2,3)
552.8(2,3)
Storage Portfolio I, LLCStorage Portfolio (75% Account Interest) Storage 173.6
(2,3)
156.5(2,3)
TOTAL REAL ESTATE JOINT VENTURES(Cost $4,399.3 and $4,393.2) $ 5,675.4 $ 5,622.4
LIMITED PARTNERSHIPS—0.5% and 0.5%Clarion Gables Multi-Family Trust LP (8.407% Account Interest) $ 124.9 $ 121.6Colony Realty Partners LP (5.27% Account Interest) — 3.1 (10)
Lion Gables Apartment Fund (18.46% Account Interest) — 0.2 (5)
Taconic New York City GP Fund, LP (60% Account Interest) 11.0 4.8Transwestern Mezz Realty Partners III, LLC (11.708% Account Interest) 4.8 7.8
TOTAL LIMITED PARTNERSHIPS(Cost $140.9 and $137.2) $ 140.7 $ 137.5
TOTAL REAL ESTATE JOINT VENTURES AND LIMITED PARTNERSHIPS(Cost $4,540.2 and $4,530.4) $ 5,816.1 $ 5,759.9

29
MARKETABLE SECURITIES—19.9% and 19.3%REAL ESTATE-RELATED MARKETABLE SECURITIES—4.1% and 4.1%
SharesIssuer
Fair Value atSeptember 30,
2017December 31,
20162017 2016(Unaudited)
82,202 84,437 Acadia Realty Trust $ 2.3 $ 2.828,294 26,717 Agree Realty Corporation 1.4 1.22,132 2,132 Alexander's, Inc. 0.9 0.9
92,255 83,175 Alexandria Real Estate Equities, Inc. 11.0 9.248,980 — Altisource Residential Corp. 0.5 —40,188 41,010 American Assets Trust, Inc. 1.6 1.8
133,888 138,467 American Campus Communities, Inc. 5.9 6.9— 6,347 American Farmland Company — 0.1
239,344 233,916 American Homes 4 Rent 5.2 4.9421,695 443,315 American Tower Corp. 57.6 46.8155,985 163,592 Apartment Investment and Management Company 6.8 7.4210,602 223,733 Apple Hospitality Inc. 4.0 4.547,395 38,282 Armada Hoffler Properties Inc. 0.7 0.627,462 27,631 Ashford Hospitality Prime Inc. 0.3 0.475,865 96,553 Ashford Hospitality Trust, Inc. 0.5 0.7
137,335 143,728 Avalonbay Communities, Inc. 24.5 25.524,509 21,354 Bluerock Residential Growth, Inc. 0.3 0.3
153,602 160,997 Boston Properties, Inc. 18.9 20.3172,155 183,336 Brandywine Realty Trust 3.0 3.0305,457 319,555 Brixmore Property Group Inc 5.7 7.890,816 91,727 Camden Property Trust 8.3 7.7
— 89,419 Care Capital Properties, Inc. — 2.276,188 64,966 CareTrust REIT Inc. 1.5 1.039,488 43,788 Catchmark Timber Trust, Inc. 0.5 0.5
167,957 178,895 CBL & Associates Properties, Inc. 1.4 (9) 2.192,124 92,124 Cedar Shopping Centers, Inc. 0.5 0.639,759 39,759 Chatham Lodging Trust 0.8 0.858,946 63,363 Chesapeake Lodging Trust 1.6 1.615,330 — Clipper Realty, Inc. 0.2 (9) —
541,689 — Colony Northstar, Inc. 6.8 —— 50,961 Colony Starwood Homes — 1.5
122,581 130,704 Columbia Property Trust Inc. 2.7 2.8— 161,499 Communication Sales & Leasing, Inc. — 4.1
17,855 13,231 Community Healthcare Trust, Inc. 0.5 0.3117,713 117,878 CoreCivic, Inc. 3.2 2.912,695 12,695 Corenergy Infrastructure Trust, Inc. 0.4 (9) 0.433,863 35,452 CoreSite Realty Corporation 3.8 2.899,369 98,668 Corporate Office Properties Trust 3.3 3.1
414,681 358,876 Cousins Properties Incorporated 3.9 3.1401,185 378,286 Crown Castle International Corporation 40.1 32.8180,122 189,128 Cubesmart 4.7 5.186,428 80,245 CyrusOne Inc. 5.1 3.692,007 95,203 DCT Industrial Trust, Inc. 5.3 4.6
308,806 326,844 DDR Corp 2.8 5.0198,919 211,566 DiamondRock Hospitality Company 2.2 2.4203,672 166,911 Digital Realty Trust, Inc. 24.1 16.4

30
SharesIssuer
Fair Value atSeptember 30,
2017December 31,
20162017 2016(Unaudited)
144,167 146,715 Douglas Emmett, Inc. $ 5.7 $ 5.4355,455 371,513 Duke Realty Corporation 10.2 9.9
— 79,039 DuPont Fabros Technology, Inc. — 3.538,107 38,107 Easterly Government Properties, Inc. 0.8 0.832,984 34,448 EastGroup Properties, Inc. 2.9 2.573,142 76,609 Education Realty Trust, Inc. 2.6 3.2
125,679 128,313 Empire State Realty Trust 2.6 2.662,943 66,086 EPR Properties 4.4 4.777,532 74,499 Equinix Inc. 34.6 26.6
120,619 132,412 Equity Commonwealth 3.7 4.081,386 81,207 Equity Lifestyle Properties, Inc. 6.9 5.9
— 97,735 Equity One, Inc. — 3.0355,638 378,516 Equity Residential 23.4 24.439,142 39,142 Escrow Winthrop Realty Trust 0.3 0.365,165 68,928 Essex Property Trust, Inc. 16.6 16.0
121,584 123,598 Extra Space Storage, Inc. 9.7 9.533,146 20,247 Farmland Partners, Inc. 0.3 (9) 0.2 (9)
72,018 75,390 Federal Realty Investment Trust 8.9 10.7— 146,636 FelCor Lodging Trust Incorporated — 1.2
117,988 122,078 First Industrial Realty Trust, Inc. 3.6 3.462,454 62,454 First Potomac Realty Trust 0.7 0.7
242,943 247,510 Forest City Realty Trust A 6.2 5.262,347 62,347 Four Corners Property Trust 1.6 1.3
105,457 105,457 Franklin Street Properties Corp. 1.1 1.4200,306 215,403 Gaming and Leisure Properties, Inc. 7.4 6.6616,628 528,439 General Growth Properties, Inc. 12.8 13.2121,553 75,332 GEO Group, Inc./The 3.3 2.732,335 27,304 Getty Realty Corp. 0.9 0.727,842 24,752 Gladstone Commercial Corporation 0.6 0.57,822 — Gladstone Land Corporation 0.1 —
14,323 14,323 Global Medical REIT, Inc. 0.1 (9) 0.1 (9)
66,375 169,785 Global Net Lease, Inc. 1.5 1.393,766 74,542 Government Properties Income Trust 1.8 1.4
150,155 439,336 Gramercy Property Trust Inc. 4.5 4.0468,228 488,199 HCP, Inc. 13.0 14.5121,482 121,172 Healthcare Realty Trust Inc. 3.9 3.7197,648 148,194 Healthcare Trust of America 5.9 4.338,921 38,921 Hersha Hospitality Trust 0.7 0.8
100,544 105,127 Highwoods Properties, Inc. 5.2 5.4162,463 172,557 Hospitality Properties Trust 4.6 5.5730,412 784,264 Host Hotels & Resorts, Inc. 13.5 14.8156,033 130,545 Hudson Pacific Properties, Inc. 5.2 4.570,772 64,154 Independence Realty Trust, Inc. 0.7 0.6
130,841 130,841 Investors Real Estate Trust 0.8 0.987,831 — Invitation Homes 2.0 —
262,389 251,283 Iron Mountain Inc. 10.2 8.21,500,000 1,500,000 iShares Dow Jones US Real Estate Index Fund 119.8 115.4 (9)
86,089 — JBG Smith Properties 2.9 —96,468 96,739 Kilroy Realty Corporation 6.9 7.1

31
SharesIssuer
Fair Value atSeptember 30,
2017December 31,
20162017 2016(Unaudited)
413,143 446,152 Kimco Realty Corporation $ 8.1 $ 11.282,157 86,474 Kite Realty Group Trust 1.7 2.082,861 86,839 Lamar Advertising Corporation 5.7 5.8
113,248 118,625 LaSalle Hotel Properties 3.3 3.6233,615 246,697 Lexington Realty Trust 2.4 2.7147,200 154,875 Liberty Property Trust 6.0 6.145,893 48,870 Life Storage, Inc. 3.8 4.239,429 41,261 LTC Properties, Inc. 1.9 1.991,244 93,046 Mack-Cali Realty Corporation 2.2 2.729,800 23,475 Medequities Realty Trust, Inc. 0.4 0.3
362,242 337,220 Medical Properties Trust, Inc. 4.8 4.1113,412 118,873 Mid-America Apartment Communities, Inc. 12.1 11.671,720 69,038 Monmouth Real Estate Investment Corporation 1.2 1.1
— 175,519 Monogram Residential Trust Inc. — 1.939,678 38,542 National Health Investors, Inc. 3.1 2.9
148,742 154,142 National Retail Properties, Inc. 6.2 6.844,249 44,249 National Storage Affiliates Trust 1.1 1.083,324 83,324 New Senior Investment Group 0.8 0.8
— 175,401 New York REIT — 1.817,140 17,140 Nexpoint Residential Trust, Inc. 0.4 0.454,554 59,329 NorthStar Realty Europe Corp. 0.7 0.7
— 189,799 NorthStar Realty Finance Corp. — 2.9194,823 181,435 Omega Healthcare Investors, Inc. 6.2 (9) 5.716,324 16,324 One Liberty Properties, Inc. 0.4 0.4
138,381 144,614 Outfront Media Inc. 3.5 3.6198,430 157,741 Paramount Group Inc. 3.2 2.5144,718 — Park Hotels & Resorts, Inc. 4.0 —42,820 45,533 Parkway Properties, Inc. 1.0 1.068,431 75,815 Pebblebrook Hotel Trust 2.5 (9) 2.369,866 69,866 Pennsylvania Real Estate Investment Trust 0.7 (9) 1.3
178,281 141,267 Physicians Realty Trust 3.2 2.7144,783 153,053 Piedmont Office Realty Trust, Inc. 2.9 3.240,092 39,487 Potlatch Corporation 2.0 1.630,894 25,352 Preferred Apartment Communities, Inc. 0.6 0.4
526,083 549,455 ProLogis 33.4 29.019,639 20,916 PS Business Parks, Inc. 2.6 2.4
147,591 152,197 Public Storage, Inc. 31.6 34.047,384 47,125 QTS Realty Trust, Inc. 2.5 2.396,479 98,883 Quality Care Properties 1.5 1.578,232 82,342 Ramco-Gershenson Properties Trust 1.0 1.4
127,625 129,796 Rayonier, Inc. 3.7 3.4272,317 270,184 Realty Income Corporation 15.6 15.5149,168 109,616 Regency Centers Corporation 9.3 7.6107,617 113,887 Retail Opportunity Investment 2.0 2.4230,343 247,302 Retail Properties of America 3.0 3.870,011 67,197 Rexford Industrial Realty Inc. 2.0 1.6
169,181 131,026 RLJ Lodging Trust 3.7 3.244,005 50,994 Ryman Hospitality Properties 2.7 3.2
173,736 68,440 Sabra Health Care REIT Inc. 3.8 1.7

32
SharesIssuer
Fair Value atSeptember 30,
2017December 31,
20162017 2016(Unaudited)
11,006 — Safety Income and Growth, Inc. $ 0.2 $ —11,082 14,267 Saul Centers, Inc. 0.7 0.9
119,786 — SBA Communications Corporation 17.3 —63,334 71,466 Select Income Real Estate Investment Trust 1.5 1.8
235,142 248,749 Senior Housing Properties Trust 4.6 4.7— 36,820 Silver Bay Realty Trust Corp. — 0.6
310,266 329,687 Simon Property Group, Inc. 50.0 58.696,162 106,453 SL Green Realty Corp. 9.7 11.4
483,394 483,032 Spirit Realty Capital Inc. 4.1 5.291,969 78,649 Stag Industrial, Inc. 2.5 1.9
126,762 — Starwood Waypoint Homes 4.6 —170,571 162,012 STORE Capital Corporation 4.2 4.0101,582 88,627 Summit Hotel Properties, Inc. 1.6 1.475,320 68,173 Sun Communities, Inc. 6.5 5.2
223,998 227,526 Sunstone Hotel Investors, Inc. 3.6 3.593,587 100,862 Tanger Factory Outlet Centers, Inc. 2.3 3.659,024 63,335 Taubman Centers, Inc. 2.9 4.750,869 48,484 Terreno Realty Corporation 1.8 1.4
136,929 150,999 The Macerich Company 7.5 10.750,411 50,411 Tier Inc. 1.0 0.9
265,245 280,233 UDR, Inc. 10.1 10.230,879 27,329 UMH Properties, Inc. 0.5 0.4
165,032 — UNITI Group, Inc. 2.4 —13,049 14,676 Universal Health Realty Income Trust 1.0 1.097,222 93,500 Urban Edge Properties 2.3 2.631,959 31,959 Urstadt Biddle Properties, Inc. 0.7 0.8
353,728 371,296 Ventas, Inc. 23.0 23.2975,362 1,012,629 VEREIT, Inc. 8.1 8.6172,179 177,780 Vornado Realty Trust 13.2 18.6185,508 193,859 Washington Prime Group, Inc. 1.5 2.076,866 78,200 Washington Real Estate Investment Trust 2.5 2.6
119,216 120,820 Weingarten Realty Investors 3.8 4.3365,663 380,425 Welltower Inc. 25.7 25.5744,863 783,938 Weyerhaeuser Company 25.3 23.638,883 32,110 Whitestone Real Estate Investment Trust B 0.5 0.5
105,577 95,234 WP Carey Inc. 7.1 5.6107,316 113,720 Xenia Hotels & Resorts Inc. 2.3 2.2
TOTAL REAL ESTATE-RELATED MARKETABLE SECURITIES(Cost $889.5 and $883.9) $ 1,121.0 $ 1,081.5

33
OTHER MARKETABLE SECURITIES—15.8% and 15.2%GOVERNMENT AGENCY NOTES—12.1% and 8.7%
PrincipalIssuer Yield(4)
MaturityDate
Fair Value atSeptember 30,
2017December 31,
20162017 2016(Unaudited)
$ — $ 22.0 Fannie Mae Discount Notes 0.416% 2/1/2017 $ — $ 22.0— 42.0 Fannie Mae Discount Notes 0.366% - 0.482% 3/1/2017 — 42.0— 10.0 Fannie Mae Discount Notes 0.427% 3/3/2017 — 10.0— 20.0 Fannie Mae Discount Notes 0.427% 3/6/2017 — 20.0— 20.0 Fannie Mae Discount Notes 0.406% 3/13/2017 — 20.0— 30.3 Fannie Mae Discount Notes 0.406% 3/27/2017 — 30.3— 25.0 Fannie Mae Discount Notes 0.406% 3/28/2017 — 25.0— 30.0 Fannie Mae Discount Notes 0.518% 4/18/2017 — 29.9— 24.0 Fannie Mae Discount Notes 0.483% - 0.579% 4/19/2017 — 24.0— 31.5 Fannie Mae Discount Notes 0.447% - 0.539% 5/1/2017 — 31.5— 49.9 Fannie Mae Discount Notes 0.518% 5/2/2017 — 49.9— 39.9 Fannie Mae Discount Notes 0.539% 5/5/2017 — 39.9
34.9 — Fannie Mae Discount Notes 0.987% 10/2/2017 34.9 —47.1 — Fannie Mae Discount Notes 1.017% - 1.038% 10/11/2017 47.1 —35.1 — Fannie Mae Discount Notes 1.027% 10/12/2017 35.1 —33.6 — Fannie Mae Discount Notes 1.017% 10/13/2017 33.6 —37.1 — Fannie Mae Discount Notes 1.017% - 1.037% 10/19/2017 37.1 —15.1 — Fannie Mae Discount Notes 1.038% 10/23/2017 15.1 —20.0 — Fannie Mae Discount Notes 1.038% 10/25/2017 20.0 —40.0 — Fannie Mae Discount Notes 1.038% 10/27/2017 40.0 —35.0 — Fannie Mae Discount Notes 0.996% 10/30/2017 35.0 —75.1 — Fannie Mae Discount Notes 0.996% - 1.006% 11/1/2017 75.0 —10.0 — Fannie Mae Discount Notes 0.985% 11/3/2017 10.0 —24.6 — Fannie Mae Discount Notes 1.048% 11/6/2017 24.5 —5.0 — Fannie Mae Discount Notes 1.048% 11/9/2017 5.0 —
75.0 — Fannie Mae Discount Notes 1.058% 11/20/2017 74.9 —75.0 — Fannie Mae Discount Notes 1.058% 11/21/2017 74.9 —30.0 — Fannie Mae Discount Notes 1.058% 11/22/2017 30.0 —20.0 — Fannie Mae Discount Notes 1.007% 11/24/2017 20.0 —25.0 — Fannie Mae Discount Notes 1.042% 12/20/2017 24.9 —40.0 — Fannie Mae Discount Notes 1.063% 1/11/2018 40.0 —30.0 — Fannie Mae Discount Notes 1.038% 1/22/2018 29.9 —46.2 — Fannie Mae Discount Notes 1.038% 1/23/2018 46.0 —35.1 — Fannie Mae Discount Notes 1.038% 1/24/2018 35.0 —
— 19.9 Farmer Mac Discount Notes 0.682% 6/1/2017 — 19.9— 15.5 Federal Farm Credit Bank Discount Notes 0.376% - 0.381% 2/22/2017 — 15.5— 34.7 Federal Home Loan Bank Discount Notes 0.304% - 0.355% 1/3/2017 — 34.7— 40.0 Federal Home Loan Bank Discount Notes 0.345% 1/4/2017 — 40.0— 29.2 Federal Home Loan Bank Discount Notes 0.355% - 0.447% 1/6/2017 — 29.2— 7.1 Federal Home Loan Bank Discount Notes 0.299% - 0.345% 1/9/2017 — 7.1— 25.0 Federal Home Loan Bank Discount Notes 0.325% 1/10/2017 — 25.0— 50.0 Federal Home Loan Bank Discount Notes 0.304% - 0.396% 1/11/2017 — 50.0— 33.0 Federal Home Loan Bank Discount Notes 0.365% - 0.396% 1/12/2017 — 33.0— 50.0 Federal Home Loan Bank Discount Notes 0.386% 1/13/2017 — 50.0— 36.0 Federal Home Loan Bank Discount Notes 0.345% 1/17/2017 — 36.0— 42.1 Federal Home Loan Bank Discount Notes 0.294% - 0.365% 1/18/2017 — 42.1

34
PrincipalIssuer Yield(4)
MaturityDate
Fair Value atSeptember 30,
2017December 31,
20162017 2016(Unaudited)
$ — $ 20.0 Federal Home Loan Bank Discount Notes 0.284% 1/20/2017 $ — $ 20.0— 50.0 Federal Home Loan Bank Discount Notes 0.335% 1/23/2017 — 50.0— 47.0 Federal Home Loan Bank Discount Notes 0.345% 1/24/2017 — 47.0— 34.8 Federal Home Loan Bank Discount Notes 0.304% - 0.360% 1/25/2017 — 34.8— 45.0 Federal Home Loan Bank Discount Notes 0.294% - 0.406% 1/27/2017 — 45.0— 25.0 Federal Home Loan Bank Discount Notes 0.416% 1/30/2017 — 25.0— 34.7 Federal Home Loan Bank Discount Notes 0.467% - 0.497% 2/1/2017 — 34.7— 42.0 Federal Home Loan Bank Discount Notes 0.406% 2/3/2017 — 42.0— 15.0 Federal Home Loan Bank Discount Notes 0.416% 2/7/2017 — 15.0— 10.2 Federal Home Loan Bank Discount Notes 0.376% 2/10/2017 — 10.2— 50.0 Federal Home Loan Bank Discount Notes 0.386% - 0.487% 2/17/2017 — 50.0— 30.0 Federal Home Loan Bank Discount Notes 0.365% 2/21/2017 — 30.0— 30.0 Federal Home Loan Bank Discount Notes 0.437% 2/22/2017 — 30.0— 50.0 Federal Home Loan Bank Discount Notes 0.396% 2/24/2017 — 50.0— 20.0 Federal Home Loan Bank Discount Notes 0.533% 2/27/2017 — 20.0— 10.1 Federal Home Loan Bank Discount Notes 0.518% 3/3/2017 — 10.1— 15.0 Federal Home Loan Bank Discount Notes 0.523% 3/6/2017 — 15.0— 30.0 Federal Home Loan Bank Discount Notes 0.538% 3/8/2017 — 30.0— 45.8 Federal Home Loan Bank Discount Notes 0.447% - 0.574% 3/10/2017 — 45.8— 20.0 Federal Home Loan Bank Discount Notes 0.543% 3/14/2017 — 20.0— 40.5 Federal Home Loan Bank Discount Notes 0.528% - 0.579% 3/17/2017 — 40.5— 49.9 Federal Home Loan Bank Discount Notes 0.538% 3/20/2017 — 49.9— 36.1 Federal Home Loan Bank Discount Notes 0.533% 3/22/2017 — 36.1— 28.0 Federal Home Loan Bank Discount Notes 0.427% - 0.518% 3/23/2017 — 28.0— 40.0 Federal Home Loan Bank Discount Notes 0.528% 3/24/2017 — 40.0— 25.0 Federal Home Loan Bank Discount Notes 0.548% 3/28/2017 — 25.0— 31.0 Federal Home Loan Bank Discount Notes 0.558% 3/29/2017 — 31.0— 6.4 Federal Home Loan Bank Discount Notes 0.477% 3/31/2017 — 6.4— 49.9 Federal Home Loan Bank Discount Notes 0.559% 4/17/2017 — 49.9— 26.0 Federal Home Loan Bank Discount Notes 0.548% - 0.605% 4/19/2017 — 26.0— 20.1 Federal Home Loan Bank Discount Notes 0.488% 4/28/2017 — 20.1— 25.0 Federal Home Loan Bank Discount Notes 0.538% - 0.600% 5/5/2017 — 25.0— 37.2 Federal Home Loan Bank Discount Notes 0.558% - 0.641% 5/12/2017 — 37.2
27.1 — Federal Home Loan Bank Discount Notes 1.015% 10/5/2017 27.1 —30.8 — Federal Home Loan Bank Discount Notes 0.968% 10/6/2017 30.8 —40.1 — Federal Home Loan Bank Discount Notes 1.020% - 1.053% 10/10/2017 40.1 —4.0 — Federal Home Loan Bank Discount Notes 1.049% 10/13/2017 4.0 —
88.3 — Federal Home Loan Bank Discount Notes 1.020% - 1.025% 10/16/2017 88.3 —44.2 — Federal Home Loan Bank Discount Notes 1.063% 10/18/2017 44.1 —39.6 — Federal Home Loan Bank Discount Notes 1.008% - 1.039% 10/20/2017 39.6 —30.1 — Federal Home Loan Bank Discount Notes 1.031% - 1.049% 10/23/2017 30.0 —42.2 — Federal Home Loan Bank Discount Notes 1.013% 10/24/2017 42.1 —23.2 — Federal Home Loan Bank Discount Notes 1.036% - 1.048% 10/25/2017 23.2 —10.2 — Federal Home Loan Bank Discount Notes 1.041% 10/27/2017 10.1 —37.1 — Federal Home Loan Bank Discount Notes 1.048% 10/30/2017 37.1 —34.5 — Federal Home Loan Bank Discount Notes 1.019% - 1.041% 11/1/2017 34.4 —43.2 — Federal Home Loan Bank Discount Notes 1.048% 11/2/2017 43.1 —50.0 — Federal Home Loan Bank Discount Notes 1.024% - 1.031% 11/3/2017 50.0 —

35
PrincipalIssuer Yield(4)
MaturityDate
Fair Value atSeptember 30,
2017December 31,
20162017 2016(Unaudited)
$ 58.2 $ — Federal Home Loan Bank Discount Notes 1.031% - 1.048% 11/7/2017 $ 58.1 $ —50.0 — Federal Home Loan Bank Discount Notes 1.031% - 1.069% 11/8/2017 49.9 —61.0 — Federal Home Loan Bank Discount Notes 1.030% - 1.068% 11/9/2017 60.9 —33.6 — Federal Home Loan Bank Discount Notes 1.079% 11/10/2017 33.6 —42.3 — Federal Home Loan Bank Discount Notes 1.032% - 1.079% 11/13/2017 42.3 —51.9 — Federal Home Loan Bank Discount Notes 1.068% - 1.079% 11/14/2017 51.9 —43.4 — Federal Home Loan Bank Discount Notes 1.068% - 1.109% 11/15/2017 43.4 —40.0 — Federal Home Loan Bank Discount Notes 1.068% 11/16/2017 40.0 —66.4 — Federal Home Loan Bank Discount Notes 1.068% - 1.069% 11/17/2017 66.3 —15.2 — Federal Home Loan Bank Discount Notes 1.069% 11/27/2017 15.2 —40.0 — Federal Home Loan Bank Discount Notes 1.110% 11/28/2017 39.9 —30.0 — Federal Home Loan Bank Discount Notes 1.068% 11/29/2017 30.0 —36.9 — Federal Home Loan Bank Discount Notes 1.047% - 1.069% 12/1/2017 36.9 —40.0 — Federal Home Loan Bank Discount Notes 1.110% 12/5/2017 39.9 —20.3 — Federal Home Loan Bank Discount Notes 1.110% 12/6/2017 20.2 —40.0 — Federal Home Loan Bank Discount Notes 1.100% 12/8/2017 39.9 —20.0 — Federal Home Loan Bank Discount Notes 1.068% 12/11/2017 20.0 —40.0 — Federal Home Loan Bank Discount Notes 1.079% 12/12/2017 39.9 —44.3 — Federal Home Loan Bank Discount Notes 1.067% - 1.074% 12/15/2017 44.2 —15.2 — Federal Home Loan Bank Discount Notes 1.079% 12/18/2017 15.1 —25.1 — Federal Home Loan Bank Discount Notes 1.079% 12/19/2017 25.0 —28.5 — Federal Home Loan Bank Discount Notes 1.058% - 1.074% 12/20/2017 28.4 —30.0 — Federal Home Loan Bank Discount Notes 1.074% 12/22/2017 29.9 —30.0 — Federal Home Loan Bank Discount Notes 1.069% 12/26/2017 29.9 —30.0 — Federal Home Loan Bank Discount Notes 1.069% 12/27/2017 29.9 —25.0 — Federal Home Loan Bank Discount Notes 1.069% 12/29/2017 24.9 —20.2 — Federal Home Loan Bank Discount Notes 1.069% 1/2/2018 20.1 —40.0 — Federal Home Loan Bank Discount Notes 1.079% 1/3/2018 39.9 —40.0 — Federal Home Loan Bank Discount Notes 1.068% 1/5/2018 39.9 —40.0 — Federal Home Loan Bank Discount Notes 1.068% 1/8/2018 39.9 —33.0 — Federal Home Loan Bank Discount Notes 1.058% 1/9/2018 32.9 —20.0 — Federal Home Loan Bank Discount Notes 1.068% 1/10/2018 19.9 —10.0 — Federal Home Loan Bank Discount Notes 1.089% 1/12/2018 10.0 —38.1 — Federal Home Loan Bank Discount Notes 1.068% 1/16/2018 38.0 —30.0 — Federal Home Loan Bank Discount Notes 1.094% 1/17/2018 29.9 —30.2 — Federal Home Loan Bank Discount Notes 1.063% 1/19/2018 30.1 —38.0 — Federal Home Loan Bank Discount Notes 1.063% 1/25/2018 37.8 —36.1 — Federal Home Loan Bank Discount Notes 1.063% 1/26/2018 36.0 —19.2 — Federal Home Loan Bank Discount Notes 1.069% 1/29/2018 19.1 —37.1 — Federal Home Loan Bank Discount Notes 1.069% 2/9/2018 37.0 —2.2 — Federal Home Loan Bank Discount Notes 1.161% 3/2/2018 2.1 —— 16.1 Freddie Mac Discount Notes 0.345% 1/9/2017 — 16.1— 25.0 Freddie Mac Discount Notes 0.335% 1/10/2017 — 25.0— 30.0 Freddie Mac Discount Notes 0.391% 1/20/2017 — 30.0— 13.1 Freddie Mac Discount Notes 0.426% 1/30/2017 — 13.1— 40.0 Freddie Mac Discount Notes 0.447% 2/6/2017 — 40.0— 36.9 Freddie Mac Discount Notes 0.436% - 0.457% 2/7/2017 — 36.9— 44.2 Freddie Mac Discount Notes 0.360% 2/8/2017 — 44.2
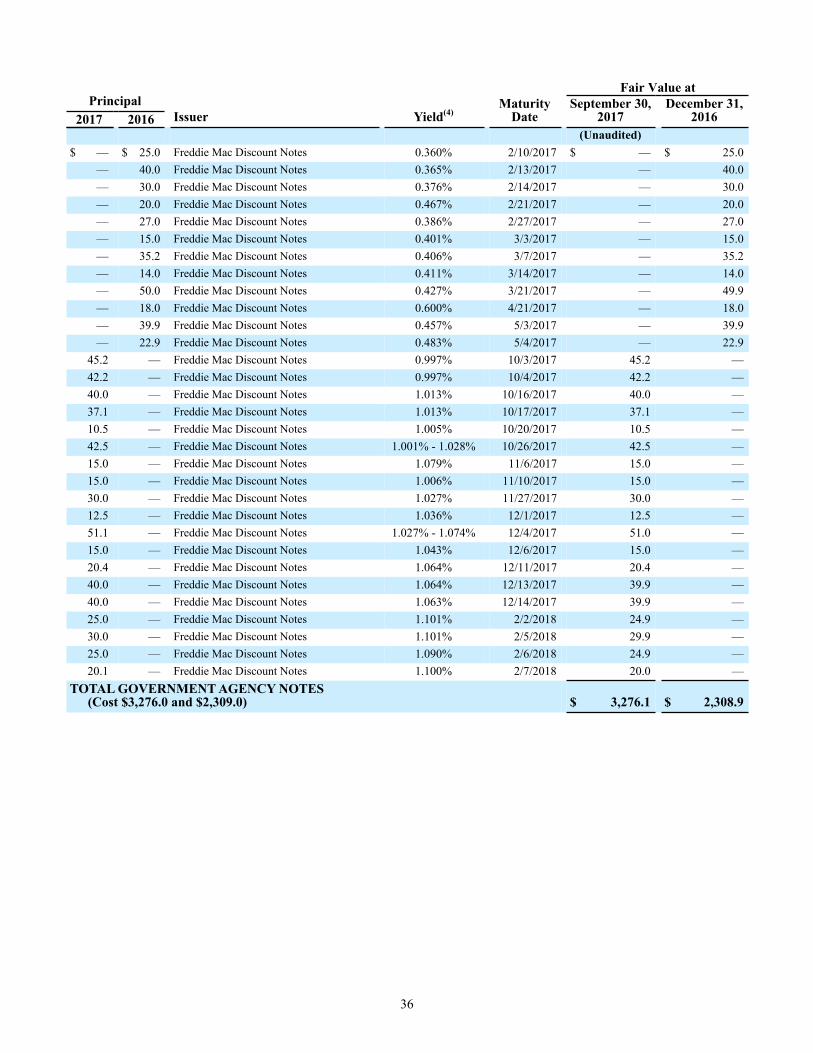
36
PrincipalIssuer Yield(4)
MaturityDate
Fair Value atSeptember 30,
2017December 31,
20162017 2016(Unaudited)
$ — $ 25.0 Freddie Mac Discount Notes 0.360% 2/10/2017 $ — $ 25.0— 40.0 Freddie Mac Discount Notes 0.365% 2/13/2017 — 40.0— 30.0 Freddie Mac Discount Notes 0.376% 2/14/2017 — 30.0— 20.0 Freddie Mac Discount Notes 0.467% 2/21/2017 — 20.0— 27.0 Freddie Mac Discount Notes 0.386% 2/27/2017 — 27.0— 15.0 Freddie Mac Discount Notes 0.401% 3/3/2017 — 15.0— 35.2 Freddie Mac Discount Notes 0.406% 3/7/2017 — 35.2— 14.0 Freddie Mac Discount Notes 0.411% 3/14/2017 — 14.0— 50.0 Freddie Mac Discount Notes 0.427% 3/21/2017 — 49.9— 18.0 Freddie Mac Discount Notes 0.600% 4/21/2017 — 18.0— 39.9 Freddie Mac Discount Notes 0.457% 5/3/2017 — 39.9— 22.9 Freddie Mac Discount Notes 0.483% 5/4/2017 — 22.9
45.2 — Freddie Mac Discount Notes 0.997% 10/3/2017 45.2 —42.2 — Freddie Mac Discount Notes 0.997% 10/4/2017 42.2 —40.0 — Freddie Mac Discount Notes 1.013% 10/16/2017 40.0 —37.1 — Freddie Mac Discount Notes 1.013% 10/17/2017 37.1 —10.5 — Freddie Mac Discount Notes 1.005% 10/20/2017 10.5 —42.5 — Freddie Mac Discount Notes 1.001% - 1.028% 10/26/2017 42.5 —15.0 — Freddie Mac Discount Notes 1.079% 11/6/2017 15.0 —15.0 — Freddie Mac Discount Notes 1.006% 11/10/2017 15.0 —30.0 — Freddie Mac Discount Notes 1.027% 11/27/2017 30.0 —12.5 — Freddie Mac Discount Notes 1.036% 12/1/2017 12.5 —51.1 — Freddie Mac Discount Notes 1.027% - 1.074% 12/4/2017 51.0 —15.0 — Freddie Mac Discount Notes 1.043% 12/6/2017 15.0 —20.4 — Freddie Mac Discount Notes 1.064% 12/11/2017 20.4 —40.0 — Freddie Mac Discount Notes 1.064% 12/13/2017 39.9 —40.0 — Freddie Mac Discount Notes 1.063% 12/14/2017 39.9 —25.0 — Freddie Mac Discount Notes 1.101% 2/2/2018 24.9 —30.0 — Freddie Mac Discount Notes 1.101% 2/5/2018 29.9 —25.0 — Freddie Mac Discount Notes 1.090% 2/6/2018 24.9 —20.1 — Freddie Mac Discount Notes 1.100% 2/7/2018 20.0 —
TOTAL GOVERNMENT AGENCY NOTES(Cost $3,276.0 and $2,309.0) $ 3,276.1 $ 2,308.9

37
UNITED STATES TREASURY SECURITIES—3.7% and 6.5%
PrincipalIssuer Yield(4)
MaturityDate
Fair Value at
September 30,2017
December 31,20162017 2016
(Unaudited)$ — $ 35.9 United States Treasury Bills 0.345% - 0.369% 1/5/2017 $ — $ 35.9
— 47.9 United States Treasury Bills 0.423% - 0.428% 1/19/2017 — 48.0— 36.1 United States Treasury Bills 0.371% - 0.401% 1/26/2017 — 36.1— 60.1 United States Treasury Bills 0.363% - 0.423% 2/2/2017 — 60.1— 75.0 United States Treasury Bills 0.315% - 0.426% 2/9/2017 — 75.0— 48.0 United States Treasury Bills 0.325% - 0.437% 2/16/2017 — 48.0— 48.0 United States Treasury Bills 0.448% - 0.473% 2/23/2017 — 48.0— 36.0 United States Treasury Bills 0.368% - 0.477% 3/2/2017 — 36.0— 48.7 United States Treasury Bills 0.386% - 0.518% 3/9/2017 — 48.7— 59.9 United States Treasury Bills 0.406% - 0.481% 3/16/2017 — 60.0— 129.0 United States Treasury Bills 0.380% - 0.533% 3/23/2017 — 129.0— 25.9 United States Treasury Bills 0.396% - 0.518% 3/30/2017 — 25.9— 58.9 United States Treasury Bills 0.411% - 0.509% 4/6/2017 — 58.9— 130.8 United States Treasury Bills 0.518% - 0.529% 4/13/2017 — 130.8— 49.9 United States Treasury Bills 0.514% - 0.559% 4/20/2017 — 49.9— 48.2 United States Treasury Bills 0.554% - 0.781% 4/27/2017 — 48.2— 49.9 United States Treasury Bills 0.514% 5/4/2017 — 49.9— 42.0 United States Treasury Bills 0.601% - 0.623% 5/11/2017 — 42.0— 30.1 United States Treasury Bills 0.584% - 0.620% 5/18/2017 — 30.1— 32.0 United States Treasury Bills 0.587% 6/8/2017 — 32.0— 74.8 United States Treasury Bills 0.541% - 0.654% 7/20/2017 — 74.7— 86.7 United States Treasury Bills 0.574% - 0.591% 8/17/2017 — 86.6— 34.8 United States Treasury Bills 0.696% - 0.934% 9/14/2017 — 34.8
30.0 — United States Treasury Bills 0.943% 10/5/2017 30.0 —0.8 — United States Treasury Bills 0.956% 10/12/2017 0.8 —
20.0 — United States Treasury Bills 1.017% 11/24/2017 20.0 —50.0 — United States Treasury Bills 0.998% 11/30/2017 49.9 —49.0 — United States Treasury Bills 0.768% 12/7/2017 48.9 —50.0 — United States Treasury Bills 1.090% 12/21/2017 49.9 —97.0 — United States Treasury Bills 1.099% - 1.100% 12/28/2017 96.7 —50.0 — United States Treasury Bills 1.084% 1/4/2018 49.9 —40.0 — United States Treasury Bills 1.114% 1/18/2018 39.9 —71.0 — United States Treasury Bills 1.132% 1/25/2018 70.8 —36.0 — United States Treasury Bills 1.106% 2/1/2018 35.9 —93.0 — United States Treasury Bills 1.075% - 1.077% 2/8/2018 92.6 —98.0 — United States Treasury Bills 1.106% - 1.122% 2/22/2018 97.6 —81.0 — United States Treasury Bills 1.060% - 1.117% 3/1/2018 80.6 —
— 69.9 United States Treasury Notes 0.431% - 0.451% 1/31/2017 — 69.9— 46.9 United States Treasury Notes 0.441% - 0.471% 2/15/2017 — 47.0— 49.7 United States Treasury Notes 0.502% 2/28/2017 — 49.7— 50.0 United States Treasury Notes 0.542% 3/15/2017 — 50.0— 50.0 United States Treasury Notes 0.515% 3/31/2017 — 50.0— 69.6 United States Treasury Notes 0.550% - 0.621% 5/31/2017 — 69.6— 40.1 United States Treasury Notes 0.580% 6/15/2017 — 40.1— 50.0 United States Treasury Notes 0.586% 6/30/2017 — 50.0— 30.0 United States Treasury Notes 0.668% - 0.710% 7/31/2017 — 30.0
50.0 — United States Treasury Notes 0.768% 10/31/2017 50.0 —

38
PrincipalIssuer Yield(4)
MaturityDate
Fair Value at
September 30,2017
December 31,20162017 2016
(Unaudited)$ 21.1 $ — United States Treasury Notes 0.812% - 0.935% 11/30/2017 $ 21.0 $ —
5.0 — United States Treasury Notes 0.997% 12/15/2017 5.0 —50.0 — United States Treasury Notes 1.148% - 1.180% 1/31/2018 49.9 —40.0 — United States Treasury Notes 1.175% - 1.184% 2/15/2018 40.0 —48.0 — United States Treasury Notes 1.200% 2/28/2018 47.9 —40.0 — United States Treasury Notes 1.179% 3/15/2018 40.0 —
TOTAL UNITED STATES TREASURY SECURITIES(Cost $1,017.3 and $1,745.0) $ 1,017.3 $ 1,744.9
TOTAL OTHER MARKETABLE SECURITIES(Cost $4,293.3 and $4,054.0) $ 4,293.4 $ 4,053.8
TOTAL MARKETABLE SECURITIES(Cost $5,182.8 and $4,937.9) $ 5,414.4 $ 5,135.3
LOANS RECEIVABLE—1.1% and 1.1% Fair Value at
Borrower Interest Rate(7)Maturity
DateSeptember 30,
2017December 31,
2016(Unaudited)
DJM Capital Partners(8) 4.200% 7/1/2018 $ 34.0 $ 32.3Simply Self Storage Portfolio 8.250% 9/6/2021 37.6 37.6State Street Financial Center JuniorMezz 6.500% 11/10/2021 125.2 125.2Charles River Plaza North 6.080% 4/6/2029 102.0 100.6
TOTAL LOANS RECEIVABLE(Cost $296.5 and $294.8) $ 298.8 $ 295.7
TOTAL INVESTMENTS(Cost $22,964.2 and $22,581.2) $ 27,183.5 $ 26,643.7
(1) The investment has a mortgage loan payable outstanding, as indicated in Note 6.(2) The fair value reflects the Account’s interest in the joint venture and is net of debt.(3) Properties within this investment are located throughout the United States.(4) Yield represents the annualized yield.(5) The assets held in this investment were liquidated on February 18, 2015.(6) A partial disposition of assets held by the portfolio was completed on February 1, 2017.(7) Represents fixed interest rate.(8) This loan has the option to increase the principal balance up to $35.0 million and includes a one year extension option at a 5.0% annual
interest-only rate.(9) All or a portion of these securities are out on loan. The aggregate value of securities on loan is $5.5 million as of September 30, 2017. (10) The assets held in this investment were in liquidation as of May 2014, with final dissolution in 2017.(11) A partial disposition of assets held by the portfolio was completed on August 17, 2017.

39
ITEM 2. MANAGEMENT’S DISCUSSION AND ANALYSIS OF FINANCIAL CONDITION AND RESULTS OF OPERATIONS
The following discussion and analysis of the Account’s financial condition and results of operations should be read together with the consolidated financial statements and notes contained in this report and with consideration to the sub-section entitled “Forward-Looking Statements,” which begins below, and the section of the Account’s Annual Report on Form 10-K for the year ended December 31, 2016 (the “Form 10-K”) entitled “Item 1A. Risk Factors.” The past performance of the Account is not indicative of future results.
Forward-looking Statements
Some statements in this Form 10-Q which are not historical facts may be “forward-looking statements” within the meaning of Section 27A of the Securities Act of 1933, Section 21E of the Securities Exchange Act of 1934 and the Private Securities Litigation Reform Act of 1995. Forward-looking statements include statements about management’s expectations, beliefs, intentions or strategies for the future, include the assumptions and beliefs underlying these forward-looking statements, and are based on current expectations, estimates and projections about the real estate industry, domestic and global economic conditions, including conditions in the credit and capital markets, the sectors, and markets in which the Account invests and operates, and the transactions described in this Form 10-Q. While management believes the assumptions underlying any of its forward-looking statements and information to be reasonable, such information may be subject to uncertainties and may involve certain risks which may be difficult to predict and are beyond management’s control. These risks and uncertainties could cause actual results to differ materially from those contained in any forward-looking statement. These risks and uncertainties include, but are not limited to, the risks associated with the following:
• Acquiring and Owning Real Estate: The risks associated with acquiring and owning real property, including general economic and real estate market conditions, the availability of, and economic cost associated with, financing the Account’s properties, the risk that the Account’s properties become too concentrated (whether by geography, sector or by tenant mix), competition for acquiring real estate properties, leasing risk (including tenant defaults) and the risk of uninsured losses at properties (including due to terrorism, natural disasters, and acts of violence);
• Selling Real Estate: The risk that the sales price of a property might differ, perhaps significantly, from its estimated or appraised value, leading to losses or reduced profits to the Account, the risk that the Account might not be able to sell a property at a particular time for a price which management believes represents its fair or full value, the risk of a lack of availability of financing (for potential purchasers of the Account’s properties), risks associated with disruptions in the credit and capital markets, and the risk that the Account may be required to make significant expenditures before the Account is able to market and/or sell a property;
• Valuation: The risks associated with property valuations, including the fact that appraisals can be subjective in a number of respects and the fact that the Account’s appraisals are generally obtained on a quarterly basis and there may be periods in between appraisals of a property during which the value attributed to the property for purposes of the Account’s daily accumulation unit value may be more or less than the actual realizable value of the property;
• Borrowing: Risks associated with financing the Account’s properties, including the risk of default on loans secured by the Account’s properties (which could lead to foreclosure), the risk associated with high loan to value ratios on the Account’s properties (including the fact that the Account may have limited, or no net value in such a property), the risk that significant sums of cash could be required to make principal and interest payments on the loans and the risk that the Account may not have the ability to obtain financing or refinancing on favorable terms (or at all), which may be aggravated by general disruptions in credit and capital markets;
• Participant Transactions and Cash Management: Investment risk associated with participant transactions, in particular that (i) significant net participant transfers out of the Account may impair our ability to pursue or consummate new investment opportunities that are otherwise attractive to the Account and/ or may result in sales of real estate-related assets to generate liquidity, (ii) significant net participant transfers into the Account may result, on a temporary basis, in our cash holdings and/ or holdings in liquid real estate-related investments exceeding our long-term targeted holding levels
40
and (iii) high levels of cash in the Account during times of appreciating real estate values can impair the Account’s overall return;
• Joint Venture Investments: The risks associated with joint ventures organized as limited partnerships or limited liability companies, as applicable, including the risk that a co-venturer may have interests or goals inconsistent with those of the Account, that a co-venturer may have financial difficulties, and the risk that the Account may have limited rights with respect to operation of the property and transfer of the Account’s interest;
• Regulatory Matters: Uncertainties associated with environmental liability and regulations and other governmental regulatory matters such as zoning laws, rent control laws, and property taxes;
• Foreign Investments: The risks associated with purchasing, owning and disposing foreign investments (primarily real estate properties), including political risk, the risk associated with currency fluctuations (whether hedged or not), regulatory and taxation risks and risks of enforcing judgments;
• Conflicts of Interest: Conflicts of interest associated with TIAA serving as investment manager of the Account and provider of the liquidity guarantee at the same time as TIAA and its affiliates are serving as an investment manager to other real estate accounts or funds, including conflicts associated with satisfying its fiduciary duties to all such accounts and funds associated with purchasing, selling and leasing of properties;
• Required Property Sales: The risk that, if TIAA were to own too large a percentage of the Account’s accumulation units through funding the liquidity guarantee (as determined by the independent fiduciary), the independent fiduciary could require the sales of properties to reduce TIAA’s ownership interest, which sales could occur at times and at prices that depress the sale proceeds to the Account;
• Government and Government Agency Securities: Risks associated with investment securities issued by U.S. government agencies and U.S. government-sponsored entities, including the risk that the issuer may not have their securities backed by the full faith and credit of the U.S. government, and that transaction activity may fluctuate significantly from time to time, which could negatively impact the value of the securities and the Account’s ability to dispose of a security at a favorable time; and
• Liquid Assets and Securities: Risks associated with investments in real estate-related liquid assets (which could include, from time to time, registered or unregistered real estate investment trust (“REIT”) securities and commercial mortgage-backed securities (“CMBS”)), and non-real estate-related liquid assets, including:
• Financial/credit risk—Risks that the issuer will not be able to pay principal and interest when due or that the issuer’s earnings will fall;
• Market volatility risk—Risk that the changing conditions in financial markets may cause the Account’s investments to experience price volatility;
• Interest rate volatility risk—Risk that interest rate volatility may affect the Account’s current income from an investment; and
• Deposit/money market risk—Risks that the Account could experience losses if banks fail.
More detailed discussions of certain of these risk factors are contained in the section of the Form 10-K entitled “Item 1A. Risk Factors” and in this section below and also in the section below entitled “Quantitative and Qualitative Disclosures About Market Risk.” These risks could cause actual results to differ materially from historical experience or management’s present expectations.
Caution should be taken not to place undue reliance on management’s forward-looking statements, which represent management’s views only as of the date that this report is filed. Neither management nor the Account undertake any obligation to update publicly or revise any forward-looking statement, whether as a result of new information, changed assumptions, future events or otherwise.
Commercial real estate market statistics discussed in this section are obtained by the Account from sources that management considers reliable, but some of the data are preliminary for the period ended September 30, 2017 and may be subsequently revised. Prior period data may have been adjusted to reflect updated calculations. Investors should not rely exclusively on the data presented below in forming a judgment regarding the current or prospective performance of the commercial real estate market generally.

41
ABOUT THE TIAA REAL ESTATE ACCOUNT
The Account was established in February 1995 as an insurance separate account of TIAA and interests in the Account were first offered to eligible participants on October 2, 1995. The Account offers individual and group accumulating annuity contracts (with contributions made on a pre-tax or after-tax basis), as well as individual lifetime and term-certain variable payout annuity contracts (including the payment of death benefits to beneficiaries). Investors are entitled to transfer funds to or from the Account under certain circumstances. Funds invested in the Account for each category of contract are expressed in terms of units, and unit values will fluctuate depending on the Account’s performance.
Investment Objective and Strategy
The Account seeks favorable long-term returns primarily through rental income and appreciation of real estate and real estate investments owned by the Account. The Account will also invest in non-real estate-related publicly traded securities and short-term higher quality liquid investments that are easily converted to cash to enable the Account to meet participant redemption requests, purchase or improve properties, or cover other expense needs.
Real Estate-Related Investments. The Account intends to have between 75% and 85% of its net assets invested directly in real estate or real estate-related investments with the goal of producing favorable long-term returns primarily through rental income and appreciation. These investments may consist of:
• Direct ownership interests in real estate;• Direct ownership of real estate through interests in joint ventures; or• Indirect interests in real estate through real estate-related securities, such as:
• public and/or privately placed registered and unregistered equity investments in REITs, which investments may consist of common or preferred stock interests;
• real estate limited partnerships and limited liability companies;• investments in equity or debt securities of companies whose operations involve real estate (i.e., that primarily
own or manage real estate) which may not be REITs; and• conventional commercial mortgage loans, participating mortgage loans, secured mezzanine loans and
collateralized mortgage obligations, including CMBS and other similar investments.
The Account’s principal investment strategy is to purchase direct ownership interests in income-producing real estate, primarily office, industrial, retail and multi-family residential properties. The Account is targeted to hold between 65% and 80% of the Account’s net assets in such direct ownership interests at any time. Historically, approximately 70% of the Account’s net assets have been comprised of such direct ownership interests in real estate.
In addition, while the Account is authorized to hold up to 25% of its net assets in liquid real estate-related securities, such as REITs and CMBS, management intends that the Account will not hold more than 10% of its net assets in such securities on a long-term basis. Traditionally, less than 10% of the Account’s net assets have been comprised of interests in these securities; although, the Account has recently held approximately 10% of its net assets in equity REIT securities at times. In addition, under the Account’s current investment guidelines, the Account is authorized to hold up to 10% of its net assets in CMBS. As of September 30, 2017, REIT securities comprised approximately 4.5% of the Account’s net assets, and the Account held no CMBS as of such date.
Non-Real Estate-Related Investments. The Account will invest the remaining portion of its assets (targeted to be between 15% and 25% of its net assets) in publicly traded, liquid investments; namely:
• Short-term government-related instruments, including U.S. Treasury bills;• Long-term government-related instruments, such as securities issued by U.S. government agencies or U.S.
government sponsored entities;• Short-term non-government-related instruments, such as money market instruments and commercial paper;• Long-term non-government-related instruments, such as corporate debt securities; and• Stock of companies that do not primarily own or manage real estate.

42
However, from time to time, the Account’s non-real estate-related liquid investments may comprise less than 15% (and possibly less than 10%) of its assets (on a net basis and/or a gross basis), especially during and immediately following periods of significant net participant outflows, in particular due to significant participant transfer activity. In addition, the Account, from time to time and on a temporary basis, may hold in excess of 25% of its net assets in non-real estate-related liquid investments, particularly during times of significant inflows into the Account and/or a lack of attractive real estate-related investments available in the market.
Liquid Securities. Primarily due to management’s need to manage fluctuations in cash flows, in particular during and immediately following periods of significant participant net transfer activity into or out of the Account, the Account may, on a temporary basis (i) exceed the upper end of its targeted holdings (currently 35% of the Account’s net assets) in liquid securities of all types, including both publicly traded non-real estate-related liquid investments and liquid real estate-related securities, such as REITs and CMBS, or (ii) be below the low end of its targeted holdings in such liquid securities (currently 15% of the Account’s net assets).
The portion of the Account’s net assets invested in liquid investments of all types may exceed the upper end of its target, for example, if (i) the Account receives a large inflow of money in a short period of time, in particular due to significant participant transfer activity into the Account, (ii) the Account receives significant proceeds from sales or financings of direct real estate assets, (iii) there is a lack of attractive direct real estate investments available on the market, and/or (iv) the Account anticipates more near-term cash needs, including to apply to acquire direct real estate investments, pay expenses or repay indebtedness.
Foreign Investments. The Account from time to time will also make foreign real estate investments. Under the Account’s investment guidelines, investments in direct foreign real estate, together with foreign real estate-related securities and foreign non-real estate-related liquid investments, may not comprise more than 25% of the Account’s net assets. As of September 30, 2017, the Account did not hold any foreign real estate investments.

43
THIRD QUARTER 2017 U.S. ECONOMIC AND COMMERCIAL REAL ESTATE OVERVIEW
The Account invests primarily in high-quality, core real estate in order to meet its investment objective of obtaining favorable long-term returns through rental income and the appreciation of its real estate holdings.
Economic Overview and Outlook
Key U.S. economic indicators and their near-term outlook are summarized in the table below. According to the “advance estimate” from the Bureau of Economic Analysis, U.S. Gross Domestic Product (“GDP”) increased at a 3.0% annual rate during third quarter as compared to 3.1% during the second quarter. Inventory accumulation, trade, and consumer spending contributed to growth, although the pace of spending moderated. Several major hurricanes made landfall in the U.S. during the quarter, causing significant damage. The overall impact on third quarter GDP was not quantified, but the hurricanes likely caused some disruption to economic production in several states. The storms ended an 83 month streak of job gains when employment fell by 33,000 jobs in September, most of which was concentrated in the leisure and hospitality sector. As a result, the Bureau of Labor Statistics reported that the pace of job growth moderated during the third quarter when 274,000 jobs were added as compared to 562,000 during second quarter. The unemployment rate decreased to end the third quarter at 4.2%.
Economic Indicators*
2016 1Q 2017 2Q 2017 3Q 2017Forecast
2017 2018Economy(1)
Gross Domestic Product ("GDP") 1.5% 1.2% 3.1% 3.0% 2.2% 2.4%Employment Growth (Thousands) 2,240 498 562 274 2,100 1,800Unemployment Rate 4.9% 4.5% 4.4% 4.2% 4.4% 4.1%Interest Rates(2)
10 Year Treasury 1.8% 2.4% 2.3% 2.2% 2.3% 2.8%Sources: Blue Chip Economic Indicators, Blue Chip Financial Forecasts, BEA, Bureau of Labor Statistics, Federal Reserve and Moody’s Analytics
* Data subject to revision(1) GDP growth rates are annual rates. Quarterly unemployment rates are the reported value for the final month of the quarter while annual
values represent a twelve-month average.(2) Treasury rates are an average over the stated period.
The Federal Open Market Committee (“FOMC”) voted in September to maintain the target range for the federal funds rate at 1.0% to 1.25% “in view of realized and expected labor market conditions and inflation”, as indicated in the September meeting minutes. The committee expects that economic conditions will continue to evolve in a manner that will warrant gradual rate increases. The FOMC is widely expected to raise the federal funds rate target range by 25 basis points at the December meeting.
Despite damage endured by recent hurricanes and related distortions in September’s economic data, the U.S. economy has demonstrated consistent momentum and GDP is expected to increase at above-trend rates through next year. Blue Chip economists expect GDP to increase at a 2.2% rate for all of 2017 and at a 2.4% rate in 2018. The loss of jobs in September was largely associated with business disruptions from recent hurricanes; and employment growth is expected to resume in the coming months. GDP and employment growth of this magnitude is supportive of ongoing improvement in commercial real estate market conditions.

44
Real Estate Market Conditions and Outlook
Commercial real estate conditions remained relatively steady during the third quarter of 2017. Tenant demand was generally strong enough to support modest vacancy rate improvements in the office and industrial sectors while apartment and retail market conditions softened. Transaction activity continued to weaken compared to 2016 levels. Real Capital Analytics (“RCA”) reported that sales of office, industrial, retail, and multi-family properties totaled $102.2 billion during third quarter 2017, a 5.1% decline from third quarter 2016. Property pricing as calculated by the Green Street Advisor Commercial Property Price Index (“CPPI”) increased 1.0% during the third quarter on a year-over-year basis. During 2017, property pricing has been essentially flat as modest increases in cap rates have largely offset income growth.
For the quarter ending September 30, 2017, the NCREIF Fund Index Open-End Diversified Core Equity (“NFI-ODCE”) Equal Weight total return, net of fees was 1.68%. The NFI-ODCE is a leveraged fund-level return index which includes property investments at ownership share, cash balances, and other investments. The Account's real estate assets generated a 1.51% total return during the third quarter of 2017. Total returns were positive for the 30th consecutive quarter, but at this stage in the cycle, income is the primary driver of returns.
Occupancy in the Account’s properties averaged 91.1% leased during the third quarter of 2017 as compared with 91.4% during second quarter. Data for the Account’s top five markets in terms of market value as of September 30, 2017 are provided below. These five markets represent nearly half of the Account’s total real estate portfolio.
Top 5 Metro Areas by Fair Market Value
Account % Leased Fair
Value Weighted*
Number of Property
Investments
Metro Area Fair Value as a % of
Total RE Portfolio**
Metro Area Fair Value as a % of
Total Investments
New York-Jersey City-White Plains, NY-NJ 93.3% 16 13.1% 10.3%Washington-Arlington-Alexandria, DC-VA-MD-WV 86.4% 13 11.4% 9.0%Los Angeles-Long Beach-Glendale, CA 86.5% 12 8.9% 7.0%Boston, MA 91.6% 5 7.1% 5.5%Seattle-Bellevue-Everett, WA 91.8% 6 5.8% 4.6%
* Weighted by fair value, which differs from the calculations provided for market comparisons to CBRE-EA data and are used here to reflect the fair value of the Account’s monetary investments in those markets.
** Wholly-owned properties are represented at fair value and gross of any debt, while joint venture properties are represented at the net equity value.
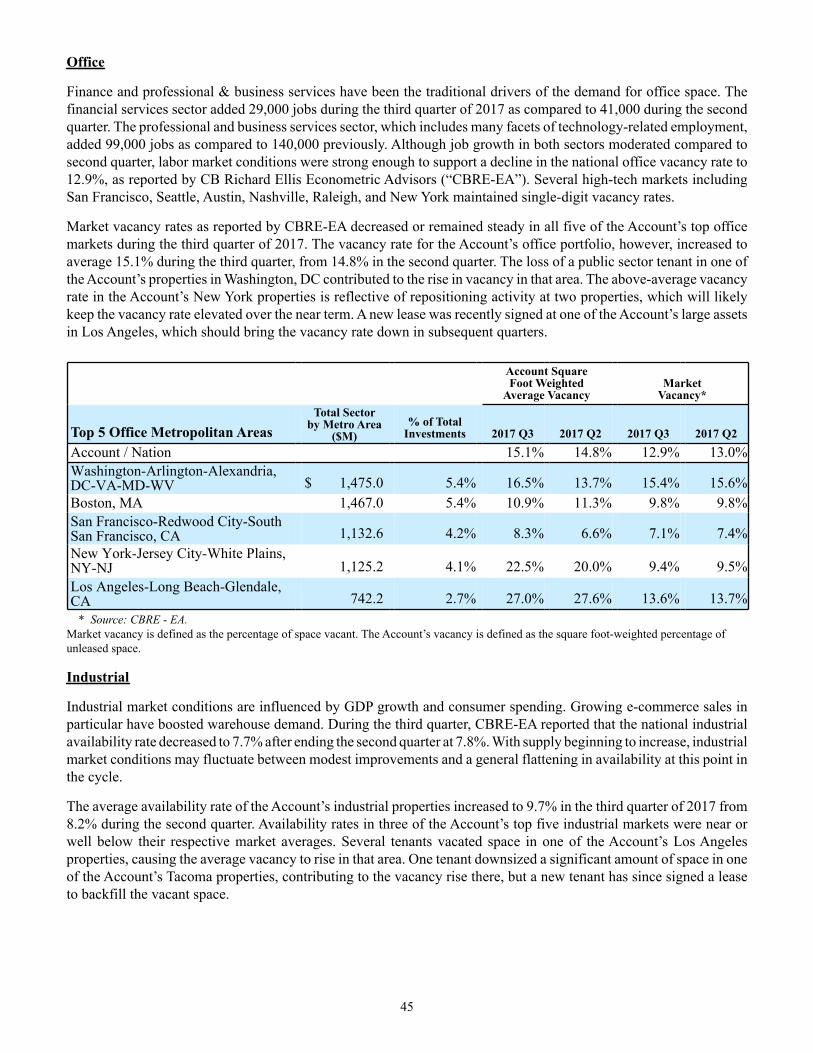
45
Office
Finance and professional & business services have been the traditional drivers of the demand for office space. The financial services sector added 29,000 jobs during the third quarter of 2017 as compared to 41,000 during the second quarter. The professional and business services sector, which includes many facets of technology-related employment, added 99,000 jobs as compared to 140,000 previously. Although job growth in both sectors moderated compared to second quarter, labor market conditions were strong enough to support a decline in the national office vacancy rate to 12.9%, as reported by CB Richard Ellis Econometric Advisors (“CBRE-EA”). Several high-tech markets including San Francisco, Seattle, Austin, Nashville, Raleigh, and New York maintained single-digit vacancy rates.
Market vacancy rates as reported by CBRE-EA decreased or remained steady in all five of the Account’s top office markets during the third quarter of 2017. The vacancy rate for the Account’s office portfolio, however, increased to average 15.1% during the third quarter, from 14.8% in the second quarter. The loss of a public sector tenant in one of the Account’s properties in Washington, DC contributed to the rise in vacancy in that area. The above-average vacancy rate in the Account’s New York properties is reflective of repositioning activity at two properties, which will likely keep the vacancy rate elevated over the near term. A new lease was recently signed at one of the Account’s large assets in Los Angeles, which should bring the vacancy rate down in subsequent quarters.
Account SquareFoot Weighted
Average VacancyMarket
Vacancy*
Top 5 Office Metropolitan AreasTotal Sector
by Metro Area($M)
% of TotalInvestments 2017 Q3 2017 Q2 2017 Q3 2017 Q2
Account / Nation 15.1% 14.8% 12.9% 13.0%Washington-Arlington-Alexandria,DC-VA-MD-WV $ 1,475.0 5.4% 16.5% 13.7% 15.4% 15.6%Boston, MA 1,467.0 5.4% 10.9% 11.3% 9.8% 9.8%San Francisco-Redwood City-SouthSan Francisco, CA 1,132.6 4.2% 8.3% 6.6% 7.1% 7.4%New York-Jersey City-White Plains,NY-NJ 1,125.2 4.1% 22.5% 20.0% 9.4% 9.5%Los Angeles-Long Beach-Glendale,CA 742.2 2.7% 27.0% 27.6% 13.6% 13.7%
* Source: CBRE - EA.Market vacancy is defined as the percentage of space vacant. The Account’s vacancy is defined as the square foot-weighted percentage of unleased space.
Industrial
Industrial market conditions are influenced by GDP growth and consumer spending. Growing e-commerce sales in particular have boosted warehouse demand. During the third quarter, CBRE-EA reported that the national industrial availability rate decreased to 7.7% after ending the second quarter at 7.8%. With supply beginning to increase, industrial market conditions may fluctuate between modest improvements and a general flattening in availability at this point in the cycle.
The average availability rate of the Account’s industrial properties increased to 9.7% in the third quarter of 2017 from 8.2% during the second quarter. Availability rates in three of the Account’s top five industrial markets were near or well below their respective market averages. Several tenants vacated space in one of the Account’s Los Angeles properties, causing the average vacancy to rise in that area. One tenant downsized a significant amount of space in one of the Account’s Tacoma properties, contributing to the vacancy rise there, but a new tenant has since signed a lease to backfill the vacant space.

46
Account SquareFoot Weighted
Average VacancyMarket
Vacancy*
Top 5 Industrial Metropolitan AreasTotal Sector
by Metro Area($M)
% of TotalInvestments 2017 Q3 2017 Q2 2017 Q3 2017 Q2
Account / Nation 9.7% 8.2% 7.7% 7.8%Riverside-San Bernardino-Ontario, CA $ 772.2 2.8% 0.0% 0.0% 6.2% 6.4%Los Angeles-Long Beach-Glendale, CA 320.1 1.2% 9.0% 5.1% 4.2% 3.9%New York-Jersey City-White Plains,NY-NJ 307.2 1.1% 2.4% 3.2% 7.2% 7.0%Tacoma-Lakewood, WA 295.2 1.1% 7.3% 4.1% 4.7% 4.7%Dallas-Plano-Irving, TX 263.9 1.0% 4.7% 6.1% 8.0% 8.1%
* Source: CBRE-EA.Market availability is the percentage of space available for rent. Account vacancy is the square foot-weighted percentage of unleased space.Note—CBRE-EA considers Tacoma part of the Seattle industrial market. Market vacancy rates reflect the Seattle-Tacoma total.
Multi-Family
Apartment demand is generated from a combination of economic and demographic forces including job growth, household formations, and changes in the U.S. homeownership rate. The national apartment vacancy rate increased to 4.6% during the third quarter of 2017 as compared to 4.5% during third quarter 2016. CBRE-EA is expecting market conditions to continue to soften as new supply is delivered to the market. Over the next year, the supply pipeline is expected to peak and market conditions should begin to stabilize.
The vacancy rate of the Account’s multi-family properties fell to 6.4% during the third quarter, as compared to 7.0% in the second quarter. As shown in the following table, average vacancy rates in the Account’s top five apartment markets are at or above their comparable market averages. Strong leasing activity at one of the Account’s properties in New York improved vacancy to market average. The delivery and lease-up of several new projects in the local sub-market impacted vacancy in the Account’s properties in Denver. The Account’s properties in Fort Lauderdale benefited from increased leasing activity during the end of the summer while the overall market experienced significant deliveries.
Account UnitsFoot Weighted
Average VacancyMarket
Vacancy*
Top 5 Apartment Metropolitan AreasTotal Sector
by Metro Area($M)
% of TotalInvestments 2017 Q3 2017 Q2 2017 Q3 2017 Q2
Account / Nation 6.4% 7.0% 4.6% 4.6%New York-Jersey City-White Plains,NY-NJ $ 863.1 3.2% 3.1% 4.8% 3.1% 3.2%Washington-Arlington-Alexandria, DC-VA-MD-WV 803.2 3.0% 8.2% 8.6% 4.7% 4.5%Los Angeles-Long Beach-Glendale, CA 558.9 2.1% 6.2% 5.9% 4.0% 3.9%Denver-Aurora-Lakewood, CO 327.9 1.2% 7.7% 5.3% 4.9% 5.2%Fort Lauderdale-Pompano Beach-Deerfield Beach, FL 295.9 1.1% 8.3% 12.3% 6.0% 5.6%
* Source: CBRE-EA.Market vacancy is the percentage of units vacant. The Account’s vacancy is the percentage of unleased units.
Retail
Preliminary data from the U.S. Census Bureau indicate that retail sales excluding motor vehicles and parts increased 1.0% from second to third quarter and 4.1% on a year-over-year basis in the third quarter. Retail market conditions have been challenged by rising online retail sales, bankruptcies and store closings, but national availability rates have generally held steady or modestly declined since 2011. However, CBRE-EA data indicates that the national retail availability rate increased to 10.2% in the third quarter from 10.1% in the second quarter. CBRE-EA noted that an

47
increasing trend could continue in the coming quarters. All of the Account’s retail investments have vacancy rates below 10.0%, which is reflective of the overall high quality of the retail portfolio.
Outlook
The real estate cycle is indeed mature; moderation of returns has occurred and is to be expected. Cycles do not end simply because of longevity, however. Imbalances in one or more segments of the economy are typically the cause, and none are currently evident. Property market conditions have generally remained stable. Regional conditions have varied depending on their economic drivers, but U.S. real estate markets on the whole are largely well-balanced.
Economists expect GDP growth of 2.2% in 2017 and 2.4% in 2018. Job growth is expected to moderate, but remain strong enough to bring the unemployment rate down further. Interest rates are expected to rise at a gradual pace throughout the rest of 2017 and 2018. The biggest risk to the US economy is exogenous. The geopolitical landscape has increased uncertainty. Expected cuts in U.S. personal and corporate tax rates appear increasingly unlikely to occur in 2017. Nonetheless, if domestic economic conditions approximate economist expectations, real estate market conditions should remain healthy into 2018.

48
INVESTMENTS
As of September 30, 2017, the Account had total net assets of $24.8 billion, a 2.2% increase from December 31, 2016. The increase in the Account’s net assets was primarily driven by net investment income and appreciation in value of the Account’s investments.
As of September 30, 2017, the Account owned a total of 134 real estate investments (109 of which were wholly-owned, 25 of which were held in joint ventures). The real estate portfolio included 38 office investments (including 12 held in joint ventures), 34 industrial investments (including one held in a joint venture), 39 apartment investments (including one held in a joint venture), 21 retail investments (including ten held in joint ventures), one 75% owned joint venture interest in a portfolio of storage facilities, and one leasehold interest encumbered by a ground lease. Of the real estate investments, 33 are subject to debt (including 13 joint venture investments).
The outstanding principal on mortgage loans payable on the Account’s wholly-owned real estate portfolio as of September 30, 2017 was $2.3 billion. The Account’s proportionate share of outstanding principal on mortgage loans payable within its joint venture investments was $2.2 billion, which is netted against the underlying properties when determining the joint venture investment’s fair value presented on the consolidated schedules of investments. When the mortgage loans payable within the joint venture investments are considered, total outstanding principal on the Account’s portfolio as of September 30, 2017 was $4.5 billion, which represented a loan to value ratio of 15.2%. The Account has no Account-level debt.
At September 30, 2017, the Account held 78.5% of its total investments in real estate and real estate joint ventures. The Account also held investments in government agency notes representing 12.1% of total investments, real estate-related equity securities representing 4.1% of total investments, U.S. Treasury securities representing 3.7% of total investments, loans receivable representing 1.1% of total investments, and real estate limited partnerships representing 0.5% of total investments.
Management believes that the Account’s real estate portfolio is diversified by location and property type. The Account’s largest investment, Fashion Show located in Las Vegas, NV, represented 3.9% of total real estate investments and 3.1%of total investments. As discussed in the Account’s prospectus, the Account does not intend to buy and sell its real estate investments simply to make short-term profits. Rather, the Account’s general strategy in selling real estate investments is to dispose of those assets that management believes (i) have maximized in value, (ii) have underperformed or face deteriorating property-specific or market conditions, (iii) need significant capital infusions in the future, (iv) are appropriate to dispose of in order to remain consistent with the Account’s intent to diversify the Account by property type and geographic location (including reallocating the Account’s exposure to or away from certain property types in certain geographic locations), or (v) otherwise do not satisfy the investment objectives of the Account. Management, from time to time, will evaluate the need to manage liquidity in the Account as part of its analysis as to whether to undertake a particular asset sale. The Account could reinvest any sale proceeds that it does not need to pay operating expenses or to meet debt service or redemption requests (e.g., participant withdrawals or benefit payments).

49
The following table lists the Account's ten largest investments as of September 30, 2017. For information regarding the Account's diversification of real estate assets by region and property type, see Note 3—Credit Risk Concentrations.
Ten Largest Real Estate Investments
Property Investment Name City State TypeFair Value
(in millions)(1)
Property as a% of TotalReal Estate
Portfolio
Property as a% of Total
InvestmentsFashion Show Las Vegas NV Retail $ 837.9 (2) 3.9% 3.1%1001 Pennsylvania Avenue Washington DC Office 810.0 (3) 3.8% 3.0%The Florida Mall Orlando FL Retail 754.8 (4) 3.5% 2.8%DDR Various USA Retail 615.8 (5) 2.9% 2.3%Fourth and Madison Seattle WA Office 527.0 (6) 2.5% 1.9%501 Boylston Street Boston MA Office 506.3 (7) 2.4% 1.9%99 High Street Boston MA Office 504.0 2.4% 1.9%425 Park Avenue New York NY Ground Lease 454.0 2.1% 1.7%780 Third Avenue New York NY Office 429.0 (8) 2.0% 1.6%Ontario Industrial Portfolio Ontario CA Industrial 397.4 1.9% 1.5%
(1) Fair Value as reported in the September 30, 2017 Consolidated Schedules of Investments. Investments owned 100% by the Account are reported based on fair value. Investments in joint ventures are reported at net equity value on a fair value basis, and are presented at the Account's ownership interest.
(2) Fashion Show is held in a joint venture with General Growth Properties, in which the Account holds 50% interest, and is presented net of debt. As of September 30, 2017, this debt had a fair value of $431.5 million.
(3) 1001 Pennsylvania Avenue is presented gross of debt. The value of the Account's interest less the fair value of leverage is $475.4 million.(4) The Florida Mall is held in a joint venture with Simon Property Group, L.P., in which the Account hold a 50% interest, and is presented
net of debt. As of September 30, 2017, this debt had a fair value of $175.6 million.(5) DDR Joint Venture, in which the Account holds an 85% interest, consists of 24 retail properties located in 11 states and is presented net of
debt. As of September 30, 2017, this debt had a fair value of $606.5 million.(6) Fourth and Madison is presented gross of debt. The value of the Account's interest less the fair value of leverage is $324.8 million.(7) 501 Boylston Street is presented gross of debt. The value of the Account's interest less the fair value of leverage is $292.5 million.(8) 780 Third Avenue is presented gross of debt. The value of the Account's interest less the fair value of leverage is $258.4 million.

50
Results of Operations
Nine months ended September 30, 2017 compared to nine months ended September 30, 2016
Net Investment Income
The following table shows the results of operations for the nine months ended September 30, 2017 and 2016 and the dollar and percentage changes for those periods (dollars in millions, unaudited).
For the Nine MonthsEnded September 30, Change
2017 2016 $ %INVESTMENT INCOMEReal estate income, net:
Rental income $ 791.6 $ 755.9 $ 35.7 4.7 %Real estate property level expenses:
Operating expenses 164.9 163.5 1.4 0.9 %Real estate taxes 127.3 116.9 10.4 8.9 %Interest expense 67.3 63.3 4.0 6.3 %
Total real estate property level expenses 359.5 343.7 15.8 4.6 %Real estate income, net 432.1 412.2 19.9 4.8 %
Income from real estate joint ventures and limitedpartnerships 154.3 111.8 42.5 38.0 %
Interest 37.6 17.8 19.8 N/MDividends 15.7 19.9 (4.2) (21.1)%
TOTAL INVESTMENT INCOME 639.7 561.7 78.0 13.9 %Expenses:
Investment management charges 52.9 51.8 1.1 2.1 %Administrative charges 46.0 48.4 (2.4) (5.0)%Distribution charges 19.6 21.3 (1.7) (8.0)%Mortality and expense risk charges 0.9 0.9 — — %Liquidity guarantee charges 34.5 28.1 6.4 22.8 %
TOTAL EXPENSES 153.9 150.5 3.4 2.3 %INVESTMENT INCOME, NET $ 485.8 $ 411.2 $ 74.6 18.1 %
Rental Income:
Rental income increased $35.7 million, or 4.7%, primarily due to net acquisitions coupled with increased occupancy in the retail and apartment sectors and reduced leasing incentives in the industrial and retail sectors.
Operating Expenses:
Operating expenses increased $1.4 million, or 0.9%, primarily due to net acquisitions.
Real Estate Taxes:
Real estate taxes increased $10.4 million, or 8.9%, primarily due to net real estate acquisitions coupled with higher property tax assessments resulting from increases in property values across the office and apartment sectors.
Interest Expense:
Interest expense increased $4.0 million, or 6.3%, due to higher average outstanding principal balances through the nine months ended September 30, 2017, as compared to the same period in 2016.

51
Income from Real Estate Joint Ventures and Limited Partnerships:
Income from real estate joint ventures and limited partnerships increased $42.5 million, or 38.0%, as a result of net acquisitions and higher distributions, primarily from a joint venture that holds a large retail property in Las Vegas, Nevada.
Interest and Dividend Income:
Interest income increased $19.8 million primarily due to interest income earned on a larger loan receivable portfolio in 2017 as compared to the same period in 2016. Dividend income decreased $4.2 million when compared to the same period in 2016 due to lower dividend yields on the Account's real-estate related securities.
Expenses:
Expense ratios, as a percentage of average net assets, for investment advisory, administrative and distribution charges were 0.48% and 0.52% for the nine month period ended September 30, 2017 and 2016, respectively. Costs decreasing slightly period over period, coupled with an increase in average net assets, reduced the overall expense ratio. These costs have fixed and variable components, the latter of which generally correspond to the level of the Account’s net assets under management and other cost drivers.
Mortality and expense risk and liquidity guarantee charges are contractual charges to the Account from TIAA for TIAA’s assumption of these risks and provision of the guarantee. The rates for these charges were established effective May 1, 2017, for the twelve month period ending April 30, 2018, and are charged based on the Account’s net assets.
Net Realized and Unrealized Gains and Losses on Investments and Mortgage Loans Payable
The following table shows the net realized and unrealized gains and losses on investments and mortgage loans payable for the nine months ended September 30, 2017 and 2016 and the dollar and percentage changes for those periods (dollars in millions, unaudited).
For the NineMonths EndedSeptember 30, Change
2017 2016 $ %NET REALIZED AND UNREALIZED GAIN (LOSS) ONINVESTMENTS AND MORTGAGE LOANS PAYABLE
Net realized gain (loss) on investments:Real estate properties $ 58.4 $ 26.5 $ 31.9 N/MReal estate joint ventures and limited partnerships (8.6) 0.4 (9.0) N/MMarketable securities 15.3 21.6 (6.3) (29.2)%
Total realized gain on investments: 65.1 48.5 16.6 34.2 %Net change in unrealized appreciation (depreciation) on:
Real estate properties 74.8 242.2 (167.4) (69.1)%Real estate joint ventures and limited partnerships 88.7 152.3 (63.6) (41.8)%Marketable securities 34.2 84.2 (50.0) (59.4)%Loans receivable 1.4 0.1 1.3 N/MMortgage loans payable (10.6) (54.8) 44.2 (80.7)%
Net change in unrealized appreciation on investments andmortgage loans payable 188.5 424.0 (235.5) (55.5)%
NET REALIZED AND UNREALIZED GAIN ON INVESTMENTSAND MORTGAGE LOANS PAYABLE $ 253.6 $ 472.5 $ (218.9) (46.3)%
N/M—Not meaningful

52
Real Estate Properties, Joint Ventures and Limited Partnerships:
Net realized gains in the Account are primarily attributed to the disposition of wholly-owned real estate properties. See the Recent Transactions section herein for additional disclosure regarding the sale of the Account’s real estate property investments.
Real Estate Properties:
Wholly-owned real estate investments experienced net realized and unrealized gains of $133.2 million during the first nine months of 2017 compared to $268.7 million during the comparable period of 2016. While the rate of appreciation has slowed in 2017, the Account continues to see appreciation across most of its sectors. Appreciation for the nine months ended September 30, 2017 was largely concentrated among the Account's industrial sector, especially in the Western region. Strong tenant demand for industrial space in California has been the primary driver of this appreciation.
Real Estate Joint Ventures and Limited Partnerships:
Real estate joint ventures and limited partnerships experienced net realized and unrealized gains of $80.1 million during the first nine months of 2017, compared to $152.7 million during the comparable period of 2016. While the rate of appreciation has slowed in 2017, the Account continues to see modest appreciation across most sectors of the Account's joint venture portfolio. The strongest appreciation for the nine months ended September 30, 2017 was among the Account's office investments in the Western region. Appreciation from joint venture regional malls in the Southern region was especially strong in 2016; the absence of this same appreciation in 2017 due to moderating market conditions was a significant driver of the overall decline from the prior year.
Marketable Securities:
The Account’s marketable securities experienced net realized and unrealized gains of $49.5 million during the first nine months of 2017 compared to $105.8 million during the comparable period of 2016. The markets for REITs in the U.S. increased 6.0% as measured by the FTSE NAREIT All Equity REITs Index during the nine month period ended September 30, 2017, compared to a increase of 12.3% in the same period of 2016. Appreciation on the Account's real estate related equity securities moved in line with the market movements. Additionally, as of September 30, 2017, the Account held $4.3 billion of investments in government agency notes and U.S. Treasury securities, which had nominal changes due to the short-term nature of these investments.
Mortgage Loans Payable:
Mortgage loans payable experienced unrealized losses of $10.6 million during the first nine months 2017 compared to unrealized losses of $54.8 million during the comparable period of 2016. The lower unrealized losses for the nine months ended September 30, 2017, were consistent with the directional movement of Treasury rates during the comparable period.

53
Results of Operations
Three months ended September 30, 2017 compared to three months ended September 30, 2016
Net Investment Income
The following table shows the results of operations for the three months ended September 30, 2017 and 2016 and the dollar and percentage changes for those periods (dollars in millions, unaudited).
For the Three MonthsEnded September 30, Change
2017 2016 $ %INVESTMENT INCOMEReal estate income, net:
Rental income $ 267.9 $ 257.4 $ 10.5 4.1 %Real estate property level expenses:
Operating expenses 56.9 54.8 2.1 3.8 %Real estate taxes 43.2 40.4 2.8 6.9 %Interest expense 22.5 22.4 0.1 0.4 %
Total real estate property level expenses 122.6 117.6 5.0 4.3 %Real estate income, net 145.3 139.8 5.5 3.9 %
Income from real estate joint ventures and limitedpartnerships 60.9 33.5 27.4 81.8 %
Interest 15.9 6.3 9.6 N/MDividends 7.9 9.2 (1.3) (14.1)%
TOTAL INVESTMENT INCOME 230.0 188.8 41.2 21.8 %Expenses:
Investment management charges 15.5 17.6 (2.1) (11.9)%Administrative charges 14.7 17.0 (2.3) (13.5)%Distribution charges 6.4 7.2 (0.8) (11.1)%Mortality and expense risk charges 0.3 0.3 — — %Liquidity guarantee charges 12.5 10.2 2.3 22.5 %
TOTAL EXPENSES 49.4 52.3 (2.9) (5.5)%INVESTMENT INCOME, NET $ 180.6 $ 136.5 $ 44.1 32.3 %
Rental Income:
Rental income increased $10.5 million, or 4.1%, primarily due to net real estate acquisitions.
Operating Expenses:
Operating expenses increased $2.1 million, or 3.8%, attributed mainly to net real estate acquisitions.
Real Estate Taxes:
Real estate taxes increased $2.8 million, or 6.9%, primarily due to net real estate acquisitions and rising tax value of properties in the portfolio.
Interest Expense:
Interest expense increased $0.1 million, or 0.4%, remaining relatively flat, due to minimal movement in average outstanding principal as compared to the comparable period of 2016.
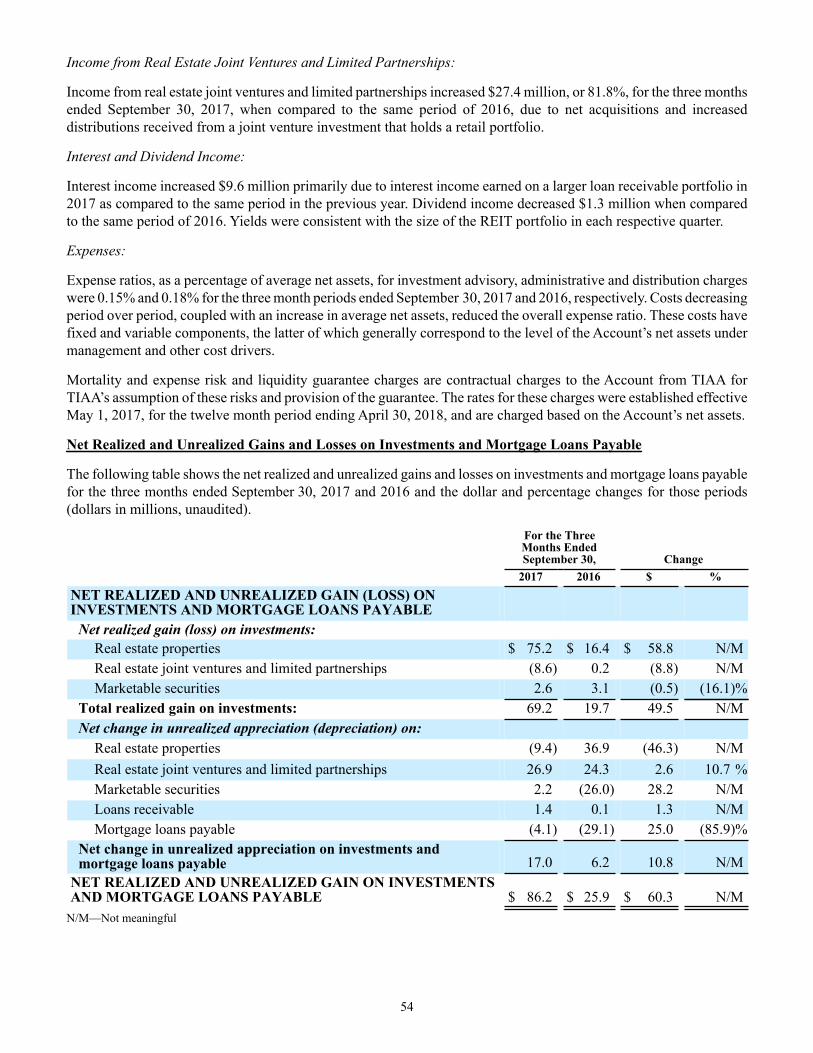
54
Income from Real Estate Joint Ventures and Limited Partnerships:
Income from real estate joint ventures and limited partnerships increased $27.4 million, or 81.8%, for the three months ended September 30, 2017, when compared to the same period of 2016, due to net acquisitions and increased distributions received from a joint venture investment that holds a retail portfolio.
Interest and Dividend Income:
Interest income increased $9.6 million primarily due to interest income earned on a larger loan receivable portfolio in 2017 as compared to the same period in the previous year. Dividend income decreased $1.3 million when compared to the same period of 2016. Yields were consistent with the size of the REIT portfolio in each respective quarter.
Expenses:
Expense ratios, as a percentage of average net assets, for investment advisory, administrative and distribution charges were 0.15% and 0.18% for the three month periods ended September 30, 2017 and 2016, respectively. Costs decreasing period over period, coupled with an increase in average net assets, reduced the overall expense ratio. These costs have fixed and variable components, the latter of which generally correspond to the level of the Account’s net assets under management and other cost drivers.
Mortality and expense risk and liquidity guarantee charges are contractual charges to the Account from TIAA for TIAA’s assumption of these risks and provision of the guarantee. The rates for these charges were established effective May 1, 2017, for the twelve month period ending April 30, 2018, and are charged based on the Account’s net assets.
Net Realized and Unrealized Gains and Losses on Investments and Mortgage Loans Payable
The following table shows the net realized and unrealized gains and losses on investments and mortgage loans payable for the three months ended September 30, 2017 and 2016 and the dollar and percentage changes for those periods (dollars in millions, unaudited).
For the ThreeMonths EndedSeptember 30, Change
2017 2016 $ %NET REALIZED AND UNREALIZED GAIN (LOSS) ONINVESTMENTS AND MORTGAGE LOANS PAYABLE
Net realized gain (loss) on investments:Real estate properties $ 75.2 $ 16.4 $ 58.8 N/MReal estate joint ventures and limited partnerships (8.6) 0.2 (8.8) N/MMarketable securities 2.6 3.1 (0.5) (16.1)%
Total realized gain on investments: 69.2 19.7 49.5 N/MNet change in unrealized appreciation (depreciation) on:
Real estate properties (9.4) 36.9 (46.3) N/MReal estate joint ventures and limited partnerships 26.9 24.3 2.6 10.7 %Marketable securities 2.2 (26.0) 28.2 N/MLoans receivable 1.4 0.1 1.3 N/MMortgage loans payable (4.1) (29.1) 25.0 (85.9)%
Net change in unrealized appreciation on investments andmortgage loans payable 17.0 6.2 10.8 N/M
NET REALIZED AND UNREALIZED GAIN ON INVESTMENTSAND MORTGAGE LOANS PAYABLE $ 86.2 $ 25.9 $ 60.3 N/M
N/M—Not meaningful

55
Real Estate Properties:
Wholly-owned real estate investments experienced net realized and unrealized gains of $65.8 million during the third quarter of 2017, compared to $53.3 million during the comparable period of 2016, mostly attributed to gains realized from the sale of wholly-owned properties and appreciation among the Account's industrial properties in the Western region. Strong tenant demand for industrial space in California has been the primary driver of this appreciation.
Real Estate Joint Ventures and Limited Partnerships:
Real estate joint ventures and limited partnerships experienced net realized and unrealized gains of $18.3 million during the third quarter of 2017, compared to gains of $24.5 million during the comparable period of 2016. The joint venture portfolio experienced positive appreciation during the third quarter of 2017, primarily due to increased occupancy and a decrease in lease concessions at one of the Account's joint venture office properties in California. The Account recorded similar appreciation in the comparable quarter of 2016, driven by similar factors within the Account's joint venture retail properties.
Marketable Securities:
The Account’s marketable securities experienced net realized and unrealized gains of $4.8 million during the third quarter of 2017 compared to losses of $22.9 million during the comparable period of 2016. The markets for REITs in the U.S. increased 1.1% as measured by the FTSE NAREIT All Equity REITs Index during the three month period ended September 30, 2017, compared to a decrease of 1.2% in the same period of 2016. Appreciation on the Account's real estate related equity securities moved in line with the market movements. Additionally, as of September 30, 2017, the Account held $4.3 billion of investments in government agency notes and U.S. Treasury securities, which had nominal changes due to the short-term nature of these investments.
Mortgage Loans Payable:
Mortgage loans payable experienced unrealized losses of $4.1 million during the third quarter of 2017 compared to $29.1 million during the comparable period of 2016. The unrealized losses were consistent with the directional movement of Treasury rates during the comparable period.
Liquidity and Capital Resources
As of September 30, 2017 and December 31, 2016, the Account’s cash and cash equivalents and non-real estate-related marketable securities had a value of $4.3 billion and $4.1 billion representing 17.3% and 16.7% of the Account’s net assets at such dates, respectively.
Participant Flows: Nine months ended September 30, 2017 compared to nine months ended September 30, 2016
During the nine months ended September 30, 2017, the Account received $2.0 billion in premiums from participants offset by participant outflows of $2.2 billion in annuity payments and withdrawals and death benefits. During the nine months ended September 30, 2016, the Account received $2.3 billion in premiums from participants offset by participant outflows of $1.6 billion in annuity payments and withdrawals and death benefits.
Net Income and Marketable Securities
The Account’s net investment income continues to be an additional source of liquidity for the Account. Net investment income was $485.8 million for the nine months ended September 30, 2017, as compared to $411.2 million for the comparable period of 2016. The increase in total net investment income is described more fully in the Results of Operations section.
As of September 30, 2017, cash and cash equivalents, along with real estate-related and non-real estate related marketable securities comprised 21.8% of the Account’s net assets. The Account’s real estate-related marketable securities primarily consist of publicly traded REITs. The Account’s liquid assets continue to be available to purchase suitable real estate properties, meet the Account’s debt obligations, expense needs, and participant redemption requests (i.e., participant withdrawals or benefit payments).

56
Leverage
The Account may borrow money and assume or obtain a mortgage on a property to make leveraged real estate investments. Also, to meet any short-term cash needs, the Account may obtain a line of credit that may be unsecured and/or contain terms that may require the Account to secure the loan with one or more of its properties.
The Account is authorized to borrow money in accordance with its investment guidelines. Under the Account’s current investment guidelines, the Account’s loan to value ratio (as described below) is to be maintained at or below 30%. Such incurrences of debt from time to time may include:
• placing new debt on properties;• refinancing outstanding debt;• assuming debt on acquired properties or interests in the Account’s properties; and/or• long term extensions of the maturity date of outstanding debt.
In calculating this limit, only the Account’s actual percentage interest in any borrowings is included, and not that percentage interest held by any joint venture partner. Further, the Account may only borrow up to 70% of the then-current value of a property, although construction loans may be for 100% of the costs incurred in developing a property. At the time the Account (or a joint venture in which the Account is a partner) enters into a revolving line of credit, for the purpose of calculating the loan to value ratio, management deems the maximum amount which may be drawn under that line of credit as fully incurred, regardless of whether the maximum amount available has been drawn from time to time.
As of September 30, 2017, the Account’s ratio of outstanding principal amount of debt (inclusive of the Account’s proportionate share of debt held within its joint venture investments) to total gross asset value (i.e., a “loan to value ratio”) was 15.2%. The Account intends to maintain its loan to value ratio at or below 30% (this ratio is measured at the time of incurrence and after giving effect thereto). The Account’s total gross asset value, for these purposes, is equal to the total fair value of the Account’s assets (including the fair value of the Account’s interest in joint ventures), with no reduction associated with any indebtedness on such assets.
As of September 30, 2017, there are no mortgage obligations secured by real estate investments wholly-owned by the Account maturing within the next twelve months. The Account has sufficient liquidity in the form of cash and cash equivalents and securities to meet its current mortgage obligations.
In times of high net inflow activity, in particular during times of high net participant transfer inflows, management may determine to apply a portion of such cash flows to make prepayments of indebtedness prior to scheduled maturity, which would have the effect of reducing the Account’s loan to value ratio.
Recent Transactions
The following describes property transactions by the Account during the third quarter of 2017. Except as noted, the expenses for operating the properties purchased are either borne or reimbursed, in whole or in part, by the property tenants, although the terms vary under each lease.
Purchases
The Bridges—Minneapolis, MN
On July 13, 2017, the Account acquired a student housing complex located near the University of Minnesota for $60.9 million.
The Knoll—Minneapolis, MN
On July 13, 2017, the Account acquired a student housing complex located near the University of Minnesota for $14.8 million, which is net of a $17.7 million mortgage loan the Account assumed with the property, as further discussed in the Financings section.

57
803 Corday—Naperville, IL
On August 10, 2017, the Account purchased a multi-family property located in Naperville, Illinois for $92.9 million.
DDR Joint Venture—Village Crossing: Phase I - Niles, IL
On September 7, 2017, the DDR joint venture investment, in which the Account holds an 85% interest, purchased a retail property located in Niles, Illinois for $44.4 million (the Account’s share).
Broward Industrial Portfolio—Various, FL
On September 19, 2017, the Account purchased an investment portfolio consisting of four industrial properties located in the Miami/Fort Lauderdale metro area for $54.1 million.
Orion on Orpington—Orlando, FL
On September 21, 2017, the Account purchased a student housing complex located near the University of Central Florida for $42.3 million.
Sales
Ontario Industrial Portfolio: Inland Empire Industrial Portfolio—Various, CA
On August 17, 2017, the Account sold an industrial portfolio held within its Ontario Industrial Portfolio located in various parts of California for a net sales price of $66.0 million, resulting in a realized gain of $20.9 million, the majority of which has been previously recognized as unrealized gains in the Account’s consolidated statements of operations. The Account’s cost basis in the property at the date of the sale was $45.1 million.
Rancho Cucamonga Industrial Portfolio: Inland Empire Industrial Portfolio—Various, CA
On August 17, 2017, the Account sold an industrial portfolio held within its Rancho Cucamonga Industrial Portfolio located in various parts of California for a net sales price of $104.8 million, resulting in a realized gain of $56.0 million, the majority of which has been previously recognized as unrealized gains in the Account’s consolidated statements of operations. The Account’s cost basis in the property at the date of the sale was $48.8 million.
The Pepper Building—Philadelphia, PA
On September 15, 2017, the Account sold this multi-family property located in Philadelphia, Pennsylvania for a net sales price of $51.7 million, realizing a loss of $1.7 million from the sale, the majority of which has been previously recognized as unrealized losses in the Account’s consolidated statements of operations. The Account’s cost basis in the property at the date of the sale was $53.4 million.
DDR Joint Venture: McFarland Plaza—Tuscaloosa, AL
On September 18, 2017, the DDR joint venture investment, in which the Account holds an 85% interest, sold a retail property located in Tuscaloosa, Alabama for a net sales price of $14.7 million (the Account’s share), which is gross of a $7.4 million mortgage loan extinguished during the sale of the property, as further discussed in the Financings section. The sale resulted in a realized loss of $8.9 million, the majority of which has been previously recognized as unrealized gains in the Account’s consolidated statements of operations. The Account’s cost basis in the property at the date of the sale was $23.6 million.
Financings
The Knoll—Minneapolis, MN
On July 13, 2017, concurrent with the purchase of a student housing complex located near the University of Minnesota, the Account assumed a $17.7 million mortgage loan. The loan has an interest rate of 3.98%, matures on December 5, 2020, and is adjusted monthly for principal payments.

58
Colorado Center—Santa Monica, CA
On August 1, 2017, Colorado Center joint venture investment, in which the Account holds a 50% interest, entered into a new mortgage loan with a principal amount of $275.0 million (the Account’s share). The debt has an interest rate of 3.563%, maturing August 9, 2027 and is interest only.
DDR Joint Venture—Various, USA
On August 14, 2017, the DDR joint venture investment, in which the Account holds an 85% interest, entered into a new mortgage loan secured by three retail properties with a principal amount totaling $90.3 million (the Account's share). The debt has an interest rate of 3.82%, maturing on September 11, 2027 and is interest only.
DDR Joint Venture: McFarland Plaza—Tuscaloosa, AL
On September 18, 2017, the DDR joint venture investment, in which the Account holds an 85% interest, extinguished $7.4 million of outstanding mortgage debt (the Account’s share) concurrent with the sale of a retail property located in Tuscaloosa, Alabama.
Critical Accounting Policies
Management’s discussion and analysis of the Account’s financial condition and results of operations is based on the Account’s consolidated interim financial statements, which have been prepared by management in accordance with GAAP. The preparation of the Account’s financial statements in conformity with GAAP requires management to make estimates and assumptions that affect the financial statements and disclosures. Some of these estimates and assumptions require application of difficult, subjective, and/or complex judgments about the effect of matters that are inherently uncertain and that may change in subsequent periods. Management evaluates its estimates and assumptions on an ongoing basis. Management bases its estimates on historical experience and on various other assumptions that it believes to be reasonable under the circumstances, the results of which form the basis for making judgments about the carrying values of assets and liabilities of the Account that are not readily apparent from other sources. Actual results may differ from these estimates under different assumptions or conditions.
In the Account’s Annual Report on Form 10-K for the year ended December 31, 2016, management identified the critical accounting policies which affect its significant estimates and assumptions used in preparing the Account’s financial statements. Certain of these accounting policies are described in Note 1—Organization and Significant Accounting Policies in this Form 10-Q. There have been no material changes to these accounting policies to those disclosed in our 2016 Form 10-K.
59
ITEM 3. QUANTITATIVE AND QUALITATIVE DISCLOSURES ABOUT MARKET RISK
The Account’s real estate holdings, including real estate joint venture, limited partnerships and loans receivable, which, as of September 30, 2017, represented 80.1% of the Account’s total investments, expose the Account to a variety of risks. These risks include, but are not limited to:
• General Real Estate Risk—The risk that the Account’s property values or rental and occupancy rates could go down due to general economic conditions, a weak market for real estate generally, disruptions in the credit and/or capital markets, or changing supply and demand for certain types of properties;
• Appraisal Risk—The risk that the sale price of an Account property (i.e., the value that would be determined by negotiations between independent parties) might differ substantially from its estimated or appraised value, leading to losses or reduced profits to the Account upon sale;
• Risk Relating to Property Sales—The risk that the Account might not be able to sell a property at a particular time for its full value, particularly in a poor market. This might make it difficult to raise cash quickly and also could lead to Account losses;
• Risks of Borrowing—The risk that interest rate changes may impact Account returns if the Account takes out a mortgage on a property, buys a property subject to a mortgage or holds a property subject to a mortgage, and hedging against such interest rate changes, if undertaken by the Account, may entail additional costs and be unsuccessful; and
• Foreign Currency Risk—The risk that the value of the Account’s foreign investments, related debt, or rental income could increase or decrease due to changes in foreign currency exchange rates or foreign currency exchange control regulations, and hedging against such currency changes, if undertaken by the Account, may entail additional costs and be unsuccessful.
The Account believes the diversification of its real estate portfolio, both geographically and by sector, along with its quarterly valuation procedure, helps manage the real estate and appraisal risks described above.
As of September 30, 2017, 19.9% of the Account’s total investments were comprised of marketable securities. Marketable securities include high-quality debt instruments (i.e., U.S. government agency notes) and REIT securities. The consolidated schedule of investments for the Account sets forth the general financial terms of these instruments, along with their fair values, as determined in accordance with procedures described earlier in the Critical Accounting Policies section above and in Note 1—Organization and Significant Accounting Policies to the Account’s Consolidated Financial Statements included herewith. As of the date of this report, the Account does not invest in derivative financial investments, nor does the Account engage in any hedging activity, although it may do so in selected circumstances in the future.
Risks associated with investments in real estate-related liquid assets (which could include, from time to time, REIT securities and CMBS), and non-real estate-related liquid assets, including financial/credit risk, market volatility risk, interest rate volatility risk and deposit/money market risk.
• Financial/Credit Risk—The risk, for debt securities, that the issuer will not be able to pay principal and interest when due (and/or declare bankruptcy or be subject to receivership) and, for equity securities such as common or preferred stock, that the issuer’s current earnings will fall or that its overall financial soundness will decline, reducing the security’s value.
• Market Volatility Risk—The risk that the Account’s investments will experience price volatility due to changing conditions in the financial markets regardless of the credit quality or financial condition of the underlying issuer. This risk is particularly acute to the extent the Account holds equity securities, which have experienced significant short-term price volatility over the past year. Also, to the extent the Account holds debt securities, changes in overall interest rates can cause price fluctuations.
• Interest Rate Volatility—The risk that interest rate volatility may affect the Account’s current income from an investment.
• Deposit/Money Market Risk—The risk that, to the extent the Account’s cash held in bank deposit accounts exceeds federally insured limits as to that bank, the Account could experience losses if banks fail. The Account does not believe it has exposure to significant concentration of deposit risk. In addition, there is some risk that investments held in money market accounts can suffer losses.
60
In addition, to the extent the Account were to hold mortgage-backed securities (including commercial mortgage-backed securities) these securities are subject to prepayment risk or extension risk (i.e., the risk that borrowers will repay the loans earlier or later than anticipated). If the underlying mortgage assets experience faster than anticipated repayments of principal, the Account could fail to recoup some or all of its initial investment in these securities, since the original price paid by the Account was based in part on assumptions regarding the receipt of interest payments. If the underlying mortgage assets are repaid later than anticipated, the Account could lose the opportunity to reinvest the anticipated cash flows at a time when interest rates might be rising. The rate of prepayment depends on a variety of geographic, social and other functions, including prevailing market interest rates and general economic factors. The fair value of these securities is also highly sensitive to changes in interest rates. Note that the potential for appreciation, which could otherwise be expected to result from a decline in interest rates, may be limited by any increased prepayments. These securities may be harder to sell than other securities.
In addition to these risks, real estate equity securities (such as REIT stocks and mortgage-backed securities) would be subject to many of the same general risks inherent in real estate investing, making mortgage loans and investing in debt securities. For more information on the risks associated with all of the Account’s investments, see the Account’s most recent prospectus.
ITEM 4. CONTROLS AND PROCEDURES
(a) The registrant maintains a system of disclosure controls and procedures that are designed to provide reasonable assurance that information required to be disclosed in the registrant’s reports under the Securities Exchange Act of 1934, as amended (the “Exchange Act”), is recorded, processed, summarized and reported within the time periods specified in the SEC’s rules and forms, and that such information is accumulated and communicated to management, including TIAA’s Executive Vice President, Institutional Investment & Endowment Services (Principal Executive Officer (“PEO”)) and TIAA’s Senior Executive Vice President and Chief Financial Officer (Principal Financial Officer (“PFO”)), as appropriate, to allow timely decisions regarding required disclosure.
Under the supervision and participation of the registrant’s management, including the registrant’s PEO and PFO, the registrant conducted an evaluation of the effectiveness of the registrant’s disclosure controls and procedures as defined in Rule 13a-15(e) under the Exchange Act as of September 30, 2017. Based upon management’s review, the PEO and PFO concluded that the registrant’s disclosure controls and procedures provide reasonable assurance that material information required to be included in the Account's periodic reports is recorded, processed, summarized and reported within the time periods specified in the relevant SEC rules and forms.
(b) Changes in internal control over financial reporting. There have been no changes in the registrant’s internal control over financial reporting that occurred during the registrant’s last fiscal quarter that materially affected, or are reasonably likely to materially affect, the registrant’s internal control over financial reporting.
61
PART II. OTHER INFORMATIONITEM 1. LEGAL PROCEEDINGS.
The Account is party to various claims and routine litigation arising in the ordinary course of business. Management of the Account does not believe that the results of any such claims or litigation, individually or in the aggregate, will have a material effect on the Account’s business, financial position or results of operations.
ITEM 1A. RISK FACTORS.
There have been no material changes from the Account’s risk factors as previously reported in the Account’s Annual Report on Form 10-K for the year ended December 31, 2016.
ITEM 2. UNREGISTERED SALES OF EQUITY SECURITIES AND USE OF PROCEEDS.
Not applicable.
ITEM 3. DEFAULTS UPON SENIOR SECURITIES.
Not applicable.
ITEM 4. MINE SAFETY DISCLOSURES.
Not applicable.
ITEM 5. OTHER INFORMATION.
The Code of Ethics for TIAA’s senior financial officers, including its principal executive officer, principal financial officer, principal accounting officer, or controller, and persons performing similar functions, has been filed as an exhibit to the Account’s Annual Report on Form 10-K for the year ended December 31, 2016 and can also be found on the following web site, http://www.tiaa.org/public/prospectuses/index.html.

62
ITEM 6. EXHIBITS
(1) (A) Distribution Agreement for the Contracts Funded by the TIAA Real Estate Account, dated as of January 1, 2008, by and among Teachers Insurance and Annuity Association of America, for itself and on behalf of the Account, and TIAA-CREF Individual & Institutional Services, LLC1
(3) (A) Restated Charter of TIAA (as amended)2
(B) Amended Bylaws of TIAA3
(4) (A) Forms of RA, GRA, GSRA, SRA, IRA Real Estate Account Endorsements,4 Keogh Contract,5 Retirement Choice and Retirement Choice Plus Contracts5 and Retirement Select and Retirement Select Plus Contracts and Endorsements6
(B) Forms of Income-Paying Contracts4
(C) Form of Contract Endorsement for Internal Transfer Limitation7
(D) Form of Non-ERISA Retirement Choice Plus Contract10
(E) Form of Trust Company Retirement Choice Contract11
(F) Form of Trust Company Retirement Choice Plus Contract12
(10) (A) Amended and Restated Independent Fiduciary Letter Agreement, dated as of February 2, 2015, between TIAA, on behalf of the Registrant, and RERC, LLC8
(B) Custodian Agreement, dated as of March 3, 2008, by and between TIAA, on behalf of the Registrant, and State Street Bank and Trust Company, N.A.9
(31) Rule 13(a)-15(e)/ Rule 13a-15(e)/15d-15(e) Certifications*(32) Section 1350 Certifications*(101) The following financial information from the Quarterly Report on Form 10-Q for the period
ended September 30, 2017, formatted in XBRL (Extensible Business Reporting Language): (i)the Consolidated Statements of Assets and Liabilities, (ii) the Consolidated Statements ofOperations, (iii) the Consolidated Statements of Changes in Net Assets, (iv) the ConsolidatedStatements of Cash Flows, and (v) the Notes to the Consolidated Financial Statements.**
* Filed herewith.** Furnished electronically herewith.(1) Previously filed and incorporated herein by reference to Exhibit 1(A) to the Account’s Registration Statement on Form S-1, filed with
the Commission on March 15, 2013 (File No. 333-187309).(2) Previously filed and incorporated herein by reference to Exhibit 3(A) to the Account’s Registration Statement on Form S-1, filed with
the Commission on April 22, 2015 (File No. 333-202583).(3) Previously filed and incorporated herein by reference to Exhibit 3(B) to the Account’s Registration Statement on Form S-1, filed with
the Commission on April 22, 2015 (File No. 333-202583).(4) Previously filed and incorporated herein by reference to the Account’s Post-Effective Amendment No. 2 to the Registration Statement on
Form S-1, filed with the Commission on April 30, 1996 (File No. 33-92990).(5) Previously filed and incorporated herein by reference to the Account’s Post-Effective Amendment No. 1 to the Registration Statement on
Form S-1, filed with the Commission on May 2, 2005 (File No. 333-121493).(6) Previously filed and incorporated herein by reference to the Account’s Pre-Effective Amendment No. 1 to the Registration Statement on
Form S-1, filed with the Commission on April 29, 2004 (File No. 333-113602). (7) Previously filed and incorporated by reference to Exhibit 4(C) to the Account’s Quarterly Report on Form 10-Q for the quarter ended
September 30, 2010, filed with the Commission on November 12, 2010 (File No. 33-92990).(8) Previously filed and incorporated herein by reference to Exhibit 10.1 to the Account’s Current Report on Form 8-K, filed with the
Commission on February 6, 2015 (File No. 33-92990).(9) Previously filed and incorporated herein by reference to Exhibit 10(D) to the Account’s Annual Report on Form 10-K for the fiscal year
ended December 31, 2012, filed with the Commission on March 14, 2013 (File No. 33-92990).(10) Previously filed and incorporated herein by reference to Exhibit 4(D)(1) and 4(D)(2) to the Account’s Registration Statement on Form
S-1, filed with the Commission on March 21, 2017 (File No. 333-216849). (11) Previously filed and incorporated herein by reference to Exhibit 4(E)(1) and 4(E)(2) to the Account’s Registration Statement on Form
S-1, filed with the Commission on March 21, 2017 (File No. 333-216849). (12) Previously filed and incorporated herein by reference to Exhibit 4(F)(1) and 4(F)(2) to the Account’s Registration Statement on Form
S-1, filed with the Commission on March 21, 2017 (File No. 333-216849).

63
SIGNATURES
Pursuant to the requirements of the Securities Exchange Act of 1934, as amended, the registrant, TIAA Real Estate Account, has duly caused this Report to be signed on its behalf by the undersigned, thereunto duly authorized, in New York, New York, on the 7th day of November, 2017.
TIAA REAL ESTATE ACCOUNT
By: TEACHERS INSURANCE AND ANNUITY ASSOCIATIONOF AMERICA
November 7, 2017 By: /s/ Carol W. DeckbarCarol W. DeckbarExecutive Vice President, Institutional Investment & Endowment ServicesTeachers Insurance and Annuity Association of America(Principal Executive Officer)
November 7, 2017 By: /s/ Virginia M. WilsonVirginia M. WilsonSenior Executive Vice President and Chief Financial Officer,Teachers Insurance and Annuity Association of America(Principal Financial and Accounting Officer)

EXHIBIT 31
CERTIFICATIONS
I, Carol W. Deckbar, certify that:
1. I have reviewed this quarterly report on Form 10-Q of the TIAA Real Estate Account;
2. Based on my knowledge, this report does not contain any untrue statement of a material fact or omit to state a material fact necessary to make the statements made, in light of the circumstances under which such statements were made, not misleading with respect to the period covered by this report;
3. Based on my knowledge, the financial statements, and other financial information included in this report, fairly present in all material respects the financial condition, results of operations and cash flows of the registrant as of, and for, the periods presented in this report;
4. The Registrant’s other certifying officer and I are responsible for establishing and maintaining disclosure controls and procedures (as defined in Exchange Act Rules 13a-15(e) and 15d-15(e)) and internal control over financial reporting (as defined in Exchange Act Rules 13a-15(f) and 15d-15(f)) for the registrant and have:
a) Designed such disclosure controls and procedures, or caused such disclosure controls and procedures to be designed under our supervision, to ensure that material information relating to the registrant, including its consolidated subsidiaries, is made known to us by others within those entities, particularly during the period in which this report is being prepared;
b) Designed such internal control over financial reporting, or caused such internal control over financial reporting to be designed under our supervision, to provide reasonable assurance regarding the reliability of financial reporting and the preparation of financial statements for external purposes in accordance with generally accepted accounting principles;
c) Evaluated the effectiveness of the registrant’s disclosure controls and procedures and presented in this report our conclusions about the effectiveness of the disclosure controls and procedures, as of the end of the period covered by this report based on such evaluation; and
d) Disclosed in this report any change in the registrant’s internal control over financial reporting that occurred during the registrant’s most recent fiscal quarter (the registrant’s fourth fiscal quarter in the case of an annual report) that has materially affected, or is reasonably likely to materially affect, the registrant’s internal control over financial reporting; and
5. The registrant’s other certifying officers and I have disclosed, based on our most recent evaluation of internal control over financial reporting, to the registrant’s auditors and the audit committee of registrant’s board of directors (or persons performing the equivalent function):
a) all significant deficiencies and material weaknesses in the design or operation of internal control over financial reporting which are reasonably likely to adversely affect the registrant’s ability to record, process, summarize and report financial information; and
b) any fraud, whether or not material, that involves management or other employees who have a significant role in the registrant’s internal control over financial reporting.
November 7, 2017 /s/ Carol W. DeckbarCarol W. DeckbarExecutive Vice President, Institutional Investment & Endowment ServicesTeachers Insurance and Annuity Association of America(Principal Executive Officer)

I, Virginia M. Wilson, certify that:
1. I have reviewed this quarterly report on Form 10-Q of the TIAA Real Estate Account;
2. Based on my knowledge, this report does not contain any untrue statement of a material fact or omit to state a material fact necessary to make the statements made, in light of the circumstances under which such statements were made, not misleading with respect to the period covered by this report;
3. Based on my knowledge, the financial statements, and other financial information included in this report, fairly present in all material respects the financial condition, results of operations and cash flows of the registrant as of, and for, the periods presented in this report;
4. The Registrant’s other certifying officer and I are responsible for establishing and maintaining disclosure controls and procedures (as defined in Exchange Act Rules 13a-15(e) and 15d-15(e)) and internal control over financial reporting (as defined in Exchange Act Rules 13a-15(f) and 15d-15(f)) for the registrant and have:
a) Designed such disclosure controls and procedures, or caused such disclosure controls and procedures to be designed under our supervision, to ensure that material information relating to the registrant, including its consolidated subsidiaries, is made known to us by others within those entities, particularly during the period in which this report is being prepared;
b) Designed such internal control over financial reporting, or caused such internal control over financial reporting to be designed under our supervision, to provide reasonable assurance regarding the reliability of financial reporting and the preparation of financial statements for external purposes in accordance with generally accepted accounting principles;
c) Evaluated the effectiveness of the registrant’s disclosure controls and procedures and presented in this report our conclusions about the effectiveness of the disclosure controls and procedures, as of the end of the period covered by this report based on such evaluation; and
d) Disclosed in this report any change in the registrant’s internal control over financial reporting that occurred during the registrant’s most recent fiscal (the registrant’s fourth fiscal quarter in the case of an annual report) quarter that has materially affected, or is reasonably likely to materially affect, the registrant’s internal control over financial reporting; and
5. The registrant’s other certifying officers and I have disclosed, based on our most recent evaluation of internal control over financial reporting, to the registrant’s auditors and the audit committee of registrant’s board of directors (or persons performing the equivalent function):
a) all significant deficiencies and material weaknesses in the design or operation of internal control over financial reporting which are reasonably likely to adversely affect the registrant’s ability to record, process, summarize and report financial information; and
b) any fraud, whether or not material, that involves management or other employees who have a significant role in the registrant’s internal control over financial reporting.
November 7, 2017 /s/ Virginia M. WilsonVirginia M. WilsonSenior Executive Vice President and Chief Financial Officer,Teachers Insurance and Annuity Association of America(Principal Financial and Accounting Officer)

EXHIBIT 32
CERTIFICATIONPURSUANT TO SECTION 906 OF THE SARBANES-OXLEY ACT OF 2002
Pursuant to Section 906 of the Sarbanes-Oxley Act of 2002 (subsections (a) and (b) of section 1350, chapter 63 of title 18, United States Code), each of the undersigned officers of Teachers Insurance and Annuity Association of America, do hereby certify, to such officer’s knowledge, that:
The quarterly report on Form 10-Q of the TIAA Real Estate Account (the “Account”) for the quarter ended September 30, 2017(the “Form 10-Q”) fully complies with the requirements of Section 13(a) or 15(d) of the Securities Exchange Act of 1934 and information contained in the Form 10-Q fairly presents, in all material respects, the financial condition and results of operations of the Account.
November 7, 2017 /s/ Carol W. DeckbarCarol W. DeckbarExecutive Vice President, Institutional Investment & Endowment ServicesTeachers Insurance and Annuity Association of America(Principal Executive Officer)
November 7, 2017 /s/ Virginia M. WilsonVirginia M. WilsonSenior Executive Vice President and Chief Financial Officer,Teachers Insurance and Annuity Association of America(Principal Financial and Accounting Officer)
A signed original of this written statement required by Section 906 has been provided to the TIAA Real Estate Account and will be retained by the Account and furnished to the Securities and Exchange Commission or its staff upon request.