contents and data summary (for web) - opec : home · · 2014-02-17monthly oilm arket report tel...
TRANSCRIPT

Feature Article:Review of developments in the world economy
OPECOrganization of the Petroleum Exporting Countries
Monthly Oil Market Report
Tel +43 1 21112 Fax +43 1 2164320 E-mail: [email protected] Web site: www.opec.org
Data Summary OPECOrganization of the Petroleum Exporting Countries
Monthly Oil Market Report
Tel +43 1 21112 Fax +43 1 2164320 E-mail: [email protected] Web site: www.opec.org
Data Summary
Helferstorferstrasse 17, A-1010 Vienna, Austria
Oil market highlights
Feature article
Crude oil price movements
Commodity markets
World economy
World oil demand
World oil supply
Product markets and refinery operations
Tanker market
Oil trade
Stock movements
Balance of supply and demand
1
3
5
11
15
27
36
46
53
57
63
70
September 2013


_________________________________________________________________________________________________________________________________________Monthly Oil Market Report
September 2013 1
Oil Market Highlights § The OPEC Reference Basket averaged $107.52/b in August, representing an increase of $3.07
over the previous month. All Basket component values improved, except Ecuador’s Oriente. Prices were generally supported by tightness in the Brent market. The Basket’s year-to-date value stood at $105.32/b, a decline of $4.81 or 4.8% from the same period last year. In August, international crude oil futures soared on both sides of the Atlantic, as a result of seasonal increases in demand, some supply outages, and geopolitical worries. Money managers capitalized on the combination of higher political risks and supply disruptions to push crude prices higher as net length for ICE Brent crude futures and options reached all-time highs. Nymex WTI rose $1.84 to an average of $106.54/b. ICE Brent jumped $3.02 to an average of $110.45/b. § World economic growth forecasts for 2013 and 2014 remain unchanged at 2.9% and 3.5%,
respectively. US growth for 2013 has been revised up to 1.7% from 1.6% due to a stronger-than-expected 2Q13; the 2014 forecast remains at 2.5%. After a return to growth in 2Q13, the Euro-zone is now expected to see a lower contraction of 0.5% in 2013; the forecast for 2014 remains at 0.6%. Japan’s forecast has been revised to 1.7% from 1.9% and the 2014 forecast is unchanged at 1.4%. India has recently been impacted by capital outflows and its 2013 forecast has been revised from 5.6% to 5.3%, while its 2014 growth remains at 6.0%. China’s forecasts remain unchanged at 7.6% and 7.7% for 2013 and 2014 respectively. Overall, developed economies are recovering – albeit from low levels – amid a slowdown in emerging and developing economies. § World oil demand growth in 2013 was revised up slightly by 25 tb/d, reflecting higher-than-
expected actual data for the first half of the year, as well as positive signs of improvement in major OECD economies, particularly in the US, UK and Germany. The forecast for 2013 currently stands at 0.8 mb/d. In 2014, world oil demand is projected to grow by 1.0 mb/d, in line with the previous forecast, despite some marginal regional revisions to account for the latest information. § Non-OPEC supply is anticipated to increase by 1.1 mb/d in 2013. Growth is supported by expected
gains in the US, Canada, South Sudan & Sudan, Russia, China, and Colombia, while output from Syria, Norway, the UK and Australia is projected to decline. In 2014, non-OPEC oil supply is forecast to grow by 1.2 mb/d. OPEC NGLs are expected to average 5.8 mb/d in 2013 and 6.0 mb/d in 2014, representing growth of 0.2 mb/d and 0.1 mb/d, respectively. In August, OPEC crude oil production stood at 30.23 mb/d, representing a decrease of 124 tb/d from the previous month, according to secondary sources. § Product markets exhibited a mixed performance in August. Middle distillates retained some
strength on the back of tightening sentiment, fuelled by the upcoming autumn maintenance season. The top and bottom of the barrel weakened worldwide, due to lacklustre demand amid rising supplies and the winding down of the driving season in the Atlantic Basin. This caused refinery margins to fall across the globe. § The tanker market saw mixed movement in August, with VLCC spot freight rates dropping and
Suezmax and Aframax spot rates rising from a month earlier. Tanker tonnage availability, low activity and holidays in the Far East and the UK were the main factors behind the decline in VLCC spot freight rates, while Suezmax and Aframax freight rates saw support from port delays and prompt replacements. OPEC spot fixtures were lower in August compared to the previous month, averaging 17.3 mb/d, while OPEC sailings reported a decline of 0.6 mb/d. § Total OECD commercial oil stocks rose by 5.3 mb in July, but indicated a deficit of around 55
mb with the five-year average. Crude stocks were 20 mb below the five-year average and product inventories were down 35 mb. In days of forward cover, OECD commercial stocks stood at 58.5 days, 0.3 days above the five-year average. Preliminary data for August shows that US commercial oil stocks fell slightly by 0.7 mb, reversing the build of last five months, but still indicating a surplus of 30.7 mb with the five-year average. Crude and product stocks saw surpluses of 19.1 mb and 11.5 mb. § Demand for OPEC crude in 2013 is forecast to average 29.9 mb/d, unchanged from the previous
report and 0.5 mb/d lower than last year. Demand for OPEC crude in 2014 was revised down slightly to 29.6 mb/d since the last MOMR to show a decline of 0.3 mb/d compared to the current year.

Monthly Oil Market Report______________________________________________________________________
September 2013 2

_______________________________________________________________________________________________________________________________________________Monthly Oil Market Report
September 2013 3
Review of developments in the world economy
The global economy gained momentum in the second quarter after a relatively weak start to the year. The main impetus behind this pick-up in activity has come from the OECD economies, with a healthy performance in the US and the Euro-zone returning to growth after eighteen months of recession. Emerging and developing economies are likely to follow, led by China and Brazil is expected to gain further traction in the second half. However, India and Russia are likely to continue to be impacted by declining investments. Growth in both countries is expected to remain below potential, with Russia in a better position to withstand the current challenges. The improving situation in the developed economies can be seen in the most recent Purchasing Manager’s Indices (PMIs) for the manufacturing sector (Graph 1). Despite recent improvements, the forecast for global economic growth in 2013 remains at 2.9%, the lowest level since 2010, due to the low growth at the start of the year. However, the pick-up is expected to continue into the coming year, with global growth forecast at 3.5%.
Graph 1: PMIs for manufacturing in OECD Graph 2: FX moves and current account positions
A more positive performance for the world economy could materialize on developments such as any progress made on US fiscal issues; a stronger-than-expected recovery in the Euro-zone; more effective stimulus measures in Japan; further progress in structural reforms in emerging economies; and an improvement in international trade. Among the downside risks are the upcoming budget and debt ceiling negotiations in the US, the continued weakness in the Euro-zone’s banking system, and fiscal consolidation in Japan. Further downside risks include the impact on emerging and developing economies of efforts to scale back monetary stimulus in the US; the potential re-emergence of challenges to China’s financial system; and reduced foreign and domestic investments in India and Russia.
Looking at the OECD in more detail, the Euro-zone’s return to growth in the second quarter has been a significant driver for the improvement in the global economy. In recent years, its severe sovereign debt crisis and the impact that this has had on the financial sector, as well as the decline in output due to austerity measures had a significant negative effect on the global economy. The latest data appears to show a broader-based yet gradual improvement in the Euro-zone. In the US, strong growth in the second quarter in combination with the expansion of its manufacturing sector has been supportive to the global economy. Elsewhere, Japan is benefitting from the recovery in its main trading partners in the OECD and China, and seems to be on track with its stimulus measures. However, the need to make fiscal adjustments will likely drag on the country’s growth next year.
In the emerging and developing economies, expectations that the US central bank will reduce monetary stimulus in the coming months has proved a challenge, particularly for economies with large current account deficits (Graph 2). India, in particular, has seen a significant depreciation in the value of its currency, as well as declining investments in recent months. These factors are likely to dampen economic growth in the second half. Russia is also experiencing declining investments, which could impact growth over the coming quarters. Brazil has experienced a welcomed increase in investments in the first half, which should lead to an improvement in economic growth in the second half. China’s output numbers have improved recently and lead-indicators point to better momentum in the second half. More broadly speaking, the current recovery in the developed economies could be expected to filter through to the emerging and developing economies in the coming months.
The recent positive developments in the OECD economies have already resulted in a gradual improvement in oil demand. This, along with some supply outages, has resulted in a decline in OECD crude inventories, adding to the upward pressure on crude oil prices in recent weeks. However, a look at days of forward cover – which provides a good measure of market needs – shows that OECD inventories stand at a comfortable level of 58.5 days. This figure is above the historical norm and provides confirmation that the market at present remains well supplied. Looking ahead, crude stocks should gradually begin to build as refiners head into maintenance at the end of the third quarter and summer demand winds down. At the same time, the on-going rise in non-OECD inventories should also provide a further cushion to the market, complementing existing – and expanding – crude oil production capacity.
44
46
48
50
52
54
56
US Euro-zone Japan
IndexJan 13
Feb 13
Mar 13
Apr 13
May 13
Jun 13
Jul 13
Aug 13
Sources: ISM, Markit, Japan Materials Management Association and Haver Analytics.
South Africa
China
Brazil
Russia
India
Indonesia
Malaysia
Turkey
-25
-20
-15
-10
-5
0
5
-10 -5 0 5 10
% change in FX rate vs. US$ (1 May 13 - 28 Aug 13)
Current account balance (% of GDP, 2012)
Sources: OPEC Secretariat and Haver Anayltics.
Current account deficit countries Current account surplus countries

Monthly Oil Market Report__________________________________________________________________________________________________________________________________________
4 September 2013

_________________________________________________________________________________________________________________________________________Monthly Oil Market Report
September 2013 5
Crude Oil Price Movements
OPEC Reference Basket The Basket hit a six-month high in August
The OPEC Reference Basket (ORB) increased in August for the third straight month, hitting six-month highs. Crude oil prices surged during the last ten days of the month on rising geopolitical tensions, at a time of improving demand signals and tightening supply. Lower supplies from some producers in North and West Africa as well as the Middle East added upward momentum. Summer maintenance also tightened the supply of North Sea crudes and limited the availability of some crude grades in the Asia-Pacific region. An improving US economy, sporadic recovery in the Euro-zone and higher Chinese oil demand figures for July sent the market a bullish signal on the demand side of the equation. Crude outright prices were also buoyed by increasing speculative activities, following views that the Federal Reserve (Fed) could push back the trimming of its monetary stimulus programme following weak data on US home sales and durable goods orders. The value of the ORB increased by $3.07/b, gaining around $6.50/b in the last two months, to reach a monthly average of $107.52/b in August, the highest level since February’s peak of $112.75/b. Compared to the same period last year, the Basket year-to-date value is at $105.32/b, $4.81/b or 4.8% lower.
Graph 1.1: Crude oil price movement, 2013
All Basket component values improved over the month, except Ecuador’s Oriente, which declined by $1.30/b. Light-sweet grades priced off of Dated Brent were supported by supply tightness in the Brent market. A disruption in alternative supplies from North Africa boosted Nigerian light-sweet crude, which was already well-supported by production outages due to maintenance. As a result, the premium for Algeria’s light-sweet crude to Dated Brent rose to its highest levels in almost two years. Summer maintenance has cut the supply of North Sea Forties crude and more crude from the sour Buzzard field has been blended into the stream, raising the sulfur content of the grade. On average, the prices of Brent-related Basket components from North and West Africa — including Saharan Blend, Bonny Light, Girassol and Es Sider — edged up by $4.12/b. Meanwhile, spot premiums for October-loading crude sold in Asia surged to multi-month highs in August after supply tightened on disruptions in Iraq and Libya ahead of peak winter demand. Abu Dhabi's Murban crude surged to its highest spot premium in six years in mid-August as Asian refiners snapped up cargoes amid supply worries,
80
90
100
110
120
80
90
100
110
120
01 A
pr
08 A
pr
15 A
pr
22 A
pr
29 A
pr
06 M
ay
13 M
ay
20 M
ay
27 M
ay
03 J
un
10 J
un
17 J
un
24 J
un
01 J
ul
08 J
ul
15 J
ul
22 J
ul
29 J
ul
05 A
ug
12 A
ug
19 A
ug
26 A
ug
02 S
ep
US$/bUS$/b
OPEC Basket WTI Brent Dated

Monthly Oil Market Report_________________________________________________________________________________________________________________________________________
September 2013 6
while October DME Oman's premium to Dubai swaps stayed at elevated levels of more than $2/b for most of the month. Strong Brent prices against Dubai also led to a rush for Middle Eastern and Russian crudes priced on the comparatively cheaper Middle Eastern market. The Middle Eastern grades, including Qatar Marine and Murban crudes, increased by $3.47/b over the month while multi-destination grades Iran Heavy, Basrah Light, Kuwait Export and Arab Light strengthened on average by around $3.12/b. Venezuela’s Merey crude edged up by $2.38/b, as its pricing formula was adjusted to reflect the improvement in formula elements. On 9 September, the OPEC Reference Basket stood at $111.39/b, an increase of $3.87 compared to the August average.
Table 1.1: OPEC Reference Basket and selected crudes, US$/b
The oil futures market Oil futures rose on supply tightness, geopolitics and speculation
International crude oil futures on both sides of the Atlantic soared in August as a result of numerous supply outages, seasonal increases in demand and geopolitical worries. Rising geopolitical tension in the Middle East and North Africa (MENA) region, along with an improved economic outlook, drove the oil market higher earlier in the month. Subsequently, trading turned choppy and trended downward as investors continue to weigh how each piece of economic data would influence the US Federal Reserve (Fed)’s decision on whether and when to scale back its stimulus programme. Prices rebounded when weak data on US home sales and durable goods orders added to signs that economic growth may be slower than previously expected in the third quarter, tempering the view, particularly of the speculative community, that the Federal Reserve could start paring its economic stimulus programme as soon as September. Money managers capitalised on the combination of higher political risk and supply disruptions to bid on higher oil prices by accumulating long positions, while net length for Brent crude futures and options held by speculators on London's ICE exchange reached all-time highs. Lower supplies due to output disruptions, coupled with renewed
ChangeJul 13 Aug 13 Aug/Jul 2012 2013
OPEC Reference Basket 104.45 107.52 3.07 110.12 105.32 Arab Light 105.03 108.09 3.06 110.68 106.12 Basrah Light 103.24 106.07 2.83 108.62 103.29 Bonny Light 110.21 113.62 3.41 114.30 110.63 Es Sider 107.91 111.07 3.16 112.54 108.00 Girassol 107.55 110.80 3.25 113.06 108.42 Iran Heavy 103.65 107.06 3.41 109.54 104.54 Kuwait Export 103.22 106.47 3.25 109.58 104.30 Marine 103.34 106.67 3.33 109.75 104.45 Merey 95.68 98.06 2.38 102.03 96.72 Murban 105.58 109.18 3.60 112.19 107.10 Oriente 99.54 98.24 -1.30 104.47 98.87 Saharan Blend 107.56 111.87 4.31 111.89 108.35Other Crudes Brent 107.96 111.27 3.31 112.06 107.99 Dubai 103.52 106.81 3.29 109.40 104.60 Isthmus 109.18 109.09 -0.09 108.46 107.84 Mars 104.96 105.59 0.63 107.98 104.40 Minas 103.38 105.55 2.17 119.63 107.12 Urals 108.06 110.75 2.69 110.90 107.36 WTI 104.51 106.55 2.04 96.29 97.15Differentials WTI/Brent -3.45 -4.72 -1.27 -15.77 -10.84 Brent/Dubai 4.44 4.46 0.02 2.66 3.39
Year-to-date
Note: Arab Light and other Saudi Arabian crudes as well as Basrah Light preliminarily based on AmericanCrude Market (ACM) and subject to revision.
Source: Platt's, Direct Communication and Secretariat's assessments.

_________________________________________________________________________________________________________________________________________Monthly Oil Market Report
September 2013 7
signs of economic growth in the US, China and the Euro-zone, added further upward momentum. US GDP growth was revised up to 2.5% from 1.7%, pointing to rising demand growth. Signs of economic recovery in Europe were also felt, as Spanish exports surged and Italian consumer confidence hit a two-year high. During the latter part of the month, prices soared with global benchmark ICE Brent crude hitting six-month highs and US crude futures Nymex WTI trading at their highest level in 18 months as traders weighed the possible implications of on-going geopolitical developments. On the Nymex, the WTI front-month ended the month improving by $1.84 to an average of $106.54/b, the first time above the $105/b mark since March. Compared to the same period in 2012, WTI value is slightly higher by 71¢ or 0.7% at $97.13/b. This is the first time the year-to-date value of Nymex WTI front-month is higher this year compared to the all-time high year of 2012. On the ICE exchange, the Brent front-month improved by a hefty $3.02 to an average of $110.45/b, back again above the $110/b mark. On the other hand, year-to-date, ICE Brent was lower in value compared to the same period last year. Its value weakened by $3.92 or 3.5% to $108.23/b from $112/b. On 9 September, ICE Brent stood at $113.72/b and Nymex WTI at $109.52/b.
Graph 1.2: Nymex WTI futures and US$ exchange rate, 2013
Money managers expanded their net length and overall exposure in ICE Brent futures and options in August relative to the previous month, end of August data released by the ICE exchange showed. Speculators picked up 41,852 fresh ICE Brent futures and options longs, and shed 8,775 shorts, expanding their net length by a hefty 50,727 contracts to 321,962 contracts, the largest growth on record since data was first published in 2011. Overall exposure was also increased by a combination of 33,077 contracts long and short crude futures, leaving money managers with a total of 324,962 contracts. During the same period, money managers in the Nymex WTI markets marginally reduced their net length by 1,296 contracts, but overall numbers remain high at 317,523 contracts by the end of August. Short positions increased by 5,795 contracts while long numbers rose by 4,499 contracts. Managed money overall exposure in Nymex WTI futures increased by 10,294 to 387,803 future lots. Over this period, ICE Brent and Nymex WTI front-month increased by $7.45/b and $5.93/b, respectively, signifying greater bullish sentiments in the Brent market. Furthermore, open interest volume in both crude futures exchanges — ICE Brent and Nymex WTI — increased sharply by 75,754 and 24,738 contracts to 1.9 and 2.7 million lots, respectively.
1.261.271.281.291.301.311.321.331.341.35
80
85
90
95
100
105
110
115
01 A
pr
08 A
pr
15 A
pr
22 A
pr
29 A
pr
06 M
ay
13 M
ay
20 M
ay
27 M
ay
03 J
un
10 J
un
17 J
un
24 J
un
01 J
ul
08 J
ul
15 J
ul
22 J
ul
29 J
ul
05 A
ug
12 A
ug
19 A
ug
26 A
ug
02 S
ep
US$/€US$/b
Nymex WTI futures (LHS) US$/€ (RHS)

Monthly Oil Market Report_________________________________________________________________________________________________________________________________________
September 2013 8
The aggregate traded volume per day in both crude oil futures markets increased by almost 110,545 contracts in August, although the month’s total is less due to fewer trading days, leaving total futures traded at the two exchanges at over 1.3 million future contracts a day, equivalent to around 14.5 times the daily world oil demand. ICE Brent futures daily traded volumes increased by 19,334 contracts to 614,767, while Nymex WTI dropped a hefty 129,789 to 587,858 lots.
Graph 1.3: Nymex WTI price vs. speculative activity, 2012-13
The futures market structure Tightness and lower crude stocks firmed backwardation
Backwardation between first- and second-month ICE Brent crude futures has rallied over the month as short-term supply threats boosted prompt crude values compared with those further forward. Around 3 mb/d of oil supply has been lost to the market through various on-going disruptions in half a dozen countries. The demand side has also played its part with the use of direct burning crude for power generation peaking at 1.1 mb/d over the July–September peak summer months. Maintenance-related declines in North Sea production caused many September-loading cargoes to be deferred into October. In August, the spread between the second- and first-month ICE Brent contracts averaged around $1.25/b, the steepest since October 2011. In the US, Nymex WTI backwardation firmed for the second month in a row as crude stocks continue to be drawn from Cushing with more and more pipeline and rail takeaway capacity becoming available. Crude stocks in Cushing, the delivery point for WTI futures, have fallen by more than a quarter since the start of this year because of the Seaway pipeline reversal. Seasonal demand and firm backwardation of WTI also helped bring down Cushing stocks. The first versus second month time spread widened further to average over 50¢/b.
0
50
100
150
200
250
300
350
7580859095
100105110115
Dec
12
Jan
13
Feb
13
Mar
13
Apr
13
May
13
Jun
13
Jul 1
3
Aug
13
Managed money net long positions (RHS) WTI (LHS)
'000 ContractsUS$/b

_________________________________________________________________________________________________________________________________________Monthly Oil Market Report
September 2013 9
Graph 1.4: Nymex WTI and ICE Brent forward curve, 2013
Tightening European markets helped raise the Brent premium to WTI, masking the steady strengthening of WTI. ICE Brent managed money traders have been increasing net length more quickly, which has contributed to widening spreads as well. Moreover, the Brent market retained more of a supply risk premium than US oil, as any Middle East unrest could further tighten already strained global supplies. The US market is somewhat shielded from global ructions by rising domestic oil supplies. The front-month spread between Nymex WTI and ICE Brent widened to $3.90/b during the month of August, reversing last month’s record-setting narrowing trend.
Table 1.2: Nymex WTI and ICE Brent forward price, US$/b
The light-sweet/heavy-sour crude spread The light/sour spread widened except in the USGC
In August, global sweet/sour and light/heavy differentials were mixed as the spread in Europe and Asia widened, while in the US, the Light Louisiana Sweet (LLS)/Mars spread narrowed slightly. In Asia, the light sweet and heavy sour spread — represented by Tapis/Dubai —widened significantly by almost $1 to more than $10.50/b. The Tapis/Dubai spread was in double-digit territory for most of the month except for a few sessions towards month-end. Asian light, sweet crudes found plenty of support due to a wide Brent/Dubai spread that limited inflows of Brent-related grades from West Africa. The collapse in Libyan exports and seasonal field maintenance in the Pacific also tightened availability to some extent. Far Eastern buying interest for middle distillate-rich crude also surged in line with seasonal distillate stock rebuilding efforts. In Europe, the Brent/Ural and light/heavy spread flipped, with Urals trading at a discount of more than 50¢, compared to a premium of 10¢ the previous month. August saw a return to normal of the European light/heavy spread, as Urals moved to a discount to Dated Brent. Pressure for medium-sour Russian crude came from both sides, as lighter grades found support in missing rival barrels as well as ongoing North Sea maintenance, while Urals came under pressure from higher supplies due to Russian refinery maintenance as well as less demand owing to upcoming European refinery maintenance. Further support came from the product market as gasoline and middle distillate cracks improved, while fuel oil cracks remained lacklustre.
90
95
100
105
110
115
90
95
100
105
110
115
1FM 2FM 3FM 4FM 5FM 6FM 7FM 8FM 9FM 10FM 11FM 12FM
US$/bUS$/b
ICE Brent: 26 Jul 13 ICE Brent: 26 Aug 13Nymex WTI: 26 Jul 13 Nymex WTI: 26 Aug 13
FM = future month.
Nymex WTI 1st FM 2nd FM 3rd FM 6th FM 12th FM
26 Jul 13 104.70 104.01 102.78 98.87 94.0926 Aug 13 105.92 105.35 104.16 100.25 95.05
ICE Brent1st FM 2nd FM 3rd FM 6th FM 12th FM
26 Jul 13 107.17 106.29 105.65 103.98 101.2326 Aug 13 110.73 109.49 108.57 106.52 103.12
FM = future month.

Monthly Oil Market Report_________________________________________________________________________________________________________________________________________
September 2013 10
Graph 1.5: Brent Dated vs. Sour grades (Urals and Dubai) spread, 2013
In the US, the LLS/Mars spread remained relatively stable, narrowing slightly by 20¢ to the advantage of Mars, on average. Both grades lost strongly relative to both WTI and Dated Brent. LLS and Mars traded at a premium of around $21/b and $16/b to WTI in January, compared to $6/b and 50¢/b in August, respectively. The weakness of both grades was also reflected in the product market as all cracks improved markedly towards the end of the month on the back of weakening crude prices. Both LLS and Mars were affected by outages at two Motiva refineries on the United States Gulf Coast (USGC).
-4
-2
0
2
4
6
8
-4
-2
0
2
4
6
8
01 A
pr
08 A
pr
15 A
pr
22 A
pr
29 A
pr
06 M
ay
13 M
ay
20 M
ay
27 M
ay
03 J
un
10 J
un
17 J
un
24 J
un
01 J
ul
08 J
ul
15 J
ul
22 J
ul
29 J
ul
05 A
ug
12 A
ug
19 A
ug
26 A
ug
02 S
ep
US$/bUS$/b
Dubai Urals

_________________________________________________________________________________________________________________________________________Monthly Oil Market Report
September 2013 11
Commodity Markets Trends in selected commodity markets Since the sharp decline in the first four months of the year, commodity prices have recovered by almost 10% on average
Since the sharp decline in the first four months of the year, commodity prices have recovered by almost 10% on average. While in the past, the main source of price increases in the physical market has come from growing demand in emerging and developing economies, it has been the recovery of the major OECD economies in combination with geopolitical tensions, mainly in the Middle East and North Africa region, which has again led to rising prices. The increased interest in the field of commodities has also become obvious when reviewing the latest data on speculative activity, which rose in gold and oil, probably again to hedge against inflation. However, the price behaviour among commodities has been different. While energy and precious metals have supported the average price trend, industrial metals and, particularly agricultural products, have continued underperforming. The recovery in commodities on average has been driven by energy prices, which have risen by around 15% since hitting bottom in mid-April. Moreover, precious metals were also in demand in a flight to safety since the beginning of July. Since then, gold recovered by about 15%, but is still trading below the low level seen in April. Silver, however, recovered by around 25% since then and is now trading above the April level. On the other hand, amid plenty of supply, agricultural commodities have continued sliding in the past months. While industrial metals and, particularly, copper also declined in the past months, it seems that the recent slight turnaround of the slowing momentum in China has also brought this decline to a halt.
Table 2.1: Commodity price data, 2013
In general, future average price increases are expected to become more muted in the main commodity areas compared to past developments. This is mainly attributable to the slowdown in emerging and developing economies, and while the recovery in OECD economies currently seems to be a major support factor for economic development, relative demand for commodities in industrialised economies is lower. On a positive note, the more muted price rises in commodities have also led to less accentuated global inflation this year.
Jun 13 Jul 13 Aug 13 Jun/May Jul/Jun Aug/Jul
Energy 178.7 186.6 190.7 -0.1 4.4 2.2Coal, Australia $/mt 82.8 77.3 77.0 -5.7 -6.6 -0.4Crude oil, average $/bbl 99.7 105.3 108.2 0.4 5.5 2.8Natural gas, US $/mmbtu 3.8 3.6 3.4 -5.4 -5.4 -5.3Non Energy 173.9 171.5 170.9 -1.6 -1.4 -0.3Agriculture 180.6 176.4 172.5 -0.7 -2.3 -2.2Food 199.5 194.6 187.1 0.3 -2.5 -3.9Soybean meal $/mt 558.0 563.0 524.0 2.8 0.9 -6.9Soybean oil $/mt 1,041.0 995.0 997.0 -3.0 -4.4 0.2Soybeans $/mt 524.0 509.0 514.0 5.4 -2.9 1.0Grains 241.6 239.7 228.2 3.0 -0.8 -4.8Maize $/mt 298.4 279.5 238.7 1.0 -6.3 -14.6Wheat, US, HRW $/mt 313.4 304.6 305.3 -2.0 -2.8 0.2Sugar World ¢/kg 37.7 37.1 37.5 -3.0 -1.5 1.2Base Metal 149.7 147.0 153.1 -2.6 -1.8 4.2Aluminum $/mt 1,814.5 1,769.6 1,817.6 -1.0 -2.5 2.7Copper $/mt 7,000.2 6,906.6 7,192.9 -3.4 -1.3 4.1Iron ore, cfr spot ¢/dmtu 114.8 127.2 136.7 -7.7 10.8 7.5Lead ¢/kg 210.0 204.8 217.4 3.3 -2.5 6.2Nickel $/mt 14,280.3 13,750.3 14,314.9 -4.5 -3.7 4.1Tin ¢/kg 2,026.7 1,956.4 2,164.4 -2.4 -3.5 10.6Zinc ¢/kg 183.9 183.8 189.9 0.4 -0.1 3.3Precious MetalsGold $/toz 1,343.4 1,285.5 1,351.7 -5.0 -4.3 5.2Silver ¢/toz 2,110.9 1,971.0 2,189.4 -8.4 -6.6 11.1
Source: World Bank, Commodity price data.
World Bank commodity price indices for low and middle income countries (2005 = 100)
UnitCommodity Monthly averages % Change

Monthly Oil Market Report_________________________________________________________________________________________________________________________________________
September 2013 12
Decelerating foreign investments into key emerging economies have also been an important and influential factor for the commodity price decline. The start of the Federal Reserve Board’s reduction of monetary stimulus in the near future could further impact the price development as it has been observed that rising commodity prices were closely correlated with rising monetary supply from mainly the developed economies’ central banks. While energy prices rose for the second consecutive month by 2.2% m-o-m in August and 4.4% m-o-m in July, the natural gas price declined again for the fourth consecutive month, falling by 5.3% m-o-m in August, almost at the same level as in the previous two months. The agricultural sector also showed some weakness, falling by 2.2%. The decline in base metal prices seems to have come to an end. They rose by 4.2% m-o-m in August. As already highlighted, precious metals continued recovering, and both gold and silver increased by 5.2% and 11.1%, respectively.
Graph 2.1: Major commodity price indexes, 2011-13
In August, the Henry Hub (HH) natural gas price index decreased by 5.3% for the
fourth straight month. Gas prices have been under pressure earlier in the month as Northeast and Midwest temperatures turned milder and allowed homeowners and businesses to turn down their air conditioners. Bearish inventory reports also affected prices negatively. However, as warmer temperatures during the second half of the month drove up demand for air conditioning, particularly in the Northeast and Midwest, prices posted a 3.9% increase.
Graph 2.2: Inventories at the LME
0
100
200
300
400
500
0
100
200
300
400
500
Aug
11Se
p 11
Oct
11
Nov
11
Dec
11
Jan
12Fe
b 12
Mar
12
Apr 1
2M
ay 1
2Ju
n 12
Jul 1
2Au
g 12
Sep
12O
ct 1
2N
ov 1
2D
ec 1
2Ja
n 13
Feb
13M
ar 1
3Ap
r 13
May
13
Jun
13Ju
l 13
Aug
13
IndexIndex
Energy Non-energy Agriculture Food
Base metals HH natural gas Gold
Source: World Bank, Commodity price data.
6,250
6,500
6,750
7,000
7,250
7,500
7,750
6,250
6,500
6,750
7,000
7,250
7,500
7,750
Aug
12
Sep
12
Oct
12
Nov
12
Dec
12
Jan
13
Feb
13
Mar
13
Apr 1
3
May
13
Jun
13
Jul 1
3
Aug
13
'000 Tonnes'000 Tonnes
Source: London Metal Exchange and Haver Analytics.

_________________________________________________________________________________________________________________________________________Monthly Oil Market Report
September 2013 13
Investment flows into commodities Total OIV in major commodity markets in the US increased marginally in August
The total open interest volume (OIV) in major commodity markets in the US increased marginally by a little over 0.5% m-o-m to 8.8 million contracts in August. The growth was mainly attributed to higher OIV in agriculture, crude oil and livestock, with the latter increasing by more than 5% compared to the previous month. The remaining commodities’ OIV decreased over the month. Total net length speculative positions in commodities increased sharply by almost 10% m-o-m to 542,210 contracts in August compared to the sharp decline of more than 20% in the previous month. The data reflected the significant bullish speculative sentiments across the board in the commodity markets, particularly in precious metals, gold and livestock, as they increased by over 25% each, over the month. Agricultural OIV rose by 1.3% m-o-m to 4,216,697 contracts in August. Money managers’ net long positions in agriculture increased by 4.7% to 99,452 lots in August, after a hefty reduction last month amid forecasts for record supplies and rising carryout in the year ahead.
Graph 2.3: Total open interest volume, futures and options
Henry Hub natural gas’s OIV decreased again by 2.3% m-o-m to 1,357,482 contracts in August. Money managers’ net length positions decreased sharply to now stand at 18,377 net short contracts amid lower demand in the beginning of the month due to milder weather.
Graph 2.4: Speculative activity in key commodities, net length
6,000
6,500
7,000
7,500
8,000
8,500
9,000
9,500
6,000
6,500
7,000
7,500
8,000
8,500
9,000
9,500
Aug
11
Sep
11
Oct
11
Nov
11
Dec
11
Jan
12Fe
b 12
Mar
12
Apr
12
May
12
Jun
12Ju
l 12
Aug
12
Sep
12
Oct
12
Nov
12
Dec
12
Jan
13Fe
b 13
Mar
13
Apr
13
May
13
Jun
13Ju
l 13
Aug
13
'000 contracts
Source: US Commodity Futures Trading Commission.
'000 contracts
-300
0
300
600
900
1,200
-300
0
300
600
900
1,200
Jul 1
1Au
g 11
Sep
11O
ct 1
1N
ov 1
1D
ec 1
1Ja
n 12
Feb
12M
ar 1
2Ap
r 12
May
12
Jun
12Ju
l 12
Aug
12Se
p 12
Oct
12
Nov
12
Dec
12
Jan
13Fe
b 13
Mar
13
Apr 1
3M
ay 1
3Ju
n 13
Jul 1
3Au
g 13
'000 contracts'000 contracts
Agriculture Gold WTI Natural gas Livestocks Copper
Source: US Commodity Futures Trading Commission.

Monthly Oil Market Report_________________________________________________________________________________________________________________________________________
September 2013 14
Copper’s OIV decreased 3.5% m-o-m for two months in a row to 160,596 contracts in August. The group of investors reversed their net short positions to stand at a net length of 4,895 contracts, helped by data from China that reinforced expectations of a rebound in demand for metals from the world's largest consumer.
Graph 2.5: Speculative activity in key commodities as % of open interest
Gold’s OIV decreased by 8% m-o-m to 389,030 contracts in August. However, hedge funds and money managers have boosted bullish bets in US gold by 23% m-o-m to 47,885 lots, the highest levels in several months, as fears over US-led military strikes on Syria triggered safe-haven buying.
Table 2.2: CFTC data on non-commercial positions, ’000 contracts
Graph 2.6: Inflow of investment into commodities, 2009 to date
-20-1001020304050
-20-10
01020304050
Jul 1
1Au
g 11
Sep
11O
ct 1
1N
ov 1
1D
ec 1
1Ja
n 12
Feb
12M
ar 1
2Ap
r 12
May
12
Jun
12Ju
l 12
Aug
12Se
p 12
Oct
12
Nov
12
Dec
12
Jan
13Fe
b 13
Mar
13
Apr 1
3M
ay 1
3Ju
n 13
Jul 1
3Au
g 13
%%
Agriculture Gold WTI Livestocks Copper Natural gas
Source: US Commodity Futures Trading Commission.
Jul 13 Aug 13 Jul 13 % OIV Aug 13 % OIV
Crude oil 1,834 1,876 277 15 276 15Natural gas 1,389 1,357 0 0 -18 -1Agriculture 4,163 4,217 95 2 99 2Precious metals 556 519 44 8 60 11Copper 166 161 -22 -13 5 3Livestock 611 640 95 16 121 19Total 8,720 8,770 489 6 543 6Source: US Commodity Futures Trading Commission.
Open interest Net length
020406080
100120140160
1Q 2Q 3Q 4Q 1Q 2Q 3Q 4Q 1Q 2Q 3Q 4Q 1Q 2Q 3Q 4Q 1Q 2Q Jul
2009 2010 2011 2012 2013
US$ bn
Agriculture Copper Gold Natural gas WTI crude oil
Source: US Commodity Futures Trading Commission.

_________________________________________________________________________________________________________________________________________Monthly Oil Market Report
September 2013 15
World Economy Table 3.1: Economic growth rate 2013-14, % World OECD US Japan Euro-zone China India 2013 2.9 1.2 1.7 1.7 -0.5 7.6 5.3 2014 3.5 1.9 2.5 1.4 0.6 7.7 6.0
Industrialised countries US US forecast for this year revised up slightly to 1.7%; forecast for 2014 unchanged at 2.5%, due to ongoing uncertainties
The upward revision of the US 2Q13 GDP number from the previous 1.7% q-o-q seasonally adjusted annualised rate (saar) to 2.5% q-o-q has confirmed that the economy is enjoying positive momentum, mainly supported by an underlying healthy development in private household consumption. Moreover, the rise in the second quarter comes after only a 1.1% q-o-q saar expansion in 1Q13. This points to a solidly rising momentum and could also indicate that the first quarter has been adversely impacted by the debate on the necessary fiscal spending cuts at that time. While the positive momentum is forecast to continue in the second half, uncertainties prevail. The ongoing budget negotiations in Congress in connection with the potentially necessary increase of the debt ceiling by the end of October is one major aspect that again could increase uncertainty of private households. If this is not solved in an orderly manner, it could keep consumers from spending and businesses from investing in the economy. Furthermore, the indication by the Federal Reserve Board (Fed) to reduce its monetary stimulus is another important aspect to consider. Not only is this impacting the local economy, but as has been seen by global reactions, it also has the potential to have an unwanted effect on those economies that have largely benefited from US-dollar investments. This is an important observation, which will make this a very sensitive decision as to when and at which magnitude to reduce the stimulus. The Fed has communicated that it monitors labour market improvements and inflation to make this decision. While inflation rose to a healthy 2.0% in July, the latest data from the labour market has again provided a somewhat mixed picture with a falling unemployment rate, less-than-expected job growth and a falling participation rate. Therefore, it remains to be seen what the Fed will communicate at its next meeting on 17-18 September, but it will need to strike a delicate balance. Given the latest expectation of a reduction in monetary stimulus, mortgage rates have already increased. The average thirty-year mortgage rate has increased from 3.45% in April to 4.46% in August. While the Fed is expected to primarily cut back on buying treasury bonds, the avoidance of a further rise in sensitive mortgage rates will also be a key aspect of its future policy. Mixed signals come from the labour market. The unemployment rate continued to decline, ending at 7.3% in August from 7.4% in July. Non-farm payrolls rose by 169,000 in August after a significantly revised 104,000 in July. The share of long-term unemployment increased for the second consecutive month in August to a level of 37.9% from 37.0% in July, and the participation rate fell again to now stand at 63.2%, a record low. The consumer confidence sentiment index of the Conference Board increased very slightly to 81.5 in August from 81.0 in July. The other important consumer sentiment indicator of the University of Michigan fell to 82.1 from 85.1. The manufacturing sector continues improving. The purchasing manager’s index (PMI) for the manufacturing sector, as provided by the Institute of Supply Management (ISM), increased to 55.7 in August, after an already high reading of 55.4 in July. Moreover, some recovery in manufacturing has been confirmed also by manufacturing order numbers, although they have clearly decelerated, rising by 1.4% in July, after 6.9% in June. The ISM for the services sector, which constitutes more than two-thirds of the economy, also increased to an elevated level of 58.6 in August from 56.0 in July.

Monthly Oil Market Report___________________________________________________________________________________________________________________________________________
September 2013 16
Graph 3.1: ISM manufacturing and non-ISM manufacturing indices
The very important housing sector also provides mixed signals, probably already being negatively impacted by rising mortgage rates. Pending home sales fell by 1.3% in July, after a decline of 0.4% in June, according to the National Association of Realtors. Pending home sales are considered a leading indicator of progress in real estate because they track contract signings. Positively, the yearly change of the house pricing index of the Federal Housing Finance Agency (FHFA) has continued its rising trend at a monthly price increase of 7.7% y-o-y in June, the largest increase since April 2006. While the momentum in the first quarter seems to have been significantly impacted by the fiscal drag, the second quarter’s performance is pointing to some improvements that are forecast to continue in the second half. Taking this into consideration, the forecast for this year has been revised up slightly from 1.6% to 1.7%. However, with the main uncertainties coming from the fiscal and the monetary side, major challenges remain for the economy, and the forecast for 2014 remains unchanged at 2.5%.
Japan The Japanese economy continues to benefit from the large government-led stimulus. Growth forecast has been revised from 1.9% to 1.7% in 2013; 2014 growth remains at 1.4%
As in the previous months, Japan continues its expansion, backed by the stimulus measures that have been introduced by the government and additionally through an increase in exports, benefitting from the recovery of its most important trading partners in the OECD and also from China’s recent improvements. While the monetary stimulus of the Bank of Japan (BoJ) has so far been the main driver of the so-called three arrows, the fiscal stimulus that has been implemented at the end of the last year has also been helpful. However, given the high debt level of the economy, further fiscal stimulus is expected to be limited, while the so-called third arrow of fiscal reforms will be of greater importance. In general, this year’s expansion seems to be well supported, led by government support and also aided by recent global economic improvements, which are expected to continue into the second half of the year. This positive momentum has also been reflected in the latest economic outlook of the BoJ, which cautiously pointed at a moderately recovering economy. The BoJ also highlighted the improvements in the economy’s external trade and in private investments, and pointed to rising public investments, which increased by 7.3% q-o-q saar in the second quarter and by 4.5% saar in the first quarter. In this respect, it is also of interest that government consumption increased by 3.4% q-o-q saar, a level which, given the tight budgetary situation, should not be expected to continue. The expected limitations of increased public spending due to the need for fiscal adjustments lead to a forecast of less growth in Japan’s economy in the second half, compared to the first half of 2013. While GDP growth in 1H13 stood at around 3.2% saar, it is forecast to be closer to 3.0% saar in 2H13. The continued monetary stimulus and the third arrow of the government, to implement structural changes, will be the main drivers. The discussion on the planned sales tax increase as one important part of raising government revenues in order to reduce dependency on debt has continued. After the recent improvement in the domestic economy and in foreign trade, the government
45
50
55
60
Sep
12
Oct
12
Nov
12
Dec
12
Jan
13
Feb
13
Mar
13
Apr 1
3
May
13
Jun
13
Jul 1
3
Aug
13
Index
ISM manufacturing index ISM non-manufacturing index
Source: Institute for Supply Management.

_________________________________________________________________________________________________________________________________________Monthly Oil Market Report
September 2013 17
seems to be more confident about moving ahead with this plan. The raising of the consumption tax is planned in two steps. It will be increased to 8% by 2014 and to 10% by 2015, from currently 5%. It should also be noted that the raise of the consumption tax might turn out to be a risky move. In 1997, the last time the tax was increased, it led to a recession and a slump in retail sales, and to a steep decline in central government tax revenues. The cabinet office itself has released a forecast of only 1.0% GDP growth for the next fiscal year 2014/2015 in the case the sales tax increase is implemented as planned. However, recent comments from the BoJ have also been confident on moving ahead, and the BoJ has indicated that, while there is still room for fiscal adjustments ‒ in case of a too strong negative effect ‒ the BoJ might also further accommodate its monetary policy. Industrial production has increased by 0.2% y-o-y, which corresponds to a monthly rise of 3.2%, i.e. significant monthly upward momentum. This has, to some extent, been fuelled by rising exports, which increased by 9.1% y-o-y in July, after a rise of 10.7% in June and also by improving domestic demand. According to the 1H13 GDP numbers, the local momentum has been broad-based, but with the latest retail numbers as an important element of GDP declining by 0.3% y-o-y in July, the 2H13 support from the domestic side might be a little bit softer. Sentiment points at a continuation of the current growth momentum. The latest PMI numbers, as provided by Markit, show an increase for the manufacturing sector from 50.7 to 52.2, and for the services sector, a rise from 50.6 to 51.2. A lower consumer confidence index level, declining from 44.3 in June to 43.6 in July, also points to some slowing momentum, at least in the very short term, for domestic demand based on numbers provided by the Cabinet Office. Inflation has improved significantly, but remains much below the targeted level of 2% for next year. While it fell by 0.3% y-o-y in May, it rose by 0.2% in June, and the latest numbers show a rise of 0.7% for July. The yen also performed relatively well at approximately ¥100/$ in the past two months. By taking into account the latest release of actual 1H13 GDP numbers, the 2013 forecast has been revised from 1.9% to 1.7%. While growth for the current year is relatively well established, the potential for next year remains to be seen. The increase of the consumption tax is expected to largely impact the 2Q14 growth number, which is now expected to be flat, after a more significant rise in 1Q14 ahead of the tax increase. Taking into consideration this negative impact and its continued drag for the remainder of the year and also some slower underlying momentum in 2014 due to reduced public spending, the economy’s growth forecast for 2014 remains at 1.4%.
Euro-zone The Euro-zone’s second quarter GDP performance better than expected, growing 0.3% q-o-q The forecast for 2013 revised to minus 0.5% from minus 0.6%, while the forecast for 2014 remains at 0.6%
The Euro-zone’s second quarter GDP performance was better than expected, growing 0.3% q-o-q. While the momentum has been gradual, it has a relatively broader base, with Germany picking up by 0.7%, France’s GDP rising by 0.7% and even Italy’s GDP declining only by 0.2% and Spain’s GDP dropping by just 0.1%. This increase in GDP marks the end of a long decline. GDP growth rates have now been falling in the Euro-zone for six quarters, the longest recession for the Euro-zone on record. The pickup is forecast to continue in 2H13, and slowly growing output should be expected in the next year. The Euro-zone has been the most negatively affected economic region within the OECD with a wide impact on global growth, so the latest development is very positive, also for emerging and developing economies, for which the Euro-zone remains a very important trading partner. But some uncertainties prevail, and it might still be too early to change the assumption of slowly and only gradually moving out of the recession. The banking system remains relatively weak, political uncertainties in Italy continue and the domestic economy in Spain is still dealing with very high unemployment levels. These are among other issues that might keep the Euro-zone’s development from a significant turnaround. In general, there has been some improvement in the past weeks in the underlying economy, but the strength of the momentum remains unclear. Industrial production for the Euro-zone improved by 1.2% q-o-q in 2Q13 after a rise of 0.2% q-o-q in 1Q13. This came after a decline lasting almost five quarters. Some of the most recent lead indicators are also pointing to improvements in the economy, particularly for the manufacturing sector. The latest PMI for manufacturing, as provided by Markit, stood

Monthly Oil Market Report___________________________________________________________________________________________________________________________________________
September 2013 18
above the growth-indicating level of 50 in August for the second consecutive month. It stood at 51.4, compared to 50.3 in July. Also, the services sector index increased to stand above the 50-level for the first time in August, ending at 50.7. The lagging indicators of the labour market, however, are still pointing to the challenges with which the economy is dealing. The unemployment rate in July remained at 12.1%. Again, the highest level of unemployment among the larger Euro-zone economies was recorded in Spain, with a rate of 26.3%. Youth unemployment for the Euro-zone also increased to 24.0% from 23.9%, with Spain keeping the top mark of 56.1%, a rise from June’s level of 55.9%. This situation of the labour market in the Euro-zone has held back domestic consumption in the past months, but this area now seems to start to be recovering softly. Retail sales increased on a value base in July by 0.2% m-o-m, after a decline of 0.5% in June, while May had already increased by 1.2% m-o-m. By looking into the two largest economies, the picture remains mixed. Industrial production in Germany continues to decline on a yearly basis, but is improving. It fell by 1.2% y-o-y in July, after a decline of 1.4% y-o-y in June. Improvement in Germany was found in the development of manufacturing orders, a lead indicator for future production, which increased by 3.5% y-o-y in June after a decline of 2.4% y-o-y in May. This positive trend is also confirmed by the Ifo business climate index, a reasonable lead indicator for German business activity, which rose again in August to 107.5 from 106.2 in July and 105.9 in June. Yet, in France industrial production fell by 0.2% y-o-y after a rise of 0.9% in May. The National Institute of Statistics and Economic Studies (INSEE) business climate index, however, indicated that this decline might be temporary. It rose to a level of 90 in August, the highest level in more than a year. While this slight improvement of the Euro-zone’s economy has been highlighted by the president of the European Central Bank (ECB), the ECB is sending a clear signal that it will keep interest rates at low levels for the foreseeable time, and if interest rates rise further, as has been the case in the past months, it will continue to act accordingly. In this respect, the ECB has made it clear that it would not tolerate rising interest rates, which could be detrimental to the still fragile recovery. After its latest meeting, it kept the key policy rate unchanged at 0.5%. One of the major issues is the continuously impaired transmission channel of money flows in the Euro-zone’s financial system. This is still a significant issue for the ECB. The latest available data from July shows a record decline of 3.3% y-o-y after June’s fall of 2.9%. Rising market interest rates are therefore a very unwelcome development. Taking into consideration the better-than-expected second quarter GDP number, the forecast for 2013 has been lifted from minus 0.6% to minus 0.5%. Many uncertainties, however, prevail. Therefore, the 2014 forecast remains unchanged at 0.6%. It remains to be seen to what extent the economy will manage to rebound in coming months, but it will certainly need the larger economies of Germany and France to improve, with the other peripheral economies, particularly Italy and Spain, supporting this momentum as well.
Emerging markets and developing countries India’s 2013 forecast revised down to 5.3%
The early signs of an economic pick-up in Brazil represented by the notable growth rate of the second quarter’s GDP and inflation drop, together with a slide in the unemployment rate, have not been supported by the manufacturing outlook shown by August’s PMI reading. The outlook has not changed this month, due to yet largely mixed signals. It must be noted, however, that the risk is now less skewed to the downside, compared with last month’s analysis. The GDP forecast remains at 2.5% and 2.8% for 2013 and 2014, respectively. Russia’s disappointing growth rate of 1.4% in the first half of this year, along with the trimming of the official forecast to just 1.8%, have overshadowed the few positive economic signals that emerged in the beginning of the second half. However, the looming risk that this year may witness the slowest expansion rate since the 2009 contraction, is now on the rise as well as the likelihood of a further GDP down revision.

_________________________________________________________________________________________________________________________________________Monthly Oil Market Report
September 2013 19
India’s GDP growth rate for 2013 was revised down to 5.3%, and the 2Q13 growth rate was around 4.4%, much lower than expected, but the 2014 GDP growth rate expectation remains unchanged at 6.0%. China’s real GDP growth expectation y-o-y remained unchanged in August at 7.6% for 2013 and 7.7% for 2014. Economic growth over the next few years will be driven by consumption and fiscal spending aimed at improving standards of living and rebalancing.
Table 3.2: Summary of macroeconomic performance of BRIC countries
Brazil Mixed economic signals in Brazil, although less skewed to the downside
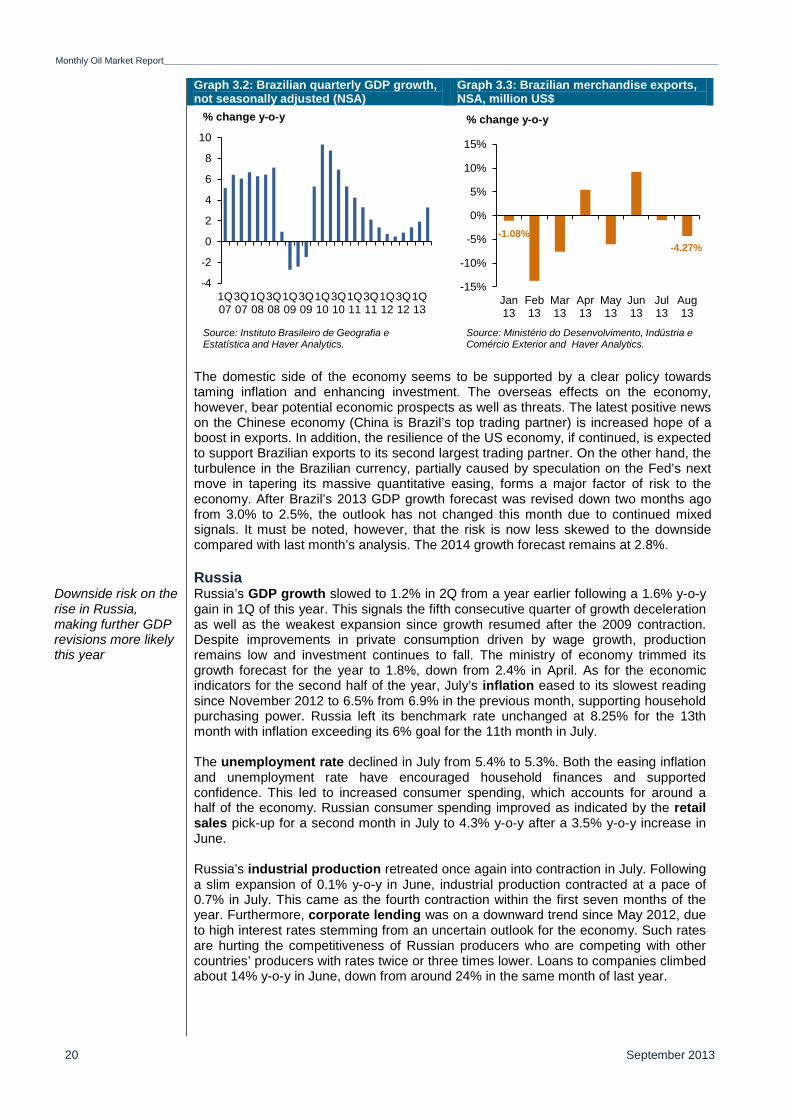
The latest 2Q13 GDP figure showed that the Brazilian economy grew at its fastest pace in eight quarters at 3.3% y-o-y, up from a disappointing expansion of 1.9% y-o-y in 1Q13. The notable improvement has been supported by healthier investment and higher agricultural production. After it had grown by 3% in 1Q, investment accelerated by 9% in 2Q, whereas domestic consumption increased at a rate of 2.3% from 2.1% in the first three months of the year. At the same time, public spending decelerated by around 1%, and imports grew faster than exports at 7.9% and 6.3%, respectively. Since the mass protests in Brazil two months ago, Brazil’s monetary policy is focusing on mitigating inflation risk. The central bank raised the key “Selic” rate by half a percentage point (pp) to 9%. This is the third straight policy tightening aimed at putting inflation on a decline and assures that this trend will persist next year. This came amid inflationary risks caused by weaker exchange rates, which put upward pressure on prices. The real depreciation of around 11% over the last three months represents a significant threat to efforts to slow inflation in Brazil given the economy’s current account deficit. The central bank of Brazil has raised its benchmark interest rate more than any major economy this year, bringing it up 1.25 pp from a record low of 7.25 pp in March. By reducing public spending and tightening monetary policy, inflation finally started to move into the desired direction. Brazil’s National Consumer Price Index (INPC) fell to 6.4% y-o-y in July from 7% a month earlier. This latest reading put inflation back within the central bank’s target boundaries between 2.5 and 6.5%. The increase in food and beverage prices decelerated in July to 11.9% from 13.3%. Adding to the latest positive signals, the unemployment rate slowed in Brazil to register 5.6%. The HSBC Brazil manufacturing PMI showed a slowing pace of deterioration in manufacturing business conditions in August compared to the previous month. The index rose to 49.4, though still in contraction territory, signaling an output fall at a marginal and slower pace. The survey showed lower levels of new orders for the second month running. This situation has been attributed to weaker demand and increased competition from Chinese manufacturers. Furthermore, the survey found that manufacturers’ cost burdens rose at the sharpest rate in almost five years during August, due to the continued depreciation of the Brazilian real against the dollar.
2013 2014 2013 2014 2013 2014 2013 2014 2013 2014
Brazil 2.5 2.8 6.0 5.8 -73.3 -81.6 -3.1 -3.2 59.8 61.2Russia 2.6 3.0 6.3 5.6 50.0 36.4 -0.5 -0.3 8.0 8.0India 5.6 6.0 9.3 8.6 -92.5 -83.1 -5.1 -4.9 48.8 48.0China 7.6 7.7 2.7 3.6 175.9 155.9 -2.1 -2.1 16.3 16.9
GDPgrowth rate
CPI, % change y-o-y
Current account balance, US$ bn
Government fiscal balance,
% of GDP
Source: OPEC Secretariat, Economic Intelligence Unit and Financial Times.
Net public debt,
% of GDP
Monthly Oil Market Report___________________________________________________________________________________________________________________________________________
September 2013 20
Graph 3.2: Brazilian quarterly GDP growth, not seasonally adjusted (NSA)
Graph 3.3: Brazilian merchandise exports, NSA, million US$
The domestic side of the economy seems to be supported by a clear policy towards taming inflation and enhancing investment. The overseas effects on the economy, however, bear potential economic prospects as well as threats. The latest positive news on the Chinese economy (China is Brazil’s top trading partner) is increased hope of a boost in exports. In addition, the resilience of the US economy, if continued, is expected to support Brazilian exports to its second largest trading partner. On the other hand, the turbulence in the Brazilian currency, partially caused by speculation on the Fed’s next move in tapering its massive quantitative easing, forms a major factor of risk to the economy. After Brazil’s 2013 GDP growth forecast was revised down two months ago from 3.0% to 2.5%, the outlook has not changed this month due to continued mixed signals. It must be noted, however, that the risk is now less skewed to the downside compared with last month’s analysis. The 2014 growth forecast remains at 2.8%.
Russia Downside risk on the rise in Russia, making further GDP revisions more likely this year
Russia’s GDP growth slowed to 1.2% in 2Q from a year earlier following a 1.6% y-o-y gain in 1Q of this year. This signals the fifth consecutive quarter of growth deceleration as well as the weakest expansion since growth resumed after the 2009 contraction. Despite improvements in private consumption driven by wage growth, production remains low and investment continues to fall. The ministry of economy trimmed its growth forecast for the year to 1.8%, down from 2.4% in April. As for the economic indicators for the second half of the year, July’s inflation eased to its slowest reading since November 2012 to 6.5% from 6.9% in the previous month, supporting household purchasing power. Russia left its benchmark rate unchanged at 8.25% for the 13th month with inflation exceeding its 6% goal for the 11th month in July. The unemployment rate declined in July from 5.4% to 5.3%. Both the easing inflation and unemployment rate have encouraged household finances and supported confidence. This led to increased consumer spending, which accounts for around a half of the economy. Russian consumer spending improved as indicated by the retail sales pick-up for a second month in July to 4.3% y-o-y after a 3.5% y-o-y increase in June. Russia’s industrial production retreated once again into contraction in July. Following a slim expansion of 0.1% y-o-y in June, industrial production contracted at a pace of 0.7% in July. This came as the fourth contraction within the first seven months of the year. Furthermore, corporate lending was on a downward trend since May 2012, due to high interest rates stemming from an uncertain outlook for the economy. Such rates are hurting the competitiveness of Russian producers who are competing with other countries’ producers with rates twice or three times lower. Loans to companies climbed about 14% y-o-y in June, down from around 24% in the same month of last year.
-4
-2
0
2
4
6
8
10
1Q07
3Q07
1Q08
3Q08
1Q09
3Q09
1Q10
3Q10
1Q11
3Q11
1Q12
3Q12
1Q13
% change y-o-y
Source: Instituto Brasileiro de Geografia e Estatística and Haver Analytics.
-1.08%-4.27%
-15%
-10%
-5%
0%
5%
10%
15%
Jan13
Feb13
Mar13
Apr13
May13
Jun13
Jul13
Aug13
Source: Ministério do Desenvolvimento, Indústria e Comércio Exterior and Haver Analytics.
% change y-o-y

_________________________________________________________________________________________________________________________________________Monthly Oil Market Report
September 2013 21
Graph 3.4: Russian GDP growth, NSA Graph 3.5: Russian corporate loans, non-financial corporations, NSA
Russia’s manufacturing PMI remained below 50 for the second consecutive month, though it marginally increased in August to 49.4 from 49.2. This signals an ongoing downturn in overall manufacturing conditions in the Russian goods-producing sector. The survey showed stagnation in the export market, along with some increase in new work in the domestic market. With slower inflation and low unemployment, household consumption is seen to remain a significant supporting factor to the economy. Due to the disappointing rate of expansion in the first half of the year, however, achieving more than 2% GDP growth rate this year has become rather challenging, and a further downward revision is now more likely. The GDP growth forecast for 2014 remains unchanged at 3.0%.
India India has begun tackling its growing current account deficit amid the steep depreciation of its currency
The past couple of years have seen a marked deterioration in perceptions about India’s economic prospects. The business environment is weak, infrastructure remains dilapidated, FDI inflows have stagnated and an inadequate supply-side response has led to persistently high food price inflation. A modest recovery at the end of the 3rd week of August 2013 notwithstanding, the Indian rupee continues to tumble and was among the worst performing emerging market currencies over the last three months. Even as the current account deficit has begun to narrow, the Foreign Exchange (FX) market is in the midst of a full-blown self-fulfilling spiral where currency weakness is driving more weakness. Markets have been surprised that the authorities have refrained from intervening more aggressively in the FX market and have begun to doubt the central bank’s resolve to defend its interest rates. The rupee has depreciated by almost 17% in just three months, and the chances of a further depreciation remain high. India’s rupee was on track for its worst one-day fall in more than two decades on Wednesday, 28 August 2013, plunging 3.4% in morning trading to breach Rs68 to the US dollar for the first time, despite the government’s release of a 10-point plan to reduce the nation’s current account deficit and restore economic growth. The rapid slide in the rupee means that India’s immediate priority is to protect the current account deficit. Although India’s foreign exchange reserves still cover the import bill for about six months, they have depleted considerably since, say 2007, when they provided import cover of about 18 months. And if the rupee continues its downward trend, the situation could get rapidly worse.
-15%
-10%
-5%
0%
5%
10%
15%
1Q07
3Q07
1Q08
3Q08
1Q09
3Q09
1Q10
3Q10
1Q11
3Q11
1Q12
3Q12
1Q13
% change y-o-y
Source: State Committee of the Russian Federation and Haver Analytics.
24.7%
14.9%14.0%
10%
15%
20%
25%
30%
Jan
12
Mar
12
May
12
Jul 1
2
Sep
12
Nov
12
Jan
13
Mar
13
May
13
Sources: Central Bank od the Russian Federation and Haver Analytics.
% change y-o-y

Monthly Oil Market Report___________________________________________________________________________________________________________________________________________
September 2013 22
Graph 3.6: Indian PMI Graph 3.7: Indian GDP growth (saar )
2Q13 GDP growth forecast at 4.4% y-o-y was slightly below market expectations. The release reflects a loss of growth momentum, which is likely to continue until 3Q13. Growth will likely get a boost from a strong monsoon and an expansive food security bill later this year, but the stagflationary shock from the rupee depreciation over the last three months and high interest rates are expected to be a key drag on growth. Considering the most recent weakness in the first half and the ongoing uncertainties about the second half GDP growth momentum, the 2013 growth forecast has been revised down to 5.3% from 5.6%, while the 2014 forecast remains unchanged at 6.0%, but the situation will be closely monitored.
China Some signs of a possible recovery of China’s domestic economy
Real GDP growth expectation remained unchanged y-o-y in August at 7.6% for 2013 and 7.7% for 2014. A tougher approach to credit issuance in the coming months will be balanced by a modest acceleration in government infrastructure spending. Overall, economic growth is forecast to remain subdued this year, at 7.6%. The strong expansion in investment in 2012 is unlikely to be repeated this year, with depressed business confidence serving to dampen real investment growth. Another factor limiting real GDP expansion in 2013 will be the government's campaign against extravagant public spending. This is likely to have a knock-on effect on private consumption, which will grow by 7.7% in 2013, compared with 8% in 2012. There are some signs that the domestic economy in China is recovering or at least not slowing any further. The HSBC flash manufacturing PMI for August rose to 50.1 on the back of stronger domestic new orders and output. In addition, imports rebounded in July following a very weak second quarter, suggesting domestic demand is holding up with retail sales and some elements of investment growing fairly steadily. The government has announced measures to support growth and employment through tax cuts for small businesses and help for exporters, while emphasizing that China will meet its growth target of 7.5% for this year. The Chinese economy slowed to 7.5% in 2Q13, and recent indicators suggest growth will remain comparatively subdued. The government appears determined to rebalance the economy and tackle the over-dependency on credit, even if it means slower growth in the near term. Growth over the next few years will be driven by consumption and fiscal spending aimed at improving standards of living and rebalancing the economy: § Rising middle class, underpinning strong consumer spending — the number of
Chinese households with income over $30,000 a year is set to increase nearly 20-fold over the coming decade, and it seems consumer spending will outpace investment over the next five years as the government seeks to rebalance the economy, according to findings of Oxford Economics.
48.4 47.6
50.148.5
45
50
55
60
65
Jan
12
Mar
12
May
12
Jul 1
2
Sep
12
Nov
12
Jan
13
Mar
13
May
13
Jul 1
3
Index
Indian composite PMIIndian manufacturing PMI
Sources: HSBC, Markit and Haver Analytics.
9.7
7.66.4 6.1
5.0 5.3 5.2 4.8 4.8 4.4
0
2
4
6
8
10
12
1Q 2Q 3Q 4Q 1Q 2Q 3Q 4Q 1Q 2Q
2011 2012 2013
Source: Central Statistical Office of India and Haver Analytics.
% change y-o-y

_________________________________________________________________________________________________________________________________________Monthly Oil Market Report
September 2013 23
§ Stimulatory fiscal policy — spending on infrastructure and affordable housing and support for small businesses will continue to rise significantly.
§ Investment — the government has announced $150 billion in infrastructure projects, which are expected to be implemented in 2013 and 2014.
§ Trade — domestic demand will be the key driver of growth as a gradual recovery in China’s export markets is likely to be offset by strengthening imports for consumption.
Graph 3.8: Chinese PMI Graph 3.9: Chinese GDP growth (saar )
Other Asia Falling exports and currency weakening put a drag on growth in Other Asia, pushing current account balances into a deficit
Indonesia’s weakening currency has contributed both to July’s record trade deficit as well as to the further rise in inflation. The trade deficit in July was $2.3 billion, the biggest on record. Inflation, on the other hand, rose to 8.8% in August from a year earlier, the highest since January 2009. The increased consumption before the Eid Al-Fitr holiday also played a role in the rising deficit and inflation. Imports were higher due to a lack of sufficient production to meet the seasonal hike in demand. Therefore, the record trade deficit is not expected to continue, though the currency will remain a challenging issue in the coming months. The HSBC Indonesia manufacturing PMI exhibited deterioration in the country’s operating conditions in August. The gauge plunged below the 50.0 no-change-limit to register 48.5, down from the expansion of 50.7 in the previous month. It is worth noting that the August reading of the index is the lowest in 15 months. The survey showed that companies reduced their production levels in August for the first time since January on the back of contracted new export business together with domestic demand. This led employment to shrink at the fastest pace in survey history. In Taiwan, the manufacturing sector stabilised in August as indicated by an increase in its PMI manufacturing to hit the no-change limit at 50.0, up from 48.6 in July. This improvement came after three months of deterioration. The economy of the Philippines grew at a remarkable rate for the fourth quarter running. The GDP recorded a 7.5% increase in 2Q13 compared with 7.7% in 1Q13. The slowdown in China’s economy and weak overseas demand have put Thailand’s economy into recession as 2Q13 GDP contracted by 0.3% q-o-q following a drop of 1.7% in 4Q12. The manufacturing sector in Vietnam moved towards stabilisation in August. PMI manufacturing improved to 49.4 in August from 48.5 a month earlier. This figure shows that output and new orders remain in the fall area though at marginal rates. The survey outcomes suggest that the tough export market is showing signs of stabilisation.
49.551.8
47.7
50.1
48.450.0
44464850525456
Jan
12
Mar
12
May
12
Jul 1
2
Sep
12
Nov
12
Jan
13
Mar
13
May
13
Jul 1
3
Index
Chinese composite PMIChinese manufacturing PMIChinese manufacturing imports PMI
Source: HSBC, Markit and Haver Analytics.
9.8
9.7
9.3
8.7
8.2
7.6
7.6 7.9
7.7
7.5
0
2
4
6
8
10
12
1Q 2Q 3Q 4Q 1Q 2Q 3Q 4Q 1Q 2Q
2011 2012 2013
Source: China's National Bureau of Statistics and Haver Analytics.
% change y-o-y

Monthly Oil Market Report___________________________________________________________________________________________________________________________________________
September 2013 24
Africa Africa’s GDP growth forecast revised down to 3.8% and 4.1% for 2013 and 2014, respectively
South Africa’s economy registered a marginal acceleration in 2Q13 at about 2% y-o-y, up from around 1.9% in 1Q13 due to weak growth in mining and farming output. Strikes and sinking consumer and business confidence may put downward pressure on Africa’s largest economy in the second half of the year. The reserve bank of South Africa has kept its benchmark lending rate at 5% for the 13th consecutive month to keep inflation under control. The mineworkers’ union, representing two-thirds of the gold miners in South Africa, has begun a strike over a wage dispute. Strikes may cost the economy about $58 million a day in revenue, lost wages and taxes according to the chamber of mines. Moreover, workers in the automotive, construction and aviation industries went on strike, demanding pay raises in excess of the inflation rate. On the other hand, the continued weakness in South Africa’s currency has contributed to improving the global competitiveness of the country’s exports of manufactured goods. Furthermore, the currency depreciation helped increase demand for locally produced goods in the domestic market versus more expensive imported goods. This is reflected in the rise of South Africa’s PMI, which rose to its highest reading in six years in August. In Egypt, the economic deterioration continued last month with the PMI continuing well below the 50 no-change mark at 42.2, though marginally up from 41.7 in July. Operating conditions in the private sector have been sliding since October 2012. The survey showed the fastest pace of decline in new export orders since its record drop in December 2012, while output and new orders showed substantial declines. Meanwhile, the Egyptian government plans are aimed at raising the growth rate to 3.5% in the current fiscal year, up from 2% a year ago. Some states in the MENA region pledged financial support of around $12 billion, of which about $5 billion has already been received. This support helped boost the central bank’s foreign currency reserves by around 35% in one month, to exceed $15 billion in July, up from $11.2 billion in June. Furthermore, the Egyptian government is working to implement an emergency plan to revive the economy in 10 months via investment projects. The uncertain political and security climate continues to limit Africa’s economies significantly below their potentials. Africa is now forecast to grow at a rate of 3.8% this year, down from 4.1% estimated in July. Likewise, the economic expansion for 2014 has been revised down to 4.1% from 4.4% estimated earlier.
Latin America The outlook for Latin America unchanged, amid positive signals in Brazil
In Argentina, consumer confidence increased to 50.03 in August 2013, its highest level in 17 months, from 47.48 the previous month. Households are more optimistic about the outlook of the Argentinean economy. This reflected on retail sales, which increased 19.7% in July 2013 over the same month a year earlier. Retail sales y-o-y in Argentina are reported by the Instituto Nacional de Estadística y Censos. The positive domestic sentiment contributed to an inflation increase of 10.6% in July, up from 10.5% a month earlier. Mexico’s economy expanded 1.5% in the second quarter y-o-y, up from 0.6% in the first quarter. It registered a deficit in its trade balance in July of about $1.4 billion, up from $0.4 billion in the same month a year earlier. As import growth moved up faster than exports, the country accumulated a trade deficit of $3.3 billion over the first seven months of the year. On the other hand, the unemployment rate increased in July to its highest since the beginning of the year. Unemployment rose to 5.1%, up from 5% in the previous month. Inflation eased to a 6-month low in July to 3.5%. This marks the third consecutive monthly inflation decline.

_________________________________________________________________________________________________________________________________________Monthly Oil Market Report
September 2013 25
Transition region The economy of Slovenia contracted in 2Q13 by 1.7% y-o-y, following the 4.8% drop
in 1Q. This came as the fifth consecutive quarter of GDP contraction. The less sharp contraction compared to the previous quarter is due to the improvement in net trade on the back of improved performance by the Euro-zone economies, which helped offset the apparent weakness in consumption and investment. In late August, the central bank of Hungary continued a series of interest rate cut decisions it has made over the past year. The two-week deposit rate was cut to a record-low of 3.8% from 4%. The central bank is aiming to protect the attractiveness of local assets as the US Fed considers when to start reducing its quantitative easing. Due to funds flowing out of emerging market and developing countries, central banks across Eastern Europe are feeling the impacts of the Fed’s tapering of its money stimulus programme. The central bank of Romania cut the interest rate a half point to a record low of 4.5%. The Polish central bank had a nine-month series of interest rate cuts to settle in July at a record low of 2.5%.
OPEC Member Countries OPEC MCs GDP growth forecast revised down to 3.2% and 4.0% for 2013 and 2014, respectively
Saudi Arabia’s PMI for August, published as the Saudi British Bank (SABB), signaled ongoing improvement in operating conditions at Saudi Arabia’s non-oil producing private sector firms. The gauge registered 57.5 in August, up from 56.5 in the previous month. August’s figure is the four-month high of the index. Furthermore, the survey showed a rise in new orders at the fastest pace in four months. Output rose at an accelerated pace in August, and client demand from foreign markets also strengthened. It is worth noting that the monthly index has stayed in expansion territory since its inception. The United Arab Emirates’ (UAE) PMI maintained its same reading in August, unchanged from July. The gauge posted 54.5 in August, a good indication of the continuing expansion in the country’s non-oil producing private sector. The survey revealed a further rise in output levels to a six-month high. The output rise, as shown by the survey outcomes, is driven by increased business and improved market conditions. As a result, employment levels improved in August to meet higher production requirements. Output prices in the UAE also increased in line with input costs. Uncertainty over the short-term political climate in North Africa, the Middle East and West Africa is expected to have its toll on the economic growth prospects over the short term. OPEC economies are now forecast to grow this year at a rate of 3.2% instead of July’s 3.3%, while next year’s forecast is revised down to 4.0% from 4.2%.
Graph 3.10: Saudi Arabian and UAE purchasing manufacturing indices
Aug 1357.5
Aug 1354.5
45
50
55
60
65
Apr11
Jun11
Aug11
Oct11
Dec11
Feb12
Apr12
Jun12
Aug12
Oct12
Dec12
Feb13
Apr13
Jun13
Aug13
Index
Saudi Arabia UAE
Source: SAAB, HSBC, Markit and Haver Analytics.

Monthly Oil Market Report___________________________________________________________________________________________________________________________________________
September 2013 26
Oil prices, US dollar and inflation The US dollar lost some value against all major currencies on average in August. In real terms, the Basket price rose by 1.6% or $1.04/b to $66.04/b from $65.00/b
The US dollar lost some value against the major currencies on average in August. It lost 1.7% compared to the euro, 1.8% compared to the Japanese yen and the Swiss franc and 1.9% versus the pound sterling. Since the beginning of September, the US dollar regained strength after better-than-expected second quarter GDP numbers had been reported. The average August level to the euro stood at $1.3309/€, and at ¥97.870/$ to the yen. With the US economy expected to improve in the second half and consequently, the Fed to size-down its extraordinary supply measures, the US dollar should be expected to again trade at around the $1.30/€ level, but this also depends on the Euro-zone’s recovery and the ECB’s monetary actions. Compared to the yen, it is expected to keep a level of around ¥100.0/$. In general, many uncertainties prevail, ranging from the budget and debt ceiling negotiations in the US Congress to geopolitical issues in the Middle East. Moreover, the expected implementation of the US central bank’s plan to reduce its monetary stimulus in the near future will also determine the value of the US dollar. However, with the ECB, the BoJ and the Bank of England (BoE) continuing with an expansive monetary policy in the relative near term, the US dollar should continue to be well supported. In nominal terms, the price of the OPEC Reference Basket increased on a monthly average in August. It rose by $3.07/b or 2.9% from $104.45/b in July to $107.52/b in August. In real terms, after accounting for inflation and currency fluctuations, the Basket price rose by 1.6% or $1.04/b to $66.04/b from $65.00/b (base June 2001=100). Over the same period, the US dollar declined by 1.3% against the import-weighted modified Geneva I + US dollar basket* while inflation remained flat.
* The ‘modified Geneva I+US$ basket’ includes the euro, the Japanese yen, the US dollar, the pound sterling and the Swiss franc, weighted
according to the merchandise imports of OPEC Member Countries from the countries in the basket.

_________________________________________________________________________________________________________________________________________Monthly Oil Market Report
September 2013 27
World Oil Demand World oil demand World oil demand growth in 2013 revised up by 25 tb/d to stand at 0.82 mb/d
The shift in momentum from developing countries to OECD regions that has been seen in the most recent macroeconomic data, permitted a slight upward revision in total world oil demand growth for 2013 from last month’s MOMR report. World oil demand growth in 2013 was revised up by 25 tb/d to stand at 0.82 mb/d.
Table 4.1: World oil demand in 2013, mb/d
The bulk of the positive revision came from the OECD regions as a result of better-than-expected market sentiment. Oil demand in the OECD regions was revised up by a total of 40 tb/d, gains were particularly notable in OECD America (10 tb/d) and OECD Europe (30 tb/d), while OECD Asia Pacific remained unchanged. On a quarterly basis, the second quarter was revised higher by 70 tb/d with the majority of the adjustment coming from OECD Europe. The third and fourth quarters were also revised higher — by 50 tb/d each — in anticipation of a general improvement in key OECD economies. Conversely, figures were revised down for some developing countries. “Other Asia”, especially India, had an adverse impact on demand growth figures. The region was revised down in both 3Q13 and 4Q13 by 30 tb/d each quarter, leading to a total reduction in demand of 20 tb/d for the whole of 2013. Lacklustre economic indicators, as well as the impact of falling subsidies in various countries in the region, prompted these downward adjustments. In absolute terms, total world demand in 2013 is expected to reach 89.74 mb/d. The OECD region is expected to reach 45.71 mb/d, up slightly from last month’s figure of 45.67 mb/d. In contrast, total demand figures for developing countries were adjusted lower to reach 28.83 mb/d, slightly down from the 28.85 mb/d reported last month. Demand growth data for 2014 remained unchanged at around 1.04 mb/d, despite regional adjustments made to account for the latest data. In absolute figures, total oil demand in 2014 is now expected to average around 90.77 mb/d.
2012 1Q13 2Q13 3Q13 4Q13 2013 Growth %Americas 23.70 23.71 23.75 23.89 23.83 23.80 0.10 0.43Europe 13.74 13.15 13.60 13.56 13.38 13.43 -0.31 -2.28Asia Pacific 8.59 8.95 7.97 8.29 8.74 8.49 -0.10 -1.21Total OECD 46.03 45.82 45.32 45.74 45.96 45.71 -0.32 -0.69Other Asia 10.83 10.89 11.02 11.10 11.14 11.04 0.21 1.94Latin America 6.26 6.21 6.47 6.70 6.59 6.49 0.23 3.69Middle East 7.58 7.79 7.75 8.18 7.75 7.87 0.29 3.80Africa 3.42 3.42 3.42 3.38 3.52 3.43 0.01 0.26Total DCs 28.10 28.30 28.66 29.36 29.01 28.83 0.74 2.63FSU 4.41 4.33 4.18 4.59 4.84 4.49 0.07 1.63Other Europe 0.64 0.63 0.59 0.63 0.71 0.64 -0.01 -0.81China 9.74 9.79 10.19 9.89 10.41 10.07 0.33 3.38Total "Other regions" 14.80 14.75 14.95 15.10 15.96 15.19 0.40 2.68
Total world 88.92 88.86 88.93 90.20 90.92 89.74 0.82 0.92Previous estimate 88.92 88.86 88.86 90.18 90.90 89.71 0.79 0.89Revision 0.00 0.00 0.07 0.02 0.02 0.03 0.03 0.03
Change 2013/12
Totals may not add up due to independent rounding.

Monthly Oil Market Report_________________________________________________________________________________________________________________________________________
September 2013 28
Table 4.2: World oil demand in 2014, mb/d
Graph 4.1: World oil demand by region
In OECD Americas, expectations for US oil demand in the first half of 2013 have not changed since last month. These include growing demand for distillate fuel, propane/propylene and naphtha for petrochemical feedstock and declining requirements for residual fuel oil, gasoline and jet fuel/kerosene. The picture matches recent economic data, which shows rising industrial production, strengthening consumer confidence, increasing construction activity, and a recovery in the auto market. The overall outlook for oil demand in OECD Europe for 2013 has improved since last month’s projections, particularly for some main countries in the region. Oil demand grew in Germany and the UK in July, while falling slightly in France. Italy continued to be on the negative side, with demand improving compared to the previous months. Similarly, oil demand in countries such as Greece and Portugal witnessed less of a contraction than in recent months. For the Other Asian region, Indian data continues to paint a grim picture with lacklustre economic data, heavy rainy season across the country, lower sales figures of vehicles, improved power situation in the country which reduced gasoil/diesel oil consumption for power generation and the higher base line for 2012, curbing oil demand growth figures for the recent months and possibly in the near future. Reduction in subsides from other countries in the region are also expected to weigh on oil consumption in the region.
2013 1Q14 2Q14 3Q14 4Q14 2014 Growth %Americas 23.80 23.83 23.83 24.00 23.94 23.90 0.10 0.44Europe 13.43 12.97 13.32 13.43 13.27 13.25 -0.17 -1.30Asia Pacific 8.49 8.82 7.90 8.16 8.55 8.36 -0.13 -1.53Total OECD 45.71 45.62 45.06 45.60 45.76 45.51 -0.20 -0.44Other Asia 11.04 11.13 11.22 11.36 11.40 11.28 0.24 2.19Latin America 6.49 6.44 6.70 6.95 6.83 6.73 0.24 3.65Middle East 7.87 8.11 8.04 8.52 8.03 8.17 0.31 3.89Africa 3.43 3.45 3.45 3.41 3.56 3.47 0.03 0.96Total DCs 28.83 29.13 29.41 30.23 29.82 29.65 0.82 2.83FSU 4.49 4.41 4.25 4.67 4.93 4.57 0.08 1.78Other Europe 0.64 0.64 0.58 0.64 0.72 0.64 0.01 0.82China 10.07 10.09 10.54 10.25 10.72 10.40 0.33 3.32Total "Other regions" 15.19 15.14 15.37 15.56 16.36 15.61 0.42 2.76
Total world 89.74 89.89 89.85 91.38 91.94 90.77 1.04 1.16Previous estimate 89.71 89.89 89.76 91.36 91.94 90.75 1.04 1.16Revision 0.03 0.00 0.09 0.02 0.00 0.03 0.00 0.00
Change 2014/13
Totals may not add up due to independent rounding.
23.8
13.411.0 10.1
8.5 7.96.5
4.5 3.40.6
23.9
13.311.3 10.4
8.4 8.26.7
4.6 3.50.6
0
5
10
15
20
25
30
Americas Europe OtherAsia
China AsiaPacific
MiddleEast
LatinAmerica
FSU Africa OtherEurope
mb/d
2013 2014

_________________________________________________________________________________________________________________________________________Monthly Oil Market Report
September 2013 29
Graph 4.2: Quarterly world oil demand growth
OECD Americas In 2013, OECD Americas oil demand is expected to grow by 0.1 mb/d
The latest US monthly data for June shows a decline in oil demand of around 0.17 mb/d y-o-y. This downward trend supports a weakening also observed in May. All main products dropped, with the bulk of losses seen in jet fuel/kerosene. Gasoline and residual fuel oil consumption also fell, while demand for naphtha for the petrochemical industry, as well as other industrial fuels, notably pentane plus, increased. In general, there has not been much change in estimates for US oil demand since last month — growing demand for distillate fuel, propane/propylene and naphtha for petrochemical feedstock and declining demand for residual fuel oil, gasoline and jet-fuel/kerosene remain the main trends. Preliminary weekly data for July shows a strong increase of around 5% y-o-y, with all main product categories registering gains, except residual fuel oil. This increase in demand reflects recent economic data showing rising industrial production, improving consumer confidence, increasing construction activity, and a recovery in the auto market. Meanwhile, preliminary weekly data for August shows flat oil requirements y-o-y, a result of increasing demand for industrial fuels, especially propane/propylene, and aviation fuels. Preliminary figures for July and August — together with a markedly improving economy — provide grounds for cautious optimism for the remainder of 2013 and 2014. At the same time, potential downside risks, such as pending fiscal issues and the effects of budget cuts on the overall economy, remain. Thus, 2014 oil demand projections for the US remained slightly higher than in 2013, and roughly unchanged from last month, with risk to some degree skewed towards the upside.
Graph 4.3: US oil consumption, y-o-y changes
-1,500
-1,000
-500
0
500
1,000
1,500
2,000
1Q 2Q 3Q 4Q 1Q 2Q 3Q 4Q 1Q 2Q 3Q 4Q
2012 2013 2014
tb/d
OECD Non-OECD Total world
-1,500
-1,000
-500
0
500
1,000
1,500
Jan
12
Feb
12
Mar
12
Apr 1
2
May
12
Jun
12
Jul 1
2
Aug
12
Sep
12
Oct
12
Nov
12
Dec
12
Jan
13
Feb
13
Mar
13
Apr 1
3
May
13
Jun
13
Jul 1
3
Aug
13
All other Distillates Gasoline Total oil
tb/d

Monthly Oil Market Report_________________________________________________________________________________________________________________________________________
September 2013 30
In Mexico, a marginal decline in industrial production in July led to decreased oil demand, with fuel oil and distillates accounting for the bulk of these declines. Mexican oil demand forecasts for 2013 and 2014 are unchanged from last month showing growth of only 0.5% annually. As Mexican industry is closely connected to developments in the US market, future risks are skewed more towards the upside. In Canada, June came in solidly with gains in all product categories, particularly transportation fuels, in line with improvements in the automotive market. Canadian oil demand for 2013 and 2014 is projected to remain roughly at 2012 levels, experiencing only marginal increases, with risks being equally distributed between the upside and downside, depending on how the economy develops. In 2013, OECD Americas oil demand is expected to grow by 0.1 mb/d compared with the previous year. In 2014, OECD Americas oil demand is projected to also increase by 0.1 mb/d over the previous year.
OECD — Europe For 2013, European oil demand growth is projected to decrease by 0.31 mb/d
July was a month in which positive signs pointing to further growth in European oil demand dominated over negative developments. The absolute level of contraction in European oil demand declined substantially starting in 2Q13, and continuing in the first month of 3Q13. July oil demand grew in big consumers Germany and the UK, while it fell slightly in France. Italy continued to be in the minus; however, by a smaller magnitude than in recent months. Similar developments in Italian oil demand have also been observed in Greece and Portugal, where oil demand contracted less than in the early months of 2013. Positive oil demand developments are in line with increasing July manufacturing PMI in the Euro-zone, which exceeded the 50 threshold for the first time since July 2011.
Table 4.3: Europe Big 4* oil demand, tb/d
Furthermore, the European auto market showed considerable improvements in July, with increasing car sales across all major markets, such as Germany, France, the UK and notably Spain, while the Italian market contracted slightly y-o-y. General expectations for the region’s oil demand during 2013 have once more improved since last month’s projections, supported by improvement in oil demand from some of the main countries in the region. This is also in line with projections for 2014 — unchanged since last month — which predict a smaller contraction for oil requirements than in 2013. For 2013, European oil demand growth is projected to decrease by 0.31 mb/d, an improvement over the decline of 0.54 mb/d in 2012, while oil demand growth in 2014 is projected to contract by 0.17 mb/d, less than the decline expected in 2013.
OECD — Asia Pacific OECD Asia Pacific oil consumption fell by 0.10 mb/d in 2013
A generally improving Japanese economy and rising petrochemical activity were the main reasons behind relatively strong Japanese oil demand in July, in which increases of around 0.05 mb/d y-o-y were seen. Naphtha and LPG — the backbones of the petrochemical industry — grew significantly, while jet fuel demand increased 0.04 mb/d y-o-y as a result of increasing aviation activities. Oil requirements for crude and fuel oil for direct burning and electricity generation saw mixed trends, with fuel oil decreasing and crude oil increasing, y-o-y. Gasoil demand was also strong as a result of reconstruction activities related to the triple disaster of March 2011 and greater diesel demand for transportation, especially trucks.
Jul 13 Jul 12 Change from Jul 12 Change from Jul 12, %LPG 410 403 7 1.8Gasoline 1,197 1,162 34 2.9Jet/Kerosene 819 781 38 4.9Gas/Diesel oil 3,316 3,292 24 0.7Fuel oil 384 371 13 3.6Other products 1,051 1,048 4 0.3Total 7,177 7,057 120 1.7
* Germany, France, Italy and the UK.

_________________________________________________________________________________________________________________________________________Monthly Oil Market Report
September 2013 31
Restart activity for Japanese nuclear power plants did not change significantly, with the exception of recent problems at the Fukushima plant. Currently only two out of a total of 50 plants are operating, while required inspection is not expected to take place within 2013. Around 12 utilities have applied to the Japanese Nuclear Regulatory Authority (NRA) to restart operations, but the latest projections do not envision the first nuclear reactor restarting prior to July 2014. Nevertheless, direct burning of crude and fuel oil for electricity generation is expected to continue falling as a result of increasing fuel substitution with LNG and coal. The outlook for Japanese oil demand in 2013 remains unchanged from last month’s forecasts, with risks remaining skewed towards the downside as a result of signs of continued fuel substitution for electricity generation. Similarly, oil demand projections for 2014 remain unchanged from last month and assume a real probability that only a small number of nuclear plants will re-join operation next year. In South Korea, June showed a reduction of 0.07 mb/d, y-o-y. Increasing industrial production and hence stronger demand for distillates has been more than offset by declining LPG and residual fuel oil requirements, with increasing LNG usage in the power generation sector. The forecast for South Korean oil demand during 2013 and 2014 remained unchanged from last month’s projections.
OECD Asia Pacific oil consumption fell by 0.10 mb/d in 2013, a trend expected to continue in 2014 at an even greater extent with a drop of 0.13 mb/d, y-o-y.
Other Asia Other Asia’s oil demand is expected to grow at a rate of 0.21 mb/d in 2013
India’s oil consumption has been on the negative side of the chart for the second month running, recording a y-o-y decline of 68 tb/d in July after marginally declining in the previous month. The last time a decline in oil consumption took place over consecutive months was between August and October of 2010. In absolute terms, total oil consumption in India in July stands at 3.52 mb/d, its lowest level since October of last year. In terms of products, gasoil/diesel oil, which account for the largest portion of Indian oil demand, have seen a declining trend for the past three consecutive months, edging lower in May before dipping further during the months of June and July by 27 tb/d and 100 tb/d, respectively. This is a trend which has never before been witnessed in data available for Indian gasoil demand growth figures, going back at least a decade. Gasoil/diesel oil account for around 40% of total Indian oil consumption. Other products showed a mixed performance, with LPG and gasoline demand improving, while jet fuel, kerosene and fuel oil demand are declining, with fuel oil being firmly in the negative.
Graph 4.4: Changes in Indian oil demand, y-o-y
As stated in last month’s MOMR, the rainy season across the country dampened gasoil/diesel oil consumption. This was compounded by a 15% decline in sales figures for diesel vehicles. A number of factors were behind the sharp decline in gasoil consumption in July, namely the shift away from gasoil/diesel oil to other fuel types,
-300-200-100
0100200300400500600
Jan12
Feb12
Mar12
Apr12
May12
Jun12
Jul12
Aug12
Sep12
Oct12
Nov12
Dec12
Jan13
Feb13
Mar13
Apr13
May13
Jun13
Jul13
tb/d
LPG Gasoline Kerosene Diesel oil Fuel oil Other products

Monthly Oil Market Report_________________________________________________________________________________________________________________________________________
September 2013 32
particularly by construction companies due to economic viability; the slowdown in economic activity accompanied with a historically sharp depreciation of the rupee against the dollar; the country’s improved power situation which reduced gasoil/diesel oil consumption for power generation, and the higher baseline for 2012. Furthermore, the country’s manufacturing PMI a dipped in July after staging a modest improvement in June over the previous month. The July index reading was above the expansionary level at 50.11, although the overall trend is lower. August PMI fell even further, slipping into contraction territory. Additionally, industrial activities in the country have been weakening since February of this year, as India’s sluggish economic conditions pushed manufacturing output lower.
Table 4.4: Indian oil demand by main products, tb/d
Taiwan’s oil consumption improved in June, with product demand registering an increase of 78 tb/d from levels seen in June 2012, a jump of nearly 10%. This improvement in oil consumption can be primarily attributed to a lower growth base in 2012, rather than a direct improvement in Taiwan’s consumption. Total demand for the country stood at 0.89 mb/d, compared with 0.81 mb/d for the same period in 2012. It is worth pointing out that exports — the backbone of Taiwan's economy — have been fluctuating in the first half of 2013, with manufacturing PMI dropping for four consecutive months from as high as 62.4 in March to 52.6 in both July and August. With signs of improvement in the OECD economies, potential improvement in new orders for Taiwanese exports are anticipated. In Indonesia, despite a slight improvement in total consumption growth levels for the month of June — by 10 tb/d or just shy of 1% growth on a y-o-y basis — gasoil/diesel oil consumption in the country continued to decline as a result of subsidy reductions in late June. Product demand was lower than last year’s levels by 28 tb/d, or just below 6%, in June. As a result of the latest developments in the Other Asia region, oil consumption in the third and fourth quarters were adjusted lower by 30 tb/d each, mainly due to weaker Indian demand, as well as the impact of subsidy cuts. Other Asia’s oil demand is expected to grow at a rate of 0.21 mb/d in 2013, following a downward revision of 16 tb/d since last month. This is also lower than the growth levels seen in the previous year, largely a result of slower economic activities in India and subsidy reductions in Indonesia. Other Asia’s oil demand growth is now projected to be marginally higher in 2014, reaching 0.24 mb/d.
Latin America Total oil consumption in Latin America is estimated to reach 6.49 mb/d in 2013
Total oil consumption in Latin America is estimated to reach 6.49 mb/d in 2013, growing by around 0.23 mb/d from 2012 levels. These estimations are unchanged from last month’s figures despite slow overall economic sentiment in Brazil, the largest consuming country in the region. The Brazilian economy has been decelerating since the start of this year in spite of a better-than-expected uptick in 2Q GDP growth figures, which expanded by 3.3% y-o-y. Although manufacturing PMI for the country improved marginally, it nevertheless remained in contraction territory for the fourth consecutive month in August at 49.4, although up from 47.66 in July. Overall, oil consumption in the country remained positive, particularly on a cumulative basis. Data for the first half of the year illustrates good demand growth, with a total oil
Difference toJul 13 Jun 13 Jan-Jul 13 Jan-Jul 12 %
LPG 475 454 485 -9 -1.9Motor gasoline 392 411 403 32 8.7Jet Kero 257 259 282 -9 -3.2Gas diesel oil 1,399 1,487 1,491 19 1.3Residual fuel oil 265 259 284 -69 -19.5Other products 728 784 785 97 14.1
Total oil demand 3,517 3,653 3,729 61 1.7
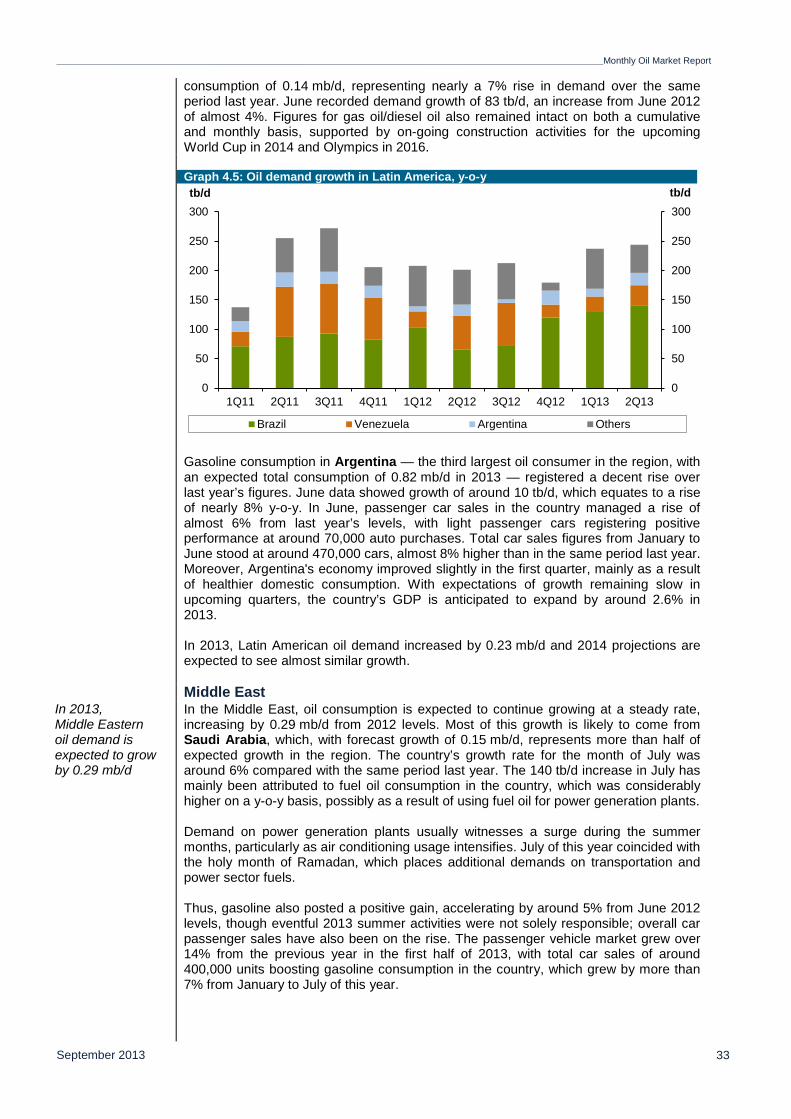
_________________________________________________________________________________________________________________________________________Monthly Oil Market Report
September 2013 33
consumption of 0.14 mb/d, representing nearly a 7% rise in demand over the same period last year. June recorded demand growth of 83 tb/d, an increase from June 2012 of almost 4%. Figures for gas oil/diesel oil also remained intact on both a cumulative and monthly basis, supported by on-going construction activities for the upcoming World Cup in 2014 and Olympics in 2016.
Graph 4.5: Oil demand growth in Latin America, y-o-y
Gasoline consumption in Argentina — the third largest oil consumer in the region, with an expected total consumption of 0.82 mb/d in 2013 — registered a decent rise over last year’s figures. June data showed growth of around 10 tb/d, which equates to a rise of nearly 8% y-o-y. In June, passenger car sales in the country managed a rise of almost 6% from last year’s levels, with light passenger cars registering positive performance at around 70,000 auto purchases. Total car sales figures from January to June stood at around 470,000 cars, almost 8% higher than in the same period last year. Moreover, Argentina's economy improved slightly in the first quarter, mainly as a result of healthier domestic consumption. With expectations of growth remaining slow in upcoming quarters, the country’s GDP is anticipated to expand by around 2.6% in 2013. In 2013, Latin American oil demand increased by 0.23 mb/d and 2014 projections are expected to see almost similar growth.
Middle East In 2013, Middle Eastern oil demand is expected to grow by 0.29 mb/d
In the Middle East, oil consumption is expected to continue growing at a steady rate, increasing by 0.29 mb/d from 2012 levels. Most of this growth is likely to come from Saudi Arabia, which, with forecast growth of 0.15 mb/d, represents more than half of expected growth in the region. The country’s growth rate for the month of July was around 6% compared with the same period last year. The 140 tb/d increase in July has mainly been attributed to fuel oil consumption in the country, which was considerably higher on a y-o-y basis, possibly as a result of using fuel oil for power generation plants. Demand on power generation plants usually witnesses a surge during the summer months, particularly as air conditioning usage intensifies. July of this year coincided with the holy month of Ramadan, which places additional demands on transportation and power sector fuels. Thus, gasoline also posted a positive gain, accelerating by around 5% from June 2012 levels, though eventful 2013 summer activities were not solely responsible; overall car passenger sales have also been on the rise. The passenger vehicle market grew over 14% from the previous year in the first half of 2013, with total car sales of around 400,000 units boosting gasoline consumption in the country, which grew by more than 7% from January to July of this year.
0
50
100
150
200
250
300
0
50
100
150
200
250
300
1Q11 2Q11 3Q11 4Q11 1Q12 2Q12 3Q12 4Q12 1Q13 2Q13
tb/dtb/d
Brazil Venezuela Argentina Others

Monthly Oil Market Report_________________________________________________________________________________________________________________________________________
September 2013 34
Graph 4.6: Oil demand growth in the Middle East, y-o-y
In 2013, Middle Eastern oil demand is expected to grow by 0.29 mb/d. Oil demand growth in the region for 2014 is projected to be in the 0.31 mb/d range.
China Chinese oil demand is expected to grow by 0.33 mb/d in 2013
Chinese annual oil demand growth has been increasing over the past two months compared to earlier this year to reach just below the average five-year growth levels of around 0.48 mb/d. Demand growth for the country during the months of June and July was at 0.45 mb/d and 0.47 mb/d respectively, according to the latest data. In absolute figures, total oil demand for the country stands at 9.79 mb/d for the month of July, a 5% increase from a year earlier, marking the highest growth rate since February.
Graph 4.7: Chinese apparent oil demand, y-o-y
Additionally, products have been on the rise on a y-o-y basis, with all products recording positive growth, while gasoline and gasoil/diesel grew the most, at 0.13 mb/d and 0.12 mb/d, respectively. However, gasoline growth was relatively modest for the month of July, compared with monthly growth figures for the past 18 months, with the exception of March 2012 and April 2013. In percentage terms, growth in gasoline demand has continued to outpace that for gasoil, although to a lesser degree in July. This phenomenon has been observed in Chinese oil demand growth figures for the past months. Gasoline demand growth in China has been outpacing gasoil as a result of the former capturing larger market segments due to the rising number of new purchases of vehicles, which typically run on gasoline. Gasoil/diesel-fueled vehicles are rather uncommon in China, as the government discouraged use of this fuel for private vehicles. July private vehicles sales improved by around 10% on a y-o-y basis, with total sales of 1.24 million vehicles supporting the increase in gasoline demand in the country.
-100-50050100150200250300350
-100-50
050
100150200250300350
1Q11 2Q11 3Q11 4Q11 1Q12 2Q12 3Q12 4Q12 1Q13 2Q13
tb/dtb/d
Saudi Arabia I.R. Iran Kuwait UAE Others
-1,000
-500
0
500
1,000
1,500
2,000
-1,000
-500
0
500
1,000
1,500
2,000
Jan Feb Mar Apr May Jun Jul Aug Sep Oct Nov Dec
tb/dtb/d
Historical range 2010 2011 2012 2013

_________________________________________________________________________________________________________________________________________Monthly Oil Market Report
September 2013 35
Graph 4.8: Chinese gasoil and gasoline demand growth, y-o-y
In absolute terms, gasoline demand has steadily grown from 1.96 mb/d in January 2012 to 2.14 mb/d in July 2013, with an average monthly growth level of 12%. While total monthly gasoil demand lacked direction, it held at similar levels seen in the same period of comparison, fluctuating between a high of 3.64 mb/d and a low of 3.29 mb/d, with growth very much depending on the country’s industrial output and export levels. In percentage terms, and on a monthly average basis, the product experienced only minor monthly growth of 1% compared with a year ago. Slowing industrial activities in the country have also contributed to lower gasoil/diesel growth in the past months, despite the latest news from China's manufacturing sector, which grew in August for the first time in four months, according to PMI data, rising to 50.1 from 47.7 the month before. Chinese oil demand is expected to grow by 0.33 mb/d in 2013 and to see similar growth in 2014.
-5
0
5
10
15
20
Jan12
Feb12
Mar12
Apr12
May12
Jun12
Jul12
Aug12
Sep12
Oct12
Nov12
Dec12
Jan13
Feb13
Mar13
Apr13
May13
Jun13
Jul13
%
Gasoline Gasoil

Monthly Oil Market Report_________________________________________________________________________________________________________________________________________
September 2013 36
World Oil Supply Non-OPEC Forecast for 2013 Non-OPEC supply forecast to increase by 1.08 mb/d in 2013
Non-OPEC oil production in 2013 is expected to increase by 1.08 mb/d over the previous year to average 54.00 mb/d. The forecast represents an upward revision of 70 tb/d over the previous report. The majority of the upward revisions affected the third quarter as a result of the latest production data. OECD Americas encountered the highest upward revision, followed by Africa, while Other Asia experienced the largest downward revision compared to the previous MOMR.
Graph 5.1: Regional non-OPEC supply growth, y-o-y
On a regional basis, OECD Americas is expected to see the largest growth in 2013, followed by the FSU and Africa, while OECD Europe and the Middle East are seen showing the largest decline. On a quarterly basis, non-OPEC supply is expected to stand at 53.82 mb/d, 53.73 mb/d, 54.09 mb/d and 54.35 mb/d, respectively.
Table 5.1: Non-OPEC oil supply in 2013, mb/d
-0.4
0.0
0.4
0.8
1.2
-0.4
0.0
0.4
0.8
1.2
OECDAmerica
OECDEurope
OECDAsia
Pacific
OtherAsia
LatinAmerica
MiddleEast
Africa FSU
mb/dmb/d
12/11 13/12 14/13
Change2012 1Q13 2Q13 3Q13 4Q13 2013 13/12
Americas 16.73 17.63 17.65 17.93 17.89 17.78 1.05Europe 3.78 3.63 3.56 3.47 3.61 3.57 -0.21Asia Pacific 0.56 0.45 0.49 0.53 0.51 0.49 -0.07Total OECD 21.07 21.71 21.71 21.93 22.01 21.84 0.77
Other Asia 3.64 3.65 3.58 3.57 3.62 3.61 -0.03Latin America 4.67 4.68 4.70 4.82 4.83 4.76 0.09Middle East 1.49 1.47 1.33 1.39 1.35 1.39 -0.11Africa 2.32 2.32 2.43 2.44 2.49 2.42 0.10Total DCs 12.12 12.12 12.05 12.22 12.29 12.17 0.05
FSU 13.30 13.44 13.39 13.41 13.45 13.42 0.13Other Europe 0.14 0.14 0.14 0.14 0.14 0.14 0.00China 4.17 4.24 4.27 4.20 4.27 4.24 0.08Total "Other regions" 17.61 17.81 17.79 17.75 17.86 17.81 0.20Total Non-OPEC production 50.80 51.64 51.55 51.91 52.16 51.82 1.02Processing gains 2.12 2.18 2.18 2.18 2.18 2.18 0.06
Total Non-OPEC supply 52.92 53.82 53.73 54.09 54.35 54.00 1.08Previous estimate 52.93 53.80 53.70 53.88 54.34 53.93 1.01Revision -0.01 0.02 0.03 0.21 0.01 0.07 0.07

_________________________________________________________________________________________________________________________________________Monthly Oil Market Report
September 2013 37
Forecast for 2014 Non-OPEC supply to grow by 1.22 mb/d in 2014 to average 55.21 mb/d
Non-OPEC oil supply in 2014 is forecast to increase by 1.22 mb/d to average 55.21 mb/d. Average non-OPEC production experienced an upward revision of 135 tb/d, while the expected growth experienced an upward revision of 70 tb/d. The majority of this revision was related to changes to the 2013 supply forecast. The US, Canada, Brazil, South Sudan and Sudan, China, Kazakhstan and Colombia are expected to be the major contributors to supply growth in 2014, while supply from Norway, Syria, the UK and Mexico is expected to continue to decline. Risks to the forecast remain high due to weather, natural decline, technical, political and environmental factors. On a quarterly basis, non-OPEC supply is expected to average 54.78 mb/d, 54.70 mb/d, 55.12 mb/d and 56.24 mb/d, respectively.
Table 5.2: Non-OPEC oil supply in 2014, mb/d
Revisions to the 2014 forecast The total non-OPEC supply forecast and growth in 2014 experienced an upward
revision compared to the previous MOMR. Most of the upward revision came on the back of changes to the forecast in 2013 that were carried over to 2014, including the US, Mexico, Norway, the UK, Australia, Malaysia, Brazil and Azerbaijan. The supply estimates for South Sudan and Sudan experienced an upward revision in 2014 of 50 tb/d. South Sudan’s and Sudan’s oil production is expected to increase by 0.11 mb/d in 2014 to average 0.33 mb/d.
OECD Total OECD oil supply in 2013 is forecast to increase by 0.77 mb/d to average
21.84 mb/d, indicating an upward revision of 0.10 mb/d compared to the previous MOMR. The upward revision came mainly from changes to the third quarter supply estimates. The supply forecast for OECD Americas encountered the largest upward revision compared to the previous month, followed by OECD Europe, while OECD Asia-Pacific supply figures encountered a downward revision. The OECD Americas supply forecast is expected to experience the largest growth, while OECD Europe oil supply in 2013 is expected to drop. OECD Asia-Pacific oil supply is seen to decrease by 70 tb/d in 2013. On a quarterly basis, OECD oil supply is seen to average 21.71 mb/d, 21.71 mb/d, 21.93 mb/d and 22.01 mb/d, respectively.
Change2013 1Q14 2Q14 3Q14 4Q14 2014 14/13
Americas 17.78 18.15 18.24 18.57 19.03 18.50 0.72Europe 3.57 3.58 3.40 3.29 3.54 3.45 -0.12Asia Pacific 0.49 0.51 0.53 0.54 0.52 0.53 0.03Total OECD 21.84 22.24 22.18 22.40 23.09 22.48 0.64
Other Asia 3.61 3.65 3.67 3.68 3.66 3.67 0.06Latin America 4.76 4.87 4.91 4.98 5.10 4.97 0.21Middle East 1.39 1.36 1.37 1.37 1.38 1.37 -0.01Africa 2.42 2.54 2.54 2.54 2.54 2.54 0.12Total DCs 12.17 12.42 12.49 12.57 12.68 12.54 0.37
FSU 13.42 13.48 13.41 13.53 13.78 13.55 0.13Other Europe 0.14 0.14 0.14 0.14 0.14 0.14 0.00China 4.24 4.29 4.27 4.28 4.34 4.30 0.05Total "Other regions" 17.81 17.91 17.82 17.95 18.26 17.99 0.18Total Non-OPEC production 51.82 52.57 52.49 52.92 54.04 53.01 1.19Processing gains 2.18 2.21 2.21 2.21 2.21 2.21 0.02
Total Non-OPEC supply 54.00 54.78 54.70 55.12 56.24 55.21 1.22Previous estimate 53.93 54.67 54.57 54.98 56.09 55.08 1.15Revision 0.07 0.11 0.13 0.14 0.16 0.13 0.07

Monthly Oil Market Report_________________________________________________________________________________________________________________________________________
September 2013 38
Graph 5.2: OECD’s quarterly production
OECD Americas OECD Americas oil production is projected to average 17.78 mb/d in 2013,
indicating strong growth of 1.05 mb/d. The total expected output experienced an upward revision of 90 tb/d compared to the previous MOMR. The upward revision came from the US as updated production figures in the first half as well as the early part of the third quarter required the undertaken adjustments. OECD Americas is expected to have the highest growth among all non-OPEC regions in 2013. The forecast calls for continued strong growth from the US and Canada, and a relatively minor decline from Mexico. According to preliminary data, the OECD Americas oil supply increased by 1.18 mb/d in the first half of 2013 compared to the same period in 2012. On a quarterly basis, OECD Americas oil production is expected to average 17.63 mb/d, 17.65 mb/d, 17.93 mb/d and 17.89 mb/d, respectively.
US Tight oil growth to drive US supply to increase by 0.85 mb/d in 2013
US oil production is expected to increase by 0.85 mb/d in 2013 to average 10.88 mb/d, indicating an upward revision of 90 tb/d compared to the previous month. The upward revision came mainly in the third quarter to adjust for updated and estimated production data. The expected US supply growth is the highest among all non-OPEC countries in 2013. The anticipated growth continues to be supported by tight oil developments from Texas and North Dakota. During the first half of 2013, the US crude oil production averaged 7.21 mb/d, the highest level since the first half of 1992. North Dakota crude oil production reached a new record high of 821 tb/d in June. Despite the impact of the flood, output is expected to continue growing in the coming period. Texas crude oil supply stood at 2.58 mb/d in June, the highest level since May 1981. Tight oil developments were the main driver of growth in North Dakota and Texas. During the first half of 2013, North Dakota crude supply increased by 190 tb/d compared to the same period a year ago, supported mainly by shale oil developments. However, it is worth pointing out that in the same period of 2012, North Dakota crude output experienced growth of 240 tb/d. Texas crude supply averaged 2.43 mb/d in the first half of 2013, 0.59 mb/d higher than the same period a year earlier, supported mainly by tight oil supply growth from the Eagle Ford area. Alaska crude oil production averaged 0.53 mb/d in the first half of 2013, the lowest level since 1977. However, fracturing at the producing wells in the Oooguruk field is seen supporting the output. Gulf of Mexico crude output stood at 1.07 mb/d in June, the lowest level since October 2008, mainly due to maintenance at various fields. The government reduced the hurricane season forecast to “above normal” from “very active”. It is also proposing a new rule to strengthen offshore production safety.
19.0
20.0
21.0
22.0
23.0
24.0
19.0
20.0
21.0
22.0
23.0
24.0
1Q11
2Q11
3Q11
4Q11
1Q12
2Q12
3Q12
4Q12
1Q13
2Q13
3Q13
4Q13
1Q14
2Q14
3Q14
4Q14
mb/dmb/d
_________________________________________________________________________________________________________________________________________Monthly Oil Market Report
September 2013 39
Pressure is mounting on the US 2014 biofuel mandates as different groups are requesting the government to reduce the “impossible to meet” requirements. On a quarterly basis, US oil production is seen to average 10.62 mb/d, 10.94 mb/d, 11.03 mb/d and 10.91 mb/d, respectively.
Canada and Mexico Canada’s oil production to grow by 0.24 mb/d in 2013
Canada’s oil supply is forecast to average 4.01 mb/d in 2013, representing an increase of 0.24 mb/d over 2012, unchanged from the previous month. The steady state came despite reports of higher output at certain sites, however, the reported leakage that led to a shutdown of the Primrose facilities offset the increase. The anticipated growth in Canadian oil supply in 2013 is the highest annual supply growth since 1973. Preliminary production data for the first half of 2013 supports the forecast trend for Canadian oil supply, with growth backed by both oil sand and crude developments. During the first half of 2013, Canada oil supply averaged 3.95 mb/d, an increase of 0.22 mb/d compared to the same period a year earlier. During the second half, Canada oil supply is expected to achieve a gradual increase on ramp-up of various operations. On a quarterly basis, Canada’s supply is expected to average 4.08 mb/d, 3.82 mb/d, 4.02 mb/d and 4.12 mb/d, respectively.
KMZ output remained steady in 1H13 with only a minor decline
Mexico’s oil production is foreseen to decline by 40 tb/d in 2013 to average 2.88 mb/d, flat from the previous month, and the lowest annual level since 1988. According to actual production data, Mexico crude supply indicated a relatively heavy decline in July compared to the previous month. The decline came mainly from lower output from the Ku-Maloob-Zaap (KMZ) fields, where production averaged 847 tb/d. However, Mexico output during most of August recovered. During the first seven months, Mexico oil production averaged 2.89 mb/d, a decline of 40 tb/d compared to the same period in 2012. Updated data showed that the Cantarell field crude supply averaged 388 tb/d during the first seven months of 2013, 17 tb/d lower than the average of the field’s same period in 2012. The KMZ field’s crude output averaged 862 tb/d in the first seven months of 2013, 8 tb/d lower than the same period a year earlier. Production stabilisation, natural decline and limited new developments remain the main characteristics of Mexico’s oil supply forecast in 2013. On a quarterly basis, Mexico’s oil supply is seen to stand at 2.91 mb/d, 2.87 mb/d, 2.87 mb/d and 2.86 mb/d, respectively.
OECD Europe OECD Europe’s total oil production is seen to decline by 0.21 mb/d and average
3.57 mb/d in 2013, representing an upward revision of 20 tb/d compared to the previous MOMR. The upward revision was due mainly to updated production data for the second quarter as well as early parts of the third. The anticipated output in 2013 of 3.57 mb/d is the lowest since 1982. The supply situation remains relatively unchanged, with declines expected from major producers in the region. On a quarterly basis, supply is seen to average 3.63 mb/d, 3.56 mb/d, 3.47 mb/d and 3.61 mb/d, respectively. Preliminary data indicates that OECD Europe’s supply stood at 3.60 mb/d in the first half of 2013, a decline of 0.40 mb/d compared to the same period in 2012.
Norway’s oil supply in July at the highest in 14 months
Norway’s oil output is anticipated to decline by 80 tb/d in 2013 to average 1.83 mb/d, indicating an upward revision of 35 tb/d compared to the last MOMR. The expected drop in Norway oil supply in 2013 is the smallest since 2004 as new volume is seen to offset a big part of the mature decline. Despite the lower performance of the Oseberg, Vigdis, Skuld, Ula and Valhall fields in July, Norway oil supply, as per preliminary data, averaged 1.96 mb/d, the highest level since May 2012. The healthy level of output in July was supported by the return of the Ekofisk production site,which averaged 220 tb/d in July, up from the 60 tb/d average in June. Output is expected to be lower in August as suggested by the loading programme as well as the impact of the resolved power failure at the Visund A platform. Despite a healthy output level in July, Norway’s oil supply is forecast to be lower in the third quarter compared to the second due to expected maintenance. According to preliminary data, Norway’s oil supply averaged 1.85 mb/d during the first seven months of 2013, 0.16 mb/d lower than the same period a year earlier. On a quarterly basis, Norway’s production is seen to average 1.84 mb/d, 1.84 mb/d, 1.80 mb/d and 1.85 mb/d, respectively.

Monthly Oil Market Report_________________________________________________________________________________________________________________________________________
September 2013 40
UK oil output to decline 70 tb/d to average 0.88 mb/d in 2013
Oil production from the UK is expected to average 0.88 mb/d in 2013, a decline of 70 tb/d from the previous year. This represents a downward revision of 10 tb/d compared to the previous MOMR. The revision came in the second, third and fourth quarters on updated production data that was partially carried over to the rest of the year. While UK July oil production, as per preliminary data, was higher than June, the maintenance shutdown and loading programme suggest lower output in the rest of the third quarter. Brent oil output supported UK production in July, which averaged 135 tb/d, compared to 60 tb/d in June. The return of the Cormorant Alpha platform to full output after a long shutdown is seen to support production and offset some of the decline in other areas. The short shutdown of the Huntington field in August is seen to impact the UK production as well as the delays of the ramp-up at the Buzzard field in early September. The reduction of the forecast of the UK oil and gas production local industry group further supported the downward revision. During the first half of 2013, UK oil supply averaged 0.90 mb/d, a decline of 160 tb/d compared to the same period a year earlier. On a quarterly basis, UK oil supply is seen to average 0.92 mb/d, 0.89 mb/d, 0.83 mb/d and 0.90 mb/d, respectively.
OECD Asia Pacific Total OECD Asia-Pacific oil supply is expected to decline by 70 tb/d in 2013
compared to the previous year, to average 0.49 mb/d. This represents a downward revision of 10 tb/d compared to the previous MOMR. The downward revision was due to updated production figures as well as changes to the forecast. During the first half of 2013, OECD Asia-Pacific oil supply averaged 0.47 mb/d, a decline of 90 tb/d from the same period last year. On a quarterly basis, total OECD Asia-Pacific supply is seen to average 0.45 mb/d, 0.49 mb/d, 0.53 mb/d and 0.51 mb/d, respectively.
Pyrenees shutdown to impact Australia output in the fourth quarter
Oil production from Australia is anticipated to decline by 60 tb/d in 2013 to average 0.42 mb/d, indicating a downward revision of 15 tb/d from the previous month. The downward revision was introduced to adjust for updated production data in the first half as well as changes to the expected output in the second half of 2013. Output of the Pyrenees field is expected to be halted during part of October due to maintenance that supported the undertaken revision. Australia’s expected annual production average for 2013 is the lowest since 1972. Production is expected to increase slightly in the third and fourth quarters on the ramp-up of new volume. During the first half of 2013, Australia’s oil supply averaged 0.39 mb/d, a decline of 90 tb/d compared to the same period in 2012. According to preliminary data, Australia’s oil supply increased in the second quarter yet remained lower than the same time a year earlier. On a quarterly basis, Australian oil production is seen to average 0.37 mb/d, 0.41 mb/d, 0.45 mb/d and 0.44 mb/d, respectively.
Developing countries South Sudan, Sudan and Colombia to drive growth in DCs’ oil output in 2013
Total Developing Countries’ (DCs) oil supply is forecast to increase by 50 tb/d in 2013 to average 12.17 mb/d, representing a downward revision of 20 tb/d from the previous month. The downward revision came from Other Asia and the Middle East, while the forecasts for Africa’s and Latin America’s oil supply encountered minor upward revisions from the previous MOMR. Overall, supply conditions within DCs remain unchanged with growth in 2013 coming from Africa and Latin America, while the Middle East’s and Other Asia’s supply are expected to decline. South Sudan, Sudan, and Colombia are the main contributors to the anticipated DCs’ supply growth in 2013, while Syria, Indonesia and Argentina are expected to have the largest decline. On a quarterly basis, DCs’ supply is expected to average 12.12 mb/d, 12.05 mb/d, 12.22 mb/d and 12.29 mb/d, respectively. According to preliminary data, DCs’ 1H13 oil supply showed a drop of 70 tb/d compared to the same period last year.

_________________________________________________________________________________________________________________________________________Monthly Oil Market Report
September 2013 41
Graph 5.3: Developing Countries’ quarterly production
Other Asia supply to average 3.61 mb/d in 2013, a decline of 30 tb/d
Oil supply from Other Asia is expected to decline by 30 tb/d in 2013 to average 3.61 mb/d, indicating a downward revision of 40 tb/d from the previous MOMR. The downward revision came mainly from Malaysia’s and Vietnam’s oil supply forecast while Indonesia’s oil outlook encountered an upward revision. Oil production from Malaysia and Vietnam is seen to experience a minor increase while output from India and Indonesia is seen to decline, and the output from the rest of the region’s countries is expected to remain steady. The forecast for Malaysia’s oil supply encountered a downward revision of 40 tb/d mainly due to updated production figures in the second quarter that were carried over to the rest of the year. Malaysia’s oil supply is now forecast to average 0.67 mb/d, an increase of 10 tb/d from the previous year. The maintenance at the Kikeh oil field, which is seen to reduce October loading by 40 tb/d, supported the downward revision. The adjustment came despite the startup of the West Desaru oil field. Preliminary data indicates that output from Other Asia averaged 3.62 mb/d during the first half of 2013, indicating a decline of 20 tb/d compared to the same time a year earlier. The decline was mainly due to Indonesian output, while Thailand’s and Vietnam’s output in the first half of 2013 increased. On a quarterly basis, Other Asia oil supply is seen to stand at 3.65 mb/d, 3.58 mb/d, 3.57 mb/d and 3.62 mb/d, respectively. Oil supply from Indonesia is expected to average 0.94 mb/d in 2013, representing a decline of 40 tb/d compared to 2012 and an upward revision of 10 tb/d compared with the previous MOMR. The minor upward revision came on the back of updated production data in the first half of 2013. Expected annual supply in Indonesia in 2013 is the lowest since 1971. Limited new developments and natural decline are the main factors behind the continued decrease in Indonesian oil supply. Vietnam’s oil supply is forecast to remain steady in 2013 compared to the previous year to average 0.39 mb/d, a downward revision of 10 tb/d compared to last month.
Colombia output reached a record high in July
Latin America’s oil production is projected to increase by 90 tb/d in 2013 to average 4.76 mb/d, indicating a minor upward revision of 10 tb/d over the previous month. The upward revision was due to updated production data and changes to the supply forecast of Brazil. Argentina’s oil supply is expected to average 0.66 mb/d in 2013, a decline of 30 tb/d compared to 2012, unchanged from the previous MOMR. The drop in Argentina’s oil supply is expected in 2013 on decline in mature producing areas and limited new volume. The foreseen decline is expected despite increased output reported by the national operator in the second quarter y-o-y, with small volumes coming from shale developments as the country’s total supply in the second quarter declined. In June, Argentina’s oil supply averaged 0.67 mb/d, a decline of 10 tb/d compared to the same period a year earlier. The annual drop is expected despite an increase in drilling at the Vaca Muetra shale formation, which is not seen to add large volume in 2013 and offset natural decline.
11.75
12.00
12.25
12.50
12.75
13.00
11.75
12.00
12.25
12.50
12.75
13.00
1Q11
2Q11
3Q11
4Q11
1Q12
2Q12
3Q12
4Q12
1Q13
2Q13
3Q13
4Q13
1Q14
2Q14
3Q14
4Q14
mb/dmb/d

Monthly Oil Market Report_________________________________________________________________________________________________________________________________________
September 2013 42
Colombia’s oil production is forecast to average 1.03 mb/d in 2013, representing an increase of 70 tb/d over 2012, flat compared to the previous report. During 1H13, Colombia’s oil supply increased 70 tb/d compared to the same period in 2013. Growth is supported by the continued ramp-up of the Rubiales fields, while the repeated sabotage of some infrastructure reduced growth. Colombia’s oil supply reached a record high in July despite the attacks and averaged 1.04 mb/d. On a quarterly basis, Latin America oil supply is seen to stand at 4.68 mb/d, 4.70 mb/d, 4.82 mb/d and 4.83 mb/d, respectively.
Return from maintenance supports Brazil’s output in June and July
Brazil’s oil supply is projected to experience a minor increase of 10 tb/d in 2013 to average 2.61 mb/d, representing an upward revision of 15 tb/d compared to the last MOMR. The upward revision was made partially to adjust for updated production data for the second quarter as well as changes to the supply profile in the third quarter. Brazil’s oil supply indicates an increase in July, mainly on return from maintenance activities. The Pappa Terra floating, production, storage and offload (FPSO) facilities sailed from the shipyard, and production is expected from the field in late October. Brazil’s oil supply is expected to increase in the second half of 2013 and support the annual figure as the drop in 1H13 on the back of maintenance and natural decline heavily impacted production. On a quarterly basis, Brazil’s oil supply is seen to average 2.54 mb/d, 2.58 mb/d, 2.67 mb/d and 2.67 mb/d, respectively.
Middle East supply to decline by 0.11 mb/d in 2013 to average 1.39 mb/d
Oil production from the Middle East is seen to average 1.39 mb/d in 2013, a decline of 0.11 mb/d. Middle East oil supply remained relatively unchanged compared to the previous MOMR, with a minor downward revision of 10 tb/d following updated production data. The anticipated decline is coming from Syria and Yemen, while Oman oil production is forecast to increase by 20 tb/d in 2013 to average 0.94 mb/d. This is unchanged from the previous assessment, despite a minor upward revision in the third quarter that did not impact the annual figure. Syria’s oil supply is expected to decline by 0.12 mb/d to average 90 tb/d in 2013. However, the lack of production data from Syria due to the ongoing political situation might bring a large revision once the numbers become available. Yemen’s oil supply is expected to drop 20 tb/d in 2013 to average 0.16 mb/d. The risk and uncertainties of the forecast remain on the high side given the continued security issues as well as data availability. On a quarterly basis, Middle East oil production is expected to average 1.47 mb/d, 1.33 mb/d, 1.39 mb/d and 1.35 mb/d, respectively.
South Sudan oil flow to Sudan set to continue
Africa’s oil supply is expected to average 2.42 mb/d in 2013, representing an increase of 0.10 mb/d over last year, indicating an upward revision of 25 tb/d compared to the previous MOMR. The upward revision came from South Sudan and Sudan. Most African producers’ supply forecasts are either seen to be steady or declining in 2013, except for South Sudan and Sudan, and Ghana. Congo’s oil production is expected to decrease by 20 tb/d in 2013 to average 0.28 mb/d due to the natural decline impact of the Azurite field output. South Sudan’s and Sudan’s oil production is forecast to average 0.22 mb/d in 2013, an increase of 0.10 mb/d compared to the previous year, indicating an upward revision of 10 tb/d compared to the previous month. The upward revision was introduced as the two nations averted the previously extended shutdown of the connecting pipeline and decided to continue with the established agreement. Further upward revision to the supply forecast might be experienced in the coming period if the two nations demonstrate commitment to the agreements. On a quarterly basis, African oil supply is seen to average 2.32 mb/d, 2.43 mb/d, 2.44 mb/d and 2.49 mb/d, respectively.
FSU, Other regions FSU supply to grow by 0.13 mb/d in 2013 to average 13.42 mb/d
Total FSU oil production is projected to grow by 0.13 mb/d in 2013 to average 13.42 mb/d, indicating an upward revision of 10 tb/d compared to the previous month. The upward revision was made to Russia’s and Azerbaijan’s supply forecasts, while other producers’ output projections remained steady. The revision was attributable to updated production figures in the second and part of the third quarters. In terms of regional growth, total FSU supply in 2013 is only behind that of OECD Americas. During the first half of 2013, FSU oil production increased by 0.11 mb/d over the same period in 2012. Total FSU oil supply is expected to continue to experience

_________________________________________________________________________________________________________________________________________Monthly Oil Market Report
September 2013 43
modest growth during the second half of 2013 compared to the first half and the previous year supported by Russia, Kazakhstan and Azerbaijan. On a quarterly basis, total oil production in the FSU is seen to average 13.44 mb/d, 13.39 mb/d, 13.41 mb/d and 13.45 mb/d, respectively. Other European supply is expected to remain flat and average 0.14 mb/d in 2013. China’s oil production is seen to average 4.24 mb/d in 2013, representing an increase of 80 tb/d over the previous year.
Graph 5.4: FSU and other region’s quarterly production
Russia Russia’s output continued to achieve steady monthly growth in August
Russia’s oil supply is forecast to increase by 90 tb/d in 2013 to average 10.46 mb/d, representing a minor upward revision of 10 tb/d, relatively steady compared to the previous month. The minor adjustment came on the back of updated production data that indicated slightly higher output than previously expected. Additionally, the startup of minor volumes from the Baibakov, Treb and Tivot fields supported the upward revision. With August’s oil supply reaching a record high, Russia’s oil production is aligned to achieve a healthy production level with steady growth in 2013. The upward revision from the previous MOMR was minor as the Vityaz field output is expected to be limited in September on the back of maintenance. Reports suggested that shale activities are gaining momentum in Russia with drilling commitments at the Bazhenov formation arranged for 2014. According to preliminary data, Russia’s oil supply averaged 10.51 mb/d in August, higher by 90 tb/d from the previous month. During the first eight months of 2013, Russia’s oil supply averaged 10.46 mb/d, representing an increase of 0.15 mb/d compared to the same period a year earlier. On a quarterly basis, Russian oil supply is expected to average 10.47 mb/d, 10.41 mb/d, 10.46 mb/d and 10.61 mb/d, respectively.
Caspian Production tests started at the Kashagan field
Kazakhstan’s oil supply is predicted to increase by 50 tb/d in 2013 to average 1.64 mb/d, unchanged from the last MOMR. The startup of production tests at the Kashagan field is seen supporting the expected growth in 2013. While maintenance at the Karachaganak field is seen to limit condensate output, Kazakh oil supply is expected to increase in the fourth quarter on the ramp-up of new volumes. During the first seven months, Kazakhstan’s oil production averaged 1.64 mb/d, an increase of 40 tb/d compared to the same period a year earlier. On a quarterly basis, Kazakhstan’s oil supply is estimated to average 1.68 mb/d, 1.60 mb/d, 1.63 mb/d and 1.66 mb/d, respectively.
Azeri oil output in July the highest so far at 0.90 mb/d
Azerbaijan’s oil production is estimated to decrease by 20 tb/d in 2013 and average 0.88 mb/d, an upward revision of 10 tb/d compared to the previous MOMR. The upward revision was introduced to adjust for updated production data in the second quarter, which was partially carried over to the rest of the year. So far in 2013, Azeri oil
4.0
4.2
4.4
4.6
12.5
13.0
13.5
14.0
1Q11
2Q11
3Q11
4Q11
1Q12
2Q12
3Q12
4Q12
1Q13
2Q13
3Q13
4Q13
1Q14
2Q14
3Q14
4Q14
mb/dmb/d
FSU (LHS) Other regions (RHS)

Monthly Oil Market Report_________________________________________________________________________________________________________________________________________
September 2013 44
supply remained subdued on limited new developments and technical issues. During the first half of 2013, Azerbaijan’s oil supply averaged 0.87 mb/d, a decline of 70 tb/d compared to the same period a year earlier. Despite the highest output level so far in 2013 in July, as per preliminary data, August data is expected to come with a decline due to maintenance. Production in the second half of 2013 is expected to remain relatively steady compared to the first half. On a quarterly basis, Azerbaijan’s oil supply is seen to average 0.87 mb/d, 0.87 mb/d, 0.88 mb/d and 0.88 mb/d, respectively.
China China’s July output the lowest since July 2012
Oil supply from China is seen to grow by 80 tb/d in 2013 to average 4.24 mb/d, indicating a downward revision of 20 tb/d compared to the previous month. The downward revision came on the back of updated production data in July, the lowest since July 2012, which came significantly lower than June and was partially carried over to the rest of the year. China’s oil supply growth in the second half is expected to be slow compared to the growth achieved in the first half of 2013. During the first seven months of 2013, China’s oil supply averaged 4.23 mb/d, an increase of 190 tb/d compared to the same period a year earlier. According to the preliminary data, China’s oil supply stood at 4.12 mb/d in July, a drop of 0.20 mb/d compared to the previous month. On a quarterly basis, China’s oil supply is seen to average 4.24 mb/d, 4.27 mb/d, 4.20 mb/d and 4.27 mb/d, respectively.
OPEC natural gas liquids and non-conventional oils OPEC NGLs and non-conventional oils are forecast to grow by 0.24 mb/d in 2013 to
average 5.80 mb/d. In 2014, OPEC NGLs and nonconventional oils are expected to increase by 0.15 mb/d over the previous year to average 5.95 mb/d.
Table 5.3: OPEC NGLs + non-conventional oils, 2011-14
OPEC crude oil production OPEC crude output averaged 30.23 mb/d in August
Total OPEC crude oil production averaged 30.23 mb/d in August, according to secondary sources, down by 124 tb/d from the previous month. OPEC production, not including Iraq, stood at 27.10 mb/d, a decrease of 257 tb/d over the previous month. Crude oil production from Libya and Angola declined while Saudi Arabia, Iraq, and the UAE crude output increased.
Table 5.4: OPEC crude oil production based on secondary sources, tb/d
Change Change Change2011 2012 12/11 1Q13 2Q13 3Q13 4Q13 2013 13/12 2014 14/13
Total OPEC 5.37 5.57 0.20 5.76 5.78 5.81 5.85 5.80 0.24 5.95 0.15
2011 2012 4Q12 1Q13 2Q13 Jun 13 Jul 13 Aug 13 Aug/JulAlgeria 1,240 1,210 1,186 1,169 1,166 1,151 1,168 1,167 -1.7Angola 1,667 1,738 1,728 1,754 1,749 1,724 1,722 1,695 -26.4Ecuador 490 499 502 502 506 504 508 510 1.7Iran, I.R. 3,628 2,973 2,680 2,709 2,678 2,685 2,675 2,683 7.5Iraq 2,665 2,979 3,118 3,031 3,098 3,022 3,004 3,136 132.8Kuwait 2,538 2,793 2,820 2,787 2,836 2,837 2,817 2,829 12.3Libya 462 1,393 1,468 1,399 1,342 1,186 1,007 529 -477.7Nigeria 2,111 2,073 1,965 1,992 1,905 1,871 1,872 1,883 11.6Qatar 794 753 732 736 729 731 731 730 -0.8Saudi Arabia 9,296 9,737 9,436 9,105 9,470 9,590 9,771 9,960 188.5UAE 2,516 2,624 2,650 2,690 2,728 2,757 2,740 2,762 22.5Venezuela 2,380 2,359 2,328 2,345 2,347 2,342 2,344 2,349 5.8
Total OPEC 29,788 31,132 30,613 30,218 30,555 30,400 30,358 30,234 -123.9OPEC excl. Iraq 27,122 28,152 27,495 27,187 27,457 27,378 27,354 27,098 -256.7
Totals may not add up due to independent rounding.

_________________________________________________________________________________________________________________________________________Monthly Oil Market Report
September 2013 45
Table 5.5: OPEC crude oil production based on direct communication, tb/d
X
World Oil Supply Preliminary figures show that world oil supply averaged 89.94 mb/d in August, a
decrease of 0.43 mb/d from the previous month. OPEC crude is estimated to have a 33.6% share in global supply, unchanged from the previous month. The estimate is based on preliminary data for non-OPEC supply, estimates for OPEC NGLs and OPEC crude production, according to secondary sources.
Graph 5.5: OPEC and world oil supply
2011 2012 4Q12 1Q13 2Q13 Jun 13 Jul 13 Aug 13 Aug/JulAlgeria 1,173 1,203 1,184 1,199 1,202 1,207 1,210 1,198 -12.0Angola 1,618 1,704 1,690 1,734 1,730 1,748 1,713 1,678 -35.0Ecuador 500 504 503 506 520 524 530 537 6.4Iran, I.R. 3,576 3,740 3,713 3,704 3,711 3,708 3,721 3,718 -3.0Iraq 2,653 2,944 3,058 2,957 3,042 2,994 2,972 3,207 235.0Kuwait 2,660 2,977 2,967 2,813 2,970 2,980 3,011 2,995 -15.6Libya 462 1,450 1,498 1,489 1,415 1,286 1,242 597 -644.8Nigeria 1,896 1,954 1,864 1,820 1,649 1,544 1,783 1,663 -119.3Qatar 734 734 727 728 724 721 722 714 -8.2Saudi Arabia 9,311 9,763 9,413 9,111 9,538 9,642 10,034 10,190 156.2UAE 2,565 2,652 2,664 2,823 2,792 2,836 2,877 2,812 -64.9Venezuela 2,795 2,804 2,785 2,743 2,762 2,774 2,754 2,773 19.3
Total OPEC 29,942 32,429 32,066 31,626 32,055 31,964 32,569 32,083 -486OPEC excl. Iraq 27,290 29,485 29,008 28,669 29,013 28,970 29,597 28,876 -721
Totals may not add up due to independent rounding.
85
86
87
88
89
90
91
26
27
28
29
30
31
32
Sep
11
Oct
11
Nov
11
Dec
11
Jan
12Fe
b 12
Mar
12
Apr
12
May
12
Jun
12Ju
l 12
Aug
12
Sep
12
Oct
12
Nov
12
Dec
12
Jan
13Fe
b 13
Mar
13
Apr
13
May
13
Jun
13Ju
l 13
Aug
13
mb/dmb/d
OPEC crude production (LHS) World supply (RHS)

Monthly Oil Market Report_________________________________________________________________________________________________________________________________________
September 2013 46
Product Markets and Refinery Operations Refinery margins fell worldwide due to weaker demand
Product markets exhibited a mixed performance in August. Middle distillates retained some strength on the back of tightening sentiment fuelled by the upcoming autumn maintenance season. The top and bottom of the barrel weakened worldwide due to lacklustre demand amid rising supplies and the driving season coming to an end in the Atlantic Basin, which caused the refinery margins to drop across the globe.
Graph 6.1: Refining margins, 2012-13
US product cracks showed a mixed performance. Middle distillate cracks rose, supported by the exports to Latin America where demand for middle distillates has been growing steadily this year, and increasing exports opportunities to Europe. Gasoline experienced a sharp loss as the recovery in domestic demand was outweighed by the pressure coming from the supply side and bearish sentiment increasing with the approaching end of the driving season. The losses exhibited at the top of the barrel, along with the developments in crude market prices, caused the margin for WTI to continue to fall during August, losing almost $1 to average around $8.5/b, while the margin for Arab Heavy and LLS crudes on the US Gulf Coast (USGC) showed an increase of $1 in August to average $8/b and $11/b, respectively. Looking forward, a reduction in refining runs should help balance the market and could avoid additional losses in margins, which have so far been supported by sustained higher exports and some refineries on the US Gulf coast experiencing problems along with other issues facing secondary refining units. European product markets registered a mixed performance, with middle distillates retaining some strength on the back of tightening sentiment fuelled by the upcoming maintenance season; However, the losses suffered by the top and bottom of the barrel caused the refinery margins to continue the downward trend in the region. Demand in light and middle distillates has been lower than the level expected during the summer peak and increased pressure from US exports may have also played their part in depressing European margins. In addition, the bottom of the barrel continued weak, with high fuel oil inventories facing low demand in Europe, and limited arbitrage to Asia Pacific causing the crack to continued losing ground. This also contributed to the losses in the refinery margin for Brent crude in Northwest Europe, which dropped by around 80¢ to average $2.5/b in August. Some hopes about tightening supply as refiners begin their autumn maintenance early, should provide support to keep margins from slipping too low.
0
10
20
30
40
0
10
20
30
40
Aug
12
Sep
12
Oct
12
Nov
12
Dec
12
Jan
13
Feb
13
Mar
13
Apr 1
3
May
13
Jun
13
Jul 1
3
Aug
13
US$/bUS$/b
WTI (US Gulf) Arab Heavy (US Gulf) Brent (Rotterdam)Dubai (Singapore) LLS (US Gulf)

_________________________________________________________________________________________________________________________________________Monthly Oil Market Report
September 2013 47
Asian refining margins plummeted during August, hit by the fall across all parts of the barrel, mainly due to gasoline showing the worst performance as expectations of lower seasonal demand weighed on the market, amid increasing supplies, causing the gasoline cracks to show a sharp loss of more than $7/b. The gasoil crack fell on pressure emerging from reduced domestic demand due to the monsoon season, leading to a rise in India’s gasoil exports. The bottom of the barrel continued to suffer from weak power and bunker demand, causing a continue loss in the fuel oil crack in Singapore. Refinery margins in Asia plummeted from the level reached during the previous month, to average 60¢/b in August, losing more than $3.5/b and hitting the lowest level seen in the last 3 years.
Refinery operations Refinery runs at high levels ahead of the autumn maintenance season in some regions
Refinery throughputs have been on the rise worldwide during the last months, mainly in Asia and the US; however the downward trend in worldwide refinery margins amid the driving season ending in the Atlantic Basin and demand waning in Asia during the monsoon season will push refiners to cut runs ahead of autumn maintenance. Gasoline demand in the US continued to increase in August to hit 9.2 mb/d and refineries increased their yields, which caused US gasoline inventories to remain comfortable, above the latest five-year average. Despite increased domestic demand and higher exports, the gasoline crack fell due to the pressure from the supply side amid the driving season ending, causing refinery margins to continue to drop. Refining utilization rates declined 2 percentage points (pp) vs. the previous month to average 90.4% during August. Lower margins and operational problems in several units contributed to the run cuts.
Graph 6.2: Refinery utilisation rates, 2012-13
In Europe, the refinery utilisation rate averaged around 82% in July, dropping by 1 pp compared to the previous month. Moderate throughput levels are expected to continue due to the downward trend in the margins and some refineries are expected to begin their autumn maintenance early, thus tightening supply. This situation should keep margins from slipping further. In Asia, Chinese and Indian refineries continued increasing runs to average around 90% in July. The contributing factor has been that China has been processing more crude instead of straight-run fuel oil, due to economic advantages. In Singapore, runs averaged above 96%, 2 pp higher than in June, while Japanese throughputs rose to 82 % of capacity in August, increasing 6 pp.
60
70
80
90
100
60
70
80
90
100
Aug
12
Sep
12
Oct
12
Nov
12
Dec
12
Jan
13
Feb
13
Mar
13
Apr 1
3
May
13
Jun
13
Jul 1
3
Aug
13
%%
US EU-16 Japan Singapore

Monthly Oil Market Report_________________________________________________________________________________________________________________________________________
September 2013 48
US market US gasoline crack falling with the approaching end of the driving season
US gasoline demand stood at around 9.2 mb/d in August, around 100 tb/d higher than the previous month and up by around 5 tb/d from the same month a year earlier. The gasoline crack continued losing ground in August despite the slight improvement seen in the implied demand, which remains slightly above the previous year’s level. The steady recovery in domestic demand and higher exports to West Africa and Central and South America have been outweighed by pressure coming from the supply side: gasoline production in the US remains strong after some refinery units restart production from outages during July, while inventories remain persistently high for the season ‒ particularly on the East Coast, due to higher imports in previous months. The bearish sentiment was underpinned by the driving season coming to an end. The gasoline crack showed a loss of almost $5 in August, to average $28/b. On the other hand, in recent weeks, despite their high levels, inventories have started to show a drawdown ahead of the switch to winter grades, which could reduce imports from Europe.
Graph 6.3: US Gulf crack spreads vs. WTI, 2012-13
Middle distillate demand stood at around 3.7 mb/d in August, 180 tb/d lower than in the previous month and around 50 tb/d below the same month a year earlier. Middle distillate cracks recovered part of the ground lost last month on the back of a relatively tighter balance. 10 ppm-sulphur grade heating oil prices rose in the New York Harbor market. Such grades of heating oil are not subject to the US biofuel blending requirements, and regional refiners have been maximising their production to reduce their exposure to renewable fuel blending costs. Replacement renewable fuel certificate prices have fallen sharply in August, diverting production away from 1 ppm heating oil and supporting prices. On the supply side, production has been above year-ago levels and higher than the five-year average. At the same time, the strength seen in trucking demand, a key component of diesel demand in the US, is diminishing with the ATA Trucking Index registering a 0.4% decline y-o-y in July. On the other hand, exports have continued to recover, and increasing volumes have been shipped to Central and South America, while exports to Europe are also on the rise. These higher exports have lent support to the market by keeping in check inventories that stopped rising since mid-August and thus outweighed the supply pressure, allowing
-10
0
10
20
30
40
50
60
-10
0
10
20
30
40
50
60
Aug
12
Sep
12
Oct
12
Nov
12
Dec
12
Jan
13
Feb
13
Mar
13
Apr
13
May
13
Jun
13
Jul 1
3
Aug
13
US$/bUS$/b
Prem.Gasoline Unl.93 Jet/Kero Gasoil/Diesel (0.05%S) Fuel oil (1.0%S)

_________________________________________________________________________________________________________________________________________Monthly Oil Market Report
September 2013 49
the USGC gasoil crack to exhibit a gain of almost $2 to stand at around $18/b in August. At the bottom of the barrel, fuel oil cracks continued losing ground, pushed lower by weaker demand. Ample supplies and muted buying interest from the power generation sector continued weighing on the low-sulphur fuel oil market, which fell more steeply than high-sulphur fuel oil. The fuel oil crack lost almost $2 to average minus $3.4/b in August, sinking into negative territory after being on the positive side for more than 24 months.
European market Middle distillate crack remained healthy on the back of tight sentiment
Product market fundamentals remained mixed in Europe, with middle distillates retaining some strength on the back of tightening sentiment fuelled by the upcoming maintenance season while the top and bottom of the barrel continued to weaken due to lacklustre demand and the driving season coming to an end in the Atlantic Basin. In light distillates, the gasoline crack lost some ground due to weak demand amid higher stocks, which offset supply concerns due to the upcoming maintenance season in the region. Export opportunities have also been waning as spot shipments to the US have become uneconomic in the last weeks, and the demand from West Africa weakened, thus contributing to a stock build in Europe. US stocks remained relatively high, and along with a hike in US Renewable Identification Number (RIN) prices, tradeable biofuel blending certificates in July dented the arbitrage from Europe to the US. The gasoline crack spread against Brent crude dropped by $1.5 to average $15/b in August. European naphtha demand for the petrochemical sector remained lacklustre, however additional losses were avoided as margins have been supported by fears of tight supply with the upcoming maintenance season. Additionally, the arbitrage to Northeast Asia, which had been providing support, will be limited due to upcoming cracker capacity going into maintenance in Asia.
Graph 6.4: Rotterdam crack spreads vs. Brent, 2012-13
The middle of the barrel remained relatively balanced, and the cracks were stable as
demand steadied and fears of tight supply continued to support the cracks.
-20
-10
0
10
20
30
-20
-10
0
10
20
30
Aug
12
Sep
12
Oct
12
Nov
12
Dec
12
Jan
13
Feb
13
Mar
13
Apr
13
May
13
Jun
13
Jul 1
3
Aug
13
US$/bUS$/b
Prem.Gasoline Unl.50 ppm Jet/Kero Gasoil 10 ppm Fuel oil (1.0%S)

Monthly Oil Market Report_________________________________________________________________________________________________________________________________________
September 2013 50
Diesel margins rose on tight prompt supply as the region has been increasingly reliant on imports after weaker margins led refineries to curtail production. This situation has contributed to reopening the arbitrage to Europe from India. Additional support came from news about the upcoming maintenance season, not only in Europe, but also in Russia, and additional concerns over the Motiva refinery outage in the US, which could potentially impact diesel flows to Europe. The gasoil crack spread against Brent crude at Rotterdam stood largely unchanged from the previous month to average $14.8/b in August. At the bottom of the barrel, fuel oil cracks continued their downward trend seen since the end of June, due to pressure exerted by persistently increasing inventories along with lacklustre demand for bunker fuel and fewer requirements by utilities. High-sulphur fuel oil fell against crude on weak demand in Europe and Asia-Pacific. Fuel oil in independent storage around Rotterdam has been on the rise, and margins kept being pressured by the inflows coming from the Black Sea. Straight-run fuel oil prices fell on slim demand as refinery demand for alternative straight-run feedstock has been limited due to many refineries in Europe operating at reduced rates because of weak margins. The Northwest European fuel oil crack spread against Brent exhibited a loss of $3 in August to stand at minus $16/b.
Asian market Asian gasoline cracks plummeted due to weak seasonal demand
The Asian market weakened sharply in August as cracks fell across all parts of the barrel, with gasoline exhibiting the worst performance as expectations of lower seasonal demand weighed on the market amid increasing supplies. Additionally, the bottom of the barrel crack spread continued its downward trend caused by weaker demand in the bunker and power sectors. The gasoline crack plummeted in August on the back of rising supplies, causing an increase in stocks. This weighed on the gasoline market amid expectations of lower seasonal demand as the key importing countries have begun to cut imports after seasonal domestic consumption passed its peak in early August. Supplies have been improving during the last weeks in the Asian market with a seasonal uptick in Japanese gasoline yields boosting output. Meanwhile, Taiwan’s gasoline exports have risen substantially, and Chinese exports to Singapore have been on the rise. Additional pressure came from the expected spot cargoes to be offered from the Mideast Gulf in coming weeks. The gasoline crack spread against Dubai crude in Singapore plummeted, losing more than $7 to average $8/b in August. The Asian naphtha market continues to be weak, and the crack showed little movement over the month, as growing supplies and cracker maintenance weighed on the naphtha market. Higher volumes out of the Middle East were a pressuring factor for petrochemical feedstock with higher-than-usual spot volumes from Kuwait. Additionally, the cracker maintenance season will reach its peak in September and early October with several crackers expected to be offline in Japan, South Korea and Taiwan.

_________________________________________________________________________________________________________________________________________Monthly Oil Market Report
September 2013 51
Graph 6.5: Singapore crack spreads vs. Dubai, 2012-13
At the middle of the barrel, the gasoil crack continued relatively healthy in August, however it showed a slight loss last month as the market continued to be pressured by the passing of peak demand season, ample regional supplies and growing Indian exports. Gasoil´s falling seasonal demand from key importer Indonesia was partially offset by some demand seen from South Africa, Sri Lanka and Vietnam. This allowed losses to be capped, mainly due to support coming from the African market remaining strong with several firms moving to secure cargoes for September and October delivery. Additionally, trading firms booked cargoes from Northeast Asia to Europe amid more favourable arbitrage economics. The gasoil crack spread in Singapore against Dubai lost almost $1.5 to average around $19/b in August. Looking forward, gasoil demand could continue to be impacted by the rainy season in the region, taking into consideration that in India the monsoon season typically dents demand from the power and agriculture sectors. At the bottom of the barrel, cracks continued to be pressured as the region continued to suffer from weak power and bunker demand, while residual stocks in Singapore kept rising on ample supplies, hitting the high level above 21 mb, lifted by exports from India where the monsoon season has dampened demand for fuel oil utilized for power generation. Additionally, pressure came from weakening demand from the Japanese power sector as the major power utilities in the country are reducing fuel oil intake and new gas-fired units are being pushed forward as Japan struggles to cope with its reduction in nuclear power output. The fuel oil crack spread in Singapore against Dubai continued to show a sharp loss of more than $3 to average minus $14/b in August.
-20
-10
0
10
20
30
-20
-10
0
10
20
30
Aug
12
Sep
12
Oct
12
Nov
12
Dec
12
Jan
13
Feb
13
Mar
13
Apr
13
May
13
Jun
13
Jul 1
3
Aug
13
US$/bUS$/b
Prem.Gasoline Unl.92 Jet/Kero Gasoil 50 ppm Fuel oil 180 CST (2.0%S)

Monthly Oil Market Report_________________________________________________________________________________________________________________________________________
September 2013 52
Table 6.1: Refinery operations in selected OECD countries
Table 6.2: Refined product prices, US$/b
Jul 13 Aug 13 Aug/Jul Jul 13 Aug 13 Aug/JulUS 16.09 15.78 -0.31 92.20 90.43 -1.77France 1.20 - - 68.73 - -Germany 1.87 - - 83.30 - -Italy 1.30 - - 58.99 - -UK 1.23 - - 69.32 - -Euro-16 10.37 - - 82.22 - -Japan 3.39 3.65 0.26 75.80 82.45 6.65RSources: OPEC statistics, Argus, Euroilstock inventory report, IEA, EIA/DoE, METI and PAJ.
Refinery throughput, mb/d
Revised since last issue
Refinery utilization, %
ChangeJun 13 Jul 13 Aug 13 Aug/Jul
US Gulf (Cargoes):Naphtha 94.18 109.63 109.07 -0.56Premium gasoline (unleaded 93) 133.55 138.57 134.80 -3.77Regular gasoline (unleaded 87) 117.28 124.75 123.64 -1.11Jet/Kerosene 117.71 122.16 126.76 4.60Gasoil (0.05% S) 117.33 120.61 124.40 3.79Fuel oil (1.0% S) 96.42 96.90 98.76 1.86Fuel oil (3.0% S) 90.93 91.24 93.10 1.86Rotterdam (Barges FoB):Naphtha 94.24 96.98 101.10 4.12Premium gasoline (unleaded 10 ppm) 106.18 110.35 111.92 1.58Premium gasoline (unleaded 95) 120.73 124.48 126.26 1.78Jet/Kerosene 120.80 124.14 127.64 3.50Gasoil/Diesel (10 ppm) 119.21 122.60 126.03 3.43Fuel oil (1.0% S) 94.82 94.57 95.36 0.79Fuel oil (3.5% S) 91.87 94.55 94.95 0.40Mediterranean Naphtha 90.35 94.51 100.32 5.81Premium gasoline (50 ppm) 123.85 129.96 133.59 3.63Jet/Kerosene 114.50 118.49 123.33 4.84Gasoil/Diesel (50 ppm) 102.45 106.08 110.20 4.12Fuel oil (1.0% S) 95.32 94.81 96.71 1.90Fuel oil (3.5% S) 91.60 94.22 94.74 0.52Singapore (Cargoes):Naphtha 95.06 97.70 101.01 3.31Premium gasoline (unleaded 95) 118.75 121.73 117.11 -4.62Regular gasoline (unleaded 92) 115.65 118.79 114.67 -4.12Jet/Kerosene 117.65 121.18 124.73 3.55Gasoil/Diesel (50 ppm) 120.36 124.19 126.08 1.89Fuel oil (180 cst 2.0% S) 97.76 95.23 97.82 2.59Fuel oil (380 cst 3.5% S) 94.68 93.15 94.46 1.31

_________________________________________________________________________________________________________________________________________Monthly Oil Market Report
September 2013 53
Tanker Market
OPEC spot fixtures dropped in August from the previous month
According to preliminary data, OPEC spot fixtures dropped in August from the previous month. Middle East-to-East fixtures declined by 0.92 mb/d to stand at 5.37 mb/d, while Middle East-to-West fixtures declined by 0.77 mb/d to stand at 2.77 mb/d. As a result, global fixtures fell 10% or 1.96 mb/d compared to a month earlier to stand at 17.3 mb/d. Compared to a year ago, global fixtures and OPEC fixtures were both 5% higher. Preliminary data also showed that OPEC sailings declined in August by 0.63 mb/d to average 23.71 mb/d. OPEC sailings were 1% lower than a year earlier. All arrivals showed a decline from last month, with North American arrivals dropping the most, falling 10% to average 8.82 mb/d. European and Far Eastern arrivals both declined by 2%, while West Asian arrivals dropped slightly by 0.04 mb/d from July.
Table 7.1: Tanker chartering, sailings and arrivals, mb/d
Dirty tanker sentiment remained under pressure in August, particularly for VLCCs
Dirty tanker sentiment remained under pressure in August, particularly for very large crude carriers (VLCCs), while Suezmax reported a rise in freight rates of 8% compared with one month earlier. Aframax freight rates were mixed: while rates in the East dropped on the back of low activity, they increased by WS 14 points in the Caribbean as lighterage operations stimulated the market. On average, dirty freight rates closed the month flat. On the other hand, clean tanker freight rates increased by 4% over the previous month, mainly as a result of an increase seen in East of Suez, which rose by 14% on the back of increased demand for both long-range (LR) and medium-range (MR) tankers, while freight rates in West of Suez were flat from last month.
ChangeJun 13 Jul 13 Aug 13 Aug/Jul
Spot CharteringAll areas 17.78 19.26 17.30 -1.96OPEC 12.99 14.35 12.41 -1.94Middle East/East 6.29 6.29 5.37 -0.92Middle East/West 2.67 3.54 2.77 -0.77Outside Middle East 4.03 4.53 4.27 -0.26
SailingsOPEC 23.74 24.34 23.71 -0.63Middle East 17.44 17.99 17.38 -0.61
ArrivalsNorth America 9.01 9.78 8.82 -0.96Europe 11.99 12.42 12.23 -0.19Far East 8.43 8.73 8.60 -0.13West Asia 4.41 4.27 4.30 0.04
Source: Oil Movements and Lloyd's Marine Intelligence Unit.

Monthly Oil Market Report_________________________________________________________________________________________________________________________________________
September 2013 54
Graph 7.1: Tanker chartering, sailings and arrivals, mb/d
VLCC freight rates pressured due to tonnage build-up
The VLCC market was particularly active in the first week of August for Middle East loading, yet the amount of activity was not reflected in freight rates gains; on the contrary, freight rates were under pressure, mainly due to a tonnage build up in that part of the world. Interest in West Africa for VLCCs was waning, and freight rates declined as they followed the trend in the Middle East. Market movement maintained its slow pace even when September requirements arrived, as continuous vessel availability generally left charterers in no rush to secure their requirements; this was also encouraged by the declining trend in freight rates. Owners were hoping for the market to stabilise, as their tactics were unable to prevent rates from declining. Freight rates for west-bound fixtures were no better; they were reported to be lower, in combination with low activity. Holidays in the UK added some pressure on westbound spot freight rates. The end of the month saw enhanced activity, however freight rates remained stable at the low rates seen earlier, with the tanker market remaining under the influence of abundant vessel supply. Consequentially, both Middle East-to-East and Middle East-to-West spot freight rates decreased by 21% and 19%, respectively, from the previous month, while spot freight rates on the West Africa-to-East route declined by 15%. In an annual comparison, VLCC freight rates on the reported routes were lower by 8%, 12% and 5%, respectively. Despite declining sentiment in the VLCC segment, the Suezmax market registered an average increase in its freight rates of 7% over one month ago. The gains were mainly as a result of an active market. In West Africa, freight rates increased in August by 2.0% from July to stand at 59 WS points. This increase came mainly on the back of stable demand for Suezmax and limited activity for VLCC in that area. Demand for vessels loading from West Africa to Indian ports remained high and tonnage demand for Mediterranean loading was stable at the beginning of the month, though it declined later. Freight rates for vessels operating on the Middle East-to-East route increased on the back of delays seen in Indian ports, which forced charterers to find prompt replacements; this was done at premiums over the prevailing rates. In the Caribbean, an expected weather disruption did not materialise, thus vessels’ loading schedules functioned without disturbance, and as a result freight rates and vessel availability remained stable. By the end of August, Suezmax freight rates saw a weakening trend across a number of routes, due in large part to less activity. On a monthly average, reported freight rates for the Northwest Europe-to-US Gulf Coast and West Africa-to-US Gulf Coast routes increased by 13% and 2%, respectively. Aframax spot freight rates were mixed in August. In general, there has been a notable slowdown in activity in the Mediterranean at certain points and lower tonnage requirements. However, freight rates were seen to be higher due to delays in some ports and supply flow uncertainty in others. Thus, average Aframax spot freight rates for vessels trading on the Mediterranean-to-Mediterranean route ended the month flat to average 82 WS points, while freight rates seen on the Mediterranean-to-Northwest Europe route increased slightly to average 76 WS points over last month’s levels. Activity in the North Sea and the Baltics increased in August, despite closure of the
20
40
60
80
100
20
40
60
80
100
Aug
12
Sep
12
Oct
12
Nov
12
Dec
12
Jan
13
Feb
13
Mar
13
Apr 1
3
May
13
Jun
13
Jul 1
3
Aug
13
WorldscaleWorldscale
Med/NWE (Aframax) West Africa/USGC (Suezmax) Middle East/East (VLCC)

_________________________________________________________________________________________________________________________________________Monthly Oil Market Report
September 2013 55
Primorsk oil terminal for planned maintenance. However, the active market did benefit from higher freight rates, as the well-populated position list eventually thinned due to continuous fuel oil and crude activity, particularly for September liftings. In the Caribbean, freight rates registered their highest increase among other areas. The market firmed as a result of delays and increased lighterage activities, in addition to premiums paid for prompt replacements and tight availability for certain windows. As a result, spot freight rates for vessels operating on the Caribbean-to-US East Coast route saw a worthy increase of 16% to average 104 WS points, while Indonesia-to-East freight rates lost 3 WS points from last month to average 80 WS point in August.
Table 7.2: Spot tanker crude freight rates, Worldscale
Clean tanker market sentiment was mixed in August, but up on average by 4% from a month ago
Clean tanker market sentiment was mixed in August, with all reported routes showing positive performance except for the Northwest Europe-to-US route, which declined by 9% from last month. On average, the clean tanker market was up by 4% from a month ago. In the West of Suez, MR vessels were under pressure as a result of a lack of cargoes and low fixing levels. The market did balance itself to a certain extent and freight rates rose back to levels of WS 110 or more after dipping to approximately WS 90 points in the middle of the month. On average, the Northwest Europe-to-US route reported WS 118 in August, down 9% from last month. However, spot freight rates on the Mediterranean-to-Mediterranean and Mediterranean-to-Northwest Europe routes increased by 4% and 3%, respectively. East of Suez clean spot freight rates increased by 14% compared to the previous month. This increase was mainly seen due to a good level of activity registered for LR vessels and a tighter positions list. The positive trend in LR vessels also affected MR vessels, as they were chosen as an alternative to LR tankers when freight rates in that category hit a higher level. Thus, freight rates for both the Middle East-to-East and Singapore-to-East routes edged up by 28% and 4%, respectively, from a month earlier.
Graph 7.2: Monthly averages of clean spot freight rates
Size Change1,000 DWT Jun 13 Jul 13 Aug 13 Aug/Jul
CrudeMiddle East/East 230-280 42 42 33 -9Middle East/West 270-285 25 27 22 -5West Africa/East 260 40 41 35 -6West Africa/US Gulf Coast 130-135 48 58 59 1NW Europe/USEC-USGC 130-135 46 48 54 6Indonesia/US West Coast 80-85 72 83 80 -3Caribbean/US East Coast 80-85 94 90 104 14Mediterranean/Mediterranean 80-85 74 82 82 0Mediterranean/North-West Europe 80-85 70 75 76 1
Source: Galbraith’s tanker market report and Platts.
20
40
60
80
100
20
40
60
80
100
Aug
12
Sep
12
Oct
12
Nov
12
Dec
12
Jan
13
Feb
13
Mar
13
Apr 1
3
May
13
Jun
13
Jul 1
3
Aug
13
WorldscaleWorldscale
Med/NWE (Aframax) West Africa/USGC (Suezmax) Middle East/East (VLCC)
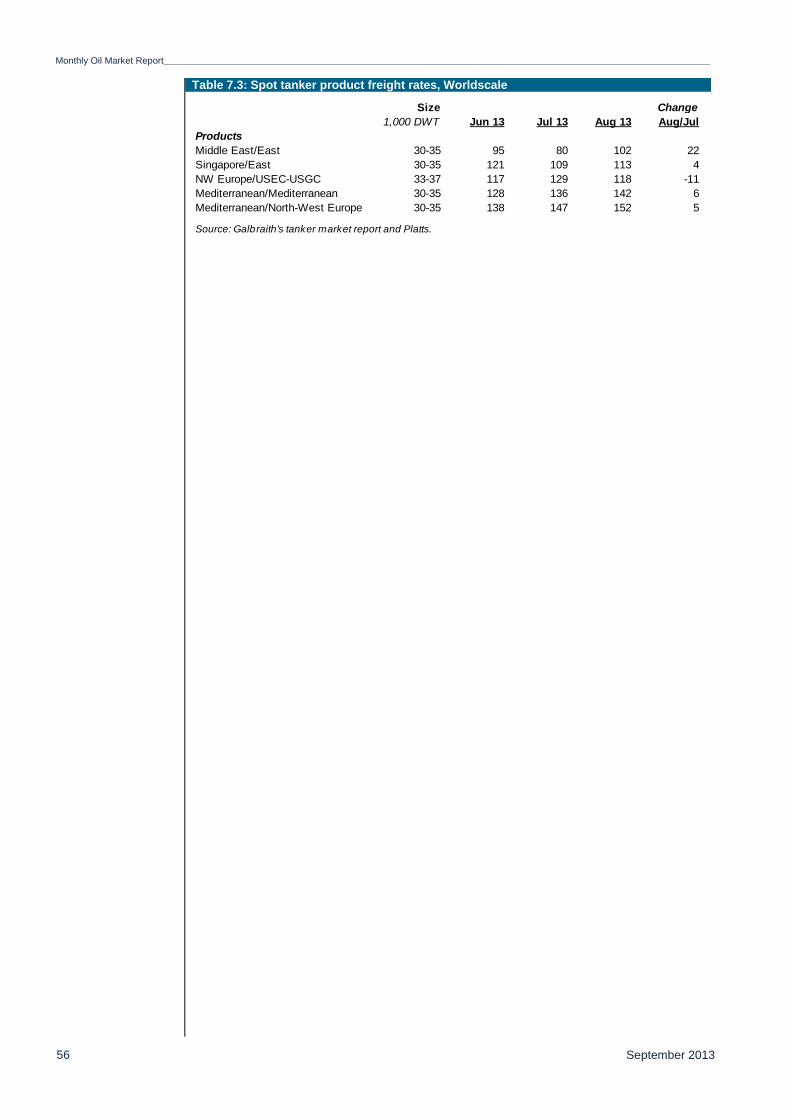
Monthly Oil Market Report_________________________________________________________________________________________________________________________________________
September 2013 56
Table 7.3: Spot tanker product freight rates, Worldscale
Size Change1,000 DWT Jun 13 Jul 13 Aug 13 Aug/Jul
ProductsMiddle East/East 30-35 95 80 102 22Singapore/East 30-35 121 109 113 4NW Europe/USEC-USGC 33-37 117 129 118 -11Mediterranean/Mediterranean 30-35 128 136 142 6Mediterranean/North-West Europe 30-35 138 147 152 5
Source: Galbraith’s tanker market report and Platts.

_________________________________________________________________________________________________________________________________________Monthly Oil Market Report
September 2013 57
Oil Trade US US crude oil imports increased in August from a month ago to average 8 mb/d
In August, preliminary data shows that US crude oil imports increased by 227 tb/d or 3% from the previous month to average 8 mb/d, the highest since November 2012. On an annual basis, this reflects a loss of 520 tb/d or 6% less from a year earlier.
Graph 8.1: US imports of crude and petroleum products
US product imports declined by 72 tb/d or 4% m-o-m to average 1.9 mb/d, while on a yearly basis, they dropped by 174 tb/d or 8%. Product imports in August were the lowest since March 2012. On a y-t-d comparison, both crude and product imports declined by 11% and 3%, respectively. US product exports registered a gain by 245 tb/d or 8% in August to average 3.1 mb/d from the previous month. On an annual comparison, the figures reflect a drop of approximately 275 tb/d or 9%. As a result, total US net imports decreased in August to average 6.8 mb/d, around 2% lower than the previous month and 14% less than last year’s level.
Graph 8.2: US exports of crude and petroleum products
6
7
8
9
10
-0.5
0.5
1.5
2.5
3.5Au
g 12
Sep
12
Oct
12
Nov
12
Dec
12
Jan
13
Feb
13
Mar
13
Apr 1
3
May
13
Jun
13
Jul 1
3
Aug
13
mb/dmb/d
Others* Propane/Propylene GasolineJet fuel/Kerosene Fuel oil Crude (RHS)
*Others: Contains natural gas liquids, liquefied refinery gases (LRG's), other liquids and all finished petroleumproducts except gasoline, jet fuel/kerosene, fuel oil and propane/propylene.
0
50
100
150
200
0
1,000
2,000
3,000
4,000
Aug
12
Sep
12
Oct
12
Nov
12
Dec
12
Jan
13
Feb
13
Mar
13
Apr 1
3
May
13
Jun
13
Jul 1
3
Aug
13
tb/dtb/d
Others* Propane/Propylene GasolineJet fuel/Kerosene Fuel oil Crude (RHS)
*Others: Contains natural gas liquids, liquefied refinery gases (LRG's), other liquids and all finished petroleumproducts except gasoline, jet fuel/kerosene, fuel oil and propane/propylene.

Monthly Oil Market Report_________________________________________________________________________________________________________________________________________
September 2013 58
In June, Canada remained the top supplier, accounting for 31% of total US crude imports, up by 1.5% or 36 tb/d from last month. Canada has held the top supplier position to the US since March 2006. Saudi Arabia ranked as the second supplier to the US, holding a share of 19% of total crude imports. Saudi Arabia’s crude exports to the US were stable from a month earlier. Venezuela came in third in June, after it increased its volumes from last month by 164 tb/d.
However, on average, crude imports from all OPEC Member Countries went down in June from the previous month by 164 tb/d or 4% to average 3.6 mb/d, and accounted for 47% of total US crude imports. Meanwhile, US product imports from OPEC Member Countries decreased from a month earlier to stand at 205 tb/d, representing a share of 10% of the total products imported by the US, down from the 15%-share held in the same month the previous year. As to product supplier share, Canada and Russia maintained their positions as first and second suppliers to the US, with a share of 24% and 22%, respectively. Yet, volume-wise, both Canada and Russia decreased their exports from last month by 3% and 14%, respectively. The UK was the third product supplier to the US in June.
Table 8.1: US crude and product net imports, tb/d
Japan Japan crude oil imports increased in July to average 3.5 mb/d
Japan crude oil imports increased in July by 207 tb/d or 6% to average 3.5 mb/d, reaching the highest level seen since April 2013. On an annual basis, crude imports increased in July by 2%.
Graph 8.3: Japan’s imports of crude and petroleum products
Saudi Arabia, as in the previous month, maintained its position as the first crude supplier to Japan, holding a share of 30% of total crude exports to Japan, up by 135 tb/d or 15% from last month. Nevertheless, these volumes were found to be down by 91 tb/d or 9% from the previous year. The UAE was the second-largest supplier to Japan with a share of 25% of total crude imports. Qatar came in third, holding a share of 16%. While UAE crude exports were less than last month, Qatar saw an increase in its monthly exports by 71 tb/d or 15%.
ChangeJun 13 Jul 13 Aug 13 Aug/Jul
Crude oil 7,610 7,832 8,056 224Total products -1,365 -890 -1,207 -317Total crude and products 7,549 6,942 6,850 -93
0
1
2
3
4
5
0200400600800
1,0001,2001,400
Jul 1
2
Aug
12
Sep
12
Oct
12
Nov
12
Dec
12
Jan
13
Feb
13
Mar
13
Apr 1
3
May
13
Jun
13
Jul 1
3
mb/dtb/d
Others* LPG Naphtha Fuel oil Crude (RHS)
*Others: Contains gasoline, jet fuel, kerosene, gasoil, asphalt and paraffin wax.

_________________________________________________________________________________________________________________________________________Monthly Oil Market Report
September 2013 59
Graph 8.4: Japan’s exports of petroleum products
Similary, Japan’s product imports increased in July by 11 tb/d to average 522 tb/d, however, annually, product imports were lower by 137 tb/d or 21%. Japan’s product import increase came as a result of higher imports of gasoline and fuel oil, which increased by 35% each. As for product exports, Japan’s exports in July saw a drop by 44 tb/d or 8% to average 512 tb/d, the lowest since March of this year. Annually, exports were up by 29 tb/d or 6%. Accordingly, Japan’s net imports increased in July by 263 tb/d to average 3.5 mb/d, reflecting a monthly gain of 8%, however, annually, dropping by 3%.
Table 8.2: Japan’s crude and product net imports, tb/d
China China’s crude oil imports increased in July to average 6.1 mb/d
China’s crude oil imports increased in July by 765 tb/d or 14% from the previous month to average 6.1 mb/d. The record-high monthly crude imports were mostly due to a number of temporary factors in addition to a series of disruptions to domestic crude production and quality matters. On an annual comparison, China’s crude imports were 20% higher. On a y-t-d analysis, the figures reflect an increase of 111 tb/d or 2%. In terms of supplier share, Saudi Arabia, Angola and Oman were the top crude suppliers to China this month, holding a share of 20%, 13% and 13%, respectively. All top suppliers increased their exports to China by a percentage ranging from 2% to 78% from a month ago. While Saudi Arabia and Oman increased their exports from last year, Angola’s volumes were fairly stable compared to last year’s level. On the other hand, China’s product imports decreased in July by 35 tb/d from the previous month and increased 39 tb/d from a year earlier to average 798 tb/d, the lowest since March of this year.
0100200300400500600700800
0100200300400500600700800
Jul 1
2
Aug
12
Sep
12
Oct
12
Nov
12
Dec
12
Jan
13
Feb
13
Mar
13
Apr
13
May
13
Jun
13
Jul 1
3
tb/dtb/d
Fuel oil Gasoil Jet fuel Others*
*Others: Contains LPG, gasoline, naphtha, kerosene, lubricating oil, asphalt and paraffin wax.
ChangeMay 13 Jun 13 Jul 13 Jul/Jun
Crude oil 3,379 3,278 3,485 208Total products 208 248 377 129Total crude and products 3,587 3,526 3,862 336
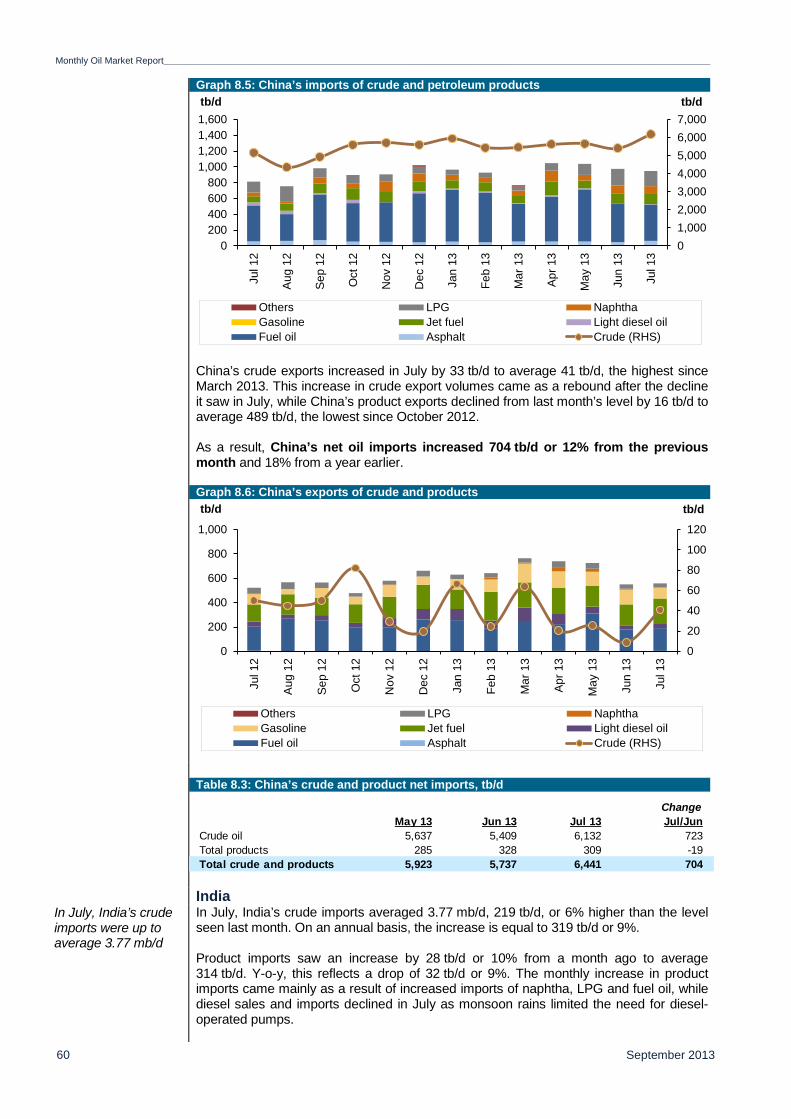
Monthly Oil Market Report_________________________________________________________________________________________________________________________________________
September 2013 60
Graph 8.5: China’s imports of crude and petroleum products
China’s crude exports increased in July by 33 tb/d to average 41 tb/d, the highest since March 2013. This increase in crude export volumes came as a rebound after the decline it saw in July, while China’s product exports declined from last month’s level by 16 tb/d to average 489 tb/d, the lowest since October 2012. As a result, China’s net oil imports increased 704 tb/d or 12% from the previous month and 18% from a year earlier.
Graph 8.6: China’s exports of crude and products
Table 8.3: China’s crude and product net imports, tb/d
India In July, India’s crude imports were up to average 3.77 mb/d
In July, India’s crude imports averaged 3.77 mb/d, 219 tb/d, or 6% higher than the level seen last month. On an annual basis, the increase is equal to 319 tb/d or 9%. Product imports saw an increase by 28 tb/d or 10% from a month ago to average 314 tb/d. Y-o-y, this reflects a drop of 32 tb/d or 9%. The monthly increase in product imports came mainly as a result of increased imports of naphtha, LPG and fuel oil, while diesel sales and imports declined in July as monsoon rains limited the need for diesel-operated pumps.
01,0002,0003,0004,0005,0006,0007,000
0200400600800
1,0001,2001,4001,600
Jul 1
2
Aug
12
Sep
12
Oct
12
Nov
12
Dec
12
Jan
13
Feb
13
Mar
13
Apr
13
May
13
Jun
13
Jul 1
3
tb/dtb/d
Others LPG NaphthaGasoline Jet fuel Light diesel oilFuel oil Asphalt Crude (RHS)
0
20
40
60
80
100
120
0
200
400
600
800
1,000
Jul 1
2
Aug
12
Sep
12
Oct
12
Nov
12
Dec
12
Jan
13
Feb
13
Mar
13
Apr
13
May
13
Jun
13
Jul 1
3
tb/dtb/d
Others LPG NaphthaGasoline Jet fuel Light diesel oilFuel oil Asphalt Crude (RHS)
ChangeMay 13 Jun 13 Jul 13 Jul/Jun
Crude oil 5,637 5,409 6,132 723Total products 285 328 309 -19Total crude and products 5,923 5,737 6,441 704

_________________________________________________________________________________________________________________________________________Monthly Oil Market Report
September 2013 61
Graph 8.7: India’s imports of crude and petroleum products
In terms of exports, India’s products increased in July by 127 tb/d from the previous month to average 1.4 mb/d, while they increased by 144 tb/d or 12% a year earlier. Monthly exports of petrol dropped by 4% from the previous month while all other product exports increased by a percentage ranging between 0.3% to 27%. Consequentially, India’s net imports increased by 119 tb/d to average 2.7 mb/d or 5% higher than last month and a year ago.
Graph 8.8: India’s exports of petroleum products
Table 8.4: India’s crude and product net imports, tb/d
FSU In July, total FSU crude oil exports increased slightly to average 6.3 mb/d.
In July, total FSU crude oil exports increased slightly by 38 tb/d or 0.6 % to average 6.3 mb/d. Crude exports through Russian pipelines saw minor gains as they increased by 12 tb/d or 0.3% to average 3.9 mb/d. Shipments from the Druzhba pipeline to Central and Eastern Europe increased by 38 tb/d or 3% to average 1.1 mb/d as greater quantities were exported to Hungary. Exports through Kozmino also increased by a similar volume as both Lukoil and Gazpromneft shipped their cargoes in July. Black Sea exports dropped by 55 tb/d or
0
1,000
2,000
3,000
4,000
5,000
0
100
200
300
400
500
Jul 1
2
Aug
12
Sep
12
Oct
12
Nov
12
Dec
12
Jan
13
Feb
13
Mar
13
Apr
13
May
13
Jun
13
Jul 1
3
tb/dtb/d
Others LPG Naphtha GasolineKerosene Gasoil Fuel oil Crude (RHS)
02004006008001,0001,2001,4001,600
0200400600800
1,0001,2001,4001,600
Jul 1
2
Aug
12
Sep
12
Oct
12
Nov
12
Dec
12
Jan
13
Feb
13
Mar
13
Apr
13
May
13
Jun
13
Jul 1
3
tb/dtb/d
Fuel oil Gasoil Jet fuel Gasoline Naphtha Others
ChangeMay 13 Jun 13 Jul 13 Jul/Jun
Crude oil 4,062 3,550 3,769 219Total products -973 -952 -1,051 -99Total crude and products 3,089 2,598 2,718 119
Note: India data tab le does not include information for crude import and product export by Reliance Industries.

Monthly Oil Market Report_________________________________________________________________________________________________________________________________________
September 2013 62
7% to average715 tb/d. Also, exports from the Baltics declined by 49 tb/d or 4% to average 1.3 mb/d in July. Loadings of the CPC blend rose 32 tb/d or 5% from June to average 737 tb/d.
Concerning product exports, FSU total product exports were stable from a month earlier to average 3.4 tb/d. The monthly product exports showed increased volumes of gasoline and naphtha by 15% and 18%, respectively, and a decline in jet, fuel oil and gasoil exports by 11 tb/d, 24 tb/d and 53 tb/d, respectively.
Table 8.5: Recent FSU exports of crude and products by sources, tb/d
2011 2012 4Q12 1Q13 2Q13 Jun 13 Jul 13*Crude
Russian pipeline Black Sea 918 858 774 769 752 770 715 Baltic 1,511 1,747 1,665 1,574 1,647 1,369 1,320 Druzhba 1,170 1,079 980 991 1,020 1,044 1,080 Kozmino 309 331 380 438 433 421 456Total 4,224 4,322 4,100 4,086 4,152 3,900 3,912
Other routes Russian rail 173 107 195 196 178 187 233 Russian-Far East 283 258 242 243 261 243 234 Kazakh rail 158 97 165 183 169 177 224 Vadandey 82 66 104 103 109 105 117 Kaliningrad 23 20 17 18 21 24 19 CPC 685 656 614 672 703 705 737 BTC 695 654 590 601 714 729 697 Kenkiyak-Alashankou 222 210 252 240 232 228 213 Caspian 170 173 166 189 148 132 128
6,558 6,466 6,280 6,347 6,518 6,252 6,290
ProductsGasoline 162 130 124 141 123 132 151Naphtha 259 313 345 339 355 357 420Jet 10 9 10 14 16 18 7Gasoil 773 791 787 977 875 907 883Fuel oil 1,305 1,416 1,314 1,339 1,557 1,623 1,570VGO 211 250 234 219 288 323 326Total 2,721 2,909 2,814 3,028 3,214 3,359 3,357
9,279 9,375 9,095 9,375 9,732 9,611 9,647
Total crude exports
Total oil exports
* PreliminaryTotals may not add due to independent rounding.
Source: Nefte Transport, Global Markets, Argus Fundamentals, Argus FSU and OPEC.

_________________________________________________________________________________________________________________________________________Monthly Oil Market Report
September 2013 63
Stock Movements
OECD Preliminary data for July shows total OECD commercial oil stocks rose by 5.3 mb for the second consecutive month
Preliminary data for July shows total OECD commercial oil stocks rose by 5.3 mb for the second consecutive month, ending July at 2,668 mb. At this level, inventories were 55.5 mb below the five-year average and showed a deficit of 49.1 mb compared with the same time a year ago. It should be noted that OECD commercial oil stocks were revised down by 9.3 mb in April and 32 mb in May, mainly driven by a downward revision in OECD Americas and Europe. This downward adjustment has contributed to widening the gap with the latest five-year average from a month earlier. Within the components, the recent trend of declining crude oil stocks and rising product inventories continues. Crude commercial stocks went down by 13.4 mb for the third consecutive month, while products increased by 18.7 mb following a build of 33.6 mb in June. On a regional basis, the picture was mixed; OECD Asia-Pacific and OECD Americas saw a build of 7.3 mb and 0.3 mb, respectively, while OECD Europe experienced a drop of 2.0 mb, compared with the previous month. In terms of days of forward cover, OECD commercial stocks rose by 0.2 days in July to stand at 58.5 days. This represents around 0.3 days above the five-year average, some 0.5 days lower than in the same month last year. OECD Americas was 1.1 days above the historical average, while Europe and Asia-Pacific indicated deficits of 0.7 and 1.2 days, respectively. At 1,263 mb, OECD crude commercial stocks in July stood at 46.4 mb below the same period one year earlier and 38 mb below the five-year average. Product stocks ended the month at 1,405 mb, showing a deficit of 35.6 mb with the seasonal average and a slight deficit of 2.8 mb compared with the previous year.
Graph 9.1: OECD’s commercial oil stocks
OECD Americas’ inventories rose slightly by 0.3 mb for the fourth consecutive month to end July at 1,376 mb. However, this build is much less than the one that occurred in the last three months, which was around 11 mb. At this level, inventories are at comfortable levels, indicating a surplus of 8.4 mb over the same time last year and 33.6 mb higher than the seasonal norm. This surplus was divided between crude oil and products, with an excess of 17.8 mb and 15.8 mb, respectively. In July, the build in total commercial stocks came from products, increasing by 12.7 mb, while crude abated this build, declining by 12.4 mb. A rise in US refinery input of nearly 16.1 mb/d — corresponding to a utililsation rate of 92.2% — boosted product stocks. During the period April to July, product stocks in OECD Americas accumulated a build of almost 54 mb. In contrast, a fall in crude oil imports, combined with higher refinery crude demand, was behind the stock-draw in July. OECD Europe’s inventories fell by 2.0 mb for six consecutive months, ending July at
2,500
2,550
2,600
2,650
2,700
2,750
2,800
2,850
2,500
2,550
2,600
2,650
2,700
2,750
2,800
2,850
Jan Feb Mar Apr May Jun Jul Aug Sep Oct Nov Dec
mbmb
2012 2013 Average 2008-12
Max/Min2008-12

Monthly Oil Market Report_________________________________________________________________________________________________________________________________________
September 2013 64
876 mb. With this draw, the deficit from the previous month has widened to stand at 48.7 mb below last year and 89.3 mb lower than the seasonal norm. This shortage is attributed to both crude and products. In July, crude commercial stocks in OECD Europe fell by 0.9 mb for the third consecutive month, driven mainly by limited crude exports. Product stocks also fell by 1.1 mb on the back of a lower refinery utilisation rate.
It should be noted that, despite the lower absolute level of OECD Europe commercial stocks and the large deficit with the five-year average, days of forward cover remain at around 64.5 days, almost in line with the five-year average for days of forward cover. This mainly reflects the weakness in oil consumption in this region. Commercial inventories in OECD Asia-Pacific rose by 7.0 mb in July, following a build in the last month to stand at 416 mb. At this level, they were 8.4 mb below the same period a year ago, but they are in line with the five-year average. Within the components, the total build came from products as they rose by 7.1 mb, while crude saw a slight drop of 0.1 mb. Crude inventories stood at 9.3 mb below a year ago but are in line with the five-year average. OECD Asia-Pacific’s total product inventories are at the same level when compared to a year ago and to the five-year average.
Table 9.1: OECD commercial stocks, mb
EU plus Norway Preliminary data for July shows that European stocks fell by 2.0 mb, reversing the build of the last month
Preliminary data for July shows that European stocks fell by 2.0 mb, reversing the build of the last month to stand at 1,062.0 mb. At this level, they are almost in line with the same time a year ago, but still 46.2 mb or 4.2% below the five-year average. Both crude and products experienced a stock-draw in July, as they declined by 0.9 mb and 1.1 mb, respectively.
Graph 9.2: EU-15 plus Norway’s total oil stocks
European crude inventories fell for the second consecutive month, ending July at 455.7 mb. At this level, European crude oil stocks were 5.3 mb or 1.2% below the same period last year and represent a deficit of 14.5 mb or 3.1% compared with the latest five-year average. Limited crude supply from Russia combined with reduced exports from Iraq and Libya were behind the fall in crude oil stocks. Lower refinery crude runs limited a further drop in crude oil inventories. Indeed, refiners have decreased crude runs by around 133,000 b/d in July from the previous month. At 10.3 mb/d, runs were about 900,000 b/d lower than a year earlier. This corresponds to utilisation rates of just 82% compared with 87% in July a year earlier.
ChangeMay 13 Jun 13 Jul 13 Jul 13/Jun 13 Jul 12
Crude oil 1,299 1,277 1,263 -13.4 1,310Products 1,352 1,386 1,405 18.7 1,407Total 2,651 2,663 2,668 5.3 2,717
Days of forward cover 58.0 58.3 58.5 0.2 58.9
1,040
1,060
1,080
1,100
1,120
1,140
1,160
1,180
1,040
1,060
1,080
1,100
1,120
1,140
1,160
1,180
Jan Feb Mar Apr May Jun Jul Aug Sep Oct Nov Dec
mbmb
2012 2013 Average 2008-12
Max/Min2008-12

_________________________________________________________________________________________________________________________________________Monthly Oil Market Report
September 2013 65
Product stocks in Europe also saw a decline of 1.1 mb in July, reversing the stock-
build of the last month. At 606.3 mb, European product stocks represented a surplus of 4.2 mb or 0.7% over the same period last year, but remained some 31.7 mb or 5.0% below the five-year average. Within products, the picture was mixed: gasoline and residual fuel oil saw a draw, while distillate stocks experienced a build. Naphtha stocks remained unchanged from the previous month. Gasoline stocks fell by 1.8 mb, reversing the build of the last month and ending July at 110.2 mb. At this level, they represent a surplus of 3.9 mb or 3.7% over a year ago, but they are 1.0 mb or 0.9% above the five-year average. Higher gasoline exports to the US, following a surge in gasoline requirements amid the driving season, were behind the decline in gasoline stocks. Lower gasoline production also contributed to the decline of gasoline inventories. Residual fuel oil stocks also fell by 1.9 mb, reversing last month’s build, ending July at 87.7 mb. Despite this stock-draw, they were 1.4 mb or 1.6% above the same time last year, but still remained at 15.8 mb or 15.3% below the seasonal average. Higher exports to Asia-Pacific contributed to the fall in residual fuel stocks in July. In contrast, distillate stocks rose by 2.6 mb, following a build of 4.1 mb in June, ending the month of July at 382.5 mb. With this build, they represented a surplus of 5.5 mb or 1.5% over the previous year, but they are still 9.3 mb or 2.4% below the seasonal norm. The stock-build mainly reflected weaker demand in the region.
Table 9.2: EU-15 plus Norway’s total oil stocks, mb
US Preliminary data for August shows that US total commercial oil stocks fell slightly by 0.7 mb, reversing the build of the last five months
Preliminary data for August shows that US total commercial oil stocks fell slightly by 0.7 mb, reversing the build of the last five months, to stand at 1121.2 mb. Despite this decline, inventories stood at 16.3 mb, or 1.5%, above last year at the same time and indicated a gain of 30.7 mb, or 2.8%, over the five-year average. The stock-draw was attributed to crude, which decreased by 3.1 mb, while products abated this fall, increasing by 2.3 mb.
Graph 9.3: US weekly commercial crude oil stocks
ChangeMay 13 Jun 13 Jul 13 Jul 13/Jun 13 Jul 12
Crude oil 462.6 456.6 455.7 -0.9 461.0Gasoline 107.5 112.0 110.2 -1.8 106.3Naphtha 26.4 26.0 26.0 0.0 32.5Middle distillates 375.8 379.9 382.5 2.6 377.0Fuel oils 85.1 89.6 87.7 -1.9 86.3Total products 594.8 607.4 606.3 -1.1 602.1Total 1,057.4 1,064.0 1,062.0 -2.0 1,063.1
Source: Argus and Euroilstock.
280
300
320
340
360
380
400
280
300
320
340
360
380
400
1 4 7 10 13 16 19 22 25 28 31 34 37 40 43 46 49 52
mbmb
2012 2013 Average 2008-12
Max/Min2008-12

Monthly Oil Market Report_________________________________________________________________________________________________________________________________________
September 2013 66
US commercial crude stocks fell by 3.1 mb for the fourth month to end August at 360.2 mb. Despite this drop, US crude oil commercial stocks finished the month at 19.1 mb, or 5.6%, above the five-year average, while they were 2.3 mb, or 0.6%, lower than a year ago at the same time. The bulk of the stock-draw came during the week ending 30 August, due to a combination of a decline of crude oil imports combined with higher crude runs. US crude oil imports fell by 119,000 b/d to stand at 8.3 mb/d, while US crude oil refinery inputs rose by 162,000 b/d to 15.9 mb/d. The increase in runs helped utilization rates to rise by 0.5% to 91.7% of capacity, which was 5.6 percentage points (pp) higher than last year at the same time. Inventories in Cushing continued to decline, dropping by nearly 5 mb in August from a month earlier to stand at 34.8 mb. Crude stocks have fallen almost 16 mb since the week ending 24 May. The rapid fall in crude oil stocks has been due to recent pipeline developments, including the reversal of the 400,000 b/d Seaway pipeline from Cushing to the US Gulf Coast, as well as the reversal of the around 225,000 b/d Magellan Longhorn pipeline to carry crude from West Texas to Houston, rather than to Cushing. The restart of the 250,000 b/d BP crude unit at Whiting refinery in June resulted in increasing utilisation rates to almost 94% of capacity in the US midcontinent, leading to higher crude demand from refineries also contributing to the decline in Cushing inventories. This stock-draw strengthened the WTI price relative to other benchmarks, leaving the Brent-WTI spread at around minus $5/b, compared to minus $20/b just five months ago.
Graph 9.4: US weekly gasoline stocks
Total product stocks rose in August for five consecutive months to stand at 761.0 mb, which is the highest level since September 2010. Since last April, US product inventories accumulated more than 51 mb on the back of higher refinery throughput. With this build, they stood at 18.6 mb, or 2.5%, higher than a year ago. Compared with the seasonal average, product stocks stood at 11.5 mb, or 1.5%, above the five-year average. Within products, the picture was mixed; gasoline, fuel oil and residual fuel oil saw a stock-draw, while distillates, jet fuel oil, unfinished products and propylene witnessed builds. Distillate stocks rose by 3.1 mb, following three consecutive months of a build to stand at 129.6 mb. Despite this build, they still indicated a deficit of 21.7 mb or 14.3% below the five-year average, while they switched the deficit in the previous month to a surplus of 1.7%. A decline of around 180,000 b/d in apparent demand contributed to the build in distillate stocks. Higher distillate output also supported the build in stocks. In contrast, gasoline stocks fell by 7.6 mb in August, after declining by 1.3 mb in July to stand at 216.0 mb. At this level, gasoline stocks stood at 15.3 mb, or 7.6%, above a year ago, and 8.5 mb or 4.1% higher than the seasonal average. The draw in gasoline stocks was driven mainly by higher gasoline demand during the summer season.
175
185
195
205
215
225
235
245
175
185
195
205
215
225
235
245
1 4 7 10 13 16 19 22 25 28 31 34 37 40 43 46 49 52
mbmb
2012 2013 Average 2008-12
Max/Min2008-12
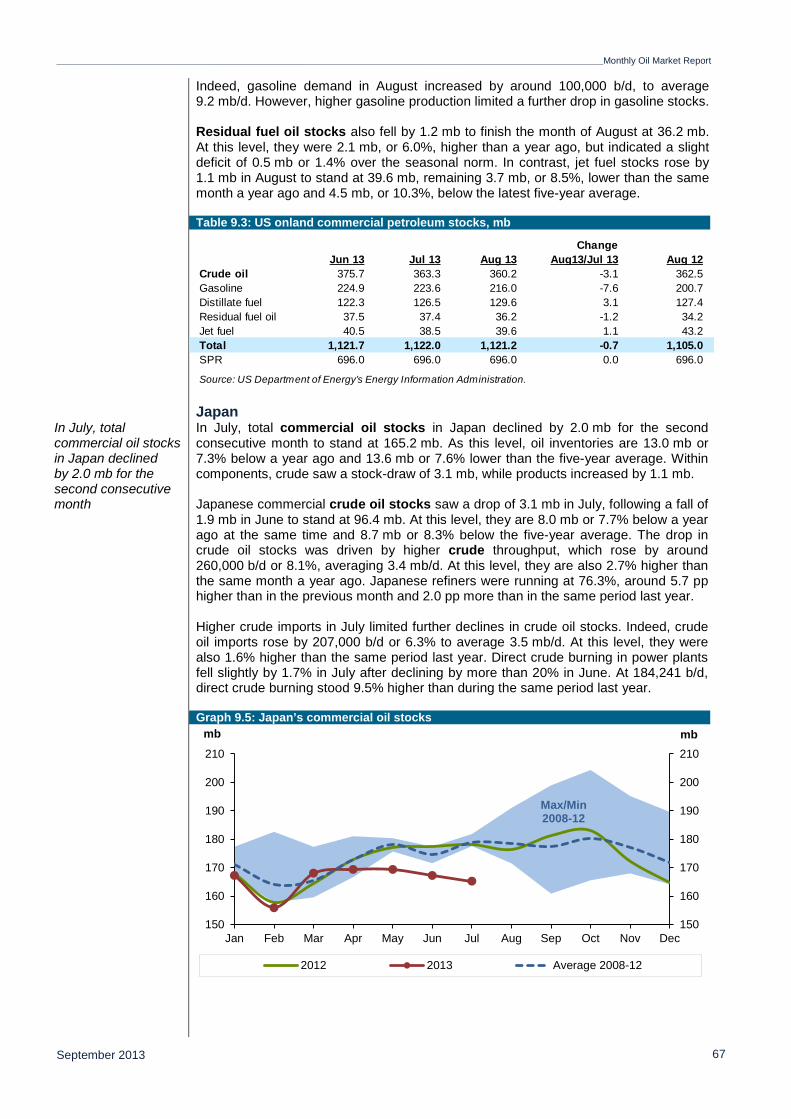
_________________________________________________________________________________________________________________________________________Monthly Oil Market Report
September 2013 67
Indeed, gasoline demand in August increased by around 100,000 b/d, to average 9.2 mb/d. However, higher gasoline production limited a further drop in gasoline stocks. Residual fuel oil stocks also fell by 1.2 mb to finish the month of August at 36.2 mb. At this level, they were 2.1 mb, or 6.0%, higher than a year ago, but indicated a slight deficit of 0.5 mb or 1.4% over the seasonal norm. In contrast, jet fuel stocks rose by 1.1 mb in August to stand at 39.6 mb, remaining 3.7 mb, or 8.5%, lower than the same month a year ago and 4.5 mb, or 10.3%, below the latest five-year average.
Table 9.3: US onland commercial petroleum stocks, mb
Japan In July, total commercial oil stocks in Japan declined by 2.0 mb for the second consecutive month
In July, total commercial oil stocks in Japan declined by 2.0 mb for the second consecutive month to stand at 165.2 mb. As this level, oil inventories are 13.0 mb or 7.3% below a year ago and 13.6 mb or 7.6% lower than the five-year average. Within components, crude saw a stock-draw of 3.1 mb, while products increased by 1.1 mb. Japanese commercial crude oil stocks saw a drop of 3.1 mb in July, following a fall of 1.9 mb in June to stand at 96.4 mb. At this level, they are 8.0 mb or 7.7% below a year ago at the same time and 8.7 mb or 8.3% below the five-year average. The drop in crude oil stocks was driven by higher crude throughput, which rose by around 260,000 b/d or 8.1%, averaging 3.4 mb/d. At this level, they are also 2.7% higher than the same month a year ago. Japanese refiners were running at 76.3%, around 5.7 pp higher than in the previous month and 2.0 pp more than in the same period last year. Higher crude imports in July limited further declines in crude oil stocks. Indeed, crude oil imports rose by 207,000 b/d or 6.3% to average 3.5 mb/d. At this level, they were also 1.6% higher than the same period last year. Direct crude burning in power plants fell slightly by 1.7% in July after declining by more than 20% in June. At 184,241 b/d, direct crude burning stood 9.5% higher than during the same period last year.
Graph 9.5: Japan’s commercial oil stocks
ChangeJun 13 Jul 13 Aug 13 Aug13/Jul 13 Aug 12
Crude oil 375.7 363.3 360.2 -3.1 362.5Gasoline 224.9 223.6 216.0 -7.6 200.7Distillate fuel 122.3 126.5 129.6 3.1 127.4Residual fuel oil 37.5 37.4 36.2 -1.2 34.2Jet fuel 40.5 38.5 39.6 1.1 43.2Total 1,121.7 1,122.0 1,121.2 -0.7 1,105.0SPR 696.0 696.0 696.0 0.0 696.0
Source: US Department of Energy’s Energy Information Administration.
150
160
170
180
190
200
210
150
160
170
180
190
200
210
Jan Feb Mar Apr May Jun Jul Aug Sep Oct Nov Dec
mbmb
2012 2013 Average 2008-12
Max/Min2008-12

Monthly Oil Market Report_________________________________________________________________________________________________________________________________________
September 2013 68
On the product side, Japan’s total product inventories saw a build of 1.1 mb in July, reversing the draw of the last two months to stand at 68.9 mb. Despite this build, they showed a deficit of 5.0 mb or 6.7% compared with a year ago and are 4.9 mb or 6.7% lower than the five-year average. Higher refinery output, which increased by 10.5% in July from June was behind the build in product inventories. At 3.2 mb/d, Japanese refinery output was 4.1% above the same period last year. A rise in product imports of 2.6% also contributed to the build in Japanese product stocks. However, the increase of total domestic sales of oil products in Japan, which rose by 11.7% from a month earlier to an average of 3.2 mb/d, limited a further build in product stocks. Within products, the picture was mixed; distillates and residual fuel oil witnessed builds, while gasoline and naphtha dropped. Distillate stocks rose by 2.4 mb in July for the second consecutive month, ending the month at 31.1 mb. At this level, they are 0.2 mb or 0.6% below a year ago and 1.4 mb or 4.2% above the seasonal average. Within distillate components, jet fuel and kerosene stocks rose, while gasoil stocks dropped. In July, kerosene inventories increased by 18.3%, driven by higher output, while improved domestic sales limited a further build in kerosene stocks. Jet fuel stocks rose by 4.1% on the back of higher production, which increased by 7.7%. In contrast, gasoil stocks fell by 1.1%, reflecting higher domestic sales, which increased by 10.9%. Total residual fuel oil stocks went up by 0.3 mb to end the month of July at 14.8 mb. At this level, they were 2.6 mb or 14.8% less than a year ago and 1.9 mb or 11.7% lower than the five-year average. Within the fuel oil components, the picture was mixed as fuel oil A inventories fell by 3.9%, while fuel oil B.C stocks rose by 6.2%. Naphtha stocks fell by 1.2 mb to finish the month of July at 10.2 mb. At this level, they represent a deficit of 0.9 mb or 8% compared with a year ago and 1.4 mb or 12.0% less than the seasonal norm. The drop in naphtha stocks came from higher domestic sales, which rose by 13.0%. Gasoline stocks also fell by 0.5 mb in July, ending the month at 12.8 mb. At this level, they are 1.3 mb or 9.5% less than the same time last year and 0.2 mb or 1.6% below the five-year average. A rise of 13.4% in domestic sales was behind this stock-draw, while higher gasoline output limited a further drop in gasoline stocks.
Table 9.4: Japan’s commercial oil stocks*, mb
ChangeMay 13 Jun 13 Jul 13 Jul 13/Jun 13 Jul 12
Crude oil 101.4 99.5 96.4 -3.1 104.5Gasoline 14.3 13.2 12.8 -0.5 14.1Naphtha 11.0 11.4 10.2 -1.2 11.1Middle distillates 27.5 28.8 31.1 2.4 31.3Residual fuel oil 15.3 14.4 14.8 0.3 17.3Total products 68.0 67.8 68.9 1.1 73.8Total** 169.4 167.2 165.2 -2.0 178.3
* At end of month.** Includes crude oil and main products only.Source: Ministry of Economy, Trade and Industry, Japan.
_________________________________________________________________________________________________________________________________________Monthly Oil Market Report
September 2013 69
Singapore and Amsterdam-Rotterdam-Antwerp (ARA) At the end of July, product stocks in Singapore fell for the second consecutive month
At the end of July, product stocks in Singapore fell for the second consecutive month, declining by 1.1 mb and ending the month at 36.8 mb. This stock-draw indicated a deficit of 2.2 mb or 5.6% compared with a year ago. All products saw a drop, with the bulk of the fall coming from fuel oil. Light distillate stocks fell by 0.1 mb for the fourth consecutive month, ending the month at 9.0 mb. With this stock-draw, light distillate stocks stood at 1.3 mb or 12.9% below a year ago in the same period. Lower imports to Singapore from mainly China and Taiwan were behind the decline. Taiwan’s CPC is expected to halt its exports to Singapore as it will close down an 80,000 b/d gasoline-production unit by October following a gas leak. This may lead to a further stock-draw in gasoline inventories in the next two months. Middle distillate stocks also fell by 0.2 mb for the third consecutive month, finishing the month of July at 7.9 mb. At this level, middle distillate stocks stood at 1.0 mb or 11.1 mb below the level observed over the same period last year. Higher diesel exports to Australia contributed to this drawdown in middle distillate stocks. A backwardated structure of the diesel market also contributed to keeping inventories at a minimum and higher diesel imports from India limited diesel inventories further. Residual fuel oil also fell by 0.9 mb in July for the second consecutive month, ending the month at 19.9 mb. Despite this stock-draw, fuel oil stocks represented a surplus of 0.1 mb or 0.6% over last year at the same time. The stock-draw was driven by lower imports.
Product stocks in ARA fell by 0.7 mb in July for the fourth consecutive month
Product stocks in Amsterdam-Rotterdam-Antwerp (ARA) fell by 0.7 mb in July for the fourth consecutive month to end at 28.8 mb. With this stock-draw, last month’s deficit with a year ago of 6.7% widened to 9.2%. Within products, the picture was mixed, with gasoil and jet oil witnessing builds, while gasoline, naphtha and fuel oil saw a drop. Gasoline stocks fell by 0.3 mb to end the month of July at 5.8 mb. Despite this stock-draw, gasoline stocks remained at 0.8 mb or 14.8% higher than the same period last year. The fall in gasoline stocks mainly reflects higher exports to the US, however ongoing weaker demand in the region limited a further drop in gasoline stocks. In contrast, gasoil rose in July by 0.4 mb, reversing the fall of June and ending the month at 14.4 mb. At this level, inventories remained at 3.0 mb or 17.2% below a year ago at the same time. The build in gasoil stocks partly reflects lower demand for diesel in the region. Jet fuel stocks saw a build of 0.2 mb to end the month of July at 3.0 mb and remained at 0.2 mb or 8.8 % above a year ago during the same period. In contrast, residual fuel oil stocks saw a drop of 0.5 mb, reversing the build of the last month and ending July at 4.6 mb. At this level, ARA fuel oil stocks stood at 0.4 mb or 8.8% lower than a year ago during the same period. Higher exports from the ARA hub were the main driver behind the drawdown in fuel oil stocks. Naphtha stocks fell by 0.5 mb to finish the month of July at 1.0 mb, standing almost 30% lower than the level seen at the same time last year.

Monthly Oil Market Report_________________________________________________________________________________________________________________________________________
September 2013 70
Balance of Supply and Demand Forecast for 2013 Required OPEC crude in 2013 estimated at 29.9 mb/d, down 0.5 mb/d from last year
Demand for OPEC crude in 2013 remained unchanged from the previous report to stand at 29.9 mb/d, representing a decrease of 0.5 mb/d from last year’s level. Within the quarters, the first quarter remained unchanged, while 2Q13 and 4Q13 saw an upward revision of around 0.1 mb/d. In contrast, the demand for OPEC crude in 3Q13 was revised down by 0.1 mb/d. The first quarter is estimated to fall by 0.3 mb/d versus the same quarter last year; while 2Q13 and 3Q13 are expected to see negative growth of 0.6 mb/d and 1.1 mb/d respectively. The fourth quarter is forecast to drop by 0.2 mb/d versus the same quarter last year.
Table 10.1: Summarized supply/demand balance for 2013, mb/d
Forecast for 2014 Demand for OPEC crude in 2014 forecast at 29.6 mb/d, 0.3 mb/d less than in the current year
Demand for OPEC crude in 2014 saw little change from the previous report to stand at 29.6 mb/d. This represents a decline of 0.3 mb/d compared to a year earlier. The first quarter remained unchanged from the previous assessment, while the second experienced a downward revision of 0.1 mb/d. The first and second quarters are expected to show declines of 0.1 mb/d and 0.2 mb/d respectively, versus the same period last year. The third quarter is expected to remained flat; however, the fourth is forecast to drop by 1.0 mb/d versus the same quarter last year.
Table 10.2: Summarized supply/demand balance for 2014, mb/d
Graph 10.1: Balance of supply and demand
2012 1Q13 2Q13 3Q13 4Q13 2013(a) World oil demand 88.92 88.86 88.93 90.20 90.92 89.74 Non-OPEC supply 52.92 53.82 53.73 54.09 54.35 54.00 OPEC NGLs and non-conventionals 5.57 5.76 5.78 5.81 5.85 5.80(b) Total supply excluding OPEC crude 58.48 59.58 59.51 59.90 60.20 59.80
Difference (a-b) 30.43 29.28 29.41 30.30 30.72 29.93
OPEC crude oil production 31.13 30.22 30.56 30.40Balance 0.70 0.94 1.14 0.10
Totals may not add up due to independent rounding.
2013 1Q14 2Q14 3Q14 4Q14 2014(a) World oil demand 89.74 89.89 89.85 91.38 91.94 90.77 Non-OPEC supply 54.00 54.78 54.70 55.12 56.24 55.21 OPEC NGLs and non-conventionals 5.80 5.88 5.93 5.97 6.01 5.95(b) Total supply excluding OPEC crude 59.80 60.66 60.63 61.10 62.25 61.16
Difference (a-b) 29.93 29.23 29.22 30.29 29.69 29.61
Totals may not add up due to independent rounding.
26
27
28
29
30
31
32
26
27
28
29
30
31
32
1Q13 2Q13 3Q13 4Q13 1Q14 2Q14 3Q14 4Q14
mb/dmb/d
OPEC crude production Required OPEC crude

_________________________________________________________________________________________________________________________________________Monthly Oil Market Report
September 2013 71
Ta
ble
10.3
: Wor
ld o
il de
man
d/su
pply
bal
ance
, mb/
d
2008
2009
2010
2011
2012
1Q13
2Q13
3Q13
4Q13
2013
1Q14
2Q14
3Q14
4Q14
2014
Wor
ld d
eman
dOE
CD48
.446
.447
.046
.546
.045
.845
.345
.746
.045
.745
.645
.145
.645
.845
.5Am
erica
s24
.523
.724
.124
.023
.723
.723
.823
.923
.823
.823
.823
.824
.023
.923
.9Eu
rope
15.5
14.7
14.7
14.3
13.7
13.2
13.6
13.6
13.4
13.4
13.0
13.3
13.4
13.3
13.3
Asia
Pacif
ic8.4
8.08.2
8.28.6
9.08.0
8.38.7
8.58.8
7.98.2
8.68.4
DCs
25.0
25.5
26.5
27.3
28.1
28.3
28.7
29.4
29.0
28.8
29.1
29.4
30.2
29.8
29.7
FSU
4.14.0
4.24.3
4.44.3
4.24.6
4.84.5
4.44.2
4.74.9
4.6Ot
her E
urop
e0.7
0.70.6
0.60.6
0.60.6
0.60.7
0.60.6
0.60.6
0.70.6
Chin
a8.0
8.39.0
9.49.7
9.810
.29.9
10.4
10.1
10.1
10.5
10.2
10.7
10.4
(a) T
otal
wor
ld d
eman
d86
.184
.887
.388
.188
.988
.988
.990
.290
.989
.789
.989
.891
.491
.990
.8No
n-OP
EC su
pply
OECD
19.6
19.8
20.0
20.2
21.1
21.7
21.7
21.9
22.0
21.8
22.2
22.2
22.4
23.1
22.5
Amer
icas
14.0
14.4
15.0
15.5
16.7
17.6
17.6
17.9
17.9
17.8
18.2
18.2
18.6
19.0
18.5
Euro
pe4.9
4.74.4
4.13.8
3.63.6
3.53.6
3.63.6
3.43.3
3.53.5
Asia
Pacif
ic0.6
0.60.7
0.60.6
0.40.5
0.50.5
0.50.5
0.50.5
0.50.5
DCs
12.2
12.4
12.7
12.6
12.1
12.1
12.1
12.2
12.3
12.2
12.4
12.5
12.6
12.7
12.5
FSU
12.6
13.0
13.2
13.2
13.3
13.4
13.4
13.4
13.5
13.4
13.5
13.4
13.5
13.8
13.6
Othe
r Eur
ope
0.10.1
0.10.1
0.10.1
0.10.1
0.10.1
0.10.1
0.10.1
0.1Ch
ina
3.83.8
4.14.1
4.24.2
4.34.2
4.34.2
4.34.3
4.34.3
4.3Pr
oces
sing
gai
ns2.0
2.02.1
2.12.1
2.22.2
2.22.2
2.22.2
2.22.2
2.22.2
Tota
l non
-OPE
C su
pply
50.4
51.1
52.3
52.4
52.9
53.8
53.7
54.1
54.3
54.0
54.8
54.7
55.1
56.2
55.2
OPEC
NGL
s + n
on-c
onve
ntio
nal o
ils4.1
4.35.0
5.45.6
5.85.8
5.85.9
5.85.9
5.96.0
6.05.9
(b) T
otal
non
-OPE
C su
pply
and
OPEC
NGL
s54
.555
.457
.357
.858
.559
.659
.559
.960
.259
.860
.760
.661
.162
.361
.2OP
EC cr
ude o
il pr
oduc
tion
(sec
onda
ry so
urce
s)31
.328
.829
.229
.831
.130
.230
.6To
tal s
uppl
y85
.884
.286
.587
.689
.689
.890
.1Ba
lanc
e (st
ock c
hang
e and
mis
cella
neou
s)-0
.4-0
.6-0
.7-0
.50.7
0.91.1
OECD
clos
ing
stoc
k lev
els (
mb)
C
omm
ercia
l2,6
972,6
622,6
792,6
082,6
652,6
572,6
63
SPR
1,530
1,568
1,565
1,536
1,547
1,578
1,575
T
otal
4,227
4,231
4,244
4,145
4,212
4,235
4,238
Oil-o
n-wa
ter96
991
987
182
580
189
587
8Da
ys o
f for
ward
cons
umpt
ion
in O
ECD
Com
mer
cial o
nland
stoc
ks58
5758
5758
5958
SPR
3333
3433
3435
34To
tal91
9091
9092
9393
Mem
o ite
ms
FSU
net e
xpor
ts8.5
9.09.1
9.08.9
9.19.2
8.88.6
8.99.1
9.28.9
8.99.0
(a) -
(b)
31
.629
.429
.930
.330
.429
.329
.430
.330
.729
.929
.229
.230
.329
.729
.6
Note:
Tota
ls ma
y not
add u
p due
to in
depe
nden
t roun
ding.

Monthly Oil Market Report_________________________________________________________________________________________________________________________________________
September 2013 72
T
able
10.
4: W
orl
d o
il d
eman
d/s
up
ply
bal
ance
: ch
ang
es fr
om
last
mo
nth
's ta
ble
* , m
b/d
2008
2009
2010
2011
2012
1Q13
2Q13
3Q13
4Q13
2013
1Q14
2Q14
3Q14
4Q14
2014
Wor
ld d
eman
dO
ECD
--
--
--
0.1
--
--
0.1
--
0.1
Amer
icas
--
--
--
--
--
--
--
-Eu
rope
--
--
--
0.1
--
--
0.1
--
-As
ia P
acific
--
--
--
--
--
--
--
-DC
s-
--
--
--
--
--
--
--
FSU
--
--
--
--
--
--
--
-O
ther
Eur
ope
--
--
--
--
--
--
--
-Ch
ina
--
--
--
--
--
--
--
-(a
) Tot
al w
orld
dem
and
--
--
--
0.1
--
--
0.1
--
-W
orld
dem
and
grow
th-
--
--
-0.
07-
--
--
--
-No
n-O
PEC
supp
lyO
ECD
--
--
--
-0.
30.
10.
10.
10.
10.
10.
10.
1Am
eric
as-
--
--
--
0.3
0.1
0.1
0.1
0.1
0.1
0.1
0.1
Euro
pe-
--
--
--
--
--
--
--
Asia
Pac
ific-
--
--
--
--
--
--
--
DCs
--
--
--
--0
.1-
--
--
--
FSU
--
--
--
--
--
--
--
-O
ther
Eur
ope
--
--
--
--
--
--
--
-Ch
ina
--
--
--
--0
.1-
--
--
--
Proc
essi
ng g
ains
--
--
--
--
--
--
--
-To
tal n
on-O
PEC
supp
ly-
--
--
--
0.2
-0.
10.
10.
10.
10.
20.
1To
tal n
on-O
PEC
supp
ly g
row
th-
--
--
--
0.23
-0.
070.
090.
10-0
.07
0.15
0.07
OPE
C NG
Ls +
non
-con
vent
iona
ls-
--
--0
.1-0
.1-0
.1-0
.1-0
.1-0
.1-0
.1-0
.1-0
.1-0
.1-0
.1(b
) Tot
al n
on-O
PEC
supp
ly a
nd O
PEC
NGLs
--
--
-0.1
--
0.1
-0.1
--
0.1
0.1
0.1
0.1
OPE
C cr
ude
oil p
rodu
ctio
n (s
econ
dary
sou
rces
)-
--
--
--
Tota
l sup
ply
--
--
-0.1
--
Bala
nce
(sto
ck c
hang
e an
d m
isce
llane
ous)
--
--
-0.1
--0
.1O
ECD
clos
ing
stoc
k le
vels
(mb
)
Com
mer
cial
--
--
-1-1
-33
S
PR-
--
--
-1
T
otal
--
--
--1
-32
Oil-
on-w
ater
--
--
--
-3Da
ys o
f for
ward
con
sum
ptio
n in
OEC
DCo
mm
erci
al o
nlan
d sto
cks
--
--
--
-1SP
R-
--
--
--
Tota
l-
--
--
--1
Mem
o ite
ms
FSU
net e
xpor
ts-
--
--
--
--
--
--
--
(a) -
(b)
--
--
0.1
-0.
1-0
.10.
1-
--
-0.1
-0.1
-
* This
com
pare
s Tab
le 1
0.3
in th
is iss
ue o
f the
MO
MR
with
Tab
le 1
0.3
in th
e Au
gust
2013
issu
e. T
his t
able
show
s onl
y whe
re ch
ange
s hav
e oc
curre
d.

_________________________________________________________________________________________________________________________________________Monthly Oil Market Report
September 2013 73
Tabl
e 10
.5: O
ECD
oil
stoc
ks a
nd o
il on
wat
er a
t the
end
of p
erio
d
2008
2009
2010
2011
2012
2Q09
3Q09
4Q09
1Q10
2Q10
3Q10
4Q10
1Q11
2Q11
3Q11
4Q11
1Q12
2Q12
3Q12
4Q12
1Q13
2Q13
Clos
ing
stoc
k lev
els,
mb
OECD
onlan
d com
mer
cial
2,697
2,662
2,679
2,608
2,665
2,765
2,784
2,662
2,684
2,765
2,753
2,679
2,648
2,686
2,671
2,608
2,656
2,689
2,730
2,665
2,657
2,663
Amer
icas
1,278
1,285
1,329
1,308
1,363
1,364
1,369
1,285
1,312
1,367
1,396
1,329
1,298
1,338
1,341
1,308
1,330
1,360
1,383
1,363
1,340
1,376
Euro
pe1,0
1299
595
990
890
51,0
0099
699
598
699
495
795
996
294
191
690
894
791
691
990
590
487
8
Asia
Pacif
ic40
638
339
139
239
740
141
938
338
640
440
039
138
840
741
539
237
941
342
839
741
340
9
OECD
SPR
1,530
1,568
1,565
1,536
1,547
1,565
1,568
1,568
1,571
1,566
1,553
1,565
1,562
1,565
1,529
1,536
1,536
1,539
1,542
1,547
1,578
1,575
Amer
icas
704
729
729
697
696
726
727
729
729
729
728
729
727
727
696
697
697
697
696
696
697
697
Euro
pe42
043
142
742
643
743
043
343
143
342
642
342
742
442
742
442
642
642
943
343
747
146
8
Asia
Pacif
ic40
640
941
041
441
440
840
840
940
941
140
241
041
141
140
941
441
441
341
441
441
141
0
OECD
tota
l4,2
274,2
314,2
444,1
454,2
124,3
304,3
524,2
314,2
554,3
304,3
064,2
444,2
104,2
514,2
014,1
454,1
924,2
284,2
724,2
124,2
354,2
38
Oil-o
n-wa
ter96
991
987
182
580
190
486
991
991
989
792
687
189
185
383
582
578
781
279
780
189
587
8
Days
of f
orwa
rd co
nsum
ptio
n in
OEC
D
OECD
onlan
d com
mer
cial
5857
5857
5860
5957
5858
5857
5857
5756
5859
5958
5958
Amer
icas
5453
5555
5758
5754
5456
5855
5555
5656
5657
5857
5658
Euro
pe69
6867
6667
6868
6969
6664
6768
6465
6669
6667
6967
65
Asia
Pacif
ic51
4747
4647
5350
4450
5148
4552
5048
4347
5049
4452
49
OECD
SPR
3333
3433
3434
3333
3433
3333
3433
3333
3433
3334
3534
Amer
icas
3030
3029
2931
3031
3030
3030
3130
2930
2929
2929
2929
Euro
pe29
2930
3132
2930
3030
2828
3030
2930
3131
3132
3335
35
Asia
Pacif
ic51
5050
4849
5449
4753
5148
4755
5147
4551
5047
4652
50
OECD
tota
l91
9091
9092
9493
9092
9191
9093
9190
8992
9292
9294
94

Monthly Oil Market Report_________________________________________________________________________________________________________________________________________
September 2013 74
Chan
geCh
ange
Chan
geCh
ange
2008
2009
2010
2011
11/1
01Q
122Q
123Q
124Q
1220
1212
/11
1Q13
2Q13
3Q13
4Q13
2013
13/1
21Q
142Q
143Q
144Q
1420
1414
/13
US
7.57
8.17
8.64
9.04
0.39
9.77
9.81
9.93
10.5
910
.03
0.99
10.6
210
.94
11.0
310
.91
10.8
80.
8511
.15
11.2
811
.52
11.8
811
.46
0.58
Can
ada
3.25
3.23
3.36
3.55
0.20
3.81
3.65
3.67
3.96
3.77
0.22
4.08
3.82
4.02
4.12
4.01
0.24
4.15
4.14
4.20
4.31
4.20
0.19
Mex
ico3.
172.
982.
962.
95-0
.02
2.92
2.94
2.93
2.90
2.92
-0.0
22.
912.
872.
872.
862.
88-0
.04
2.85
2.82
2.84
2.83
2.83
-0.0
5O
ECD
Amer
icas
*14
.01
14.3
914
.97
15.5
50.
5816
.52
16.4
016
.53
17.4
716
.73
1.18
17.6
317
.65
17.9
317
.89
17.7
81.
0518
.15
18.2
418
.57
19.0
318
.50
0.72
Nor
way
2.47
2.35
2.14
2.04
-0.1
02.
081.
981.
751.
851.
91-0
.13
1.84
1.84
1.80
1.85
1.83
-0.0
81.
841.
731.
671.
821.
77-0
.07
UK
1.57
1.48
1.37
1.12
-0.2
41.
091.
020.
830.
890.
96-0
.17
0.92
0.89
0.83
0.90
0.88
-0.0
70.
880.
820.
770.
870.
84-0
.05
Denm
ark
0.28
0.26
0.25
0.22
-0.0
20.
210.
210.
210.
200.
21-0
.01
0.20
0.18
0.18
0.17
0.18
-0.0
30.
170.
160.
160.
150.
16-0
.02
Othe
r OEC
D Eu
rope
0.62
0.63
0.64
0.69
0.04
0.69
0.70
0.70
0.69
0.70
0.01
0.67
0.66
0.66
0.68
0.67
-0.0
30.
690.
690.
690.
690.
690.
02O
ECD
Euro
pe4.
944.
734.
394.
07-0
.32
4.08
3.92
3.49
3.62
3.78
-0.2
93.
633.
563.
473.
613.
57-0
.21
3.58
3.40
3.29
3.54
3.45
-0.1
2Au
strali
a0.
530.
540.
560.
49-0
.07
0.47
0.49
0.50
0.45
0.48
-0.0
10.
370.
410.
450.
440.
42-0
.06
0.44
0.46
0.47
0.45
0.46
0.04
Othe
r Asia
Pac
ific0.
100.
100.
100.
09-0
.01
0.09
0.09
0.08
0.08
0.08
0.00
0.08
0.08
0.08
0.07
0.08
-0.0
10.
070.
070.
070.
070.
07-0
.01
OEC
D As
ia P
acifi
c0.
630.
640.
660.
58-0
.08
0.55
0.57
0.59
0.52
0.56
-0.0
20.
450.
490.
530.
510.
49-0
.07
0.51
0.53
0.54
0.52
0.53
0.03
Tota
l OEC
D19
.58
19.7
620
.02
20.2
00.
1721
.15
20.9
020
.61
21.6
121
.07
0.87
21.7
121
.71
21.9
322
.01
21.8
40.
7722
.24
22.1
822
.40
23.0
922
.48
0.64
Brun
ei0.
170.
160.
170.
170.
000.
160.
140.
160.
170.
16-0
.01
0.17
0.15
0.16
0.16
0.16
0.00
0.16
0.16
0.16
0.16
0.16
0.00
India
0.80
0.78
0.86
0.89
0.03
0.88
0.88
0.88
0.88
0.88
-0.0
10.
870.
870.
870.
880.
87-0
.01
0.88
0.88
0.88
0.88
0.88
0.01
Indo
nesia
1.05
1.03
1.04
1.02
-0.0
21.
010.
990.
970.
960.
98-0
.04
0.96
0.95
0.93
0.92
0.94
-0.0
40.
950.
970.
970.
960.
960.
02M
alays
ia0.
760.
730.
700.
64-0
.06
0.69
0.63
0.63
0.69
0.66
0.02
0.68
0.64
0.65
0.69
0.67
0.01
0.71
0.70
0.70
0.69
0.70
0.03
Thail
and
0.36
0.37
0.34
0.33
-0.0
10.
350.
350.
360.
360.
350.
020.
370.
360.
370.
360.
360.
010.
360.
360.
360.
350.
35-0
.01
Vietn
am0.
330.
370.
350.
350.
000.
370.
370.
390.
390.
380.
030.
390.
390.
380.
400.
390.
000.
390.
390.
400.
400.
390.
01As
ia oth
ers
0.26
0.25
0.23
0.23
0.00
0.22
0.22
0.22
0.22
0.22
-0.0
10.
210.
220.
220.
220.
220.
000.
220.
220.
220.
220.
220.
00O
ther
Asi
a3.
733.
693.
703.
63-0
.07
3.68
3.59
3.61
3.67
3.64
0.01
3.65
3.58
3.57
3.62
3.61
-0.0
33.
653.
673.
683.
663.
670.
06Ar
genti
na0.
780.
750.
750.
71-0
.04
0.70
0.69
0.69
0.68
0.69
-0.0
20.
660.
660.
680.
650.
66-0
.03
0.66
0.66
0.67
0.67
0.67
0.00
Braz
il2.
382.
512.
662.
64-0
.03
2.71
2.57
2.53
2.60
2.60
-0.0
32.
542.
582.
672.
672.
610.
012.
682.
702.
802.
862.
760.
15C
olom
bia0.
600.
680.
800.
930.
130.
930.
960.
950.
990.
960.
031.
021.
021.
031.
051.
030.
071.
071.
081.
051.
121.
080.
05Tr
inida
d &
Toba
go0.
160.
150.
150.
14-0
.01
0.12
0.12
0.12
0.11
0.12
-0.0
20.
120.
110.
120.
100.
110.
000.
100.
100.
090.
090.
09-0
.02
L. A
mer
ica o
thers
0.28
0.30
0.31
0.30
-0.0
10.
300.
300.
310.
330.
310.
010.
340.
330.
330.
350.
340.
030.
360.
370.
370.
360.
360.
03La
tin A
mer
ica
4.20
4.39
4.66
4.71
0.05
4.75
4.63
4.60
4.71
4.67
-0.0
44.
684.
704.
824.
834.
760.
094.
874.
914.
985.
104.
970.
21Ba
hrain
0.21
0.21
0.20
0.21
0.01
0.20
0.18
0.20
0.19
0.19
-0.0
20.
200.
200.
200.
200.
200.
010.
210.
210.
200.
200.
200.
01O
man
0.76
0.81
0.86
0.89
0.02
0.89
0.92
0.93
0.94
0.92
0.03
0.94
0.93
0.96
0.94
0.94
0.02
0.95
0.96
0.96
0.97
0.96
0.02
Syria
0.41
0.41
0.42
0.37
-0.0
50.
220.
240.
190.
180.
21-0
.16
0.16
0.09
0.07
0.04
0.09
-0.1
20.
040.
040.
040.
040.
04-0
.05
Yem
en0.
300.
300.
290.
23-0
.06
0.14
0.18
0.21
0.19
0.18
-0.0
50.
180.
120.
170.
170.
16-0
.02
0.17
0.17
0.17
0.17
0.17
0.01
Mid
dle
East
1.68
1.73
1.78
1.69
-0.0
91.
441.
511.
521.
501.
49-0
.20
1.47
1.33
1.39
1.35
1.39
-0.1
11.
361.
371.
371.
381.
37-0
.01
Cha
d0.
150.
140.
150.
140.
000.
140.
140.
130.
130.
13-0
.01
0.13
0.13
0.13
0.13
0.13
0.00
0.13
0.13
0.12
0.12
0.13
-0.0
1C
ongo
0.26
0.27
0.30
0.30
0.00
0.30
0.30
0.30
0.29
0.30
0.00
0.28
0.28
0.28
0.28
0.28
-0.0
20.
280.
270.
270.
260.
27-0
.01
Egyp
t0.
690.
690.
710.
70-0
.01
0.71
0.71
0.71
0.71
0.71
0.01
0.71
0.72
0.71
0.69
0.71
0.00
0.70
0.69
0.69
0.68
0.69
-0.0
2Eq
uator
ial G
uinea
0.38
0.36
0.32
0.30
-0.0
20.
320.
310.
310.
310.
320.
010.
320.
320.
320.
310.
320.
000.
320.
330.
330.
320.
320.
01G
abon
0.24
0.24
0.25
0.25
0.00
0.25
0.24
0.24
0.24
0.24
-0.0
10.
230.
230.
240.
230.
23-0
.01
0.24
0.24
0.24
0.24
0.24
0.01
South
Afric
a0.
180.
170.
180.
180.
000.
190.
190.
190.
190.
190.
010.
190.
190.
190.
180.
190.
000.
190.
180.
180.
180.
18-0
.01
Suda
ns0.
460.
480.
460.
43-0
.03
0.19
0.09
0.10
0.10
0.12
-0.3
10.
110.
220.
230.
310.
220.
100.
320.
330.
340.
350.
330.
11Af
rica
other
0.27
0.25
0.23
0.29
0.06
0.30
0.30
0.30
0.32
0.31
0.01
0.35
0.34
0.34
0.35
0.34
0.04
0.36
0.37
0.38
0.38
0.37
0.03
Afric
a2.
622.
602.
602.
59-0
.01
2.39
2.28
2.28
2.31
2.32
-0.2
82.
322.
432.
442.
492.
420.
102.
542.
542.
542.
542.
540.
12To
tal D
Cs12
.22
12.4
112
.74
12.6
3-0
.11
12.2
712
.02
12.0
112
.19
12.1
2-0
.50
12.1
212
.05
12.2
212
.29
12.1
70.
0512
.42
12.4
912
.57
12.6
812
.54
0.37
FSU
12.6
012
.95
13.2
113
.24
0.03
13.3
613
.24
13.2
213
.36
13.3
00.
0513
.44
13.3
913
.41
13.4
513
.42
0.13
13.4
813
.41
13.5
313
.78
13.5
50.
13 R
ussia
9.78
9.92
10.1
410
.27
0.12
10.3
410
.32
10.3
610
.47
10.3
70.
1110
.45
10.4
710
.47
10.4
510
.46
0.09
10.4
710
.41
10.4
610
.61
10.4
90.
03 K
azak
hstan
1.41
1.54
1.60
1.60
0.01
1.62
1.57
1.52
1.63
1.59
-0.0
21.
681.
601.
631.
661.
640.
051.
641.
641.
701.
781.
690.
05 A
zerb
aijan
0.94
1.06
1.07
0.95
-0.1
20.
960.
910.
910.
820.
90-0
.05
0.87
0.87
0.88
0.88
0.88
-0.0
20.
900.
890.
900.
930.
900.
02 F
SU o
thers
0.46
0.44
0.41
0.42
0.02
0.44
0.44
0.44
0.44
0.44
0.02
0.44
0.44
0.44
0.47
0.45
0.01
0.48
0.48
0.48
0.47
0.48
0.03
Othe
r Eur
ope
0.15
0.14
0.14
0.14
0.00
0.14
0.14
0.14
0.14
0.14
0.00
0.14
0.14
0.14
0.14
0.14
0.00
0.14
0.14
0.14
0.14
0.14
0.00
Chin
a3.
843.
844.
124.
11-0
.01
4.08
4.09
4.19
4.30
4.17
0.06
4.24
4.27
4.20
4.27
4.24
0.08
4.29
4.27
4.28
4.34
4.30
0.05
Non-
OPE
C pr
oduc
tion
48.3
849
.10
50.2
350
.32
0.09
51.0
150
.39
50.1
851
.61
50.8
00.
4751
.64
51.5
551
.91
52.1
651
.82
1.02
52.5
752
.49
52.9
254
.04
53.0
11.
19Pr
oces
sing
gains
1.97
2.00
2.11
2.11
0.00
2.12
2.12
2.12
2.12
2.12
0.01
2.18
2.18
2.18
2.18
2.18
0.06
2.21
2.21
2.21
2.21
2.21
0.02
Non-
OPE
C su
pply
50.3
551
.10
52.3
552
.44
0.09
53.1
352
.51
52.3
053
.73
52.9
20.
4853
.82
53.7
354
.09
54.3
554
.00
1.08
54.7
854
.70
55.1
256
.24
55.2
11.
22O
PEC
NG
L4.
044.
244.
875.
230.
365.
275.
435.
485.
295.
370.
135.
525.
545.
565.
585.
550.
195.
605.
645.
685.
725.
660.
11O
PEC
Non
-con
venti
onal
0.11
0.11
0.11
0.13
0.02
0.19
0.20
0.19
0.23
0.20
0.07
0.24
0.24
0.25
0.27
0.25
0.05
0.28
0.29
0.29
0.29
0.29
0.04
OPE
C (N
GL+N
CF)
4.14
4.35
4.98
5.37
0.39
5.46
5.62
5.67
5.52
5.57
0.20
5.76
5.78
5.81
5.85
5.80
0.24
5.88
5.93
5.97
6.01
5.95
0.15
Non-
OPE
C &
OPE
C (N
GL+N
CF)
54.4
955
.45
57.3
357
.80
0.48
58.5
958
.13
57.9
759
.25
58.4
80.
6859
.58
59.5
159
.90
60.2
059
.80
1.32
60.6
660
.63
61.1
062
.25
61.1
61.
36
* Ch
ile h
as b
een
includ
ed in
OEC
D Am
erica
s.
Tab
le 1
0.6:
No
n-O
PE
C s
up
ply
an
d O
PE
C n
atu
ral g
as li
qu
ids,
mb
/d
Note
s: T
otals
may
not
add
up
due
to in
depe
nden
t rou
nding
.
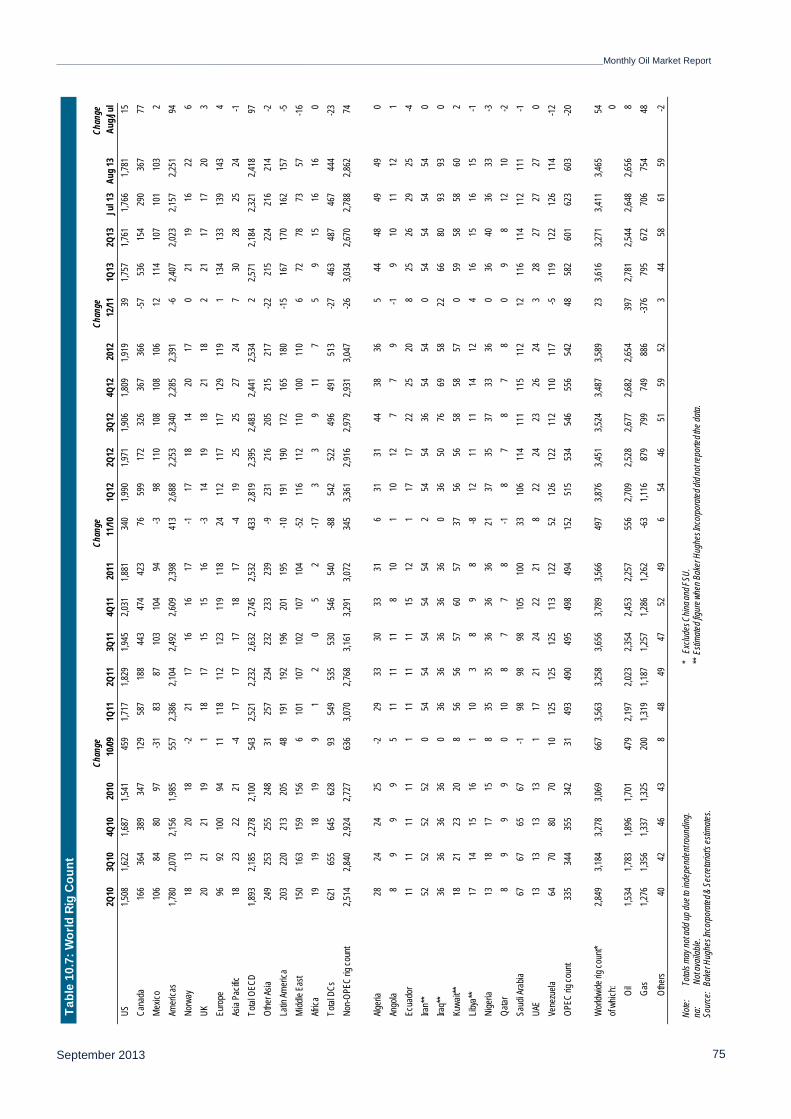
_________________________________________________________________________________________________________________________________________Monthly Oil Market Report
September 2013 75
Ta
ble
10.7
: Wor
ld R
ig C
ount
Chan
geCh
ange
Chan
geCh
ange
2Q10
3Q10
4Q10
2010
10/09
1Q11
2Q11
3Q11
4Q11
2011
11/10
1Q12
2Q12
3Q12
4Q12
2012
12/11
1Q13
2Q13
Jul 1
3Au
g 13
Aug/J
ulUS
1,508
1,622
1,687
1,541
459
1,717
1,829
1,945
2,031
1,881
340
1,990
1,971
1,906
1,809
1,919
391,7
571,7
611,7
661,7
8115
Cana
da16
636
438
934
712
958
718
844
347
442
376
599
172
326
367
366
-57
536
154
290
367
77M
exico
106
8480
97-3
183
8710
310
494
-398
110
108
108
106
1211
410
710
110
32
Amer
icas
1,780
2,070
2,156
1,985
557
2,386
2,104
2,492
2,609
2,398
413
2,688
2,253
2,340
2,285
2,391
-62,4
072,0
232,1
572,2
5194
Norw
ay18
1320
18-2
2117
1616
17-1
1718
1420
170
2119
1622
6UK
2021
2119
118
1715
1516
-314
1918
2118
221
1717
203
Euro
pe96
9210
094
1111
811
212
311
911
824
112
117
117
129
119
113
413
313
914
34
Asia
Pacif
ic18
2322
21-4
1717
1718
17-4
1925
2527
247
3028
2524
-1To
tal O
ECD
1,893
2,185
2,278
2,100
543
2,521
2,232
2,632
2,745
2,532
433
2,819
2,395
2,483
2,441
2,534
22,5
712,1
842,3
212,4
1897
Othe
r Asia
249
253
255
248
3125
723
423
223
323
9-9
231
216
205
215
217
-22
215
224
216
214
-2La
tin Am
erica
203
220
213
205
4819
119
219
620
119
5-1
019
119
017
216
518
0-1
516
717
016
215
7-5
Midd
le Ea
st15
016
315
915
66
101
107
102
107
104
-52
116
112
110
100
110
672
7873
57-1
6Afr
ica19
1918
199
12
05
2-1
73
39
117
59
1516
160
Total
DCs
621
655
645
628
9354
953
553
054
654
0-8
854
252
249
649
151
3-2
746
348
746
744
4-2
3No
n-OP
EC rig
coun
t2,5
142,8
402,9
242,7
2763
63,0
702,7
683,1
613,2
913,0
7234
53,3
612,9
162,9
792,9
313,0
47-2
63,0
342,6
702,7
882,8
6274
Alger
ia28
2424
25-2
2933
3033
316
3131
4438
365
4448
4949
0An
gola
89
99
511
1111
810
110
127
79
-19
1011
121
Ecua
dor
1111
1111
111
1111
1512
117
1722
2520
825
2629
25-4
Iran*
*52
5252
520
5454
5454
542
5454
3654
540
5454
5454
0Ira
q**
3636
3636
036
3636
3636
036
5076
6958
2266
8093
930
Kuwa
it**
1821
2320
856
5657
6057
3756
5658
5857
059
5858
602
Libya
**17
1415
161
103
89
8-8
1211
1114
124
1615
1615
-1Ni
geria
1318
1715
835
3536
3636
2137
3537
3336
036
4036
33-3
Qatar
89
99
010
87
78
-18
78
78
09
812
10-2
Saud
i Ara
bia67
6765
67-1
9898
9810
510
033
106
114
111
115
112
1211
611
411
211
1-1
UAE
1313
1313
117
2124
2221
822
2423
2624
328
2727
270
Vene
zuela
6470
8070
1012
512
512
511
312
252
126
122
112
110
117
-511
912
212
611
4-1
2OP
EC rig
coun
t33
534
435
534
231
493
490
495
498
494
152
515
534
546
556
542
4858
260
162
360
3-2
0
Wor
ldwide
rig co
unt*
2,849
3,184
3,278
3,069
667
3,563
3,258
3,656
3,789
3,566
497
3,876
3,451
3,524
3,487
3,589
233,6
163,2
713,4
113,4
6554
of wh
ich:
0
O
il1,5
341,7
831,8
961,7
0147
92,1
972,0
232,3
542,4
532,2
5755
62,7
092,5
282,6
772,6
822,6
5439
72,7
812,5
442,6
482,6
568
Gas
1,276
1,356
1,337
1,325
200
1,319
1,187
1,257
1,286
1,262
-63
1,116
879
799
749
886
-376
795
672
706
754
48
Othe
rs
4042
4643
848
4947
5249
654
4651
5952
344
5861
59-2
Note:
Total
s may
not a
dd up
due t
o ind
epen
dent
roun
ding.
*Ex
clude
s Chin
a and
FSU.
na:
Not a
vaila
ble.
** E
stima
ted fig
ure w
hen B
aker
Hug
hes I
ncor
pora
ted di
d not
repo
rted t
he da
ta.So
urce
: Ba
ker H
ughe
s Inc
orpo
rated
& Se
cretar
iat's
estim
ates.

Monthly Oil Market Report_________________________________________________________________________________________________________________________________________
September 2013 76
Contributors to the OPEC Monthly Oil Market Report Editor-in-Chief Omar S. Abdul-Hamid, Director, Research Division email: [email protected] Editor Hojatollah Ghanimi Fard, Head, Petroleum Studies Department email: [email protected] Analysts Crude Oil Price Movements Eissa Alzerma
email: [email protected] Commodity Markets Eissa Alzerma
email: [email protected] Joerg Spitzy email: [email protected]
World Economy Afshin Javan email: [email protected]
Imad Alam Al-Deen email: [email protected] Joerg Spitzy email: [email protected]
World Oil Demand Hassan Balfakeih email: [email protected]
World Oil Supply Haidar Khadadeh email: [email protected]
Product Markets and Refinery Operations
Elio Rodriguez email: [email protected]
Tanker Market and Oil Trade Anisah Almadhayyan email: [email protected]
Stock Movements Aziz Yahyai email: [email protected]
Technical and editorial team Aziz Yahyai email: [email protected] Douglas Linton email: [email protected]
Data services Adedapo Odulaja, Head, Data Services Department ([email protected]), Pantelis Christodoulides (World Oil Demand, Stock Movements), Hannes Windholz (Oil Trade, Product & Refinery), Mouhamad Moudassir (Tanker Market), Klaus Stoeger (World Oil Supply), Harvir Kalirai (Economics), Mohammed Sattar (Crude Oil Prices) Editing, production, design and circulation Maureen MacNeill, Scott Laury, Viveca Hameder, Hataichanok Leimlehner, Evelyn Oduro-Kwateng, Andrea Birnbach

_________________________________________________________________________________________________________________________________________Monthly Oil Market Report
September 2013 77
Disclaimer The data, analysis and any other information contained in the Monthly Oil Market Report (the “MOMR”) is for informational purposes only and is not intended as a substitute for advice from your business, finance, investment consultant or other professional. The views expressed in the MOMR are those of the OPEC Secretariat and do not necessarily reflect the views of its Governing Bodies and/or individual OPEC Member Countries. Whilst reasonable efforts have been made to ensure the accuracy of the MOMR’s content, the OPEC Secretariat makes no warranties or representations as to its accuracy, currency reference or comprehensiveness, and assumes no liability or responsibility for any inaccuracy, error or omission, or for any loss or damage arising in connection with or attributable to any action or decision taken as a result of using or relying on the information in the MOMR. The MOMR may contain references to material(s) from third parties whose copyright must be acknowledged by obtaining necessary authorization from the copyright owner(s). The OPEC Secretariat shall not be liable or responsible for any unauthorized use of third party material(s). All rights of the Publication shall be reserved to the OPEC Secretariat, including every exclusive economic right, in full or per excerpts, with special reference but without limitation, to the right to publish it by press and/or by any communications medium whatsoever, including Internet; translate, include in a data base, make changes, transform and process for any kind of use, including radio, television or cinema adaptations, as well as sound-video recording, audio-visual screenplays and electronic processing of any kind and nature whatsoever. Full reproduction, copying or transmission of the MOMR is not permitted in any form or by any means by third parties without the OPEC Secretariat’s written permission, however the information contained therein may be used and/or reproduced for educational and other non-commercial purposes without the OPEC Secretariat’s prior written permission, provided that OPEC is fully acknowledged as the copyright holder.

September 2013
OPEC Basket average priceUS$ per barrel
up 3.07 in August August 2013 107.52 July 2013 104.45 Year-to-date 105.32
down 0.12 in August August 2013 30.23 July 2013 30.36
August OPEC crude productionin million barrels per day, according to secondary sources
Supply and demandin million barrels per day
2013 12/13 2014 13/14
World demand 89.7 0.8 World demand 90.8 1.0
Non-OPEC supply 54.0 1.1 Non-OPEC supply 55.2 1.2
OPEC NGLs 5.8 0.2 OPEC NGLs 5.9 0.1
Difference 29.9 –0.5 Difference 29.6 –0.3
Totals may not add due to independent rounding.
StocksTotal OECD commercial oil stocks rose by 5.3 mb in July, but indicated a deficit of around 55 mb with the five-year average. Crude stocks were 20.0 mb below the five-year average and product inventories showed a deficit of 35 mb. In days of forward cover, OECD commercial stocks stood at 58.5 days, 0.3 days more than the five-year average. Preliminary data for August indicates that US commercial oil stocks fell a slight 0.7 mb, following five months of consecutive builds, but remain 30.7 mb higher than the five-year average. Crude and product stocks showed a surplus of 19.1 mb and 11.5 mb, respectively.
World economyGlobal growth expectations remain at 2.9% for 2013 and 3.5% for 2014. The OECD economies are forecast to rebound to 1.9% in 2014, after low growth of 1.2% in 2013. Growth expectations for India have been revised down to 5.3% for this year but remain at 6.0% in 2014. China’s forecasts remain unchanged at 7.6% and 7.7%, for 2013 and 2014, respectively.
Issued 10 September 2013 Data covered up to the end of August 2013 unless otherwise stated.Next report to be issued on 10 October 2013
OPECOrganization of the Petroleum Exporting Countries
Monthly Oil Market Report
Tel +43 1 21112 Fax +43 1 2164320 E-mail: [email protected] Web site: www.opec.org
Data Summary