gas flaring reduction: opec views opec secretariat
TRANSCRIPT
Gas Flaring Reduction: OPEC Views
OPEC Secretariat
Outline of presentation
• Energy demand growth forecasts and impact on associated gas volumes and flaring
• OPEC gas flaring history and progress and specific examples of gas flaring reduction in OPEC Member Countries
• Gas flaring reduction challenges
• Joint OPEC/ World Bank workshop on gas flaring and potential role of GGFR in facilitating financing and carbon credits
• Concluding remarks

World energy demand by fuel type(mtoe)
0
2000
4000
6000
8000
10000
12000
14000
16000
1960 1965 1970 1975 1980 1985 1990 1995 2000 2005 2010 2015 2020 2025
mto
e
Oil
Hydro/nuclear/renewables
Coal
Gas
History Projection Growth (% pa) Fuel shares (%) 2005-2025 2005 2010 2020 2025
Oil 1.6 39.7 39.5 39.2 38.9 Solids 1.2 26.7 26.2 25.0 24.3 Gas 2.6 23.7 24.7 27.0 28.3 Hyd/Nuc/Ren 0.9 9.9 9.6 8.9 8.5 Total 1.7 100.0 100.0 100.0 100.0

Oil supply outlook, mb/d (reference case)
2005 2010 2015 2020 2025
OECD 20.5 20.6 20.7 20.5 19.5
DCs, excl. OPEC 16.1 18.6 19.7 20.0 19.9
Transition economies 11.7 14.4 15.5 16.1 16.5
Total non-OPEC 50.1 55.8 58.3 59.4 58.9
OPEC (incl. NGLs) 33.1 34.9 39.7 46.2 54.3
World 83.2 90.7 98.0 105.6 113.1

Evolution of gas flaring
0
50
100
150
200
250
Flar
ed G
as -
BC
M p
er Y
ear
OPEC Flared
Non-OPEC Flared
Global Gas Flared
Source: OPEC
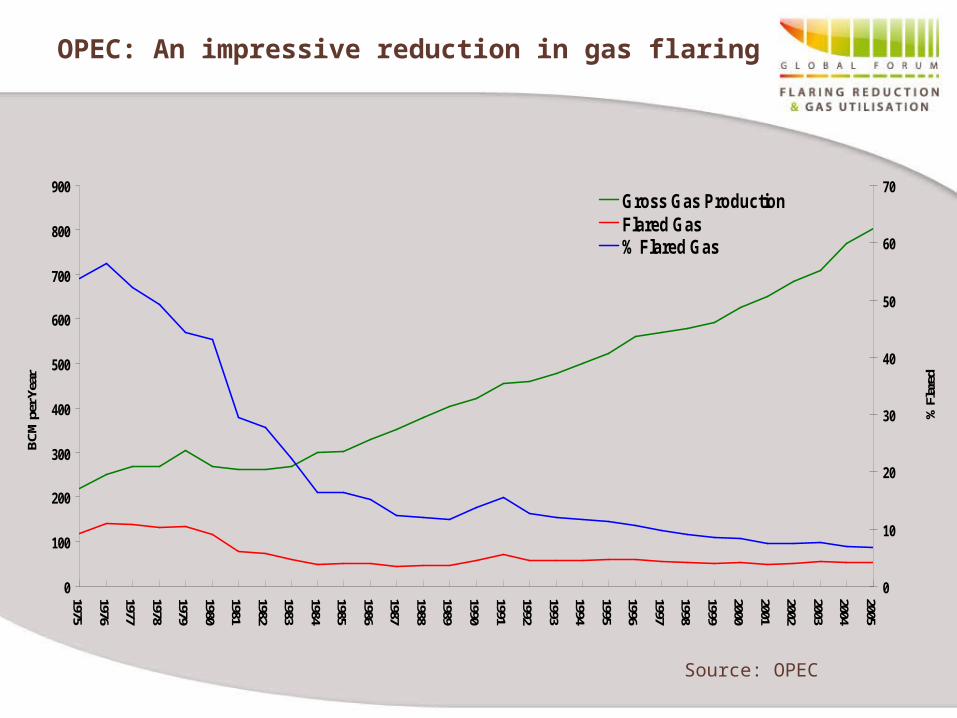
OPEC: An impressive reduction in gas flaring
Source: OPEC
BC
M p
er Y
ear
0
100
200
300
400
500
600
700
800
900
1975
1976
1977
1978
1979
1980
1981
1982
1983
1984
1985
1986
1987
1988
1989
1990
1991
1992
1993
1994
1995
1996
1997
1998
1999
2000
2001
2002
2003
2004
2005
% F
lare
d
0
10
20
30
40
50
60
70Gross Gas ProductionFlared Gas% Flared Gas
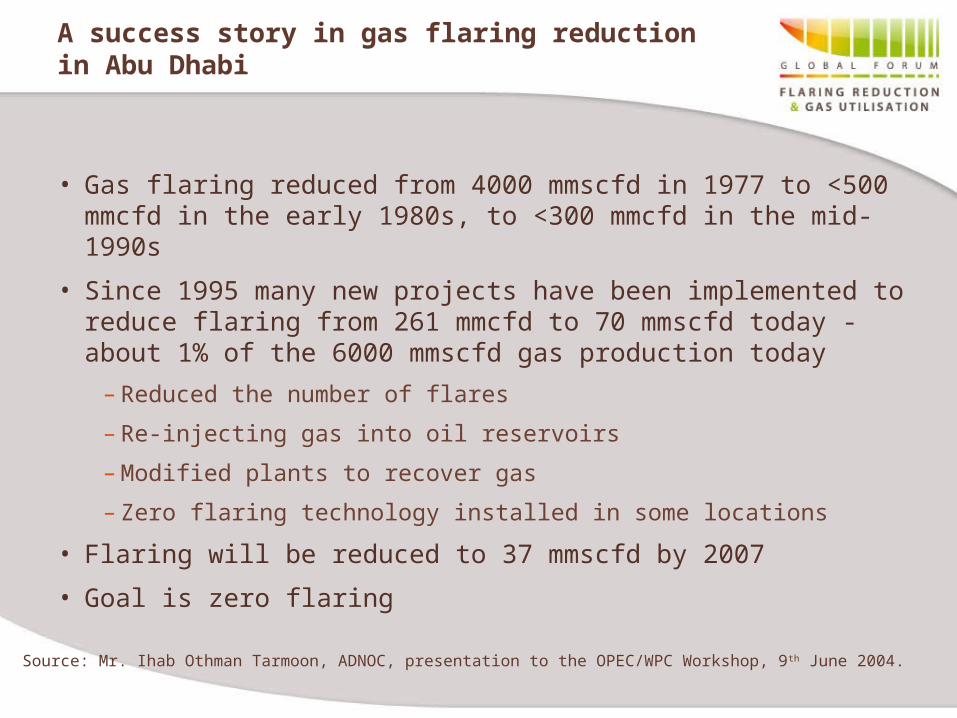
A success story in gas flaring reduction in Abu Dhabi
• Gas flaring reduced from 4000 mmscfd in 1977 to <500 mmcfd in the early 1980s, to <300 mmcfd in the mid-1990s
• Since 1995 many new projects have been implemented to reduce flaring from 261 mmcfd to 70 mmscfd today - about 1% of the 6000 mmscfd gas production today
– Reduced the number of flares
– Re-injecting gas into oil reservoirs
– Modified plants to recover gas
– Zero flaring technology installed in some locations
• Flaring will be reduced to 37 mmscfd by 2007
• Goal is zero flaring
Source: Mr. Ihab Othman Tarmoon, ADNOC, presentation to the OPEC/WPC Workshop, 9 th June 2004.
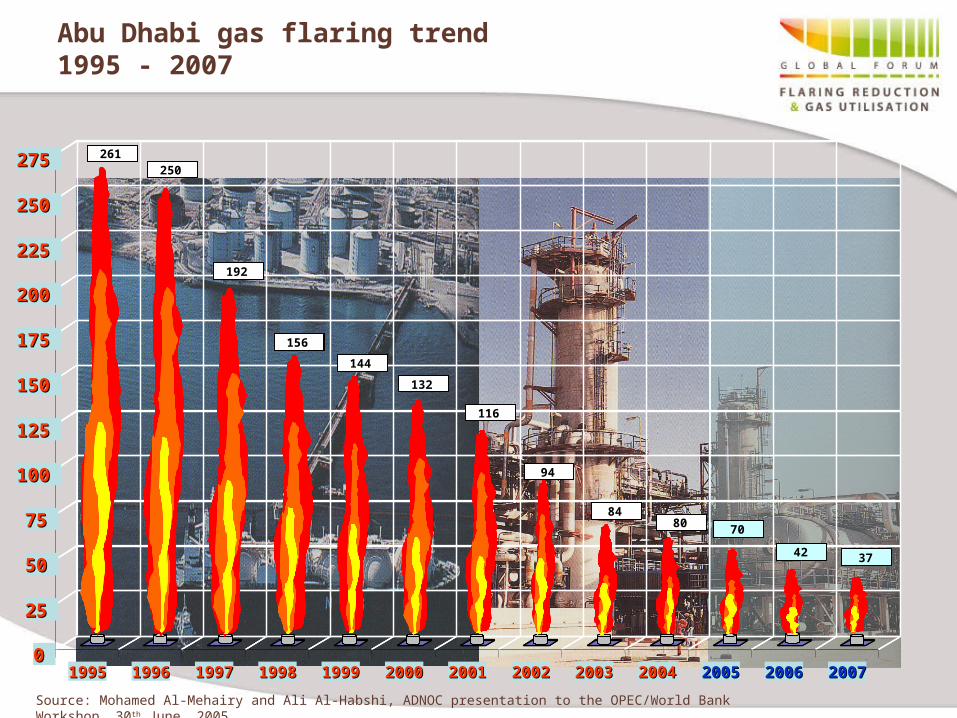
Abu Dhabi gas flaring trend 1995 - 2007
Source: Mohamed Al-Mehairy and Ali Al-Habshi, ADNOC presentation to the OPEC/World Bank Workshop, 30th June, 2005
0
25
50
75
100
125
150
175
200
225
250
275
1995 1996 1997 1998 1999 2000 2001 2002 2003 2004 2005 2006 2007
261250
192
156
94
144
132
116
7461 53
38 35
0
25
50
75
100
125
150
175
0 0
25 25
50 50
75 75
100 100
125 125
150 150
175 175
200 200
225 225
250 250
275 275
19951995 19961996 19971997 19981998 19991999 20002000 20012001 20022002 20032003 20042004 20052005 20062006 20072007
261250
192
156
94
144
132
116
8480 70
42 37
Gas flaring reduction challenges
• Associated gas is often produced in remote locations and sometimes in small volumes
• Two options to reduce gas flaring – re-injection or market the gas
• Investment necessary to market the gas may not be economic– Lack of infrastructure
– Low domestic demand for gas and/or electricity
• Re-injection of associated gas is not always economic due to high cost and low incremental oil reserves
• A sudden call on spare oil production capacity may exceed capacities of existing gas handling facilities, resulting in gas flaring
• The World Bank Gas Flaring Reduction Initiative was formed to support national governments’ efforts to reduce flaring by providing
– Facilitation of local public-private partnerships and co-operation on gas infrastructure and markets
– Links with existing World Bank instruments
– Assistance on carbon credits
• OPEC/World Bank joint workshop held in Vienna, 30th June – 1st July, 2005
Workshop objectives
• To present an overview of the Global Gas Flaring Reduction Partnership (GGFR), and its activities, with specific focus on CDM and the Voluntary Standard for Global Gas Flaring and Venting Reduction
• To discuss the financial resources and mechanisms, including carbon credits, available by or through the World Bank Initiative for gas flaring reduction projects
• To present success stories from OPEC Member Countries in flaring reduction
Role of GGFR
● Work with the CDM Executive Committee to remove barriers to receiving carbon credits for gas flaring reduction projects
– Additionality criteria are stringent and inflexible, and can create perverse incentives at times.
– Okpai power plant and West Africa Gas Pipeline in Nigeria will be important tests
● Build CDM capacity in OPEC Member Countries– Identify and develop CDM projects– Develop institutional capacity to comply with CDM rules– Assist with implementation issues such as carbon ownership and
downstream integration
● Facilitate collaboration between public and private sectors, and between governments
● Help countries obtain World Bank financing and MIGA guarantees● Facilitate access to World Bank carbon funds
– Source of additional cash flow– Can make marginal projects economic
Conclusions
• As oil production increases to meet growing demand, gas flaring reduction efforts will have to be intensified if reductions in actual flared volumes are to be realised
• Gas flaring reduction has not only environmental benefits but also social and economic benefits
• Financing and carbon credits are often necessary
• Huge reductions in gas flaring have been achieved in OPEC Member Countries during the last three decades
• OPEC Member Countries could further reduce gas flaring if CDM methodologies could be established for these projects
• However, the CDM is a complex mechanism and has been applied to only one gas flaring project to date – there is a need to test the mechanism and possibly modify the rules

Thank You