consolidated financial statements for the 12-month … · consolidated financial statements for the...
TRANSCRIPT

1
Consolidated Financial Statements for the 12-month period ended March 31, 2008 (FY2008) May 14, 2008 Company Name Tokyo Seimitsu Co., Ltd. ACCRETECH Code number: 7729 Stock Listing: First Section TSE(URL: http://www.accretech.jp/) Head office location: TokyoRepresentative: Sadakatsu Suzuki, CEO Inquiries: Kunimasa Ohta, CFO Tel: 0422 - 48 - 1011Board of directors meeting: May 14, 2008 Use of U.S. accounting standards: No
Expected Starting Date of Dividend Payout: June 30, 2008
1. Consolidated Results for the Period of FY2008 (April 1, 2007 - March 31, 2008) (1) Consolidated sales and earnings (Millions of yen, rounded down)
Net Sales Operating Income Ordinary Income Net Income FY2008 91,823 -8.5% 10,450 -25.8% 9,375 -31.1% 4,813 -44.9% FY2007 100,322 8.1% 14,086 0.7% 13,612 - 3.0% 8,741 179.7%
(Millions of yen, except as indicated) Net income per
Share (yen) Net income per
Share (diluted) (yen)Return on Net Assets
Ordinary Income on Total Assets
Operating Income Ratio
FY2008 FY2007
119.84 217.91 111.93
203.10 8.8% 17.3%
8.4% 12.1%
11.4% 14.0%
Notes: Equity in affiliates in FY08: - million yen; in FY07: - million yen. (2) Consolidated financial position (Millions of yen; except as indicated)
Total Assets Net Assets Equity Ratio Net Assets per Share (yen)
FY2008 FY2007
107,667 114,831
55,487 54,281
51.2% 47.1%
1,370.98 1,347.09
Notes: Equity in FY08: 55,111 million yen; in FY07: - 54,098million yen. (3) Consolidated cash flows (Millions of yen)
Cash flow from Operating Activities
Cash flow from Investing Activities
Cash flow from Financing Activities
Cash and Cash Equivalents at End of Period
FY2008 FY2007
10,014 10,920
-6,483 -3,439
-4,815 -4,638
15,665 16,800
2. Situation of Dividend
Per Share Dividend
Interim Year End Full Year Total Dividend(for Year)
Dividend Pay Out Ratio
Dividend on Net Assets
Yen Yen Yen Millions of Yen % % FY2007 25.00 25.00 50.00 2,006 22.9 4.0 FY2008 30.00 40.00 70.00 2,812 58.4 5.2 FY2009
(Projected) 15.00 25.00 40.00 67.0
3. Forecast for FY 2009 (April 1, 2008-March 31, 2009) (Millions of yen) (Percentage figures represent changes from the previous year for full-year figures and from the same period of the previous year for interim-period figures.)
Net Sales Operating Income Ordinary Income Ordinary Income Net Income per Share (yen)
Interim 36,500 -26.8% 3,300 -44.1% 3,300 -44.7% 100 -97.0% 2.49 Full Year 76,000 -17.2% 7,800 -25.4% 7,800 -16.8% 2,400 -50.1% 59.70

2
4. Others (1) Significant changes in subsidiaries during the year under review (changes in specific subsidiaries involving
changes in scope of consolidation): Yes. Exclusion from consolidation: 1 (Accretech Micro Technologies Co., Ltd.)
Note: Please refer to “Tokyo Seimitsu Corporate Group” on page 8 for details. (2) Changes in accounting principles, procedures, method of presentation and other matters associated with
preparation of consolidated financial statements (basic matters for preparation of consolidated financial statements) 1) Changes due to revision of accounting standards, etc.: Yes. 2) Changes other than 1): None.
(Note: Please refer to "Changes in Basis of Presenting Consolidated Financial Statements," on page 16 for details.) (3) Number of shares outstanding (common shares)
1) Number of shares outstanding at fiscal year end (including treasury shares): FY2008: 40,228,281 shares; FY2007: 40,187,517 shares
2) Number of treasury shares at fiscal year end: FY2008: 29,552 shares; FY2007: 28,215 shares (Note: Please refer to "Per Share Information," on page 20 for numbers of share as for the basis of this calculation.)
Reference: Summary of non-consolidated results
1. Non-Consolidated Results for the Period of FY2008 (April 1, 2007 - March 31, 2008) (1) Non-consolidated sales and earnings (Millions of yen, %, yen; percentage figures represent changes from previous year)
Net Sales Operating Income Ordinary Income Net Income FY2008 78,422 -9.7% 5,960 -37.7% 6,492 - 34.1% 3,442 -39.2% FY2007 86,827 5.2% 9,565 -5.6% 9,847 - 5.5% 5,666 134.7%
Net Income per Share Net Income per Share (diluted)
Yen Yen FY2008 85.70 80.05 FY2007 141.25 131.66
(2) Non-consolidated financial position (Millions of yen, %, yen; percentage figures represent changes from previous year)
Total Assets Net Assets Equity Ratio Net Assets per Share % YenFY2008 91,165 42,849 46.6 1,056.60 FY2007 97,005 42,695 43.8 1,058.57
Notes:Equity in FY08: 42,473 million yen; in FY07: 42,511million yen. Note to ensure appropriate use of forecasts and other matters warranting special mention All forecasts and other forward-looking statements in this document are based on information currently available to the Company and assumptions that the Company considers reasonable. Various uncertainties could cause actual results to significantly differ from these forecasts. Please refer to "1. Business Performance" on pages 3-6 for details of forecasts.

3
1. Business Performance (1) Analysis of Business Performance 1) Overview of Business Performance for Fiscal Year, Ended March 31, 2008 [Overall Business Performance] During the fiscal year under review, the business environment of Tokyo Seimitsu was severe for the semiconductor manufacturing equipment division but favorable for the measuring instrument division. Semiconductor manufacturing equipment division faced severe business environment because the semiconductor manufacturers decreased or postponed the capital investment due to the drastic decrease of DRAM price based on the unbalance of demand-supply of semiconductors. The measuring instrument division achieved its highest-ever sales and operating income as demand continued strong from such users as automobile-related industries and machine tool manufacturers. Notably, sales to overseas markets posted a steady rise. As a result, orders received in the fiscal year under review totaled ¥81,911 million (down 22.3% from the previous year). Net sales amounted to ¥91,823 million (down 8.5%), operating income reached ¥10,450 million (down 25.8%), and ordinary income came to ¥9,375 million (down 31.1%). Overall, net income amounted to ¥4,813 million (down 44.9% [Performance by Business Segment] A. Semiconductor Manufacturing Equipment Division The Semiconductor Manufacturing Equipment Division was influenced by the decrease or postponing of capital spending of DRAM manufacturers, especially for testing process. Meanwhile, sale of wafer dicing machines for the back-end process and polish grinders grabbed the customers’ needs and increased from the previous year. The orders received in the fiscal year under review were ¥57,093 million (down 30.8%), and sales were ¥67,469 million (down 13.6%). The operating income was ¥4,454 million (down 49.5%), due to the weak sales. (Regional overview) Domestic sales decreased 12.0% from the previous year and sales to overseas also decreased 14.7%. While the total sales decreased, sales to Southeast Asia increased with 23.8% from the previous year. (Product overview) (a) With weak capital investment of DRAM manufacturers and LCD drivers, order received and sales of wafer
probing machines decreased considerably on a year-to-year basis.
In early fiscal 2007, the "UF3000EX" wafer probing machine was introduced. This high-precision, high-throughput machine was developed based on a design concept that goes beyond conventional ideas and highly esteemed by our customers.
Tokyo Seimitsu, as the top wafer probing machine manufacturer, continuously makes an efforts to increase its share of the world market to react the expected high demands of wafer testing while the capacity of the device expands with its function.
(b) As for wafer dicing machines, the "A-WD-300TX" for 300 mm wafers, a highly-productive new product with an
80,000rpm spindle was introduced in April 2006 and spreaded in the market. Further, Tokyo Seimitsu developed the package singulation system (PS280), and began sales. The product has the feature on standalone twin-stage super-speed package singulation system, which divides chip-scale package (CSP) substrates with high speed and its sales are steadily increasing.
The "MAHOH DICING MACHINE”, a dry-process bladeless laser dicing machine, has been highly acclaimed by users for its dust-free operation and other performance characteristics and for high productivity. Sales of this product, mainly for MEMS and thin wafers, are steadily expanding. This product, which combines a Hamamatsu Photonics laser and Tokyo Seimitsu’s unique high-precision positioning and conveyance technologies, is highly rated by customers due to its considerable superiority over competing products.

4
(c) As for wafer inspection systems, the "Win-Win 50" system continued to be highly regarded for its notable features
-- a lower cost of ownership and higher detection rates --. A new model for a wider range of applications -- one that is excellent for mass production -- was marketed in 2007 in hopes of further improving performance in this product category.
(d) Tokyo Seimitsu’s unique Polish Grinders have become the “de facto” standard in the thin wafer market because
of their inimitable functions of producing thinner wafers and revoking damage in a single unit.
Competition has been intensifying in the thin wafer market. However, our sales of Polish Grinders drastically increased in this fiscal year. Tokyo Seimitsu's position as the market leader will be further strengthened as the technological superiority of the "PG300RM is appreciated."
(e) Regarding chemical mechanical planarizers (CMPs), the concept of the "ChaMP" series and its structural
advantages have become widely known to customers. The Company is striving to further increase sales by gaining more customers and to reduce costs. These efforts will improve profitability in future.
(f) Accretech USA, Inc. terminated distribution agreement of wire saws in the North American market in January
2008 and the backlog of the products decreased accordingly. B. Measuring Instrument Division In the measuring instrument division, the demand of automobile-related manufacturers and machine tool producers was steady and both orders and sales were expanded in the year under review as a result of the Company's efforts to win orders by addressing users' needs. Orders received totaled ¥24,818 million (up 7.9% from the previous year), and sales reached ¥24,354 million (up 9.6%). Both were record highs for the fifth consecutive year since fiscal 2004. As for production, the Company has made efforts to reduce costs, achieving the fifth straight year of record-high operating income, at ¥5,995 million (up 14.1%). (Regional overview) Looking at this division's business results by region, Japanese domestic sales rose 5.2% from the previous year, while sales to overseas markets were extremely strong, rising 28.5%. Sales to East Asia and Southeast Asia in particular soared. (Product overview) (a) Among industrial measuring systems, sales of the "XYZAX SVA" series of 3D coordinate measuring machines,
which combine Carl Zeiss analysis and control technologies with Tokyo Seimitsu’s high-rigidity design technology, have increased as products satisfying the needs of customers. Sales also increased from the year-earlier period for Carl Zeiss’ ACCURA, which use active scanning technology to guarantee high throughput. The "SURFCOM" series of surface texture and contour measuring instruments uses linear motors to achieve the world's highest precision while minimizing vibration. In this series, sales increased for such products as the "SURFCOM 1500/2000DX" and "CONTOURECORD 1700DX".
(b) Sales of in-line measuring systems were down from the previous year. The main reason for this was that the postponement of capital investment by domestic automobile-related manufacturers adversely affected sales of "PULCOM" series products, which are typically used in auto parts production lines. However, in the second half of fiscal 2008, the sales gradually increased as a result of the aggressive sales activities to the automobile-related manufacturers and machine tool producers.
2) Forecasts for Next Fiscal Year [Overall and Business Segment-based Forecasts] A. Semiconductor Manufacturing Equipment Division The economic situation in FY 2009 is expected to be uncertain due to the price increase of oil and raw materials, drastic changes of exchange rates and problems relating to sub-prime loans. The semiconductor device market is expected to show continued strong growth, lifted by growth of automobile-related devices, in addition to increasing demand for digital consumer electronics such as mobile phones and flat-screen televisions. However, capital investment by semiconductor manufacturers and foundries is expected to be cautious due to the uncertainty of world economy and unstable situation of DRAM prices.

5
Given the situation, Tokyo Seimitsu expects the market environment of semiconductor manufacturing equipment will remain uncertain in FY 2009. However, like the other research companies, the Company considers the strong demand will be recovered after FY 2010 (the year ended March 31, 2010). The Company will supply new products that match the customers’ needs and try to expand the market share of each product. Also, the Company will improve its profitability by cost reduction and production innovation. To improve its productivity, the Company will launch to construct the Hachioji’s fifth plant in June 2008 and complete in April 2009.
Consequently, net sales in the semiconductor manufacturing equipment division in FY 2009, ending March 31, 2009, is expected to be¥51,000 million (down 24.4% from FY 2008).
B. Measuring Instrument Division Although the slowdown of world economy will impact the automobile related and machine tool industries, in the measuring instrument division, sales are expected to increase from the previous year by expanding the overseas sales where our market share is still low and by striving to accurately grasp the needs of customers and win orders. This is expected to drive the measuring instrument division's net sales for FY 2009 to ¥25,000 million (up 2.7% from FY 2008) for the sixth straight years of record highs.
C. Overall Overall, consolidated net sales in FY 2009 are forecasted to total ¥76 billion (down 17.2% from FY 2008), operating income will amount to ¥7,800 million (down 16.8%), and ordinary income will come to ¥7,800 million (down 16.8%). Net income is expected to be ¥2,400 million (down 50.1%) with including loses on inventory devaluation in the first quarter in accordance with No.9 Accounting Standards for measurement of inventories applicable from April 2008.

6
(2) Analysis of Financial Position 1) Assets, Liabilities and Net Assets Total assets as of March 31, 2008, amounted to ¥107.6 billion, a decrease of ¥7.1 billion from a year earlier. The major factors behind this decrease include a decrease in notes and accounts receivable of ¥7.4 billion, an increase in land of ¥2.7 billion and a decrease in investment securities of ¥1.5 billion.
Total liabilities were down ¥8.3 billion, to ¥52.1 billion. This was mainly because of a ¥4.0 billion decrease in notes and account payable, a decrease of long-term debt of ¥3.1 billion and a decrease of income tax payable of ¥1.7 billion.
Net assets totaled ¥55.4 billion, and the equity ratio was up 4.1% from a year earlier, to 51.2%.
2) Cash Flows Cash and cash equivalents at the end of the fiscal year under review amounted to ¥15.6 billion, a decrease of ¥1.1 billion from a year earlier. The status of cash flows and factors behind them are given below.
Net cash earned from operating activities was ¥10.0 billion. The major components were income before income taxes and minority interests (¥9.2 billion), depreciation and amortization (¥2.2 billion), a decrease in trade receivables (¥7.2 billion), and a decrease in trade liabilities (-¥3.4 billion) and income taxes paid (-¥4.6 billion).
Net cash used in investing activities amounted to -¥6.4 billion. This was mainly reflected by capital equipment expenditures of ¥5.0 billion.
Net cash used in financing activities came to -¥4.8 billion. The major factors of this were a decrease in repayments of long-term debt (-¥3.1 billion), payment for redemption of bonds (-¥1.2 billion), dividend payments (-¥2.2 billion), and an increase in short-term loans payable (¥1.7 billion).
Trends in financial indices are shown below. FY2006 FY2007 FY2008 Equity ratio (%) 42.5 47.1 51.2 Equity ratio, based on market value (%) 256.4 139.9 68.3 Number of years for amortization (years) 3.3 2.3 2.2 Interest coverage ratio (times) 41.7 50.3 60.9
Equity ratio: Net assets/total assets Equity ratio based on market value: Total market value of equity/total assets Number of years for amortization: Interest-bearing debt/operating cash flows Interest coverage ratio: Operating cash flows/interest payments
Notes: 1. All indices are calculated on consolidated financial statements. 2. The total market value of equity is calculated by multiplying market price at the end of FY by the number of
shares outstanding at the end of FY. 3. “Operating cash flows” refers to cash flows from operating activities as shown in the consolidated cash flow
statements. 4. Interest-bearing debts refer to all debts in Consolidated Financial Statements which we pay interest. “Interest
payments” denotes interest payments as reflected in the consolidated cash flow statements.

7
(3) Basic Policy for Profit Distribution and Dividends for Fiscal 2008 and 2009 Tokyo Seimitsu believes the most important management task for the Company is to enhance its corporate value and constantly distribute profits to shareholders by providing unsurpassed products based on state-of-the-art technologies in semiconductor manufacturing equipment market and measuring instrument market.
The Company determines distribution of profit contemplating various factors, including its consolidated business results, financial position, investments for business expansion and shareholders’ long-term prospects. More specifically, Tokyo Seimitsu pays dividends at around 30% of the consolidated net income. On the other hand, the Company endeavors to ensure a full-year dividend of ¥30 per share in case of slumping business conditions, considering shareholders’ long-term prospects.
Retained earnings will be used effectively to capital investments that are indispensable for the growth of Tokyo Seimitsu, including research and development activities and production facilities.
For FY 2008, Tokyo Seimitsu paid an interim dividend of ¥30 per share. The Company plans to pay a year-end dividend of ¥40 per share. A proposal for a full-year dividend of ¥70 per share will be submitted to the 85th General Meeting of Shareholders.
As for dividends for FY 2009, even in the severe business environment such as slump market conditions, the Company plans to pay a full-year dividend of ¥40 per share (of which ¥15 will be an interim dividend) including ordinary dividend of ¥30 and commemorative dividend of ¥10, based on shareholders’ prospect and 60th anniversary in March 2009.
8
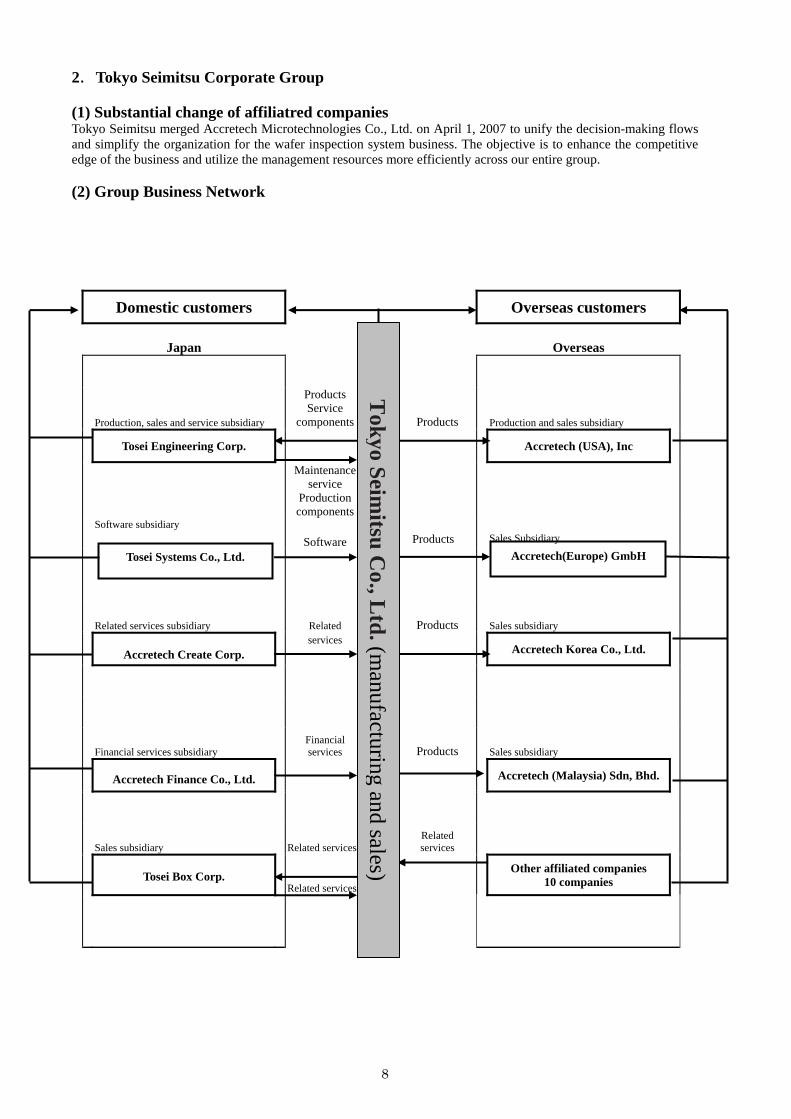
2.Tokyo Seimitsu Corporate Group
(1) Substantial change of affiliatred companies Tokyo Seimitsu merged Accretech Microtechnologies Co., Ltd. on April 1, 2007 to unify the decision-making flows and simplify the organization for the wafer inspection system business. The objective is to enhance the competitive edge of the business and utilize the management resources more efficiently across our entire group.
(2) Group Business Network
Domestic customers Overseas customers
Japan
Overseas
Production, sales and service subsidiary
Products Service
components
Products Production and sales subsidiary
Tosei Engineering Corp. Accretech (USA), Inc
Maintenance service
Production components
Software subsidiary
Software Products Sales Subsidiary
Accretech(Europe) GmbH
Related services subsidiary
Related Products Sales subsidiary
Accretech Create Corp.
services Accretech Korea Co., Ltd.
Financial services subsidiary Financial
services Products Sales subsidiary
Accretech Finance Co., Ltd.
Accretech (Malaysia) Sdn, Bhd.
Sales subsidiary
Related services Related
services
Tosei Box Corp.
Related services Other affiliated companies 10 companies
Tokyo Seim
itsu Co., L
td. (manufacturing and sales)
Tosei Systems Co., Ltd.

9
3. Management Policy (1) Basic Policy 1. As a manufacturer of precision measuring instruments and semiconductor manufacturing equipment, Tokyo Seimitsu has consistently focused on developing state-of-the-art products that contribute to improving our customers' productivity and on providing good customer support. With technological innovation advancing rapidly and becoming more sophisticated, the prime necessity for our continuous growth is to establish a strong product development organization and to keep appropriate product development criteria. To accomplish this, in line with the following "Strategic Principles for Our R&D" that we have established as the core of our management principles, we are working to minimize the effects of market cycles in capital investment, build a business foundation of high growth and profitability, and further increase corporate value.
Strategic Principles for Our R&D
a. Endeavor to create the number-one products in the global market.
Products with the leading share of the global market should have the following qualities: a)The ability to generate maximum profits during favorable economic periods; b)The ability to incur only minimal losses during periods of recession.
b. Finance R&D exclusively from internal cash flows. c. Target fields that have strong technology barriers but where market needs are high and the potential size of the
market is large. d. Actively seek alliances to share R&D costs and utilize synergies that benefit industry partners.
2. Tokyo Seimitsu has adopted as a corporate motto "Win-Win Relationships Create the World's No. 1 Products." The Company is striving to establish a structure that is capable of creating world-leading products. To do this, we apply the core technologies we have developed, and build cooperative Win-Win relationships with domestic and overseas companies and individuals that share the common goal of creating the world's best products. Behind all our efforts is the goal of being a truly global company.
3. Tokyo Seimitsu has also implemented the executive officer system and the internal company system under which the entire company has been divided into three internal companies -- Semiconductor Company, Metrology Company and Administration Company. These internal companies, as fully functioning organizations with appropriate responsibilities and authority, are positioned to improve the level of customer satisfaction and business performance by responding to each customer more flexibly and promptly.
4. For product development, groups were formed for each product and the group leaders have headed each group. Furthermore, Semiconductor Company established Marketing Department and Technology Department by separating each group for marketing and technology development in order to strengthen the customer support and accelerate the speed of technology development.
(2) Essential Management Indicators Tokyo Seimitsu conducts its management in a manner that conforms to the goals of all of its shareholders. We believe that long-term growth in earnings per share and the resulting long-term growth in corporate value are important indicators for management.
(3)Medium- to Long-term Management Strategies and Issues for Tokyo Seimitsu 1. In March 2009, Tokyo Seimitsu will celebrate its 60th anniversary. The measuring instrument division is estimated to achieve the goal of its mid-term plan “ACCRETECH Action 60 (AA60)“, net sales of ¥25 billion. But it would be difficult for the semiconductor manufacturing equipment division to reach the target because of the slumping semiconductor manufacturing equipment market mainly caused by the price decline of DRAM. Given the situation, Tokyo Seimitsu promotes further quality improvement and production innovation, to enhance company structure, to increase its sales, to expand its market share and to reach the higher profit rate, in preparation for the future market recovery.
2. The company is making active capital investment to improve quality and innovate production in the measuring instrument business (Tsuchiura Plant), the semiconductor manufacturing equipment business (Hachioji Plant) and Tosei Engineering Corp. The new factory (Assembly Factory) of the measuring instrument business is completed in May 2008. The construction of the new factory (5th Factory) of the semiconductor manufacturing business will commence in June 2008 and is scheduled to be completed in April 2009. The construction of the new factory (Kita-Kandatsu Plant) of Tosei Engineering Corp. was completed in February 2008.
10
3. In recent years, corporate governance and risk management have become increasingly important. Tokyo Seimitsu will endeavor to strengthen its corporate governance by establishing an effective internal control system and a proper compliance/risk management system, thereby ensuring sound and transparent management.
Cautionary Statements with Respect to Forward-looking Statements This summary and its related materials contain forward-looking statements based on information available to the management at the time of this announcement that it has judged to be rational, including such factors as economic conditions in Japan and other countries, or fluctuations in exchange rates, which may affect the Company’s performance. These forecasts and projects are subject to a number of risks and uncertainties, including market conditions, competition, and the
global state of the semiconductor industry. Accordingly, actual results may differ materially from those projected in this earnings summary.

11
4.Consolidated Financhial Statements
(1)Consolidated Balance Sheet
FY2007 FY2008 (ended March 31,2007) (ended March 31,2008)
Change Item
Million yen % Million yen % Million yen
ASSETS
Ⅰ Current Assets 86,561 75.4 77,603 72.1 △ 8,957
1. Cash and cash equivalents 16,826 15,693 △ 1,132
2. Notes and accounts receivable 39,717 32,282 △ 7,434
3. Inventories 27,207 27,676 468
4. Consumption tax receivable 583 721 137
5. Deferred tax assets 1,607 757 △ 849
6. Other 647 517 △ 129
7. Allowance for doubtful accounts △ 28 △ 45 △ 17
Ⅱ Fixed Assets 28,270 24.6 30,063 27.9 1,793
1. Property, plant and equipment 15,180 13.2 18,969 17.6 3,788
(1) Buildings and structures 8,219 8,813 594
(2) Tools and fixtures 2,633 2,712 78
(3) Other fixed assets 872 798 △ 73
(4) Land 3,002 5,761 2,758
(5) Construction in process account 452 882 430
2. Intangible fixed assets 3,589 3.1 3,188 3.0 △ 401
(1) Software 608 597 △ 10
(2) Goodwill 2,888 2,495 △ 393
(3) Other 92 95 2
3. Investments and other assets 9,499 8.3 7,905 7.3 △ 1,593
(1) Investment securities 5,966 4,397 △ 1,569
(2) Long-term loans 374 13 △ 361
(3) Deferred tax assets 1,551 1,841 290
(4) Other 1,620 1,758 137
(5) Allowance for investment loss - △ 82 △ 82
(6) Allowance for doubtful accounts △ 12 △ 21 △ 9
Total Assets 114,831 100.0 107,667 100.0 △ 7,164

12
FY2007 FY2008 (ended March 31,
2007) (ended March 31,
2008) Change
Item
Million yen % Million yen % Million yen
LIABILITIES
Ⅰ Current Liabilities 36,312 31.6 44,540 41.4 8,227
1 Notes and accounts payable, trade 23,596 19,530 △ 4,065
2 Short-term debt 118 1,800 1,682
3 Current portion of long-term debt 3,117 2,692 △ 425
4 Current portion of bonds 1,200 13,965 12,765
5 Current portion of convertible bonds 50 - △ 50
6 Income taxes payable 3,483 1,777 △ 1,705
7 Bonus reserve 956 889 △ 67
8 Reserve for directors' bonuses 59 14 △ 45
9 Other current liabilities 3,732 3,871 139
Ⅱ Long-term Liabilities 24,237 21.1 7,640 7.1 △ 16,597
1 Bonds 13,965 - △ 13,965
2 Long-term debt 6,163 3,471 △ 2,692
3 Allowance for employee retirement benefits 3,816 3,891 75
4 Allowance for director retirement benefits 292 106 △ 186
5 Long-term accounts payable - 170 170
Total Liabilities 60,549 52.7 52,180 48.5 △ 8,369
NET ASSETS
Ⅰ Shareholders' Equity 52,424 45.6 55,081 51.2 2,656
1 Common Stock 9,592 9,633 41
2 Capital surplus 20,611 20,653 41
3 Retained earnings 22,322 24,900 2,578
4 Treasury stock △ 101 -105 △ 4
Ⅱ Valuation and Translation Adjustments 1,673 1.5 29 0.0 △ 1,643
1 Valuation difference on securities 1,416 65 △ 1,351
2 Foreign currency translation adjustment 257 -35 △ 292
Ⅲ Subscription Rishts 183 0.2 375 0.3 191
Total Net Assets 54,281 47.3 55,487 51.5 1,205
Total Liabilities and Net Assets 114,831 100.0 107,667 100.0 △ 7,164

13
(2) Consolidated Statements of Income
FY2007 (April 1, 2006 - March
31, 2007)
FY2008 (April 1, 2007 - March 31,
2008) Change
Item
Million yen % Million yen % Million yen
Ⅰ Net sales 100,322 100.0 91,823 100.0 △ 8,499
Ⅱ Cost of sales 72,211 72.0 67,763 73.8 △ 4,447
Gross profit on sales 28,111 28.0 24,060 26.2 △ 4,051
Ⅲ Selling, general and administrative expenses
1 Selling expenses 10,593 10,39
8
2 General expenses 3,431 14,025 14.0 3,211 13,609 14.8 △ 415
Operating Income 14,086 14.0 10,450 11.4 △ 3,636
Ⅳ Non-operating income
1 Interest and dividend income 114 467
2 Other 93 208 0.2 78 545 0.6 336
Ⅴ Non-operating expenses
1 Interest expenses 259 243
2 Foreign exchange loss - 1,090
3 Other 422 681 0.6 286 1,619 1.8 937
Ordinary income 13,612 13.6 9,375 10.2 △ 4,237
Ⅵ Extraordinary gains
1 Gain on consumption tax refund 155 -
2 Other 0 155 0.2 7 7 0.0 △ 148
Ⅶ Extraordinary losses
1 Expense of lowsuit 517 -
2 Other 51 569 0.6 165 165 0.2 △ 404
Income before income taxes and minority interests 13,198 13.2 9,217 10.0 △ 3,980
Income taxes 4,310 2,976
Income tax adjustment 146 4,457 4.5 1,427 4,403 4.8 △ 53
Net Income 8,741 8.7 4,813 5.2 △ 3,927

14
(3) Consolidated Statements of Changes in Net Assets
FY 2007 (April 1, 2006 - March 31, 2007)
Shareholders' equity Valuation and translation adjustments
Item Common
Stock Capital surplus
Retained earnings
Treasury stock
Total sharehol
ders' equity
Valuation Difference
on securities
Foreign currency
translation adjustments
Total valuation
and translation
adjustments
Warrants
Total net assets
Balance as of March 31, 2006 9,447 20,466 15,399 △ 90 45,223 1,340 139 1,479
- 46,703
Changes during FY 2007
Issuance of new shares 144 144 288 288
Dividends from surplus △ 1,804 △ 1,804 △ 1,804
Bonuses to directors by profit distribution △ 14 △ 14 △ 14
Net income 8,741 8,741 8,741
Treasury stock acquisition △ 11 △ 11 △ 11
Treasury stock disposition 0 0 1 1
Net changes in items other than shareholders'
75 118 193 183 377
Total 144 144 6,922 △ 10 7,201 75 118 193 183 7,578
Balance as of March 31, 2007 9,592 20,611 22,322 △ 101 52,424 1,416 257 1,673 183 54,281
FY 2008 (April 1, 2007 - March 31, 2008)
Shareholders' equity Valuation and translation adjustments
Item Common
Stock Capital surplus
Retained earnings
Treasury stock
Total sharehol
ders' equity
Valuation Difference
on securities
Foreign currency
translation adjust-ments
Total valuation
and translation
adjustments
Warrants
Total net assets
Balance as of March 31, 2007 9,592 20,611 22,322 △ 101 52,424 1,416 257 1,673 183 54,281
Changes during FY 2008
Issuance of new shares 41 41 83 83
Dividends from surplus △ 2,208 △ 2,208 △ 2,208
Net income 4,813 4,813 4,813
Treasury stock acquisition △ 5 △ 5 △ 5
Treasury stock disposition △0 0 0 0
Decrease of retained earnings by newly consolidated subsidiaries
△ 26 △ 26 △ 26
Net changes in items other than shareholders'
△ 1,351 △ 292 △ 1,643 191 △ 1,451
Total 41 41 2,578 △ 4 2,656 △ 1,351 △ 292 △ 1,643 191 1,205
Balance as of March 31, 2008 9,633 20,653 24,900 △ 105 55,081 65 △ 35 29 375 55,487

15
(4) Consolidated Statements of Cash Flows (Million Yen)
FY2007
(April 1, 2006 -March 31, 2007)
FY2008 (April 1, 2007
-March 31, 2008) Change
Ⅰ Cash flows from operating activities: Income before income taxes and minority interests 13,198 9,217 △ 3,980 Depreciation and amortization 2,468 2,247 △ 221 Amotizationof goodwill 413 393 △ 20 Stock related expense 183 217 34 Change in allowance for employee retirement benefits △ 6 75 81 Change in allowance for director retirement benefits △ 60 △ 186 △ 126 Interest and dividend income △ 114 △ 467 △ 352 Interest expense 259 243 △ 16 Loss on sales and disposal of tangible assets 145 23 △ 122 Change in trade notes and accounts receivable △ 3,096 7,287 10,383 Change in inventories △ 382 △ 682 △ 299 Change in trade notes and accounts payable △ 1,379 △ 3,499 △ 2,119 Change in other operating activities 1,606 △ 424 △ 2,030 Subtotal 13,235 14,446 1,211 Proceeds from interest and dividend income 114 467 352 Payment of interest △ 265 △ 244 20 Payment of income taxes △ 2,164 △ 4,654 △ 2,489
Net cash provided by operating activities 10,920 10,014 △ 905Ⅱ Cash flows from investing activities:
Payment for time deposits △ 38 △ 38 0 Proceeds from time deposits 48 38 △ 10 Payment for purchase of property, plant and equipment △ 3,144 △ 5,013 △ 1,868 Proceeds from sales of property, plant and equipment 134 68 △ 66 Payment for purchase of intangible assets △ 165 △ 608 △ 443 Payment for purchase of investment securities △ 1,500 △ 842 658 Proceeds from sales of investment securites 1,509 - △ 1,509 Payment by purchase of subsidiary stock △ 113 △ 91 22 Payment for loans △ 200 - 200 Proceeds from repayment of loans 31 9 △ 21 Payment for other investing activities - △ 5 △ 5
Net cash used in investing activities △ 3,439 △ 6,483 △ 3,044Ⅲ Cash flows from financing activities:
Change in short-term loans payable △ 2,938 1,700 4,638 Proceeds from long-term debt 4,000 - △ 4,000 Repayment of long-term debt △ 3,473 △ 3,117 356 Payment for redemption of bonds △ 700 △ 1,200 △ 500 Income by execution of warrants 287 15 △ 272 Dividend payments △ 1,804 △ 2,208 △ 404 Payment for other financing activities △ 10 △ 5 5 Net cash provided by (used in) financing activities △ 4,638 △ 4,815 △ 176
Ⅳ Effect of exchange rate changes on cash and cash equivalents 106 △ 26 △ 132
Ⅴ Net increase (decrease) in cash and cash equivalents 2,948 △ 1,310 △ 4,259Ⅵ Cash and cash equivalents at beginning of year 13,851 16,800 2,948Ⅶ
Income of cash and cash equivalente from newly consolidated subsidiary - 175 175
Ⅷ Cash and cash equivalents at end of year 16,800 15,665 △ 1,135

16
(5) Basis of Presenting Consolidated Financial Statements Matters pertaining to scope of consolidation 1) Subsidiaries included in consolidation: Tosei Box Co., Ltd., Accretech Korea Co., Ltd. These two subsidiaries, which had been unconsolidated subsidiaries until the previous fiscal year, have been included in consolidated financial statements for the period under review due to their increasing importance. 2) Subsidiary excluded from consolidation: Accretech Micro Technologies Co., Ltd. This subsidiary was dissolved as a result of its merger into the Company on April 1, 2007. Disclosures other than those described above are omitted as there is no significant change from statements in the previous report (submitted on June 28, 2007).
(6) Changes in Basis of Presenting Consolidated Financial Statements
Method of depreciation of tangible fixed assets Pursuant to amendments to the Corporation Tax Law, starting from the period under review, the Company and its domestic consolidated subsidiaries depreciate tangible fixed assets acquired on and after April 1, 2007, using the method stipulated by the amended Corporation Tax Law. As a result of this change, operating income, ordinary income and income before taxes and minority interests decreased by ¥55 million each, compared with those calculated by the previous method. The impact of this change on segment information is described in the relevant section. (Additional information) Pursuant to amendments to the Corporation Tax Law, the Company and its domestic consolidated subsidiaries record tangible fixed assets acquired on and before March 31, 2007, as follows. The difference between an amount equivalent to 5% of the acquisition cost and the memorandum value is to be depreciated equally over five years from the fiscal year following the year in which the undepreciated value reached 5% of the acquisition cost in accordance with the depreciation method under the previous Corporation Tax Law. The depreciation amount is to be included in “Depreciation and amortization.” As a result of this change, operating income, ordinary income and income before income taxes and minority interests each decreased by ¥25 million, compared with those calculated by the previous method. The impact of this change on segment information is described in the relevant section.
(7) Changes in Accounting Standards The Company terminated its director’s retirement benefit system from fiscal year ended March 2006. Up to last fiscal year, the amount needed to pay as the retirement benefit for directors was accounted and shown as "Allowance for director retirement benefits." But from this fiscal year, they will be shown as "Long term account payable" in the Long-term Liabilities based on new guideline issued by Japan Public Accountant Association Report No.42 issued on April 13, 2007. “Auditing Treatment on Reserve, allowance and allowance for directors retirement benefit.”
(8) Note on Consolidated Financial Statements (Omission of disclosure)
Notes regarding lease transactions, stock options, etc., and derivatives transactions are omitted, as it is believed there is no significant need to disclose such information in the financial statements.

17
5.Segment Information (1) Business segments FY2007 (April 1, 2006 - March 31, 2007) (Millions of yen, rounded down) Semiconductor
manufacturing equipment division
Measuring systems division
Total Corporate and elimination Consolidation
Ⅰ Sales and operating income: 1. Sales to third parties
2. Intersegment sales to transfer
78,091
-
22,230
-
100,322
-
-
-
100,322
- Total 78,091 22,230 100,322 - 100,322
Cost of revenue from operations 69,261 16,974 86,236 - 86,236 Operating Income 8,830 5,256 14,086 - 14,086 Ⅱ Assets, depreciation and capital
expenditure: Assets 87,583
23,470
111,054
3,777
114,831
Depreciation 2,360 521 2,882 - 2,882 Capital expenditure 1,500 1,010 2,511 - 2,511 FY 2008 (April 1, 2007 - March 31, 2008) (Millions of yen, rounded down) Semiconductor
manufacturing equipment division
Measuring systems division
Total Corporate and elimination Consolidation
Ⅰ Sales and operating income: 1. Sales and operating income:
2. Intersegment sales to transfer
67,469
-
24,354
-
91,823
-
-
-
91,823
- Total 67,469 24,354 91,823 - 91,823
Cost of revenue from operations 63,014 18,359 81,373 - 81,373 Operating Income 4,454 5,995 10,450 - 10,450 Assets, depreciation and capital expenditure: Assets
80,873
24,062
104,935
2,731
107,667
Depreciation 2,107 533 2,640 - 2,640 Capital expenditure 4,925 1,247 6,172 - 6,172 Notes 1. Pursuant to amendments to the Corporation Tax Law, starting from the period under review, the Company and its domestic consolidated subsidiaries depreciate tangible fixed assets acquired on and after April 1, 2007, using the method stipulated by the amended Corporation Tax Law. As a result of this change, in the semiconductor manufacturing equipment division, cost of revenue from operations rose by ¥43 million and operating income decreased by the same amount, compared with those calculated by the previous method. In the measuring systems division, cost of revenue from operations increased by ¥11 million and operating income fell by the same amount, compared with those calculated by the previous method. 2. Pursuant to amendments to the Corporation Tax Law, the Company and its domestic consolidated subsidiaries record tangible fixed assets acquired on and before March 31, 2007, as follows. The difference between the amount equivalent to 5% of the acquisition cost and the memorandum value is to be depreciated equally over five years from the fiscal year following the year in which the undepreciated value reached 5% of the acquisition cost in accordance with the depreciation method under the previous Corporation Tax Law. The depreciation amount is to be included in “Depreciation and amortization.” As a result of this change, in the semiconductor manufacturing equipment division, cost of revenue from operations rose by ¥15 million and operating income decreased by the same amount, compared with those calculated by the previous method. Meanwhile, in the measuring systems division, cost of revenue from operations increased by ¥10 million and operating income fell by the same amount, compared with those calculated by the previous method.

18
(2) Geographical segments FY2007(April 1, 2006 - March 31, 2007) (Millions of yen, rounded down)
Japan U.S. Germany Total Corporate
and elimination
Consolidation
Ⅰ Sales and operating income: 1. Sales to third parties 2. Intersegment sales to transfer
81,916 11,957
11,443 -
6,962 -
100,322 11,957
- (11,957)
100,322 -
Total 93,874 11,443 6,962 112,280 (11,957) 100,322 Cost of revenue from operations 80,531 11,406 6,197 98,135 (11,899) 86,236 Operating Income 13,343 36 765 14,144 ( 58) 14,086 Ⅱ Assets 106,466 6,741 2,891 116,099 ( 1,268) 114,831 FY2008(April 1, 2007 - March 31, 2008) (Millions of yen, rounded down)
Japan U.S. Germany Korea Total
Corporate and
elimination Consolidation
Ⅰ Sales and operating income: 1. Sales to third parties 2. Intersegment sales to transfer
77,920 9,040
6,109 -
7,304 60
488500
91,823
9,600
- ( 9,600)
91,823
- Total 86,960 6,109 7,364 988 101,424 ( 9,600) 91,823
Cost of revenue from operations 76,607 6,673 6,875 916 91,072 ( 9,699) 81,373 Operating Income 10,353 △563 489 72 10,351 98 10,450 Ⅱ Assets 101,175 4,846 3,672 492 110,186 ( 2,519) 107,667 Notes 1. Pursuant to amendments to the Corporation Tax Law, starting from the period under review, the Company and its domestic consolidated subsidiaries depreciate tangible fixed assets acquired on and after April 1, 2007, using the method stipulated by the amended Corporation Tax Law. As a result of this change, in Japan, cost of revenue from operations rose by ¥55 million and operating income decreased by the same amount, compared with those calculated by the previous method. 2. Pursuant to amendments to the Corporation Tax Law, the Company and its domestic consolidated subsidiaries record tangible fixed assets acquired on and before March 31, 2007, as follows. The difference between an amount equivalent to 5% of the acquisition cost and the memorandum value is to be depreciated equally over five years from the fiscal year following the year in which the undepreciated value reached 5% of the acquisition cost in accordance with the depreciation method under the previous Corporation Tax Law. The depreciation amount is to be included in “Depreciation and amortization.” As a result of this change, in Japan, the cost of revenue from operations rose ¥25 million and operating income decreased by the same amount, compared with those calculated by the previous method.

19
(3) Overseas Sales FY2007 (April 1, 2006 - March 31, 2007) (Millions of yen, rounded down)
East Asia North America Europe Others Total
Ⅰ Overseas sales 28,709 9,121 7,332 5,299 50,462 Ⅱ Consolidated sales 100,322 Ⅲ Ratio of overseas sales to
consolidated sales 28.6% 9.1% 7.3% 5.3% 50.3%
FY2008 (April 1, 2007 - March 31, 2008) (Millions of yen, rounded down)
East Asia Europe South East Asia North America Others Total
Ⅰ Overseas sales 25,722 7,468 6,706 4,479 464 44,841 Ⅱ Consolidated sales 91,823 Ⅲ Ratio of overseas sales to
consolidated sales 28.0% 8.1% 7.3% 4.9% 0.5% 48.8%

20
6. Per Share Information
FY 2007 (April 1, 2006 - March 31, 2007) FY 2008 (April 1, 2007 - March 31, 2008)
Net assets per share 1,347.09 yen Net assets per share 1,370.98 yen
Earnings per share 217.91 yen Earnings per share 119.84 yen
Diluted earnings per share 203.10 yen Diluted earnings per share 111.93 yen
Note: Bases for calculation
1. Net assets per share
Item FY 2007 (March 31, 2007) FY 2008 (March 31, 2008)
Total net assets in consolidated balance sheet 54,281 55,487 Net assets related to common stock 54,098 55,111 Main components of difference Warants 183 375
Number of outstanding shares (thousand shares) 40,187 40,228 Number of treasury shares (thousand shares) 28 29
Number of outstanding shares that are bases for culculation of net assets per share (thousand shares) 40,159 40,198
2. Earnings per share and diluted earnings per share
Item FY 2007 (April 1, 2006 - March 31, 2007)
FY 2008 (April 1, 2007 - March 31, 2008)
Net income on consolidated balance sheet (million yen) 8,741 4,813
Net income related to common stock (million yen) 8,741 4,813
Main item of amount not attributable to common stock Bonuses to directors by profit distribution (million yen)
-
-
Average number of shares of common stock outstanding during year (thousand shares) 40,114 40,169
Main item of adjustment used for calculation of diluted earnings per share (million yen)
Interest expenses (after tax-equivalent amount)
0
0
Main components of increase in number of shares of common stock used for calculation of diluted earnings per share (thousand shares)
Warrants Stock option program 109 Stock option program 0
Stock option program (share-based payment) 60 Stock option program
(share-based payment) 85
Bond with warrants Yen-denominated convertible bonds with warrants due 2008 2,728 Yen-denominated convertible bonds with
warrants due 2008 2,728
Convertible bonds Unsecured convertible bonds No. 2 27 Unsecured convertible bonds No. 2 25
Number of shares of common stock increased (thousand shares) 2,926 2,839
Items which has no effect on dilution (thousand shares)
Bonds with warrants of stock option program in July 2006 79 Bonds with warrants of stock option program 421

21
7.Production, Orders and Sales (1) Production (Millions of yen, rounded down)
FY2007 FY2008 Business Segment (April 1, 2006–
March 31, 2007) YoY (%) (April 1, 2007 – March 31, 2008) YoY (%)
Semiconductor manufacturing
equipment
78,562
+13.1%
67,065
- 14.6%
Measuring systems 22,375 +4.3% 24,596 +9.9% Total 100,937 +11.1% 91,662 - 9.2%
Note: Amounts shown are based on the sales price (excluding consumption tax). (2) Orders (Millions of yen, rounded down)
FY2007 FY2008 (April 1, 2006 – March 31, 2007) (April 1, 2007 – March 31, 2008) Business Segment Received Backlog Received Backlog
Semiconductor manufacturing
equipment
82,465
23,823
57,093
13,447
Measuring systems 22,994 5,118 24,818 5,628 Total 105,460 28,942 81,911 19,076
Note: Amounts shown are based on the sales price (excluding consumption tax). (3) Sales (Millions of yen, rounded down)
FY2007 FY2008 Business Segment (April 1, 2006–
March 31, 2007) YoY (%) (April 1, 2007 – March 31, 2008) YoY (%)
Semiconductor manufacturing
equipment
78,091
+ 8.7 %
67,469
- 13.6 %
Measuring systems 22,230 + 5.8 % 24,354 + 9.6% Total 100,322 + 8.1 % 91,823 - 8.5 %
Note: Amounts are shown excluding consumption tax.