consolidated financial statements - global.tdk.com · consolidated financial statements for the...
TRANSCRIPT

Consolidated Financial Statements for the three-month-period ended December 31, 2009
and December 31, 2008 (in English)
On February 15, 2010, this report in the Japanese version was filed with the Director-General of the Kanto Local Finance Bureau of the Ministry of Finance
pursuant to Japan’s Financial Instruments and Exchange Act.

- 2 -
[This is an English translation prepared for the convenience of non-resident shareholders. Should there be any inconsistency between the translation and the official Japanese text, the latter shall prevail.] [Cover] Document to be filed: Quarterly Report Provisions to base upon: Article 24-4-7, paragraph 1 of the Financial Instruments
and Exchange Act Filing to: Director-General of the Kanto Local Finance Bureau Date of filing: February 15, 2010 Business year: 3rd quarter of 114th term (from October 1, 2009 to
December 31, 2009) Company name (Japanese): TDK Kabushiki-Kaisha Company name (English): TDK CORPORATION Title and name of representative: Takehiro Kamigama, President & Representative
Director Location of head office: 1-13-1, Nihonbashi, Chuo-ku, Tokyo, Japan Telephone number: +81-3-5201-7116 Contact person: Takakazu Momozuka, General Manager, Finance &
Accounting Department of Administration Group Place of contact: 1-13-1, Nihonbashi, Chuo-ku, Tokyo, Japan Telephone number: +81-3-5201-7116 Contact person: Takakazu Momozuka, General Manager, Finance &
Accounting Department of Administration Group Places where the document to be filed
is available for public inspection: Tokyo Stock Exchange, Inc.
(2-1, Nihonbashi-kabutocho, Chuo-ku, Tokyo, Japan)

- 3 -
TABLE OF CONTENTS
Consolidated Financial Statements for the three-month-period ended December 31, 2009
and December 31, 2008 (in English)
1) Consolidated balance sheets (Unaudited) 2) Consolidated statements of operations (Unaudited) 3) Consolidated statements of cash flows (Unaudited) 4) Notes to Consolidated Financial Statements (Unaudited)
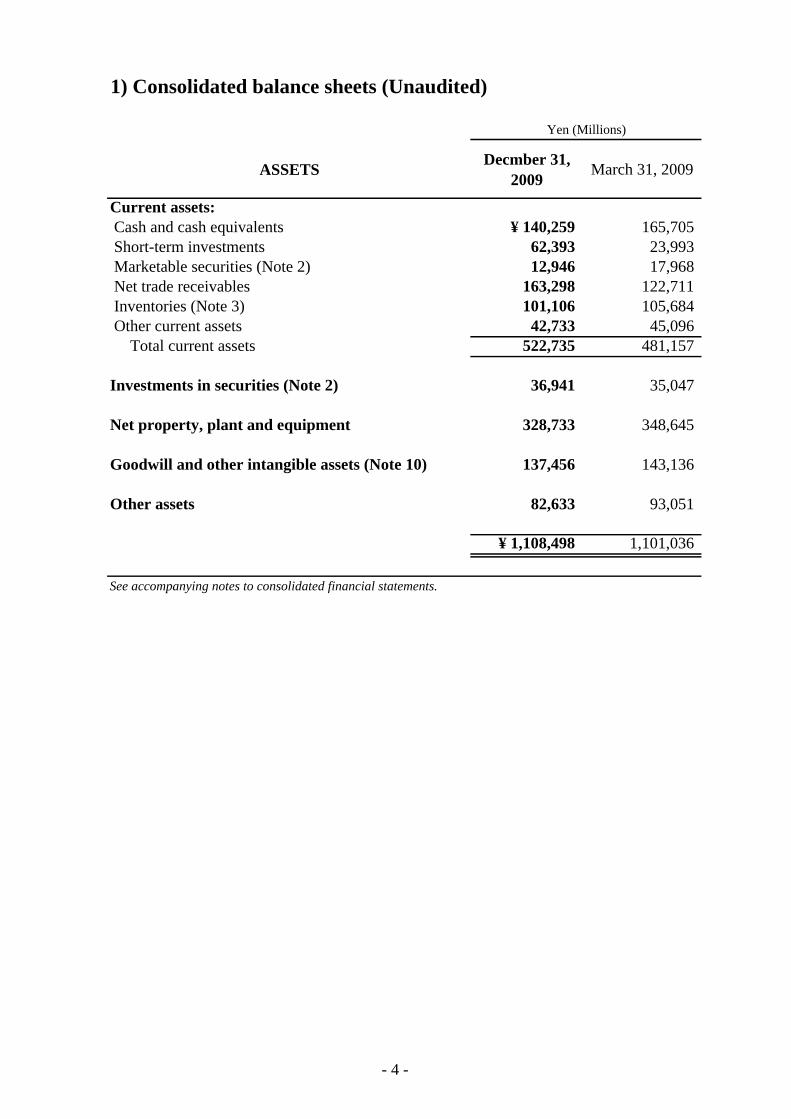
ASSETS Decmber 31,2009 March 31, 2009
Current assets: Cash and cash equivalents ¥ 140,259 165,705 Short-term investments 62,393 23,993 Marketable securities (Note 2) 12,946 17,968 Net trade receivables 163,298 122,711 Inventories (Note 3) 101,106 105,684 Other current assets 42,733 45,096 Total current assets 522,735 481,157
Investments in securities (Note 2) 36,941 35,047
Net property, plant and equipment 328,733 348,645
Goodwill and other intangible assets (Note 10) 137,456 143,136
Other assets 82,633 93,051
¥ 1,108,498 1,101,036
See accompanying notes to consolidated financial statements.
Yen (Millions)
1) Consolidated balance sheets (Unaudited)
- 4 -

LIABILITIES AND EQUITY December 31,2009 March 31, 2009
Current liabilities: Short-term debt ¥ 74,990 71,049 Current installments of long-term debt 9,385 3,497 Trade payables 82,373 50,970 Accrued expenses (Note 9) 57,605 63,314 Other current liabilities 10,543 10,791 Total current liabilities 234,896 199,621
Long-term debt, excluding current installments 203,973 210,083
Retirement and severance benefits 99,451 98,007
Other noncurrent liabilities 29,759 30,284
Total liabilities 568,079 537,995
Stockholders’ equity (Note 11) : Common stock Authorized 480,000,000 shares; issued 129,590,659 shares
at December 31, 2009 and March 31, 2009 32,641 32,641 Additional paid-in capital 61,276 64,257 Legal reserve 21,677 20,772 Retained earnings 603,003 605,622 Accumulated
other comprehensive income (loss) (Note 12) (177,384) (162,741) Treasury stock at cost; 598,687 shares at December 31, 2009
and 611,272 shares at March 31, 2009 (6,191) (6,333) Total stockholders’ equity 535,022 554,218 Noncontrolling interests (Note 11) 5,397 8,823 Total equity (Note 11) 540,419 563,041
¥ 1,108,498 1,101,036
Yen (Millions)
- 5 -
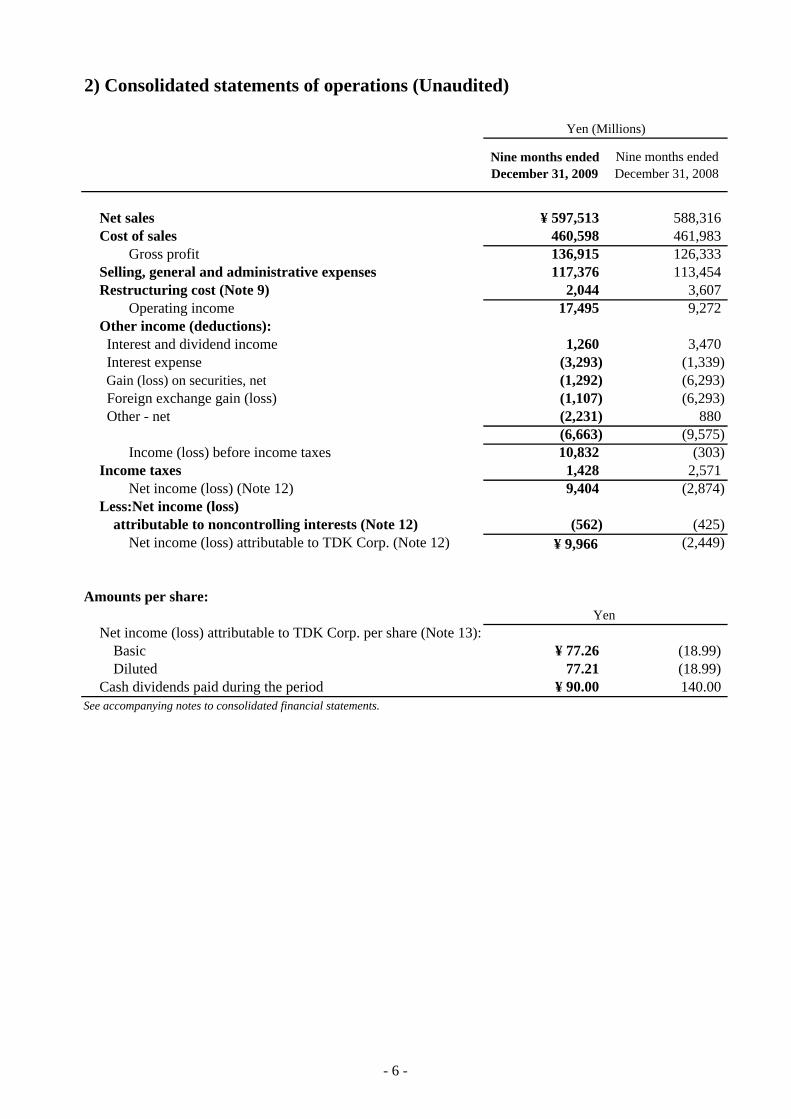
2) Consolidated statements of operations (Unaudited)
Nine months endedDecember 31, 2009
Nine months endedDecember 31, 2008
Net sales ¥ 597,513 588,316 Cost of sales 460,598 461,983
Gross profit 136,915 126,333 Selling, general and administrative expenses 117,376 113,454 Restructuring cost (Note 9) 2,044 3,607
Operating income 17,495 9,272 Other income (deductions): Interest and dividend income 1,260 3,470 Interest expense (3,293) (1,339) Gain (loss) on securities, net (1,292) (6,293) Foreign exchange gain (loss) (1,107) (6,293) Other - net (2,231) 880
(6,663) (9,575) Income (loss) before income taxes 10,832 (303)
Income taxes 1,428 2,571 Net income (loss) (Note 12) 9,404 (2,874)
Less:Net income (loss) attributable to noncontrolling interests (Note 12) (562) (425)
Net income (loss) attributable to TDK Corp. (Note 12) ¥ 9,966 (2,449)
Amounts per share:
Net income (loss) attributable to TDK Corp. per share (Note 13):Basic ¥ 77.26 (18.99) Diluted 77.21 (18.99)
Cash dividends paid during the period ¥ 90.00 140.00 See accompanying notes to consolidated financial statements.
Yen (Millions)
Yen
- 6 -

Three months endedDecember 31, 2009
Three months endedDecember 31, 2008
Net sales ¥ 211,662 191,779 Cost of sales 158,167 154,427
Gross profit 53,495 37,352 Selling, general and administrative expenses 41,535 38,854 Restructuring cost (Note 9) (133) 3,607
Operating income (loss) 12,093 (5,109) Other income (deductions): Interest and dividend income 336 1,293 Interest expense (923) (1,061) Gain (loss) on securities, net (1,037) (5,251) Foreign exchange gain (loss) 641 (4,535) Other - net (1,231) (466)
(2,214) (10,020) Income (loss) before income taxes 9,879 (15,129)
Income taxes 1,054 (667) Net income (loss) (Note 12) 8,825 (14,462)
Less:Net income (loss) attributable to noncontrolling interests (Note 12) (1) (145)
Net income (loss) attributable to TDK Corp. (Note 12) ¥ 8,826 (14,317)
Amounts per share:
Net income (loss) attributable to TDK Corp. per share (Note 13):Basic ¥ 68.42 (111.00) Diluted 68.37 (111.00)
Cash dividends paid during the period ¥ 30.00 70.00 See accompanying notes to consolidated financial statements.
Yen (Millions)
Yen
- 7 -

Nine months endedDecember 31, 2009
Nine months endedDecember 31, 2008
Cash flows from operating activities: Net income (loss) ¥ 9,404 (2,874) Adjustments to reconcile net income to net cash provided by operating activities: Depreciation and amortization 62,711 61,189 Loss (gain) on securities, net 1,292 6,293 Changes in assets and liabilities, net of effects of acquisition of businesses: Decrease (increase) in trade receivables (45,983) 28,985 Decrease (increase) in inventories 2,480 (12,057) Increase (decrease) in trade payables 34,637 (15,851) Increase (decrease) in accrued expenses 2,674 (5,666) Increase (decrease) in changes in other assets and liabilities, net 6,866 (14,671) Other - net 4,556 6,124Net cash provided by operating activities 78,637 51,472
Cash flows from investing activities: Capital expenditures (48,335) (86,783) Proceeds from sale and maturity of short-term investments 81,352 5,330 Payment for purchase of short-term investments (121,444) (13,365) Proceeds from sale and maturity of investments in securities 15,254 4,319 Payment for purchase of investments in securities (11,275) (826) Acquisition of subsidiaries, net of cash acquired - (131,301) Repayment of deposits for investments 6,912 - Other - net 7 2,026Net cash used in investing activities (77,529) (220,600)
Cash flows from financing activities: Repayment of long-term debt (5,140) (1,590) Increase (decrease) in short-term debt, net 2,756 218,040 Dividends paid (11,609) (18,056) Acquisition of noncontrolling interests (7,228) (166) Other - net 1,214 470Net cash provided by (used in) financing activities (20,007) 198,698
Effect of exchange rate changes on cash and cash equivalents (6,547) (18,468)Net increase (decrease) in cash and cash equivalents (25,446) 11,102Cash and cash equivalents at beginning of period 165,705 166,105 Cash and cash equivalents at end of period ¥ 140,259 177,207
See accompanying notes to consolidated financial statements.
3) Consolidated statements of cash flows (Unaudited)
Yen (Millions)
- 8 -
- 9 -
4) Notes to Consolidated Financial Statements (Unaudited) 1. Summary of Significant Accounting Policies (a) Basis of Presentation
TDK and most of its domestic subsidiaries maintain their books of account in conformity with financial accounting standards of Japan, and its foreign subsidiaries mainly in conformity with those of the countries of their domicile.
The consolidated financial statements presented herein reflect certain adjustments, not recorded on the primary books of TDK and subsidiaries, to present the financial position, results of operations, and cash flows in conformity with U.S. generally accepted accounting principles (the “U.S. GAAP”). (b) Consolidation Policy
The consolidated financial statements include the accounts of TDK, its subsidiaries and those variable interest entities where TDK is the primary beneficiary under U.S. GAAP. All significant intercompany accounts and transactions have been eliminated in consolidation.
The investments in affiliates in which TDK’s ownership is 20 percent to 50 percent and where TDK exercises significant influence over their operating and financial policies are accounted for by the equity method. All significant intercompany profits from these affiliates have been eliminated. (c) Adoption of New Accounting Standards
“Generally Accepted Accounting Principles” TDK adopted Financial Accounting Standards Board (“FASB”) Accounting Standards
Codification (“ASC”) 105, “Generally Accepted Accounting Principles” during the second quarter beginning on July 1, 2009. ASC 105 establishes ASC as the sole source for authoritative U.S. GAAP, except for rules and interpretive releases issued by U.S. Securities and Exchange Commission (“SEC”). Accordingly, the references to accounting standards in Notes to Consolidated Financial Statements are based on ASC. The adoption of ASC 105 did not have a material impact on TDK’s financial position and results of operations.
“Business Combinations” TDK adopted FASB ASC 805 “Business Combinations” (Former FASB Statement of
Financial Accounting Standards (“SFAS”) No.141(R), “Business Combinations”) on April 1, 2009. ASC 805 establishes principles and requirements for how an acquirer recognizes and measures in its financial statements the identifiable assets acquired, the liabilities assumed, any noncontrolling interest in the acquiree and the goodwill acquired. ASC 805 also establishes disclosure requirements to enable the evaluation of the nature and financial effects of the business combination. The adoption of ASC 805 did not have a material impact on TDK’s financial position and results of operations.
“Noncontrolling Interests in Consolidated Financial Statements” TDK adopted FASB ASC 810 “Consolidation” (Former FASB SFAS No. 160,
“Noncontrolling Interests in Consolidated Financial Statements—an amendment of ARB No. 51”) on April 1, 2009. ASC 810 establishes accounting and reporting standards for ownership interests in subsidiaries held by parties other than the parent, the amount of consolidated net income attributable to the parent and to the noncontrolling interest, changes in a parent’s ownership interest, and the valuation of a retained noncontrolling equity investment when a subsidiary is deconsolidated. ASC 810 also establishes disclosure requirements that clearly identify and distinguish between the interests of the parent and the interests of the noncontrolling owners.
- 10 -
Upon the adoption of ASC 810, minority interests, which were previously shown between liabilities and stockholders’ equity on the consolidated balance sheets, are now included in total equity as noncontrolling interests. TDK also has changed the presentation of its consolidated statements of operations and consolidated statements of cash flows. Certain reclassifications have been made to the prior year’s consolidated financial statements to conform to the presentation used for the nine-month and three-month ended December 31, 2009. The adoption of ASC 810 did not have a material impact on TDK’s financial position and results of operations.
“Fair Value Measurements” FASB ASC 820 “Fair Value Measurements and Disclosures” (Former FASB Staff
Positions No. FAS 157-2 (“FSP FAS 157-2”), “Effective Date of FASB Statement No. 157”) delayed the effective date of ASC 820 for one year for all nonfinancial assets and nonfinancial liabilities, except for items that are recognized or disclosed at fair value in the financial statements on a nonrecurring basis, until the beginning of the first quarter of the year ending March 31, 2010.
TDK adopted ASC 820 for all nonfinancial assets and nonfinancial liabilities in the first quarter for the year ending March 31, 2010. The adoption of ASC 820 did not have a material impact on TDK’s consolidated financial position and results of operations. The required disclosures in accordance with ASC 820 are presented in Note 8 of the Notes to Consolidated Financial Statements.
“Subsequent Events” TDK adopted FASB ASC 855 “Subsequent Events” (Former FASB SFAS No. 165,
“Subsequent Events”) during the first quarter beginning on April 1, 2009. ASC 855 requires an entity that has a current expectation of widely distributing its financial statements to its shareholders and other financial statement users (including a public entity) to evaluate subsequent events through the date that the financial statements are issued and disclose when the date is. TDK has evaluated subsequent events through the date and time the financial statements were issued on February 15, 2010. (d) Reclassifications
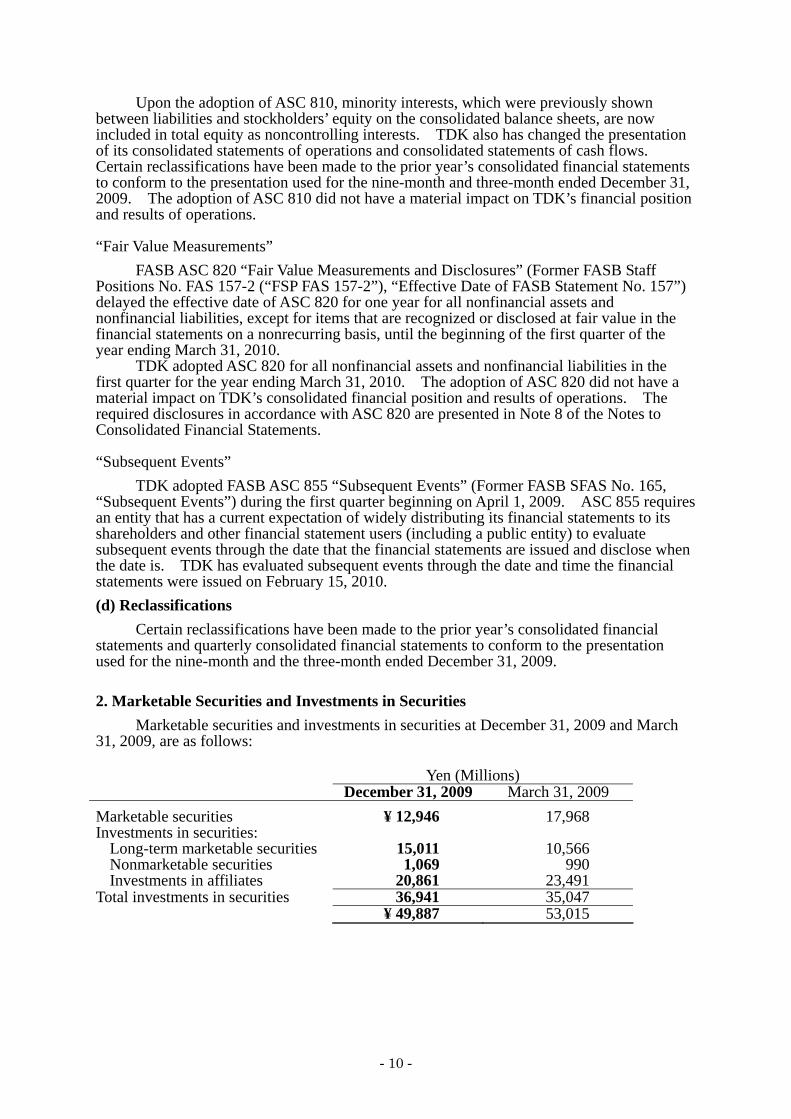
Certain reclassifications have been made to the prior year’s consolidated financial statements and quarterly consolidated financial statements to conform to the presentation used for the nine-month and the three-month ended December 31, 2009. 2. Marketable Securities and Investments in Securities
Marketable securities and investments in securities at December 31, 2009 and March 31, 2009, are as follows:
Yen (Millions) December 31, 2009 March 31, 2009 Marketable securities ¥ 12,946 17,968 Investments in securities:
Long-term marketable securities 15,011 10,566 Nonmarketable securities 1,069 990 Investments in affiliates 20,861 23,491
Total investments in securities 36,941 35,047 ¥ 49,887 53,015

- 11 -
Marketable securities and investments in securities include available-for-sale securities. Information with respect to such securities at December 31, 2009 and March 31, 2009, are as follows: As of December 31, 2009
Yen (Millions): Cost
Gross Unrealized Holding Gains
Gross Unrealized Holding Losses
Fair Value
Equity securities ¥ 10,021 2,403 198 12,226 Debt securities 14,733 125 3 14,855 Investment trusts 845 31 - 876
¥ 25,599 2,559 201 27,957 As of March 31, 2009
Yen (Millions): Cost
Gross Unrealized Holding Gains
Gross Unrealized Holding Losses
Fair Value
Equity securities ¥ 12,420 482 3,029 9,873 Debt securities 18,659 3 1 18,661
¥ 31,079 485 3,030 28,534
Debt securities classified as available-for-sale at December 31, 2009 have a weighted average remaining term of 0.8 years.
The proceeds from sale and maturity of available-for-sale securities are ¥15,254 million and ¥14,197 million for the nine-month and the three-month ended December 31, 2009, respectively. The gross realized gains on the sale and settlement of available-for-sale securities are ¥247 million and ¥189 million for the nine-month and the three-month ended December 31, 2009, respectively. The cost of available-for-sale securities sold was determined on average cost basis. TDK recorded an impairment of ¥1,418 million and ¥1,105 million on certain available-for-sale securities and nonmarketable securities representing other-than-temporary declines in the fair value for the nine-month and the three-month ended December 31, 2009, respectively.
At December 31, 2009, all of the available-for-sale securities with unrealized losses had been in a continuous unrealized loss position for less than 12 months.
The aggregate cost of nonmarketable securities accounted for under the cost method at December 31, 2009 totaled ¥1,069 million and those securities as of December 31, 2009 were not evaluated for impairment because (a) TDK did not estimate the fair value of those investments as it was not practicable to estimate the fair value of the investment and (b) TDK did not identify any events or changes in circumstances that might have had significant adverse effect on the fair value of those investments.
As of December 31, 2009, certain debt securities in the amount of ¥997 million were pledged as collateral for extended custom duty payments to Tokyo Customs.
- 12 -
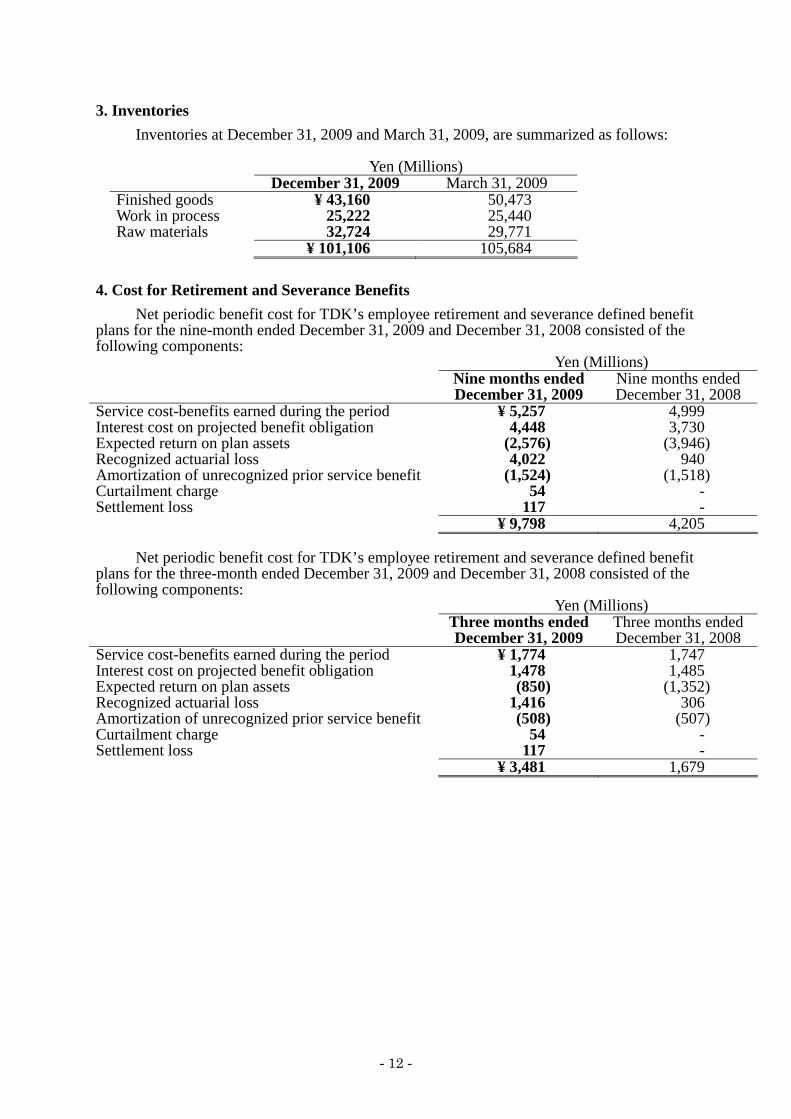
3. Inventories Inventories at December 31, 2009 and March 31, 2009, are summarized as follows:
Yen (Millions)
December 31, 2009 March 31, 2009 Finished goods ¥ 43,160 50,473 Work in process 25,222 25,440 Raw materials 32,724 29,771 ¥ 101,106 105,684
4. Cost for Retirement and Severance Benefits
Net periodic benefit cost for TDK’s employee retirement and severance defined benefit plans for the nine-month ended December 31, 2009 and December 31, 2008 consisted of the following components: Yen (Millions) Nine months ended
December 31, 2009 Nine months ended December 31, 2008
Service cost-benefits earned during the period ¥ 5,257 4,999 Interest cost on projected benefit obligation 4,448 3,730 Expected return on plan assets (2,576) (3,946) Recognized actuarial loss 4,022 940 Amortization of unrecognized prior service benefit (1,524) (1,518) Curtailment charge 54 - Settlement loss 117 - ¥ 9,798 4,205
Net periodic benefit cost for TDK’s employee retirement and severance defined benefit plans for the three-month ended December 31, 2009 and December 31, 2008 consisted of the following components: Yen (Millions) Three months ended
December 31, 2009 Three months ended December 31, 2008
Service cost-benefits earned during the period ¥ 1,774 1,747 Interest cost on projected benefit obligation 1,478 1,485 Expected return on plan assets (850) (1,352) Recognized actuarial loss 1,416 306 Amortization of unrecognized prior service benefit (508) (507) Curtailment charge 54 - Settlement loss 117 - ¥ 3,481 1,679
- 13 -
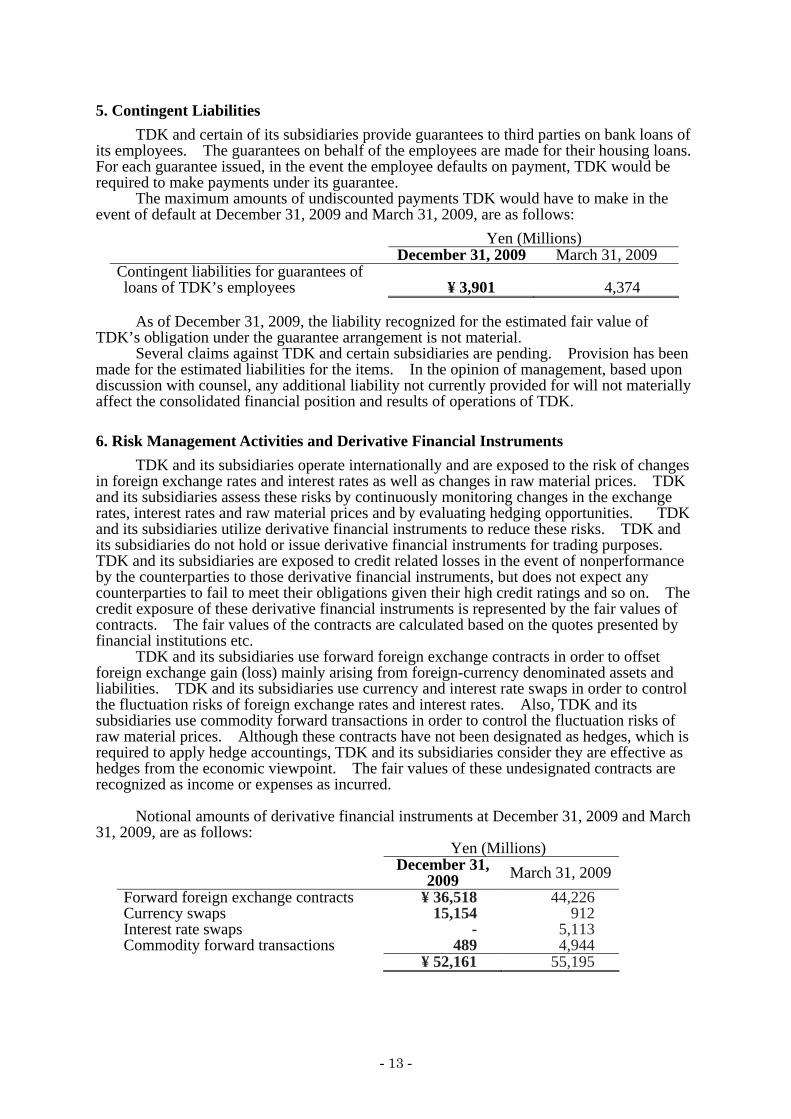
5. Contingent Liabilities TDK and certain of its subsidiaries provide guarantees to third parties on bank loans of
its employees. The guarantees on behalf of the employees are made for their housing loans. For each guarantee issued, in the event the employee defaults on payment, TDK would be required to make payments under its guarantee.
The maximum amounts of undiscounted payments TDK would have to make in the event of default at December 31, 2009 and March 31, 2009, are as follows:
Yen (Millions) December 31, 2009 March 31, 2009 Contingent liabilities for guarantees of loans of TDK’s employees ¥ 3,901 4,374
As of December 31, 2009, the liability recognized for the estimated fair value of
TDK’s obligation under the guarantee arrangement is not material. Several claims against TDK and certain subsidiaries are pending. Provision has been
made for the estimated liabilities for the items. In the opinion of management, based upon discussion with counsel, any additional liability not currently provided for will not materially affect the consolidated financial position and results of operations of TDK. 6. Risk Management Activities and Derivative Financial Instruments
TDK and its subsidiaries operate internationally and are exposed to the risk of changes in foreign exchange rates and interest rates as well as changes in raw material prices. TDK and its subsidiaries assess these risks by continuously monitoring changes in the exchange rates, interest rates and raw material prices and by evaluating hedging opportunities. TDK and its subsidiaries utilize derivative financial instruments to reduce these risks. TDK and its subsidiaries do not hold or issue derivative financial instruments for trading purposes. TDK and its subsidiaries are exposed to credit related losses in the event of nonperformance by the counterparties to those derivative financial instruments, but does not expect any counterparties to fail to meet their obligations given their high credit ratings and so on. The credit exposure of these derivative financial instruments is represented by the fair values of contracts. The fair values of the contracts are calculated based on the quotes presented by financial institutions etc.
TDK and its subsidiaries use forward foreign exchange contracts in order to offset foreign exchange gain (loss) mainly arising from foreign-currency denominated assets and liabilities. TDK and its subsidiaries use currency and interest rate swaps in order to control the fluctuation risks of foreign exchange rates and interest rates. Also, TDK and its subsidiaries use commodity forward transactions in order to control the fluctuation risks of raw material prices. Although these contracts have not been designated as hedges, which is required to apply hedge accountings, TDK and its subsidiaries consider they are effective as hedges from the economic viewpoint. The fair values of these undesignated contracts are recognized as income or expenses as incurred.
Notional amounts of derivative financial instruments at December 31, 2009 and March
31, 2009, are as follows: Yen (Millions)
December 31, 2009 March 31, 2009
Forward foreign exchange contracts ¥ 36,518 44,226 Currency swaps 15,154 912 Interest rate swaps - 5,113 Commodity forward transactions 489 4,944
¥ 52,161 55,195
- 14 -
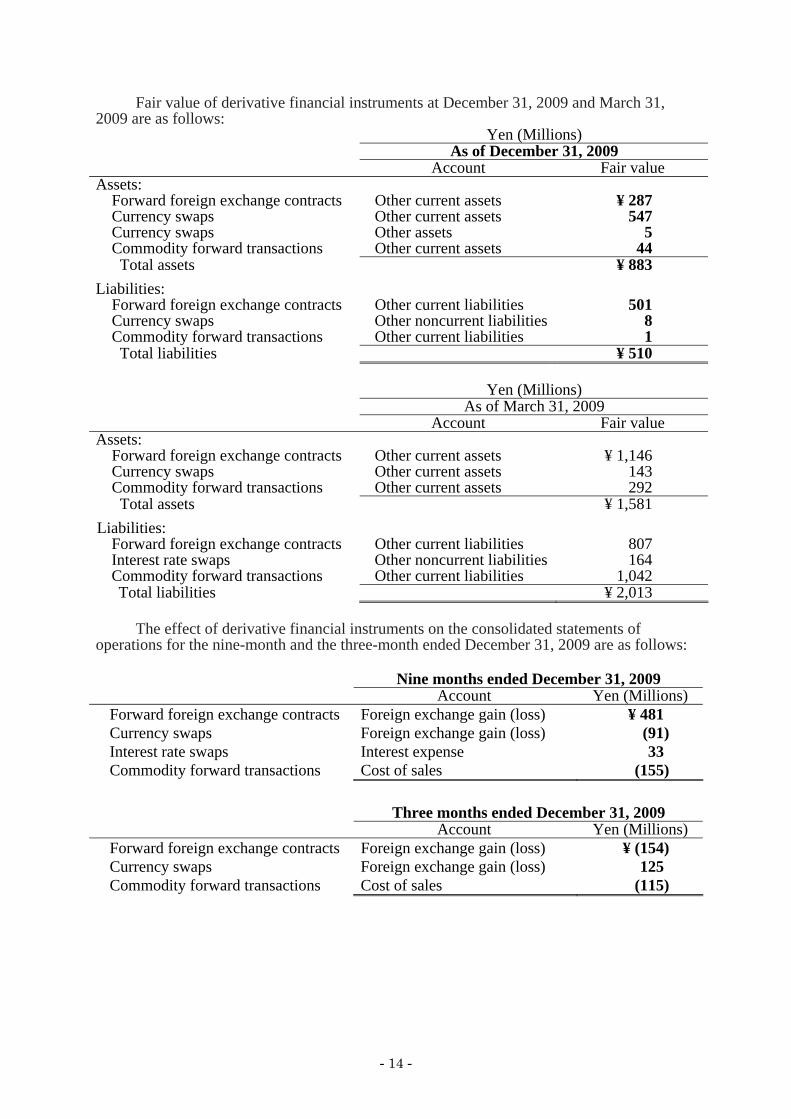
Fair value of derivative financial instruments at December 31, 2009 and March 31, 2009 are as follows:
Yen (Millions) As of December 31, 2009 Account Fair value
Assets: Forward foreign exchange contracts Other current assets ¥ 287 Currency swaps Other current assets 547 Currency swaps Other assets 5 Commodity forward transactions Other current assets 44 Total assets ¥ 883
Liabilities: Forward foreign exchange contracts Other current liabilities 501 Currency swaps Other noncurrent liabilities 8 Commodity forward transactions Other current liabilities 1 Total liabilities ¥ 510
Yen (Millions) As of March 31, 2009 Account Fair value
Assets: Forward foreign exchange contracts Other current assets ¥ 1,146 Currency swaps Other current assets 143 Commodity forward transactions Other current assets 292 Total assets ¥ 1,581
Liabilities: Forward foreign exchange contracts Other current liabilities 807 Interest rate swaps Other noncurrent liabilities 164 Commodity forward transactions Other current liabilities 1,042 Total liabilities ¥ 2,013
The effect of derivative financial instruments on the consolidated statements of
operations for the nine-month and the three-month ended December 31, 2009 are as follows:
Nine months ended December 31, 2009 Account Yen (Millions)
Forward foreign exchange contracts Foreign exchange gain (loss) ¥ 481 Currency swaps Foreign exchange gain (loss) (91) Interest rate swaps Interest expense 33 Commodity forward transactions Cost of sales (155)
Three months ended December 31, 2009 Account Yen (Millions)
Forward foreign exchange contracts Foreign exchange gain (loss) ¥ (154) Currency swaps Foreign exchange gain (loss) 125 Commodity forward transactions Cost of sales (115)
- 15 -
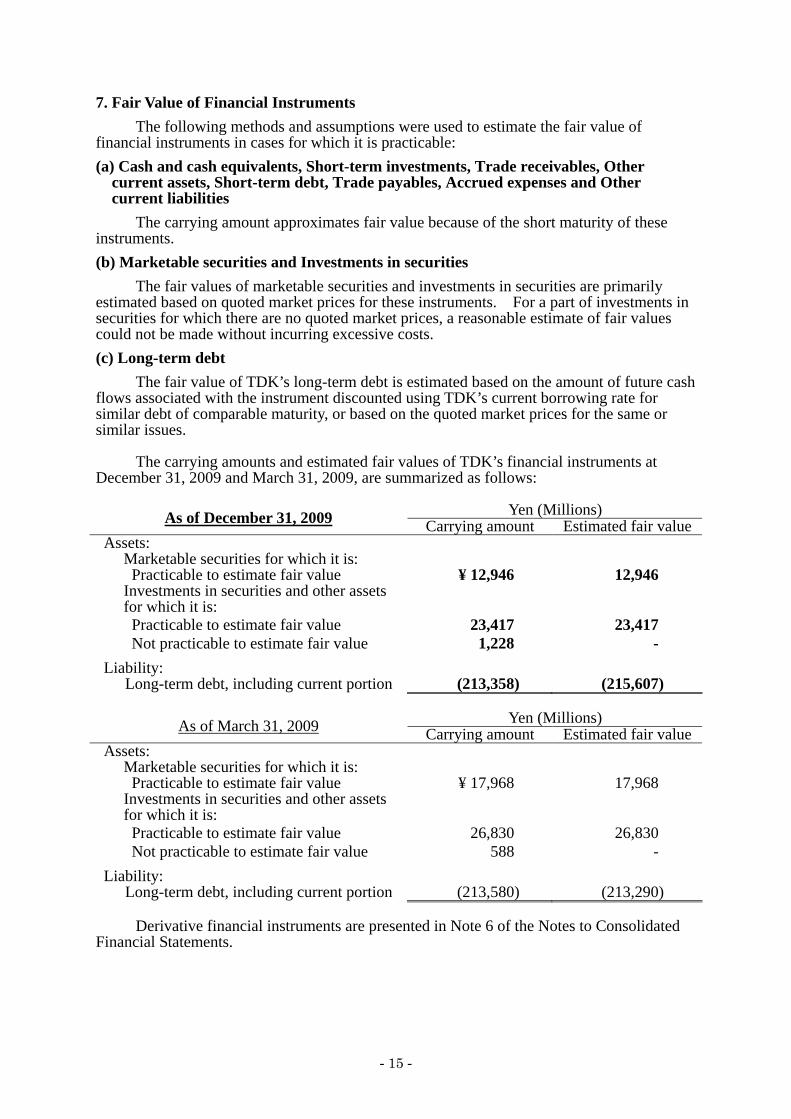
7. Fair Value of Financial Instruments The following methods and assumptions were used to estimate the fair value of
financial instruments in cases for which it is practicable: (a) Cash and cash equivalents, Short-term investments, Trade receivables, Other
current assets, Short-term debt, Trade payables, Accrued expenses and Other current liabilities
The carrying amount approximates fair value because of the short maturity of these instruments. (b) Marketable securities and Investments in securities
The fair values of marketable securities and investments in securities are primarily estimated based on quoted market prices for these instruments. For a part of investments in securities for which there are no quoted market prices, a reasonable estimate of fair values could not be made without incurring excessive costs. (c) Long-term debt
The fair value of TDK’s long-term debt is estimated based on the amount of future cash flows associated with the instrument discounted using TDK’s current borrowing rate for similar debt of comparable maturity, or based on the quoted market prices for the same or similar issues.
The carrying amounts and estimated fair values of TDK’s financial instruments at
December 31, 2009 and March 31, 2009, are summarized as follows:
Yen (Millions) As of December 31, 2009 Carrying amount Estimated fair valueAssets:
Marketable securities for which it is: Practicable to estimate fair value ¥ 12,946 12,946
Investments in securities and other assets for which it is:
Practicable to estimate fair value 23,417 23,417 Not practicable to estimate fair value 1,228 -
Liability: Long-term debt, including current portion (213,358) (215,607)
Yen (Millions) As of March 31, 2009 Carrying amount Estimated fair value
Assets: Marketable securities for which it is: Practicable to estimate fair value ¥ 17,968 17,968
Investments in securities and other assets for which it is:
Practicable to estimate fair value 26,830 26,830 Not practicable to estimate fair value 588 -
Liability: Long-term debt, including current portion (213,580) (213,290)
Derivative financial instruments are presented in Note 6 of the Notes to Consolidated
Financial Statements.

- 16 -
Limitations Fair value estimates are made at a specific point in time, based on relevant market
information and information about the financial instruments. These estimates are subjective in nature and involve uncertainties and matters of significant judgment and therefore cannot be determined with precision. Changes in assumptions could significantly affect the estimates. 8. Fair Value Measurements
FASB ASC 820 “Fair Value Measurements and Disclosures” defines fair value as the price that would be received to sell an asset or paid to transfer a liability in an orderly transaction between market participants at the measurement date in the principal or most advantageous market for the asset or liability. ASC 820 establishes a three-level fair value hierarchy for material inputs used in measuring fair value as follows:
Level 1: Quoted prices (unadjusted) in active markets for identical assets or liabilities that
TDK has the ability to access at the measurement date. Level 2: Inputs other than quoted prices included within Level 1 that are observable for the
asset or liability, either directly or indirectly. Level 3: Unobservable inputs for the asset or liability.
Assets and liabilities that are measured at fair value on a recurring basis
Assets and liabilities that are measured at fair value on a recurring basis as of
December 31, 2009 are as follows: Yen (Millions) As of December 31, 2009 Level 1 Level 2 Level 3 Total
Assets: Marketable securities:
Debt securities ¥ 12,946 - - ¥ 12,946 Derivative contracts - 883 - 883 Long-term marketable securities:
Debt securities 1,003 906 - 1,909 Equity securities 12,226 - - 12,226 Investment trusts 876 - - 876
Trust investments 3,613 - - 3,613 Total ¥ 30,664 1,789 - ¥ 32,453
Liabilities: Derivative contracts ¥ - 510 - ¥ 510
Total ¥ - 510 - ¥ 510 Level 1 marketable securities and long-term marketable securities that are mainly listed
shares are valued using unadjusted quoted prices in active markets in which transactions occur with sufficient frequency and volume. Trust investments included in other assets in which a part of employees’ salary is deposited is valued using unadjusted quoted prices in active markets same as above.
Level 2 derivative contracts include forward foreign exchange contracts, currency swaps and commodity forward transactions and are valued based on quotes obtained from counterparties and are verified using observable market inputs, such as foreign currency exchange rates and inputs from commodities markets. Long-term marketable securities consist of commercial papers and the fair values thereof are based on the third-party assessment using observable market data.
- 17 -
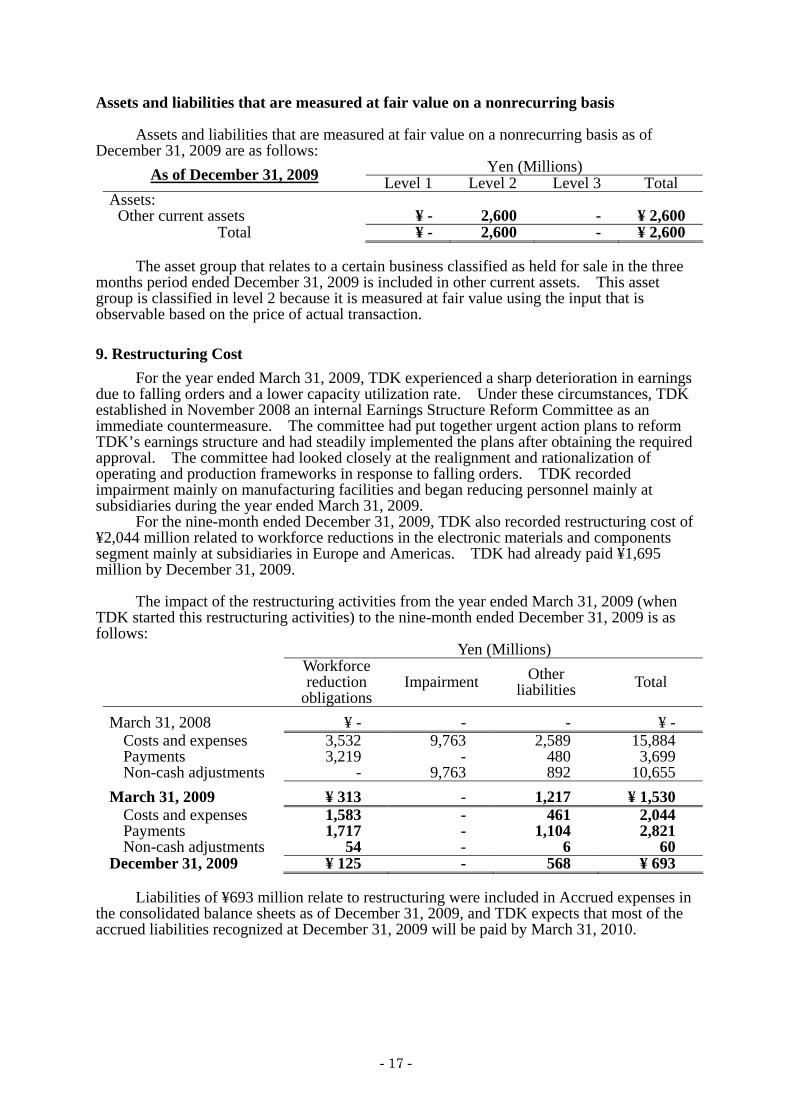
Assets and liabilities that are measured at fair value on a nonrecurring basis Assets and liabilities that are measured at fair value on a nonrecurring basis as of
December 31, 2009 are as follows: Yen (Millions) As of December 31, 2009 Level 1 Level 2 Level 3 Total
Assets: Other current assets ¥ - 2,600 - ¥ 2,600
Total ¥ - 2,600 - ¥ 2,600 The asset group that relates to a certain business classified as held for sale in the three
months period ended December 31, 2009 is included in other current assets. This asset group is classified in level 2 because it is measured at fair value using the input that is observable based on the price of actual transaction. 9. Restructuring Cost
For the year ended March 31, 2009, TDK experienced a sharp deterioration in earnings due to falling orders and a lower capacity utilization rate. Under these circumstances, TDK established in November 2008 an internal Earnings Structure Reform Committee as an immediate countermeasure. The committee had put together urgent action plans to reform TDK’s earnings structure and had steadily implemented the plans after obtaining the required approval. The committee had looked closely at the realignment and rationalization of operating and production frameworks in response to falling orders. TDK recorded impairment mainly on manufacturing facilities and began reducing personnel mainly at subsidiaries during the year ended March 31, 2009.
For the nine-month ended December 31, 2009, TDK also recorded restructuring cost of ¥2,044 million related to workforce reductions in the electronic materials and components segment mainly at subsidiaries in Europe and Americas. TDK had already paid ¥1,695 million by December 31, 2009.
The impact of the restructuring activities from the year ended March 31, 2009 (when
TDK started this restructuring activities) to the nine-month ended December 31, 2009 is as follows:
Liabilities of ¥693 million relate to restructuring were included in Accrued expenses in
the consolidated balance sheets as of December 31, 2009, and TDK expects that most of the accrued liabilities recognized at December 31, 2009 will be paid by March 31, 2010.
Yen (Millions) Workforce
reduction obligations
Impairment Other liabilities Total
March 31, 2008 ¥ - - - ¥ - Costs and expenses 3,532 9,763 2,589 15,884 Payments 3,219 - 480 3,699 Non-cash adjustments - 9,763 892 10,655
March 31, 2009 ¥ 313 - 1,217 ¥ 1,530 Costs and expenses 1,583 - 461 2,044 Payments 1,717 - 1,104 2,821 Non-cash adjustments 54 - 6 60
December 31, 2009 ¥ 125 - 568 ¥ 693
- 18 -
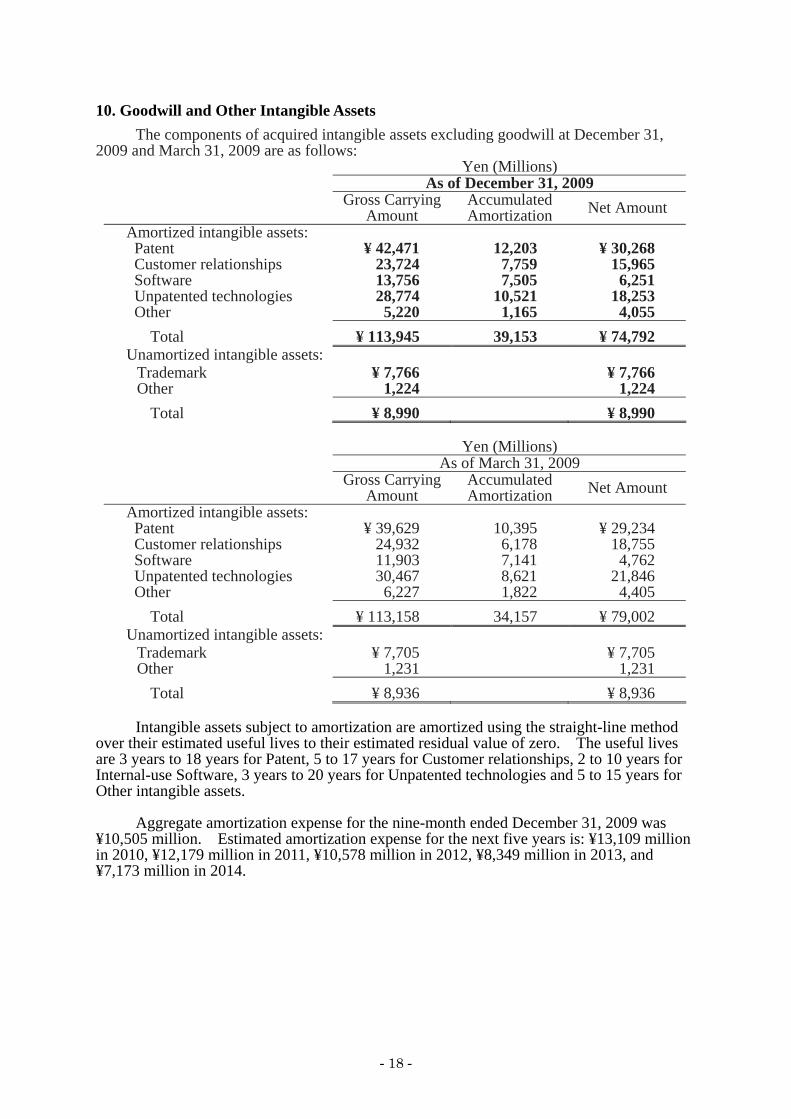
10. Goodwill and Other Intangible Assets The components of acquired intangible assets excluding goodwill at December 31,
2009 and March 31, 2009 are as follows: Yen (Millions) As of December 31, 2009 Gross Carrying
Amount Accumulated Amortization Net Amount
Amortized intangible assets: Patent ¥ 42,471 12,203 ¥ 30,268 Customer relationships 23,724 7,759 15,965 Software 13,756 7,505 6,251 Unpatented technologies 28,774 10,521 18,253 Other 5,220 1,165 4,055
Total ¥ 113,945 39,153 ¥ 74,792 Unamortized intangible assets:
Trademark ¥ 7,766 ¥ 7,766 Other 1,224 1,224
Total ¥ 8,990 ¥ 8,990
Yen (Millions) As of March 31, 2009 Gross Carrying
Amount Accumulated Amortization Net Amount
Amortized intangible assets: Patent ¥ 39,629 10,395 ¥ 29,234 Customer relationships 24,932 6,178 18,755 Software 11,903 7,141 4,762 Unpatented technologies 30,467 8,621 21,846 Other 6,227 1,822 4,405
Total ¥ 113,158 34,157 ¥ 79,002 Unamortized intangible assets:
Trademark ¥ 7,705 ¥ 7,705 Other 1,231 1,231
Total ¥ 8,936 ¥ 8,936
Intangible assets subject to amortization are amortized using the straight-line method over their estimated useful lives to their estimated residual value of zero. The useful lives are 3 years to 18 years for Patent, 5 to 17 years for Customer relationships, 2 to 10 years for Internal-use Software, 3 years to 20 years for Unpatented technologies and 5 to 15 years for Other intangible assets.
Aggregate amortization expense for the nine-month ended December 31, 2009 was
¥10,505 million. Estimated amortization expense for the next five years is: ¥13,109 million in 2010, ¥12,179 million in 2011, ¥10,578 million in 2012, ¥8,349 million in 2013, and ¥7,173 million in 2014.
- 19 -
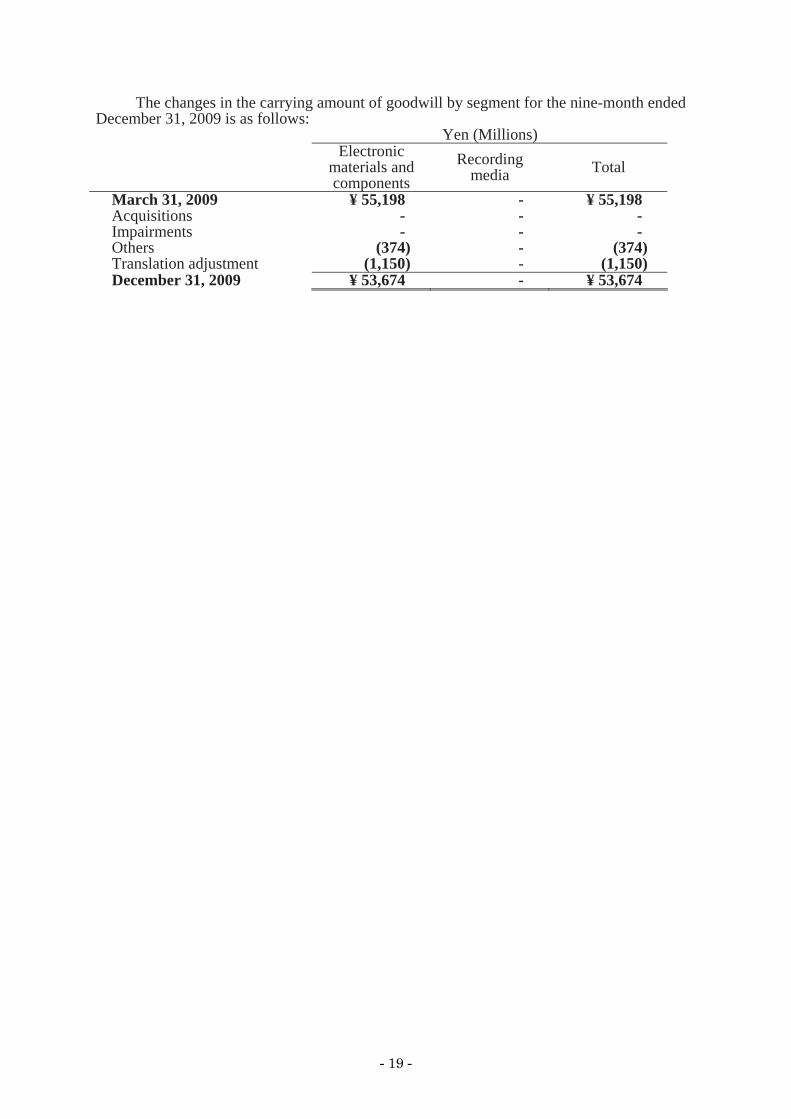
The changes in the carrying amount of goodwill by segment for the nine-month ended December 31, 2009 is as follows:
Yen (Millions) Electronic
materials and components
Recording media Total
March 31, 2009 ¥ 55,198 - ¥ 55,198 Acquisitions - - - Impairments - - - Others (374) - (374) Translation adjustment (1,150) - (1,150) December 31, 2009 ¥ 53,674 - ¥ 53,674

- 20 -
11. Equity The changes in the carrying amount of stockholders’ equity, noncontrolling interests
and total equity for the nine-month ended December 31, 2009 and December 31, 2008 are as follows:
Yen (Millions) Stockholders’
equity Noncontrolling
interests Total equity
March 31, 2009 ¥ 554,218 8,823 ¥ 563,041 Equity transaction of consolidated subsidiaries and other
(2,910)
(2,554)
(5,464)
Comprehensive income (loss): Net income (loss) 9,966 (562) 9,404 Other comprehensive income (loss), net of tax:
Foreign currency translation adjustments
(18,908)
(183)
(19,091)
Pension liability adjustments 1,208 (12) 1,196 Net unrealized gains (losses) on
securities
3,057
-
3,057 Other comprehensive income (loss), net of tax
(14,643)
(195)
(14,838)
Total comprehensive income (loss), net of tax:
(4,677)
(757)
(5,434)
Dividends (11,609) (115) (11,724) December 31, 2009 ¥ 535,022 5,397 ¥ 540,419
Yen (Millions) Stockholders’
equity Noncontrolling
interests Total equity
March 31, 2008 ¥ 716,577 3,684 ¥ 720,261 Acquisition of subsidiaries and other 397 5,539 5,936
Comprehensive income (loss): Net income (loss) (2,449) (425) (2,874) Other comprehensive income (loss), net of tax:
Foreign currency translation adjustments
(59,261)
(304)
(59,565)
Pension liability adjustments (1,994) 8 (1,986) Net unrealized gains (losses) on
securities
229
-
229 Other comprehensive income (loss), net of tax
(61,026)
(296)
(61,322)
Total comprehensive income (loss), net of tax:
(63,475)
(721)
(64,196)
Dividends (18,056) (33) (18,089) December 31, 2008 ¥ 635,443 8,469 ¥ 643,912

- 21 -
Net income attributable to TDK Corp. and transfers (to) from noncontrolling interest for the nine-month ended December 31, 2009 is as follows:
Yen (Millions) Nine months ended
December 31, 2009 Net income attributable to TDK Corp. ¥ 9,966 Increase in TDK Corp.’s paid-in capital for purchase of
7,200,000 TDK Philippines Corp. common shares
94 Decrease in TDK Corp.’s paid-in capital for purchase of
2,000 TDK-Lambda (Thailand) Co., Ltd. common shares
(24) Increase in TDK Corp.’s paid-in capital for allocation of
4,150 TDK Micro Devices Corp. new common shares to a third party
8 Decrease in TDK Corp.’s paid-in capital for purchase of
2,785,206 EPCOS AG common shares
(3,242) Net transfers (to) from noncontrolling interest (3,164) Change from net income attributable to TDK Corp. and
transfers (to) from noncontrolling interest
¥ 6,802 12. Comprehensive Income (Loss)
Comprehensive income (loss) for the nine-month ended December 31, 2009 and December 31, 2008 are as follows: Yen (Millions) Nine months ended
December 31, 2009 Nine months ended December 31, 2008
Net income (loss) ¥ 9,404 (2,874) Other comprehensive income (loss), net of tax:
Foreign currency translation adjustments (19,091) (59,565) Pension liability adjustments 1,196 (1,986) Net unrealized gains (losses) on securities 3,057 229
Other comprehensive income (loss), net of tax (14,838) (61,322) Comprehensive income (loss) (5,434) (64,196)
Comprehensive income (loss) attributable to non- controlling interests (757) (721)
Comprehensive income (loss) attributable to TDK Corp. ¥ (4,677) (63,475)
Comprehensive income (loss) for the three-month ended December 31, 2009 and December 31, 2008 are as follows: Yen (Millions) Three months ended
December 31, 2009 Three months endedDecember 31, 2008
Net income (loss) ¥ 8,825 (14,462) Other comprehensive income (loss), net of tax:
Foreign currency translation adjustments 8,092 (68,630) Pension liability adjustments 805 (1,680) Net unrealized gains (losses) on securities 834 511
Other comprehensive income (loss), net of tax 9,731 (69,799) Comprehensive income (loss) 18,556 (84,261)
Comprehensive income (loss) attributable to non- controlling interests 54 (484)
Comprehensive income (loss) attributable to TDK Corp. ¥ 18,502 (83,777)

- 22 -
13. Net Income (Loss) Attributable to TDK Corp. per Share A reconciliation of the numerators and denominators of the basic and diluted net
income (loss) attributable to TDK Corp. per share computations are as follows:
Yen (Millions) Nine months ended
December 31, 2009 Nine months ended December 31, 2008
Net income (loss) attributable to TDK Corp. ¥ 9,966 (2,449) Number of shares (Thousands) Nine months ended
December 31, 2009 Nine months ended December 31, 2008
Weighted average common shares outstanding – Basic
128,986
128,972
Effect of dilutive stock options 95 - Weighted average common shares
outstanding – Diluted
129,081
128,972 Yen Nine months ended
December 31, 2009 Nine months ended December 31, 2008
Net income (loss) attributable to TDK Corp. per share:
Basic ¥ 77.26 (18.99) Diluted ¥ 77.21 (18.99)
Yen (Millions) Three months ended
December 31, 2009 Three months ended December 31, 2008
Net income (loss) attributable to TDK Corp. ¥ 8,826 (14,317) Number of shares (Thousands) Three months ended
December 31, 2009 Three months ended December 31, 2008
Weighted average common shares outstanding – Basic
128,992
128,980
Effect of dilutive stock options 102 - Weighted average common shares
outstanding – Diluted
129,094
128,980 Yen Three months ended
December 31, 2009 Three months ended December 31, 2008
Net income (loss) attributable to TDK Corp. per share:
Basic ¥ 68.42 (111.00) Diluted ¥ 68.37 (111.00)

- 23 -
14. Acquisition On October 17, 2008 (“acquisition date”), TDK acquired 36.0 percent of the issued and
outstanding common shares of EPCOS AG (“EPCOS”) by a public tender offer (“Offer”) in accordance with Business Combination Agreement (“BCA”) that TDK and EPCOS concluded on July 31, 2008.
As a result of the Offer and the acquisitions of shares outside the Offer, TDK obtained 55,993 thousand shares (84.3 percent equity interest) in EPCOS at the acquisition date, and EPCOS became a consolidated subsidiary of TDK.
EPCOS is headquartered in Munich, Germany, and is a leading manufacturer of electronic components, modules and systems. With its broad portfolio, EPCOS offers a comprehensive range of products and focuses on fast-growing and technologically demanding markets, in particular in the areas of information and communication technology, as well as automotive, industrial and consumer electronics. EPCOS and its subsidiaries have design and manufacturing locations and sales offices in Europe, Asia, and in North and South America.
TDK and EPCOS are both engaged in the electronic components business, but there is little overlap in terms of product fields or markets, and TDK expects to capture powerful synergies.
TDK acquired 23,890 thousand shares (36.0 percent equity interest) at a cost of ¥63,560 million through the Offer. Prior to the conclusion of the Offer, TDK had acquired 32,103 thousand shares of EPCOS in the market, giving it 48.3 percent equity interest at a cost of ¥79,466 million. As of the acquisition date, TDK held 55,993 thousand shares (84.3 percent equity interest) in EPCOS at a total cost of ¥143,026 million.
As a result of the successful Offer, TDK conducted an additional public tender offer from October 14, 2008 through October 27, 2008 (“Additional Offer”) in accordance with the German regulations. TDK acquired an additional 7,904 thousand shares (11.5 percent equity interest) for ¥17,858 million including shares acquired outside of the Additional Offer.
As of March 31, 2009, TDK held 63,897 thousand shares (95.8 percent equity interest) in EPCOS at a total cost of ¥163,727 million, which was paid in cash. The total cost includes direct costs of ¥2,843 million.
On October 22, 2009, the squeeze out of the shares of noncontrolling interests (4.2 percent of the issued stocks) of EPCOS as of September 30, 2009 was completed in accordance with German Stock Corporation Act, and TDK acquired 2,785 thousand shares of EPCOS in the three months period ended December 31, 2009 at a total cost of ¥6,912 million. As a result, EPCOS became a TDK’s wholly owned subsidiary.
The acquisition has been accounted for by the purchase method of accounting. TDK applied equity method of accounting prior to the acquisition date.
TDK has included the results of operations of EPCOS and its subsidiaries in its consolidated financial statements since the acquisition date.
There are no significant changes in goodwill for the nine-month ended December 31, 2009.
- 24 -
15. Subsequent Events On June 29, 2005, TDK received from the Tokyo Regional Taxation Bureau (the
“Bureau”) the correction notices based on the transfer pricing taxation that resulted in ¥21,302 million of incremental income amount, and was imposed the additional tax amounted to ¥11,960 million including the corporation tax and regional taxes. On August 26 of the same year, TDK filed a request for reinvestigation with the Bureau, and on June 29, 2007, it received a reinvestigation decision from the Bureau, rescinding ¥3,073 million of the incremental income assessed. As the result, TDK received the refund of ¥1,677 million of the corporation tax including regional taxes.
However, because the portion not permitted by the bureau still remained, TDK filed a request for reconsideration on July 26, 2007 with the National Tax Tribunal (the “Tribunal”), seeking rescission of the full amount of the portion not permitted by the Bureau. On February 1, 2010, TDK came to receive the Tribunal’s decision on the request rescinding ¥14,092 million of the incremental income assessed. As a result of the decision, TDK expects to receive a tax refund of approximately ¥9.4 billion of the total corporation tax including regional taxes by March 31, 2010, which will be recorded in consolidated statements of operations for the year ending March 31, 2010.

- 25 -
16. Segment Information (a) Industry segment information Three months ended December 31, 2009 Yen (Millions) Electronic
materials & components
Recording media Sub total Eliminations
and corporate Total
Net sales External sales ¥ 207,230 4,432 211,662 - ¥ 211,662 Intersegment - - - - -
Total 207,230 4,432 211,662 - 211,662 Operating expenses 194,184 5,385 199,569 - 199,569 Operating income (loss) ¥ 13,046 (953) 12,093 - ¥ 12,093 Three months ended December 31, 2008 Yen (Millions) Electronic
materials & components
Recording media Sub total Eliminations
and corporate Total
Net sales External sales ¥ 186,835 4,944 191,779 - ¥ 191,779 Intersegment - - - - -
Total 186,835 4,944 191,779 - 191,779 Operating expenses 191,303 5,585 196,888 - 196,888 Operating income (loss) ¥ (4,468) (641) (5,109) - ¥ (5,109) Nine months ended December 31, 2009 Yen (Millions) Electronic
materials & components
Recording media Sub total Eliminations
and corporate Total
Net sales External sales ¥ 585,316 12,197 597,513 - ¥ 597,513 Intersegment - - - - -
Total 585,316 12,197 597,513 - 597,513 Operating expenses 565,280 14,738 580,018 - 580,018 Operating income (loss) ¥ 20,036 (2,541) 17,495 - ¥ 17,495 Nine months ended December 31, 2008 Yen (Millions) Electronic
materials & components
Recording media Sub total Eliminations
and corporate Total
Net sales External sales ¥ 571,079 17,237 588,316 - ¥ 588,316 Intersegment - - - - -
Total 571,079 17,237 588,316 - 588,316 Operating expenses 559,532 19,512 579,044 - 579,044 Operating income (loss) ¥ 11,547 (2,275) 9,272 - ¥ 9,272 (Notes) 1. Segment classification
Segments are classified by the similarity of the products, the product’s character, the manufacturing method and the selling market.

- 26 -
2. Principal products in each segment Electronic materials and components: Multilayer ceramic chip capacitors, Rare-earth magnets, Ferrite cores,
Inductive devices (Coils, Transformers), Switching power supplies, HDD heads, Energy devices (Rechargeable batteries), and products manufactured and sold by the EPCOS and its subsidiaries
Recording media: Optical media (Blu-ray discs) and Tape-based data storage media for
computers (b) Geographic segment information Three months ended December 31, 2009 Yen (Millions)
Japan Americas Europe Asia and others Sub total
Elimina-tions and corporate
Total
Net sales External sales ¥ 31,889 13,672 32,512 133,589 211,662 - ¥ 211,662Intersegment 45,365 2,764 7,853 22,902 78,884 (78,884) -
Total 77,254 16,436 40,365 156,491 290,546 (78,884) 211,662Operating
expenses 75,615 21,104 45,073 136,762 278,554 (78,985) 199,569Operating
income (loss) ¥ 1,639 (4,668) (4,708) 19,729 11,992 101 ¥ 12,093 Three months ended December 31, 2008 Yen (Millions)
Japan Americas Europe Asia and others Sub total
Elimina-tions and corporate
Total
Net sales External sales ¥ 31,899 13,570 27,533 118,777 191,779 - ¥ 191,779Intersegment 37,143 9,497 5,633 18,903 71,176 (71,176) -
Total 69,042 23,067 33,166 137,680 262,955 (71,176) 191,779Operating
expenses 77,984 21,661 37,712 132,789 270,146 (73,258) 196,888Operating
income (loss) ¥ (8,942) 1,406 (4,546) 4,891 (7,191) 2,082 ¥ (5,109)

- 27 -
Nine months ended December 31, 2009 Yen (Millions)
Japan Americas Europe Asia and others Sub total
Elimina-tions and corporate
Total
Net sales External sales ¥ 86,169 36,136 91,203 384,005 597,513 - ¥ 597,513Intersegment 113,415 21,979 21,331 58,898 215,623 (215,623) -
Total 199,584 58,115 112,534 442,903 813,136 (215,623) 597,513Operating
expenses 212,950 59,906 127,918 394,731 795,505 (215,487) 580,018Operating
income (loss) ¥ (13,366) (1,791) (15,384) 48,172 17,631 (136) ¥ 17,495 Nine months ended December 31, 2008 Yen (Millions)
Japan Americas Europe Asia and others Sub total
Elimina-tions and corporate
Total
Net sales External sales ¥106,591 36,835 47,976 396,914 588,316 - ¥ 588,316Intersegment 130,879 31,764 6,609 42,170 211,422 (211,422) -
Total 237,470 68,599 54,585 439,084 799,738 (211,422) 588,316Operating
expenses 251,937 61,414 59,889 417,268 790,508 (211,464) 579,044Operating
income (loss) ¥ (14,467) 7,185 (5,304) 21,816 9,230 42 ¥ 9,272 (Notes) 1. Net sales in each geographic area are based on the location of TDK entities
where the sales are generated. 2. Principal nations in each geographic segment excluding Japan: Americas: United States of America Europe: Germany, Austria and Hungary Asia and others: Hong Kong, China, Singapore, Thailand and Malaysia
- 28 -
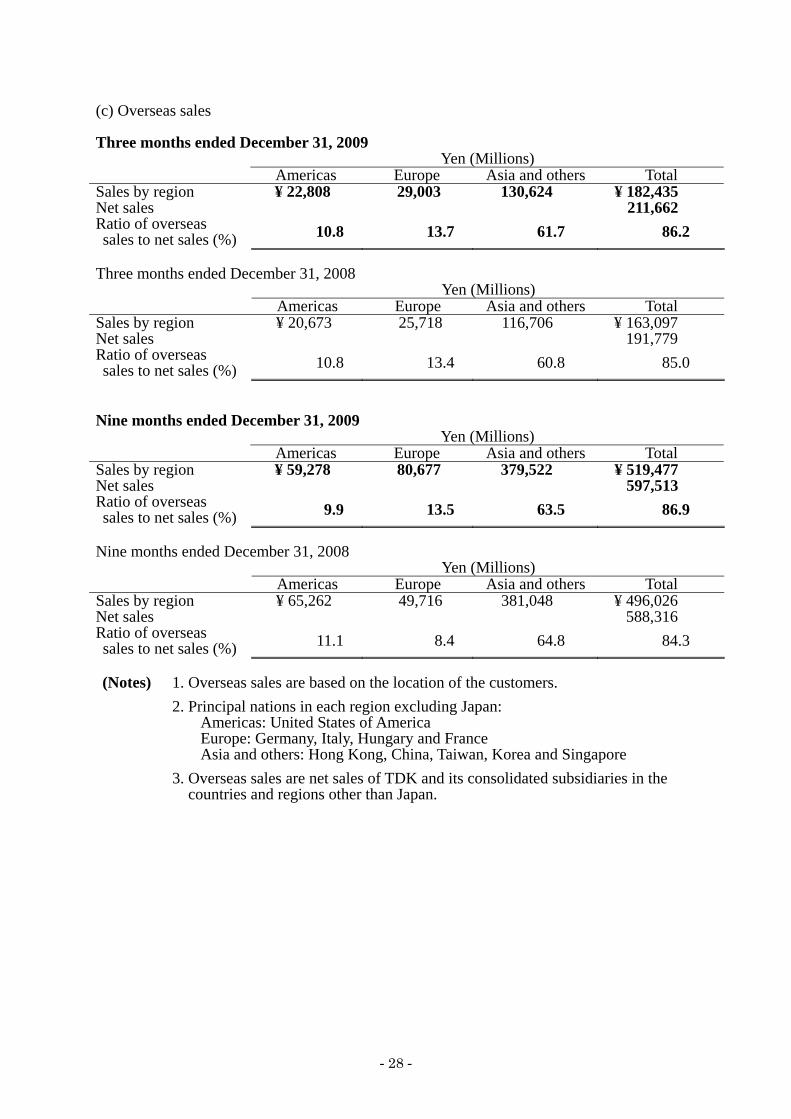
(c) Overseas sales Three months ended December 31, 2009
Yen (Millions) Americas Europe Asia and others Total
Sales by region ¥ 22,808 29,003 130,624 ¥ 182,435 Net sales 211,662 Ratio of overseas sales to net sales (%) 10.8 13.7 61.7 86.2
Three months ended December 31, 2008
Yen (Millions) Americas Europe Asia and others Total
Sales by region ¥ 20,673 25,718 116,706 ¥ 163,097 Net sales 191,779 Ratio of overseas sales to net sales (%) 10.8 13.4 60.8 85.0
Nine months ended December 31, 2009
Yen (Millions) Americas Europe Asia and others Total
Sales by region ¥ 59,278 80,677 379,522 ¥ 519,477 Net sales 597,513 Ratio of overseas sales to net sales (%) 9.9 13.5 63.5 86.9
Nine months ended December 31, 2008
Yen (Millions) Americas Europe Asia and others Total
Sales by region ¥ 65,262 49,716 381,048 ¥ 496,026 Net sales 588,316 Ratio of overseas sales to net sales (%) 11.1 8.4 64.8 84.3
(Notes) 1. Overseas sales are based on the location of the customers. 2. Principal nations in each region excluding Japan: Americas: United States of America Europe: Germany, Italy, Hungary and France Asia and others: Hong Kong, China, Taiwan, Korea and Singapore 3. Overseas sales are net sales of TDK and its consolidated subsidiaries in the
countries and regions other than Japan.