consolidated financial report for the six-month period
TRANSCRIPT
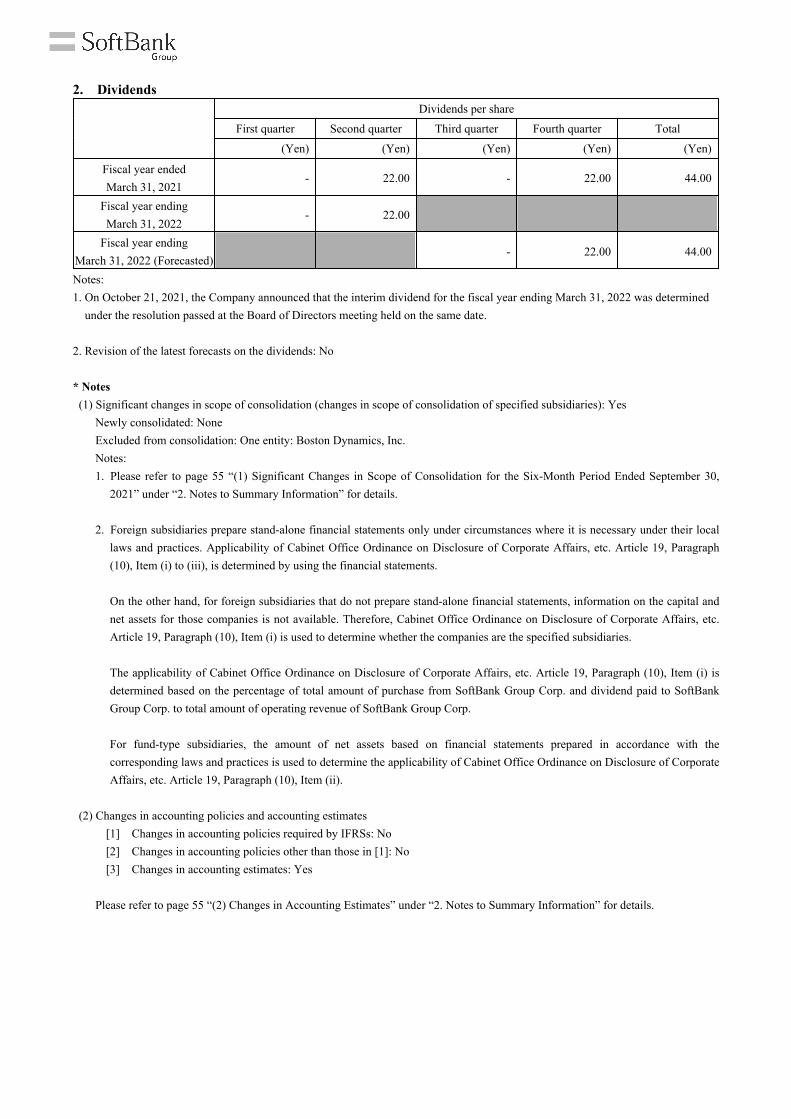
1. Financial Highlights (Millions of yen; amounts are rounded to the nearest million yen)
(Percentages are shown as year-on-year changes)
Net sales Incomebefore income tax Net income
Net income attributable to
owners of the parent
Total comprehensive
income
Amount % Amount % Amount % Amount % Amount %
Six-month period endedSeptember 30, 2021
¥2,983,504 13.4 ¥1,046,971 (27.4) ¥590,125 (68.6) ¥363,569 (80.7) ¥892,161 (42.9)
Six-month period endedSeptember 30, 2020
¥2,630,531 3.6 ¥1,441,472 22.9 ¥1,879,377 253.1 ¥1,883,211 346.7 ¥1,562,319 -
Basic earnings pershare (Yen)
Diluted earnings pershare (Yen)
Six-month period endedSeptember 30, 2021
¥202.46 ¥195.62
Six-month period endedSeptember 30, 2020
¥950.54 ¥903.06
Total assets Total equity
Equityattributable toowners of the
parent
Ratio of equityattributable to
owners of the parentto total assets (%)
As of September 30, 2021 ¥46,220,788 ¥12,339,470 ¥10,548,562 22.8
As of March 31, 2021 ¥45,750,453 ¥11,955,593 ¥10,213,093 22.3
This English translation of the financial report was prepared for reference purposes only and is qualified in its entirety by the original Japanese version. The financial information contained in this report is derived from our unaudited consolidated financial statements appearing in item 3 of this report.
SoftBank Group Corp.Consolidated Financial Report
For the Six-Month Period Ended September 30, 2021 (IFRS)
Tokyo, November 8, 2021
(1) Results of Operations
Note:* Net sales and income before income tax are presented based on the amounts from continuing operations only.
(2) Financial Position
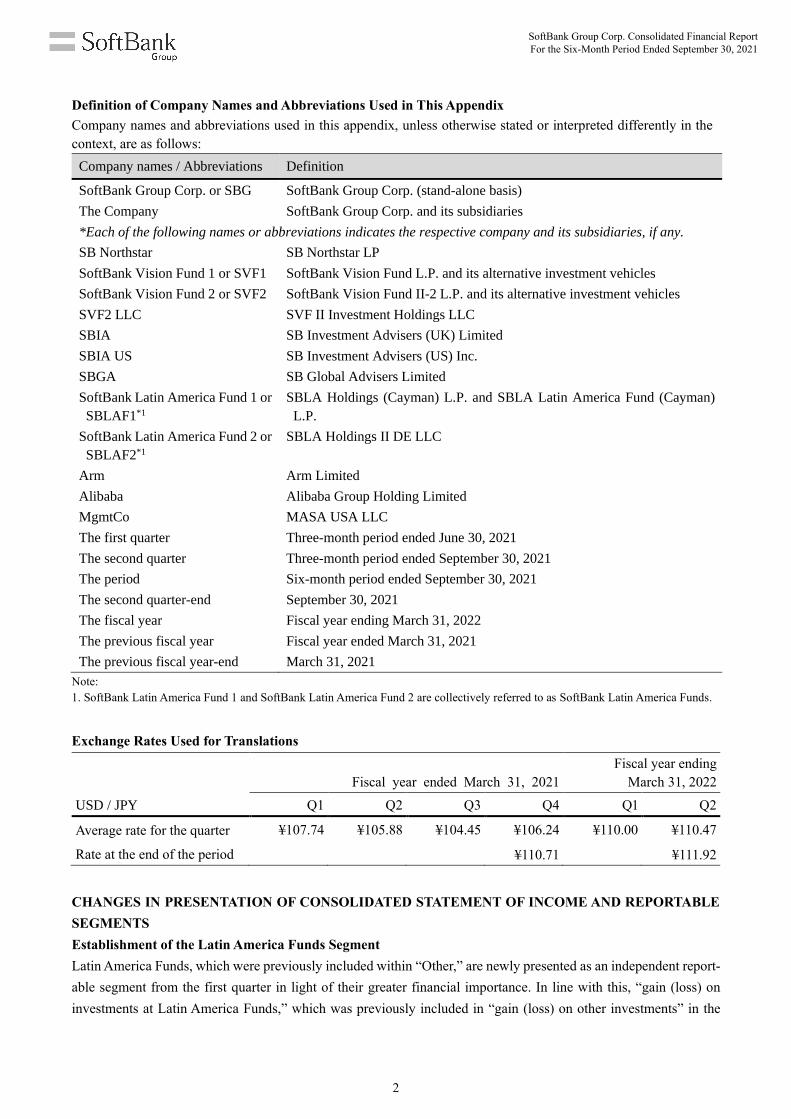
Dividends per share
First quarter Second quarter Third quarter Fourth quarter Total
(Yen) (Yen) (Yen) (Yen) (Yen)
Fiscal year endedMarch 31, 2021
- 22.00 - 22.00 44.00
Fiscal year endingMarch 31, 2022
- 22.00
Fiscal year endingMarch 31, 2022 (Forecasted)
- 22.00 44.00
2. Dividends
Notes:1. On October 21, 2021, the Company announced that the interim dividend for the fiscal year ending March 31, 2022 was determined
under the resolution passed at the Board of Directors meeting held on the same date.
2. Revision of the latest forecasts on the dividends: No
* Notes(1) Significant changes in scope of consolidation (changes in scope of consolidation of specified subsidiaries): Yes
Newly consolidated: NoneExcluded from consolidation: One entity: Boston Dynamics, Inc.Notes:1. Please refer to page 55 “(1) Significant Changes in Scope of Consolidation for the Six-Month Period Ended September 30,
2021” under “2. Notes to Summary Information” for details.
2. Foreign subsidiaries prepare stand-alone financial statements only under circumstances where it is necessary under their local laws and practices. Applicability of Cabinet Office Ordinance on Disclosure of Corporate Affairs, etc. Article 19, Paragraph (10), Item (i) to (iii), is determined by using the financial statements.
On the other hand, for foreign subsidiaries that do not prepare stand-alone financial statements, information on the capital and net assets for those companies is not available. Therefore, Cabinet Office Ordinance on Disclosure of Corporate Affairs, etc. Article 19, Paragraph (10), Item (i) is used to determine whether the companies are the specified subsidiaries.
The applicability of Cabinet Office Ordinance on Disclosure of Corporate Affairs, etc. Article 19, Paragraph (10), Item (i) is determined based on the percentage of total amount of purchase from SoftBank Group Corp. and dividend paid to SoftBank Group Corp. to total amount of operating revenue of SoftBank Group Corp.
For fund-type subsidiaries, the amount of net assets based on financial statements prepared in accordance with the corresponding laws and practices is used to determine the applicability of Cabinet Office Ordinance on Disclosure of Corporate Affairs, etc. Article 19, Paragraph (10), Item (ii).
(2) Changes in accounting policies and accounting estimates[1] Changes in accounting policies required by IFRSs: No[2] Changes in accounting policies other than those in [1]: No[3] Changes in accounting estimates: Yes
Please refer to page 55 “(2) Changes in Accounting Estimates” under “2. Notes to Summary Information” for details.

As of September 30, 2021: 1,722,953,730 sharesAs of March 31, 2021: 2,089,814,330 shares
As of September 30, 2021: 9,337,361 sharesAs of March 31, 2021: 351,297,587 shares
As of September 30, 2021: 1,718,003,004 sharesAs of September 30, 2020: 1,965,237,924 shares
(3) Number of shares issued (common stock)[1] Number of shares issued (including treasury stock):
[2] Number of shares of treasury stock:
[3] Number of average shares outstanding during six-month period (April-September):
* This condensed interim consolidated financial report is not subject to interim review procedures by certified public accountants or an audit firm.
* Note to forecasts on the consolidated results of operations and other itemsDescriptions regarding the future are estimated based on the information that the Company is able to obtain at the present point in time and assumptions which are deemed to be reasonable. However, actual results may be different due to various factors.
On November 8, 2021 (JST), the Company will hold an earnings results briefing for the media, institutional investors, and financial institutions. This earnings results briefing will be broadcast live on the Company’s website in both Japanese and English at https://group.softbank/en/ir/presentations. The Data Sheet will also be posted on the website in a few days at the same site.

(Appendix)
Contents
1. Results of Operations .......................................................................................................................................... P.4
(1) Overview of Results of Operations .............................................................................................................. P.4
a. Consolidated Results of Operations ............................................................................................................ P.5
b. Results by Segment .................................................................................................................................... P.8
(a) Investment Business of Holding Companies Segment ........................................................................ P.9
(b) SoftBank Vision Funds Segment ....................................................................................................... P.18
(c) SoftBank Segment ............................................................................................................................. P.30
(d) Arm Segment ..................................................................................................................................... P.31
(e) Latin America Funds Segment ........................................................................................................... P.37
(f) Other ................................................................................................................................................... P.39
(2) Overview of Financial Position .................................................................................................................. P.40
(3) Overview of Cash Flows ............................................................................................................................ P.50
(4) Forecasts ..................................................................................................................................................... P.53
2. Notes to Summary Information ......................................................................................................................... P.55
(1) Significant Changes in Scope of Consolidation for the Six-Month Period Ended September 30, 2021 ......... P.55
(2) Changes in Accounting Estimates ............................................................................................................... P.55
3. Condensed Interim Consolidated Financial Statements and Primary Notes ...................................................... P.56
(1) Condensed Interim Consolidated Statement of Financial Position.............................................................. P.58
(2) Condensed Interim Consolidated Statement of Income
and Condensed Interim Consolidated Statement of Comprehensive Income ............................................. P.60
(3) Condensed Interim Consolidated Statement of Changes in Equity ............................................................. P.64
(4) Condensed Interim Consolidated Statement of Cash Flows ........................................................................ P.68
(5) Significant Doubt about Going Concern Assumption ................................................................................. P.70
(6) Notes to Condensed Interim Consolidated Financial Statements ................................................................ P.70
Disclaimer
This material does not constitute an offer to sell, or a solicitation of an offer to buy, limited partnership interests or comparable limited
liability equity interests in any funds (including SoftBank Vision Fund 1, SoftBank Vision Fund 2, and SoftBank Latin America
Funds) managed by any of the subsidiaries of SBG including SB Global Advisers Limited, SB Investment Advisers (UK) Limited,
SBLA Advisers Corp. or their respective affiliates, or any securities in any jurisdiction, nor should it be relied upon as such in any
way.
Notice Regarding PFIC Status
It is possible that SBG and certain subsidiaries of SBG may be a “passive foreign investment company” (“PFIC”) under the U.S.
Internal Revenue Code of 1986, as amended, for its current fiscal year due to the composition of its assets and the nature of its income.
For the fiscal year ended March 31, 2021, we believe that SBG and certain subsidiaries of SBG were PFICs. We recommend that
U.S. holders of SBG’s shares consult their tax advisors with respect to the U.S. federal income tax consequences to them if SBG and
its subsidiaries are classified as PFICs. SBG is not responsible for any tax treatments or consequences thereof with respect to U.S.
holders of SBG’s shares.
SoftBank Group Corp. Consolidated Financial Report For the Six-Month Period Ended September 30, 2021
1
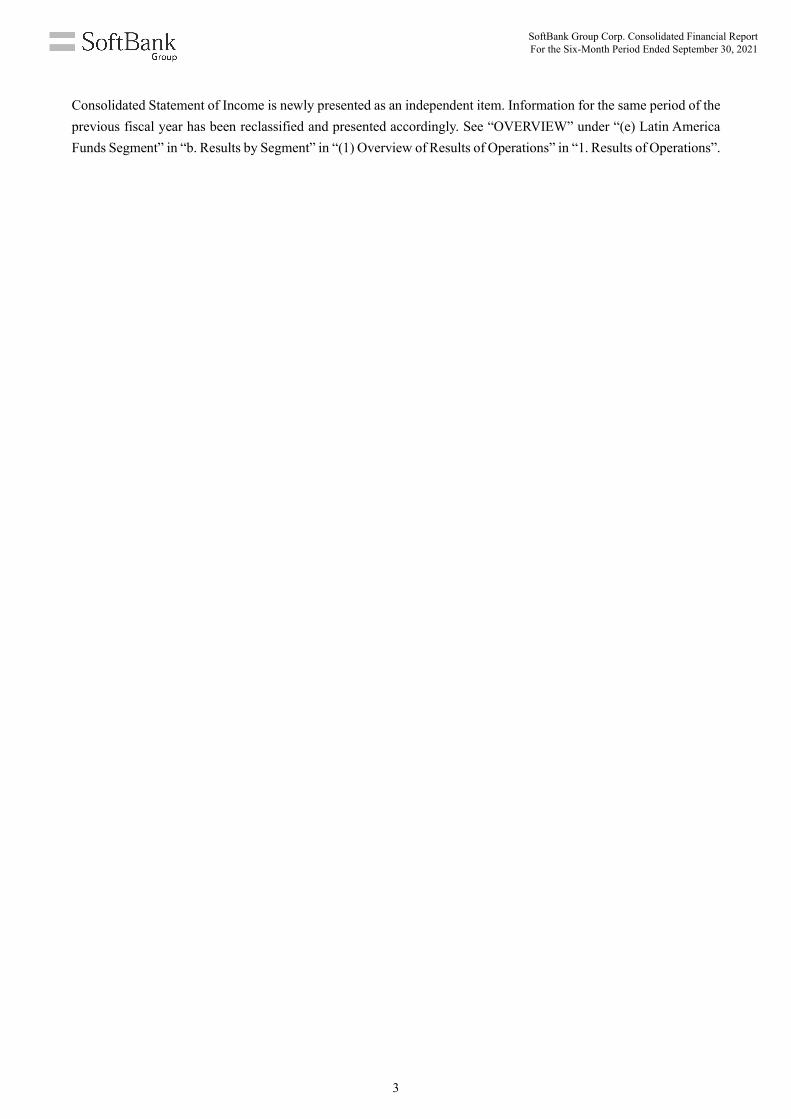
Definition of Company Names and Abbreviations Used in This Appendix
Company names and abbreviations used in this appendix, unless otherwise stated or interpreted differently in the
context, are as follows:
Company names / Abbreviations Definition
SoftBank Group Corp. or SBG SoftBank Group Corp. (stand-alone basis)
The Company SoftBank Group Corp. and its subsidiaries
*Each of the following names or abbreviations indicates the respective company and its subsidiaries, if any.
SB Northstar SB Northstar LP
SoftBank Vision Fund 1 or SVF1 SoftBank Vision Fund L.P. and its alternative investment vehicles
SoftBank Vision Fund 2 or SVF2 SoftBank Vision Fund II-2 L.P. and its alternative investment vehicles
SVF2 LLC SVF II Investment Holdings LLC
SBIA SB Investment Advisers (UK) Limited
SBIA US SB Investment Advisers (US) Inc.
SBGA SB Global Advisers Limited
SoftBank Latin America Fund 1 or
SBLAF1*1
SBLA Holdings (Cayman) L.P. and SBLA Latin America Fund (Cayman)
L.P.
SoftBank Latin America Fund 2 or
SBLAF2*1
SBLA Holdings II DE LLC
Arm Arm Limited
Alibaba Alibaba Group Holding Limited
MgmtCo MASA USA LLC
The first quarter Three-month period ended June 30, 2021
The second quarter Three-month period ended September 30, 2021
The period Six-month period ended September 30, 2021
The second quarter-end September 30, 2021
The fiscal year Fiscal year ending March 31, 2022
The previous fiscal year Fiscal year ended March 31, 2021
The previous fiscal year-end March 31, 2021
Note:
1. SoftBank Latin America Fund 1 and SoftBank Latin America Fund 2 are collectively referred to as SoftBank Latin America Funds.
Exchange Rates Used for Translations
Fiscal year ended March 31, 2021
Fiscal year ending
March 31, 2022
USD / JPY Q1 Q2 Q3 Q4 Q1 Q2
Average rate for the quarter ¥107.74 ¥105.88 ¥104.45 ¥106.24 ¥110.00 ¥110.47
Rate at the end of the period ¥110.71 ¥111.92
CHANGES IN PRESENTATION OF CONSOLIDATED STATEMENT OF INCOME AND REPORTABLE
SEGMENTS
Establishment of the Latin America Funds Segment
Latin America Funds, which were previously included within “Other,” are newly presented as an independent report-
able segment from the first quarter in light of their greater financial importance. In line with this, “gain (loss) on
investments at Latin America Funds,” which was previously included in “gain (loss) on other investments” in the
SoftBank Group Corp. Consolidated Financial Report For the Six-Month Period Ended September 30, 2021
2
Consolidated Statement of Income is newly presented as an independent item. Information for the same period of the
previous fiscal year has been reclassified and presented accordingly. See “OVERVIEW” under “(e) Latin America
Funds Segment” in “b. Results by Segment” in “(1) Overview of Results of Operations” in “1. Results of Operations”.
SoftBank Group Corp. Consolidated Financial Report For the Six-Month Period Ended September 30, 2021
3
1. Results of Operations
(1) Overview of Results of Operations
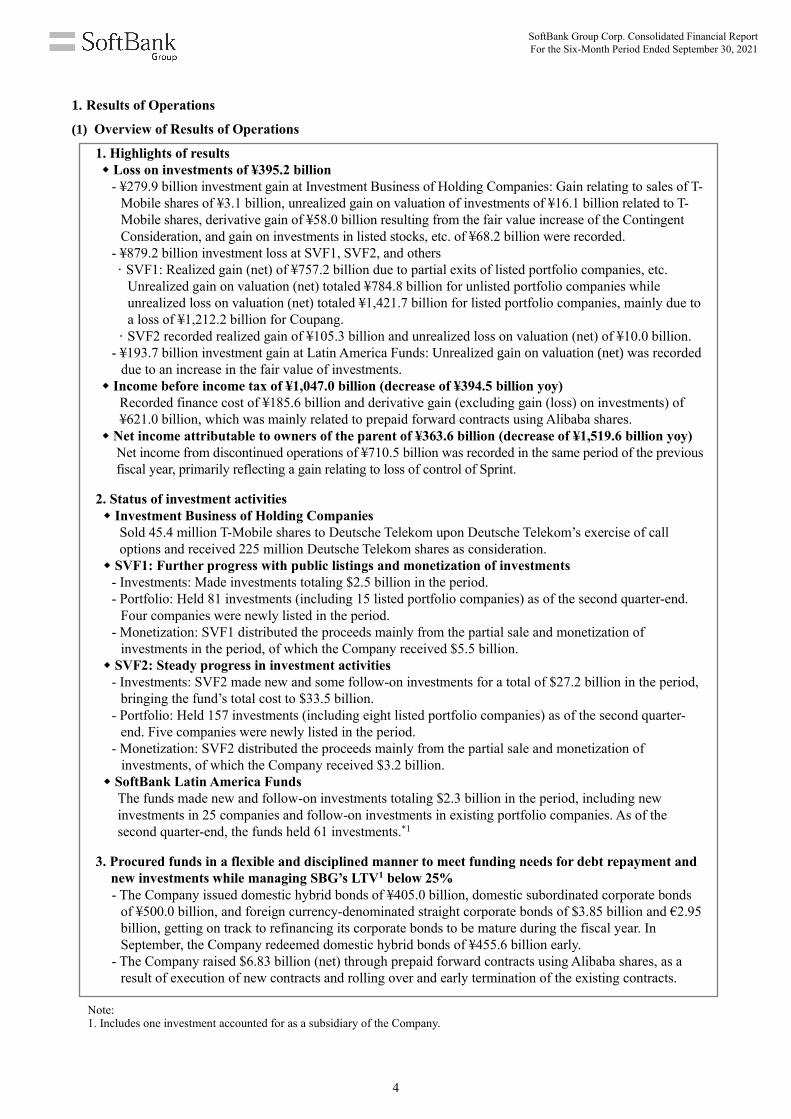
1. Highlights of results
Loss on investments of ¥395.2 billion
- ¥279.9 billion investment gain at Investment Business of Holding Companies: Gain relating to sales of T-
Mobile shares of ¥3.1 billion, unrealized gain on valuation of investments of ¥16.1 billion related to T-
Mobile shares, derivative gain of ¥58.0 billion resulting from the fair value increase of the Contingent
Consideration, and gain on investments in listed stocks, etc. of ¥68.2 billion were recorded.
- ¥879.2 billion investment loss at SVF1, SVF2, and others
· SVF1: Realized gain (net) of ¥757.2 billion due to partial exits of listed portfolio companies, etc.
Unrealized gain on valuation (net) totaled ¥784.8 billion for unlisted portfolio companies while
unrealized loss on valuation (net) totaled ¥1,421.7 billion for listed portfolio companies, mainly due to
a loss of ¥1,212.2 billion for Coupang.
· SVF2 recorded realized gain of ¥105.3 billion and unrealized loss on valuation (net) of ¥10.0 billion.
- ¥193.7 billion investment gain at Latin America Funds: Unrealized gain on valuation (net) was recorded
due to an increase in the fair value of investments.
Income before income tax of ¥1,047.0 billion (decrease of ¥394.5 billion yoy)
Recorded finance cost of ¥185.6 billion and derivative gain (excluding gain (loss) on investments) of
¥621.0 billion, which was mainly related to prepaid forward contracts using Alibaba shares.
Net income attributable to owners of the parent of ¥363.6 billion (decrease of ¥1,519.6 billion yoy)
Net income from discontinued operations of ¥710.5 billion was recorded in the same period of the previous
fiscal year, primarily reflecting a gain relating to loss of control of Sprint.
2. Status of investment activities
Investment Business of Holding Companies
Sold 45.4 million T-Mobile shares to Deutsche Telekom upon Deutsche Telekom’s exercise of call
options and received 225 million Deutsche Telekom shares as consideration.
SVF1: Further progress with public listings and monetization of investments
- Investments: Made investments totaling $2.5 billion in the period.
- Portfolio: Held 81 investments (including 15 listed portfolio companies) as of the second quarter-end.
Four companies were newly listed in the period.
- Monetization: SVF1 distributed the proceeds mainly from the partial sale and monetization of
investments in the period, of which the Company received $5.5 billion.
SVF2: Steady progress in investment activities
- Investments: SVF2 made new and some follow-on investments for a total of $27.2 billion in the period,
bringing the fund’s total cost to $33.5 billion.
- Portfolio: Held 157 investments (including eight listed portfolio companies) as of the second quarter-
end. Five companies were newly listed in the period.
- Monetization: SVF2 distributed the proceeds mainly from the partial sale and monetization of
investments, of which the Company received $3.2 billion. SoftBank Latin America Funds
The funds made new and follow-on investments totaling $2.3 billion in the period, including new
investments in 25 companies and follow-on investments in existing portfolio companies. As of the
second quarter-end, the funds held 61 investments.*1
3. Procured funds in a flexible and disciplined manner to meet funding needs for debt repayment and
new investments while managing SBG’s LTV1 below 25%
- The Company issued domestic hybrid bonds of ¥405.0 billion, domestic subordinated corporate bonds
of ¥500.0 billion, and foreign currency-denominated straight corporate bonds of $3.85 billion and €2.95
billion, getting on track to refinancing its corporate bonds to be mature during the fiscal year. In
September, the Company redeemed domestic hybrid bonds of ¥455.6 billion early.
- The Company raised $6.83 billion (net) through prepaid forward contracts using Alibaba shares, as a
result of execution of new contracts and rolling over and early termination of the existing contracts. Note: 1. Includes one investment accounted for as a subsidiary of the Company.
SoftBank Group Corp. Consolidated Financial Report For the Six-Month Period Ended September 30, 2021
4

a. Consolidated Results of Operations
(Millions of yen)
Six months ended September 30
2020 2021 Change Change %
Continuing operations
Net sales 2,630,531 2,983,504 352,973 13.4% A
Gross profit 1,419,812 1,635,033 215,221 15.2%
Gain on investments
Gain on investments at Investment Business
of Holding Companies
579,614
279,928
(299,686) (51.7%) B
Gain (loss) on investments at SVF1, SVF2,
and others
1,336,638
(879,186)
(2,215,824) - C
Gain on investments at Latin America Funds 63,468 193,698 130,230 205.2% D
Gain on other investments 53,591 10,325 (43,266) (80.7%)
Total gain (loss) on investments 2,033,311 (395,235) (2,428,546) -
Selling, general and administrative expenses (1,011,301) (1,186,672) (175,371) 17.3% E
Finance cost (153,808) (185,599) (31,791) 20.7% F
Income on equity method investments 200,830 265,331 64,501 32.1% G
Derivative gain (loss)
(excluding gain (loss) on investments)
(761,557)
620,959
1,382,516 - H
Change in third-party interests in SVF1 and
SVF2
(457,537)
195,179
652,716 -
Other gain 171,722 97,975 (73,747) (42.9%)
Income before income tax 1,441,472 1,046,971 (394,501) (27.4%)
Income taxes (272,282) (456,846) (184,564) 67.8% I
Net income from continuing operations 1,169,190 590,125 (579,065) (49.5%)
Discontinued operations
Net income from discontinued operations 710,187 - (710,187) - J
Net income 1,879,377 590,125 (1,289,252) (68.6%)
Net income attributable to owners of the parent 1,883,211 363,569 (1,519,642) (80.7%)
Total comprehensive income 1,562,319 892,161 (670,158) (42.9%)
Comprehensive income attributable to owners of
the parent
1,563,669
664,724
(898,945)
(57.5%)
The following is an overview of the main and noteworthy components.
A Net Sales
Net sales increased in the SoftBank and Arm segments.
B Gain on Investments at Investment Business of Holding Companies
Investment gain of ¥279,928 million was recorded. The Company recorded gain relating to sales of T-Mobile shares
(T-Mobile US, Inc. after merging with Sprint Corporation) of ¥3,149 million, unrealized gain on valuation of
SoftBank Group Corp. Consolidated Financial Report For the Six-Month Period Ended September 30, 2021
5
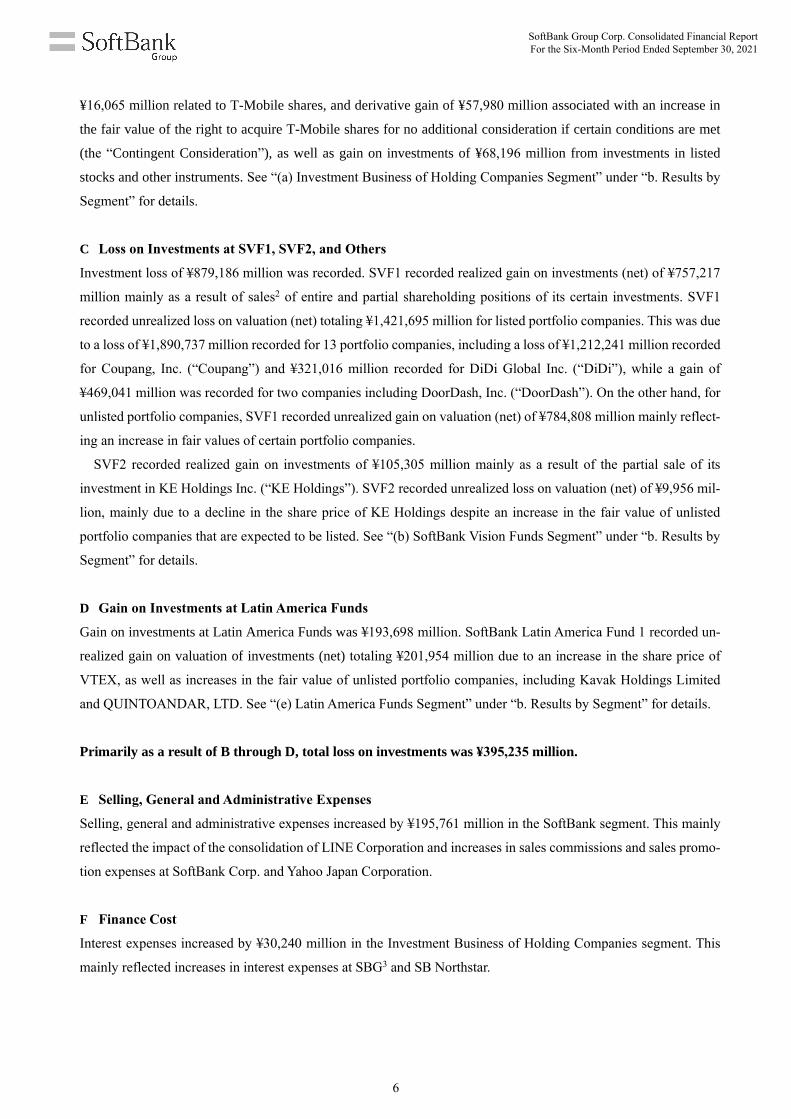
¥16,065 million related to T-Mobile shares, and derivative gain of ¥57,980 million associated with an increase in
the fair value of the right to acquire T-Mobile shares for no additional consideration if certain conditions are met
(the “Contingent Consideration”), as well as gain on investments of ¥68,196 million from investments in listed
stocks and other instruments. See “(a) Investment Business of Holding Companies Segment” under “b. Results by
Segment” for details.
C Loss on Investments at SVF1, SVF2, and Others
Investment loss of ¥879,186 million was recorded. SVF1 recorded realized gain on investments (net) of ¥757,217
million mainly as a result of sales2 of entire and partial shareholding positions of its certain investments. SVF1
recorded unrealized loss on valuation (net) totaling ¥1,421,695 million for listed portfolio companies. This was due
to a loss of ¥1,890,737 million recorded for 13 portfolio companies, including a loss of ¥1,212,241 million recorded
for Coupang, Inc. (“Coupang”) and ¥321,016 million recorded for DiDi Global Inc. (“DiDi”), while a gain of
¥469,041 million was recorded for two companies including DoorDash, Inc. (“DoorDash”). On the other hand, for
unlisted portfolio companies, SVF1 recorded unrealized gain on valuation (net) of ¥784,808 million mainly reflect-
ing an increase in fair values of certain portfolio companies.
SVF2 recorded realized gain on investments of ¥105,305 million mainly as a result of the partial sale of its
investment in KE Holdings Inc. (“KE Holdings”). SVF2 recorded unrealized loss on valuation (net) of ¥9,956 mil-
lion, mainly due to a decline in the share price of KE Holdings despite an increase in the fair value of unlisted
portfolio companies that are expected to be listed. See “(b) SoftBank Vision Funds Segment” under “b. Results by
Segment” for details.
D Gain on Investments at Latin America Funds
Gain on investments at Latin America Funds was ¥193,698 million. SoftBank Latin America Fund 1 recorded un-
realized gain on valuation of investments (net) totaling ¥201,954 million due to an increase in the share price of
VTEX, as well as increases in the fair value of unlisted portfolio companies, including Kavak Holdings Limited
and QUINTOANDAR, LTD. See “(e) Latin America Funds Segment” under “b. Results by Segment” for details.
Primarily as a result of B through D, total loss on investments was ¥395,235 million.
E Selling, General and Administrative Expenses
Selling, general and administrative expenses increased by ¥195,761 million in the SoftBank segment. This mainly
reflected the impact of the consolidation of LINE Corporation and increases in sales commissions and sales promo-
tion expenses at SoftBank Corp. and Yahoo Japan Corporation.
F Finance Cost
Interest expenses increased by ¥30,240 million in the Investment Business of Holding Companies segment. This
mainly reflected increases in interest expenses at SBG3 and SB Northstar.
SoftBank Group Corp. Consolidated Financial Report For the Six-Month Period Ended September 30, 2021
6

G Income on Equity Method Investments
Income on equity method investments related to Alibaba was ¥277,273 million,4 an increase of ¥109,505 million
year on year. A loss was recorded for Alibaba in the same period of the previous fiscal year mainly due to the
recording of an investment loss on its investments classified as financial assets at FVTPL for the three-month period
ended March 31, 2020, following the fall in stock markets due to the COVID-19 pandemic.
Alibaba recorded an expense for the three-month period ended March 31, 2021 for the fine levied by China’s
State Administration for Market Regulation pursuant to China’s Anti-Monopoly Law. The Company had already
recorded the expense in the fourth quarter of the previous fiscal year as a significant event during the applicable
period on a three-month time lag.
H Derivative Gain (Excluding Gain (Loss) on Investments)
Derivative gain of ¥625,116 million was recorded in connection with prepaid forward contracts using Alibaba shares
entered into in the fiscal years ended March 31, 2020 and March 31, 2021, as well as in the period.
Within derivative gain (loss), gains and losses related to investing activities, such as the acquisition and sale of
shares, are included in “gain (loss) on investments.” For example, this applies to derivative gains and losses arising
from long call options of listed stocks held by asset management subsidiaries. Conversely, those related non-invest-
ing activities, particularly gains and losses arising from derivatives used in fund procurement, are included in “de-
rivative gain (loss) (excluding gain (loss) on investments).” For example, this applies to derivative gains and losses
related to prepaid forward contracts using Alibaba shares and T-Mobile shares. However, in cases where the prepaid
forward contracts are settled using shares rather than cash, gains and losses arising from the reversal of derivative
financial assets or derivative financial liabilities at settlement are included in “investment gain (loss)” as part of
gain (loss) relating to settlement of prepaid forward contracts using shares.
Primarily as a result of A through H, income before income tax was ¥1,046,971 million, a decrease of ¥394,501
million (27.4%) year on year.
I Income Taxes
Income taxes were recorded at SoftBank Corp. and at Yahoo Japan Corporation. Meanwhile, deferred tax expenses
were recorded due to recording derivative gain related to prepaid forward contracts using Alibaba shares.
J Net Income from Discontinued Operations
In the same period of the previous fiscal year, the Company recorded a gain of ¥721,404 million relating to loss of
control of Sprint Corporation in connection with Sprint Corporation ceasing to be a subsidiary of the Company,
following the completion of the merger between Sprint Corporation and T-Mobile US, Inc.
Primarily as a result of A through J, net income attributable to owners of the parent was ¥363,569 million, a
decrease of ¥1,519,642 million (80.7%) year on year.
SoftBank Group Corp. Consolidated Financial Report For the Six-Month Period Ended September 30, 2021
7

b. Results by Segment
The Company’s reportable segments are the components of its business activities for which decisions on resource
allocation and assessment of performance are made. In the first quarter, “Latin America Funds segment” was newly
established. In the second quarter, “SoftBank Vision Funds segment” was renamed from “SVF1 and Other SBIA-
Managed Funds segment” due to change in the manager of SVF2 to SBGA. As of the second quarter-end, there are
five reportable segments: Investment Business of Holding Companies, SoftBank Vision Funds, SoftBank, Arm, and
Latin America Funds.
The following is a summary of the reportable segments.
Segments Main businesses Core companies
Reportable segments
Investment Business
of Holding
Companies
· Investment activities by SBG and its subsidiar-
ies
SoftBank Group Corp.
SoftBank Group Capital Limited
SoftBank Group Japan Corporation
SB Northstar LP
SoftBank Vision
Funds
· Investment activities by SVF1 and SVF2 SB Investment Advisers (UK)
Limited
SoftBank Vision Fund L.P.
SB Global Advisers Limited
SoftBank Vision Fund II-2 L.P.
SoftBank · Provision of mobile services, sale of mobile
devices, and provision of broadband and other
internet services in Japan
· Internet advertising and e-commerce business
SoftBank Corp.
Z Holdings Corporation
Yahoo Japan Corporation
LINE Corporation
Arm · Design of microprocessor intellectual property
and related technology
· Sale of software tools and provision of related
services
Arm Limited
Latin America
Funds
· Investment activities by SoftBank Latin
America Fund 1 and SoftBank Latin America
Fund 2
SBLA Advisers Corp.
SBLA Latin America Fund
(Cayman) L.P.
SBLA Holdings (Cayman) L.P.
SBLA Holdings II DE LLC
Other · Smartphone payment business PayPay Corporation
· Alternative investment management business Fortress Investment Group LLC
· Fukuoka SoftBank HAWKS-related businesses Fukuoka SoftBank HAWKS Corp.
SoftBank Group Corp. Consolidated Financial Report For the Six-Month Period Ended September 30, 2021
8

(a) Investment Business of Holding Companies Segment
1. Segment income was ¥1.0 trillion, as a result of recording ¥279.7 billion gain on investments and
¥623.9 billion derivative gain (excluding gain (loss) on investments) related to prepaid forward
contracts using Alibaba shares
2. Recorded ¥68.0 billion*1 investment gain in listed stocks and other instruments (total investment
gains and losses of SBG and SB Northstar)
Note:
1. Includes an impact of investment by SB Northstar in Special Purpose Acquisition Companies (SPACs) controlled by SBIA
US, which is eliminated in consolidation.
OVERVIEW
This segment is led by SBG, which conducts investment activities, either directly or through subsidiaries, as a stra-
tegic investment holding company. The segment consists of SBG, SoftBank Group Capital Limited (“SBGC”), Soft-
Bank Group Japan Corporation (“SBGJ”), asset management subsidiary SB Northstar, and certain other subsidiaries
engaged in investment and financing activities. Gain and loss on investments at Investment Business of Holding
Companies comprises gain and loss on investments held by SBG either directly or through its subsidiaries but does
not include gain and loss on investments pertaining to subsidiaries’ shares, such as dividend income from subsidiaries
or impairment loss relating to subsidiaries’ shares.
The companies comprising this segment hold approximately 120 portfolio companies, including Alibaba and T-
Mobile as well as investees of SB Northstar. They are either equity method associates (such as Alibaba) or invest-
ments classified as financial assets at FVTPL. Regarding the financial results of portfolio companies classified as
equity method associates, income and loss are recorded as “income (loss) on equity method investments” in propor-
tion to equity interest. Investments classified as financial assets at FVTPL are measured at fair value every quarter,
and any change in fair value is recorded in the Consolidated Statement of Income as “gain (loss) on investments.”
Investment in listed stocks and other instruments by asset management subsidiaries
Since the first quarter of the previous fiscal year, the Company has been investing in highly liquid listed stocks
to diversify its assets and manage surplus funds, while being firmly committed to its stated financial policies.
These investments were made by SBG in the first quarter of the previous fiscal year, but from the second quarter
of the previous fiscal year, asset management subsidiary SB Northstar has been acquiring and selling listed
stocks and other instruments and engaging in derivative and credit transactions related to listed stocks. The scale
of its investments in listed stocks and other instruments fluctuates depending on SBG’s funding needs, cash on
hand, and the status of the assets held by SBG.
SBG indirectly holds 67% and SBG’s Representative Director, Corporate Officer, Chairman & CEO Ma-
sayoshi Son indirectly holds 33% of interests in SB Northstar. Masayoshi Son’s interest is deducted from the
gains and losses on investments at SB Northstar as a non-controlling interest; therefore, 67% of the gains and
losses on investments impacts net income attributable to owners of the parent. Furthermore, if, at the end of the
fund life (12 years + 2-year extension), SB Northstar has any unfunded repayment obligations to SBG, Ma-
sayoshi Son will pay his pro rata share of any such unfunded obligations based upon his relative ownership
percentage of SB Northstar.
SoftBank Group Corp. Consolidated Financial Report For the Six-Month Period Ended September 30, 2021
9

FINANCIAL RESULTS
(Millions of yen)
Six months ended September 30
2020 2021 Change Change %
Gain on investments at Investment Business of
Holding Companies 579,614 279,688 (299,926) (51.7%) A
Gain relating to sales of T-Mobile shares 421,755 3,149 (418,606) (99.3%)
Realized gain (loss) on investments at asset
management subsidiaries (8,060) 62,951 71,011 -
Unrealized loss on valuation of investments at
asset management subsidiaries (95,082) (80,019) 15,063 -
Derivative gain (loss) on investments at
asset management subsidiaries (292,346) 76,185 368,531 -
Realized gain (loss) on investments 163,621 (336,667) (500,288) -
Unrealized gain on valuation of investments 234,573 462,152 227,579 97.0%
Change in valuation for the fiscal year 235,859 56,617 (179,242) (76.0%)
Reclassified to realized gain (loss) recorded in
the past fiscal year*1 (1,286) 405,535 406,821 -
Derivative gain on investments 151,690 68,499 (83,191) (54.8%)
Effect of foreign exchange translation - 11,233 11,233 -
Other 3,463 12,205 8,742 252.4%
Selling, general and administrative expenses (52,922) (46,184) 6,738 (12.7%)
Finance cost (108,175) (138,415) (30,240) 28.0% B
Income on equity method investments 194,607 266,989 72,382 37.2% C
Derivative gain (loss)
(excluding gain (loss) on investments) (762,417) 623,897 1,386,314 - D
Other gain 174,641 30,078 (144,563) (82.8%)
Segment income (income before income tax) 25,348 1,016,053 990,705 -
Note:
1. Unrealized gains and losses on valuation of investments recorded in prior fiscal years related to the investments realized in the
fiscal year are reclassified as “realized gain (loss) on investments.”
A Gain on investments at Investment Business of Holding Companies: ¥279,688 million
· Gain relating to sales of T-Mobile shares of ¥3,149 million was recorded in conjunction with a partial sale of T-
Mobile shares in September 2021. See “Partial Sale of T-Mobile Shares in September 2021” for details of the
sale transaction. Cumulative losses pertaining to the 45.4 million T-Mobile shares that were the subject of this
sale transaction were ¥13,447 million. This is the difference between the fair value of the 45.4 million shares as
of June 26, 2020, when T-Mobile was excluded from the Company's equity method associates, and the fair value
of the 225.0 million Deutsche Telekom shares received as consideration upon completion of such sale transaction.
· Realized gain on investments at asset management subsidiaries of ¥62,951 million and unrealized loss on valu-
ation of investments at asset management subsidiaries of ¥80,019 million were recorded. This was a result of
investments in listed stocks and other instruments by SB Northstar.
· Derivative gain on investments at asset management subsidiaries of ¥76,185 million was recorded. This was
mainly due to recording gains related to long call options on listed stocks at SB Northstar.
SoftBank Group Corp. Consolidated Financial Report For the Six-Month Period Ended September 30, 2021
10

· Realized loss on investments of ¥336,667 million and unrealized gain on valuation of investments of ¥462,152
million were recorded. This was mainly due to the sale of shares of a wholly owned subsidiary that held the
shares of WeWork Inc. (“WeWork”) from SBG to SVF2. The Company recorded a total realized loss of ¥458,716
million from the sale, while also reclassifying an aggregate of ¥478,059 million of unrealized losses on the val-
uation of investments recorded in prior fiscal years as a realized gain (gains and losses related to the sale are
eliminated in consolidation as an intercompany transaction). A cumulative loss incurred at Investment Business
of Holdings Companies segment from the acquisition of the WeWork shares to the sale of the shares totaled
¥636,135 million ($5,924 million), which is the sum of the abovementioned investment gains and losses and
gains and losses related to investments accounted for using the equity method. In addition, change in valuation
for the fiscal year recorded as unrealized gain on valuation of investments included unrealized gain on valuation
of ¥16,065 million related to investments in T-Mobile.
· Derivative gain on investments of ¥68,499 million was recorded. This was mainly due to the recording of a
derivative gain resulting from an increase of ¥57,980 million in the fair value of the Contingent Consideration
related to T-Mobile shares.
B Finance cost: ¥138,415 million (increase of ¥30,240 million year on year)
Interest expenses increased by ¥21,877 million year on year at SBG3 to ¥129,718 million and by ¥8,045 million
to ¥8,407 million at SB Northstar. The increase at SBG was mainly due to an increase in interest-bearing debt
resulting from the issuance of bonds and borrowings made through a margin loan. The increase at SB Northstar
was mainly due to the short-term borrowings for the purpose of acquiring listed stocks that were made following
the commencement of its business in the second quarter of the previous fiscal year.
C Income on equity method investments: ¥266,989 million (increase of ¥72,382 million year on year)
Income on equity method investments related to Alibaba was ¥277,273 million, an increase of ¥109,505 million
year on year. A loss on investment was recorded for Alibaba in the same period of the previous fiscal year mainly
due to recording of investment loss on its investments classified as financial assets at FVTPL for the three-month
period ended March 31, 2020, following the fall in stock markets due to the COVID-19 pandemic.
Alibaba recorded an expense for the three-month period ended March 31, 2021 for the fine levied by China’s
State Administration for Market Regulation pursuant to China’s Anti-Monopoly Law. The Company had already
recorded the expense in the fourth quarter of the previous fiscal year as a significant event during the period on a
three-month time lag.
D Derivative gain (excluding gain (loss) on investments): ¥623,897 million
Derivative gain of ¥625,116 million was recorded in connection with the prepaid forward contracts using Alibaba
shares entered into in the fiscal years ended March 31, 2020 and March 31, 2021, as well as in the period.
SoftBank Group Corp. Consolidated Financial Report For the Six-Month Period Ended September 30, 2021
11
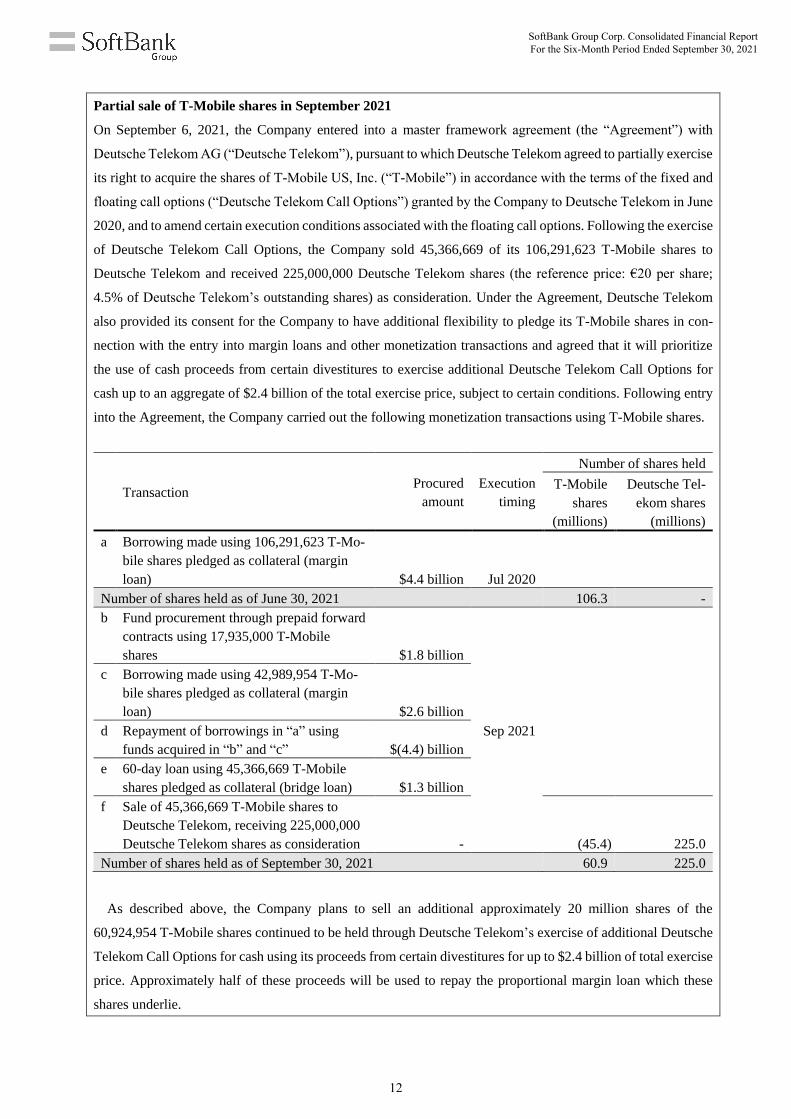
Partial sale of T-Mobile shares in September 2021
On September 6, 2021, the Company entered into a master framework agreement (the “Agreement”) with
Deutsche Telekom AG (“Deutsche Telekom”), pursuant to which Deutsche Telekom agreed to partially exercise
its right to acquire the shares of T-Mobile US, Inc. (“T-Mobile”) in accordance with the terms of the fixed and
floating call options (“Deutsche Telekom Call Options”) granted by the Company to Deutsche Telekom in June
2020, and to amend certain execution conditions associated with the floating call options. Following the exercise
of Deutsche Telekom Call Options, the Company sold 45,366,669 of its 106,291,623 T-Mobile shares to
Deutsche Telekom and received 225,000,000 Deutsche Telekom shares (the reference price: €20 per share;
4.5% of Deutsche Telekom’s outstanding shares) as consideration. Under the Agreement, Deutsche Telekom
also provided its consent for the Company to have additional flexibility to pledge its T-Mobile shares in con-
nection with the entry into margin loans and other monetization transactions and agreed that it will prioritize
the use of cash proceeds from certain divestitures to exercise additional Deutsche Telekom Call Options for
cash up to an aggregate of $2.4 billion of the total exercise price, subject to certain conditions. Following entry
into the Agreement, the Company carried out the following monetization transactions using T-Mobile shares.
Transaction Procured
amount
Execution
timing
Number of shares held
T-Mobile
shares
(millions)
Deutsche Tel-
ekom shares
(millions)
a Borrowing made using 106,291,623 T-Mo-
bile shares pledged as collateral (margin
loan) $4.4 billion Jul 2020
Number of shares held as of June 30, 2021 106.3 -
b Fund procurement through prepaid forward
contracts using 17,935,000 T-Mobile
shares $1.8 billion
Sep 2021
c Borrowing made using 42,989,954 T-Mo-
bile shares pledged as collateral (margin
loan) $2.6 billion
d Repayment of borrowings in “a” using
funds acquired in “b” and “c” $(4.4) billion
e 60-day loan using 45,366,669 T-Mobile
shares pledged as collateral (bridge loan) $1.3 billion
f Sale of 45,366,669 T-Mobile shares to
Deutsche Telekom, receiving 225,000,000
Deutsche Telekom shares as consideration - (45.4) 225.0
Number of shares held as of September 30, 2021 60.9 225.0
As described above, the Company plans to sell an additional approximately 20 million shares of the
60,924,954 T-Mobile shares continued to be held through Deutsche Telekom’s exercise of additional Deutsche
Telekom Call Options for cash using its proceeds from certain divestitures for up to $2.4 billion of total exercise
price. Approximately half of these proceeds will be used to repay the proportional margin loan which these
shares underlie.
SoftBank Group Corp. Consolidated Financial Report For the Six-Month Period Ended September 30, 2021
12
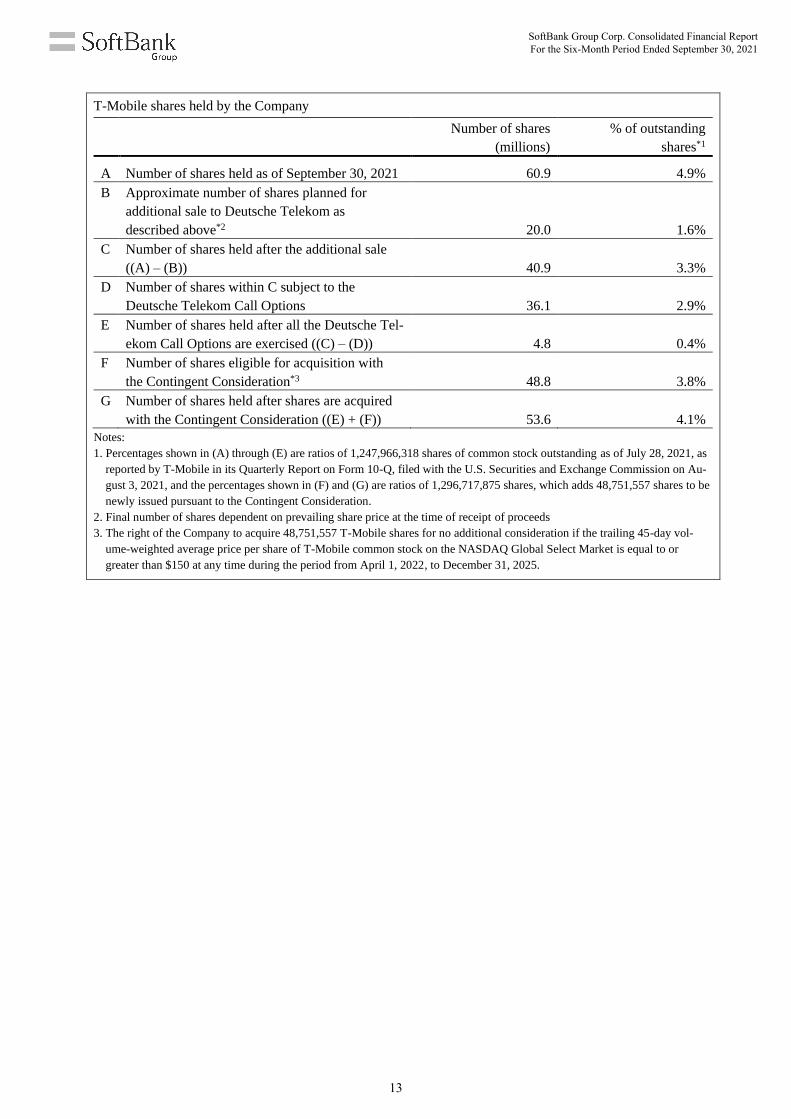
T-Mobile shares held by the Company
Number of shares
(millions)
% of outstanding
shares*1
A Number of shares held as of September 30, 2021 60.9 4.9%
B Approximate number of shares planned for
additional sale to Deutsche Telekom as
described above*2 20.0 1.6%
C Number of shares held after the additional sale
((A) – (B)) 40.9 3.3%
D Number of shares within C subject to the
Deutsche Telekom Call Options 36.1 2.9%
E Number of shares held after all the Deutsche Tel-
ekom Call Options are exercised ((C) – (D)) 4.8 0.4%
F Number of shares eligible for acquisition with
the Contingent Consideration*3 48.8 3.8%
G Number of shares held after shares are acquired
with the Contingent Consideration ((E) + (F)) 53.6 4.1%
Notes:
1. Percentages shown in (A) through (E) are ratios of 1,247,966,318 shares of common stock outstanding as of July 28, 2021, as
reported by T-Mobile in its Quarterly Report on Form 10-Q, filed with the U.S. Securities and Exchange Commission on Au-
gust 3, 2021, and the percentages shown in (F) and (G) are ratios of 1,296,717,875 shares, which adds 48,751,557 shares to be
newly issued pursuant to the Contingent Consideration.
2. Final number of shares dependent on prevailing share price at the time of receipt of proceeds
3. The right of the Company to acquire 48,751,557 T-Mobile shares for no additional consideration if the trailing 45-day vol-
ume-weighted average price per share of T-Mobile common stock on the NASDAQ Global Select Market is equal to or
greater than $150 at any time during the period from April 1, 2022, to December 31, 2025.
SoftBank Group Corp. Consolidated Financial Report For the Six-Month Period Ended September 30, 2021
13

INVESTMENT IN LISTED STOCKS AND OTHER INSTRUMENTS BY THE ASSET MANAGEMENT SUBSIDIARIES
Main impact on the financial position and gain (loss) on investments (Millions of yen)
Investor Investment type
Condensed Interim Consolidated Statement of Financial Position
Condensed Interim Consolidated Statement of Income
Cumulative gain (loss)
since inception Account
Balance at Q2E (Parentheses show
liabilities) Account
Amount recorded
Q1-Q2
SBG Stocks
Investment securities 24,373
Realized gain (loss) on investments*1 37,569 259,578
Unrealized gain (loss) on valuation of investments*1 (28,731)
13,557
SB Northstar
Stocks, etc. Investments from asset management subsidiaries 460,022
Realized gain (loss) on investments at asset management subsidiaries 62,951
42,414
Securities pledged as collateral in asset management subsidiaries 67,923
Unrealized gain (loss) on valuation of investments at asset management subsidiaries*3 (79,778)
54,296 Credit transactions Borrowed securities*2 -
Derivatives Long call options of listed stocks
Derivative financial assets in asset management subsidiaries 129,089
Derivative gain (loss) on investments at asset management subsidiaries 76,185
(534,505)
Short call options of listed stocks
Derivative financial liabilities in asset management subsidiaries -
Short stock index futures contracts - -
Total return swap contracts related to listed stocks
Derivative financial assets in asset management subsidiaries -
Derivative financial liabilities in asset management subsidiaries (39)
Long forward contracts related to listed stocks
Derivative financial assets in asset management subsidiaries -
Derivative financial liabilities in asset management subsidiaries (1,749)
Notes: 1. Some of the listed shares acquired by SBG in the first and second quarters of the previous fiscal year were transferred to
SB Northstar in the second quarter of the previous fiscal year. For a portion of such listed shares that were sold to third parties by SB Northstar following the transfer, the difference between the acquisition value paid by SBG and the transfer value to SB Northstar is presented as “realized gain (loss) on investments.” When SB Northstar sells such listed shares to third parties, the corresponding difference was reclassified from “unrealized gain (loss) on valuation of investments” to “realized gain (loss) on investments.”
2. The fair value of the securities borrowed for short credit transactions 3. After elimination of intercompany transactions 4. 33% of the gain (loss) on investments at SB Northstar 5. Excludes impacts such as selling, general and administrative expenses and tax expenses.
Gain (loss) on investments at Investment Business of Holding Companies 68,196 (164,660)
Net income attributable to non-controlling interests*4,*5 (19,786) 145,931
Impact on net income attributable to owners of the parent*5 48,410 (18,729)
SoftBank Group Corp. Consolidated Financial Report For the Six-Month Period Ended September 30, 2021
14

Impact of the asset management subsidiaries on the Company’s Condensed Interim Consolidated Statement of
Financial Position*1
As of September 30, 2021
(Millions of yen)
September 30, 2021
Cash and cash equivalents 237,306
Investments from asset management subsidiaries 460,022
Securities pledged as collateral in asset management subsidiaries 67,923
Derivative financial assets in asset management subsidiaries 129,089
Other financial assets 40,677
Other 393
Total assets 935,410
Interest-bearing debt 286,257
Derivative financial liabilities in asset management subsidiaries 1,788
Other financial liabilities 68,863
Other 3,997
Total liabilities 360,905
Investments from Delaware subsidiaries*2 1,037,297
Equivalent amount of cash investments by SBG in Delaware subsidiaries 39,786
Equivalent amount of loans to Delaware subsidiaries held by SBG
(the amount entrusted by SBG related to asset management) 977,618
Equivalent amount of cash investments by Masayoshi Son in Delaware subsidiaries 19,893 A
Retained earnings (461,240) B
Exchange differences on translating foreign operations (1,552)
Equity 574,505 C
Notes:
1. SB Northstar’s statement of financial position, excluding the impact of Alibaba shares contributed in kind to SB Northstar by SBG
via Delaware subsidiaries and investments made by SB Northstar in SPACs controlled by SBIA US, is presented for reference to
show the impact of SB Northstar on the Condensed Interim Consolidated Statement of Financial Position of the Company.
2. Investments from the Company’s subsidiaries, Delaware Project 1 L.L.C., Delaware Project 2 L.L.C., and Delaware Project 3 L.L.C.
(“Delaware subsidiaries”), to the asset management subsidiary, SB Northstar
(Calculation of non-controlling interests)
(Millions of yen)
Equivalent amount of cash investments by Masayoshi Son in Delaware subsidiaries 19,893 A
Cumulative loss attributable to non-controlling interests*3 (153,674)
Exchange differences on translating foreign operations (1,329)
Non-controlling interests (interests of Masayoshi Son) (135,110) D
Note:
3. One-third of B in the table
(Interests in equity (C above))
(Millions of yen)
Interests of SBG 709,615
Non-controlling interests (interests of Masayoshi Son) (135,110) D
Equity 574,505 C
SoftBank Group Corp. Consolidated Financial Report For the Six-Month Period Ended September 30, 2021
15

Status of assets
As of September 30, 2021
a. Stocks, etc.
(Millions of U.S. dollars)
Fair value as of September 30, 2021
Stock
AbCellera Biologics Inc. 197
Arqit Quantum Inc. 10
Doma Holdings, Inc. 20
Lyell Immunopharma, Inc. 52
Pacific Biosciences of California, Inc. 208
Sana Biotechnology, Inc. 50
SomaLogic, Inc. 27
Sema4 Holdings Corp. 68
11 SPACs 311
Including three SPACs controlled by SBIA US*1 51
Others 2,568
NVIDIA Corporation*2 218
Others
Convertible bonds 1,256
Total 4,987
Notes:
1. Investments into the three SPACs controlled by SBIA US are eliminated in consolidation as intercompany transactions.
2. The NVIDIA shares are held by SBG.
b. Derivatives
(Millions of U.S. dollars)
Fair value as of September 30, 2021*1 Notional principal
Long call options of listed stocks 1,153 4,872
Total return swap contracts related to listed stocks (0) 3
Long forward contracts related to listed stocks (16) 1,953
Total 1,137 6,828
Note:
1. Parentheses show liabilities.
SoftBank Group Corp. Consolidated Financial Report For the Six-Month Period Ended September 30, 2021
16

MAIN INTEREST-BEARING DEBT AND LEASE LIABILITIES IN THIS SEGMENT
Borrower Type
Balance as of September 30, 2021
in Condensed Interim
Consolidated Statement of
Financial Position
SBG Borrowings ¥1,245.7 billion
Corporate bonds ¥6,002.4 billion
Lease liabilities ¥12.7 billion
Commercial paper ¥237.1 billion
Wholly owned subsidiaries
conducting fund procurement
Prepaid forward contracts using Alibaba shares
(floor contracts, collar contracts, and a forward
contract) ¥3,852.7 billion
Borrowings using Alibaba shares (margin loan) ¥1,114.4 billion
Borrowings using SoftBank Corp. shares
(margin loan) ¥499.3 billion
Prepaid forward contracts using T-Mobile shares
(collar contracts)
¥229.4 billion
Borrowings using T-Mobile shares
(margin loan and bridge loan) ¥435.3 billion
SB Northstar Borrowings ¥286.3 billion
Note:
1. Borrowings of wholly owned subsidiaries conducting fund procurement are non-recourse to SBG, except for borrowings using T-
Mobile shares which SBG partially guarantees.
SoftBank Group Corp. Consolidated Financial Report For the Six-Month Period Ended September 30, 2021
17
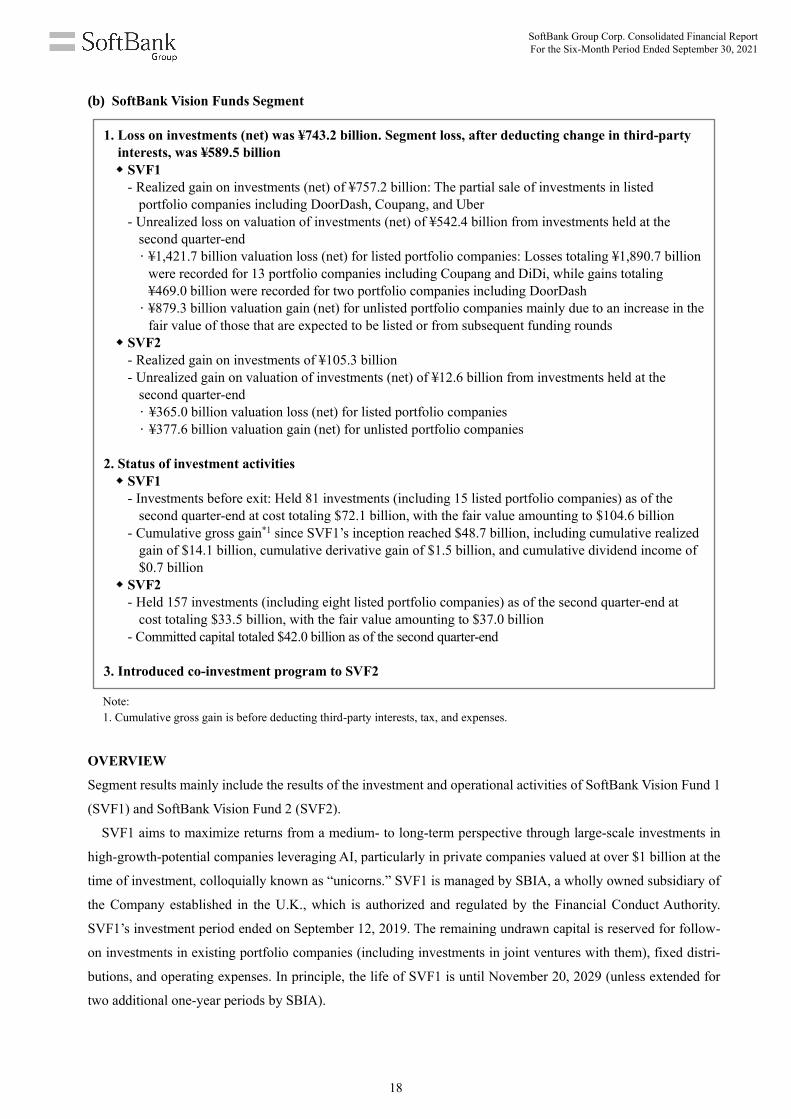
(b) SoftBank Vision Funds Segment
1. Loss on investments (net) was ¥743.2 billion. Segment loss, after deducting change in third-party
interests, was ¥589.5 billion
SVF1
- Realized gain on investments (net) of ¥757.2 billion: The partial sale of investments in listed
portfolio companies including DoorDash, Coupang, and Uber
- Unrealized loss on valuation of investments (net) of ¥542.4 billion from investments held at the
second quarter-end
· ¥1,421.7 billion valuation loss (net) for listed portfolio companies: Losses totaling ¥1,890.7 billion
were recorded for 13 portfolio companies including Coupang and DiDi, while gains totaling
¥469.0 billion were recorded for two portfolio companies including DoorDash
· ¥879.3 billion valuation gain (net) for unlisted portfolio companies mainly due to an increase in the
fair value of those that are expected to be listed or from subsequent funding rounds
SVF2
- Realized gain on investments of ¥105.3 billion
- Unrealized gain on valuation of investments (net) of ¥12.6 billion from investments held at the
second quarter-end
· ¥365.0 billion valuation loss (net) for listed portfolio companies
· ¥377.6 billion valuation gain (net) for unlisted portfolio companies
2. Status of investment activities
SVF1
- Investments before exit: Held 81 investments (including 15 listed portfolio companies) as of the
second quarter-end at cost totaling $72.1 billion, with the fair value amounting to $104.6 billion
- Cumulative gross gain*1 since SVF1’s inception reached $48.7 billion, including cumulative realized
gain of $14.1 billion, cumulative derivative gain of $1.5 billion, and cumulative dividend income of
$0.7 billion
SVF2
- Held 157 investments (including eight listed portfolio companies) as of the second quarter-end at
cost totaling $33.5 billion, with the fair value amounting to $37.0 billion
- Committed capital totaled $42.0 billion as of the second quarter-end
3. Introduced co-investment program to SVF2
Note:
1. Cumulative gross gain is before deducting third-party interests, tax, and expenses.
OVERVIEW
Segment results mainly include the results of the investment and operational activities of SoftBank Vision Fund 1
(SVF1) and SoftBank Vision Fund 2 (SVF2).
SVF1 aims to maximize returns from a medium- to long-term perspective through large-scale investments in
high-growth-potential companies leveraging AI, particularly in private companies valued at over $1 billion at the
time of investment, colloquially known as “unicorns.” SVF1 is managed by SBIA, a wholly owned subsidiary of
the Company established in the U.K., which is authorized and regulated by the Financial Conduct Authority.
SVF1’s investment period ended on September 12, 2019. The remaining undrawn capital is reserved for follow-
on investments in existing portfolio companies (including investments in joint ventures with them), fixed distri-
butions, and operating expenses. In principle, the life of SVF1 is until November 20, 2029 (unless extended for
two additional one-year periods by SBIA).
SoftBank Group Corp. Consolidated Financial Report For the Six-Month Period Ended September 30, 2021
18

SVF2 launched in October 2019 with committed capital from SBG, aiming to facilitate the continued accelera-
tion of the AI revolution through investment in market-leading, tech-enabled growth companies across vintage
years. While SVF2 was previously managed by SBIA, since the second quarter, the fund has been managed by
SBGA, a wholly owned subsidiary of the Company established in the U.K. Investment management decisions of
SVF2 are made through an investment committee established in SBGA. SBGA is headed by Rajeev Misra, CEO
of SBIA, who is also a member of the investment committee. SBGA outsources the majority of its investment and
operating functions to SBIA and SBIA continues to support the management of SVF2 under a service agreement.
In addition, MASA USA LLC (“MgmtCo”), an investment entity for the co-investment program, newly partici-
pated in the fund in the second quarter.5 The interest attributable to MgmtCo is treated as a third-party interest in
the Company’s consolidated financial statements. As of the second quarter-end, SVF2’s total committed capital is
$42.0 billion.
In addition, SBIA US uses SPACs to complement its investments in listed and unlisted companies and to pursue
a wider range of investment opportunities beyond the investment mandates for the private funds. The SPACs
controlled by SBIA US, specifically SVF Investment Corp., SVF Investment Corp. 2, and SVF Investment Corp.
3, were listed on the Nasdaq in January, March, and March 2021, respectively, and such SPACs aim to complete
their business combinations within two years of the closing of each offering. After such business combinations,
SBIA US expects to cease control of the combined companies.
Co-investment Program of SVF2
In the second quarter, SVF2 introduced a co-investment program with restricted rights to receive distributions (the
“Program”). Under the Program, the Company’s management makes joint investments with the Company and
shares both the profits and also the risks associated with the investments. The Program aims the Company’s man-
agement to further focus on SVF2 and contribute to the Company’s earnings growth.
The Program targets an approved selection of SVF2’s investments, including investments in private portfolio
companies held or intended to be held by SVF2 as of June 23, 2021, and any new investments executed on or after
June 24, 2021 (excluding any follow-on investments to the portfolio companies that are outside of the Program’s
scope). Target investments are held by SVF II Investment Holdings LLC (“SVF2 LLC”), a subsidiary of the Com-
pany established beneath SVF2. SVF2 LLC issued equity6 to the Company and MgmtCo. Accordingly, the Com-
pany holds 82.75% and MgmtCo holds 17.25% of the total equity interests. These equity interests are entitled to
performance-based distributions that are allocated based on the proportion of respective equity contributions.
Distributions from SVF2 LLC to MgmtCo are subject to certain restrictions. Specifically, distribution will not
be made to MgmtCo until the sum of proceeds received by SVF2 LLC from realized investments plus the aggregate
fair market value of all of SVF2 LLC’s unrealized investments (net of borrowings) exceeds 130% of the aggregate
acquisition cost of all of SVF2 LLC’s investments. After the ratio exceeds 130%, restrictions on distributions to
MgmtCo will be released proportionately in increments of 10%. When the ratio reaches 200%, all restrictions will
be released and MgmtCo will be entitled to receive the full amount of the distribution.
MgmtCo is entitled to make full or partial payment of its capital contribution in SVF2 LLC at any point in time
and is required to pay a premium calculated at 3% per annum on outstanding receivable of SVF2 LLC.7 Any
distributable amount from SVF2 LLC to MgmtCo is offset against receivables at the time of the distribution notice
SoftBank Group Corp. Consolidated Financial Report For the Six-Month Period Ended September 30, 2021
19
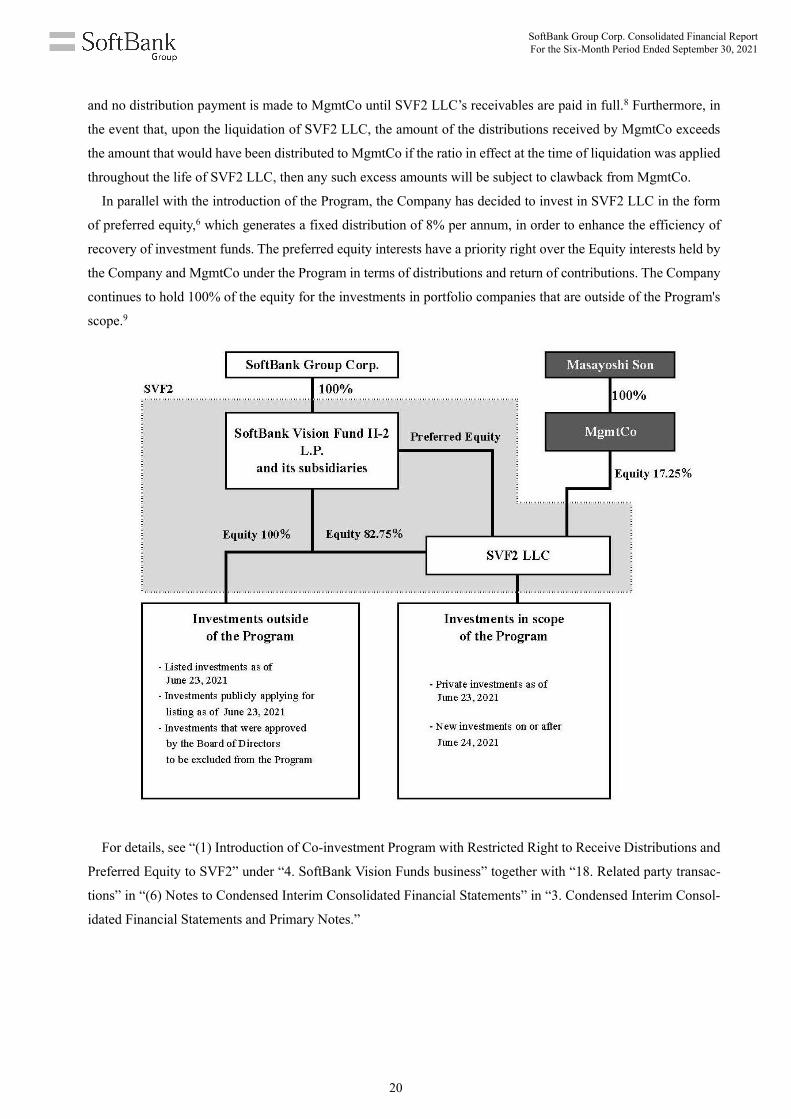
and no distribution payment is made to MgmtCo until SVF2 LLC’s receivables are paid in full.8 Furthermore, in
the event that, upon the liquidation of SVF2 LLC, the amount of the distributions received by MgmtCo exceeds
the amount that would have been distributed to MgmtCo if the ratio in effect at the time of liquidation was applied
throughout the life of SVF2 LLC, then any such excess amounts will be subject to clawback from MgmtCo.
In parallel with the introduction of the Program, the Company has decided to invest in SVF2 LLC in the form
of preferred equity,6 which generates a fixed distribution of 8% per annum, in order to enhance the efficiency of
recovery of investment funds. The preferred equity interests have a priority right over the Equity interests held by
the Company and MgmtCo under the Program in terms of distributions and return of contributions. The Company
continues to hold 100% of the equity for the investments in portfolio companies that are outside of the Program's
scope.9
For details, see “(1) Introduction of Co-investment Program with Restricted Right to Receive Distributions and
Preferred Equity to SVF2” under “4. SoftBank Vision Funds business” together with “18. Related party transac-
tions” in “(6) Notes to Condensed Interim Consolidated Financial Statements” in “3. Condensed Interim Consol-
idated Financial Statements and Primary Notes.”
SoftBank Group Corp. Consolidated Financial Report For the Six-Month Period Ended September 30, 2021
20

Outline of principal funds in the segment
As of September 30, 2021
SoftBank Vision Fund 1 SoftBank Vision Fund 2
Major limited partnership SoftBank Vision Fund L.P. SoftBank Vision Fund II-2 L.P.
Total committed capital
(Billions of U.S. dollars) 98.6 42.0
The Company: 33.1*1
Third-party investors: 65.5
The Company: 39.4
Third-party investor (MgmtCo): 2.6
General partner SVF GP (Jersey) Limited
(The Company’s wholly owned over-
seas subsidiary)
SVF II GP (Jersey) Limited
(The Company’s wholly owned over-
seas subsidiary)
Investment period Ended on September 12, 2019 Not disclosed
Minimum fund life Until November 20, 2029 (in principle)
Note:
1. The Company’s committed capital to SVF1 includes approximately $8.2 billion of an obligation satisfied by using Arm shares
(all said shares have been contributed) and $2.5 billion earmarked for purposes of an incentive scheme related to SVF1.
For a complete list of SVF1 and SVF2’s portfolio companies, see the Data Sheets in “Materials” under “Earnings Results Brief-
ing” on the Company’s website at https://group.softbank/en/ir/presentations/.
SoftBank Group Corp. Consolidated Financial Report For the Six-Month Period Ended September 30, 2021
21

Capital deployment
As of September 30, 2021
SVF1 (Billions of U.S. dollars)
Total The Company Third-party investors
Committed capital (A) 98.6 33.1 65.5
Drawn capital10 (B) 86.4 29.6 56.8
Return of capital (non-recallable) (C) 26.4 6.4 20.0
Outstanding capital (D) = (B) – (C) 60.0 23.2 36.8
Remaining committed capital (E) = (A) – (B) 12.2 3.5 8.7
Note: The Company’s committed capital to SVF1 includes approximately $8.2 billion of an obligation that is satisfied by using
Arm shares (all said shares have been contributed) and $2.5 billion earmarked for purposes of an incentive scheme related to
SVF1.
SVF2
(Billions of U.S. dollars)
Total
Committed capital (A) 42.0
Drawn capital (B) 33.9
Remaining committed capital (C) = (A) – (B) 8.1
Note: Remaining committed capital includes recallable return of capital.
(Reference: Breakdown of committed capital as of September 30, 2021)
Total committed capital 42.0
The Company’s Equity commitment to investments outside of the Program 7.7
The Company’s Preferred Equity commitment to SVF2 LLC 19.3
The Company’s Equity commitment to SVF2 LLC 12.4
MgmtCo’s Equity commitment to SVF2 LLC 2.6
Note: As of the second quarter-end, no capital was paid by MgmtCo.
SoftBank Group Corp. Consolidated Financial Report For the Six-Month Period Ended September 30, 2021
22

FINANCIAL RESULTS
(Millions of yen)
Six months ended September 30
2020 2021 Change Change %
Gain (loss) on investments at SVF1, SVF2,
and others*1 1,411,567 (743,164) (2,154,731) - A
Realized gain on investments 141,385 862,522 721,137 510.1%
Unrealized gain (loss) on valuation of
investments 1,260,592 (1,553,736) (2,814,328) -
Change in valuation for the fiscal year 1,342,001 (529,840) (1,871,841) -
Reclassified to realized gain recorded in
the past fiscal year*2 (81,409) (1,023,896) (942,487) -
Dividend income from investments 4,623 22,635 18,012 389.6%
Derivative gain (loss) on investments 1,091 (42,370) (43,461) -
Effect of foreign exchange translation 3,876 (32,215) (36,091) -
Selling, general and administrative expenses (34,430) (30,051) 4,379 (12.7%)
Finance cost (6,228) (9,679) (3,451) 55.4%
Derivative gain (excluding gain (loss) on
investments) - 1,424 1,424 -
Change in third-party interests in SVF1 and
SVF2 (457,537) 195,179 652,716 - B
Other gain (loss) 617 (3,245) (3,862) -
Segment income (income before income tax) 913,989 (589,536) (1,503,525) -
Notes:
1. Because Arm is a subsidiary of the Company, unrealized gains and losses associated with the change in valuation on SVF1’s
holdings of Arm, as well as dividends income received from Arm (which includes shares of Treasure Data, Inc. received as divi-
dends in kind), are included in segment income as “gain (loss) on investments at SVF1, SVF2, and others,” but are eliminated in
consolidation and not included in “gain (loss) on investments at SVF1, SVF2, and others” in the Condensed Interim Consoli-
dated Statement of Income.
2. Unrealized gains and losses on valuation of investments recorded in prior fiscal years related to the investments realized in the
fiscal year are reclassified as “realized gain on investments.”
During the period, SVF1 made a new investment and follow-on investments totaling $2.5 billion2 and sold all of
its shares in one portfolio company and a portion of its shares in nine portfolio companies for a total of $12.1
billion11 of which the initial acquisition cost was $5.3 billion.2 SVF2 made new and follow-on investments totaling
$27.2 billion and sold all of its shares in one portfolio company and a portion of its shares in another portfolio
company for a total of $1.3 billion, of which the initial acquisition cost was $0.4 billion.
SoftBank Group Corp. Consolidated Financial Report For the Six-Month Period Ended September 30, 2021
23

Segment income
A Loss on investments at SVF1, SVF2, and others: ¥(743,164) million
· SVF1
- Realized gain on investments (net) of ¥757,217 million was recorded mainly due to the sale2 of all of its
shares in one portfolio company and a portion of its shares in nine portfolio companies including DoorDash,
Coupang, and Uber Technologies Inc (“Uber”).
- Unrealized loss on valuation of investments held by SVF1 at the second quarter-end was ¥542,405 million
($4,894 million, net) (see “SVF1” under “Investment performance” below for a breakdown). Valuation loss
(net) totaling $12,861 million for listed portfolio companies was recorded due to the decline in the share
prices of 13 portfolio companies, including Coupang and DiDi, despite an increase in the share prices of two
portfolio companies including DoorDash. On the other hand, valuation gain (net) totaling $7,967 million was
recorded for unlisted portfolio companies mainly due to an increase in the fair value of those that are expected
to be listed or from subsequent funding rounds.
· SVF2
- Realized gain on investments of ¥105,305 million was recorded as a result of an entire sale of one portfolio
company and the partial sale of KE Holdings.
- Unrealized gain on valuation of investments was ¥12,565 million ($116 million, net) (see “SVF2” under
“Investment performance” below for a breakdown). Valuation loss (net) of $3,306 million for listed portfolio
companies was recorded, mainly due to a decline in the share price of KE Holdings. On the other hand,
valuation gain (net) totaling $3,421 million was recorded for unlisted portfolio companies, mainly due to an
increase in the fair value of those that are expected to be listed.
B Change in third-party interests in SVF1 and SVF2: ¥195,179 million
This indicates the sum of distributions to third-party investors in proportion to their interests in fixed distributions
and performance-based distributions, which are based on the gains and losses on investments at SVF1 and SVF2,
net of management and performance fees payable to each manager, and operating and other expenses of SVF1 and
SVF2. For details, see “(4) Third-party interests in SVF1 and SVF2” under “4. SoftBank Vision Funds business”
in “(6) Notes to Condensed Interim Consolidated Financial Statements” in “3. Condensed Interim Consolidated
Financial Statements and Primary Notes.”
SoftBank Group Corp. Consolidated Financial Report For the Six-Month Period Ended September 30, 2021
24
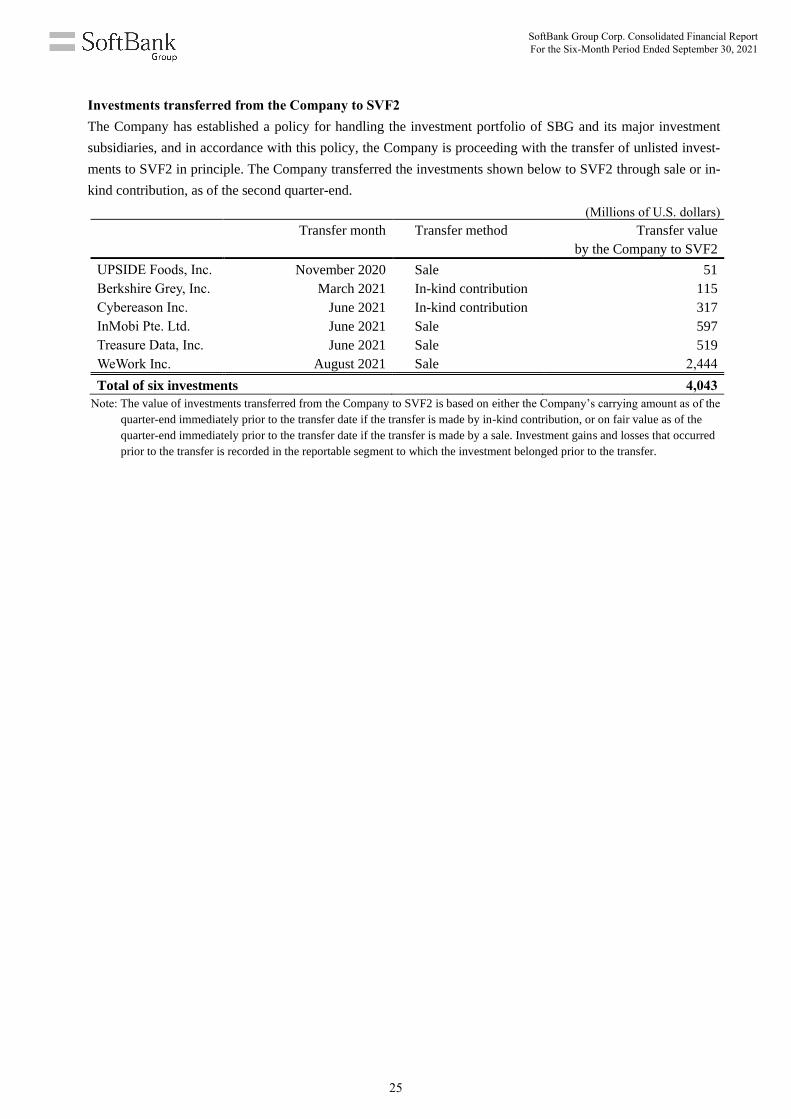
Investments transferred from the Company to SVF2
The Company has established a policy for handling the investment portfolio of SBG and its major investment
subsidiaries, and in accordance with this policy, the Company is proceeding with the transfer of unlisted invest-
ments to SVF2 in principle. The Company transferred the investments shown below to SVF2 through sale or in-
kind contribution, as of the second quarter-end.
(Millions of U.S. dollars)
Transfer month Transfer method Transfer value
by the Company to SVF2
UPSIDE Foods, Inc. November 2020 Sale 51
Berkshire Grey, Inc. March 2021 In-kind contribution 115
Cybereason Inc. June 2021 In-kind contribution 317
InMobi Pte. Ltd. June 2021 Sale 597
Treasure Data, Inc. June 2021 Sale 519
WeWork Inc. August 2021 Sale 2,444
Total of six investments 4,043
Note: The value of investments transferred from the Company to SVF2 is based on either the Company’s carrying amount as of the
quarter-end immediately prior to the transfer date if the transfer is made by in-kind contribution, or on fair value as of the
quarter-end immediately prior to the transfer date if the transfer is made by a sale. Investment gains and losses that occurred
prior to the transfer is recorded in the reportable segment to which the investment belonged prior to the transfer.
SoftBank Group Corp. Consolidated Financial Report For the Six-Month Period Ended September 30, 2021
25
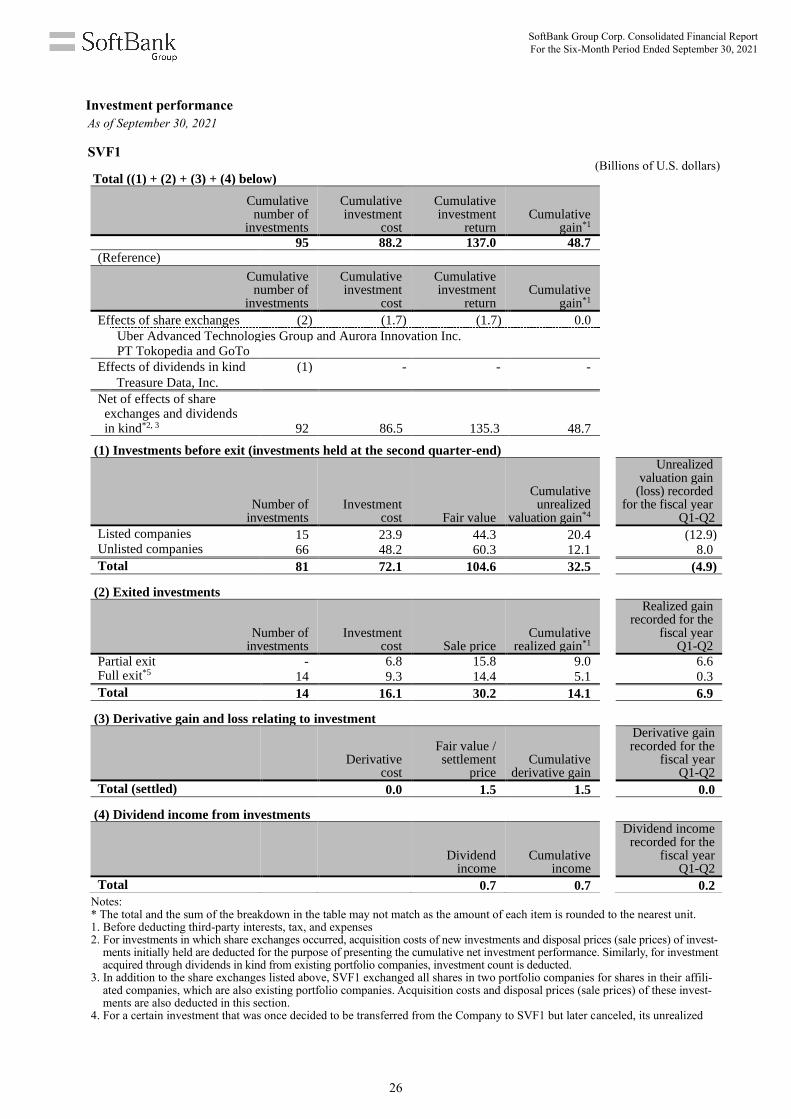
Investment performance
As of September 30, 2021 SVF1
(Billions of U.S. dollars) Total ((1) + (2) + (3) + (4) below)
Cumulative number of
investments
Cumulative investment
cost
Cumulative investment
return Cumulative
gain*1
95 88.2 137.0 48.7 (Reference)
Cumulative number of
investments
Cumulative investment
cost
Cumulative investment
return Cumulative
gain*1
Effects of share exchanges (2) (1.7) (1.7) 0.0
Uber Advanced Technologies Group and Aurora Innovation Inc.
PT Tokopedia and GoTo
Effects of dividends in kind (1) - - -
Treasure Data, Inc.
Net of effects of share exchanges and dividends in kind*2, 3 92 86.5 135.3 48.7
(1) Investments before exit (investments held at the second quarter-end)
Number of investments
Investment cost Fair value
Cumulative unrealized
valuation gain*4
Unrealized valuation gain
(loss) recorded for the fiscal year
Q1-Q2
Listed companies 15 23.9 44.3 20.4 (12.9) Unlisted companies 66 48.2 60.3 12.1 8.0
Total 81 72.1 104.6 32.5 (4.9)
(2) Exited investments
Number of
investments Investment
cost Sale price Cumulative
realized gain*1
Realized gain recorded for the
fiscal year Q1-Q2
Partial exit - 6.8 15.8 9.0 6.6 Full exit*5 14 9.3 14.4 5.1 0.3
Total 14 16.1 30.2 14.1 6.9
(3) Derivative gain and loss relating to investment
Derivative
cost
Fair value / settlement
price Cumulative
derivative gain
Derivative gain recorded for the
fiscal year Q1-Q2
Total (settled) 0.0 1.5 1.5 0.0
(4) Dividend income from investments
Dividend
income Cumulative
income
Dividend income recorded for the
fiscal year Q1-Q2
Total 0.7 0.7 0.2 Notes: * The total and the sum of the breakdown in the table may not match as the amount of each item is rounded to the nearest unit. 1. Before deducting third-party interests, tax, and expenses 2. For investments in which share exchanges occurred, acquisition costs of new investments and disposal prices (sale prices) of invest-
ments initially held are deducted for the purpose of presenting the cumulative net investment performance. Similarly, for investment acquired through dividends in kind from existing portfolio companies, investment count is deducted.
3. In addition to the share exchanges listed above, SVF1 exchanged all shares in two portfolio companies for shares in their affili-ated companies, which are also existing portfolio companies. Acquisition costs and disposal prices (sale prices) of these invest-ments are also deducted in this section.
4. For a certain investment that was once decided to be transferred from the Company to SVF1 but later canceled, its unrealized
SoftBank Group Corp. Consolidated Financial Report For the Six-Month Period Ended September 30, 2021
26

valuation gains and losses incurred for the period leading up to the decision to cancel the transfer are not included in the presen-tation.
5. Includes disposal (sale) through share exchanges.
SVF2
(Billions of U.S. dollars)
Total ((1) + (2) + (3) + (4) below)
Cumulative number of
investments
Cumulative investment
cost
Cumulative investment
return Cumulative
gain*1
158 33.9 37.9 4.0
(1) Investments before exit (investments held at the second quarter-end)
Number of
investments Investment
cost*2 Fair value*2
Cumulative unrealized
valuation gain
Unrealized valuation gain
(loss) recorded for the fiscal year
Q1-Q2
Listed companies 8 3.2 3.3 0.1 (3.3) Unlisted companies 149 30.3 33.7 3.4 3.4
Total 157 33.5 37.0 3.5 0.1
(2) Exited investments
Number of
investments Investment
cost Sale price
Cumulative realized
gain*1
Realized gain recorded for
the fiscal year Q1-Q2
Partial exit - 0.4 1.2 0.8 0.9 Full exit 1 0.0 0.1 0.1 0.1
Total 1 0.4 1.3 0.9 1.0 (3) Derivative gain and loss relating to investment
Derivative
cost Fair value Cumulative
derivative loss
Derivative loss recorded for
the fiscal year Q1-Q2
Total - (0.4) (0.4) (0.4)
(4) Dividend income from investments
Dividend
income Cumulative
income
Dividend income recorded for
the fiscal year Q1-Q2
Total 0.0 0.0 0.0 Notes: 1. Before deducting tax and expenses 2. The investment cost and fair value of investments before exit in SVF2 include those related to a minor SVF2 ownership percent-
age in another portfolio company received as part of the consideration for SVF2’s investment in a portfolio company.
SoftBank Group Corp. Consolidated Financial Report For the Six-Month Period Ended September 30, 2021
27

(Reference) Investments before exit (investments held at the second quarter-end) As of September 30, 2021
SVF1
(Billions of U.S. dollars)
Sector Number of
investments Investment cost Fair value
Cumulative
unrealized valua-
tion gain (loss)
Unrealized valuation
gain (loss) recorded
for the fiscal year
Q1-Q2
a Consumer 12 10.6 32.6 22.0 (7.2)
b Edtech 1 0.7 0.1 (0.6) (1.0)
c Enterprise 7 1.6 2.5 0.9 0.5
d Fintech 11 4.3 4.5 0.2 1.8
e Frontier Tech 10 11.1 12.3 1.2 0.4
f Health Tech 8 2.0 3.5 1.5 (0.4)
g Logistics 13 8.5 21.0 12.5 5.3
h Proptech 9 10.1 5.2 (4.9) (0.5)
i Transportation 10 23.2 22.9 (0.3) (3.8)
Total 81 72.1 104.6 32.5 (4.9)
(Reference)
Listed companies*1 15 23.9 44.3 20.4 (12.9)
a Coupang 2.4 14.2 11.8 (11.0)
d OneConnect 0.1 0.0 (0.1) (0.1)
d ZhongAn Insurance 0.1 0.1 (0.0) (0.0)
e Zymergen 0.4 0.3 (0.1) (0.5)
f Guardant Health 0.0 0.1 0.1 (0.0)
f Relay Therapeutics 0.3 0.9 0.6 (0.1)
f Vir Biotechnology 0.2 1.0 0.8 (0.2)
g DoorDash 0.5 9.0 8.5 3.2
g Full Truck Alliance 1.7 3.0 1.3 1.0
h Compass 1.1 1.8 0.7 (0.6)
h Opendoor 0.3 0.9 0.6 (0.0)
h View 1.2 0.4 (0.8) (0.1)
i AUTO1 0.7 1.4 0.7 (0.8)
i DiDi 12.0 7.5 (4.5) (2.9)
i Uber 2.9 3.7 0.8 (0.8)
Unlisted companies 66 48.2 60.3 12.1 8.0
Total 81 72.1 104.6 32.5 (4.9) Note: 1. The letter corresponding to the listed companies indicates the sector to which the company belongs. Investments in that sector
are not limited to those listed companies.
SoftBank Group Corp. Consolidated Financial Report For the Six-Month Period Ended September 30, 2021
28
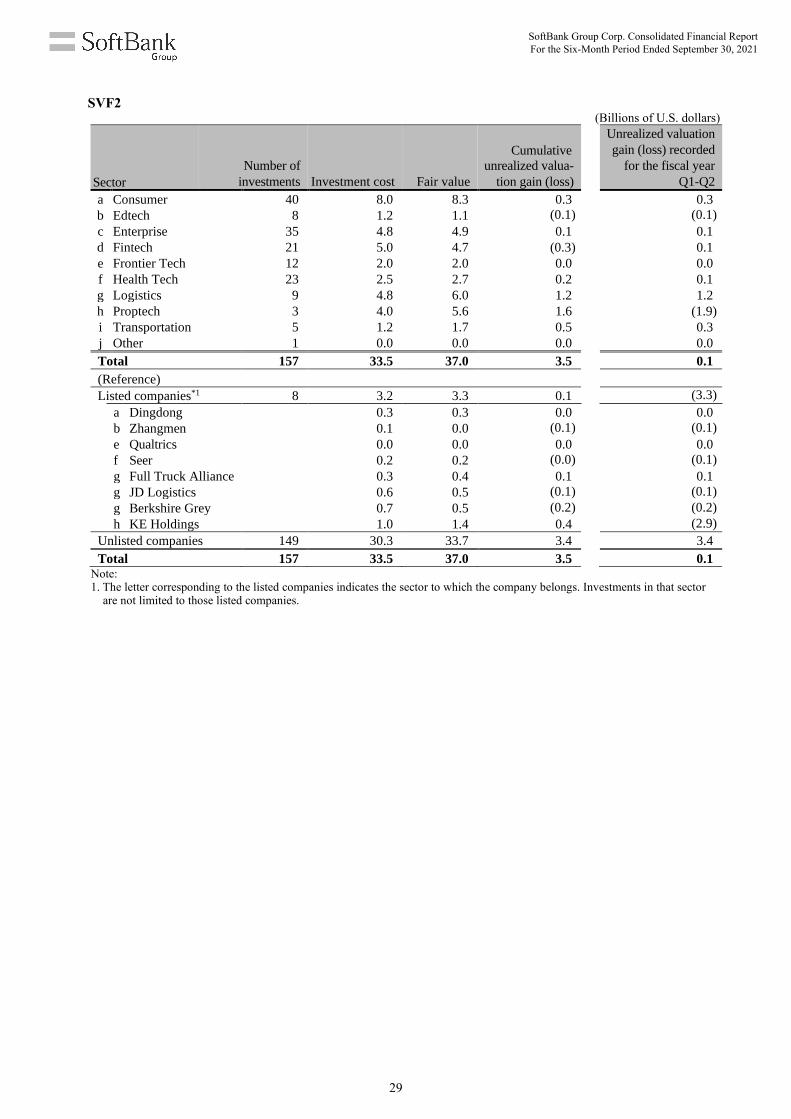
SVF2 (Billions of U.S. dollars)
Sector
Number of
investments Investment cost Fair value
Cumulative
unrealized valua-
tion gain (loss)
Unrealized valuation
gain (loss) recorded
for the fiscal year
Q1-Q2
a Consumer 40 8.0 8.3 0.3 0.3
b Edtech 8 1.2 1.1 (0.1) (0.1)
c Enterprise 35 4.8 4.9 0.1 0.1
d Fintech 21 5.0 4.7 (0.3) 0.1
e Frontier Tech 12 2.0 2.0 0.0 0.0
f Health Tech 23 2.5 2.7 0.2 0.1
g Logistics 9 4.8 6.0 1.2 1.2
h Proptech 3 4.0 5.6 1.6 (1.9)
i Transportation 5 1.2 1.7 0.5 0.3
j Other 1 0.0 0.0 0.0 0.0
Total 157 33.5 37.0 3.5 0.1
(Reference)
Listed companies*1 8 3.2 3.3 0.1 (3.3)
a Dingdong 0.3 0.3 0.0 0.0
b Zhangmen 0.1 0.0 (0.1) (0.1)
e Qualtrics 0.0 0.0 0.0 0.0
f Seer 0.2 0.2 (0.0) (0.1)
g Full Truck Alliance 0.3 0.4 0.1 0.1
g JD Logistics 0.6 0.5 (0.1) (0.1)
g Berkshire Grey 0.7 0.5 (0.2) (0.2)
h KE Holdings 1.0 1.4 0.4 (2.9)
Unlisted companies 149 30.3 33.7 3.4 3.4
Total 157 33.5 37.0 3.5 0.1 Note: 1. The letter corresponding to the listed companies indicates the sector to which the company belongs. Investments in that sector
are not limited to those listed companies.
SoftBank Group Corp. Consolidated Financial Report For the Six-Month Period Ended September 30, 2021
29

(c) SoftBank Segment
Segment income was almost flat yoy; gain on investments improved and income increased in the
enterprise and the Yahoo! JAPAN/LINE businesses, while income decreased in the consumer busi-
ness.
(Millions of yen)
Six months ended September 30
2020 2021 Change Change %
Net sales 2,427,767 2,724,357 296,590 12.2%
Segment income (income before income tax) 533,284 532,125 (1,159) (0.2%)
Depreciation and amortization (348,009) (367,752) (19,743) 5.7%
Gain (loss) on investments (6,043) 20,284 26,327 -
Finance cost (32,920) (31,104) 1,816 (5.5%)
Loss on equity method investments*1 (17,129) (28,254) (11,125) -
Derivative gain (loss)
(excluding gain (loss) on investments) (42) 2 44 -
Note:
1. Includes losses on equity method investments related to PayPay Corporation of ¥13,930 million for the period and ¥14,767 mil-
lion for the same period of the previous fiscal year. At SoftBank Corp., PayPay Corporation is classified as an equity method
associate; however, PayPay Corporation has consistently been classified as a subsidiary of SBG since its founding in June 2018
and its financial results are included in “Other.” For this reason, loss on equity method investments related to PayPay Corpora-
tion recognized in the SoftBank segment is eliminated in “Reconciliations” in segment information.
OVERVIEW
Segment results include the results of business activities conducted by SoftBank Corp., such as provision of mobile
services and sale of mobile devices, as well as provision of internet services and e-commerce services, mainly
inside Japan. Under its Beyond Carrier strategy, SoftBank Corp. aims to strengthen its earnings base by going
beyond the confines of a conventional telecommunications carrier, while further growing the telecommunications
business, and expanding its businesses in three fields: telecommunications business, Yahoo! JAPAN/LINE busi-
ness, and new businesses.
FINANCIAL RESULTS
Segment income was ¥532,125 million, almost flat year on year. This was mainly due to an improved gain on
investments and increases in income in the Yahoo! JAPAN/LINE and enterprise businesses, which more than offset
a decrease in income in the consumer business caused by the impact of lower communication charges for mobile
services. While revenue increase was mainly driven by the consolidation of LINE Corporation and an increase in
sales of mobile devices, their contribution to segment income was tempered by corresponding increases in cost of
sales and selling, general and administrative expenses.
Income in the Yahoo! JAPAN/LINE business increased primarily due to recording gain relating to loss of control
in conjunction with the sale of YJFX, Inc. Income in the enterprise business increased due to an increase in mobile
revenue following the greater demand for remote working, along with an increase in sales of cloud services and
security solutions as the digitization of enterprises accelerates.
For more information on SoftBank Corp.’s financial results and business operations, please refer to its website at
https://www.softbank.jp/en/corp/ir/.
SoftBank Group Corp. Consolidated Financial Report For the Six-Month Period Ended September 30, 2021
30

(d) Arm Segment
1. Continuing strong revenue growth, resulting in positive segment income
Net sales increased by 61.3% yoy.
- Technology royalty revenue increased by 23.8% yoy (U.S. dollar-based) due to strong industry
growth especially in markets where Arm has good exposure such as chips for mobile, infrastructure
and automotive.
- Technology non-royalty revenue increased by 115.6% yoy (U.S. dollar-based) due to the availability
of Arm’s newly developed products combined with some large Arm customers increasing invest-
ments in R&D as they enter new markets.
Strong revenue growth leads to positive segment income. Arm’s ongoing investments in R&D in
previous years are driving the current segment income gains.
2. Cumulative Arm-based chip shipments break 200 billion mark
In the period, Arm’s partners reported that they had shipped 13.7 billion Arm-based chips.12 This takes
the cumulative total of Arm-based chip shipments to over 200 billion since Arm was founded.
(Millions of yen)
Six months ended September 30
2020 2021 Change Change %
Net sales 100,004 161,355 61,351 61.3%
Segment income (income before income tax) (10,821) 33,994 44,815 -
Notes:
1. Since the fourth quarter of the previous fiscal year, the Internet-of-Things Services Group (ISG) business is managed separately
from the Arm business and its results are therefore included in “Other” instead of the Arm segment.
2. Segment income included amortization expenses of ¥24,997 million for the period and ¥24,220 million for the same period of
the previous fiscal year. These expenses are related to intangible assets recognized in the purchase price allocation at the time of
the acquisition of Arm.
OVERVIEW
Arm’s operations primarily consist of licensing of semiconductor intellectual property (IP), including the design
of energy-efficient microprocessors and associated technologies. Arm has accelerated investment in R&D by hir-
ing more engineers. With the expansion of its engineering capability, Arm can develop new technologies that will
help it maintain or increase its share of the existing markets and expand into new markets.
Industry trends and their impact
Semiconductor industry trends can have a significant impact on Arm’s financial results, both positively and nega-
tively. The semiconductor industry has grown very strongly due to long-term trends such as more products and
services depending on increasing amounts of embedded intelligence, such as cars providing more driver infor-
mation and assistance, and smartphones improving camera technology generation after generation for better pho-
tography. Some markets have shown particularly strong growth in the period including 5G smartphones and net-
working equipment as well as embedded and automotive applications, where Arm has good exposure. This growth
has benefited Arm’s technology royalty revenue as it grows with industry sales. Industry growth also accelerated
Arm’s customers’ design activity, creating new opportunities for Arm to license its latest technologies and thus
driving non-royalty revenue (technology licensing revenue and software and services revenue). The industry is
vulnerable to other external factors, including trade disputes and sanctions against specific companies, as well as
the impact of temporary component shortages; for example, some automotive manufacturers and smartphone
SoftBank Group Corp. Consolidated Financial Report For the Six-Month Period Ended September 30, 2021
31
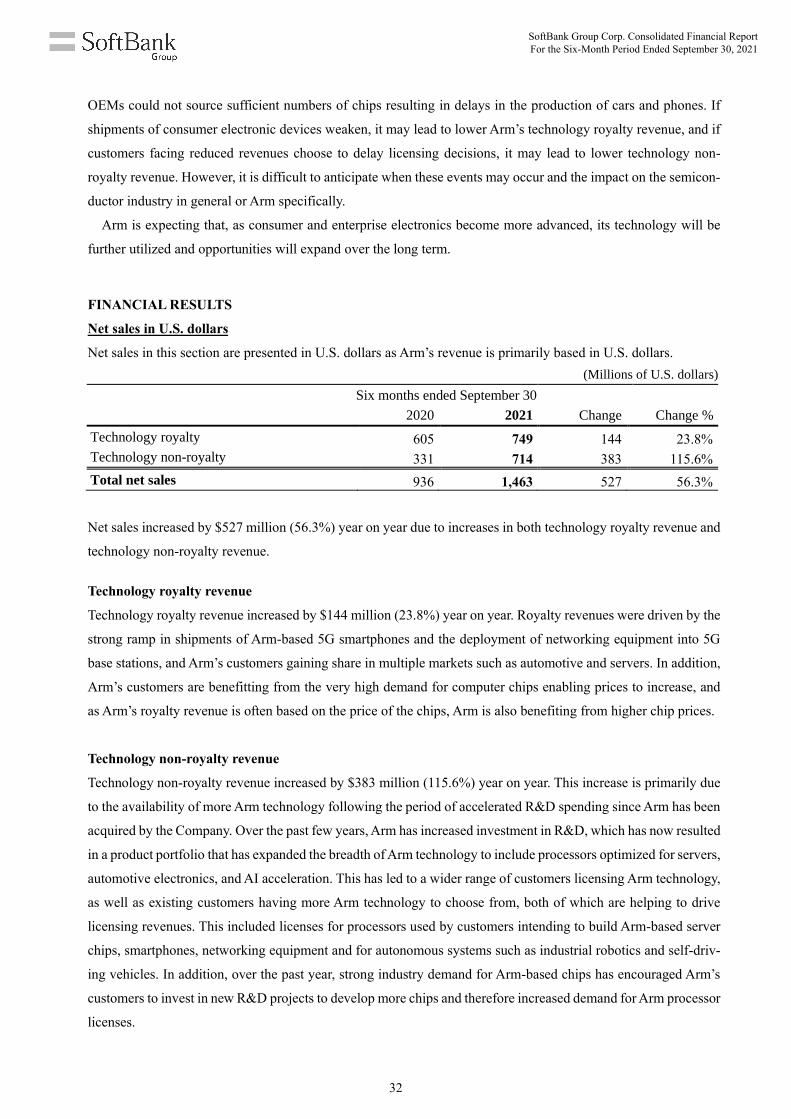
OEMs could not source sufficient numbers of chips resulting in delays in the production of cars and phones. If
shipments of consumer electronic devices weaken, it may lead to lower Arm’s technology royalty revenue, and if
customers facing reduced revenues choose to delay licensing decisions, it may lead to lower technology non-
royalty revenue. However, it is difficult to anticipate when these events may occur and the impact on the semicon-
ductor industry in general or Arm specifically.
Arm is expecting that, as consumer and enterprise electronics become more advanced, its technology will be
further utilized and opportunities will expand over the long term.
FINANCIAL RESULTS
Net sales in U.S. dollars
Net sales in this section are presented in U.S. dollars as Arm’s revenue is primarily based in U.S. dollars.
(Millions of U.S. dollars)
Six months ended September 30
2020 2021 Change Change %
Technology royalty 605 749 144 23.8%
Technology non-royalty 331 714 383 115.6%
Total net sales 936 1,463 527 56.3%
Net sales increased by $527 million (56.3%) year on year due to increases in both technology royalty revenue and
technology non-royalty revenue.
Technology royalty revenue
Technology royalty revenue increased by $144 million (23.8%) year on year. Royalty revenues were driven by the
strong ramp in shipments of Arm-based 5G smartphones and the deployment of networking equipment into 5G
base stations, and Arm’s customers gaining share in multiple markets such as automotive and servers. In addition,
Arm’s customers are benefitting from the very high demand for computer chips enabling prices to increase, and
as Arm’s royalty revenue is often based on the price of the chips, Arm is also benefiting from higher chip prices.
Technology non-royalty revenue
Technology non-royalty revenue increased by $383 million (115.6%) year on year. This increase is primarily due
to the availability of more Arm technology following the period of accelerated R&D spending since Arm has been
acquired by the Company. Over the past few years, Arm has increased investment in R&D, which has now resulted
in a product portfolio that has expanded the breadth of Arm technology to include processors optimized for servers,
automotive electronics, and AI acceleration. This has led to a wider range of customers licensing Arm technology,
as well as existing customers having more Arm technology to choose from, both of which are helping to drive
licensing revenues. This included licenses for processors used by customers intending to build Arm-based server
chips, smartphones, networking equipment and for autonomous systems such as industrial robotics and self-driv-
ing vehicles. In addition, over the past year, strong industry demand for Arm-based chips has encouraged Arm’s
customers to invest in new R&D projects to develop more chips and therefore increased demand for Arm processor
licenses.
SoftBank Group Corp. Consolidated Financial Report For the Six-Month Period Ended September 30, 2021
32
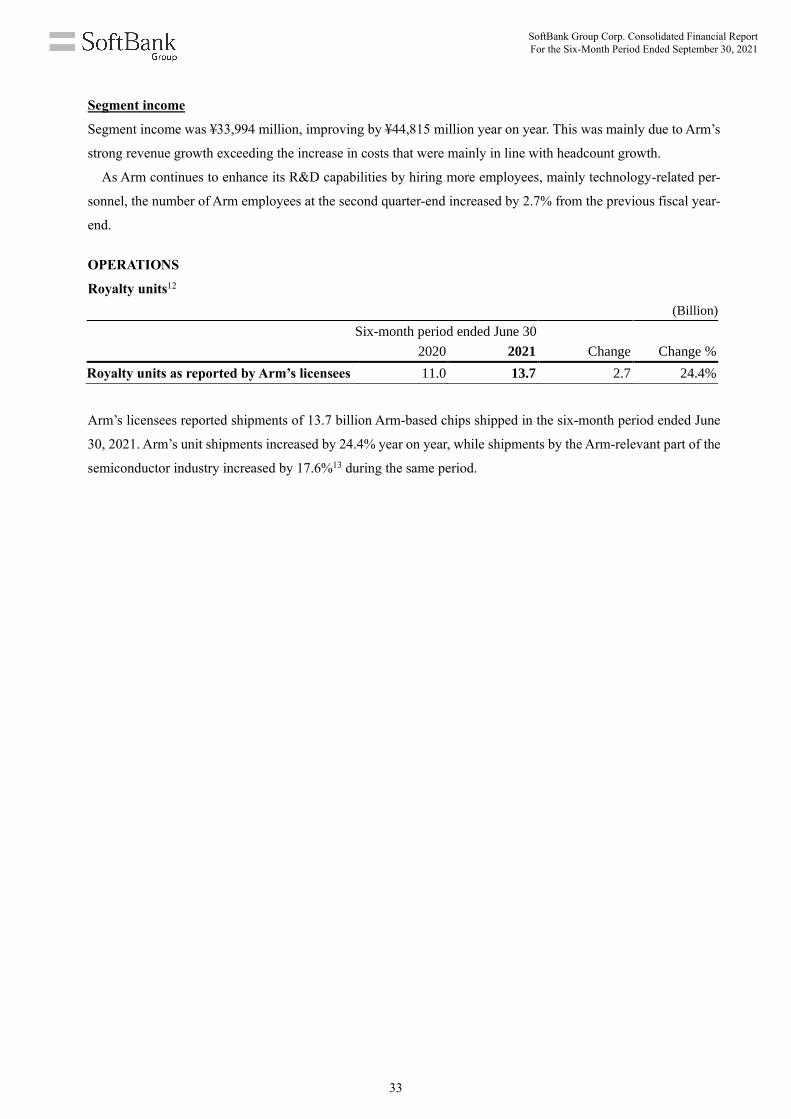
Segment income
Segment income was ¥33,994 million, improving by ¥44,815 million year on year. This was mainly due to Arm’s
strong revenue growth exceeding the increase in costs that were mainly in line with headcount growth.
As Arm continues to enhance its R&D capabilities by hiring more employees, mainly technology-related per-
sonnel, the number of Arm employees at the second quarter-end increased by 2.7% from the previous fiscal year-
end.
OPERATIONS
Royalty units12
(Billion)
Six-month period ended June 30
2020 2021 Change Change %
Royalty units as reported by Arm’s licensees 11.0 13.7 2.7 24.4%
Arm’s licensees reported shipments of 13.7 billion Arm-based chips shipped in the six-month period ended June
30, 2021. Arm’s unit shipments increased by 24.4% year on year, while shipments by the Arm-relevant part of the
semiconductor industry increased by 17.6%13 during the same period.
SoftBank Group Corp. Consolidated Financial Report For the Six-Month Period Ended September 30, 2021
33
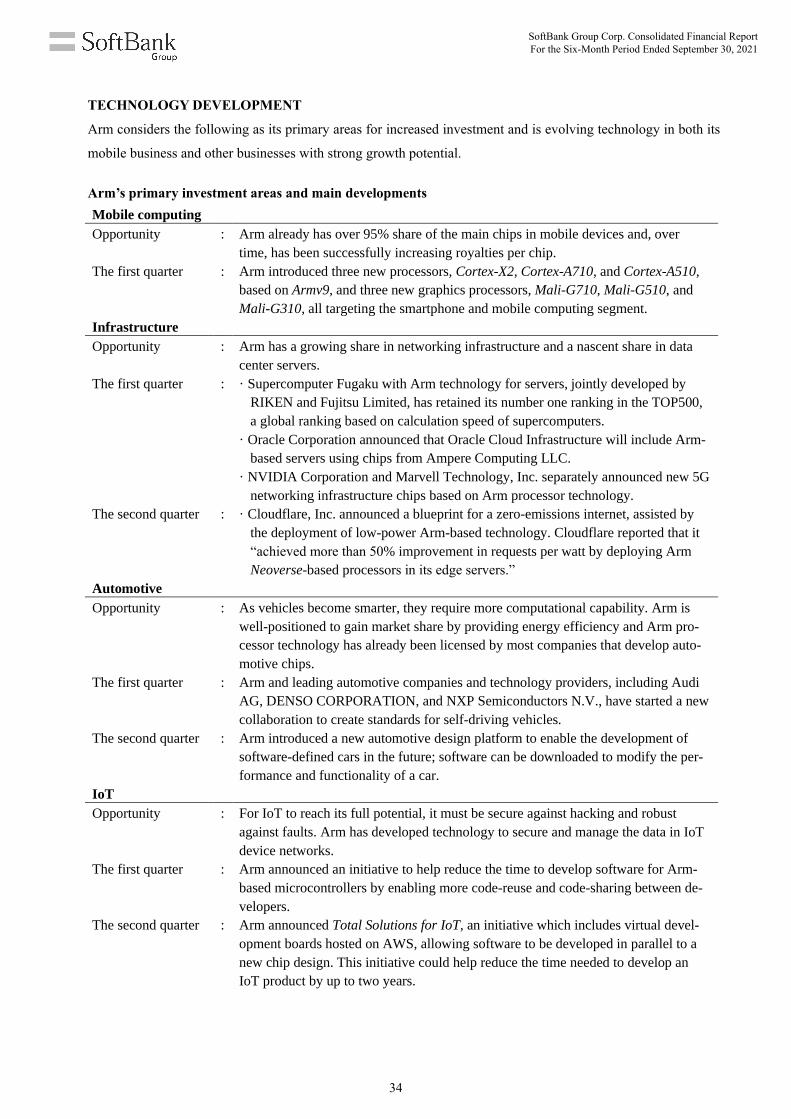
TECHNOLOGY DEVELOPMENT
Arm considers the following as its primary areas for increased investment and is evolving technology in both its
mobile business and other businesses with strong growth potential.
Arm’s primary investment areas and main developments
Mobile computing
Opportunity : Arm already has over 95% share of the main chips in mobile devices and, over
time, has been successfully increasing royalties per chip.
The first quarter : Arm introduced three new processors, Cortex-X2, Cortex-A710, and Cortex-A510,
based on Armv9, and three new graphics processors, Mali-G710, Mali-G510, and
Mali-G310, all targeting the smartphone and mobile computing segment.
Infrastructure
Opportunity : Arm has a growing share in networking infrastructure and a nascent share in data
center servers.
The first quarter : · Supercomputer Fugaku with Arm technology for servers, jointly developed by
RIKEN and Fujitsu Limited, has retained its number one ranking in the TOP500,
a global ranking based on calculation speed of supercomputers.
· Oracle Corporation announced that Oracle Cloud Infrastructure will include Arm-
based servers using chips from Ampere Computing LLC.
· NVIDIA Corporation and Marvell Technology, Inc. separately announced new 5G
networking infrastructure chips based on Arm processor technology.
The second quarter : · Cloudflare, Inc. announced a blueprint for a zero-emissions internet, assisted by
the deployment of low-power Arm-based technology. Cloudflare reported that it
“achieved more than 50% improvement in requests per watt by deploying Arm
Neoverse-based processors in its edge servers.”
Automotive
Opportunity : As vehicles become smarter, they require more computational capability. Arm is
well-positioned to gain market share by providing energy efficiency and Arm pro-
cessor technology has already been licensed by most companies that develop auto-
motive chips.
The first quarter : Arm and leading automotive companies and technology providers, including Audi
AG, DENSO CORPORATION, and NXP Semiconductors N.V., have started a new
collaboration to create standards for self-driving vehicles.
The second quarter : Arm introduced a new automotive design platform to enable the development of
software-defined cars in the future; software can be downloaded to modify the per-
formance and functionality of a car.
IoT
Opportunity : For IoT to reach its full potential, it must be secure against hacking and robust
against faults. Arm has developed technology to secure and manage the data in IoT
device networks.
The first quarter : Arm announced an initiative to help reduce the time to develop software for Arm-
based microcontrollers by enabling more code-reuse and code-sharing between de-
velopers.
The second quarter : Arm announced Total Solutions for IoT, an initiative which includes virtual devel-
opment boards hosted on AWS, allowing software to be developed in parallel to a
new chip design. This initiative could help reduce the time needed to develop an
IoT product by up to two years.
SoftBank Group Corp. Consolidated Financial Report For the Six-Month Period Ended September 30, 2021
34

Entry into agreement for sale of all shares in Arm
On September 13, 2020 (U.S. time), SBGC, a wholly owned subsidiary of the Company, and SVF1 entered into a Share
Purchase Agreement (the “Purchase Agreement”) with NVIDIA Corporation (“NVIDIA”), a U.S.-based semiconductor
manufacturer, whereby the Company will sell all of the shares in its wholly owned subsidiary Arm held by SBGC and
SVF1 to NVIDIA in a transaction valued up to $40 billion (the “Transaction”). The Transaction is subject to regulatory
approvals (including those of the U.K., China, the European Union, and the U.S.) and other closing conditions. The ISG
businesses are outside the scope of the Transaction.
Upon the closing of the Transaction, Arm will cease to be a subsidiary of the Company and will no longer be consol-
idated into the Company’s financial results; however, Arm will continue to be classified under continuing operations in
the Company’s consolidated financial statements until the closing of the Transaction is deemed highly probable. Upon
closing of the Transaction, SBGC and SVF1 expect to receive an aggregate of approximately 6.7-8.1% of outstanding
NVIDIA shares (excluding treasury shares), depending on the final amount of the earn-out, if any (as discussed below).
NVIDIA is not expected to become a subsidiary or an associate of the Company following the completion of the Trans-
action.
A breakdown of the transaction value is presented below.
(Billions of U.S. dollars)
Transaction value Time of receipt
(1) Cash 12.0 (a) 2.0 Received in September 2020
($0.75 billion of which was received
by Arm as consideration for a license
agreement)
(b) 10.0 Upon closing
(2) NVIDIA shares 21.5
(44.37 million shares*3)
Upon closing
(3) Earn-out
(cash or NVIDIA shares)
Up to 5.0
(or 10.32 million shares*3)
Upon closing; subject to satisfaction
of specific financial performance
targets of Arm
Total consideration for
the Company Up to 38.5
(4) NVIDIA share compensa-
tion for Arm employees
1.5 Upon closing; to be received by Arm
employees
Total Up to 40.0
Notes:
1. The consideration described in (1), (2) and, if any, (3) will be allocated to SBGC and SVF1 in accordance with their respective
ownership ratios of Arm shares (75.01% to SBGC and 24.99% to SVF1). The proceeds received by SVF1 will be further allo-
cated to SVF1’s limited partners, including the Company, based on a designated waterfall.
2. Transaction value of (2) and (3) is calculated based on NVIDIA shares with a price of $484.6007 per share (the average of the daily clos-
ing prices of NVIDIA common stock for the 30 consecutive trading days ended September 10, 2020, rounded up to four decimal points).
If (2) and (3) (in case of receiving the consideration in the form of NVIDIA shares) are calculated based on the closing price of
NVIDIA common stock on September 30, 2021 ($828.64), the maximum consideration for the Company would be $57.3 billion.
3. The number of shares before NVIDIA’s stock split on July 20, 2021
(1) $12.0 billion in cash
(a) $2.0 billion
Upon the execution of the Purchase Agreement on September 13, 2020, SBGC and Arm received cash totaling $2.0
billion. Of this amount, $1.25 billion was received by SBGC as a deposit for part of the consideration in the Trans-
action (refundable to NVIDIA subject to certain conditions until the closing of the Transaction, after which such
amount will become non-refundable) and $0.75 billion was received by Arm as consideration for a license agree-
ment that Arm and NVIDIA entered into concurrently with the execution of the Purchase Agreement.
SoftBank Group Corp. Consolidated Financial Report For the Six-Month Period Ended September 30, 2021
35

(b) $10.0 billion
Upon the closing of the Transaction, SBGC and SVF1 will receive cash totaling $10.0 billion.
(2) $21.5 billion in NVIDIA shares (44.37 million shares)
Upon the closing of the Transaction, SBGC and SVF1 will receive 44,366,423 shares of NVIDIA common stock,
which is before NVIDIA’s stock split on July 20, 2021 and was determined based on a price of $484.6007 per share
(the average of the daily closing prices of NVIDIA common stock for the 30 consecutive trading days ended September
10, 2020, rounded up to four decimal points). Of the NVIDIA common stock to be received, 2,063,554 shares will be
subject to escrow to satisfy certain indemnification obligations of SBGC and SVF1 as set out in the Purchase Agree-
ment.
The shares received will be recorded at their fair value at the closing of the Transaction as financial assets at FVTPL,
and thereafter changes in their fair value will be recognized as net income or loss at the end of each quarter.
(3) Earn-out up to $5.0 billion (cash or 10.32 million NVIDIA shares)
An earn-out of up to $5.0 billion in cash or up to 10,317,772 shares of NVIDIA common stock, which is the number
of shares before NVIDIA’s stock split on July 20, 2021, (based on a price of $484.6007 per share, being the average
of the daily closing prices of NVIDIA common stock for the 30 consecutive trading days ended September 10, 2020
(rounded up to four decimal points)) is payable to SBGC and SVF1 subject to the satisfaction of certain financial
performance targets for each of revenue and EBITDA of Arm (in each case subject to certain adjustments and excluding
any amounts attributable to the ISG businesses) during the fiscal year ending March 31, 2022 as set out in the Purchase
Agreement. If Arm’s financial performance exceeds the agreed floors but does not meet such targets, the earn-out will
be prorated. If Arm’s financial performance does not meet such floors, the earn-out will not be payable.
If SBGC and SVF1 elect to receive the earn-out in the form of NVIDIA shares, the fair value of those shares will be
recorded as financial assets at FVTPL upon the closing of the Transaction, and thereafter changes in their fair value
will be recognized as net income or loss at the end of each quarter.
(4) NVIDIA stock awards representing $1.5 billion to be granted to Arm employees
Upon the closing of the Transaction, Arm employees will receive $1.5 billion in NVIDIA stock awards from NVIDIA.
For more information about Arm, its business, and its technology, please refer to its website at https://www.arm.com.
SoftBank Group Corp. Consolidated Financial Report For the Six-Month Period Ended September 30, 2021
36
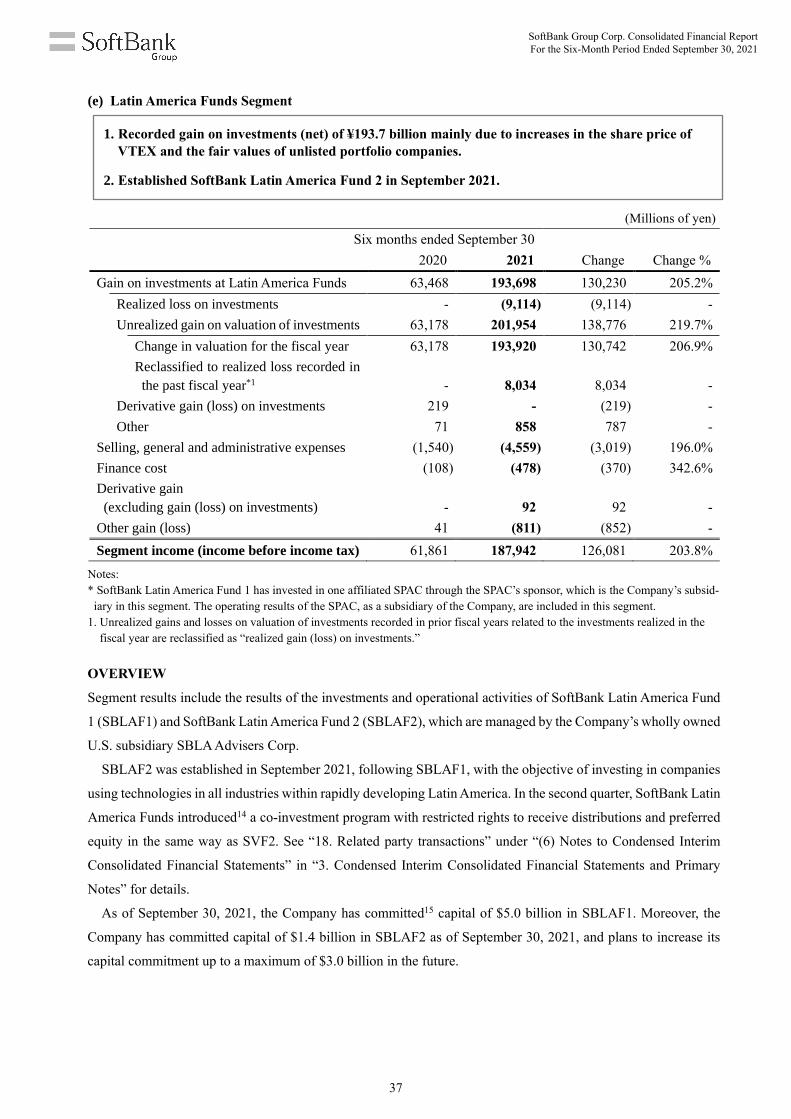
(e) Latin America Funds Segment
1. Recorded gain on investments (net) of ¥193.7 billion mainly due to increases in the share price of
VTEX and the fair values of unlisted portfolio companies.
2. Established SoftBank Latin America Fund 2 in September 2021.
(Millions of yen)
Six months ended September 30
2020 2021 Change Change %
Gain on investments at Latin America Funds 63,468 193,698 130,230 205.2%
Realized loss on investments - (9,114) (9,114) -
Unrealized gain on valuation of investments 63,178 201,954 138,776 219.7%
Change in valuation for the fiscal year 63,178 193,920 130,742 206.9%
Reclassified to realized loss recorded in
the past fiscal year*1 - 8,034 8,034 -
Derivative gain (loss) on investments 219 - (219) -
Other 71 858 787 -
Selling, general and administrative expenses (1,540) (4,559) (3,019) 196.0%
Finance cost (108) (478) (370) 342.6%
Derivative gain
(excluding gain (loss) on investments) - 92 92 -
Other gain (loss) 41 (811) (852) -
Segment income (income before income tax) 61,861 187,942 126,081 203.8%
Notes:
* SoftBank Latin America Fund 1 has invested in one affiliated SPAC through the SPAC’s sponsor, which is the Company’s subsid-
iary in this segment. The operating results of the SPAC, as a subsidiary of the Company, are included in this segment.
1. Unrealized gains and losses on valuation of investments recorded in prior fiscal years related to the investments realized in the
fiscal year are reclassified as “realized gain (loss) on investments.”
OVERVIEW
Segment results include the results of the investments and operational activities of SoftBank Latin America Fund
1 (SBLAF1) and SoftBank Latin America Fund 2 (SBLAF2), which are managed by the Company’s wholly owned
U.S. subsidiary SBLA Advisers Corp.
SBLAF2 was established in September 2021, following SBLAF1, with the objective of investing in companies
using technologies in all industries within rapidly developing Latin America. In the second quarter, SoftBank Latin
America Funds introduced14 a co-investment program with restricted rights to receive distributions and preferred
equity in the same way as SVF2. See “18. Related party transactions” under “(6) Notes to Condensed Interim
Consolidated Financial Statements” in “3. Condensed Interim Consolidated Financial Statements and Primary
Notes” for details.
As of September 30, 2021, the Company has committed15 capital of $5.0 billion in SBLAF1. Moreover, the
Company has committed capital of $1.4 billion in SBLAF2 as of September 30, 2021, and plans to increase its
capital commitment up to a maximum of $3.0 billion in the future.
SoftBank Group Corp. Consolidated Financial Report For the Six-Month Period Ended September 30, 2021
37

FINANCIAL RESULTS
SBLAF1 recorded unrealized gain on valuation of investments (net) totaling ¥201,954 million mainly due to an
increase in the share price of VTEX and the fair values of unlisted portfolio companies including Kavak Hold-
ings Limited and QUINTOANDAR, LTD. On the other hand, SBLAF1 recorded realized loss on investments of
¥9,114 million following the liquidation of two investments. These resulted in gain on investments of ¥193,698
million and segment income of ¥187,942. As of the second quarter-end, SBLAF1 and SBLAF2 held a combined
total of 61 investments and had invested a cumulative total of $4.9 billion, with a fair value of $8.1 billion.
For a list of portfolio companies of SoftBank Latin America Funds, see the Data Sheets in “Materials” under “Earnings Results
Briefing” to be posted in a few days on the Company’s website at https://group.softbank/en/ir/presentations/.
SoftBank Group Corp. Consolidated Financial Report For the Six-Month Period Ended September 30, 2021
38

(f) Other
(Millions of yen)
Six months ended September 30
2020 2021 Change Change %
Net sales 112,200 111,613 (587) (0.5%)
Segment income (income before income tax) (22,860) (16,662) 6,198 -
Depreciation and amortization (22,344) (16,118) 6,226 (27.9%)
Gain (loss) on investments 59,634 (9,972) (69,606) -
Finance cost (7,897) (7,568) 329 (4.2%)
Income on equity method investments 6,908 19,486 12,578 182.1%
Derivative loss
(excluding gain (loss) on investments) (250) (3,479) (3,229) -
Note: Since the fourth quarter of the previous fiscal year, the ISG business is managed separately from the Arm business and its
operating results are therefore included in “Other” instead of the Arm segment. In June 2021, all of the shares of Treasure Data,
Inc. in the ISG business were distributed in kind to SVF1 and SBGC in accordance with their ownership ratios of Arm shares,
and subsequently SBGC sold its portion to SVF2.
Segment loss was ¥16,662 million. Fortress Investment Group LLC (“Fortress”) and PayPay Corporation recorded
losses before income tax of ¥42,056 million and ¥27,824 million, respectively. On the other hand, the Company
recorded a gain relating to loss of control of Boston Dynamics, Inc. of ¥72,936 million following the completion
of the sale of its shares in the first quarter. See “7. Disposal group classified as held for sale” under “(6) Notes to
Condensed Interim Consolidated Financial Statements” in “3. Condensed Interim Consolidated Financial State-
ments and Primary Notes” for details.
An overview of these results and operations follows.
· Fortress
Fortress recorded loss on investments of ¥23,588 million due to a decrease in the fair values of certain
investments, resulting in a loss before income tax of ¥42,056 million.
· PayPay Corporation
PayPay Corporation, which is engaged in smartphone payment services in Japan, recorded loss before income
tax of ¥27,824 million. Although revenue increased mainly due to the increase in affiliated store sales and growth
in gross merchandise volume, expenses also increased due to campaigns aimed at acquiring users and promoting
their use, as well as the expansion of stores where the service is available. PayPay Corporation’s payment services
continued to see strong growth, with the number of payments for the period reaching 1,660 million, a 1.8-fold
increase year on year.
Results of PayPay Corporation included in “Other”
(Millions of yen)
Six months ended September 30
2020 2021 Change Change %
Net sales 12,135 24,042 11,907 98.1%
Loss before income taxes (29,318) (27,824) 1,494 -
SoftBank Group Corp. Consolidated Financial Report For the Six-Month Period Ended September 30, 2021
39
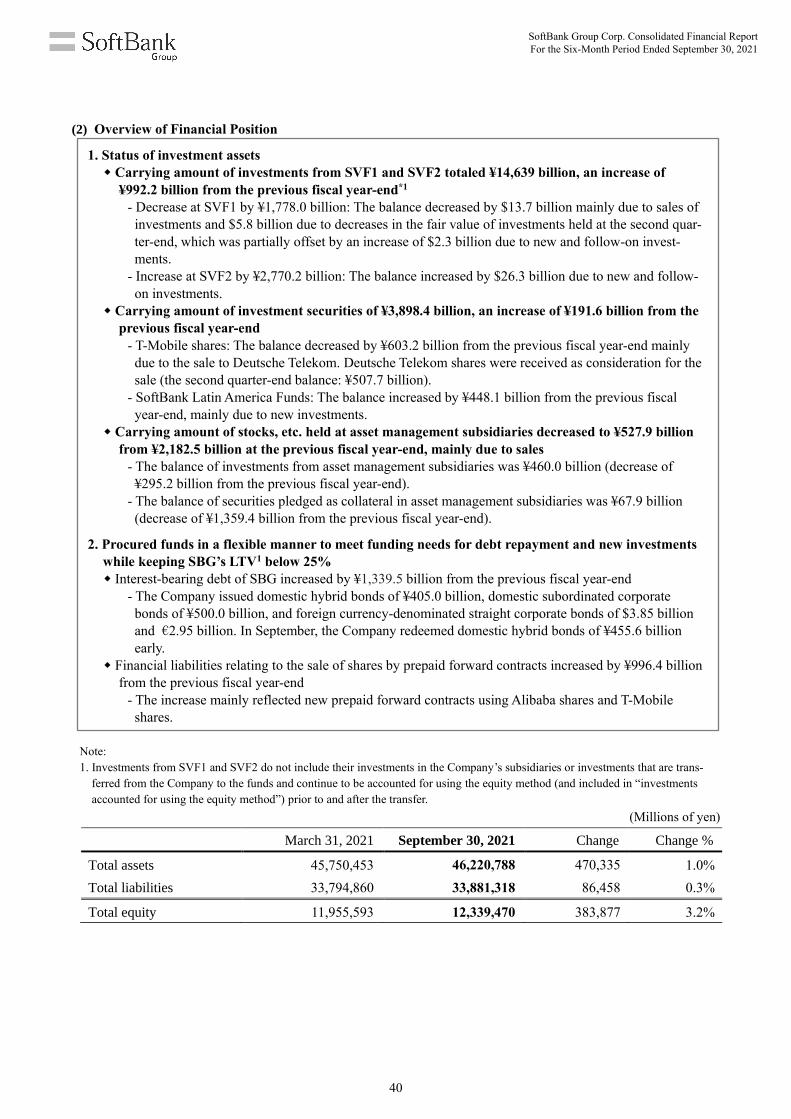
(2) Overview of Financial Position
1. Status of investment assets
Carrying amount of investments from SVF1 and SVF2 totaled ¥14,639 billion, an increase of
¥992.2 billion from the previous fiscal year-end*1
- Decrease at SVF1 by ¥1,778.0 billion: The balance decreased by $13.7 billion mainly due to sales of
investments and $5.8 billion due to decreases in the fair value of investments held at the second quar-
ter-end, which was partially offset by an increase of $2.3 billion due to new and follow-on invest-
ments.
- Increase at SVF2 by ¥2,770.2 billion: The balance increased by $26.3 billion due to new and follow-
on investments.
Carrying amount of investment securities of ¥3,898.4 billion, an increase of ¥191.6 billion from the
previous fiscal year-end
- T-Mobile shares: The balance decreased by ¥603.2 billion from the previous fiscal year-end mainly
due to the sale to Deutsche Telekom. Deutsche Telekom shares were received as consideration for the
sale (the second quarter-end balance: ¥507.7 billion).
- SoftBank Latin America Funds: The balance increased by ¥448.1 billion from the previous fiscal
year-end, mainly due to new investments. Carrying amount of stocks, etc. held at asset management subsidiaries decreased to ¥527.9 billion
from ¥2,182.5 billion at the previous fiscal year-end, mainly due to sales
- The balance of investments from asset management subsidiaries was ¥460.0 billion (decrease of
¥295.2 billion from the previous fiscal year-end).
- The balance of securities pledged as collateral in asset management subsidiaries was ¥67.9 billion
(decrease of ¥1,359.4 billion from the previous fiscal year-end).
2. Procured funds in a flexible manner to meet funding needs for debt repayment and new investments
while keeping SBG’s LTV1 below 25%
Interest-bearing debt of SBG increased by ¥1,339.5 billion from the previous fiscal year-end
- The Company issued domestic hybrid bonds of ¥405.0 billion, domestic subordinated corporate
bonds of ¥500.0 billion, and foreign currency-denominated straight corporate bonds of $3.85 billion
and €2.95 billion. In September, the Company redeemed domestic hybrid bonds of ¥455.6 billion
early.
Financial liabilities relating to the sale of shares by prepaid forward contracts increased by ¥996.4 billion
from the previous fiscal year-end
- The increase mainly reflected new prepaid forward contracts using Alibaba shares and T-Mobile
shares.
Note:
1. Investments from SVF1 and SVF2 do not include their investments in the Company’s subsidiaries or investments that are trans-
ferred from the Company to the funds and continue to be accounted for using the equity method (and included in “investments
accounted for using the equity method”) prior to and after the transfer.
(Millions of yen)
March 31, 2021 September 30, 2021 Change Change %
Total assets 45,750,453 46,220,788 470,335 1.0%
Total liabilities 33,794,860 33,881,318 86,458 0.3%
Total equity 11,955,593 12,339,470 383,877 3.2%
SoftBank Group Corp. Consolidated Financial Report For the Six-Month Period Ended September 30, 2021
40

(a) Assets
(Millions of yen) March 31, 2021 September 30, 2021 Change
Cash and cash equivalents 4,662,725 5,093,370 430,645
Trade and other receivables 2,216,434 2,009,419 (207,015)
Investments from asset
management subsidiaries 658,227 319,485 (338,742) A
Securities pledged as collateral in
asset management subsidiaries 1,427,286 67,923 (1,359,363) B
Derivative financial assets in
asset management subsidiaries 188,056 129,089 (58,967) C
Derivative financial assets 383,315 720,984 337,669 D
Other financial assets 671,907 294,090 (377,817)
Inventories 126,830 128,599 1,769
Other current assets 446,739 216,662 (230,077) E
Assets classified as held for sale 38,647 - (38,647) F
Total current assets 10,820,166 8,979,621 (1,840,545)
Property, plant and equipment 1,668,578 1,705,414 36,836
Right-of-use assets 1,147,020 1,011,800 (135,220)
Goodwill 4,684,419 4,706,186 21,767
Intangible assets 2,308,370 2,412,018 103,648 G
Costs to obtain contracts 246,996 278,814 31,818
Investments accounted for using the
equity method 4,349,971 4,825,476 475,505 H
Investments from SVF1 and SVF2
accounted for using FVTPL 13,646,774 14,638,981 992,207 I
SVF1 12,403,286 10,625,295 (1,777,991)
SVF2 1,243,488 4,013,686 2,770,198
Investment securities 3,706,784 3,898,424 191,640 J
Derivative financial assets 908,660 1,201,116 292,456 K
Other financial assets 1,919,262 2,257,290 338,028
Deferred tax assets 206,069 176,853 (29,216)
Other non-current assets 137,384 128,795 (8,589)
Total non-current assets 34,930,287 37,241,167 2,310,880
Total assets 45,750,453 46,220,788 470,335
SoftBank Group Corp. Consolidated Financial Report For the Six-Month Period Ended September 30, 2021
41

Reasons for changes by primary component
Components Main reasons for changes from the previous fiscal year-end
Current assets
A Investments from asset
management subsidiaries
Listed stocks held by SB Northstar decreased mainly due to sales.
B Securities pledged as collateral
in asset management
subsidiaries
Securities pledged as collateral decreased due to SB Northstar’s sale of
investments and repayment of collateralized debt obligations.
C Derivative financial assets in
asset management subsidiaries
The fair values of long call options of listed stocks held by SB Northstar
decreased.
D Derivative financial assets Derivative financial assets related to prepaid forward contracts using
Alibaba shares increased by ¥357,196 million, due to recording derivative
gains, reclassifying derivative financial assets with a remaining term of
one year or less from non-current assets, and new prepaid forward con-
tracts entered.
E Other current assets Withholding income tax in relation to dividends paid from SBGJ to SBG
in the previous fiscal year was refunded in July 2021, resulting in a de-
crease of ¥246,667 million.
F Assets classified as held for
sale
Boston Dynamics, Inc.’s assets were presented in this category at the pre-
vious fiscal year-end in conjunction with the classification of the com-
pany in the disposal group classified as held for sale; however, these as-
sets were derecognized following the completion of the sale in the first
quarter.
Non-current assets
G Intangible assets
Yahoo Japan Corporation entered into an agreement with Oath Holdings
Inc. and other parties, with whom it had previously entered into a license
agreement, to acquire trademarks in Japan related to Yahoo! and Yahoo!
JAPAN etc. for ¥178.5 billion. Intangible assets increased as a result of
this acquisition.
H Investments accounted for
using the equity method
In addition to recording gain on equity method investments, the consoli-
dated carrying amount for Alibaba increased due to the weaker yen
against the Chinese yuan at the second quarter-end.
I Investments from SVF1 and
SVF2 accounted for using
FVTPL
· The carrying amount of investments at SVF1 decreased by ¥1,778.0 bil-
lion, reflecting a decrease of $13.7 billion due to the sale of investments
and a decrease of $5.8 billion due to decreases in the fair values of port-
folio companies held at the second quarter-end. This was partially offset
by an increase of $2.3 billion due to new and follow-on investments in
existing portfolio companies.
· The carrying amount of investments at SVF2 increased by ¥2,770.2 bil-
lion, reflecting an increase of $26.3 billion due to new and follow-on in-
vestments in existing portfolio companies, despite a decrease of $1.6 bil-
lion due to the sale of investments.
For details of the status of investments at SVF1 and SVF2, see “(b) Soft-
Bank Vision Funds Segment” under “b. Results by Segment” in “(1)
Overview of Results of Operations.”
SoftBank Group Corp. Consolidated Financial Report For the Six-Month Period Ended September 30, 2021
42

Components Main reasons for changes from the previous fiscal year-end
J Investment securities · The carrying amount of T-Mobile shares decreased to ¥871,160 million
from ¥1,474,356 million at the previous fiscal year-end. This mainly re-
flected the sale to Deutsche Telekom of 45.4 million T-Mobile shares
held by the Company due to Deutsche Telekom’s partial exercise of call
options for T-Mobile shares.
· The Company received 225 million Deutsche Telekom shares as consid-
eration for the sale of T-Mobile shares (the second quarter-end balance:
¥507,727 million)
· The carrying amount of investments from SoftBank Latin America
Funds increased by ¥448,116 million due to new and follow-on invest-
ments, as well as increases in the fair values of portfolio companies (the
second quarter-end balance: ¥889,124 million).
· The shares of WeWork, InMobi Pte. Ltd. and Cybereason Inc. were
transferred to SVF2 and reclassified to “investments from SVF1 and
SVF2 accounted for using FVTPL”. See “Investments transferred from
the Company to SVF2” under “FINANCIAL RESULTS” in “(b) Soft-
Bank Vision Funds Segment” in “(1) Overview of Results of Opera-
tions.”
K Derivative financial assets · Derivative financial assets related to prepaid forward contracts using
Alibaba shares increased by ¥220,704 million due to recording of deriv-
ative gains and newly concluded prepaid forward contracts, while the as-
sets with a remaining term of one year or less were reclassified as cur-
rent assets.
· The fair value of the Contingent Consideration related to T-Mobile
shares increased by ¥57,980 million (the second quarter-end balance:
¥518,689 million).
SoftBank Group Corp. Consolidated Financial Report For the Six-Month Period Ended September 30, 2021
43
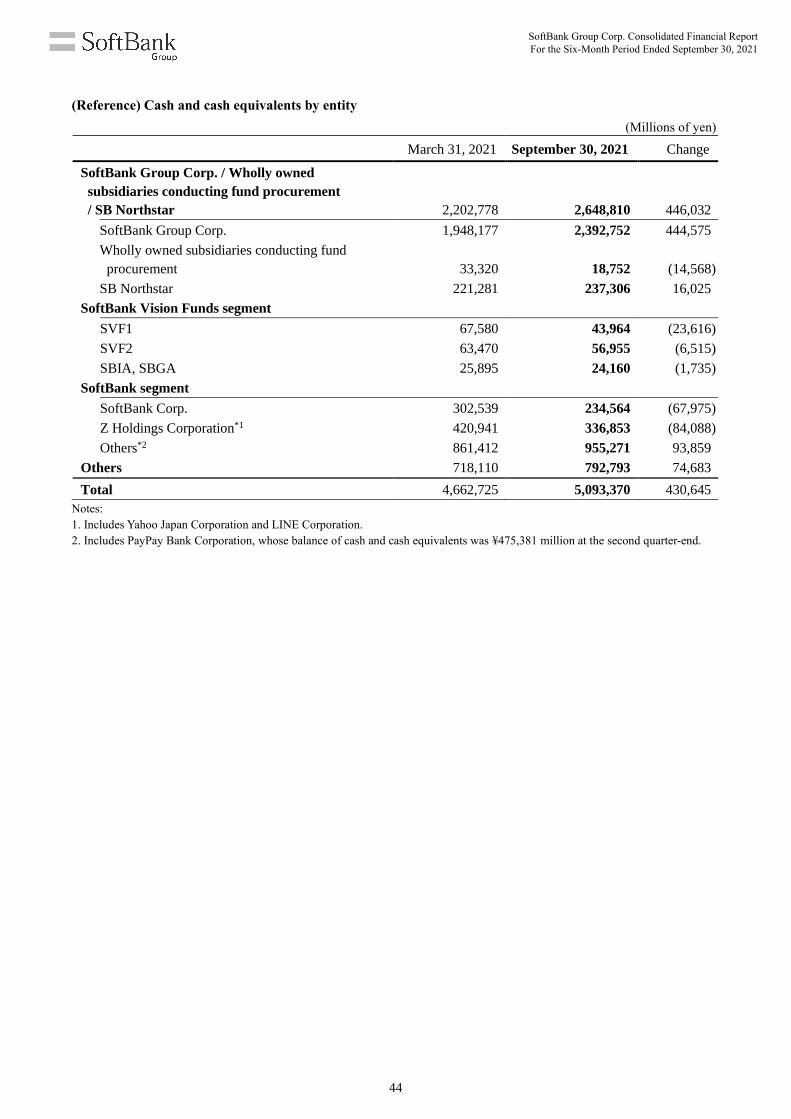
(Reference) Cash and cash equivalents by entity
(Millions of yen)
March 31, 2021 September 30, 2021 Change
SoftBank Group Corp. / Wholly owned
subsidiaries conducting fund procurement
/ SB Northstar 2,202,778 2,648,810 446,032
SoftBank Group Corp. 1,948,177 2,392,752 444,575
Wholly owned subsidiaries conducting fund
procurement 33,320 18,752 (14,568)
SB Northstar 221,281 237,306 16,025
SoftBank Vision Funds segment
SVF1 67,580 43,964 (23,616)
SVF2 63,470 56,955 (6,515)
SBIA, SBGA 25,895 24,160 (1,735)
SoftBank segment
SoftBank Corp. 302,539 234,564 (67,975)
Z Holdings Corporation*1 420,941 336,853 (84,088)
Others*2 861,412 955,271 93,859
Others 718,110 792,793 74,683
Total 4,662,725 5,093,370 430,645
Notes:
1. Includes Yahoo Japan Corporation and LINE Corporation.
2. Includes PayPay Bank Corporation, whose balance of cash and cash equivalents was ¥475,381 million at the second quarter-end.
SoftBank Group Corp. Consolidated Financial Report For the Six-Month Period Ended September 30, 2021
44

(b) Liabilities
(Millions of yen)
March 31, 2021 September 30, 2021 Change
Interest-bearing debt 7,735,239 7,122,992 (612,247)
Lease liabilities 307,447 273,346 (34,101)
Deposits for banking business 1,109,240 1,194,584 85,344
Trade and other payables 1,970,275 1,542,463 (427,812)
Derivative financial liabilities in asset
management subsidiaries 14,673 1,788 (12,885)
Derivative financial liabilities 322,213 108,938 (213,275) A
Other financial liabilities 51,285 92,137 40,852
Income taxes payables 391,930 161,417 (230,513) B
Provisions 24,939 18,251 (6,688)
Other current liabilities 952,443 685,467 (266,976) C
Liabilities directly relating to assets
classified as held for sale 11,271 - (11,271) D
Total current liabilities 12,890,955 11,201,383 (1,689,572)
Interest-bearing debt 10,777,736 13,024,167 2,246,431
Lease liabilities 727,554 678,949 (48,605)
Third-party interests in SVF1 and SVF2 6,601,791 5,853,663 (748,128)
Derivative financial liabilities 32,692 83,523 50,831
Other financial liabilities 415,407 464,760 49,353
Provisions 110,586 112,105 1,519
Deferred tax liabilities 2,030,651 2,287,079 256,428 E
Other non-current liabilities 207,488 175,689 (31,799)
Total non-current liabilities 20,903,905 22,679,935 1,776,030
Total liabilities 33,794,860 33,881,318 86,458
SoftBank Group Corp. Consolidated Financial Report For the Six-Month Period Ended September 30, 2021
45

Reasons for changes by primary component
Components Main reasons for changes from the previous fiscal year-end
*See “(Reference)” on the following page for a breakdown of interest-bearing debt.
Current liabilities
A Derivative financial liabilities · Derivative financial liabilities decreased by ¥113,499 million due to the
partial exercise of call options for T-Mobile shares by Deutsche Tele-
kom (the second quarter-end balance: ¥91,322 million).
· With the completion of the tender offer for WeWork shares in April
2021, the Company reversed a derivative financial liability of ¥76,823
million recorded at the previous fiscal year-end as the difference be-
tween the valuation amount of common stock and preferred stock ex-
pected to be acquired and the planned acquisition amount. See “(1) Op-
tion contracts” and “(3) Forward contracts” under “10. Financial instru-
ments” in “(6) Notes to Condensed Interim Consolidated Financial
Statements” in “3. Condensed Interim Consolidated Financial State-
ments and Primary Notes” for details.
B Income taxes payables SBGJ paid income tax of ¥197,432 million based on taxable income in-
cluding a gain on sale of shares of SoftBank Corp. generated in the previ-
ous fiscal year.
C Other current liabilities
Withholding income tax of ¥245,053 million was paid in relation to divi-
dends paid from SBGJ to SBG in the previous fiscal year.
D Liabilities directly relating to
assets classified as held for
sale
Boston Dynamics, Inc.’s liabilities were presented in this category at the
previous fiscal year-end in conjunction with the classification of the com-
pany in the disposal group classified as held for sale; however, these lia-
bilities were derecognized following the completion of the sale in the
first quarter.
Non-current liabilities
E Deferred tax liabilities Deferred tax liabilities increased due to an increase in the fair value of
derivative financial assets related to prepaid forward contracts using
Alibaba shares concluded in the fiscal years ended March 31, 2020 and
March 31, 2021, as well as in the period.
SoftBank Group Corp. Consolidated Financial Report For the Six-Month Period Ended September 30, 2021
46

(Reference) Interest-bearing debt and lease liabilities (total of current liabilities and non-current liabilities)
(Millions of yen)
March 31, 2021 September 30, 2021 Change
SoftBank Group Corp. / Wholly owned
subsidiaries conducting fund procurement*1 /
SB Northstar 12,984,650 13,915,321 930,671
SoftBank Group Corp. 6,158,350 7,497,889 1,339,539
Borrowings 1,152,934 1,245,677 92,743
Corporate bonds 4,745,549 6,002,397 1,256,848
Lease liabilities 13,367 12,715 (652)
Commercial paper 246,500 237,100 (9,400)
Wholly owned subsidiaries conducting fund
procurement*1 4,959,779 6,131,175 1,171,396
Borrowings 1,874,040 2,049,010 174,970
Financial liabilities relating to sale of shares by
prepaid forward contracts 3,085,739 4,082,165 996,426
SB Northstar 1,866,521 286,257 (1,580,264)
Borrowings 1,866,521 286,257 (1,580,264)
SoftBank Vision Funds segment
SVF1 444,227 715,286 271,059
Borrowings 444,227 715,286 271,059
SVF2 - 111,920 111,920
Borrowings - 111,920 111,920
SBIA 363 349 (14)
Lease liabilities 363 349 (14)
SoftBank segment
SoftBank Corp. 4,166,323 4,203,002 36,679
Borrowings 3,037,229 2,989,234 (47,995)
Corporate bonds 260,000 359,634 99,634
Lease liabilities 706,393 630,133 (76,260)
Commercial paper 162,701 224,001 61,300
Z Holdings Corporation*2 1,030,980 1,206,269 175,289
Borrowings 442,406 472,928 30,522
Corporate bonds 543,992 643,800 99,808
Lease liabilities 44,582 40,041 (4,541)
Commercial paper - 49,500 49,500
Other 494,747 559,841 65,094
Others
Other interest-bearing debt 334,917 302,638 (32,279)
Lease liabilities 91,769 84,828 (6,941)
Total 19,547,976 21,099,454 1,551,478
Notes:
1. The interest-bearing debt of wholly owned subsidiaries conducting fund procurement is non-recourse to SBG. However, $3.90
billion of borrowings made using T-Mobile shares is exceptionally guaranteed by SBG to a limit of $0.97 billion. As a precondi-
tion for SBG to fulfill its guarantee obligations, the lenders are obligated to first recover the amount to the maximum extent pos-
sible from Alibaba shares that have been pledged as collateral.
2. Includes Yahoo Japan Corporation and LINE Corporation.
SoftBank Group Corp. Consolidated Financial Report For the Six-Month Period Ended September 30, 2021
47
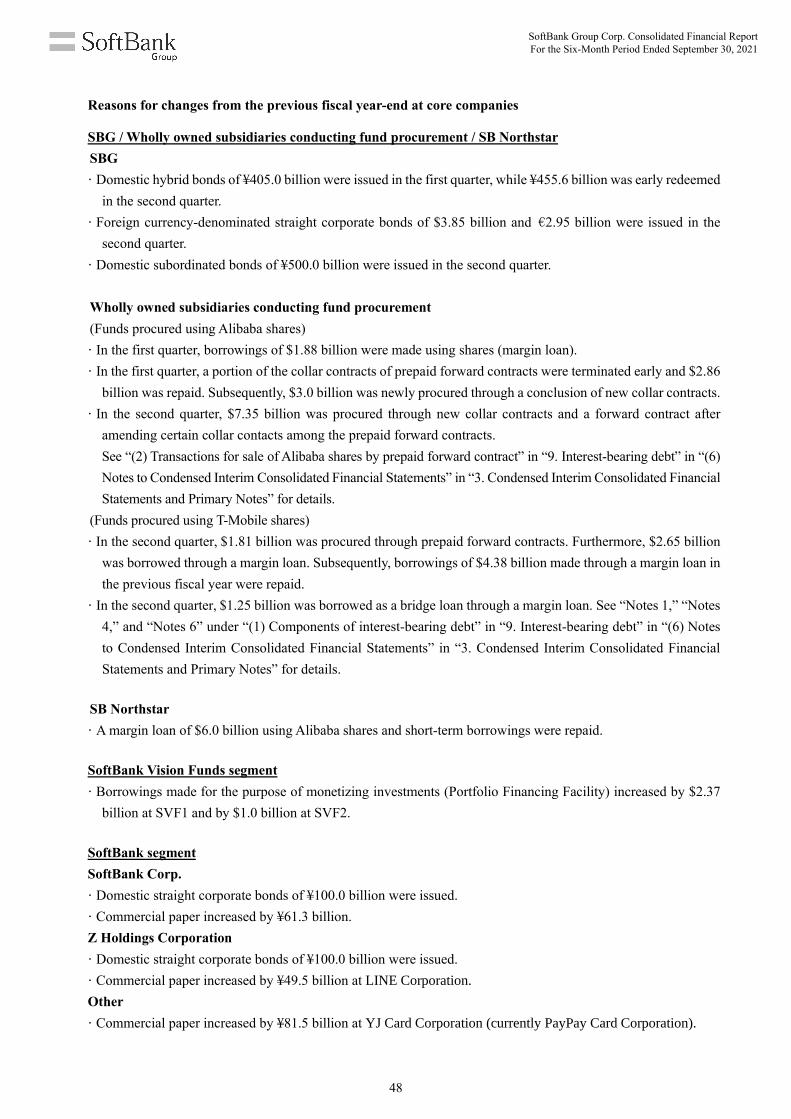
Reasons for changes from the previous fiscal year-end at core companies
SBG / Wholly owned subsidiaries conducting fund procurement / SB Northstar
SBG
· Domestic hybrid bonds of ¥405.0 billion were issued in the first quarter, while ¥455.6 billion was early redeemed
in the second quarter.
· Foreign currency-denominated straight corporate bonds of $3.85 billion and €2.95 billion were issued in the
second quarter.
· Domestic subordinated bonds of ¥500.0 billion were issued in the second quarter.
Wholly owned subsidiaries conducting fund procurement
(Funds procured using Alibaba shares)
· In the first quarter, borrowings of $1.88 billion were made using shares (margin loan).
· In the first quarter, a portion of the collar contracts of prepaid forward contracts were terminated early and $2.86
billion was repaid. Subsequently, $3.0 billion was newly procured through a conclusion of new collar contracts.
· In the second quarter, $7.35 billion was procured through new collar contracts and a forward contract after
amending certain collar contacts among the prepaid forward contracts.
See “(2) Transactions for sale of Alibaba shares by prepaid forward contract” in “9. Interest-bearing debt” in “(6)
Notes to Condensed Interim Consolidated Financial Statements” in “3. Condensed Interim Consolidated Financial
Statements and Primary Notes” for details.
(Funds procured using T-Mobile shares)
· In the second quarter, $1.81 billion was procured through prepaid forward contracts. Furthermore, $2.65 billion
was borrowed through a margin loan. Subsequently, borrowings of $4.38 billion made through a margin loan in
the previous fiscal year were repaid.
· In the second quarter, $1.25 billion was borrowed as a bridge loan through a margin loan. See “Notes 1,” “Notes
4,” and “Notes 6” under “(1) Components of interest-bearing debt” in “9. Interest-bearing debt” in “(6) Notes
to Condensed Interim Consolidated Financial Statements” in “3. Condensed Interim Consolidated Financial
Statements and Primary Notes” for details.
SB Northstar
· A margin loan of $6.0 billion using Alibaba shares and short-term borrowings were repaid.
SoftBank Vision Funds segment
· Borrowings made for the purpose of monetizing investments (Portfolio Financing Facility) increased by $2.37
billion at SVF1 and by $1.0 billion at SVF2.
SoftBank segment
SoftBank Corp.
· Domestic straight corporate bonds of ¥100.0 billion were issued.
· Commercial paper increased by ¥61.3 billion.
Z Holdings Corporation
· Domestic straight corporate bonds of ¥100.0 billion were issued.
· Commercial paper increased by ¥49.5 billion at LINE Corporation.
Other
· Commercial paper increased by ¥81.5 billion at YJ Card Corporation (currently PayPay Card Corporation).
SoftBank Group Corp. Consolidated Financial Report For the Six-Month Period Ended September 30, 2021
48

(c) Equity
(Millions of yen)
March 31, 2021 September 30, 2021 Change
Common stock 238,772 238,772 -
Capital surplus 2,618,504 2,595,649 (22,855)
Other equity instruments 496,876 496,876 -
Retained earnings 8,810,422 6,642,298 (2,168,124) A
Treasury stock (2,290,077) (64,618) 2,225,459 B
Accumulated other comprehensive income 338,329 639,585 301,256 C
Accumulated other comprehensive income directly
relating to assets classified as held for sale 267 - (267)
Total equity attributable to owners of the parent 10,213,093 10,548,562 335,469
Non-controlling interests 1,742,500 1,790,908 48,408
Total equity 11,955,593 12,339,470 383,877
Reasons for changes by primary component
Components Main reasons for changes from the previous fiscal year-end
A Retained earnings · Net income attributable to owners of the parent of ¥363,569 million was
recorded.
· ¥2,475,817 million*1 was deducted following the retirement of
366,860,600 treasury stock in May 2021 (equivalent to 17.6% of the total
number of issued shares as of April 30, 2021).
B Treasury stock · The Company repurchased 25,980,400 of its own shares for ¥257,777 mil-
lion from April 1 to May 12, 2021 in accordance with a Board resolution
on July 30, 2020.
· The Company retired treasury stock in May 2021.
C Accumulated other
comprehensive income
· Exchange differences from the translation of foreign operations, which
arise from translating overseas subsidiaries and associates into yen, in-
creased by ¥285,754 million due to a weaker yen against the U.S. dollar
and the Chinese yuan.
Note:
1. The number of shares retired is the same as the number of shares acquired from the share repurchase (the “Share Repurchase”)
conducted in accordance with respective resolutions of the Board of Directors in March, May, June, and July 2020. However,
because the retirement amount is calculated based on the carrying amounts, including the treasury stock held by the Company
prior to the Share Repurchase, the retirement amount differs from the total repurchase amount of the Share Repurchase.
SoftBank Group Corp. Consolidated Financial Report For the Six-Month Period Ended September 30, 2021
49
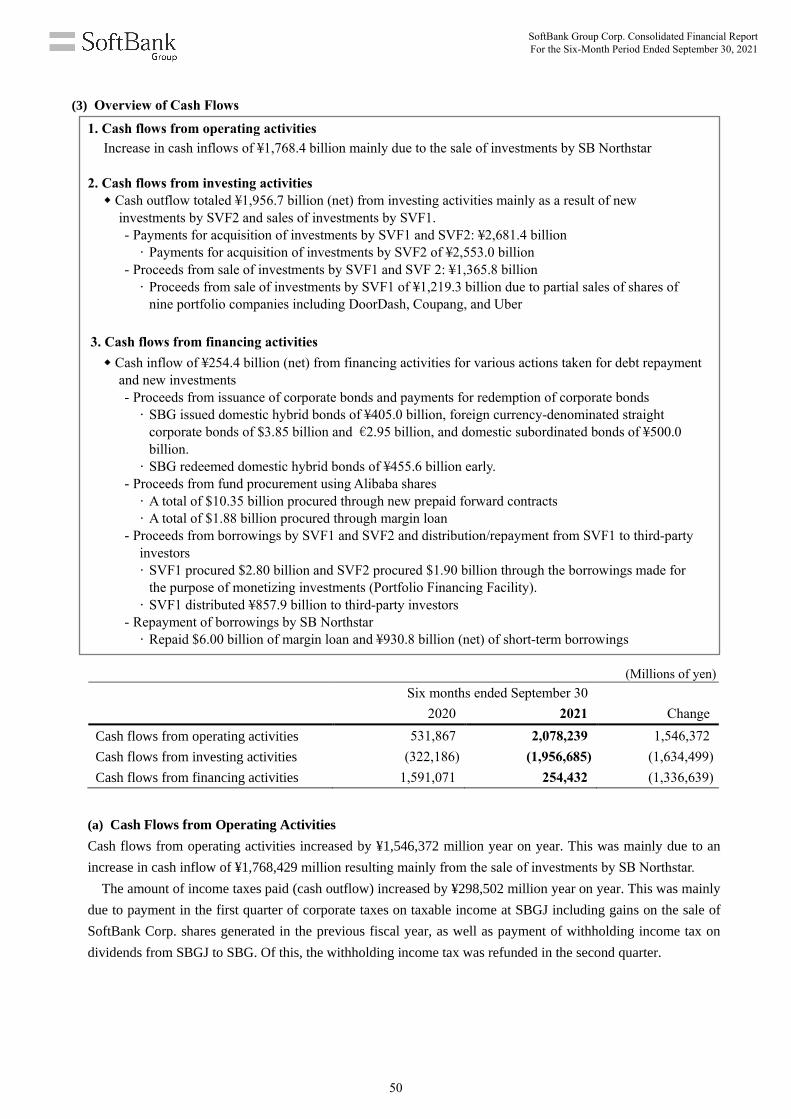
(3) Overview of Cash Flows
1. Cash flows from operating activities
Increase in cash inflows of ¥1,768.4 billion mainly due to the sale of investments by SB Northstar
2. Cash flows from investing activities
Cash outflow totaled ¥1,956.7 billion (net) from investing activities mainly as a result of new
investments by SVF2 and sales of investments by SVF1.
- Payments for acquisition of investments by SVF1 and SVF2: ¥2,681.4 billion
· Payments for acquisition of investments by SVF2 of ¥2,553.0 billion
- Proceeds from sale of investments by SVF1 and SVF 2: ¥1,365.8 billion
· Proceeds from sale of investments by SVF1 of ¥1,219.3 billion due to partial sales of shares of
nine portfolio companies including DoorDash, Coupang, and Uber
3. Cash flows from financing activities
Cash inflow of ¥254.4 billion (net) from financing activities for various actions taken for debt repayment
and new investments
- Proceeds from issuance of corporate bonds and payments for redemption of corporate bonds
· SBG issued domestic hybrid bonds of ¥405.0 billion, foreign currency-denominated straight
corporate bonds of $3.85 billion and €2.95 billion, and domestic subordinated bonds of ¥500.0
billion.
· SBG redeemed domestic hybrid bonds of ¥455.6 billion early.
- Proceeds from fund procurement using Alibaba shares
· A total of $10.35 billion procured through new prepaid forward contracts
· A total of $1.88 billion procured through margin loan
- Proceeds from borrowings by SVF1 and SVF2 and distribution/repayment from SVF1 to third-party
investors
· SVF1 procured $2.80 billion and SVF2 procured $1.90 billion through the borrowings made for
the purpose of monetizing investments (Portfolio Financing Facility).
· SVF1 distributed ¥857.9 billion to third-party investors
- Repayment of borrowings by SB Northstar
· Repaid $6.00 billion of margin loan and ¥930.8 billion (net) of short-term borrowings
(Millions of yen)
Six months ended September 30
2020 2021 Change
Cash flows from operating activities 531,867 2,078,239 1,546,372
Cash flows from investing activities (322,186) (1,956,685) (1,634,499)
Cash flows from financing activities 1,591,071 254,432 (1,336,639)
(a) Cash Flows from Operating Activities
Cash flows from operating activities increased by ¥1,546,372 million year on year. This was mainly due to an
increase in cash inflow of ¥1,768,429 million resulting mainly from the sale of investments by SB Northstar.
The amount of income taxes paid (cash outflow) increased by ¥298,502 million year on year. This was mainly
due to payment in the first quarter of corporate taxes on taxable income at SBGJ including gains on the sale of
SoftBank Corp. shares generated in the previous fiscal year, as well as payment of withholding income tax on
dividends from SBGJ to SBG. Of this, the withholding income tax was refunded in the second quarter.
SoftBank Group Corp. Consolidated Financial Report For the Six-Month Period Ended September 30, 2021
50
(b) Cash Flows from Investing Activities
Primary components
Components Primary details
Payments for acquisition of
investments
¥(666,003) million
· SoftBank Latin America Funds made new and follow-on investments
totaling $2.3 billion.
· The Company acquired preferred stocks and common stocks of
WeWork by tender offer, which was completed in April 2021, for
¥101,377 million.
· The unpaid acquisition price of ¥115,227 million for shares of a new
company established through the business integration of Z Holdings
Corporation and LINE Corporation was paid after the shares were ac-
quired from non-controlling interests in the previous fiscal year.
Payments for acquisition of
investments by SVF1 and SVF2
¥(2,681,439) million
· SVF2 made new and follow-on investments totaling $23.2 billion.
· SVF1 made follow-on investments totaling $1.2 billion.
Proceeds from sales of invest-
ments by SVF1 and SVF2
¥1,365,766 million
· SVF1 sold a portion of its shares in nine portfolio companies, includ-
ing DoorDash, Coupang, and Uber.
· SVF2 sold all of its shares in one portfolio company and a portion of
its shares in KE Holdings.
Purchase of property, plant and
equipment and intangible assets
¥(535,121) million
· Yahoo Japan Corporation purchased intangible assets following an ex-
ecution of an agreement with Oath Holdings Inc. and other parties,
with whom it had previously entered into a license agreement, to ac-
quire trademarks in Japan related to Yahoo! and Yahoo! JAPAN etc.
and paid ¥178.5 billion.
· SoftBank Corp. purchased telecommunications equipment.
Proceeds from withdrawal of
restricted cash
¥359,058 million
In April 2021, restricted cash (a deposit of $3.3 billion required for the
early termination procedure of a portion of the collar contracts out of the
prepaid forward contracts using Alibaba shares) recorded at the previous
fiscal year-end was withdrawn. In the same month, a payment of $2.86
billion was completed for the early termination, and the cash outflow as-
sociated with the transaction was recorded as “repayment of interest-
bearing debt” (cash flows from financing activities).
SoftBank Group Corp. Consolidated Financial Report For the Six-Month Period Ended September 30, 2021
51

(c) Cash Flows from Financing Activities
Primary components
Components Primary details
Proceeds in short-term
interest-bearing debt, net
¥(908,254) million*1
(Proceeds and payments for interest-
bearing debt (current liabilities) with
fast turnover and short maturities)
· Short-term borrowings at SB Northstar decreased by ¥930,763 million
(net).
· SoftBank Corp.’s short-term borrowings decreased by ¥89,415 million
(net).
· YJ Card Corporation (currently PayPay Card Corporation) and LINE
Corporation issued commercial paper of ¥66,500 million (net) and
¥44,500 million (net), respectively.
Proceeds from interest-bearing debt
¥6,955,021 million
Proceeds from borrowings
¥3,692,760 million*2
· SBG made short-term borrowings of ¥1,349,870 million.
· The Company’s wholly owned subsidiaries conducting fund procure-
ment borrowed $1.88 billion through a margin loan using Alibaba
shares and also borrowed $2.65 billion through a margin loan and
$1.25 billion through a bridge loan, using T-Mobile shares.
· SVF1 and SVF2 borrowed $2.80 billion and $1.90 billion through a fi-
nancing facility made for the purpose of monetizing investments (Port-
folio Financing Facility).
· SoftBank Corp. procured ¥137,400 million through commercial paper and
borrowed ¥487,467 million through the securitization of installment sales
receivables and sale and leaseback transactions.
· Z Holdings Corporation borrowed ¥243,700 million.
Proceeds from issuance of
corporate bonds
¥1,920,055 million
· SBG issued domestic hybrid bonds of ¥405,000 million, foreign cur-
rency-denominated straight corporate bonds of $3.85 billion and €2.95
billion, and domestic subordinated bonds of ¥500,000 million.
· SoftBank Corp. issued domestic straight corporate bonds of ¥100,000
million.
· Z Holdings Corporation issued domestic straight corporate bonds of
¥100,000 million.
Proceeds from procurement
by prepaid forward
contracts using shares
¥1,342,206 million
The Company’s wholly owned subsidiaries conducting fund procure-
ment procured an aggregate amount of $10.35 billion through several
prepaid forward contracts using Alibaba shares. They also procured an
aggregate amount of $1.81 billion through prepaid forward contracts us-
ing T-Mobile shares.
SoftBank Group Corp. Consolidated Financial Report For the Six-Month Period Ended September 30, 2021
52

Components Primary details
Repayment of interest-bearing debt
¥(4,295,720) million
Repayment of borrowings
¥(3,520,633) million*2
· SBG repaid short-term borrowings of ¥1,225,568 million.
· SB Northstar repaid a margin loan using Alibaba shares of $6.00 bil-
lion.
· The Company’s wholly owned subsidiaries conducting fund procure-
ment repaid a margin loan using T-Mobile shares of $4.38 billion bor-
rowed in the previous fiscal year.
· SVF1 and SVF2 repaid $0.43 billion and $0.90 billion, respectively, in
borrowings made for the purpose of monetizing investments (Portfolio
Financing Facility).
· SoftBank Corp. repaid ¥73,100 million in commercial paper and
¥448,135 million in borrowings related to the securitization of install-
ment sales receivables and sale and leaseback transactions.
· LINE Corporation repaid ¥151,577 million of borrowings.
Redemption of corporate
bonds
¥(455,600) million
SBG redeemed domestic hybrid bonds of ¥455,600 million early.
Payment of the settlement
of the variable prepaid
forward contract
¥(319,487) million
In April 2021, the Company paid $2.86 billion for early termination of a
portion of the collar contracts out of the prepaid forward contracts using
Alibaba shares.
Distribution/repayment from
SVF1 to third-party investors
¥(857,907) million
SVF1 made distributions to third-party investors.
Purchase of treasury stock
¥(257,784) million
SBG repurchased its own shares up to May 12, 2021 in accordance with
a Board resolution on July 30, 2020.
Cash dividends paid to
non-controlling interests
¥(148,911) million
SoftBank Corp. and Z Holdings Corporation paid dividends to non-
controlling interests.
Notes:
1. “Proceeds in short-term interest-bearing debt, net” presents cash flows from financing activities that meet the requirement of
“Reporting cash flows on a net basis” under IFRSs.
2. “Proceeds from borrowings” and “repayment of borrowings” include proceeds of ¥2,212,685 million and outlays of ¥1,607,314
million, respectively, related to borrowings with a contracted term of one year or less.
(4) Forecasts
The Company does not provide forecasts of consolidated results of operations as they are difficult to project due to
numerous uncertainties affecting earnings.
SoftBank Group Corp. Consolidated Financial Report For the Six-Month Period Ended September 30, 2021
53

Notes regarding “1. Overview of Results of Operations”
1 The ratio of liabilities to holding assets, calculated as adjusted net interest-bearing debt divided by equity value of holdings. The
Company strives to manage this below 25% in normal times in financial markets, with an upper threshold of 35% in times of
emergency. Equity value of holdings and adjusted net interest-bearing debt each exclude amounts to be settled at maturity or
borrowings that are part of asset-backed finance. The calculation of adjusted net interest-bearing debt also excludes, from the
Company’s consolidated figures, interest-bearing debt and cash and cash equivalents, etc. attributable to listed subsidiaries such
as SoftBank Corp. and Z Holdings Corporation, as well as entities managed on a self-financing basis, such as SoftBank Vision
Fund 1, SoftBank Vision Fund 2, SoftBank Latin America Funds, Arm, PayPay Corporation, and Fortress Investment Group,
along with SB Northstar.
2 Includes a share exchange. In the first quarter, SVF1 exchanged all of its shares in PT Tokopedia (“Tokopedia”) for shares in
GoTo, a newly formed company as a result of merger between Tokopedia and PT Aplikasi Karya Anak Bangsa. This share
exchange is treated as a full exit (entire sale) from the investment and an acquisition of the new investment, with the sale price
and acquisition cost being recorded in gross, respectively, and with the difference between the acquisition cost of shares initially
held and sale price (acquisition cost of the exchanged shares) being recorded as realized gain and loss on the investments.
3 Interest expenses of SBG include interest expenses of its wholly owned subsidiaries conducting fund procurement.
4 The Company applied the equity method to Alibaba’s consolidated financial statements (the Company’s economic interests in
Alibaba as of June 30, 2021: 24.90%) for each reporting period on a three-month time lag because it is impractical to align
reporting periods with Alibaba due to contracts with the company, among others. Necessary adjustments are made to reflect
significant transactions and events announced by Alibaba during the period on a three-month time lag.
5 As of the second quarter-end, only Masayoshi Son, SBG’s Representative Director, Corporate Officer, Chairman & CEO, invests
in MgmtCo. Participation by members of management other than Masayoshi Son was undecided as of October 31, 2021; however,
such participation is planned for the future.
6 For the nature of equity and preferred equity, see “(1) Introduction of Co-investment Program with Restricted Right to Receive
Distributions and Preferred Equity to SVF2” under “4. SoftBank Vision Funds business” in “(6) Notes to Condensed Interim
Consolidated Financial Statements” in “3. Condensed Interim Consolidated Financial Statements and Primary Notes.”
7 As of the second quarter-end, none of the investment amounts from MgmtCo has been paid.
8 SVF2 LLC’s receivables include the transaction amounts incurred in connection with the acceptance of MgmtCo’s capital contri-
bution. Such transaction amounts include (i) MgmtCo's interest of 17.25% of the aggregate of the initial acquisition cost of in-
vestments held by SVF2 LLC and amounts of contributions made by the Company to SVF2 to meet other costs, (ii) increase in
fair market value of the investments from its initial acquisition cost at SVF2 to 30 June 2021 multiplied by MgmtCo's interest of
17.25% and (iii) adjustments equivalent to the interest incurred for the period from the Company's contribution to SVF2 until 30
June 2021.
9 For investments outside the scope of the co-investment program, see the Data Sheets in “Materials” under “Earnings Results
Briefing” on the Company’s website at https://group.softbank/en/ir/presentations/.
10 Drawn capital of SVF1 excludes the amount repaid to limited partners due to investment plan changes and other reasons after the
capital was drawn.
11 After deducting transaction fees, etc.
12 This analysis is based on the actual shipments of royalty units (chips incorporating Arm technology) by Arm licensees for the six-
month period ended June 30, 2021, as reported by licensees in royalty reports. Arm’s licensees report their actual shipments of
royalty units one quarter in arrears, and therefore, the royalty unit analysis for the period is based on chips shipped for the six-
month period ended June 30, 2021. In contrast, royalty revenues are accrued in the same quarter the chips are shipped, based on
estimates.
13 World Semiconductor Trade Statistics (WSTS) as of August 2021. Excludes memory and analog chips, which do not contain
processor technology. This data is compiled on the basis of data submitted by semiconductor companies participating in the
survey.
14 For SBLAF1, investments in unlisted companies made on or after June 24, 2021 are subject to these.
15
In addition to the Company’s commitment, a co-investment program of employees involved in the management of the fund has
committed $7 million (the program’s interest is deducted as third-party interests) to the fund.
SoftBank Group Corp. Consolidated Financial Report For the Six-Month Period Ended September 30, 2021
54
2. Notes to Summary Information
(1) Significant Changes in Scope of Consolidation for the Six-Month Period Ended September 30, 2021
(Specified subsidiary (one entity) excluded from the scope of consolidation)
On June 21, 2021, the Company sold the majority of shares in Boston Dynamics, Inc. (“Boston Dynamics”) held by the Company through a wholly-owned subsidiary to Hyundai Motor Company and its affiliates (collectively, the “Hyundai Motor Group”) and Euisun Chung, Chairman of Hyundai Motor Group. On the same date, Hyundai Motor Group and Euisun Chung subscribed for additional shares of Boston Dynamics. Upon completion of the transaction, Boston Dynamics, which was a specified subsidiary of the Company, was no longer a subsidiary of the Company. The details are described in “Note 7. Disposal group classified as held for sale” in “(6) Notes to Condensed Interim Consolidated Financial Statements” under “3. Condensed Interim Consolidated Financial Statements and Primary Notes.”
(2) Changes in Accounting Estimates
(Reversal of impairment losses on equity method investments)
Reversal of impairment losses on equity method investments was recorded for the equity method investment in WeWork Inc., an equity method associate of the Company. The details are described in “Notes 3” in “Note 16. Other gain” in “(6) Notes to Condensed Interim Consolidated Financial Statements” under “3. Condensed Interim Consolidated Financial Statements and Primary Notes.”
SoftBank Group Corp. Consolidated Financial Report For the Six-Month Period Ended September 30, 2021
55

Company names / Abbreviations Definition
SoftBank Group Corp. SoftBank Group Corp. (stand-alone basis)
The Company SoftBank Group Corp. and its subsidiaries
* Each of the following names or abbreviations indicates the respective company and its subsidiaries, if any.
SB Northstar SB Northstar LP
SVF1 SoftBank Vision Fund L.P. and its alternative investment vehicles
SVF2 SoftBank Vision Fund II-2 L.P. and its alternative investment vehicles
SVF2 LLC SVF II Investment Holdings LLC
SBIA SB Investment Advisers (UK) Limited
SBGA SB Global Advisers Limited
Arm Arm Limited
SoftBank Latin America Funds SLA Latin America Fund LLC
Fortress Fortress Investment Group LLC
Sprint Sprint Corporation
Alibaba Alibaba Group Holding Limited
WeWork WeWork Inc.
MgmtCo MASA USA LLC
3. Condensed Interim Consolidated Financial Statements and Primary Notes
(Definitions of company names and abbreviations used in the condensed interim consolidated financial statements and primary notes)
Company names and abbreviations used in the condensed interim consolidated financial statements and primary notes, unless otherwise stated or interpreted differently in the context, are as follows:
SoftBank Group Corp. Consolidated Financial Report For the Six-Month Period Ended September 30, 2021
56

Previous Current
Proceeds from sales of investments by SVF1 Proceeds from sales of investments by SVF1 and SVF2
Previous Current
Third-party interests in SVF1 Third-party interests in SVF1 and SVF2
Previous Current
Change in third-party interests in SVF1 Change in third-party interests in SVF1 and SVF2
Previous Current
Change in third-party interests in SVF1 Change in third-party interests in SVF1 and SVF2
Previous Current
SVF1 and Other SBIA-Managed Funds segment SoftBank Vision Funds segment
From the three-month period ended June 30, 2021, the account of condensed interim consolidated statement of cash flows has been changed as follows:
Condensed Interim Consolidated Statement of Cash Flows
From the three-month period ended September 30, 2021, the names of accounts and a reportable segment have been changed as follows:
Condensed Interim Consolidated Statement of Financial Position
Condensed Interim Consolidated Statement of Income
Condensed Interim Consolidated Statement of Cash Flows
Segment information
SoftBank Group Corp. Consolidated Financial Report For the Six-Month Period Ended September 30, 2021
57
(Millions of yen)As of
March 31, 2021As of
September 30, 2021AssetsCurrent assets
Cash and cash equivalents 4,662,725 5,093,370Trade and other receivables 2,216,434 2,009,419Investments from asset management subsidiaries 658,227 319,485Securities pledged as collateral in asset management subsidiaries 1,427,286 67,923
Derivative financial assets in asset management subsidiaries 188,056 129,089
Derivative financial assets 383,315 720,984Other financial assets 671,907 294,090Inventories 126,830 128,599Other current assets 446,739 216,662
Subtotal 10,781,519 8,979,621Assets classified as held for sale 38,647 -
Total current assets 10,820,166 8,979,621
Non-current assetsProperty, plant and equipment 1,668,578 1,705,414Right-of-use assets 1,147,020 1,011,800Goodwill 4,684,419 4,706,186Intangible assets 2,308,370 2,412,018Costs to obtain contracts 246,996 278,814Investments accounted for using the equity method 4,349,971 4,825,476Investments from SVF1 and SVF2 accounted for using
FVTPL 13,646,774 14,638,981
Investment securities 3,706,784 3,898,424Derivative financial assets 908,660 1,201,116Other financial assets 1,919,262 2,257,290Deferred tax assets 206,069 176,853Other non-current assets 137,384 128,795
Total non-current assets 34,930,287 37,241,167Total assets 45,750,453 46,220,788
(1) Condensed Interim Consolidated Statement of Financial Position
SoftBank Group Corp. Consolidated Financial Report For the Six-Month Period Ended September 30, 2021
58

(Millions of yen)As of
March 31, 2021As of
September 30, 2021Liabilities and equityCurrent liabilities
Interest-bearing debt 7,735,239 7,122,992Lease liabilities 307,447 273,346Deposits for banking business 1,109,240 1,194,584Trade and other payables 1,970,275 1,542,463Derivative financial liabilities in asset management
subsidiaries 14,673 1,788
Derivative financial liabilities 322,213 108,938Other financial liabilities 51,285 92,137Income taxes payables 391,930 161,417Provisions 24,939 18,251Other current liabilities 952,443 685,467
Subtotal 12,879,684 11,201,383Liabilities directly relating to assets classified as held for
sale 11,271 -
Total current liabilities 12,890,955 11,201,383
Non-current liabilitiesInterest-bearing debt 10,777,736 13,024,167Lease liabilities 727,554 678,949Third-party interests in SVF1 and SVF2 6,601,791 5,853,663Derivative financial liabilities 32,692 83,523Other financial liabilities 415,407 464,760Provisions 110,586 112,105Deferred tax liabilities 2,030,651 2,287,079Other non-current liabilities 207,488 175,689
Total non-current liabilities 20,903,905 22,679,935Total liabilities 33,794,860 33,881,318
EquityEquity attributable to owners of the parent
Common stock 238,772 238,772Capital surplus 2,618,504 2,595,649Other equity instruments 496,876 496,876Retained earnings 8,810,422 6,642,298Treasury stock (2,290,077) (64,618)Accumulated other comprehensive income 338,329 639,585
Subtotal 10,212,826 10,548,562Accumulated other comprehensive income directly
relating to assets classified as held for sale 267 -
Total equity attributable to owners of the parent 10,213,093 10,548,562
Non-controlling interests 1,742,500 1,790,908Total equity 11,955,593 12,339,470Total liabilities and equity 45,750,453 46,220,788
SoftBank Group Corp. Consolidated Financial Report For the Six-Month Period Ended September 30, 2021
59

(Millions of yen)
Six-month period ended September 30, 2020
Six-month period ended September 30, 2021
Continuing operationsNet sales 2,630,531 2,983,504
Cost of sales (1,210,719) (1,348,471)Gross profit 1,419,812 1,635,033Gain on investments
Gain on investments at Investment Business of Holding Companies 579,614 279,928
Gain (loss) on investments at SVF1, SVF2, and others 1,336,638 (879,186)
Gain on investments at Latin America Funds 63,468 193,698Gain on other investments 53,591 10,325
Total gain on investments 2,033,311 (395,235)
Selling, general and administrative expenses (1,011,301) (1,186,672)Finance cost (153,808) (185,599)Income on equity method investments 200,830 265,331Derivative gain (loss) (excluding gain (loss) on investments) (761,557) 620,959
Change in third-party interests in SVF1 and SVF2 (457,537) 195,179Other gain 171,722 97,975
Income before income tax 1,441,472 1,046,971Income taxes (272,282) (456,846)
Net income from continuing operations 1,169,190 590,125
Discontinued operationsNet income from discontinued operations 710,187 -Net income 1,879,377 590,125
Net income attributable toOwners of the parent 1,883,211 363,569
Net income from continuing operations 1,172,737 363,569Net income from discontinued operations 710,474 -
Non-controlling interests (3,834) 226,556Net income from continuing operations (3,547) 226,556Net income from discontinued operations (287) -
Net income 1,879,377 590,125
Earnings per shareBasic earnings per share (Yen)
Continuing operations 589.02 202.46Discontinued operations 361.52 -
Total basic earnings per share 950.54 202.46Diluted earnings per share (Yen)
Continuing operations 542.35 195.62Discontinued operations 360.71 -
Total diluted earnings per share 903.06 195.62
(2) Condensed Interim Consolidated Statement of Income and Condensed Interim Consolidated Statement of Comprehensive Income
For the six-month period ended September 30
Condensed Interim Consolidated Statement of Income
SoftBank Group Corp. Consolidated Financial Report For the Six-Month Period Ended September 30, 2021
60

(Millions of yen)
Six-month period ended September 30, 2020
Six-month period ended September 30, 2021
Net income 1,879,377 590,125Other comprehensive income, net of tax
Items that will not be reclassified to profit or lossEquity financial assets at FVTOCI 5,486 12,765
Total items that will not be reclassified to profit or loss 5,486 12,765
Items that may be reclassified subsequently to profit or lossDebt financial assets at FVTOCI 825 200Cash flow hedges 30,722 3,501Exchange differences on translating foreign
operations (364,835) 303,164
Share of other comprehensive income of associates 10,744 (17,594)Total items that may be reclassified subsequently to
profit or loss (322,544) 289,271
Total other comprehensive income, net of tax (317,058) 302,036Total comprehensive income 1,562,319 892,161
Total comprehensive incomeComprehensive income from continuing operations 1,059,869 892,161Comprehensive income from discontinued operations 502,450 -
Total comprehensive income attributable toOwners of the parent 1,563,669 664,724
Comprehensive income from continuing operations 1,060,932 664,724
Comprehensive income from discontinued operations 502,737 -
Non-controlling interests (1,350) 227,437Total comprehensive income 1,562,319 892,161
Condensed Interim Consolidated Statement of Comprehensive Income
SoftBank Group Corp. Consolidated Financial Report For the Six-Month Period Ended September 30, 2021
61

(Millions of yen)
Three-month period ended September 30, 2020
Three-month period ended September 30, 2021
Continuing operationsNet sales 1,350,558 1,504,370
Cost of sales (628,218) (681,308)Gross profit 722,340 823,062Gain on investments
Loss on investments at Investment Business of Holding Companies (70,879) (461,598)
Gain (loss) on investments at SVF1, SVF2, and others 1,040,061 (1,167,067)
Gain (loss) on investments at Latin America Funds 40,187 (25,670)Gain (loss) on other investments 41,022 (3,968)
Total gain on investments 1,050,391 (1,658,303)
Selling, general and administrative expenses (506,727) (593,242)Finance cost (76,815) (102,800)Income on equity method investments 194,257 214,951Derivative gain (loss) (excluding gain (loss) on
investments) (585,732) 732,495
Change in third-party interests in SVF1 and SVF2 (309,894) 329,272Other gain 119,532 9,058
Income before income tax 607,352 (245,507)Income taxes (20,123) (96,857)
Net income from continuing operations 587,229 (342,364)
Discontinued operationsNet income from discontinued operations (24,273) -Net income 562,956 (342,364)
Net income attributable toOwners of the parent 627,499 (397,940)
Net income from continuing operations 651,594 (397,940)Net income from discontinued operations (24,095) -
Non-controlling interests (64,543) 55,576Net income from continuing operations (64,365) 55,576Net income from discontinued operations (178) -
Net income 562,956 (342,364)
Earnings per shareBasic earnings per share (Yen)
Continuing operations 338.11 (236.86)Discontinued operations (12.65) -
Total basic earnings per share 325.46 (236.86)Diluted earnings per share (Yen)
Continuing operations 315.62 (241.19)Discontinued operations (12.61) -
Total diluted earnings per share 303.01 (241.19)
For the three-month period ended September 30
Condensed Interim Consolidated Statement of Income
SoftBank Group Corp. Consolidated Financial Report For the Six-Month Period Ended September 30, 2021
62

(Millions of yen)
Three-month period ended September 30, 2020
Three-month period ended September 30, 2021
Net income 562,956 (342,364)Other comprehensive income, net of tax
Items that will not be reclassified to profit or lossEquity financial assets at FVTOCI 3,539 493
Total items that will not be reclassified to profit or loss 3,539 493
Items that may be reclassified subsequently to profit or lossDebt financial assets at FVTOCI 248 (137)Cash flow hedges 2,097 303Exchange differences on translating foreign
operations (145,744) 256,317
Share of other comprehensive income of associates 3,216 (18,851)Total items that may be reclassified subsequently to
profit or loss (140,183) 237,632
Total other comprehensive income, net of tax (136,644) 238,125Total comprehensive income 426,312 (104,239)
Total comprehensive incomeComprehensive income from continuing operations 448,231 (104,239)Comprehensive income from discontinued operations (21,919) -
Total comprehensive income attributable toOwners of the parent 490,183 (158,371)
Comprehensive income from continuing operations 511,924 (158,371)
Comprehensive income from discontinued operations (21,741) -
Non-controlling interests (63,871) 54,132Total comprehensive income 426,312 (104,239)
Condensed Interim Consolidated Statement of Comprehensive Income
SoftBank Group Corp. Consolidated Financial Report For the Six-Month Period Ended September 30, 2021
63

(Millions of yen)
Equity attributable to owners of the parent
Common stock
Capital surplus
Other equity instruments
Retained earnings
Treasury stock
Accumulated other
comprehensive income Subtotal
As of April 1, 2020 238,772 1,490,325 496,876 3,945,820 (101,616) (362,259) 5,707,918Comprehensive income
Net income - - - 1,883,211 - - 1,883,211Other comprehensive Income - - - - - (113,847) (113,847)
Total comprehensive income - - - 1,883,211 - (113,847) 1,769,364Transactions with owners and
other transactionsCash dividends - - - (45,496) - - (45,496)Distribution to owners of other
equity instruments- - - (15,339) - - (15,339)
Transfer of accumulated other comprehensive income to retained earnings
- - - 451 - (451) -
Purchase and disposal of treasury stock
- - - 268 (1,011,656) - (1,011,388)
Changes from loss of control - - - - - - -Changes in interests in subsidiaries - 914,767 - - - - 914,767Changes in associates’ interests in
their subsidiaries- (12,115) - - - - (12,115)
Changes in interests in associates’ capital surplus
- 1,243 - - - - 1,243
Share-based payment transactions - (6,201) - - - - (6,201)Transfer of accumulated other
comprehensive income held for sale
- - - - - 4,946 4,946
Other - - - - - - -Total transactions with owners
and other transactions- 897,694 - (60,116) (1,011,656) 4,495 (169,583)
As of September 30, 2020 238,772 2,388,019 496,876 5,768,915 (1,113,272) (471,611) 7,307,699
(3) Condensed Interim Consolidated Statement of Changes in Equity
For the six-month period ended September 30, 2020
SoftBank Group Corp. Consolidated Financial Report For the Six-Month Period Ended September 30, 2021
64

(Millions of yen)
Equity attributable to owners of theparent
Accumulated other comprehensive income
directly relating to assets classified as held for sale Total
Non-controlling
interests Total equity
As of April 1, 2020 205,695 5,913,613 1,459,304 7,372,917Comprehensive income
Net income - 1,883,211 (3,834) 1,879,377Other comprehensive income (205,695) (319,542) 2,484 (317,058)
Total comprehensive income (205,695) 1,563,669 (1,350) 1,562,319Transactions with owners and
other transactionsCash dividends - (45,496) (93,597) (139,093)Distribution to owners of other
equity instruments- (15,339) - (15,339)
Transfer of accumulated other comprehensive income to retained earnings
- - - -
Purchase and disposal of treasury stock
- (1,011,388) - (1,011,388)
Changes from loss of control - - (424,653) (424,653)Changes in interests in subsidiaries - 914,767 179,369 1,094,136Changes in associates’ interests in
their subsidiaries- (12,115) - (12,115)
Changes in interests in associates’ capital surplus
- 1,243 - 1,243
Share-based payment transactions - (6,201) (941) (7,142)Transfer of accumulated other
comprehensive income held for sale
(4,946) - - -
Other - - (280) (280)Total transactions with owners
and other transactions(4,946) (174,529) (340,102) (514,631)
As of September 30, 2020 (4,946) 7,302,753 1,117,852 8,420,605
SoftBank Group Corp. Consolidated Financial Report For the Six-Month Period Ended September 30, 2021
65
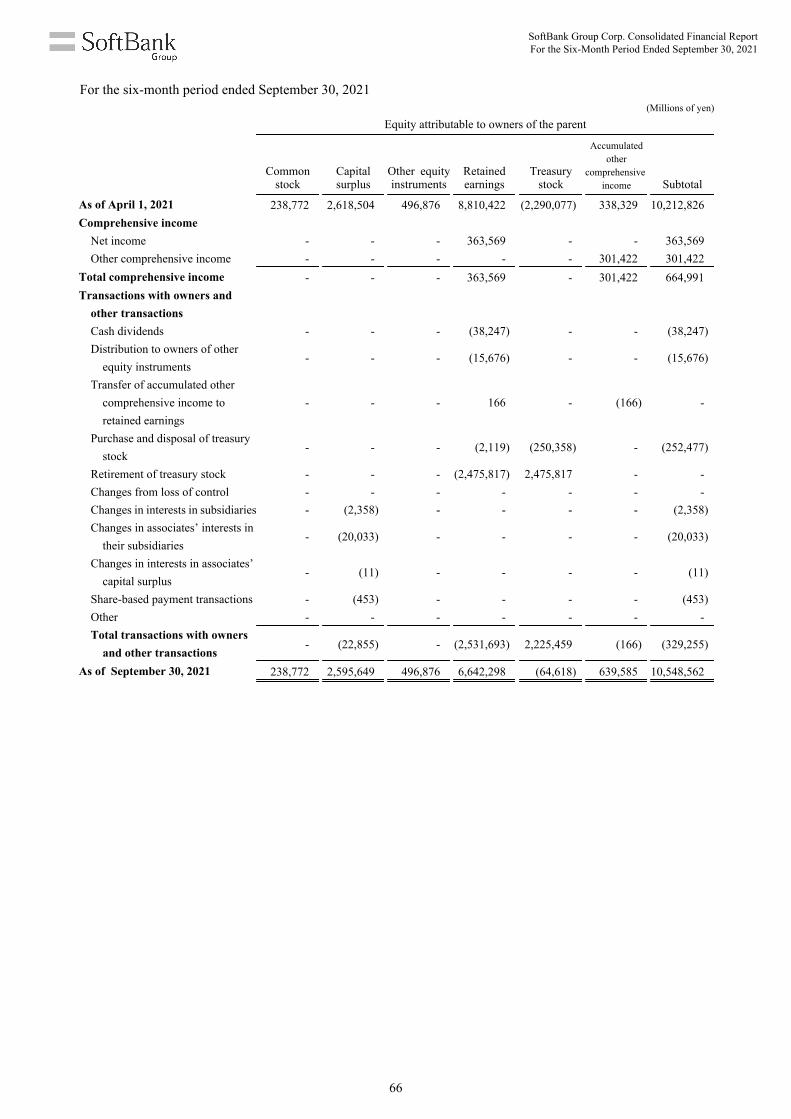
(Millions of yen)
Equity attributable to owners of the parent
Common stock
Capital surplus
Other equity instruments
Retained earnings
Treasury stock
Accumulated other
comprehensive income Subtotal
As of April 1, 2021 238,772 2,618,504 496,876 8,810,422 (2,290,077) 338,329 10,212,826Comprehensive income
Net income - - - 363,569 - - 363,569Other comprehensive income - - - - - 301,422 301,422
Total comprehensive income - - - 363,569 - 301,422 664,991Transactions with owners and
other transactionsCash dividends - - - (38,247) - - (38,247)Distribution to owners of other
equity instruments- - - (15,676) - - (15,676)
Transfer of accumulated other comprehensive income to retained earnings
- - - 166 - (166) -
Purchase and disposal of treasury stock
- - - (2,119) (250,358) - (252,477)
Retirement of treasury stock - - - (2,475,817) 2,475,817 - -Changes from loss of control - - - - - - -Changes in interests in subsidiaries - (2,358) - - - - (2,358)Changes in associates’ interests in
their subsidiaries- (20,033) - - - - (20,033)
Changes in interests in associates’ capital surplus
- (11) - - - - (11)
Share-based payment transactions - (453) - - - - (453)Other - - - - - - -Total transactions with owners
and other transactions- (22,855) - (2,531,693) 2,225,459 (166) (329,255)
As of September 30, 2021 238,772 2,595,649 496,876 6,642,298 (64,618) 639,585 10,548,562
For the six-month period ended September 30, 2021
SoftBank Group Corp. Consolidated Financial Report For the Six-Month Period Ended September 30, 2021
66

(Millions of yen)
Equity attributable to owners of theparent
Accumulated other comprehensive income
directly relating to assets classified as held for sale Total
Non-controlling
interests Total equity
As of April 1, 2021 267 10,213,093 1,742,500 11,955,593Comprehensive income
Net income - 363,569 226,556 590,125Other comprehensive income (267) 301,155 881 302,036
Total comprehensive income (267) 664,724 227,437 892,161Transactions with owners and
other transactionsCash dividends - (38,247) (149,098) (187,345)Distribution to owners of other
equity instruments- (15,676) - (15,676)
Transfer of accumulated other comprehensive income to retained earnings
- - - -
Purchase and disposal of treasury stock
- (252,477) - (252,477)
Retirement of treasury stock - - - -Changes from loss of control - - (15,864) (15,864)Changes in interests in subsidiaries - (2,358) (19,945) (22,303)Changes in associates’ interests in
their subsidiaries- (20,033) - (20,033)
Changes in interests in associates’ capital surplus
- (11) - (11)
Share-based payment transactions - (453) 6,720 6,267Other - - (842) (842)Total transactions with owners
and other transactions- (329,255) (179,029) (508,284)
As of September 30, 2021 - 10,548,562 1,790,908 12,339,470
SoftBank Group Corp. Consolidated Financial Report For the Six-Month Period Ended September 30, 2021
67
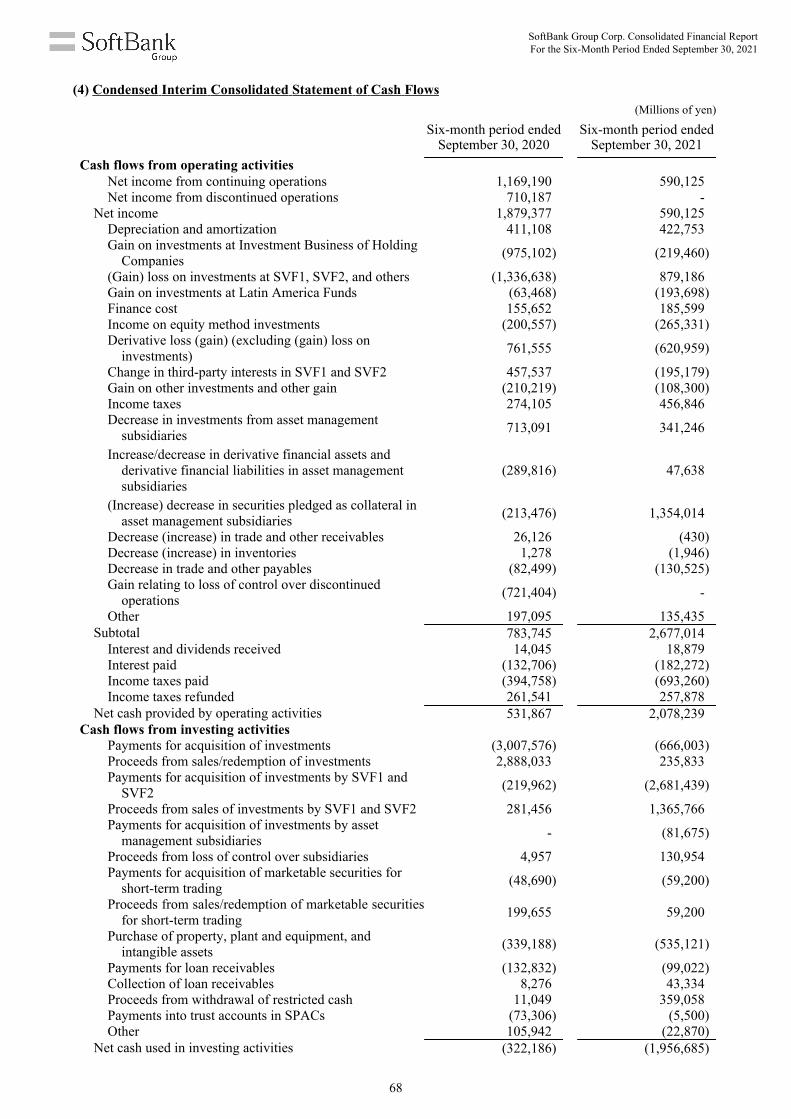
(Millions of yen)
Six-month period ended September 30, 2020
Six-month period ended September 30, 2021
Cash flows from operating activitiesNet income from continuing operations 1,169,190 590,125Net income from discontinued operations 710,187 -
Net income 1,879,377 590,125Depreciation and amortization 411,108 422,753Gain on investments at Investment Business of Holding
Companies (975,102) (219,460)
(Gain) loss on investments at SVF1, SVF2, and others (1,336,638) 879,186Gain on investments at Latin America Funds (63,468) (193,698)Finance cost 155,652 185,599Income on equity method investments (200,557) (265,331)Derivative loss (gain) (excluding (gain) loss on
investments) 761,555 (620,959)
Change in third-party interests in SVF1 and SVF2 457,537 (195,179)Gain on other investments and other gain (210,219) (108,300)Income taxes 274,105 456,846Decrease in investments from asset management
subsidiaries 713,091 341,246
Increase/decrease in derivative financial assets and derivative financial liabilities in asset management subsidiaries
(289,816) 47,638
(Increase) decrease in securities pledged as collateral in asset management subsidiaries (213,476) 1,354,014
Decrease (increase) in trade and other receivables 26,126 (430)Decrease (increase) in inventories 1,278 (1,946)Decrease in trade and other payables (82,499) (130,525)Gain relating to loss of control over discontinued
operations (721,404) -
Other 197,095 135,435Subtotal 783,745 2,677,014
Interest and dividends received 14,045 18,879Interest paid (132,706) (182,272)Income taxes paid (394,758) (693,260)Income taxes refunded 261,541 257,878
Net cash provided by operating activities 531,867 2,078,239Cash flows from investing activities
Payments for acquisition of investments (3,007,576) (666,003)Proceeds from sales/redemption of investments 2,888,033 235,833Payments for acquisition of investments by SVF1 and
SVF2 (219,962) (2,681,439)
Proceeds from sales of investments by SVF1 and SVF2 281,456 1,365,766Payments for acquisition of investments by asset
management subsidiaries - (81,675)
Proceeds from loss of control over subsidiaries 4,957 130,954Payments for acquisition of marketable securities for
short-term trading (48,690) (59,200)
Proceeds from sales/redemption of marketable securities for short-term trading 199,655 59,200
Purchase of property, plant and equipment, and intangible assets (339,188) (535,121)
Payments for loan receivables (132,832) (99,022)Collection of loan receivables 8,276 43,334Proceeds from withdrawal of restricted cash 11,049 359,058Payments into trust accounts in SPACs (73,306) (5,500)Other 105,942 (22,870)
Net cash used in investing activities (322,186) (1,956,685)
(4) Condensed Interim Consolidated Statement of Cash Flows
SoftBank Group Corp. Consolidated Financial Report For the Six-Month Period Ended September 30, 2021
68
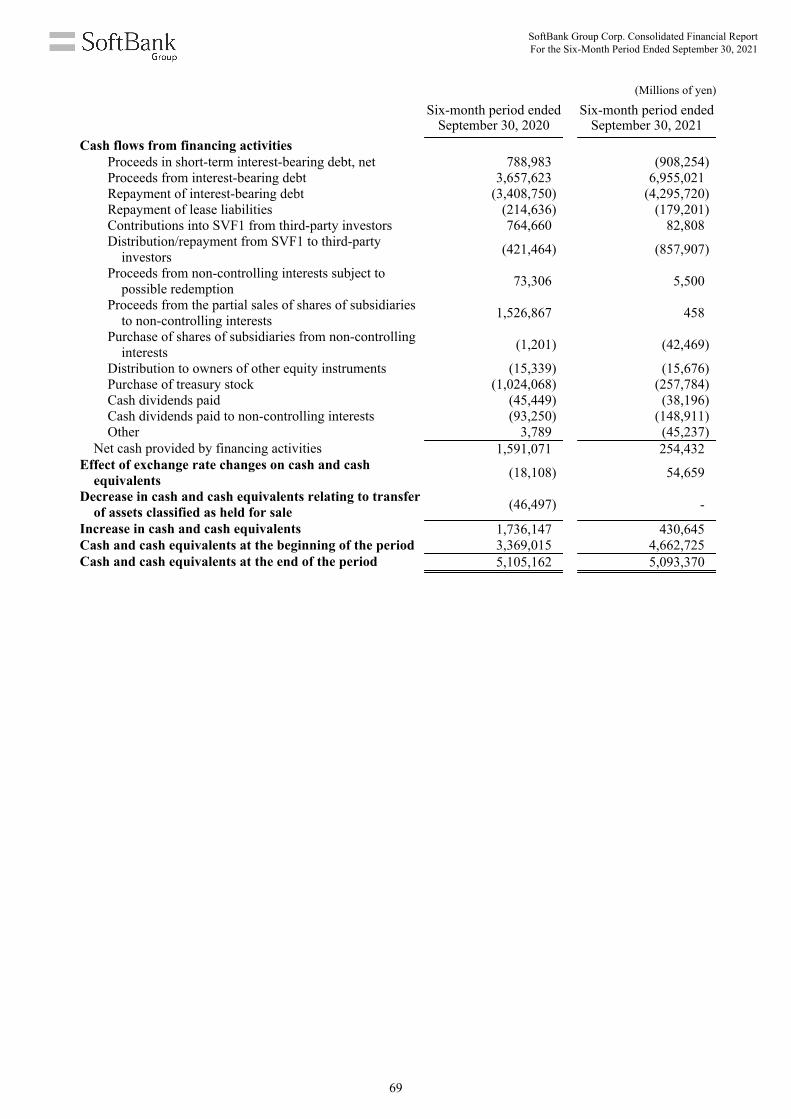
(Millions of yen)
Six-month period ended September 30, 2020
Six-month period ended September 30, 2021
Cash flows from financing activitiesProceeds in short-term interest-bearing debt, net 788,983 (908,254)Proceeds from interest-bearing debt 3,657,623 6,955,021Repayment of interest-bearing debt (3,408,750) (4,295,720)Repayment of lease liabilities (214,636) (179,201)Contributions into SVF1 from third-party investors 764,660 82,808Distribution/repayment from SVF1 to third-party
investors (421,464) (857,907)
Proceeds from non-controlling interests subject to possible redemption 73,306 5,500
Proceeds from the partial sales of shares of subsidiaries to non-controlling interests 1,526,867 458
Purchase of shares of subsidiaries from non-controlling interests (1,201) (42,469)
Distribution to owners of other equity instruments (15,339) (15,676)Purchase of treasury stock (1,024,068) (257,784)Cash dividends paid (45,449) (38,196)Cash dividends paid to non-controlling interests (93,250) (148,911)Other 3,789 (45,237)
Net cash provided by financing activities 1,591,071 254,432Effect of exchange rate changes on cash and cash
equivalents (18,108) 54,659
Decrease in cash and cash equivalents relating to transfer of assets classified as held for sale (46,497) -
Increase in cash and cash equivalents 1,736,147 430,645Cash and cash equivalents at the beginning of the period 3,369,015 4,662,725Cash and cash equivalents at the end of the period 5,105,162 5,093,370
SoftBank Group Corp. Consolidated Financial Report For the Six-Month Period Ended September 30, 2021
69
(5) Significant Doubt about Going Concern Assumption
There are no applicable items.
(6) Notes to Condensed Interim Consolidated Financial Statements
1. Changes in presentation
(Condensed interim consolidated statement of financial position)
“Derivative financial assets (current),” which was included in “Other financial assets (current)” in the past fiscal year, is separately presented from the three-month period ended September 30, 2021 since the amount increased and became significant. In order to reflect the change in presentation, ¥383,315 million, which was included in “Other financial assets (current)” as of March 31, 2021, is reclassified as “Derivative financial assets (current).”
(Condensed interim consolidated statement of income and condensed interim consolidated statement of comprehensive income)
“Gain on investments at Latin America Funds,” which was included in “Gain on other investments” in the past fiscal year, is separately presented from the three-month period ended June 30, 2021 since the amount increased and became significant. In order to reflect the change in presentation, ¥63,468 million and ¥40,187 million, which were included in “Gain on other investments” for the six-month period ended September 30, 2020 and the three-month period ended September 30, 2020, are reclassified as “Gain on investments at Latin America Funds.” The details of Latin America Funds are described in “Note 3. Segment information.”
SoftBank Group Corp. Consolidated Financial Report For the Six-Month Period Ended September 30, 2021
70
2. Significant accounting policies
Significant accounting policies applied to the condensed interim consolidated financial statements are consistent with the accounting policies applied to the consolidated financial statements for the fiscal year ended March 31, 2021. In addition, income taxes for the six-month period ended September 30, 2021 are calculated based on the estimated effective tax rate for the fiscal year.
Significant accounting policies for the SoftBank Vision Funds segment and for the asset management subsidiary are consistent with the accounting policies applied to the consolidated financial statements for the fiscal year ended March 31, 2021. The details are described in “(1) Significant accounting policies for the SoftBank Vision Funds segment.” and “(2) Significant accounting policies for the asset management subsidiary.”
(1) Significant accounting policies for the SoftBank Vision Funds segment
For SVF1 and SVF2, the Company applies the following accounting policies.
a. Consolidation of SVF1 and SVF2 by the Company
SVF1 and SVF2 are limited partnerships established by their respective general partners which are wholly-owned subsidiaries of the Company (SVF2 owns limited liability companies including SVF2 LLC) as its subsidiaries and by their forms of organization, qualify as structured entities. SVF1 and SVF2 are consolidated by the Company for the following reasons.
As of September 30, 2021, SVF1 and SVF2 are managed by SBIA and SBGA, respectively, which are wholly-owned subsidiaries of the Company in the UK. SVF2 was previously managed by SBIA and has been managed by SBGA since September 2021. SVF1 and SVF2 make investment decisions through each investment committee, which was established in SBIA and SBGA, respectively. As such, the Company has power as defined under IFRS 10 “Consolidated Financial Statements” over SVF1 and SVF2. Furthermore, SBIA and SBGA receive performance fees and the Company receives distributions attributable to limited partners based on the investment performance as returns from SVF1 and SVF2. The Company has the ability to affect those returns through its power over SVF1 and SVF2, and therefore, the Company is deemed to have control as stipulated in IFRS 10 “Consolidated Financial Statements” over SVF1 and SVF2.
Inter-company transactions such as management fees and performance fees to SBIA and SBGA paid or to be paid from SVF1 and SVF2 are eliminated in consolidation.
SoftBank Group Corp. Consolidated Financial Report For the Six-Month Period Ended September 30, 2021
71

b. Portfolio company investments made by SVF1 and SVF2
(a) Investments in subsidiaries
Of the portfolio company investments made by SVF1 and SVF2, the portfolio companies that the Company is deemed to control under IFRS 10 “Consolidated Financial Statements” are subsidiaries of the Company. Accordingly, their results of operations, assets and liabilities are included in the Company’s condensed interim consolidated financial statements.
Gain and loss on investments in the subsidiaries of the Company which are recognized in SVF1 and SVF2 are eliminated in consolidation.
(b) Investments in associates and joint ventures
Of the portfolio company investments made by SVF1 and SVF2, the portfolio companies over which the Company has significant influence under IAS 28 “Investments in Associates and Joint Ventures” are associates of the Company, and the portfolio companies that are joint ventures of SVF1 and SVF2 when, as defined under IFRS 11 “Joint Arrangements,” SVF1 and SVF2 have joint control with other investors under contractual arrangements and the investors have rights to the net assets of the arrangement.
The investments in associates and joint ventures of the Company made by SVF1 and SVF2 are accounted for as financial assets at FVTPL in accordance with paragraph 18 of IAS 28 “Investments in Associates and Joint Ventures” and presented as “Investments from SVF1 and SVF2 accounted for using FVTPL” in the condensed interim consolidated statement of financial position. The payments for these investments are presented as “Payments for acquisition of investments by SVF1 and SVF2” and the proceeds from sales of these investments are presented as “Proceeds from sales of investments by SVF1 and SVF2” under cash flows from investing activities in the condensed interim consolidated statement of cash flows.
If the investments in associates and joint ventures that were transferred from SoftBank Group Corp. and its subsidiaries to SVF1 or SVF2 were accounted for using the equity method prior to the transfer, these investments continue to be accounted for using the equity method after the transfer to SVF1 or SVF2 and presented as “Investments accounted for using the equity method” in the condensed interim consolidated statements of financial position. Gain and loss on the investments which were recognized in SVF1 or SVF2 are eliminated in consolidation and gain and loss on the investments accounted for using the equity method are presented as “Income on equity method investments” in the condensed interim consolidated statements of income.
(c) Other investments
Investments other than those in associates or joint ventures of the Company made by SVF1 and SVF2 are accounted for as financial assets at FVTPL. The presentation of these investments in the condensed interim consolidated statement of financial position and the condensed interim consolidated statement of cash flows are the same as the above “(b) Investments in associates and joint ventures.”
SoftBank Group Corp. Consolidated Financial Report For the Six-Month Period Ended September 30, 2021
72

c. Contribution from limited partners in SVF1 and SVF2 and investors in SVF2 LLC (collectively “SVF Investors”)
The Company introduced a co-investment program with restricted rights to receive distributions to SVF2 in August 2021. Accordingly, SVF Investors other than the Company have invested in SVF2 for the purpose of the program since the three-month period ended September 30, 2021. The details are described in “(1) Introduction of Co-investment Program with Restricted Rights to Receive Distributions and Preferred Equity to SVF2” under “Note 4. SoftBank Vision Funds business.”
(a) Contribution from SVF Investors other than the Company (“Third-Party Investors,” and each a “Third-Party Investor”)
The interests attributable to Third-Party Investors in SVF1 and SVF2 are classified as financial liabilities, “Third-party interests in SVF1 and SVF2” in the condensed interim consolidated statement of financial position, due to the predetermined finite life and contractual payment provision to each of Third-Party Investors at the end of the finite life within the constitutional agreements relating to SVF1 and SVF2. The liabilities are classified as “financial liabilities measured at amortized cost” upon initial recognition. The carrying amounts attributable to Third-Party Investors represent the amounts that would be distributed in accordance with the constitutional agreements in a theoretical liquidation scenario at the end of each quarter.
Third-Party Investor in SVF2 is entitled to make full or partial payment of their investment and related adjustments at any point in time, at its discretion, from the date it became an investor in SVF2 LLC to the end of company life of SVF2 LLC, and as of September 30, 2021, the Company has recognized receivables from Third-Party Investor. The receivables are included in “Other financial assets (non-current)” in the condensed interim consolidated statement of financial position.
“Third-party interests in SVF1 and SVF2” fluctuates due to the results of SVF1 and SVF2 in addition to contributions from Third-Party Investors, and distributions and repayments of investments to Third-Party Investors, respectively. The fluctuations due to the results of SVF1 and SVF2 are presented as “Change in third-party interests in SVF1 and SVF2” in the condensed interim consolidated statement of income.
Contributions from Third-Party Investors to SVF1 are included in “Contributions into SVF1 from third-party investors” under cash flows from financing activities in the condensed interim consolidated statement of cash flows. The distributions and repayments of investments to Third-Party Investors are included in “Distribution/repayment from SVF1 to third-party investors” under cash flows from financing activities in the condensed interim consolidated statement of cash flows. No cash contributions into SVF2 from Third-Party Investor and no cash distribution/repayment from SVF2 to Third-Party Investor were made as of September 30, 2021.
(b) Contribution from the Company
Contributions to SVF1 and SVF2 from the Company are eliminated in consolidation.
SoftBank Group Corp. Consolidated Financial Report For the Six-Month Period Ended September 30, 2021
73

(2) Significant accounting policies for the asset management subsidiary
SB Northstar, a subsidiary of the Company, is engaged in various transactions such as acquisition and sale of listed stocks, derivative transactions related to listed stocks, credit transactions, and others for diversification of the assets held and management of surplus funds. “The asset management subsidiary” described in the condensed interim consolidated financial statements and the notes indicates SB Northstar.
For SB Northstar, the Company applies the following accounting policies.
a. Investments from the asset management subsidiary
The investments in securities made by SB Northstar (except for investments in associates) are accounted for as financial assets at FVTPL as the investments meet the definition of financial assets held for sale in accordance with IFRS 9 “Financial Instruments” and presented as “Investments from assets management subsidiaries” under current assets in the condensed interim consolidated statement of financial position. At initial recognition, the investments are measured at fair value and transaction costs directly arising from the acquisition of financial assets are recognized as net of profit and loss. Subsequent to initial recognition, they are measured at fair value and valuation gains and losses arising from changes in fair value and dividend income are included in “Gain (loss) on investments at Investment Business of Holding Companies” in the condensed interim consolidated statement of income. In addition, the changes in investment amounts due to acquisition and sale of investments from SB Northstar are presented as net of “(Increase) decrease in investments from asset management subsidiaries (cash flows from operating activities)” in the condensed interim consolidated statement of cash flows. The investments in associates of the Company made by SB Northstar are accounted for using the equity method and included in “Investments accounted for using the equity method” in the condensed interim consolidated statement of financial position.
The investments in convertible bonds made by SB Northstar are accounted for as financial assets at FVTPL and are included in “Other financial assets (non-current)” in the condensed interim consolidated statement of financial position. Valuation gains and losses arising from changes in fair value and dividend income are included in “Gain (loss) on investments at Investment Business of Holding Companies” in the condensed interim consolidated statement of income. In addition, payments for acquisition of convertible bonds made by SB Northstar are presented as “Payments for acquisition of investments by asset management subsidiaries (cash flows from investing activities)” in the condensed interim consolidated statement of cash flows.
b. Securities pledged as collateral in the asset management subsidiary
Of securities pledged as collateral, securities which the recipient can sell or pledge them as re-collateral are separated from “Investments from asset management subsidiaries” and presented as “Securities pledged as collateral in asset management subsidiaries” in the condensed interim consolidated statement of financial position. In addition, changes in the securities pledged as collateral in SB Northstar are presented as net of “(Increase) decrease in securities pledged as collateral in asset management subsidiaries (cash flows from operating activities)” in the condensed interim consolidated statement of cash flows.
SoftBank Group Corp. Consolidated Financial Report For the Six-Month Period Ended September 30, 2021
74
c. Restricted cash
Restricted cash in SB Northstar is the deposit pledged as collateral to the brokers for acquisition transactions of investments using borrowings, derivative transactions, and credit transactions and its usage is restricted. The restricted cash is included in “Other financial assets (current)” in the condensed interim consolidated financial position and changes in restricted cash in SB Northstar are included under cash flows from operating activities in the condensed interim consolidated statement of cash flows.
d. Margin deposits
Margin deposits in SB Northstar are the deposits pledged as collateral for unsettled balance for acquisition and sale of investments and unsettled derivatives to the brokers and are included in “Other financial assets (current)” in the condensed interim consolidated statement of financial position. At initial recognition, they are measured at fair value and subsequent to initial recognition, they are measured at amortized cost. In addition, changes in margin deposits in SB Northstar are included under cash flows from operating activities in the condensed interim consolidated statement of cash flows.
e. Borrowed securities
The securities borrowed for short credit transactions have obligations for delivery of future financial assets and meet the definition of financial liabilities held for sale in accordance with IFRS 9 “Financial Instruments.” Therefore, they are accounted for as financial instruments at FVTPL and included in “Other financial liabilities (current)” in the condensed interim consolidated statement of financial position. At initial recognition and subsequent to initial recognition, they are measured at fair value and valuation gains and losses arising from changes in fair value are included in “Gain (loss) on investments at Investment Business of Holding Companies” in the condensed interim consolidated statement of income. In addition, changes in borrowed securities in SB Northstar are included under cash flows from operating activities in the condensed interim consolidated statement of cash flows.
SoftBank Group Corp. Consolidated Financial Report For the Six-Month Period Ended September 30, 2021
75

3. Segment information
(1) Description of reportable segments
The Company’s reportable segments are components of business activities for which discrete financial information is available, and such information is regularly reviewed by the Company’s Board of Directors in order to make decisions about the allocation of resources and assess its performance.
For the fiscal year ended March 31, 2021, the Company had four reportable segments, the Investment Business of Holding Companies segment, the SoftBank Vision Funds segment, the SoftBank segment, and the Arm segment. The Latin America Funds segment previously included in “Other” has been added to the reportable segments from the three-month period ended June 30, 2021 since the materiality has increased. The SVF1 and Other SBIA-Managed Funds segment was renamed to the SoftBank Vision Funds segment from the three-month period ended September 30, 2021.
The Investment Business of Holding Companies segment conducts, mainly through SoftBank Group Corp. as a strategic investment holding company, investment activities in a wide range of sectors in Japan and overseas directly or through subsidiaries of the Company. The Investment Business of Holding Companies segment consists of SoftBank Group Corp., SoftBank Group Capital Limited, SoftBank Group Japan Corporation, SB Northstar that is an asset management subsidiary, and certain subsidiaries of the Company that conduct investment or funding. SB Northstar is engaged in various transactions such as acquisition and sale of listed stocks, derivative transactions related to listed stocks, credit transactions, and others for diversification of the assets held and management of surplus funds. Gain and loss on investments at Investment Business of Holding Companies consists of gain and loss arising from investments held directly by SoftBank Group Corp. or through subsidiaries of the Company. However, gain and loss on investments relating to investments in subsidiaries including dividend income from subsidiaries and impairment loss on investments in subsidiaries are excluded.
The SoftBank Vision Funds segment conducts, mainly through SVF1 and SVF2, investment activities in a wide range of technology sectors. Primarily, gain and loss on investments at SVF1, SVF2, and others consist of gain and loss arising from investments held by SVF1 and SVF2 including the investment in the Company’s subsidiary.
The SoftBank segment provides, mainly through SoftBank Corp., mobile services, sale of mobile devices, internet services such as broadband services in Japan, and through Yahoo Japan Corporation and Line Corporation, internet advertising and e-commerce business.
The Arm segment provides, through Arm, designs of microprocessor intellectual property and related technology, the sale of software tools, and related services.
The Latin America Funds segment conducts, mainly through SoftBank Latin America Funds, investment activities all over the Latin America region. Primarily, gain and loss on investments at Latin America Funds consist of gain and loss arising from investments held by SoftBank Latin America Funds.
SoftBank Group Corp. Consolidated Financial Report For the Six-Month Period Ended September 30, 2021
76

Information on business segments which are not included in the reportable segments is classified in “Other.” “Other” includes mainly PayPay Corporation, Fortress, and the Fukuoka SoftBank HAWKS-related operations.
“Reconciliations” includes an elimination of intersegment transactions, as well as an elimination of gain and loss on the investment in shares in Arm, a subsidiary of the Company, and WeWork, an equity method associate, and others, which are included in segment income of the SoftBank Vision Funds segment and an elimination of income on equity method investments recognized relating to PayPay Corporation, which is included in segment income of the SoftBank segment. Such income on equity method investments is eliminated because the Company consolidates PayPay Corporation as its subsidiary and related amounts are also included in “Other.”
Segment information for the six-month period ended September 30, 2020 and the three-month period ended September 30, 2020 is presented based on the reportable segments after the aforementioned change.
(2) Net sales and income of reportable segments
Income of reportable segments is defined as “Income before income tax.” As in the condensed interim consolidated statement of income, “Gain (loss) on investments” included in segment income includes realized gain and loss from investments in financial assets at FVTPL for which investment performance is measured at fair value, unrealized gain and loss on valuation of investments, dividend income from investments, derivative gain and loss relating to investments in financial assets at FVTPL, and realized gain and loss from investments accounted for using the equity method. The Investment Business of Holding Companies segment calculates its segment income by eliminating gain and loss on investments relating to investments in subsidiaries, including dividend income from subsidiaries and impairment loss on investments in subsidiaries.
Intersegment transaction prices are determined under the same general business conditions as applied for external customers.
SoftBank Group Corp. Consolidated Financial Report For the Six-Month Period Ended September 30, 2021
77

(Millions of yen)
Reportable segments
Investment Businessof Holding Companies
SoftBank VisionFunds SoftBank Arm
Latin AmericaFunds
Net salesCustomers - - 2,423,044 99,678 -Intersegment - - 4,723 326 -
Total - - 2,427,767 100,004 -
Segment income 25,348 913,989 533,284 (10,821) 61,861Depreciation and amortization
(975) (266) (348,009) (35,722) (32)
Gain (loss) on investments 579,614 1,411,567 (6,043) - 63,468
Finance cost (108,175) (6,228) (32,920) (419) (108)Income (loss) on equity method investments
194,607 - (17,129) 1,677 -
Derivative gain (loss) (excluding gain (loss) on investments)
(762,417) - (42) 1,152 -
Total Other Reconciliations Consolidated
Net salesCustomers 2,522,722 107,809 - 2,630,531Intersegment 5,049 4,391 (9,440) -
Total 2,527,771 112,200 (9,440) 2,630,531
Segment income 1,523,661 (22,860) (59,329) 1,441,472Depreciation and amortization
(385,004) (22,344) - (407,348)
Gain (loss) on investments 2,048,606 59,634 (74,929) 2,033,311
Finance cost (147,850) (7,897) 1,939 (153,808)Income (loss) on equity method investments
179,155 6,908 14,767 200,830
Derivative gain (loss) (excluding gain (loss) on investments)
(761,307) (250) - (761,557)
For the six-month period ended September 30, 2020
SoftBank Group Corp. Consolidated Financial Report For the Six-Month Period Ended September 30, 2021
78

(Millions of yen)
Reportable segments
Investment Businessof Holding Companies
SoftBank VisionFunds* SoftBank Arm
Latin AmericaFunds
Net salesCustomers - - 2,718,057 161,093 -Intersegment - - 6,300 262 -
Total - - 2,724,357 161,355 -
Segment income 1,016,053 (589,536) 532,125 33,994 187,942Depreciation and amortization
(1,935) (277) (367,752) (36,595) (76)
Gain (loss) on investments 279,688 (743,164) 20,284 12 193,698
Finance cost (138,415) (9,679) (31,104) (489) (478)Income (loss) on equity method investments
266,989 - (28,254) (878) -
Derivative gain (loss) (excluding gain (loss) on investments)
623,897 1,424 2 (977) 92
Total Other Reconciliations Consolidated
Net salesCustomers 2,879,150 104,354 - 2,983,504Intersegment 6,562 7,259 (13,821) -
Total 2,885,712 111,613 (13,821) 2,983,504
Segment income 1,180,578 (16,662) (116,945) 1,046,971Depreciation and amortization
(406,635) (16,118) - (422,753)
Gain (loss) on investments (249,482) (9,972) (135,781) (395,235)
Finance cost (180,165) (7,568) 2,134 (185,599)Income (loss) on equity method investments
237,857 19,486 7,988 265,331
Derivative gain (loss) (excluding gain (loss) on investments)
624,438 (3,479) - 620,959
For the six-month period ended September 30, 2021
Note:* The details of the difference between “Gain (loss) on investments” in the SoftBank Vision Funds segment and “Gain (loss) on
investments at SVF1, SVF2, and others” in the condensed interim consolidated statement of income are described in “Note 4. SoftBank Vision Funds business.”
SoftBank Group Corp. Consolidated Financial Report For the Six-Month Period Ended September 30, 2021
79

(Millions of yen)
Reportable segments
Investment Businessof Holding Companies
SoftBank VisionFunds SoftBank Arm
Latin AmericaFunds
Net salesCustomers - - 1,253,389 53,719 -Intersegment - - 2,056 110 -
Total - - 1,255,445 53,829 -
Segment income (433,549) 784,359 274,035 (4,274) 39,534Depreciation and amortization
(520) (116) (174,875) (17,946) (16)
Gain (loss) on investments (70,879) 1,114,990 (10,159) - 40,187
Finance cost (55,025) (1,628) (16,664) (206) (104)Income (loss) on equity method investments
190,504 - (8,123) 964 -
Derivative gain (loss) (excluding gain (loss) on investments)
(586,227) - (43) 815 -
Total Other Reconciliations Consolidated
Net salesCustomers 1,307,108 43,450 - 1,350,558Intersegment 2,166 2,323 (4,489) -
Total 1,309,274 45,773 (4,489) 1,350,558
Segment income 660,105 14,949 (67,702) 607,352Depreciation and amortization
(193,473) (9,031) - (202,504)
Gain (loss) on investments 1,074,139 51,181 (74,929) 1,050,391
Finance cost (73,627) (4,031) 843 (76,815)Income (loss) on equity method investments
183,345 4,099 6,813 194,257
Derivative gain (loss) (excluding gain (loss) on investments)
(585,455) (277) - (585,732)
For the three-month period ended September 30, 2020
SoftBank Group Corp. Consolidated Financial Report For the Six-Month Period Ended September 30, 2021
80

(Millions of yen)
Reportable segments
Investment Businessof Holding Companies
SoftBank VisionFunds SoftBank Arm
Latin AmericaFunds
Net salesCustomers - - 1,364,049 87,076 -Intersegment - - 3,738 1 -
Total - - 1,367,787 87,077 -
Segment income 390,348 (825,086) 261,171 25,213 (28,417)Depreciation and amortization
(940) (140) (183,412) (18,122) (37)
Gain (loss) on investments (461,692) (1,134,726) 5,022 6 (25,670)
Finance cost (78,820) (5,578) (15,551) (231) (275)Income (loss) on equity method investments
212,319 - (15,915) (1,087) -
Derivative gain (loss) (excluding gain (loss) on investments)
732,002 720 101 (526) 198
Total Other Reconciliations Consolidated
Net salesCustomers 1,451,125 53,245 - 1,504,370Intersegment 3,739 4,151 (7,890) -
Total 1,454,864 57,396 (7,890) 1,504,370
Segment income (176,771) (49,510) (19,226) (245,507)Depreciation and amortization
(202,651) (7,188) - (209,839)
Gain (loss) on investments (1,617,060) (8,998) (32,245) (1,658,303)
Finance cost (100,455) (3,463) 1,118 (102,800)Income (loss) on equity method investments
195,317 17,446 2,188 214,951
Derivative gain (loss) (excluding gain (loss) on investments)
732,495 - - 732,495
For the three-month period ended September 30, 2021
SoftBank Group Corp. Consolidated Financial Report For the Six-Month Period Ended September 30, 2021
81

4. SoftBank Vision Funds business
(1) Introduction of Co-investment Program with Restricted Right to Receive Distributions and Preferred Equity to SVF2
a. Co-investment Program with Restricted Rights to Receive Distributions
The Board of Directors of SoftBank Group Corp. resolved to introduce a co-investment program with restricted rights to receive distributions to SVF2. In July 2021, based on the resolution, the Company established SVF2 LLC, a wholly-owned subsidiary of the Company, beneath SVF2 for the program. SVF2 LLC has entered into a definitive agreement in August with the Company and MgmtCo, a participant in the program, which resulted in MgmtCo becoming an investor in SVF2 LLC.
MgmtCo is a company controlled by Masayoshi Son, Representative Director, Corporate Officer, Chairman & CEO of SoftBank Group Corp., and a related party of the Company. The details of the related party transactions between the Company and MgmtCo are described in “Note 18. Related party transactions.”
(a) Purpose of the program
The program has been introduced for the purpose of enabling Masayoshi Son to make a co-investment in SVF2, sharing risk of losses as well as benefit of profits in the success of SVF2, and leading to enhanced focus on the management of SVF2 investments, which in turn is intended to contribute to increases in the Company’s earnings. In making a co-investment in SVF2 under the terms of the program, MgmtCo both receives the benefit of profits from SVF2 and assumes the risk of losses from SVF2, and MgmtCo’s right to receive distributions from its investment is subject to certain restrictions.
(b) Overview of the program
Contributions by SVF Investors are classified as “Equity” and “Preferred Equity” depending on the terms and conditions of distribution. Overview of the program is as follows:
i. Investment in SVF2 LLC
Based on the definitive agreement entered into in August 2021, SVF2 LLC has issued Equity to the Company and MgmtCo. The Company (through SoftBank Vision Fund II-2 L.P. and its subsidiaries) holds 82.75% of the total Equity interests in SVF2 LLC and MgmtCo holds 17.25% of the total Equity interests in SVF2 LLC. The Equity interests held by the Company and MgmtCo are entitled to performance-based distributions that are allocated to each investor based on the proportion of their respective Equity contributions.
SoftBank Group Corp. Consolidated Financial Report For the Six-Month Period Ended September 30, 2021
82
ii. Transfer of portfolio companies
After the definitive agreement signed in August 2021, for the purpose of the program, unlisted portfolio companies that were held or planned to be held by SVF2 as of June 23, 2021 have in principle been transferred to SVF2 LLC. As a result, some portfolio companies have been transferred by September 30, 2021 and the remaining portfolio companies have been transferred on and after October 1, 2021, sequentially.
iii. Investment from MgmtCo
The total amount of capital contribution by MgmtCo is expected to be $2.6 billion and the total amount after adding the related adjustments to the capital contribution amount (the “Equity Acquisition Amount”) is expected to be $2.9 billion. Upon the completion of the transfers of portfolio companies from SVF2 to SVF2 LLC, the Equity for each portfolio company is issued from SVF2 LLC to the Company and MgmtCo. As a result, capital contribution made by MgmtCo was $1.4 billion and the Equity Acquisition Amount was $1.6 billion, respectively as of September 30, 2021.
iv. Receivables and premiums accrued on Equity Acquisition Amount
MgmtCo is entitled to make full or partial payment of its Equity Acquisition Amount at any point in time, at its discretion, from the date it became an investor in SVF2 LLC to the end of the company life of SVF2 LLC. MgmtCo is required to pay a premium of 3% per annum on the unpaid Equity Acquisition Amount until the unpaid amount is paid in full. MgmtCo is also entitled to make full or partial payment of the premium at any point in time, at its discretion on the same terms and conditions as Equity Acquisition Amount. As of September 30, 2021, no cash payment has been made from MgmtCo for the Equity Acquisition Amount and the premium. The details of the receivables related to the Equity Acquisition Amount and the premium as of September 30, 2021 are described in “(b) Third-party interests in SVF2 and receivables in (4) Third-party interests in SVF1 and SVF2: b. Changes in interests attributable to Third-Party Investors.” Any distributable amount from SVF2 LLC to MgmtCo is offset against the receivables at the time of the distribution notice and no distribution payments to MgmtCo are made until SVF2 LLC’s receivables are paid in full.
v. Collateral and other credit protection for receivables
In order to secure the receivables of SVF2 LLC, all of the Equity interests in SVF2 LLC held by MgmtCo were pledged as collateral. In the event that MgmtCo pays into the receivables or offsets such receivables with distributions due to it from SVF2 LLC, the collateral is released to the extent that the cumulative amounts of payments and offsets exceeds the balance of the receivables after deduction of such cumulative amounts. Masayoshi Son also provides a personal guarantee to the receivables up to the balance of the receivables. In addition, as of September 30, 2021, 8,897,100 shares of SoftBank Group Corp. are deposited in SVF2 LLC by Masayoshi Son. The deposited shares of SoftBank Group Corp. will be released only where the entire amount of receivables is settled. SVF2 LLC may acquire the deposited SoftBank Group Corp. shares without consideration where there are any unpaid receivables in SVF2 LLC after the enforcement of the collateral and personal guarantees by SVF2 LLC.
SoftBank Group Corp. Consolidated Financial Report For the Six-Month Period Ended September 30, 2021
83
vi. Restrictions on rights to receive distributions to MgmtCo
Distributions from SVF2 LLC to MgmtCo are fully restricted and are not paid until the sum of proceeds received by SVF2 LLC from realized investments plus the aggregate fair value of all of SVF2 LLC’s unrealized investments (net of borrowings) exceeds 130% of the aggregate acquisition cost of all of SVF2 LLC’s investments. After the ratio exceeds 130%, restrictions on distributions to MgmtCo are released proportionately in increments of 10%, and when the ratio reaches 200%, all restrictions are released and MgmtCo is entitled to receive the full amount of the distributions. In the event that, upon the liquidation of SVF2 LLC, the amount of the distribution received by MgmtCo exceeds the amount that would have been distributed to MgmtCo if the ratio in effect at the time of liquidation was applied throughout the life of SVF2 LLC, then any such excess amounts will be subject to clawback from MgmtCo.
vii. Nature of the Equity contribution by the Company and MgmtCo
The Equity interests held by the Company and MgmtCo are subordinated to the Preferred Equity of SVF2 LLC described in “b. Preferred Equity Contribution to SVF2 by the Company.” If there is a shortfall in the amount of return of Preferred Equity contributions and the amount of fixed distributions to be received by the Preferred Equity holders at the time of the final profit distribution by SVF2 LLC, then MgmtCo is obligated to pay the shortfall proportional to Equity interests’ ratio up to the total amount of return of Equity contributions and the distributions received by MgmtCo.
viii. Management fee and performance fees to be charged to MgmtCo
The terms of the management fee and performance fees to be charged to MgmtCo are the same as those to be charged to the Company as an Equity investor in SVF2 LLC. The details of the management fee and performance fees to be charged to MgmtCo is described in “b. Management fees and performance fees in SVF2” under “(5) Management fees and performance fees.”
b. Preferred Equity Contribution to SVF2 by the Company
SoftBank Group Corp. has resolved at a meeting of its Board of Directors that SVF2 LLC issues to the Company (through SoftBank Vision Fund II-2 L.P. and its subsidiaries) a new class of Preferred Equity interests that is subject to fixed distribution separate from the Equity under the program. The purpose of issuing the Preferred Equity is to enhance the efficiency of recovery of investment funds. The Preferred Equity interests in the amount of $5.2 billion have been issued to the Company for the three-month period ended September 30, 2021. The Preferred Equity interests have a priority right over the Equity interests held by the Company and MgmtCo under the program in terms of its distributions and return of the contributions, and the Company receives a fixed distribution amount calculated at 8% per annum on the amount of Preferred Equity contributions by the Company. The Company’s contributions to SVF2 LLC for new investments on and after June 24, 2021 are Preferred Equity contributions.
c. Committed capital
After the introduction of the program and Preferred Equity, $2.6 billion was reduced from the Company’s committed capital and MgmtCo’s committed capital was increased by the same amount. As a result, the total committed capital for SVF2 as a whole amount after the introduction of the program was $40 billion.
SoftBank Group Corp. Consolidated Financial Report For the Six-Month Period Ended September 30, 2021
84

d. Structure
Please refer to the following scheme diagram for “a. Co-investment Program with Restricted Rights to Receive Distributions” and “b. Preferred Equity Contribution to SVF2 by the Company.”
(a) Structure prior to the introduction of the program and Preferred Equity
(b) Structure after the introduction of the program and Preferred Equity
Notes:1. For the three-month period ended September 30, 2021 after the introduction of the program and Preferred Equity, the
committed capital for SVF2 was increased by $2.0 billion, which is attributable to the Company as an investor in SVF2. As a result, the total commitment capital for SVF2 as a whole was $42.0 billion as of September 30, 2021.
2. Includes portfolio companies publicly filing for listing as of June 23, 2021, and portfolio companies that were approved by the Board of Directors to be excluded from the program. The Company continues to hold 100% of Equity for investments in the portfolio companies that are outside of the program’s scope.
SoftBank Group Corp. Consolidated Financial Report For the Six-Month Period Ended September 30, 2021
85

(Millions of yen)Six-month period ended
September 30, 2020Six-month period ended
September 30, 2021
Gain (loss) on investments at SVF1, SVF2, and others
Realized gain on investments1 141,385 862,522
Unrealized gain (loss) on valuation of investments
Change in valuation for the fiscal year2 1,342,001 (529,840)Reclassified to realized gain recorded in the past
fiscal year3 (81,409) (1,023,896)
Dividend income from investments 4,623 22,635Derivative gain (loss) on investments 1,091 (42,370)Effect of foreign exchange translation4 3,876 (32,215)
Subtotal 1,411,567 (743,164)Selling, general and administrative expenses (34,430) (30,051)Finance cost (interest expenses) (6,228) (9,679)Derivative gain (excluding gain (loss) on
investments)- 1,424
Change in third-party interests in SVF1 and SVF2 (457,537) 195,179Other gain (loss) 617 (3,245)
Segment income arising from the SoftBank Vision Funds business (income before income tax)
913,989 (589,536)
(2) Change of a manager of SVF2
SVF2 was previously managed by SBIA and has been managed by SBGA, which is a wholly-owned subsidiary of the Company, since September 2021. SBGA outsources most of its operations to SBIA and SBIA continues to support the management of SVF2 as an outsourced service provider.
(3) Income and loss arising from the SoftBank Vision Funds business
a. Overview
Segment income arising from the SoftBank Vision Funds business (income before income tax) represents the net profits of the SoftBank Vision Funds business, after deducting the net profits attributable to Third-Party Investors. The net profits attributable to Third-Party Investors are the amount after deducting management fees and performance fees that SBIA and SBGA receive from SVF1 and SVF2, respectively.
The amount of the net profits attributable to Third-Party Investors that is deducted from the segment income is presented as “Change in third-party interests in SVF1 and SVF2.”
b. Segment income arising from the SoftBank Vision Funds business
The components of segment income arising from the SoftBank Vision Funds business are as follows:
SoftBank Group Corp. Consolidated Financial Report For the Six-Month Period Ended September 30, 2021
86

Notes:1. In addition to the realized gain and loss on sales by cash consideration, the realized gain and loss by share exchange are
included.
2. In September 2020, the Company entered into a definitive agreement with NVIDIA Corporation in order to sell all of its shares in Arm, a subsidiary of the Company, held by the Company (including shares held by SVF1). Given the definitive agreement, SVF1 recorded ¥94,482 million of unrealized gain on valuation for the six-month period ended September 30, 2021 upon the fair value estimation of Arm held by SVF1.
The unrealized gain on valuation arising from Arm shares held by SVF1 is included in “Gain (loss) on investments at SVF1, SVF2, and others” (in Change in valuation for the fiscal year under Unrealized gain (loss) on valuation of investments) in the above-mentioned segment income. However, the unrealized gain on valuation is eliminated in consolidation as Arm is a subsidiary of the Company.
For the three-month period ended June 30, 2021, Arm transferred 75.01% all of the shares of Treasure Data, Inc., a wholly-owned subsidiary of Arm, to the Company’s foreign subsidiary and 24.99% of the shares to SVF1 as dividends in kind. The 75.01% of Treasure Data, Inc. shares were transferred through sales from the Company’s foreign subsidiary to SVF2. As a result, the fair values of Arm shares and Treasure Data, Inc. shares held by SVF1 and SVF2 were separately measured as of September 30, 2021. The fair value of Treasure Data, Inc. shares, which was included in the fair value of Arm shares as of March 31, 2021, is not included in the fair value of Arm shares as of September 30, 2021.
¥19,019 million of shares of Treasure Data, Inc. received as dividends in kind which SVF1 received from Arm is included in “Gain (loss) on investments at SVF1, SVF2, and others” (in Dividend income from investments) in the above-mentioned segment income, however, the dividends are eliminated in consolidation.
For the three-month period ended September 30, 2021, a wholly-owned subsidiary of the Company other than SVF1 was transferred through sales from the Company to SVF2. As a result of the transaction, WeWork shares held by SVF2 include common shares and the common shares are continuously accounted for using the equity method on a consolidation basis after the transfer. ¥18,557 million of the unrealized gain on valuation after the transfer date arising from WeWork common shares held by SVF2 is included in “Gain (loss) on investments at SVF1, SVF2, and others” (in Change in valuation for the fiscal year under Unrealized gain (loss) on valuation of investments) in the above-mentioned segment income. However, the unrealized gain on valuation is eliminated in consolidation as WeWork is an equity method associate of the Company.
The unrealized gain and loss on valuation and the dividends, that are eliminated in consolidation, are not included in “Gain (loss) on investments at SVF1, SVF2, and others” in the condensed interim consolidated statement of income.
3. It represents the unrealized gain and loss on valuation of investments recorded as “Gain (loss) on investments at SVF1, SVF2, and others” in the past fiscal years, which are reclassified to realized gain and loss on investments due to the realization for the six-month period ended September 30, 2021.
4. Unrealized gain and loss on valuation of investments are translated using the average exchange rate for the quarter in which the gain and loss were recognized, while realized gain and loss on investments are translated using the average exchange rate for the quarter in which the shares were disposed. Foreign currency translation effects are arising from the different foreign currency exchange rates used for unrealized gain and loss on valuation and realized gain and loss.
(4) Third-party interests in SVF1 and SVF2
a. Terms and conditions of contribution from/ distribution to SVF Investors
Contributions by SVF Investors are classified as “Equity” and “Preferred Equity” depending on the terms and conditions of distribution. Preferred Equity is prioritized over Equity with regard to distribution and return of contribution.
SoftBank Group Corp. Consolidated Financial Report For the Six-Month Period Ended September 30, 2021
87

(Millions of yen)(For reference purposes only)
Links with the condensed interim consolidated financial statements
Third-party interests in SVF1(Total of current liabilities and
non-current liabilities)
Consolidated statementof income
(Negative figures represent expenses)
Consolidated statement of cash flows
(Negative figures represent payments)
(Breakdown)As of April 1, 2021 6,601,791Contributions from third-party
investors82,808 - 82,808
Changes in third-party interests (196,283) 196,283 -Attributable to investors entitled to
fixed distribution78,179
Attributable to investors entitled to performance-based distribution
(274,462)
Distribution/repayment to third-party investors
(857,907) - (857,907)
Exchange differences on translating third-party interests*
58,785 - -
As of September 30, 2021 5,689,194
Performance-based distributions attributed to SVF Investors, consisting of the Company and Third-Party Investors, are calculated using the net proceeds from the investment performance of SVF1 and SVF2. Those performance-based distributions and performance fees attributed to SBIA and SBGA are allocated using the method specified in the limited partnership agreement. The amount of performance-based distribution attributed to SVF Investors are allocated to each of the SVF Investors based on the proportion of their respective Equity contribution. The amount of performance-based distributions is paid to each of the SVF Investors after SVF1 and SVF2 receive cash through dividend, or disposition or monetization of investments.
In SVF1, fixed distributions are defined as distributions of Preferred Equity holders which are calculated equal to a 7% rate per annum based on their contributions. The fixed distributions are made every last business day of the months of June and December. The details of the terms and conditions of the Equity contributed by Third-Party Investor in SVF2 are described in “a. Co-investment Program with Restricted Rights to Receive Distributions” under “(1) Introduction of Co-investment Program with Restricted Rights to Receive Distributions and Preferred Equity to SVF2.” There are no Third-Party Investors who contributed to Preferred Equity in SVF2.
In the following table, Third-Party Investors contributing Equity are defined as “Investors entitled to performance-based distribution” and Third-Party Investors contributing Preferred Equity are defined as “Investors entitled to fixed distribution.”
b. Changes in interests attributable to Third-Party Investors
(a) Third-party interests in SVF1
Changes in interests attributable to Third-Party Investors in SVF1 (included in “Third-party interests in SVF1 and SVF2” in the condensed interim consolidated statement of financial position) are as follows:
SoftBank Group Corp. Consolidated Financial Report For the Six-Month Period Ended September 30, 2021
88

(Millions of yen)(For reference purposes only)
Links with the condensed interim consolidated financial statements
Third-party interests in SVF2(Total of current
liabilities and non-current liabilities)
Consolidated statementof income
(Negative figures represent expenses)
Consolidated statement of cash
flows(Negative figures
represent payments)
As of April 1, 2021 -Acquisition of interest by third-party investor 180,338 - -Changes in third-party interests 1,104 (1,104) -Distribution/repayment to the third-party
investor (Offsetting against the receivables) (19,104) - -
Exchange differences on translating third-party interests* 2,131 - -
As of September 30, 2021 164,469
(Millions of yen)Receivables from third-party
investor in SVF2As of April 1, 2021 -Increase of receivables from Equity Acquisition Amount and accrued
premiums charged to third-party investor 181,442
Reduction of receivables by offsetting distribution/repayment to third-party investor (19,104)
Exchange differences on receivables 2,131As of September 30, 2021 164,469
Note:* Exchange differences were included in “Exchange differences on translating foreign operations” in the condensed interim
consolidated statement of comprehensive income.
(b) Third-party interests in SVF2 and receivables
Changes in interests attributable to Third-Party Investor in SVF2 (included in “Third-party interests in SVF1 and SVF2” in the condensed interim consolidated statement of financial position) are as follows: Third-party Investor in SVF2 is the investor entitled to performance-based distribution.
Note:* Exchange differences were included in “Exchange differences on translating foreign operations” in the condensed interim
consolidated statement of comprehensive income.
The Company has receivables from Third-party Investor in SVF2. The changes in the receivables from Third-Party Investor in SVF2 (included in “Other financial assets (non-current)” in the condensed interim consolidated statements of financial position) are as follows: The details of the receivables from Third-Party Investor in SVF2 are described in “a. Co-investment Program with Restricted Rights to Receive Distributions.” under “(1) Introduction of the Co-investment Program with Restricted Rights to Receive Distributions and Preferred Equity to SVF2.”
SoftBank Group Corp. Consolidated Financial Report For the Six-Month Period Ended September 30, 2021
89

c. Uncalled committed capital from Third-Party Investors
Uncalled committed capital from SVF1’s Third-Party Investors as of September 30, 2021 was $8.7 billion.
(5) Management fees and performance fees
Terms and conditions of management fees and performance fees, included in segment income from the SoftBank Vision Funds business, are as follows.
a. Management fees and performance fees in SVF1
Management fees to SBIA from SVF1 are, in accordance with the limited partnership agreement, calculated by multiplying 1% per annum by Equity contributions used to fund investments and paid to SBIA by SVF1 quarterly. A clawback provision is attached to the management fees received, which is triggered under certain conditions based on future investment performance.
Same as the performance-based distributions, the amount of the performance fees to SBIA from SVF1 is calculated using the allocation method as specified in the limited partnership agreement. SBIA is entitled to receive the performance fees when SVF1 receives cash through disposition, dividend and monetization of an investment.
From the inception of SVF1 to September 30, 2021, the cumulative amount of performance fees paid to SBIA was $439 million. For the six-month period ended September 30, 2021, no performance fees were paid to SBIA.
In addition, the performance fees received are subject to clawback provisions which are triggered under certain conditions based on future investment performance.
b. Management fees and performance fees in SVF2
Management fees to SBGA from SVF2 are, in accordance with the constitutional agreements, calculated by multiplying 0.7% per annum by the acquisition cost of investments and paid to SBGA by SVF2 quarterly.
Same as the performance-based distributions, the amount of the performance fees to SBGA from SVF2 is calculated using the allocation method as specified in the constitutional agreement. SBGA is entitled to receive the performance fees when SVF2 receives cash through disposition, dividend and monetization of an investment.
From the inception of SVF2 to September 30, 2021, no performance fees were paid to SBIA or SBGA.
SoftBank Group Corp. Consolidated Financial Report For the Six-Month Period Ended September 30, 2021
90

(Millions of yen)Acquisition date
(February 28, 2021)
Fair value of common shares in LINE Corporation already held at the time of acquisition of control
172,922
Fair value of common shares in Shiodome Z Holdings G.K. transferred at the time of acquisition of control
689,150
Total consideration transferred A 862,072
5. Business combinations
For the six-month period ended September 30, 2021
Acquisition of LINE Corporation and business integration of LINE Group and Z Holdings Corporation
(Amendment of provisional amounts)
SoftBank Corp., a subsidiary of the Company, obtained control of LINE Corporation1, effective February 28, 2021. The consideration for acquisition is allocated to the acquired assets and the assumed liabilities based on the fair value on the acquisition date. For the six-month period ended September 30, 2021, the allocation of the consideration for acquisition has been completed.
The main effects of the adjustments comprise of decrease in property, plant and equipment of ¥2,762 million, decrease in intangible assets including identifiable intangible assets of ¥14,092 million, decrease in deferred tax liabilities of ¥5,352 million, decrease in non-controlling interests of ¥5,861 million, and increase in goodwill of ¥5,861 million.
(1) Consideration transferred and the component
SoftBank Group Corp. Consolidated Financial Report For the Six-Month Period Ended September 30, 2021
91
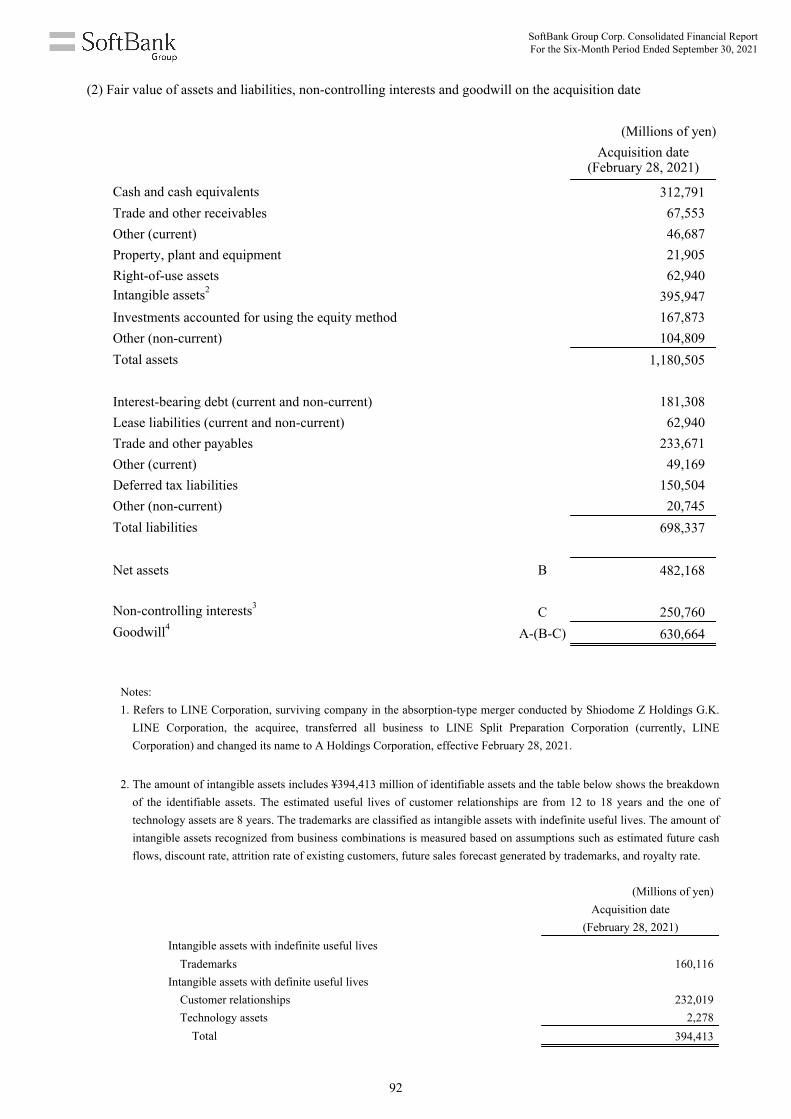
(Millions of yen)Acquisition date
(February 28, 2021)
Cash and cash equivalents 312,791Trade and other receivables 67,553Other (current) 46,687Property, plant and equipment 21,905Right-of-use assets 62,940Intangible assets2 395,947Investments accounted for using the equity method 167,873Other (non-current) 104,809Total assets 1,180,505
Interest-bearing debt (current and non-current) 181,308Lease liabilities (current and non-current) 62,940Trade and other payables 233,671Other (current) 49,169Deferred tax liabilities 150,504Other (non-current) 20,745Total liabilities 698,337
Net assets B 482,168
Non-controlling interests3 C 250,760Goodwill4 A-(B-C) 630,664
(Millions of yen)Acquisition date
(February 28, 2021)Intangible assets with indefinite useful lives
Trademarks 160,116Intangible assets with definite useful lives
Customer relationships 232,019Technology assets 2,278
Total 394,413
(2) Fair value of assets and liabilities, non-controlling interests and goodwill on the acquisition date
Notes:1. Refers to LINE Corporation, surviving company in the absorption-type merger conducted by Shiodome Z Holdings G.K.
LINE Corporation, the acquiree, transferred all business to LINE Split Preparation Corporation (currently, LINE Corporation) and changed its name to A Holdings Corporation, effective February 28, 2021.
2. The amount of intangible assets includes ¥394,413 million of identifiable assets and the table below shows the breakdown of the identifiable assets. The estimated useful lives of customer relationships are from 12 to 18 years and the one of technology assets are 8 years. The trademarks are classified as intangible assets with indefinite useful lives. The amount of intangible assets recognized from business combinations is measured based on assumptions such as estimated future cash flows, discount rate, attrition rate of existing customers, future sales forecast generated by trademarks, and royalty rate.
SoftBank Group Corp. Consolidated Financial Report For the Six-Month Period Ended September 30, 2021
92

3. Non-controlling interests are measured at the fair values of the acquiree’s identifiable net assets as of the acquisition date, multiplied by the ratio of the non-controlling interests.
4. Goodwill reflects the ability to generate excess earnings resulting from expected future business development and synergies between the Group and the acquiree.
SoftBank Group Corp. Consolidated Financial Report For the Six-Month Period Ended September 30, 2021
93

(Millions of yen)As of
March 31, 2021As of
September 30, 2021
CurrentMarketable securities 80,797 113,426Restricted cash1 480,100 57,542Time deposits (maturities of more than three
months)36,315 34,318
Other 85,630 101,215Allowance for doubtful accounts (10,935) (12,411)
Total 671,907 294,090
Non-currentInstallment receivables 481,943 473,955Loan receivables 390,073 461,741Deposits for banking business 384,394 391,166Trust accounts in SPACs 327,569 298,142Receivables from MgmtCo2 - 241,838Investments from asset management subsidiaries 97,023 140,537Lease and guarantee deposits 73,355 53,917Other 247,504 271,271Allowance for doubtful accounts (82,599) (75,277)
Total 1,919,262 2,257,290
6. Other financial assets
The components of other financial assets are as follows:
Notes:1. On April 13, 2021, the Company paid ¥313,411 million ($2.9 billion) from ¥361,355 million ($3.3 billion) of restricted cash
which was required to be maintained in a segregated custody account as of March 31, 2021 for the early termination of the prepaid forward contract using Alibaba shares by cash. Accordingly, the Company completed the settlement of the prepaid forward contract using Alibaba shares. Also, ¥47,944 million of the rest of the restricted cash was released from usage limit and transferred to “Cash and cash equivalents” for the six-month period ended September 30, 2021. The details are described
in “(2) Transactions for sale of Alibaba shares by prepaid forward contract” under “Note 9. Interest-bearing debt.”
2. Receivables from MgmtCo is outstanding balance of the receivables in relation to the Equity Acquisition Amount and accrued premiums from MgmtCo as a Third-Party Investor of SVF2 and SoftBank Latin America Funds. The receivables of SVF2 and SoftBank Latin America Funds are ¥164,469 million and ¥77,369 million, respectively. The details of the receivables are described in “(1) Introduction of Co-investment Program with Restricted Rights to Receive Distributions and Preferred Equity to SVF2.” under “Note 4. SoftBank Vision Funds business” and “Note 18. Related party transactions.”
SoftBank Group Corp. Consolidated Financial Report For the Six-Month Period Ended September 30, 2021
94
7. Disposal group classified as held for sale
As of December 11, 2020, the Company agreed on main terms of a transaction with South Korea-based Hyundai Motor Company and its affiliates (collectively “Hyundai Motor Group”) and Euisun Chung, Chairman of Hyundai Motor Group, pursuant to which (i) the Company would sell the majority of its shares held in Boston Dynamics, Inc. (“Boston Dynamics”), to Hyundai Motor Group and Euisun Chung, and (ii) Hyundai Motor Group and Euisun Chung would subscribe for additional shares of Boston Dynamics. Upon this agreement, it was highly probable that Boston Dynamics would no longer be a subsidiary of the Company. Accordingly, assets, liabilities, and accumulated other comprehensive income of Boston Dynamics were reclassified as a disposal group classified as held for sale for the fiscal year ended March 31, 2021. The disposal group classified as held for sale was measured at the carrying amount as the consideration from the sale transaction was higher than the carrying amount of Boston Dynamics. The carrying amounts of assets, liabilities, and accumulated other comprehensive income in Boston Dynamics were ¥38,647 million, ¥11,271 million, and ¥267 million, respectively as of March 31, 2021.
In addition, the transaction was completed following regulatory approval and satisfaction of certain conditions on June 21, 2021. Boston Dynamics is no longer a subsidiary of the Company from the same date and the shares continuously held as a minority shareholder are measured at fair value and accounted for as financial instruments at FVTPL. Accordingly, for the six-month period ended September 30, 2021, the difference between the consideration from the sale transaction (excluding the cost to sell) and the fair value of shares continuously held, and the carrying amount of Boston Dynamics (assets, liabilities, accumulated other comprehensive income, and non-controlling interests) was recorded as a gain relating to loss of control over subsidiaries for ¥72,936 million under “Other gain” in the condensed interim consolidated statement of income.
8. Income taxes
For the six-month period ended September 30, 2021
Due to the enactment of the UK Finance Act of 2021 in June 2021, the corporate tax rate was increased from 19% to 25% on or after April 1, 2023. As a result, the Company reversed a deferred tax liability of ¥38,029 million (translated at the exchange rate as of March 31, 2021). In addition, credits of income taxes (profit) and other comprehensive income (profit) were recorded for ¥31,953 million and ¥5,890 million, respectively. This is primarily due to the fact that certain subsidiaries based in the UK, which were applicable for the calculation of aggregation of income earned by controlled foreign companies in SoftBank Group Corp., will be expected to be exempt from the calculation on or after April 1, 2023.
SoftBank Group Corp. Consolidated Financial Report For the Six-Month Period Ended September 30, 2021
95

(Millions of yen)As of
March 31, 2021As of
September 30, 2021
CurrentShort-term borrowings1 2,637,401 2,147,606Commercial paper 409,201 592,101Current portion of long-term borrowings2 2,085,348 1,630,903Current portion of corporate bonds 804,356 947,218Current portion of financial liabilities relating to
sale of shares by prepaid forward contracts3 1,798,701 1,804,973
Current portion of installment payables 232 191Total 7,735,239 7,122,992
Non-currentLong-term borrowings4 4,745,058 4,687,674Corporate bonds5 4,745,184 6,058,923Financial liabilities relating to sale of shares by
prepaid forward contracts3,6 1,287,038 2,277,192
Installment payables 456 378Total 10,777,736 13,024,167
9. Interest-bearing debt
(1) Components of interest-bearing debt
The components of interest-bearing debt are as follows:
Notes:1. For the six-month period ended September 30, 2021, a wholly-owned subsidiary of the Company made a borrowing of $1.25
billion by using 45,366,669 shares of T-Mobile held as collateral. Deutsche Telekom AG (“Deutsche Telekom”) exercised call options over 45,366,669 shares out of 101,491,623 shares of T-Mobile held through the wholly-owned subsidiary of the Company and the wholly-owned subsidiary of the Company acquired newly issued 225,000,000 shares of Deutsche Telekom as its consideration. As a result of the transaction, T-Mobile shares pledged as collateral were replaced by 225,000,000 shares of Deutsche Telekom. As of September 30, 2021, the wholly-owned subsidiary pledged ¥507,727 million of Deutsche Telekom shares held as collateral for ¥139,900 million of short-term borrowings. Deutsche Telekom shares pledged as collateral are included in “Investment securities” in the condensed interim consolidated statement of financial position as of September 30, 2021. The details of the acquisition of Deutsche Telekom shares are described in “Note 19. Additional information.”
In addition, related to the transaction, Alibaba shares held by the Company are pledged as collateral. Alibaba shares pledged as collateral are recorded for ¥10,387 million as “Investments accounted for using the equity method” in the condensed interim consolidated statement of financial position as of September 30, 2021. Also, “T-Mobile” indicates T-Mobile US, Inc. after merging with Sprint.
2. SB Northstar had made a borrowing by using Alibaba shares pledged as collateral. For the three-month period ended September 30, 2021, SB Northstar repaid all of its borrowing of $6.0 billion before the maturity date and the collateral for Alibaba shares was released. The carrying amount of current portion of long-term borrowings is ¥662,596 million and the carrying amount of Alibaba shares pledged as collateral, on a consolidation basis, which are included in “Investments accounted for using the equity method” is ¥302,048 million in the condensed interim consolidated financial position as of March 31, 2021.
SoftBank Group Corp. Consolidated Financial Report For the Six-Month Period Ended September 30, 2021
96

3. These are primarily financial liabilities relating to sale of shares by prepaid forward contracts using Alibaba shares. The details of the contracts are described in “(2) Transactions for sale of Alibaba shares by prepaid forward contract.”
4. For the six-month period ended September 30, 2021, long-term borrowings decreased by ¥481,260 million as an early repayment was made for the total amount of borrowings ($4.38 billion) using T-Mobile shares held by a wholly-owned subsidiary and Alibaba shares held by the Company pledged as collateral. Accordingly, on the same date, the collaterals for T-Mobile shares and Alibaba shares were released. T-Mobile shares pledged as collateral are recorded for ¥1,474,356 million as “Investment securities” in the condensed interim consolidated statement of financial position as of March 31, 2021. In addition, Alibaba shares pledged as collateral are recorded for ¥42,381 million as “Investments accounted for using the equity method” in the condensed interim consolidated statement of financial position as of March 31, 2021.
For the six-month period ended September 30, 2021, the wholly-owned subsidiary of the Company made a borrowing of $2.65 billion by using T-Mobile shares held as collateral. As of September 30, 2021, ¥614,709 million of T-Mobile shares is pledged as collateral for ¥295,367 million of the long-term borrowing. T-Mobile shares pledged as collateral are included in “Investment securities” in the condensed interim consolidated statement of financial position as of September 30, 2021. In addition, related to the transaction, Alibaba shares held by the Company are pledged as collateral. Alibaba shares pledged as collateral are recorded for ¥22,001 million as “Investments accounted for using the equity method” in the condensed interim consolidated statement of financial position as of September 30, 2021.
5. SoftBank Group Corp. issued the 5th unsecured subordinated bonds with interest deferrable clause and early redeemable option (with a subordination provision) with June 21, 2021, as the due date for payment. Also, SoftBank Group Corp. issued USD-denominated Senior Notes due 2025, 2026, 2028, and 2031, and Euro-denominated Senior Notes due 2024, 2027, 2029, and 2032 with July 6, 2021, as the due date for payment, and issued the 4th unsecured subordinated corporate bond (with a subordination provision) with September 16, 2021, as the due date for payment, and the 3rd unsecured subordinated corporate bond (with a subordination provision) with September 30, 2021, as the due date for payment. As a result, corporate bonds increased by ¥1,695,937 million.
6. For the six-month period ended September 30, 2021, a wholly-owned subsidiary entered into prepaid forward contracts by using T-Mobile shares and procured $1.81 billion. As of September 30, 2021, the Company pledges ¥256,451 million of T-Mobile shares held as collateral for ¥229,437 million of financial liabilities relating to sale of shares by prepaid forward contracts. The shares pledged as collateral are included in “Investment securities” in the condensed interim consolidated statement of financial position as of September 30, 2021.
The number of T-Mobile shares settled by the prepaid forward contracts is determined by reference to the market price of the shares at the valuation dates prior to the settlement dates. A cap and a floor are set for the price of shares settled. The aforementioned prepaid forward contracts are classified as hybrid financial instruments with embedded derivatives and the embedded derivatives are measured at fair value.
(2) Transactions for sale of Alibaba shares by prepaid forward contract
Wholly-owned subsidiaries of the Company entered into prepaid forward contracts with financial institutions to procure funds using Alibaba shares, which are held by the subsidiaries.
In the prepaid forward contracts, the number of Alibaba shares settled by the prepaid forward contracts is fixed regardless of changes in market share price in the future in a forward contract or determined by reference to market price of the shares at the valuation dates prior to the settlement date. The latter type of contracts include Floor contract that a floor is set for the price of shares settled and collar contract that a cap and a floor are set for the price of shares settled. A part of wholly-owned subsidiaries of the Company entering into prepaid forward contracts with financial institutions to procure funds using Alibaba shares (“Entities for fund procurement by using Alibaba shares”), in addition to the prepaid forward contracts, enter into the call spread (combination of long position of call option and short position of call option with different strike prices) contracts in preparation for Alibaba shares price rise.
SoftBank Group Corp. Consolidated Financial Report For the Six-Month Period Ended September 30, 2021
97

The aforementioned prepaid forward contracts are classified as hybrid financial instruments with embedded derivatives. The Company accounts for the contracts by bifurcating the main contracts and embedded derivatives, and the main contracts are recognized as financial liabilities relating to sale of shares by prepaid forward contracts then measured at amortized cost and the embedded derivatives are measured at fair value. Also, the call spread contracts are measured at fair value as well. In addition, for the derivative financial assets and the derivative financial liabilities recognized from the prepaid forward contracts and the call spread contracts, a tax effect is recognized.
The ending balance of the derivative financial assets and the derivative financial liabilities recognized from the prepaid forward contracts and the call spread contracts are described in “(1) Option contracts” and “(3) Forward contracts” under “Note 10. Financial Instruments.”
Entities for fund procurement by using Alibaba shares have the option to settle all of the prepaid forward contracts by delivering cash, Alibaba shares, or a combination of cash and Alibaba shares. If Entities for fund procurement by using Alibaba shares elect cash settlement, Entities for fund procurement by using Alibaba shares will pay the cash equivalent to the fair value of the number of shares subject to the settlement, as determined by reference to the market price of the shares.
Alibaba shares held by Entities for fund procurement by using Alibaba shares are pledged as collateral in accordance with all of the prepaid forward contracts, and except for a certain contract, the Company granted right of use to the financial institutions with respect to such shares. However, the collateral can be released by cash settlement at the discretion of Entities for fund procurement by using Alibaba shares. Alibaba continues to be an equity method associate of the Company after the completion of these transactions because the Company still has significant influence over Alibaba via voting rights.
(For the fiscal year ended March 31, 2021)For the fiscal year ended March 31, 2021, Entities for fund procurement by using Alibaba shares had exercised the option to settle the prepaid forward contract by cash and provided a notice to the counterparty for early termination in April 2021. Under the prepaid forward contract, Entities for fund procurement by using Alibaba shares is required to maintain cash that would exceed expected early termination amounts in a segregated custody account as restricted cash before the expected early termination date. ¥361,355 million ($3.3 billion) of the restricted cash is recognized as “Other financial assets (current)” in the condensed interim consolidated statement of financial position as of March 31, 2021.
On April 13, 2021, Entities for fund procurement by using Alibaba shares paid ¥313,411 million ($2.9 billion) from restricted cash and completed the settlement of the transactions. ¥285,780 million of current portion of financial liabilities relating to sale of shares by prepaid forward contracts and ¥28,096 million of “Derivative financial liabilities (current)” which were recognized in the condensed interim consolidated statement of financial position as of March 31, 2021, were derecognized. Accordingly, on the same date, ¥61,633 million of Alibaba shares recognized in the condensed interim consolidated statement of financial position as of March 31, 2021 was released from the collateral.
SoftBank Group Corp. Consolidated Financial Report For the Six-Month Period Ended September 30, 2021
98

(Millions of yen)
Six-month period ended September 30, 2020
Six-month period ended September 30, 2021
Net increase (decrease) of short-term borrowings 796,983 (1,001,154)Net (decrease) increase of commercial paper (8,000) 92,900
Total 788,983 (908,254)
(For the six-month period ended September 30, 2021)For the three-month period ended June 30, 2021, Entities for fund procurement by using Alibaba shares entered into collar contracts and procured ¥329,852 million ($3.0 billion) in total. Also, for the three-month period ended September 30, 2021, Entities for fund procurement by using Alibaba shares entered into collar contracts and a forward contract, and procured ¥812,502 million ($7.4 billion) in total.
Further, for the three-month period ended September 30, 2021, a part of prepaid forward contracts has been amended in terms of the cap and floor for the price of shares settled and the term of the contracts. The amendments of the contracts are applicable for as exchanges of debt instruments with substantially different terms under IFRS, and accounted for as extinguishments of the original financial liabilities relating to sale of shares by prepaid forward contracts and the recognition of new financial liabilities relating to sale of shares by prepaid forward contracts.
As a result of the amendments, upon the extinguishment of the original contracts, ¥776,580 million of financial liabilities relating to sale of shares by prepaid forward contracts and ¥235,475 million of derivative financial assets are derecognized. On the other hand, ¥514,172 million of new financial liabilities relating to sale of shares by prepaid forward contracts and ¥45,476 million of derivative financial assets are newly recognized and ¥72,616 million of cash is paid as a difference in exchange value between the original and new contracts. Further, along with the fluctuation of derivative financial assets, ¥62,674 million of deferred tax liabilities is decreased and the same amount of income taxes is recognized as a gain, representing the tax effect.
As of September 30, 2021, the Company set ¥1,025,926 million of Alibaba shares, which is recognized as “Investments accounted for using the equity method” in the condensed interim consolidated statement of financial position, as collateral for ¥1,804,973 million of current portion of financial liabilities relating to sale of shares by prepaid forward contracts and ¥2,047,755 million of financial liabilities relating to sale of shares by prepaid forward contracts.
(3) Components of proceeds in short-term interest-bearing debt, net
The components of “Proceeds in short-term interest-bearing debt, net” in the condensed interim consolidated statement of cash flows are as follows:
SoftBank Group Corp. Consolidated Financial Report For the Six-Month Period Ended September 30, 2021
99
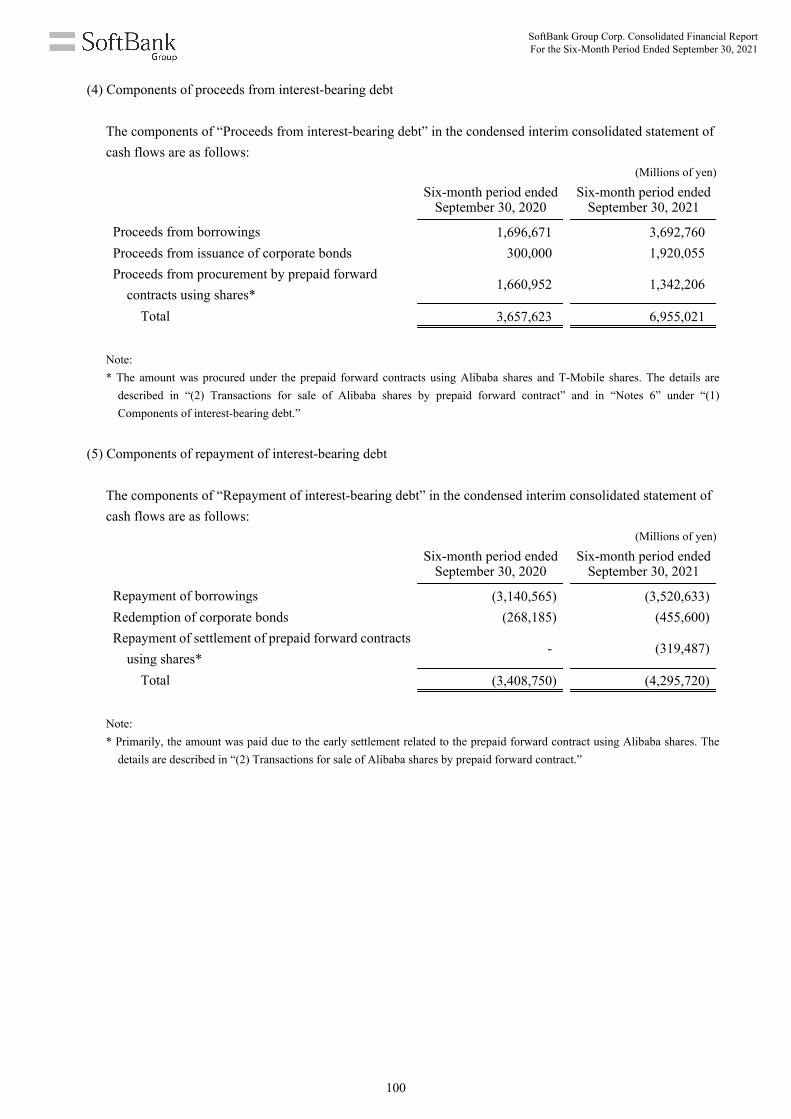
(Millions of yen)
Six-month period ended September 30, 2020
Six-month period ended September 30, 2021
Proceeds from borrowings 1,696,671 3,692,760Proceeds from issuance of corporate bonds 300,000 1,920,055Proceeds from procurement by prepaid forward
contracts using shares*1,660,952 1,342,206
Total 3,657,623 6,955,021
(Millions of yen)
Six-month period ended September 30, 2020
Six-month period ended September 30, 2021
Repayment of borrowings (3,140,565) (3,520,633)Redemption of corporate bonds (268,185) (455,600)Repayment of settlement of prepaid forward contracts
using shares*- (319,487)
Total (3,408,750) (4,295,720)
(4) Components of proceeds from interest-bearing debt
The components of “Proceeds from interest-bearing debt” in the condensed interim consolidated statement of cash flows are as follows:
Note:* The amount was procured under the prepaid forward contracts using Alibaba shares and T-Mobile shares. The details are
described in “(2) Transactions for sale of Alibaba shares by prepaid forward contract” and in “Notes 6” under “(1) Components of interest-bearing debt.”
(5) Components of repayment of interest-bearing debt
The components of “Repayment of interest-bearing debt” in the condensed interim consolidated statement of cash flows are as follows:
Note:* Primarily, the amount was paid due to the early settlement related to the prepaid forward contract using Alibaba shares. The
details are described in “(2) Transactions for sale of Alibaba shares by prepaid forward contract.”
SoftBank Group Corp. Consolidated Financial Report For the Six-Month Period Ended September 30, 2021
100

(Millions of yen)As of
March 31, 2021As of
September 30, 2021
Carrying amount(fair value)
Carrying amount(fair value)
Assets Liabilities Assets LiabilitiesLong call option of listed stocks in asset
management subsidiaries176,627 - 129,089 -
Short call option of listed stocks in asset management subsidiaries
- (9,283) - -
Contingent consideration relating to acquisition of T-Mobile shares1 460,709 - 518,689 -
Prepaid forward contracts using Alibaba shares2 661,615 (28,096) 1,243,757 -Call spread contracts relating to prepaid forward
contracts using Alibaba shares2 42,059 - 8,792 -
Short call option for T-Mobile shares to Deutsche Telekom3 - (204,821) - (91,322)
10. Financial instruments
(1) Option contracts
The details of option contracts are mainly as follows:
Option contracts to which hedge accounting is not applied
Notes:1. Acquired due to the merger transaction with Sprint and T-Mobile US, Inc. on April 1, 2020 and the Company has the right to
acquire 48,751,557 shares of T-Mobile for no additional consideration if certain conditions are met.
2. The details of prepaid forward contracts using Alibaba shares and call spread contracts relating to prepaid forward contracts using Alibaba shares are described in “(2) Transactions for sale of Alibaba shares by prepaid forward contract” under “Note 9. Interest-bearing debt.”
3. The decrease was primarily due to the partial exercise of the call options by Deutsche Telekom. The details are described in “Note 19. Additional information.”
SoftBank Group Corp. Consolidated Financial Report For the Six-Month Period Ended September 30, 2021
101

(Millions of yen)As of
March 31, 2021As of
September 30, 2021
Carrying amount(fair value)
Carrying amount(fair value)
Assets Liabilities Assets LiabilitiesTotal return swap contracts of listed stocks in asset
management subsidiaries7,057 (5,390) - (39)
(Millions of yen)As of
March 31, 2021As of
September 30, 2021
Carrying amount(fair value)
Carrying amount(fair value)
Assets Liabilities Assets LiabilitiesForward contracts of listed stocks in asset
management subsidiaries4,372 - - (1,749)
Prepaid forward contracts using Alibaba shares1 - - 29,025 -Tender offer for WeWork shares2 - (76,823) - -
(2) Swap contracts
The details of swap contracts are mainly as follows:
Swap contracts to which hedge accounting is not applied
(3) Forward contracts
The details of forward contracts are mainly as follows:
Forward contracts to which hedge accounting is not applied
Notes:1. The details of prepaid forward contracts using Alibaba shares are described in “(2) Transactions for sale of Alibaba shares by
prepaid forward contract” under “Note 9. Interest-bearing debt.”
2. In March 2021, a wholly-owned subsidiary of the Company other than SVF1 commenced a tender offer to purchase WeWork common shares and preferred shares from certain shareholders other than the Company at a price of $19.19 per share for the total amount of $922 million. The tender offer is considered as forward contracts and accounted for as derivatives. The difference between the valuation amount of common shares and preferred shares expected to purchase and the expected acquisition amount was recorded as “Derivative financial liabilities (current)” as of March 31, 2021. The tender offer was completed in April 2021 and the derivative financial liabilities are reversed and reduced from the initially recognized amount of the purchased common shares and preferred shares for the six-month period ended September 30, 2021.
SoftBank Group Corp. Consolidated Financial Report For the Six-Month Period Ended September 30, 2021
102

(Yen)As of
March 31, 2021As of
September 30, 2021
USD 110.71 111.92CNY 16.84 17.30
(Yen)Three-month period ended
June 30, 2020Three-month period ended
September 30, 2020
USD 107.74 105.88CNY 15.16 15.27
(Yen)Three-month period ended
June 30, 2021Three-month period ended
September 30, 2021
USD 110.00 110.47CNY 17.01 17.09
11. Foreign currency exchange rates
Exchange rates of the major currencies used for translating financial statements of foreign operations are as follows:
(1) Rate at the end of the period
(2) Average rate for the quarter
For the six-month period ended September 30, 2020
For the six-month period ended September 30, 2021
SoftBank Group Corp. Consolidated Financial Report For the Six-Month Period Ended September 30, 2021
103

(Thousands of shares)
Six-month period ended September 30, 2020
Six-month period ended September 30, 2021
Balance at the beginning of the period 21,818 351,298Increase during the period1 191,077 25,980Decrease during the period2 (2,401) (367,941)Balance at the end of the period 210,494 9,337
(Millions of yen)As of
March 31, 2021As of
September 30, 2021
Equity financial assets at FVTOCI 24,099 36,594Debt financial assets at FVTOCI 390 404Cash flow hedges 42,962 45,955Exchange differences on translating foreign
operations270,878 556,632
Total 338,329 639,585
12. Equity
(1) Other equity instruments
On July 19, 2017, the Company issued USD-denominated Undated Subordinated Non-Call 6 years Resettable Notes and USD-denominated Undated Subordinated Non-Call 10 years Resettable Notes (collectively, the “Hybrid Notes”).
The Hybrid Notes are classified as equity instruments in accordance with IFRSs because the Company has the option to defer interest payments, the notes have no maturity date, and the Company has an unconditional right to avoid delivering cash or another financial asset except for distribution of residual assets on liquidation.
(2) Treasury stock
Changes in treasury stock are as follows:
Notes:1. For the six-month period ended September 30, 2021, due to purchases of treasury stock under the resolutions passed at the
Board of Directors meetings held on July 30, 2020, the number of treasury stock increased by 25,980 thousand shares (amount purchased ¥257,777 million) as part of “SoftBank announces ¥4.5 trillion ($41 billion) program to repurchase shares and reduce debt” announced on March 23, 2020 (the “¥4.5 trillion program”). In addition, the purchases of treasury stock up to ¥2 trillion have been completed based on the ¥4.5 trillion program with the completion of purchases of treasury stock under the resolution.
2. For the six-month period ended September 30, 2021, the decrease was made mainly under the resolutions passed at the Board of Directors meeting held on April 28, 2021 and May 12, 2021. The Company retired its treasury stock of 366,860 thousand shares in total on May 11, 2021 and May 20, 2021. As a result of the transaction, retaining earnings and treasury stock decreased by ¥2,475,817 million, respectively.
(3) Accumulated other comprehensive income
The components of accumulated other comprehensive income are as follows:
SoftBank Group Corp. Consolidated Financial Report For the Six-Month Period Ended September 30, 2021
104

(Millions of yen)
Six-month period ended September 30, 2020
Six-month period ended September 30, 2021
Gain relating to sales of T-Mobile shares1 421,755 3,149Realized gain (loss) on investments at asset
management subsidiaries(8,060) 62,951
Unrealized loss on valuation of investments at asset management subsidiaries
(95,082) (79,778)
Derivative gain (loss) on investments at asset management subsidiaries
(292,346) 76,185
Realized gain on investments 162,335 49,524Unrealized gain on valuation of investments 235,859 87,193Derivative gain on investments2 151,690 68,499Other 3,463 12,205
Total 579,614 279,928
13. Gain on investments
(1) Gain and loss on investments at Investment Business of Holding Companies
The components of gain and loss on investments at Investment Business of Holding Companies are as follows:
Notes:1. On September 23, 2021, Deutsche Telekom partially exercised the call options over 45,366,669 shares out of 101,491,623
shares of T-Mobile held through a wholly-owned subsidiary of the Company and the wholly-owned subsidiary acquired newly issued 225,000,000 shares of Deutsche Telekom as its consideration. As a result, ¥3,149 million of gain relating to sales of T-Mobile shares was recorded for the six-month period ended September 30, 2021. Cumulative losses on T-Mobile shares and the call options associated with the transaction are ¥13,447 million. Of this, ¥16,596 million of loss was recorded for the fiscal year ended March 31, 2021. The details are described in “Note 19. Additional information.”
2. For the six-month period ended September 30, 2021, ¥57,980 million of derivative gain on investments was recorded due to changes in the fair value of contingent consideration related to the acquisition of T-Mobile shares through the merger transaction with Sprint and T-Mobile US, Inc. The details of contingent consideration are described in “Notes 1” in “(1) Option contracts” under “Note 10. Financial instruments.”
(2) Gain and loss on investments at SVF1, SVF2, and others
The details are described in “Note 4. SoftBank Vision Funds business.”
SoftBank Group Corp. Consolidated Financial Report For the Six-Month Period Ended September 30, 2021
105

(Millions of yen)
Six-month period ended September 30, 2020
Six-month period ended September 30, 2021
Realized loss on investments - (9,114)Unrealized gain on valuation of investments
Change in valuation for the fiscal year 63,178 193,920Reclassified to realized loss recorded in the past
fiscal year1 - 8,034
Derivative gain on investments 219 -Effect of foreign exchange translation2 - 364Other 71 494
Total 63,468 193,698
(3) Gain and loss on investments at Latin America Funds
The components of gain and loss on investments at Latin America Funds are as follows:
Notes:1. It represents the unrealized gain and loss on valuation of investments recorded as “Gain (loss) on investments at Latin
America Funds” in the past fiscal years, which are reclassified to realized gain and loss on investments due to the realization for the six-month period ended September 30, 2021.
2. Unrealized gain and loss on valuation of investments are translated using the average exchange rate for the quarter in which the gain and loss were recognized, while realized gain and loss on investments are translated using the average exchange rate for the quarter in which the shares were disposed. Foreign currency translation effects are arising from the different foreign currency exchange rates used for unrealized gain and loss on valuation and realized gain and loss.
Also, in SoftBank Latin America Funds, SoftBank Group Corp. introduced a co-investment program with restricted right to receive distributions in September 2021. The details are described in “Note 18. Related party transactions.”
SoftBank Group Corp. Consolidated Financial Report For the Six-Month Period Ended September 30, 2021
106
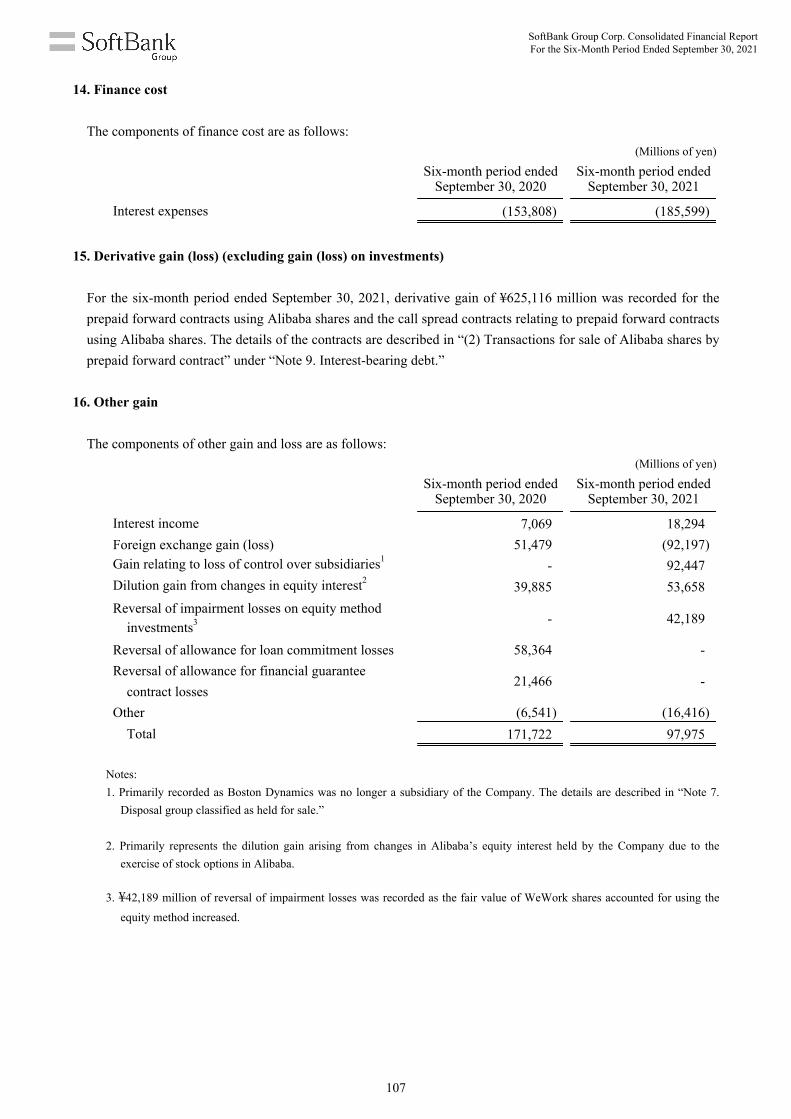
(Millions of yen)
Six-month period ended September 30, 2020
Six-month period ended September 30, 2021
Interest expenses (153,808) (185,599)
14. Finance cost
The components of finance cost are as follows:
15. Derivative gain (loss) (excluding gain (loss) on investments)
For the six-month period ended September 30, 2021, derivative gain of ¥625,116 million was recorded for the prepaid forward contracts using Alibaba shares and the call spread contracts relating to prepaid forward contracts using Alibaba shares. The details of the contracts are described in “(2) Transactions for sale of Alibaba shares by prepaid forward contract” under “Note 9. Interest-bearing debt.”
(Millions of yen)
Six-month period ended September 30, 2020
Six-month period ended September 30, 2021
Interest income 7,069 18,294Foreign exchange gain (loss) 51,479 (92,197)Gain relating to loss of control over subsidiaries1 - 92,447Dilution gain from changes in equity interest2 39,885 53,658Reversal of impairment losses on equity method
investments3 - 42,189
Reversal of allowance for loan commitment losses 58,364 -Reversal of allowance for financial guarantee
contract losses21,466 -
Other (6,541) (16,416)Total 171,722 97,975
16. Other gain
The components of other gain and loss are as follows:
Notes:1. Primarily recorded as Boston Dynamics was no longer a subsidiary of the Company. The details are described in “Note 7.
Disposal group classified as held for sale.”
2. Primarily represents the dilution gain arising from changes in Alibaba’s equity interest held by the Company due to the exercise of stock options in Alibaba.
3. ¥42,189 million of reversal of impairment losses was recorded as the fair value of WeWork shares accounted for using the
equity method increased.
SoftBank Group Corp. Consolidated Financial Report For the Six-Month Period Ended September 30, 2021
107

17. Supplemental information to the condensed interim consolidated statement of cash flows
(1) Cash flows from discontinued operations
Cash flows from continuing operations and cash flows from discontinued operations are included in the condensed interim consolidated statement of cash flows.
(2) Income taxes paid and income taxes refunded
For the six-month period ended September 30, 2021
Payment of withholding income tax related to dividends within the group companies of ¥268,621 million is included in “Income taxes paid.”
In addition, withholding income tax related to dividends within the group companies of ¥247,259 million is included in “Income taxes refunded.”
(3) Proceeds from withdrawal of restricted cash
For the six-month period ended September 30, 2021
¥359,038 million of proceeds, which was required to be maintained in a segregated custody account for the early termination of financial liabilities related to the settlement of prepaid forward contracts using Alibaba shares as of March 31, 2021, is included in “Proceeds from withdrawal of restricted cash.” The details are described in “(2) Transactions for sale of Alibaba shares by prepaid forward contract” under “Note 9. Interest-bearing debt.”
(4) Significant non-cash transactions
For the six-month period ended September 30, 2021
Deutsche Telecom partially exercised the call option over T-Mobile shares which the Company granted in June 2020. Accordingly, the Company sold 45,366,669 shares of T-Mobile held, through a wholly-owned subsidiary, to Deutsche Telecom and received newly issued 225,000,000 shares of Deutsche Telecom as its consideration. The transaction corresponds to a non-cash transaction. The details are described in “Note 19. Additional information.”
SoftBank Group Corp. Consolidated Financial Report For the Six-Month Period Ended September 30, 2021
108

18. Related party transactions
The Board of Directors of SoftBank Group Corp. has resolved to introduce a co-investment program with restricted rights to receive distributions to SVF2 and SoftBank Latin America Funds. As such, for the three-month period ended September 30, 2021, SVF2 LLC, a subsidiary of SVF2 and a subsidiary of the Company, and SLA Holdco II LLC (“SLA LLC”), a subsidiary of SoftBank Latin America Funds, and a subsidiary of the Company, have each entered into a definitive agreement with the Company and MgmtCo, a participant in the program, which resulted in MgmtCo becoming an investor in SVF2 LLC and SLA LLC.
MgmtCo is a company controlled by Masayoshi Son, Representative Director, Corporate Officer, Chairman & CEO of SoftBank Group Corp., and a related party of the Company. The program has been introduced for the purpose of enabling Masayoshi Son to make a co-investment in SVF2 and SoftBank Latin America Funds with the Company, sharing risk of losses as well as benefit of profits in the success of SVF2 and SoftBank Latin America Funds, and leading to enhanced focus on the management of investments held by them, which in turn is intended to contribute to increases in the Company’s earnings. In making a co-investment in SVF2 and SoftBank Latin America Funds under the terms of the program, MgmtCo both receives the benefit of profits and assumes the risk of losses from SVF2 and SoftBank Latin America Funds, and MgmtCo’s right to receive distributions from its investment is subject to certain restrictions.
Contributions to SVF2 LLC and SLA LLC are classified as “Equity” and “Preferred Equity” depending on the terms and conditions of distribution. SVF2 LLC and SLA LLC each have issued Equity entitled to performance-based distributions that are allocated to the Company and MgmtCo based on the proportion of their respective contributions. The Company’s Equity interest in each of SVF2 LLC and SLA LLC is 82.75%, and MgmtCo’s Equity interest in each of SVF2 LLC and SLA LLC is 17.25%. The Company’s investment in SVF2 LLC is made through SoftBank Vision Fund II-2 L.P. and its subsidiaries, and its investment in SLA LLC is made through SLA Latin America Fund LLC and its subsidiaries.
SoftBank Group Corp. Consolidated Financial Report For the Six-Month Period Ended September 30, 2021
109
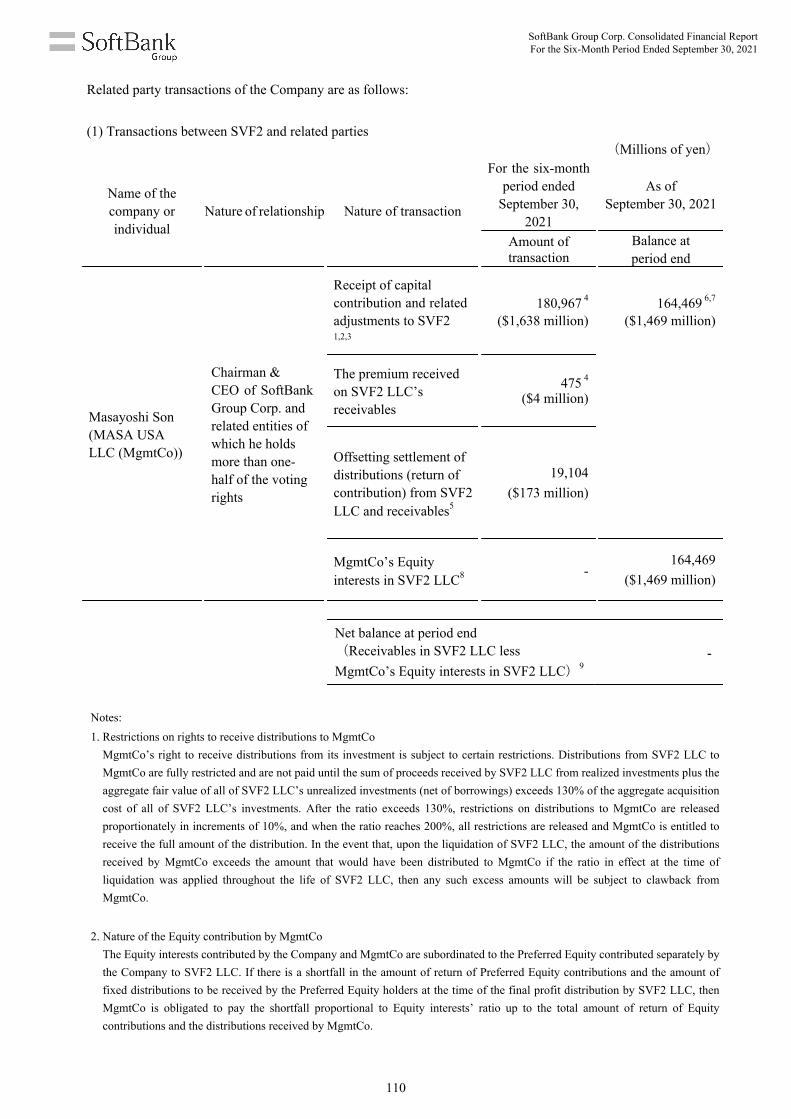
Name of the company or individual
Nature of relationship Nature of transaction
For the six-month period ended
September 30, 2021
As ofSeptember 30, 2021
Amount oftransaction
Balance atperiod end
Masayoshi Son(MASA USALLC (MgmtCo))
Chairman &CEO of SoftBank Group Corp. and related entities of which he holds more than one-half of the voting rights
Receipt of capital contribution and related adjustments to SVF2 1,2,3
180,967 4
($1,638 million)164,469 6,7
($1,469 million)
The premium received on SVF2 LLC’s receivables
475 4
($4 million)
Offsetting settlement of distributions (return of contribution) from SVF2 LLC and receivables5
19,104($173 million)
MgmtCo’s Equity interests in SVF2 LLC8 -
164,469($1,469 million)
Net balance at period end(Receivables in SVF2 LLC lessMgmtCo’s Equity interests in SVF2 LLC)9
-
Related party transactions of the Company are as follows:
(1) Transactions between SVF2 and related parties(Millions of yen)
Notes:1. Restrictions on rights to receive distributions to MgmtCo
MgmtCo’s right to receive distributions from its investment is subject to certain restrictions. Distributions from SVF2 LLC to MgmtCo are fully restricted and are not paid until the sum of proceeds received by SVF2 LLC from realized investments plus the aggregate fair value of all of SVF2 LLC’s unrealized investments (net of borrowings) exceeds 130% of the aggregate acquisition cost of all of SVF2 LLC’s investments. After the ratio exceeds 130%, restrictions on distributions to MgmtCo are released proportionately in increments of 10%, and when the ratio reaches 200%, all restrictions are released and MgmtCo is entitled to receive the full amount of the distribution. In the event that, upon the liquidation of SVF2 LLC, the amount of the distributions received by MgmtCo exceeds the amount that would have been distributed to MgmtCo if the ratio in effect at the time of liquidation was applied throughout the life of SVF2 LLC, then any such excess amounts will be subject to clawback from MgmtCo.
2. Nature of the Equity contribution by MgmtCoThe Equity interests contributed by the Company and MgmtCo are subordinated to the Preferred Equity contributed separately by the Company to SVF2 LLC. If there is a shortfall in the amount of return of Preferred Equity contributions and the amount of fixed distributions to be received by the Preferred Equity holders at the time of the final profit distribution by SVF2 LLC, then MgmtCo is obligated to pay the shortfall proportional to Equity interests’ ratio up to the total amount of return of Equity contributions and the distributions received by MgmtCo.
SoftBank Group Corp. Consolidated Financial Report For the Six-Month Period Ended September 30, 2021
110

3. Management fee and performance fees to be charged to MgmtCoThe terms of the management fee and performance fee to be charged to MgmtCo are the same as those to be charged to the Company as an Equity investor in SVF2 LLC.
4. The amount of transaction with MgmtCo related to receipt of capital contributionThe amount of the transaction for “Receipt of capital contribution and related adjustments in SVF2 LLC” is MgmtCo’s Equity Acquisition Amount in SVF2 LLC, which consists of ¥159,956 million ($1,448 million) calculated based on MgmtCo’s Equity interests of 17.25% in the SVF2’s initial acquisition costs of the portfolio companies held by SVF2 LLC and ¥20,382 million ($184 million) of related adjustments calculated based on 17.25% interest in the increase in the portfolio companies’ fair value from the initial acquisition costs at SVF2 to June 30, 2021, and ¥629 million ($6 million) of the adjustment equivalent to interests for the period from the Company’s contribution to SVF2 until June 30, 2021. The total amount of MgmtCo’s committed capital for the program is $2.6 billion and the total amount after adding the related adjustments to the committed capital is expected to be $2.9 billion. All capital contributions from MgmtCo have not been completed yet as of September 30, 2021 and the remaining contributions have been made on and after October 1, 2021, sequentially. Total MgmtCo’s Equity Acquisition Amount will be determined when all capital contributions from MgmtCo have been completed.
MgmtCo is entitled to make full or partial payment of its Equity Acquisition Amount at any point in time at its discretion from the date it became an investor in SVF2 LLC to the end of the company life of SVF2 LLC. MgmtCo is required to pay a premium of 3% per annum on the unpaid Equity Acquisition Amount until the unpaid amount is paid in full. “The premium received on SVF2’s receivables” refers to the amount of such premium accrued in the current period. MgmtCo is also entitled to make full or partial payment of the premium at any point in time, at its discretion on the same terms and conditions as Equity Acquisition Amount.
5. Offsetting settlement between distributions from SVF2 LLC and receivablesAny distributable amount from SVF2 LLC to MgmtCo is offset against the receivables at the time of the distribution notice and no distribution payments to MgmtCo are made until the SVF2 LLC’s receivables are paid in full.
6. Balance at period end of receivables from MgmtCo for receipt of capital contribution and related adjustmentsBalance at period end is the balance of SVF2 LLC’s receivables consist of the balance related to receipt of capital contribution, related adjustments and premiums received, less any decrease in receivables due to offsetting settlement with distributions to MgmtCo.
7. Collateral and other credit protection for receivablesIn order to secure the receivables of SVF2 LLC related to Equity Acquisition Amount and the premium thereon, all of the Equity interests in SVF2 LLC held by MgmtCo were pledged as collateral. In the event that MgmtCo pays into the receivables or offsets such receivables with distributions due to it from SVF2 LLC, the collateral is released to the extent that the cumulative amounts of payments and offsets exceeds the balance of the receivables after deduction of such cumulative amounts. Masayoshi Son also provides a personal guarantee to the receivables up to the balance of the receivables. In addition, as of September 30, 2021, 8,897,100 shares of SoftBank Group Corp. are deposited in SVF2 LLC by Masayoshi Son. The deposited shares of SoftBank Group Corp. will be released only where the entire amount of receivables is settled. SVF2 LLC may acquire the deposited SoftBank Group Corp. shares without consideration where there are any unpaid receivables in SVF2 LLC after the enforcement of the collateral and personal guarantees by SVF2 LLC.
8. MgmtCo’s Equity interest in SVF2 LLCThe amount represents SVF2 LLC’s net assets attributable to MgmtCo (before deduction of receivables), which is included in “Third-party interests in SVF1 and SVF2” in the condensed interim consolidated statement of financial position.
9. Net balance at period endNet balance at period end is the balance of receivables held by SVF2 LLC of ¥164,469 million ($1,469 million) less MgmtCo’s Equity interest in SVF2 LLC of ¥164,469 million ($1,469 million).
SoftBank Group Corp. Consolidated Financial Report For the Six-Month Period Ended September 30, 2021
111

Name of the company or individual
Nature of relationship Nature of transaction
For the six-month period ended
September 30, 2021
As ofSeptember 30, 2021
Amount oftransaction
Balance atperiod end
Masayoshi Son(MASA USA LLC (MgmtCo))
Chairman &CEO of SoftBank Group Corp. and related entities of which he holds more than one-half of the voting rights
Receipt of capital contribution in SLA LLC and related adjustments 1, 2, 3
76,367 4
($691 million)77,369 5, 6
($691 million)
MgmtCo’s Equity interests in SLA LLC7 - 77,236
($690 million)
Net balance at period end(Receivables in SLA LLC lessMgmtCo’s Equity interests in SLA LLC)8
133($1 million)
(2) Transactions between SoftBank Latin America Funds and related parties
(Millions of yen)
Notes:1. Restrictions on rights to receive distributions to MgmtCo
MgmtCo’s rights to receive distributions from its investment is subject to certain restrictions. Distributions from SLA LLC to MgmtCo are fully restricted and are not paid until the sum of proceeds received by SLA LLC from realized investments plus the aggregate fair value of all of SLA LLC’s unrealized investments (net of borrowings) exceeds 130% of the aggregate acquisition cost of all of SLA LLC’s investments. After the ratio exceeds 130%, restrictions on distributions to MgmtCo are released proportionately in increments of 10%, and when the ratio reaches 200%, all restrictions are released and MgmtCo is entitled to receive the full amount of the distribution. In the event that, upon the liquidation of SLA LLC, the amount of the distributions received by MgmtCo exceeds the amount that would have been distributed to MgmtCo if the ratio in effect at the time of liquidation was applied throughout the life of SVF2 LLC, then any such excess amounts will be subject to clawback from MgmtCo.
2. Nature of the Equity contribution by MgmtCoThe Equity interests contributed by the Company and MgmtCo are subordinated to the Preferred Equity contributed separately by the Company to SLA LLC. If there is a shortfall in the amount of return of Preferred Equity contributions and the amount of fixed distributions to be received by the Preferred Equity holders at the time of the final profit distribution by SLA LLC, then MgmtCo is obligated to pay the shortfall proportional to Equity interests’ ratio up to the total amount of return of Equity contributions and the distributions received by MgmtCo.
3. Management fee and performance fees to be charged to MgmtCoThe terms of the management fee and performance fee to be charged to MgmtCo are the same as those to be charged to the Company as an Equity investor in SLA LLC.
SoftBank Group Corp. Consolidated Financial Report For the Six-Month Period Ended September 30, 2021
112
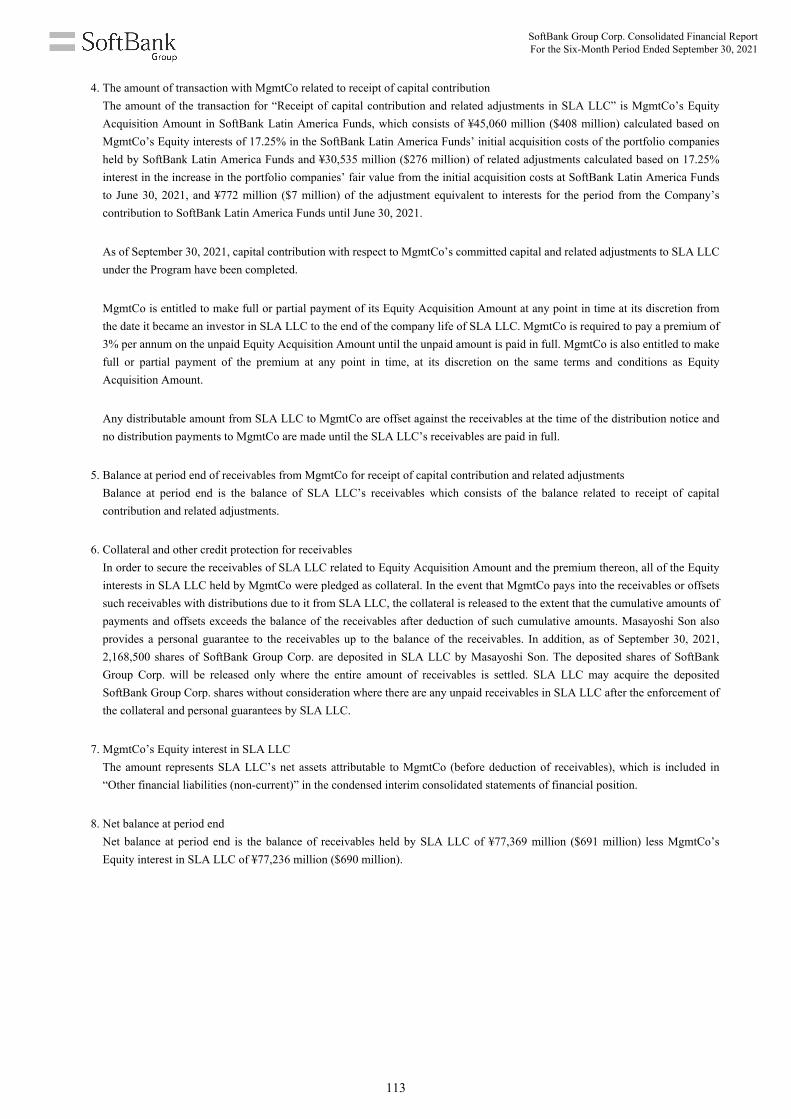
4. The amount of transaction with MgmtCo related to receipt of capital contributionThe amount of the transaction for “Receipt of capital contribution and related adjustments in SLA LLC” is MgmtCo’s Equity Acquisition Amount in SoftBank Latin America Funds, which consists of ¥45,060 million ($408 million) calculated based on MgmtCo’s Equity interests of 17.25% in the SoftBank Latin America Funds’ initial acquisition costs of the portfolio companies held by SoftBank Latin America Funds and ¥30,535 million ($276 million) of related adjustments calculated based on 17.25% interest in the increase in the portfolio companies’ fair value from the initial acquisition costs at SoftBank Latin America Funds to June 30, 2021, and ¥772 million ($7 million) of the adjustment equivalent to interests for the period from the Company’s contribution to SoftBank Latin America Funds until June 30, 2021.
As of September 30, 2021, capital contribution with respect to MgmtCo’s committed capital and related adjustments to SLA LLC under the Program have been completed.
MgmtCo is entitled to make full or partial payment of its Equity Acquisition Amount at any point in time at its discretion from the date it became an investor in SLA LLC to the end of the company life of SLA LLC. MgmtCo is required to pay a premium of 3% per annum on the unpaid Equity Acquisition Amount until the unpaid amount is paid in full. MgmtCo is also entitled to make full or partial payment of the premium at any point in time, at its discretion on the same terms and conditions as Equity Acquisition Amount.
Any distributable amount from SLA LLC to MgmtCo are offset against the receivables at the time of the distribution notice and no distribution payments to MgmtCo are made until the SLA LLC’s receivables are paid in full.
5. Balance at period end of receivables from MgmtCo for receipt of capital contribution and related adjustmentsBalance at period end is the balance of SLA LLC’s receivables which consists of the balance related to receipt of capital contribution and related adjustments.
6. Collateral and other credit protection for receivablesIn order to secure the receivables of SLA LLC related to Equity Acquisition Amount and the premium thereon, all of the Equity interests in SLA LLC held by MgmtCo were pledged as collateral. In the event that MgmtCo pays into the receivables or offsets such receivables with distributions due to it from SLA LLC, the collateral is released to the extent that the cumulative amounts of payments and offsets exceeds the balance of the receivables after deduction of such cumulative amounts. Masayoshi Son also provides a personal guarantee to the receivables up to the balance of the receivables. In addition, as of September 30, 2021, 2,168,500 shares of SoftBank Group Corp. are deposited in SLA LLC by Masayoshi Son. The deposited shares of SoftBank Group Corp. will be released only where the entire amount of receivables is settled. SLA LLC may acquire the deposited SoftBank Group Corp. shares without consideration where there are any unpaid receivables in SLA LLC after the enforcement of the collateral and personal guarantees by SLA LLC.
7. MgmtCo’s Equity interest in SLA LLCThe amount represents SLA LLC’s net assets attributable to MgmtCo (before deduction of receivables), which is included in “Other financial liabilities (non-current)” in the condensed interim consolidated statements of financial position.
8. Net balance at period endNet balance at period end is the balance of receivables held by SLA LLC of ¥77,369 million ($691 million) less MgmtCo’s Equity interest in SLA LLC of ¥77,236 million ($690 million).
SoftBank Group Corp. Consolidated Financial Report For the Six-Month Period Ended September 30, 2021
113
19. Additional information
(Partial sale of T-Mobile shares for the six-month period ended September 30, 2021)
On September 6, 2021, the Company entered into a master framework agreement (“the Agreement”) with Deutsche Telekom, pursuant to which Deutsche Telekom agreed to partially exercise its right to acquire the shares of T-Mobile in accordance with the terms of the call options (the “Call Options”) granted by the Company to Deutsche Telekom in June 2020, and to amend the execution conditions of the same. Following the exercise of the Call Options, the Company sold 45,366,669 shares of T-Mobile held, though a wholly-owned subsidiary of the Company, to Deutsche Telekom and received newly issued 225,000,000 shares of Deutsche Telekom as its consideration. Under the Agreement, Deutsche Telekom also provided its consent for the Company to have additional flexibility to pledge its T-Mobile shares in connection with the entry into margin loans and other monetization transactions and agreed that it will prioritize the use of cash proceeds from certain divestitures to exercise the additional Call Options for cash up to an aggregate of $2.4 billion of total exercise price, subject to certain conditions. Following entry into the Agreement, the Company carried out the monetization transactions using T-Mobile shares.
(1) Outline of the Call Options to Deutsche Telekom
In June 2020, the Company granted to Deutsche Telekom the Call Options over 101,491,623 shares of T-Mobile.
a. For the Call Options over 44,905,479 shares (the “Fixed Call Options”), a strike price of the call option is $101.455 per a share. Deutsche Telekom can exercise the Call Options any time after the grant date.
b. For the Call options over 56,586,144 shares (the “Floating Call Options”), a strike price of the call option is equal to the average of the daily volume-weighted average price of the shares of T-Mobile for each of the 20 trading days immediately prior to exercise. Deutsche Telekom can exercise the Call Options after the exercise of rights described in the above a. from October 2, 2020 to May 22, 2024 and, after May 22, 2024, can exercise any time regardless of the exercise of rights described in the above a.
Note:
* The Call Options expire on June 22, 2024, unless certain events occur that trigger an earlier expiration date.
(2) Partial exercise of the Call Options
On September 23, 2021, Deutsche Telekom exercised the Fixed Call Options for 26,348,874 shares and the Floating Call Options for 19,017,795 shares and a wholly-owned subsidiary of the Company received newly issued 225,000,000 shares of Deutsche Telekom as its consideration. Adjustments were made for a strike price of the Floating Call Options to be equal to the acquired 225,000,000 shares of Deutsche Telekom from the partial exercise of the Call Options.
(3) Change in conditions for the unexercised Call Options
A strike price of the Floating Call Options was changed to the lesser of the following a. and b.
SoftBank Group Corp. Consolidated Financial Report For the Six-Month Period Ended September 30, 2021
114

a. Number of shares held before the partial exercise 106,291,623 shares
b. Number of the sold shares by the partial exercise 45,366,669 shares
c. Number of shares held after the partial exercise 60,924,954 shares
d. Number of shares subject to the unexercised Call Options 56,124,954 shares
e. Number of shares held after the Call Options are exercised* 4,800,000 shares
a. The average of the daily volume weighted average prices of T-Mobile shares for the 20 scheduled trading days beginning on, and including, the Scheduled Trading Day immediately following the date of delivery of the Notice of Exercise.
b. The average of the daily volume weighted average prices of T-Mobile shares for (a) the period of 20 Trading Days ending with the date of delivery of the Notice of Exercise (or ending on the immediately preceding Trading Day if the date of delivery of the Notice of Exercise is not a Trading Day) and (b) the 20 Scheduled Trading Days beginning on, and including, the Scheduled Trading Day immediately following the date of delivery of the Notice of Exercise.
In addition, the expiration time for the unexercised Call Options is May 28, 2024 and the Call Options can be exercised at any time.
(4) Number of T-Mobile shares to be sold by partial exercise of the Call Options, number of shares subject to the unexercised Call Options and number of the shares held by the Company before/after the transactions
Note:
* Calculated on the assumption that the Call Options are fully exercised.
(5) Outline of the monetization
For the six-month period ended September 30, 2021, a wholly-owned subsidiary of the Company procured $1.81 billion through prepaid forward contracts by using 17,935,000 shares of T-Mobile and $2.65 billion through a new margin loan by using 42,989,954 shares of T-Mobile pledged as collateral, and made an early repayment of $4.38 billion of the previous margin loan by using 106,291,623 shares of T-Mobile pledged as collateral. In addition, $1.25 billion was procured through a bridge loan by using 45,366,669 shares of T-Mobile pledged as collateral. T-Mobile shares pledged as collateral for the bridge loan were replaced by 225,000,000 shares of Deutsche Telekom as Deutsche Telekom partially exercised the Call Options and the wholly-owned subsidiary of the Company received Deutsche Telekom shares as its consideration. The details are described in “Notes 1, 4, and 6” in “(1) Components of interest-bearing debt” under “Note 9. Interest bearing debts.”
SoftBank Group Corp. Consolidated Financial Report For the Six-Month Period Ended September 30, 2021
115