consolidated financial report for the first half of the ... · 2 2. average number of shares...
TRANSCRIPT
1
NIPPON THOMPSON CO., LTD. Corporate Headquarters: Tokyo
Listed Code: 6480 Listed Stock Exchange: Tokyo (URL: http://www.ikont.co.jp/eg/)
November 14, 2005
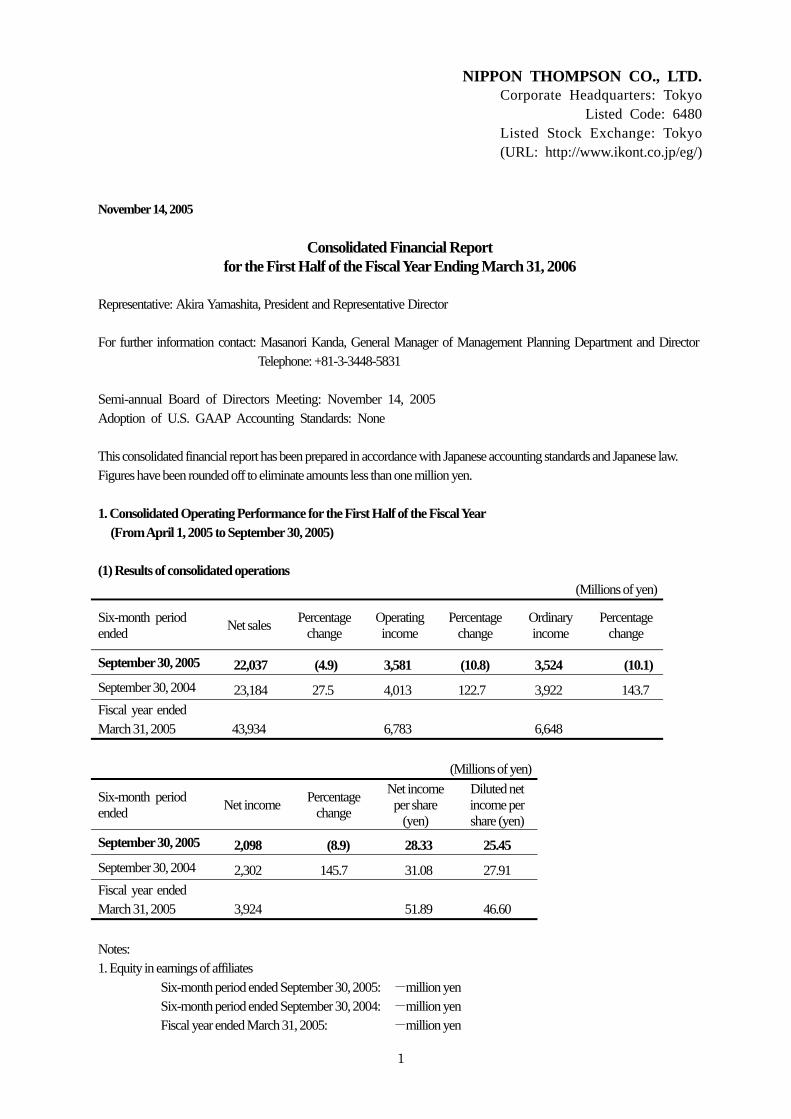
Consolidated Financial Report for the First Half of the Fiscal Year Ending March 31, 2006
Representative: Akira Yamashita, President and Representative Director For further information contact: Masanori Kanda, General Manager of Management Planning Department and Director
Telephone: +81-3-3448-5831 Semi-annual Board of Directors Meeting: November 14, 2005 Adoption of U.S. GAAP Accounting Standards: None This consolidated financial report has been prepared in accordance with Japanese accounting standards and Japanese law. Figures have been rounded off to eliminate amounts less than one million yen. 1. Consolidated Operating Performance for the First Half of the Fiscal Year
(From April 1, 2005 to September 30, 2005) (1) Results of consolidated operations (Millions of yen)
Six-month period ended Net sales Percentage
change Operating income
Percentage change
Ordinary income
Percentage change
September 30, 2005 22,037 (4.9) 3,581 (10.8) 3,524 (10.1) September 30, 2004 23,184 27.5 4,013 122.7 3,922 143.7 Fiscal year ended March 31, 2005 43,934 6,783 6,648 (Millions of yen)
Six-month period ended Net income Percentage
change
Net income per share
(yen)
Diluted net income per share (yen)
September 30, 2005 2,098 (8.9) 28.33 25.45 September 30, 2004 2,302 145.7 31.08 27.91 Fiscal year ended March 31, 2005 3,924 51.89 46.60 Notes: 1. Equity in earnings of affiliates
Six-month period ended September 30, 2005: -million yen Six-month period ended September 30, 2004: -million yen Fiscal year ended March 31, 2005: -million yen
2
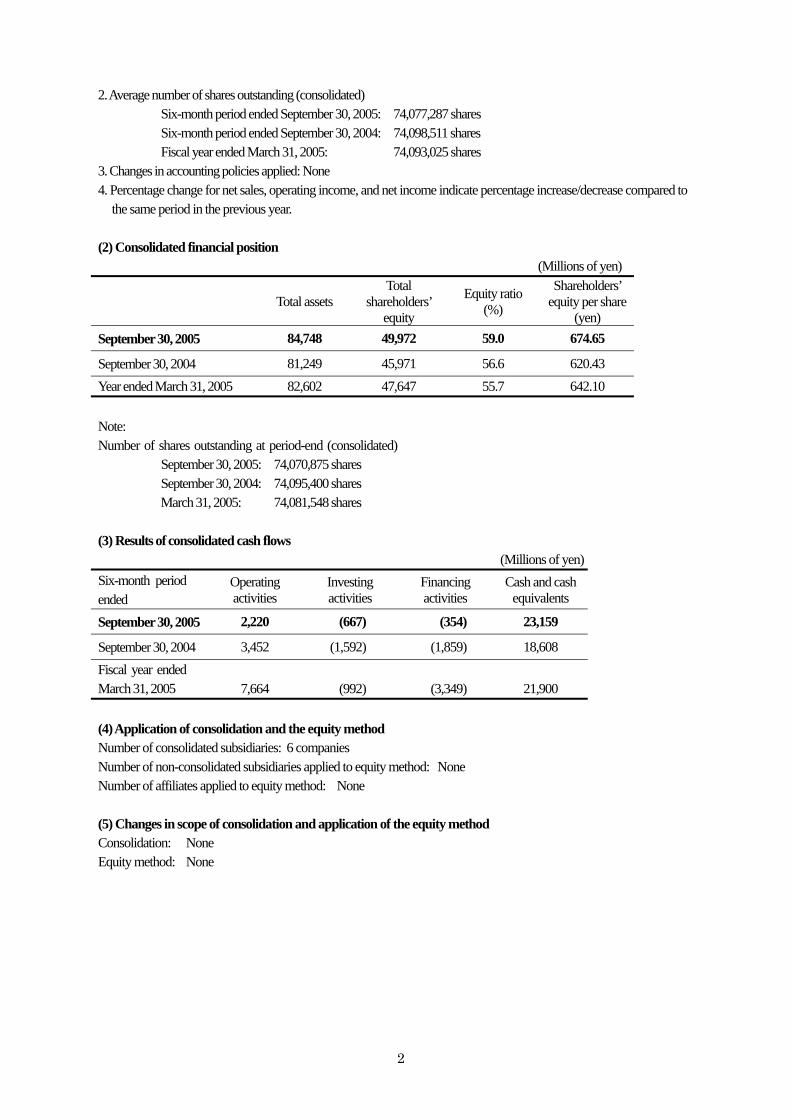
2. Average number of shares outstanding (consolidated)
Six-month period ended September 30, 2005: 74,077,287 shares Six-month period ended September 30, 2004: 74,098,511 shares Fiscal year ended March 31, 2005: 74,093,025 shares
3. Changes in accounting policies applied: None 4. Percentage change for net sales, operating income, and net income indicate percentage increase/decrease compared to
the same period in the previous year. (2) Consolidated financial position (Millions of yen)
Total assets Total
shareholders’ equity
Equity ratio (%)
Shareholders’ equity per share
(yen) September 30, 2005 84,748 49,972 59.0 674.65
September 30, 2004 81,249 45,971 56.6 620.43 Year ended March 31, 2005 82,602 47,647 55.7 642.10 Note: Number of shares outstanding at period-end (consolidated)
September 30, 2005: 74,070,875 shares September 30, 2004: 74,095,400 shares March 31, 2005: 74,081,548 shares
(3) Results of consolidated cash flows (Millions of yen) Six-month period ended
Operating activities
Investing activities
Financing activities
Cash and cash equivalents
September 30, 2005 2,220 (667) (354) 23,159
September 30, 2004 3,452 (1,592) (1,859) 18,608 Fiscal year ended March 31, 2005 7,664 (992) (3,349) 21,900 (4) Application of consolidation and the equity method Number of consolidated subsidiaries: 6 companies Number of non-consolidated subsidiaries applied to equity method: None Number of affiliates applied to equity method: None (5) Changes in scope of consolidation and application of the equity method Consolidation: None Equity method: None

3
2. Forecast of Consolidated Operating Performance for the Fiscal Year Ending March 31, 2006 (Millions of yen)
Net sales Operating Income Ordinary income Net income
Year ending March 31, 2006 45,000 7,600 7,450 4,450
(Reference) The forecast of “Net income per share” (Annual): ¥60.07 Note: The forecast of results of operations made in this document involves risks and uncertainties since the forecast is based on management’s assumptions and beliefs in light of the information currently available to it. The reader should be aware that actual results maybe materially different from any future results expressed herein due to various factors.
Above forecasts have been based on projected foreign exchange rates of ¥110 = US$1 and ¥130 = €1.

4
Business Flows within the Group The Nippon Thompson Group (the “ Group ”) is composed of Nippon Thompson Co., Ltd. (the “Company ”) and its subsidiaries, and engages in the manufacture and sale of Needle Roller Bearings, Linear Motion Rolling Guides, and machine components. The Group’s business is outlined in the following diagram.
Customers
Sales (Domestic) Consolidated Subsidiaries: Nippon Thompson Sales Co., Ltd. Nippon Dic Co., Ltd. Non-Consolidated Companies: Hassei Shokai Co., Ltd. (Overseas) Consolidated Subsidiaries: IKO International, Inc. Nippon Thompson Europe B.V.
Production/Sales Nippon Thompson Co., Ltd.
Production Consolidated Subsidiaries: Mugegawa MFG. Co., Ltd. Kasagami MFG. Co., Ltd. Non-Consolidated Companies: Shinmie Seiko Co., Ltd.

5
Management Policies
1. Fundamental Management Policies
Based on the corporate philosophy of “contributing to society as an R&D-oriented company,” the Group —a
trusted international enterprise—is committed to serving domestic and overseas markets through the manufacture
and sale of bearings and bearing-related devices. Our emphasis is on quality rather than scale, as we see our
mission as developing high-value-added products that meet customer needs. The entire Company is engaged in an
effort to associate the Nippon Thompson brand with the acronym IKO—“ I ” for Innovation, because the
Company’s products are always innovative; “K” for Know-how, because they incorporate a high level of
technological expertise; and “O” for Originality, because they are highly creative.
The Group believes that contributing to the development of society is one of its most important
management policies. While thoroughly instilling corporate ethics, we make every effort to ensure compliance in
management and contribute to the preservation of the global environment as a good corporate citizen. Our corporate
activities take into account this social mission.
2. Fundamental Earnings Distribution Policy
Shareholders returns are one of the Company’s most important management issues. The Company’s fundamental
policy is to maintain stable dividends, taking business performance into account. The Company also uses internal
reserves for the expansion and renovation of manufacturing facilities and the development of new products in order
to prepare for future business environments, maximize corporate value, increase earning power, strengthen the
business base and remain abreast of rapid technological innovation and changes in demand.
3. Policy Regarding Trading Unit of Common Stock
Our basic policy is that the trading unit of our common stock should be appropriately revised to make our shares
more accessible to individual investors, thereby expanding our investor base and increasing share liquidity. In the
future, we will revise our trading unit, taking into account share market trends, our performance, and the related
costs and effects of reducing our trading unit.
4. Management Targets and Performance Indicators
Raising shareholder return on equity (ROE), in an effort to maximize shareholder value, is the principal indicator for
the Group. Management also focuses on improving cash flows to enhance stability and to strengthen the Group’s
financial position.
5. Medium-term Management Strategies
To remain a creative and competitive corporate group in this era of economic globalization, the Group is
strengthening ties among domestic and overseas Group companies, pursuing increased asset efficiency and lower
6
costs, and concentrating management resources into Linear Motion Rolling Guides and other high-growth strategic
businesses. Strengthening the Group’s ability to meet demand in this way will both enable improved earnings
power and strengthen the Group’s financial position.
6. Issues to Be Resolved.
The Group is engaged in a number of corporate activities intended to allow it to accurately grasp rapidly changing
demand trends in domestic and overseas markets, and to nimbly respond to these changes amid rapid advances in
technology around the world. To lay a stronger management foundation, the Group is implementing measures
related to sales activities, product development and manufacturing.
Through the user-centered, proposal-based sales activities that are the linchpin of our marketing strategy,
we are working to develop new markets and to increase our market share. As a foundation for this, we are building a
rational and efficient sales system that is adaptable to the changes in domestic and overseas markets.
In Japan’s domestic markets, the Group’s strategies do not only concentrate on emerging industries in principal
markets, but also recognize the necessity to applying proposal-based sales activities for niche markets. The cornerstone of
proposal-based sales activities will include directly visiting users where small-scale exhibitions can be held and actively
hosting technology-training sessions and workshops. Through the cultivation of a broad-range manufacturing industry, the
Group is striving for the formation of a well-balanced sales structure that will not be easily influenced by the economic
trends of one specific industry.
In overseas markets, in North American and European subsidiary companies where sales power is being
bolstered and enriched, as well as in Asia where growth has been remarkable, we are actively promoting the opening
of new markets and the reinforcement of sales support activities to distributing agents through cooperation between
regional offices and each of Japan’s domestic divisions. The results of these activities have led to an expansion of
orders.
As it is essential to improve new product development capabilities and increase the corporate value of the
Group, the Company is employing its user-oriented product development system to develop creative, marketable,
high-value-added products and to introduce them to the market in a timely fashion. In the first half of this fiscal year
ending March 31, 2006, the Company introduced 13 new products to stimulate demand. We will continue product
development optimally suited to market requirements, centered on Linear Motion Rolling Guides, which have one
of the largest numbers of product variations in the world.
In our manufacturing operations, we have been striving for cost reductions and improvement of the profit
structure, while working to build a solid business base that is not subject to the vagaries of trends in business
conditions, by strengthening our manufacturing system so that it can respond flexibly to demand.
Furthermore, working to fulfill its corporate responsibilities to society and in response to global
environmental problems, the Group’s core manufacturing bases have been striving toward developing
environmentally friendly products based on “ISO 14001” standards and reducing production waste. Other such
activities include the establishment of our Environment Committee in May 2004. The committee, at the center of all
7
environment-related undertakings, will continue with the promotion of its environment conservation activities
throughout the entire Group.
7. Fundamental Policy on Corporate Governance and Activities
(Fundamental Policy)
Based on its fundamental management policy to ensure sustained growth in harmonious coexistence with society,
the Group positions swift and accurate decision making, the overview of the executive function based on a policy of
strict regulatory compliance, and full and open disclosure at the core of its business and corporate governance
activities, with the aims of developing user-centric technology and realizing a better global environment.
(Corporate Governance Activities)
The Board of Directors consists of 12 directors (all of whom are in-house directors). In addition to its scheduled
monthly meetings, the Board convenes when required to make decisions pertaining to significant statutory and
regulatory issues as well as important management issues, and is also the body charged with the oversight of
executive functions.
The Operating Committee convenes once a week and has a membership of seven, including the
chairman, the president, the senior managing director and managing directors. This committee determines the status
of progress toward goals and resolution of management issues, and promotes swift business decisions and
execution of operations.
The Company adopts the corporate auditors system, centered on a four-member Board of Corporate
Auditors, of whom two are appointed from outside the Group. In addition, the Company conducts internal audits.
In principle, all members of the Board of Corporate Auditors attend the meetings of the Board of Directors. There,
the directors keep them informed with regard to business issues, and they offer their opinions as needed. The Board
of Corporate Auditors also exercises oversight with regard to the executive functions of the Board of Directors.
There are no improper or questionable business dealings or other relationships between the Company and its
outside auditors.
When needed, the Company seeks the advice of corporate attorneys, accounting and auditing firms, and
their contract employees. There are no improper relationships between the Company and the aforementioned
parties.
In regard to the auditing of accounts, the auditing contract between auditing corporation Deloitte Touche
Tohmatsu and the Company concerning commercial law audits and the Securities Exchange Law audits has been
concluded. Certified public accounts “Shigeji Sugimoto” and “Taisei Kunii” have been appointed to audit the
consolidated results of the current interim period. Also, the appointment of three certified public accountants and
five junior certified public accountants has been made to assist in audit-related matters.
From the perspective of enhancing transparency in corporate management, the Company discloses
quarterly financial reports and holds explanatory sessions as necessary. The Company also publishes business

8
reports, showing business progress and non-consolidated and consolidated results, every six months for its
shareholders. We also emphasize the timely disclosure of corporate information on our Web site, and show the
financial report and the statements of results, etc., on our IR site. We will aim to continue expanding our efforts in
this Web site. Operating Results and Financial Position 1. Operating Results
(1) Overview of the First Half of the Fiscal Year Ending March 31, 2006 (April 1, 2005 to September 30,
2005)
In the consolidated interim period under review, the Japanese economy saw the beginning of a gradual recovery in
demand in digital-related industries. As the sustained health of the U.S. economy coupled with the growing
economies of China and ASEAN countries drive the world economy, Japan’s thriving automotive industry is at the
center of an upturn in corporate earnings. Against this backdrop, with capital investment in the private sector
showing steady movement and an improved employment and income environment causing increased personal
consumption, Japan’s economy continues in the basic direction of a steady recovery. However, the appreciation
of raw material prices and the continuance of crude oil to sell at inflated prices are affecting corporate performance
and continue to cause great concern for the future.
Owing to this environment, the Group’s performance showed underlying signs of recovery from a
bottoming out at the beginning of the year, but was unable to match results from the same period in the previous
year, when it experienced vigorous digital-related demand. Net sales for the Group amounted to ¥22,037 million, a
4.9% decline year on year. In revenues, ordinary income totaled ¥3,524 million, falling 10.1% compared to the
same period in the previous year, with net income coming to ¥2,098 million, an 8.9% decrease. These results were
not only affected by high material costs, but also the pressure of ongoing fixed costs, the Group’s focus on cost
reduction measures, and other factors.
Business Segment Information
Because the Group manufactures and sells Needle Roller Bearings, Linear Motion Rolling Guides, and machine
components on an integrated basis, business segment information is not provided.
As for the sales environment, backed by an increase in private sector capital investment comparable to
that of the robust automotive industry, demand in the machinery industry made a an overall recovery. Under these
market conditions and with a focus on increasing demand, the Group continued to actively pursue size variation
enhancements in its “The Maintenance-Free Series” with such products as “C-Sleeve Linear Way,” which are an
environmentally conscious, innovative Linear Motion Rolling Guides that reduces the number of maintenance
work hours dedicated to machine device lubrication necessary for standard operation. Furthermore, favorable
recovery was seen in demand for Needle Roller Bearings used in machine tools and hydraulic machines. In sales,
restructuring of the sales network based on the actual market environment was implemented, boosting the mobility

9
of the Group’s sales force. In manufacturing, the Group developed an efficient product supply structure through the
maintenance and reinforcement of a flexible manufacturing system. At the same time, the Group worked in
overseas markets to bolster its market development capabilities through the cooperation between distributing agents,
representative offices in China and Thailand and Japan’s domestic divisions, as a means to reach the ever-expanding
economies of the South East Asian markets and China’s vast market, with its potential for increasing demand. As a
result, sales in Needle Roller Bearings and Linear Motion Rolling Guides totaled ¥18,734 million, a 6.3% decline
compared to the same period in the previous year. Owing to a surge in orders for Ball Screws and other components
used in conjunction with Linear Motion Rolling Guides, sales in machine components climbed 3.3% to ¥3,302
million.
Geographic Segment Information
Japan
Reflecting an increasing trend of private sector capital investment, orders targeting the automotive industry grew
while orders for machine tools remained solid. Furthermore, in the semiconductor-related manufacturing industry,
stock adjustment phases of electronic components nearing completion helped to bring about a recovery in demand
for Linear Motion Rolling Guides. As for exports, the Chinese market has once again increased after undergoing a
temporary phase of adjustment. Market expansion in the Middle and Near East and in Latin America also made
steady progress. Still, comparing these results to the same period in the previous year, with the entire market in the
course of recovery, net sales dropped 6.3% to ¥18,100 million and operating income fell 4.7% to ¥3,429 million.
North America
Although there was growth in demand for Linear Motion Rolling Guides for use in general industrial machinery
and medical equipment, semiconductor manufacturing equipment industries that are a principal source of demand
for Nippon Thompson’s products have yet to fully recover, which brought net sales down 6.3% to ¥2,029 million
compared to the same period in previous year. Operating income declined 53.2 % year on year to ¥122 million.
Europe
The export environment improved on the back of a weak euro and the economy followed a course of gradual
recovery. Growth in demand for Linear Motion Rolling Guides for machine tools was particularly robust, and an
increase in revenues benefiting from foreign exchange transactions led to a 12.2% rise in net sales to ¥1,907 million
and a 43.1% jump in operating income to ¥180 million.
10
(2) Outlook
In Japan’s economy, high crude oil prices showed no sign of falling and the price of imported raw materials
increased due to the weak yen. Although anxiety over the slow growth of the U.S. and Chinese economies remains
a primary cause of worry, Japanese business performance is on the rise, corresponding to improvement in the
employment and income environment. Accordingly, the Group expects domestic demand in private sector capital
investment and personal consumption to make steady progress toward a recovery. Furthermore, with a recovery in
digital-related demand and an upturn for Linear Motion Rolling Guides that are regularly used by
semiconductor-related manufacturers, the Group anticipates a boost in performance results.
Under these circumstances, consolidated performance forecasts for the fiscal year ending March 31,
2006 are net sales of ¥45.0 billion, ordinary income of ¥7.45 billion and net income of ¥4.45 billion, assuming an
exchange rate of ¥110=US$1 and ¥130=€1.
11
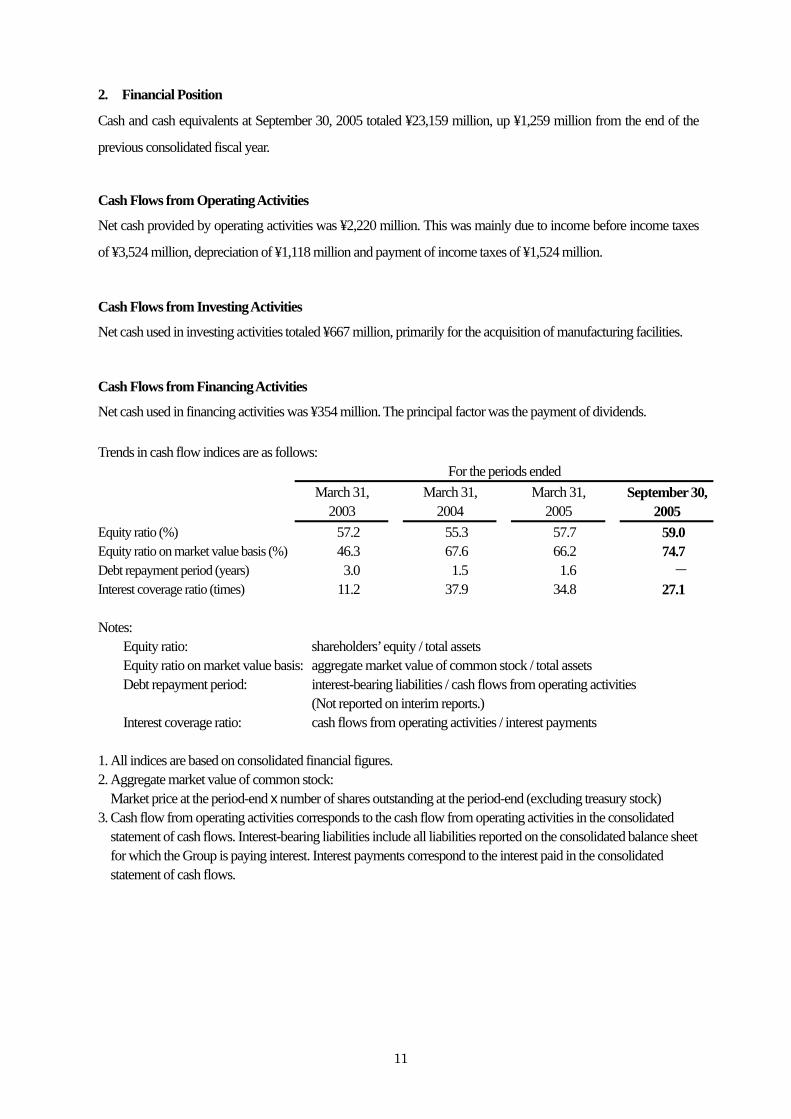
2. Financial Position
Cash and cash equivalents at September 30, 2005 totaled ¥23,159 million, up ¥1,259 million from the end of the
previous consolidated fiscal year.
Cash Flows from Operating Activities
Net cash provided by operating activities was ¥2,220 million. This was mainly due to income before income taxes
of ¥3,524 million, depreciation of ¥1,118 million and payment of income taxes of ¥1,524 million.
Cash Flows from Investing Activities
Net cash used in investing activities totaled ¥667 million, primarily for the acquisition of manufacturing facilities.
Cash Flows from Financing Activities
Net cash used in financing activities was ¥354 million. The principal factor was the payment of dividends. Trends in cash flow indices are as follows: For the periods ended March 31,
2003 March 31,
2004 March 31,
2005 September 30,
2005 Equity ratio (%) 57.2 55.3 57.7 59.0 Equity ratio on market value basis (%) 46.3 67.6 66.2 74.7 Debt repayment period (years) 3.0 1.5 1.6 - Interest coverage ratio (times) 11.2 37.9 34.8 27.1 Notes: Equity ratio: shareholders’ equity / total assets Equity ratio on market value basis: aggregate market value of common stock / total assets Debt repayment period: interest-bearing liabilities / cash flows from operating activities (Not reported on interim reports.) Interest coverage ratio: cash flows from operating activities / interest payments 1. All indices are based on consolidated financial figures. 2. Aggregate market value of common stock:
Market price at the period-end x number of shares outstanding at the period-end (excluding treasury stock) 3. Cash flow from operating activities corresponds to the cash flow from operating activities in the consolidated
statement of cash flows. Interest-bearing liabilities include all liabilities reported on the consolidated balance sheet for which the Group is paying interest. Interest payments correspond to the interest paid in the consolidated statement of cash flows.
12
3. Business Risks
Listed herein are a number of risks that have the potential to affect the financial position, operating results and
business development of the Group. The Group is aware of the possibility of such risks and works to prevent their
occurrence, and in the event that one occurs it will take the appropriate action to deal with such unforeseeable
events.
Forward-looking statements included herein have been determined based on information available to
the Group as of November 14, 2005, the day results for the interim period under review were announced.
(1) Market Environment and Economic Conditions
The Group’s business comprises two main product categories: Needle Roller Bearings and Linear Motion Rolling
Guides, which constitute 85% of the Group’s business, and machine components, constituting 15% of the business.
At this time, the Group does not foresee any major changes in this breakdown. Furthermore, the Group’s future as
it stands does not include plans for the creation of new businesses.
Products of the Group are used by domestic and foreign businesses in a wide-range of fields that include
semiconductor manufacturing equipment, machine tools, automobiles and motorcycles, electric equipment, robots,
construction equipment and textile machines. Therefore, a recession or a reduction in demand in these fields within
the markets of Japan, North America, Europe and Asia may adversely affect the operating results and financial
position of the Group.
(2) Product Development
As a manufacturer and supplier of Needle Roller Bearings and Linear Motion Rolling Guides, the Group
implements proposal-based sales activities that closely correspond to product users as a fundamental element of its
sales strategy. As a result of these activities, the Group is able to produce products that reflect the needs of users and
has released into the market a variety of products that clearly distinguish itself from its competitors. In the event
that demand for lower-cost products resembling ours outweighs the quality, performance, and superiority that our
products offer, however, there may be an unavoidable revision of the Group’s policy to engage in price
maintenance.
(3) Manufacturing Structure
The Group believes that up-front investment in resources and manufacturing facilities is necessary to meet the
requests of rapidly changing domestic and overseas markets for products and shorter delivery times. Furthermore,
the Group has established a manufacturing structure that can flexibly respond to the changing demands of its
customers. Should an unforeseen change in demand occur, however, there exists the possibility of a delay in the
supply of products or a rise in product cost.
13
(4) Foreign Exchange Transactions
The Group is engaged in the business of providing products to various regions within the global market, namely
North America, Europe, Asia and other countries. To this end, the Group hedges against the risk of change in
foreign exchange rates through foreign exchange contracts, but realizes the impossibility of removing all such risk.
Also, local-currency denominated items including the consolidated sales, expenses and assets of subsidiary
companies located in the United States and the Netherlands are converted into yen for the purpose of creating
consolidated financial statements, and may therefore be affected by the fluctuation of foreign exchange rates.
The Group is subject to a variety of other risks that have not been stated above, which is in no way an
exhaustive listing of all such risks.
14
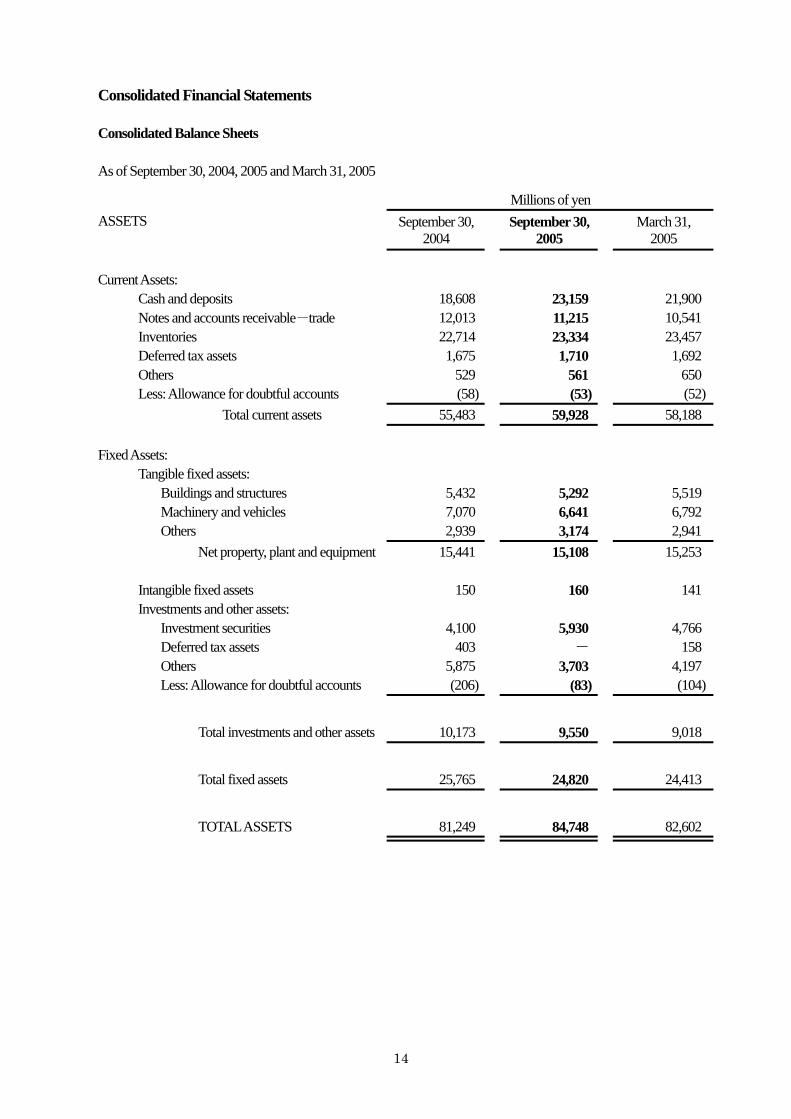
Consolidated Financial Statements Consolidated Balance Sheets As of September 30, 2004, 2005 and March 31, 2005
Millions of yen ASSETS September 30,
2004 September 30,
2005 March 31,
2005 Current Assets:
Cash and deposits 18,608 23,159 21,900 Notes and accounts receivable-trade 12,013 11,215 10,541 Inventories 22,714 23,334 23,457 Deferred tax assets 1,675 1,710 1,692 Others 529 561 650 Less: Allowance for doubtful accounts (58) (53) (52) Total current assets 55,483 59,928 58,188 Fixed Assets: Tangible fixed assets: Buildings and structures 5,432 5,292 5,519 Machinery and vehicles 7,070 6,641 6,792 Others 2,939 3,174 2,941 Net property, plant and equipment 15,441 15,108 15,253 Intangible fixed assets 150 160 141 Investments and other assets: Investment securities 4,100 5,930 4,766 Deferred tax assets 403 - 158 Others 5,875 3,703 4,197 Less: Allowance for doubtful accounts (206) (83) (104)
Total investments and other assets 10,173 9,550 9,018
Total fixed assets 25,765 24,820 24,413
TOTAL ASSETS 81,249 84,748 82,602
15
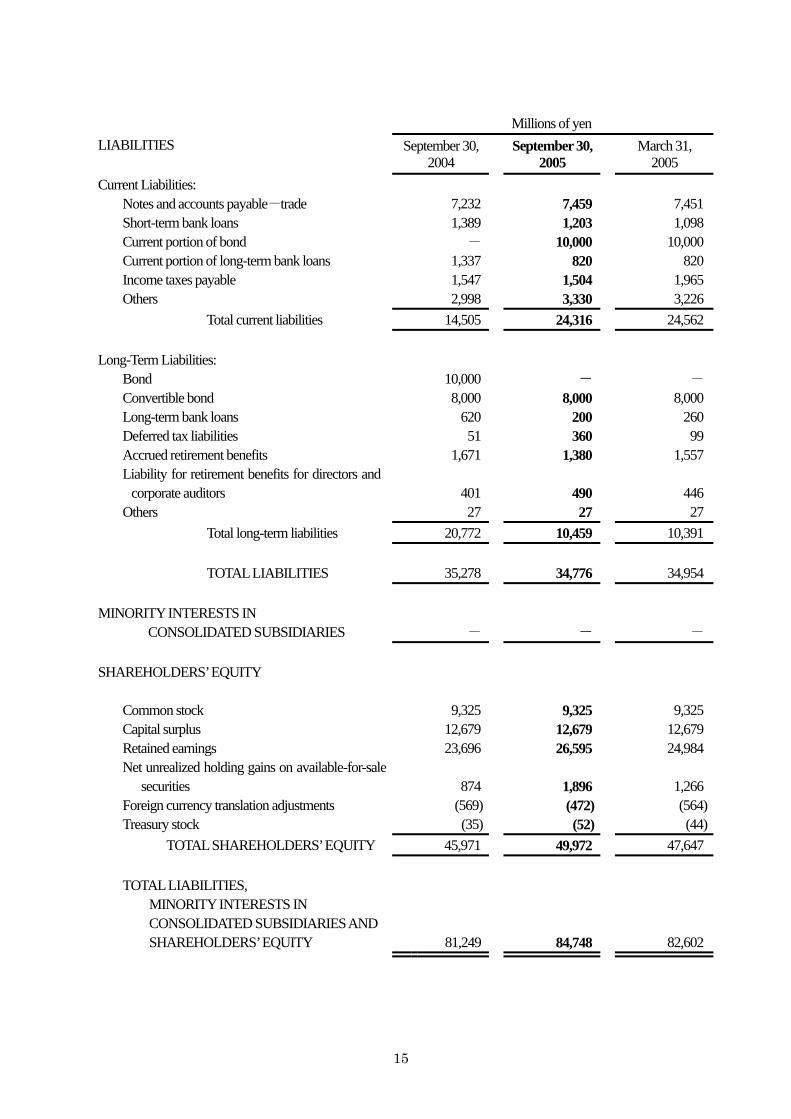
Millions of yen LIABILITIES September 30,
2004 September 30,
2005 March 31,
2005 Current Liabilities: Notes and accounts payable-trade 7,232 7,459 7,451 Short-term bank loans 1,389 1,203 1,098 Current portion of bond - 10,000 10,000 Current portion of long-term bank loans 1,337 820 820 Income taxes payable 1,547 1,504 1,965 Others 2,998 3,330 3,226 Total current liabilities 14,505 24,316 24,562 Long-Term Liabilities: Bond 10,000 - -
Convertible bond 8,000 8,000 8,000 Long-term bank loans 620 200 260 Deferred tax liabilities 51 360 99 Accrued retirement benefits 1,671 1,380 1,557 Liability for retirement benefits for directors and
corporate auditors 401 490
446 Others 27 27 27 Total long-term liabilities 20,772 10,459 10,391
TOTAL LIABILITIES 35,278 34,776
34,954 MINORITY INTERESTS IN
CONSOLIDATED SUBSIDIARIES -
- -
SHAREHOLDERS’ EQUITY Common stock 9,325 9,325 9,325 Capital surplus 12,679 12,679 12,679 Retained earnings 23,696 26,595 24,984 Net unrealized holding gains on available-for-sale
securities 874 1,896
1,266 Foreign currency translation adjustments (569) (472) (564) Treasury stock (35) (52) (44) TOTAL SHAREHOLDERS’ EQUITY 45,971 49,972 47,647 TOTAL LIABILITIES,
MINORITY INTERESTS IN CONSOLIDATED SUBSIDIARIES AND SHAREHOLDERS’ EQUITY 81,249 84,748
82,602

16
Consolidated Statements of Income For the six-month periods ended September 30, 2004 and 2005, and the year ended March 31, 2005 Millions of yen
September 30,2004
September 30, 2005
March 31, 2005
Net sales 23,184 22,037 43,934Cost of sales 14,752 13,902 28,167 Gross profit 8,431 8,135 15,767Selling, general and administrative expenses 4,418 4,554 8,983 Operating income 4,013 3,581 6,783 Non-operating income: 107 133 280Non-operating expenses: 198 189 415 Ordinary income 3,922 3,524 6,648 Extraordinary income: 36 - 61Extraordinary losses: 50 - 41 Income before income taxes 3,908 3,524 6,669Income taxes: Current 1,605 1,426 2,703 Deferred - - 41 Net income 2,302 2,098 3,924
17
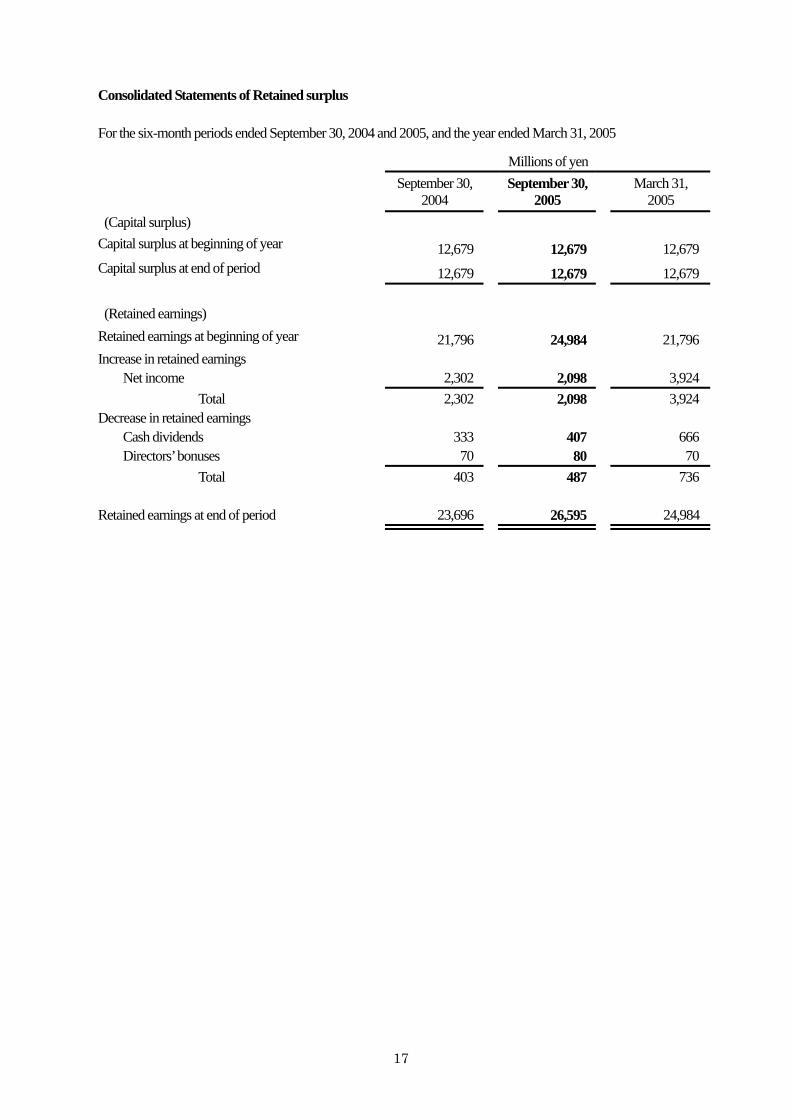
Consolidated Statements of Retained surplus For the six-month periods ended September 30, 2004 and 2005, and the year ended March 31, 2005 Millions of yen September 30,
2004 September 30,
2005 March 31,
2005 (Capital surplus)
Capital surplus at beginning of year 12,679 12,679 12,679Capital surplus at end of period 12,679 12,679 12,679 (Retained earnings)
Retained earnings at beginning of year 21,796 24,984 21,796Increase in retained earnings
Net income 2,302 2,098 3,924Total 2,302 2,098 3,924
Decrease in retained earnings Cash dividends 333 407 666Directors’ bonuses 70 80 70
Total 403 487 736 Retained earnings at end of period 23,696 26,595 24,984

18
Consolidated Statements of Cash Flows For the six-month periods ended September 30, 2004 and 2005, and the year ended March 31, 2005 Millions of yen September 30,
2004 September 30,
2005 March 31, 2005
Cash Flows from Operating Activities: Income before income taxes 3,908 3,524 6,669 Depreciation and amortization 1,180 1,118 2,416 Interest and dividend income (30) (49) (63) Interest expenses 121 82 219 Increase in notes and accounts
receivable-trade (1,560) (679) (58) Decrease in inventories 709 76 88 Increase in notes and accounts
payable-trade 842 62 936 Others-net (103) 23 (138) Subtotal 5,067 4,159 10,068 Interest and dividend income received 30 49 63 Interest paid (121) (81) (220) Income taxes paid (1,524) (1,906) (2,247) Net cash provided by operating activities 3,452 2,220 7,664 Cash Flows from Investing Activities: Payments for purchase of property, plant
and equipment (675) (1,013) (1,667) Others-net (916) 345 674 Net cash used in investing activities (1,592) (667) (992) Cash Flows from Financing Activities: Net increase in short-term bank loans 366 120 95 Proceeds from issuance of long-term bank loan - - 400 Repayments of long-term bank loans (1,887) (60) (3,165) Cash dividends paid (333) (406) (667) Others-net (4) (8) (13) Net cash used in financing activities (1,859) (354) (3,349) Foreign currency translation adjustments on cash and
cash equivalents 7
62 (23) Net increase in cash and cash equivalents 7 1,259 3,300
Cash and cash equivalents at beginning of year 18,600 21,900 18,600
Cash and cash equivalents at end of period 18,608 23,159 21,900
19
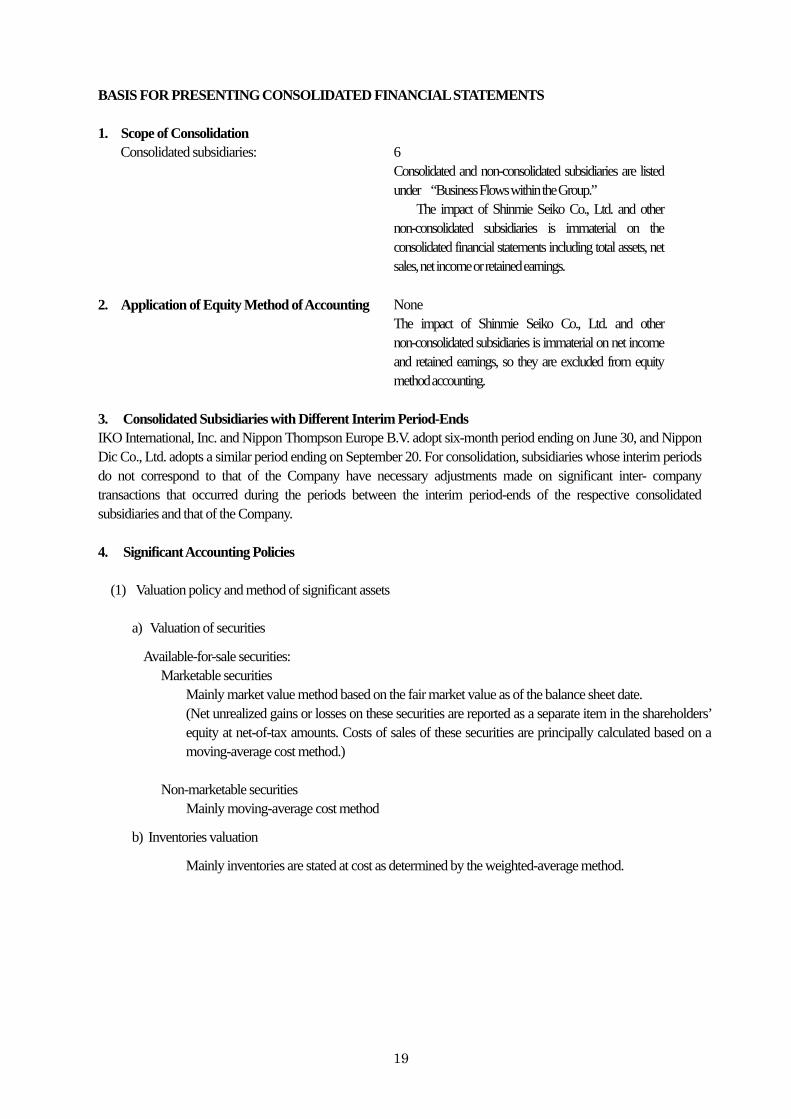
BASIS FOR PRESENTING CONSOLIDATED FINANCIAL STATEMENTS 1. Scope of Consolidation
Consolidated subsidiaries: 6 Consolidated and non-consolidated subsidiaries are listed under “Business Flows within the Group.” The impact of Shinmie Seiko Co., Ltd. and other non-consolidated subsidiaries is immaterial on the consolidated financial statements including total assets, net sales, net income or retained earnings.
2. Application of Equity Method of Accounting None
The impact of Shinmie Seiko Co., Ltd. and other non-consolidated subsidiaries is immaterial on net income and retained earnings, so they are excluded from equity method accounting.
3. Consolidated Subsidiaries with Different Interim Period-Ends IKO International, Inc. and Nippon Thompson Europe B.V. adopt six-month period ending on June 30, and Nippon Dic Co., Ltd. adopts a similar period ending on September 20. For consolidation, subsidiaries whose interim periods do not correspond to that of the Company have necessary adjustments made on significant inter- company transactions that occurred during the periods between the interim period-ends of the respective consolidated subsidiaries and that of the Company. 4. Significant Accounting Policies
(1) Valuation policy and method of significant assets
a) Valuation of securities
Available-for-sale securities: Marketable securities
Mainly market value method based on the fair market value as of the balance sheet date. (Net unrealized gains or losses on these securities are reported as a separate item in the shareholders’ equity at net-of-tax amounts. Costs of sales of these securities are principally calculated based on a moving-average cost method.)
Non-marketable securities
Mainly moving-average cost method
b) Inventories valuation
Mainly inventories are stated at cost as determined by the weighted-average method.
20
(2) Depreciation method of significant depreciable assets
Tangible fixed assets: Mainly declining-balance method
Intangible fixed assets:
Straight-line method
The software used in the Company is depreciated using the straight-line method with an effective life of five years of mainly internal usability.
(3) Calculation method of significant allowances
a) Allowance for doubtful accounts The Company and consolidated subsidiaries principally provide the allowance for doubtful accounts by the method that uses the percentage of its own actual experience of bad-debt loss written off against the balance of general receivables, plus the amount deemed necessary to cover individual accounts estimated to be uncollectible.
b) Accrued retirement benefits
Pension and severance costs for employees are principally accrued on the estimates of the pension obligations and the plan assets at the end of the current interim term. The actuarial difference is amortized for three years using the straight-line method from the fiscal year when the difference was generated.
c) Liability for retirement benefits for directors and corporate auditors The Company’s provision of retirement benefits for directors and corporate auditors is determined based on its pertinent rules, which are calculated as the estimated amount to be paid if all directors and corporate auditors retired at each balance-sheet date.
(4) Rules for conversion of outstanding foreign-currency-denominated assets or liabilities into Japanese yen
Monetary claims or debt denominated in a foreign currency are converted to Japanese yen according to the spot exchange rate, usually at the interim closing date. The difference arising from the conversion is treated as a deductible expense. Assets and liabilities of overseas subsidiaries are converted into yen by the spot exchange rate on the interim closing dates of subsidiaries; earnings and expenses are converted into yen by using average market rates during the period. The difference arising from the conversion is added to the “Foreign currency translation adjustments” under shareholders’ equity.
(5) Accounting method of significant lease transactions
Finance lease transactions of the Company and the Domestic Consolidated Subsidiaries, except for lease items of which the title is recognized as moving to the borrower, are accounted for based on regular lease contracts.The Overseas Consolidated Subsidiaries’ lease transactions are accounted for based on regular marketable contract.
(6) Accounting method of significant hedge transactions
To those exchange contracts that meet the requirements for appropriation, appropriation treatment is applied. To those interest rate swaps that meet the requirements for exceptional treatment, exceptional treatment is applied.
21
(7) Accounting method of consumption tax and local consumption tax
Consumption tax and local consumption tax are accounted for by the tax-exclusion method. 5. Nature of Fund on Interim Consolidated Statements of Cash Flows
The fund (cash and cash equivalents) consists of cash on hand, and deposits that can be easily withdrawn and converted to cash with maturity within three months of its acquisition date.
CHANGES IN ACCOUNTING METHOD Fixed asset impairment accounting standard
Effective this interim fiscal year, the Company and Domestic Consolidated Subsidiaries adopted the Accounting Standard Concerning Fixed Asset Impairment (Statement of Position Concerning Establishment of Fixed Asset Impairment Accounting Standard by the Business Accounting Council on August 9, 2002) and the Application Guideline for Fixed Asset Impairment Accounting Standard (Business Accounting Standard Board, Accounting Standard Application Guideline No.6, October 31, 2003).
The effect of these changes is minor.
22
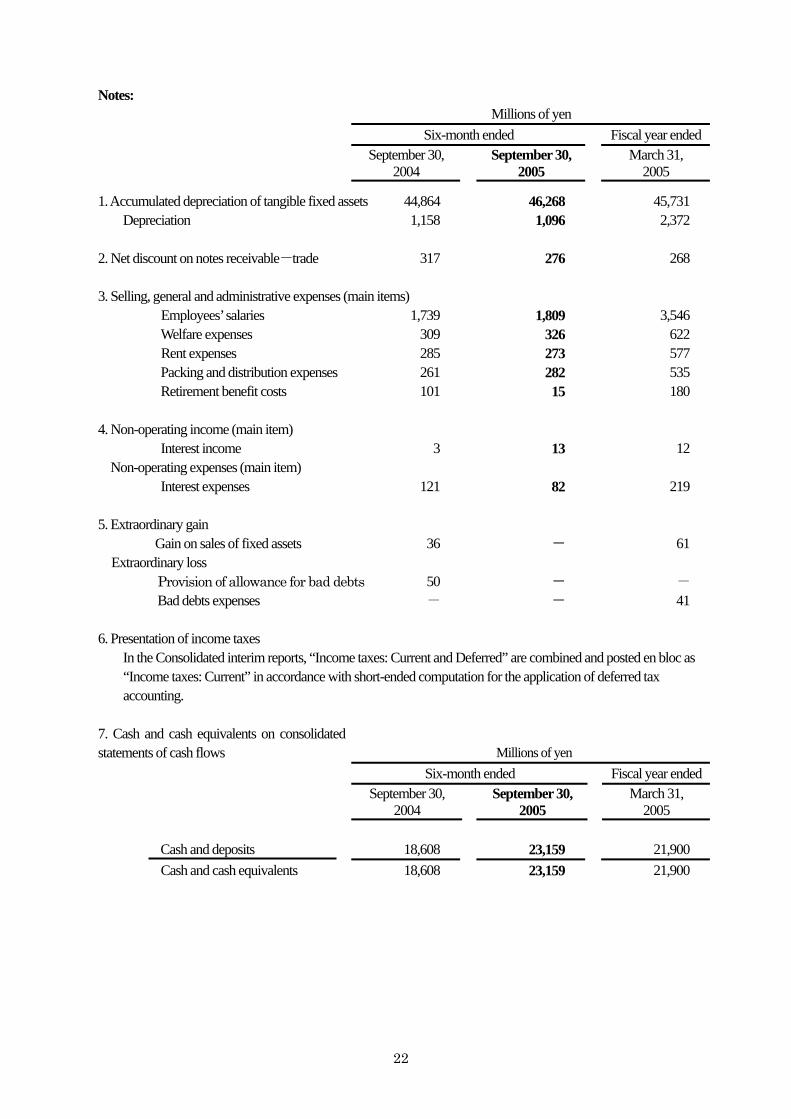
Notes: Millions of yen Six-month ended Fiscal year ended September 30,
2004 September 30,
2005 March 31, 2005
1. Accumulated depreciation of tangible fixed assets 44,864 46,268 45,731 Depreciation 1,158 1,096 2,372
2. Net discount on notes receivable-trade 317 276 268 3. Selling, general and administrative expenses (main items)
Employees’ salaries 1,739 1,809 3,546 Welfare expenses 309 326 622 Rent expenses 285 273 577 Packing and distribution expenses 261 282 535 Retirement benefit costs 101 15 180
4. Non-operating income (main item) Interest income 3 13 12
Non-operating expenses (main item) Interest expenses 121 82 219
5. Extraordinary gain Gain on sales of fixed assets 36 - 61
Extraordinary loss Provision of allowance for bad debts 50 - - Bad debts expenses - - 41
6. Presentation of income taxes
In the Consolidated interim reports, “Income taxes: Current and Deferred” are combined and posted en bloc as “Income taxes: Current” in accordance with short-ended computation for the application of deferred tax accounting.
7. Cash and cash equivalents on consolidated statements of cash flows Millions of yen
Six-month ended Fiscal year ended September 30,
2004 September 30,
2005 March 31, 2005
Cash and deposits 18,608 23,159 21,900 Cash and cash equivalents 18,608 23,159 21,900
23
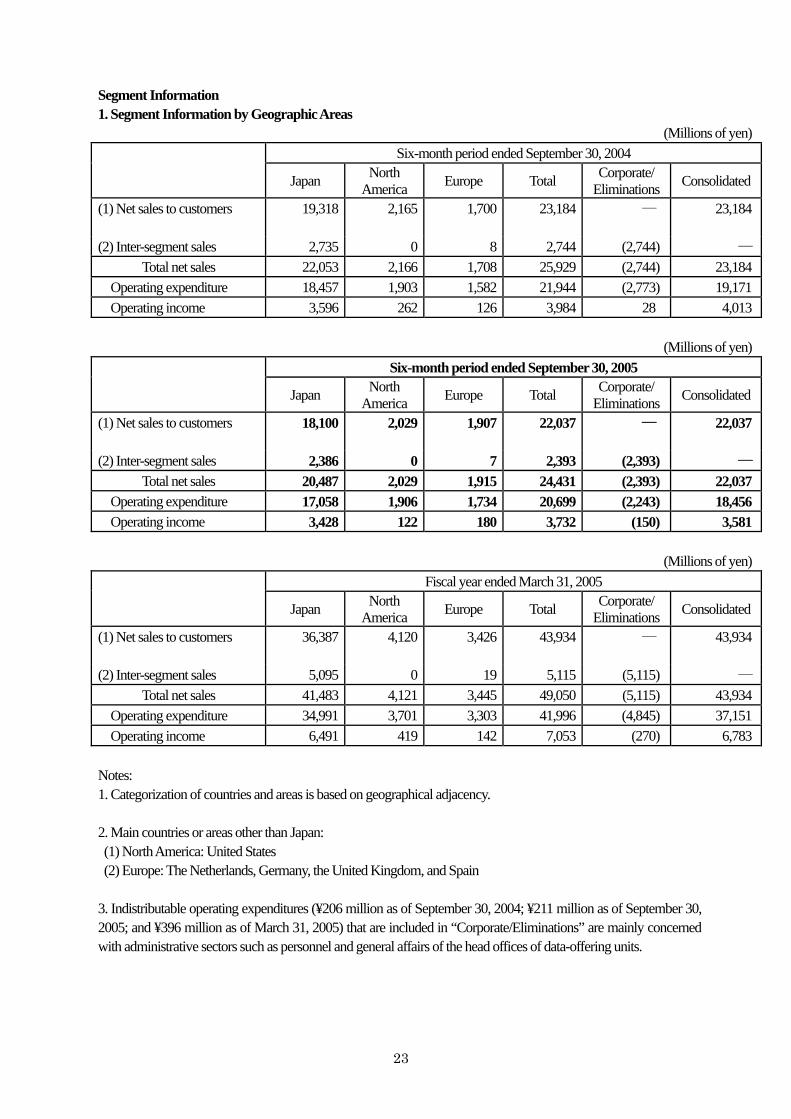
Segment Information 1. Segment Information by Geographic Areas (Millions of yen) Six-month period ended September 30, 2004 Japan North
America Europe Total Corporate/ Eliminations Consolidated
(1) Net sales to customers
19,318 2,165 1,700 23,184 ― 23,184
(2) Inter-segment sales 2,735 0 8 2,744 (2,744) ―
Total net sales 22,053 2,166 1,708 25,929 (2,744) 23,184Operating expenditure 18,457 1,903 1,582 21,944 (2,773) 19,171Operating income 3,596 262 126 3,984 28 4,013
(Millions of yen) Six-month period ended September 30, 2005 Japan North
America Europe Total Corporate/ Eliminations Consolidated
(1) Net sales to customers
18,100 2,029 1,907 22,037 ― 22,037
(2) Inter-segment sales 2,386 0 7 2,393 (2,393) ―
Total net sales 20,487 2,029 1,915 24,431 (2,393) 22,037Operating expenditure 17,058 1,906 1,734 20,699 (2,243) 18,456Operating income 3,428 122 180 3,732 (150) 3,581
(Millions of yen) Fiscal year ended March 31, 2005 Japan North
America Europe Total Corporate/ Eliminations Consolidated
(1) Net sales to customers
36,387 4,120 3,426 43,934 ― 43,934
(2) Inter-segment sales 5,095 0 19 5,115 (5,115) ―
Total net sales 41,483 4,121 3,445 49,050 (5,115) 43,934Operating expenditure 34,991 3,701 3,303 41,996 (4,845) 37,151Operating income 6,491 419 142 7,053 (270) 6,783
Notes: 1. Categorization of countries and areas is based on geographical adjacency. 2. Main countries or areas other than Japan: (1) North America: United States (2) Europe: The Netherlands, Germany, the United Kingdom, and Spain
3. Indistributable operating expenditures (¥206 million as of September 30, 2004; ¥211 million as of September 30, 2005; and ¥396 million as of March 31, 2005) that are included in “Corporate/Eliminations” are mainly concerned with administrative sectors such as personnel and general affairs of the head offices of data-offering units.
24
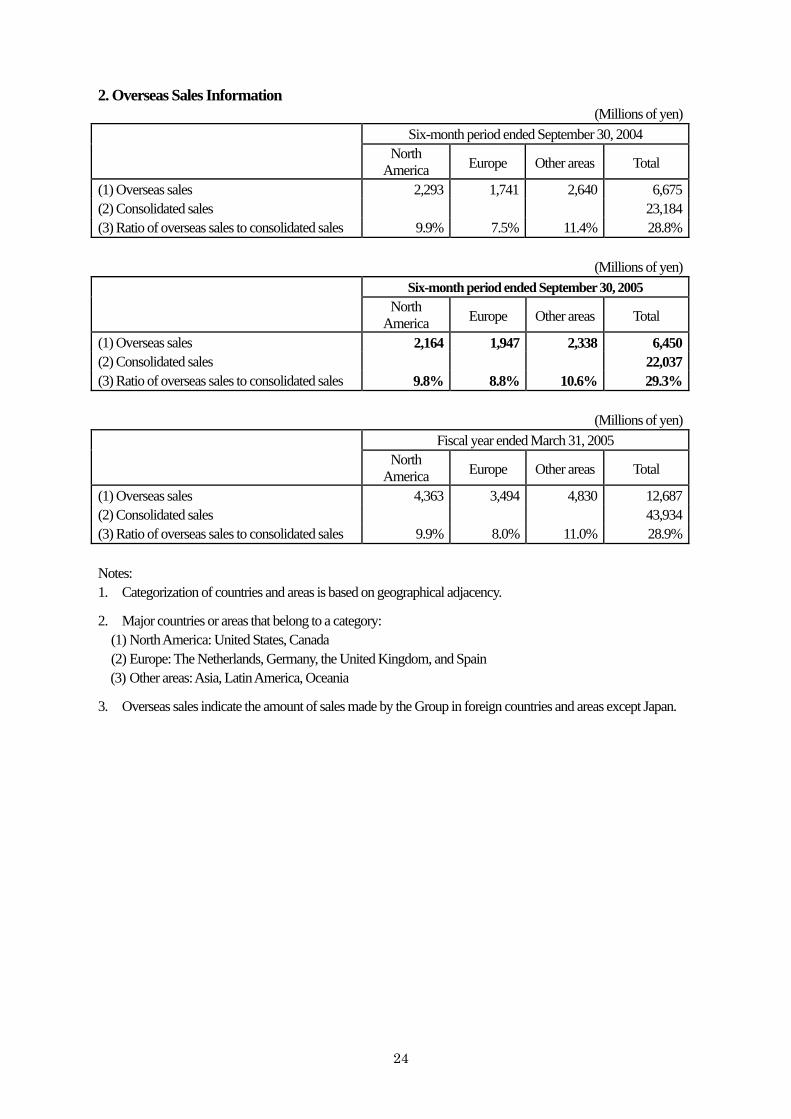
2. Overseas Sales Information
(Millions of yen) Six-month period ended September 30, 2004 North
America Europe Other areas Total
(1) Overseas sales 2,293 1,741 2,640 6,675(2) Consolidated sales 23,184(3) Ratio of overseas sales to consolidated sales 9.9% 7.5% 11.4% 28.8%
(Millions of yen) Six-month period ended September 30, 2005 North
America Europe Other areas Total
(1) Overseas sales 2,164 1,947 2,338 6,450(2) Consolidated sales 22,037(3) Ratio of overseas sales to consolidated sales 9.8% 8.8% 10.6% 29.3%
(Millions of yen) Fiscal year ended March 31, 2005 North
America Europe Other areas Total
(1) Overseas sales 4,363 3,494 4,830 12,687(2) Consolidated sales 43,934(3) Ratio of overseas sales to consolidated sales 9.9% 8.0% 11.0% 28.9% Notes: 1. Categorization of countries and areas is based on geographical adjacency.
2. Major countries or areas that belong to a category: (1) North America: United States, Canada (2) Europe: The Netherlands, Germany, the United Kingdom, and Spain (3) Other areas: Asia, Latin America, Oceania
3. Overseas sales indicate the amount of sales made by the Group in foreign countries and areas except Japan.

25
Lease Transactions Millions of yen September 30,
2004 September 30,
2005 March 31, 2005
Equipment and other assets: Acquisition cost 133 96 110Accumulated depreciation 88 72 76Net book value
45 24 34
Future lease payments: Within one year 21 14 18Over one year 24 9 15
Total 45 24 34 Lease expenses:
(Equivalent amount of depreciation expenses) 13 9 25 Computation of amount corresponding to
depreciation expenses: Straight-line method Note: Because the net book value of future lease payments represents only a small portion of the net book value of tangible fixed assets, acquisition costs and the net book value of future lease payments are calculated to include the amount representing interest. Securities Millions of yen
September 30, 2004
September 30, 2005 March 31,
2005 Available-for-Sale Securities: Stocks Acquisition cost 1,886 1,989 1,888 Book value 3,363 5,194 4,030 Unrealized gain 1,477 3,204 2,141 Book values of securities without market value Other securities Non-listed shares (except OTC shares) Book value 610 610 610
Derivative transactions
There are no applicable articles.
26
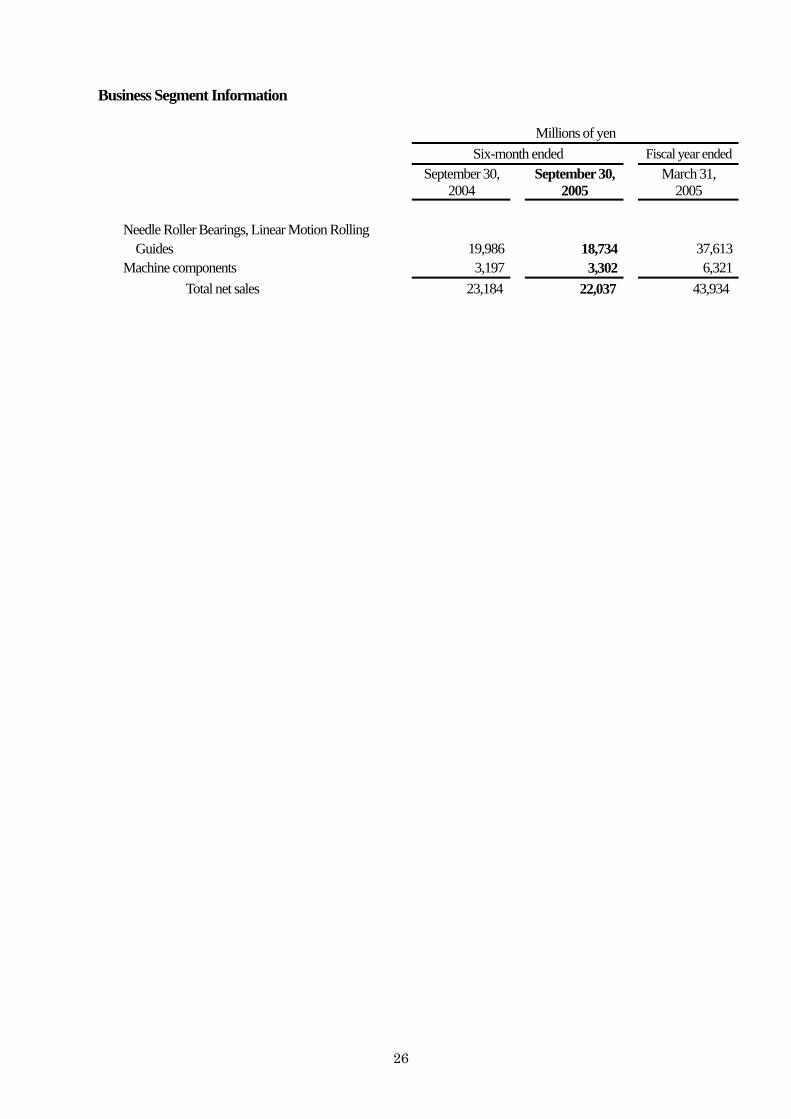
Business Segment Information Millions of yen Six-month ended Fiscal year ended September 30,
2004 September 30,
2005 March 31, 2005
Needle Roller Bearings, Linear Motion Rolling
Guides 19,986 18,734 37,613Machine components 3,197 3,302 6,321
Total net sales 23,184 22,037 43,934