considering the validity of test score inferences for
TRANSCRIPT
1
Considering the Validity of Test Score Inferences for English Language Learners with Limited Proficiency Using Language
Liaisons and Other Accommodations
Heather Mann Jessica Emick Ming-yi Cho
Rebecca Kopriva
March, 2006
Paper presented at the Annual Conference of the American Educational Research Association Conference, March 2006, San Francisco, CA

2
Including English language learners (ELLs) and students with disabilities in
statewide and district testing is currently a top priority among educators at the national,
state, and local level (Abedi, 2004). Schools in the United States face a growing number
of ELLs who come from many different linguistic and cultural backgrounds. Zehler,
Fleischman, Hopstock, Stephenson, Pendzick, and Sapru (2003) reported that the United
States Department of Education identified approximately four million students as limited
English proficient (LEP), representing 8.4% of total school enrollment with a 71.9%
growth rate over the past ten years in the United States. Additionally, Title III of the No
Child Left Behind Act of 2001 (NCLB) specified state accountability for ELLs’ progress
toward English proficiency and in meeting the same challenging academic content
standards as their native English-speaking peers (Public Law 107-110). The increased
emphasis on accountability for all students and new regulations requiring disaggregated
student data, including data by ELL status, has called for the development of state
assessment policies that ensure the inclusion of ELLs. Further, in response to the federal
regulations, states are considering the best way to validly and reliably include ELL
students in the assessment process. The most commonly used method of including ELLs
in state assessments is to offer accommodations. The current NCLB legislation allows
reasonable accommodations for ELLs if the accommodations do no compromise the
reliability of test scores and the validity of the inferences made from them (Public Law
107-110).
Traditionally, accommodations have only been considered in general categories
that include presentation (e.g. test forms and test materials), administration (e.g. setting

3
and scheduling), and responding (e.g. writing or dictating answers) (Hollenbeck, 2002).
Samuelson and Kopriva (2004) suggest tools as a distinct category and recently it has
become evident that a broader range of accommodation options is necessary to meet the
needs of diverse students (Samuelson & Carr, 2004; Koran, Kopriva, Emick, Monroe,
Webb, Walker & Garavaglia, 2006). An interdisciplinary review of the literature
underscores the immense range of linguistic and cultural attributes and diverse needs of
students (Monroe, 2004). However, issues of cultural discontinuities that may affect the
testing of ELLs have received less attention than language differences. Additionally, the
main focus of assessment researchers has been to identify and study the impact of those
accommodations that are most relevant to the entire range of English proficiency.
Moreover, little work has been done to understand how best to include students who have
little English language proficiency and cultural familiarity with the practices of testing
used routinely in U.S. schools.
In general, there is a growing body of research attempting to validate (or
invalidate) accommodation use. Although the research focus on accommodation use has
been mostly related to students with disabilities (Fuchs & Fuchs, 1999; Tindal &
Halandyna, 2002), since the late 1990s there has been a dramatic increase in research on
culturally or linguistically diverse students and accommodations. However, the current
results are inconclusive due, in part, to the complexity of issues surrounding appropriate
accommodations for students with specific needs (Kopriva, 2005) to the varying levels of
construct analysis, and how accommodation research is conducted (e.g., individual
accommodations vs. packages of accommodations) (Tindal & Ketterlin-Geller, 2003;
Kopriva & Mislevy, 2001).

4
This study investigates the impact of individualized accommodation packages that
include the use of language liaisons on the validity of test score inferences for ELLs. A
language liaison is a novel accommodation in which a trained resource person, who is
familiar with the culture of the students, the school, and the testing culture, provides
narrowly defined support in the primary language of the student. The accommodation is
specifically developed to help more accurately assess the knowledge of students with
very low levels of English proficiency whose score inferences are otherwise invalid due
to both linguistic and cultural differences. Specifically, this study 1) addresses whether
the use of language liaisons for low ELL students holds promise in allowing scores to
more accurately reflect their ability and 2) investigates the impact of individualized
accommodation packages on the validity of scores for various levels of ELLs and non-
ELLs.
Education and Culture
Education is a cultural mechanism (Bourdieu, 2003) whereby much of culture is
transmitted though education. The broadness and complexity of the concept of culture
contributes to the difficulty of using it in a methodologically sound manner in the
classroom and in educational research. Cultural codes include subtle traits and ways of
communicating that often go unrecognized by people of other cultures. Understanding
the role of culture in education is crucial to providing a fair and inclusive learning
environment. Despite the relative paucity of research on culture in education, studies
have shown that culture influences what and when children learn and how they learn it.
(e.g., Heath, 1982; Tharp 1994; Tobin, Wu, & Davidson 1989; Wang, Bernas, &

5
Eberhard 2002). On the other hand, the relationship between language proficiency and
learning has been relatively better documented. For example, in a review of studies of
language and cognition, August and Hakuta (1997) conclude that issues involving
knowledge transfer and accessibility of content learned in L1 make it difficult to provide
high-quality instruction for English language learners.
Farr and Trumbull (1997) suggest that the culture of the U.S. education system is
predominantly that of mainstream and middle-class U.S. culture that has its roots in
European-American history and values. Further, they and others (e.g. August & Hakuta,
1997; Solano-Flores & Trumbull, 2003) argue that the language and cultural assumptions
of large scale tests reflect this mainstream culture. As such, students from non-dominant
cultural groups, regardless of whether they were born in the United States or in another
country, may either not be represented in test results because they were exempt, or
receive scores that do not reflect what they know because of an inability to access or
process what is being measured.
Kopriva (2000) explains that cultural discontinuities may cause
misunderstandings if test developers assume prior experiences or a value system more
prevalent among students who have grown up in the U.S. Kopriva (2000) writes that
“students read an item based on their values and experiences and the values and
experiences prevalent in their culture. Since values and experiences of the students’
native culture and the U.S. culture may be dissimilar, there is room for
misinterpretation.”
Improvements in standardized achievement assessments, for instance plain
language editing, bilingual word list or dictionary, or oral administration, seem to impact

6
broad swaths of ELLs (e.g. Abedi, 2001; Abedi, Lord, Boscardin, and Miyoshi, 2000).
However, variable needs suggest that other accommodations, such as language liaisons,
may also be necessary for some students to best demonstrate what they know. The
concept of language liaison grew out of the literature supporting the use of a cultural
broker. A cultural broker was originally defined in the anthropological literature during
the early 1970s, as an individual who mediated a business deal or transaction, but it
recent years the definition has expanded to include individuals who are used in schools
with high ELL populations (Monroe, 2004). Gay (2003) writes that “a cultural broker is
one who thoroughly understands different cultural systems, is able to interpret cultural
systems from one frame of reference to another, can mediate cultural incompatibilities,
and knows how to build bridges or establish linkages across cultures that facilitate the
instructional process.” Although there has been little empirical support for or against the
use of cultural brokers in the context of assessing an increasingly diverse body of
individuals, it would be expected that more cultural disconnect would occur and require
mediation (Michie, 2004).
In the late 1990s, a popular approach to bridging this disconnect in large scale
testing was the use of educational support staff fluent in the student’s primary language
but who generally received little to no formal training (Kopriva, 1996). Lack of training
and oversight, however, led to concerns about unfair advantages during testing, and, since
these allegations, the use of such personnel has largely fallen out of use (Emick, 2005; M.
Malagon, personal communication, December 2002). Recently, though, because of the
focus on the inclusion of all students, specifically students with the lowest English
proficiency and substantial cultural discontinuities, concern about the validity of score

7
inferences for these vulnerable populations has resurfaced. With this concern in mind,
the concept of having a trained support person (a.k.a. language liaison) available to
provide very particular and specific assistance to new students with little English
proficiency and great cultural discontinuities has again been considered. These language
liaisons would be available to read test directions in the student’s primary language,
provide narrowly defined linguistic support during the test, and answer questions about
phrases, concepts, and other item tasks that are difficult to define in a glossary and not
connected to the targeted constructs being measured on the tests.
Method
The Valid Assessment of English Language Learners (VAELL) project included a
broad investigation that assessed approximately 3,635 third- and fifth-grade students,
including several hundred ELL students, who varied in language of origin, language
acquisition status, other language development variables (e.g., length of time in country),
level of reading, writing and mathematics achievement, and demographic characteristics
(Kopriva & Mislevy, 2001). Teachers of participating students completed a questionnaire
concerning each student’s participation in educational services, learning strengths and
challenges, use of strategies in mathematics problem solving, assessment experiences,
mathematics knowledge specifically keyed to the items used, English language arts skills,
and factors that are hypothesized to either support or inhibit student access in testing
math content. Further, teachers were asked to rate on a three-point scale (rarely,
sometimes, almost always) how often students successfully demonstrated knowledge and
skills of particular mathematics construct elements that would be appearing in the test

8
items. For instance, for third-graders, one question asked teachers to rate prevalence of
classroom performance on the following element: This student can solve a word problem
involving a solution requiring subtraction with regrouping.
For the purposes of this study, students participated in a district wide mathematics
test that included 11 multiple choice items and 8 constructed-response items. These
items were rewritten versions of state released mathematics items, designed to measure
the same mathematics constructs but provide more access for students with less
proficiency (e.g., shorter sentences, modified vocabulary, more accessible problem
contexts, clearer formatting, use of pictures/graphic organizers, etc.).
Some students, particularly ELLs and poor readers, received individualized sets of
accommodations, assigned to them on the basis of school records data and teacher
identification of student challenges. Accommodations that were variously assigned
included a word-picture list in English, a Spanish-English glossary, use of manipulatives,
oral administration in English, small-group administration, and access to a language
liaison. Language liaisons were provided for identified Spanish speaking students only.
As defined in this study, a language liaison is an adult proficient in Spanish who
reads test instructions in Spanish and is available to answer certain narrowly defined
questions in Spanish. The language liaison was trained to address certain language tasks
that did not threaten the validity of the target constructs and was instructed not to provide
an on-the-fly translation. Language liaisons were recruited for the large-scale research
study through advertisements in local papers and to the university community (e.g.,
email, flyers, etc). The individuals that were recruited were very diverse, ranging in age
and gender. Their experience ranged from ELL teachers to university students and

9
language staff, to community members with minimal formal education. Language
liaisons had to complete an application process, including a background check, and attend
a three-hour training session focusing on the principles of test administration and
explicitly defining their role as language liaisons. For instance, one portion of training
included listing and discussing what language liaisons could and could not do. Another
consisted of interactive role-playing of testing situations that could provide students with
unfair advantages. The training was developed in collaboration with a local ELL expert
with significant classroom experience. Twenty individuals were ultimately chosen to
serve as language liaisons to test-takers with low English proficiency or lack of cultural
familiarity.
Qualitative and formal observations about the selection, training, and oversight of
language liaisons indicated that a certain amount of base knowledge is required about
U.S. testing culture and educational practices (e.g., the language liaisons themselves
could not have a cultural disconnect with U.S. testing practices). This base knowledge
was above and beyond what could be presented during a single training session. Although
the language liaisons were screened for oral proficiency in Spanish, our results indicated
that it was also necessary to screen for their literacy in English. Finally, it was also clear
that this accommodation should be practiced in the classroom prior to the assessment.
This provides the student with the opportunity to understand the role of the language
liaison and fully utilize their presence on the day of the test.
Upon successful completion of the training, and demonstrating oral proficiency in
Spanish and oral as well as written proficiency in English, language liaisons provided
defined support for Spanish-speaking 3rd (n=110) and 5th (n=78) graders with low English

10
literacy and cultural considerations during the large scale administration. Other Spanish-
speaking and non-Spanish-speaking ELL students with low English literacy and cultural
disconnect received oral administration in English in lieu of a language liaison.
All test administrations involving language liaisons were tape-recorded, as were a
sample of the oral administrations. The language liaison sessions were tape recorded to
ensure treatment integrity and for research purposes. Additionally, the language liaisons
completed a behavioral observation form during the session and were overseen by trained
staff members on site. This enabled the researchers to monitor for any cueing of students
by test administrators.
Based on other identified needs and challenges, all participants were screened to
determine specific accommodation needs. Students could receive no accommodations, a
single accommodation, or a combination of several accommodations in a package. All
students were assigned the accommodations deemed essential to their ability to access the
test, within the logistical constraints (e.g., language liaisons were offered for Spanish
speakers only; no L1 oral administrations were conducted; staff ratios did not allow for
individual administrations). A trained team leader circulated in each building to
troubleshoot and ensure fidelity of test administration. Observation forms completed by
the test administrators were reviewed to determine the extent of accommodations usage
among students and to note any other incidents that might affect the accuracy of test
results.
Research Design and Analysis Approach

11
For this study, we defined three groups of ELL students (beginning, intermediate,
and advanced) and two additional groups (exited ELL and non-ELL) within both grades 3
and 5. Analyses were designed to assess the two research questions discussed above.
For each question, a description of the research design and analysis approach is described
below. Two analyses, A and B, were designed to answer question one and a single
analysis plan was developed for question two.
Question 1: Does the use of language liaisons for low ELL students allow scores to more
accurately reflect their ability?
Two analyses were completed to address this first question. In analysis A, all
Spanish-speaking beginning ELLs and some intermediate ELLs with low reading
received a language liaison accommodation. This group was compared to intermediate
ELLs who did not receive a language liaison accommodation because their English
reading level was sufficient. We expect that scores will be at least as high for the group
who did not get a language liaison compared with the group that did because their
reading level is higher and therefore access to content is probably higher. However, we
hypothesize that the scores should be equally valid for both groups if the language liaison
and other accommodations do in fact improve access to the test items.
In an effort to isolate the effects of language liaisons among intermediate ELLs
with low English reading proficiency, analysis B compares those who received a
language liaison accommodation to those who received oral administration in English as
a substitute. For research purposes, approximately one of every two of these students
was randomly assigned to a language liaison and the other to oral administration. Since

12
these groups are theoretically randomly equivalent, we expect the validity to be higher for
the group receiving the language liaison, indicating that language liaisons enhance access
to test items more than oral administration in English for ELL students.
Question 2: What is the impact of individualized accommodation packages on the
validity of scores for various levels of ELLs and non-ELLs?
The analysis focusing on the second research question addresses the validity of
ELLs vs. non-ELLs using all three ELL groups (beginning, intermediate, and advanced)
and both non-ELL groups (exited and non-ELL). We hypothesize that if the
individualized accommodation packages were assigned appropriately and enhance access
to the test items, the validity of test scores will be similar across all groups.
To test the validity hypotheses in questions 1 and 2, we compare the results of
regressions of the mathematics criterion teacher rating on test scores across the groups.
The coefficient for the target criterion measures the effect of the construct status on the
test score and is interpreted as a validity index demonstrating the strength to which the
target criterion discriminates the test score. The significance of the extent to which the
target beta differs from zero is analyzed with t-tests. T-tests are also used to analyze the
significance of the difference of the betas between groups in the analysis of language
liaisons and F-tests are used to test the difference in the betas among ELL groups.
Results
Frequency data and means and standard deviations of test score data for five
groups: beginning ELLs, intermediate ELLs, advanced ELLs, exited ELLS, and non-

13
ELLs, are shown in Tables 1 and 2 for grades 3 and 5. Table 3 provides means and
standard deviations of criterion mathematics teacher ratings for both grades.
Table 1: Frequency (%) of Students in Each ELL Level Grade 3 Grade 5
Beginning 52 (4.1%)
45 (3.7%)
Intermediate 197 (15.4%)
148 (12.1%)
Advanced 75 (5.9%)
55 (4.5%)
Exited 245 (19.1%)
255 (20.9%)
Non-ELL 711 (55.5%)
719 (58.8%)
N = 1280 N = 1222
Table 2: Mean and Standard Deviation of Mathematics Test Scores by ELL Level Grade 3 Grade 5
Multiple Choice
Constructed Response
Multiple Choice
Constructed Response
Beginning 3.192 (1.401)
2.154 (1.775)
3.022 (1.485)
2.244 (1.694)
Intermediate 3.832 (1.919)
2.919 (2.459)
3.757 (1.940)
4.236 (3.290)
Advanced 5.293 (2.235)
4.253 (2.853)
4.800 (2.305)
5.564 (3.553)
Exited 6.318 (2.609)
6.392 (3.524)
5.800 (2.382)
7.765 (3.919)
Non-ELL 5.899 (2.554)
5.752 (3.748)
5.809 (2.705)
6.752 (4.169)
N = 1280 N = 1222 Table 3: Mean and Standard Deviation of Criterion Mathematics Rating by Teachers by ELL Level Grade 3 Grade 5
Multiple Choice
Constructed Response
Multiple Choice
Constructed Response
Beginning 1.610 (0.520)
1.590 (0.576)
1.380 (0.477)
1.304 (0.453)
Intermediate 1.852 (0.475)
1.905 (0.514)
1.619 (0.520)
1.531 (0.513)
Advanced 2.210 (0.431)
2.256 (0.462)
1.934 (0.520)
1.837 (0.549)

14
Exited 2.391 (0.428)
2.443 (0.431)
2.249 (0.559)
2.167 (0.584)
Non-ELL 2.291 (0.499)
2.332 (0.509)
2.214 (0.572)
2.160 (0.613)
N = 1280 N = 1222
In both grades, the average target criterion and the mean test scores are higher for
exited ELLs and non-ELLs than for the three ELL groups. If English proficiency does in
fact affect opportunity to learn, it is to be expected that the math criterion and test scores
increase as ELL levels increase. The variability in the target criterion is largely
consistent across groups for multiple choice and constructed response for both grades.
Among test scores, however, variability increases as ELL level increases.
Question 1: The Impact of Language Liaisons on Beginning and Intermediate ELLs
Analysis A
Analysis A compares beginning and intermediate ELLs who got a language
liaison accommodation (Group 1) with intermediate ELLs than did not get a language
liaison and did not need it (Group 2). While we expect that scores may be higher for
Group 2 with higher reading proficiency and criterion scores, we hypothesize that
validity will be the same for both groups. Means and standard deviations of test scores
and mathematics criterion are reported in Table 4 and Table 5. In both grades, the mean
target criterion and test scores for multiple choice and constructed response are higher for
Group 2. Since students in Group 2 have higher English reading levels, opportunity to
learn may be a factor in the score and criterion differences.
Table 4: Mean and Standard Deviation of Mathematics Test Scores by Language Liaison Group (Analysis A)
Grade 3 Grade 5

15
N Multiple Choice
Constructed Response N Multiple
Choice Constructed Response
Got language Liaison (Group 1) 110 3.091
(1.469) 2.182
(1.954) 78 3.231 (1.643)
2.667 (2.087)
Didn’t get language liaison and
didn’t need it (Group 2) 69 4.264
(1.996) 3.507
(2.964) 47 4.383 (1.929)
5.851 (3.665)
Table 5: Mean and Standard Deviation of Criterion Teacher Rating by Language Liaison Group (Analysis A)
Grade 3 Grade 5
N Multiple Choice
Constructed Response N Multiple
Choice Constructed Response
Got language Liaison (Group 1) 110 1.622
(0.445) 1.646
(0.497) 78 1.365 (0.432)
1.298 (0.407)
Didn’t get language liaison and
didn’t need it (Group 2) 69 2.138
(0.422) 2.203
(0.455) 47 1.940 (0.456)
1.831 (0.468)
Results from t-tests for equality of the mean test scores across groups are reported
in Table 6. The tests are two-tailed to allow for the possibility that the accommodations
made the test easier for Group 1. As expected, the t-tests indicate that the scores on the
multiple choice and constructed response tests for Group 2 are statistically significantly
higher than for Group 1 in both grades.
Table 6: Mathematics Test Score t-test Results (Analysis A)
Equality of Variance
H0 F p Test df t p
Grade 3
Multiple Choice µ1–µ2 = 0 1.85 0.004 Satterthwaite 114 -4.16 0.000
Constructed Response µ1–µ2 = 0 2.30 0.000 Satterthwaite 105 -3.29 0.001
Grade 5 Multiple Choice µ1–µ2 = 0 1.38 0.212 Pooled 123 -3.55 0.001
16
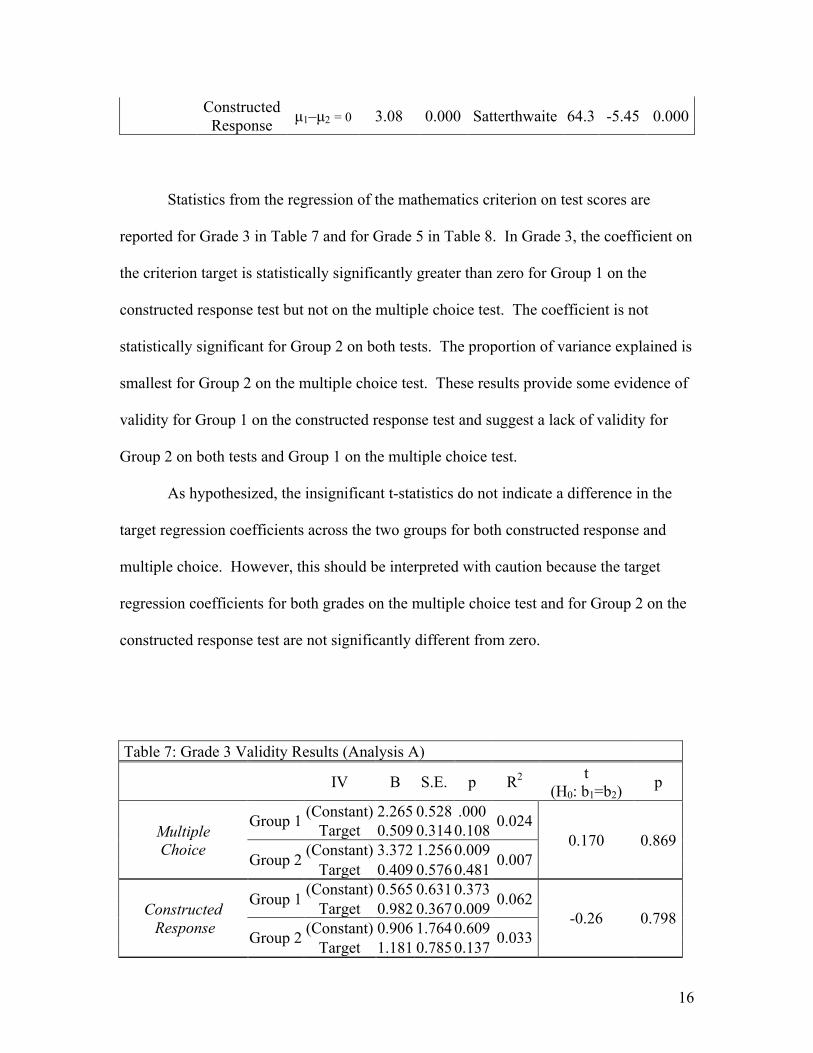
Constructed Response µ1–µ2 = 0 3.08 0.000 Satterthwaite 64.3 -5.45 0.000
Statistics from the regression of the mathematics criterion on test scores are
reported for Grade 3 in Table 7 and for Grade 5 in Table 8. In Grade 3, the coefficient on
the criterion target is statistically significantly greater than zero for Group 1 on the
constructed response test but not on the multiple choice test. The coefficient is not
statistically significant for Group 2 on both tests. The proportion of variance explained is
smallest for Group 2 on the multiple choice test. These results provide some evidence of
validity for Group 1 on the constructed response test and suggest a lack of validity for
Group 2 on both tests and Group 1 on the multiple choice test.
As hypothesized, the insignificant t-statistics do not indicate a difference in the
target regression coefficients across the two groups for both constructed response and
multiple choice. However, this should be interpreted with caution because the target
regression coefficients for both grades on the multiple choice test and for Group 2 on the
constructed response test are not significantly different from zero.
Table 7: Grade 3 Validity Results (Analysis A)
IV B S.E. p R2 t (H0: b1=b2)
p
Multiple Choice
Group 1 (Constant) 2.265 0.528 .000 0.024 Target 0.509 0.314 0.108 0.170 0.869
Group 2 (Constant) 3.372 1.256 0.009 0.007 Target 0.409 0.576 0.481
Constructed Response
Group 1 (Constant) 0.565 0.631 0.373 0.062 Target 0.982 0.367 0.009 -0.26 0.798
Group 2 (Constant) 0.906 1.764 0.609 0.033 Target 1.181 0.785 0.137

17
N = 179
For Grade 5, only the target coefficient for Group 1 on the constructed response
test is statistically greater than zero, indicating a lack of validity on the multiple choice
test for both groups and for Group 2 on the constructed response test. The proportion of
variance explained is also highest for Group 1 on the constructed response test.
As desired, t-tests of differences in the target regression coefficients between the
two groups indicate that the groups do not differ significantly on either the multiple
choice or constructed response tests. However, the interpretation of this result is
ambiguous when coupled with the statistically insignificant regression coefficients on the
multiple choice test for both groups and the constructed response test for Group 2.
Table 8: Grade 5 Validity Results (Analysis A)
IV B S.E. p R2 t (H0: b1=b2)
p
Multiple Choice
Group 1 (Constant) 2.800 0.622 0.000 0.007 Target 0.315 0.435 0.470 -0.66 0.509
Group 2 (Constant) 2.831 1.234 0.027 0.036 Target 0.800 0.619 0.203
Constructed Response
Group 1 (Constant) 0.241 0.746 0.748 0.133 Target 1.869 0.549 0.001 1.31 0.194
Group 2 (Constant) 5.184 2.198 0.023 0.002 Target 0.364 1.163 0.756 N = 125 Analysis B
Analysis B compares intermediate ELLs who received a language liaison
accommodation (LL group) with those at the same reading level who received an oral
administration in English accommodation (Oral group). Regression results are provided
below to analyze the hypothesis that validity will be higher for the LL group than for the

18
Oral group if the language liaison accommodation provides better access to the test items.
Following the validity results, analysis on test scores for the two groups is presented.
Table 9 and Table 10 display results from the regression of the mathematics
criterion on test scores for grades 3 and 5 respectively. In Grade 3, the coefficient on the
target criterion is not statistically significantly greater than zero for the multiple choice
test for either group. Neither is its sign greater than zero for the LL group on the
constructed response test; but it is for the Oral group. The proportion of variance
explained is small for all regressions in Grade 3, with the largest coefficient of
determination associated with the Oral group on the constructed response test. The
results suggest a lack of validity evidence for the LL group on both tests and for the Oral
group on the multiple choice test.
T-tests for the difference in target regression coefficients show no difference
between the groups on both tests in Grade 3. This makes interpretation of the statistically
significant coefficient for the Oral group on the constructed response test ambiguous.
These results, along with the small target coefficients, indicate that neither language
liaison nor oral administration is helping to make scores valid for the intermediate ELL
students in Grade 3 who perform consistently below grade level in reading.
Table 9: Grade 3 Validity Results (Analysis B)
IV B S.E. p R2 t (H0: b1=b2)
p
Multiple Choice
LL (Constant) 2.183 0.808 0.009 0.019 Target 0.525 0.477 0.275 -0.520 0.601
Oral (Constant) 2.584 0.974 0.010 0.044 Target 0.908 0.539 0.097
Constructed Response
LL (Constant) 1.344 1.027 0.196 0.012 Target 0.504 0.583 0.391 -0.690 0.491 Oral (Constant) 1.154 0.937 0.223 0.063

19
Target 1.036 0.507 0.045 N = 128
In Grade 5, the target coefficient for the LL group on the constructed response test
is statistically significantly greater than zero. However, the target coefficients are not
statistically significantly different from zero for the Oral group on both tests and for the
LL group on the multiple choice test. The proportion of variance explained is highest for
the LL group on the constructed response test and is very low for the Oral group and for
the LL group on the multiple choice test. The results provide evidence of validity for the
LL group on the constructed response test and lack of validity evidence for the Oral
group on both tests and for the LL group on the multiple choice test for Grade 5.
Table 10: Grade 5 Validity Results (Analysis B)
IV B S.E. p R2 t (H0: b1=b2)
p
Multiple Choice
LL (Constant) 2.395 0.998 0.022 0.031 Target 0.722 0.683 0.298 0.520 0.604
Oral (Constant) 3.097 0.784 0.000 0.005 Target 0.267 0.493 0.590
Constructed Response
LL (Constant) -0.539 1.246 0.668 0.218 Target 2.776 0.888 0.004 1.810 0.073
Oral (Constant) 3.104 1.139 0.008 0.004 Target 0.389 0.757 0.609 N = 101
The t-tests comparing the target regression coefficients, also reported in Table 10,
show no statistically significant difference between the two groups on both tests. Again,
results suggest that neither a language liaison accommodation nor an oral administration
accommodation is helping to make the test score inferences more valid for intermediate
ELLs.

20
Table 11 and Table 12 show means and standard deviations for the math test
scores and target criterion for Analysis B. The Oral group scored higher on average than
the LL group in both grades, although the difference is smaller in Grade 5. The average
criterion ratings are also higher for the Oral group in both grades, albeit the differences
are not statistically significant (Grade 3: p= .180 (MC), p = .363 (CR); Grade 5: p = .241
(MC), p = .407 (CR)).
Table 11: Mean and Standard Deviation of Mathematics Test Scores by Language Liaison Group (Analysis B)
Grade 3 Grade 5
N Multiple Choice
Constructed Response N Multiple
Choice Constructed Response
LL 64 3.047 (1.516)
2.203 (2.048) 37 3.405
(1.771) 3.189
(2.436)
Oral 64 4.172 (1.980)
3.000 (2.055) 64 3.500
(1.960) 3.656
(3.020) Table 12: Mean and Standard Deviation of Criterion Teacher Rating by Language Liaison Group
Grade 3 Grade 5
N Multiple Choice
Constructed Response N Multiple
Choice Constructed Response
LL 64 1.646 (0.400)
1.707 (0.444) 37 1.398
(0.431) 1.342
(0.410)
Oral 64 1.749 (0.456)
1.783 (0.499) 64 1.510
(0.504) 1.419
(0.506)
T-test results in Table 13 below show that scores on the multiple choice and
constructed response tests were significantly higher for Group 2 in Grade 3 and not
significantly different between groups in Grade 5.
Table 13: Mathematics Test Score t-test Results (Analysis B)
Equality of Variance
H0 F p Test df t sig. Grade 3 Multiple µ1–µ2 = 0 1.71 0.036 Satterthwaite 118 -3.61 0.001

21
Choice Constructed Response µ1–µ2 = 0 1.01 0.981 Pooled 126 -2.20 0.030
Grade 5
Multiple Choice µ1–µ2 = 0 1.22 0.517 Pooled 99 -0.24 0.809
Constructed Response µ1–µ2 = 0 1.54 0.166 Pooled 99 -0.80 0.425
Question 2: The Impact of individualized accommodation packages on the validity of test
scores for ELLs and Non-ELLs
Results from testing the hypothesis that the target regression coefficients will be
similar across each ELL and non-ELL group are reported in Table 14 for Grade 3. The
target regression coefficients are statistically significantly higher than zero for
intermediate ELLs, exited ELLs, and non-ELLs and not statistically significantly
different from zero for beginning and advanced ELLS on the multiple choice test. On the
constructed response test for Grade 3, the target regression coefficients are statistically
significantly greater than zero for all groups. These coefficients indicate that validity
evidence exists on both tests for intermediate ELLs, exited ELLs, and non-ELLs and on
the constructed response test for beginning and advanced ELLs.
For Grade 3, F-tests analyzing the difference in the target regression coefficients
between the five groups indicate a statistically significant difference. Post hoc pairwise
comparisons of the Grade 3 target regression coefficients are reported in Table 15. The
validity coefficients for beginning, intermediate, and advanced ELLs are not statistically
significantly different and the validity coefficients for exited ELLs and non-ELLs are not
statistically significantly different on both tests. However, the validity coefficients for
the ELL groups (beginning, intermediate and advanced) are each statistically

22
significantly lower than the non-ELL groups (exited and non-ELL). This indicates that
while the multiple choice and constructed response tests are equally valid among ELLs
and among non-ELLs, the score inferences are less valid for ELLs than for non-ELLs.
Table 14: Grade 3: Validity Results IV B S.E. p R2 F p
Multiple Choice
Beginning (Constant) 2.538 0.636 0.000 0.023
10.400 0.000
Target 0.407 0.376 0.285
Intermediate (Constant) 2.228 0.539 0.000 0.046 Target 0.866 0.282 0.002
Advanced (Constant) 2.838 1.334 0.037 0.046 Target 1.111 0.593 0.065
Exited (Constant) -0.208 0.849 0.807 0.2001 Target 2.728 0.349 0.000
Non-ELL (Constant) -0.220 0.384 0.567 0.273 Target 2.670 0.164 0.000
Constructed Response
Beginning (Constant) -0.094 0.656 0.886 0.209
8.670 0.000
Target 1.413 0.388 0.001
Intermediate (Constant) 0.723 0.657 0.272 0.058 Target 1.153 0.333 0.001
Advanced (Constant) 0.331 1.598 0.836 0.079 Target 1.739 0.694 0.015
Exited (Constant) -2.592 1.162 0.027 0.202 Target 3.679 0.469 0.000
Non-ELL (Constant) -2.565 0.578 0.000 0.234 Target 3.568 0.242 0.000 N = 1280
Table 15: Grade 3: Contrasts Multiple choice Constructed Response F p sig? F p sig? 1 vs. 2 0.480 0.487 0.090 0.761 1 vs. 3 0.750 0.388 0.090 0.761 1 vs. 4 12.390 0.000 * 6.760 0.009 * 1 vs. 5 14.290 0.000 * 7.680 0.006 * 2 vs. 3 0.140 0.711 0.450 0.505 2 vs. 4 16.820 0.000 * 16.500 0.000 *

23
2 vs. 5 25.130 0.000 * 25.190 0.000 * 3 vs. 4 5.990 0.015 * 4.710 0.030 * 3 vs. 5 6.750 0.010 * 5.200 0.023 * 4 vs. 5 0.030 0.871 0.050 0.827
For Grade 5, the target regression coefficients, reported in Table 16 are
statistically significantly greater than zero for all groups on both tests except for
beginning ELLs on the multiple choice test. This provides evidence of validity on the
multiple choice and constructed response tests for intermediate to non-ELLs and on the
constructed response test for beginning ELLs.
The F-tests for differences among the target regression coefficients for Grade 5,
also reported in Table 16 indicate difference among the groups on both the multiple
choice and constructed response tests. Post hoc pairwise contrasts, shown in Table 17,
indicate that on the multiple choice test, the validity coefficients are not statistically
significantly different for beginning and intermediate ELLs and, as desired, not different
between advanced, exited, and non-ELLs. On the constructed response test, as
hypothesized, the validity coefficients are not statistically significantly different among
beginning ELLs, advanced ELLs, exited ELLs and non-ELLS. Similarly, they are not
statistically significantly different for beginning and intermediate ELLs. However, the
coefficient for intermediate ELLs is statistically lower than the coefficients for exited
ELLs and non-ELLs. These results support evidence of similar validity between
advanced and exited and non-ELLs for both multiple choice and constructed response
and between beginning and exited and non-ELLs on the constructed response test.
Table 16: Grade 5: Validity Results IV B S.E. p R2 F p
Multiple Choice Beginning (Constant) 3.461 0.688 0.000 0.0105 6.410 0.000 Target -0.318 0.472 0.504

24
Intermediate (Constant) 2.497 0.514 0.000 0.0435 Target 0.779 0.302 0.011
Advanced (Constant) 1.684 1.135 0.144 0.1322 Target 1.611 0.567 0.006
Exited (Constant) 1.594 0.558 0.005 0.1925 Target 1.870 0.241 0.000
Non-ELL (Constant) 0.828 0.355 0.020 0.2265 Target 2.249 0.155 0.000
Constructed Response
Beginning (Constant) 0.521 0.736 0.483 0.1249
2.650 0.032
Target 1.322 0.534 0.017
Intermediate (Constant) 1.818 0.831 0.030 0.0606 Target 1.580 0.515 0.003
Advanced (Constant) 0.215 1.519 0.888 0.2028 Target 2.910 0.793 0.001
Exited (Constant) 0.325 0.814 0.690 0.2615 Target 3.433 0.363 0.000
Non-ELL (Constant) -0.142 0.504 0.778 0.2202 Target 3.192 0.224 0.000 N = 1222
Table 17: Grade 5: Contrasts Multiple choice Constructed Response F p-value sig? F p-value sig? 1 vs. 2 1.910 0.167 0.040 0.842 1 vs. 3 4.400 0.036 * 1.200 0.273 1 vs. 4 8.460 0.004 * 2.990 0.084 1 vs. 5 12.590 0.000 * 2.510 0.114 2 vs. 3 1.470 0.226 1.670 0.197 2 vs. 4 6.260 0.013 * 7.540 0.006 * 2 vs. 5 14.590 0.000 * 7.210 0.007 * 3 vs. 4 0.160 0.686 0.310 0.579 3 vs. 5 1.110 0.292 0.100 0.752 4 vs. 5 1.700 0.193 0.310 0.575
Discussion
The analyses in this study suggest low validity for early ELLs, even when proper
accommodations are given. Perhaps the low validity is related to the opportunity to learn
the mathematics content or the opportunity to practice different types of mathematics

25
items (e.g. word problems). Because the validity of the tests for early ELLs is so low,
when we focus the analysis on smaller groups of early ELLs to isolate the effects of
language liaisons, we have limited power to detect small changes in the validity. Thus,
we are unable to determine if the language liaison accommodation is beneficial in making
score inferences more valid.
In the analysis on the five ELL groups, on the multiple choice test, validity is low
for beginning and intermediate ELLs as evidenced by small target regression coefficients
and a very small proportion of variance in the scores explained by the mathematics
criterion for both grades. Validity is also low for advanced ELLs in Grade 3 but it is
better in Grade 5 on the multiple choice test.
On the constructed response test, the validity coefficients are statistically
significantly greater than zero for all groups providing more evidence of validity than on
the multiple choice test for both grades. In addition, the amount of variation in the scores
explained by the criterion is relatively high and similar for beginning ELLs and exited
and non-ELLs in Grade 3. The proportion of variance explained for beginning ELLs in
Grade 5 is smaller than advanced, exited, and non-ELLs, but, nonetheless, shows some
predictive validity. The results are very different for the intermediate ELLs, though. The
amount of variance explained is relatively small on the constructed response test in both
grades; thus, their teacher ratings are not doing a good job explaining the variance in their
scores.
On both the multiple choice and constructed response tests, validity is lower for
all three ELL groups relative to exited and non-ELLs in Grade 3. In Grade 5, validity is
the same for advanced ELLs and exited and non-ELLs on both multiple choice and

26
constructed response. Surprisingly, validity is not different for beginning ELLs
compared to exited and non-ELLs on the constructed response test in Grade 5.
The independent target criterion seems to be a reasonably valid measure, as it
does appear to be a measure related to ability for exited and non-ELLs. Therefore,
statistically insignificant regression coefficients on the target criterion suggest largely
flat, non-differentiating, or scattered scores (indicative of chance behavior or guessing).
There is likely something else going one besides just learning math (e.g. language,
literacy, confidence, motivation) that is affecting test scores. Perhaps, as some test
administrators noticed, teachers were telling their students just to guess.
It is possible that early ELLs do not get as full a curriculum as non-ELLs and
have less of an opportunity to learn. Also, because of their language problems, ELL
teachers often will teach math concepts using just algorithms rather than using word
problems—of which the entire test is comprised. Thus, for those concepts that ELLs
were taught and have learned, and subsequently given appropriate scores on the teacher
rating questionnaire, it is likely that they don't have regular practice with word problems
using those concepts, presented in access-based ways, orally or otherwise. This can lead
to a lack of validity.
As a start to further analysis on causes of the low validity coefficients and what
might be predicting either test scores or the teacher ratings, we have begun to look at
scores expected by chance for beginning ELLs and other descriptive analyses of
beginning and intermediate ELLs. T-tests were conducted to determine if the beginning
ELLs scored significantly higher than chance on the multiple choice test. For Grade 3,
they scored higher than chance on average, but for Grade 5 they did not. Preliminary

27
descriptive and graphical analysis for each of the ELL groups indicate that beginning and
intermediate ELLs scored lower even when their target teacher ratings were higher than
non-ELLs. For these students, looking more closely at other student variables and item
analysis may lead to insight into the factors influencing their test performance.

28
References
Abedi, J. (2001). Language accommodation for large-scale assessment in science:
Assessing English language learners. (Final Deliverable, Project 2.4
Accommodation). Los Angeles, CA: National Center for Research on Evaluation,
Standards, and Student Testing, University of California.
Abedi, J. (2004). The No Child Left Behind Act and English language learners:
Assessment and accountability issues. Educational Researcher, 33(1), 4-14.
Abedi, J., Lord, C. Boscardin, C., and Miyoshi, J. (2000). The effects of accommodations
on the assessment of LEP students in NAEP . (CSE Tech. Rep. No 537). Los
Angeles: National Center for Research on Evaluation, Standards, and Student
Testing, University of California.
August, D. & Hakuta, K. (Eds.).(1997). Improving schooling for language-minority
children: A research agenda. Washington, DC: National Academy Press.
Bourdieu, P. (2003). Outline of a Theory of Practice. (R. Nice, Trans) (17th ed.).
Cambridge University Press: Cambridge.
Emick, J. (2005). Decision Making and accommodations: The development of a
taxononomy. Manuscript in preparation.

29
Farr, B. P. & Trumbull, E. (1997). Assessment Alternatives for Diverse Classrooms
Christopher-Gordon Publishers, Inc. Norwood, MA.
Gay, G. (1993). Building cultural bridges: A bold proposal for teacher education.
Education and Urban Society, 25(3), 45-51.
Heath, S. B. (1982). Questioning at Home and at School: A Comparative Study. In G.
Spindler (Ed.), Doing the Ethnography of Schooling, Educational Anthropology
in Action (pp. 109-131). Holt, Rinehart and Winston: New York.
Hollenbeck, K. (2002). Determining when test alterations are valid accommodations or
modifications for large-scale assessment. In G.Tindal & T. M. Haladyna (Eds.),
Large-scale assessment programs for all students: validity, technical adequacy,
and implementation. Mahwah, NJ: Lawrence Erlbaum Associates, Publishers.
Kopriva, R.J. (October, 1996). Variant Methodology for Different Testing Populations.
Presentation for Meta-SCASS meeting, Washington, D.C.
Kopriva, R. (2000). Ensuring accuracy in testing for English language learners.
Washington, DC: Council of Chief State School Officers.
Kopriva, R. (2005). Improving Large-Scale Achievement Tests for English Language
Learners. Manuscript in preparation.

30
Kopriva, R. & Mislevy, R. (2001). Valid Assessment of English Language Learners.
Proposal for the U.S. Department of Education, Institute of Education Sciences.
Washington, D.C.
Koran, J., Kopriva, R., Emick, J., Monroe, R., Webb, P., Walker, P., & Garavaglia, D.
(April, 2006). A Multiple Measures Approach for Gathering Information to Make
Individualized Test Accommodation Decisions for English Language Learners.
Presentation at the meeting of the National Council on Measurement in
Education, San Francisco, CA.
Michie, M. (2004, April 1-3). Teaching science to Indigenous students: Teacher as
culture broker or is it something else? Paper presented at the annual meeting the
National Association for Research in Science Teaching. Retrieved June 5, 2005
from http://members.ozemail.com.au/~mmichie/teacher_cb.htm.
Monroe, R. (2004). Family Assessment Night. Unpublished manuscript. University of
Maryland College Park.
No Child Left Behind Act of 2001, Pub. L. No. 107-110, 115 Stat. 1425 (2002).
Solano-Flores, G., & Trumbull, E. (2003). Examining language in context: The need for

31
new research and practice paradigms in the testing of English-language learners.
Educational Researcher, 32(2), 3-13.
Tindal, G. & Haladyna, T. M. (Eds.)(2002). Large-scale assessment programs for all
students: Validity, technical adequacy, and implementation. Hillsdale, NJ:
Erlbaum.
Zehler, A.M., Fleischman, H.L., Hopstock, P.J., Stephenson, T.G., Pendzick, M.L., and
Sapru, S. (2003). Descriptive Study of Services to LEP Students and LEP
Students with Disabilities. Volume I: Research Report. Submitted to U.S.
Department of Education, OELA. Arlington VA: Development Associates, Inc.