congestion pricing and urban partnerships presentation 4 us department of transportation part 2:...
TRANSCRIPT
Congestion Pricing and Urban Partnerships
Presentation 4
US Department of Transportation
www.fightgridlocknow.gov
Part 2: Congestion Pricing Policy Development
Congestion Pricing and Urban Partnerships
Presentation 4
US Department of Transportation
www.fightgridlocknow.gov
Addressing Public Concerns and Key Strategies for Success
Presentation 4:Public Concerns
Congestion Pricing and Urban Partnerships
Presentation 4
US Department of Transportation
www.fightgridlocknow.gov
Overview
• 10 most frequent public concerns
• What you can do to get acceptance:▫ Communicate ▫ Design appropriate policies to address
concerns
• Key ingredients for success
Congestion Pricing and Urban Partnerships
Presentation 4
US Department of Transportation
www.fightgridlocknow.gov
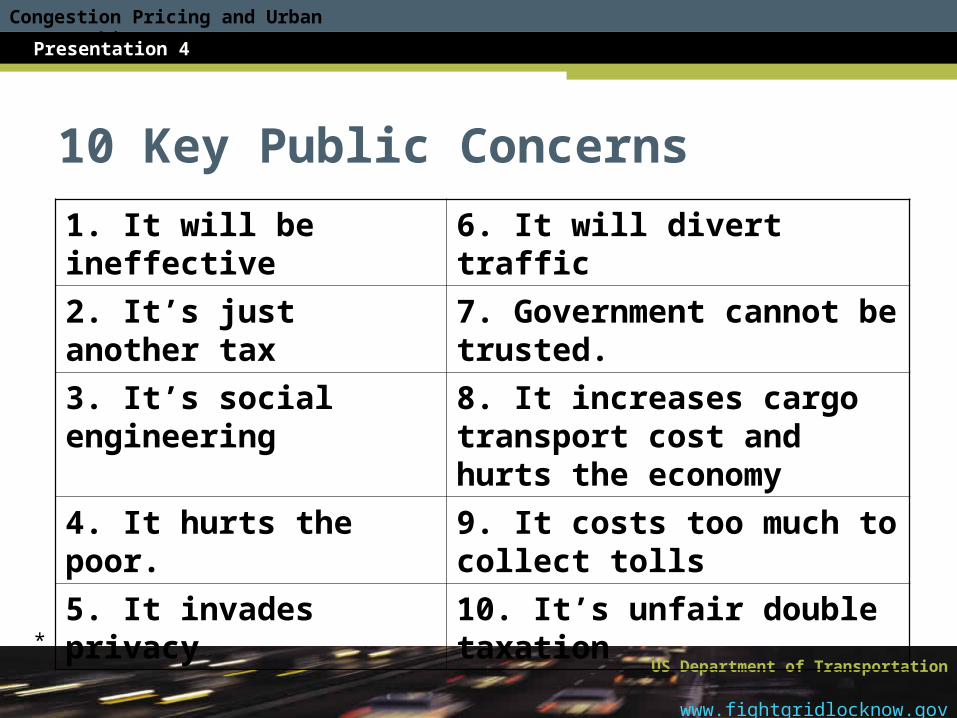
10 Key Public Concerns
1. It will be ineffective 6. It will divert traffic
2. It’s just another tax 7. Government cannot be trusted.
3. It’s social engineering 8. It increases cargo transport cost and hurts the economy
4. It hurts the poor. 9. It costs too much to collect tolls
5. It invades privacy 10. It’s unfair double taxation
*
Congestion Pricing and Urban Partnerships
Presentation 4
US Department of Transportation
www.fightgridlocknow.gov
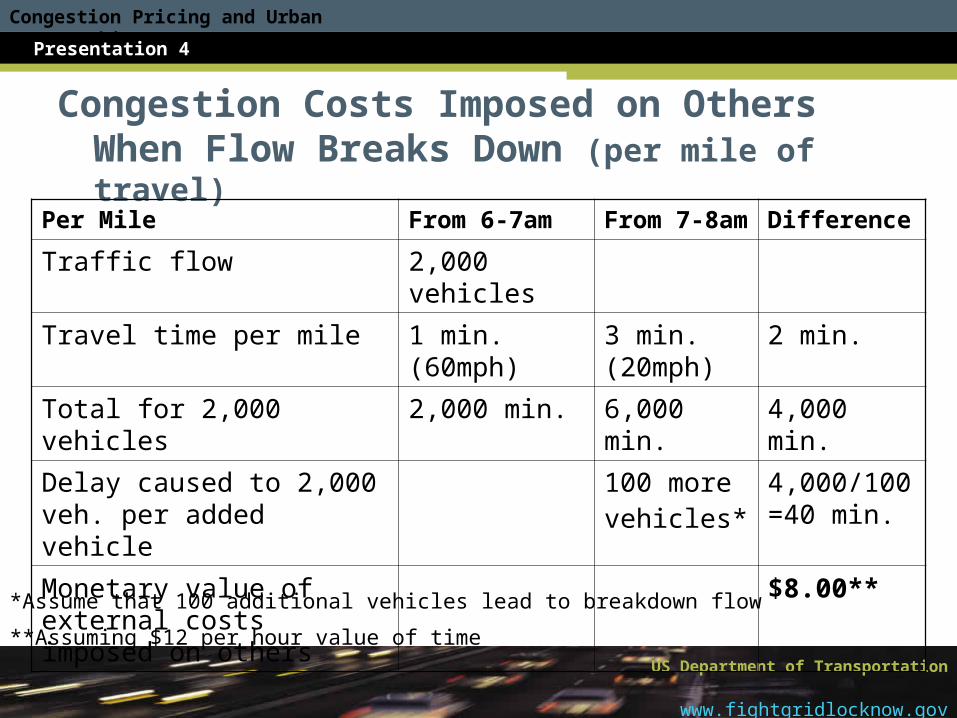
Congestion Costs Imposed on Others When Flow Breaks Down (per mile of travel)
Per Mile From 6-7am From 7-8am Difference
Traffic flow 2,000 vehicles
Travel time per mile 1 min. (60mph)
3 min. (20mph)
2 min.
Total for 2,000 vehicles 2,000 min. 6,000 min. 4,000 min.
Delay caused to 2,000 veh. per added vehicle
100 morevehicles*
4,000/100 =40 min.
Monetary value of external costs imposed on others
$8.00**
*Assume that 100 additional vehicles lead to breakdown flow
**Assuming $12 per hour value of time
Congestion Pricing and Urban Partnerships
Presentation 4
US Department of Transportation
www.fightgridlocknow.gov
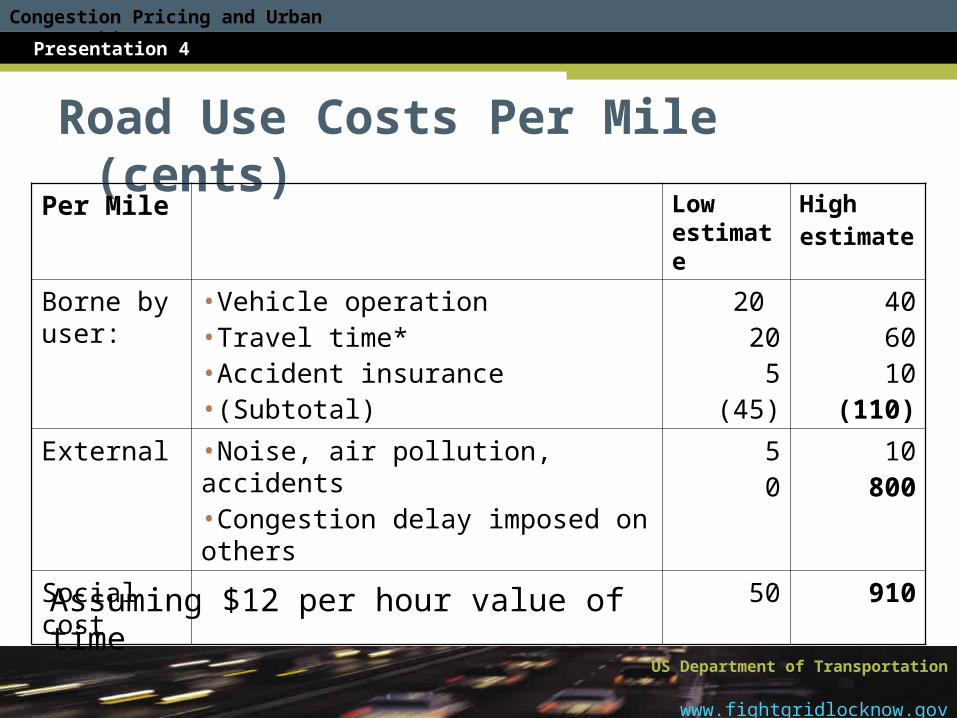
Road Use Costs Per Mile (cents)Per Mile Low
estimateHighestimate
Borne by user:
•Vehicle operation•Travel time*•Accident insurance•(Subtotal)
20 20
5(45)
406010
(110)
External •Noise, air pollution, accidents•Congestion delay imposed on others
50
10800
Social cost 50 910
Assuming $12 per hour value of time
Congestion Pricing and Urban Partnerships
Presentation 4
US Department of Transportation
www.fightgridlocknow.gov
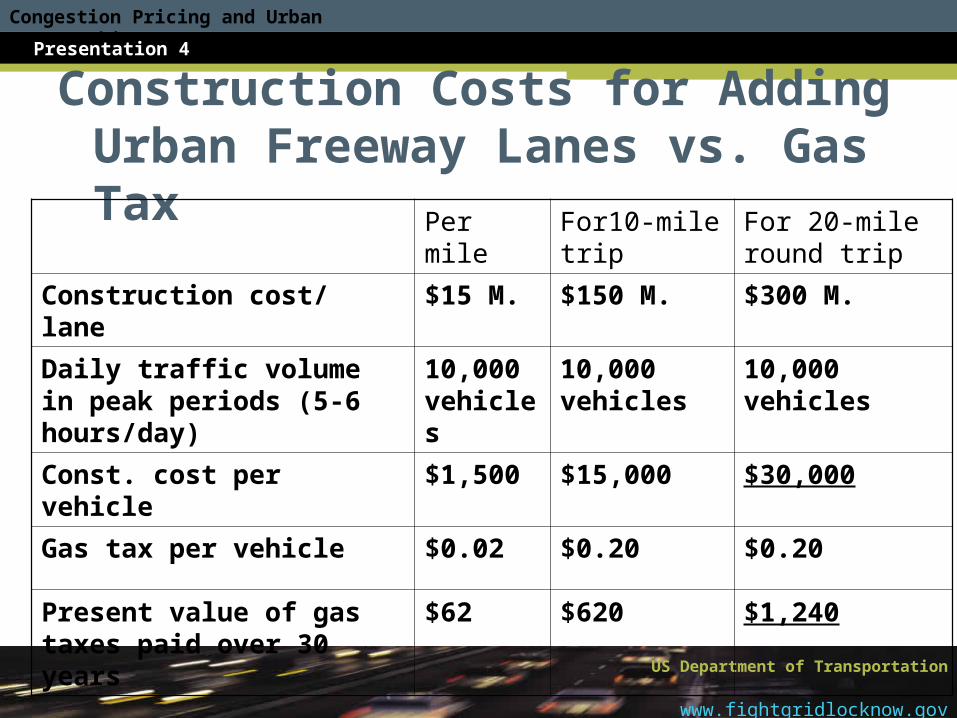
Construction Costs for Adding Urban Freeway Lanes vs. Gas Tax
Per mile For10-mile trip
For 20-mile round trip
Construction cost/ lane $15 M. $150 M. $300 M.
Daily traffic volume in peak periods (5-6 hours/day)
10,000 vehicles
10,000 vehicles
10,000 vehicles
Const. cost per vehicle $1,500 $15,000 $30,000
Gas tax per vehicle $0.02 $0.20 $0.20
Present value of gas taxes paid over 30 years
$62 $620 $1,240
Congestion Pricing and Urban Partnerships
Presentation 4
US Department of Transportation
www.fightgridlocknow.gov
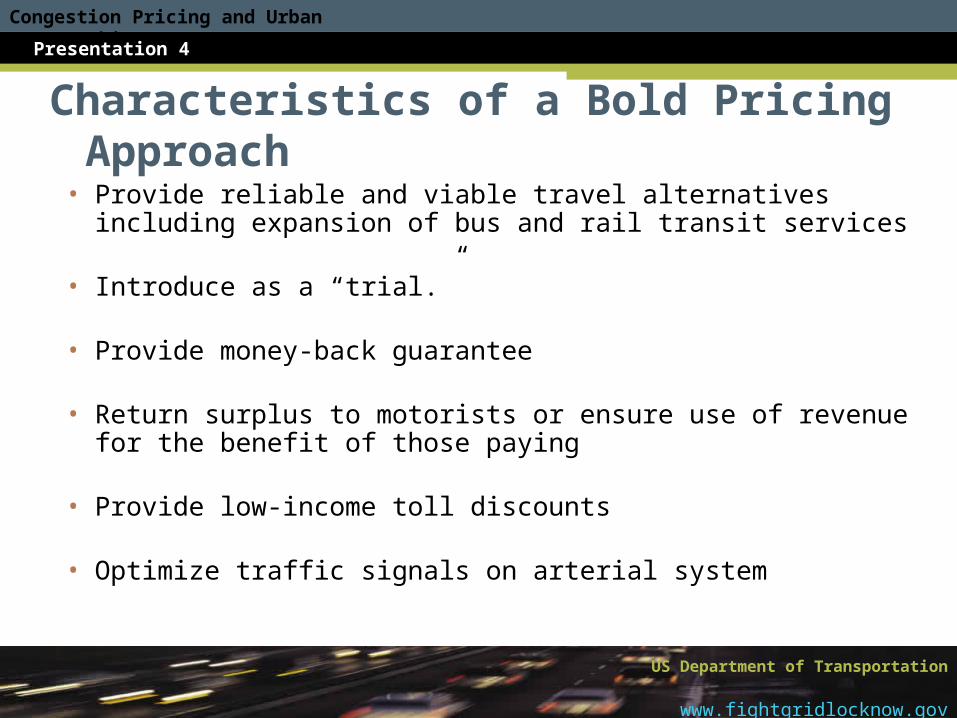
Characteristics of a Bold Pricing Approach
• Provide reliable and viable travel alternatives including expansion of bus and rail transit services
• Introduce as a “trial.”
• Provide money-back guarantee
• Return surplus to motorists or ensure use of revenue for the benefit of those paying
• Provide low-income toll discounts
• Optimize traffic signals on arterial system
Congestion Pricing and Urban Partnerships
Presentation 4
US Department of Transportation
www.fightgridlocknow.gov
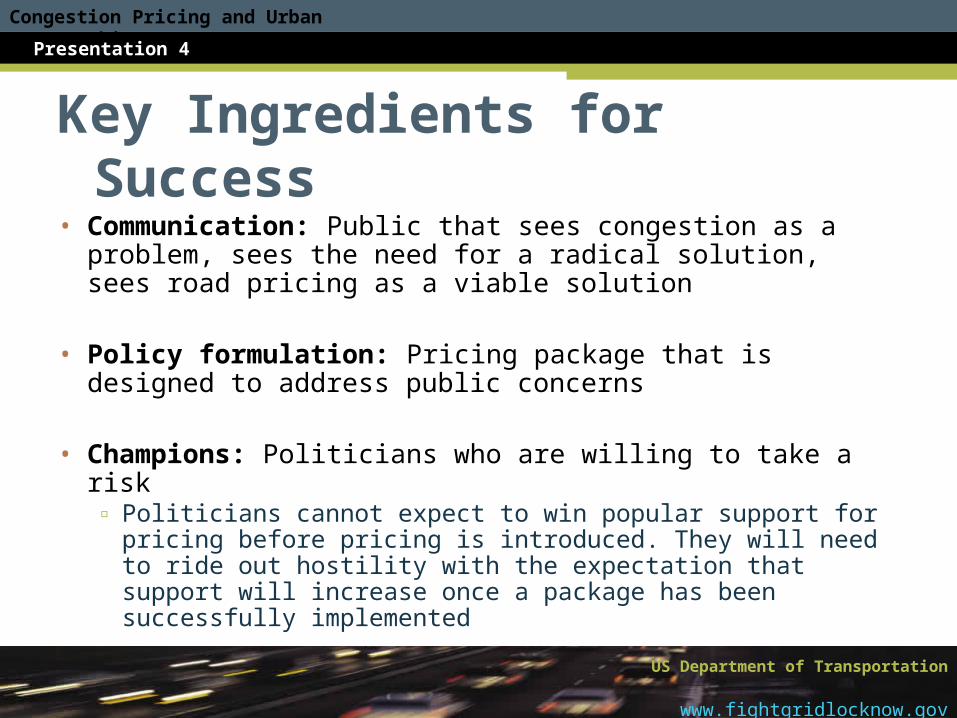
Key Ingredients for Success• Communication: Public that sees congestion as a
problem, sees the need for a radical solution, sees road pricing as a viable solution
• Policy formulation: Pricing package that is designed to address public concerns
• Champions: Politicians who are willing to take a risk▫ Politicians cannot expect to win popular support for pricing
before pricing is introduced. They will need to ride out hostility with the expectation that support will increase once a package has been successfully implemented
Congestion Pricing and Urban Partnerships
Presentation 4
US Department of Transportation
www.fightgridlocknow.gov
Involving the Public and Creating Political Champions – Case Study
•Grassroots and Grasstops•Minnesota’s experience with congestion pricing•The I-394 MnPass HOT lane project
Presentation 5:Public and Political Outreach
Congestion Pricing and Urban Partnerships
Presentation 4
US Department of Transportation
www.fightgridlocknow.gov
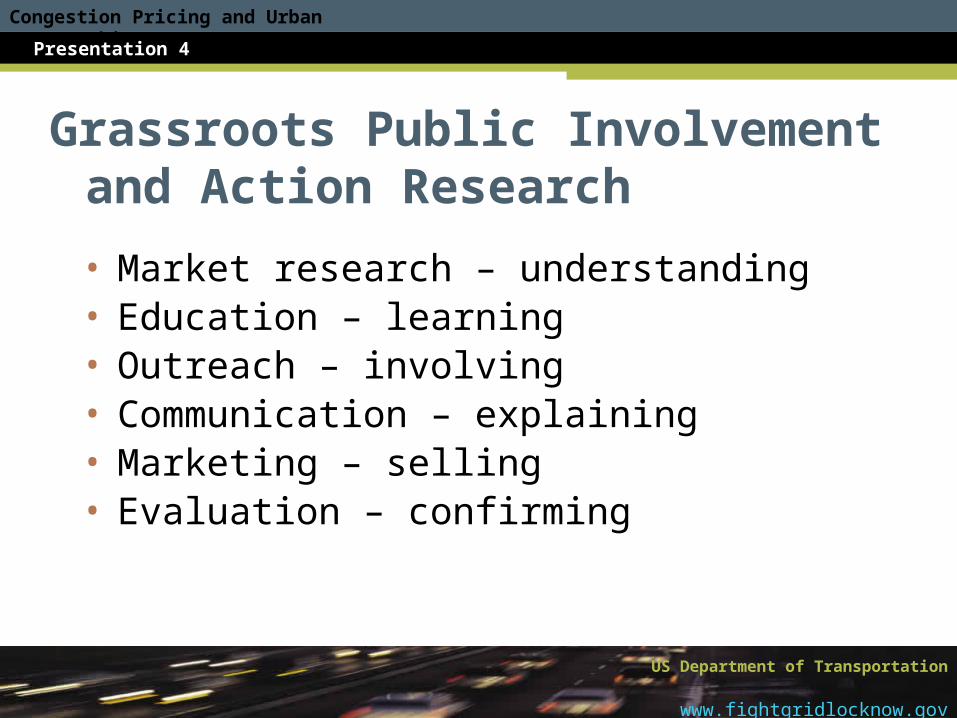
Grassroots Public Involvement and Action Research
• Market research – understanding• Education – learning• Outreach – involving• Communication – explaining• Marketing – selling• Evaluation – confirming
Congestion Pricing and Urban Partnerships
Presentation 4
US Department of Transportation
www.fightgridlocknow.gov
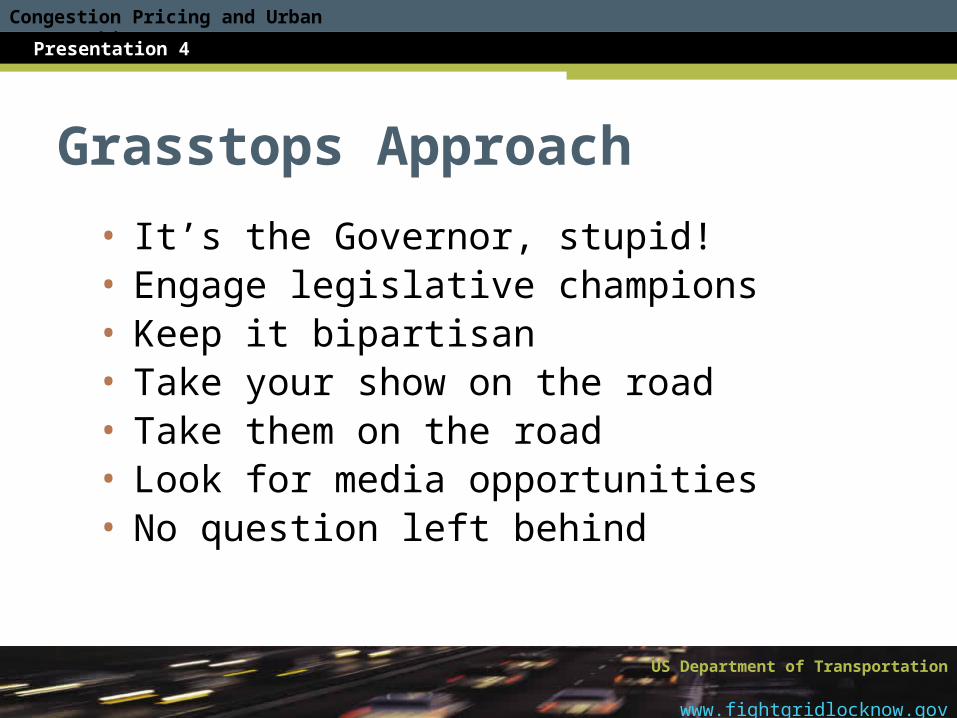
Grasstops Approach
• It’s the Governor, stupid!• Engage legislative champions• Keep it bipartisan• Take your show on the road• Take them on the road• Look for media opportunities• No question left behind
Congestion Pricing and Urban Partnerships
Presentation 4
US Department of Transportation
www.fightgridlocknow.gov
Twin Cities Citizens Jury on Congestion Pricing (1995)
• 24 randomly selected citizens gathered in St. Paul State Capitol for five days
• 16 against, 8 in favor of congestion pricing as a way of managing congestion and financing transportation
• Congestion not bad enough yet• Congestion pricing not fair – Lexus Lane• Congestion pricing costs too much – raise gas
tax instead• Not convinced that congestion pricing will work
Congestion Pricing and Urban Partnerships
Presentation 4
US Department of Transportation
www.fightgridlocknow.gov
Minnesota’s Experience with Congestion Pricing
1995 Citizens Jury on congestion pricing1996 Hwy 212 toll proposal defeated by local
veto1997 I-394 HOV lane buy-in proposal withdrawn2000 Value Pricing Workshop2001 Value Pricing Advisory Task Force
“Grass tops” communication plan2002 I-35W Crosstown pricing proposal
considered too complicated by Mn/DOT
Congestion Pricing and Urban Partnerships
Presentation 4
US Department of Transportation
www.fightgridlocknow.gov
Congestion Pricing and Urban Partnerships
Presentation 4
US Department of Transportation
www.fightgridlocknow.gov
Minnesota’s Experience with Congestion Pricing
2003 I-394 HOT lane project approved by Legislature and Governor
2004 I-394 Community Task Force I-394 User Focus Groups
2005 I-394 MnPASS express lanes open2006 I-394 Phase 2 Task Force – improving
transit and throughput
Congestion Pricing and Urban Partnerships
Presentation 4
US Department of Transportation
www.fightgridlocknow.gov
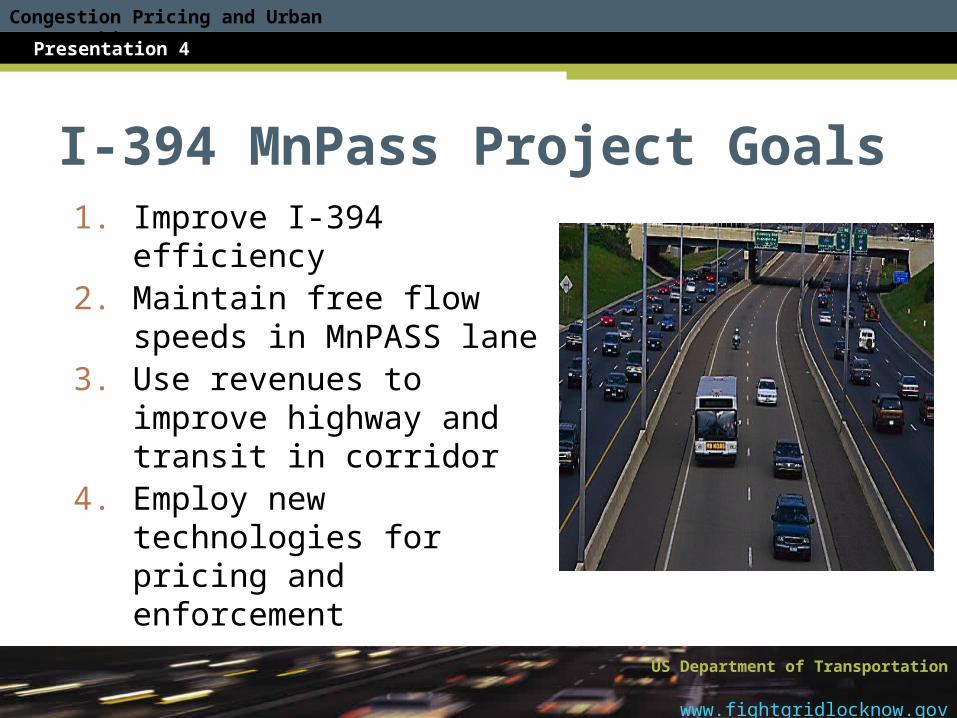
I-394 MnPass Project Goals1. Improve I-394 efficiency 2. Maintain free flow speeds
in MnPASS lane3. Use revenues to improve
highway and transit in corridor
4. Employ new technologies for pricing and enforcement
Congestion Pricing and Urban Partnerships
Presentation 4
US Department of Transportation
www.fightgridlocknow.gov
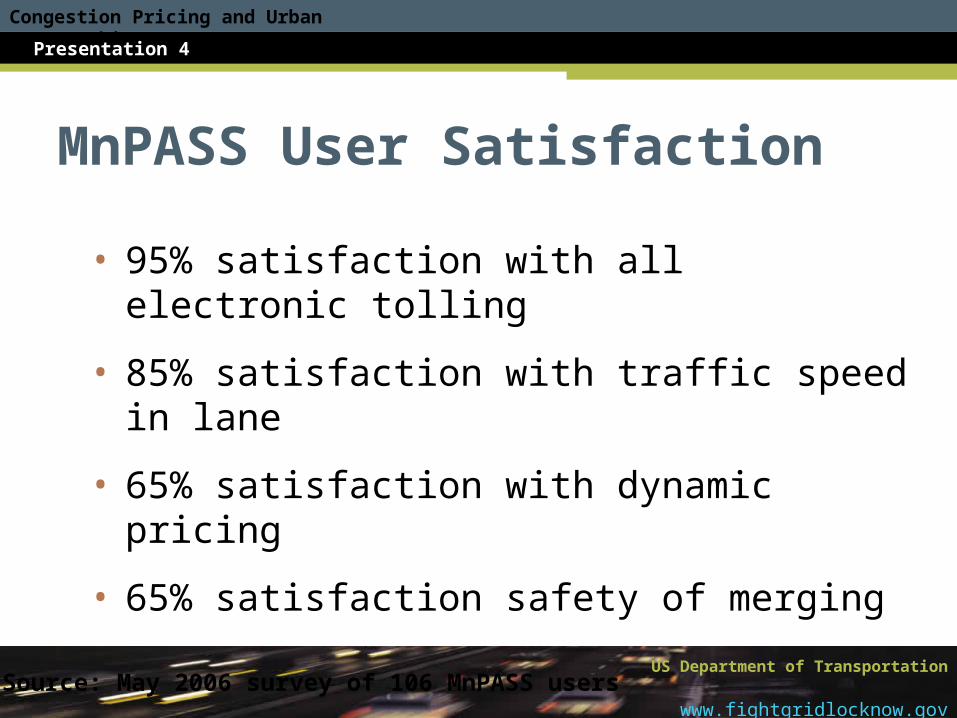
MnPASS User Satisfaction
• 95% satisfaction with all electronic tolling
• 85% satisfaction with traffic speed in lane
• 65% satisfaction with dynamic pricing
• 65% satisfaction safety of merging
Source: May 2006 survey of 106 MnPASS users
Congestion Pricing and Urban Partnerships
Presentation 4
US Department of Transportation
www.fightgridlocknow.gov
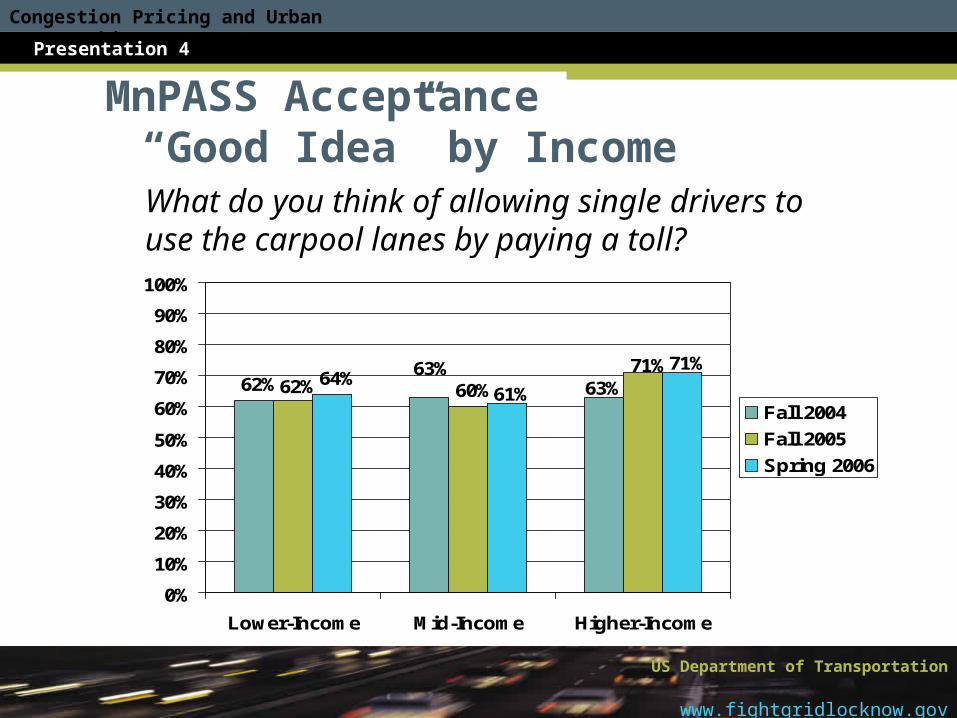
MnPASS Acceptance “Good Idea” by IncomeWhat do you think of allowing single drivers to use the carpool lanes by paying a toll?
63%63%
62%71%
60%62%71%
61%64%
0%
10%
20%
30%
40%
50%
60%
70%
80%
90%
100%
Lower-Income Mid-Income Higher-Income
Fall 2004
Fall 2005
Spring 2006
Congestion Pricing and Urban Partnerships
Presentation 4
US Department of Transportation
www.fightgridlocknow.gov
Lessons Learned
• Political leadership is necessary• Public will support projects if they can see
benefits• Pricing projects must work from day one• Effective outreach, education and marketing
are critical for success• Pricing projects are more likely to generate
support if linked to transit improvements
Congestion Pricing and Urban Partnerships
Presentation 4
US Department of Transportation
www.fightgridlocknow.gov
Evaluation of Economic and Financial Feasibility
Presentation 6: Congestion Pricing Concepts
Congestion Pricing and Urban Partnerships
Presentation 4
US Department of Transportation
www.fightgridlocknow.gov
Introduction
• Congestion pricing concepts
• Examples of innovative strategies
• Costs, toll rates, revenues and benefits
Congestion Pricing and Urban Partnerships
Presentation 4
US Department of Transportation
www.fightgridlocknow.gov
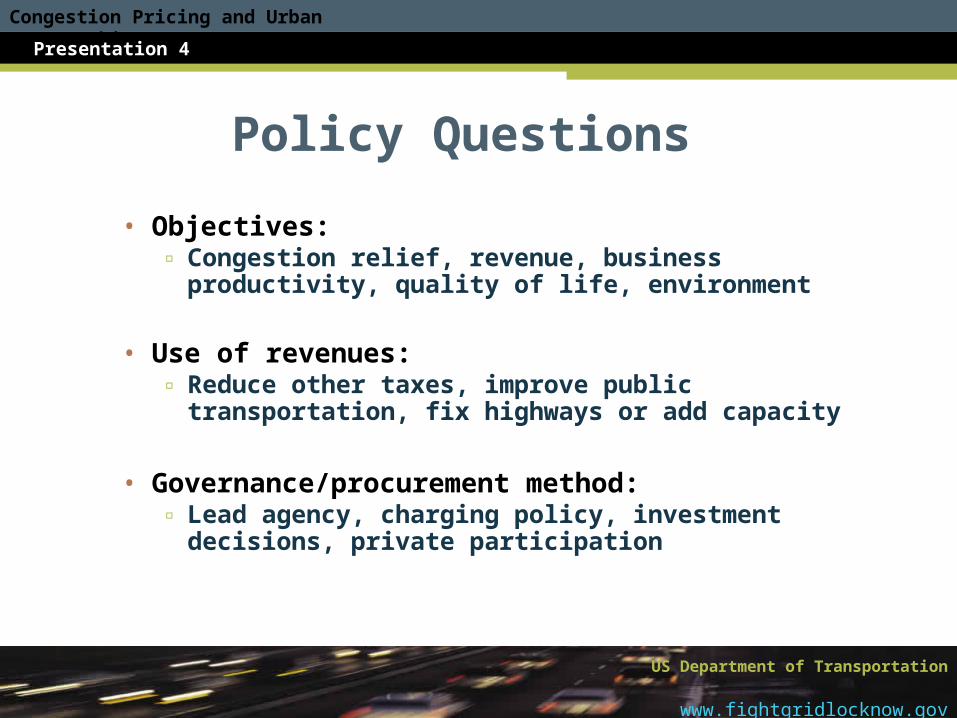
Policy Questions
• Objectives:▫ Congestion relief, revenue, business
productivity, quality of life, environment
• Use of revenues:▫ Reduce other taxes, improve public
transportation, fix highways or add capacity
• Governance/procurement method:▫ Lead agency, charging policy, investment
decisions, private participation
Congestion Pricing and Urban Partnerships
Presentation 4
US Department of Transportation
www.fightgridlocknow.gov
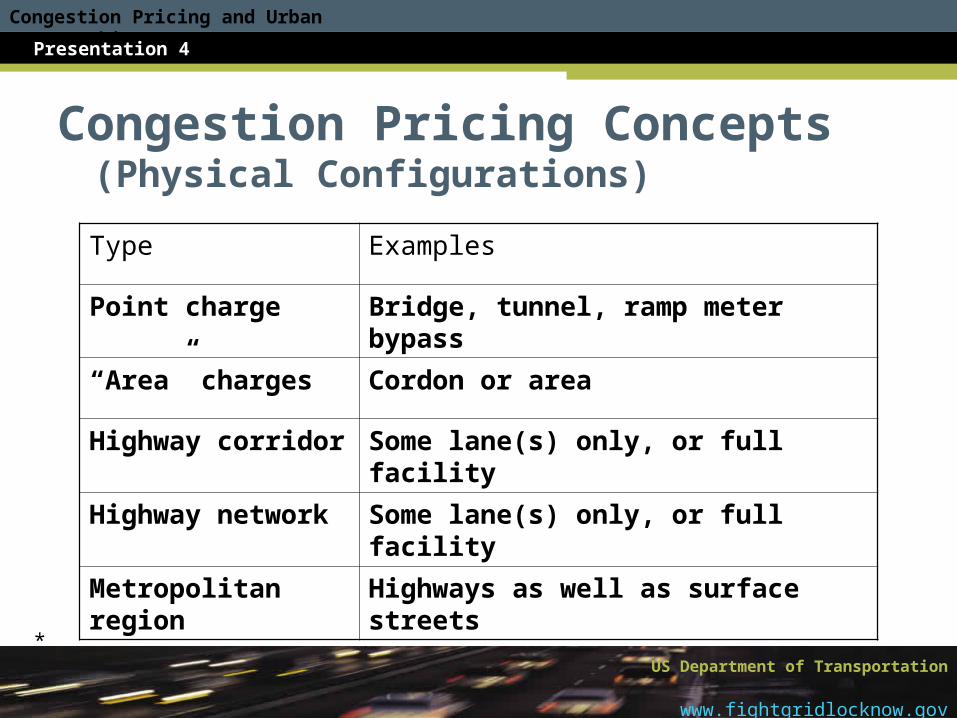
Congestion Pricing Concepts(Physical Configurations)
Type Examples
Point charge Bridge, tunnel, ramp meter bypass
“Area” charges Cordon or area
Highway corridor Some lane(s) only, or full facility
Highway network Some lane(s) only, or full facility
Metropolitan region Highways as well as surface streets
*
Congestion Pricing and Urban Partnerships
Presentation 4
US Department of Transportation
www.fightgridlocknow.gov
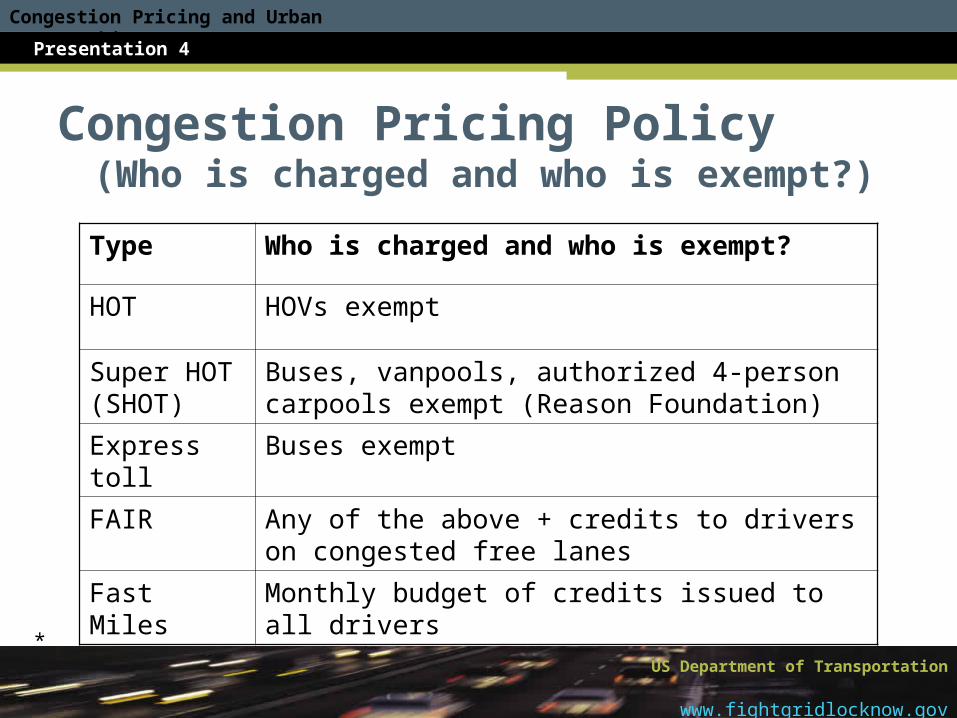
Congestion Pricing Policy(Who is charged and who is exempt?)
Type Who is charged and who is exempt?
HOT HOVs exempt
Super HOT (SHOT)
Buses, vanpools, authorized 4-person carpools exempt (Reason Foundation)
Express toll Buses exempt
FAIR Any of the above + credits to drivers on congested free lanes
Fast Miles Monthly budget of credits issued to all drivers
*
Congestion Pricing and Urban Partnerships
Presentation 4
US Department of Transportation
www.fightgridlocknow.gov
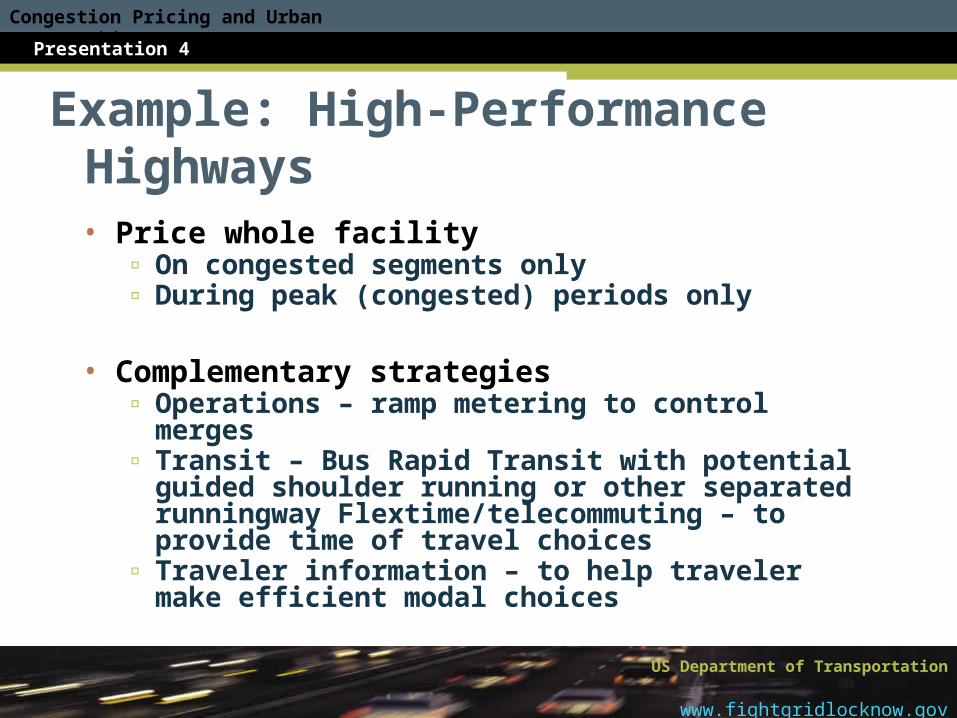
Example: High-Performance Highways
• Price whole facility▫ On congested segments only▫ During peak (congested) periods only
• Complementary strategies▫ Operations – ramp metering to control merges▫ Transit – Bus Rapid Transit with potential guided
shoulder running or other separated runningway Flextime/telecommuting – to provide time of travel choices
▫ Traveler information – to help traveler make efficient modal choices
Congestion Pricing and Urban Partnerships
Presentation 4
US Department of Transportation
www.fightgridlocknow.gov
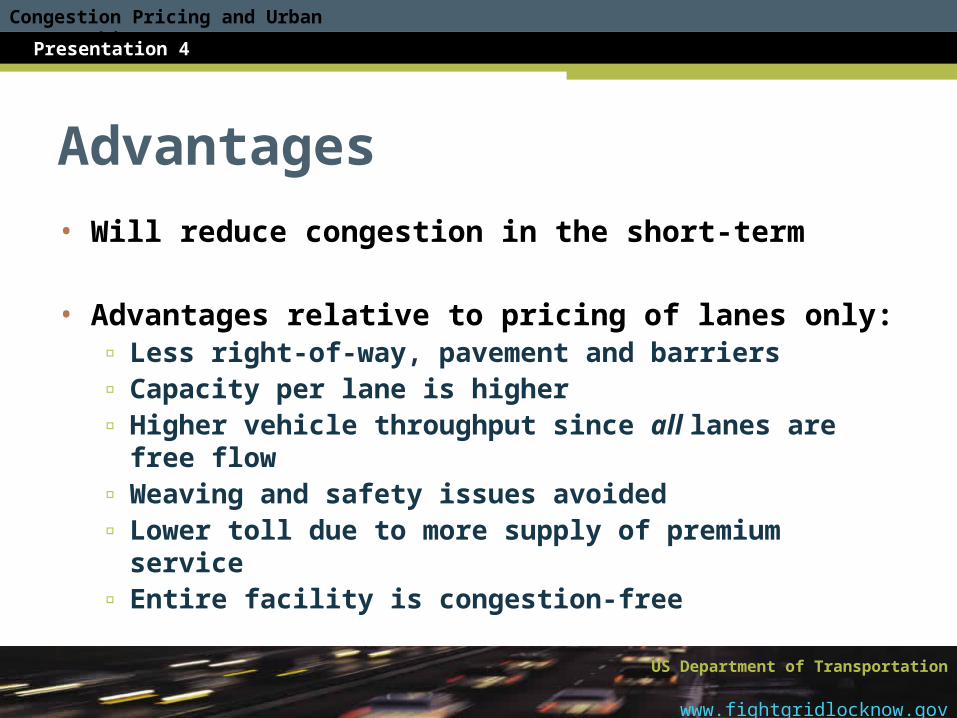
Advantages
• Will reduce congestion in the short-term
• Advantages relative to pricing of lanes only:▫ Less right-of-way, pavement and barriers▫ Capacity per lane is higher▫ Higher vehicle throughput since all lanes are free flow▫ Weaving and safety issues avoided▫ Lower toll due to more supply of premium service▫ Entire facility is congestion-free
Congestion Pricing and Urban Partnerships
Presentation 4
US Department of Transportation
www.fightgridlocknow.gov
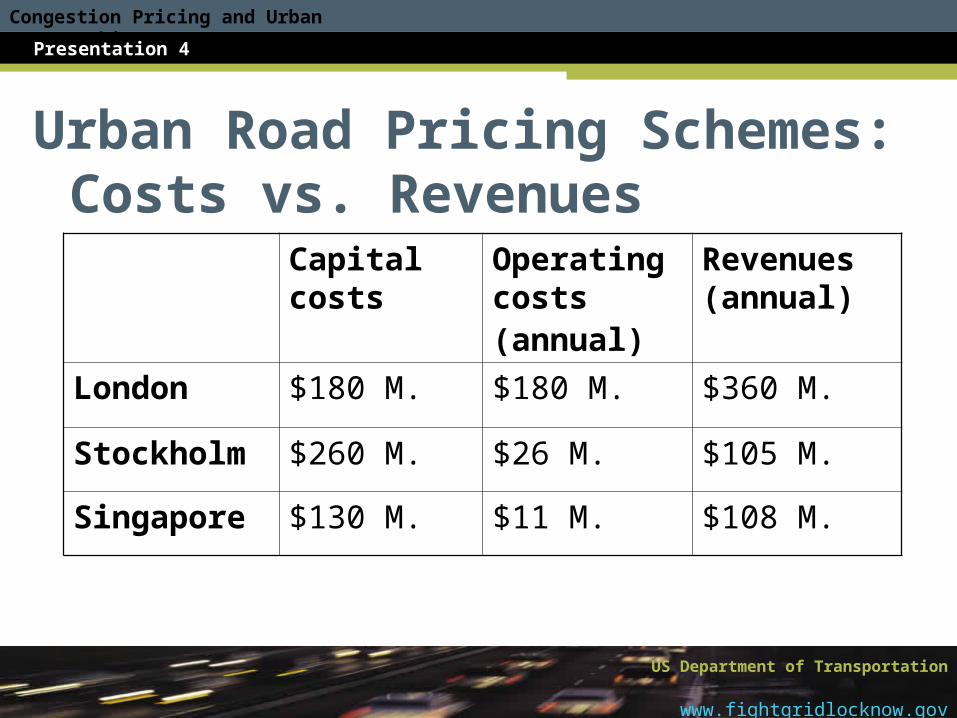
Urban Road Pricing Schemes: Costs vs. Revenues
Capital costs
Operating costs(annual)
Revenues (annual)
London $180 M. $180 M. $360 M.
Stockholm $260 M. $26 M. $105 M.
Singapore $130 M. $11 M. $108 M.
Congestion Pricing and Urban Partnerships
Presentation 4
US Department of Transportation
www.fightgridlocknow.gov
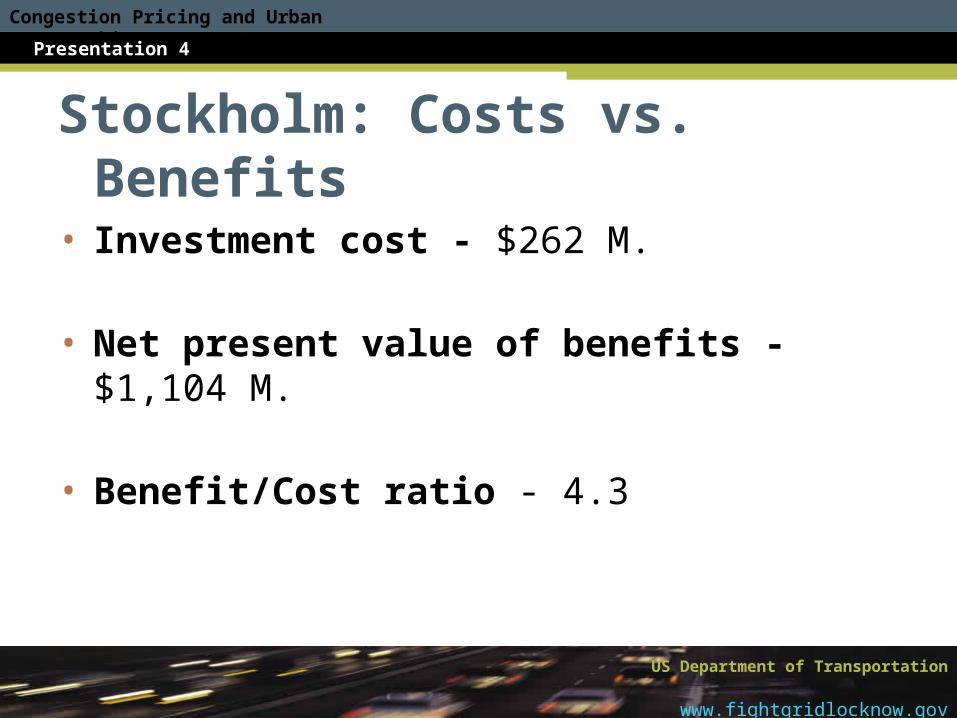
Stockholm: Costs vs. Benefits
• Investment cost - $262 M.
• Net present value of benefits - $1,104 M.
• Benefit/Cost ratio - 4.3
Congestion Pricing and Urban Partnerships
Presentation 4
US Department of Transportation
www.fightgridlocknow.gov
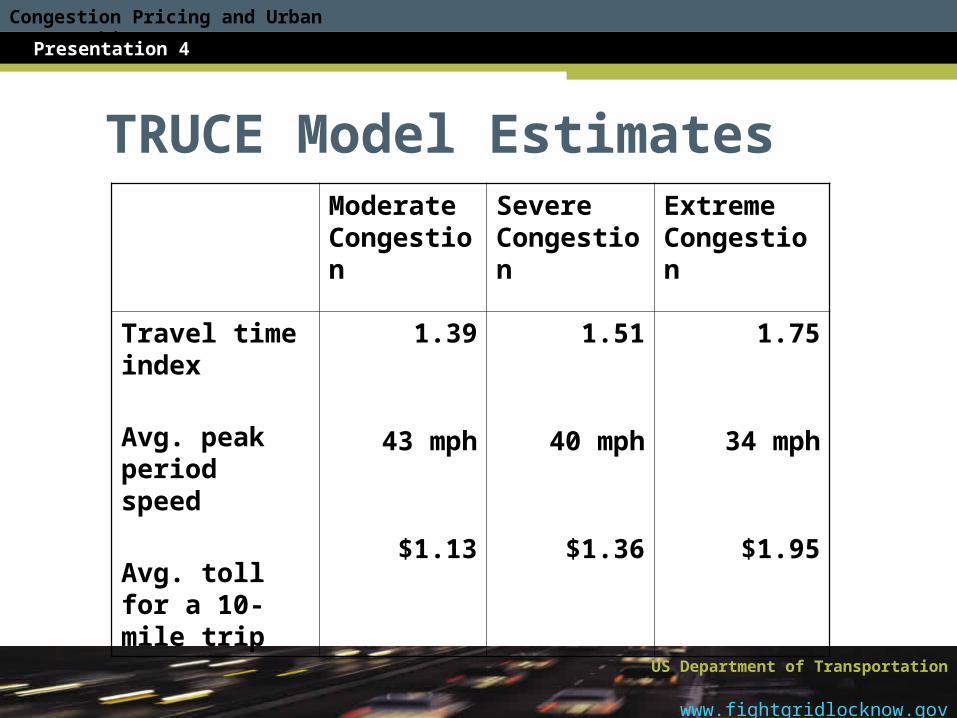
TRUCE Model EstimatesModerate Congestion
Severe Congestion
Extreme Congestion
Travel time index
Avg. peak period speed
Avg. toll for a 10-mile trip
1.39
43 mph
$1.13
1.51
40 mph
$1.36
1.75
34 mph
$1.95
Congestion Pricing and Urban Partnerships
Presentation 4
US Department of Transportation
www.fightgridlocknow.gov
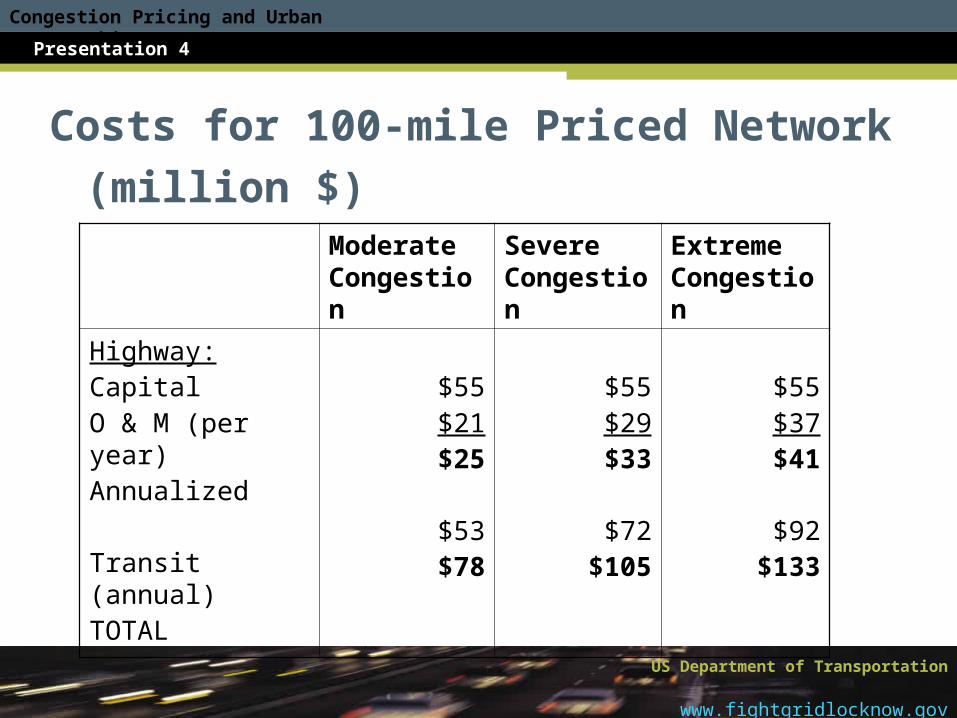
Costs for 100-mile Priced Network
(million $) Moderate Congestion
Severe Congestion
Extreme Congestion
Highway:CapitalO & M (per year)Annualized
Transit (annual)TOTAL
$55$21$25
$53$78
$55$29$33
$72$105
$55$37$41
$92$133
Congestion Pricing and Urban Partnerships
Presentation 4
US Department of Transportation
www.fightgridlocknow.gov
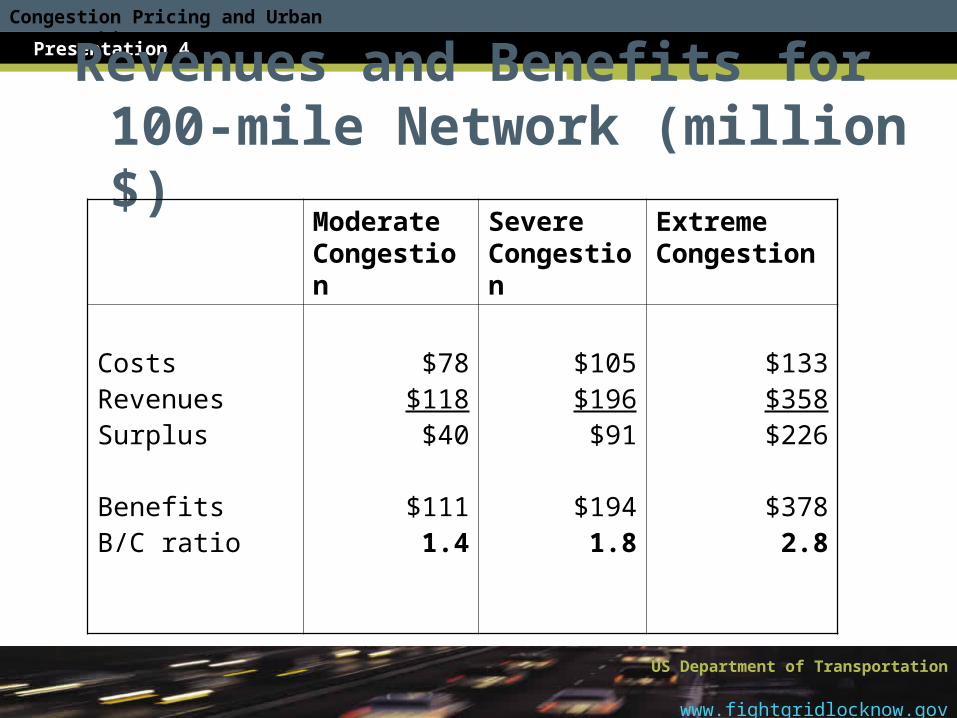
Revenues and Benefits for 100-mile Network (million $)
Moderate Congestion
Severe Congestion
Extreme Congestion
CostsRevenuesSurplus
BenefitsB/C ratio
$78$118
$40
$1111.4
$105$196
$91
$1941.8
$133$358$226
$3782.8
Congestion Pricing and Urban Partnerships
Presentation 4
US Department of Transportation
www.fightgridlocknow.gov
Broad Conclusions
• High performance highways will be financially self-sufficient
• With high levels of congestion▫ Revenue surpluses will be higher▫ Benefits will exceed costs by wider margins