confidence, error, and ingenuity in diagnostic problem...
TRANSCRIPT
Confidence, Error, and Ingenuity in Diagnostic Problem Solving: Clarifying the Role of Exploration and Exploitation
Jenny W. Rudolph Harvard Medical School
Center for Medical Simulation [email protected]
J. Bradley Morrison Brandeis University
International Business School [email protected]
Version 1 Winter 2007
DRAFT
Submitted to the Academy of Management for the Annual Meeting in August, 2007
at Philadelphia, PA USA
1
Confidence, Error and Ingenuity in Diagnostic Problem Solving: Clarifying the Role of Exploration and Exploitation
ABSTRACT
This paper examines the role of confidence in how clinicians balance exploring new diagnoses and exploiting known treatments in handling a diagnostic challenge in acute care. Building on in-depth studies of diagnostic problem solving in a time-pressured acute care setting, we develop a formal mathematical model of the dynamic structures that underlie four diagnostic archetypes: fixating, in which a self-reinforcing exploitation structure dominates; diagnostic vagabonding in which a self-reinforcing exploration structure dominates; stalling, in which neither exploration nor exploitation are sustained, and adapting in which structures for both exploration and exploitation are engaged in balance. We clarify the mechanisms that facilitate and prevent switching between and combining exploring diagnoses and exploiting known treatments. This analysis provides both theoretical insights into the interplay of exploration and exploitation and practical suggestions for reducing diagnostic error and enhancing diagnostic effectiveness.
2
In 1999, the US National Academy of Science’s Institute of Medicine rocked the medical world
with its report that medical errors in US hospitals alone may cause as many as 44,000-98,000
deaths a year. While the exact scope of the medical error problem (Hayward & Hofer, 2001) and
how much progress has been made in reducing this rate (Wachter, 2004) is under debate, we do
understand a great deal more about medication errors, hand-off related errors, hospital-acquired
infections, and wrong-side procedures than we did 10 years ago (Campion, 2003; Gandhi, 2005;
Heimann, 2005; Jagsi et al., 2005; Pronovost et al., 2003; Weick, Sutcliffe, & Obstfeld, 2005).
However, one area of medical error remains largely opaque: errors in diagnostic problem
solving. Recent surveys of the literature on diagnostic error as well as early empirical work find
that, although such errors happen at nontrivial rates (2-5% in radiology, pathology, and possibly
in the double digits in other specialties when autopsies are included) they are understudied both
by researchers and by healthcare organizations’ quality tracking efforts (Berner & Graber, 2006;
Graber, 2005; Schiff et al., 2004). Further, these surveys and older research also find that
clinicians themselves are often unaware of some of the diagnostic errors they've made (Elstein,
Shulman, & Sprafka, 1978). Diagnostic errors are also hard to study because they go to the
heart of physician competence; clinicians often feel that such errors are undiscussable
(Christensen, Levinison, & Dunn, 1992; Crosskerry, 2000; Wu, Folkman, McPhee, & Lo, 1991).
Despite the facts that diagnostic errors are often invisible and hard to track, and physicians rarely
receive feedback on the accuracy of their diagnoses, a small number of studies on diagnostic
problem-solving in process shed some on typical patterns of success and failure modes. The
canonical approach to diagnostic problem solving, promoted in medical school and residency, is
the formulation of a differential diagnosis, a list of candidate diagnoses which are then ruled out:
3
Medical problem solving proceeds by selecting a number of diagnostic hypotheses as possible goals, and then testing to see whether one or more of the hypotheses selected can be justified (Elstein et al., 1978, pg. 21).
There is ample evidence, however, in studies of “fixation error”—a process in which a person
sticks with early-developed meanings despite countervailing external cues—that this process
breaks down in healthcare and elsewhere. Instead, clinicians and others often hit upon an early
diagnosis, build confidence in it (or at least don’t lose confidence in it) such that it filters and
even distorts cues the person extracts from the environment (Cook & McDonald, 1988; De
Keyser & Woods, 1990; Elstein et al., 1978; Finkelstein, 2003; Johnson, Moen, & Thompson,
1988; Johnson & Thompson, 1981; Smith & Blankenship, 1991; Voytovich, Rippey, &
Suffredini, 1985; Xiao & MacKenzie, 1995). Rather than updating the diagnostic story based on
reinterpretation of clinical signs and symptoms, a plausible but incorrect diagnosis persists as
confidence in or commitment to that story escalates in a self-reinforcing cycle that stymies
revision (De Keyser et al., 1990; Starbuck, Greve, & Hedberg, 1978; Staw, 1976). Examples of
this from healthcare and elsewhere include the accidental shoot-down in 1988 by the U.S.S.
Vincennes of a commercial Iranian airliner (Cannon-Bowers & Salas, 1998; Roberts &
Dotterway, 1995), the 1994 friendly fire incident in which American pilots killed other
Americans in a Black Hawk helicopter in Iraq (Snook, 2000), the firestorm in Mann Gulch,
Montana in 1949 that killed 13 smoke jumpers (Weick, 1993b), and the death in 2003 of a 17-
year-old girl at Duke University after receiving a heart-lung transplant from an incompatible
donor (Campion, 2003).
Though we know much about fixation error as a type of diagnostic error, it is likely that the
variety and ubiquity of diagnostic errors do not make them amenable to what Reason calls “
‘tokenism’—focusing remedial efforts on preventing the recurrence of specific unsafe acts”
(Reason, 1990, pg 206). Instead, organizational theory can help reduce diagnostic errors and
4
improve patient safety by providing concepts that help us identify generalizable patterns in both
diagnostic error and diagnostic effectiveness. One area of organizational theory that lends itself
to mapping general patterns in diagnostic problem solving is the conceptual dichotomy between
the exploitation and exploration articulated by James March (March, 1991; March, 1996; March,
2006).
Rather than address all diagnostic problem solving, this paper focuses on the problem of
diagnostic error and effectiveness in settings where there is diagnostic ambiguity in an acute care
setting, with some time pressure; settings where the patient can deteriorate over minutes rather
than hours or days such as the operating room (OR), emergency department (ED) or the intensive
care unit (ICU). The diagnostic challenge we study is how a doctor keeps a patient clinically
stable while also confronting a serious, ambiguous clinical problem with the potential to harm
the patient. In such a situation, doctors must explore the clinical terrain, examining clinical signs
and symptoms, and occasionally test or question the soundness of their own diagnostic story,
while also exploiting known treatment algorithms and studies as they pursue therapy to stabilize
the patient (Elstein et al., 1978; Johnson, Hassenbrock, Duran, & Moller, 1982; Klein, Phillips,
Rall, & Peluso, 2006; Klein, Pliske, Crandall, & Woods, 2005). In this situation, doctors must
diagnose an unfamiliar or novel presentation of a problem and, at the same time, pursue routine
treatments or tests quickly.
To model how doctors balance exploration and exploitation to manage this sort of diagnostic
problem, we began by clarifying what we mean by exploration and exploitation. March distilled
central streams of broad organizational literatures in strategy and organizational learning
concerned with when people should pursue what they already know versus try new approaches
into the potent dichotomy between “exploiting old certainties” and “exploring new possibilities”
5
(March, 1991; March, 1996; March, 2006). Exploitation, according to March, includes
approaches like “refinement, choice, production, efficiency, selection, implementation,
execution” (March, 1991: 71) and exploration approaches like “search, variation, risk taking
experimentation, play, flexibility, discovery, innovation” (March, 1991: 71). The concepts of
exploration and exploitation provide a way to examine the processes of inertia and change in an
emerging diagnostic story and doctors’ confidence in how that story fits with external reality.
The expression “exploration” may call to mind search, discovery or even adventure somewhere
“out there.” But the organization studies literature also indicates that exploration in diagnostic
problem solving of any sortin the sense of experimentation, hypothesis testing, and cognitive
flexibilityalso requires the willingness to question one’s own internal expectations and
assumptions (Bartunek, 1984; Kegan, 1994; Nielsen & Bartunek, 1996; Torbert, 1991). Such
internal exploration can be particularly difficult in stressful acute care environments where
psychological and cognitive processes drive people toward exploitation of well-learned
responses (Rudolph & Repenning, 2002; Staw, Sandelands, & Dutton, 1981; Weick, 1993b).
Exploitation, on the other hand, requires having enough confidence in a diagnosis to hold it
firmly in mind and thoroughly pursue relevant treatment algorithms, which in turn provides
evidence about the current clinical problem.
Organizational research concerned with the challenges and trade-offs between exploring new
possibilities and exploiting known certainties has revealed much about when each is optimal
(Carroll, Rudolph, & Hatakenaka, 2002; Gupta, Smith, & Shalley, 2006; March, 1991; March,
1996; March, 2006; Repenning & Sterman, 2002; Torbert, 1991; Weick, Sutcliffe, & Obstfeld,
1999) Through this research we have learned that in situations where certainty is high and
managing a large quantity of routine demands is important, exploiting established knowledge
6
and skills using standard operating procedures, single-loop learning, or managerial controls will
likely be effective (Galbraith, 1972; March, 1991; Rudolph et al., 2002; Sitkin, Sutcliffe, &
Schroeder, 1994; Staw et al., 1981). When certainty is low and the demands on people are novel,
or unfamiliar, exploration of new possibilities through rethinking problems, improvisation,
widening our attention, reframing, and double-loop learning are the best approaches (Cooper &
Gaba, 1989; Galbraith, 1972; March, 1991; Pearson & Clair, 1998; Sitkin et al., 1994; Weick,
1993b, Weick, 1993c #160). We have also learned that the pace and timing of adaptation—how
quickly and when a person or system gives up exploiting existing strategies and explores new
ones or vice versa has an important impact on performance (Ancona & Caldwell, 1992; Cohen,
Freeman, & Thompson, 1998; Gersick, 1988; March, 1991; Sastry, 1997; Waller, 1999).
This previous research tells us what sorts of problems are amenable to tactics of exploration and
which to tactics of exploitation. Computer simulations have provided insight about how the two
activities interact at the organizational level over weeks and months (March, 1991; Sastry, 1997).
We know little, however, about the exact mechanisms by which individuals move back and forth
between exploration and exploitation in short time frames or what triggers or prevents such
movement. To address this gap, we use a grounded theory approach to induce a formal
mathematical model of the interplay of exploration and exploitation in diagnostic problem
solving.
Drawing on theory and data from an in-depth observational study of diagnostic problem solving
by 39 doctors facing the same acute care scenario in high-fidelity simulated operating room
crises (Rudolph, 2003; Rudolph & Raemer, 2004), other studies of diagnostic problem solving,
((Cohen, Freeman, & Wolf, 1996; Cook et al., 1988; Cook & Woods, 1994; De Keyser et al.,
1990; Dörner, 1997; Elstein et al., 1978; Johnson et al., 1982; Xiao et al., 1995), and
7
organizational theory on exploration and exploitation, we develop and analyze a dynamic model
of a single clinician attempting to diagnose and resolve a challenging problem. Through the
model building and simulation process, we are able to induce an internally consistent theory of
how people move back and forth between exploration and exploitation and the impact of this
interplay on diagnostic problem solving. Our analysis provides a new characterization of the
role of confidence in how diagnostic errors come about and how they can be avoided.
METHODS To clarify general patterns of diagnostic error and effectiveness, we developed a mathematical
model of how clinicians move back and forth between or combine exploration and exploitation
in diagnostic problem solving. In contrast to many formal models in the medical decision-
making literature, we did not deduce ours from general principles, but, rather using the methods
of grounded theory, induced it from theory and data found in an in-depth study of diagnostic
problem solving, other studies of diagnostic problem solving, as well as related literature on
exploration and exploitation. While grounded theory is most commonly used to build theory
from raw data using qualitative analysis, the method is not restricted to this application
(Suddaby, 2006). Strauss and Corbin (1994) were proponents of developing formal (or general)
theories grounded in previously generated domain-specific (or substantive) analyses. Strauss and
Corbin (1994) pointed out that Glaser and Strauss (1967) not only advocated using grounded
theory with quantitative (not just qualitative) analysis, but also suggested using it to generate
theory from theory.
Our goal was to develop a general explanation of what facilitates and prevents clinicians moving
back and forth between and combining exploration and exploitation in diagnostic problem
solving, both crucial processes in avoiding diagnostic errors. We chose formal modeling as a
8
tool for enriching theory on diagnostic problem solving for two reasons. First, while the
organizational studies literature is clear about how and when to use exploration and exploitation
separately and has deduced from general principles the idea that exploration and exploitation
must either be combined simultaneously (ambidexterity) or in a pattern resembling punctuated
equilibrium (Gupta et al., 2006), the mechanisms that allow people to or prevent them from
alternating between the two or combining them is much less clear. Since these processes are
hard to study naturalistically, modeling provides a way to synthesize findings from a range of
studies that illuminate the switching process. Second, despite their variety, existing analyses of
exploration and exploitation converge in outlining an inherently dynamic process (Gupta et al.,
2006; March, 1991). Theorizing about such processes without formal models is notoriously
error-prone and can lead to important logical gaps and inconsistencies cf. (Sastry, 1997; Sterman,
1994). Inducing a formal mathematical model from existing data and theory provides an
approach for both identifying structures common to the different narratives and for enforcing the
internal consistency of the emerging theory. Similar formal modeling efforts across a variety of
organizational domains demonstrate how this process clarifies structures common to the different
narratives and enforces the internal consistency of the emerging theory (Black, Carlile, &
Repenning, 2004; Rudolph et al., 2002; Sastry, 1997; Sterman & Wittenberg, 1999). Translating
a narrative theory into a mathematical model loses some of the richness and nuance of the
original. The benefit, however, is an internally and dynamically consistent theory whose central
structures and relationships are explicitly, rather than implicitly, represented.
The genesis of our theory was Rudolph’s in-depth analysis of diagnostic problem solving in
operating room crises (Rudolph, 2003; Rudolph et al., 2004). Following established procedures
for grounded theory building (Strauss et al., 1994; Suddaby, 2006), we used Rudolph’s typology
9
of four diagnostic problem solving modes as our source data and started the theory building
process by translating her text-based constructs and theoretical relationships into the system
dynamics language of stocks, flows, and feedback loops (Forrester, 1961; Sterman, 2000). To
construct the model (which represents our theory) we used a process of constant comparison
between our diagrams and the constructs and relationships identified in other of studies
diagnostic problem solving. (Cohen et al., 1996; Cook et al., 1988; De Keyser et al., 1990;
Elstein et al., 1978; Johnson et al., 1982; Johnson et al., 1988; Klayman, 1988; Klayman & Ha,
1987; Klein et al., 2006; Klein, Orasanu, Calderwood, & Zsambok, 1993; Xiao et al., 1995).
Through this processes of iterative model elaboration and revision, we translated the emerging
set of relationships into a formal mathematical model and then used computer simulation to
analyze it. Lastly, we returned to the Rudolph’s empirical data as well as the literatures on
exploration and exploitation and diagnostic problem solving, noting both similarities and
differences. The result is a theory that addresses gaps in the literature on diagnostic error and in
our understanding of how exploration and exploitation interact: how and when people move
between exploration and exploitation, when they are combined, and the impact on diagnostic
error. 1
FOUR MODES OF DIAGNOSTIC PROBLEM SOLVING: EMPIRCAL DATA
To ground the mathematical model (presented in the next section) in concrete data, we describe
in this section the clinical challenge that served as the basis of our grounded theory building, and
the initial study of that challenge (Rudolph, 2003; Rudolph et al., 2004). The study examined 1 A technical appendix with complete model documentation appears at the end of the paper; this appendix as well as simulation instructions and a simulating version of the model is available from the authors. The model is created and analyzed using the Vensim software, available from Ventanna Systems, see <www.Ventanna.com>.
10
diagnostic problem solving by 39 anesthesia residents in a full-field, high-fidelity medical
simulation that was part of an on-going training program in clinical crisis resource management2
In the simulation scenario studied, the anesthesiologist is called to take over anesthesia in an
operating room where a 29-year-old woman urgently needs an appendectomy. The scenario
presents a common, but serious problem in anesthesia: difficulty with the airway or ventilation.
A variety of diagnoses for the ventilation problem are plausible, but contradictory evidence is
present for each, except one: The patient has exhaled some mucous into the tube, partially
blocking it. Some air can get through the tube, but not enough for the patient to survive. This is
the actual cause of the problem. Treatments addressing problems other than the mucous plug in
the breathing tube will not result in any sustained improvement in the patient’s status. In fact,
the patient’s oxygen saturation level, the amount of oxygen circulating in their blood,
deteriorates steadily and at an increasing rate, unless the doctor identifies the source of the
problem, the partially blocked tube. The patient can have uneven heartbeat and even go into
cardiac arrest if the problem is not rectified. Other personnel in the OR are loosely scripted staff
.
In these settings, described in depth elsewhere (Gaba, 1994; Gaba & DeAnda, 1989), trainees
confront rare and/or difficult medical crisis scenarios in settings equipped and staffed
appropriately for the clinical situation by role-playing simulation staff. The “patient” is a voiced,
computer-controlled plastic mannequin capable of simulating life signs, fluid and electrolyte
balance, airway gas exchange, hemodynamics (e.g., blood pressure, heart rate), and
pharmacological responses to about 100 medications.
2 We use the term “simulation” in two ways in this paper. The first use refers to the initial source data for the study. These data were provided by a full-field, high-fidelity simulation (i.e. the research participant is in a fully equipped, actual OR with a computer controlled mannequin patient). The second use of the term refers to the computer-based simulation we conducted to analyze the behavior of our mathematical model.
11
and faculty of the simulation center: the surgeon, circulating nurse, and scrub nurse. The scenario
ran for about 25 minutes.
Rudolph identified four different problem solving modes for dealing with this diagnostic
challenge, each with different blends of exploration and exploitation. She defined exploitation in
diagnostic problem solving as the degree to which people use existing routines, algorithms, and
heuristics to generate and take specific actions (e.g. therapeutic treatments) to address given
problems within the context of an existing diagnosis or situation assessment. Exploitation in
diagnostic problem solving requires holding a clear diagnostic frame and utilizing known
treatments for that diagnosis. For example, if a doctor who thinks diagnosis A is the problem
uses the first line treatment for diagnosis A and then the second line treatment, she is exploiting
her existing knowledge of the algorithm for addressing Diagnosis A.
Exploration in diagnostic problem solving refers to the breadth of diagnoses and clinical signs
clinicians consider, and the extent to which they test or examine the soundness of these
diagnoses. For example, if a doctor considers 5 possible diagnoses, this is broader exploration
than considering 1. If she carries out diagnostic tests of one or more of these diagnoses, she is
exploring the validity of her current diagnostic story.
To diagnose an acute care problem involving a concrete physical problem (such as a partially
blocked breathing tube), there is a physical, clinical issue to be addressed. In the case of the
partially blocked breathing tube, exploiting a known treatment for the wrong problem, however
skillful, will not resolve the problem. Similarly, exploring new diagnostic possibilities, if not
coupled with determined treatments or tests to stir up feedback, will also not solve the problem.
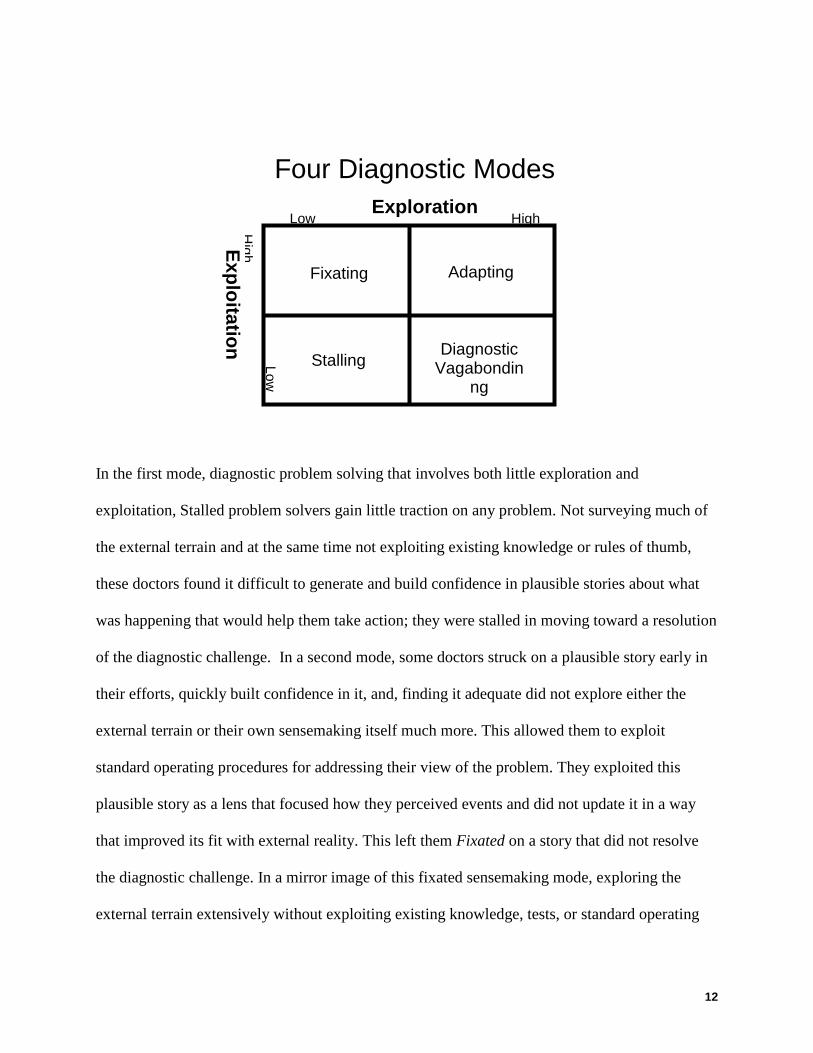
Conceptualizing exploration and exploitation as two orthogonal dimensions of sensemaking
allowed these modes to be mapped as a function of different levels of each (see Figure 1).
12
In the first mode, diagnostic problem solving that involves both little exploration and
exploitation, Stalled problem solvers gain little traction on any problem. Not surveying much of
the external terrain and at the same time not exploiting existing knowledge or rules of thumb,
these doctors found it difficult to generate and build confidence in plausible stories about what
was happening that would help them take action; they were stalled in moving toward a resolution
of the diagnostic challenge. In a second mode, some doctors struck on a plausible story early in
their efforts, quickly built confidence in it, and, finding it adequate did not explore either the
external terrain or their own sensemaking itself much more. This allowed them to exploit
standard operating procedures for addressing their view of the problem. They exploited this
plausible story as a lens that focused how they perceived events and did not update it in a way
that improved its fit with external reality. This left them Fixated on a story that did not resolve
the diagnostic challenge. In a mirror image of this fixated sensemaking mode, exploring the
external terrain extensively without exploiting existing knowledge, tests, or standard operating
Four Diagnostic Modes
Exploration Low High
Exploitation H
igh Low
Fixating Adapting
Stalling Diagnostic
Vagabondinng
13
procedures created a sensemaking approach that jumped, like a vagabond moving from place to
place, from plausible story to plausible story3
MODEL STRUCTURE
without taking action that provided feedback on
the accuracy of any one. Without clear feedback, these Diagnostic Vagabonds did not take action
that resolved the diagnostic challenge. Lastly, those in the Adaptive sensemaking mode explored
the external terrain (surveying different aspects of it) and explored the internal terrain by testing
their diagnostic story as they went though studies and tests. In this mode clinicians also exploited
standard operating procedures that generated concrete feedback to help update a plausible story
(or stories) about the crisis in a way that improved its accuracy enough to resolve the crisis.
OVERVIEW Our model assumes that the doctor observes some problem with the patient, and this prompts her
to generate diagnoses about the cause of the problem often in an automatic, unconscious process
so that she can take action. One of these diagnoses is the leading one in her mind. In our model
call this leading diagnosis the current diagnosis. The current diagnosis serves a dual role. First,
the current diagnosis may be a catalyst for action, guiding therapeutic interventions that might
improve the patient’s condition if the diagnosis is correct. Second, the current diagnosis in some
cases may be treated as a hypothesis that can be held up for testing by experiments to gather data
that shape the current diagnostic story. Since the goal of our model is to uncover patterns in how
clinicians move back and forth between or combine exploration and exploitation, we streamline
the challenge facing the clinician to set these patterns in stark relief. Thus, the challenge for the
stylized diagnostician in our model is to 1) hit upon the diagnosis that solves the problem (e.g. as
with our source data, only one diagnosis will resolve the clinical issue); and 2) to determine that
3 We've adapted Dietrich Dörner's term "thematic vagabonding" which he uses to describe a similar phenomenon among public officials conducting scenario planning simulations. Dörner, D. 1997. The Logic of Failure: Recognizing and avoiding error in complex situations. New York: Perseus.
14
it is indeed the diagnosis that will work. Therefore, in our model we assume that once the
diagnostician has determined the right diagnosis, proper treatment and improved patient status
will follow.
Linking to Rudolph’s four problem solving modes, Stalling occurs when the diagnosticians do
not generate a current diagnosis. Fixating occurs when they do not discard their leading or
current diagnosis and never discover the one that solves the problem. Vagabonding occurs when
they jump from current diagnosis to current diagnosis, perhaps hitting upon the one that solves
the problem, but not recognizing that it will resolve the problem and therefore discarding it.
Adaptive problem solving occurs only when the clinicians both discover the correct diagnosis
and determine that it is the correct one.
CONFIDENCE IN CURRENT DIAGNOSIS The central construct in our model is Confidence in the Current Diagnosis (See Figure 2.) We
focus our analysis on this variable because previous research suggests it is the fulcrum on which
exploration and exploitation is balanced. Studies of tactical decision-making under stress
(Cannon-Bowers et al., 1998), problem detection (Klein et al., 2005; Mandler, 1982), and
naturalistic decision-making in the field (Klein et al., 1993; Snook, 2000; Zsambok & Klein,
1997) indicate that gaining and losing confidence in a particular diagnosis or situation
assessment influences whether the problem solver sticks with the current assessment and exploits
treatment algorithms for that problem or steps back to reconsider and explore new possibilities.
We operationalize Confidence in Current Diagnosis as a measure ranging from 0 to 1 to
represent of the diagnostician’s current belief about the likelihood that the current diagnosis is
the correct one. When the first diagnosis emerges, the diagnostician has a beginning estimate
15
given by the Confidence in a New Diagnosis. We will choose different values for this initial
confidence level to model the different problem solving modes.
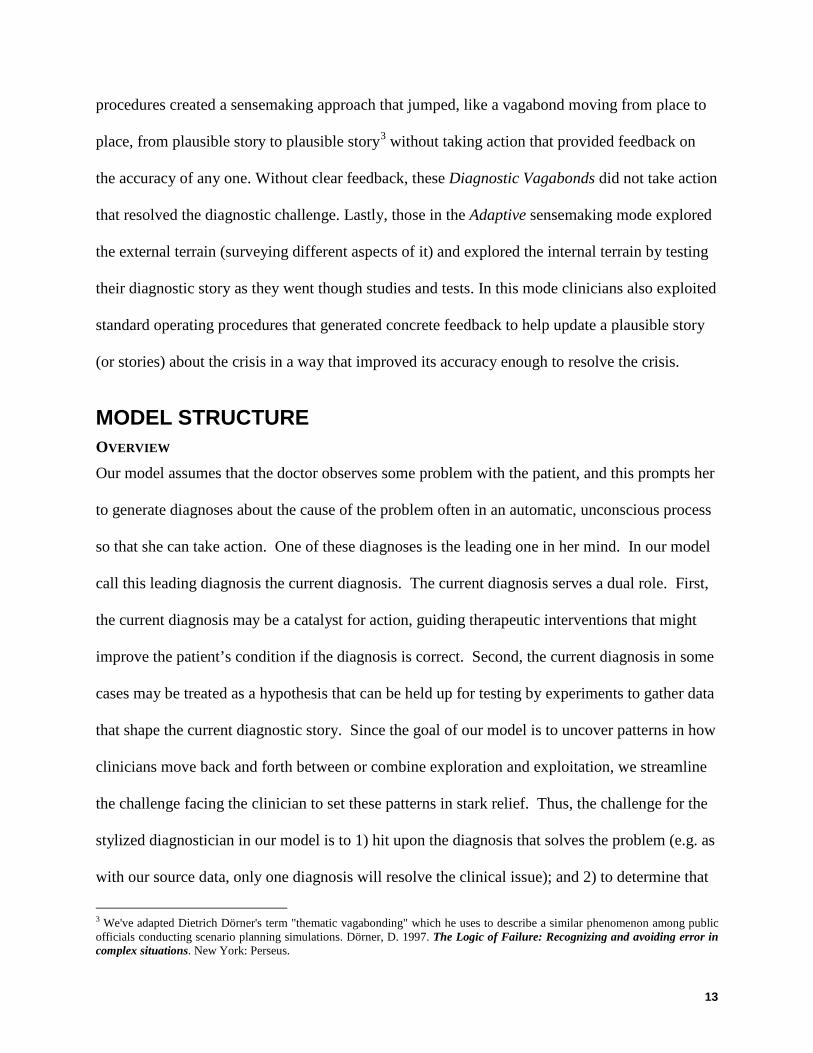
Figure 2: Confirming the Current Diagnosis
As the doctor takes actions, observes results, and monitors the patient’s progress, the Confidence
in the Current Diagnosis may go up or down. The primary means for the doctor to update the
Confidence in Current Diagnosis is to conduct Treatments and Studies that discover evidence
regarding fit of the diagnosis with external signs and symptoms. Figure 2 shows that as
Confidence in the Current Diagnosis goes up, the doctor conducts more Treatments and Studies.
This in turn increases the rate of Discovering Evidence. The evidence the doctor discovers may
cause him to gain or lose confidence in the current diagnosis. In the Confirmation loop depicted
in Figure 2, discovering more evidence leads to Gaining Confidence and thus even greater
Confidence in the Current Diagnosis. Continuing to discover evidence supportive of the current
diagnosis, which in turn increases confidence in the diagnosis, is a reinforcing process.
Confidence inCurrent Diagnosis
Treatmentsand Studies
Effect ofConfidence
RDiscovering
Evidence+
Confidence in aNew Diagnosis
+
+
+
Confirmation
GainingConfidence in
Diagnosis+
+
16
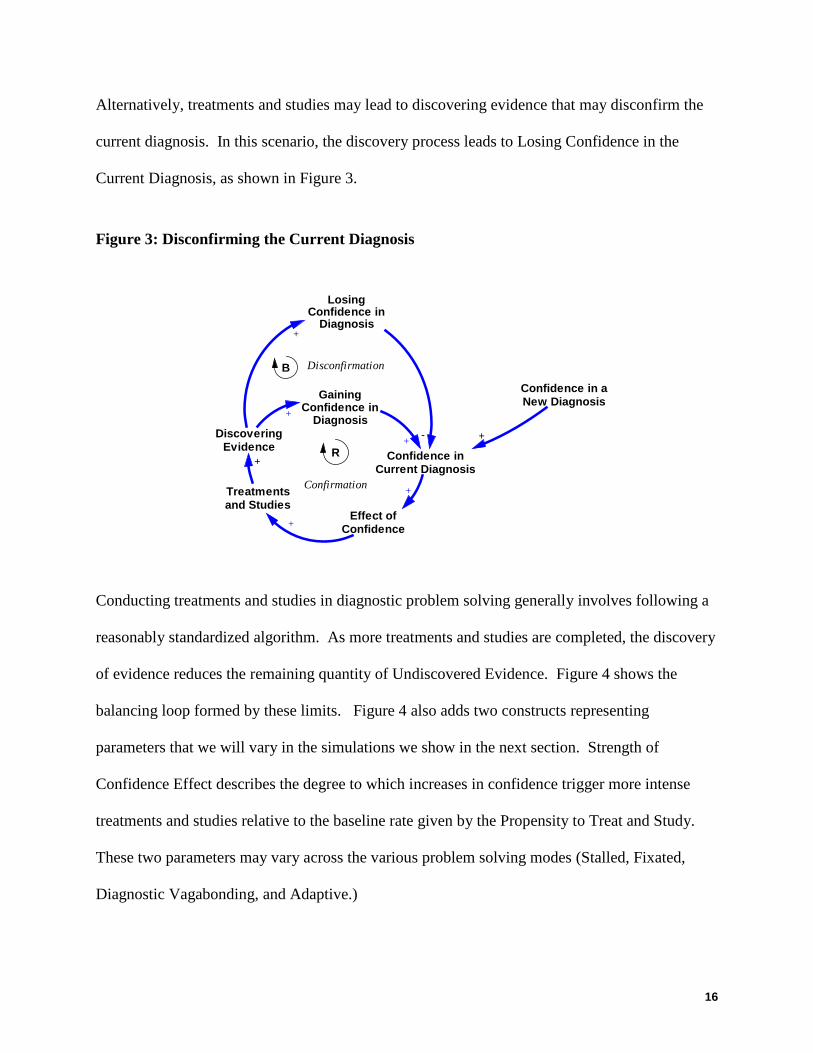
Alternatively, treatments and studies may lead to discovering evidence that may disconfirm the
current diagnosis. In this scenario, the discovery process leads to Losing Confidence in the
Current Diagnosis, as shown in Figure 3.
Figure 3: Disconfirming the Current Diagnosis
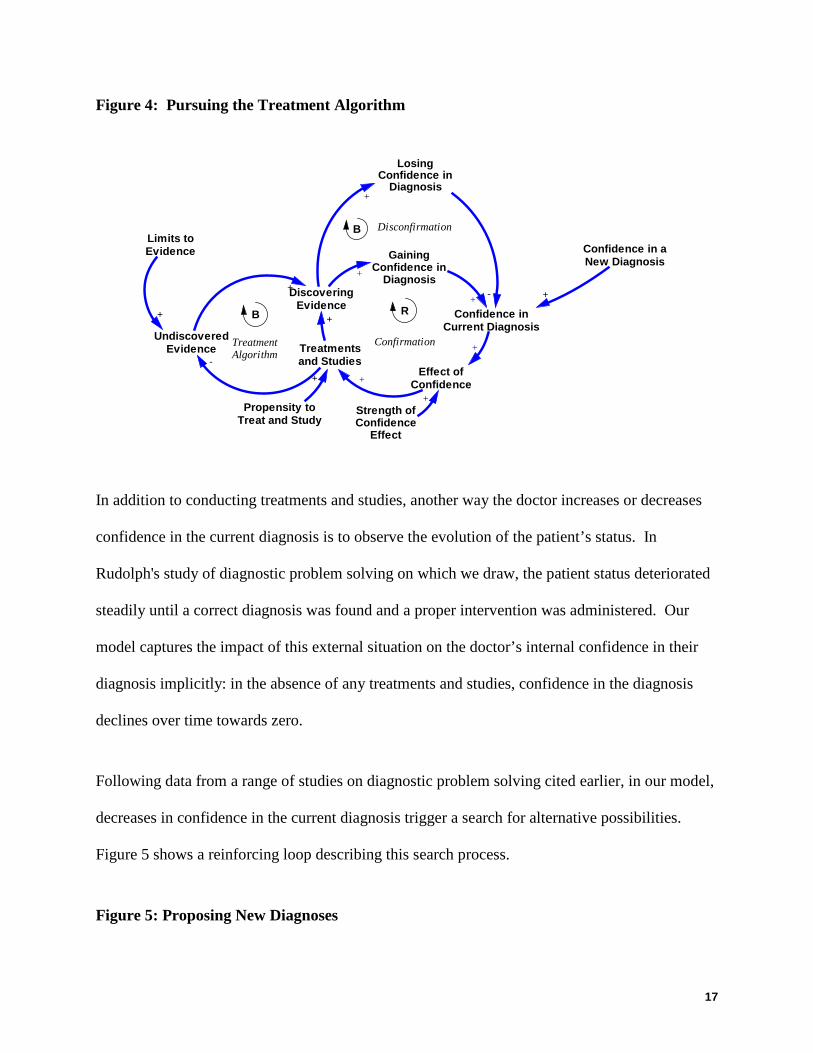
Conducting treatments and studies in diagnostic problem solving generally involves following a
reasonably standardized algorithm. As more treatments and studies are completed, the discovery
of evidence reduces the remaining quantity of Undiscovered Evidence. Figure 4 shows the
balancing loop formed by these limits. Figure 4 also adds two constructs representing
parameters that we will vary in the simulations we show in the next section. Strength of
Confidence Effect describes the degree to which increases in confidence trigger more intense
treatments and studies relative to the baseline rate given by the Propensity to Treat and Study.
These two parameters may vary across the various problem solving modes (Stalled, Fixated,
Diagnostic Vagabonding, and Adaptive.)
Confidence inCurrent Diagnosis
Treatmentsand Studies
Effect ofConfidence
R
Disconfirmation
DiscoveringEvidence
+
Confidence in aNew Diagnosis
+
+
+
LosingConfidence in
Diagnosis+
-
B
Confirmation
GainingConfidence in
Diagnosis+
+
17
Figure 4: Pursuing the Treatment Algorithm
In addition to conducting treatments and studies, another way the doctor increases or decreases
confidence in the current diagnosis is to observe the evolution of the patient’s status. In
Rudolph's study of diagnostic problem solving on which we draw, the patient status deteriorated
steadily until a correct diagnosis was found and a proper intervention was administered. Our
model captures the impact of this external situation on the doctor’s internal confidence in their
diagnosis implicitly: in the absence of any treatments and studies, confidence in the diagnosis
declines over time towards zero.
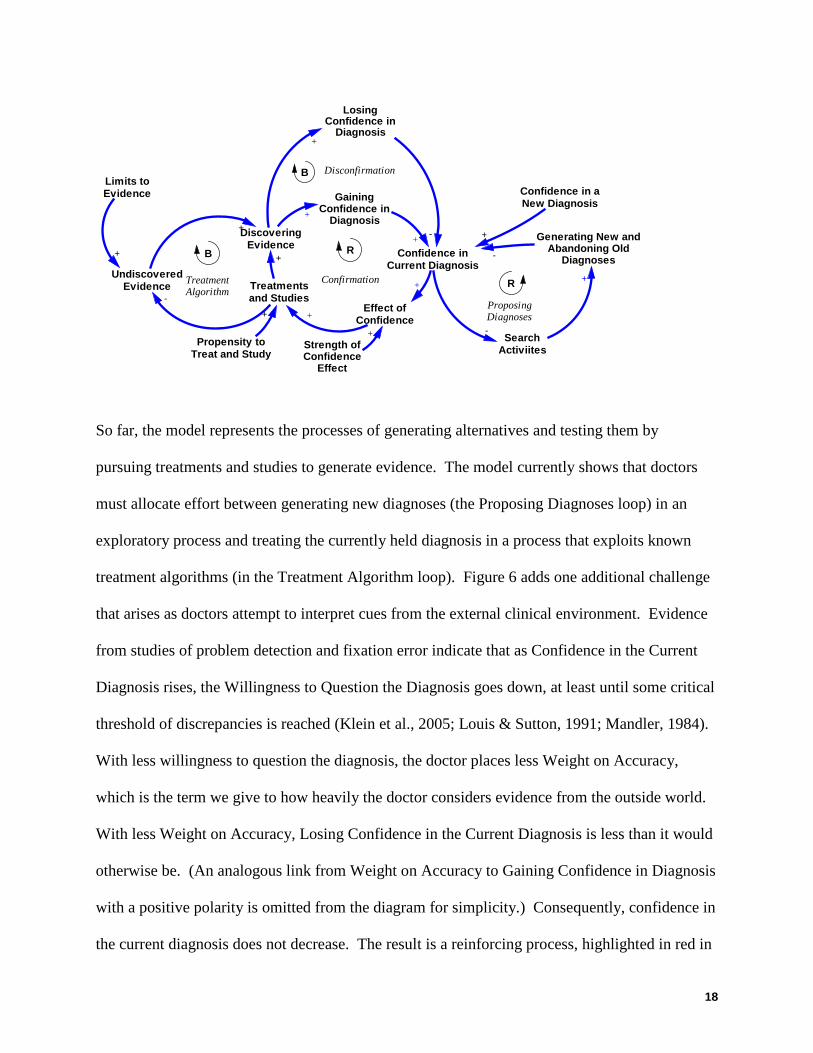
Following data from a range of studies on diagnostic problem solving cited earlier, in our model,
decreases in confidence in the current diagnosis trigger a search for alternative possibilities.
Figure 5 shows a reinforcing loop describing this search process.
Figure 5: Proposing New Diagnoses
Confidence inCurrent Diagnosis
Treatmentsand Studies
Effect ofConfidence
R
UndiscoveredEvidence
-
+
Limits toEvidence
+ B
Disconfirmation
DiscoveringEvidence
+
Propensity toTreat and Study
+
Strength ofConfidence
Effect
TreatmentAlgorithm
Confidence in aNew Diagnosis
+
+
+
+
LosingConfidence in
Diagnosis+
-
B
Confirmation
GainingConfidence in
Diagnosis+
+
18
So far, the model represents the processes of generating alternatives and testing them by
pursuing treatments and studies to generate evidence. The model currently shows that doctors
must allocate effort between generating new diagnoses (the Proposing Diagnoses loop) in an
exploratory process and treating the currently held diagnosis in a process that exploits known
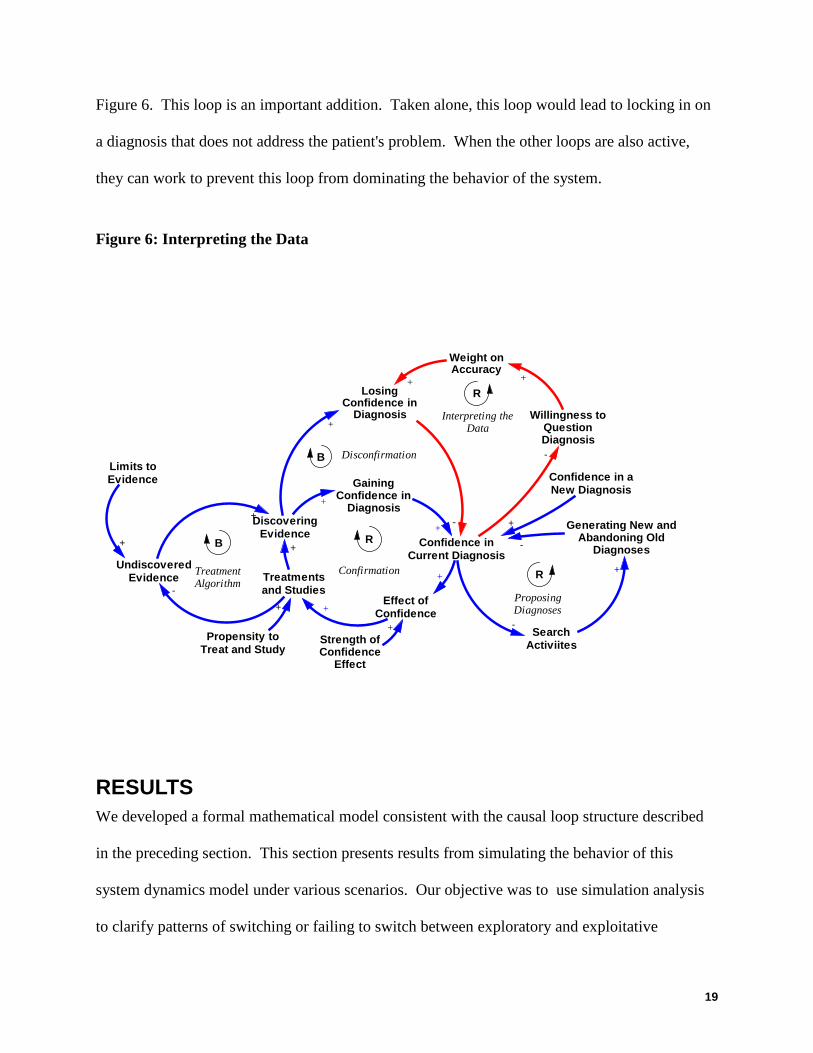
treatment algorithms (in the Treatment Algorithm loop). Figure 6 adds one additional challenge
that arises as doctors attempt to interpret cues from the external clinical environment. Evidence
from studies of problem detection and fixation error indicate that as Confidence in the Current
Diagnosis rises, the Willingness to Question the Diagnosis goes down, at least until some critical
threshold of discrepancies is reached (Klein et al., 2005; Louis & Sutton, 1991; Mandler, 1984).
With less willingness to question the diagnosis, the doctor places less Weight on Accuracy,
which is the term we give to how heavily the doctor considers evidence from the outside world.
With less Weight on Accuracy, Losing Confidence in the Current Diagnosis is less than it would
otherwise be. (An analogous link from Weight on Accuracy to Gaining Confidence in Diagnosis
with a positive polarity is omitted from the diagram for simplicity.) Consequently, confidence in
the current diagnosis does not decrease. The result is a reinforcing process, highlighted in red in
Confidence inCurrent Diagnosis
Treatmentsand Studies
-Search
Activiites
Generating New andAbandoning Old
Diagnoses-
+
Effect ofConfidence
R
R
UndiscoveredEvidence
-
+
Limits toEvidence
+ B
Disconfirmation
ProposingDiagnoses
DiscoveringEvidence
+
Propensity toTreat and Study
+
Strength ofConfidence
Effect
TreatmentAlgorithm
Confidence in aNew Diagnosis
+
+
+
+
LosingConfidence in
Diagnosis+
-
B
Confirmation
GainingConfidence in
Diagnosis+
+
19
Figure 6. This loop is an important addition. Taken alone, this loop would lead to locking in on
a diagnosis that does not address the patient's problem. When the other loops are also active,
they can work to prevent this loop from dominating the behavior of the system.
Figure 6: Interpreting the Data
RESULTS We developed a formal mathematical model consistent with the causal loop structure described
in the preceding section. This section presents results from simulating the behavior of this
system dynamics model under various scenarios. Our objective was to use simulation analysis
to clarify patterns of switching or failing to switch between exploratory and exploitative
Confidence inCurrent Diagnosis
Treatmentsand Studies
-Search
Activiites
Generating New andAbandoning Old
Diagnoses-
+
Effect ofConfidence
R
R
Willingness toQuestionDiagnosis-
UndiscoveredEvidence
-
+
Limits toEvidence
+
R
B
Disconfirmation
ProposingDiagnoses
DiscoveringEvidence
+
Propensity toTreat and Study
+
Strength ofConfidence
Effect
TreatmentAlgorithm
Confidence in aNew Diagnosis
+
Interpreting theData
Weight onAccuracy
+
+
+
+
LosingConfidence in
Diagnosis+
-
B
Confirmation
+
GainingConfidence in
Diagnosis+
+
20
activities that produce the problem solving modes observed in the field study from which we
induced our theory.
Recall that the central construct in our model is the Confidence in Current Diagnosis. An
adaptive problem solving process will generate declining confidence in a diagnosis that is
incorrect eventually leading to replacing the flawed diagnosis with a new one. If the next
diagnosis is also incorrect, the process should again deplete confidence and yield a replacement,
and so on until the current diagnosis is correct. When the current diagnosis is the correct one, the
process should exhibit increasing confidence and a steady-state convergence on the correct
diagnosis. The replacement of one diagnosis with another is modeled as a discontinuous process
triggered when the confidence in the current diagnosis drops below a specified threshold value.
In the model, this trigger instantly replaces the current diagnosis with a new one for which the
value of confidence is given by the Confidence in New Diagnosis. We also control for any
effects of random search by assuming that all diagnosticians generate alternative diagnoses in the
same sequence. Specifically, we say that the first, second, and third diagnoses considered are
incorrect, the fourth is correct, and the fifth and all others after that are incorrect. In the
simulation results that follow, the time scale begins with the first diagnosis in place at a
confidence set by the value of the Confidence in New Diagnosis parameter. (It is trivial in this
model to replicate the stalled mode of problem solving, in which no diagnosis is generated, so we
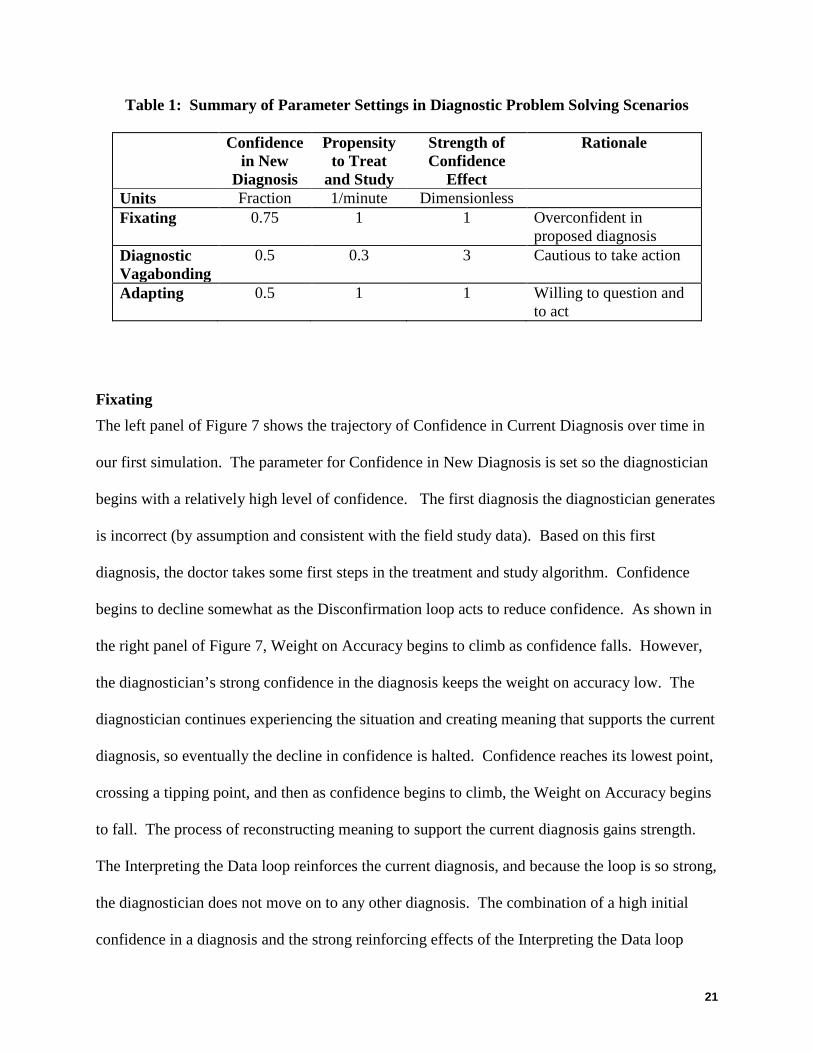
will not comment further on this mode.) Table 1 shows the parameters used to generate the
simulated problem solving modes in the following graphs.
21
Table 1: Summary of Parameter Settings in Diagnostic Problem Solving Scenarios
Confidence in New
Diagnosis
Propensity to Treat
and Study
Strength of Confidence
Effect
Rationale
Units Fraction 1/minute Dimensionless Fixating 0.75 1 1 Overconfident in
proposed diagnosis Diagnostic Vagabonding
0.5 0.3 3 Cautious to take action
Adapting 0.5 1 1 Willing to question and to act
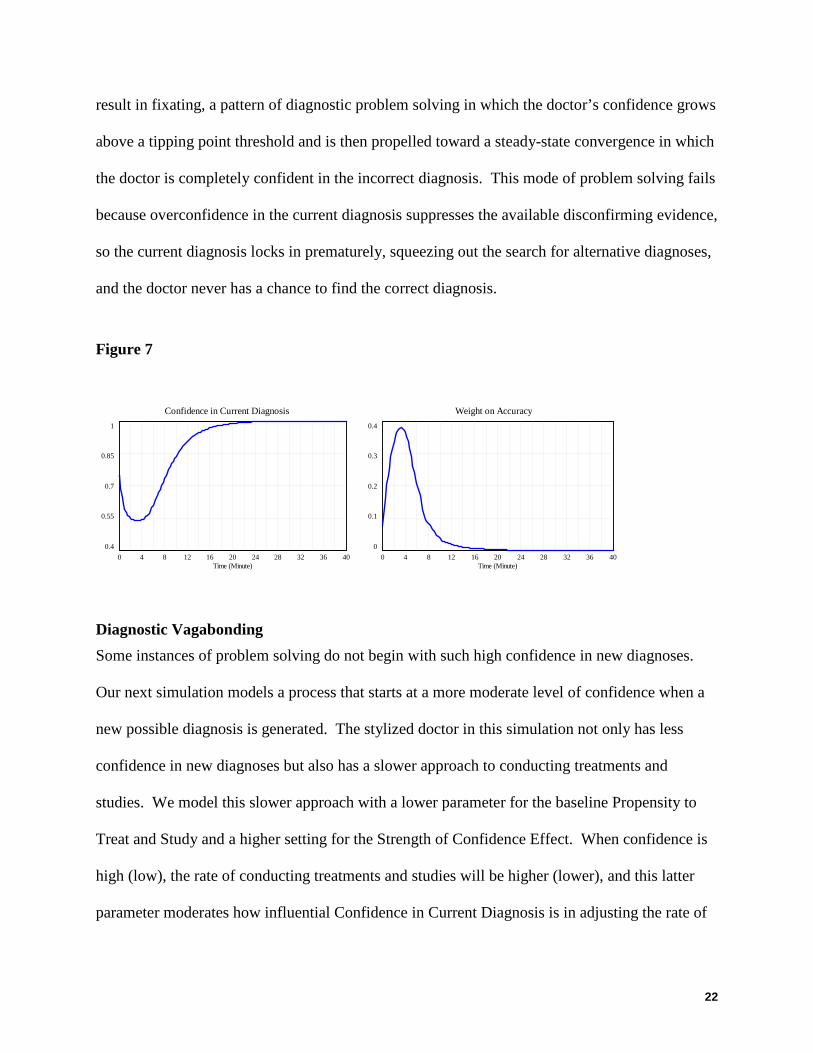
Fixating The left panel of Figure 7 shows the trajectory of Confidence in Current Diagnosis over time in
our first simulation. The parameter for Confidence in New Diagnosis is set so the diagnostician
begins with a relatively high level of confidence. The first diagnosis the diagnostician generates
is incorrect (by assumption and consistent with the field study data). Based on this first
diagnosis, the doctor takes some first steps in the treatment and study algorithm. Confidence
begins to decline somewhat as the Disconfirmation loop acts to reduce confidence. As shown in
the right panel of Figure 7, Weight on Accuracy begins to climb as confidence falls. However,
the diagnostician’s strong confidence in the diagnosis keeps the weight on accuracy low. The
diagnostician continues experiencing the situation and creating meaning that supports the current
diagnosis, so eventually the decline in confidence is halted. Confidence reaches its lowest point,
crossing a tipping point, and then as confidence begins to climb, the Weight on Accuracy begins
to fall. The process of reconstructing meaning to support the current diagnosis gains strength.
The Interpreting the Data loop reinforces the current diagnosis, and because the loop is so strong,
the diagnostician does not move on to any other diagnosis. The combination of a high initial
confidence in a diagnosis and the strong reinforcing effects of the Interpreting the Data loop
22
result in fixating, a pattern of diagnostic problem solving in which the doctor’s confidence grows
above a tipping point threshold and is then propelled toward a steady-state convergence in which
the doctor is completely confident in the incorrect diagnosis. This mode of problem solving fails
because overconfidence in the current diagnosis suppresses the available disconfirming evidence,
so the current diagnosis locks in prematurely, squeezing out the search for alternative diagnoses,
and the doctor never has a chance to find the correct diagnosis.
Figure 7
Diagnostic Vagabonding Some instances of problem solving do not begin with such high confidence in new diagnoses.
Our next simulation models a process that starts at a more moderate level of confidence when a
new possible diagnosis is generated. The stylized doctor in this simulation not only has less
confidence in new diagnoses but also has a slower approach to conducting treatments and
studies. We model this slower approach with a lower parameter for the baseline Propensity to
Treat and Study and a higher setting for the Strength of Confidence Effect. When confidence is
high (low), the rate of conducting treatments and studies will be higher (lower), and this latter
parameter moderates how influential Confidence in Current Diagnosis is in adjusting the rate of
Confidence in Current Diagnosis1
0.85
0.7
0.55
0.40 4 8 12 16 20 24 28 32 36 40
Time (Minute)
Weight on Accuracy0.4
0.3
0.2
0.1
00 4 8 12 16 20 24 28 32 36 40
Time (Minute)
23
conducting treatments and studies. The stylized doctor in this simulation is quite capable of
generating new diagnoses but is neither particularly sure of them nor prone to pursue treatments
and studies based on them.
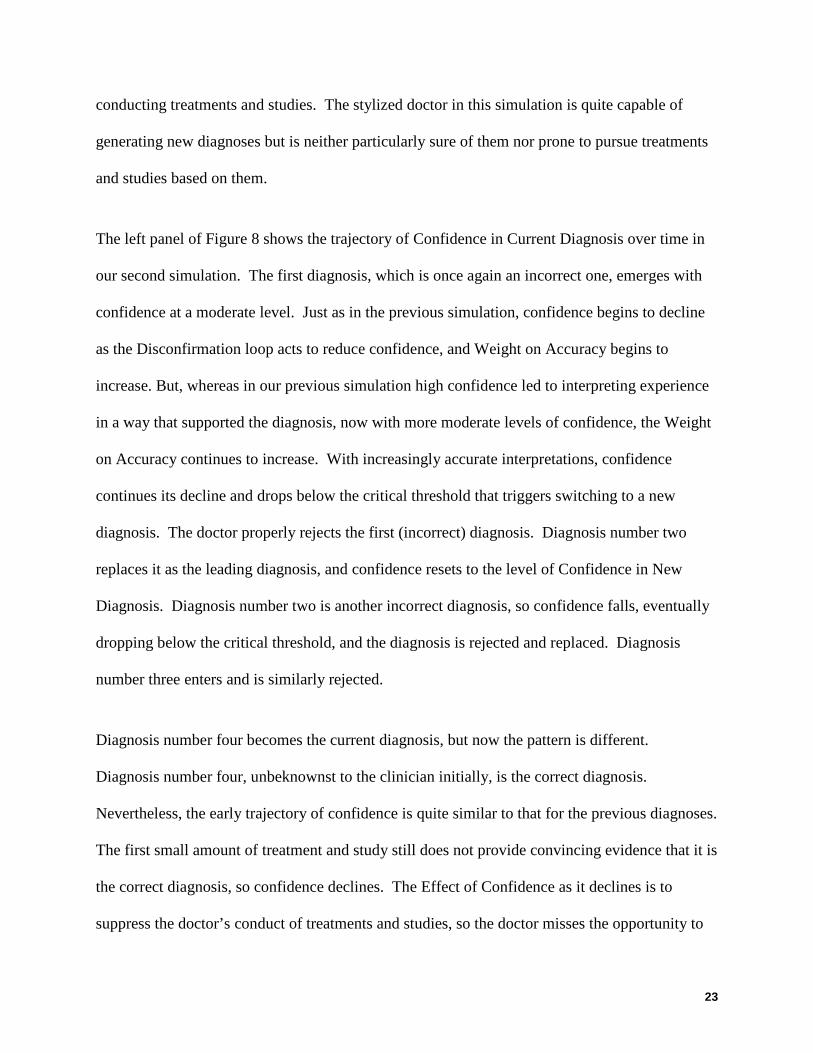
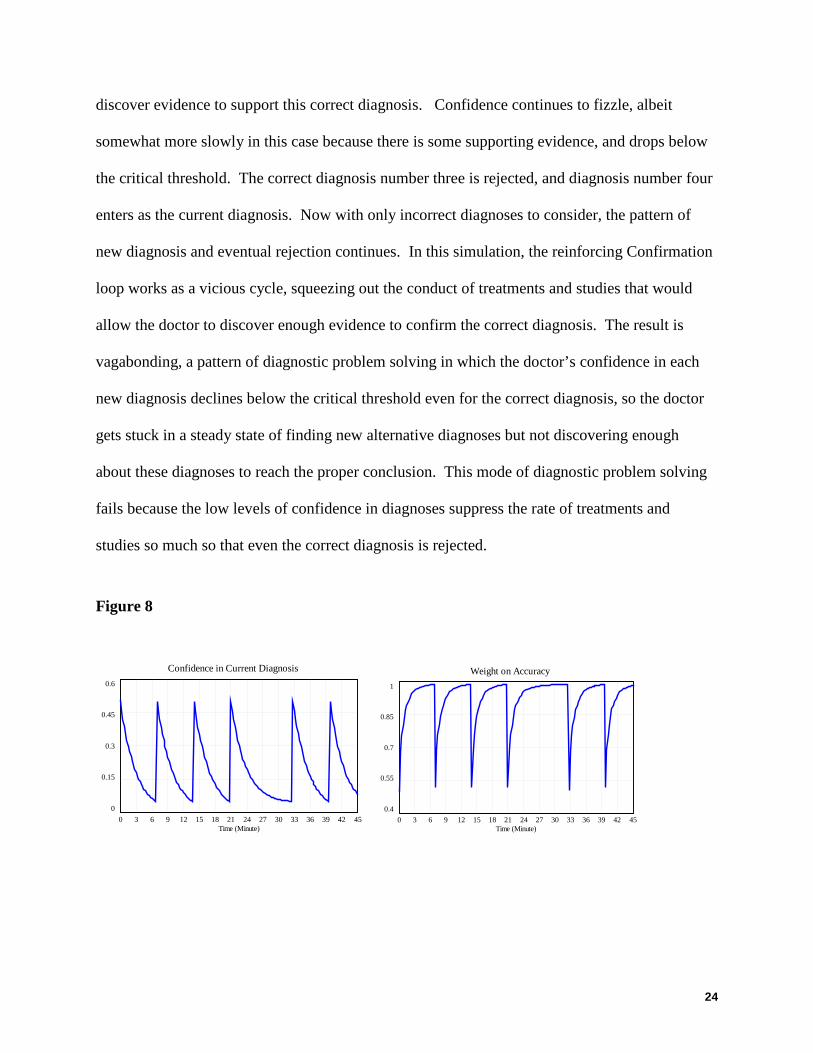
The left panel of Figure 8 shows the trajectory of Confidence in Current Diagnosis over time in
our second simulation. The first diagnosis, which is once again an incorrect one, emerges with
confidence at a moderate level. Just as in the previous simulation, confidence begins to decline
as the Disconfirmation loop acts to reduce confidence, and Weight on Accuracy begins to
increase. But, whereas in our previous simulation high confidence led to interpreting experience
in a way that supported the diagnosis, now with more moderate levels of confidence, the Weight
on Accuracy continues to increase. With increasingly accurate interpretations, confidence
continues its decline and drops below the critical threshold that triggers switching to a new
diagnosis. The doctor properly rejects the first (incorrect) diagnosis. Diagnosis number two
replaces it as the leading diagnosis, and confidence resets to the level of Confidence in New
Diagnosis. Diagnosis number two is another incorrect diagnosis, so confidence falls, eventually
dropping below the critical threshold, and the diagnosis is rejected and replaced. Diagnosis
number three enters and is similarly rejected.
Diagnosis number four becomes the current diagnosis, but now the pattern is different.
Diagnosis number four, unbeknownst to the clinician initially, is the correct diagnosis.
Nevertheless, the early trajectory of confidence is quite similar to that for the previous diagnoses.
The first small amount of treatment and study still does not provide convincing evidence that it is
the correct diagnosis, so confidence declines. The Effect of Confidence as it declines is to
suppress the doctor’s conduct of treatments and studies, so the doctor misses the opportunity to
24
discover evidence to support this correct diagnosis. Confidence continues to fizzle, albeit
somewhat more slowly in this case because there is some supporting evidence, and drops below
the critical threshold. The correct diagnosis number three is rejected, and diagnosis number four
enters as the current diagnosis. Now with only incorrect diagnoses to consider, the pattern of
new diagnosis and eventual rejection continues. In this simulation, the reinforcing Confirmation
loop works as a vicious cycle, squeezing out the conduct of treatments and studies that would
allow the doctor to discover enough evidence to confirm the correct diagnosis. The result is
vagabonding, a pattern of diagnostic problem solving in which the doctor’s confidence in each
new diagnosis declines below the critical threshold even for the correct diagnosis, so the doctor
gets stuck in a steady state of finding new alternative diagnoses but not discovering enough
about these diagnoses to reach the proper conclusion. This mode of diagnostic problem solving
fails because the low levels of confidence in diagnoses suppress the rate of treatments and
studies so much so that even the correct diagnosis is rejected.
Figure 8
Confidence in Current Diagnosis0.6
0.45
0.3
0.15
00 3 6 9 12 15 18 21 24 27 30 33 36 39 42 45
Time (Minute)
Weight on Accuracy1
0.85
0.7
0.55
0.40 3 6 9 12 15 18 21 24 27 30 33 36 39 42 45
Time (Minute)
25
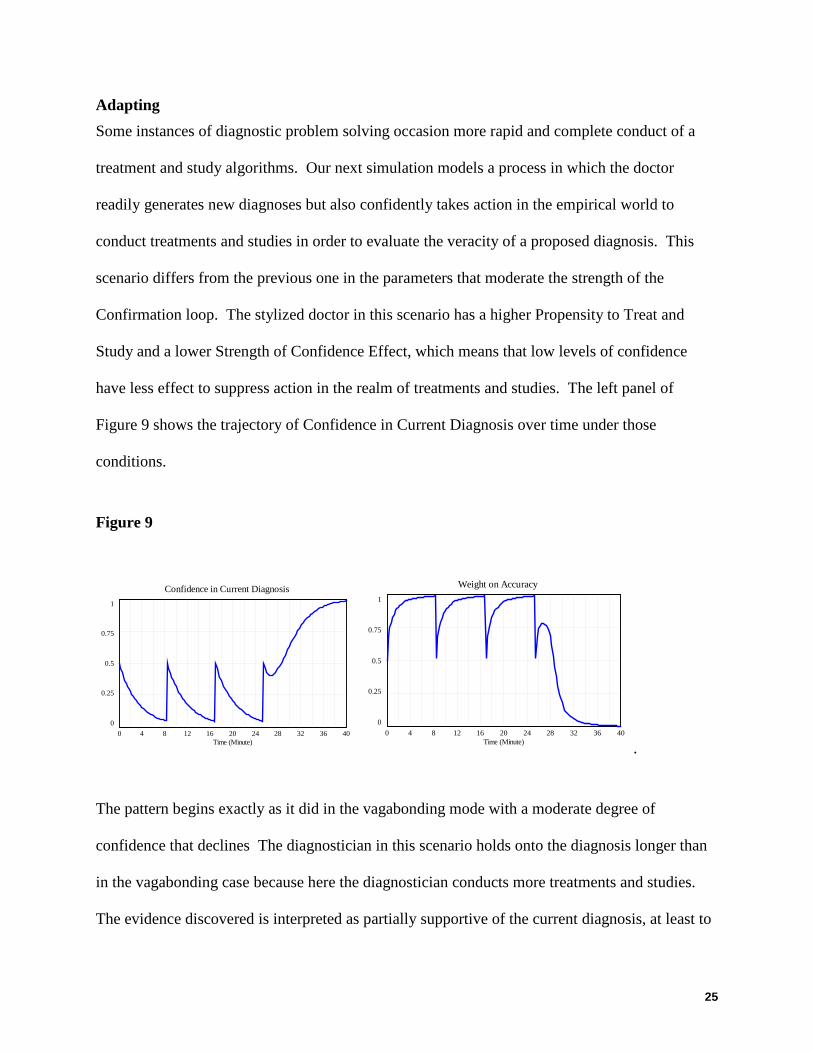
Adapting Some instances of diagnostic problem solving occasion more rapid and complete conduct of a
treatment and study algorithms. Our next simulation models a process in which the doctor
readily generates new diagnoses but also confidently takes action in the empirical world to
conduct treatments and studies in order to evaluate the veracity of a proposed diagnosis. This
scenario differs from the previous one in the parameters that moderate the strength of the
Confirmation loop. The stylized doctor in this scenario has a higher Propensity to Treat and
Study and a lower Strength of Confidence Effect, which means that low levels of confidence
have less effect to suppress action in the realm of treatments and studies. The left panel of
Figure 9 shows the trajectory of Confidence in Current Diagnosis over time under those
conditions.
Figure 9
.
The pattern begins exactly as it did in the vagabonding mode with a moderate degree of
confidence that declines The diagnostician in this scenario holds onto the diagnosis longer than
in the vagabonding case because here the diagnostician conducts more treatments and studies.
The evidence discovered is interpreted as partially supportive of the current diagnosis, at least to
Confidence in Current Diagnosis1
0.75
0.5
0.25
00 4 8 12 16 20 24 28 32 36 40
Time (Minute)
Weight on Accuracy1
0.75
0.5
0.25
00 4 8 12 16 20 24 28 32 36 40
Time (Minute)
26
the extent that continuing the treatment and study algorithm is still deemed worthy. Each
diagnosis is held up for a more thorough examination to determine its merits. Nevertheless, the
first diagnosis is incorrect, so confidence eventually drops below the critical threshold for
rejection and replacement. The pattern continues with a thorough examination and subsequent
rejection of diagnoses two and three. When the diagnostician begins to consider diagnosis
number four, the correct one, confidence initially begins to decline as before. However, the rate
of conducting treatments and studies is high enough to discover evidence that begins to build
confidence in the current diagnosis. Increasing confidence in this diagnosis increases that rate of
doing treatments and studies, discovering more evidence, bolstering confidence even more.
Moreover, increasing confidence boosts degree of favorable interpretation as the Interpreting the
Data loop acts to reduce the Weight on Accuracy. The diagnostician pursues the treatment and
study algorithm to completion and converges on a steady state choice of the correct diagnosis.
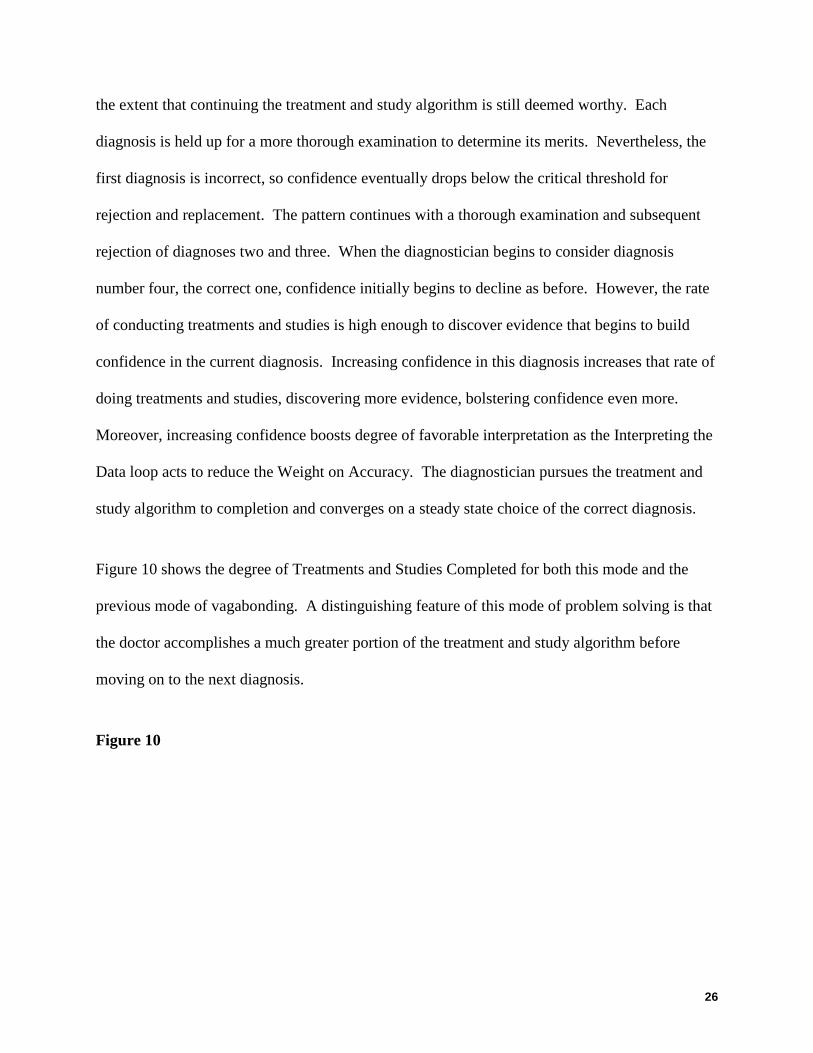
Figure 10 shows the degree of Treatments and Studies Completed for both this mode and the
previous mode of vagabonding. A distinguishing feature of this mode of problem solving is that
the doctor accomplishes a much greater portion of the treatment and study algorithm before
moving on to the next diagnosis.
Figure 10

27
The result is adapting, a pattern of diagnostic problem solving in which the doctor’s confidence
is high enough to allow for a more complete examination of each hypothesis before the rejection
of incorrect diagnoses and that enables the doctor to discover and confirm the correct diagnosis.
This mode of problem solving succeeds because the doctor strikes an appropriate balance
between considering new diagnoses and sticking with them long enough to gather evidence to
evaluate them. The adaptive diagnostic problem solver is able both to hold up the diagnoses for
examination and to take action to conduct the examination.
The simulation results in this section show how the feedback structure in our model of diagnostic
decision making (Figure 6) generates the modes of diagnostic problem solving observed in the
field study. Stalling occurs when the diagnosticians do not generate proposed diagnoses.
Fixating occurs when they do not discard an incorrect diagnosis, never discovering the correct
hypothesis. Vagabonding occurs when they do not determine a correct diagnosis to be so and
thus prematurely discard it. Adaptive problem solving occurs only when they both discover the
correct diagnosis and determine that it is the correct one.
Treatments and Studies Completed4
3
2
1
00 3 6 9 12 15 18 21 24 27 30 33 36 39 42 45
Time (Minute)
Treatments and Studies Completed : vagabonding stepsTreatments and Studies Completed : adaptive problem solving steps
28
DISCUSSION Our study offers three contributions to understanding how to avoid diagnostic error and move
toward effective diagnostic problem solving. First, we offer a clear picture of the dynamic
structures that produce four general modes in diagnostic problem solving. Second, we clarify the
mechanisms that make exploratory and exploitative diagnostic activities self- reinforcing and the
mechanisms that allow people to switch between them and combine them. Third, whereas the
liability of exploitation has been well understood via studies and fixation error, the liability of
exploration in the diagnostic context has been left obscure. We clarify this liability by describing
how excessive exploration and inadequate exploitation are linked.
Success and Failure Modes in Diagnostic Problem Solving Diagnostic problem solving in time-pressured, acute care settings is not a situation where
“meaning already exists and is waiting to be found.” Rather it “awaits construction that might
not happen or might go awry…” (Weick, 1995a: 15). In the fixating problem-solving mode,
doctors’ initially high level of confidence in their diagnosis is a launching pad for exploiting
known treatment algorithms via the treatment algorithm loop. The “disconfirmation,” loop loses
strength as confidence in their current diagnosis pushes a self-reinforcing process. This process
finds those in the fixating mode interpreting the feedback they got as yet further confirmation of
their current story in the “interpreting the data loop”. Exploiting the current diagnosis heavily
without exploring other aspects of the terrain, or questioning their own diagnosis suppressed the
updating processes that might have improved the accuracy of the story–its fit with external
reality. In the fixating mode, the Interpreting the Data loop dominates the system behavior,
locking them into a mode of excessive exploitation and preventing the doctors from exploring
alternatives that might steer them to an effective diagnosis.
29
Studies of fixation error (also known as premature closure or tunnel vision), generally conclude
that broadening the range of alternatives considered is the needed antidote. Surprisingly, the
example of the diagnostic vagabonds showed that exploring a broader range of possibilities is not
enough on its own to allow problem solvers to identify and treat the patient’s problem. In
contrast to the stalled and fixated sensemaking modes, the diagnostic vagabonds generated a
wide range of plausible diagnoses. Though they readily shifted among diagnostic stories, they
were not as readily able to assess the accuracy of these stories. Failing to exploit treatments or
studies, the diagnostic vagabonds lacked adequate feedback that would allow them to improve
the fit between of their diagnostic stories and the external environment. Their repeated hesitation
to take action that would generate useful feedback allowed the Disconfirmation loop to
overwhelm the system, leading to frequent introduction of new alternatives by the Proposing
Diagnoses loop. They got locked in to a mode of excessive exploration.
These failure modes suggest that intertwining exploration and exploitation may enhance and
bolster the effectiveness of each activity. In the adaptive sensemaking mode, the stylized doctor
launched into action with a higher Propensity to Treat and Study and a lower Strength of
Confidence Effect. The result was that low levels of confidence had a less suppressive effect on
action in the realm of treatments and studies than it did on the Diagnostic Vagabonds. Thus,
when exploiting known approaches for a given diagnostic story, they proceeded relatively
unencumbered by declining confidence in the diagnosis. Failure was still a trip-wire for
exploring other diagnoses, but with more complete information, the doctor was able to recognize
a correct diagnosis when she found one. Conducting treatments and studies in the “treatment
algorithm loop” combined with exploration in the “proposing diagnoses loop” to yield a mode of
balanced diagnostic problem solving characterized by effective switching between exploitation
30
and exploration. Accomplishing this balance involves the willingness to question one’s current
diagnosis and translating that questioning toward heightening interest in external evidence . The
combination of exploitation (more treatments and studies) and exploration (more alternative
diagnoses) based on feedback allowed those in the adaptive sensemaking mode to assess the
accuracy of plausible diagnostic stories, rule some out, and resolve the underlying problem.
Mechanisms for switching (or not) between exploration and exploitation. Existing research and theory suggests that combining exploration and exploitation is difficult for
an individual or small group under resource constraints, time pressure and possible threat of a
crisis (Gupta et al., 2006; Rudolph et al., 2002; Staw et al., 1981). Time-constrained, resource-
scarce acute care situation situations, this research suggests, are likely to produce exploration or
exploitation, since it is difficult to switch between exploratory versus exploitative mindsets, each
activity tends to be self-reinforcing, and both compete for scarce resources (Gupta et al., 2006;
March, 1991; March, 1996; Rudolph et al., 2002; Staw et al., 1981). Our data help “unpack”
how each of these processes comes about. The exploitative confirmation loop coupled with a
high level of confidence seems to create a mind-set and reinforcing process that captures fixated
problem solvers attentional capacity. The exploratory disconfirmation loop coupled with lower
level of confidence appears to create a mind-set and reinforcing process that hoards diagnostic
vagabonds attentional capacity.
In contrast, in adaptive sensemaking, however, exploration and exploitation appear to be
combined. The dynamics of diagnostic problem highlighted in our model, and missing from
earlier discussions of exploration and exploitation facilitate the combining of exploitation and
exploitation. The first loop crucial to this process is exploring one’s diagnosis by questioning it
(the interpreting data loop). Skeptically reviewing one’s own diagnosis in the interpreting data
31
loop is the linchpin that connects exploration and exploitation, which otherwise tend toward
separate, competing paths. This loop captures the types of activities that have been described as
“having your simplifications but doubting them” (Weick et al., 1999), deutero-learning (Bateson,
1972), double-loop learning (Argyris, Putnam, & Smith, 1985; Torbert & Associates, 2004),
premise reflection (Schwandt, 2005), and mindfulness (Langer, 1989). These are all forms of a
meta-level of awareness that link exploratory to exploitative activities. In our model, it was the
link between the exploitative Treatment Algorithm loop and the exploratory Interpreting Data
loop that made it possible for adaptive problem-solvers to move toward an effective solution.
This process protects problem solvers from the powerful forces that can tip them into either
exploration-only or exploitation-only traps.
Failure Traps Revisited
The literature on exploration and exploitation has highlighted the fact that exploratory activities
can be self reinforcing self-reinforcing because returns on exploration take longer, are often
uncertain, and fraught with failure which prompts more search for yet other new ideas to mitigate
the failure. These characteristics have lead scholars to characterize recursive search activities as
leading to ‘failure traps’. In the terms of our model, these exploratory activities are self
reinforcing because the diagnoses generated in the proposing diagnoses loop are incorrect or it
Our data suggest another explanation for why exploration alone and self reinforcing. A liability
of exploration revealed by our model, is not related to whether the diagnosis is correct or
incorrect, but rather, the liability of vagabonding occurs because a reinforcing feedback
structure, the Confirmation loop, acts as a vicious cycle so that continuous exploration of new
alternatives squeezes out the exploitative activities of the Treatment Algorithm loop to act on
these continuously changing ideas.

32
33
REFERENCES Ancona, D. G., & Caldwell, D. F. 1992. Bridging the boundary: External activity and performance in
organizational teams. Administrative Science Quarterly, 37: 634-665.
Argyris, C., Putnam, R., & Smith, D. M. 1985. Action Science: Concepts, Methods and Skills for Research and Intervention. San Francisco: Jossey-Bass.
Bartunek, J. M. 1984. Changing interpretive schemes and organizational restructuring: The example of a religious order. Administrative Science Quarterly, 29: 355-372.
Bateson, G. 1972. Steps to an ecology of mind. New York: Ballantine Books.
Berner, E. S., & Graber, M. L. 2006. Overconfidence as a Cause of Diagnostic Error in Medicine. Birmingham, AL: Department Of Health Services Administration, University of Alabama at Birmingham.
Black, L., Carlile, P., & Repenning, N. P. 2004. A dynamic theory of expertise and occupational boundaries in new technology implementation: Building on Barley's study of CT scanning Administrative Science Quarterly, 49(4): 572-607.
Campion, E. W. 2003. A death at Duke. New England Journal of Medicine, 348(12): 1083-1084.
Cannon-Bowers, J. A., & Salas, E. 1998. Making Decisions under Stress: Implications for Individual and Team Training. Washington, DC: American Psychological Association.
Carroll, J. S., Rudolph, J. W., & Hatakenaka, S. 2002. Learning from experience in high-hazard industries. Research in Organizational Behavior, 24: 87-137.
Christensen, J. F., Levinison, W., & Dunn, P. M. 1992. The heart of darkness: the impact of perceived mistakes on physicians. Journal of General Internal Medicine, 7: 424-431.
Cohen, M. S., Freeman, J. T., & Thompson, B. 1998. Critical thinking skills in tactical decision making: a model and a training strategy. In J. Cannon-Bowers, & E. Salas (Eds.), Decision Making Under Stress: Implications for Individual and Team Training. Washington, D.C.: American Psychological Association.
Cohen, M. S., Freeman, J. T., & Wolf, S. 1996. Meta-recognition in time stressed decision making: Recognizing, critiquing, and correcting. Human Factors, 38(2): 206-219.
Cook, R. I., & McDonald, J. S. 1988. Cognitive tunnel vision in the operating room: Analysis of cases using a frame model. Anesthesiology, 69: A-497.
Cook, R. I., & Woods, D. 1994. Operating at the sharp end: The complexity of human error. In B. S. Bogner (Ed.), Human Error in Medicine: 255-310. Hillsdale, NJ: Lawrence Earlbaum Associates.
Cooper, J., & Gaba, D. M. 1989. A strategy for preventing anesthesia accidents. International Anesthesiology Clinics, 27(3): 148-152.
Crosskerry, P. 2000. The feedback sanction. Academic Emergency Medicine, Seven: 1232-1238.
De Keyser, V., & Woods, D. D. 1990. Fixation errors: Failures to revise situation assessment in dynamic and risky systems. In A. G. Colombo, & A. Saiz de Bustamante (Eds.), Systems Reliability Assessment: 231-251. Amsterdam: Kluwer.
Dörner, D. 1997. The Logic of Failure: Recognizing and avoiding error in complex situations. New York: Perseus.
34
Elstein, A. S., Shulman, L. S., & Sprafka, S. A. 1978. Medical Problem Solving: An Analysis of Clinical Reasoning. Cambridge, MA: Harvard University Press.
Finkelstein, S. 2003. Why Smart Executive Fail: And What You Can Learn from Their Mistakes. New York: Portfolio.
Forrester, J. W. 1961. Industrial Dynamics. Portland, OR: Productivity.
Gaba, D. 1994. Human work environment and simulators. In R. D. Miller (Ed.), Anesthesia: 2635-2679. New York: Churchill Livingstone.
Gaba, D. M., & DeAnda, A. 1989. The response of anesthesia trainees to simulated critical incidents. Anesth Analg, 68(4): 444-451.
Galbraith, J. R. 1972. Organization design: An information processing view. In J. W. Lorsch, & P. R. Lawrence (Eds.), Organization Planning: Cases and Concepts: 49-74. Homewood, IL: Richard D. Irwin, Inc.
Gandhi, T. K. 2005. Fumbled handoffs: one dropped ball after another. Annals of Internal Medicine, 142(5): 352-358.
Gersick, C. 1988.
Glaser, B. G., & Strauss, A. L. 1967. The discovery of grounded theory: Strategies for qualitative research. New York: Aldine.
Graber, M. 2005. Diagnostic errors in medicine: A case of neglect. Journal on Quality and Patient Safety, 31(2): 112-119.
Gupta, A. K., Smith, K. G., & Shalley, C. E. 2006. The interplay between exploration and exploitation. Academy of Management Journal, 49(4): 683-706.
Hayward, R. A., & Hofer, T. P. 2001. Estimating hospital deaths due to medical errors: Preventability is in the eye of the reviewer. Journal of the American Medical Association, 286(4): 415-420.
Heimann, L. 2005. Repeated failures in the management of high risk technologies. European Management Journal, 23: 105-117.
Jagsi, R., Kitch, B. T., Weinstein, D. F., Campbell, E. G., Hutter, M., & Weissman, J. 2005. Residents report on adverse events and their causes. Archives of Internal Medicine, 165: 2607-2613.
Johnson, P. E., Hassenbrock, F., Duran, A. S., & Moller, J. H. 1982. Multimethod study of clinical judgment. Organizational behavior and human performance, 30: 201-230.
Johnson, P. E., Moen, J. B., & Thompson, W. B. 1988. Garden path errors in diagnostic reasoning. In L. Bolc, & M. J. Coombs (Eds.), Expert System Applications. Berlin: Springer-Verlag.
Johnson, P. E., & Thompson, W. B. 1981. Strolling down the garden path: Detection and recovery from error in expert problem solving. Paper presented at the Seventh International Joint Conference on Artificial Intelligence, Vancouver, BC.
Kegan, R. 1994. In Over Our Heads: The Mental Demands of Modern Life. Cambridge, MA: Harvard University Press.
Klayman, J. 1988. Cue discovery in probabilistic envirnoments: Uncertainty and experimentation. Journal of Experimental Psychology: Learning, Memory, and Cognition, 14(2): 317-330.
Klayman, J., & Ha, Y.-W. 1987. Confirmation, disconfirmation, and information in hypothesis testing. Psychological Review, 94(2): 211-228.
35
Klein, G., Phillips, J. K., Rall, E., & Peluso, D. A. 2006. A Data/Frame Theory of Sensemaking. In R. Hoffman (Ed.), Expertise Out of Context. Mahway, NJ: Erlbaum.
Klein, G., Pliske, R., Crandall, B., & Woods, D. 2005. Problem detection. Cognition, Technology and Work, 7(1): 14-28.
Klein, G. A., Orasanu, J., Calderwood, R., & Zsambok, C. E. 1993. Decision Making in Action. Norwood, NJ USA: Ablex Publishing.
Langer, E. J. 1989. Minding matters: The consequences of mindlessness-mindfulness. In L. Berkowitz (Ed.), Advances in Experimental Psychology, Vol. 22: 137-173. San Diego: Academic Press.
Louis, M. R., & Sutton, R. I. 1991. Switching cognitive gears: From habits of mind to active thinking. Human Relations, 44(1): 55-76.
Mandler, G. 1982. Stress and thought processes. In S. Goldberger, & S. Breznitz (Eds.), Handbook of Stress: 88-164. New York: Free Press.
Mandler, G. 1984. Mind and Body. New York: W. W. Nortorn & Company.
March, J. G. 1991. Exploration and exploitation in organizational learning. Organization Science, 2(1): 71-87.
March, J. G. 1996. Continuity and change in theories of organizational action. Administrative Science Quarterly, 41: 278-287.
March, J. G. 2006. Rationality, foolishness, and adaptive intelligence. Strategic management Journal, 27: 201-214.
Nielsen, R. P., & Bartunek, J. M. 1996. Opening narrow, routinized schemata to ethical stakeholder consciousness and action. Business and Society, 35(4): 483-519.
Pearson, C. M., & Clair, J. A. 1998. Reframing crisis management. Academy of Management Journal, 23(1): 59-76.
Pronovost, P., Weast, B., Schwarz, M., Wyskiel, R., Prow, D., Milanovich, S., Berenholtz, S., Dorman, T., & Lipsett, P. 2003. Medication reconciliation: a practical tool to reduce the risk of medication errors. Journal of Critical Care, 18(4): 201-205.
Reason, J. 1990. Human Error. New York: Cambridge University Press.
Repenning, N. P., & Sterman, J. D. 2002. Capability traps and self-confirming attribution errors in the dynamics of process improvement. Administrative Science Quarterly, 47: 265 - 295.
Roberts, N. C., & Dotterway, K. A. 1995. The Vincennes incident: Another player on the stage? Defense Analysis, 11(1): 31-45.
Rudolph, J. W. 2003. Into the big muddy and out again: Error persistence and crisis management in the operating room. Boston College, Chestnut Hill, MA.
Rudolph, J. W., & Raemer, D. B. 2004. Diagnostic problem solving during simulated crises
in the OR. Anesthesia and Analgesia, 98(5S): S34.
Rudolph, J. W., & Repenning, N. P. 2002. Disaster dynamics: Understanding the role of quantity in organizational collapse. Administrative Science Quarterly, 47: 1-30.
Sastry, M. A. 1997. Problems and paradoxes in a model of punctuated organizational change. Administrative Science Quarterly, 42: 237-275.
Schiff, G., Kim, S., Abrams, R., Cosby, K., Lambert, B., Feldstein, A. S., Hasler, S., Krosnjar, N., Odwazny, R., Wisniewski, M. F., & McNutt, R. A. 2004. Diagnsotic Errors: Lessons from a

36
Multi-Institutional Collaborative Project for the Diagnostic Error Evaluation and Research Project Investigators. Rockville, Maryland: Agency for Healthcare Research and Quality.
Schwandt, D. R. 2005. When managers become philosophers: integrating learning with sense making. Academy of Management Learning & Education, 4(2): 176-192.
Sitkin, S. B., Sutcliffe, K., & Schroeder, R. G. 1994. Distinguishing control from learning in total quality management: A contingency perspective. Academy of Management Review, 19(3): 537-564.
Smith, S. M., & Blankenship, S. E. 1991. Incubation and the persistence of fixation in problem solving. American Journal of Psychology, 104(1): 61-87.
Snook, S. A. 2000. Friendly Fire: The Accidental Shootdown of US Black Hawks Over Northern Iraq. Princeton, NJ USA: Princeton University Press.
Starbuck, W. H., Greve, A., & Hedberg, B. L. T. 1978. Responding to crises. Journal of Business Administration, 9(2): 111-137.
Staw, B. M. 1976. Knee-deep in the Big Muddy: A study of escalating commitment to a chosen course of action. Organizational Behavior and Human Performance, 16: 27-44.
Staw, B. M., Sandelands, L. E., & Dutton, J. E. 1981. Threat-rigidity effects in organizational behavior: A multilevel analysis. Administrative Science Quarterly, 26: 501-524.
Sterman, J. 2000. Business Dynamics. Chicago: Irwin-McGraw Hill.
Sterman, J. D. 1994. Learning in and about complex systems. System Dynamics Review, 10(2-3): 291-330.
Sterman, J. D., & Wittenberg, J. 1999. Path dependence, competition, and succession in the dynamics of scientific revolution. Organization Science, 10(3): 322-341.
Strauss, A., & Corbin, J. 1994. Grounded theory methodology: An overview. In N. K. Denzin, & Y. S. Lincoln (Eds.), Handbook of qualitative research: 273-285. Thousand Oaks: Sage.
Suddaby, R. 2006. From the Editors: What grounded theory is not. Academy of Management Journal, 49(4): 633-642.
Torbert, W. R. 1991. The Power of Balance: Transforming Self, Society, and Scientific Inquiry. Newbury Park, CA: Sage.
Torbert, W. R., & Associates. 2004. Action Inquiry: The Secret of Timely and Transforming Leadership. San Francisco: Berret-Koehler Publishers.
Voytovich, A. E., Rippey, R. M., & Suffredini, A. 1985. Premature conclusions in diagnostic reasoning. Journal of Medical Education, 60(4): 302-307.
Wachter, R. M. 2004. The end of the beginning: Patient safety five years after "To Err is Human". Health Affairs, November(??): ??
Waller, M. J. 1999. The timing of adaptive group responses to nonroutine events. Academy of Management Journal, 42(2): 127-137.
Weick, K. E. 1993b. The collapse of sensemaking in organizations: The Mann Gulch disaster. Administrative Science Quarterly, 38: 628-652.
Weick, K. E., Sutcliffe, K., & Obstfeld, D. 2005. Organizing and the process of sensemaking. Organization Science, 16(4): 409-421.
37
Weick, K. E., Sutcliffe, K. M., & Obstfeld, D. 1999. Organizing for high reliability: Processes of collective mindfulness. In R. I. Sutton, & B. M. Staw (Eds.), Research in Organizational Behavior, Vol. 21: 81-123. Stamford, CT: JAI Press.
Wu, A. W., Folkman, S., McPhee, S. J., & Lo, B. 1991. Do house officers learn from their mistakes? Journal of the American Medical Association, 265(16): 2089-2094.
Xiao, Y., & MacKenzie, C. F. 1995. Decision making in dynamic environments: Fixation errors and their causes. Paper presented at the Human Factors and Ergonomics Society 39th Annual Meeting, Santa Monica, CA.
Zsambok, C. E., & Klein, G. 1997. Naturalistic Decision Making. Mahway, NJ: Lawrence Erlbaum Associates.
38
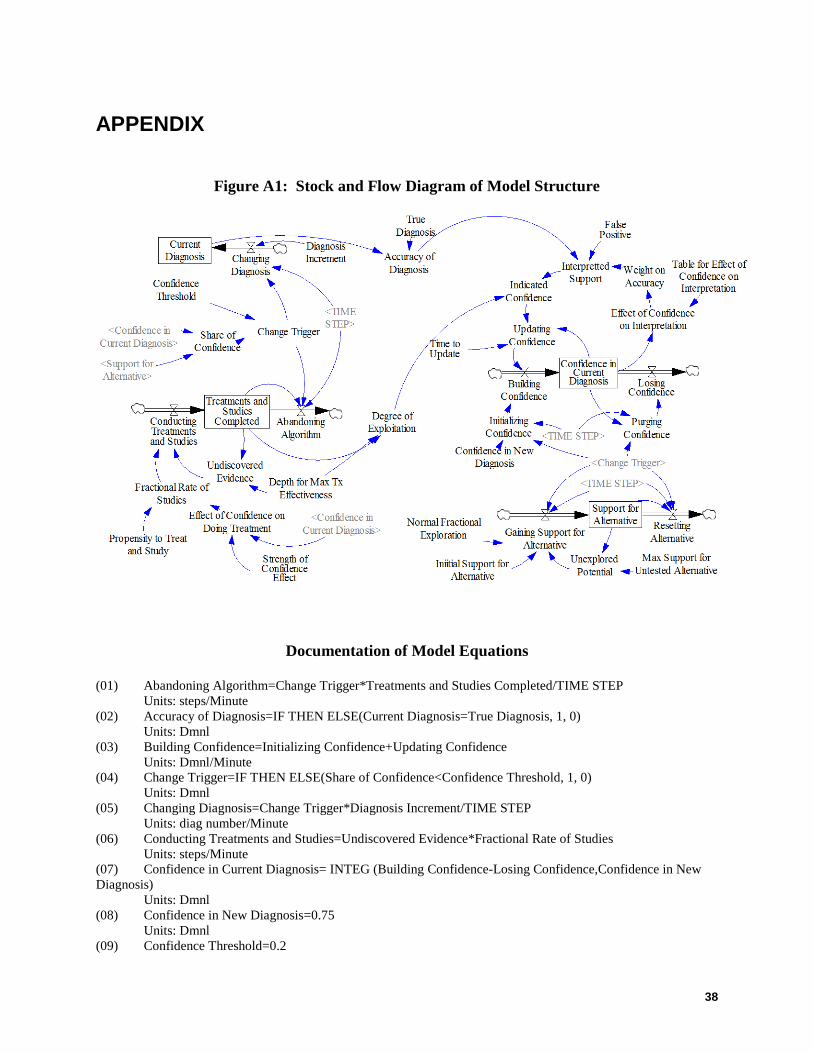
APPENDIX
Figure A1: Stock and Flow Diagram of Model Structure
Documentation of Model Equations
(01) Abandoning Algorithm=Change Trigger*Treatments and Studies Completed/TIME STEP Units: steps/Minute (02) Accuracy of Diagnosis=IF THEN ELSE(Current Diagnosis=True Diagnosis, 1, 0) Units: Dmnl (03) Building Confidence=Initializing Confidence+Updating Confidence Units: Dmnl/Minute (04) Change Trigger=IF THEN ELSE(Share of Confidence<Confidence Threshold, 1, 0) Units: Dmnl (05) Changing Diagnosis=Change Trigger*Diagnosis Increment/TIME STEP Units: diag number/Minute (06) Conducting Treatments and Studies=Undiscovered Evidence*Fractional Rate of Studies Units: steps/Minute (07) Confidence in Current Diagnosis= INTEG (Building Confidence-Losing Confidence,Confidence in New Diagnosis) Units: Dmnl (08) Confidence in New Diagnosis=0.75 Units: Dmnl (09) Confidence Threshold=0.2

39
Units: Dmnl (10) Current Diagnosis= INTEG (Changing Diagnosis,0) Units: diag number (11) Degree of Exploitation=(Treatments and Studies Completed/Depth for Max Tx Effectiveness) Units: Dmnl (12) Depth for Max Tx Effectiveness=4 Units: steps (13) Diagnosis Increment=1 Units: diag number (14) Effect of Confidence on Doing Treatment=Confidence in Current Diagnosis^Strength of Confidence Effect Units: Dmnl (15) Effect of Confidence on Interpretation=Table for Effect of Confidence on Interpretation(Confidence in Current Diagnosis) Units: Dmnl (16) False Positive=1 Units: Dmnl (17) FINAL TIME = 45 Units: Minute The final time for the simulation. (18) Fractional Rate of Studies=Effect of Confidence on Doing Treatment*Propensity to Treat and Study Units: 1/Minute (19) Gaining Support for Alternative=Normal Fractional Exploration*Unexplored Potential+Iniitial Support for Alternative*Change Trigger/TIME STEP Units: Dmnl/Minute (20) Indicated Confidence=Interpretted Support*Degree of Exploitation Units: Dmnl (21) Iniitial Support for Alternative=0.05 Units: Dmnl (22) INITIAL TIME = 0 Units: Minute The initial time for the simulation. (23) Initializing Confidence=(Confidence in New Diagnosis/TIME STEP)*Change Trigger Units: Dmnl/Minute (24) Interpretted Support=Accuracy of Diagnosis*Weight on Accuracy+(1-Weight on Accuracy)*False Positive Units: Dmnl (25) Losing Confidence=Purging Confidence Units: Dmnl/Minute (26) Max Support for Untested Alternative=0.2 Units: Dmnl (27) Normal Fractional Exploration=0.5 Units: 1/Minute (28) Propensity to Treat and Study=1 Units: 1/Minute (29) Purging Confidence=Change Trigger*(Confidence in Current Diagnosis/TIME STEP) Units: Dmnl/Minute (30) Resetting Alternative=Change Trigger*Support for Alternative/TIME STEP Units: Dmnl/Minute (31) SAVEPER = TIME STEP Units: Minute [0,?] The frequency with which output is stored. (32) Share of Confidence=Confidence in Current Diagnosis/(Confidence in Current Diagnosis+Support for Alternative) Units: Dmnl (33) Strength of Confidence Effect=1 Units: Dmnl

40
(34) Support for Alternative= INTEG (Gaining Support for Alternative-Resetting Alternative,Iniitial Support for Alternative) Units: Dmnl (35) Table for Effect of Confidence on Interpretation ([(0,0)(1,1)],(0,1),(0.192661,0.95614),(0.321101,0.877193),(0.446483,0.723684),(0.5,0.5),(0.574924,0.254386),(0.685015,0.105263),(0.850153,0.0307018),(1,0)) Units: Dmnl (36) TIME STEP = 0.25 Units: Minute [0,?] The time step for the simulation. (37) Time to Update=3 Units: Minute (38) Treatments and Studies Completed= INTEG (+Conducting Treatments and Studies-Abandoning Algorithm,0) Units: steps (39) True Diagnosis=3 Units: diag number (40) Undiscovered Evidence=Depth for Max Tx Effectiveness-Treatments and Studies Completed Units: steps (41) Unexplored Potential=Max Support for Untested Alternative-Support for Alternative Units: Dmnl (42) Updating Confidence=(Indicated Confidence-Confidence in Current Diagnosis)/Time to Update Units: Dmnl/Minute (43) Weight on Accuracy=Effect of Confidence on Interpretation Units: Dmnl