computer aided polymer design using multiscale...
TRANSCRIPT

Computer Aided Polymer Design Using Multiscale
Modelling
Kavitha C. Satyanarayana1, Jens Abildskov1, Rafiqul Gani1*, Georgia Tsolou2, Vlasis G. Mavrantzas2
1CAPEC, Department of Chemical Engineering, Technical University of Denmark, DK-2800 Lyngby,
Denmark.
2Department of Chemical Engineering, University of Patras & Institute of Chemical Engineering and
High-Temperature Chemical Processes (ICE-HT/FORTH), Patras GR 26504 Greece
[email protected], [email protected], [email protected], [email protected], [email protected]
Abstract: Different approaches are being investigated to design a new product with the required
properties. These can be broadly classified under different scale depending upon the length and time of
the approach investigated. An integration of macro to micro scale for designing a polymer, with the
required property, is made in this work. Computer Aided Molecular design (CAMD) algorithm, which
uses group contribution plus (GC+) models for predicting polymer repeat unit properties is classified
under macro and meso scale approaches. It is employed in this work to identify polymer repeat units
matching a set of desired properties. The identified repeat unit structures from the CAMD algorithm is
arranged to form a polymer chain and its structural and conformational properties are studied using an
atomistic simulation that is classified as a micro-scale approach. This integration of multiscale
approaches can decrease the time of developing new polymers with the desired property as it can readily
* Corresponding author Tel. +45 4525 2882, Fax +45 45932906, email [email protected]
1

forecast the polymer structures that has the required set of properties. A detailed case study using this
multiscale methodology is presented in this paper.
KEYWORDS – CAMD, polymer design, molecular dynamics, group contribution plus methods,
polyisobutylene, diffusivity.
INTRODUCTION
Polymers are mostly used in chemicals based consumer products in some form. The demand for new
polymer based products is increasing day by day. The search for new polymer products with desired
end-user properties has become a primary objective in chemical, pharmaceutical and food industries.
Traditional approach of preparing and testing many candidate polymers at the laboratory scale, to verify
if they have the required properties is well known. Though this approach can be accurate enough to
discover a new polymer, yet it is highly time consuming, tedious and capital intensive.
There are several other approaches, which can be used to forecast the polymer repeat unit structures
that posses the required properties, prior to the traditional synthesis-and-test approach. Some of these
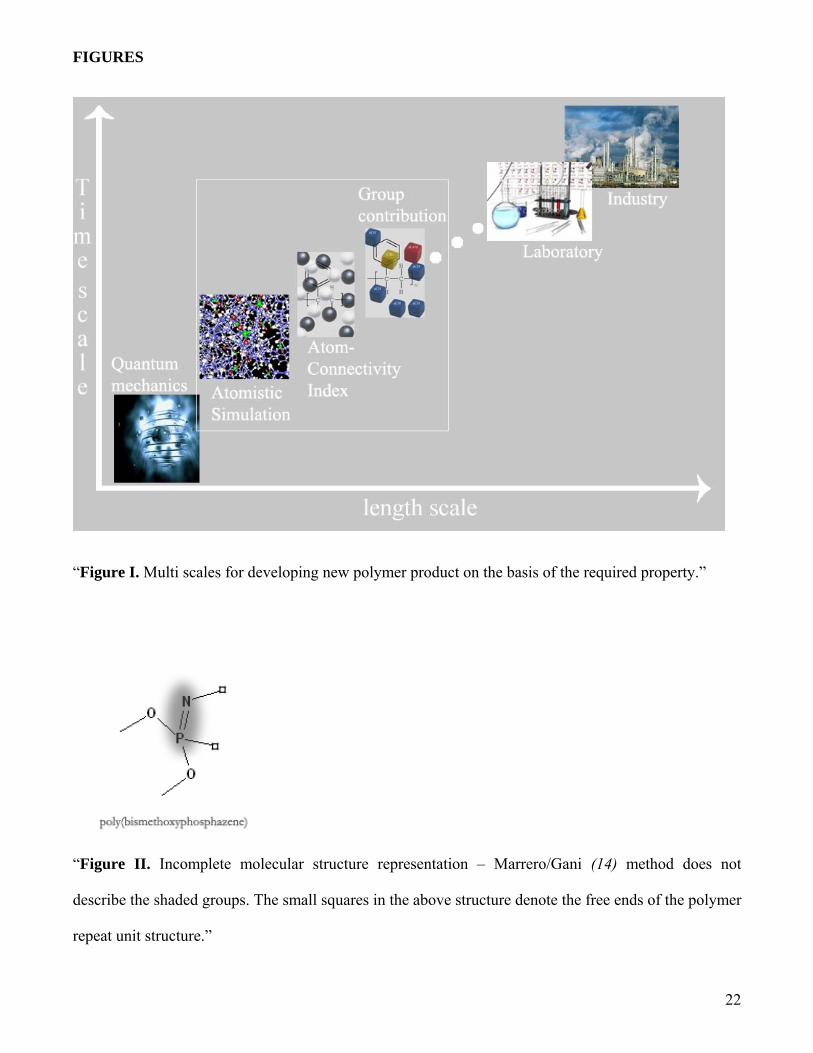
approaches are shown in the figure I. These approaches are unique in their own way but do have
limitations on their applications. At times, these approaches can also be complimentary to each other.
For example, in Computer Aided Molecular Design (CAMD) solution steps, the property constraints are
evaluated using a set of pre-selected predictive property models based on groups, or atom-connectivity;
and molecular descriptors to represent the generated molecular structures at different size scales and
structural details. This requires a multiscale modeling approach involving the selection of repeat unit (at
macroscopic scale) and its configurational arrangement (at microscopic scale).
Identification of a basic polymer repeat unit at macro scale level requires an appropriate CAMD
algorithm and a set of property prediction models. In the CAMD algorithm, fragments are used to
design the homo polymer repeat unit structures. These can either be groups at macro-scale or atoms at
meso-scale or both; and property prediction models are based on these types fragments (1-3). Therefore,
the CAMD algorithm completely depends on the reliability of the property prediction model used.
2

Group contribution based property prediction models (1,3) are sufficiently simple and reliable for use in
CAMD, but due to the limited availability of experimental data for polymer properties, one cannot
expect to fill out the entire group parameter table. At times there can also be a polymer repeat unit
structure, which cannot be totally represented by groups for a specific group contribution method. This
is overcome by a meso-scale approach, where an atom-connectivity index method is applied to
determine the missing groups and/or the missing group contributions automatically without the need for
additional experimental data. This integration of the group and atom-connectivity index based models is
called as group contribution plus (GC+) model and it has been developed for prediction of properties of
polymer repeat units by Satyanarayana et al. (3). Since, the atom-connectivity index based property
prediction models have comparatively lower accuracy than the group contribution models (4), they are
used to fill out the gaps in the group contribution models instead of relying totally on them. After the
integration of macro and meso-scales for the fragments to be used in the CAMD algorithm, the next step
is to decide which type of CAMD algorithm can be used.
Different types of CAMD algorithms have been proposed for homo polymer repeat unit structure
identification for a specified (desired) set of property criteria. Some of them being a mixed integer
linear programming (MILP) based algorithm using group contribution property models by Maranas (5);
a genetic algorithm based CAMD-algorithm using group contribution property models by
Venkatasubramanian et al. (6) and a multi-step, multi-level hybrid CAMD algorithm by Harper and
Gani (8). A multi-step, multi-level hybrid CAMD algorithm developed by Harper and Gani (8)
suppresses the combinatorial explosion problem and also generates a large number of structures. This
method has been modified for using GC+ models by Satyanarayana et al (7) and it is used in this work.
Configurational arrangement of the identified basic polymer repeat unit can be done by using
molecular mechanics at micro scale level and these arranged structures can later be used for either
prediction or validation of the required properties using atomistic simulations (micro scale). This
approach depends on reliability of the model used for force fields and also on the accuracy of the
conformational and structural properties of polymer chain. These simulations are computationally
3
intensive and time consuming, as such, this can be used immediately after the basic polymer repeat unit
structure has been identified using the CAMD algorithm. Some atomistic simulation based studies to
predict the property of polymers have been done by Makrodimitri et al. (9), Tsolou et al. (10), Charati
and Stern (11), Boyd and Pant (12), Müller-Plathe et al (13), etc.
By integrating the different scales, from macro- to micro-scale, the uniqueness of each method is
retained and their limitations are avoided to some extent. Integration of multiscale approaches and using
this to design a polymer repeat unit structure (as well as its chain length distribution), meeting a set of
target properties is the main goal of this paper. The method and its application is highlighted through a
case study.
BACKGROUND
Group Contribution plus (GC+) model – This property prediction model is the integration of group
contribution method with atom-connectivity index method developed by Gani et al. (4), with emphasis
on properties of organic chemicals. It has been further extended for predicting homo-polymer repeat
unit properties in this work using Marrero/Gani group contribution method and atom-connectivity index
method (3). Marrero/Gani group contribution method (14) has advantages over other group contribution
methods due to the large range of groups, classified as first-, second- and third order, which may be
used in models for polymer property prediction as well as for generation of polymer-repeat unit
structures.
The two main requirements of any group contribution method are:
(1) To represent the polymer repeat unit structure completely with the groups available in the selected
property prediction method.
(2) To estimate the necessary property by using the property contributions of the groups used to
represent the polymer structures.
If the polymer repeat unit structure of poly(bismethoxyphosphazene) (15) is considered (see figure II),
Marrero/Gani group contribution model cannot fully represent this structure; and hence its properties
4
cannot be estimated by this method. Moreover, as the number of reliable data on polymer systems is
limited, one cannot expect group contribution tables covering large ranges of groups without missing
entries. Thus, such a method alone may not be very widely applicable because the generation of missing
group contributions cannot be totally ruled out.
To retain the advantages of Marrero/Gani group contribution methods and to overcome the limitation
of their missing contributions, this group contribution method is integrated with the atom-connectivity
index method, which is called GC+ model.
Marrero/Gani group Contribution method
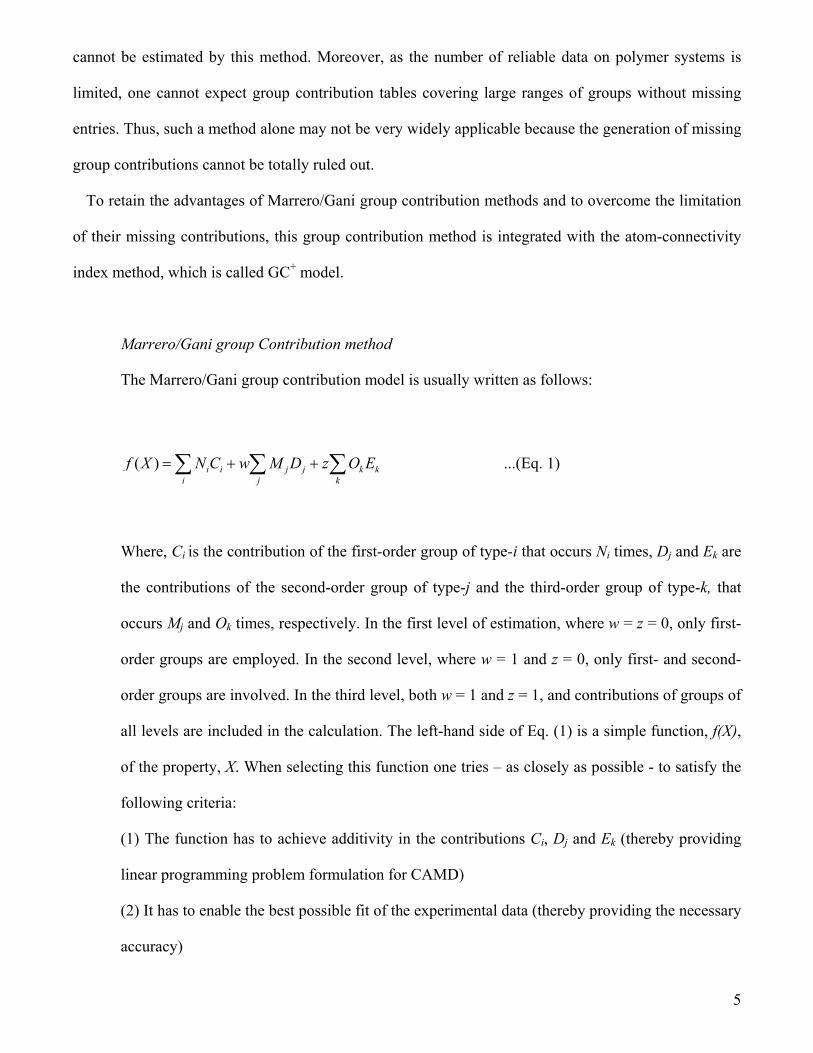
The Marrero/Gani group contribution model is usually written as follows:
( ) i i j j k ki j k
f X N C w M D z O= + +∑ ∑ ∑ E ...(Eq. 1)
Where, Ci is the contribution of the first-order group of type-i that occurs Ni times, Dj and Ek are
the contributions of the second-order group of type-j and the third-order group of type-k, that
occurs Mj and Ok times, respectively. In the first level of estimation, where w = z = 0, only first-
order groups are employed. In the second level, where w = 1 and z = 0, only first- and second-
order groups are involved. In the third level, both w = 1 and z = 1, and contributions of groups of
all levels are included in the calculation. The left-hand side of Eq. (1) is a simple function, f(X),
of the property, X. When selecting this function one tries – as closely as possible - to satisfy the
following criteria:
(1) The function has to achieve additivity in the contributions Ci, Dj and Ek (thereby providing
linear programming problem formulation for CAMD)
(2) It has to enable the best possible fit of the experimental data (thereby providing the necessary
accuracy)
5

(3) It should provide good extrapolating capability and therefore, a wide applicability (thereby
providing reliability of innovative solutions)
Thus the procedure for property prediction is the same as in the case of organic chemicals,
except that here the same set of groups describes the polymer repeat unit structures, that is,
structures having two free attachments.
Atom-Connectivity index method
In this case, the polymer repeat unit structures are represented by atoms and atom-connectivity
indices, as proposed by Gani et al. (4):
6
+ …(Eq. 2) vvii d(∑ ++=
icbAaYf )2)()()( 10 χχ
Where, Y is the sought polymer property, Ai is the contribution of atom i occurring in the
molecular structure ai times. vχ0 and vχ1 are the zeroth- (atom) and first-order (bond) connectivity
indices, respectively, as described by Kier and Hall (23). b, c and d are adjustable parameters.
These models have very few adjustable parameters: Ai (one per atom i), b, c and d.
Development of GC+ models for predicting polymer properties are explained in detail in
Satyanarayana et al (3).
CAMD algorithm for Polymer repeat unit design
CAMD algorithm for polymer product design has three main steps: problem formulation, repeat unit
identification and result analysis, similar to the work by Harper and Gani (16).
Problem formulation
The main aim of using a CAMD algorithm is to identify a set of candidates or compounds
possessing a specified set of properties. This can be achieved by generating molecular structures
that match the required specifications with respect to compound type, and physical and chemical

properties. In order to find a set of polymer repeat unit structures having desired properties, it is
necessary to provide a set of specifications for these (target) properties. The molecular design
problem may be formulated to have only structural constraints or only property constraints, or
both, depending on the specific needs for the desired product.
Structural constraints – these are related to the size and chemical feasibility of the generated
structures. For example, for a representation by groups, how many groups (maximum and
minimum) can be present, how many times a particular group can occur in the repeat unit, and
the rules for combining them? Moreover any chemical structure that is generated should also
satisfy certain structural conditions, such as; there must be two free attachments in each polymer
repeat unit structure. The combination rules have been adapted from those of Harper and Gani
(16).
Property constraints – these are related to the needs for the desired product, expressed in terms
of target property values. Mathematically, these constraints are written as Pl ≤ P(ni)≤ Pu, where
ni is the number of times the ith group appear in the polymer, P(ni) is the vector of predicted
properties for the polymer, Pl is the vector of lower bounds specified on the various polymer
properties and Pu is the vector of upper bounds specified on the various polymer properties.
Repeat unit identification
The employed CAMD technique is of the “generate-and-test” type, where all feasible repeat unit
structures are generated from a set of building blocks and subsequently tested against the
property constraints. The multi-level approach of Harper et al. (8) is employed, basically to
avoid a combinatorial explosion. This multi-step, multi-level hybrid CAMD algorithm is
modified for polymer repeat unit design, which uses GC+ model for predicting property of the
generated polymer repeat unit structures (19). Hence, polymer repeat units are generated in
successive steps, where they are screened against a corresponding set of property constraints.
The level of molecular details increases as the number of promising candidates decreases, in
each subsequent step.
7
Result analysis
The screened repeat units satisfying the property constraints can be further analyzed; if
necessary, using literature sources or other prediction methods, as additional design steps.
Molecular Dynamics
The identified basic polymer repeat unit from the CAMD algorithm does not give the complete
structural or conformational information of the polymer. More over it is not one basic repeat unit that
constitutes the whole polymer, but number of basic repeat units that together form a characteristic
polymer. It is therefore required to arrange the identified basic repeat unit structures in such a way that
it has full conformational information of how a polymer repeat unit could exist in reality. This is a
missing part of the CAMD algorithm but it can be complimented by using molecular dynamics to
arrange the polymer repeat unit structures and obtain the conformational information and verify the
chain-length for the polymer. Having the available structural information, the polymer repeat units can
be set for atomistic simulations to predict and/or validate how the property corresponding to these
structures change as a function of size (number of repeat units) or operational variables such as,
temperature. These atomistic simulations are done in this work using Material Studio, software package
of Accelrys Software Inc. (17).
METHODOLOGY
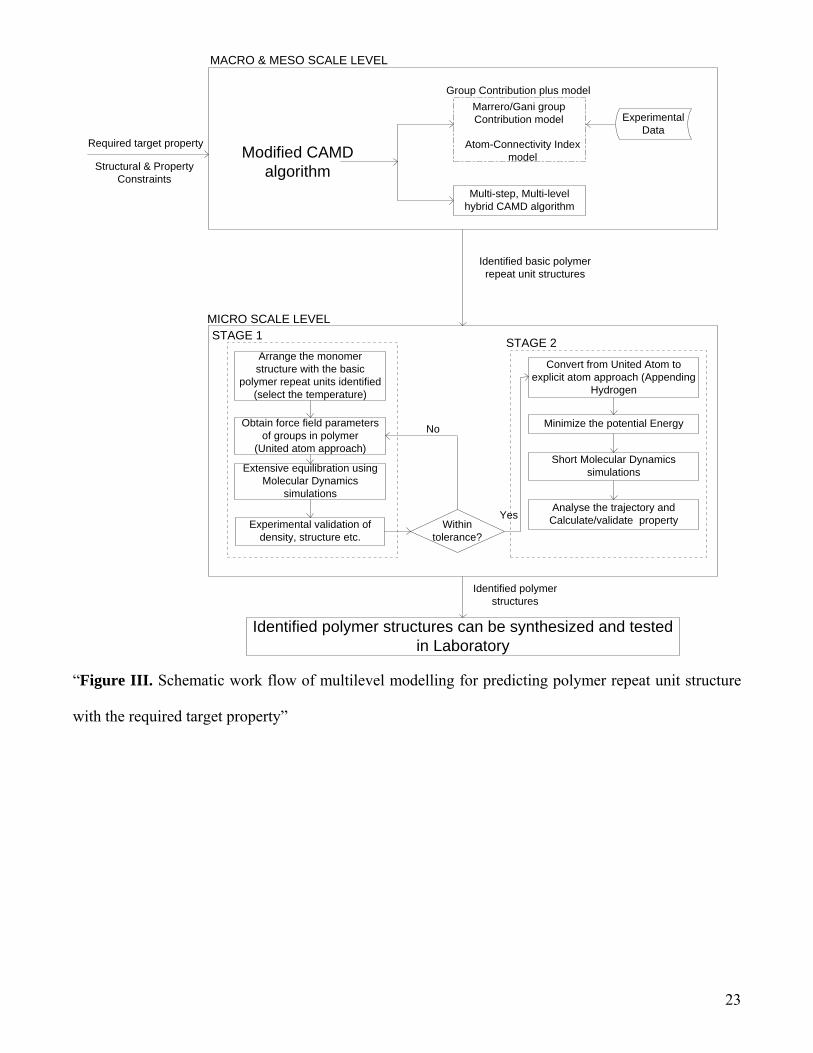
The schematic work flow of multilevel modeling for predicting polymer repeat unit structure with the
required target properties is shown in the figure III. The required target properties are set as the input to
this multilevel modeling methodology. The modified CAMD algorithm (7) using either macro or meso
scale approach or both, is used generate the basic polymer repeat unit structures and check if they
posses the required property or not (using GC+ model). A set of basic polymer repeat unit structures
which promises to have the required properties are obtained as output from this step.
8

A number of basic polymer repeat units, which are identified from macro and meso scale approach,
are arranged to form a homo-polymer repeat unit structures. The united-atom force fields model, which
incorporates a group of atoms that can approximately represent the molecular mechanical properties of
the group on a scale of size that is larger than atomic scale, is used to describe these structures. The
united-atom model is a good approximation to simulate molecular systems in which the intermolecular
motion is much more important than the intramolecular motion. These polymer repeat unit structures are
simulated extensively to determine or validate conformational characteristics and volumetric properties
over a wide range of temperatures. This extensive simulation is done in stage A as described in the
micro scale level part of the figure III. The independent configurations of the polymer obtained from
stage A is used in stage B, as shown in figure III. These pre-equilibrated configurations with united-
atom model are converted to all-atom (explicit-atom) structures, re-equilibrated using the detailed
COMPASS (Condensed-phase Optimized Molecular Potentials for Atomistic Simulation Studies) force
field and then simulated shortly to estimate or validate the required property. The conversion to all atom
model is an essential step for the prediction of properties (like barrier properties) because hydrogen
atoms in the polymer matrix exhibit enhanced mobility there by causing an increase in the dynamic
flexibility of the system through the fast local re-arrangements of the accessible accessible volume. The
conversions from a united-atom to all-atom representation do give rise to steric overlaps, but these can
be easily eliminated by subjecting the system to an energy minimization procedure.
The obtained polymer configurations that have the required set of properties can then be tested in
laboratory to verify if they can be synthesized and also to validate if they have the required property.
This methodology can reduce the need for laboratory scale synthesize-and-test of thousands of polymers
to verify if they have the required properties, thereby, reducing the time and cost for developing a new
polymer based product.
CASE STUDY
9
A hermetic seal based stopper has wide applications in food, chemical and pharmaceutical industries,
as these seals intend to secure against the entry of air or microorganisms and to maintain the safety and
quality of the contents stored in the containers with this seal. There are a number of materials that are
used as sealants such as natural rubber, cork, etc. Natural rubber has a disadvantage to be used as a
stopper for medical (or drug) bottles as they may cause latex allergies on patients (24). Cork stoppers
also have disadvantages as they may at times spoil the contents stored with this stopper due to their
varying pores size (25). It would be interesting to design a polymeric material which can be used as a
hermetic stopper (sealant) by retaining the advantages of the existing stopper materials and overcoming
their disadvantages. The multilevel modeling methodology can be used for designing this polymeric
material that can be used as a hermetic stopper. But designing a hermetic seal in common to be used in
the food, chemical and pharmaceutical industries could be too ambitious, as each of these areas may
have different types materials needed to be stored. Therefore, narrowing the problem definition, this
case study is confined to the design of a polymeric material that is suitable for use as a hermetic seal in
pharmaceutical industries. In other words, it is required to design a polymeric material that can be used
as a medical container stopper, which is a hermetic sealant.
Application of the Macro-Meso-scale approach
The design problem to be solved through this methodology is to identify the basic polymer repeat unit
structures that can be used as a hermetic stopper, using the macro and meso scale approach. These
require a set of structural and property constraints, which are explained in detail below, need to be
specified first.
Property Constraints
Glass transition temperature: The polymeric stopper is required to be elastic over a wide range
of temperature, and it is preferred to have a rubbery amorphous polymer; which implies that the
glass transition temperature of the polymer should be less than or equal to the room temperature,
10

300 K (1). The upper limit for glass transition temperature is relaxed to 350 K. By doing this, the
scope of missing some candidates that have the required property (but are not identified due to
inconsistency of the experimental data reported and also considered while developing the
property prediction models) is minimized to some extent.
Dielectric constant: Some contents stored in the medical containers needs to be constantly
agitated with electrical agitators before use. It is therefore required that the polymeric stopper
that is required to be designed should not conduct electricity and affect the stored contents in the
medical containers. This implies that the polymer designed should have low dielectric constant.
Therefore, maximum constraint can be imposed as 2.5 for dielectric constant.
Low permeation to moisture and air: The focus of this case study is to design a stopper for
medical containers that is a hermetic sealant. This implies that the stopper should protect the
contents stored from moisture and air; that means that the designed material should have very
low water (or moisture) absorptivity (1).
Low permeation to air is also an important aspect to be considered. Air is a mixture of nitrogen
and oxygen in larger proportions when compared to other gases comprising it. Low permeation
of air through the polymeric stopper that needs to be designed implies low permeation to
nitrogen (N2) and oxygen (O2). Since there is no direct group contribution method to study the
solubility and diffusivity (the key factors to determine permeation) in the polymer, this can be
studied at micro scale after identifying the basic polymer repeat units that can be used as a
hermetic stopper.
Structural Constraints
Based on the property constraints, it is more efficient to pre-select a basis set of groups (or
building blocks) that are needed to build the basic polymer repeat unit structures. In this way,
the combinatorial size of the problem is reduced and redundant structures are eliminated easily.
Since it is required to design rubbery amorphous polymer (as stated above) with low
11
permeability to moisture, the polar and hydrogen bond forming functional groups are not
included in the basis set. The reason for this is, the presence of polar and hydrogen bonding
functional groups on polymeric chain often enhances chain-chain attractions (as they make
possible dipole-dipole hydrogen bonding intermolecular forces), particularly if these
involve hydrogen bonding and there by enhancing crystallinity and tensile strength.
Considering that the polymer repeat unit does not contain any polar or hydrogen bonding
forming groups (also aromatic groups), only the groups forming olefinic polymers can be
allowed. It is also known that the double bonds in polymers make them poor for weather
resistance, thermal resistance, oxygen resistance and ozone resistance, thereby limiting their
influence (18). This applies to olefinic groups with triple bonds. Taking this into account,
olefinic groups with double and triple bonds are not included in the basis set for designing a
polymer repeat unit structure that can be used as a stopper for medical containers. Therefore the
basis set of groups included in this case study are CH3, CH2, CH and C.
Upper and lower bounds on occurrences of groups: Apart from deciding the basis set, it is also
required to decide the minimum and maximum number of groups that can occur in a basic
polymer repeat unit structure and also the number of time each group can be repeated. As the
side chain forming groups like CH and C are included in the basis set, it is safer to avoid too
many side chains in a basic polymer repeat unit and also the longer side chains (in the
combination with CH2 and CH3). Therefore, the number of times each group can occur in a
repeat unit is set to 2. The minimum number of groups’ occurring in the basic repeat unit is set
to 2. Since the maximum number of times each group can occur is set to 2, the maximum number
of groups that can occur with the combination of all the groups that are included in the basis set
comes to 6. Thus;
12
6 …(Eq. 3) 2 jj
n≤ ≤∑
where, nj is the number of groups of type j.

The structural groups considered in the basis set were classified on the basis of their valency
(number of free attachments) and general octet rule is followed while generating structures using
these building blocks. As this case study aims at generating a basic polymer (homo) repeat unit
that has two free ends, this criterion of having two free ends in each generated structure is also
specified. Thus a simple relation for structural feasibility of a collection of groups with this
constraint is;
…(Eq. 4) (2 ) 2( 1)j jj
v n m− = −∑
where nj, vj are the number and valency, respectively, of groups of type j and m =1, 0 or -1 for
acyclic, monocyclic and bicyclic groups, respectively. Here in thos case, as only olifinic groups
are considered only acyclic polymer repeat units are generated. Therefore m takes the value of 1.
Structural and property constraints are given as the input to the CAMD algorithm. 112 candidates of
basic repeat unit structures are designed and 106 candidates among them are selected based on the given
constraints. These 106 candidates include also some isomers of the generated repeat units. Removing
the isomers, 12 basic polymer repeat units that satisfy all constraints are listed in table 1.
Repeat unit structure of polyisobutylene is one of the identified repeat units from the CAMD
algorithm. Polyisobutylene is an important (known) elastomer with a low glass transition temperature.
From different literature sources (12, 13, 19) it is reported that this polymer is well known for its
markedly low permeability properties to small gas molecules, when compared to other elastomers, due
to the presence of two bulky pendant methyl groups on each basic repeat unit structure. Permeability is
described as the product of solubility and diffusivity. Lower solubility and diffusivity values always
correspond to low permeability. Therefore, solubility and diffusivity of the gas molecules (O2 and N2)
can be verified or studied under the micro-scale approach. As it is highly time consuming to study the
entire identified basic polymer repeat unit structures at micro-scale level (at this point of time), only
polyisobutylene is studied at micro-scale level in this paper.
13

Application of the Micro-scale approach
Stage I
As shown in figure III, this stage deals with the structural representation of polymeric systems.
Different polyisobutylene (PIB) systems at various temperatures starting from 8 basic repeat
units to 80 basic repeat units to represent a reasonable distribution of chain lengths were studied
by Tsolou et al (10). In this study included a brute-force application of a parallel molecular
dynamics simulations based on a new united-atom model. Resuts from this work by Tsolou et al
(10) correctly reproduces the volumetric, structural and conformational properties of PIB. The
correct reproduction of the polymeric system is very important to make further investigations on
properties. Therefore, these structures have been taken in stage 2 to study the solubility and
diffusivity of O2 in PIB systems.
Stage II
This stage deals with the further investigation of properties from the well represented structures
from stage I (see figure III). Fully equilibrated configurations from the simulations performed by
Tsolou et al. (10) were used in the prediction of solubility of O2 and N2. These two molecules
have lower solubility coefficient in PIB system as reported by Tsolou et al. (10). As solubility
alone is not sufficient to describe permeability, diffusivity of these molecules in the same PIB
system needs to be studied. Since the molecular diameter of N2 is larger than O2, it is reasonable
to just study the diffusivity of O2 alone as lower diffusivity of O2 implies lower diffusivity of
N2 (22).
Description of PIB system used in this work: Independent configurations of PIB system of 80
basic repeat units (a total of 320 Carbon atoms in each chain) to represent each chain is
considered for studying the diffusivity of O2. If a number of shorter chain lengths are
considered in the simulation box, it can result in the increase in the free volume there by lowering
14

the density of the system (see figure IV). Inorder to have the density of the system closer to the e
experimental density, longer chains are taken in the simulation box.
Step wise approach of stage 2: A small simulation box with three chains of PIB-C320 which is
thoroughly pre-equilibrated is taken at 350, 450, 500 and 550 K. This system is then converted
from united- to all-atom representation using Material Studio (17). The energy of the system is
minimized. 5 O2 molecules are inserted randomly at different positions to each PIB-C320 matrix
at different temperatures and the energy of these matrixes are re-minimized. These systems are
further thermally re-equilibrated through a short NVT molecular dynamics run for a short time.
Later they are simulated through NPT runs (up 2 ns depending on the lower temperature
considered).
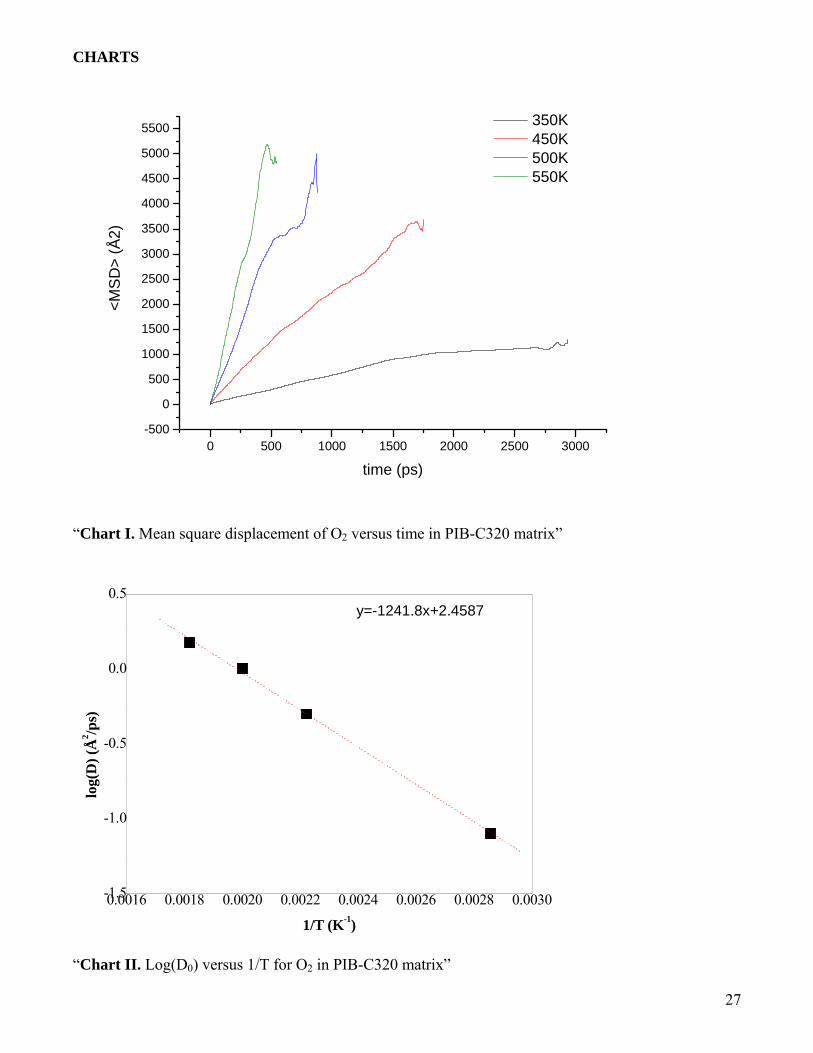
Trajectory Analysis to calculate diffusivity of O2: The mean square displacement (MSD) of the
gas molecules is calculated and averaged over number of molecules from the trajectory saved
during the molecular dynamics simulations. MSD versus time, which is a straight line, is plotted
and the slope gives the diffusion coefficient. Diffusion of small molecules in polymer using
molecular dynamics simulation is most frequently calculated by means of the Einstein
relationship which is given as (20):
[ ]2
1
1 lim ( ) (0)6
N
i it i
dD r tN dt
α
αα
→∞=
= ∑ r− …(eq. 3)
where, ri denotes the position vector of center of mass of species α, and angular brackets denote
averaging over all choices of time origin within a dynamic trajectory. From an molecular
dynamics run, long enough to ensure that the system has reached the fickian diffusive regime
(when slope of the log of MSD averaged over number of atoms/molecules (Nα) is plotted against
time. A plot of MSD as a function of time should give a straight line, if the molecular motion is
described by the diffusion equations, and the diffusion coefficient may be determined from the
slope of the line (21). MSD versus time for O2 in PIB-C320 at 350, 450, 500 and 550 K are
shown in chart I.
15

Diffusion Coefficient of O2 in PIB C-320: The diffusion coefficient of O2 molecules calculated at
different temperatures is shown in chart II (log (D0) vs 1/T). From this chart the diffusion
coefficient of O2 at 300 K in PIB-C320 can be extrapolated. This value comes to 0.021 Å2/ps
which is two orders higher in dimension to that reported in Müller-Plathe et al. (13). Activation
energy for the diffusion can also be calculated using the slope from the chart II in the equation,
( )( )log
10.434appa
DRET
∂= −
∂ …(eq. 4)
The calculated activation energy using equation 4 is 5.7kcal/mol and that reported by
Amerongen (22) is 11.9kcal/mol. Moreover, from the same literature it has been found that
activation energy increases as temperature decreases. Consequently the value of 5.7kcal/mol for
activation energy is extracted from this simulation, is quite reasonable.
The reason for why the obtained results deviate from the reported results has been scrutinized.
Since diffusivity is inversely related to density, and as NPT simulation is performed, it is
necessary to find out if the density of the system is equilibrated or not. The density profiles (at
all the considered temperatures) after NPT runs have been analyzed. It is found that the density of
the matrix decreased by approximately 5 % when compared to the initial density of the matrix.
These values are reported in table 2.
The reason for this was investigated for the PIB-C320 matrix at 450 K. The initial united atom
configuration is converted to all atom configurations using Material Studio (17). The initial d
ensity is 0.8508; the whole matrix is minimized for energy and simulated under NPT conditions
for 500 ps. The averaged density of the system is rechecked and it is found to be approximately
5 % lower than the initial density. Therefore, lowering of the density of the system by Material
Studio (17) can probably be the reason for higher value of diffusivity obtained from NPT runs.
The use of NVT simulation instead of NPT, may give diffusivity value closer to the
experimental/reported result as the density of the system will be kept constant all throughout the
simulation.
16

Case study results and discussion
This case study clearly justifies the application of multilevel approach to the design of a polymer
having the desired properties. Using the Macro-Meso-Scale approach, a set of basic polymer repeat
units promising to have the required target property is obtained. Since only olefinic groups were
included in the basis set, it is obvious that the basic polymer repeat unit structures formed from them
have very low water absorptivity. This property has been validated using Van Krevelen’s group
contribution model (1), and has been reported in table 1. Macro-Meso-Scale approach alone cannot
decide the arrangement of the repeat units or the chain length, Micro-Scale approach is made used.
Since it is time consuming to study all the identified repeat units from the Macro-Meso-Scale approach
under Micro-scale approach and as the main intension of this work is to verify the multilevel modeling
methodology, only PIB structure is used for Micro-scale approach studies.
PIB structures were investigated to see if they have low diffusivity to O2. Though the diffusivity
results obtained from simulation were two orders of magnitude when compared to the experimental
results, yet the diffusivity of O2 in PIB C-320 system is quite low. The low solubility of O2 reported by
Tsolou et al. (10) and low diffusivity of O2 from the simulation result implies in the low permeability of
O2 in this designed polymer. Moreover as the molecular size of O2 is smaller than N2, which therefore
means that this designed polymer has low permeability to N2. In broader sense, this polymer has low
permeability to air. It has also been mentioned in different literature (12, 13, 19) that this polymer is a
very good elastomer and has low glass transition temperature too. Based on the literature sources and
the obtained results from this case study, this material (PIB-C320) can be sent for the laboratory scale
synthesis and also can be validated to see if it has all the required property or not.
This case study therefore clealy validates the multilevel approach for computer aided polymer design.
CONCLUSION
17

A multilevel approach in designing a polymer with the required properties is very promising as it
decreases the time for developing a new production that is the traditional approach of synthesizing a lot
of compounds in laboratory and tesiting them can be reduced to greater extent. Application of GC+
property models for predicting polymer repeat unit structure properties in the CAMD algorithm
enhances the application range of problems that can be handled. The CAMD algorithm is not a stand
alone approach to the design of a new polymer based product as this approach does not give complete
information on how the basic polymer repeat units are arranged or the chain length of the polymer
designed. Therefore after identifying the basic repeat unit structures, using a CAMD algorithm based on
Macro-Meso-Scale approach, further details on the polymer are added in terms of the arrangement of
the identified polymer repeat unit to form a polymer chain by studying the conformational and structural
properties of the polymer chain using atomistic simulations based on the Micro-Scale approach. This
multilevel approach has been incorporated in the developed methodology.
A case study to verify/support the multilevel approach in computer aided polymer design has been
perfomed. In this case study, the Macro-Meso-Micro scale approaches have been used to design a
polymer that can be used for making hermetic stoppers (sealent). Polyisobutylene is one of the basic
polymer repeat unit identified from the Macro-Meso-Scale approach (CAMD algorithm) and the chain
length of this polymer has been determined through the Micro-Scale approach. Since Micro-scale
approach is computationally intensive, it is too time consuming to rely alone on this approach.
Therefore, parallel computing methods or higher-order group contribution models could be used prior to
the Micro-scale approach. Thus the step wise integration of multilevel approaches helped in overcoming
the disadvantages of each approaches while retaining its advantages.
REFERENCE
1. Van Krevelen, D.W. (1990). Properties of Polymers, Amsterdam: Elsevier.
2. Bicerano, J. (2002). Prediction of Polymer Properties. New York: Marcel Dekker Inc.
18

3. Satyanarayana, K.C., Gani, R., Abildskov, J. (2007). Polymer property modeling using grid
technology for design of structured products. Fluid Phase Equilibria, 261, 58.
4. Gani, R., Harper, P.M., Hostrup, M. (2005). Automatic creation of missing groups through
connectivity index for pure-component property prediction. Ind. Eng. Chem. Res., 44, 7262.
5. Manaras, C.D. (1996). Optimal computer-aided molecular design: A polymer design case study.
Ind. Eng. Chem. Res.,35 (10), 3403.
6. Venkatasubramanian, V., Chan, K., Caruthers, J. M.(1994). Computer-Aided Molecular Design
using Genetic Algorithms. Computers &.Chemical Engineering, 18, 9, 833.
7. Satyanarayana, K.C, Abildskov, J. , Gani, R.. Computer aided polymer design using group
contribution plus property models. Computers & Chemical Engineering. (submitted 2008).
8. Harper, P.M., Gani, R. (2000). A multi-step and multi-level approach for computer aided
molecular design. Computers & Chemical Engineering, 24, 2-7, 677.
9. Makrodimitri, Z.A., Dohrn, R., Economou, I.G. (2007). Atomistic simulation of
poly(dimethylsiloxane): Force field development, structure and thermodynamic properties of
polymer melt and solubility of n-alkanes, n-perfluoroalkanes, and noble and light gases.
Macromolecules, 40, 1720.
10. Tsolou, G., Mavrantzas, V.G., Makrodimitri, Z.A., Economou, I.G., Gani, R. (2008). Atomistic
simulation of the sorption of small gas molecules in polyisobutylene. Macromolecules, 41 (16),
6228.
11. Charati, S.G., Stern, S.A. (1998). Diffusion of gases in silicone polymers: Molecular dynamics
simulations. Macromolecules 31, 5529.
12. Boyd, R.H., Pant, P.V. (1991). Molecular packing and diffusion in polyisobutylene.
Macromolecules 24, 6325.
19
13. Müller-Plathe, F., Rogers, S.C., van Gunsteren, W.F. (1993). Gas sorption and transport in
polyisobutylene: Equilibrium and nonequilibrium molecular dynamics simulations. J. Chem. Phys.
98 (12), 9895.
14. Marrero, J., Gani, R. (2001). Group-contribution based estimation of pure component properties.
Fluid Phase Equilibria, 183-184, 183.
15. PolyInfo (a polymer database), National Institute for Material Science, Japan.
https://polymer.nims.go.jp/PoLyInfo/
16. Harper, P.M., Gani, R., Kolar, P., Ishikawa, T. (1999). Computer-aided molecular design with
combined molecular modeling and group contribution. Fluid Phase Equilibria 158-160, 337.
17. Material Studio, M.S.P., Accelrys Software Inc., San Diego, USA.
18. United States Patent 5994477 (1999), Selective hydrogenation method of living polymer having
olefinic double bond.
19. Pant, P.V., Boyd, R.H. (1993). Molecular dynamics simulation of diffusion of small penetrants in
polymers. Macromolecules 26, 679.
20. Karayiannis, N.C., Mavrantzas, V.G., Theodorou, D.N. (2004). Detailed atomistic simulation of
the segmental dynamics and barrier properties of amorphous poly(ethylene terephthalate) and
poly(ethylene isophthalate). Macromolecules, 37, 2978.
21. Karayiannis, N.C., Giannousaki, A.E., Mavrantzas, V.G. (2003). An advanced Monte Carlo
method for the equilibration of model long-chain branched polymers with a well-defined
molecular architecture: Detailed atomistic simulation of an h-shaped polyethylene melt. Journal of
Chemical Physics, 118 (6), 2451.
22. Van Amerongen, G.J. (1950). Influence of structure of elastomers on their permeability to gases.
Journal of polymer science, 5 (3), 307.
20
21
23. Kier, B., Hall, H.L. (1986). Molecular connectivity in Structure Activity Analysis. New York:
John Wiley & Sons.
24. Drug Bottles Containing Natural Rubber Stoppers May Place Latex Allergic Patients At Risk for
Reactions. ScienceDaily, June 15, 2001. (http://www.sciencedaily.com)
25. United States Patent 6528152 (2003), Stopper of foamed thermoplastic synthetic material.
FIGURES
“Figure I. Multi scales for developing new polymer product on the basis of the required property.”
“Figure II. Incomplete molecular structure representation – Marrero/Gani (14) method does not
describe the shaded groups. The small squares in the above structure denote the free ends of the polymer
repeat unit structure.”
22
Modified CAMD algorithm
Group Contribution plus modelMarrero/Gani group Contribution model
Atom-Connectivity Index model
Multi-step, Multi-level hybrid CAMD algorithm
Experimental Data
Required target property
Structural & Property Constraints
MACRO & MESO SCALE LEVEL
MICRO SCALE LEVEL
Identified basic polymer repeat unit structures
Arrange the monomer structure with the basic
polymer repeat units identified(select the temperature)
Obtain force field parameters of groups in polymer
(United atom approach)
Extensive equilibration using Molecular Dynamics
simulations
Experimental validation of density, structure etc.
Within tolerance?
STAGE 1
No
Convert from United Atom to explicit atom approach (Appending
Hydrogen
Minimize the potential Energy
Short Molecular Dynamics simulations
YesAnalyse the trajectory and
Calculate/validate property
STAGE 2
Identified polymer structures
Identified polymer structures can be synthesized and tested in Laboratory
“Figure III. Schematic work flow of multilevel modelling for predicting polymer repeat unit structure
with the required target property”
23
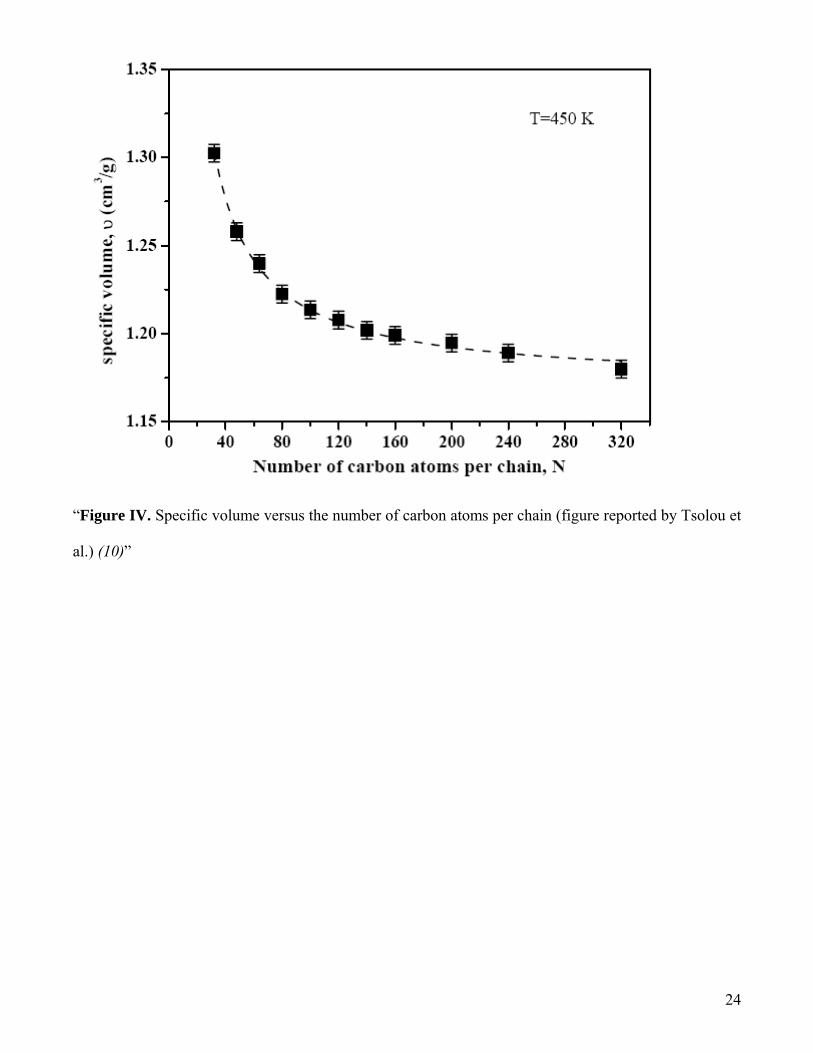
“Figure IV. Specific volume versus the number of carbon atoms per chain (figure reported by Tsolou et
al.) (10)”
24

TABLES
Structural Constraints
Basis set CH3, CH2, CH, C
Number of groups 6 (Max) 2 (Min)
Property Constraints Min Max
Glass Transition temperature (K) 350
Dielectric Constant 2.5
Basic polymer repeat units Tg (K) ε
Wabs (g of H2O/g of polymer)
-[-CH(CH3)-]n- 302.51 2.48 0.00004
-[-CH2-CH2-]n- 168.72 2.47 0.00004
-[-CH2-CH(CH3)-]n- 257.91 2.37 0.00004
-[-CH2-C(CH3)2-]n- 342.1 2.23 0.00003
-[-CH(CH(CH3)2)-]n- 303.13 2.28 0.00004
-[-CH(CH3)-CH(CH3)-]n- 302.51 2.26 0.00004
-[-CH((CH2)2CH3)-]n- 235.61 2.25 0.00004
-[-C(CH3)((CH2)2CH3)-]n- 307.43 2.12 0.00003
-[-CH(CH(CH3)CH2CH3)-]n- 275.75 2.14 0.00004
-[-CH2-CH(CH(CH3)2)-]n- 276.24 2.17 0.00004
-[-CH(CH(CH3)((CH2)2CH3))-]n- 257.91 2.03 0.00004
-[-CH((CH2)2-CH(CH3)2)-]n- 258.32 2.05 0.00004
“Table 1. Identified basic polymer repeat units from CAMD algorithm”
Temperature Initial Density Density after NPT runs
550 K 0.798907 0.7562
25

26
500 K 0.826817 0.7781
450 K 0.8508 0.8152
350 K 0.905498 0.8658
“Table 2. Table showing the change in density (from initial density) after NPT runs for PIB-C320”
CHARTS
0 500 1000 1500 2000 2500 3000-500
0
500
1000
1500
2000
2500
3000
3500
4000
4500
5000
5500<M
SD
> (Å
2)
time (ps)
350K 450K 500K 550K
“Chart I. Mean square displacement of O2 versus time in PIB-C320 matrix”
0.0016 0.0018 0.0020 0.0022 0.0024 0.0026 0.0028 0.0030-1.5
-1.0
-0.5
0.0
0.5
log(
D) (
Å2 /p
s)
1/T (K-1)
y=-1241.8x+2.4587
“Chart II. Log(D0) versus 1/T for O2 in PIB-C320 matrix”
27