comprehensive a d c a 13-36 m pfundacjanutricia.pl/wp-content/uploads/2018/03/study-report-in... ·...
TRANSCRIPT

FINAL REPORT
COMPREHENSIVE ASSESSMENT OF DIET OF
CHILDREN AGED 13-36 MONTHS IN POLAND Study results 2010-2011
FINAL REPORT
COMPREHENSIVE ASSESSMENT OF DIET OF
CHILDREN AGED 13-36 MONTHS IN POLAND
Study results 2010-2011
Study edited by
Halina Weker and Marta Barańska
Warsaw 2011
The study COMPREHENSIVE ASSESSMENT OF DIET OF CHILDREN AGED 13-36 MONTHS IN
POLAND was financed by the Nutricia Foundation, the task of IMD No. OPK 549-25-01
Subject matter of the report prepared by:
Prof. nadz. dr hab. n. med. Halina Weker1
Mgr Marta Barańska2
Dr n. med. Joanna Mazur3
Prof. dr hab. med. Piotr Socha4
The study was conducted by:
Prof. nadz. dr hab. n. med. Halina Weker1
Mgr Marta Barańska2
Dr n. med. Joanna Mazur3
Prof. dr hab. med. Piotr Socha4
Dr n. med. Grażyna Rowicka1
Lek. med. Hanna Dyląg1
Lek. med. Witold Klemarczyk1
Mgr Małgorzata Strucińska1
Mgr Małgorzata Więch1
Mgr Agnieszka Riahi1
Mgr Patrycja Kurpińska1
1Department of Nutrition, Institute of Mother and Child, Warsaw
2Department of Early Psychological Intervention, Institute of Mother and Child, Warsaw
3Department of Protection and Promotion of Children and Youth Health, Institute of Mother and
Child, Warsaw
4Children’s Memorial Health Institute, Warsaw
Institute of Mother and Child
Warsaw 2011
Table of Contents

4
I. Introduction .............................................................................................................................. 5
II. Theoretical Assumptions and Study Overview ........................................................................... 7
1. Dietary Patterns for Young Children ............................................................................................... 7
2. Food Rations for Children Aged 1-3 years ....................................................................................... 8
3. Demand for Energy and Nutrients 29-34 .......................................................................................... 11
III. Comprehensive Assessment of Diet of Children Aged 13-36 Months in Poland - Nationwide
Study ......................................................................................................................................... 27
1. Purpose of the Study ..................................................................................................................... 27
2. Methodology ................................................................................................................................. 28
2.1. Selection of Sample ................................................................................................................ 28
2.2. Study Tool ............................................................................................................................... 30
2.3. Methodology of Study ............................................................................................................ 31
2.4. Methods of Statistical Analysis ............................................................................................... 32
3. Characteristics of the Study Group ............................................................................................... 33
4. Discussion of Results ..................................................................................................................... 36
4.1. Assessment of the Nutritional Status of the Studied Children............................................... 36
4.2. Assessment of diet ................................................................................................................. 40
4.2.1. The analysis of dietary patterns of the studied children ................................................. 40
4.2.2. Assessment of share of food products in food rations of children ................................. 48
4.2.3. Assessment of the energy and nutritional value of daily food rations ........................... 54
4.2.4. Identification of factors affecting the nutritional status of children ............................... 64
IV. Summary and Conclusions ..................................................................................................... 66
V. Suggestions regarding solutions for the implementation of nutritional recommendations for
children aged 13-36 months ....................................................................................................... 70
Literature ................................................................................................................................... 71
Appendix ................................................................................................................................... 77
Annex 1 List of Figures in the Report ................................................................................................ 77
Annex 2 List of Tables in the Report .................................................................................................. 79
Annex 3 Survey Questionnaire .......................................................................................................... 81
Appendix 5 The survey results (Parts A, B and C)............................................................................ 141
5
I. Introduction
Proper nutrition is one of the most important factors for the child's proper
psychosomatic development. The impact of early nutrition on the development of foetus
and child, called a nutrition programming, is associated with short- and long-term
effects in the functioning of the body, including the health condition in adulthood 1-4 .
The rules for feeding children aged 13-36 months were established in 2007 and
published as a medical standard in 2008 in Poland5. The idea behind the
recommendations was to draw attention to proper nutrition in younger children in
order to reduce the risk of obesity and malnutrition.
In the same year the nutrition standards for the Polish population that had been
in force since 2001 were changed6 ,7. The changes introduced in the nutrition standards
related to demand for energy and nutrients (protein, vitamins) and were dictated by the
current results of research in the area of nutritional science. It was proved that
adherence to the nutrition standards through a balanced diet combined with proper
physical activity is associated with reduced risk of diet-related diseases, including
obesity 8-13.
No comprehensive assessment of diet of children aged 1-3 years on a
representative sample has been conducted in Poland yet. The results of individual tests
conducted on small groups at various centres did not allow drawing conclusions
regarding the nutrition in children at that age 14-17 . The conducted study is an attempt
1 Barker D.J.: In utero programming of cardiovascular disease. Theriogenology 2000, 53(2), 555-574 2 Barker D.J.: The developmental origins of adult disease. J. Am. Coll. Nutr. 2004, 23(6 suppl), 588S-595S 3 Neu J., Hauser N., Douglas-Escobar M.: Postnatal nutrition and adult health programming. Semin. Fetal Neonatal Med. 2007, 12(1), 78-86. 4 Cottrell E.C., Ozanne S.E.: Early life programming of obesity and metabolic disease. Physiol. Behav. 2008, 94(1), 17-28 5 Dobrzańska A., Czerwionka-Szaflarska M., Kunachowicz H., Książyk J., Lukas W., Ryżko J., Socha J., Stolarczyk A., Szajewska H., Wąsowska-Królikowska K., Weker H.: Recommendations for nutrition of healthy children aged 1-3 years (13-36 months) prepared by the team of experts appointed by the National Consultant in Paediatrics. Pediatr. Pol. 2008, 82(1), 93-95 6 Jarosz M., Bułhak-Jachymczyk B. (eds): Normy żywienia człowieka. Podstawy prewencji otyłości i chorób niezakaźnych. Wydawnictwo Lekarskie PZWL, Warszawa 2008 7 Ziemlański Ś. [ed]: Normy żywienia człowieka. Fizjologiczne podstawy. Wydawnictwo Lekarskie PZWL, Warszawa 2001 8 ADA Position Paper. Dietary Guidance for Healthy Children Aged 2 to 11 Years. J. Am. Diet. Assoc. 2004, 104(4), 660-677 9 Baird J., Fisher D., Lucas P., Kleijnen J., Roberts H., Law C.: Being big or growing fast: systematic review of size and growth in infancy and later obesity. BMJ 2005 331(7522), 929 10 FAO/WHO/UNU Expert Consultation: Human Energy Requirements. Rome, World Health Organization 2004 11 Garlick P.J., Rigo J., Ziegler E.E. (eds): Protein and Energy Requirements in Infancy and Childhood. Nestle Nutr. Workshop Ser. Pediatr. Program, Nestec Ltd., Vevey/S. Karger A.G., Basel 2006, 58, 39-50 12 Oblacińska A., Weker H. (eds): Profilaktyka otyłości u dzieci i młodzieży. Od urodzenia do dorosłości. Wydawnictwo Help-Med., Kraków 2008 13 Wu T.C., Chen P.H.: Health consequences of nutrition in childhood and early infancy. Pediatr. Neonatal. 2009, 50(4), 135-142 14 Bała G., Czerwionka-Szaflarska M., Swincow G., Rytarowska A.: Analiza przyczyn niedożywienia u dzieci do lat 2. Pediatr. Współ. Gastrol., Hepatol. Żyw. Dziecka 2004, 6(1): 23-26 15 Weker H.: Badanie nad powiązaniem czynnika żywieniowego z otyłością prostą u dzieci. Med. Wieku Rozw. 2006, 1(1), X
6
to assess the functioning of current nutrition recommendations for healthy children
aged 13-36 months in practice.
16 Szponar L., Sekuła W., Rychlik E., Ołtarzewski M., Figurska K.: Badania indywidualnego spożycia żywności i stanu odżywienia w gospodarstwach domowych. Prace Instytut Żywności i Żywienia, Warszawa 2003 17 Charzewska J., Weker H.: Ogólnopolskie badanie nad zawartością wapnia i witaminy D w dietach dzieci w wieku 4 lat. Pediatr. Współ. Gastroenterol., Hepatol. Żyw. Dziecka 2006, 8 (2), 107-109
7
II. Theoretical Assumptions and Study Overview
1. Dietary Patterns for Young Children
Natural feeding is the best way to feed infants. Natural food contains all the
substances necessary for the development of child in the first months of life. They have
nutritional and building functions, regulate immunity, have anti-inflammatory
properties and prevent infections 18-20.
In artificial feeding of infants, the human milk is replaced with cow's milk, in
which each fraction is modified so that its composition is similar to breast milk. The
pattern for feeding infants who are not breastfed, amended in 2007 - 2008, adopted a
lower energy rate in accordance with the standards: for children aged 0 - 3 months - 100
- 110 kcal/kg of body weight, for children aged 3 - 6 months - 90 - 95 kcal/kg of BW, for
children aged 6 - 12 months - 95 - 100 kcal/kg of BW Also, the following were adopted: a
lower intake of protein - about 2 g/kg of BW, the introduction of gluten between 17th
and 24th week of life (breastfed infants - 5 months of age, artificially fed infants - 6
months of age) for the prevention of celiac disease and wheat allergy, in the artificial
feeding of infants - the use of infant formula in the first half year and follow-on milk in
the second half year of child's life, complementary food in the composition, nutritional
value and health quality appropriate to the needs of the particular child21, 22.
The recommendations that form the safe nutrition model and pattern allow
eliminating improper practices in infant nutrition.
18 European Network for Public Health Nutrition: Networking, Monitoring, Intervention and Training (EUNUTNET). Infant and young child feeding: standard recommendations for European Union. European Commission, Directorate Public Health and Risk Assessment, Luxemburg, 2006 19 ESPGHAN Committee on Nutrition. Breast-feeding: A Commentary by the ESPGHAN Committee on Nutrition. J. Pediatr. Gastroenterol. Nutr. 2009, 49(1), 112-125 20 American Academy of Pediatrics. Working Group on Breastfeeding. Breastfeeding and use of human milk. Pediatrics 1997, 100, 1035-1039 21 Dobrzańska A., Czerwionka-Szaflarska M., Kunachowicz H., Książyk J., Lukas W., Ryżko J., Socha J., Stolarczyk A., Szajewska H., Wąsowska-Królikowska K., Weker H.: Recommendations for nutrition of healthy children in the first year of age. Team of experts appointed by the National Consultant in Paediatrics. Standardy Med. 2007, 4, 2-5 22 Książyk J., Weker H.: Nowe zalecenia żywienia niemowląt od roku 2007. Pediatria Współczesna. Gastroenterologia, Hepatologia i Żywienie Dziecka 2007, 9 (1): 9-14.
8
Children at post-infant age (aged 2 years) and aged 3 years also require a proper
nutrition, because of the intensive mental, emotional and motor development. There are
significant changes in the dietary pattern of children aged 2 - 3 years, associated with
the transition from a typical liquid dairy diet to a more diversified diet (infant diet ->
transitory diet -> family table diet23). Also, the appropriate dietary behaviour and
preferences are shaped during this age24.
Demand for energy and most nutrients decreases per 1 kg of body weight
compared with the infancy period, remaining at relatively constant level in the case of
some nutrients.
This period is defined as the most critical for the risk of nutritional deficiencies,
stunted growth and excess body weight / obesity. Inadequate nutrition or deficiencies in
the developmental age affect the functioning and health in adulthood.
2. Food Rations for Children Aged 1-3 years
Appropriately selected products recommended for consumption during the day
and composed into food / meals allow covering the demand for energy and all nutrients.
Combining products from different groups into food / meals in amounts consistent with
the standards determined in daily food rations is fundamental got proper nutrition of
children25. Table 1 shows the quantities of products recommended for consumption
during the day, i.e. daily food rations (DFR), which provide a certain amount of energy
and nutrients for children aged 13-36 months, according to various recommendations.
23 Definitions: Transitory diet - the selection of products / food suitable for the phase of child development, safe in terms of nutritional value and health quality, with semi-solid and solid consistency. Family table diet - based on food / meals prepared for the whole family, suitably modified for the needs of the child in terms of consistency, organoleptic properties and method of preparation. 24 Rudzka-Kańtoch Z., Weker H., Strucińska M.: Zalecenia żywieniowe dla małych dzieci (2-3 lata). Med. Wieku Rozw. 1998, II(2), 247-267 25 Dzieniszewski J., Szponar L., Szczygieł B., Socha J.: Podstawy naukowe żywienia w szpitalach. Instytut Żywności i Żywienia, Warszawa 2001
9
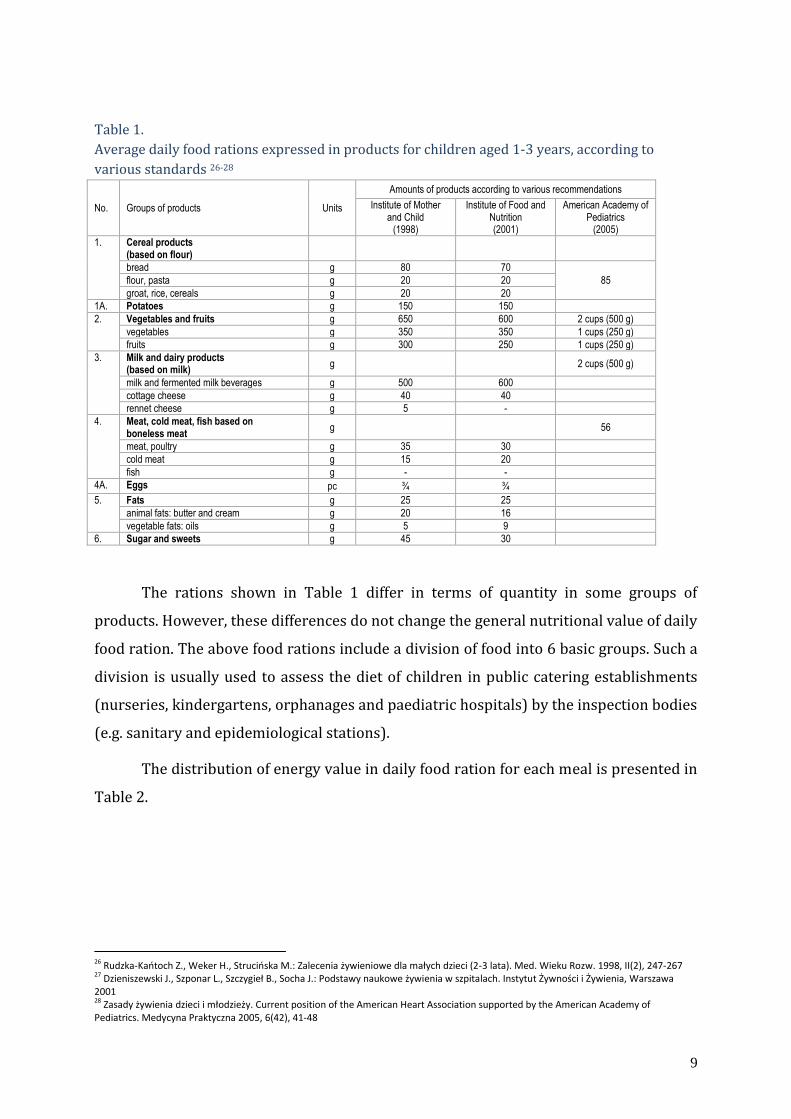
Table 1.
Average daily food rations expressed in products for children aged 1-3 years, according to
various standards 26-28
No. Groups of products Units
Amounts of products according to various recommendations
Institute of Mother and Child
(1998)
Institute of Food and Nutrition (2001)
American Academy of Pediatrics
(2005)
1. Cereal products (based on flour)
bread g 80 70
85 flour, pasta g 20 20
groat, rice, cereals g 20 20
1A. Potatoes g 150 150
2. Vegetables and fruits g 650 600 2 cups (500 g)
vegetables g 350 350 1 cups (250 g)
fruits g 300 250 1 cups (250 g)
3. Milk and dairy products (based on milk)
g 2 cups (500 g)
milk and fermented milk beverages g 500 600
cottage cheese g 40 40
rennet cheese g 5 -
4. Meat, cold meat, fish based on boneless meat
g 56
meat, poultry g 35 30
cold meat g 15 20
fish g - -
4A. Eggs pc ¾ ¾
5. Fats g 25 25
animal fats: butter and cream g 20 16
vegetable fats: oils g 5 9
6. Sugar and sweets g 45 30
The rations shown in Table 1 differ in terms of quantity in some groups of
products. However, these differences do not change the general nutritional value of daily
food ration. The above food rations include a division of food into 6 basic groups. Such a
division is usually used to assess the diet of children in public catering establishments
(nurseries, kindergartens, orphanages and paediatric hospitals) by the inspection bodies
(e.g. sanitary and epidemiological stations).
The distribution of energy value in daily food ration for each meal is presented in
Table 2.
26 Rudzka-Kańtoch Z., Weker H., Strucińska M.: Zalecenia żywieniowe dla małych dzieci (2-3 lata). Med. Wieku Rozw. 1998, II(2), 247-267 27 Dzieniszewski J., Szponar L., Szczygieł B., Socha J.: Podstawy naukowe żywienia w szpitalach. Instytut Żywności i Żywienia, Warszawa 2001 28 Zasady żywienia dzieci i młodzieży. Current position of the American Heart Association supported by the American Academy of Pediatrics. Medycyna Praktyczna 2005, 6(42), 41-48

10
Table 2.
The distribution of energy value in daily food ration for meals
Type of meal % Energy value of meals*
Children 1-3 years
1st breakfast 25 250 kcal
2nd breakfast 10 100 kcal
Dinner 30 300 kcal
High tea 10 100 kcal
Supper 25 250 kcal
Total 1000 kcal
Type of meal % Energy value of meals*
Children 1-3 years
Breakfast 25 250 kcal
Dinner 35 350 kcal
High tea 15 150 kcal
Supper 25 250 kcal
Total 1000 kcal
*Without 15% of loss that should be included in public catering (nurseries, kindergartens)
It is believed that children should eat 4-5 meals per day, including 3 basic ones -
breakfast, dinner and supper. Before going to the nursery / kindergarten, the child
should eat first breakfast or another small meal at home. In the nursery / kindergarten,
children usually have breakfast, dinner and high tea. After returning home, the child
should eat supper. The planning of menus allows avoiding many errors, such as
repetition of dishes, their incorrect selection in terms of nutritional, energy and
organoleptic value. Various institutions - e.g. nurseries, kindergartens, hospitals - usually
prepare the so-called ten-day menus, which cover 10 days.
11
3. Demand for Energy and Nutrients 29-34
Energy Demand
Fulfilment of the child's energy needs is the main objective of nutrition. Energy is
needed primarily to maintain vital functions, i.e. the basal metabolic rate (BMR),
representing 50-60% of the total energy expenditure in healthy children, to maintain
thermogenesis, which represents about 5-8% of energy expenditure, as well as physical
activity (30-40 % of expenditure). Energy expenditure needed in the processes of
growth decrease from about 35% of the total energy expenditure at the moment of birth
to about 5% by the end of the first year of life.
The increase in the infant's body mass is the most vital indicator of a proper
intake of energy. In two first years of life, children have the highest BMR due to the high
rate of growth and development of new tissues. During the first six months of life,
infants double their birth weight, and triple it at the end of the first year of life.
Energy needs are changing with physical activity and environmental conditions.
They also undergo changes during disease of the organism. Physical activity plays a key
role in psychological and sociological development of the child, so it is important that
children receive the amount of energy sufficient to maintain their optimal physical
activity.
Energy Sources. Energy from food is consumed in the form of fats,
carbohydrates and proteins. In breast milk, which is the main source of energy for the
29 Jarosz M., Bułhak-Jachymczyk B. (eds): Normy żywienia człowieka. Podstawy prewencji otyłości i chorób niezakaźnych. Wydawnictwo Lekarskie PZWL, Warszawa 2008 30 Dietary Reference Intakes for Energy, Carbohydrate, Fiber, Fat, Fatty Acids, Cholesterol, Protein, and Amino Acids (Macronutrients) (2005). National Academy of Sciences. Institute of Medicine. Food and Nutrition Board. 31 Dobrzańska A., Czerwionka-Szaflarska M., Kunachowicz H., Książyk J., Lukas W., Ryżko J., Socha J., Stolarczyk A., Szajewska H., Wąsowska-Królikowska K., Weker H.: Recommendations for nutrition of healthy children aged 1-3 years (13-36 months) prepared by the team of experts appointed by the National Consultant in Paediatrics. Pediatr. Pol. 2008, 82(1), 93-95 32 FAO/WHO/UNU Expert Consultation: Human Energy Requirements. Rome, World Health Organization 2004 33 Human Vitamin and Mineral Requirements Report of a joint FAO/WHO expert consultation Bangkok, Thailand. Food and Nutrition Division FAO Rome Food and Agriculture Organization of the United Nations World Health Organization. FAO 2001 34 Fleischer M.K., Weaver L., Branca F., Robertson A.: Feeding and nutrition of infants and young children. Guidelines for the World Health Organization European Region, with emphasis on the former Soviet Countries. WHO Regional Publication, European Series, No. 87, Kopenhaga, 2000
12
breastfed infants, fats constitute about 55% of energy. Fat is gradually being replaced by
carbohydrates, which are the main source of energy in older children.
In the case of a healthy and properly growing child, the energy intake from fat
and carbohydrates during the first months of life significantly exceeds the energy
demand compared with an adult per 1 kg of body weight. WHO standards of 1985 on the
recommended energy intake were based on the observations of average energy intake
by healthy breastfed children in industrialized countries, taking into account a 5% safety
margin35.
In Poland it was assumed that the energy value of diets of infants in the first half
year should be 600 kcal/day, and should provide 700 kcal/day in the second half36.
However, according to the medical standard, these values are about 600 kcal and 830
kcal, respectively37.
Studies show that the introduction of complementary food before the 6th month
of life may have an adverse effect on breastfeeding38. It should be noted that when the
child reaches the age of 6 months, feeding only in the form of breastfeeding does not
correlate with the demand for energy in the second half year. Adequate intake of
complementary food is essential for proper fulfilment of energy needs in children in the
second half year of life.
Energy intake lower than the demand leads to inhibition or limitation of physical
activity and/or growth and development of the infant. It may also contribute to protein
and energy malnutrition. When energy intake exceeds the body's demand, the amount of
fat and weight are increased. The level of reserve fat, measured as subcutaneous fat,
increases rapidly up to the 4th month of life and decreases after that period up to about
the 6th year of life.
35 World Health Organisation. Energy and protein requirements. Report of a joint FAO/WHO/UNU export consultation. Geneva, WHO, 1985. Technical Report Series, No. 724 36 Jarosz M., Bułhak-Jachymczyk B. (eds): Normy żywienia człowieka. Podstawy prewencji otyłości i chorób niezakaźnych. Wydawnictwo Lekarskie PZWL, Warszawa 2008 37 Książyk J., Weker H.: Nowe zalecenia żywienia niemowląt od roku 2007. Pediatria Współczesna. Gastroenterologia, Hepatologia i Żywienie Dziecka 2007, 9 (1): 9-14. 38 Simondon K.B., Gartner A., Berger J., Cornu A., Massamba J.P., San Miguel J.N., Ly C., Missotte I., Simondon F., Traissac P., Delpeuch F., Maire B.: Effect of early, short-term supplementation on weight and linear growth of 4-7 month-old infants in developing countries: a four-country randomized trial. Am. J. Clin. Nutr. 1996, 64, 537-545
13
Demand for Basic Nutrients
Protein
Proteins are the main functional and structural component of every cell in the
body. They maintain cell activity as enzymes, receptors, growth factors, intercellular
substances, most of hormones (e.g. insulin and glucagon) and components of cell
membranes. Proteins are essential for transport and storage of small molecules and ions
(e.g. albumin, globulin, haemoglobin, myoglobin). They also coordinate movement (actin
and myosin) and stabilize structures (e.g. collagen or keratin). They play an important
role in defence against foreign substances (antibodies, cytokines) and in control of
expression of genetic information. The building components of proteins are amino acids,
which often act as precursors of synthesis of many coenzymes, hormones, nucleic acids
and other molecules necessary for life39. A proper intake of protein in the diet in
necessary to maintain the functional and cellular integration of the system, as well as to
ensure health and growth.
Protein intake is extremely important during infancy and childhood, when the
body needs amino acids for rapid growth. All amino acids provide nitrogen necessary for
the synthesis of human proteins.
The human body contains very little reserves of protein (about 3% of the total
content of body weight). Pathological conditions, such as trauma, infection or starvation
can cause the loss of protein in the body. If energy intake is too low to maintain an
adequate level of synthesis of proteins, they are catabolized through the breakdown of
muscle cells, which leads to receiving the required amino acids or energy.
Sources. The sources of high-quality protein are animal products (meat, fish,
cheese, milk and eggs), and some vegetable products: soya, green beans and pulses.
Wheat products are good sources of vegetable proteins.
39 Murray R.K. et al.: Biochemia Harpera. PZWL, Warszawa 2004
14
Animal proteins (except for collagen) are wholesome, i.e. they contain all the
essential amino acids and have a high biological value. Most of vegetable proteins, with
the exception of soya, contain inadequate set of amino acids.
The proteins most similar (in terms of composition) to human proteins are egg
white proteins (ovoalbumine) and cow's milk proteins (lactalbumin). The proportions of
amino acid composition of these two proteins were found to be optimal and are used as
a benchmark to compare the quality of other proteins.
Demand. Demand for protein for breastfed infants was estimated on the basis of
the composition of breast milk. WHO standard was calculated based on the amount of
protein found in breast milk, taking into account the biological variation (by adding 2
standard deviations above the mean).
Due to the fact that the biological value of protein in the diet of artificially fed
infants is lower than in the case of protein in breast milk, higher amounts of the first are
recommended to be used in the diet 40. The recommended level of protein intake for
infants in Poland at the age of 0-0.5 years was 2.1 g/kg of BW and for older infants, i.e.
aged 0.5 - 1 years, these values are recommended to be 2.6 g/kg of BW 41. Currently, the
standards for protein intake for infants in Poland are determined at the level of
Adequate Intake (AI), based on breast milk protein at the level of 1.52 g/kg of BW/day in
the first six months of life and 1.6 g/kg of BW/day in the second half year 42,43. The
medical standard for nutrition of children aged 13-36 months assumes that protein
intake in children aged 13 - 36 months should be about 1 g/kg of body weight. This
value results from the analysis of the recommendations in which the average protein
intake in children aged 6 months - 10 years ranges from 1.12 g/kg/day at 6 months to
0.74 g/kg/day at the age of 10 years (safe intake was specified in the range of 0.91
g/kg/day to 1.43 g/kg/day, respectively) 44.
Fat
40 WHO. Energy and protein requirements. Report of a joint FAO/WHO/UNU export consultation. Geneva, WHO, 1985. Technical Report Series, No. 724 41 Książyk J., Weker H.: Nowe zalecenia żywienia niemowląt od roku 2007. Pediatria Współczesna. Gastroenterologia, Hepatologia i Żywienie Dziecka 2007, 9 (1): 9-14. 42 Jarosz M., Bułhak-Jachymczyk B. (eds): Normy żywienia człowieka. Podstawy prewencji otyłości i chorób niezakaźnych. Wydawnictwo Lekarskie PZWL, Warszawa 2008 43 Socha J, Socha P, Gruszfeld D., Stolarczyk A., Dobrzańska A.: Znaczenie białka w żywieniu niemowląt. Standardy Medyczne. Pediatria 2010, 7(1), 79-86. 44 Dobrzańska A., Czerwionka-Szaflarska M., Kunachowicz H., Książyk J., Lukas W., Ryżko J., Socha J., Stolarczyk A., Szajewska H., Wąsowska-Królikowska K., Weker H.: Recommendations for nutrition of healthy children aged 1-3 years (13-36 months) prepared by the team of experts appointed by the National Consultant in Paediatrics. Pediatr. Pol. 2008, 82(1), 93-95
15
Fats contained in the diet provide infants and young children with energy,
essential fatty acids and fat-soluble vitamins (A, D, E). They also improve the taste of
food, and therefore increase the absorption of energy. Particular fatty acids, especially
long-chain polyunsaturated fatty acids, have characteristic and important physiological
functions 45,46.
Sources. Dietary fats contain all the lipids present in both plant and animal food.
Fats from animal products (e.g. cow's milk and meat) contain mostly saturated fatty
acids. Fats derived from plants and fish contain mainly mono-and polyunsaturated fatty
acids.
Essential fatty acids (EFA), especially linoleic acid (LA) and -linolenic acid (ALA)
are not synthesized in the human body and must be supplied with food. They are the
precursors of phospholipids, prostaglandins and long-chain polyunsaturated fatty acids,
including arachidonic and docosahexaenoic acid. Infants have a limited ability to
synthesize arachidonic acid (AA) and docosahexaenoic acid (DHA), therefore these acids
are present in breast milk. DHA is necessary for a developing brain 47.
Demand. About 50% of the total energy pool in human milk comes from fat.
WHO recommends that between the 6th and 24th month of life the energy in the child's
diet comes in 30%-40% from fat, of which linoleic acid should be about 3%, and -
linolenic acid - 0.3% 48. EFA intake for this age group is still debated. According to the
current standards in Poland, the percentage of energy from fat should be 41-35% in the
diet of infants, and 30-35% in the case of children over 1 year of age 49.
45 Ziemlański Ś. [ed]: Normy żywienia człowieka. Fizjologiczne podstawy. Wydawnictwo Lekarskie PZWL, Warszawa 2001 46 Jarosz M., Bułhak-Jachymczyk B. (eds): Normy żywienia człowieka. Podstawy prewencji otyłości i chorób niezakaźnych. Wydawnictwo Lekarskie PZWL, Warszawa 2008 47 Czajkowski K., Czerwionka-Szaflarska M., Charzewska J., Chybicka A., Dobrzańska Anna, Gruszfeld Dariusz, Imiela J., Jackowska T., Helwich E., Kaczmarski M., Poręba R., Książyk Janusz, Lauterbach R., Lukas W., Mojska H., Milanowski A., Radowicki S., Ryżko Józef, Socha Piotr, Szajewska H., Szczapa J., Walkowiak J., Weker H.: Stanowisko grupy ekspertów w sprawie suplementacji kwasu dokozaheksaenowego i innych kwasów tłuszczowych omega-3 w populacji kobiet ciężarnych, karmiących piersią oraz niemowląt i dzieci do lat 3 Standardy Med. 2010 T. 7 nr 5/6 s. 729-736 48 Fats and oils in human nutrition. Report of a joint expert consultation. Food and Agriculture Organization of the United Nations, Rome 1994 (FAO Food and Nutrition Paper, No.57) 49 Jarosz M., Bułhak-Jachymczyk B. (eds): Normy żywienia człowieka. Podstawy prewencji otyłości i chorób niezakaźnych. Wydawnictwo Lekarskie PZWL, Warszawa 2008

16
Carbohydrates
Carbohydrates are a major component of food and energy source supplied to the
body. Carbohydrates from food are converted and absorbed as monosaccharides, mainly
glucose. Glucose is the main source of energy for all body tissues, especially for brain
and erythrocytes, which are not able to use any other energy sources.
After digestion and absorption, carbohydrates may be available as glycogen
stored in the liver, muscles or kidneys. Supply of glycogen and its release from the liver
are controlled by insulin and glucagon - pancreatic hormones - and adrenaline - the
adrenal hormone 50.
For cells to be able to directly use the glucose, the body maintains its
concentration in blood at a constant level of 70-115 mg/l.
Another important role of carbohydrates is associated with their impact on the
senses. Sugars affect the taste, colour, consistency and structure of foods.
Sources. The first source of carbohydrates in the child's diet is breast milk
containing lactose, or modified milk, followed by other dairy products. The good sources
of carbohydrates among the complementary food are cereal products (flour, porridge,
gruel, oatmeal, corn, bread, pasta), which contain 50-80% of starch. Starch is well
tolerated and absorbed by infants and young children.
Cereal products and vegetables provide an adequate amount of starch to the
child's diet. Due to the lack of gluten, rice is the most appropriate source of this
polysaccharide during the introduction of first complementary foods to the child's diet.
Fruits and vegetables contain about 10-25% of simple carbohydrates and disaccharides,
and are a less significant source of this macro-component. Their role in nutrition is
determined by the presence of dietary fibre, vitamins and minerals 51.
Demand. The human body uses carbohydrates as the energy source. An adequate
daily intake of carbohydrates prevents excessive catabolism of tissue proteins, which is
especially important during the period of growth and development. Physiological
standards for carbohydrates are determined on the basis of intake. According to the
50 Murray R.K. et al.: Biochemia Harpera. PZWL, Warszawa 2004 51 Jarosz M., Bułhak-Jachymczyk B. (eds): Normy żywienia człowieka. Podstawy prewencji otyłości i chorób niezakaźnych. Wydawnictwo Lekarskie PZWL, Warszawa 2008
17
current Polish standards, the recommended daily intake of absorbed carbohydrates is
60 g (AI) for children aged 0-0.5 years, 95 g (AI) for children aged 0.5-1 year and 130 g
for children aged 1 - 3 years. Sucrose and simple sugars are only the source of energy.
They do not interact with other nutrients. Diet with a high content of simple sugars has a
reduced ability to provide adequate amount of nutrients, and may also cause diarrhoea,
especially in the case of fruit juices rich in fructose. Reducing the intake of simple sugars
may reduce the risk of dental caries at the preschool age.
It is recommended that the amount of energy introduced into the diet as sucrose
does not exceed 10% of daily energy demand 52.
Demand for Vitamins
The Current Polish standards for the daily intake of vitamins are similar to the
American recommendations 53, with the exception of vitamin D 54,55.
Vitamin A
Vitamin A affects the processes of vision, somatic functions, such as growth,
development, as well as differentiation of epithelial and bone tissue. It also plays a
significant role in the process of spermatogenesis, the development of placenta and
embryo growth 56.
Sources. This vitamin is available in the form of retinol in animal products, as
well as in the form of carotenoids, mainly -carotene, which are a part of plant products.
Significant amounts of retinol are contained in dairy products, eggs and fish. The
sources of carotenoids are dark green leafy vegetables, yellow and orange vegetables
and fruits.
52 Jarosz M., Bułhak-Jachymczyk B. (eds): Normy żywienia człowieka. Podstawy prewencji otyłości i chorób niezakaźnych. Wydawnictwo Lekarskie PZWL, Warszawa 2008 53 Ibid. 54 Dobrzańska A., Lukas W., Socha J., Wąsowska-Królikowska K., Chlebna-Sokół D., Milanowski A., Książyk J., Szymankiewicz M., Charzewska J., Czech-Kowalska J., Weker H.: Polskie zalecenia dotyczące profilaktyki niedoborów witaminy D. Klinika Pediatryczna 2009; Szkoła Pediatrii cz. 13, 17 (5), 5117-5120 55 Dobrzańska A., Lukas W., Socha J., Wąsowska-Królikowska K., Chlebna-Sokół D., Milanowski A., Książyk J., Szymankiewicz M., Charzewska J., Czech-Kowalska J., Weker H.: Zalecenia Konsultanta Krajowego w dziedzinie Pediatrii dotyczące profilaktyki krzywicy i osteoporozy. Standardy Med. 2004, 1, 443-445 56 Murray R.K. et al.: Biochemia Harpera. PZWL, Warszawa 2004
18
Children should be encouraged to eat food rich in vitamin A from the introduction
of complementary foods into the diet.
Demand. According to the Polish standards, demand for vitamin A is 400 g/day
in the first half year and 500 g/day in the second half year of the child's life.
Recommendations for the intake of vitamin A for children aged 1-3 years are 400
g/day. Suggested intake of about 400-500 g of vitamin A, expressed as retinol
equivalent, should meet the needs of healthy infants and young children 57.
Vitamin B12 (cyanocobalamin) and folic acid
Vitamin B12 and folic acid are essential for the proper functioning of
haematopoietic and nervous systems; they also play a role in the development of all
body cells. Deficiencies in these vitamins can lead to disturbances in the functioning of
the above-mentioned systems and megaloblastic anaemia 58.
Sources. Human milk and cow's milk are good sources of these compounds (40-
60 g/l). Folates are also found in dark green leafy vegetables, yeasts, sprouts and eggs.
The main sources of vitamin B12 are animal products - meat, smaller amounts are
present also in fish, eggs and dairy products. Breastfed infants whose mothers are
vegetarian are at risk of neurological diseases, anaemia, and even encephalopathy.
57 Jarosz M., Bułhak-Jachymczyk B. (eds): Normy żywienia człowieka. Podstawy prewencji otyłości i chorób niezakaźnych. Wydawnictwo Lekarskie PZWL, Warszawa 2008 58 Murray R.K. et al.: Biochemia Harpera. PZWL, Warszawa 2004

19
Vitamin C
Vitamin C plays an important role in the functioning of the immune system; it also
has the properties neutralizing free radicals and stimulates collagen production in the
body. This vitamin also increases the absorption of non-haem iron.
Sources. The best sources of vitamin C are vegetables, especially spinach,
tomatoes, potatoes, broccoli and fruit - strawberries, currants, oranges and other
citruses.
Vitamin D
Vitamin D plays an active role in the metabolism of calcium and phosphorus - it
stimulates their absorption in the intestine, resorption in the kidney and the release and
incorporation of these minerals in the bone system.
Sources. This vitamin is synthesized in the skin under the influence of sunlight.
About 50% of the amount delivered with food is absorbed from the gastrointestinal
tract. After absorption, the vitamin is transported with blood to the liver and kidneys,
where it undergoes further transformation to biologically active 1.25-dihydroxyvitamin.
It occurs in foods of animal origin - in oily fish (sardines, salmon and tuna),
margarines enriched with this vitamin, in dairy products, as well as in milk mixtures for
babies and in eggs. In complementary food, the amount of vitamin D is low; therefore it
is important that babies and young children have the possibility of exposure to sunlight
59,60.
Demand. Estimation of the recommended daily intake of vitamin D is difficult
because it is synthesized by the body. Daily supplementation of this vitamin is
recommended in the European countries. In most countries where the supplementation
of this vitamin is recommended, its doses are within 7-10 g (280-400 IU)/day.
59 Dobrzańska A., Lukas W., Socha J., Wąsowska-Królikowska K., Chlebna-Sokół D., Milanowski A., Książyk J., Szymankiewicz M., Charzewska J., Czech-Kowalska J., Weker H.: Polskie zalecenia dotyczące profilaktyki niedoborów witaminy D. Klinika Pediatryczna 2009; Szkoła Pediatrii cz. 13, 17 (5), 5117-5120 60 Dobrzańska A., Lukas W., Socha J., Wąsowska-Królikowska K., Chlebna-Sokół D., Milanowski A., Książyk J., Szymankiewicz M., Charzewska J., Czech-Kowalska J., Weker H.: Zalecenia Konsultanta Krajowego w dziedzinie Pediatrii dotyczące profilaktyki krzywicy i osteoporozy. Standardy Med. 2004, 1, 443-445
20
Currently, it is believed that vitamin D intake in infants and young children in Poland
should be higher 61.
Demand for Minerals
Iodine
Iodine is an essential substrate for the synthesis of thyroid hormones - thyroxine
and triiodothyronine, which play an important role in the metabolism of the whole body,
also influencing thermogenesis and determining the proper development and
functioning of the nervous system.
Sources. The content of iodine in food is determined by the environment.
Deficiencies of iodine are present in the population living in mountainous regions.
Marine fish are natural sources of iodine, and contain this element in large amounts
(160-1400 g/kg). A portion of about 200 g of marine fish consumed weekly should
provide an average of about 50 g of iodine/day.
Fruits, vegetables, cereals, meat and meat products contain from 20 to 50 g of
iodine/kg.
Zinc
Zinc included in many enzymes plays an important role in metabolic processes
associated with the synthesis of proteins and nucleic acids.
Sources. Zinc contained in animal products is absorbed better than zinc in the
products of plant origin. A good source of zinc is red meat, milk, milk products, and rice.
61 Płudowski P., Socha P. Paper in press (2011).

21
Calcium
Calcium is a major component of teeth and bones. It takes part in regulating many
of metabolic processes in the body. Calcium is a cofactor of many enzymes necessary for
the proper functioning of nerves and muscles. It is a part of the blood clotting factors
and regulates many intracellular processes.
Sources. Milk and milk products are major sources of calcium. Other good
sources include fish, nuts and green vegetables.
Demand. Demand for calcium in children is met by breast milk for the first six
months of the child's life. After this period, milk should remain the main source of
calcium in the child's diet.
Sodium
Sodium is present in the body mainly in ionic form and is the main cation in
extracellular space. It is responsible for the proper functioning of the nervous system
and muscles, regulates water management, and affects the acid-base balance of the
system.
Sources. Sodium is contained in legumes, nuts, potatoes, as well as in meat,
bananas and whole grains. Bread, meat products and processed food are also sources of
sodium.
Iron
Iron is one of the components of haemoglobin and myoglobin. It is also a part of
many enzymes necessary for transport and storage of oxygen and electron transport.
Sources. The main sources of this element in the diet are: meat and meat
products, legumes, chives, parsley and dill green, cereal products. It is present in food in
the heme and non-heme form (in plant products).
22
Insufficient intake of iron causes a negative balance and reduction of its deposits
in the body, then it may result in biochemical changes. A longer low intake of iron may
lead to iron deficiency anaemia, caused by the reduction in haemoglobin concentration.
Symptoms of anaemia include changes in the mucosa, or diarrhoea. Hypoxia, which
accompany anaemia, reduces the ability to make physical effort, and causes impaired
psychomotor and intellectual development. Deficiencies of iron at the level of tissue iron
may lead to lower immunity of the body.
The effects of too high iron intake may be the following: excessive accumulation
of this element in tissues and their damage, as well as lowered absorption of other
minerals, mainly copper and zinc.
23
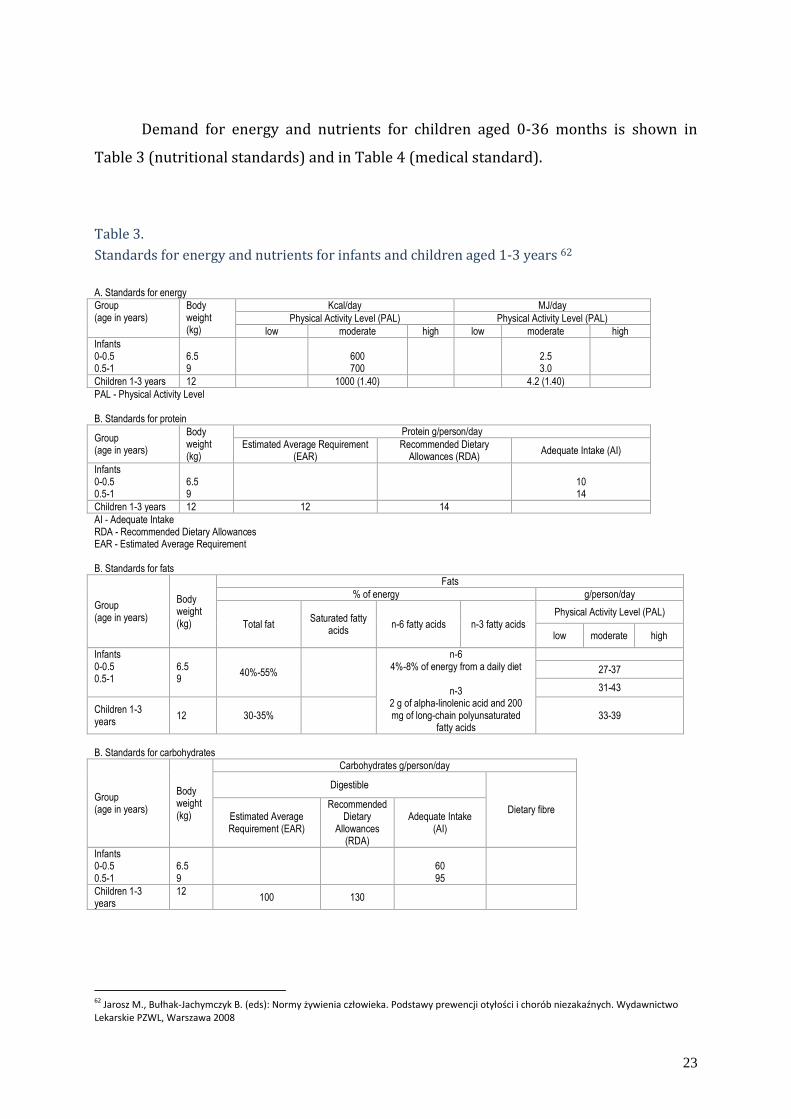
Demand for energy and nutrients for children aged 0-36 months is shown in
Table 3 (nutritional standards) and in Table 4 (medical standard).
Table 3.
Standards for energy and nutrients for infants and children aged 1-3 years 62
A. Standards for energy
Group (age in years)
Body weight (kg)
Kcal/day MJ/day
Physical Activity Level (PAL) Physical Activity Level (PAL)
low moderate high low moderate high
Infants 0-0.5 0.5-1
6.5 9
600 700
2.5 3.0
Children 1-3 years 12 1000 (1.40) 4.2 (1.40)
PAL - Physical Activity Level B. Standards for protein
Group (age in years)
Body weight (kg)
Protein g/person/day
Estimated Average Requirement (EAR)
Recommended Dietary Allowances (RDA)
Adequate Intake (AI)
Infants 0-0.5 0.5-1
6.5 9
10 14
Children 1-3 years 12 12 14
AI - Adequate Intake RDA - Recommended Dietary Allowances EAR - Estimated Average Requirement B. Standards for fats
Group (age in years)
Body weight (kg)
Fats
% of energy g/person/day
Total fat Saturated fatty
acids n-6 fatty acids n-3 fatty acids
Physical Activity Level (PAL)
low moderate high
Infants 0-0.5 0.5-1
6.5 9
40%-55%
n-6 4%-8% of energy from a daily diet
n-3
2 g of alpha-linolenic acid and 200 mg of long-chain polyunsaturated
fatty acids
27-37
31-43
Children 1-3 years
12 30-35% 33-39
B. Standards for carbohydrates
Group (age in years)
Body weight (kg)
Carbohydrates g/person/day
Digestible
Dietary fibre Estimated Average Requirement (EAR)
Recommended Dietary
Allowances (RDA)
Adequate Intake (AI)
Infants 0-0.5 0.5-1
6.5 9
60 95
Children 1-3 years
12 100 130
62 Jarosz M., Bułhak-Jachymczyk B. (eds): Normy żywienia człowieka. Podstawy prewencji otyłości i chorób niezakaźnych. Wydawnictwo Lekarskie PZWL, Warszawa 2008

24
B. Standards for vitamins
Vitamins Infants (age in months) Children (age in years)
0-6 7-12 1-3
A (μg/day) 400* 500* 400**
D3 (μg/day) 5* 5* 5*
E (mg/day) Tocopherol 4* 5* 6*
K (μg/day) 5* 10* 15*
B1 (mg/day) Thiamine 0.2* 0.3* 0.5**
B2 (mg/day) Riboflavin 0.3* 0.4* 0.5**
Niacin (mg/day) 2* 4* 6**
B6 (mg/day) 0.1* 0.3* 0.5**
Folate (μg/day) 65* 80* 150**
B12 (μg/day) 0.4* 0.5* 0.9**
Biotin (μg/day) 5* 6* 8*
Pantothenic acid (mg/day) 1.7* 1.8* 2*
Vitamin C (mg/day) 40* 50* 40**
Choline (mg/day) 125* 150* 200*
*AI - Adequate Intake **RDA - Recommended Dietary Allowances F. Standards for minerals for infants
Name Infants (age in months) Children (age in years)
0-6 7-12 1-3
Calcium Ca mg 300* 400* 500*
Magnesium Mg mg 30* 70* 80**
Iron Fe mg 0.3* 11** 7**
Copper Cu mg 0.2* 0.3* 0.3**
Zinc Zn mg 2* 3** 3**
Selenium Se mg 15* 20* 20**
Iodine J μg 110* 130* 90**
*AI - Adequate Intake **RDA - Recommended Dietary Allowances
The intake of energy, protein, fibre, vitamin D and calcium was determined
according to the nutritional recommendations for children aged 13-36 months63.
Recommendations other than in the nutritional standards were adopted for those
elements64.
Recommendations for energy and protein intake according to the medical
standard
For the proper formulation of recommendations, it is necessary to divide the total
energy into individual food components: carbohydrates and fats, and to determine the
protein intake.
63 Dobrzańska A., Czerwionka-Szaflarska M., Kunachowicz H., Książyk J., Lukas W., Ryżko J., Socha J., Stolarczyk A., Szajewska H., Wąsowska-Królikowska K., Weker H.: Zalecenia dotyczące żywienia dzieci zdrowych w wieku 1-3 lata (13-36 miesięcy) opracowane przez zespół ekspertów powołany przez konsultanta krajowego ds. pediatrii. Pediatr. Pol. 2008, 82(1), 93-95 64 Jarosz M., Bułhak-Jachymczyk B. (eds): Normy żywienia człowieka. Podstawy prewencji otyłości i chorób niezakaźnych. Wydawnictwo Lekarskie PZWL, Warszawa 2008
25
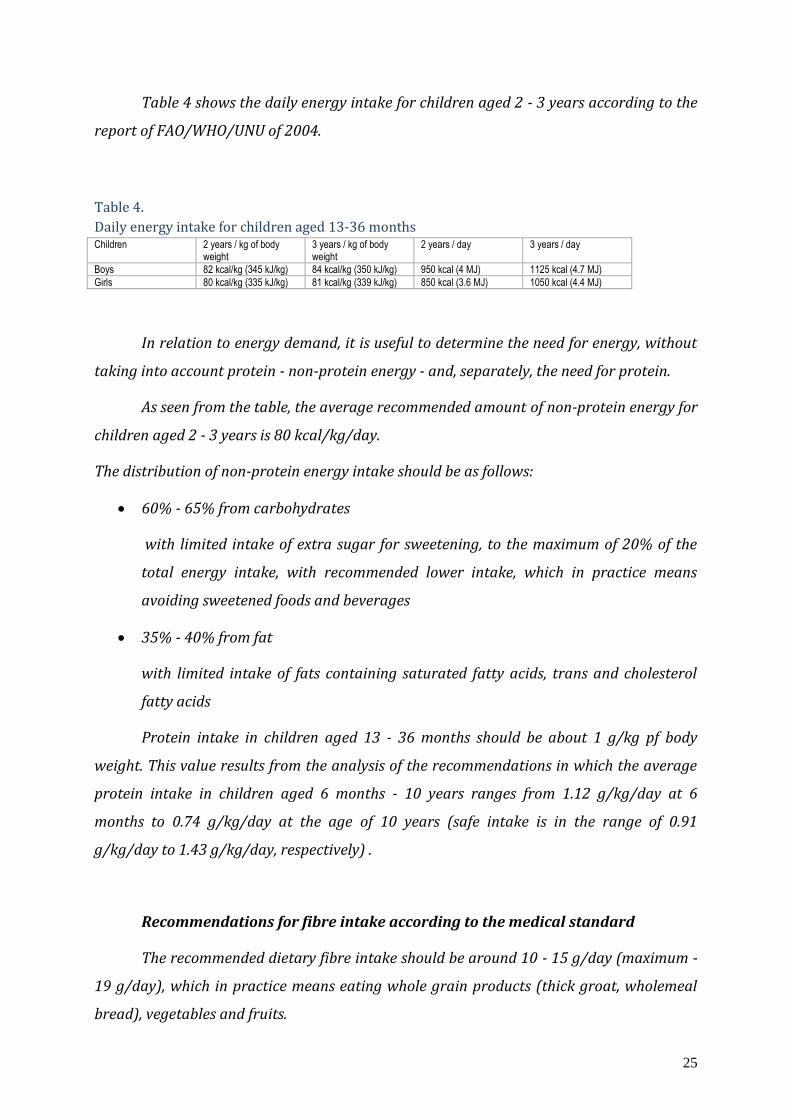
Table 4 shows the daily energy intake for children aged 2 - 3 years according to the
report of FAO/WHO/UNU of 2004.
Table 4.
Daily energy intake for children aged 13-36 months Children 2 years / kg of body
weight 3 years / kg of body weight
2 years / day 3 years / day
Boys 82 kcal/kg (345 kJ/kg) 84 kcal/kg (350 kJ/kg) 950 kcal (4 MJ) 1125 kcal (4.7 MJ)
Girls 80 kcal/kg (335 kJ/kg) 81 kcal/kg (339 kJ/kg) 850 kcal (3.6 MJ) 1050 kcal (4.4 MJ)
In relation to energy demand, it is useful to determine the need for energy, without
taking into account protein - non-protein energy - and, separately, the need for protein.
As seen from the table, the average recommended amount of non-protein energy for
children aged 2 - 3 years is 80 kcal/kg/day.
The distribution of non-protein energy intake should be as follows:
60% - 65% from carbohydrates
with limited intake of extra sugar for sweetening, to the maximum of 20% of the
total energy intake, with recommended lower intake, which in practice means
avoiding sweetened foods and beverages
35% - 40% from fat
with limited intake of fats containing saturated fatty acids, trans and cholesterol
fatty acids
Protein intake in children aged 13 - 36 months should be about 1 g/kg pf body
weight. This value results from the analysis of the recommendations in which the average
protein intake in children aged 6 months - 10 years ranges from 1.12 g/kg/day at 6
months to 0.74 g/kg/day at the age of 10 years (safe intake is in the range of 0.91
g/kg/day to 1.43 g/kg/day, respectively) .
Recommendations for fibre intake according to the medical standard
The recommended dietary fibre intake should be around 10 - 15 g/day (maximum -
19 g/day), which in practice means eating whole grain products (thick groat, wholemeal
bread), vegetables and fruits.

26
Recommendations for calcium and vitamin D intake according to the medical
standard
The diet of children aged 13 - 36 months should include an adequate intake of
calcium and vitamin D. The demand for calcium during this period of life is 800 - 1000 mg
(equivalent to 400 ml of milk, 150 g of yoghurt and 30 g of cheese). Demand for vitamin D3
is 400 IU per day.
27
III. Comprehensive Assessment of Diet of Children Aged 13-36 Months
in Poland - Nationwide Study
1. Purpose of the Study
The aim of the conducted study was a comprehensive assessment of diets of
children aged 13 - 36 months in Poland in connection with their nutritional status and in
relation to the nutritional recommendations.
The research problem included the following specific objectives:
1. Assessment of nutritional status of children on the basis of selected
anthropometric characteristics and indicators in relation to WHO
standards
2. Assessment of nutrition in children at post-infant age compared with the
current nutritional recommendations (2008).
3. The analysis of dietary behaviours of the studied children
4. The analysis of impact of family and environmental factors on the
children's diet

28
2. Methodology
2.1. Selection of Sample
The study was conducted on a random representative sample of children aged
13-36 months.
The criterion for inclusion in the study group was the age of children (13-36
months), while the criterion for exclusion were any diseases requiring nutrition using
methods other than oral.
The study project was approved by the Bioethics Commission at the Institute of
Mother and Child in Warsaw.
Selection of children for the sample was carried out using a two-stage sampling.
In the first stage of sampling, 40 counties were drawn from the sampling frame of 379
counties (simple sampling without replacement). These counties were drawn for the
sample with a probability based on their size measured by the number of inhabitants.
Data to determine the probability for each county was obtained from the Central
Statistical Office (population in 2009).
Then, the second stage of sampling was conducted (simple sampling without
replacement using random number tables), where the sampling frame was the base of
children aged 13-36 months from 40 randomly selected counties. A sample of 10
participants of the study - children aged 13-36 months - was selected in each county.
The survey and the child's nutrition diary were filled in by the mother/father or legal
guardian of the child.
Interviewers contacted the selected parents / guardians of children - first by
telephone and then directly to instruct how to fill in the survey (part D). The study
included all the randomly selected children whose parents agreed to participate in the
study. In the case of refusal to participate in the study, another child was selected
randomly from the same county, so as to ensure the sample of 400 participants.

29
Sampling frame was prepared in accordance with the principles of: 1) relevance,
2) completeness, 3) exclusiveness, 4) accuracy, 5) convenience.
The list of counties included in the study is shown in Table 5.
Table 5.
List of counties in which the study was conducted
No. County Voivodeship Number of surveys
Population Probability of selection
1. Sopot Pomeranian 10 38 460 0.10%
2. Krosno Subcarpathian 10 47,534 0.12%
3. Tuchola Kuyavian-Pomeranian 10 47,622 0.12%
4. Ryki Lublin 10 58,342 0.15%
5. Bielsko-Biała Silesian (Podlaskie?) 10 58,463 0.15%
6. Piekary Śląskie Silesian 10 58,519 0.15%
7. Opole Opole (Lublin?) 10 62,048 0.16%
8. Jelenia Góra Lower Silesian 10 63,865 0.17%
9. Krapkowice Opole 10 66,795 0.18%
10. Myszków Silesian 10 71,517 0.19%
11. Rybnik Silesian 10 74,509 0.20%
12. Kłobuck Silesian 10 85,001 0.22%
13. Świecie Kuyavian-Pomeranian 10 97,642 0.26%
14. Kędzierzyn-Koźle Opole 10 100,320 0.26%
15. Bydgoszcz Kuyavian-Pomeranian 10 103,010 0.27%
16. Oleśnica Lower Silesian 10 104,047 0.27%
17. Lubin Lower Silesian 10 105,170 0.28%
18. Krosno Subcarpathian (Lubuskie?) 10 110,849 0.29%
19. Wrocław Lower Silesian 11 111,069 0.29%
20. Gliwice Silesian 10 114,093 0.30%
21. Puławy Lublin 10 115,860 0.30%
22. Radomsko Łódź 9 117,431 0.31%
23. Otwock Masovian 10 119,607 0.31%
24. Zawiercie Silesian 10 122,628 0.32%
25. Tychy Silesian 10 129,449 0.34%
26. Żywiec Silesian 10 150,850 0.40%
27. Oświęcim Lesser Poland 10 153,602 0.40%
28. Świdnik Lower Silesian (Lublin?) 10 159,323 0.42%
29. Ostrów Masovian (Greater Poland?) 10 159,332 0.42%
30. Cieszyn Silesian 10 172,809 0.45%
31. Wałbrzych Lower Silesian 10 179,526 0.47%
32. Nowy Sącz Lesser Poland 10 202,701 0.53%
33. Sosnowiec Silesian 10 219,300 0.57%
34. Częstochowa Silesian 10 239,319 0.63%
35. Gdynia Pomeranian 10 247,859 0.65%
36. Kraków Lesser Poland 10 253,344 0.66%
37. Katowice Silesian 10 308,548 0.81%
38. Poznań Greater Poland 10 319,258 0.84%
39. Gdańsk Pomeranian 10 456,591 1.20%
40. Warszawa Masovian 10 1,714,446 4.49%
Total 400
30
2.2. Study Tool
The study was conducted using the questionnaire by an external company, whose
properly trained interviewers verified and assessed the diets of the studied children
based on the recording of menus prepared by the parents / guardians.
The study tool was an original survey questionnaire survey with a form to record
the children's menus during three consecutive days (Appendix, Annex No. 3).
The questionnaire included four parts:
part A - collected data on the family - environmental conditions of the enrolled
children;
part B - concerned the data on the nutritional status determined based on
anthropometric characteristics (height and body weight), recorded in health
certificates and/or from the current measurements in a paediatric clinic in the
PHC, as well as data on the child's health and activity obtained from the parents /
guardians;
part C - contains questions relating to diet, including dietary behaviour and food
preferences of children;
part D - a form to record the children's menus during three consecutive days,
with instructions regarding recording for their mothers.
The study tool was validated in a pilot study conducted at the end of April and the
beginning of May 2010 on a group of 40 mothers of children aged 13-36 months.

31
2.3. Methodology of Study
The nutritional status of the studied children was assessed based on the
anthropometric characteristics - current body weight (kg) and body height (m), entered
into the spreadsheet by parents / guardians from health certificate and / or current
measurements made at the PHC clinic, which were used to calculate the values of BMI
(kg/m2) 65 and then were standardized in relation to WHO centile ranks 66,67, obtaining a
standardized BMI z-score 68 and centile values of body weight, body height and body
mass index (BMI) for each child.
The following were used to assess the children's diets:
answers to the questions in part C of the questionnaire relating to the
nutrition - during infancy (retrospectively) and the current diet;
part D of the questionnaire, mainly the record of children's menus of 3
consecutive days (including one holiday) used to estimate the average
daily food ration (DFR) and calculate its energy and nutritional value using
a nutritional computer program - Dieta 4.0 69.
65 Body Mass Index BMI 66 WHO child growth standards : length/height-for-age, weight-for-age, weight-for-length, weight-for height and body mass index-for-age: methods and development. WHO 2006. http://www.who.int/child-growth/standards/en/index.html 67 WHO Anthro for personal computers, version 3.1, 2010: Software for assessing growth and development of the world’s children. Geneva: WHO, 2010 68 Standardized Body Mass Index BMI z-score
69 Wajszczyk B., Chwojnowska Z., Chabros E., Nasiadko D., Rybaczuk M. Manual of Dieta 4.0 Program for planning and current assessment of individual diet. NFNI, Warszawa 2010.
32
2.4. Methods of Statistical Analysis
The results obtained in the survey were analysed according to the developed plan
(Appendix, Annex No. 4). Analyses carried out at the macroscale level were verified by
the following hypotheses:
1. there is a relationship between children's nutritional status and the selected
family and environmental factors
2. the children's diet varies depending on their demographic, family and
environmental characteristics
3. there is a relationship between children's nutritional status and their diet.
The following statistical procedures were used to verify the above:
non-parametric tests of differences in the distribution of variables (Mann-
Whitney test, Kruskal-Wallis test
measure of dependence - Spearman's rank correlation coefficient
polynomial logistic regression and odds ratio
cluster analysis using the k-means (Quick Cluster)
Analysis plan in the microscale included:
1. preparation of frequency lists for answers to survey questions for the whole
group of children (Appendix, Annex No. 5) and in divisions into subgroups based
on age, nutritional status, diet, and family and environmental characteristics;
2. preparation of descriptive statistics for continuous variables in the survey and
variables regarding the energy and nutritional value of average daily food
rations of the studied children
3. responses to 25 specific study questions (Appendix, Annex No. 4).

33
The following statistical procedures were used to conduct the above analyses:
non-parametric tests of differences in the distribution of variables: Mann-
Whitney, Kruskal-Wallis tests
measure of dependence - Spearman's rank correlation coefficient
Chi-square dependence test
Fisher's exact test
3. Characteristics of the Study Group
In the group of studied children (n=400) 222 were boys and 178 were girls aged
13-36 months. The average age of children was 23.1±6.8 months. Among the studied
children, 79% live in cities, 21% - in rural areas. Children came from families in which
34% of mothers had secondary education, 49% - higher education, whereas the
remaining mothers (17%) had primary and vocational education. In Poland the
proportion of women with higher education in median age of 30 years is 37.1% (source:
Table 59 (94). named "Births in 2009 by the order of birth and educational level of mothers
and median age of mothers") 70.
35% of fathers had secondary education, 37% - higher education, and the
remaining fathers (28%) had primary and vocational education. The proportion of
mothers with secondary or higher education was much higher compared with the
percentage of fathers with the same education. Mother of the studied children were
better educated than the fathers.
Table 6 presents the characteristics of the study group of children (n=400).
70 The Demographic Yearbook of Poland 2010. Central Statistical Office, Warsaw 2010.
34
Table 6.
Characteristics of the study group children (n=400) aged 13-36 months No. Variables Children 13-36 months (n=400)
1. Age of children in months (mean ± SD)
23.1±6.8
2. Sex girls boys
178 (44.5%) 222 (55.5%)
3. Place of residence city village
79% 21%
4. Education of parents mother father
primary/vocational secondary higher
17% 34% 49%
29% 34% 37%
5. Age of parents in years mother father
mean ±SD median
29.4±4.82 29
31.7±9.49 31
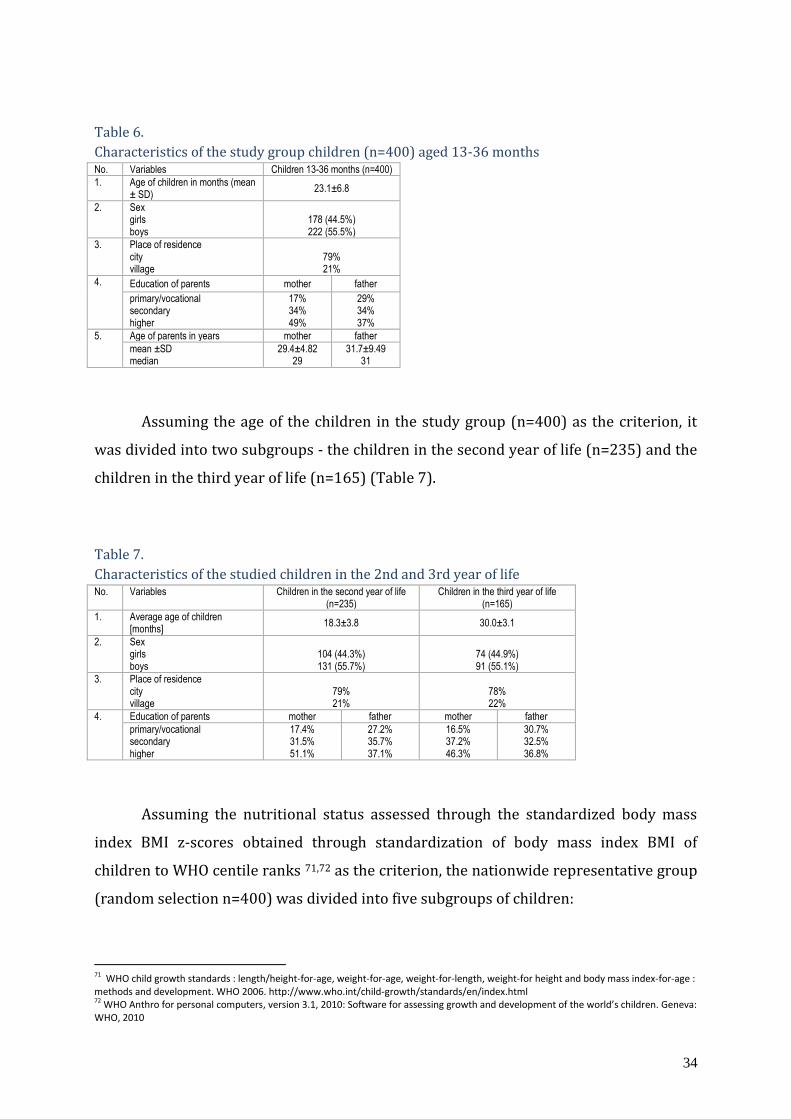
Assuming the age of the children in the study group (n=400) as the criterion, it
was divided into two subgroups - the children in the second year of life (n=235) and the
children in the third year of life (n=165) (Table 7).
Table 7.
Characteristics of the studied children in the 2nd and 3rd year of life No. Variables Children in the second year of life
(n=235) Children in the third year of life
(n=165)
1. Average age of children [months]
18.3±3.8 30.0±3.1
2. Sex girls boys
104 (44.3%) 131 (55.7%)
74 (44.9%) 91 (55.1%)
3. Place of residence city village
79% 21%
78% 22%
4. Education of parents mother father mother father
primary/vocational secondary higher
17.4% 31.5% 51.1%
27.2% 35.7% 37.1%
16.5% 37.2% 46.3%
30.7% 32.5% 36.8%
Assuming the nutritional status assessed through the standardized body mass
index BMI z-scores obtained through standardization of body mass index BMI of
children to WHO centile ranks 71,72 as the criterion, the nationwide representative group
(random selection n=400) was divided into five subgroups of children:
71 WHO child growth standards : length/height-for-age, weight-for-age, weight-for-length, weight-for height and body mass index-for-age : methods and development. WHO 2006. http://www.who.int/child-growth/standards/en/index.html 72 WHO Anthro for personal computers, version 3.1, 2010: Software for assessing growth and development of the world’s children. Geneva: WHO, 2010
35
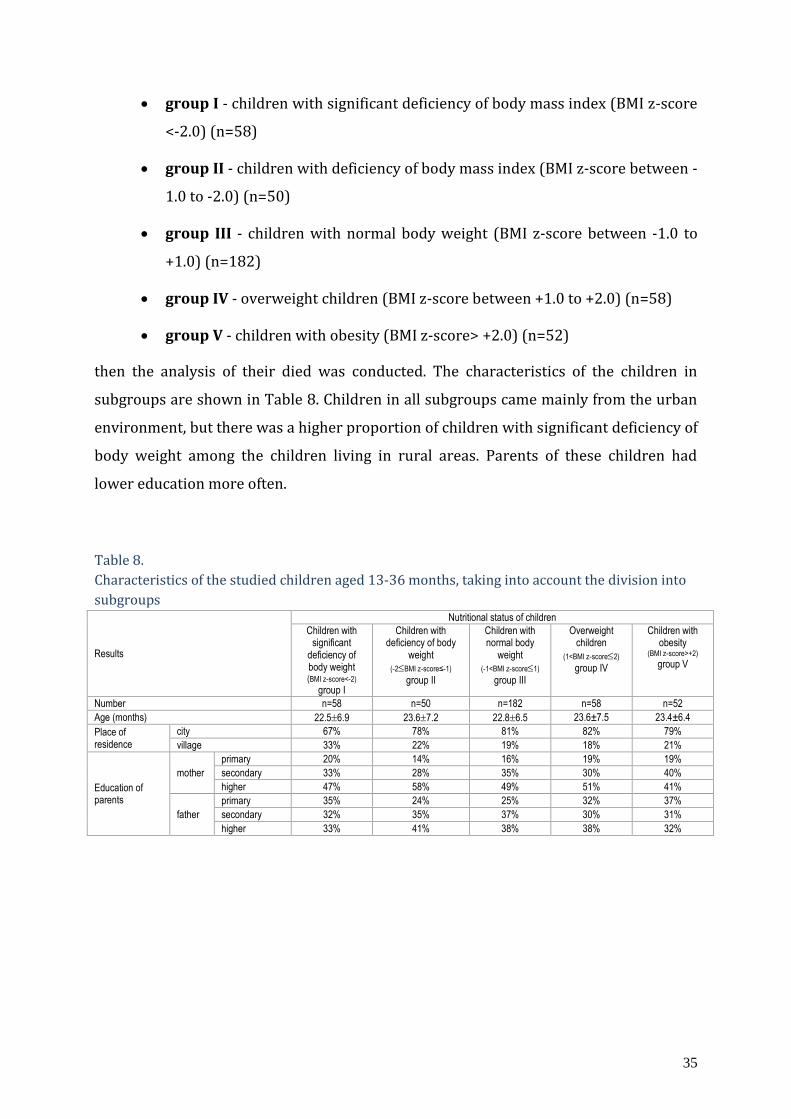
group I - children with significant deficiency of body mass index (BMI z-score
<-2.0) (n=58)
group II - children with deficiency of body mass index (BMI z-score between -
1.0 to -2.0) (n=50)
group III - children with normal body weight (BMI z-score between -1.0 to
+1.0) (n=182)
group IV - overweight children (BMI z-score between +1.0 to +2.0) (n=58)
group V - children with obesity (BMI z-score> +2.0) (n=52)
then the analysis of their died was conducted. The characteristics of the children in
subgroups are shown in Table 8. Children in all subgroups came mainly from the urban
environment, but there was a higher proportion of children with significant deficiency of
body weight among the children living in rural areas. Parents of these children had
lower education more often.
Table 8.
Characteristics of the studied children aged 13-36 months, taking into account the division into
subgroups
Results
Nutritional status of children
Children with significant
deficiency of body weight (BMI z-score<-2)
group I
Children with deficiency of body
weight
(-2BMI z-score≤-1)
group II
Children with normal body
weight
(-1<BMI z-score1)
group III
Overweight children
(1<BMI z-score2)
group IV
Children with obesity
(BMI z-score>+2)
group V
Number n=58 n=50 n=182 n=58 n=52
Age (months) 22.56.9 23.67.2 22.86.5 23.6±7.5 23.4±6.4
Place of residence
city 67% 78% 81% 82% 79%
village 33% 22% 19% 18% 21%
Education of parents
mother
primary 20% 14% 16% 19% 19%
secondary 33% 28% 35% 30% 40%
higher 47% 58% 49% 51% 41%
father
primary 35% 24% 25% 32% 37%
secondary 32% 35% 37% 30% 31%
higher 33% 41% 38% 38% 32%
36
4. Discussion of Results
4.1. Assessment of the Nutritional Status of the Studied Children
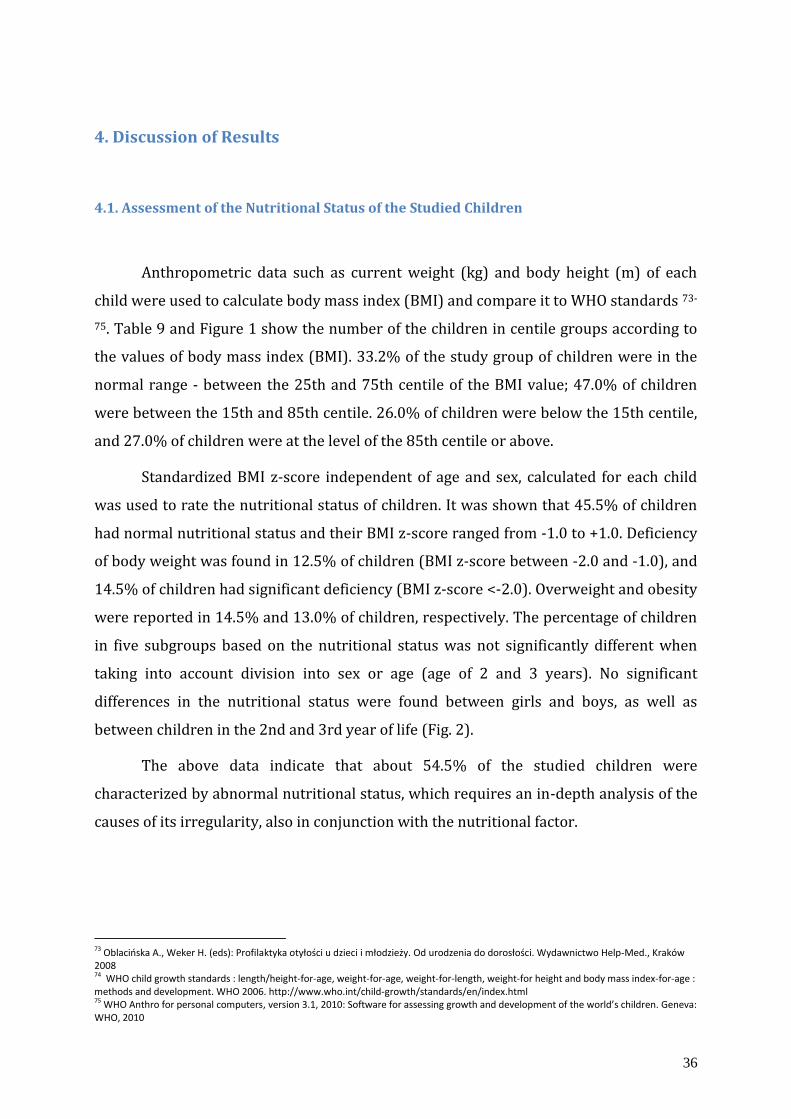
Anthropometric data such as current weight (kg) and body height (m) of each
child were used to calculate body mass index (BMI) and compare it to WHO standards 73-
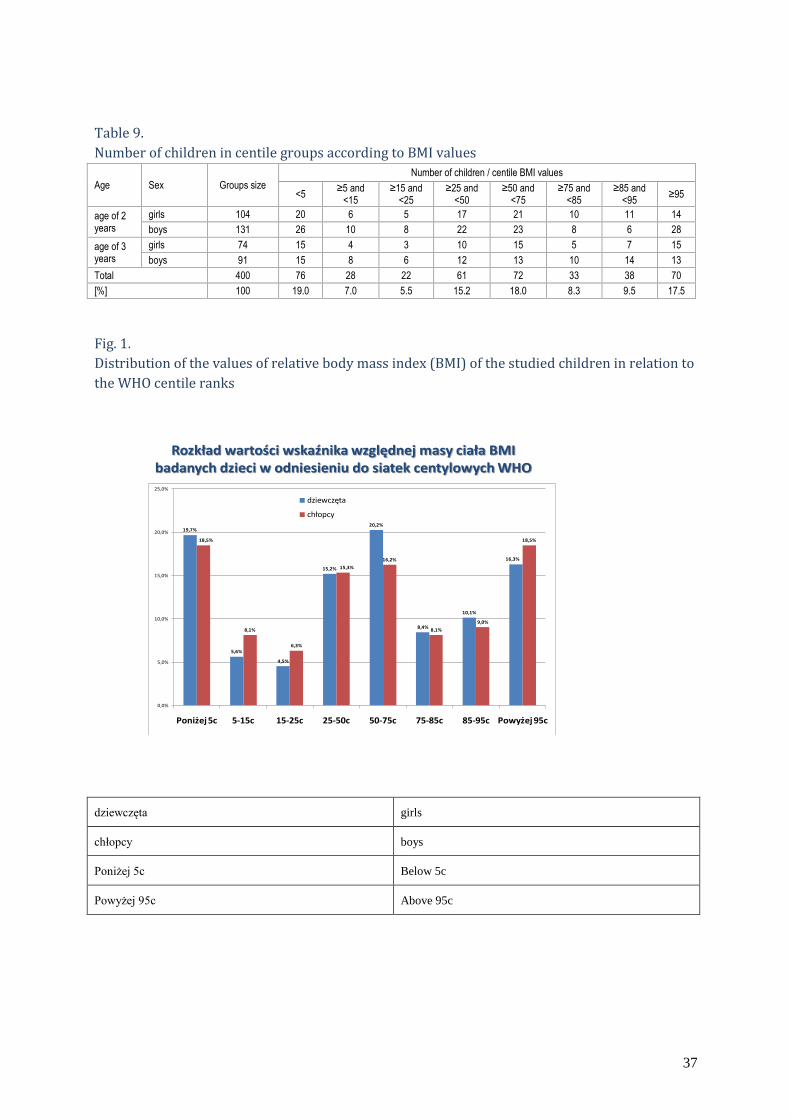
75. Table 9 and Figure 1 show the number of the children in centile groups according to
the values of body mass index (BMI). 33.2% of the study group of children were in the
normal range - between the 25th and 75th centile of the BMI value; 47.0% of children
were between the 15th and 85th centile. 26.0% of children were below the 15th centile,
and 27.0% of children were at the level of the 85th centile or above.
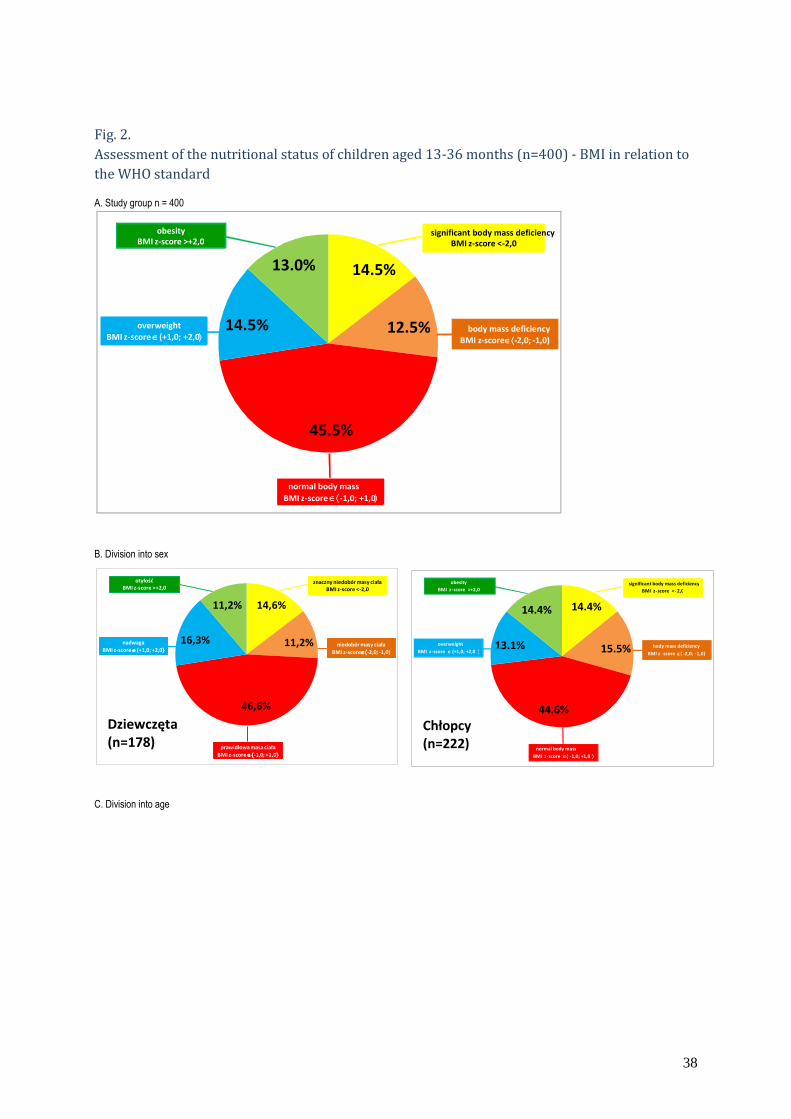
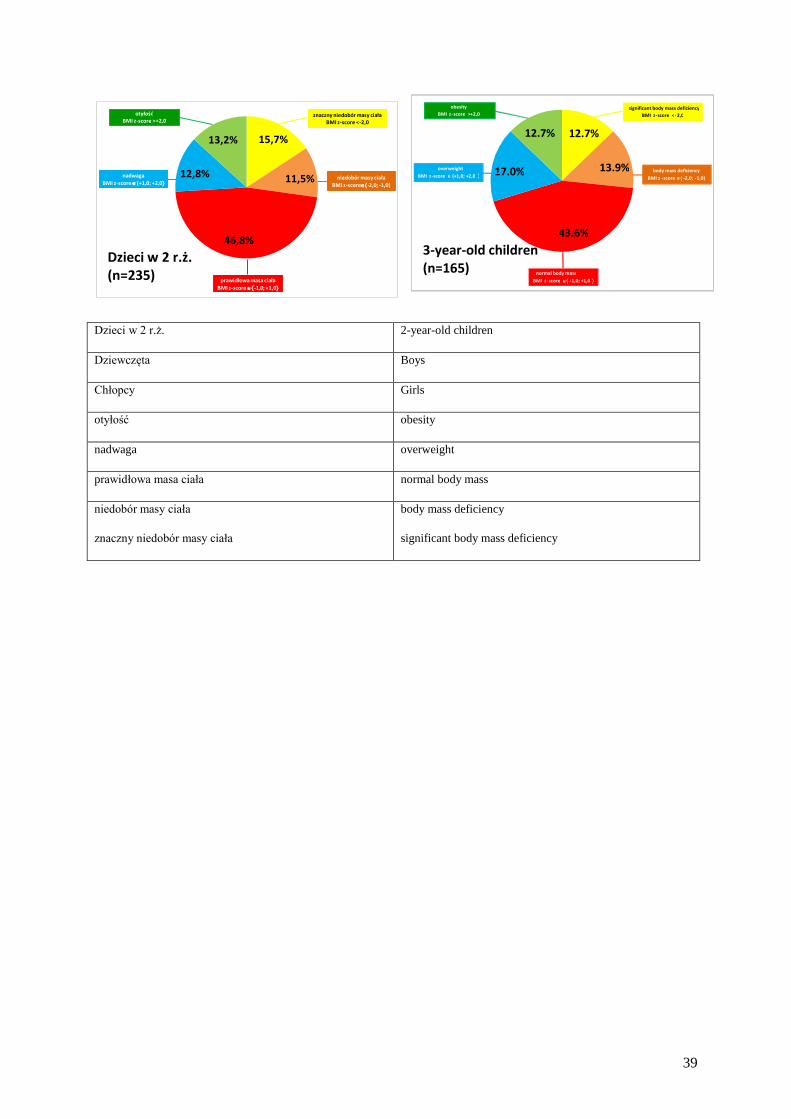
Standardized BMI z-score independent of age and sex, calculated for each child
was used to rate the nutritional status of children. It was shown that 45.5% of children
had normal nutritional status and their BMI z-score ranged from -1.0 to +1.0. Deficiency
of body weight was found in 12.5% of children (BMI z-score between -2.0 and -1.0), and
14.5% of children had significant deficiency (BMI z-score <-2.0). Overweight and obesity
were reported in 14.5% and 13.0% of children, respectively. The percentage of children
in five subgroups based on the nutritional status was not significantly different when
taking into account division into sex or age (age of 2 and 3 years). No significant
differences in the nutritional status were found between girls and boys, as well as
between children in the 2nd and 3rd year of life (Fig. 2).
The above data indicate that about 54.5% of the studied children were
characterized by abnormal nutritional status, which requires an in-depth analysis of the
causes of its irregularity, also in conjunction with the nutritional factor.
73 Oblacińska A., Weker H. (eds): Profilaktyka otyłości u dzieci i młodzieży. Od urodzenia do dorosłości. Wydawnictwo Help-Med., Kraków 2008 74 WHO child growth standards : length/height-for-age, weight-for-age, weight-for-length, weight-for height and body mass index-for-age : methods and development. WHO 2006. http://www.who.int/child-growth/standards/en/index.html 75 WHO Anthro for personal computers, version 3.1, 2010: Software for assessing growth and development of the world’s children. Geneva: WHO, 2010
37
Table 9.
Number of children in centile groups according to BMI values
Age Sex Groups size
Number of children / centile BMI values
<5 ≥5 and
<15 ≥15 and
<25 ≥25 and
<50 ≥50 and
<75 ≥75 and
<85 ≥85 and
<95 ≥95
age of 2 years
girls 104 20 6 5 17 21 10 11 14
boys 131 26 10 8 22 23 8 6 28
age of 3 years
girls 74 15 4 3 10 15 5 7 15
boys 91 15 8 6 12 13 10 14 13
Total 400 76 28 22 61 72 33 38 70
[%] 100 19.0 7.0 5.5 15.2 18.0 8.3 9.5 17.5
Fig. 1.
Distribution of the values of relative body mass index (BMI) of the studied children in relation to
the WHO centile ranks
19,7%
5,6%
4,5%
15,2%
20,2%
8,4%
10,1%
16,3%
18,5%
8,1%
6,3%
15,3%
16,2%
8,1%
9,0%
18,5%
0,0%
5,0%
10,0%
15,0%
20,0%
25,0%
Poniżej 5c 5-15c 15-25c 25-50c 50-75c 75-85c 85-95c Powyżej 95c
dziewczęta
chłopcy
Rozkład wartości wskaźnika względnej masy ciała BMI badanych dzieci w odniesieniu do siatek centylowych WHO
dziewczęta girls
chłopcy boys
Poniżej 5c Below 5c
Powyżej 95c Above 95c
38
14,6%
11,2%
46,6%
16,3%
11,2%
znaczny niedobór masy ciałaBMI z-score <-2,0
otyłośćBMI z-score >+2,0
prawidłowa masa ciała
BMI z-score-1,0; +1,0
nadwaga
BMI z-score(+1,0; +2,0niedobór masy ciała
BMI z-score-2,0; -1,0)
Dziewczęta (n=178)
Fig. 2.
Assessment of the nutritional status of children aged 13-36 months (n=400) - BMI in relation to
the WHO standard A. Study group n = 400
B. Division into sex
C. Division into age
14.5%
12.5%
45.5%
14.5%
13.0%
significant body mass deficiency BMI z - score < - 2,0
obesity BMI z - score >+2,0
normal body mass BMI z - score - 1,0; +1,0
overweight BMI z - score (+1,0; +2,0
body mass deficiency BMI z - score - 2,0; - 1,0)
14.4%
15.5%
44.6%
13.1%
14.4%
significant body mass deficiency BMI z - score < - 2,0
obesity BMI z - score >+2,0
normal body mass BMI z - score - 1,0; +1,0
overweight BMI z - score (+1,0; +2,0 body mass deficiency
BMI z - score - 2,0; - 1,0)
Chłopcy (n=222)
39
15,7%
11,5%
46,8%
12,8%
13,2%
znaczny niedobór masy ciałaBMI z-score <-2,0
otyłośćBMI z-score >+2,0
prawidłowa masa ciała
BMI z-score-1,0; +1,0
nadwaga
BMI z-score(+1,0; +2,0niedobór masy ciała
BMI z-score-2,0; -1,0)
Dzieci w 2 r.ż.(n=235)
Dzieci w 2 r.ż. 2-year-old children
Dziewczęta Boys
Chłopcy Girls
otyłość obesity
nadwaga overweight
prawidłowa masa ciała normal body mass
niedobór masy ciała
znaczny niedobór masy ciała
body mass deficiency
significant body mass deficiency
12.7%
13.9%
43.6%
17.0%
12.7%
significant body mass deficiency BMI z - score < - 2,0
obesity BMI z - score >+2,0
normal body mass BMI z - score - 1,0; +1,0
overweight BMI z - score (+1,0; +2,0 body mass deficiency
BMI z - score - 2,0; - 1,0)
3-year-old children (n=165)
40
4.2. Assessment of diet
4.2.1. The analysis of dietary patterns of the studied children
Dietary patterns, i.e. the frequency of food consumption, the selection of products
in the diet, energy and nutritional value of daily diet, dietary behaviour of the studied
children were assessed on the basis of data from the survey questionnaire (part C).
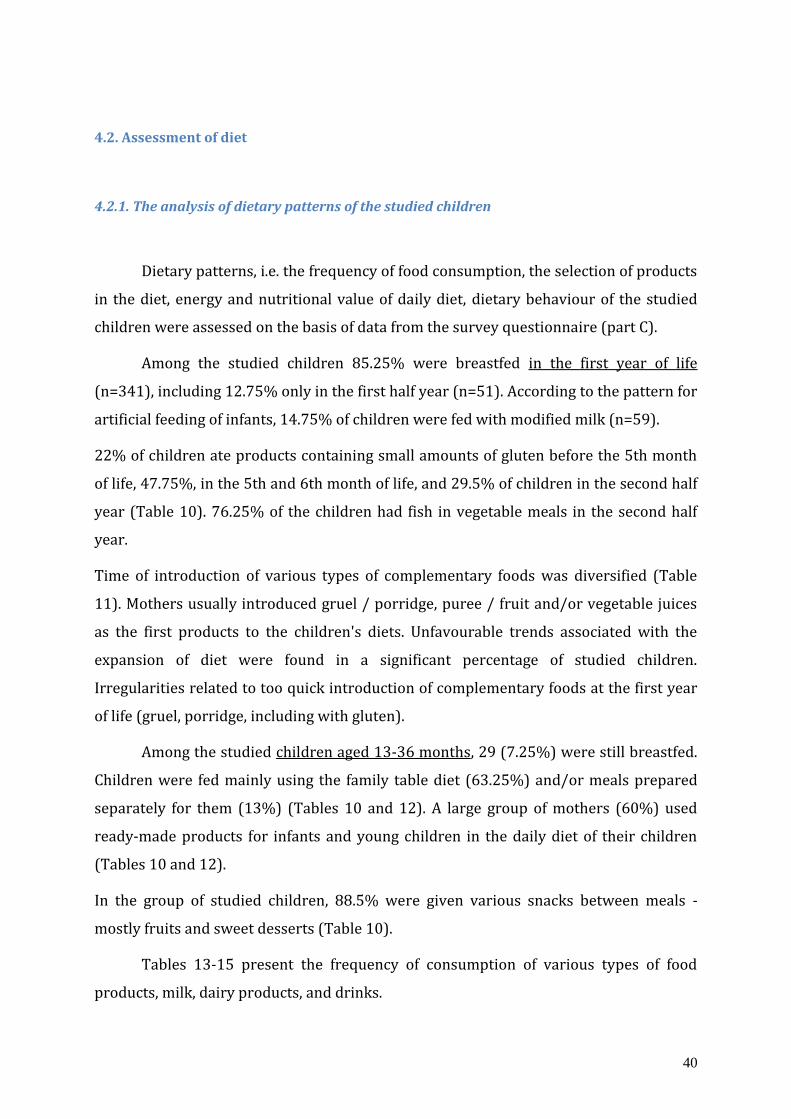
Among the studied children 85.25% were breastfed in the first year of life
(n=341), including 12.75% only in the first half year (n=51). According to the pattern for
artificial feeding of infants, 14.75% of children were fed with modified milk (n=59).
22% of children ate products containing small amounts of gluten before the 5th month
of life, 47.75%, in the 5th and 6th month of life, and 29.5% of children in the second half
year (Table 10). 76.25% of the children had fish in vegetable meals in the second half
year.
Time of introduction of various types of complementary foods was diversified (Table
11). Mothers usually introduced gruel / porridge, puree / fruit and/or vegetable juices
as the first products to the children's diets. Unfavourable trends associated with the
expansion of diet were found in a significant percentage of studied children.
Irregularities related to too quick introduction of complementary foods at the first year
of life (gruel, porridge, including with gluten).
Among the studied children aged 13-36 months, 29 (7.25%) were still breastfed.
Children were fed mainly using the family table diet (63.25%) and/or meals prepared
separately for them (13%) (Tables 10 and 12). A large group of mothers (60%) used
ready-made products for infants and young children in the daily diet of their children
(Tables 10 and 12).
In the group of studied children, 88.5% were given various snacks between meals -
mostly fruits and sweet desserts (Table 10).
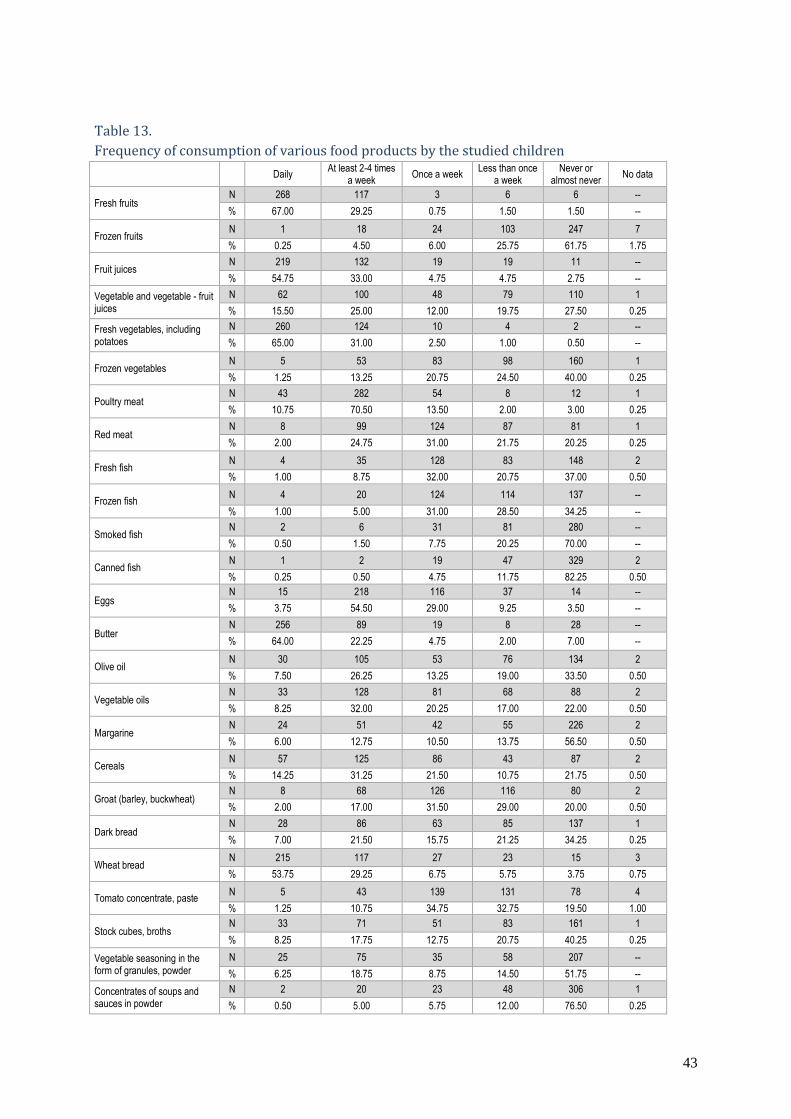
Tables 13-15 present the frequency of consumption of various types of food
products, milk, dairy products, and drinks.
41
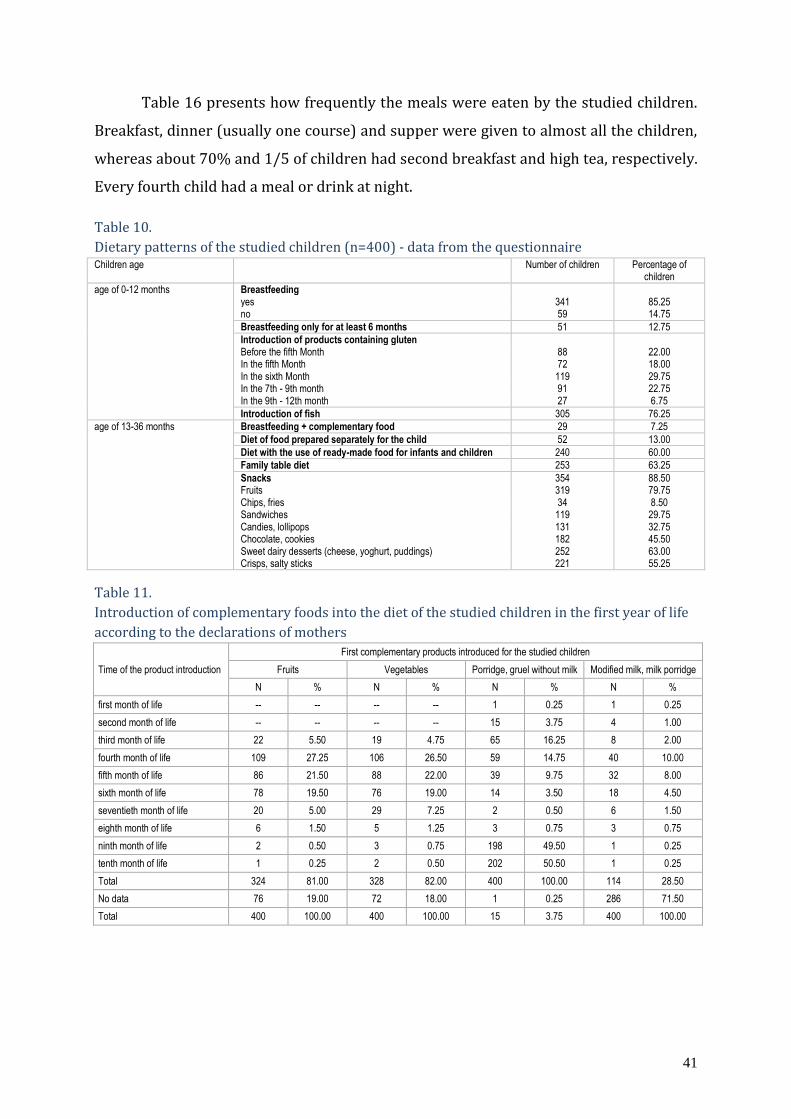
Table 16 presents how frequently the meals were eaten by the studied children.
Breakfast, dinner (usually one course) and supper were given to almost all the children,
whereas about 70% and 1/5 of children had second breakfast and high tea, respectively.
Every fourth child had a meal or drink at night.
Table 10.
Dietary patterns of the studied children (n=400) - data from the questionnaire Children age Number of children Percentage of
children
age of 0-12 months Breastfeeding yes 341 85.25 no 59 14.75
Breastfeeding only for at least 6 months 51 12.75
Introduction of products containing gluten Before the fifth Month 88 22.00 In the fifth Month 72 18.00 In the sixth Month 119 29.75 In the 7th - 9th month 91 22.75 In the 9th - 12th month 27 6.75
Introduction of fish 305 76.25
age of 13-36 months Breastfeeding + complementary food 29 7.25
Diet of food prepared separately for the child 52 13.00
Diet with the use of ready-made food for infants and children 240 60.00
Family table diet 253 63.25
Snacks 354 88.50 Fruits 319 79.75 Chips, fries 34 8.50 Sandwiches 119 29.75 Candies, lollipops 131 32.75 Chocolate, cookies 182 45.50 Sweet dairy desserts (cheese, yoghurt, puddings) 252 63.00 Crisps, salty sticks 221 55.25
Table 11.
Introduction of complementary foods into the diet of the studied children in the first year of life
according to the declarations of mothers
Time of the product introduction
First complementary products introduced for the studied children
Fruits Vegetables Porridge, gruel without milk Modified milk, milk porridge
N % N % N % N %
first month of life -- -- -- -- 1 0.25 1 0.25
second month of life -- -- -- -- 15 3.75 4 1.00
third month of life 22 5.50 19 4.75 65 16.25 8 2.00
fourth month of life 109 27.25 106 26.50 59 14.75 40 10.00
fifth month of life 86 21.50 88 22.00 39 9.75 32 8.00
sixth month of life 78 19.50 76 19.00 14 3.50 18 4.50
seventieth month of life 20 5.00 29 7.25 2 0.50 6 1.50
eighth month of life 6 1.50 5 1.25 3 0.75 3 0.75
ninth month of life 2 0.50 3 0.75 198 49.50 1 0.25
tenth month of life 1 0.25 2 0.50 202 50.50 1 0.25
Total 324 81.00 328 82.00 400 100.00 114 28.50
No data 76 19.00 72 18.00 1 0.25 286 71.50
Total 400 100.00 400 100.00 15 3.75 400 100.00

42
Table 12.
Method of preparation of meals for children aged 13-36 months
Meals for the child Daily At least 2-4
times a week Once a week
Less than once a week
Never or almost never
No data
I cook separately for the child
N 52 89 28 48 180 3
% 13.00 22.25 7.00 12.00 45.00 0.75
I use ready-made preserves for infants and children, including:
N 240 73 21 18 45 3
% 60.00 18.25 5.25 4.50 11.25 0.75
ready-made soup/meals
N 33 52 36 60 208 11
% 8.25 13.00 9.00 15.00 52.00 2.75
porridge, gruel
N 131 80 37 27 121 4
% 32.75 20.00 9.25 6.75 30.25 1.00
fruit purees, puddings
N 94 103 49 35 110 9
% 23.50 25.75 12.25 8.75 27.50 2.25
juices, beverages
N 185 97 23 26 65 4
% 46.25 24.25 5.75 6.50 16.25 1.00
teas
N 179 53 30 19 111 8
% 44.75 13.25 7.50 4.75 27.75 2.00
The child eats meals prepared for the whole family
N 253 85 19 19 20 4
% 63.25 21.25 4.75 4.75 5.00 1.00
I buy ready-made meals prepared outside the house (e.g. Chinese food, ravioli, pizza, etc.)
N 3 6 16 56 304 15
% 0.75 1.50 4.00 14.00 76.00 3.75
43
Table 13.
Frequency of consumption of various food products by the studied children
Daily At least 2-4 times
a week Once a week
Less than once a week
Never or almost never
No data
Fresh fruits N 268 117 3 6 6 --
% 67.00 29.25 0.75 1.50 1.50 --
Frozen fruits N 1 18 24 103 247 7
% 0.25 4.50 6.00 25.75 61.75 1.75
Fruit juices N 219 132 19 19 11 --
% 54.75 33.00 4.75 4.75 2.75 --
Vegetable and vegetable - fruit juices
N 62 100 48 79 110 1
% 15.50 25.00 12.00 19.75 27.50 0.25
Fresh vegetables, including potatoes
N 260 124 10 4 2 --
% 65.00 31.00 2.50 1.00 0.50 --
Frozen vegetables N 5 53 83 98 160 1
% 1.25 13.25 20.75 24.50 40.00 0.25
Poultry meat N 43 282 54 8 12 1
% 10.75 70.50 13.50 2.00 3.00 0.25
Red meat N 8 99 124 87 81 1
% 2.00 24.75 31.00 21.75 20.25 0.25
Fresh fish N 4 35 128 83 148 2
% 1.00 8.75 32.00 20.75 37.00 0.50
Frozen fish N 4 20 124 114 137 --
% 1.00 5.00 31.00 28.50 34.25 --
Smoked fish N 2 6 31 81 280 --
% 0.50 1.50 7.75 20.25 70.00 --
Canned fish N 1 2 19 47 329 2
% 0.25 0.50 4.75 11.75 82.25 0.50
Eggs N 15 218 116 37 14 --
% 3.75 54.50 29.00 9.25 3.50 --
Butter N 256 89 19 8 28 --
% 64.00 22.25 4.75 2.00 7.00 --
Olive oil N 30 105 53 76 134 2
% 7.50 26.25 13.25 19.00 33.50 0.50
Vegetable oils N 33 128 81 68 88 2
% 8.25 32.00 20.25 17.00 22.00 0.50
Margarine N 24 51 42 55 226 2
% 6.00 12.75 10.50 13.75 56.50 0.50
Cereals N 57 125 86 43 87 2
% 14.25 31.25 21.50 10.75 21.75 0.50
Groat (barley, buckwheat) N 8 68 126 116 80 2
% 2.00 17.00 31.50 29.00 20.00 0.50
Dark bread N 28 86 63 85 137 1
% 7.00 21.50 15.75 21.25 34.25 0.25
Wheat bread N 215 117 27 23 15 3
% 53.75 29.25 6.75 5.75 3.75 0.75
Tomato concentrate, paste N 5 43 139 131 78 4
% 1.25 10.75 34.75 32.75 19.50 1.00
Stock cubes, broths N 33 71 51 83 161 1
% 8.25 17.75 12.75 20.75 40.25 0.25
Vegetable seasoning in the form of granules, powder
N 25 75 35 58 207 --
% 6.25 18.75 8.75 14.50 51.75 --
Concentrates of soups and sauces in powder
N 2 20 23 48 306 1
% 0.50 5.00 5.75 12.00 76.50 0.25

44
Table 14.
Frequency of consumption of various dairy products by the studied children
Daily At least 2-4 times a
week Once a week
Less than once a week
Never or almost never
No data
Modified milk N 203 23 6 12 151 5
% 50.75 5.75 1.50 3.00 37.75 1.25
High-fat milk (3.5 - 3.2) N 47 55 28 16 244 10
% 11.75 13.75 7.00 4.00 61.00 2.50
Semi-skimmed milk (1.5 - 2) N 36 30 16 22 285 11
% 9.00 7.50 4.00 5.50 71.25 2.75
Skimmed milk (1.5 - 0.5) N 3 10 8 6 362 11
% 0.75 2.50 2.00 1.50 90.50 2.75
Natural yoghurt, kefir N 16 94 69 56 161 4
% 4.00 23.50 17.25 14.00 40.25 1.00
Fruit yoghurt N 97 180 51 19 47 6
% 24.25 45.00 12.75 4.75 11.75 1.50
Natural cheese / cottage cheese N 19 112 92 55 114 8
% 4.75 28.00 23.00 13.75 28.50 2.00
Fruit, flavoured cheese N 64 168 73 24 64 7
% 16.00 42.00 18.25 6.00 16.00 1.75
Dairy dessert N 26 102 62 59 141 10
% 6.50 25.50 15.50 14.75 35.25 2.50
Hard cheese N 29 163 63 46 94 5
% 7.25 40.75 15.75 11.50 23.50 1.25
Other (specify) N 6 2 7 -- -- 385
% 1.50 0.50 1.75 -- -- 96.25
Table 15.
Frequency of consumption of various drinks by the studied children
Daily At least 2-4 times
a week Once a week
Less than once a week
Never or almost never
No data
Water N 267 64 13 15 38 3
% 66.75 16.00 3.25 3.75 9.50 0.75
Juices, nectars N 203 135 27 17 15 3
% 50.75 33.75 6.75 4.25 3.75 0.75
Sweet still and carbonated drinks N 26 38 27 25 278 6
% 6.50 9.50 6.75 6.25 69.50 1.50
Tea N 207 100 20 15 56 2
% 51.75 25.00 5.00 3.75 14.00 0.50
Chicory coffee (without milk) N 5 13 15 23 338 6
% 1.25 3.25 3.75 5.75 84.50 1.50
Compote N 37 98 74 79 108 4
% 9.25 24.50 18.50 19.75 27.00 1.00
Homemade soups N 206 154 25 5 9 1
% 51.50 38.50 6.25 1.25 2.25 0.25
Other (specify) N 9 2 -- -- -- 389
% 2.25 0.50 -- -- -- 97.25
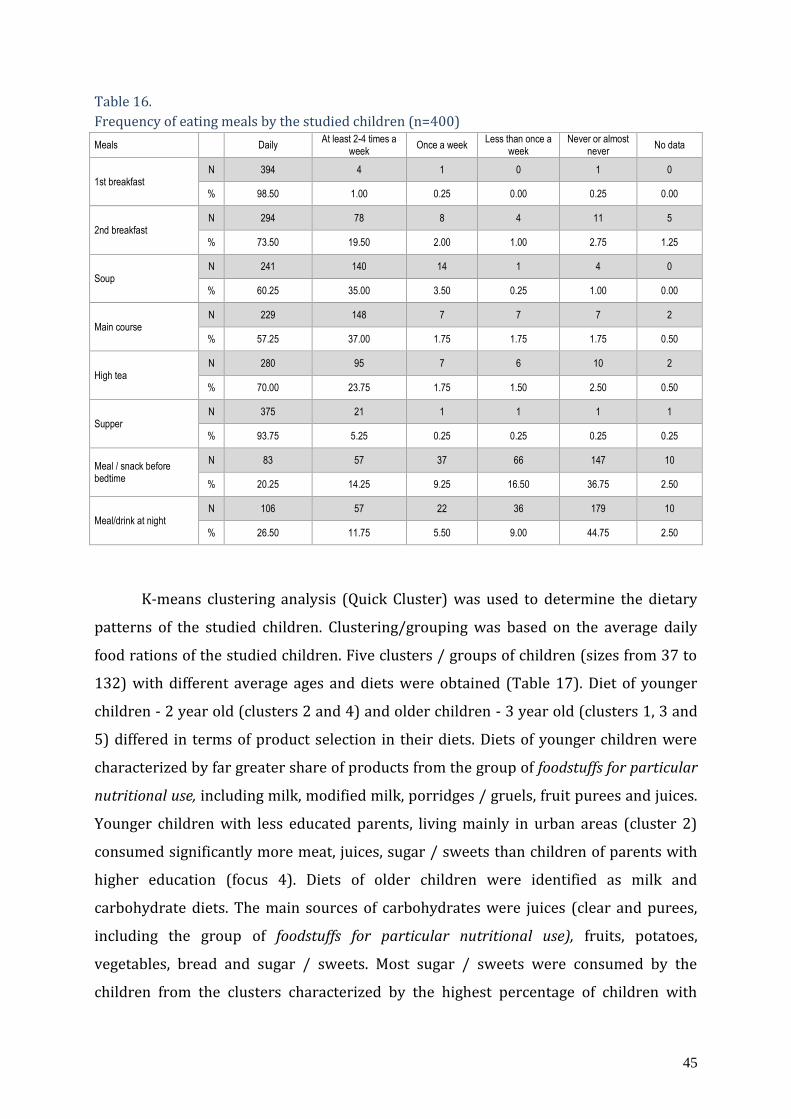
45
Table 16.
Frequency of eating meals by the studied children (n=400)
Meals Daily At least 2-4 times a
week Once a week
Less than once a week
Never or almost never
No data
1st breakfast N 394 4 1 0 1 0
% 98.50 1.00 0.25 0.00 0.25 0.00
2nd breakfast N 294 78 8 4 11 5
% 73.50 19.50 2.00 1.00 2.75 1.25
Soup N 241 140 14 1 4 0
% 60.25 35.00 3.50 0.25 1.00 0.00
Main course N 229 148 7 7 7 2
% 57.25 37.00 1.75 1.75 1.75 0.50
High tea N 280 95 7 6 10 2
% 70.00 23.75 1.75 1.50 2.50 0.50
Supper N 375 21 1 1 1 1
% 93.75 5.25 0.25 0.25 0.25 0.25
Meal / snack before bedtime
N 83 57 37 66 147 10
% 20.25 14.25 9.25 16.50 36.75 2.50
Meal/drink at night N 106 57 22 36 179 10
% 26.50 11.75 5.50 9.00 44.75 2.50
K-means clustering analysis (Quick Cluster) was used to determine the dietary
patterns of the studied children. Clustering/grouping was based on the average daily
food rations of the studied children. Five clusters / groups of children (sizes from 37 to
132) with different average ages and diets were obtained (Table 17). Diet of younger
children - 2 year old (clusters 2 and 4) and older children - 3 year old (clusters 1, 3 and
5) differed in terms of product selection in their diets. Diets of younger children were
characterized by far greater share of products from the group of foodstuffs for particular
nutritional use, including milk, modified milk, porridges / gruels, fruit purees and juices.
Younger children with less educated parents, living mainly in urban areas (cluster 2)
consumed significantly more meat, juices, sugar / sweets than children of parents with
higher education (focus 4). Diets of older children were identified as milk and
carbohydrate diets. The main sources of carbohydrates were juices (clear and purees,
including the group of foodstuffs for particular nutritional use), fruits, potatoes,
vegetables, bread and sugar / sweets. Most sugar / sweets were consumed by the
children from the clusters characterized by the highest percentage of children with
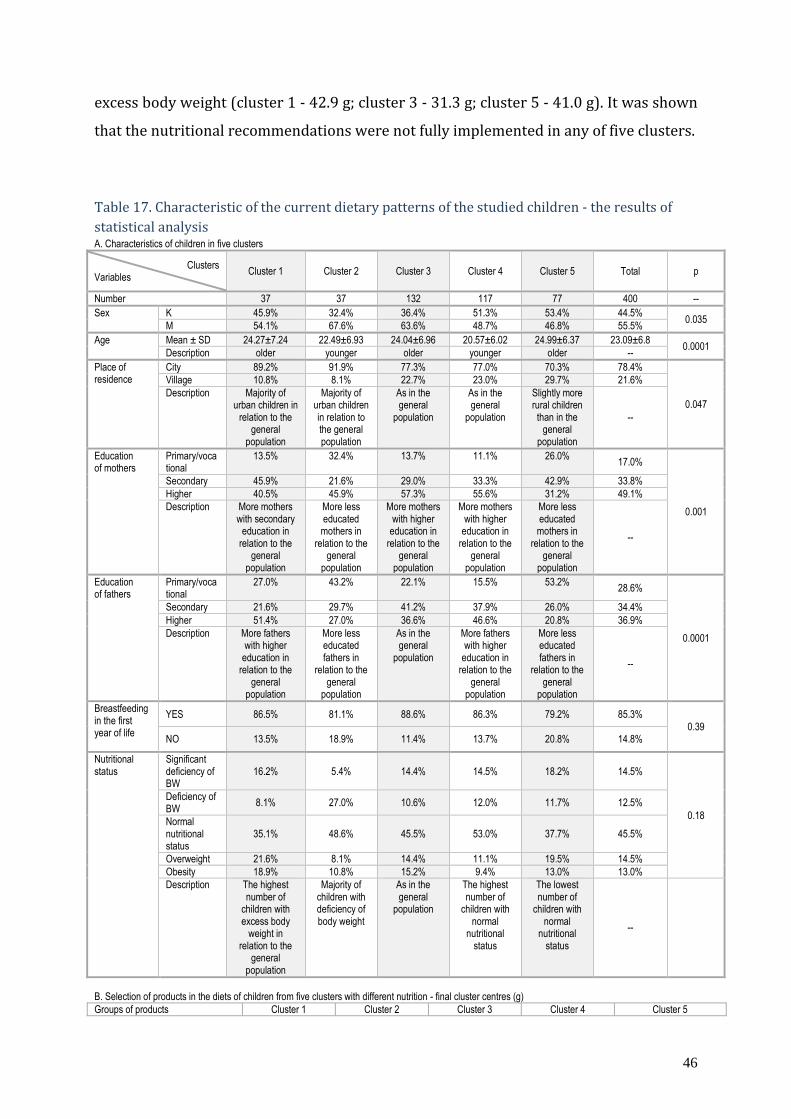
46
excess body weight (cluster 1 - 42.9 g; cluster 3 - 31.3 g; cluster 5 - 41.0 g). It was shown
that the nutritional recommendations were not fully implemented in any of five clusters.
Table 17. Characteristic of the current dietary patterns of the studied children - the results of
statistical analysis A. Characteristics of children in five clusters
Clusters Variables
Cluster 1 Cluster 2 Cluster 3 Cluster 4 Cluster 5 Total p
Number 37 37 132 117 77 400 --
Sex K 45.9% 32.4% 36.4% 51.3% 53.4% 44.5% 0.035
M 54.1% 67.6% 63.6% 48.7% 46.8% 55.5%
Age Mean ± SD 24.27±7.24 22.49±6.93 24.04±6.96 20.57±6.02 24.99±6.37 23.09±6.8 0.0001
Description older younger older younger older --
Place of residence
City 89.2% 91.9% 77.3% 77.0% 70.3% 78.4%
0.047
Village 10.8% 8.1% 22.7% 23.0% 29.7% 21.6%
Description Majority of urban children in
relation to the general
population
Majority of urban children in relation to the general population
As in the general
population
As in the general
population
Slightly more rural children than in the
general population
--
Education of mothers
Primary/vocational
13.5% 32.4% 13.7% 11.1% 26.0% 17.0%
0.001
Secondary 45.9% 21.6% 29.0% 33.3% 42.9% 33.8%
Higher 40.5% 45.9% 57.3% 55.6% 31.2% 49.1%
Description More mothers with secondary
education in relation to the
general population
More less educated mothers in
relation to the general
population
More mothers with higher
education in relation to the
general population
More mothers with higher
education in relation to the
general population
More less educated mothers in
relation to the general
population
--
Education of fathers
Primary/vocational
27.0% 43.2% 22.1% 15.5% 53.2% 28.6%
0.0001
Secondary 21.6% 29.7% 41.2% 37.9% 26.0% 34.4%
Higher 51.4% 27.0% 36.6% 46.6% 20.8% 36.9%
Description More fathers with higher
education in relation to the
general population
More less educated fathers in
relation to the general
population
As in the general
population
More fathers with higher
education in relation to the
general population
More less educated fathers in
relation to the general
population
--
Breastfeeding in the first year of life
YES 86.5% 81.1% 88.6% 86.3% 79.2% 85.3% 0.39
NO 13.5% 18.9% 11.4% 13.7% 20.8% 14.8%
Nutritional status
Significant deficiency of BW
16.2% 5.4% 14.4% 14.5% 18.2% 14.5%
0.18
Deficiency of BW
8.1% 27.0% 10.6% 12.0% 11.7% 12.5%
Normal nutritional status
35.1% 48.6% 45.5% 53.0% 37.7% 45.5%
Overweight 21.6% 8.1% 14.4% 11.1% 19.5% 14.5%
Obesity 18.9% 10.8% 15.2% 9.4% 13.0% 13.0%
Description The highest number of
children with excess body
weight in relation to the
general population
Majority of children with deficiency of body weight
As in the general
population
The highest number of
children with normal
nutritional status
The lowest number of
children with normal
nutritional status
--
B. Selection of products in the diets of children from five clusters with different nutrition - final cluster centres (g)
Groups of products Cluster 1 Cluster 2 Cluster 3 Cluster 4 Cluster 5
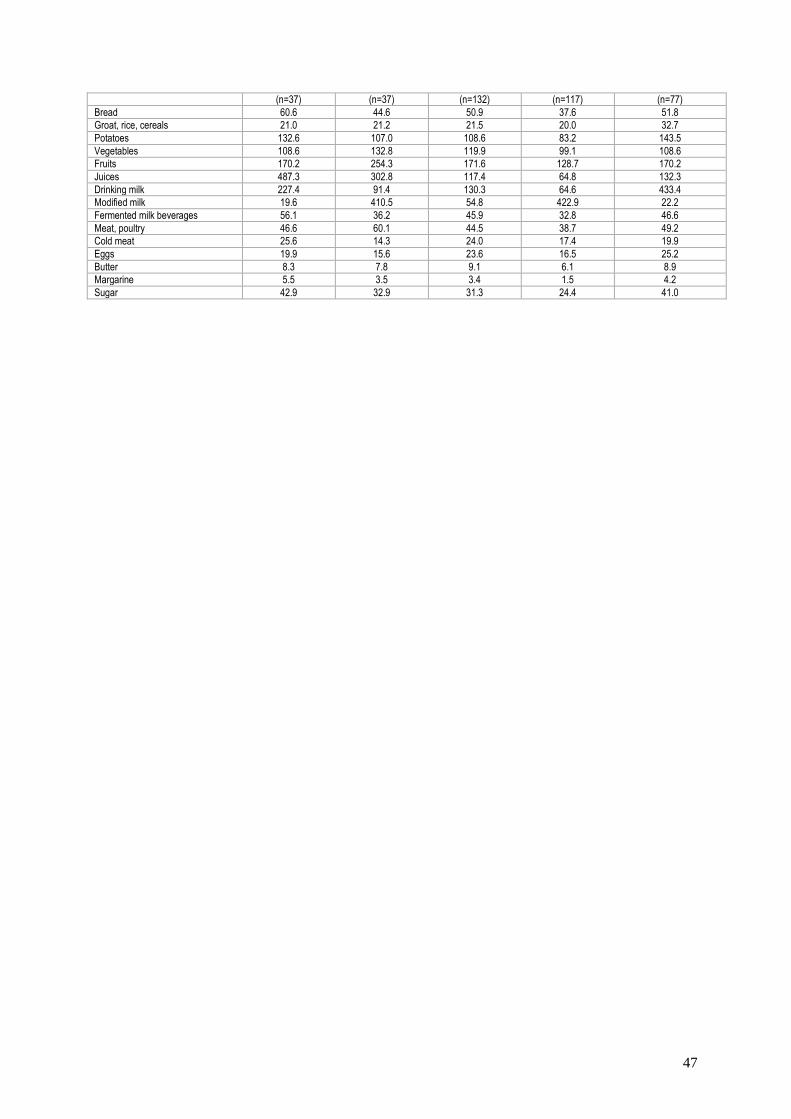
47
(n=37) (n=37) (n=132) (n=117) (n=77)
Bread 60.6 44.6 50.9 37.6 51.8
Groat, rice, cereals 21.0 21.2 21.5 20.0 32.7
Potatoes 132.6 107.0 108.6 83.2 143.5
Vegetables 108.6 132.8 119.9 99.1 108.6
Fruits 170.2 254.3 171.6 128.7 170.2
Juices 487.3 302.8 117.4 64.8 132.3
Drinking milk 227.4 91.4 130.3 64.6 433.4
Modified milk 19.6 410.5 54.8 422.9 22.2
Fermented milk beverages 56.1 36.2 45.9 32.8 46.6
Meat, poultry 46.6 60.1 44.5 38.7 49.2
Cold meat 25.6 14.3 24.0 17.4 19.9
Eggs 19.9 15.6 23.6 16.5 25.2
Butter 8.3 7.8 9.1 6.1 8.9
Margarine 5.5 3.5 3.4 1.5 4.2
Sugar 42.9 32.9 31.3 24.4 41.0
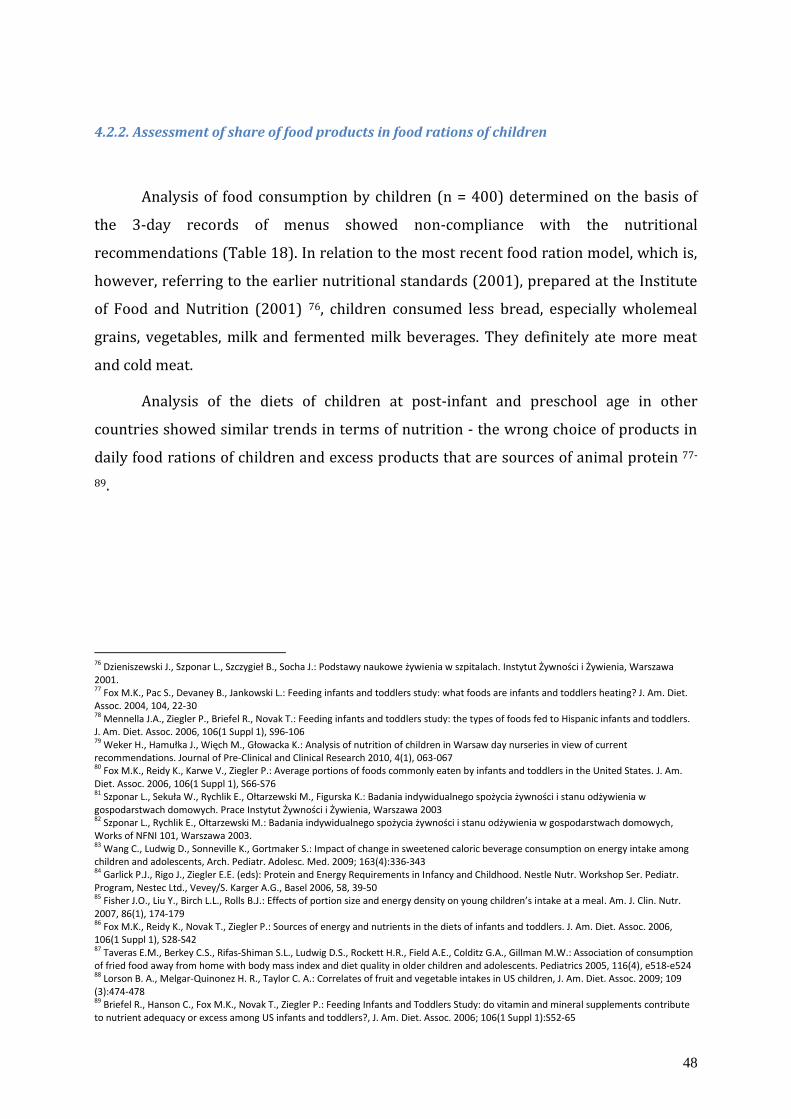
48
4.2.2. Assessment of share of food products in food rations of children
Analysis of food consumption by children (n = 400) determined on the basis of
the 3-day records of menus showed non-compliance with the nutritional
recommendations (Table 18). In relation to the most recent food ration model, which is,
however, referring to the earlier nutritional standards (2001), prepared at the Institute
of Food and Nutrition (2001) 76, children consumed less bread, especially wholemeal
grains, vegetables, milk and fermented milk beverages. They definitely ate more meat
and cold meat.
Analysis of the diets of children at post-infant and preschool age in other
countries showed similar trends in terms of nutrition - the wrong choice of products in
daily food rations of children and excess products that are sources of animal protein 77-
89.
76 Dzieniszewski J., Szponar L., Szczygieł B., Socha J.: Podstawy naukowe żywienia w szpitalach. Instytut Żywności i Żywienia, Warszawa 2001. 77 Fox M.K., Pac S., Devaney B., Jankowski L.: Feeding infants and toddlers study: what foods are infants and toddlers heating? J. Am. Diet. Assoc. 2004, 104, 22-30 78 Mennella J.A., Ziegler P., Briefel R., Novak T.: Feeding infants and toddlers study: the types of foods fed to Hispanic infants and toddlers. J. Am. Diet. Assoc. 2006, 106(1 Suppl 1), S96-106 79 Weker H., Hamułka J., Więch M., Głowacka K.: Analysis of nutrition of children in Warsaw day nurseries in view of current recommendations. Journal of Pre-Clinical and Clinical Research 2010, 4(1), 063-067 80 Fox M.K., Reidy K., Karwe V., Ziegler P.: Average portions of foods commonly eaten by infants and toddlers in the United States. J. Am. Diet. Assoc. 2006, 106(1 Suppl 1), S66-S76 81 Szponar L., Sekuła W., Rychlik E., Ołtarzewski M., Figurska K.: Badania indywidualnego spożycia żywności i stanu odżywienia w gospodarstwach domowych. Prace Instytut Żywności i Żywienia, Warszawa 2003 82 Szponar L., Rychlik E., Ołtarzewski M.: Badania indywidualnego spożycia żywności i stanu odżywienia w gospodarstwach domowych, Works of NFNI 101, Warszawa 2003. 83 Wang C., Ludwig D., Sonneville K., Gortmaker S.: Impact of change in sweetened caloric beverage consumption on energy intake among children and adolescents, Arch. Pediatr. Adolesc. Med. 2009; 163(4):336-343 84 Garlick P.J., Rigo J., Ziegler E.E. (eds): Protein and Energy Requirements in Infancy and Childhood. Nestle Nutr. Workshop Ser. Pediatr. Program, Nestec Ltd., Vevey/S. Karger A.G., Basel 2006, 58, 39-50 85 Fisher J.O., Liu Y., Birch L.L., Rolls B.J.: Effects of portion size and energy density on young children’s intake at a meal. Am. J. Clin. Nutr. 2007, 86(1), 174-179 86 Fox M.K., Reidy K., Novak T., Ziegler P.: Sources of energy and nutrients in the diets of infants and toddlers. J. Am. Diet. Assoc. 2006, 106(1 Suppl 1), S28-S42 87 Taveras E.M., Berkey C.S., Rifas-Shiman S.L., Ludwig D.S., Rockett H.R., Field A.E., Colditz G.A., Gillman M.W.: Association of consumption of fried food away from home with body mass index and diet quality in older children and adolescents. Pediatrics 2005, 116(4), e518-e524 88 Lorson B. A., Melgar-Quinonez H. R., Taylor C. A.: Correlates of fruit and vegetable intakes in US children, J. Am. Diet. Assoc. 2009; 109 (3):474-478 89 Briefel R., Hanson C., Fox M.K., Novak T., Ziegler P.: Feeding Infants and Toddlers Study: do vitamin and mineral supplements contribute to nutrient adequacy or excess among US infants and toddlers?, J. Am. Diet. Assoc. 2006; 106(1 Suppl 1):S52-65
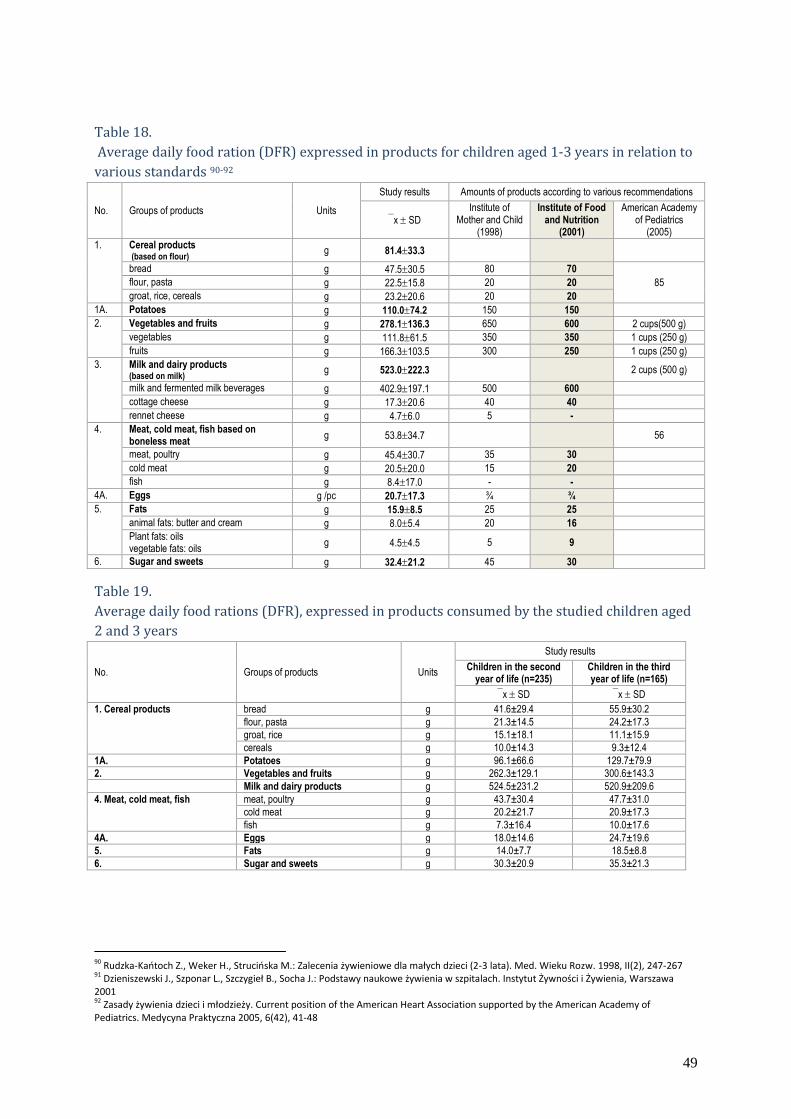
49
Table 18.
Average daily food ration (DFR) expressed in products for children aged 1-3 years in relation to
various standards 90-92
No. Groups of products Units
Study results Amounts of products according to various recommendations
x SD
Institute of Mother and Child
(1998)
Institute of Food and Nutrition
(2001)
American Academy of Pediatrics
(2005)
1. Cereal products (based on flour)
g 81.433.3
bread g 47.530.5 80 70
85 flour, pasta g 22.515.8 20 20
groat, rice, cereals g 23.220.6 20 20
1A. Potatoes g 110.074.2 150 150
2. Vegetables and fruits g 278.1136.3 650 600 2 cups(500 g)
vegetables g 111.861.5 350 350 1 cups (250 g)
fruits g 166.3103.5 300 250 1 cups (250 g)
3. Milk and dairy products (based on milk)
g 523.0222.3 2 cups (500 g)
milk and fermented milk beverages g 402.9197.1 500 600
cottage cheese g 17.320.6 40 40
rennet cheese g 4.76.0 5 -
4. Meat, cold meat, fish based on boneless meat
g 53.834.7 56
meat, poultry g 45.430.7 35 30
cold meat g 20.520.0 15 20
fish g 8.417.0 - -
4A. Eggs g /pc 20.717.3 ¾ ¾
5. Fats g 15.98.5 25 25
animal fats: butter and cream g 8.05.4 20 16
Plant fats: oils vegetable fats: oils
g 4.54.5 5 9
6. Sugar and sweets g 32.421.2 45 30
Table 19.
Average daily food rations (DFR), expressed in products consumed by the studied children aged
2 and 3 years
No. Groups of products Units
Study results
Children in the second year of life (n=235)
Children in the third year of life (n=165)
x SD x SD
1. Cereal products bread g 41.6±29.4 55.9±30.2
flour, pasta g 21.3±14.5 24.2±17.3
groat, rice g 15.1±18.1 11.1±15.9
cereals g 10.0±14.3 9.3±12.4
1A. Potatoes g 96.1±66.6 129.7±79.9
2. Vegetables and fruits g 262.3±129.1 300.6±143.3
Milk and dairy products g 524.5±231.2 520.9±209.6
4. Meat, cold meat, fish meat, poultry g 43.7±30.4 47.7±31.0
cold meat g 20.2±21.7 20.9±17.3
fish g 7.3±16.4 10.0±17.6
4A. Eggs g 18.0±14.6 24.7±19.6
5. Fats g 14.0±7.7 18.5±8.8
6. Sugar and sweets g 30.3±20.9 35.3±21.3
90 Rudzka-Kańtoch Z., Weker H., Strucińska M.: Zalecenia żywieniowe dla małych dzieci (2-3 lata). Med. Wieku Rozw. 1998, II(2), 247-267 91 Dzieniszewski J., Szponar L., Szczygieł B., Socha J.: Podstawy naukowe żywienia w szpitalach. Instytut Żywności i Żywienia, Warszawa 2001 92 Zasady żywienia dzieci i młodzieży. Current position of the American Heart Association supported by the American Academy of Pediatrics. Medycyna Praktyczna 2005, 6(42), 41-48

50
Table 20.
Average daily food rations (DFR), expressed in products consumed by the studied children,
divided into subgroups according to the nutritional status No. Groups of products Unit Study results
Children with significant
deficiency of body weight (BMI z-score<-2)
group I
Children with deficiency of body weight
(-2BMI z-score≤-1)
group II
Children with normal body
weight
(-1<BMI z-score1)
group III
Overweight children (1<BMI
z-score2)
group IV
Children with obesity
(BMI z-score>+2)
group V
x SD x SD x SD x SD x SD
1. Cereal products
bread g 44.1 36.4 47.5 31.3 47,0 29,5 45.6±27.4 55.1±29.6
flour, pasta g 19,3 13,6 26.4 20.4 23,0 16,2 21.5±13.6 21.7±13.3
groat, rice g 15,5 21,1 12,9 13,7 13,8 18,6 13.9±15.8 10.0±11.5
cereals g 10,0 11,9 10,4 15,1 9,7 13,6 9.6±14.8 8.8±12.1
1A. Potatoes g 117,0 71,5 107,8 86,7 103,9 70,7 120.9±79.5 113.0±70.4
2. Vegetables and fruits g 253,7 125,5 302,6 148,4 286,4 141,6 277.8±133.4 252.8±115.6
3. Milk and dairy products
g 495,1 184,7 544,5 254,4 532,4 221,0 538.5±228.9 483.0±225.6
4. Meat, cold meat, fish
meat, poultry g 42,1 26,7 39,6 27,3 48,4 33,0 42.5±31.2 46.8±28.6
cold meat g 19,0 15,0 23,9 31,6 19,5 18,2 21.0±17.0 21.9±19.9
fish g 5,3 10,6 13,4 22,0 8,3 16,9 6.8±14.0 9.4±19.6
4A. Eggs g 20,4 15,5 20,9 18,4 20,5 18,1 19.9±15.2 22.6±18.1
5. Fats* g 13,4 8,3 16,7 8,8 16,2 8,4 16.8±9.5 15.5±7.2
6. Sugar and sweets g 30,6 19,3 35,3 21,8 33,4 22,9 31.5±21.0 28.7±16.1
*p<0.05
60% of the studied children were given products from the group of foodstuffs for
particular nutritional use every day (Table 10). About half of the study group received
Junior-type modified milk (45.8%), porridge and gruel (26-37%) and fruit juices
(46.3%) (Table 21). Products from the group meat, cold meat, fish, eggs and products
from the group milk and dairy products provided over 70% of protein in the average
daily food ration. The main sources of fat were butter and vegetable oils, milk and dairy
products, meat and cold meat. Cereal products (porridge/gruel), potatoes, fruit (juice),
sugar and sweets provided carbohydrates. The sources of iron were mostly the products
enriched with this element (modified milk, porridge/dairy desserts). These products
were also the primary sources of calcium and vitamin D. The diets of children were
characterized by a significant share of fruits and vegetables rich in carotene (vegetable
puree/soup - carrot, pumpkin, carrot and apricot-based juice) (Fig. 3).
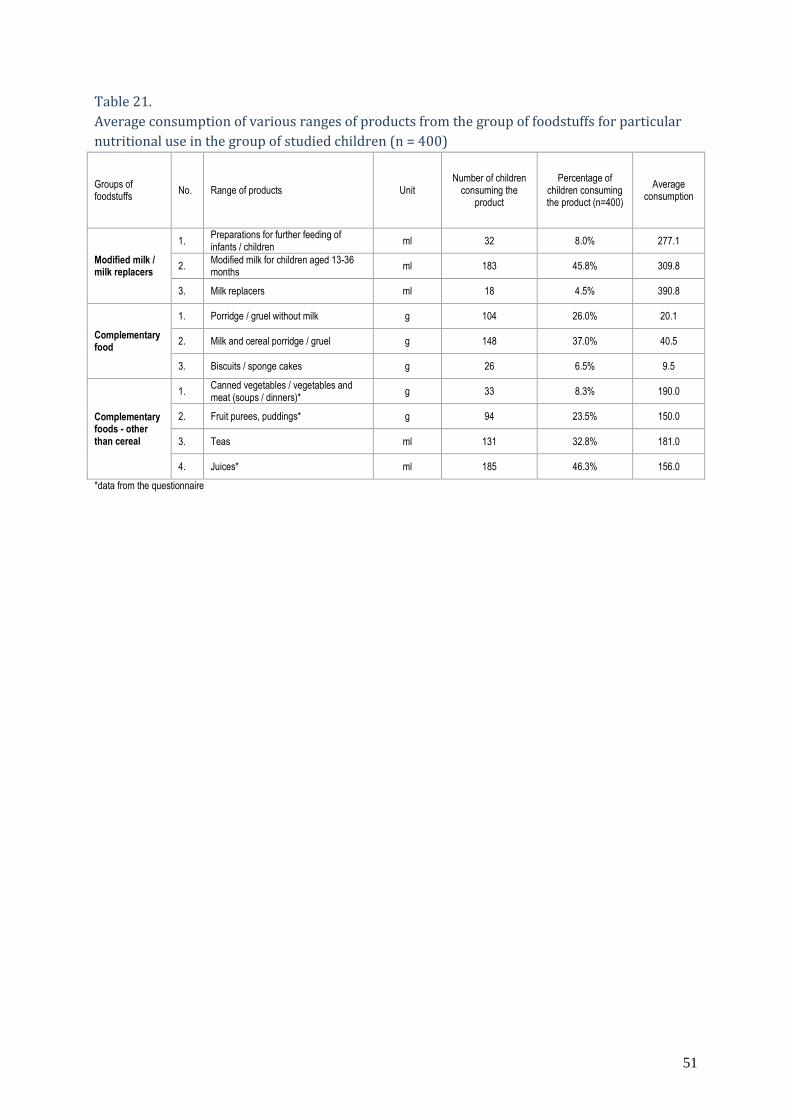
51
Table 21.
Average consumption of various ranges of products from the group of foodstuffs for particular
nutritional use in the group of studied children (n = 400)
Groups of foodstuffs
No. Range of products Unit Number of children
consuming the product
Percentage of children consuming the product (n=400)
Average consumption
Modified milk / milk replacers
1. Preparations for further feeding of infants / children
ml 32 8.0% 277.1
2. Modified milk for children aged 13-36 months
ml 183 45.8% 309.8
3. Milk replacers ml 18 4.5% 390.8
Complementary food
1. Porridge / gruel without milk g 104 26.0% 20.1
2. Milk and cereal porridge / gruel g 148 37.0% 40.5
3. Biscuits / sponge cakes g 26 6.5% 9.5
Complementary foods - other than cereal
1. Canned vegetables / vegetables and meat (soups / dinners)*
g 33 8.3% 190.0
2. Fruit purees, puddings* g 94 23.5% 150.0
3. Teas ml 131 32.8% 181.0
4. Juices* ml 185 46.3% 156.0
*data from the questionnaire

52
Fig. 3.
Main sources of nutrients in the children's diets A. Macronutrients
28,5%
20,6%
4,4%
42,3%
3,0%
39,6%
13,3%
6,4%
22,3%
26,5%
51,5%
24,0%
35,5%
31,4%
16,6%
6,8%
7,6%
12,9%
35,6%
26,7%
10,4%
17,1%
61,1%
0% 10% 20% 30% 40% 50% 60% 70% 80% 90% 100%
Energia
Białko
Tłuszcz
Węglowodany
Sacharoza
Błonnik
Produkty węglowodanowe - zbożowe, w tym kaszki / kleiki oraz ziemniakiWarzywa, owoce, w tym soki Mleko i przetwory mleczne, w tym z mleka modyfikowanego
Mięso, wędliny, drób, ryby i jajaTłuszcze
Cukier i słodyczeInne produkty
B. Vitamins
7,7%
22,0%
8,9%
26,1%
23,6%
24,4%
61,1%
97,2%
24,1%
11,7%
12,0%
26,7%
34,5%
65,5%
19,2%
27,1%
47,5%
55,2%
22,5%
55,9%
30,9%
23,4%
21,5%
22,6%
10,4%
7,2%
28,9%
43,2%
41,7%
19,0%
21,6%
23,0%
10,2%
5,2%
7,6%
33,4%
19,7%
4,8%
3,6%
2,9%
3,0%
9,3%
0% 10% 20% 30% 40% 50% 60% 70% 80% 90% 100%
Wit. D
Wit. A
Beta-karoten
Wit. E
Retinol
Wit. B12
Niacyna
Ryboflawina
Tiamina
Wit. B6
Kw. foliowy
Produkty węglowodanowe - zbożowe, w tym kaszki / kleiki oraz ziemniakiWarzywa, owoce, w tym soki Mleko i przetwory mleczne, w tym z mleka modyfikowanego
Mięso, wędliny, drób, ryby i jajaTłuszcze
Cukier i słodyczeInne produkty
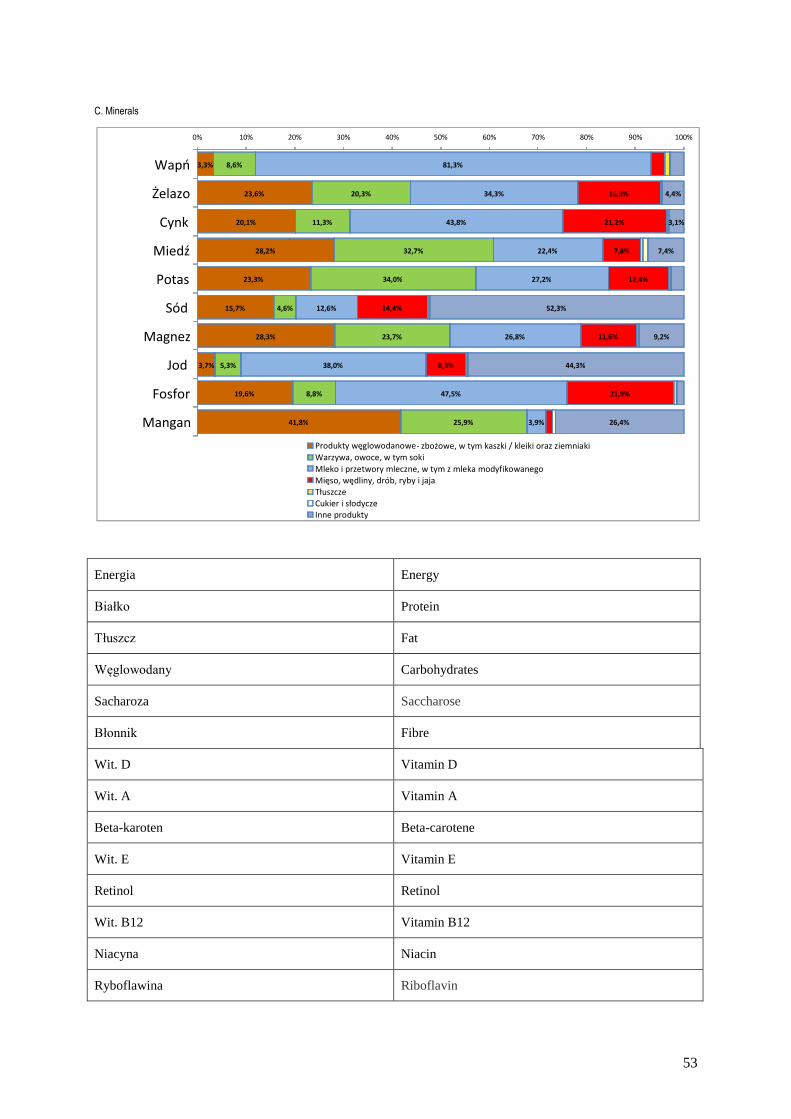
53
C. Minerals
Energia Energy
Białko Protein
Tłuszcz Fat
Węglowodany Carbohydrates
Sacharoza Saccharose
Błonnik Fibre
Wit. D Vitamin D
Wit. A Vitamin A
Beta-karoten Beta-carotene
Wit. E Vitamin E
Retinol Retinol
Wit. B12 Vitamin B12
Niacyna Niacin
Ryboflawina Riboflavin
3,3%
23,6%
20,1%
28,2%
23,3%
15,7%
28,3%
3,7%
19,6%
41,8%
8,6%
20,3%
11,3%
32,7%
34,0%
4,6%
23,7%
5,3%
8,8%
25,9%
81,3%
34,3%
43,8%
22,4%
27,2%
12,6%
26,8%
38,0%
47,5%
3,9%
16,9%
21,2%
7,8%
12,4%
14,4%
11,6%
8,3%
21,9%
4,4%
3,1%
7,4%
52,3%
9,2%
44,3%
26,4%
0% 10% 20% 30% 40% 50% 60% 70% 80% 90% 100%
Wapń
Żelazo
Cynk
Miedź
Potas
Sód
Magnez
Jod
Fosfor
Mangan
Produkty węglowodanowe - zbożowe, w tym kaszki / kleiki oraz ziemniaki Warzywa, owoce, w tym soki Mleko i przetwory mleczne, w tym z mleka modyfikowanego Mięso, wędliny, drób, ryby i jaja Tłuszcze Cukier i słodycze Inne produkty
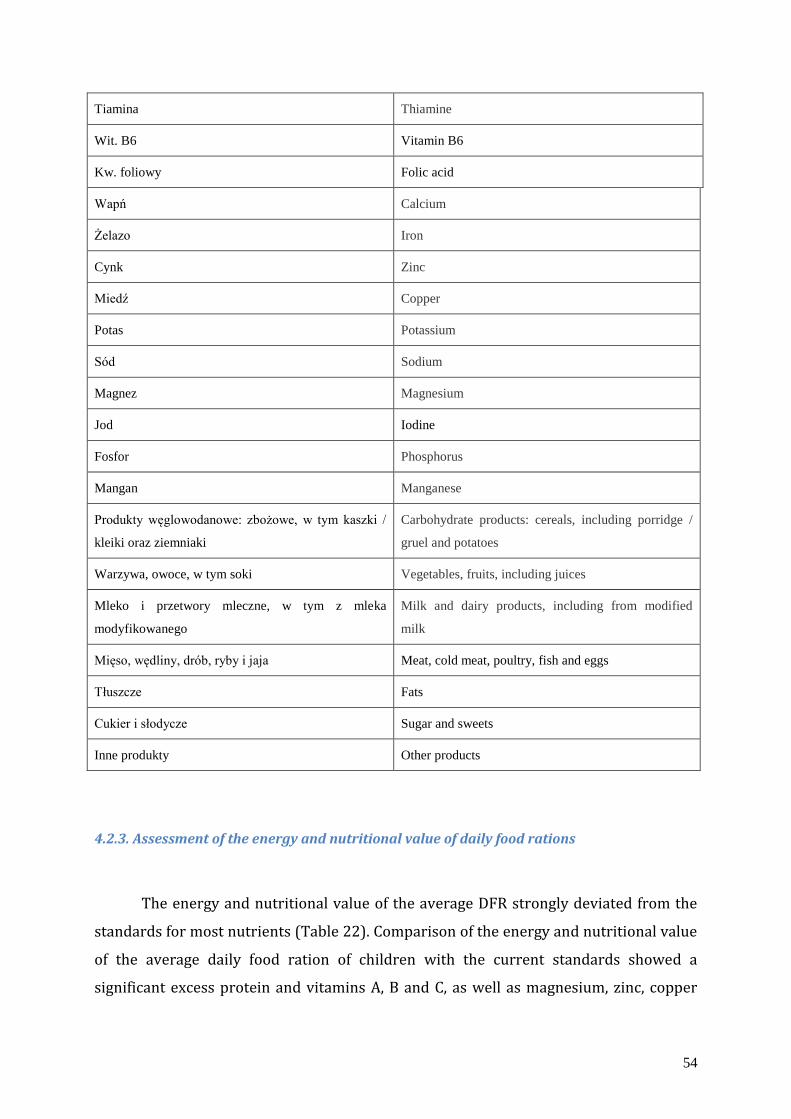
54
Tiamina Thiamine
Wit. B6 Vitamin B6
Kw. foliowy Folic acid
Wapń Calcium
Żelazo Iron
Cynk Zinc
Miedź Copper
Potas Potassium
Sód Sodium
Magnez Magnesium
Jod Iodine
Fosfor Phosphorus
Mangan Manganese
Produkty węglowodanowe: zbożowe, w tym kaszki /
kleiki oraz ziemniaki
Carbohydrate products: cereals, including porridge /
gruel and potatoes
Warzywa, owoce, w tym soki Vegetables, fruits, including juices
Mleko i przetwory mleczne, w tym z mleka
modyfikowanego
Milk and dairy products, including from modified
milk
Mięso, wędliny, drób, ryby i jaja Meat, cold meat, poultry, fish and eggs
Tłuszcze Fats
Cukier i słodycze Sugar and sweets
Inne produkty Other products
4.2.3. Assessment of the energy and nutritional value of daily food rations
The energy and nutritional value of the average DFR strongly deviated from the
standards for most nutrients (Table 22). Comparison of the energy and nutritional value
of the average daily food ration of children with the current standards showed a
significant excess protein and vitamins A, B and C, as well as magnesium, zinc, copper

55
and sodium. The diets of the children showed deficiency of vitamin D in relation to the
recommendations of the National Consultant in Paediatrics regarding the prevention of
rickets and osteoporosis 93,94. The amount of protein in the average DFR was threefold
higher in relation to the current standards. Similarly, the content of vitamin A, and
vitamins from group B (B2, B6, B12, PP), vitamin C, phosphorus, magnesium, zinc and
copper in the average food ration was twice - trice higher than in the standards. In the
total pool of energy the share of energy was as follows: 14.1±2.5% from protein,
28.9±5.2% from fat, 57.0±6.1% from carbohydrates. Such a significant share of energy
from protein, as well as sucrose (14.3 vs. 10% in standards) may contribute to excessive
weight gain in children 95-100. Figure 4 shows the comparison of the energy and
nutritional value in the average daily food ration of the studied children with the current
and previous nutritional standards, expressed as a percentage of their implementation.
The energy value and nutrient content in the average DFR of the studied children
significantly exceeded the current dietary standards (from 2008); the obtained results
were approximate to the previous recommendations (2001).
Table 22.
Energy and nutritive value of the average daily food ration (DFR) of the surveyed children
(n=400) aged 13-36 months A. Energy value and macronutrients
No. Energy value Nutrients
Units
Study results
Standards of 2008 (RDA)
Standards 2001 x SD me 1Q 3Q
1. Energy kcal 1217.5 331.8 1202.5 987.3 1400.8 1000 1000-1500
kJ 5103.5 1389.8 5042.4 4136.7 5872.6
2. Total protein animal protein
g 42.5 12.9 41.7 33.9 49.4 14 45
g 25.4 11.6 24.5 17.1 32.0
3. Total fat g 39.9 13.1 38.2 30.4 46.7 33-39 36-53
93 Dobrzańska A., Lukas W., Socha J., Wąsowska-Królikowska K., Chlebna-Sokół D., Milanowski A., Książyk J., Szymankiewicz M., Charzewska J., Czech-Kowalska J., Weker H.: Zalecenia Konsultanta Krajowego w dziedzinie Pediatrii dotyczące profilaktyki krzywicy i osteoporozy. Standardy Med. 2004, 1, 443-445 94 Dobrzańska A., Lukas W., Socha J., Wąsowska-Królikowska K., Chlebna-Sokół D., Milanowski A., Książyk J., Szymankiewicz M., Charzewska J., Czech-Kowalska J., Weker H. (2009): Polskie zalecenia dotyczące profilaktyki niedoborów witaminy D. Klinika Pediatryczna – Szkoła Pediatrii cz. 13, 2009., 17 (5), 5117-5120 95 Nader P.R., O’Brien M., Houts R., Bradley R., Belsky J., Crosnoe R., Friedman S., Mei Z., Susman E.J.: Identifying Risk for Obesity in Early Childhood. Pediatrics 2006, 118(3), 594-601 96 Fox M.K., Pac S., Devaney B., Jankowski L.: Feeding infants and toddlers study: what foods are infants and toddlers heating? J. Am. Diet. Assoc. 2004, 104, 22-30 97 Mennella J.A., Ziegler P., Briefel R., Novak T.: Feeding infants and toddlers study: the types of foods fed to Hispanic infants and toddlers. J. Am. Diet. Assoc. 2006, 106(1 Suppl 1), S96-106 98 Dennison B.A.: Fruit juice consumption by infants and children: a review. J. Am. Coll. Nutr. 1996, 15(5 Suppl), 4S-11S 99 Koletzko B., von Kries R., Closa R., Escribano J., Scaglioni S., Giovannini M., Beyer J., Demmelmair H., Gruszfeld D., Dobrzańska A., Sengier A., Langhendries J.P., Rolland Cachera M.F., Grote V.: Lower protein in infant formula is associated with Lower weight up to age 2 y: a randomized clinical trial. Am. J. Clin. Nutr. 2009, 89(6), 1836-1845 100 Olstad D.L., McCargar L.: Prevention of overweight and obesity in children under the age of 6 years. Appl. Physiol. Nutr. Metab. 2009, 34(4), 551-570
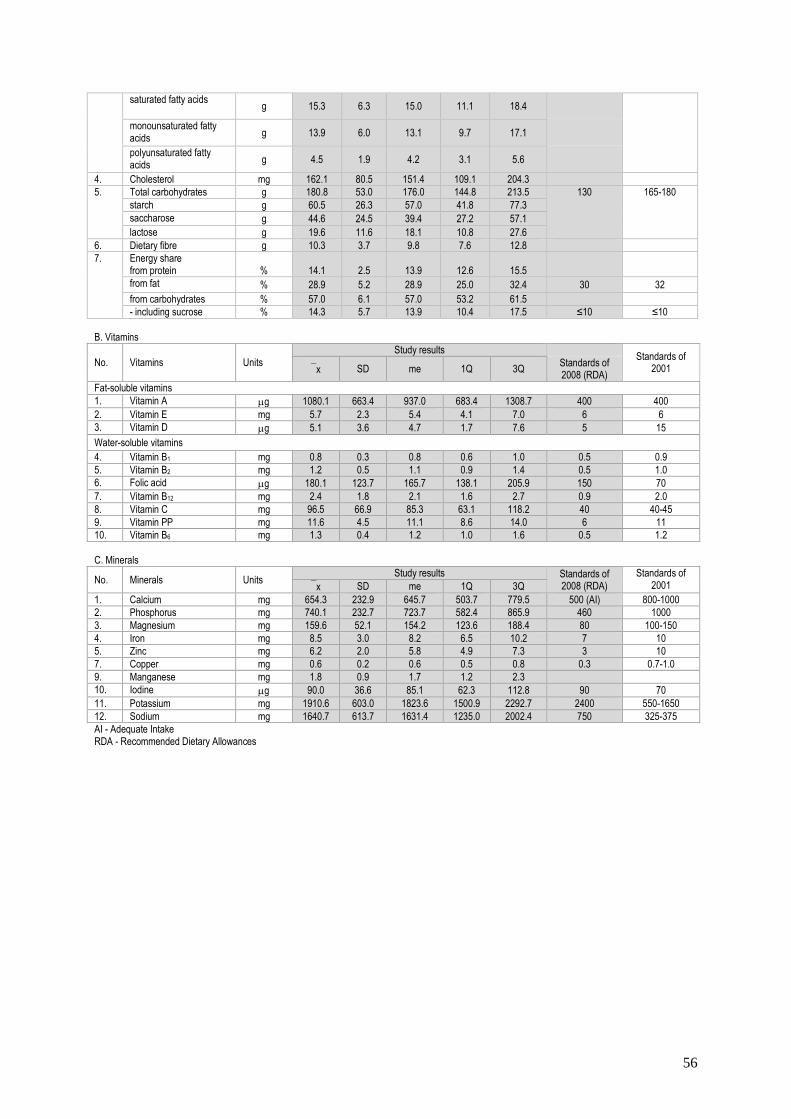
56
saturated fatty acids g 15.3 6.3 15.0 11.1 18.4
monounsaturated fatty acids
g 13.9 6.0 13.1 9.7 17.1
polyunsaturated fatty acids
g 4.5 1.9 4.2 3.1 5.6
4. Cholesterol mg 162.1 80.5 151.4 109.1 204.3
5. Total carbohydrates g 180.8 53.0 176.0 144.8 213.5 130 165-180
starch g 60.5 26.3 57.0 41.8 77.3
saccharose g 44.6 24.5 39.4 27.2 57.1
lactose g 19.6 11.6 18.1 10.8 27.6
6. Dietary fibre g 10.3 3.7 9.8 7.6 12.8
7. Energy share from protein % 14.1 2.5 13.9 12.6 15.5
from fat % 28.9 5.2 28.9 25.0 32.4 30 32
from carbohydrates % 57.0 6.1 57.0 53.2 61.5
- including sucrose % 14.3 5.7 13.9 10.4 17.5 ≤10 ≤10
B. Vitamins
No. Vitamins Units
Study results Standards of
2001 x SD me 1Q 3Q Standards of 2008 (RDA)
Fat-soluble vitamins
1. Vitamin A g 1080.1 663.4 937.0 683.4 1308.7 400 400
2. Vitamin E mg 5.7 2.3 5.4 4.1 7.0 6 6
3. Vitamin D g 5.1 3.6 4.7 1.7 7.6 5 15
Water-soluble vitamins
4. Vitamin B1 mg 0.8 0.3 0.8 0.6 1.0 0.5 0.9
5. Vitamin B2 mg 1.2 0.5 1.1 0.9 1.4 0.5 1.0
6. Folic acid g 180.1 123.7 165.7 138.1 205.9 150 70
7. Vitamin B12 mg 2.4 1.8 2.1 1.6 2.7 0.9 2.0
8. Vitamin C mg 96.5 66.9 85.3 63.1 118.2 40 40-45
9. Vitamin PP mg 11.6 4.5 11.1 8.6 14.0 6 11
10. Vitamin B6 mg 1.3 0.4 1.2 1.0 1.6 0.5 1.2
C. Minerals
No. Minerals Units Study results Standards of
2008 (RDA)
Standards of 2001 x SD me 1Q 3Q
1. Calcium mg 654.3 232.9 645.7 503.7 779.5 500 (AI) 800-1000
2. Phosphorus mg 740.1 232.7 723.7 582.4 865.9 460 1000
3. Magnesium mg 159.6 52.1 154.2 123.6 188.4 80 100-150
4. Iron mg 8.5 3.0 8.2 6.5 10.2 7 10
5. Zinc mg 6.2 2.0 5.8 4.9 7.3 3 10
7. Copper mg 0.6 0.2 0.6 0.5 0.8 0.3 0.7-1.0
9. Manganese mg 1.8 0.9 1.7 1.2 2.3
10. Iodine g 90.0 36.6 85.1 62.3 112.8 90 70
11. Potassium mg 1910.6 603.0 1823.6 1500.9 2292.7 2400 550-1650
12. Sodium mg 1640.7 613.7 1631.4 1235.0 2002.4 750 325-375
AI - Adequate Intake RDA - Recommended Dietary Allowances
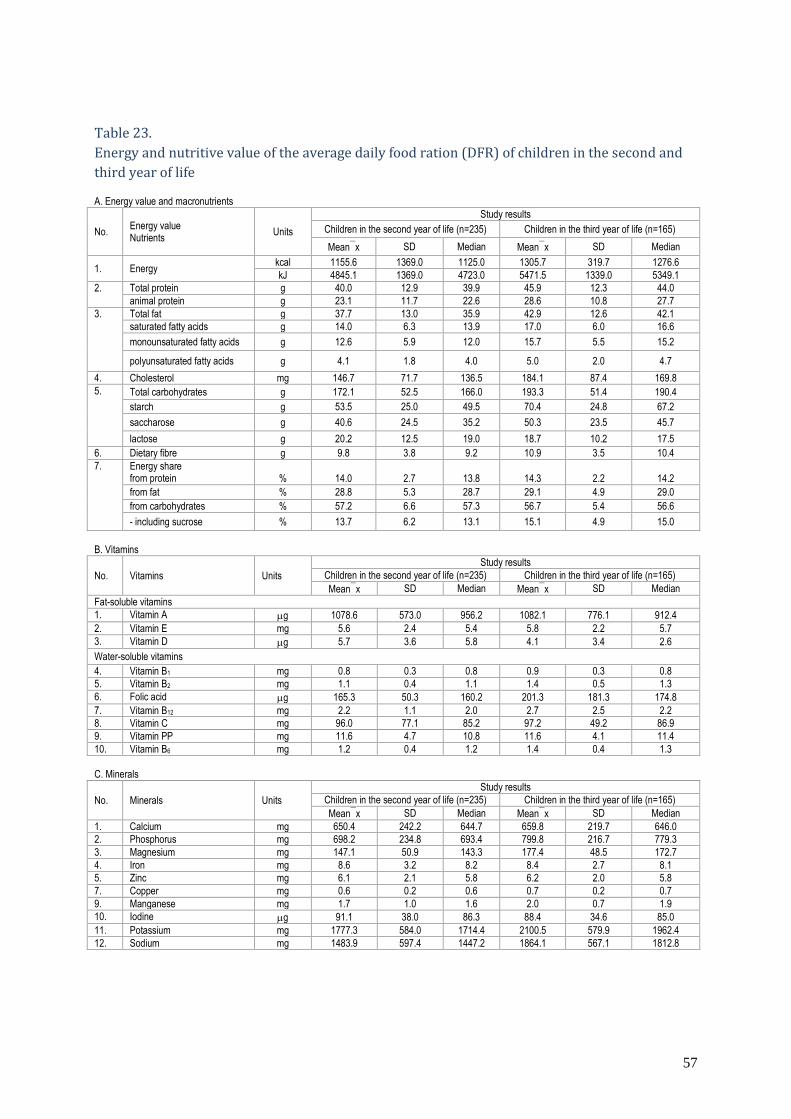
57
Table 23.
Energy and nutritive value of the average daily food ration (DFR) of children in the second and
third year of life A. Energy value and macronutrients
No. Energy value Nutrients
Units
Study results
Children in the second year of life (n=235) Children in the third year of life (n=165)
Meanx SD Median Meanx SD Median
1. Energy kcal 1155.6 1369.0 1125.0 1305.7 319.7 1276.6
kJ 4845.1 1369.0 4723.0 5471.5 1339.0 5349.1
2. Total protein g 40.0 12.9 39.9 45.9 12.3 44.0
animal protein g 23.1 11.7 22.6 28.6 10.8 27.7
3. Total fat g 37.7 13.0 35.9 42.9 12.6 42.1
saturated fatty acids g 14.0 6.3 13.9 17.0 6.0 16.6
monounsaturated fatty acids g 12.6 5.9 12.0 15.7 5.5 15.2
polyunsaturated fatty acids g 4.1 1.8 4.0 5.0 2.0 4.7
4. Cholesterol mg 146.7 71.7 136.5 184.1 87.4 169.8
5. Total carbohydrates g 172.1 52.5 166.0 193.3 51.4 190.4
starch g 53.5 25.0 49.5 70.4 24.8 67.2
saccharose g 40.6 24.5 35.2 50.3 23.5 45.7
lactose g 20.2 12.5 19.0 18.7 10.2 17.5
6. Dietary fibre g 9.8 3.8 9.2 10.9 3.5 10.4
7. Energy share from protein % 14.0 2.7 13.8 14.3 2.2 14.2
from fat % 28.8 5.3 28.7 29.1 4.9 29.0
from carbohydrates % 57.2 6.6 57.3 56.7 5.4 56.6
- including sucrose % 13.7 6.2 13.1 15.1 4.9 15.0
B. Vitamins
No. Vitamins Units
Study results
Children in the second year of life (n=235) Children in the third year of life (n=165)
Meanx SD Median Meanx SD Median
Fat-soluble vitamins
1. Vitamin A g 1078.6 573.0 956.2 1082.1 776.1 912.4
2. Vitamin E mg 5.6 2.4 5.4 5.8 2.2 5.7
3. Vitamin D g 5.7 3.6 5.8 4.1 3.4 2.6
Water-soluble vitamins
4. Vitamin B1 mg 0.8 0.3 0.8 0.9 0.3 0.8
5. Vitamin B2 mg 1.1 0.4 1.1 1.4 0.5 1.3
6. Folic acid g 165.3 50.3 160.2 201.3 181.3 174.8
7. Vitamin B12 mg 2.2 1.1 2.0 2.7 2.5 2.2
8. Vitamin C mg 96.0 77.1 85.2 97.2 49.2 86.9
9. Vitamin PP mg 11.6 4.7 10.8 11.6 4.1 11.4
10. Vitamin B6 mg 1.2 0.4 1.2 1.4 0.4 1.3
C. Minerals
No. Minerals Units
Study results
Children in the second year of life (n=235) Children in the third year of life (n=165)
Meanx SD Median Meanx SD Median
1. Calcium mg 650.4 242.2 644.7 659.8 219.7 646.0
2. Phosphorus mg 698.2 234.8 693.4 799.8 216.7 779.3
3. Magnesium mg 147.1 50.9 143.3 177.4 48.5 172.7
4. Iron mg 8.6 3.2 8.2 8.4 2.7 8.1
5. Zinc mg 6.1 2.1 5.8 6.2 2.0 5.8
7. Copper mg 0.6 0.2 0.6 0.7 0.2 0.7
9. Manganese mg 1.7 1.0 1.6 2.0 0.7 1.9
10. Iodine g 91.1 38.0 86.3 88.4 34.6 85.0
11. Potassium mg 1777.3 584.0 1714.4 2100.5 579.9 1962.4
12. Sodium mg 1483.9 597.4 1447.2 1864.1 567.1 1812.8
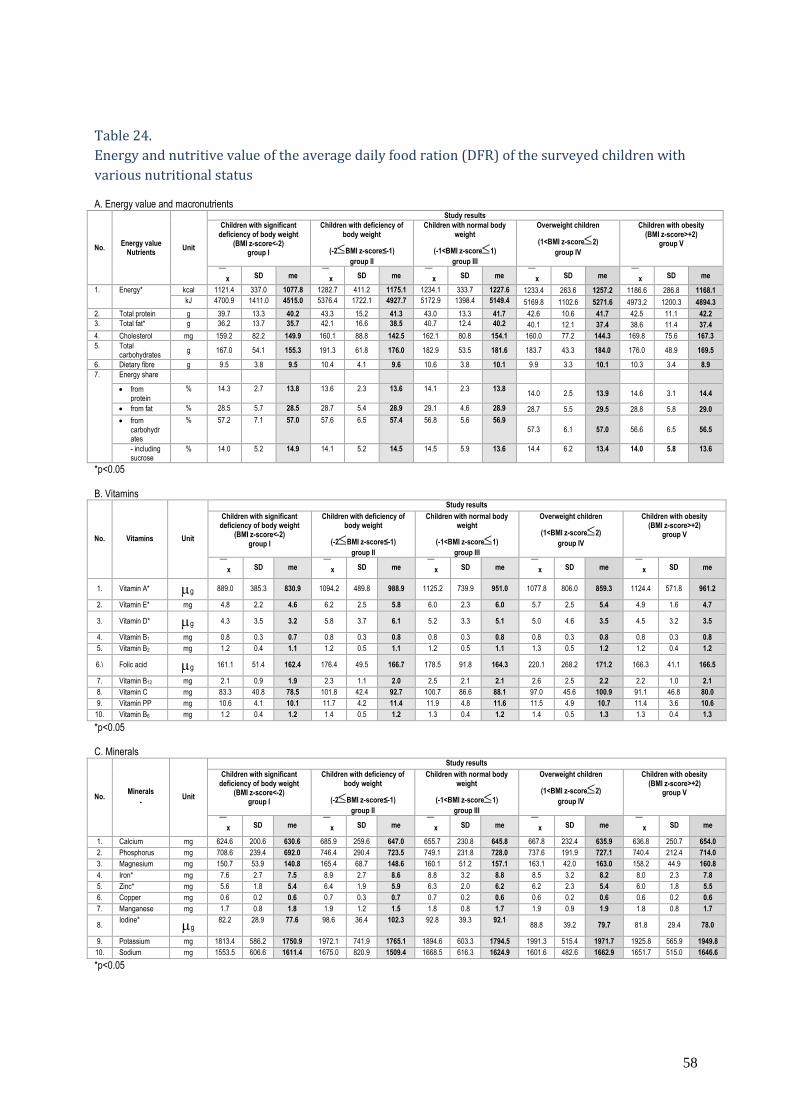
58
Table 24.
Energy and nutritive value of the average daily food ration (DFR) of the surveyed children with
various nutritional status A. Energy value and macronutrients
No. Energy value
Nutrients Unit
Study results
Children with significant deficiency of body weight
(BMI z-score<-2) group I
Children with deficiency of body weight
(-2BMI z-score≤-1)
group II
Children with normal body weight
(-1<BMI z-score1)
group III
Overweight children
(1<BMI z-score2)
group IV
Children with obesity (BMI z-score>+2)
group V
x SD me x SD me x SD me x SD me x SD me
1. Energy* kcal 1121.4 337.0 1077.8 1282.7 411.2 1175.1 1234.1 333.7 1227.6 1233.4 263.6 1257.2 1186.6 286.8 1168.1
kJ 4700.9 1411.0 4515.0 5376.4 1722.1 4927.7 5172.9 1398.4 5149.4 5169.8 1102.6 5271.6 4973.2 1200.3 4894.3
2. Total protein g 39.7 13.3 40.2 43.3 15.2 41.3 43.0 13.3 41.7 42.6 10.6 41.7 42.5 11.1 42.2
3. Total fat* g 36.2 13.7 35.7 42.1 16.6 38.5 40.7 12.4 40.2 40.1 12.1 37.4 38.6 11.4 37.4
4. Cholesterol mg 159.2 82.2 149.9 160.1 88.8 142.5 162.1 80.8 154.1 160.0 77.2 144.3 169.8 75.6 167.3
5. Total carbohydrates
g 167.0 54.1 155.3 191.3 61.8 176.0 182.9 53.5 181.6 183.7 43.3 184.0 176.0 48.9 169.5
6. Dietary fibre g 9.5 3.8 9.5 10.4 4.1 9.6 10.6 3.8 10.1 9.9 3.3 10.1 10.3 3.4 8.9
7. Energy share
from protein
% 14.3 2.7 13.8 13.6 2.3 13.6 14.1 2.3 13.8 14.0 2.5 13.9 14.6 3.1 14.4
from fat % 28.5 5.7 28.5 28.7 5.4 28.9 29.1 4.6 28.9 28.7 5.5 29.5 28.8 5.8 29.0
from carbohydrates
% 57.2 7.1 57.0 57.6 6.5 57.4 56.8 5.6 56.9
57.3 6.1 57.0 56.6 6.5 56.5
- including sucrose
% 14.0 5.2 14.9 14.1 5.2 14.5 14.5 5.9 13.6 14.4 6.2 13.4 14.0 5.8 13.6
*p<0.05 B. Vitamins
No. Vitamins Unit
Study results
Children with significant deficiency of body weight
(BMI z-score<-2) group I
Children with deficiency of body weight
(-2BMI z-score≤-1)
group II
Children with normal body weight
(-1<BMI z-score1)
group III
Overweight children
(1<BMI z-score2)
group IV
Children with obesity (BMI z-score>+2)
group V
x SD me x SD me x SD me x SD me x SD me
1. Vitamin A* g 889.0 385.3 830.9 1094.2 489.8 988.9 1125.2 739.9 951.0 1077.8 806.0 859.3 1124.4 571.8 961.2
2. Vitamin E* mg 4.8 2.2 4.6 6.2 2.5 5.8 6.0 2.3 6.0 5.7 2.5 5.4 4.9 1.6 4.7
3. Vitamin D* g 4.3 3.5 3.2 5.8 3.7 6.1 5.2 3.3 5.1 5.0 4.6 3.5 4.5 3.2 3.5
4. Vitamin B1 mg 0.8 0.3 0.7 0.8 0.3 0.8 0.8 0.3 0.8 0.8 0.3 0.8 0.8 0.3 0.8
5. Vitamin B2 mg 1.2 0.4 1.1 1.2 0.5 1.1 1.2 0.5 1.1 1.3 0.5 1.2 1.2 0.4 1.2
6.\ Folic acid g 161.1 51.4 162.4 176.4 49.5 166.7 178.5 91.8 164.3 220.1 268.2 171.2 166.3 41.1 166.5
7. Vitamin B12 mg 2.1 0.9 1.9 2.3 1.1 2.0 2.5 2.1 2.1 2.6 2.5 2.2 2.2 1.0 2.1
8. Vitamin C mg 83.3 40.8 78.5 101.8 42.4 92.7 100.7 86.6 88.1 97.0 45.6 100.9 91.1 46.8 80.0
9. Vitamin PP mg 10.6 4.1 10.1 11.7 4.2 11.4 11.9 4.8 11.6 11.5 4.9 10.7 11.4 3.6 10.6
10. Vitamin B6 mg 1.2 0.4 1.2 1.4 0.5 1.2 1.3 0.4 1.2 1.4 0.5 1.3 1.3 0.4 1.3
*p<0.05 C. Minerals
No. Minerals
- Unit
Study results
Children with significant deficiency of body weight
(BMI z-score<-2) group I
Children with deficiency of body weight
(-2BMI z-score≤-1)
group II
Children with normal body weight
(-1<BMI z-score1)
group III
Overweight children
(1<BMI z-score2)
group IV
Children with obesity (BMI z-score>+2)
group V
x SD me x SD me x SD me x SD me x SD me
1. Calcium mg 624.6 200.6 630.6 685.9 259.6 647.0 655.7 230.8 645.8 667.8 232.4 635.9 636.8 250.7 654.0
2. Phosphorus mg 708.6 239.4 692.0 746.4 290.4 723.5 749.1 231.8 728.0 737.6 191.9 727.1 740.4 212.4 714.0
3. Magnesium mg 150.7 53.9 140.8 165.4 68.7 148.6 160.1 51.2 157.1 163.1 42.0 163.0 158.2 44.9 160.8
4. Iron* mg 7.6 2.7 7.5 8.9 2.7 8.6 8.8 3.2 8.8 8.5 3.2 8.2 8.0 2.3 7.8
5. Zinc* mg 5.6 1.8 5.4 6.4 1.9 5.9 6.3 2.0 6.2 6.2 2.3 5.4 6.0 1.8 5.5
6. Copper mg 0.6 0.2 0.6 0.7 0.3 0.7 0.7 0.2 0.6 0.6 0.2 0.6 0.6 0.2 0.6
7. Manganese mg 1.7 0.8 1.8 1.9 1.2 1.5 1.8 0.8 1.7 1.9 0.9 1.9 1.8 0.8 1.7
8. Iodine*
g 82.2 28.9 77.6 98.6 36.4 102.3 92.8 39.3 92.1
88.8 39.2 79.7 81.8 29.4 78.0
9. Potassium mg 1813.4 586.2 1750.9 1972.1 741.9 1765.1 1894.6 603.3 1794.5 1991.3 515.4 1971.7 1925.8 565.9 1949.8
10. Sodium mg 1553.5 606.6 1611.4 1675.0 820.9 1509.4 1668.5 616.3 1624.9 1601.6 482.6 1662.9 1651.7 515.0 1646.6
*p<0.05
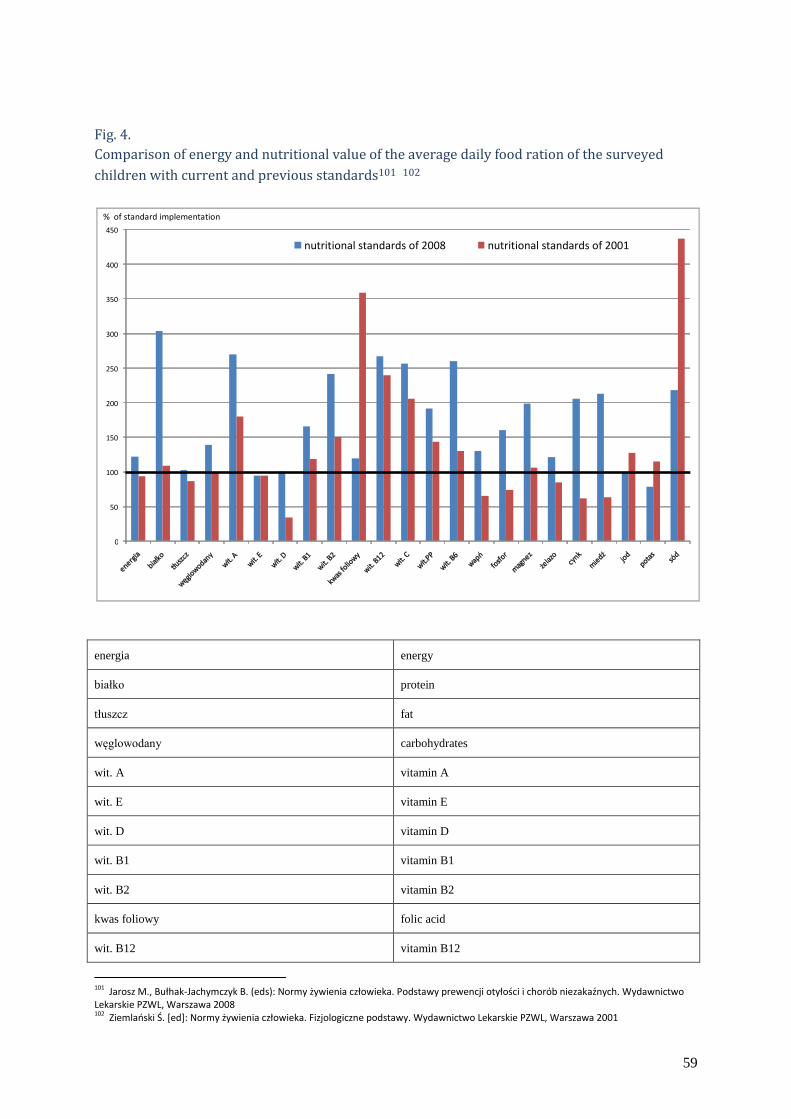
59
Fig. 4.
Comparison of energy and nutritional value of the average daily food ration of the surveyed
children with current and previous standards101 102
energia energy
białko protein
tłuszcz fat
węglowodany carbohydrates
wit. A vitamin A
wit. E vitamin E
wit. D vitamin D
wit. B1 vitamin B1
wit. B2 vitamin B2
kwas foliowy folic acid
wit. B12 vitamin B12
101 Jarosz M., Bułhak-Jachymczyk B. (eds): Normy żywienia człowieka. Podstawy prewencji otyłości i chorób niezakaźnych. Wydawnictwo Lekarskie PZWL, Warszawa 2008 102 Ziemlański Ś. [ed]: Normy żywienia człowieka. Fizjologiczne podstawy. Wydawnictwo Lekarskie PZWL, Warszawa 2001
0
50
100
150
200
250
300
350
400
450 nutritional standards of 2008 nutritional standards of 2001
% of standard implementation
60
wit. C vitamin C
wit. PP vitamin PP
wit. B6 vitamin B6
wapń calcium
fosfor phosphorus
magnez magnesium
żelazo iron
cynk zinc
miedź copper
jod iodine
potas potassium
sód sodium
The analysis of the implementation of nutritional standards of 2008 in the
surveyed population of children is shown in Figure 5.

61
Fig. 5.
The analysis of the implementation of nutritional standards103 in the surveyed population of
children
A. Macronutrients
Dietary fibre* - according to medical standard104
B. Distribution of energy pool
103 Jarosz M., Bułhak-Jachymczyk B. (eds): Normy żywienia człowieka. Podstawy prewencji otyłości i chorób niezakaźnych. Wydawnictwo Lekarskie PZWL, Warszawa 2008 104 Dobrzańska A., Czerwionka-Szaflarska M., Kunachowicz H., Książyk J., Lukas W., Ryżko J., Socha J., Stolarczyk A., Szajewska H., Wąsowska-Królikowska K., Weker H.: Zalecenia dotyczące żywienia dzieci zdrowych w wieku 1-3 lata (13-36 miesięcy) opracowane przez zespół ekspertów powołany przez konsultanta krajowego ds. pediatrii. Pediatr. Pol. 2008, 82(1), 93-95
7,5%
32,5%
4,8%
52,0%
42,3%
0,5%
19,5%
31,5%
37,3%
50,3%
99,5%
48,0%
63,8%
10,8%
0% 10% 20% 30% 40% 50% 60% 70% 80% 90% 100%
Energy
Total protein
Fat
Total
carbohydrates
Dietary fibre*
below standard standard above standard
Nutritional recommendations/
medical standard*
1000 kcal ± 10%
25 - 30 g
33 - 39 g
130 g ± 10%
10 - 15 g*
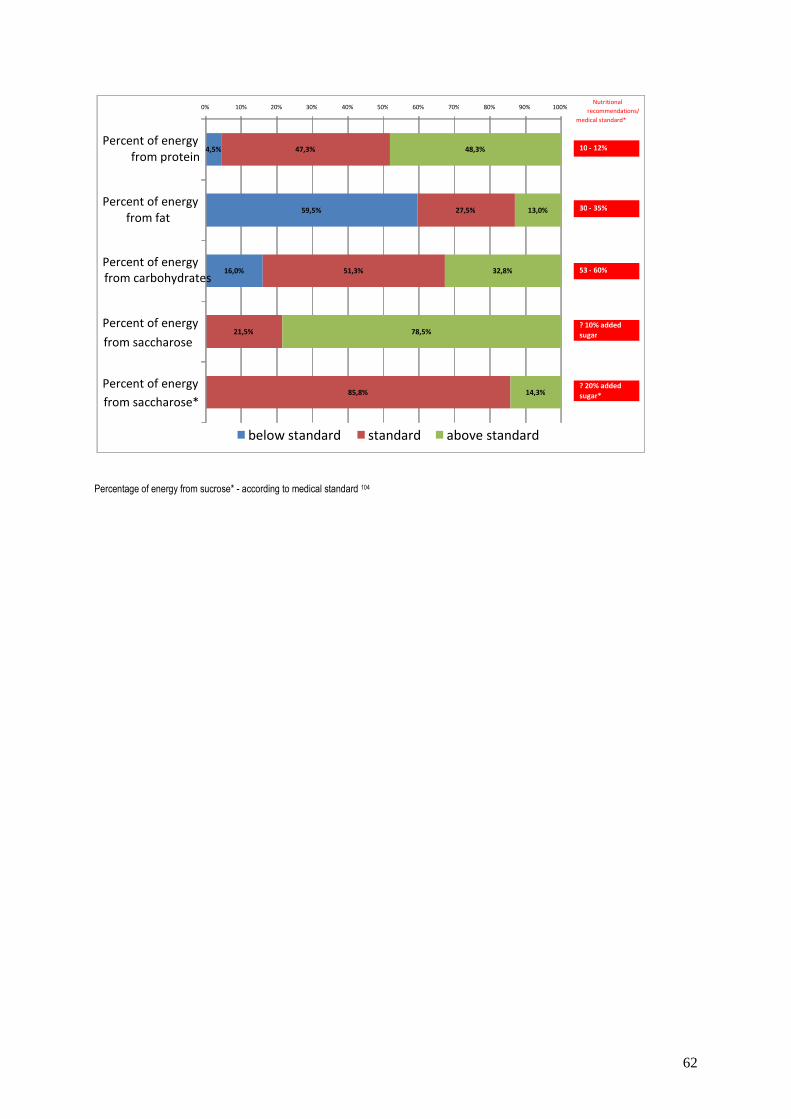
62
Percentage of energy from sucrose* - according to medical standard 104
4,5%
59,5%
16,0%
47,3%
27,5%
51,3%
21,5%
85,8%
48,3%
13,0%
32,8%
78,5%
14,3%
0% 10% 20% 30% 40% 50% 60% 70% 80% 90% 100%
Percent of energy from protein
Percent of energy from fat
Percent of energy from carbohydrates
Percent of energy
from saccharose
Percent of energy
from saccharose*
below standard standard above standard
Nutritional recommendations/
medical standard*
10 - 12%
30 - 35%
53 - 60%
? 10% added sugar
? 20% added sugar*

63
C. Vitamins
Vitamin D* - according to medical standard 105
D. Minerals
Calcium* - according to medical standard 105
105 Dobrzańska A., Czerwionka-Szaflarska M., Kunachowicz H., Książyk J., Lukas W., Ryżko J., Socha J., Stolarczyk A., Szajewska H., Wąsowska-Królikowska K., Weker H.: Zalecenia dotyczące żywienia dzieci zdrowych w wieku 1-3 lata (13-36 miesięcy) opracowane przez zespół ekspertów powołany przez konsultanta krajowego ds. pediatrii. Pediatr. Pol. 2008, 82(1), 93-95
57,0%
18,8%
77,3%
4,0%
15,3%
34,8%
7,8%
35,5%
13,3%
14,8%
17,5%
12,0%
37,3%
6,5%
6,3%
35,5%
89,8%
7,5%
68,0%
8,0%
78,5%
86,5%
47,5%
93,3%
93,0%
29,8%
0% 10% 20% 30% 40% 50% 60% 70% 80% 90% 100%
Sodium
Potassium
Calcium
Calcium*
Phosphorus
Magnesium
Iron
Zinc
Copper
Iodine
below standard standard above standard
Nutritional recommendations/
medical standard* 750 mg ± 10%
2400 mg ± 10%
800 - 1000 mg *
500 mg ± 10%
460 mg ± 10%
80 mg ± 10%
7 mg ± 10%
3 mg ± 10%
0,3 mg ± 10%
90 µg ± 10%
39,3%
2,8%
2,8%
4,0%
13,8%
47,0%
80,0%
8,3%
39,3%
20,3%
4,0%
12,0%
2,5%
7,5%
48,8%
3,8%
10,0%
15,8%
91,0%
21,5%
77,0%
95,3%
85,3%
97,3%
88,5%
37,5%
94,8%
43,0%
4,3%
0% 10% 20% 30% 40% 50% 60% 70% 80% 90% 100%
Vitamin A
Vitamin E
Thiamine
Riboflavin
Niacin
Vitamin B6
Vitamin C
Folates
Vitamin B12
Vitamin D
Vitamin D*
below standard standard above standard
Nutritional recommendations/
medical standard* 400 µg ± 10%
6 mg ± 10%
0,5 mg ± 10%
0,5 mg ± 10%
6 mg ± 10%
0,5 mg ± 10%
40 mg ± 10%
150 µg ± 10%
0,9 mg ± 10%
5 µg ± 10%
10 µg ± 10%
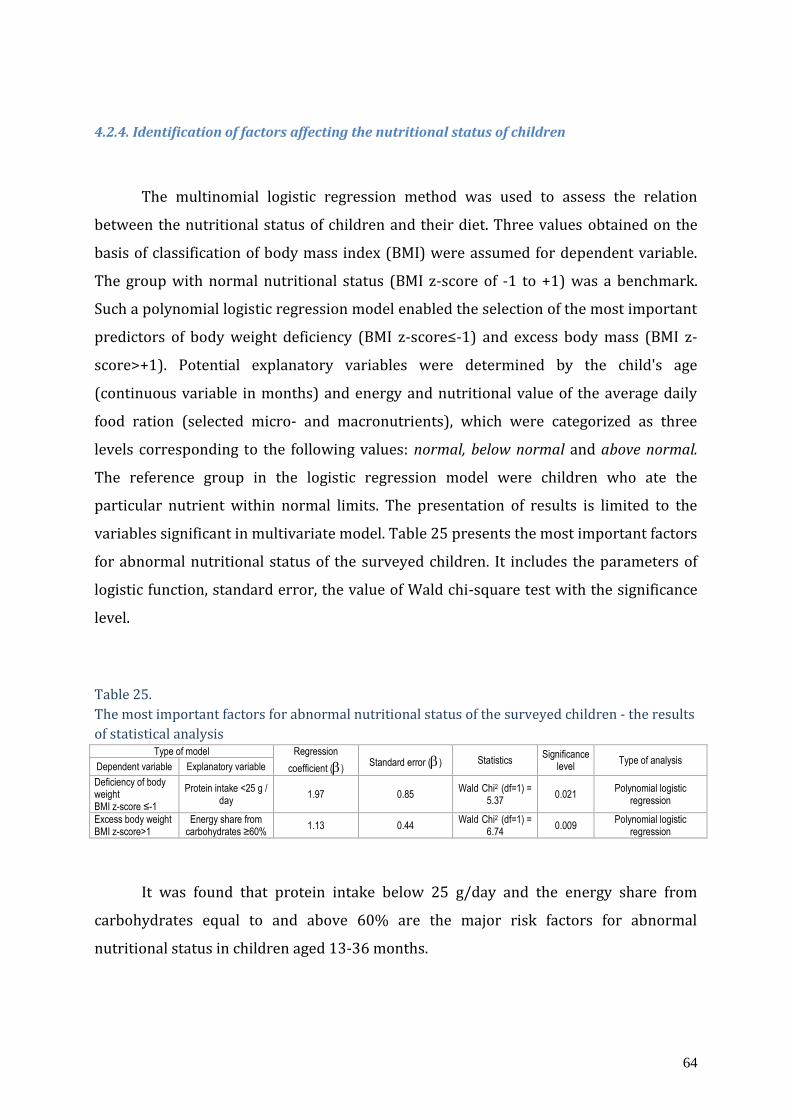
64
4.2.4. Identification of factors affecting the nutritional status of children
The multinomial logistic regression method was used to assess the relation
between the nutritional status of children and their diet. Three values obtained on the
basis of classification of body mass index (BMI) were assumed for dependent variable.
The group with normal nutritional status (BMI z-score of -1 to +1) was a benchmark.
Such a polynomial logistic regression model enabled the selection of the most important
predictors of body weight deficiency (BMI z-score≤-1) and excess body mass (BMI z-
score>+1). Potential explanatory variables were determined by the child's age
(continuous variable in months) and energy and nutritional value of the average daily
food ration (selected micro- and macronutrients), which were categorized as three
levels corresponding to the following values: normal, below normal and above normal.
The reference group in the logistic regression model were children who ate the
particular nutrient within normal limits. The presentation of results is limited to the
variables significant in multivariate model. Table 25 presents the most important factors
for abnormal nutritional status of the surveyed children. It includes the parameters of
logistic function, standard error, the value of Wald chi-square test with the significance
level.
Table 25.
The most important factors for abnormal nutritional status of the surveyed children - the results
of statistical analysis Type of model Regression
coefficient () Standard error () Statistics
Significance level
Type of analysis Dependent variable Explanatory variable
Deficiency of body weight BMI z-score ≤-1
Protein intake <25 g / day
1.97 0.85 Wald Chi2 (df=1) =
5.37 0.021
Polynomial logistic regression
Excess body weight BMI z-score>1
Energy share from carbohydrates ≥60%
1.13 0.44 Wald Chi2 (df=1) =
6.74 0.009
Polynomial logistic regression
It was found that protein intake below 25 g/day and the energy share from
carbohydrates equal to and above 60% are the major risk factors for abnormal
nutritional status in children aged 13-36 months.
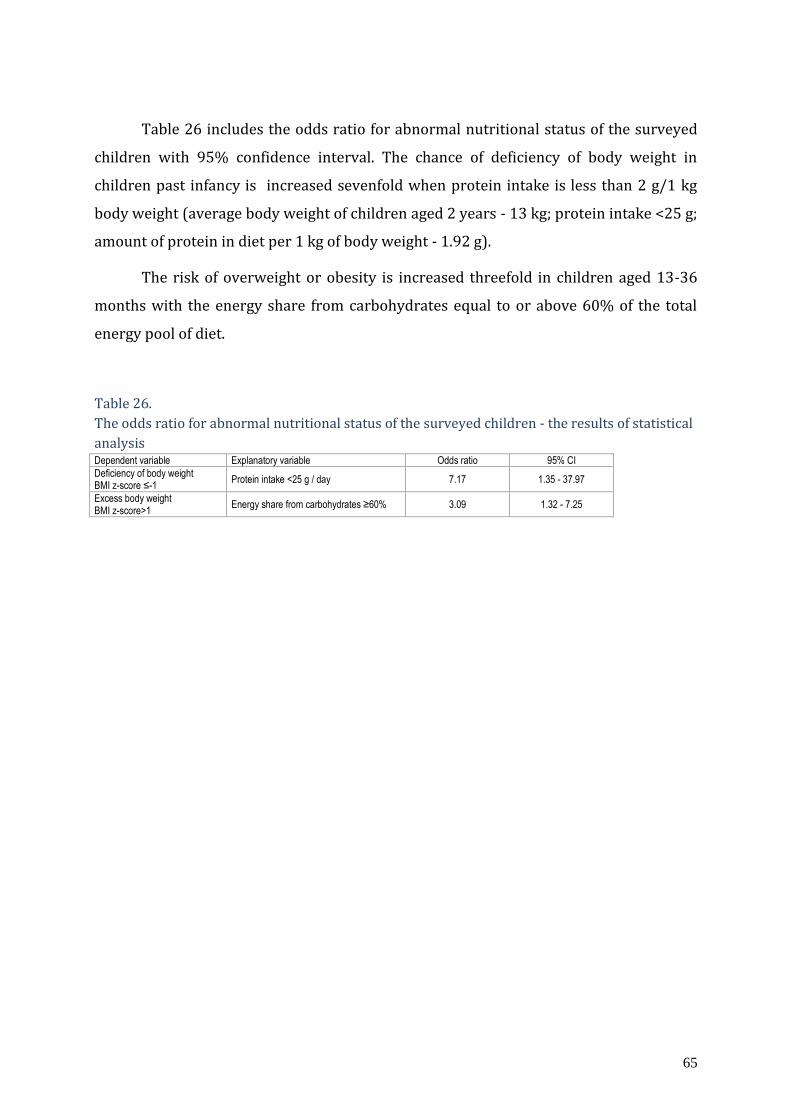
65
Table 26 includes the odds ratio for abnormal nutritional status of the surveyed
children with 95% confidence interval. The chance of deficiency of body weight in
children past infancy is increased sevenfold when protein intake is less than 2 g/1 kg
body weight (average body weight of children aged 2 years - 13 kg; protein intake <25 g;
amount of protein in diet per 1 kg of body weight - 1.92 g).
The risk of overweight or obesity is increased threefold in children aged 13-36
months with the energy share from carbohydrates equal to or above 60% of the total
energy pool of diet.
Table 26.
The odds ratio for abnormal nutritional status of the surveyed children - the results of statistical
analysis Dependent variable Explanatory variable Odds ratio 95% CI
Deficiency of body weight BMI z-score ≤-1
Protein intake <25 g / day 7.17 1.35 - 37.97
Excess body weight BMI z-score>1
Energy share from carbohydrates ≥60% 3.09 1.32 - 7.25
66
IV. Summary and Conclusions
The results of work of many authors confirm the significant relations between the
diet of children and their nutritional status 106-120. There are also reports indicating that
feeding behaviours are shaped already during the early childhood. 121-125 Therefore, a
properly targeted nutrition not only affects the child's healthy psychosomatic
development, but it can also be one of the major factors in reducing the risk of diet-
related diseases in adulthood.
The results of individual studies on the nutritional status and diet of children in
the first year of life, the diet of children aged 1-18 years and group of children aged 4
years, as well as the results of assessment of the nutrition in infants and young children
106 Baird J., Fisher D., Lucas P., Kleijnen J., Roberts H., Law C.: Being big or growing fast: systematic review of size and growth in infancy and later obesity. BMJ 2005 331(7522), 929 107 Barlow S.E., Expert Committee: Expert Committee recommendations regarding the prevention, assessment, and treatment of child and adolescent overweight and obesity: summary report. Pediatrics 2007, 120(Supp 4), S164-S192 108 Charzewska J., Weker H.: Ogólnopolskie badanie nad zawartością wapnia i witaminy D w dietach dzieci w wieku 4 lat. Pediatr. Współ. Gastroenterol., Hepatol. Żyw. Dziecka 2006, 8 (2), 107-109 109 Burdette H.L., Whitaker R.C., Hall W.C., Daniels S.R.: Breastfeeding, introduction of complementary foods, and adiposity at 5 y of age. Am. J. Clin. Nutr. 2006, 83(3), 550-558 110 Benjamin S.E., Rifas-Shiman S.L., Taveras E.M., Haines J., Finkelstein J., Kleinman K., Gillman M.W.: Early child care and adiposity at ages 1 and 3 years. Pediatrics 2009, 124(2), 555-562 111 Cope M.B., Allison D.B.: Critical review of the World Health Organization’s (WHO) 2007 report on ‘evidence of the long-term effects of breastfeeding: systematic reviews and meta-analysis’ with respect to obesity. Obes. Rev. 2008, 9(6), 594-605 112 Dennison B.A., Edmunds L.S., Stratton H.H., Pruzek R.M.: Rapid infant weight gain predicts childhood overweight. Obesity (Silver Spring) 2006, 14(3), 491-499 113 Howarth N.C., Huang T.T., Roberts S.B., McCrory M.A.: Dietary fibre and fat are associated with excess weight in young and middle-aged US adults. J. Am. Diet. Assoc. 2005, 105(9), 1365-1372 114 Weker H.: Badanie nad powiązaniem czynnika żywieniowego z otyłością prostą u dzieci. Med. Wieku Rozw. 2006, 1(1), X 115 Koletzko B., von Kries R., Closa R., Escribano J., Scaglioni S., Giovannini M., Beyer J., Demmelmair H., Gruszfeld D., Dobrzańska A., Sengier A., Langhendries J.P., Rolland Cachera M.F., Grote V.: Lower protein in infant formula is associated with Lower weight up to age 2 y: a randomized clinical trial. Am. J. Clin. Nutr. 2009, 89(6), 1836-1845 116 Pan Y., Pratt C.A.: Metabolic syndrome and its association with diet and physical activity in US adolescents. J. Am. Diet. Assoc. 2008, 108(2), 276-286 117 Welsh J.A., Cogswell M.E., Rogers S., Rockett H., Mei Z., Grummer-Strawn L.M.: Overweight among low-income preschool children associated with the consumption of sweet drinks: Missouri, 1999-2002. Pediatrics 2005, 115(2), e223-e229 118 Gleason P.M., Dodd A.H.: School breakfast program but not school lunch program participation is associated with lower body mass index. J. Am. Diet. Assoc. 2009, 109(2 Suppl), S118-128 119 Barton B.A., Eldridge A.L., Thompson D., Affenito S.G., Striegel-Moore R.H., Franko D.L., Albertson A.M., Crockett S.J.: The relationship of breakfast and cereal consumption to nutrient intake and body mass index. The National Heart, Lung, and Blood Institute Growth and Health Study. J. Am. Diet. Assoc. 2005, 105(9), 1383-1389 120 Taveras E.M., Berkey C.S., Rifas-Shiman S.L., Ludwig D.S., Rockett H.R., Field A.E., Colditz G.A., Gillman M.W.: Association of consumption of fried food away from home with body mass index and diet quality in older children and adolescents. Pediatrics 2005, 116(4), e518-e524 121 Birch L.L., Fisher J.O.: Appetite and eating behavior in children. Pediatr. Clin. N. Am. 1995, 42(4), 931-951 122 ESPGHAN Committee on Nutrition. Breast-feeding: A Commentary by the ESPGHAN Committee on Nutrition. J. Pediatr. Gastroenterol. Nutr. 2009, 49(1), 112-125 123 ESPGHAN Committee on Nutrition. Complementary Feeding: A Commentary by the ESPGHAN Committee on Nutrition Medical Position Paper. J. Pediatr. Gastroenterol. Nutr. 2008, 46(1), 99-110 124 European Food Safety Authority. Scientific opinion on the appropriate age for introduction of complementary feeding in infants. EFSA Journal 2009, 7, 1-38 125 European Network for Public Health Nutrition: Networking, Monitoring, Intervention and Training (EUNUTNET). Infant and young child feeding: standard recommendations for European Union. European Commission, Directorate Public Health and Risk Assessment, Luxemburg, 2006
67
are known in Poland 126-131. The authors of the above-cited studies demonstrated the
unfavourable trends and practical difficulties in expanding children's diets, improper
product selection, lack of nutritional balance, and the effect of diet on child's nutritional
status, including excess or deficiency of body weight.
The conducted study shows that the energy and nutritional value of diets of
children aged 13-36 months varied and differed from the current nutritional standards
(adopted in 2008 132), especially for energy and protein, as well as vitamin A and
vitamins of group B. The same results compared with the nutritional standards of 2001
133, 134 very clearly indicate that the diets of children in this age range were better
balanced (Fig. 4). The studies assessing the nutrition of children (n = 1692) conducted in
2008 on children in nurseries in Warsaw obtained results comparable to the ones in this
report in relation to the past and current nutritional standards135.
The question is therefore how to assess the obtained data, since the nutritional
status of 45.5% of children indicates their proper nutrition, 27.0% of children have
deficiencies, including significant deficiency of body weight, and 27.5% of children have
excess body weight. Verification of nutritional standards for children may be an attempt
to answer that question.
126 Szponar L., Rychlik E., Ołtarzewski M.: Badania indywidualnego spożycia żywności i stanu odżywienia w gospodarstwach domowych, Works of NFNI 101, Warszawa 2003. 127 Szponar L., Sekuła W., Rychlik E., Ołtarzewski M., Figurska K.: Badania indywidualnego spożycia żywności i stanu odżywienia w gospodarstwach domowych. Prace Instytut Żywności i Żywienia, Warszawa 2003 128 Weker H., Hamułka J., Więch M., Głowacka K.: Analysis of nutrition of children in Warsaw day nurseries in view of current recommendations. Journal of Pre-Clinical and Clinical Research 2010, 4(1), 063-067 129 Charzewska J., Weker H.: Ogólnopolskie badanie nad zawartością wapnia i witaminy D w dietach dzieci w wieku 4 lat. Pediatr. Współ. Gastroenterol., Hepatol. Żyw. Dziecka 2006, 8 (2), 107-109 130 Zagórecka E., Motkowski R., Stolarczyk A., Socha P., Piotrowska-Jastrzębska J., Socha J.: Realizacja zaleceń żywienia uzupełniającego w grupie niemowląt uczestniczących w projekcie „Nawyki żywieniowe a stan odżywienia niemowląt w Polsce”. Pediatr. Pol. 2008, 83(2), 136-149 131 Weker H., Barańska M., Riahi A.: Problemy matek dotyczące żywienia uzupełniającego u niemowląt karmionych piersią. Pediatr. Pol. 2008, 83(6), 682-686 132 Jarosz M., Bułhak-Jachymczyk B. (eds): Normy żywienia człowieka. Podstawy prewencji otyłości i chorób niezakaźnych. Wydawnictwo Lekarskie PZWL, Warszawa 2008 133 Ziemlański Ś. [ed]: Normy żywienia człowieka. Fizjologiczne podstawy. Wydawnictwo Lekarskie PZWL, Warszawa 2001 134 Szotowa W., Socha J., Charzewska J., Dłużniewska K., Jabłoński E., Kunachowicz H. et al.: Dzienne zalecenia żywieniowe dla dzieci i młodzieży. Pediatr. Pol. 1995; 71: 1-12 135 Weker H., Hamułka J., Więch M., Głowacka K.: Analysis of nutrition of children in Warsaw day nurseries in view of current recommendations. Journal of Pre-Clinical and Clinical Research 2010, 4(1), 063-067
68
In summary:
Diet of children aged 13-36 months varied in relation to the current
nutritional recommendations, and did not raise any objections in 45.5% of
children.
The average daily food ration of the studied children differed from model food
ration for this age group.
The source of nutrients in the diets of children was food from various product
groups, including the group of foodstuffs for particular nutritional use.
The average daily food rations of the studied children had improper share of
essential nutrients, especially protein, in relation to the nutritional standards,
which in the long term may result in the risk of diseases, including diet-
related.
The content of vitamins and minerals in diets of the studied children
significantly exceeded the nutritional standards (2008); thus, there is a need
to modify the addition of these substances to food for the youngest children.
Verification of the current nutritional recommendations and nutritional
standards in relation to diet of children aged 13-36 months and their
promotion is justified.

69
Conclusions:
1. Family and environmental factors (education of parents, place of
residence) have an impact on nutritional status and diet of children aged
13-36 months.
2. The nutritional status of 45.5% of children was correct, while 27.5% of
children had excess body weight, and 27% of them - deficiency of body
weight, which requires an in-depth analysis of the causes of these
irregularities.
3. Among the analysed dietary factors, two were found to be associated with
the risk of eating disorders in children aged 1-3 years:
the risk of deficiency of body weight in children aged 13-36 months
is associated with protein intake below 25 g/day;
the risk of overweight and obesity in children of the same age is
associated with the share of energy from carbohydrates above 60%
of the total energy pool of diet.
4. Nutritional patterns were dependent on the age of children and differed
significantly in the selection of products and nutritional value of the
average daily food rations.
70
V. Suggestions regarding solutions for the implementation of
nutritional recommendations for children aged 13-36 months
The report shows that only 45.5% of the studied children had correct nutritional
status. Therefore, there is an existing problem of nutrition in the group of children with
deficiencies and excess body weight, who are a group potentially at risk of developing
various diseases, including diet-related.
It is therefore necessary to:
1. continuously monitor the nutritional status and diet of children aged 13-
36 months in paediatric clinics, including rapid intervention of doctors
looking after children, aimed at normalization of the body weight;
2. make mothers/parents/guardians aware of the importance of proper diet
of children in terms of investment in their health through responsible
media (TV, radio, newspapers) and/or educational programs;
3. oblige the food industry that produces foodstuffs for particular nutritional
use for infants and young children to modify the composition of these
products in terms of both quantity and quality, taking into account the
current results of studies on nutrition.

71
Literature
ADA Position Paper. Dietary Guidance for Healthy Children Aged 2 to 11 Years. J. Am.
Diet. Assoc. 2004, 104(4), 660-677.
Baird J., Fisher D., Lucas P., Kleijnen J., Roberts H., Law C.: Being big or growing fast:
systematic review of size and growth in infancy and later obesity. BMJ 2005
331(7522), 929.
Bała G., Czerwionka-Szaflarska M., Swincow G., Rytarowska A.: Analiza przyczyn
niedożywienia u dzieci do lat 2. Pediatr. Współ. Gastrol., Hepatol. Żyw. Dziecka
2004, 6(1): 23-26.
Barker D.J.: In utero programming of cardiovascular disease. Theriogenology 2000,
53(2), 555-574.
Barker D.J.: The developmental origins of adult disease. J. Am. Coll. Nutr. 2004, 23(6
suppl), 588S-595S.
Barlow S.E., Expert Committee: Expert Committee recommendations regarding the
prevention, assessment, and treatment of child and adolescent overweight and
obesity: summary report. Pediatrics 2007, 120(Supp 4), S164-S192.
Barton B.A., Eldridge A.L., Thompson D., Affenito S.G., Striegel-Moore R.H., Franko D.L.,
Albertson A.M., Crockett S.J.: The relationship of breakfast and cereal
consumption to nutrient intake and body mass index. The National Heart, Lung,
and Blood Institute Growth and Health Study. J. Am. Diet. Assoc. 2005, 105(9),
1383-1389.
Benjamin S.E., Rifas-Shiman S.L., Taveras E.M., Haines J., Finkelstein J., Kleinman K.,
Gillman M.W.: Early child care and adiposity at ages 1 and 3 years. Pediatrics
2009, 124(2), 555-562.
Birch L.L., Fisher J.O.: Appetite and eating behavior in children. Pediatr. Clin. N. Am.
1995, 42(4), 931-951.
72
Briefel R., Hanson C., Fox M.K., Novak T., Ziegler P.: Feeding Infants and Toddlers Study:
do vitamin and mineral supplements contribute to nutrient adequacy or excess
among US infants and toddlers?, J. Am. Diet. Assoc. 2006; 106(1 Suppl 1):S52-65.
Burdette H.L., Whitaker R.C., Hall W.C., Daniels S.R.: Breastfeeding, introduction of
complementary foods, and adiposity at 5 y of age. Am. J. Clin. Nutr. 2006, 83(3),
550-558.
Charzewska J., Weker H.: Ogólnopolskie badanie nad zawartością wapnia i witaminy D w
dietach dzieci w wieku 4 lat. Pediatr. Współ. Gastroenterol., Hepatol. Żyw.
Dziecka 2006, 8 (2), 107-109.
Cope M.B., Allison D.B.: Critical review of the World Health Organization’s (WHO) 2007
report on evidence of the long-term effects of breastfeeding: systematic reviews
and meta-analysis’ with respect to obesity. Obes. Rev. 2008, 9(6), 594-605.
Cottrell E.C., Ozanne S.E.: Early life programming of obesity and metabolic disease.
Physiol. Behav. 2008, 94(1), 17-28.
Czajkowski K., Czerwionka-Szaflarska M., Charzewska J., Chybicka A., Dobrzańska Anna,
Gruszfeld Dariusz, Imiela J., Jackowska T., Helwich E., Kaczmarski M., Poręba R.,
Książyk Janusz, Lauterbach R., Lukas W., Mojska H., Milanowski A., Radowicki S.,
Ryżko Józef, Socha Piotr, Szajewska H., Szczapa J., Walkowiak J., Weker H.:
Stanowisko grupy ekspertów w sprawie suplementacji kwasu
dokozaheksaenowego i innych kwasów tłuszczowych omega-3 w populacji
kobiet ciężarnych, karmiących piersią oraz niemowląt i dzieci do lat 3.
Standardy Med. 2010 T. 7 nr 5/6 s. 729-736.
Dennison B.A., Edmunds L.S., Stratton H.H., Pruzek R.M.: Rapid infant weight gain
predicts childhood overweight. Obesity (Silver Spring) 2006, 14(3), 491-499.
Dennison B.A.: Fruit juice consumption by infants and children: a review. J. Am. Coll.
Nutr. 1996, 15(5 Suppl), 4S-11S.
Dietary Reference Intakes for Energy, Carbohydrate, Fiber, Fat, Fatty Acids, Cholesterol,
Protein, and Amino Acids (Macronutrients). National Academy of Sciences.
Institute of Medicine. Food and Nutrition Board, 2005.
73
Dobrzańska A., Czerwionka-Szaflarska M., Kunachowicz H., Książyk J., Lukas W., Ryżko J.,
Socha J., Stolarczyk A., Szajewska H., Wąsowska-Królikowska K., Weker H.:
Zalecenia dotyczące żywienia dzieci zdrowych w wieku 1-3 lata (13-36
miesięcy) opracowane przez zespół ekspertów powołany przez konsultanta
krajowego ds. pediatrii. Pediatr. Pol. 2008, 82(1), 93-95.
Dobrzańska A., Czerwionka-Szaflarska M., Kunachowicz H., Książyk J., Lukas W., Ryżko J.,
Socha J., Stolarczyk A., Szajewska H., Wąsowska-Królikowska K., Weker H.:
Recommendations for nutrition of healthy children in the first year of age. Team
of experts appointed by the National Consultant in Paediatrics. Standardy Med.
2007, 4, 2-5.
Dobrzańska A., Lukas W., Socha J., Wąsowska-Królikowska K., Chlebna-Sokół D.,
Milanowski A., Książyk J., Szymankiewicz M., Charzewska J., Czech-Kowalska J.,
Weker H.: Polskie zalecenia dotyczące profilaktyki niedoborów witaminy D.
Klinika Pediatryczna 2009; Szkoła Pediatrii cz. 13, 17 (5), 5117-5120.
Dobrzańska A., Lukas W., Socha J., Wąsowska-Królikowska K., Chlebna-Sokół D.,
Milanowski A., Książyk J., Szymankiewicz M., Charzewska J., Czech-Kowalska J.,
Weker H.: Zalecenia Konsultanta Krajowego w dziedzinie Pediatrii dotyczące
profilaktyki krzywicy i osteoporozy. Standardy Med. 2004, 1, 443-445.
Dzieniszewski J., Szponar L., Szczygieł B., Socha J.: Podstawy naukowe żywienia w
szpitalach. Instytut Żywności i Żywienia, Warszawa 2001.
ESPGHAN Committee on Nutrition. Breast-feeding: A Commentary by the ESPGHAN
Committee on Nutrition. J. Pediatr. Gastroenterol. Nutr. 2009, 49(1), 112-125.
ESPGHAN Committee on Nutrition. Complementary Feeding: A Commentary by the
ESPGHAN Committee on Nutrition Medical Position Paper. J. Pediatr.
Gastroenterol. Nutr. 2008, 46(1), 99-110.
European Food Safety Authority. Scientific opinion on the appropriate age for
introduction of complementary feeding in infants. EFSA Journal 2009, 7, 1-38.
European Network for Public Health Nutrition: Networking, Monitoring, Intervention
and Training (EUNUTNET). Infant and young child feeding: standard
recommendations for European Union. European Commission, Directorate
Public Health and Risk Assessment, Luxemburg, 2006.

74
FAO/WHO/UNU Expert Consultation: Human Energy Requirements. Rome, World
Health Organization 2004.
Fats and oils in human nutrition. Report of a joint expert consultation. Food and
Agriculture Organization of the United Nations, Rome 1994 (FAO Food and
Nutrition Paper, No.57).
Fisher J.O., Liu Y., Birch L.L., Rolls B.J.: Effects of portion size and energy density on
young children’s intake at a meal. Am. J. Clin. Nutr. 2007, 86(1), 174-179.
M.K., Weaver L., Branca F., Robertson A.: Feeding and nutrition of infants and young
children. Guidelines for the World Health Organization European Region, with
emphasis on the former Soviet Countries. WHO Regional Publication, European
Series, Nr 87, Kopenhaga, 2000.
Fox M.K., Pac S., Devaney B., Jankowski L.: Feeding infants and toddlers study: what
foods are infants and toddlers heating? J. Am. Diet. Assoc. 2004, 104, 22-30.
Garlick P.J., Rigo J., Ziegler E.E. (eds): Protein and Energy Requirements in Infancy and
Childhood. Nestle Nutr. Workshop Ser. Pediatr. Program, Nestec Ltd., Vevey/S.
Karger A.G., Basel 2006, 58, 39-50.
Gleason P.M., Dodd A.H.: School breakfast program but not school lunch program
participation is associated with lower body mass index. J. Am. Diet. Assoc. 2009,
109(2 Suppl), S118-128.
Howarth N.C., Huang T.T., Roberts S.B., McCrory M.A.: Dietary fibre and fat are associated
with excess weight in young and middle-aged US adults. J. Am. Diet. Assoc. 2005,
105(9), 1365-1372.
Human Vitamin and Mineral Requirements Report of a joint FAO/WHO expert
consultation Bangkok, Thailand. Food and Nutrition Division FAO Rome Food
and Agriculture Organization of the United Nations World Health Organization.
FAO 2001.
Jarosz M., Bułhak-Jachymczyk B. (eds): Normy żywienia człowieka. Podstawy prewencji
otyłości i chorób niezakaźnych. Wydawnictwo Lekarskie PZWL, Warszawa
2008.
75
Koletzko B., von Kries R., Closa R., Escribano J., Scaglioni S., Giovannini M., Beyer J.,
Demmelmair H., Gruszfeld D., Dobrzańska A., Sengier A., Langhendries J.P.,
Rolland Cachera M.F., Grote V.: Lower protein in infant formula is associated
with Lower weight up to age 2 y: a randomized clinical trial. Am. J. Clin. Nutr.
2009, 89(6), 1836-1845.
Książyk J., Weker H.: Nowe zalecenia żywienia niemowląt od roku 2007. Pediatria
Współczesna. Gastroenterologia, Hepatologia i Żywienie Dziecka 2007, 9 (1): 9-
14.
Lorson B. A., Melgar-Quinonez H. R., Taylor C. A.: Correlates of fruit and vegetable
intakes in US children, J. Am. Diet. Assoc. 2009; 109 (3):474-478.
Mennella J.A., Ziegler P., Briefel R., Novak T.: Feeding infants and toddlers study: the
types of foods fed to Hispanic infants and toddlers. J. Am. Diet. Assoc. 2006,
106(1 Suppl 1), S96-106.
Murray R.K. et al.: Biochemia Harpera. PZWL, Warszawa 2004.
Nader P.R., O’Brien M., Houts R., Bradley R., Belsky J., Crosnoe R., Friedman S., Mei Z.,
Susman E.J.: Identifying Risk for Obesity in Early Childhood. Pediatrics 2006,
118(3), 594-601.
Neu J., Hauser N., Douglas-Escobar M.: Postnatal nutrition and adult health
programming. Semin. Fetal Neonatal Med. 2007, 12(1), 78-86.
Oblacińska A., Weker H. (eds): Profilaktyka otyłości u dzieci i młodzieży. Od urodzenia
do dorosłości. Wydawnictwo Help-Med., Kraków 2008.
Olstad D.L., McCargar L.: Prevention of overweight and obesity in children under the age
of 6 years. Appl. Physiol. Nutr. Metab. 2009, 34(4), 551-570.
Pan Y., Pratt C.A.: Metabolic syndrome and its association with diet and physical activity
in US adolescents. J. Am. Diet. Assoc. 2008, 108(2), 276-286.
The Demographic Yearbook of Poland 2010. Central Statistical Office, Warsaw 2010.
Rudzka-Kańtoch Z., Weker H., Strucińska M.: Zalecenia żywieniowe dla małych dzieci (2-
3 lata). Med. Wieku Rozw. 1998, II(2), 247-267.
Simondon K.B., Gartner A., Berger J., Cornu A., Massamba J.P., San Miguel J.N., Ly C.,
Missotte I., Simondon F., Traissac P., Delpeuch F., Maire B.: Effect of early, short-
76
term supplementation on weight and linear growth of 4-7 month-old infants in
developing countries: a four-country randomized trial. Am. J. Clin. Nutr. 1996,
64, 537-545.
Socha J, Socha P, Gruszfeld D., Stolarczyk A., Dobrzańska A.: Znaczenie białka w żywieniu
niemowląt. Standardy Medyczne. Pediatria 2010, 7(1), 79-86.
Szotowa W., Socha J., Charzewska J., Dłużniewska K., Jabłoński E., Kunachowicz H. et al.:
Dzienne zalecenia żywieniowe dla dzieci i młodzieży. Pediatr. Pol. 1995; 71: 1-
12.
Szponar L., Rychlik E., Ołtarzewski M.: Badania indywidualnego spożycia żywności i
stanu odżywienia w gospodarstwach domowych, Works of NFNI 101, Warszawa
2003.
Szponar L., Sekuła W., Rychlik E., Ołtarzewski M., Figurska K.: Badania indywidualnego
spożycia żywności i stanu odżywienia w gospodarstwach domowych. Works of
National Food and Nutrition Institute, Warsaw 2003.
Taveras E.M., Berkey C.S., Rifas-Shiman S.L., Ludwig D.S., Rockett H.R., Field A.E., Colditz
G.A., Gillman M.W.: Association of consumption of fried food away from home
with body mass index and diet quality in older children and adolescents.
Pediatrics 2005, 116(4), e518-e524.
Wajszczyk B., Chwojnowska Z., Chabros E., Nasiadko D., Rybaczuk M. Manual of Dieta 4.0
Program for planning and current assessment of individual diet. NFNI,
Warszawa 2010.
Wang C., Ludwig D., Sonneville K., Gortmaker S.: Impact of change in sweetened caloric
beverage consumption on energy intake among children and adolescents, Arch.
Pediatr. Adolesc. Med. 2009; 163(4):336-343.
Weker H., Barańska M., Riahi A.: Problemy matek dotyczące żywienia uzupełniającego u
niemowląt karmionych piersią. Pediatr. Pol. 2008, 83(6), 682-686.
Weker H., Hamułka J., Więch M., Głowacka K.: Analysis of nutrition of children in Warsaw
day nurseries in view of current recommendations. Journal of Pre-Clinical and
Clinical Research 2010, 4(1), 063-067.
77
Weker H.: Badanie nad powiązaniem czynnika żywieniowego z otyłością prostą u dzieci.
Med. Wieku Rozw. 2006, 1(1), X.
Welsh J.A., Cogswell M.E., Rogers S., Rockett H., Mei Z., Grummer-Strawn L.M.:
Overweight among low-income preschool children associated with the
consumption of sweet drinks: Missouri, 1999-2002. Pediatrics 2005, 115(2),
e223-e229.
WHO Anthro for personal computers, version 3.1, 2010: Software for assessing growth
and development of the world’s children. Geneva: WHO, 2010.
WHO child growth standards : length/height-for-age, weight-for-age, weight-for-length,
weight-for height and body mass index-for-age : methods and development.
WHO 2006. http://www.who.int/child-growth/standards/en/index.html.
WHO. Energy and protein requirements. Report of a joint FAO/WHO/UNU export
consultation. Geneva, WHO, 1985. Technical Report Series, No. 724.
Wu T.C., Chen P.H.: Health consequences of nutrition in childhood and early infancy.
Pediatr. Neonatal. 2009, 50(4), 135-142.
Zagórecka E., Motkowski R., Stolarczyk A., Socha P., Piotrowska-Jastrzębska J., Socha J.:
Realizacja zaleceń żywienia uzupełniającego w grupie niemowląt
uczestniczących w projekcie „Nawyki żywieniowe a stan odżywienia niemowląt
w Polsce”. Pediatr. Pol. 2008, 83(2), 136-149.
Zasady żywienia dzieci i młodzieży. Current position of the American Heart Association
supported by the American Academy of Pediatrics. Medycyna Praktyczna 2005,
6(42), 41-48.
Ziemlański Ś. [ed]: Normy żywienia człowieka. Fizjologiczne podstawy. Wydawnictwo
Lekarskie PZWL, Warszawa 2001.
Appendix
Annex 1 List of Figures in the Report Fig. 1. Distribution of the values of relative body mass index (BMI) of the studied children in relation
to the WHO centile ranks ...................................................................................................................... 37

78
Fig. 2. Assessment of the nutritional status of children aged 13-36 months (n=400) - BMI in relation
to the WHO standard ............................................................................................................................ 38
Fig. 3. Main sources of nutrients in the children's diets ...................................................................... 52
Fig. 4. Comparison of energy and nutritional value of the average daily food ration of the surveyed
children with current and previous standards .................................................................................... 59
Fig. 5. The analysis of the implementation of nutritional standards in the surveyed population of
children .................................................................................................................................................. 61
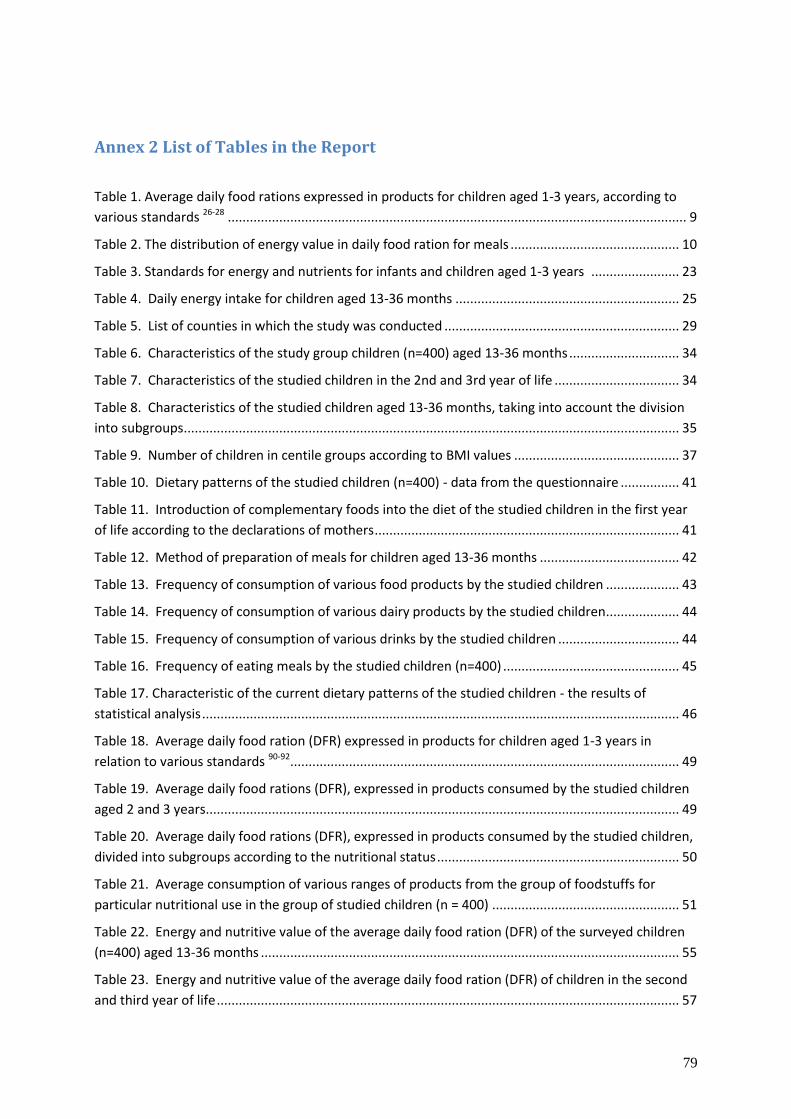
79
Annex 2 List of Tables in the Report
Table 1. Average daily food rations expressed in products for children aged 1-3 years, according to
various standards 26-28 ............................................................................................................................. 9
Table 2. The distribution of energy value in daily food ration for meals .............................................. 10
Table 3. Standards for energy and nutrients for infants and children aged 1-3 years ........................ 23
Table 4. Daily energy intake for children aged 13-36 months ............................................................. 25
Table 5. List of counties in which the study was conducted ................................................................ 29
Table 6. Characteristics of the study group children (n=400) aged 13-36 months .............................. 34
Table 7. Characteristics of the studied children in the 2nd and 3rd year of life .................................. 34
Table 8. Characteristics of the studied children aged 13-36 months, taking into account the division
into subgroups ....................................................................................................................................... 35
Table 9. Number of children in centile groups according to BMI values ............................................. 37
Table 10. Dietary patterns of the studied children (n=400) - data from the questionnaire ................ 41
Table 11. Introduction of complementary foods into the diet of the studied children in the first year
of life according to the declarations of mothers ................................................................................... 41
Table 12. Method of preparation of meals for children aged 13-36 months ...................................... 42
Table 13. Frequency of consumption of various food products by the studied children .................... 43
Table 14. Frequency of consumption of various dairy products by the studied children .................... 44
Table 15. Frequency of consumption of various drinks by the studied children ................................. 44
Table 16. Frequency of eating meals by the studied children (n=400) ................................................ 45
Table 17. Characteristic of the current dietary patterns of the studied children - the results of
statistical analysis .................................................................................................................................. 46
Table 18. Average daily food ration (DFR) expressed in products for children aged 1-3 years in
relation to various standards 90-92.......................................................................................................... 49
Table 19. Average daily food rations (DFR), expressed in products consumed by the studied children
aged 2 and 3 years ................................................................................................................................. 49
Table 20. Average daily food rations (DFR), expressed in products consumed by the studied children,
divided into subgroups according to the nutritional status .................................................................. 50
Table 21. Average consumption of various ranges of products from the group of foodstuffs for
particular nutritional use in the group of studied children (n = 400) ................................................... 51
Table 22. Energy and nutritive value of the average daily food ration (DFR) of the surveyed children
(n=400) aged 13-36 months .................................................................................................................. 55
Table 23. Energy and nutritive value of the average daily food ration (DFR) of children in the second
and third year of life .............................................................................................................................. 57
80
Table 24. Energy and nutritive value of the average daily food ration (DFR) of the surveyed children
with various nutritional status .............................................................................................................. 58
Table 25. The most important factors for abnormal nutritional status of the surveyed children - the
results of statistical analysis .................................................................................................................. 64
Table 26. The odds ratio for abnormal nutritional status of the surveyed children - the results of
statistical analysis .................................................................................................................................. 65
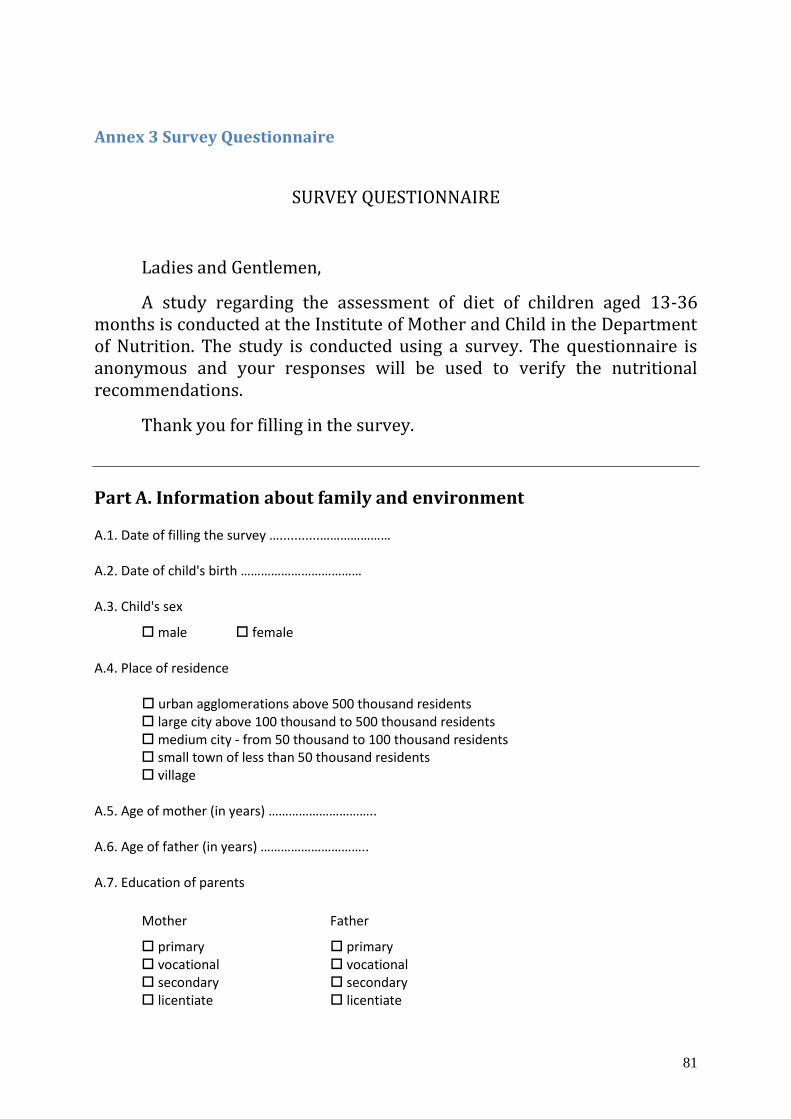
81
Annex 3 Survey Questionnaire
SURVEY QUESTIONNAIRE
Ladies and Gentlemen,
A study regarding the assessment of diet of children aged 13-36 months is conducted at the Institute of Mother and Child in the Department of Nutrition. The study is conducted using a survey. The questionnaire is anonymous and your responses will be used to verify the nutritional recommendations.
Thank you for filling in the survey.
Part A. Information about family and environment A.1. Date of filling the survey …...........…………………
A.2. Date of child's birth ……………………………… A.3. Child's sex
male female A.4. Place of residence
urban agglomerations above 500 thousand residents large city above 100 thousand to 500 thousand residents medium city - from 50 thousand to 100 thousand residents small town of less than 50 thousand residents village
A.5. Age of mother (in years) …………………………..
A.6. Age of father (in years) ………………………….. A.7. Education of parents
Mother Father
primary primary vocational vocational secondary secondary licentiate licentiate

82
higher higher A.8. Number of persons in the household, including number of children (to 18 years of age) ............
Please provide information about the child's siblings, giving gender and age (e.g., a 13-year-old girl - "gi-13"; a 2-year-old boy - "bo-2")…………………………………………………………………………………
A.9. Who works in the family? Please select all the correct answers.
both parents father only mother only none of parents other persons, who? ……………………………………………………………………………………………………….
A.10. Please specify your family's financial situation. Please select one answer.
very bad bad average (neither good nor bad) good very good
A.11. Does your child go a nursery/kindergarten?
YES NO
If NO, who looks after the child during the day? Please select all the correct answers.
mother father grandmother babysitter other persons, who? …………………………………………………………………………………………………………
A.12. From what sources do you acquire knowledge of child nutrition? Please select all the correct answers.
doctor/midwife/dietician TV, radio the Internet books, magazines brochures/leaflets mother or grandmother/other family members friends I am not interested in these issues
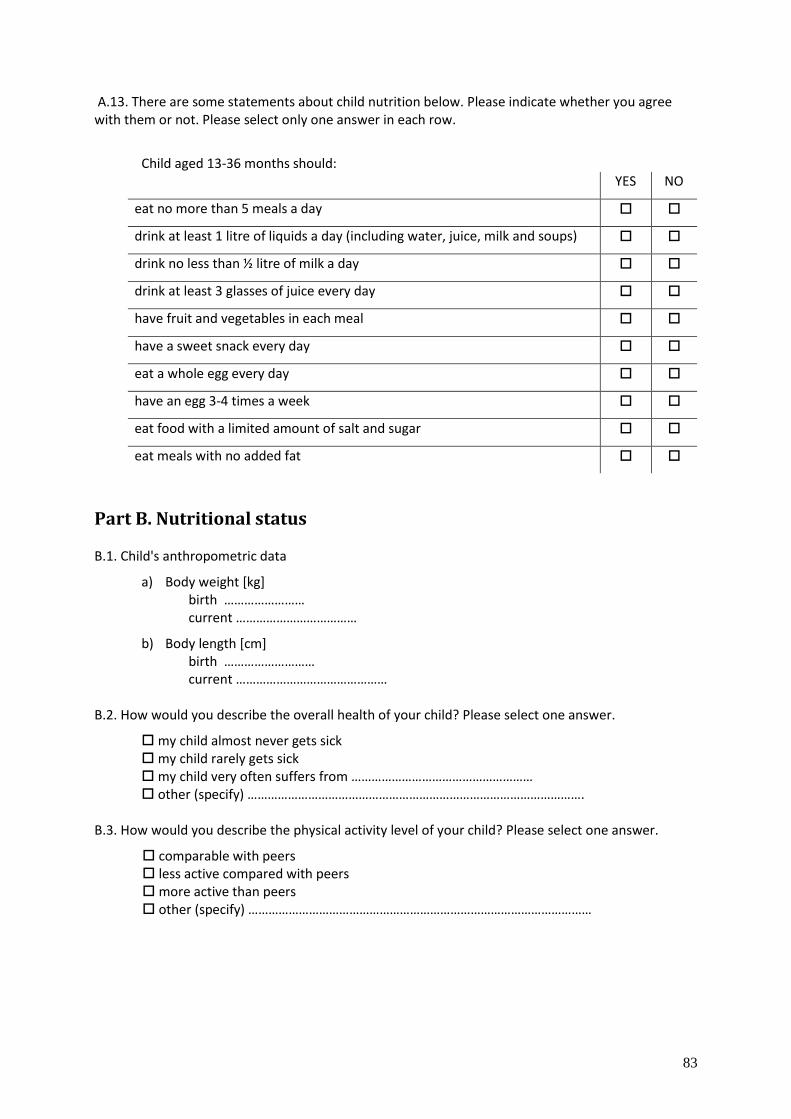
83
A.13. There are some statements about child nutrition below. Please indicate whether you agree with them or not. Please select only one answer in each row.
Child aged 13-36 months should: YES NO
eat no more than 5 meals a day
drink at least 1 litre of liquids a day (including water, juice, milk and soups)
drink no less than ½ litre of milk a day
drink at least 3 glasses of juice every day
have fruit and vegetables in each meal
have a sweet snack every day
eat a whole egg every day
have an egg 3-4 times a week
eat food with a limited amount of salt and sugar
eat meals with no added fat
Part B. Nutritional status B.1. Child's anthropometric data
a) Body weight [kg] birth …………………… current ………………………………
b) Body length [cm] birth ……………………… current ………………………………………
B.2. How would you describe the overall health of your child? Please select one answer.
my child almost never gets sick my child rarely gets sick my child very often suffers from ……………………………………………… other (specify) ……………………………………………………………………………………….
B.3. How would you describe the physical activity level of your child? Please select one answer.
comparable with peers less active compared with peers more active than peers other (specify) …………………………………………………………………………………………

84
Part C. Diet, dietary behaviour, nutritional preferences
C.1. Was the child breastfed during the first year of life (from birth to 12 months of age)?
YES NO
If YES, how long the baby was only breastfed (months)? …………………
C.2. Is the child currently breastfed?
YES NO
If YES, please indicate how many times a day the baby is breastfed .............., including how
many times at night ..............................
If NO, please specify for how long the child was breastfed (months) ...................
C.3. When (in which month of age) the first complementary products were introduced to the child's
diet and what products were they (e.g. gruel, porridge, fruit and vegetable purees, etc.)?
……………………………………………………………………………………………………………………………………………………………
……………………………………………………………………………………………………………………………………………………………
……………………………………………………………………………………………………………………………………………………………
C4. In which month of age the products containing gluten (e.g. wheat gluten/porridge, semolina,
bread crust) were introduced to the child's diet?
before the 5th month
in the 5th month
in the 6th month
in the 7th - 9th month
in the 9th - 12th month
Gluten products have not yet been introduced to the child's diet
C5. Were fish introduced to the child's diet in the second half year of his/her life?
YES NO
If YES, in what form? ……………………………………………………………………………………………………………
……………………………………………………………………………………………………………………………………………………………
If NO, why? ………………………………………………………………………………………………………………………
……………………………………………………………………………………………………………………………………………………………
……………………………………………………………………………………………………………………………………………………………
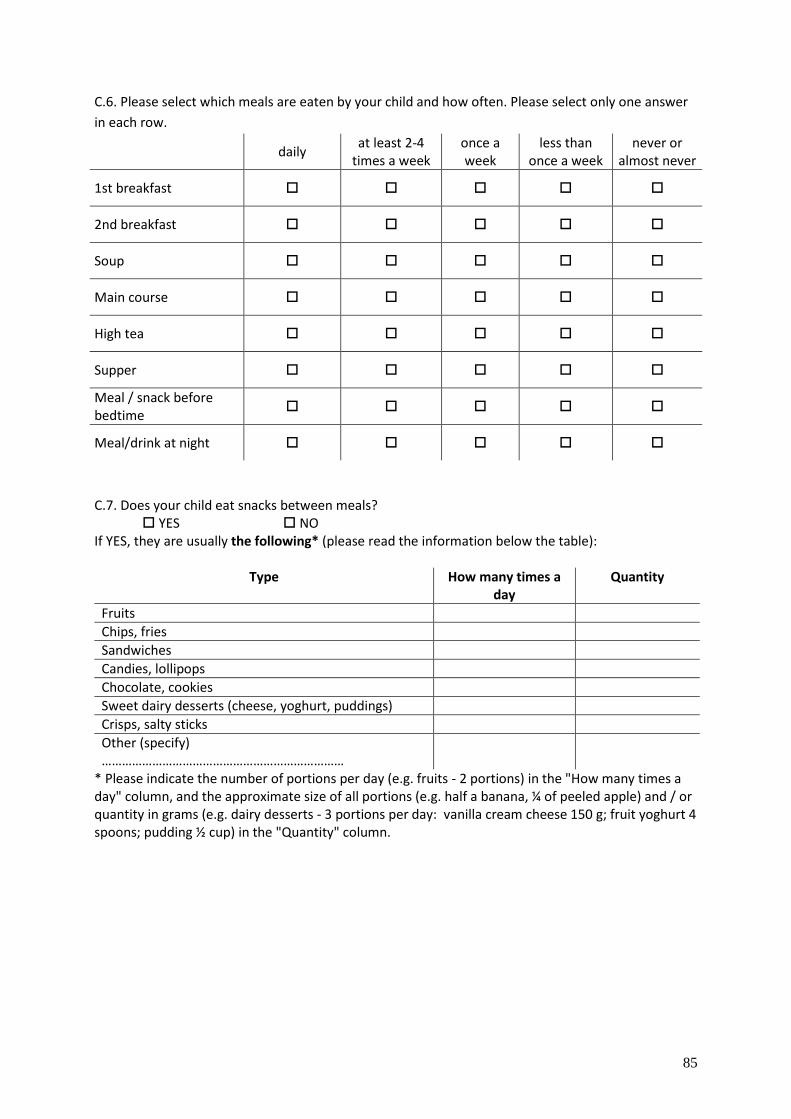
85
C.6. Please select which meals are eaten by your child and how often. Please select only one answer
in each row.
daily
at least 2-4 times a week
once a week
less than once a week
never or almost never
1st breakfast
2nd breakfast
Soup
Main course
High tea
Supper
Meal / snack before bedtime
Meal/drink at night
C.7. Does your child eat snacks between meals?
YES NO If YES, they are usually the following* (please read the information below the table):
Type How many times a day
Quantity
Fruits
Chips, fries
Sandwiches
Candies, lollipops
Chocolate, cookies
Sweet dairy desserts (cheese, yoghurt, puddings)
Crisps, salty sticks
Other (specify) ………………………………………………………………
* Please indicate the number of portions per day (e.g. fruits - 2 portions) in the "How many times a day" column, and the approximate size of all portions (e.g. half a banana, ¼ of peeled apple) and / or quantity in grams (e.g. dairy desserts - 3 portions per day: vanilla cream cheese 150 g; fruit yoghurt 4 spoons; pudding ½ cup) in the "Quantity" column.
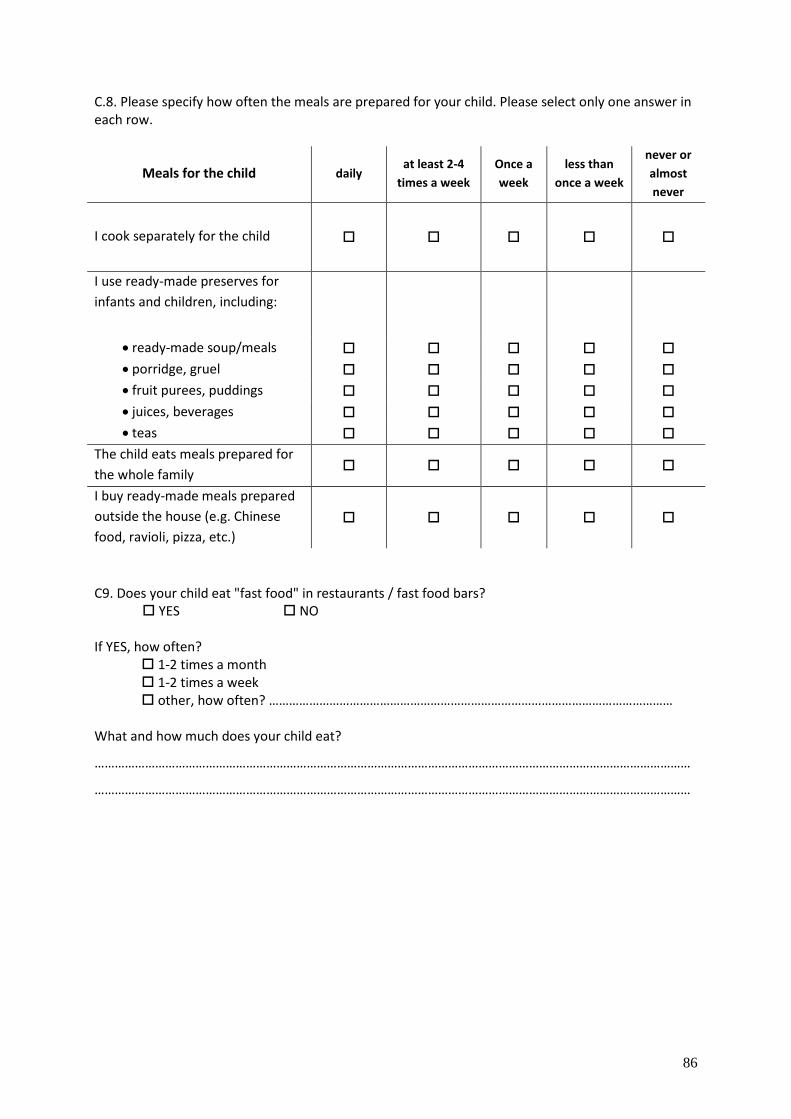
86
C.8. Please specify how often the meals are prepared for your child. Please select only one answer in each row.
Meals for the child daily at least 2-4
times a week
Once a
week
less than
once a week
never or
almost
never
I cook separately for the child
I use ready-made preserves for
infants and children, including:
ready-made soup/meals
porridge, gruel
fruit purees, puddings
juices, beverages
teas
The child eats meals prepared for
the whole family
I buy ready-made meals prepared
outside the house (e.g. Chinese
food, ravioli, pizza, etc.)
C9. Does your child eat "fast food" in restaurants / fast food bars?
YES NO If YES, how often?
1-2 times a month 1-2 times a week other, how often? …………………………………………………………………………………………………………
What and how much does your child eat?
……………………………………………………………………………………………………………………………………………………………
……………………………………………………………………………………………………………………………………………………………

87
C.10. Please specify how often the products listed below are used in the meals eaten by your child. Please select one answer in each row.
daily
at least 2-4 times a week
Once a week less than
once a week never or
almost never
Fresh fruits
Frozen fruits
Fruit juices
Vegetable and vegetable - fruit juices
Fresh vegetables, including potatoes
Frozen vegetables
Poultry meat
Red meat
Fresh fish
Frozen fish
Smoked fish
Canned fish
Eggs
Butter
Olive oil
Vegetable oils
Margarine
Cereals
Groat (barley, buckwheat)
Dark bread
Wheat bread
Tomato concentrate, paste
Stock cubes, broths
Vegetable seasoning in the form of granules, powder
Concentrates of soups and sauces in powder
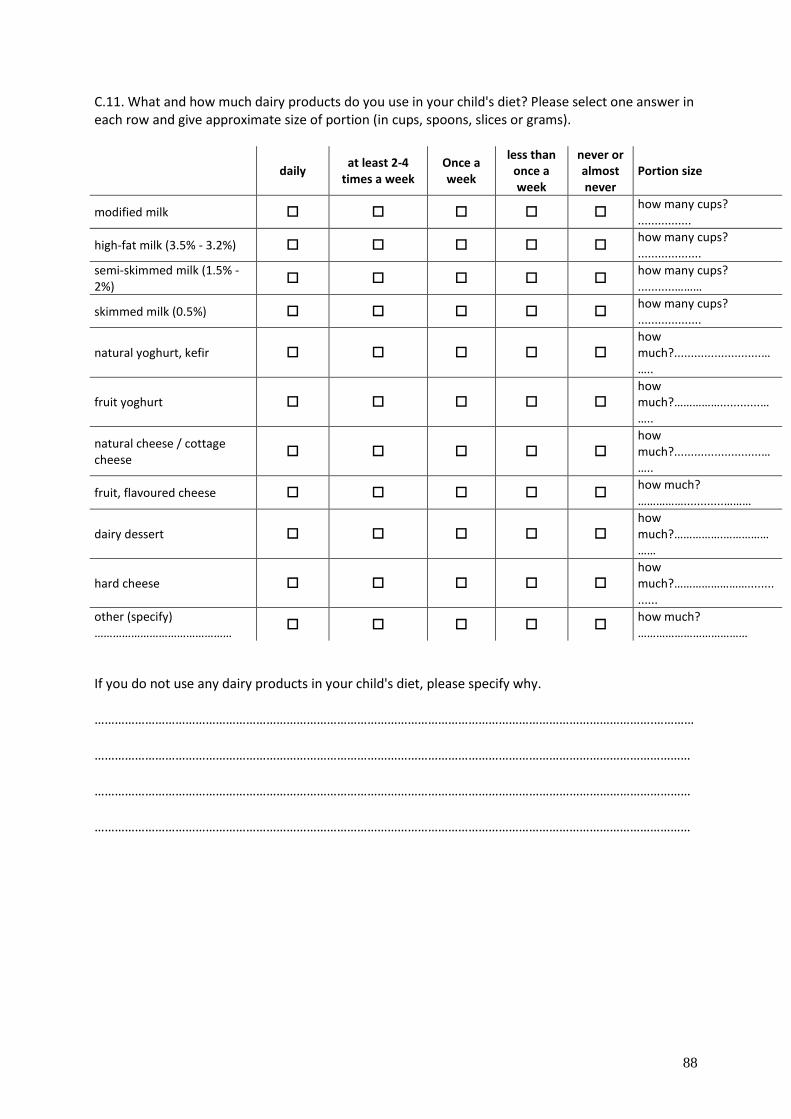
88
C.11. What and how much dairy products do you use in your child's diet? Please select one answer in each row and give approximate size of portion (in cups, spoons, slices or grams).
daily at least 2-4
times a week Once a week
less than once a week
never or almost never
Portion size
modified milk how many cups? ................
high-fat milk (3.5% - 3.2%) how many cups? ...................
semi-skimmed milk (1.5% - 2%)
how many cups? ...........………
skimmed milk (0.5%) how many cups? ...................
natural yoghurt, kefir how much?..........................……..
fruit yoghurt how much?……………............……..
natural cheese / cottage cheese
how much?..........................……..
fruit, flavoured cheese how much? ……………............………
dairy dessert how much?…………….…………………
hard cheese how much?……………………..............
other (specify) ………………………………………
how much? ………………………………
If you do not use any dairy products in your child's diet, please specify why.
………………………………………………………………………………………………………………………………………………….…………
……………………………………………………………………………………………………………………………………………………………
……………………………………………………………………………………………………………………………………………………………
……………………………………………………………………………………………………………………………………………………………

89
C.12. Please specify what other liquids (except for milk and milk beverages) does your child drink and in what amounts. Please select one answer in each row and give approximate size of portion (in cups).
daily at least 2-4 times a week
Once a week
less than once a week
never or almost never
Portion size
water how many cups? ................
juices, nectars how many cups? ...................
sweet still and carbonated drinks
how many cups? ...........………
tea how many cups? ...................
chicory coffee (without milk)
how many cups? ............……..
compote how many cups? ............……..
homemade soups how many cups? ............……..
other (specify) ………………………………………
how many cups? ............……..
C.13. Do you add salt to meals of your child? Please select one answer.
I do not use salt for my child's meals I add salt to all of my child's meals I add salt only to homemade meals I add salt to ready-made products for children
C.14. In terms of nutrition you observe that your child:
EATS: MEAT DISHES: VEGETABLES: LEARNS NEW FLAVOURS:
regularly likes likes willingly irregularly dislikes dislikes unwillingly
C.15. Please indicate how your child is usually fed. Please select one answer.
eats at least one meal a day at table with his/her family is fed separately, at other times of day than the family is fed while watching TV is fed during play / has to be convinced to eat other/none of the above ……………………………………………………………………………………………….
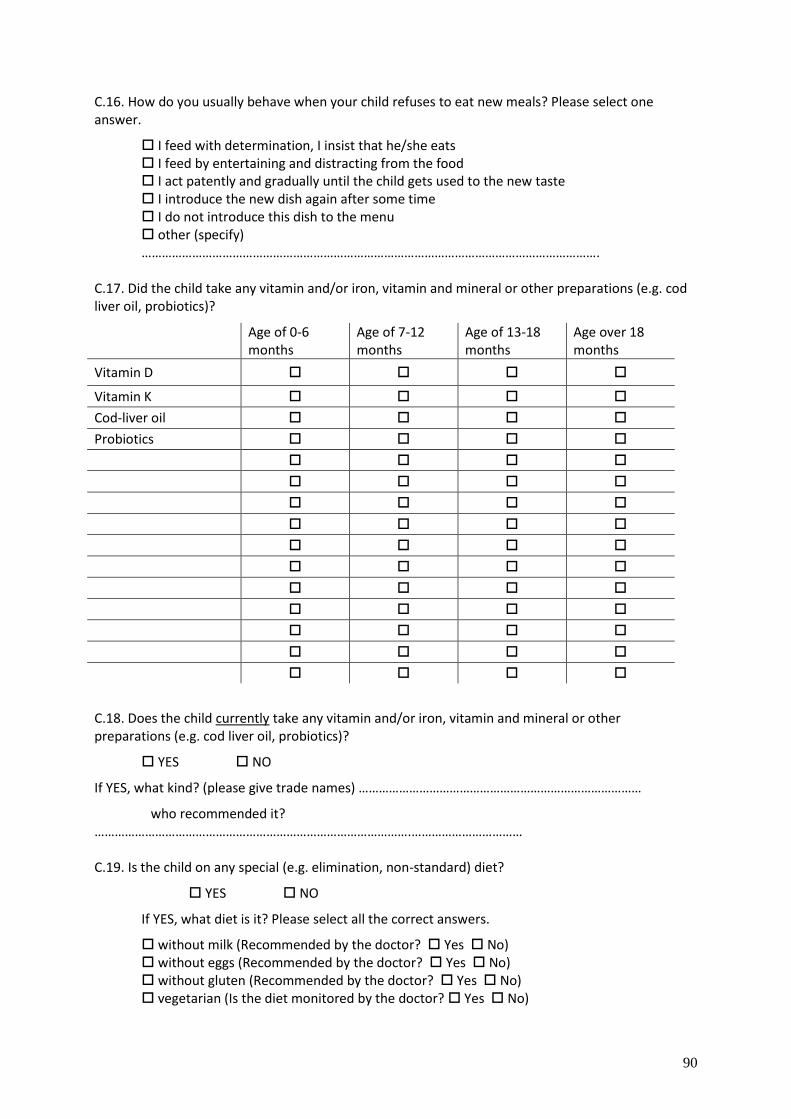
90
C.16. How do you usually behave when your child refuses to eat new meals? Please select one answer.
I feed with determination, I insist that he/she eats I feed by entertaining and distracting from the food I act patently and gradually until the child gets used to the new taste I introduce the new dish again after some time I do not introduce this dish to the menu other (specify) ……………………………………………………………………………………………………………………….
C.17. Did the child take any vitamin and/or iron, vitamin and mineral or other preparations (e.g. cod liver oil, probiotics)?
Age of 0-6 months
Age of 7-12 months
Age of 13-18 months
Age over 18 months
Vitamin D
Vitamin K
Cod-liver oil
Probiotics
C.18. Does the child currently take any vitamin and/or iron, vitamin and mineral or other preparations (e.g. cod liver oil, probiotics)?
YES NO
If YES, what kind? (please give trade names) …………………………………………………………………………
who recommended it? ………………………………………………………………………………….…………………………… C.19. Is the child on any special (e.g. elimination, non-standard) diet?
YES NO
If YES, what diet is it? Please select all the correct answers.
without milk (Recommended by the doctor? Yes No) without eggs (Recommended by the doctor? Yes No) without gluten (Recommended by the doctor? Yes No) vegetarian (Is the diet monitored by the doctor? Yes No)

91
other - what type? ………………………………………………………(Recommended by the doctor? Yes No)
92
Part D. Record of the Diet
Instructions for filling in the nutrition diary
Please record your child's daily diet (beginning at 6:00 am, with the possibility of changing the time by about half an hour in either direction). The diet should be written in the attached tables, according to the instructions.
The record of child's diet must include three days, including one weekend day / holiday (e.g.
Saturday, Sunday). Please record everything the child ate during the day. If your child goes to any
care and educational institution (e.g. nursery, kindergarten), please provide the menu from the
nursery / kindergarten and supplement it with home meals.
Please name the meals identified by you (e.g. dinner). If you can not name all the meals, please
number them, always giving the time of consumption.
Breast-feeding, both during the day and at night, should also be recorded.
Please write down everything the child ate during the day, giving the approximate portion sizes:
in cups, tablespoons, spoons,
slices,
pieces (e.g. small / medium apple)
or portion size in grams, if possible.
The diet should include the size of portion eaten by the child, not given to the child.
Please briefly describe how the meals are prepared, i.e. soup prepared in stock of meat such as
poultry, vegetables, with pasta, rice, groat, etc., boiled or refried potatoes, puree with butter, etc.,
also paying attention to the product type (e.g. wholemeal or wheat bread, etc.; milk with 3.2% of fat)
and food additives, e.g. whether a soup is with cream or butter; whether sandwiches included butter
or margarine; whether tea is sweetened and how much; how is a sauce to salads prepared, etc.
The information regarding the product manufacturer or trade name, particularly in the case of ready-
made preparations for children (jars, porridges, juices) is also important.

93
interviewer no. survey no.
Day 1
DATE
Meal Time What and how much did the child eat? - Please provide the approximate portion sizes
(cups, slices, spoons, etc.).

94
interviewer no. survey no.
Day 2
DATE
Meal Time What and how much did the child eat? - Please provide the approximate portion sizes
(cups, slices, spoons, etc.).

95
interviewer no. survey no.
Day 3
DATE
Meal Time What and how much did the child eat? - Please provide the approximate portion sizes
(cups, slices, spoons, etc.).
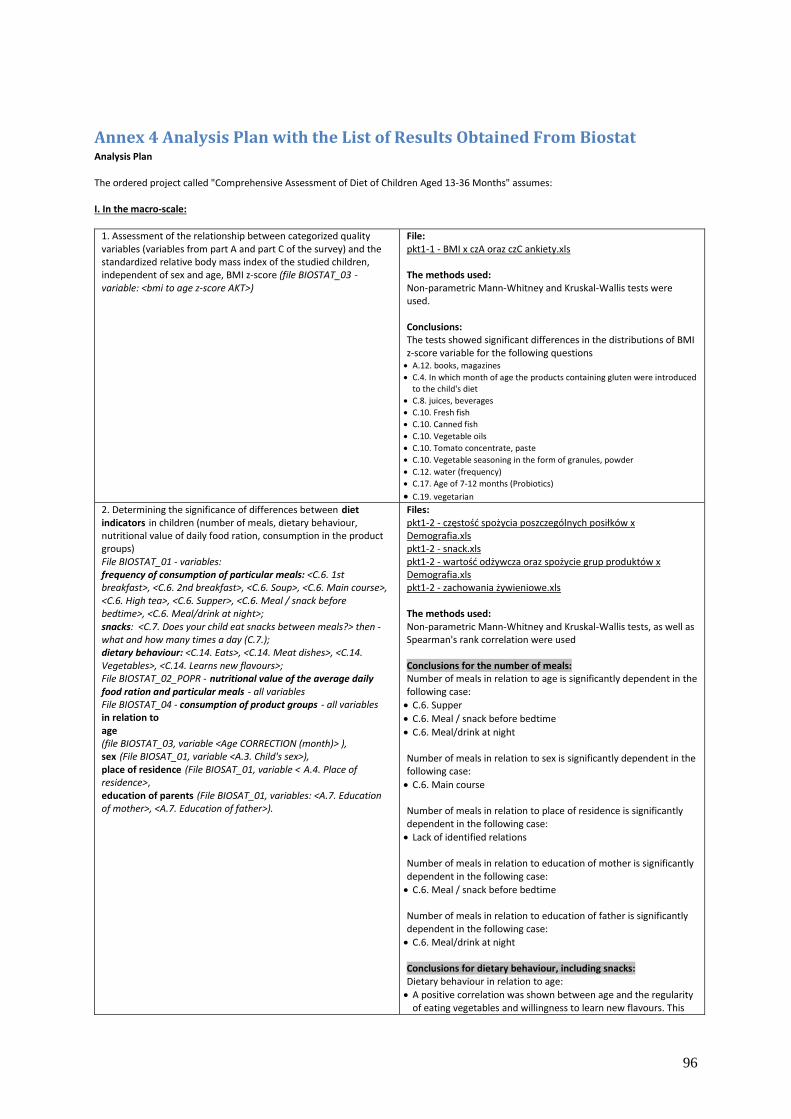
96
Annex 4 Analysis Plan with the List of Results Obtained From Biostat Analysis Plan
The ordered project called "Comprehensive Assessment of Diet of Children Aged 13-36 Months" assumes:
I. In the macro-scale:
1. Assessment of the relationship between categorized quality variables (variables from part A and part C of the survey) and the standardized relative body mass index of the studied children, independent of sex and age, BMI z-score (file BIOSTAT_03 - variable: <bmi to age z-score AKT>)
File: pkt1-1 - BMI x czA oraz czC ankiety.xls The methods used: Non-parametric Mann-Whitney and Kruskal-Wallis tests were used. Conclusions: The tests showed significant differences in the distributions of BMI z-score variable for the following questions A.12. books, magazines
C.4. In which month of age the products containing gluten were introduced to the child's diet
C.8. juices, beverages
C.10. Fresh fish
C.10. Canned fish
C.10. Vegetable oils
C.10. Tomato concentrate, paste
C.10. Vegetable seasoning in the form of granules, powder
C.12. water (frequency)
C.17. Age of 7-12 months (Probiotics)
C.19. vegetarian
2. Determining the significance of differences between diet indicators in children (number of meals, dietary behaviour, nutritional value of daily food ration, consumption in the product groups) File BIOSTAT_01 - variables: frequency of consumption of particular meals: <C.6. 1st breakfast>, <C.6. 2nd breakfast>, <C.6. Soup>, <C.6. Main course>, <C.6. High tea>, <C.6. Supper>, <C.6. Meal / snack before bedtime>, <C.6. Meal/drink at night>; snacks: <C.7. Does your child eat snacks between meals?> then - what and how many times a day (C.7.); dietary behaviour: <C.14. Eats>, <C.14. Meat dishes>, <C.14. Vegetables>, <C.14. Learns new flavours>; File BIOSTAT_02_POPR - nutritional value of the average daily food ration and particular meals - all variables File BIOSTAT_04 - consumption of product groups - all variables in relation to age (file BIOSTAT_03, variable <Age CORRECTION (month)> ), sex (File BIOSAT_01, variable <A.3. Child's sex>), place of residence (File BIOSAT_01, variable < A.4. Place of residence>, education of parents (File BIOSAT_01, variables: <A.7. Education of mother>, <A.7. Education of father>).
Files: pkt1-2 - częstość spożycia poszczególnych posiłków x Demografia.xls pkt1-2 - snack.xls pkt1-2 - wartość odżywcza oraz spożycie grup produktów x Demografia.xls pkt1-2 - zachowania żywieniowe.xls The methods used: Non-parametric Mann-Whitney and Kruskal-Wallis tests, as well as Spearman's rank correlation were used Conclusions for the number of meals: Number of meals in relation to age is significantly dependent in the following case:
C.6. Supper
C.6. Meal / snack before bedtime
C.6. Meal/drink at night Number of meals in relation to sex is significantly dependent in the following case:
C.6. Main course Number of meals in relation to place of residence is significantly dependent in the following case:
Lack of identified relations Number of meals in relation to education of mother is significantly dependent in the following case:
C.6. Meal / snack before bedtime Number of meals in relation to education of father is significantly dependent in the following case:
C.6. Meal/drink at night Conclusions for dietary behaviour, including snacks: Dietary behaviour in relation to age:
A positive correlation was shown between age and the regularity of eating vegetables and willingness to learn new flavours. This
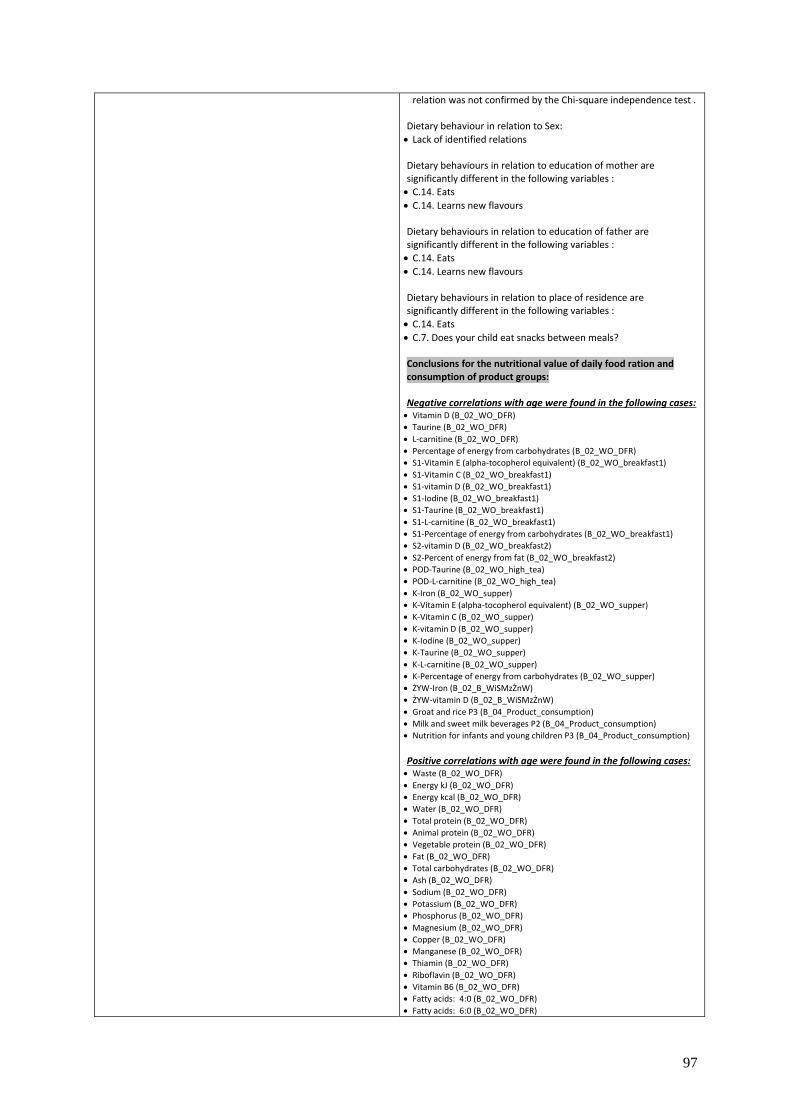
97
relation was not confirmed by the Chi-square independence test . Dietary behaviour in relation to Sex:
Lack of identified relations Dietary behaviours in relation to education of mother are significantly different in the following variables :
C.14. Eats
C.14. Learns new flavours Dietary behaviours in relation to education of father are significantly different in the following variables :
C.14. Eats
C.14. Learns new flavours Dietary behaviours in relation to place of residence are significantly different in the following variables :
C.14. Eats
C.7. Does your child eat snacks between meals? Conclusions for the nutritional value of daily food ration and consumption of product groups: Negative correlations with age were found in the following cases: Vitamin D (B_02_WO_DFR)
Taurine (B_02_WO_DFR)
L-carnitine (B_02_WO_DFR)
Percentage of energy from carbohydrates (B_02_WO_DFR)
S1-Vitamin E (alpha-tocopherol equivalent) (B_02_WO_breakfast1)
S1-Vitamin C (B_02_WO_breakfast1)
S1-vitamin D (B_02_WO_breakfast1)
S1-Iodine (B_02_WO_breakfast1)
S1-Taurine (B_02_WO_breakfast1)
S1-L-carnitine (B_02_WO_breakfast1)
S1-Percentage of energy from carbohydrates (B_02_WO_breakfast1)
S2-vitamin D (B_02_WO_breakfast2)
S2-Percent of energy from fat (B_02_WO_breakfast2)
POD-Taurine (B_02_WO_high_tea)
POD-L-carnitine (B_02_WO_high_tea)
K-Iron (B_02_WO_supper)
K-Vitamin E (alpha-tocopherol equivalent) (B_02_WO_supper)
K-Vitamin C (B_02_WO_supper)
K-vitamin D (B_02_WO_supper)
K-Iodine (B_02_WO_supper)
K-Taurine (B_02_WO_supper)
K-L-carnitine (B_02_WO_supper)
K-Percentage of energy from carbohydrates (B_02_WO_supper)
ŻYW-Iron (B_02_B_WiSMzŻnW)
ŻYW-vitamin D (B_02_B_WiSMzŻnW)
Groat and rice P3 (B_04_Product_consumption)
Milk and sweet milk beverages P2 (B_04_Product_consumption)
Nutrition for infants and young children P3 (B_04_Product_consumption)
Positive correlations with age were found in the following cases: Waste (B_02_WO_DFR)
Energy kJ (B_02_WO_DFR)
Energy kcal (B_02_WO_DFR)
Water (B_02_WO_DFR)
Total protein (B_02_WO_DFR)
Animal protein (B_02_WO_DFR)
Vegetable protein (B_02_WO_DFR)
Fat (B_02_WO_DFR)
Total carbohydrates (B_02_WO_DFR)
Ash (B_02_WO_DFR)
Sodium (B_02_WO_DFR)
Potassium (B_02_WO_DFR)
Phosphorus (B_02_WO_DFR)
Magnesium (B_02_WO_DFR)
Copper (B_02_WO_DFR)
Manganese (B_02_WO_DFR)
Thiamin (B_02_WO_DFR)
Riboflavin (B_02_WO_DFR)
Vitamin B6 (B_02_WO_DFR)
Fatty acids: 4:0 (B_02_WO_DFR)
Fatty acids: 6:0 (B_02_WO_DFR)

98
Fatty acids: 8:0 (B_02_WO_DFR)
Fatty acids: 10:0 (B_02_WO_DFR)
Fatty acids: 12:0 (B_02_WO_DFR)
Fatty acids: 14:0 (B_02_WO_DFR)
Fatty acids: 15:0 (B_02_WO_DFR)
Fatty acids: 16:0 (B_02_WO_DFR)
Fatty acids: 17:0 (B_02_WO_DFR)
Fatty acids: 18:0 (B_02_WO_DFR)
Fatty acids: 20:0 (B_02_WO_DFR)
Fatty acids: total saturated (B_02_WO_DFR)
Fatty acids: 14:1 (B_02_WO_DFR)
Fatty acids: 15:1 (B_02_WO_DFR)
Fatty acids: 16:1 (B_02_WO_DFR)
Fatty acids: 17:1 (B_02_WO_DFR)
Fatty acids: 18:1 (B_02_WO_DFR)
Fatty acids: 20:1 (B_02_WO_DFR)
Fatty acids: 22:1 (B_02_WO_DFR)
Fatty acids: Total monounsaturated (B_02_WO_DFR)
Fatty acids: 18:2 (B_02_WO_DFR)
Fatty acids: 18:3 (B_02_WO_DFR)
Fatty acids: 20:4 (B_02_WO_DFR)
Fatty acids: 22:6 (B_02_WO_DFR)
Fatty acids: Total polyunsaturated (B_02_WO_DFR)
Cholesterol (B_02_WO_DFR)
Isoleucine (B_02_WO_DFR)
Leucine (B_02_WO_DFR)
Lysine (B_02_WO_DFR)
Methionine (B_02_WO_DFR)
Cystine (B_02_WO_DFR)
Phenylalanine (B_02_WO_DFR)
Tyrosine (B_02_WO_DFR)
Threonine (B_02_WO_DFR)
Tryptophan (B_02_WO_DFR)
Valine (B_02_WO_DFR)
Arginine (B_02_WO_DFR)
Histidine (B_02_WO_DFR)
Alanine (B_02_WO_DFR)
Aspartic acid (B_02_WO_DFR)
Glutamic acid (B_02_WO_DFR)
Glycine (B_02_WO_DFR)
Proline (B_02_WO_DFR)
Serine (B_02_WO_DFR)
Sucrose (B_02_WO_DFR)
Starch (B_02_WO_DFR)
Dietary fibre (B_02_WO_DFR)
Folates/folic acid (B_02_WO_DFR)
Vitamin B12 (B_02_WO_DFR)
Long-chain polyunsaturated fatty acids (B_02_WO_DFR)
Digestible carbohydrates (B_02_WO_DFR)
Nicotinamide (B_02_WO_DFR)
Percentage of energy from protein (B_02_WO_DFR)
Percentage of energy from sucrose (B_02_WO_DFR)
S1-Waste (B_02_WO_breakfast1)
S1-Energy kJ (B_02_WO_breakfast1)
S1-Energy kcal (B_02_WO_breakfast1)
S1-Water (B_02_WO_breakfast1)
S1-Total protein (B_02_WO_breakfast1)
S1-Animal protein (B_02_WO_breakfast1)
S1-Vegetable protein (B_02_WO_breakfast1)
S1-Fat (B_02_WO_breakfast1)
S1-Total carbohydrates (B_02_WO_breakfast1)
S1-Ash (B_02_WO_breakfast1)
S1-Sodium (B_02_WO_breakfast1)
S1-Potassium (B_02_WO_breakfast1)
S1-Phosphorus (B_02_WO_breakfast1)
S1-Magnesium (B_02_WO_breakfast1)
S1-Manganese (B_02_WO_breakfast1)
S1-Beta-carotene (B_02_WO_breakfast1)
S1-Thiamin (B_02_WO_breakfast1)
S1-Riboflavin (B_02_WO_breakfast1)
S1-Vitamin B6 (B_02_WO_breakfast1)
S1-Fatty acids: 4:0 (B_02_WO_breakfast1)
S1-Fatty acids: 6:0 (B_02_WO_breakfast1)
S1-Fatty acids: 8:0 (B_02_WO_breakfast1)
S1-Fatty acids: 10:0 (B_02_WO_breakfast1)
S1-Fatty acids: 12:0 (B_02_WO_breakfast1)
S1-Fatty acids: 14:0 (B_02_WO_breakfast1)
S1-Fatty acids: 15:0 (B_02_WO_breakfast1)
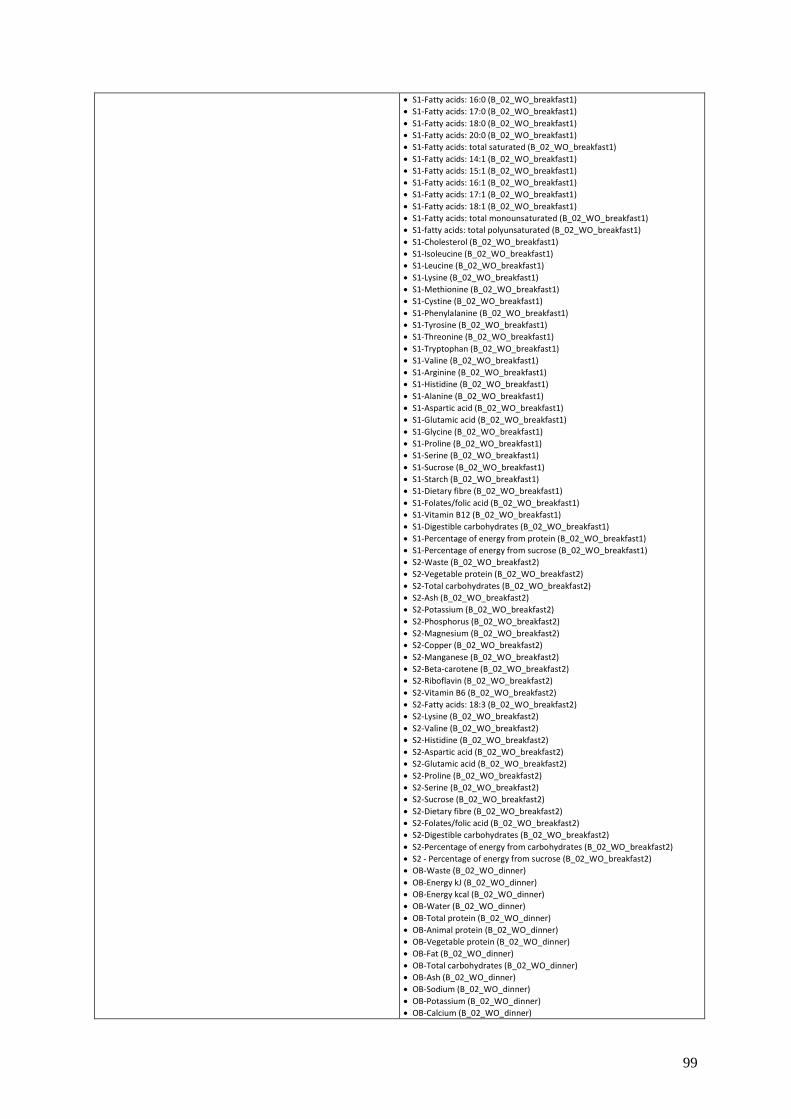
99
S1-Fatty acids: 16:0 (B_02_WO_breakfast1)
S1-Fatty acids: 17:0 (B_02_WO_breakfast1)
S1-Fatty acids: 18:0 (B_02_WO_breakfast1)
S1-Fatty acids: 20:0 (B_02_WO_breakfast1)
S1-Fatty acids: total saturated (B_02_WO_breakfast1)
S1-Fatty acids: 14:1 (B_02_WO_breakfast1)
S1-Fatty acids: 15:1 (B_02_WO_breakfast1)
S1-Fatty acids: 16:1 (B_02_WO_breakfast1)
S1-Fatty acids: 17:1 (B_02_WO_breakfast1)
S1-Fatty acids: 18:1 (B_02_WO_breakfast1)
S1-Fatty acids: total monounsaturated (B_02_WO_breakfast1)
S1-fatty acids: total polyunsaturated (B_02_WO_breakfast1)
S1-Cholesterol (B_02_WO_breakfast1)
S1-Isoleucine (B_02_WO_breakfast1)
S1-Leucine (B_02_WO_breakfast1)
S1-Lysine (B_02_WO_breakfast1)
S1-Methionine (B_02_WO_breakfast1)
S1-Cystine (B_02_WO_breakfast1)
S1-Phenylalanine (B_02_WO_breakfast1)
S1-Tyrosine (B_02_WO_breakfast1)
S1-Threonine (B_02_WO_breakfast1)
S1-Tryptophan (B_02_WO_breakfast1)
S1-Valine (B_02_WO_breakfast1)
S1-Arginine (B_02_WO_breakfast1)
S1-Histidine (B_02_WO_breakfast1)
S1-Alanine (B_02_WO_breakfast1)
S1-Aspartic acid (B_02_WO_breakfast1)
S1-Glutamic acid (B_02_WO_breakfast1)
S1-Glycine (B_02_WO_breakfast1)
S1-Proline (B_02_WO_breakfast1)
S1-Serine (B_02_WO_breakfast1)
S1-Sucrose (B_02_WO_breakfast1)
S1-Starch (B_02_WO_breakfast1)
S1-Dietary fibre (B_02_WO_breakfast1)
S1-Folates/folic acid (B_02_WO_breakfast1)
S1-Vitamin B12 (B_02_WO_breakfast1)
S1-Digestible carbohydrates (B_02_WO_breakfast1)
S1-Percentage of energy from protein (B_02_WO_breakfast1)
S1-Percentage of energy from sucrose (B_02_WO_breakfast1)
S2-Waste (B_02_WO_breakfast2)
S2-Vegetable protein (B_02_WO_breakfast2)
S2-Total carbohydrates (B_02_WO_breakfast2)
S2-Ash (B_02_WO_breakfast2)
S2-Potassium (B_02_WO_breakfast2)
S2-Phosphorus (B_02_WO_breakfast2)
S2-Magnesium (B_02_WO_breakfast2)
S2-Copper (B_02_WO_breakfast2)
S2-Manganese (B_02_WO_breakfast2)
S2-Beta-carotene (B_02_WO_breakfast2)
S2-Riboflavin (B_02_WO_breakfast2)
S2-Vitamin B6 (B_02_WO_breakfast2)
S2-Fatty acids: 18:3 (B_02_WO_breakfast2)
S2-Lysine (B_02_WO_breakfast2)
S2-Valine (B_02_WO_breakfast2)
S2-Histidine (B_02_WO_breakfast2)
S2-Aspartic acid (B_02_WO_breakfast2)
S2-Glutamic acid (B_02_WO_breakfast2)
S2-Proline (B_02_WO_breakfast2)
S2-Serine (B_02_WO_breakfast2)
S2-Sucrose (B_02_WO_breakfast2)
S2-Dietary fibre (B_02_WO_breakfast2)
S2-Folates/folic acid (B_02_WO_breakfast2)
S2-Digestible carbohydrates (B_02_WO_breakfast2)
S2-Percentage of energy from carbohydrates (B_02_WO_breakfast2)
S2 - Percentage of energy from sucrose (B_02_WO_breakfast2)
OB-Waste (B_02_WO_dinner)
OB-Energy kJ (B_02_WO_dinner)
OB-Energy kcal (B_02_WO_dinner)
OB-Water (B_02_WO_dinner)
OB-Total protein (B_02_WO_dinner)
OB-Animal protein (B_02_WO_dinner)
OB-Vegetable protein (B_02_WO_dinner)
OB-Fat (B_02_WO_dinner)
OB-Total carbohydrates (B_02_WO_dinner)
OB-Ash (B_02_WO_dinner)
OB-Sodium (B_02_WO_dinner)
OB-Potassium (B_02_WO_dinner)
OB-Calcium (B_02_WO_dinner)

100
OB-Phosphorus (B_02_WO_dinner)
OB-Magnesium (B_02_WO_dinner)
OB-Iron (B_02_WO_dinner)
OB-Zinc (B_02_WO_dinner)
OB-Copper (B_02_WO_dinner)
OB-Manganese (B_02_WO_dinner)
OB-Vitamin E (alpha-tocopherol equivalent) (B_02_WO_dinner)
OB-Thiamin (B_02_WO_dinner)
OB-Riboflavin (B_02_WO_dinner)
OB-Niacin (B_02_WO_dinner)
OB-Vitamin B6 (B_02_WO_dinner)
OB-Vitamin C (B_02_WO_dinner)
OB-Fatty acids: 4:0 (B_02_WO_dinner)
OB-Fatty acids: 6:0 (B_02_WO_dinner)
OB-Fatty acids: 8:0 (B_02_WO_dinner)
OB-Fatty acids: 10:0 (B_02_WO_dinner)
OB-Fatty acids: 12:0 (B_02_WO_dinner)
OB-Fatty acids: 14:0 (B_02_WO_dinner)
OB-Fatty acids: 15:0 (B_02_WO_dinner)
OB-Fatty acids: 16:0 (B_02_WO_dinner)
OB-Fatty acids: 17:0 (B_02_WO_dinner)
OB-Fatty acids: 18:0 (B_02_WO_dinner)
OB-Fatty acids: 20:0 (B_02_WO_dinner)
OB-fatty acids: total saturated (B_02_WO_dinner)
OB-Fatty acids: 14:1 (B_02_WO_dinner)
OB-Fatty acids: 15:1 (B_02_WO_dinner)
OB-Fatty acids: 16:1 (B_02_WO_dinner)
OB-Fatty acids: 17:1 (B_02_WO_dinner)
OB-Fatty acids: 18:1 (B_02_WO_dinner)
OB-Fatty acids: 20:1 (B_02_WO_dinner)
OB-fatty acids: total monounsaturated (B_02_WO_dinner)
OB-Fatty acids: 18:2 (B_02_WO_dinner)
OB-Fatty acids: 18:3 (B_02_WO_dinner)
OB-Fatty acids: 22:6 (B_02_WO_dinner)
OB-fatty acids: total polyunsaturated (B_02_WO_dinner)
OB-Cholesterol (B_02_WO_dinner)
OB-Isoleucine (B_02_WO_dinner)
OB-Leucine (B_02_WO_dinner)
OB-Lysine (B_02_WO_dinner)
OB-Methionine (B_02_WO_dinner)
OB-Cystine (B_02_WO_dinner)
OB-Phenylalanine (B_02_WO_dinner)
OB-Tyrosine (B_02_WO_dinner)
OB-Threonine (B_02_WO_dinner)
OB-Tryptophan (B_02_WO_dinner)
OB-Valine (B_02_WO_dinner)
OB-Arginine (B_02_WO_dinner)
OB-Histidine (B_02_WO_dinner)
OB-Alanine (B_02_WO_dinner)
OB-Aspartic acid (B_02_WO_dinner)
OB-Glutamic acid (B_02_WO_dinner)
OB-Glycine (B_02_WO_dinner)
OB-Proline (B_02_WO_dinner)
OB-Serine (B_02_WO_dinner)
OB-Sucrose (B_02_WO_dinner)
OB-Lactose (B_02_WO_dinner)
OB-Starch (B_02_WO_dinner)
OB-Dietary fibre (B_02_WO_dinner)
OB-Iodine (B_02_WO_dinner)
OB-Long-chain polyunsaturated fatty acids (B_02_WO_dinner)
OB-Digestible carbohydrates (B_02_WO_dinner)
OB-Nicotinamide (B_02_WO_dinner)
POD-Energy kJ (B_02_WO_high_tea)
POD-Energy kcal (B_02_WO_high_tea)
POD-Total protein (B_02_WO_high_tea)
POD-Animal protein (B_02_WO_high_tea)
POD-Vegetable protein (B_02_WO_high_tea)
POD-Fat (B_02_WO_high_tea)
POD-Ash (B_02_WO_high_tea)
POD-Fatty acids: 4:0 (B_02_WO_high_tea)
POD-Fatty acids: 6:0 (B_02_WO_high_tea)
POD-Fatty acids: 8:0 (B_02_WO_high_tea)
POD-Fatty acids: 10:0 (B_02_WO_high_tea)
POD-Fatty acids: 12:0 (B_02_WO_high_tea)
POD-Fatty acids: 14:0 (B_02_WO_high_tea)
POD-Fatty acids: 15:0 (B_02_WO_high_tea)
POD-Fatty acids: 16:0 (B_02_WO_high_tea)
POD-Fatty acids: 17:0 (B_02_WO_high_tea)

101
POD-Fatty acids: 18:0 (B_02_WO_high_tea)
POD-Fatty acids: 20:0 (B_02_WO_high_tea)
POD-Fatty acids: total saturated (B_02_WO_high_tea)
POD-Fatty acids: 14:1 (B_02_WO_high_tea)
POD-Fatty acids: 15:1 (B_02_WO_high_tea)
POD-Fatty acids: 16:1 (B_02_WO_high_tea)
POD-Fatty acids: 17:1 (B_02_WO_high_tea)
POD-Fatty acids: 18:1 (B_02_WO_high_tea)
POD-Fatty acids: total monounsaturated (B_02_WO_high_tea)
POD-Fatty acids: 18:3 (B_02_WO_high_tea)
POD-fatty acids: total polyunsaturated (B_02_WO_high_tea)
POD-Isoleucine (B_02_WO_high_tea)
POD-Leucine (B_02_WO_high_tea)
POD-Lysine (B_02_WO_high_tea)
POD-Methionine (B_02_WO_high_tea)
POD-Cystine (B_02_WO_high_tea)
POD-Phenylalanine (B_02_WO_high_tea)
POD-Tyrosine (B_02_WO_high_tea)
POD-Threonine (B_02_WO_high_tea)
POD-Tryptophan (B_02_WO_high_tea)
POD-Valine (B_02_WO_high_tea)
POD-Arginine (B_02_WO_high_tea)
POD-Histidine (B_02_WO_high_tea)
POD-Alanine (B_02_WO_high_tea)
POD-Aspartic acid (B_02_WO_high_tea)
POD-Glutamic acid (B_02_WO_high_tea)
POD-Glycine (B_02_WO_high_tea)
POD-Proline (B_02_WO_high_tea)
POD-Serine (B_02_WO_high_tea)
POD-Sucrose (B_02_WO_high_tea)
K-Energy kJ (B_02_WO_supper)
K-Energy kcal (B_02_WO_supper)
K-Total protein (B_02_WO_supper)
K-Animal protein (B_02_WO_supper)
K-Vegetable protein (B_02_WO_supper)
K-Fat (B_02_WO_supper)
K-Ash (B_02_WO_supper)
K-Sodium (B_02_WO_supper)
K-Potassium (B_02_WO_supper)
K-Phosphorus (B_02_WO_supper)
K-Magnesium (B_02_WO_supper)
K-Manganese (B_02_WO_supper)
K-Beta-carotene (B_02_WO_supper)
K-Riboflavin (B_02_WO_supper)
K-Fatty acids: 4:0 (B_02_WO_supper)
K-Fatty acids: 6:0 (B_02_WO_supper)
K-Fatty acids: 8:0 (B_02_WO_supper)
K-Fatty acids: 10:0 (B_02_WO_supper)
K-Fatty acids: 12:0 (B_02_WO_supper)
K-Fatty acids: 14:0 (B_02_WO_supper)
K-Fatty acids: 15:0 (B_02_WO_supper)
K-Fatty acids: 16:0 (B_02_WO_supper)
K-Fatty acids: 17:0 (B_02_WO_supper)
K-Fatty acids: 18:0 (B_02_WO_supper)
K-Fatty acids: 20:0 (B_02_WO_supper)
K-Fatty acids: total saturated (B_02_WO_supper)
K-Fatty acids: 14:1 (B_02_WO_supper)
K-Fatty acids: 15:1 (B_02_WO_supper)
K-Fatty acids: 16:1 (B_02_WO_supper)
K-Fatty acids: 17:1 (B_02_WO_supper)
K-Fatty acids: 18:1 (B_02_WO_supper)
K-Fatty acids: 20:1 (B_02_WO_supper)
K-Fatty acids: 22:1 (B_02_WO_supper)
K-Fatty acids: total monounsaturated (B_02_WO_supper)
K-Fatty acids: 20:4 (B_02_WO_supper)
K-Fatty acids: 22:6 (B_02_WO_supper)
K-Fatty acids: total polyunsaturated (B_02_WO_supper)
K-Cholesterol (B_02_WO_supper)
K-Isoleucine (B_02_WO_supper)
K-Leucine (B_02_WO_supper)
K-Lysine (B_02_WO_supper)
K-Methionine (B_02_WO_supper)
K-Cystine (B_02_WO_supper)
K-Phenylalanine (B_02_WO_supper)
K-Tyrosine (B_02_WO_supper)
K-Threonine (B_02_WO_supper)
K-Tryptophan (B_02_WO_supper)
K-Valine (B_02_WO_supper)
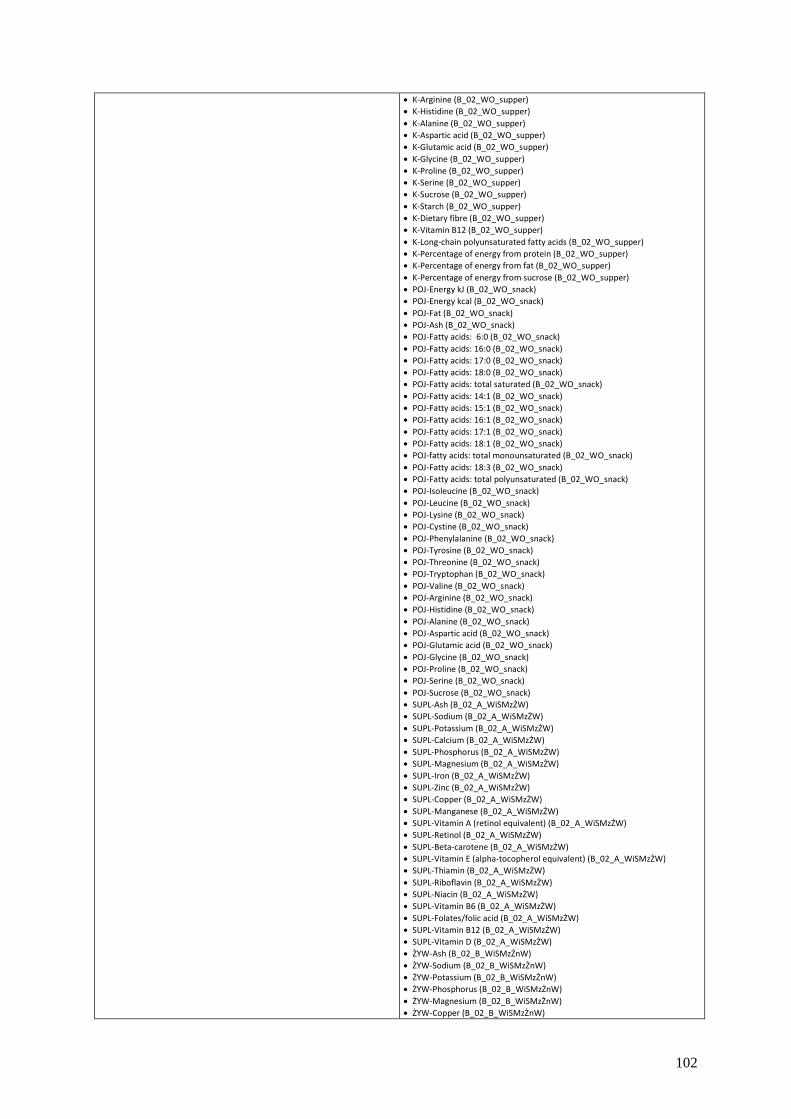
102
K-Arginine (B_02_WO_supper)
K-Histidine (B_02_WO_supper)
K-Alanine (B_02_WO_supper)
K-Aspartic acid (B_02_WO_supper)
K-Glutamic acid (B_02_WO_supper)
K-Glycine (B_02_WO_supper)
K-Proline (B_02_WO_supper)
K-Serine (B_02_WO_supper)
K-Sucrose (B_02_WO_supper)
K-Starch (B_02_WO_supper)
K-Dietary fibre (B_02_WO_supper)
K-Vitamin B12 (B_02_WO_supper)
K-Long-chain polyunsaturated fatty acids (B_02_WO_supper)
K-Percentage of energy from protein (B_02_WO_supper)
K-Percentage of energy from fat (B_02_WO_supper)
K-Percentage of energy from sucrose (B_02_WO_supper)
POJ-Energy kJ (B_02_WO_snack)
POJ-Energy kcal (B_02_WO_snack)
POJ-Fat (B_02_WO_snack)
POJ-Ash (B_02_WO_snack)
POJ-Fatty acids: 6:0 (B_02_WO_snack)
POJ-Fatty acids: 16:0 (B_02_WO_snack)
POJ-Fatty acids: 17:0 (B_02_WO_snack)
POJ-Fatty acids: 18:0 (B_02_WO_snack)
POJ-Fatty acids: total saturated (B_02_WO_snack)
POJ-Fatty acids: 14:1 (B_02_WO_snack)
POJ-Fatty acids: 15:1 (B_02_WO_snack)
POJ-Fatty acids: 16:1 (B_02_WO_snack)
POJ-Fatty acids: 17:1 (B_02_WO_snack)
POJ-Fatty acids: 18:1 (B_02_WO_snack)
POJ-fatty acids: total monounsaturated (B_02_WO_snack)
POJ-Fatty acids: 18:3 (B_02_WO_snack)
POJ-Fatty acids: total polyunsaturated (B_02_WO_snack)
POJ-Isoleucine (B_02_WO_snack)
POJ-Leucine (B_02_WO_snack)
POJ-Lysine (B_02_WO_snack)
POJ-Cystine (B_02_WO_snack)
POJ-Phenylalanine (B_02_WO_snack)
POJ-Tyrosine (B_02_WO_snack)
POJ-Threonine (B_02_WO_snack)
POJ-Tryptophan (B_02_WO_snack)
POJ-Valine (B_02_WO_snack)
POJ-Arginine (B_02_WO_snack)
POJ-Histidine (B_02_WO_snack)
POJ-Alanine (B_02_WO_snack)
POJ-Aspartic acid (B_02_WO_snack)
POJ-Glutamic acid (B_02_WO_snack)
POJ-Glycine (B_02_WO_snack)
POJ-Proline (B_02_WO_snack)
POJ-Serine (B_02_WO_snack)
POJ-Sucrose (B_02_WO_snack)
SUPL-Ash (B_02_A_WiSMzŻW)
SUPL-Sodium (B_02_A_WiSMzŻW)
SUPL-Potassium (B_02_A_WiSMzŻW)
SUPL-Calcium (B_02_A_WiSMzŻW)
SUPL-Phosphorus (B_02_A_WiSMzŻW)
SUPL-Magnesium (B_02_A_WiSMzŻW)
SUPL-Iron (B_02_A_WiSMzŻW)
SUPL-Zinc (B_02_A_WiSMzŻW)
SUPL-Copper (B_02_A_WiSMzŻW)
SUPL-Manganese (B_02_A_WiSMzŻW)
SUPL-Vitamin A (retinol equivalent) (B_02_A_WiSMzŻW)
SUPL-Retinol (B_02_A_WiSMzŻW)
SUPL-Beta-carotene (B_02_A_WiSMzŻW)
SUPL-Vitamin E (alpha-tocopherol equivalent) (B_02_A_WiSMzŻW)
SUPL-Thiamin (B_02_A_WiSMzŻW)
SUPL-Riboflavin (B_02_A_WiSMzŻW)
SUPL-Niacin (B_02_A_WiSMzŻW)
SUPL-Vitamin B6 (B_02_A_WiSMzŻW)
SUPL-Folates/folic acid (B_02_A_WiSMzŻW)
SUPL-Vitamin B12 (B_02_A_WiSMzŻW)
SUPL-Vitamin D (B_02_A_WiSMzŻW)
ŻYW-Ash (B_02_B_WiSMzŻnW)
ŻYW-Sodium (B_02_B_WiSMzŻnW)
ŻYW-Potassium (B_02_B_WiSMzŻnW)
ŻYW-Phosphorus (B_02_B_WiSMzŻnW)
ŻYW-Magnesium (B_02_B_WiSMzŻnW)
ŻYW-Copper (B_02_B_WiSMzŻnW)

103
ŻYW-Manganese (B_02_B_WiSMzŻnW)
ŻYW-Riboflavin (B_02_B_WiSMzŻnW)
ŻYW-Vitamin B12 (B_02_B_WiSMzŻnW)
Cereal products based on flour P2 (B_04_Product_consumption)
Bread P3 (B_04_Product_consumption)
Total potatoes P2 (B_04_Product_consumption)
Total fruits and vegetables P2 (B_04_Product_consumption)
Fruits, market product P3 (B_04_Product_consumption)
Juices, fruit and vegetable drinks and nectars P2 (B_04_Product_consumption)
Rennet cheese P2 (B_04_Product_consumption)
Cottage cheese (sliced and in containers) P3 (B_04_Product_consumption)
Meat and poultry based on boneless meat P2 (B_04_Product_consumption)
Cold meat, sausage and prepared products based on boneless meat P2 (B_04_Product_consumption)
Eggs, market product P2 (B_04_Product_consumption)
Total fats P1 (B_04_Product_consumption)
Butter and cream based on butter P2 (B_04_Product_consumption)
Margarine P2 (B_04_Product_consumption)
Sugar, sweets, honey based on sugar P1 (B_04_Product_consumption)
Sugar / sucrose P2 (B_04_Product_consumption)
Tea, infusions without sugar P4 (B_04_Product_consumption)
A significant relation between the nutritional value of daily food ration and child's sex was found in the following cases: Cholesterol (B_02_WO_DFR)
Lactose (B_02_WO_DFR)
S1-Waste (B_02_WO_breakfast1)
S1-Fatty acids: 18:4 (B_02_WO_breakfast1)
S2-Total carbohydrates (B_02_WO_breakfast2)
S2-Fatty acids: 20:1 (B_02_WO_breakfast2)
S2-Fatty acids: 20:4 (B_02_WO_breakfast2)
S2-Fatty acids: 20:5 (B_02_WO_breakfast2)
S2-Fatty acids: 22:5 (B_02_WO_breakfast2)
S2-Sucrose (B_02_WO_breakfast2)
S2-Dietary fibre (B_02_WO_breakfast2)
S2-Folates/folic acid (B_02_WO_breakfast2)
S2-Digestible carbohydrates (B_02_WO_breakfast2)
S2 - Percentage of energy from sucrose (B_02_WO_breakfast2)
OB-Water (B_02_WO_dinner)
OB-Calcium (B_02_WO_dinner)
OB-Iron (B_02_WO_dinner)
OB-Zinc (B_02_WO_dinner)
OB-Riboflavin (B_02_WO_dinner)
K-Niacin (B_02_WO_supper)
K-Fatty acids: 20:5 (B_02_WO_supper)
K-Taurine (B_02_WO_supper)
POJ-Energy kJ (B_02_WO_snack)
POJ-Energy kcal (B_02_WO_snack)
POJ-Water (B_02_WO_snack)
POJ-Total protein (B_02_WO_snack)
POJ-Animal protein (B_02_WO_snack)
POJ-Fat (B_02_WO_snack)
POJ-Total carbohydrates (B_02_WO_snack)
POJ-Sodium (B_02_WO_snack)
POJ-Calcium (B_02_WO_snack)
POJ-Phosphorus (B_02_WO_snack)
POJ-Iron (B_02_WO_snack)
POJ-Zinc (B_02_WO_snack)
POJ-Vitamin A (retinol equivalent) (B_02_WO_snack)
POJ-Retinol (B_02_WO_snack)
POJ-Beta-carotene (B_02_WO_snack)
POJ-Riboflavin (B_02_WO_snack)
POJ-Fatty acids: 8:0 (B_02_WO_snack)
POJ-Fatty acids: 12:0 (B_02_WO_snack)
POJ-Fatty acids: 14:0 (B_02_WO_snack)
POJ-Fatty acids: 17:0 (B_02_WO_snack)
POJ-Fatty acids: total saturated (B_02_WO_snack)
POJ-Fatty acids: 14:1 (B_02_WO_snack)
POJ-Fatty acids: 15:1 (B_02_WO_snack)
POJ-Fatty acids: 16:1 (B_02_WO_snack)
POJ-fatty acids: total monounsaturated (B_02_WO_snack)
POJ-Fatty acids: 18:3 (B_02_WO_snack)
POJ-Fatty acids: total polyunsaturated (B_02_WO_snack)
POJ-Cholesterol (B_02_WO_snack)
POJ-Sucrose (B_02_WO_snack)
POJ-Lactose (B_02_WO_snack)
POJ-vitamin B12 (B_02_WO_snack)

104
POJ-vitamin D (B_02_WO_snack)
POJ-Digestible carbohydrates (B_02_WO_snack)
Total fruits and vegetables P2 (B_04_Product_consumption)
Fruits, market product P3 (B_04_Product_consumption)
Milk and dairy products based on milk P1 (B_04_Product_consumption)
Eggs, market product P2 (B_04_Product_consumption)
A significant relation between the nutritional value of daily food ration and place of residence was found in the following cases: Waste (B_02_WO_DFR)
Vitamin C (B_02_WO_DFR)
Fatty acids: 18:3 (B_02_WO_DFR)
Dietary fibre (B_02_WO_DFR)
Percentage of energy from fat (B_02_WO_DFR)
Percentage of energy from carbohydrates (B_02_WO_DFR)
S1-Copper (B_02_WO_breakfast1)
S1-Fatty acids: total saturated (B_02_WO_breakfast1)
S1-Fatty acids: 18:3 (B_02_WO_breakfast1)
S1-fatty acids: total polyunsaturated (B_02_WO_breakfast1)
S2-Waste (B_02_WO_breakfast2)
S2-Calcium (B_02_WO_breakfast2)
S2-Manganese (B_02_WO_breakfast2)
S2-Beta-carotene (B_02_WO_breakfast2)
S2-Riboflavin (B_02_WO_breakfast2)
S2-Lactose (B_02_WO_breakfast2)
S2-L-carnitine (B_02_WO_breakfast2)
OB-Waste (B_02_WO_dinner)
OB-Energy kJ (B_02_WO_dinner)
OB-Energy kcal (B_02_WO_dinner)
OB-Water (B_02_WO_dinner)
OB-Total protein (B_02_WO_dinner)
OB-Vegetable protein (B_02_WO_dinner)
OB-Fat (B_02_WO_dinner)
OB-Total carbohydrates (B_02_WO_dinner)
OB-Ash (B_02_WO_dinner)
OB-Sodium (B_02_WO_dinner)
OB-Potassium (B_02_WO_dinner)
OB-Phosphorus (B_02_WO_dinner)
OB-Magnesium (B_02_WO_dinner)
OB-Iron (B_02_WO_dinner)
OB-Zinc (B_02_WO_dinner)
OB-Copper (B_02_WO_dinner)
OB-Manganese (B_02_WO_dinner)
OB-Retinol (B_02_WO_dinner)
OB-Vitamin E (alpha-tocopherol equivalent) (B_02_WO_dinner)
OB-Riboflavin (B_02_WO_dinner)
OB-Vitamin B6 (B_02_WO_dinner)
OB-Vitamin C (B_02_WO_dinner)
OB-Fatty acids: 4:0 (B_02_WO_dinner)
OB-Fatty acids: 6:0 (B_02_WO_dinner)
OB-Fatty acids: 8:0 (B_02_WO_dinner)
OB-Fatty acids: 10:0 (B_02_WO_dinner)
OB-Fatty acids: 12:0 (B_02_WO_dinner)
OB-Fatty acids: 14:0 (B_02_WO_dinner)
OB-Fatty acids: 15:0 (B_02_WO_dinner)
OB-Fatty acids: 16:0 (B_02_WO_dinner)
OB-Fatty acids: 17:0 (B_02_WO_dinner)
OB-Fatty acids: 18:0 (B_02_WO_dinner)
OB-Fatty acids: 20:0 (B_02_WO_dinner)
OB-fatty acids: total saturated (B_02_WO_dinner)
OB-Fatty acids: 14:1 (B_02_WO_dinner)
OB-Fatty acids: 16:1 (B_02_WO_dinner)
OB-Fatty acids: 17:1 (B_02_WO_dinner)
OB-Fatty acids: 18:1 (B_02_WO_dinner)
OB-fatty acids: total monounsaturated (B_02_WO_dinner)
OB-Fatty acids: 18:3 (B_02_WO_dinner)
OB-fatty acids: total polyunsaturated (B_02_WO_dinner)
OB-Cholesterol (B_02_WO_dinner)
OB-Isoleucine (B_02_WO_dinner)
OB-Leucine (B_02_WO_dinner)
OB-Lysine (B_02_WO_dinner)
OB-Methionine (B_02_WO_dinner)
OB-Cystine (B_02_WO_dinner)
OB-Phenylalanine (B_02_WO_dinner)
OB-Tyrosine (B_02_WO_dinner)
OB-Threonine (B_02_WO_dinner)
OB-Tryptophan (B_02_WO_dinner)
OB-Valine (B_02_WO_dinner)

105
OB-Arginine (B_02_WO_dinner)
OB-Histidine (B_02_WO_dinner)
OB-Alanine (B_02_WO_dinner)
OB-Aspartic acid (B_02_WO_dinner)
OB-Glutamic acid (B_02_WO_dinner)
OB-Glycine (B_02_WO_dinner)
OB-Proline (B_02_WO_dinner)
OB-Serine (B_02_WO_dinner)
OB-Sucrose (B_02_WO_dinner)
OB-Starch (B_02_WO_dinner)
OB-Dietary fibre (B_02_WO_dinner)
OB-Folates/folic acid (B_02_WO_dinner)
OB-vitamin B12 (B_02_WO_dinner)
OB-Digestible carbohydrates (B_02_WO_dinner)
SUB-Total carbohydrates (B_02_WO_high_tea)
POD-Vitamin C (B_02_WO_high_tea)
POD-Fatty acids: 18:1 (B_02_WO_high_tea)
POD-Fatty acids: total monounsaturated (B_02_WO_high_tea)
POD-Fatty acids: 18:2 (B_02_WO_high_tea)
POD-Fatty acids: 18:4 (B_02_WO_high_tea)
POD-fatty acids: total polyunsaturated (B_02_WO_high_tea)
POD-Sucrose (B_02_WO_high_tea)
POD-Folates/folic acid (B_02_WO_high_tea)
POD-vitamin D (B_02_WO_high_tea)
POD-Digestible carbohydrates (B_02_WO_high_tea)
K-Percentage of energy from carbohydrates (B_02_WO_supper)
POJ-Animal protein (B_02_WO_snack)
POJ-vitamin B12 (B_02_WO_snack)
SUPL-Vitamin D (B_02_A_WiSMzŻW)
ŻYW-Vitamin C (B_02_B_WiSMzŻnW)
Groat and rice P3 (B_04_Product_consumption)
Total fruits and vegetables P2 (B_04_Product_consumption)
Vegetables, market product P3 (B_04_Product_consumption)
Juices, fruit and vegetable drinks and nectars P2 (B_04_Product_consumption)
Total fats P1 (B_04_Product_consumption)
Water P3 (B_04_Product_consumption)
A significant relation between the nutritional value of daily food ration and education of mother was found in the following cases: Energy kJ (B_02_WO_DFR)
Energy kcal (B_02_WO_DFR)
Total protein (B_02_WO_DFR)
Animal protein (B_02_WO_DFR)
Vegetable protein (B_02_WO_DFR)
Fat (B_02_WO_DFR)
Ash (B_02_WO_DFR)
Sodium (B_02_WO_DFR)
Potassium (B_02_WO_DFR)
Magnesium (B_02_WO_DFR)
Manganese (B_02_WO_DFR)
Riboflavin (B_02_WO_DFR)
Vitamin B6 (B_02_WO_DFR)
Fatty acids: 8:0 (B_02_WO_DFR)
Fatty acids: 12:0 (B_02_WO_DFR)
Fatty acids: 15:0 (B_02_WO_DFR)
Fatty acids: 16:0 (B_02_WO_DFR)
Fatty acids: 17:0 (B_02_WO_DFR)
Fatty acids: 18:0 (B_02_WO_DFR)
Fatty acids: 20:0 (B_02_WO_DFR)
Fatty acids: 14:1 (B_02_WO_DFR)
Fatty acids: 15:1 (B_02_WO_DFR)
Fatty acids: 16:1 (B_02_WO_DFR)
Fatty acids: 17:1 (B_02_WO_DFR)
Fatty acids: 18:1 (B_02_WO_DFR)
Fatty acids: 20:1 (B_02_WO_DFR)
Fatty acids: Total monounsaturated (B_02_WO_DFR)
Fatty acids: 22:5 (B_02_WO_DFR)
Isoleucine (B_02_WO_DFR)
Leucine (B_02_WO_DFR)
Lysine (B_02_WO_DFR)
Methionine (B_02_WO_DFR)
Cystine (B_02_WO_DFR)
Phenylalanine (B_02_WO_DFR)
Tyrosine (B_02_WO_DFR)
Threonine (B_02_WO_DFR)
Tryptophan (B_02_WO_DFR)
Valine (B_02_WO_DFR)
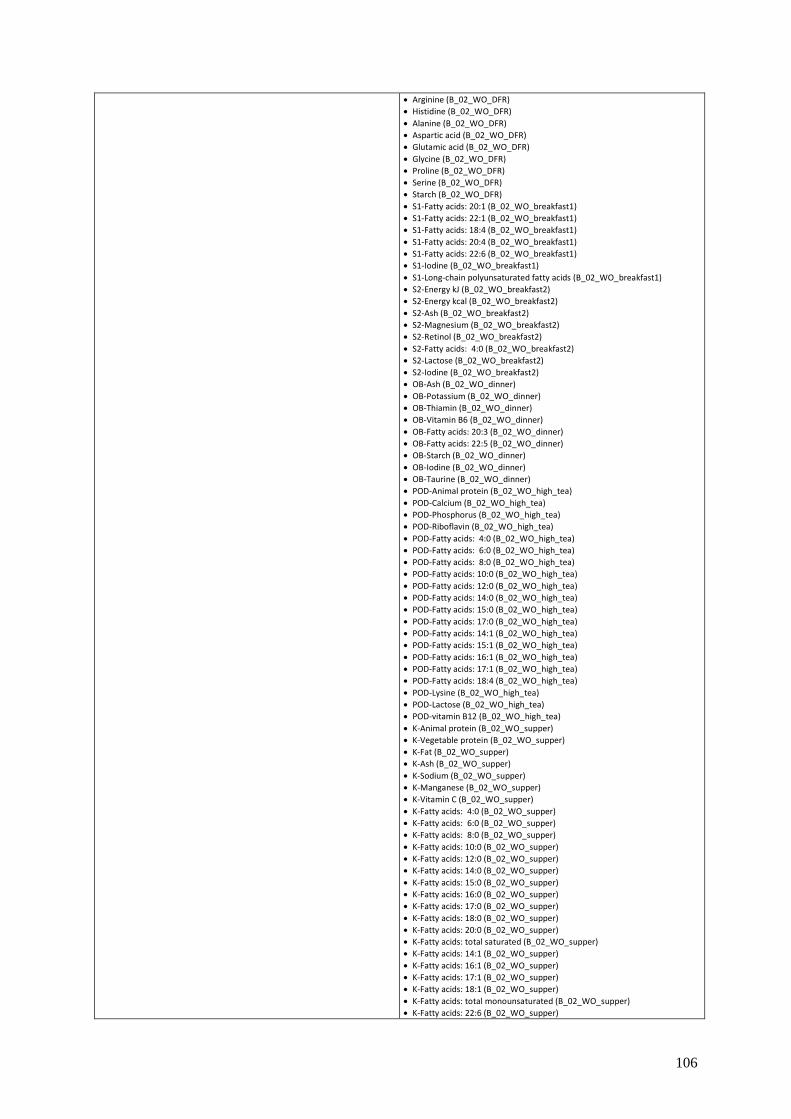
106
Arginine (B_02_WO_DFR)
Histidine (B_02_WO_DFR)
Alanine (B_02_WO_DFR)
Aspartic acid (B_02_WO_DFR)
Glutamic acid (B_02_WO_DFR)
Glycine (B_02_WO_DFR)
Proline (B_02_WO_DFR)
Serine (B_02_WO_DFR)
Starch (B_02_WO_DFR)
S1-Fatty acids: 20:1 (B_02_WO_breakfast1)
S1-Fatty acids: 22:1 (B_02_WO_breakfast1)
S1-Fatty acids: 18:4 (B_02_WO_breakfast1)
S1-Fatty acids: 20:4 (B_02_WO_breakfast1)
S1-Fatty acids: 22:6 (B_02_WO_breakfast1)
S1-Iodine (B_02_WO_breakfast1)
S1-Long-chain polyunsaturated fatty acids (B_02_WO_breakfast1)
S2-Energy kJ (B_02_WO_breakfast2)
S2-Energy kcal (B_02_WO_breakfast2)
S2-Ash (B_02_WO_breakfast2)
S2-Magnesium (B_02_WO_breakfast2)
S2-Retinol (B_02_WO_breakfast2)
S2-Fatty acids: 4:0 (B_02_WO_breakfast2)
S2-Lactose (B_02_WO_breakfast2)
S2-Iodine (B_02_WO_breakfast2)
OB-Ash (B_02_WO_dinner)
OB-Potassium (B_02_WO_dinner)
OB-Thiamin (B_02_WO_dinner)
OB-Vitamin B6 (B_02_WO_dinner)
OB-Fatty acids: 20:3 (B_02_WO_dinner)
OB-Fatty acids: 22:5 (B_02_WO_dinner)
OB-Starch (B_02_WO_dinner)
OB-Iodine (B_02_WO_dinner)
OB-Taurine (B_02_WO_dinner)
POD-Animal protein (B_02_WO_high_tea)
POD-Calcium (B_02_WO_high_tea)
POD-Phosphorus (B_02_WO_high_tea)
POD-Riboflavin (B_02_WO_high_tea)
POD-Fatty acids: 4:0 (B_02_WO_high_tea)
POD-Fatty acids: 6:0 (B_02_WO_high_tea)
POD-Fatty acids: 8:0 (B_02_WO_high_tea)
POD-Fatty acids: 10:0 (B_02_WO_high_tea)
POD-Fatty acids: 12:0 (B_02_WO_high_tea)
POD-Fatty acids: 14:0 (B_02_WO_high_tea)
POD-Fatty acids: 15:0 (B_02_WO_high_tea)
POD-Fatty acids: 17:0 (B_02_WO_high_tea)
POD-Fatty acids: 14:1 (B_02_WO_high_tea)
POD-Fatty acids: 15:1 (B_02_WO_high_tea)
POD-Fatty acids: 16:1 (B_02_WO_high_tea)
POD-Fatty acids: 17:1 (B_02_WO_high_tea)
POD-Fatty acids: 18:4 (B_02_WO_high_tea)
POD-Lysine (B_02_WO_high_tea)
POD-Lactose (B_02_WO_high_tea)
POD-vitamin B12 (B_02_WO_high_tea)
K-Animal protein (B_02_WO_supper)
K-Vegetable protein (B_02_WO_supper)
K-Fat (B_02_WO_supper)
K-Ash (B_02_WO_supper)
K-Sodium (B_02_WO_supper)
K-Manganese (B_02_WO_supper)
K-Vitamin C (B_02_WO_supper)
K-Fatty acids: 4:0 (B_02_WO_supper)
K-Fatty acids: 6:0 (B_02_WO_supper)
K-Fatty acids: 8:0 (B_02_WO_supper)
K-Fatty acids: 10:0 (B_02_WO_supper)
K-Fatty acids: 12:0 (B_02_WO_supper)
K-Fatty acids: 14:0 (B_02_WO_supper)
K-Fatty acids: 15:0 (B_02_WO_supper)
K-Fatty acids: 16:0 (B_02_WO_supper)
K-Fatty acids: 17:0 (B_02_WO_supper)
K-Fatty acids: 18:0 (B_02_WO_supper)
K-Fatty acids: 20:0 (B_02_WO_supper)
K-Fatty acids: total saturated (B_02_WO_supper)
K-Fatty acids: 14:1 (B_02_WO_supper)
K-Fatty acids: 16:1 (B_02_WO_supper)
K-Fatty acids: 17:1 (B_02_WO_supper)
K-Fatty acids: 18:1 (B_02_WO_supper)
K-Fatty acids: total monounsaturated (B_02_WO_supper)
K-Fatty acids: 22:6 (B_02_WO_supper)
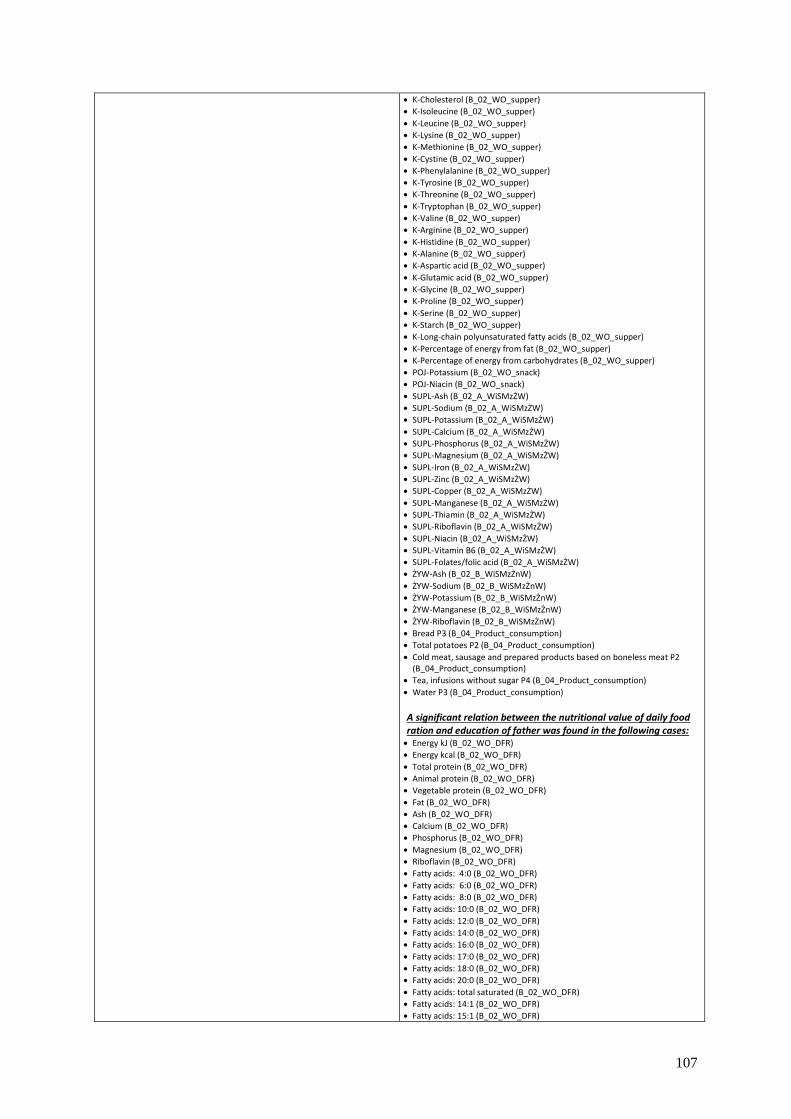
107
K-Cholesterol (B_02_WO_supper)
K-Isoleucine (B_02_WO_supper)
K-Leucine (B_02_WO_supper)
K-Lysine (B_02_WO_supper)
K-Methionine (B_02_WO_supper)
K-Cystine (B_02_WO_supper)
K-Phenylalanine (B_02_WO_supper)
K-Tyrosine (B_02_WO_supper)
K-Threonine (B_02_WO_supper)
K-Tryptophan (B_02_WO_supper)
K-Valine (B_02_WO_supper)
K-Arginine (B_02_WO_supper)
K-Histidine (B_02_WO_supper)
K-Alanine (B_02_WO_supper)
K-Aspartic acid (B_02_WO_supper)
K-Glutamic acid (B_02_WO_supper)
K-Glycine (B_02_WO_supper)
K-Proline (B_02_WO_supper)
K-Serine (B_02_WO_supper)
K-Starch (B_02_WO_supper)
K-Long-chain polyunsaturated fatty acids (B_02_WO_supper)
K-Percentage of energy from fat (B_02_WO_supper)
K-Percentage of energy from carbohydrates (B_02_WO_supper)
POJ-Potassium (B_02_WO_snack)
POJ-Niacin (B_02_WO_snack)
SUPL-Ash (B_02_A_WiSMzŻW)
SUPL-Sodium (B_02_A_WiSMzŻW)
SUPL-Potassium (B_02_A_WiSMzŻW)
SUPL-Calcium (B_02_A_WiSMzŻW)
SUPL-Phosphorus (B_02_A_WiSMzŻW)
SUPL-Magnesium (B_02_A_WiSMzŻW)
SUPL-Iron (B_02_A_WiSMzŻW)
SUPL-Zinc (B_02_A_WiSMzŻW)
SUPL-Copper (B_02_A_WiSMzŻW)
SUPL-Manganese (B_02_A_WiSMzŻW)
SUPL-Thiamin (B_02_A_WiSMzŻW)
SUPL-Riboflavin (B_02_A_WiSMzŻW)
SUPL-Niacin (B_02_A_WiSMzŻW)
SUPL-Vitamin B6 (B_02_A_WiSMzŻW)
SUPL-Folates/folic acid (B_02_A_WiSMzŻW)
ŻYW-Ash (B_02_B_WiSMzŻnW)
ŻYW-Sodium (B_02_B_WiSMzŻnW)
ŻYW-Potassium (B_02_B_WiSMzŻnW)
ŻYW-Manganese (B_02_B_WiSMzŻnW)
ŻYW-Riboflavin (B_02_B_WiSMzŻnW)
Bread P3 (B_04_Product_consumption)
Total potatoes P2 (B_04_Product_consumption)
Cold meat, sausage and prepared products based on boneless meat P2 (B_04_Product_consumption)
Tea, infusions without sugar P4 (B_04_Product_consumption)
Water P3 (B_04_Product_consumption)
A significant relation between the nutritional value of daily food ration and education of father was found in the following cases: Energy kJ (B_02_WO_DFR)
Energy kcal (B_02_WO_DFR)
Total protein (B_02_WO_DFR)
Animal protein (B_02_WO_DFR)
Vegetable protein (B_02_WO_DFR)
Fat (B_02_WO_DFR)
Ash (B_02_WO_DFR)
Calcium (B_02_WO_DFR)
Phosphorus (B_02_WO_DFR)
Magnesium (B_02_WO_DFR)
Riboflavin (B_02_WO_DFR)
Fatty acids: 4:0 (B_02_WO_DFR)
Fatty acids: 6:0 (B_02_WO_DFR)
Fatty acids: 8:0 (B_02_WO_DFR)
Fatty acids: 10:0 (B_02_WO_DFR)
Fatty acids: 12:0 (B_02_WO_DFR)
Fatty acids: 14:0 (B_02_WO_DFR)
Fatty acids: 16:0 (B_02_WO_DFR)
Fatty acids: 17:0 (B_02_WO_DFR)
Fatty acids: 18:0 (B_02_WO_DFR)
Fatty acids: 20:0 (B_02_WO_DFR)
Fatty acids: total saturated (B_02_WO_DFR)
Fatty acids: 14:1 (B_02_WO_DFR)
Fatty acids: 15:1 (B_02_WO_DFR)

108
Fatty acids: 16:1 (B_02_WO_DFR)
Fatty acids: 17:1 (B_02_WO_DFR)
Fatty acids: 18:1 (B_02_WO_DFR)
Fatty acids: Total monounsaturated (B_02_WO_DFR)
Fatty acids: 18:4 (B_02_WO_DFR)
Cholesterol (B_02_WO_DFR)
Isoleucine (B_02_WO_DFR)
Leucine (B_02_WO_DFR)
Lysine (B_02_WO_DFR)
Methionine (B_02_WO_DFR)
Cystine (B_02_WO_DFR)
Phenylalanine (B_02_WO_DFR)
Tyrosine (B_02_WO_DFR)
Threonine (B_02_WO_DFR)
Tryptophan (B_02_WO_DFR)
Valine (B_02_WO_DFR)
Histidine (B_02_WO_DFR)
Alanine (B_02_WO_DFR)
Aspartic acid (B_02_WO_DFR)
Glutamic acid (B_02_WO_DFR)
Glycine (B_02_WO_DFR)
Proline (B_02_WO_DFR)
Serine (B_02_WO_DFR)
Starch (B_02_WO_DFR)
Digestible carbohydrates (B_02_WO_DFR)
S1-Total protein (B_02_WO_breakfast1)
S1-Fat (B_02_WO_breakfast1)
S1-Vitamin A (retinol equivalent) (B_02_WO_breakfast1)
S1-Retinol (B_02_WO_breakfast1)
S1-Vitamin E (alpha-tocopherol equivalent) (B_02_WO_breakfast1)
S1-Vitamin C (B_02_WO_breakfast1)
S1-Fatty acids: 20:0 (B_02_WO_breakfast1)
S1-Fatty acids: 16:1 (B_02_WO_breakfast1)
S1-vitamin D (B_02_WO_breakfast1)
S1-Iodine (B_02_WO_breakfast1)
S1-Percentage of energy from fat (B_02_WO_breakfast1)
S1-Percentage of energy from carbohydrates (B_02_WO_breakfast1)
S2-Vegetable protein (B_02_WO_breakfast2)
S2-Total carbohydrates (B_02_WO_breakfast2)
S2-Magnesium (B_02_WO_breakfast2)
S2-Copper (B_02_WO_breakfast2)
S2-Vitamin A (retinol equivalent) (B_02_WO_breakfast2)
S2-Fatty acids: 4:0 (B_02_WO_breakfast2)
S2-Cystine (B_02_WO_breakfast2)
S2-Starch (B_02_WO_breakfast2)
S2-Dietary fibre (B_02_WO_breakfast2)
S2-Digestible carbohydrates (B_02_WO_breakfast2)
POD-Energy kJ (B_02_WO_high_tea)
POD-Energy kcal (B_02_WO_high_tea)
POD-Water (B_02_WO_high_tea)
POD-Total protein (B_02_WO_high_tea)
POD-Animal protein (B_02_WO_high_tea)
SUB-Total carbohydrates (B_02_WO_high_tea)
POD-Calcium (B_02_WO_high_tea)
POD-Phosphorus (B_02_WO_high_tea)
POD-Magnesium (B_02_WO_high_tea)
POD-Iron (B_02_WO_high_tea)
POD-Zinc (B_02_WO_high_tea)
POD-Copper (B_02_WO_high_tea)
POD-Vitamin A (retinol equivalent) (B_02_WO_high_tea)
POD-Retinol (B_02_WO_high_tea)
POD-Riboflavin (B_02_WO_high_tea)
POD-Niacin (B_02_WO_high_tea)
POD-Vitamin C (B_02_WO_high_tea)
POD-Fatty acids: 4:0 (B_02_WO_high_tea)
POD-Fatty acids: 6:0 (B_02_WO_high_tea)
POD-Fatty acids: 8:0 (B_02_WO_high_tea)
POD-Fatty acids: 10:0 (B_02_WO_high_tea)
POD-Fatty acids: 12:0 (B_02_WO_high_tea)
POD-Fatty acids: 14:0 (B_02_WO_high_tea)
POD-Fatty acids: 15:0 (B_02_WO_high_tea)
POD-Fatty acids: 18:0 (B_02_WO_high_tea)
POD-Fatty acids: 20:0 (B_02_WO_high_tea)
POD-Fatty acids: 18:4 (B_02_WO_high_tea)
POD-Lysine (B_02_WO_high_tea)
POD-Tryptophan (B_02_WO_high_tea)
POD-Lactose (B_02_WO_high_tea)
POD-Folates/folic acid (B_02_WO_high_tea)
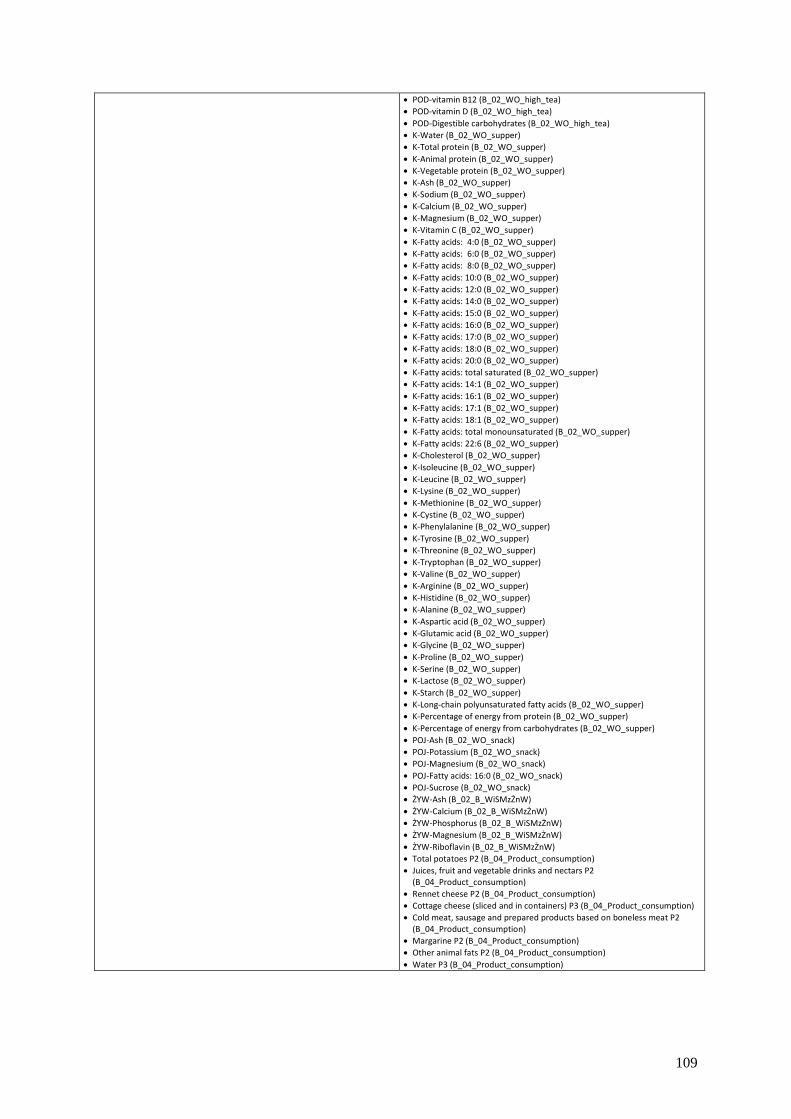
109
POD-vitamin B12 (B_02_WO_high_tea)
POD-vitamin D (B_02_WO_high_tea)
POD-Digestible carbohydrates (B_02_WO_high_tea)
K-Water (B_02_WO_supper)
K-Total protein (B_02_WO_supper)
K-Animal protein (B_02_WO_supper)
K-Vegetable protein (B_02_WO_supper)
K-Ash (B_02_WO_supper)
K-Sodium (B_02_WO_supper)
K-Calcium (B_02_WO_supper)
K-Magnesium (B_02_WO_supper)
K-Vitamin C (B_02_WO_supper)
K-Fatty acids: 4:0 (B_02_WO_supper)
K-Fatty acids: 6:0 (B_02_WO_supper)
K-Fatty acids: 8:0 (B_02_WO_supper)
K-Fatty acids: 10:0 (B_02_WO_supper)
K-Fatty acids: 12:0 (B_02_WO_supper)
K-Fatty acids: 14:0 (B_02_WO_supper)
K-Fatty acids: 15:0 (B_02_WO_supper)
K-Fatty acids: 16:0 (B_02_WO_supper)
K-Fatty acids: 17:0 (B_02_WO_supper)
K-Fatty acids: 18:0 (B_02_WO_supper)
K-Fatty acids: 20:0 (B_02_WO_supper)
K-Fatty acids: total saturated (B_02_WO_supper)
K-Fatty acids: 14:1 (B_02_WO_supper)
K-Fatty acids: 16:1 (B_02_WO_supper)
K-Fatty acids: 17:1 (B_02_WO_supper)
K-Fatty acids: 18:1 (B_02_WO_supper)
K-Fatty acids: total monounsaturated (B_02_WO_supper)
K-Fatty acids: 22:6 (B_02_WO_supper)
K-Cholesterol (B_02_WO_supper)
K-Isoleucine (B_02_WO_supper)
K-Leucine (B_02_WO_supper)
K-Lysine (B_02_WO_supper)
K-Methionine (B_02_WO_supper)
K-Cystine (B_02_WO_supper)
K-Phenylalanine (B_02_WO_supper)
K-Tyrosine (B_02_WO_supper)
K-Threonine (B_02_WO_supper)
K-Tryptophan (B_02_WO_supper)
K-Valine (B_02_WO_supper)
K-Arginine (B_02_WO_supper)
K-Histidine (B_02_WO_supper)
K-Alanine (B_02_WO_supper)
K-Aspartic acid (B_02_WO_supper)
K-Glutamic acid (B_02_WO_supper)
K-Glycine (B_02_WO_supper)
K-Proline (B_02_WO_supper)
K-Serine (B_02_WO_supper)
K-Lactose (B_02_WO_supper)
K-Starch (B_02_WO_supper)
K-Long-chain polyunsaturated fatty acids (B_02_WO_supper)
K-Percentage of energy from protein (B_02_WO_supper)
K-Percentage of energy from carbohydrates (B_02_WO_supper)
POJ-Ash (B_02_WO_snack)
POJ-Potassium (B_02_WO_snack)
POJ-Magnesium (B_02_WO_snack)
POJ-Fatty acids: 16:0 (B_02_WO_snack)
POJ-Sucrose (B_02_WO_snack)
ŻYW-Ash (B_02_B_WiSMzŻnW)
ŻYW-Calcium (B_02_B_WiSMzŻnW)
ŻYW-Phosphorus (B_02_B_WiSMzŻnW)
ŻYW-Magnesium (B_02_B_WiSMzŻnW)
ŻYW-Riboflavin (B_02_B_WiSMzŻnW)
Total potatoes P2 (B_04_Product_consumption)
Juices, fruit and vegetable drinks and nectars P2 (B_04_Product_consumption)
Rennet cheese P2 (B_04_Product_consumption)
Cottage cheese (sliced and in containers) P3 (B_04_Product_consumption)
Cold meat, sausage and prepared products based on boneless meat P2 (B_04_Product_consumption)
Margarine P2 (B_04_Product_consumption)
Other animal fats P2 (B_04_Product_consumption)
Water P3 (B_04_Product_consumption)
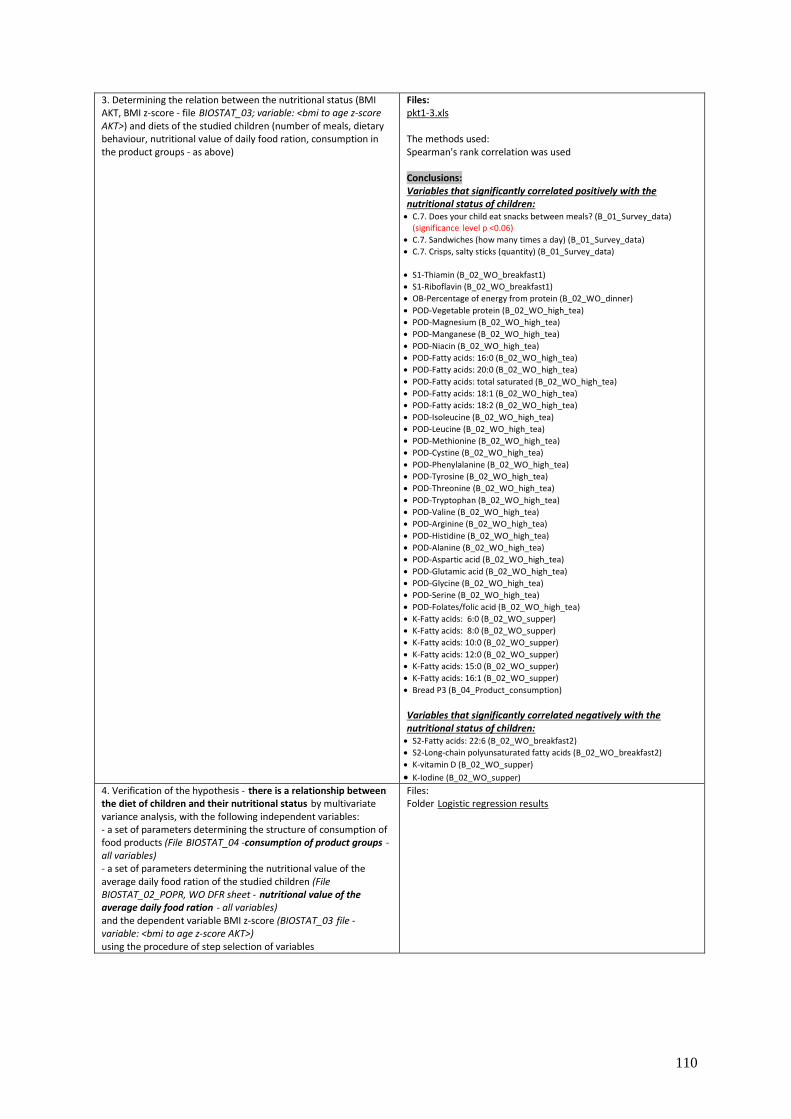
110
3. Determining the relation between the nutritional status (BMI AKT, BMI z-score - file BIOSTAT_03; variable: <bmi to age z-score AKT>) and diets of the studied children (number of meals, dietary behaviour, nutritional value of daily food ration, consumption in the product groups - as above)
Files: pkt1-3.xls The methods used: Spearman's rank correlation was used Conclusions: Variables that significantly correlated positively with the nutritional status of children: C.7. Does your child eat snacks between meals? (B_01_Survey_data)
(significance level p <0.06)
C.7. Sandwiches (how many times a day) (B_01_Survey_data)
C.7. Crisps, salty sticks (quantity) (B_01_Survey_data)
S1-Thiamin (B_02_WO_breakfast1)
S1-Riboflavin (B_02_WO_breakfast1)
OB-Percentage of energy from protein (B_02_WO_dinner)
POD-Vegetable protein (B_02_WO_high_tea)
POD-Magnesium (B_02_WO_high_tea)
POD-Manganese (B_02_WO_high_tea)
POD-Niacin (B_02_WO_high_tea)
POD-Fatty acids: 16:0 (B_02_WO_high_tea)
POD-Fatty acids: 20:0 (B_02_WO_high_tea)
POD-Fatty acids: total saturated (B_02_WO_high_tea)
POD-Fatty acids: 18:1 (B_02_WO_high_tea)
POD-Fatty acids: 18:2 (B_02_WO_high_tea)
POD-Isoleucine (B_02_WO_high_tea)
POD-Leucine (B_02_WO_high_tea)
POD-Methionine (B_02_WO_high_tea)
POD-Cystine (B_02_WO_high_tea)
POD-Phenylalanine (B_02_WO_high_tea)
POD-Tyrosine (B_02_WO_high_tea)
POD-Threonine (B_02_WO_high_tea)
POD-Tryptophan (B_02_WO_high_tea)
POD-Valine (B_02_WO_high_tea)
POD-Arginine (B_02_WO_high_tea)
POD-Histidine (B_02_WO_high_tea)
POD-Alanine (B_02_WO_high_tea)
POD-Aspartic acid (B_02_WO_high_tea)
POD-Glutamic acid (B_02_WO_high_tea)
POD-Glycine (B_02_WO_high_tea)
POD-Serine (B_02_WO_high_tea)
POD-Folates/folic acid (B_02_WO_high_tea)
K-Fatty acids: 6:0 (B_02_WO_supper)
K-Fatty acids: 8:0 (B_02_WO_supper)
K-Fatty acids: 10:0 (B_02_WO_supper)
K-Fatty acids: 12:0 (B_02_WO_supper)
K-Fatty acids: 15:0 (B_02_WO_supper)
K-Fatty acids: 16:1 (B_02_WO_supper)
Bread P3 (B_04_Product_consumption)
Variables that significantly correlated negatively with the nutritional status of children: S2-Fatty acids: 22:6 (B_02_WO_breakfast2)
S2-Long-chain polyunsaturated fatty acids (B_02_WO_breakfast2)
K-vitamin D (B_02_WO_supper)
K-Iodine (B_02_WO_supper)
4. Verification of the hypothesis - there is a relationship between the diet of children and their nutritional status by multivariate variance analysis, with the following independent variables: - a set of parameters determining the structure of consumption of food products (File BIOSTAT_04 -consumption of product groups - all variables) - a set of parameters determining the nutritional value of the average daily food ration of the studied children (File BIOSTAT_02_POPR, WO DFR sheet - nutritional value of the average daily food ration - all variables) and the dependent variable BMI z-score (BIOSTAT_03 file - variable: <bmi to age z-score AKT>) using the procedure of step selection of variables
Files: Folder Logistic regression results
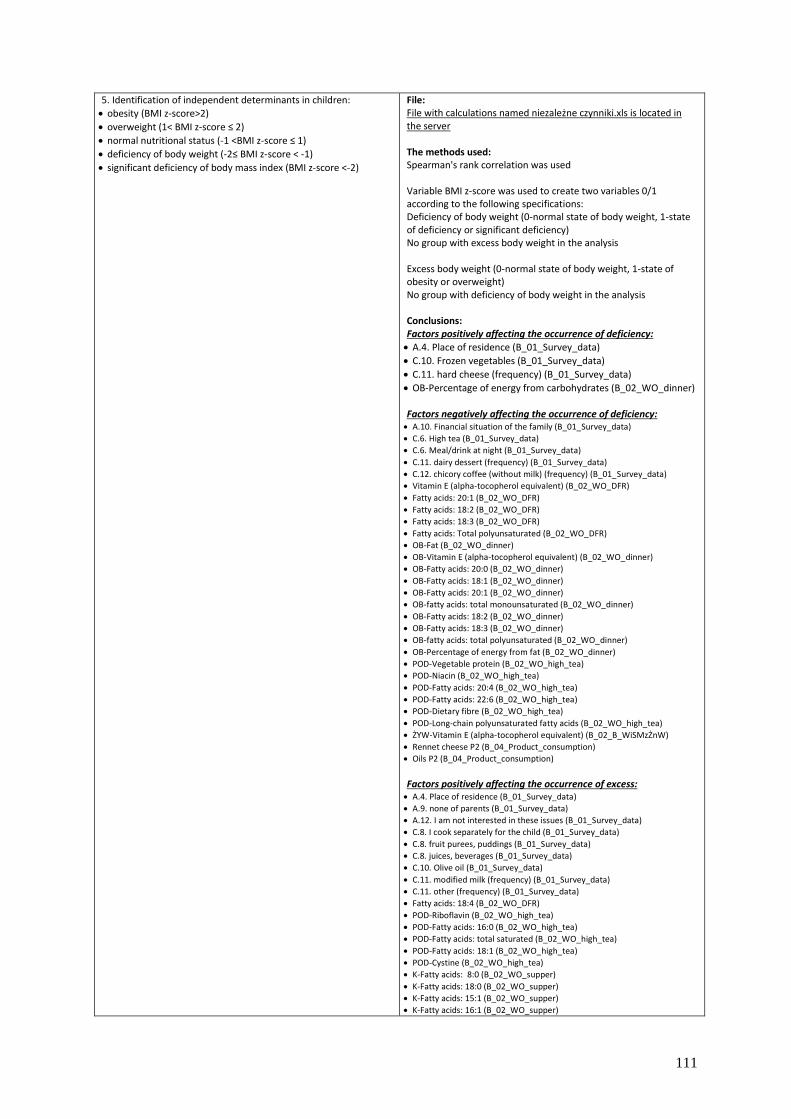
111
5. Identification of independent determinants in children:
obesity (BMI z-score>2)
overweight (1< BMI z-score ≤ 2)
normal nutritional status (-1 <BMI z-score ≤ 1)
deficiency of body weight (-2≤ BMI z-score < -1)
significant deficiency of body mass index (BMI z-score <-2)
File: File with calculations named niezależne czynniki.xls is located in the server The methods used: Spearman's rank correlation was used Variable BMI z-score was used to create two variables 0/1 according to the following specifications: Deficiency of body weight (0-normal state of body weight, 1-state of deficiency or significant deficiency) No group with excess body weight in the analysis Excess body weight (0-normal state of body weight, 1-state of obesity or overweight) No group with deficiency of body weight in the analysis Conclusions: Factors positively affecting the occurrence of deficiency:
A.4. Place of residence (B_01_Survey_data)
C.10. Frozen vegetables (B_01_Survey_data)
C.11. hard cheese (frequency) (B_01_Survey_data)
OB-Percentage of energy from carbohydrates (B_02_WO_dinner) Factors negatively affecting the occurrence of deficiency: A.10. Financial situation of the family (B_01_Survey_data)
C.6. High tea (B_01_Survey_data)
C.6. Meal/drink at night (B_01_Survey_data)
C.11. dairy dessert (frequency) (B_01_Survey_data)
C.12. chicory coffee (without milk) (frequency) (B_01_Survey_data)
Vitamin E (alpha-tocopherol equivalent) (B_02_WO_DFR)
Fatty acids: 20:1 (B_02_WO_DFR)
Fatty acids: 18:2 (B_02_WO_DFR)
Fatty acids: 18:3 (B_02_WO_DFR)
Fatty acids: Total polyunsaturated (B_02_WO_DFR)
OB-Fat (B_02_WO_dinner)
OB-Vitamin E (alpha-tocopherol equivalent) (B_02_WO_dinner)
OB-Fatty acids: 20:0 (B_02_WO_dinner)
OB-Fatty acids: 18:1 (B_02_WO_dinner)
OB-Fatty acids: 20:1 (B_02_WO_dinner)
OB-fatty acids: total monounsaturated (B_02_WO_dinner)
OB-Fatty acids: 18:2 (B_02_WO_dinner)
OB-Fatty acids: 18:3 (B_02_WO_dinner)
OB-fatty acids: total polyunsaturated (B_02_WO_dinner)
OB-Percentage of energy from fat (B_02_WO_dinner)
POD-Vegetable protein (B_02_WO_high_tea)
POD-Niacin (B_02_WO_high_tea)
POD-Fatty acids: 20:4 (B_02_WO_high_tea)
POD-Fatty acids: 22:6 (B_02_WO_high_tea)
POD-Dietary fibre (B_02_WO_high_tea)
POD-Long-chain polyunsaturated fatty acids (B_02_WO_high_tea)
ŻYW-Vitamin E (alpha-tocopherol equivalent) (B_02_B_WiSMzŻnW)
Rennet cheese P2 (B_04_Product_consumption)
Oils P2 (B_04_Product_consumption)
Factors positively affecting the occurrence of excess: A.4. Place of residence (B_01_Survey_data)
A.9. none of parents (B_01_Survey_data)
A.12. I am not interested in these issues (B_01_Survey_data)
C.8. I cook separately for the child (B_01_Survey_data)
C.8. fruit purees, puddings (B_01_Survey_data)
C.8. juices, beverages (B_01_Survey_data)
C.10. Olive oil (B_01_Survey_data)
C.11. modified milk (frequency) (B_01_Survey_data)
C.11. other (frequency) (B_01_Survey_data)
Fatty acids: 18:4 (B_02_WO_DFR)
POD-Riboflavin (B_02_WO_high_tea)
POD-Fatty acids: 16:0 (B_02_WO_high_tea)
POD-Fatty acids: total saturated (B_02_WO_high_tea)
POD-Fatty acids: 18:1 (B_02_WO_high_tea)
POD-Cystine (B_02_WO_high_tea)
K-Fatty acids: 8:0 (B_02_WO_supper)
K-Fatty acids: 18:0 (B_02_WO_supper)
K-Fatty acids: 15:1 (B_02_WO_supper)
K-Fatty acids: 16:1 (B_02_WO_supper)
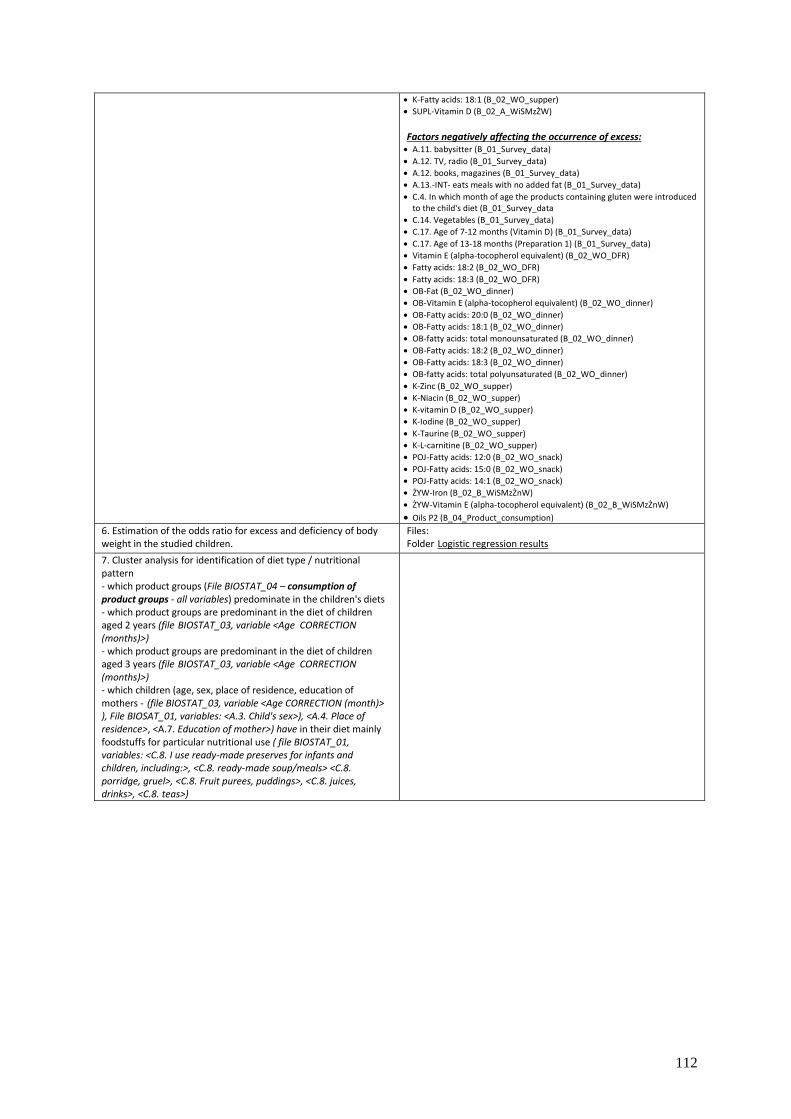
112
K-Fatty acids: 18:1 (B_02_WO_supper)
SUPL-Vitamin D (B_02_A_WiSMzŻW)
Factors negatively affecting the occurrence of excess: A.11. babysitter (B_01_Survey_data)
A.12. TV, radio (B_01_Survey_data)
A.12. books, magazines (B_01_Survey_data)
A.13.-INT- eats meals with no added fat (B_01_Survey_data)
C.4. In which month of age the products containing gluten were introduced to the child's diet (B_01_Survey_data
C.14. Vegetables (B_01_Survey_data)
C.17. Age of 7-12 months (Vitamin D) (B_01_Survey_data)
C.17. Age of 13-18 months (Preparation 1) (B_01_Survey_data)
Vitamin E (alpha-tocopherol equivalent) (B_02_WO_DFR)
Fatty acids: 18:2 (B_02_WO_DFR)
Fatty acids: 18:3 (B_02_WO_DFR)
OB-Fat (B_02_WO_dinner)
OB-Vitamin E (alpha-tocopherol equivalent) (B_02_WO_dinner)
OB-Fatty acids: 20:0 (B_02_WO_dinner)
OB-Fatty acids: 18:1 (B_02_WO_dinner)
OB-fatty acids: total monounsaturated (B_02_WO_dinner)
OB-Fatty acids: 18:2 (B_02_WO_dinner)
OB-Fatty acids: 18:3 (B_02_WO_dinner)
OB-fatty acids: total polyunsaturated (B_02_WO_dinner)
K-Zinc (B_02_WO_supper)
K-Niacin (B_02_WO_supper)
K-vitamin D (B_02_WO_supper)
K-Iodine (B_02_WO_supper)
K-Taurine (B_02_WO_supper)
K-L-carnitine (B_02_WO_supper)
POJ-Fatty acids: 12:0 (B_02_WO_snack)
POJ-Fatty acids: 15:0 (B_02_WO_snack)
POJ-Fatty acids: 14:1 (B_02_WO_snack)
ŻYW-Iron (B_02_B_WiSMzŻnW)
ŻYW-Vitamin E (alpha-tocopherol equivalent) (B_02_B_WiSMzŻnW)
Oils P2 (B_04_Product_consumption)
6. Estimation of the odds ratio for excess and deficiency of body weight in the studied children.
Files: Folder Logistic regression results
7. Cluster analysis for identification of diet type / nutritional pattern - which product groups (File BIOSTAT_04 – consumption of product groups - all variables) predominate in the children's diets - which product groups are predominant in the diet of children aged 2 years (file BIOSTAT_03, variable <Age CORRECTION (months)>) - which product groups are predominant in the diet of children aged 3 years (file BIOSTAT_03, variable <Age CORRECTION (months)>) - which children (age, sex, place of residence, education of mothers - (file BIOSTAT_03, variable <Age CORRECTION (month)> ), File BIOSAT_01, variables: <A.3. Child's sex>), <A.4. Place of residence>, <A.7. Education of mother>) have in their diet mainly foodstuffs for particular nutritional use ( file BIOSTAT_01, variables: <C.8. I use ready-made preserves for infants and children, including:>, <C.8. ready-made soup/meals> <C.8. porridge, gruel>, <C.8. Fruit purees, puddings>, <C.8. juices, drinks>, <C.8. teas>)

113
II. In the microscale:
1. Preparation of descriptive statistics and frequency for the characteristics of the entire group and in division into subgroups based on:
a. children's age (2 years old/13-24 months old, 3 years old/25-36 months old) (file BIOSTAT_03, variable <Age CORRECTION (month)> )
b. nutritional status (BIOSTAT_03 file - variable: <bmi to age z-score AKT>)
obesity (BMI z-score>2) overweight (1< BMI z-score ≤ 2) normal nutritional status (-1 <BMI z-score ≤ 1) deficiency of body weight (-2≤ BMI z-score < -1) significant deficiency of body mass index (BMI z-score <-2) c. diet in the first year of life breastfed and not breastfed (File BIOSTAT_01, variable <C.1.
Was the child breastfed during the first year of life (from birth to 12 months of age)?>)
and the introduction of complementary foods (File BIOSTAT_01, variables: <C.3. When the first complementary products were introduced - FRUITS>, <C.3. When the first complementary products were introduced - VEGETABLES>, <C.3. When the first complementary products were introduced - PORRIDGE, GRUEL WITHOUT MILK>, <C.3. When the first complementary products were introduced - MILK, MILK PORRIDGE>, <C.3. When the first complementary products were introduced - OTHER>, <C.4. In which month of age the products containing gluten were introduced to the child's diet>, <C.5. Were fish introduced to the child's diet in the second half year of his/her life?>
d. education of parents (File BIOSAT_01, variables:<A.7. Education of mother>, <A.7. Education of father>)
e. place of residence (File BIOSAT_01, variable <A.4. Place of residence>)
File: Changed - Dodatkowe_czII_p1.xlsx Conclusions: These lists do not require a summary in this study due to their nature.
f. current diet (part D of the survey)
File: Zmieniony - Dodatkowe_czII_p1.xlsx Conclusions: These lists do not require a summary in this study due to their nature.
Analyses that allow obtaining answers to the following study problems (see Table)
No.
Study problems Parameters / variables
1. How are children aged 13-36 months fed?
do they eat 4-5 meals a day
File BIOSTAT_01 - variables: frequency of consumption of particular meals: <C.6. 1st breakfast>, <C.6. 2nd breakfast>, <C.6. Soup>, <C.6. Main course>, <C.6. High tea>, <C.6. Supper>, <C.6. Meal / snack before bedtime>, <C.6. Meal/drink at night>
File: Dodatkowe_czII_p2_1.xlsx Conclusions: Less than 47% of children eat 4-5 meals a daily. About 36% of children eat more than 5 meals daily.
do they receive products from 6 groups
File BIOSTAT_04 - consumption of product groups - all variables
New file added: Spożycie 6 grup.xlsx
is the intake of energy, protein, carbohydrate and fat correct
what is the nutritional value of the average daily food ration
what is the nutritional value of particular meals
is the intake of Ca, Vitamin D, Fe, and fibre in line with the recommendations / standards
File BIOSTAT_02_POPR, the nutritional value of the average daily food ration - all variables; the nutritional value of particular meals - all variables, the intake of vitamins and minerals from unenriched food and enriched food - all variables
New file: spożycie dzienne poszczególnych składników.xlsx
2. Are there differences in the diet of children who are 2 and 3 years old?
Diet (definition): number of meals, dietary behaviour, nutritional value of daily food ration, consumption of the product groups.
Files: Mikroskala pkt2.2;3;4;6;7;8;9;10.xlsx
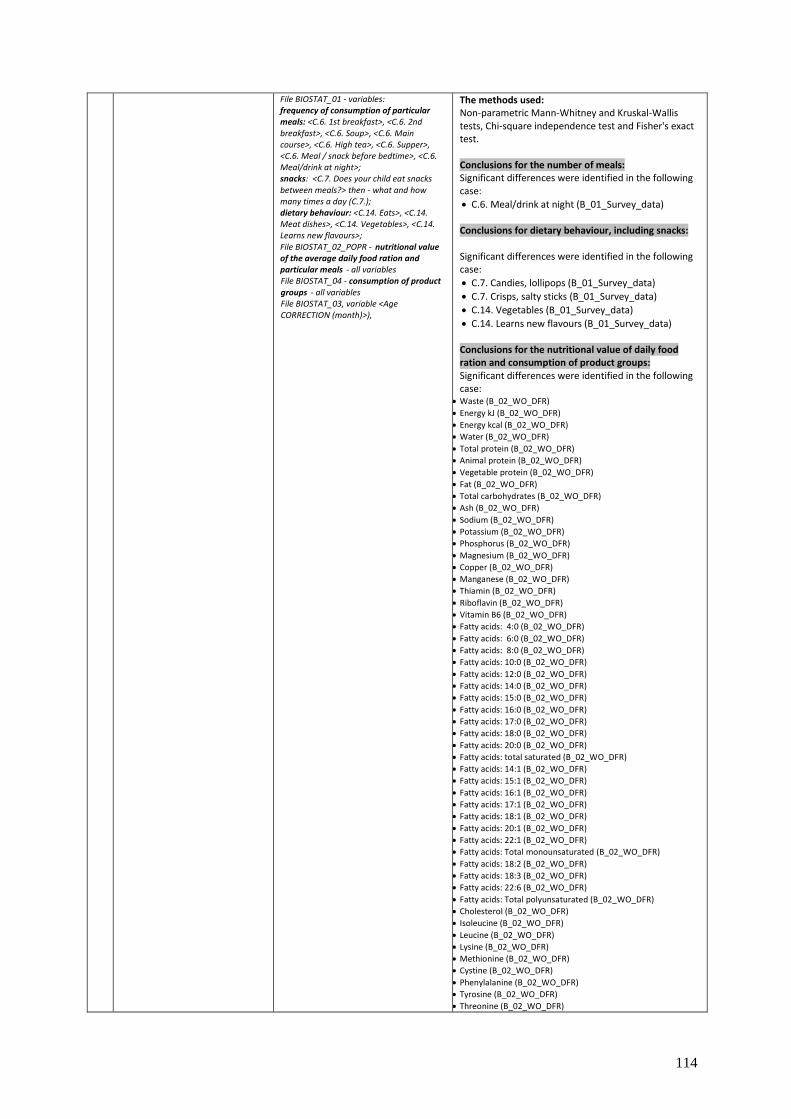
114
File BIOSTAT_01 - variables: frequency of consumption of particular meals: <C.6. 1st breakfast>, <C.6. 2nd breakfast>, <C.6. Soup>, <C.6. Main course>, <C.6. High tea>, <C.6. Supper>, <C.6. Meal / snack before bedtime>, <C.6. Meal/drink at night>; snacks: <C.7. Does your child eat snacks between meals?> then - what and how many times a day (C.7.); dietary behaviour: <C.14. Eats>, <C.14. Meat dishes>, <C.14. Vegetables>, <C.14. Learns new flavours>; File BIOSTAT_02_POPR - nutritional value of the average daily food ration and particular meals - all variables File BIOSTAT_04 - consumption of product groups - all variables File BIOSTAT_03, variable <Age CORRECTION (month)>),
The methods used: Non-parametric Mann-Whitney and Kruskal-Wallis tests, Chi-square independence test and Fisher's exact test. Conclusions for the number of meals: Significant differences were identified in the following case:
C.6. Meal/drink at night (B_01_Survey_data) Conclusions for dietary behaviour, including snacks: Significant differences were identified in the following case:
C.7. Candies, lollipops (B_01_Survey_data)
C.7. Crisps, salty sticks (B_01_Survey_data)
C.14. Vegetables (B_01_Survey_data)
C.14. Learns new flavours (B_01_Survey_data) Conclusions for the nutritional value of daily food ration and consumption of product groups: Significant differences were identified in the following case:
Waste (B_02_WO_DFR)
Energy kJ (B_02_WO_DFR)
Energy kcal (B_02_WO_DFR)
Water (B_02_WO_DFR)
Total protein (B_02_WO_DFR)
Animal protein (B_02_WO_DFR)
Vegetable protein (B_02_WO_DFR)
Fat (B_02_WO_DFR)
Total carbohydrates (B_02_WO_DFR)
Ash (B_02_WO_DFR)
Sodium (B_02_WO_DFR)
Potassium (B_02_WO_DFR)
Phosphorus (B_02_WO_DFR)
Magnesium (B_02_WO_DFR)
Copper (B_02_WO_DFR)
Manganese (B_02_WO_DFR)
Thiamin (B_02_WO_DFR)
Riboflavin (B_02_WO_DFR)
Vitamin B6 (B_02_WO_DFR)
Fatty acids: 4:0 (B_02_WO_DFR)
Fatty acids: 6:0 (B_02_WO_DFR)
Fatty acids: 8:0 (B_02_WO_DFR)
Fatty acids: 10:0 (B_02_WO_DFR)
Fatty acids: 12:0 (B_02_WO_DFR)
Fatty acids: 14:0 (B_02_WO_DFR)
Fatty acids: 15:0 (B_02_WO_DFR)
Fatty acids: 16:0 (B_02_WO_DFR)
Fatty acids: 17:0 (B_02_WO_DFR)
Fatty acids: 18:0 (B_02_WO_DFR)
Fatty acids: 20:0 (B_02_WO_DFR)
Fatty acids: total saturated (B_02_WO_DFR)
Fatty acids: 14:1 (B_02_WO_DFR)
Fatty acids: 15:1 (B_02_WO_DFR)
Fatty acids: 16:1 (B_02_WO_DFR)
Fatty acids: 17:1 (B_02_WO_DFR)
Fatty acids: 18:1 (B_02_WO_DFR)
Fatty acids: 20:1 (B_02_WO_DFR)
Fatty acids: 22:1 (B_02_WO_DFR)
Fatty acids: Total monounsaturated (B_02_WO_DFR)
Fatty acids: 18:2 (B_02_WO_DFR)
Fatty acids: 18:3 (B_02_WO_DFR)
Fatty acids: 22:6 (B_02_WO_DFR)
Fatty acids: Total polyunsaturated (B_02_WO_DFR)
Cholesterol (B_02_WO_DFR)
Isoleucine (B_02_WO_DFR)
Leucine (B_02_WO_DFR)
Lysine (B_02_WO_DFR)
Methionine (B_02_WO_DFR)
Cystine (B_02_WO_DFR)
Phenylalanine (B_02_WO_DFR)
Tyrosine (B_02_WO_DFR)
Threonine (B_02_WO_DFR)
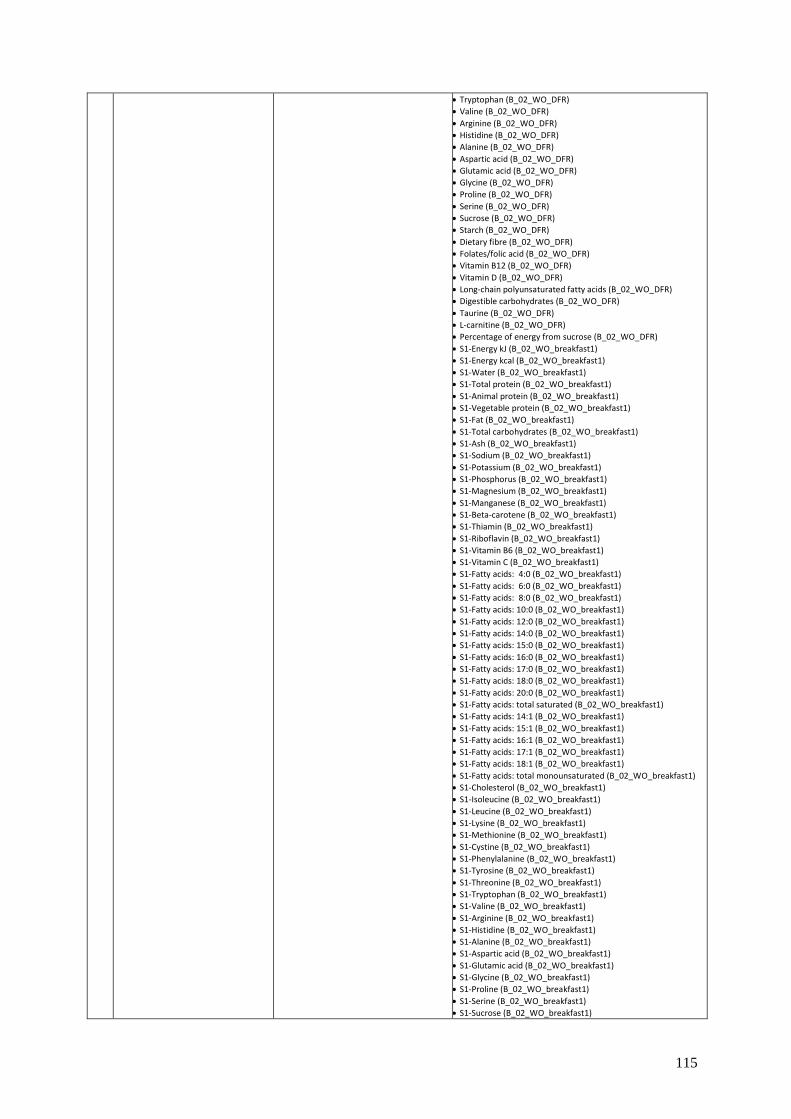
115
Tryptophan (B_02_WO_DFR)
Valine (B_02_WO_DFR)
Arginine (B_02_WO_DFR)
Histidine (B_02_WO_DFR)
Alanine (B_02_WO_DFR)
Aspartic acid (B_02_WO_DFR)
Glutamic acid (B_02_WO_DFR)
Glycine (B_02_WO_DFR)
Proline (B_02_WO_DFR)
Serine (B_02_WO_DFR)
Sucrose (B_02_WO_DFR)
Starch (B_02_WO_DFR)
Dietary fibre (B_02_WO_DFR)
Folates/folic acid (B_02_WO_DFR)
Vitamin B12 (B_02_WO_DFR)
Vitamin D (B_02_WO_DFR)
Long-chain polyunsaturated fatty acids (B_02_WO_DFR)
Digestible carbohydrates (B_02_WO_DFR)
Taurine (B_02_WO_DFR)
L-carnitine (B_02_WO_DFR)
Percentage of energy from sucrose (B_02_WO_DFR)
S1-Energy kJ (B_02_WO_breakfast1)
S1-Energy kcal (B_02_WO_breakfast1)
S1-Water (B_02_WO_breakfast1)
S1-Total protein (B_02_WO_breakfast1)
S1-Animal protein (B_02_WO_breakfast1)
S1-Vegetable protein (B_02_WO_breakfast1)
S1-Fat (B_02_WO_breakfast1)
S1-Total carbohydrates (B_02_WO_breakfast1)
S1-Ash (B_02_WO_breakfast1)
S1-Sodium (B_02_WO_breakfast1)
S1-Potassium (B_02_WO_breakfast1)
S1-Phosphorus (B_02_WO_breakfast1)
S1-Magnesium (B_02_WO_breakfast1)
S1-Manganese (B_02_WO_breakfast1)
S1-Beta-carotene (B_02_WO_breakfast1)
S1-Thiamin (B_02_WO_breakfast1)
S1-Riboflavin (B_02_WO_breakfast1)
S1-Vitamin B6 (B_02_WO_breakfast1)
S1-Vitamin C (B_02_WO_breakfast1)
S1-Fatty acids: 4:0 (B_02_WO_breakfast1)
S1-Fatty acids: 6:0 (B_02_WO_breakfast1)
S1-Fatty acids: 8:0 (B_02_WO_breakfast1)
S1-Fatty acids: 10:0 (B_02_WO_breakfast1)
S1-Fatty acids: 12:0 (B_02_WO_breakfast1)
S1-Fatty acids: 14:0 (B_02_WO_breakfast1)
S1-Fatty acids: 15:0 (B_02_WO_breakfast1)
S1-Fatty acids: 16:0 (B_02_WO_breakfast1)
S1-Fatty acids: 17:0 (B_02_WO_breakfast1)
S1-Fatty acids: 18:0 (B_02_WO_breakfast1)
S1-Fatty acids: 20:0 (B_02_WO_breakfast1)
S1-Fatty acids: total saturated (B_02_WO_breakfast1)
S1-Fatty acids: 14:1 (B_02_WO_breakfast1)
S1-Fatty acids: 15:1 (B_02_WO_breakfast1)
S1-Fatty acids: 16:1 (B_02_WO_breakfast1)
S1-Fatty acids: 17:1 (B_02_WO_breakfast1)
S1-Fatty acids: 18:1 (B_02_WO_breakfast1)
S1-Fatty acids: total monounsaturated (B_02_WO_breakfast1)
S1-Cholesterol (B_02_WO_breakfast1)
S1-Isoleucine (B_02_WO_breakfast1)
S1-Leucine (B_02_WO_breakfast1)
S1-Lysine (B_02_WO_breakfast1)
S1-Methionine (B_02_WO_breakfast1)
S1-Cystine (B_02_WO_breakfast1)
S1-Phenylalanine (B_02_WO_breakfast1)
S1-Tyrosine (B_02_WO_breakfast1)
S1-Threonine (B_02_WO_breakfast1)
S1-Tryptophan (B_02_WO_breakfast1)
S1-Valine (B_02_WO_breakfast1)
S1-Arginine (B_02_WO_breakfast1)
S1-Histidine (B_02_WO_breakfast1)
S1-Alanine (B_02_WO_breakfast1)
S1-Aspartic acid (B_02_WO_breakfast1)
S1-Glutamic acid (B_02_WO_breakfast1)
S1-Glycine (B_02_WO_breakfast1)
S1-Proline (B_02_WO_breakfast1)
S1-Serine (B_02_WO_breakfast1)
S1-Sucrose (B_02_WO_breakfast1)

116
S1-Starch (B_02_WO_breakfast1)
S1-Folates/folic acid (B_02_WO_breakfast1)
S1-Vitamin B12 (B_02_WO_breakfast1)
S1-vitamin D (B_02_WO_breakfast1)
S1-Iodine (B_02_WO_breakfast1)
S1-Digestible carbohydrates (B_02_WO_breakfast1)
S1-L-carnitine (B_02_WO_breakfast1)
S1-Percentage of energy from protein (B_02_WO_breakfast1)
S1-Percentage of energy from carbohydrates (B_02_WO_breakfast1)
S1-Percentage of energy from sucrose (B_02_WO_breakfast1)
S2-Water (B_02_WO_breakfast2)
S2-Total carbohydrates (B_02_WO_breakfast2)
S2-Ash (B_02_WO_breakfast2)
S2-Sodium (B_02_WO_breakfast2)
S2-Potassium (B_02_WO_breakfast2)
S2-Calcium (B_02_WO_breakfast2)
S2-Magnesium (B_02_WO_breakfast2)
S2-Copper (B_02_WO_breakfast2)
S2-Beta-carotene (B_02_WO_breakfast2)
S2-Riboflavin (B_02_WO_breakfast2)
S2-Vitamin B6 (B_02_WO_breakfast2)
S2-Vitamin C (B_02_WO_breakfast2)
S2-Fatty acids: 18:3 (B_02_WO_breakfast2)
S2-Fatty acids: 20:5 (B_02_WO_breakfast2)
S2-Fatty acids: 22:5 (B_02_WO_breakfast2)
S2-Cholesterol (B_02_WO_breakfast2)
S2-Proline (B_02_WO_breakfast2)
S2-Sucrose (B_02_WO_breakfast2)
S2-Lactose (B_02_WO_breakfast2)
S2-Dietary fibre (B_02_WO_breakfast2)
S2-Folates/folic acid (B_02_WO_breakfast2)
S2-Digestible carbohydrates (B_02_WO_breakfast2)
S2-Percent of energy from fat (B_02_WO_breakfast2)
S2-Percentage of energy from carbohydrates (B_02_WO_breakfast2)
S2 - Percentage of energy from sucrose (B_02_WO_breakfast2)
OB-Waste (B_02_WO_dinner)
OB-Energy kJ (B_02_WO_dinner)
OB-Energy kcal (B_02_WO_dinner)
OB-Water (B_02_WO_dinner)
OB-Total protein (B_02_WO_dinner)
OB-Animal protein (B_02_WO_dinner)
OB-Vegetable protein (B_02_WO_dinner)
OB-Fat (B_02_WO_dinner)
OB-Total carbohydrates (B_02_WO_dinner)
OB-Ash (B_02_WO_dinner)
OB-Sodium (B_02_WO_dinner)
OB-Potassium (B_02_WO_dinner)
OB-Calcium (B_02_WO_dinner)
OB-Phosphorus (B_02_WO_dinner)
OB-Magnesium (B_02_WO_dinner)
OB-Iron (B_02_WO_dinner)
OB-Zinc (B_02_WO_dinner)
OB-Copper (B_02_WO_dinner)
OB-Manganese (B_02_WO_dinner)
OB-Retinol (B_02_WO_dinner)
OB-Vitamin E (alpha-tocopherol equivalent) (B_02_WO_dinner)
OB-Thiamin (B_02_WO_dinner)
OB-Riboflavin (B_02_WO_dinner)
OB-Niacin (B_02_WO_dinner)
OB-Vitamin B6 (B_02_WO_dinner)
OB-Vitamin C (B_02_WO_dinner)
OB-Fatty acids: 4:0 (B_02_WO_dinner)
OB-Fatty acids: 6:0 (B_02_WO_dinner)
OB-Fatty acids: 8:0 (B_02_WO_dinner)
OB-Fatty acids: 10:0 (B_02_WO_dinner)
OB-Fatty acids: 12:0 (B_02_WO_dinner)
OB-Fatty acids: 14:0 (B_02_WO_dinner)
OB-Fatty acids: 15:0 (B_02_WO_dinner)
OB-Fatty acids: 16:0 (B_02_WO_dinner)
OB-Fatty acids: 17:0 (B_02_WO_dinner)
OB-Fatty acids: 18:0 (B_02_WO_dinner)
OB-Fatty acids: 20:0 (B_02_WO_dinner)
OB-fatty acids: total saturated (B_02_WO_dinner)
OB-Fatty acids: 14:1 (B_02_WO_dinner)
OB-Fatty acids: 15:1 (B_02_WO_dinner)
117
OB-Fatty acids: 16:1 (B_02_WO_dinner)
OB-Fatty acids: 17:1 (B_02_WO_dinner)
OB-Fatty acids: 18:1 (B_02_WO_dinner)
OB-fatty acids: total monounsaturated (B_02_WO_dinner)
OB-Fatty acids: 18:2 (B_02_WO_dinner)
OB-Fatty acids: 18:3 (B_02_WO_dinner)
OB-Fatty acids: 22:6 (B_02_WO_dinner)
OB-fatty acids: total polyunsaturated (B_02_WO_dinner)
OB-Cholesterol (B_02_WO_dinner)
OB-Isoleucine (B_02_WO_dinner)
OB-Leucine (B_02_WO_dinner)
OB-Lysine (B_02_WO_dinner)
OB-Methionine (B_02_WO_dinner)
OB-Cystine (B_02_WO_dinner)
OB-Phenylalanine (B_02_WO_dinner)
OB-Tyrosine (B_02_WO_dinner)
OB-Threonine (B_02_WO_dinner)
OB-Tryptophan (B_02_WO_dinner)
OB-Valine (B_02_WO_dinner)
OB-Arginine (B_02_WO_dinner)
OB-Histidine (B_02_WO_dinner)
OB-Alanine (B_02_WO_dinner)
OB-Aspartic acid (B_02_WO_dinner)
OB-Glutamic acid (B_02_WO_dinner)
OB-Glycine (B_02_WO_dinner)
OB-Proline (B_02_WO_dinner)
OB-Serine (B_02_WO_dinner)
OB-Sucrose (B_02_WO_dinner)
OB-Lactose (B_02_WO_dinner)
OB-Starch (B_02_WO_dinner)
OB-Dietary fibre (B_02_WO_dinner)
OB-Iodine (B_02_WO_dinner)
OB-Long-chain polyunsaturated fatty acids (B_02_WO_dinner)
OB-Digestible carbohydrates (B_02_WO_dinner)
POD-Energy kJ (B_02_WO_high_tea)
POD-Energy kcal (B_02_WO_high_tea)
POD-Water (B_02_WO_high_tea)
POD-Vegetable protein (B_02_WO_high_tea)
POD-Ash (B_02_WO_high_tea)
POD-Potassium (B_02_WO_high_tea)
POD-Magnesium (B_02_WO_high_tea)
POD-Fatty acids: 14:0 (B_02_WO_high_tea)
POD-Fatty acids: 16:0 (B_02_WO_high_tea)
POD-Fatty acids: 18:0 (B_02_WO_high_tea)
POD-Fatty acids: total saturated (B_02_WO_high_tea)
POD-Fatty acids: 14:1 (B_02_WO_high_tea)
POD-Fatty acids: 15:1 (B_02_WO_high_tea)
POD-Fatty acids: 17:1 (B_02_WO_high_tea)
POD-Fatty acids: 18:1 (B_02_WO_high_tea)
POD-Fatty acids: total monounsaturated (B_02_WO_high_tea)
POD-fatty acids: total polyunsaturated (B_02_WO_high_tea)
POD-Isoleucine (B_02_WO_high_tea)
POD-Leucine (B_02_WO_high_tea)
POD-Methionine (B_02_WO_high_tea)
POD-Cystine (B_02_WO_high_tea)
POD-Phenylalanine (B_02_WO_high_tea)
POD-Tyrosine (B_02_WO_high_tea)
POD-Threonine (B_02_WO_high_tea)
POD-Tryptophan (B_02_WO_high_tea)
POD-Valine (B_02_WO_high_tea)
POD-Arginine (B_02_WO_high_tea)
POD-Histidine (B_02_WO_high_tea)
POD-Alanine (B_02_WO_high_tea)
POD-Aspartic acid (B_02_WO_high_tea)
POD-Glutamic acid (B_02_WO_high_tea)
POD-Glycine (B_02_WO_high_tea)
POD-Proline (B_02_WO_high_tea)
POD-Serine (B_02_WO_high_tea)
POD-Sucrose (B_02_WO_high_tea)
POD-Taurine (B_02_WO_high_tea)
K-Energy kJ (B_02_WO_supper)
K-Energy kcal (B_02_WO_supper)
K-Total protein (B_02_WO_supper)
K-Animal protein (B_02_WO_supper)
K-Vegetable protein (B_02_WO_supper)
K-Fat (B_02_WO_supper)
K-Total carbohydrates (B_02_WO_supper)
K-Ash (B_02_WO_supper)
118
K-Sodium (B_02_WO_supper)
K-Potassium (B_02_WO_supper)
K-Phosphorus (B_02_WO_supper)
K-Magnesium (B_02_WO_supper)
K-Manganese (B_02_WO_supper)
K-Beta-carotene (B_02_WO_supper)
K-Riboflavin (B_02_WO_supper)
K-Vitamin C (B_02_WO_supper)
K-Fatty acids: 4:0 (B_02_WO_supper)
K-Fatty acids: 6:0 (B_02_WO_supper)
K-Fatty acids: 8:0 (B_02_WO_supper)
K-Fatty acids: 10:0 (B_02_WO_supper)
K-Fatty acids: 12:0 (B_02_WO_supper)
K-Fatty acids: 14:0 (B_02_WO_supper)
K-Fatty acids: 15:0 (B_02_WO_supper)
K-Fatty acids: 16:0 (B_02_WO_supper)
K-Fatty acids: 17:0 (B_02_WO_supper)
K-Fatty acids: 18:0 (B_02_WO_supper)
K-Fatty acids: 20:0 (B_02_WO_supper)
K-Fatty acids: total saturated (B_02_WO_supper)
K-Fatty acids: 14:1 (B_02_WO_supper)
K-Fatty acids: 15:1 (B_02_WO_supper)
K-Fatty acids: 16:1 (B_02_WO_supper)
K-Fatty acids: 17:1 (B_02_WO_supper)
K-Fatty acids: 18:1 (B_02_WO_supper)
K-Fatty acids: 20:1 (B_02_WO_supper)
K-Fatty acids: 22:1 (B_02_WO_supper)
K-Fatty acids: total monounsaturated (B_02_WO_supper)
K-Fatty acids: 18:2 (B_02_WO_supper)
K-Fatty acids: 18:3 (B_02_WO_supper)
K-Fatty acids: 20:4 (B_02_WO_supper)
K-Fatty acids: 22:6 (B_02_WO_supper)
K-Fatty acids: total polyunsaturated (B_02_WO_supper)
K-Cholesterol (B_02_WO_supper)
K-Isoleucine (B_02_WO_supper)
K-Leucine (B_02_WO_supper)
K-Lysine (B_02_WO_supper)
K-Methionine (B_02_WO_supper)
K-Cystine (B_02_WO_supper)
K-Phenylalanine (B_02_WO_supper)
K-Tyrosine (B_02_WO_supper)
K-Threonine (B_02_WO_supper)
K-Tryptophan (B_02_WO_supper)
K-Valine (B_02_WO_supper)
K-Arginine (B_02_WO_supper)
K-Histidine (B_02_WO_supper)
K-Alanine (B_02_WO_supper)
K-Aspartic acid (B_02_WO_supper)
K-Glutamic acid (B_02_WO_supper)
K-Glycine (B_02_WO_supper)
K-Proline (B_02_WO_supper)
K-Serine (B_02_WO_supper)
K-Sucrose (B_02_WO_supper)
K-Starch (B_02_WO_supper)
K-Dietary fibre (B_02_WO_supper)
K-vitamin D (B_02_WO_supper)
K-Iodine (B_02_WO_supper)
K-Long-chain polyunsaturated fatty acids (B_02_WO_supper)
K-Digestible carbohydrates (B_02_WO_supper)
K-Taurine (B_02_WO_supper)
K-L-carnitine (B_02_WO_supper)
K-Percentage of energy from protein (B_02_WO_supper)
K-Percentage of energy from carbohydrates (B_02_WO_supper)
K-Percentage of energy from sucrose (B_02_WO_supper)
POJ-Fatty acids: 15:0 (B_02_WO_snack)
POJ-Fatty acids: 17:0 (B_02_WO_snack)
POJ-Fatty acids: total saturated (B_02_WO_snack)
POJ-fatty acids: total monounsaturated (B_02_WO_snack)
SUPL-Ash (B_02_A_WiSMzŻW)
SUPL-Sodium (B_02_A_WiSMzŻW)
SUPL-Potassium (B_02_A_WiSMzŻW)
SUPL-Calcium (B_02_A_WiSMzŻW)
SUPL-Phosphorus (B_02_A_WiSMzŻW)
SUPL-Magnesium (B_02_A_WiSMzŻW)
SUPL-Iron (B_02_A_WiSMzŻW)
SUPL-Zinc (B_02_A_WiSMzŻW)
SUPL-Copper (B_02_A_WiSMzŻW)

119
SUPL-Manganese (B_02_A_WiSMzŻW)
SUPL-Vitamin A (retinol equivalent) (B_02_A_WiSMzŻW)
SUPL-Retinol (B_02_A_WiSMzŻW)
SUPL-Beta-carotene (B_02_A_WiSMzŻW)
SUPL-Vitamin E (alpha-tocopherol equivalent) (B_02_A_WiSMzŻW)
SUPL-Thiamin (B_02_A_WiSMzŻW)
SUPL-Riboflavin (B_02_A_WiSMzŻW)
SUPL-Niacin (B_02_A_WiSMzŻW)
SUPL-Vitamin B6 (B_02_A_WiSMzŻW)
SUPL-Vitamin C (B_02_A_WiSMzŻW)
SUPL-Folates/folic acid (B_02_A_WiSMzŻW)
SUPL-Vitamin B12 (B_02_A_WiSMzŻW)
SUPL-Vitamin D (B_02_A_WiSMzŻW)
ŻYW-Ash (B_02_B_WiSMzŻnW)
ŻYW-Sodium (B_02_B_WiSMzŻnW)
ŻYW-Potassium (B_02_B_WiSMzŻnW)
ŻYW-Phosphorus (B_02_B_WiSMzŻnW)
ŻYW-Magnesium (B_02_B_WiSMzŻnW)
ŻYW-Iron (B_02_B_WiSMzŻnW)
ŻYW-Copper (B_02_B_WiSMzŻnW)
ŻYW-Manganese (B_02_B_WiSMzŻnW)
ŻYW-Riboflavin (B_02_B_WiSMzŻnW)
ŻYW-Vitamin B6 (B_02_B_WiSMzŻnW)
ŻYW-Vitamin B12 (B_02_B_WiSMzŻnW)
ŻYW-vitamin D (B_02_B_WiSMzŻnW)
Cereal products based on flour P2 (B_04_Product_consumption)
Groat and rice P3 (B_04_Product_consumption)
Bread P3 (B_04_Product_consumption)
Total potatoes P2 (B_04_Product_consumption)
Total fruits and vegetables P2 (B_04_Product_consumption)
Fruits, market product P3 (B_04_Product_consumption)
Juices, fruit and vegetable drinks and nectars P2 (B_04_Product_consumption)
Nutrition for infants and young children P3 (B_04_Product_consumption)
Fermented milk beverages P2 (B_04_Product_consumption)
Rennet cheese P2 (B_04_Product_consumption)
Cottage cheese (sliced and in containers) P3 (B_04_Product_consumption)
Eggs, market product P2 (B_04_Product_consumption)
Total fats P1 (B_04_Product_consumption)
Butter and cream based on butter P2 (B_04_Product_consumption)
Margarine P2 (B_04_Product_consumption)
Sugar, sweets, honey based on sugar P1 (B_04_Product_consumption)
Sugar / sucrose P2 (B_04_Product_consumption)
3. Are there differences in the diet of children aged 13-18 months, 19-24 months and 25-36 months?
as above Files: Mikroskala pkt2.2;3;4;6;7;8;9;10.xlsx The methods used: Non-parametric Kruskal-Wallis tests and Chi-square independence test were used. Conclusions for the number of meals: Significant differences were identified in the following case:
C.6. Main course (B_01_Survey_data)
C.6. Meal / snack before bedtime (B_01_Survey_data)
C.6. Meal/drink at night (B_01_Survey_data) Conclusions for dietary behaviour, including snacks: Significant differences were identified in the following case:
C.7. Candies, lollipops (B_01_Survey_data)
C.7. Crisps, salty sticks (B_01_Survey_data)
C.14. Vegetables (B_01_Survey_data)
C.14. Learns new flavours (B_01_Survey_data) Conclusions for the nutritional value of daily food ration and consumption of product groups: Significant differences were identified in the following case:
120
Waste (B_02_WO_DFR)
Energy kJ (B_02_WO_DFR)
Energy kcal (B_02_WO_DFR)
Water (B_02_WO_DFR)
Total protein (B_02_WO_DFR)
Animal protein (B_02_WO_DFR)
Vegetable protein (B_02_WO_DFR)
Fat (B_02_WO_DFR)
Total carbohydrates (B_02_WO_DFR)
Ash (B_02_WO_DFR)
Sodium (B_02_WO_DFR)
Potassium (B_02_WO_DFR)
Phosphorus (B_02_WO_DFR)
Magnesium (B_02_WO_DFR)
Copper (B_02_WO_DFR)
Manganese (B_02_WO_DFR)
Riboflavin (B_02_WO_DFR)
Vitamin B6 (B_02_WO_DFR)
Fatty acids: 4:0 (B_02_WO_DFR)
Fatty acids: 6:0 (B_02_WO_DFR)
Fatty acids: 8:0 (B_02_WO_DFR)
Fatty acids: 10:0 (B_02_WO_DFR)
Fatty acids: 12:0 (B_02_WO_DFR)
Fatty acids: 14:0 (B_02_WO_DFR)
Fatty acids: 15:0 (B_02_WO_DFR)
Fatty acids: 16:0 (B_02_WO_DFR)
Fatty acids: 17:0 (B_02_WO_DFR)
Fatty acids: 18:0 (B_02_WO_DFR)
Fatty acids: 20:0 (B_02_WO_DFR)
Fatty acids: total saturated (B_02_WO_DFR)
Fatty acids: 14:1 (B_02_WO_DFR)
Fatty acids: 15:1 (B_02_WO_DFR)
Fatty acids: 16:1 (B_02_WO_DFR)
Fatty acids: 17:1 (B_02_WO_DFR)
Fatty acids: 18:1 (B_02_WO_DFR)
Fatty acids: 20:1 (B_02_WO_DFR)
Fatty acids: 22:1 (B_02_WO_DFR)
Fatty acids: Total monounsaturated (B_02_WO_DFR)
Fatty acids: 18:2 (B_02_WO_DFR)
Fatty acids: 18:3 (B_02_WO_DFR)
Fatty acids: 20:4 (B_02_WO_DFR)
Fatty acids: 22:6 (B_02_WO_DFR)
Fatty acids: Total polyunsaturated (B_02_WO_DFR)
Cholesterol (B_02_WO_DFR)
Isoleucine (B_02_WO_DFR)
Leucine (B_02_WO_DFR)
Lysine (B_02_WO_DFR)
Methionine (B_02_WO_DFR)
Cystine (B_02_WO_DFR)
Phenylalanine (B_02_WO_DFR)
Tyrosine (B_02_WO_DFR)
Threonine (B_02_WO_DFR)
Tryptophan (B_02_WO_DFR)
Valine (B_02_WO_DFR)
Arginine (B_02_WO_DFR)
Histidine (B_02_WO_DFR)
Alanine (B_02_WO_DFR)
Aspartic acid (B_02_WO_DFR)
Glutamic acid (B_02_WO_DFR)
Glycine (B_02_WO_DFR)
Proline (B_02_WO_DFR)
Serine (B_02_WO_DFR)
Sucrose (B_02_WO_DFR)
Starch (B_02_WO_DFR)
Dietary fibre (B_02_WO_DFR)
Folates/folic acid (B_02_WO_DFR)
Vitamin B12 (B_02_WO_DFR)
Vitamin D (B_02_WO_DFR)
Long-chain polyunsaturated fatty acids (B_02_WO_DFR)
Digestible carbohydrates (B_02_WO_DFR)
Taurine (B_02_WO_DFR)
L-carnitine (B_02_WO_DFR)
Percentage of energy from protein (B_02_WO_DFR)
Percentage of energy from fat (B_02_WO_DFR)
Percentage of energy from carbohydrates (B_02_WO_DFR)
Percentage of energy from sucrose (B_02_WO_DFR)
S1-Energy kJ (B_02_WO_breakfast1)
S1-Energy kcal (B_02_WO_breakfast1)
121
S1-Water (B_02_WO_breakfast1)
S1-Total protein (B_02_WO_breakfast1)
S1-Animal protein (B_02_WO_breakfast1)
S1-Vegetable protein (B_02_WO_breakfast1)
S1-Fat (B_02_WO_breakfast1)
S1-Total carbohydrates (B_02_WO_breakfast1)
S1-Ash (B_02_WO_breakfast1)
S1-Sodium (B_02_WO_breakfast1)
S1-Potassium (B_02_WO_breakfast1)
S1-Phosphorus (B_02_WO_breakfast1)
S1-Magnesium (B_02_WO_breakfast1)
S1-Manganese (B_02_WO_breakfast1)
S1-Beta-carotene (B_02_WO_breakfast1)
S1-Riboflavin (B_02_WO_breakfast1)
S1-Vitamin B6 (B_02_WO_breakfast1)
S1-Fatty acids: 4:0 (B_02_WO_breakfast1)
S1-Fatty acids: 6:0 (B_02_WO_breakfast1)
S1-Fatty acids: 8:0 (B_02_WO_breakfast1)
S1-Fatty acids: 10:0 (B_02_WO_breakfast1)
S1-Fatty acids: 12:0 (B_02_WO_breakfast1)
S1-Fatty acids: 14:0 (B_02_WO_breakfast1)
S1-Fatty acids: 15:0 (B_02_WO_breakfast1)
S1-Fatty acids: 16:0 (B_02_WO_breakfast1)
S1-Fatty acids: 17:0 (B_02_WO_breakfast1)
S1-Fatty acids: 18:0 (B_02_WO_breakfast1)
S1-Fatty acids: 20:0 (B_02_WO_breakfast1)
S1-Fatty acids: total saturated (B_02_WO_breakfast1)
S1-Fatty acids: 14:1 (B_02_WO_breakfast1)
S1-Fatty acids: 15:1 (B_02_WO_breakfast1)
S1-Fatty acids: 16:1 (B_02_WO_breakfast1)
S1-Fatty acids: 17:1 (B_02_WO_breakfast1)
S1-Fatty acids: 18:1 (B_02_WO_breakfast1)
S1-Fatty acids: 20:1 (B_02_WO_breakfast1)
S1-Fatty acids: total monounsaturated (B_02_WO_breakfast1)
S1-Cholesterol (B_02_WO_breakfast1)
S1-Isoleucine (B_02_WO_breakfast1)
S1-Leucine (B_02_WO_breakfast1)
S1-Lysine (B_02_WO_breakfast1)
S1-Methionine (B_02_WO_breakfast1)
S1-Cystine (B_02_WO_breakfast1)
S1-Phenylalanine (B_02_WO_breakfast1)
S1-Tyrosine (B_02_WO_breakfast1)
S1-Threonine (B_02_WO_breakfast1)
S1-Tryptophan (B_02_WO_breakfast1)
S1-Valine (B_02_WO_breakfast1)
S1-Arginine (B_02_WO_breakfast1)
S1-Histidine (B_02_WO_breakfast1)
S1-Alanine (B_02_WO_breakfast1)
S1-Aspartic acid (B_02_WO_breakfast1)
S1-Glutamic acid (B_02_WO_breakfast1)
S1-Glycine (B_02_WO_breakfast1)
S1-Proline (B_02_WO_breakfast1)
S1-Serine (B_02_WO_breakfast1)
S1-Sucrose (B_02_WO_breakfast1)
S1-Starch (B_02_WO_breakfast1)
S1-Dietary fibre (B_02_WO_breakfast1)
S1-Folates/folic acid (B_02_WO_breakfast1)
S1-Vitamin B12 (B_02_WO_breakfast1)
S1-vitamin D (B_02_WO_breakfast1)
S1-Iodine (B_02_WO_breakfast1)
S1-Digestible carbohydrates (B_02_WO_breakfast1)
S1-Taurine (B_02_WO_breakfast1)
S1-L-carnitine (B_02_WO_breakfast1)
S1-Percentage of energy from protein (B_02_WO_breakfast1)
S1-Percentage of energy from carbohydrates (B_02_WO_breakfast1)
S1-Percentage of energy from sucrose (B_02_WO_breakfast1)
S2-Water (B_02_WO_breakfast2)
S2-Vegetable protein (B_02_WO_breakfast2)
S2-Total carbohydrates (B_02_WO_breakfast2)
S2-Ash (B_02_WO_breakfast2)
S2-Sodium (B_02_WO_breakfast2)
S2-Potassium (B_02_WO_breakfast2)
S2-Calcium (B_02_WO_breakfast2)
S2-Magnesium (B_02_WO_breakfast2)
S2-Copper (B_02_WO_breakfast2)
S2-Beta-carotene (B_02_WO_breakfast2)
S2-Riboflavin (B_02_WO_breakfast2)
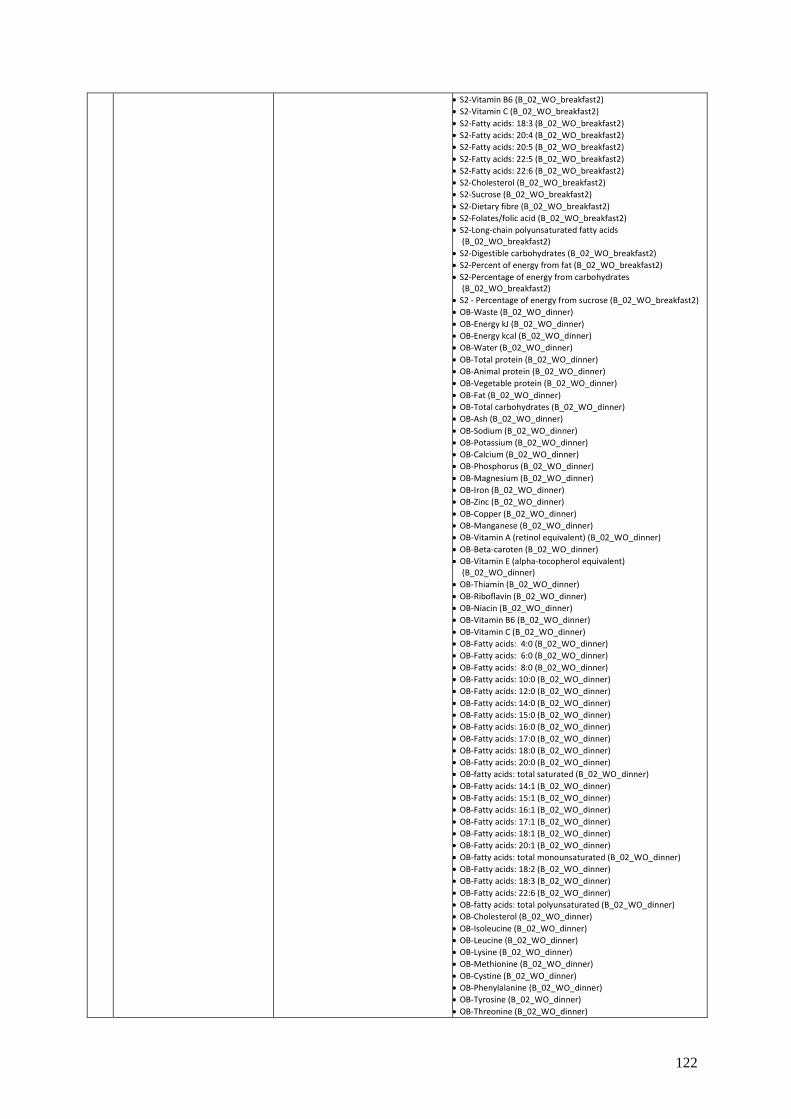
122
S2-Vitamin B6 (B_02_WO_breakfast2)
S2-Vitamin C (B_02_WO_breakfast2)
S2-Fatty acids: 18:3 (B_02_WO_breakfast2)
S2-Fatty acids: 20:4 (B_02_WO_breakfast2)
S2-Fatty acids: 20:5 (B_02_WO_breakfast2)
S2-Fatty acids: 22:5 (B_02_WO_breakfast2)
S2-Fatty acids: 22:6 (B_02_WO_breakfast2)
S2-Cholesterol (B_02_WO_breakfast2)
S2-Sucrose (B_02_WO_breakfast2)
S2-Dietary fibre (B_02_WO_breakfast2)
S2-Folates/folic acid (B_02_WO_breakfast2)
S2-Long-chain polyunsaturated fatty acids (B_02_WO_breakfast2)
S2-Digestible carbohydrates (B_02_WO_breakfast2)
S2-Percent of energy from fat (B_02_WO_breakfast2)
S2-Percentage of energy from carbohydrates (B_02_WO_breakfast2)
S2 - Percentage of energy from sucrose (B_02_WO_breakfast2)
OB-Waste (B_02_WO_dinner)
OB-Energy kJ (B_02_WO_dinner)
OB-Energy kcal (B_02_WO_dinner)
OB-Water (B_02_WO_dinner)
OB-Total protein (B_02_WO_dinner)
OB-Animal protein (B_02_WO_dinner)
OB-Vegetable protein (B_02_WO_dinner)
OB-Fat (B_02_WO_dinner)
OB-Total carbohydrates (B_02_WO_dinner)
OB-Ash (B_02_WO_dinner)
OB-Sodium (B_02_WO_dinner)
OB-Potassium (B_02_WO_dinner)
OB-Calcium (B_02_WO_dinner)
OB-Phosphorus (B_02_WO_dinner)
OB-Magnesium (B_02_WO_dinner)
OB-Iron (B_02_WO_dinner)
OB-Zinc (B_02_WO_dinner)
OB-Copper (B_02_WO_dinner)
OB-Manganese (B_02_WO_dinner)
OB-Vitamin A (retinol equivalent) (B_02_WO_dinner)
OB-Beta-caroten (B_02_WO_dinner)
OB-Vitamin E (alpha-tocopherol equivalent) (B_02_WO_dinner)
OB-Thiamin (B_02_WO_dinner)
OB-Riboflavin (B_02_WO_dinner)
OB-Niacin (B_02_WO_dinner)
OB-Vitamin B6 (B_02_WO_dinner)
OB-Vitamin C (B_02_WO_dinner)
OB-Fatty acids: 4:0 (B_02_WO_dinner)
OB-Fatty acids: 6:0 (B_02_WO_dinner)
OB-Fatty acids: 8:0 (B_02_WO_dinner)
OB-Fatty acids: 10:0 (B_02_WO_dinner)
OB-Fatty acids: 12:0 (B_02_WO_dinner)
OB-Fatty acids: 14:0 (B_02_WO_dinner)
OB-Fatty acids: 15:0 (B_02_WO_dinner)
OB-Fatty acids: 16:0 (B_02_WO_dinner)
OB-Fatty acids: 17:0 (B_02_WO_dinner)
OB-Fatty acids: 18:0 (B_02_WO_dinner)
OB-Fatty acids: 20:0 (B_02_WO_dinner)
OB-fatty acids: total saturated (B_02_WO_dinner)
OB-Fatty acids: 14:1 (B_02_WO_dinner)
OB-Fatty acids: 15:1 (B_02_WO_dinner)
OB-Fatty acids: 16:1 (B_02_WO_dinner)
OB-Fatty acids: 17:1 (B_02_WO_dinner)
OB-Fatty acids: 18:1 (B_02_WO_dinner)
OB-Fatty acids: 20:1 (B_02_WO_dinner)
OB-fatty acids: total monounsaturated (B_02_WO_dinner)
OB-Fatty acids: 18:2 (B_02_WO_dinner)
OB-Fatty acids: 18:3 (B_02_WO_dinner)
OB-Fatty acids: 22:6 (B_02_WO_dinner)
OB-fatty acids: total polyunsaturated (B_02_WO_dinner)
OB-Cholesterol (B_02_WO_dinner)
OB-Isoleucine (B_02_WO_dinner)
OB-Leucine (B_02_WO_dinner)
OB-Lysine (B_02_WO_dinner)
OB-Methionine (B_02_WO_dinner)
OB-Cystine (B_02_WO_dinner)
OB-Phenylalanine (B_02_WO_dinner)
OB-Tyrosine (B_02_WO_dinner)
OB-Threonine (B_02_WO_dinner)

123
OB-Tryptophan (B_02_WO_dinner)
OB-Valine (B_02_WO_dinner)
OB-Arginine (B_02_WO_dinner)
OB-Histidine (B_02_WO_dinner)
OB-Alanine (B_02_WO_dinner)
OB-Aspartic acid (B_02_WO_dinner)
OB-Glutamic acid (B_02_WO_dinner)
OB-Glycine (B_02_WO_dinner)
OB-Proline (B_02_WO_dinner)
OB-Serine (B_02_WO_dinner)
OB-Sucrose (B_02_WO_dinner)
OB-Lactose (B_02_WO_dinner)
OB-Starch (B_02_WO_dinner)
OB-Dietary fibre (B_02_WO_dinner)
OB-Iodine (B_02_WO_dinner)
OB-Long-chain polyunsaturated fatty acids (B_02_WO_dinner)
OB-Digestible carbohydrates (B_02_WO_dinner)
POD-Waste (B_02_WO_high_tea)
POD-Animal protein (B_02_WO_high_tea)
POD-Vegetable protein (B_02_WO_high_tea)
POD-Ash (B_02_WO_high_tea)
POD-Fatty acids: 4:0 (B_02_WO_high_tea)
POD-Fatty acids: 6:0 (B_02_WO_high_tea)
POD-Fatty acids: 8:0 (B_02_WO_high_tea)
POD-Fatty acids: 10:0 (B_02_WO_high_tea)
POD-Fatty acids: 12:0 (B_02_WO_high_tea)
POD-Fatty acids: 14:0 (B_02_WO_high_tea)
POD-Fatty acids: 15:0 (B_02_WO_high_tea)
POD-Fatty acids: 16:0 (B_02_WO_high_tea)
POD-Fatty acids: 17:0 (B_02_WO_high_tea)
POD-Fatty acids: 18:0 (B_02_WO_high_tea)
POD-Fatty acids: total saturated (B_02_WO_high_tea)
POD-Fatty acids: 14:1 (B_02_WO_high_tea)
POD-Fatty acids: 15:1 (B_02_WO_high_tea)
POD-Fatty acids: 16:1 (B_02_WO_high_tea)
POD-Fatty acids: 17:1 (B_02_WO_high_tea)
POD-Fatty acids: 18:1 (B_02_WO_high_tea)
POD-Fatty acids: total monounsaturated (B_02_WO_high_tea)
POD-Isoleucine (B_02_WO_high_tea)
POD-Leucine (B_02_WO_high_tea)
POD-Lysine (B_02_WO_high_tea)
POD-Methionine (B_02_WO_high_tea)
POD-Cystine (B_02_WO_high_tea)
POD-Phenylalanine (B_02_WO_high_tea)
POD-Tyrosine (B_02_WO_high_tea)
POD-Threonine (B_02_WO_high_tea)
POD-Tryptophan (B_02_WO_high_tea)
POD-Valine (B_02_WO_high_tea)
POD-Arginine (B_02_WO_high_tea)
POD-Histidine (B_02_WO_high_tea)
POD-Alanine (B_02_WO_high_tea)
POD-Aspartic acid (B_02_WO_high_tea)
POD-Glutamic acid (B_02_WO_high_tea)
POD-Proline (B_02_WO_high_tea)
POD-Serine (B_02_WO_high_tea)
POD-Sucrose (B_02_WO_high_tea)
POD-Taurine (B_02_WO_high_tea)
POD-Percentage of energy from sucrose (B_02_WO_high_tea)
K-Energy kJ (B_02_WO_supper)
K-Energy kcal (B_02_WO_supper)
K-Total protein (B_02_WO_supper)
K-Animal protein (B_02_WO_supper)
K-Vegetable protein (B_02_WO_supper)
K-Fat (B_02_WO_supper)
K-Total carbohydrates (B_02_WO_supper)
K-Ash (B_02_WO_supper)
K-Sodium (B_02_WO_supper)
K-Potassium (B_02_WO_supper)
K-Calcium (B_02_WO_supper)
K-Phosphorus (B_02_WO_supper)
K-Magnesium (B_02_WO_supper)
K-Iron (B_02_WO_supper)
K-Manganese (B_02_WO_supper)
K-Retinol (B_02_WO_supper)
K-Beta-carotene (B_02_WO_supper)
K-Vitamin E (alpha-tocopherol equivalent) (B_02_WO_supper)
K-Riboflavin (B_02_WO_supper)
K-Vitamin C (B_02_WO_supper)
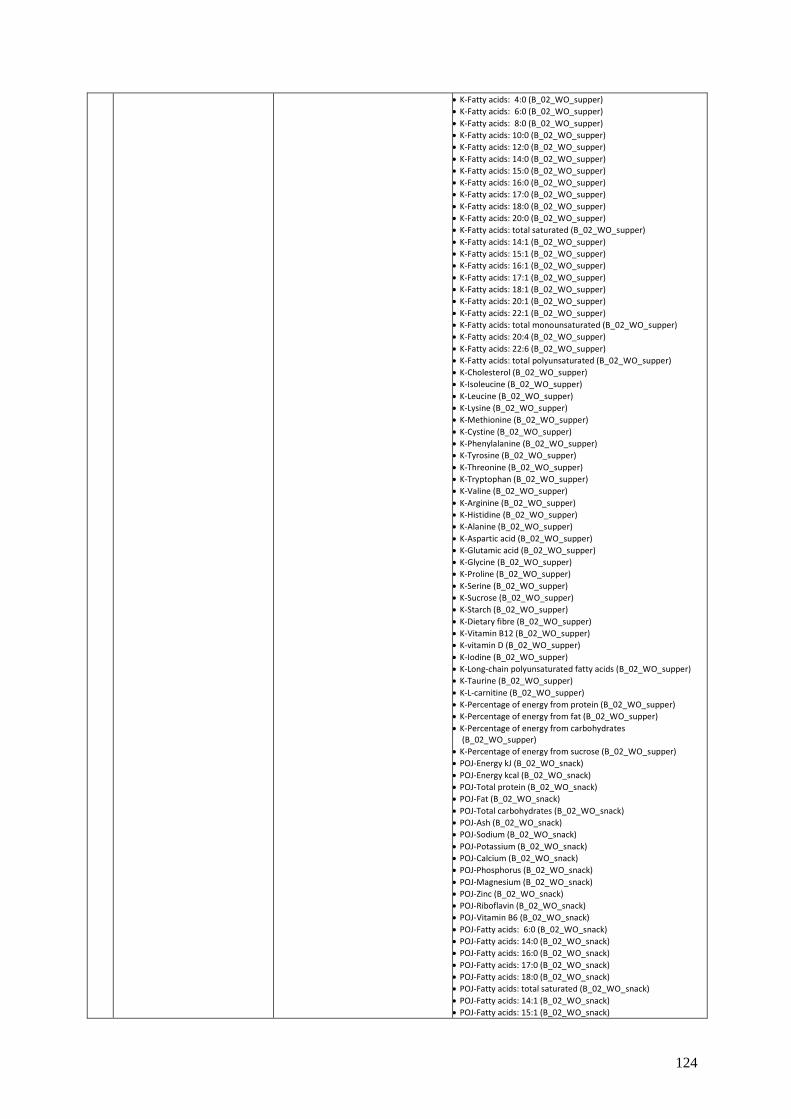
124
K-Fatty acids: 4:0 (B_02_WO_supper)
K-Fatty acids: 6:0 (B_02_WO_supper)
K-Fatty acids: 8:0 (B_02_WO_supper)
K-Fatty acids: 10:0 (B_02_WO_supper)
K-Fatty acids: 12:0 (B_02_WO_supper)
K-Fatty acids: 14:0 (B_02_WO_supper)
K-Fatty acids: 15:0 (B_02_WO_supper)
K-Fatty acids: 16:0 (B_02_WO_supper)
K-Fatty acids: 17:0 (B_02_WO_supper)
K-Fatty acids: 18:0 (B_02_WO_supper)
K-Fatty acids: 20:0 (B_02_WO_supper)
K-Fatty acids: total saturated (B_02_WO_supper)
K-Fatty acids: 14:1 (B_02_WO_supper)
K-Fatty acids: 15:1 (B_02_WO_supper)
K-Fatty acids: 16:1 (B_02_WO_supper)
K-Fatty acids: 17:1 (B_02_WO_supper)
K-Fatty acids: 18:1 (B_02_WO_supper)
K-Fatty acids: 20:1 (B_02_WO_supper)
K-Fatty acids: 22:1 (B_02_WO_supper)
K-Fatty acids: total monounsaturated (B_02_WO_supper)
K-Fatty acids: 20:4 (B_02_WO_supper)
K-Fatty acids: 22:6 (B_02_WO_supper)
K-Fatty acids: total polyunsaturated (B_02_WO_supper)
K-Cholesterol (B_02_WO_supper)
K-Isoleucine (B_02_WO_supper)
K-Leucine (B_02_WO_supper)
K-Lysine (B_02_WO_supper)
K-Methionine (B_02_WO_supper)
K-Cystine (B_02_WO_supper)
K-Phenylalanine (B_02_WO_supper)
K-Tyrosine (B_02_WO_supper)
K-Threonine (B_02_WO_supper)
K-Tryptophan (B_02_WO_supper)
K-Valine (B_02_WO_supper)
K-Arginine (B_02_WO_supper)
K-Histidine (B_02_WO_supper)
K-Alanine (B_02_WO_supper)
K-Aspartic acid (B_02_WO_supper)
K-Glutamic acid (B_02_WO_supper)
K-Glycine (B_02_WO_supper)
K-Proline (B_02_WO_supper)
K-Serine (B_02_WO_supper)
K-Sucrose (B_02_WO_supper)
K-Starch (B_02_WO_supper)
K-Dietary fibre (B_02_WO_supper)
K-Vitamin B12 (B_02_WO_supper)
K-vitamin D (B_02_WO_supper)
K-Iodine (B_02_WO_supper)
K-Long-chain polyunsaturated fatty acids (B_02_WO_supper)
K-Taurine (B_02_WO_supper)
K-L-carnitine (B_02_WO_supper)
K-Percentage of energy from protein (B_02_WO_supper)
K-Percentage of energy from fat (B_02_WO_supper)
K-Percentage of energy from carbohydrates (B_02_WO_supper)
K-Percentage of energy from sucrose (B_02_WO_supper)
POJ-Energy kJ (B_02_WO_snack)
POJ-Energy kcal (B_02_WO_snack)
POJ-Total protein (B_02_WO_snack)
POJ-Fat (B_02_WO_snack)
POJ-Total carbohydrates (B_02_WO_snack)
POJ-Ash (B_02_WO_snack)
POJ-Sodium (B_02_WO_snack)
POJ-Potassium (B_02_WO_snack)
POJ-Calcium (B_02_WO_snack)
POJ-Phosphorus (B_02_WO_snack)
POJ-Magnesium (B_02_WO_snack)
POJ-Zinc (B_02_WO_snack)
POJ-Riboflavin (B_02_WO_snack)
POJ-Vitamin B6 (B_02_WO_snack)
POJ-Fatty acids: 6:0 (B_02_WO_snack)
POJ-Fatty acids: 14:0 (B_02_WO_snack)
POJ-Fatty acids: 16:0 (B_02_WO_snack)
POJ-Fatty acids: 17:0 (B_02_WO_snack)
POJ-Fatty acids: 18:0 (B_02_WO_snack)
POJ-Fatty acids: total saturated (B_02_WO_snack)
POJ-Fatty acids: 14:1 (B_02_WO_snack)
POJ-Fatty acids: 15:1 (B_02_WO_snack)

125
POJ-Fatty acids: 16:1 (B_02_WO_snack)
POJ-Fatty acids: 17:1 (B_02_WO_snack)
POJ-Fatty acids: 18:1 (B_02_WO_snack)
POJ-fatty acids: total monounsaturated (B_02_WO_snack)
POJ-Fatty acids: 18:3 (B_02_WO_snack)
POJ-Fatty acids: 20:4 (B_02_WO_snack)
POJ-Fatty acids: total polyunsaturated (B_02_WO_snack)
POJ-Isoleucine (B_02_WO_snack)
POJ-Leucine (B_02_WO_snack)
POJ-Lysine (B_02_WO_snack)
POJ-Methionine (B_02_WO_snack)
POJ-Cystine (B_02_WO_snack)
POJ-Phenylalanine (B_02_WO_snack)
POJ-Tyrosine (B_02_WO_snack)
POJ-Threonine (B_02_WO_snack)
POJ-Tryptophan (B_02_WO_snack)
POJ-Valine (B_02_WO_snack)
POJ-Arginine (B_02_WO_snack)
POJ-Histidine (B_02_WO_snack)
POJ-Alanine (B_02_WO_snack)
POJ-Aspartic acid (B_02_WO_snack)
POJ-Glutamic acid (B_02_WO_snack)
POJ-Glycine (B_02_WO_snack)
POJ-Proline (B_02_WO_snack)
POJ-Serine (B_02_WO_snack)
POJ-Sucrose (B_02_WO_snack)
POJ-Folates/folic acid (B_02_WO_snack)
POJ-Digestible carbohydrates (B_02_WO_snack)
POJ-Percentage of energy from fat (B_02_WO_snack)
SUPL-Ash (B_02_A_WiSMzŻW)
SUPL-Sodium (B_02_A_WiSMzŻW)
SUPL-Potassium (B_02_A_WiSMzŻW)
SUPL-Calcium (B_02_A_WiSMzŻW)
SUPL-Phosphorus (B_02_A_WiSMzŻW)
SUPL-Magnesium (B_02_A_WiSMzŻW)
SUPL-Iron (B_02_A_WiSMzŻW)
SUPL-Zinc (B_02_A_WiSMzŻW)
SUPL-Copper (B_02_A_WiSMzŻW)
SUPL-Manganese (B_02_A_WiSMzŻW)
SUPL-Vitamin A (retinol equivalent) (B_02_A_WiSMzŻW)
SUPL-Beta-carotene (B_02_A_WiSMzŻW)
SUPL-Vitamin E (alpha-tocopherol equivalent) (B_02_A_WiSMzŻW)
SUPL-Thiamin (B_02_A_WiSMzŻW)
SUPL-Riboflavin (B_02_A_WiSMzŻW)
SUPL-Niacin (B_02_A_WiSMzŻW)
SUPL-Vitamin B6 (B_02_A_WiSMzŻW)
SUPL-Folates/folic acid (B_02_A_WiSMzŻW)
SUPL-Vitamin B12 (B_02_A_WiSMzŻW)
SUPL-Vitamin D (B_02_A_WiSMzŻW)
ŻYW-Ash (B_02_B_WiSMzŻnW)
ŻYW-Sodium (B_02_B_WiSMzŻnW)
ŻYW-Potassium (B_02_B_WiSMzŻnW)
ŻYW-Phosphorus (B_02_B_WiSMzŻnW)
ŻYW-Magnesium (B_02_B_WiSMzŻnW)
ŻYW-Copper (B_02_B_WiSMzŻnW)
ŻYW-Manganese (B_02_B_WiSMzŻnW)
ŻYW-Riboflavin (B_02_B_WiSMzŻnW)
ŻYW-Vitamin B12 (B_02_B_WiSMzŻnW)
ŻYW-vitamin D (B_02_B_WiSMzŻnW)
Cereal products based on flour P2 (B_04_Product_consumption)
Groat and rice P3 (B_04_Product_consumption)
Bread P3 (B_04_Product_consumption)
Total potatoes P2 (B_04_Product_consumption)
Total fruits and vegetables P2 (B_04_Product_consumption)
Fruits, market product P3 (B_04_Product_consumption)
Juices, fruit and vegetable drinks and nectars P2 (B_04_Product_consumption)
Milk and sweet milk beverages P2 (B_04_Product_consumption)
Nutrition for infants and young children P3 (B_04_Product_consumption)
Fermented milk beverages P2 (B_04_Product_consumption)
Rennet cheese P2 (B_04_Product_consumption)
Cottage cheese (sliced and in containers) P3 (B_04_Product_consumption)
Meat and poultry based on boneless meat P2
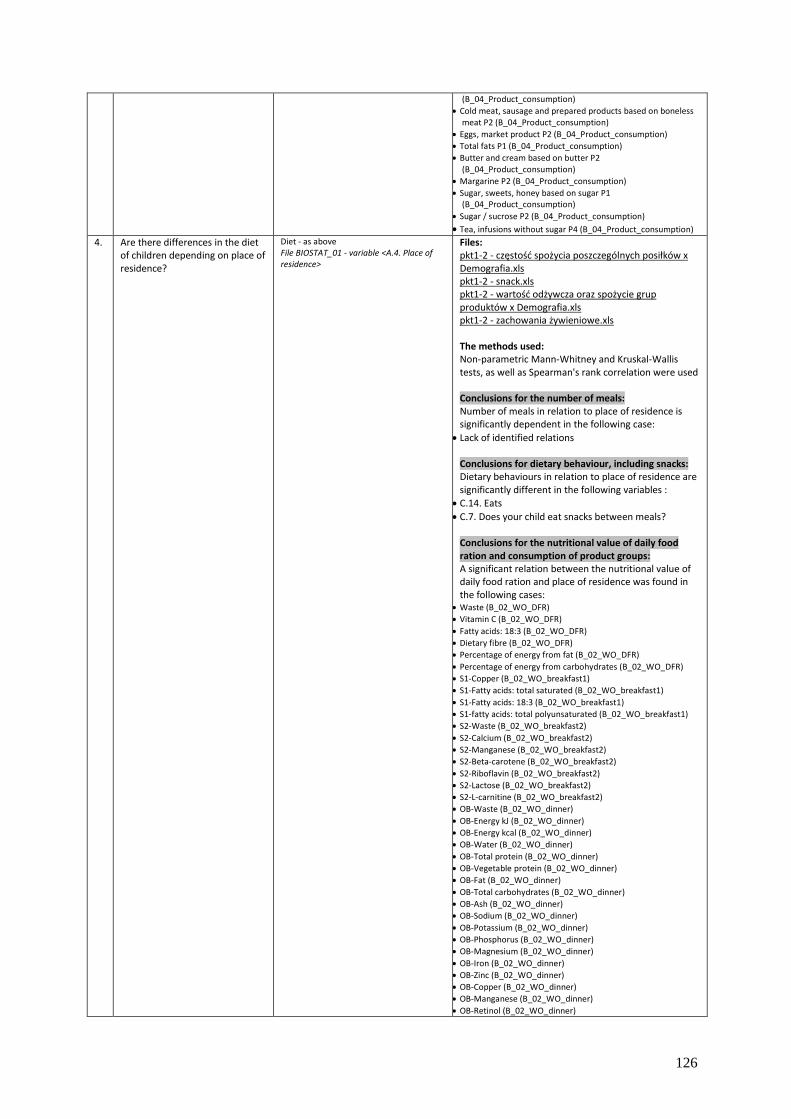
126
(B_04_Product_consumption)
Cold meat, sausage and prepared products based on boneless meat P2 (B_04_Product_consumption)
Eggs, market product P2 (B_04_Product_consumption)
Total fats P1 (B_04_Product_consumption)
Butter and cream based on butter P2 (B_04_Product_consumption)
Margarine P2 (B_04_Product_consumption)
Sugar, sweets, honey based on sugar P1 (B_04_Product_consumption)
Sugar / sucrose P2 (B_04_Product_consumption)
Tea, infusions without sugar P4 (B_04_Product_consumption)
4. Are there differences in the diet of children depending on place of residence?
Diet - as above File BIOSTAT_01 - variable <A.4. Place of residence>
Files: pkt1-2 - częstość spożycia poszczególnych posiłków x Demografia.xls pkt1-2 - snack.xls pkt1-2 - wartość odżywcza oraz spożycie grup produktów x Demografia.xls pkt1-2 - zachowania żywieniowe.xls The methods used: Non-parametric Mann-Whitney and Kruskal-Wallis tests, as well as Spearman's rank correlation were used Conclusions for the number of meals: Number of meals in relation to place of residence is significantly dependent in the following case:
Lack of identified relations Conclusions for dietary behaviour, including snacks: Dietary behaviours in relation to place of residence are significantly different in the following variables :
C.14. Eats
C.7. Does your child eat snacks between meals? Conclusions for the nutritional value of daily food ration and consumption of product groups: A significant relation between the nutritional value of daily food ration and place of residence was found in the following cases:
Waste (B_02_WO_DFR)
Vitamin C (B_02_WO_DFR)
Fatty acids: 18:3 (B_02_WO_DFR)
Dietary fibre (B_02_WO_DFR)
Percentage of energy from fat (B_02_WO_DFR)
Percentage of energy from carbohydrates (B_02_WO_DFR)
S1-Copper (B_02_WO_breakfast1)
S1-Fatty acids: total saturated (B_02_WO_breakfast1)
S1-Fatty acids: 18:3 (B_02_WO_breakfast1)
S1-fatty acids: total polyunsaturated (B_02_WO_breakfast1)
S2-Waste (B_02_WO_breakfast2)
S2-Calcium (B_02_WO_breakfast2)
S2-Manganese (B_02_WO_breakfast2)
S2-Beta-carotene (B_02_WO_breakfast2)
S2-Riboflavin (B_02_WO_breakfast2)
S2-Lactose (B_02_WO_breakfast2)
S2-L-carnitine (B_02_WO_breakfast2)
OB-Waste (B_02_WO_dinner)
OB-Energy kJ (B_02_WO_dinner)
OB-Energy kcal (B_02_WO_dinner)
OB-Water (B_02_WO_dinner)
OB-Total protein (B_02_WO_dinner)
OB-Vegetable protein (B_02_WO_dinner)
OB-Fat (B_02_WO_dinner)
OB-Total carbohydrates (B_02_WO_dinner)
OB-Ash (B_02_WO_dinner)
OB-Sodium (B_02_WO_dinner)
OB-Potassium (B_02_WO_dinner)
OB-Phosphorus (B_02_WO_dinner)
OB-Magnesium (B_02_WO_dinner)
OB-Iron (B_02_WO_dinner)
OB-Zinc (B_02_WO_dinner)
OB-Copper (B_02_WO_dinner)
OB-Manganese (B_02_WO_dinner)
OB-Retinol (B_02_WO_dinner)
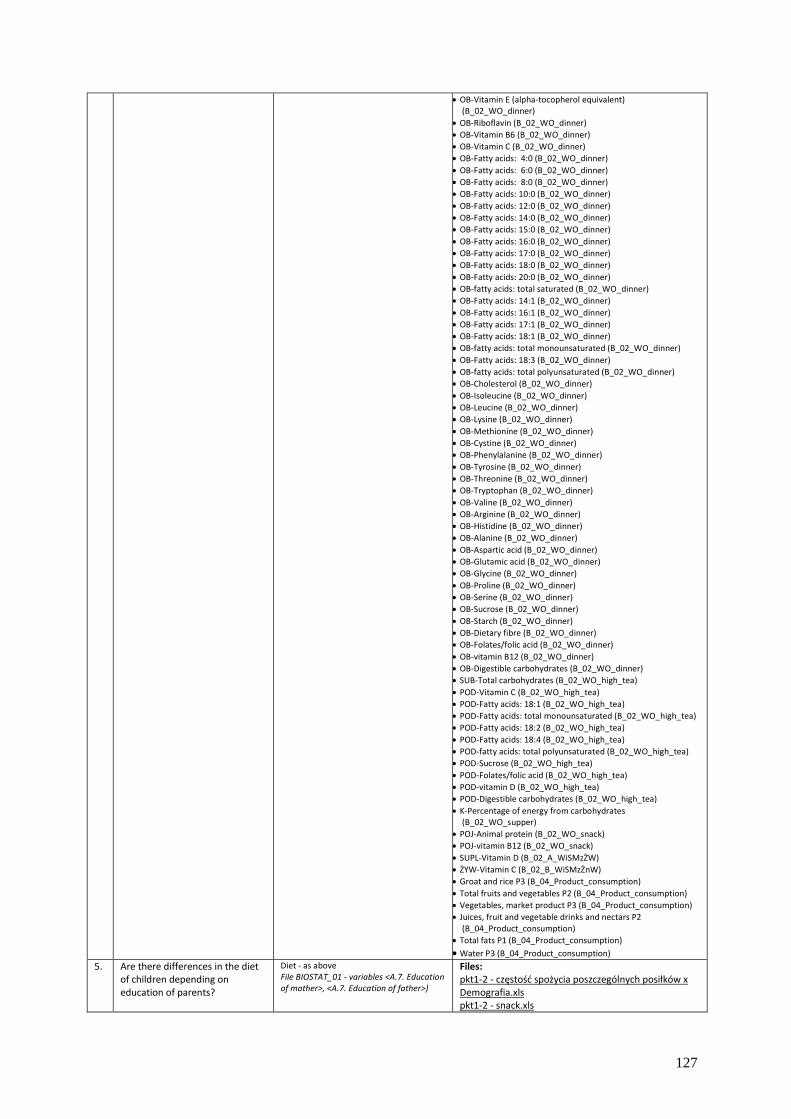
127
OB-Vitamin E (alpha-tocopherol equivalent) (B_02_WO_dinner)
OB-Riboflavin (B_02_WO_dinner)
OB-Vitamin B6 (B_02_WO_dinner)
OB-Vitamin C (B_02_WO_dinner)
OB-Fatty acids: 4:0 (B_02_WO_dinner)
OB-Fatty acids: 6:0 (B_02_WO_dinner)
OB-Fatty acids: 8:0 (B_02_WO_dinner)
OB-Fatty acids: 10:0 (B_02_WO_dinner)
OB-Fatty acids: 12:0 (B_02_WO_dinner)
OB-Fatty acids: 14:0 (B_02_WO_dinner)
OB-Fatty acids: 15:0 (B_02_WO_dinner)
OB-Fatty acids: 16:0 (B_02_WO_dinner)
OB-Fatty acids: 17:0 (B_02_WO_dinner)
OB-Fatty acids: 18:0 (B_02_WO_dinner)
OB-Fatty acids: 20:0 (B_02_WO_dinner)
OB-fatty acids: total saturated (B_02_WO_dinner)
OB-Fatty acids: 14:1 (B_02_WO_dinner)
OB-Fatty acids: 16:1 (B_02_WO_dinner)
OB-Fatty acids: 17:1 (B_02_WO_dinner)
OB-Fatty acids: 18:1 (B_02_WO_dinner)
OB-fatty acids: total monounsaturated (B_02_WO_dinner)
OB-Fatty acids: 18:3 (B_02_WO_dinner)
OB-fatty acids: total polyunsaturated (B_02_WO_dinner)
OB-Cholesterol (B_02_WO_dinner)
OB-Isoleucine (B_02_WO_dinner)
OB-Leucine (B_02_WO_dinner)
OB-Lysine (B_02_WO_dinner)
OB-Methionine (B_02_WO_dinner)
OB-Cystine (B_02_WO_dinner)
OB-Phenylalanine (B_02_WO_dinner)
OB-Tyrosine (B_02_WO_dinner)
OB-Threonine (B_02_WO_dinner)
OB-Tryptophan (B_02_WO_dinner)
OB-Valine (B_02_WO_dinner)
OB-Arginine (B_02_WO_dinner)
OB-Histidine (B_02_WO_dinner)
OB-Alanine (B_02_WO_dinner)
OB-Aspartic acid (B_02_WO_dinner)
OB-Glutamic acid (B_02_WO_dinner)
OB-Glycine (B_02_WO_dinner)
OB-Proline (B_02_WO_dinner)
OB-Serine (B_02_WO_dinner)
OB-Sucrose (B_02_WO_dinner)
OB-Starch (B_02_WO_dinner)
OB-Dietary fibre (B_02_WO_dinner)
OB-Folates/folic acid (B_02_WO_dinner)
OB-vitamin B12 (B_02_WO_dinner)
OB-Digestible carbohydrates (B_02_WO_dinner)
SUB-Total carbohydrates (B_02_WO_high_tea)
POD-Vitamin C (B_02_WO_high_tea)
POD-Fatty acids: 18:1 (B_02_WO_high_tea)
POD-Fatty acids: total monounsaturated (B_02_WO_high_tea)
POD-Fatty acids: 18:2 (B_02_WO_high_tea)
POD-Fatty acids: 18:4 (B_02_WO_high_tea)
POD-fatty acids: total polyunsaturated (B_02_WO_high_tea)
POD-Sucrose (B_02_WO_high_tea)
POD-Folates/folic acid (B_02_WO_high_tea)
POD-vitamin D (B_02_WO_high_tea)
POD-Digestible carbohydrates (B_02_WO_high_tea)
K-Percentage of energy from carbohydrates (B_02_WO_supper)
POJ-Animal protein (B_02_WO_snack)
POJ-vitamin B12 (B_02_WO_snack)
SUPL-Vitamin D (B_02_A_WiSMzŻW)
ŻYW-Vitamin C (B_02_B_WiSMzŻnW)
Groat and rice P3 (B_04_Product_consumption)
Total fruits and vegetables P2 (B_04_Product_consumption)
Vegetables, market product P3 (B_04_Product_consumption)
Juices, fruit and vegetable drinks and nectars P2 (B_04_Product_consumption)
Total fats P1 (B_04_Product_consumption)
Water P3 (B_04_Product_consumption)
5. Are there differences in the diet of children depending on education of parents?
Diet - as above File BIOSTAT_01 - variables <A.7. Education of mother>, <A.7. Education of father>)
Files: pkt1-2 - częstość spożycia poszczególnych posiłków x Demografia.xls pkt1-2 - snack.xls

128
pkt1-2 - wartość odżywcza oraz spożycie grup produktów x Demografia.xls pkt1-2 - zachowania żywieniowe.xls The methods used: Non-parametric Mann-Whitney and Kruskal-Wallis tests, as well as Spearman's rank correlation were used Conclusions for the number of meals: Number of meals in relation to education of mother is significantly dependent in the following case:
C.6. Meal / snack before bedtime Number of meals in relation to education of father is significantly dependent in the following case:
C.6. Meal/drink at night Conclusions for dietary behaviour, including snacks: Dietary behaviours in relation to education of mother are significantly different in the following variables :
C.14. Eats
C.14. Learns new flavours Dietary behaviours in relation to education of father are significantly different in the following variables :
C.14. Eats
C.14. Learns new flavours Conclusions for the nutritional value of daily food ration and consumption of product groups: A significant relation between the nutritional value of daily food ration and education of mother was found in the following cases:
Energy kJ (B_02_WO_DFR)
Energy kcal (B_02_WO_DFR)
Total protein (B_02_WO_DFR)
Animal protein (B_02_WO_DFR)
Vegetable protein (B_02_WO_DFR)
Fat (B_02_WO_DFR)
Ash (B_02_WO_DFR)
Sodium (B_02_WO_DFR)
Potassium (B_02_WO_DFR)
Magnesium (B_02_WO_DFR)
Manganese (B_02_WO_DFR)
Riboflavin (B_02_WO_DFR)
Vitamin B6 (B_02_WO_DFR)
Fatty acids: 8:0 (B_02_WO_DFR)
Fatty acids: 12:0 (B_02_WO_DFR)
Fatty acids: 15:0 (B_02_WO_DFR)
Fatty acids: 16:0 (B_02_WO_DFR)
Fatty acids: 17:0 (B_02_WO_DFR)
Fatty acids: 18:0 (B_02_WO_DFR)
Fatty acids: 20:0 (B_02_WO_DFR)
Fatty acids: 14:1 (B_02_WO_DFR)
Fatty acids: 15:1 (B_02_WO_DFR)
Fatty acids: 16:1 (B_02_WO_DFR)
Fatty acids: 17:1 (B_02_WO_DFR)
Fatty acids: 18:1 (B_02_WO_DFR)
Fatty acids: 20:1 (B_02_WO_DFR)
Fatty acids: Total monounsaturated (B_02_WO_DFR)
Fatty acids: 22:5 (B_02_WO_DFR)
Isoleucine (B_02_WO_DFR)
Leucine (B_02_WO_DFR)
Lysine (B_02_WO_DFR)
Methionine (B_02_WO_DFR)
Cystine (B_02_WO_DFR)
Phenylalanine (B_02_WO_DFR)
Tyrosine (B_02_WO_DFR)
Threonine (B_02_WO_DFR)
Tryptophan (B_02_WO_DFR)
Valine (B_02_WO_DFR)
Arginine (B_02_WO_DFR)
Histidine (B_02_WO_DFR)
Alanine (B_02_WO_DFR)

129
Aspartic acid (B_02_WO_DFR)
Glutamic acid (B_02_WO_DFR)
Glycine (B_02_WO_DFR)
Proline (B_02_WO_DFR)
Serine (B_02_WO_DFR)
Starch (B_02_WO_DFR)
S1-Fatty acids: 20:1 (B_02_WO_breakfast1)
S1-Fatty acids: 22:1 (B_02_WO_breakfast1)
S1-Fatty acids: 18:4 (B_02_WO_breakfast1)
S1-Fatty acids: 20:4 (B_02_WO_breakfast1)
S1-Fatty acids: 22:6 (B_02_WO_breakfast1)
S1-Iodine (B_02_WO_breakfast1)
S1-Long-chain polyunsaturated fatty acids (B_02_WO_breakfast1)
S2-Energy kJ (B_02_WO_breakfast2)
S2-Energy kcal (B_02_WO_breakfast2)
S2-Ash (B_02_WO_breakfast2)
S2-Magnesium (B_02_WO_breakfast2)
S2-Retinol (B_02_WO_breakfast2)
S2-Fatty acids: 4:0 (B_02_WO_breakfast2)
S2-Lactose (B_02_WO_breakfast2)
S2-Iodine (B_02_WO_breakfast2)
OB-Ash (B_02_WO_dinner)
OB-Potassium (B_02_WO_dinner)
OB-Thiamin (B_02_WO_dinner)
OB-Vitamin B6 (B_02_WO_dinner)
OB-Fatty acids: 20:3 (B_02_WO_dinner)
OB-Fatty acids: 22:5 (B_02_WO_dinner)
OB-Starch (B_02_WO_dinner)
OB-Iodine (B_02_WO_dinner)
OB-Taurine (B_02_WO_dinner)
POD-Animal protein (B_02_WO_high_tea)
POD-Calcium (B_02_WO_high_tea)
POD-Phosphorus (B_02_WO_high_tea)
POD-Riboflavin (B_02_WO_high_tea)
POD-Fatty acids: 4:0 (B_02_WO_high_tea)
POD-Fatty acids: 6:0 (B_02_WO_high_tea)
POD-Fatty acids: 8:0 (B_02_WO_high_tea)
POD-Fatty acids: 10:0 (B_02_WO_high_tea)
POD-Fatty acids: 12:0 (B_02_WO_high_tea)
POD-Fatty acids: 14:0 (B_02_WO_high_tea)
POD-Fatty acids: 15:0 (B_02_WO_high_tea)
POD-Fatty acids: 17:0 (B_02_WO_high_tea)
POD-Fatty acids: 14:1 (B_02_WO_high_tea)
POD-Fatty acids: 15:1 (B_02_WO_high_tea)
POD-Fatty acids: 16:1 (B_02_WO_high_tea)
POD-Fatty acids: 17:1 (B_02_WO_high_tea)
POD-Fatty acids: 18:4 (B_02_WO_high_tea)
POD-Lysine (B_02_WO_high_tea)
POD-Lactose (B_02_WO_high_tea)
POD-vitamin B12 (B_02_WO_high_tea)
K-Animal protein (B_02_WO_supper)
K-Vegetable protein (B_02_WO_supper)
K-Fat (B_02_WO_supper)
K-Ash (B_02_WO_supper)
K-Sodium (B_02_WO_supper)
K-Manganese (B_02_WO_supper)
K-Vitamin C (B_02_WO_supper)
K-Fatty acids: 4:0 (B_02_WO_supper)
K-Fatty acids: 6:0 (B_02_WO_supper)
K-Fatty acids: 8:0 (B_02_WO_supper)
K-Fatty acids: 10:0 (B_02_WO_supper)
K-Fatty acids: 12:0 (B_02_WO_supper)
K-Fatty acids: 14:0 (B_02_WO_supper)
K-Fatty acids: 15:0 (B_02_WO_supper)
K-Fatty acids: 16:0 (B_02_WO_supper)
K-Fatty acids: 17:0 (B_02_WO_supper)
K-Fatty acids: 18:0 (B_02_WO_supper)
K-Fatty acids: 20:0 (B_02_WO_supper)
K-Fatty acids: total saturated (B_02_WO_supper)
K-Fatty acids: 14:1 (B_02_WO_supper)
K-Fatty acids: 16:1 (B_02_WO_supper)
K-Fatty acids: 17:1 (B_02_WO_supper)
K-Fatty acids: 18:1 (B_02_WO_supper)
K-Fatty acids: total monounsaturated (B_02_WO_supper)
K-Fatty acids: 22:6 (B_02_WO_supper)
K-Cholesterol (B_02_WO_supper)
K-Isoleucine (B_02_WO_supper)
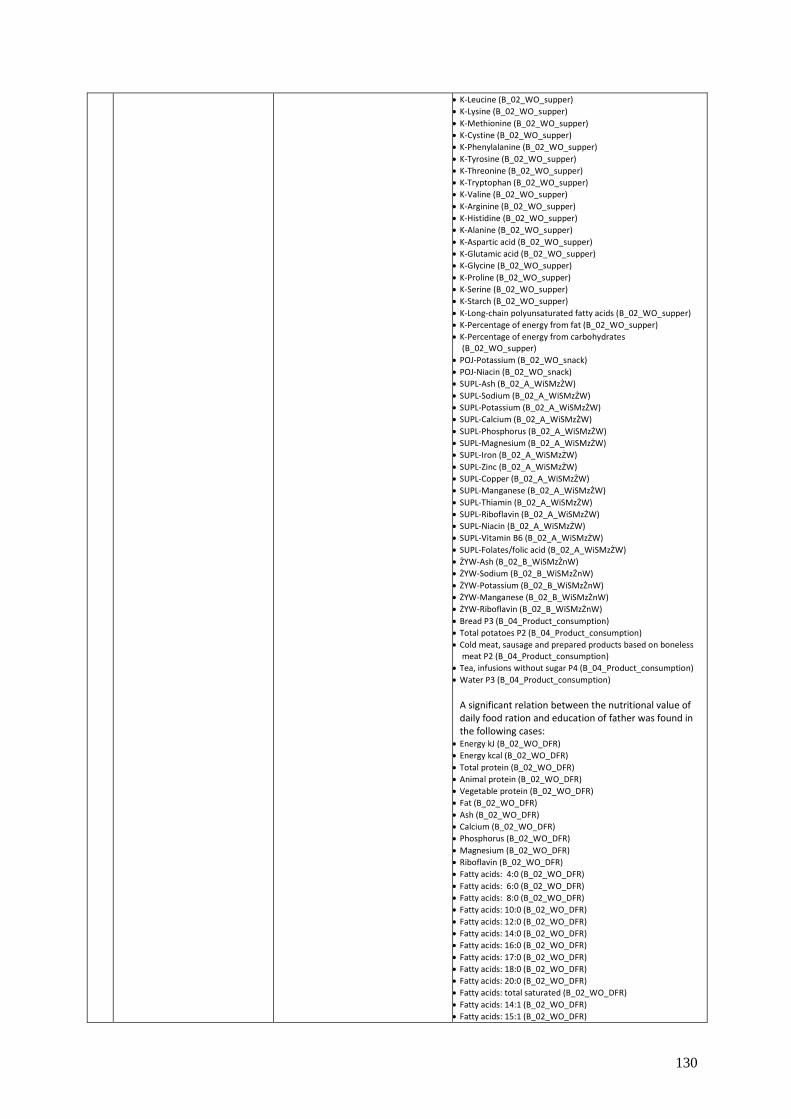
130
K-Leucine (B_02_WO_supper)
K-Lysine (B_02_WO_supper)
K-Methionine (B_02_WO_supper)
K-Cystine (B_02_WO_supper)
K-Phenylalanine (B_02_WO_supper)
K-Tyrosine (B_02_WO_supper)
K-Threonine (B_02_WO_supper)
K-Tryptophan (B_02_WO_supper)
K-Valine (B_02_WO_supper)
K-Arginine (B_02_WO_supper)
K-Histidine (B_02_WO_supper)
K-Alanine (B_02_WO_supper)
K-Aspartic acid (B_02_WO_supper)
K-Glutamic acid (B_02_WO_supper)
K-Glycine (B_02_WO_supper)
K-Proline (B_02_WO_supper)
K-Serine (B_02_WO_supper)
K-Starch (B_02_WO_supper)
K-Long-chain polyunsaturated fatty acids (B_02_WO_supper)
K-Percentage of energy from fat (B_02_WO_supper)
K-Percentage of energy from carbohydrates (B_02_WO_supper)
POJ-Potassium (B_02_WO_snack)
POJ-Niacin (B_02_WO_snack)
SUPL-Ash (B_02_A_WiSMzŻW)
SUPL-Sodium (B_02_A_WiSMzŻW)
SUPL-Potassium (B_02_A_WiSMzŻW)
SUPL-Calcium (B_02_A_WiSMzŻW)
SUPL-Phosphorus (B_02_A_WiSMzŻW)
SUPL-Magnesium (B_02_A_WiSMzŻW)
SUPL-Iron (B_02_A_WiSMzŻW)
SUPL-Zinc (B_02_A_WiSMzŻW)
SUPL-Copper (B_02_A_WiSMzŻW)
SUPL-Manganese (B_02_A_WiSMzŻW)
SUPL-Thiamin (B_02_A_WiSMzŻW)
SUPL-Riboflavin (B_02_A_WiSMzŻW)
SUPL-Niacin (B_02_A_WiSMzŻW)
SUPL-Vitamin B6 (B_02_A_WiSMzŻW)
SUPL-Folates/folic acid (B_02_A_WiSMzŻW)
ŻYW-Ash (B_02_B_WiSMzŻnW)
ŻYW-Sodium (B_02_B_WiSMzŻnW)
ŻYW-Potassium (B_02_B_WiSMzŻnW)
ŻYW-Manganese (B_02_B_WiSMzŻnW)
ŻYW-Riboflavin (B_02_B_WiSMzŻnW)
Bread P3 (B_04_Product_consumption)
Total potatoes P2 (B_04_Product_consumption)
Cold meat, sausage and prepared products based on boneless meat P2 (B_04_Product_consumption)
Tea, infusions without sugar P4 (B_04_Product_consumption)
Water P3 (B_04_Product_consumption)
A significant relation between the nutritional value of daily food ration and education of father was found in the following cases:
Energy kJ (B_02_WO_DFR)
Energy kcal (B_02_WO_DFR)
Total protein (B_02_WO_DFR)
Animal protein (B_02_WO_DFR)
Vegetable protein (B_02_WO_DFR)
Fat (B_02_WO_DFR)
Ash (B_02_WO_DFR)
Calcium (B_02_WO_DFR)
Phosphorus (B_02_WO_DFR)
Magnesium (B_02_WO_DFR)
Riboflavin (B_02_WO_DFR)
Fatty acids: 4:0 (B_02_WO_DFR)
Fatty acids: 6:0 (B_02_WO_DFR)
Fatty acids: 8:0 (B_02_WO_DFR)
Fatty acids: 10:0 (B_02_WO_DFR)
Fatty acids: 12:0 (B_02_WO_DFR)
Fatty acids: 14:0 (B_02_WO_DFR)
Fatty acids: 16:0 (B_02_WO_DFR)
Fatty acids: 17:0 (B_02_WO_DFR)
Fatty acids: 18:0 (B_02_WO_DFR)
Fatty acids: 20:0 (B_02_WO_DFR)
Fatty acids: total saturated (B_02_WO_DFR)
Fatty acids: 14:1 (B_02_WO_DFR)
Fatty acids: 15:1 (B_02_WO_DFR)

131
Fatty acids: 16:1 (B_02_WO_DFR)
Fatty acids: 17:1 (B_02_WO_DFR)
Fatty acids: 18:1 (B_02_WO_DFR)
Fatty acids: Total monounsaturated (B_02_WO_DFR)
Fatty acids: 18:4 (B_02_WO_DFR)
Cholesterol (B_02_WO_DFR)
Isoleucine (B_02_WO_DFR)
Leucine (B_02_WO_DFR)
Lysine (B_02_WO_DFR)
Methionine (B_02_WO_DFR)
Cystine (B_02_WO_DFR)
Phenylalanine (B_02_WO_DFR)
Tyrosine (B_02_WO_DFR)
Threonine (B_02_WO_DFR)
Tryptophan (B_02_WO_DFR)
Valine (B_02_WO_DFR)
Histidine (B_02_WO_DFR)
Alanine (B_02_WO_DFR)
Aspartic acid (B_02_WO_DFR)
Glutamic acid (B_02_WO_DFR)
Glycine (B_02_WO_DFR)
Proline (B_02_WO_DFR)
Serine (B_02_WO_DFR)
Starch (B_02_WO_DFR)
Digestible carbohydrates (B_02_WO_DFR)
S1-Total protein (B_02_WO_breakfast1)
S1-Fat (B_02_WO_breakfast1)
S1-Vitamin A (retinol equivalent) (B_02_WO_breakfast1)
S1-Retinol (B_02_WO_breakfast1)
S1-Vitamin E (alpha-tocopherol equivalent) (B_02_WO_breakfast1)
S1-Vitamin C (B_02_WO_breakfast1)
S1-Fatty acids: 20:0 (B_02_WO_breakfast1)
S1-Fatty acids: 16:1 (B_02_WO_breakfast1)
S1-vitamin D (B_02_WO_breakfast1)
S1-Iodine (B_02_WO_breakfast1)
S1-Percentage of energy from fat (B_02_WO_breakfast1)
S1-Percentage of energy from carbohydrates (B_02_WO_breakfast1)
S2-Vegetable protein (B_02_WO_breakfast2)
S2-Total carbohydrates (B_02_WO_breakfast2)
S2-Magnesium (B_02_WO_breakfast2)
S2-Copper (B_02_WO_breakfast2)
S2-Vitamin A (retinol equivalent) (B_02_WO_breakfast2)
S2-Fatty acids: 4:0 (B_02_WO_breakfast2)
S2-Cystine (B_02_WO_breakfast2)
S2-Starch (B_02_WO_breakfast2)
S2-Dietary fibre (B_02_WO_breakfast2)
S2-Digestible carbohydrates (B_02_WO_breakfast2)
POD-Energy kJ (B_02_WO_high_tea)
POD-Energy kcal (B_02_WO_high_tea)
POD-Water (B_02_WO_high_tea)
POD-Total protein (B_02_WO_high_tea)
POD-Animal protein (B_02_WO_high_tea)
SUB-Total carbohydrates (B_02_WO_high_tea)
POD-Calcium (B_02_WO_high_tea)
POD-Phosphorus (B_02_WO_high_tea)
POD-Magnesium (B_02_WO_high_tea)
POD-Iron (B_02_WO_high_tea)
POD-Zinc (B_02_WO_high_tea)
POD-Copper (B_02_WO_high_tea)
POD-Vitamin A (retinol equivalent) (B_02_WO_high_tea)
POD-Retinol (B_02_WO_high_tea)
POD-Riboflavin (B_02_WO_high_tea)
POD-Niacin (B_02_WO_high_tea)
POD-Vitamin C (B_02_WO_high_tea)
POD-Fatty acids: 4:0 (B_02_WO_high_tea)
POD-Fatty acids: 6:0 (B_02_WO_high_tea)
POD-Fatty acids: 8:0 (B_02_WO_high_tea)
POD-Fatty acids: 10:0 (B_02_WO_high_tea)
POD-Fatty acids: 12:0 (B_02_WO_high_tea)
POD-Fatty acids: 14:0 (B_02_WO_high_tea)
POD-Fatty acids: 15:0 (B_02_WO_high_tea)
POD-Fatty acids: 18:0 (B_02_WO_high_tea)
POD-Fatty acids: 20:0 (B_02_WO_high_tea)
POD-Fatty acids: 18:4 (B_02_WO_high_tea)
POD-Lysine (B_02_WO_high_tea)
POD-Tryptophan (B_02_WO_high_tea)
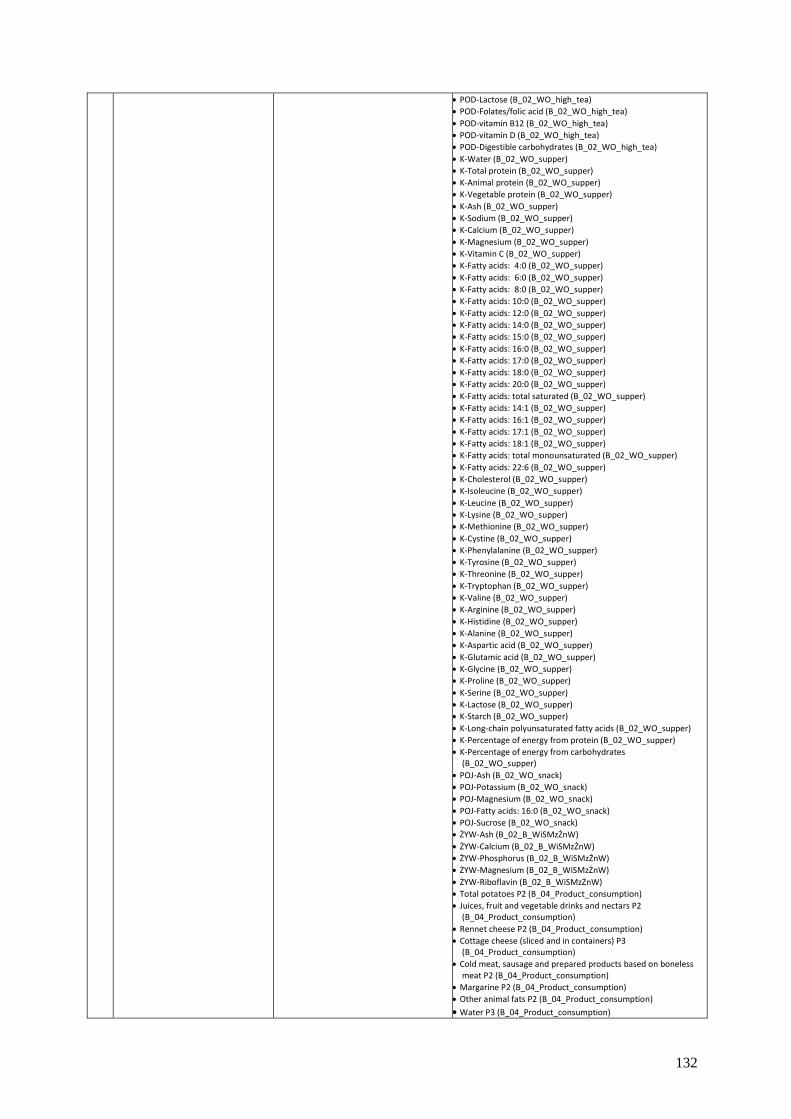
132
POD-Lactose (B_02_WO_high_tea)
POD-Folates/folic acid (B_02_WO_high_tea)
POD-vitamin B12 (B_02_WO_high_tea)
POD-vitamin D (B_02_WO_high_tea)
POD-Digestible carbohydrates (B_02_WO_high_tea)
K-Water (B_02_WO_supper)
K-Total protein (B_02_WO_supper)
K-Animal protein (B_02_WO_supper)
K-Vegetable protein (B_02_WO_supper)
K-Ash (B_02_WO_supper)
K-Sodium (B_02_WO_supper)
K-Calcium (B_02_WO_supper)
K-Magnesium (B_02_WO_supper)
K-Vitamin C (B_02_WO_supper)
K-Fatty acids: 4:0 (B_02_WO_supper)
K-Fatty acids: 6:0 (B_02_WO_supper)
K-Fatty acids: 8:0 (B_02_WO_supper)
K-Fatty acids: 10:0 (B_02_WO_supper)
K-Fatty acids: 12:0 (B_02_WO_supper)
K-Fatty acids: 14:0 (B_02_WO_supper)
K-Fatty acids: 15:0 (B_02_WO_supper)
K-Fatty acids: 16:0 (B_02_WO_supper)
K-Fatty acids: 17:0 (B_02_WO_supper)
K-Fatty acids: 18:0 (B_02_WO_supper)
K-Fatty acids: 20:0 (B_02_WO_supper)
K-Fatty acids: total saturated (B_02_WO_supper)
K-Fatty acids: 14:1 (B_02_WO_supper)
K-Fatty acids: 16:1 (B_02_WO_supper)
K-Fatty acids: 17:1 (B_02_WO_supper)
K-Fatty acids: 18:1 (B_02_WO_supper)
K-Fatty acids: total monounsaturated (B_02_WO_supper)
K-Fatty acids: 22:6 (B_02_WO_supper)
K-Cholesterol (B_02_WO_supper)
K-Isoleucine (B_02_WO_supper)
K-Leucine (B_02_WO_supper)
K-Lysine (B_02_WO_supper)
K-Methionine (B_02_WO_supper)
K-Cystine (B_02_WO_supper)
K-Phenylalanine (B_02_WO_supper)
K-Tyrosine (B_02_WO_supper)
K-Threonine (B_02_WO_supper)
K-Tryptophan (B_02_WO_supper)
K-Valine (B_02_WO_supper)
K-Arginine (B_02_WO_supper)
K-Histidine (B_02_WO_supper)
K-Alanine (B_02_WO_supper)
K-Aspartic acid (B_02_WO_supper)
K-Glutamic acid (B_02_WO_supper)
K-Glycine (B_02_WO_supper)
K-Proline (B_02_WO_supper)
K-Serine (B_02_WO_supper)
K-Lactose (B_02_WO_supper)
K-Starch (B_02_WO_supper)
K-Long-chain polyunsaturated fatty acids (B_02_WO_supper)
K-Percentage of energy from protein (B_02_WO_supper)
K-Percentage of energy from carbohydrates (B_02_WO_supper)
POJ-Ash (B_02_WO_snack)
POJ-Potassium (B_02_WO_snack)
POJ-Magnesium (B_02_WO_snack)
POJ-Fatty acids: 16:0 (B_02_WO_snack)
POJ-Sucrose (B_02_WO_snack)
ŻYW-Ash (B_02_B_WiSMzŻnW)
ŻYW-Calcium (B_02_B_WiSMzŻnW)
ŻYW-Phosphorus (B_02_B_WiSMzŻnW)
ŻYW-Magnesium (B_02_B_WiSMzŻnW)
ŻYW-Riboflavin (B_02_B_WiSMzŻnW)
Total potatoes P2 (B_04_Product_consumption)
Juices, fruit and vegetable drinks and nectars P2 (B_04_Product_consumption)
Rennet cheese P2 (B_04_Product_consumption)
Cottage cheese (sliced and in containers) P3 (B_04_Product_consumption)
Cold meat, sausage and prepared products based on boneless meat P2 (B_04_Product_consumption)
Margarine P2 (B_04_Product_consumption)
Other animal fats P2 (B_04_Product_consumption)
Water P3 (B_04_Product_consumption)
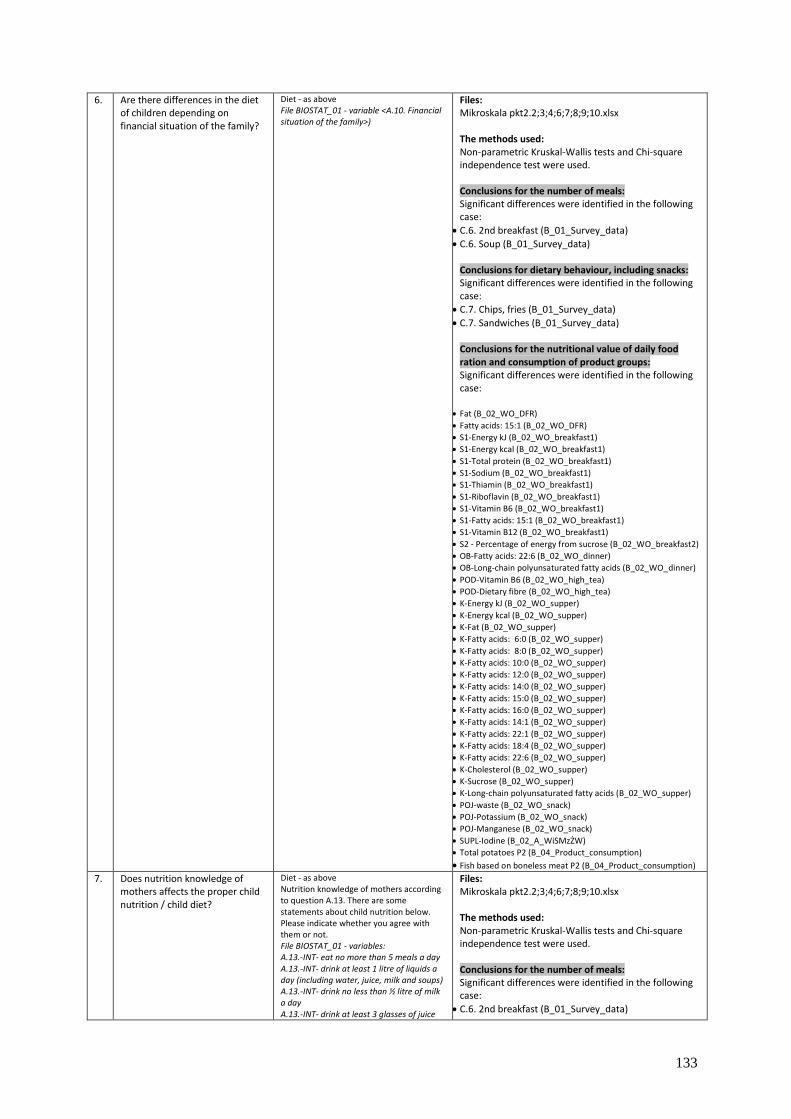
133
6. Are there differences in the diet of children depending on financial situation of the family?
Diet - as above File BIOSTAT_01 - variable <A.10. Financial situation of the family>)
Files: Mikroskala pkt2.2;3;4;6;7;8;9;10.xlsx The methods used: Non-parametric Kruskal-Wallis tests and Chi-square independence test were used. Conclusions for the number of meals: Significant differences were identified in the following case:
C.6. 2nd breakfast (B_01_Survey_data)
C.6. Soup (B_01_Survey_data) Conclusions for dietary behaviour, including snacks: Significant differences were identified in the following case:
C.7. Chips, fries (B_01_Survey_data)
C.7. Sandwiches (B_01_Survey_data) Conclusions for the nutritional value of daily food ration and consumption of product groups: Significant differences were identified in the following case:
Fat (B_02_WO_DFR)
Fatty acids: 15:1 (B_02_WO_DFR)
S1-Energy kJ (B_02_WO_breakfast1)
S1-Energy kcal (B_02_WO_breakfast1)
S1-Total protein (B_02_WO_breakfast1)
S1-Sodium (B_02_WO_breakfast1)
S1-Thiamin (B_02_WO_breakfast1)
S1-Riboflavin (B_02_WO_breakfast1)
S1-Vitamin B6 (B_02_WO_breakfast1)
S1-Fatty acids: 15:1 (B_02_WO_breakfast1)
S1-Vitamin B12 (B_02_WO_breakfast1)
S2 - Percentage of energy from sucrose (B_02_WO_breakfast2)
OB-Fatty acids: 22:6 (B_02_WO_dinner)
OB-Long-chain polyunsaturated fatty acids (B_02_WO_dinner)
POD-Vitamin B6 (B_02_WO_high_tea)
POD-Dietary fibre (B_02_WO_high_tea)
K-Energy kJ (B_02_WO_supper)
K-Energy kcal (B_02_WO_supper)
K-Fat (B_02_WO_supper)
K-Fatty acids: 6:0 (B_02_WO_supper)
K-Fatty acids: 8:0 (B_02_WO_supper)
K-Fatty acids: 10:0 (B_02_WO_supper)
K-Fatty acids: 12:0 (B_02_WO_supper)
K-Fatty acids: 14:0 (B_02_WO_supper)
K-Fatty acids: 15:0 (B_02_WO_supper)
K-Fatty acids: 16:0 (B_02_WO_supper)
K-Fatty acids: 14:1 (B_02_WO_supper)
K-Fatty acids: 22:1 (B_02_WO_supper)
K-Fatty acids: 18:4 (B_02_WO_supper)
K-Fatty acids: 22:6 (B_02_WO_supper)
K-Cholesterol (B_02_WO_supper)
K-Sucrose (B_02_WO_supper)
K-Long-chain polyunsaturated fatty acids (B_02_WO_supper)
POJ-waste (B_02_WO_snack)
POJ-Potassium (B_02_WO_snack)
POJ-Manganese (B_02_WO_snack)
SUPL-Iodine (B_02_A_WiSMzŻW)
Total potatoes P2 (B_04_Product_consumption)
Fish based on boneless meat P2 (B_04_Product_consumption)
7. Does nutrition knowledge of mothers affects the proper child nutrition / child diet?
Diet - as above Nutrition knowledge of mothers according to question A.13. There are some statements about child nutrition below. Please indicate whether you agree with them or not. File BIOSTAT_01 - variables: A.13.-INT- eat no more than 5 meals a day A.13.-INT- drink at least 1 litre of liquids a day (including water, juice, milk and soups) A.13.-INT- drink no less than ½ litre of milk a day A.13.-INT- drink at least 3 glasses of juice
Files: Mikroskala pkt2.2;3;4;6;7;8;9;10.xlsx The methods used: Non-parametric Kruskal-Wallis tests and Chi-square independence test were used. Conclusions for the number of meals: Significant differences were identified in the following case:
C.6. 2nd breakfast (B_01_Survey_data)
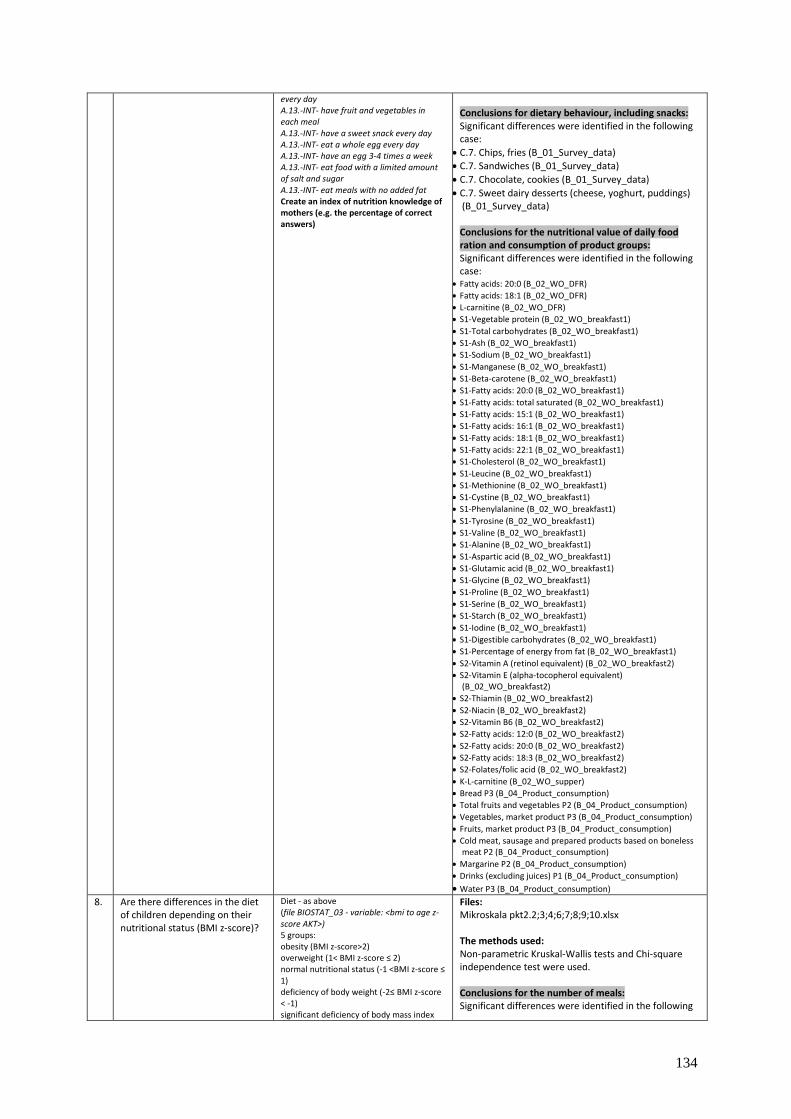
134
every day A.13.-INT- have fruit and vegetables in each meal A.13.-INT- have a sweet snack every day A.13.-INT- eat a whole egg every day A.13.-INT- have an egg 3-4 times a week A.13.-INT- eat food with a limited amount of salt and sugar A.13.-INT- eat meals with no added fat Create an index of nutrition knowledge of mothers (e.g. the percentage of correct answers)
Conclusions for dietary behaviour, including snacks: Significant differences were identified in the following case:
C.7. Chips, fries (B_01_Survey_data)
C.7. Sandwiches (B_01_Survey_data)
C.7. Chocolate, cookies (B_01_Survey_data)
C.7. Sweet dairy desserts (cheese, yoghurt, puddings) (B_01_Survey_data) Conclusions for the nutritional value of daily food ration and consumption of product groups: Significant differences were identified in the following case:
Fatty acids: 20:0 (B_02_WO_DFR)
Fatty acids: 18:1 (B_02_WO_DFR)
L-carnitine (B_02_WO_DFR)
S1-Vegetable protein (B_02_WO_breakfast1)
S1-Total carbohydrates (B_02_WO_breakfast1)
S1-Ash (B_02_WO_breakfast1)
S1-Sodium (B_02_WO_breakfast1)
S1-Manganese (B_02_WO_breakfast1)
S1-Beta-carotene (B_02_WO_breakfast1)
S1-Fatty acids: 20:0 (B_02_WO_breakfast1)
S1-Fatty acids: total saturated (B_02_WO_breakfast1)
S1-Fatty acids: 15:1 (B_02_WO_breakfast1)
S1-Fatty acids: 16:1 (B_02_WO_breakfast1)
S1-Fatty acids: 18:1 (B_02_WO_breakfast1)
S1-Fatty acids: 22:1 (B_02_WO_breakfast1)
S1-Cholesterol (B_02_WO_breakfast1)
S1-Leucine (B_02_WO_breakfast1)
S1-Methionine (B_02_WO_breakfast1)
S1-Cystine (B_02_WO_breakfast1)
S1-Phenylalanine (B_02_WO_breakfast1)
S1-Tyrosine (B_02_WO_breakfast1)
S1-Valine (B_02_WO_breakfast1)
S1-Alanine (B_02_WO_breakfast1)
S1-Aspartic acid (B_02_WO_breakfast1)
S1-Glutamic acid (B_02_WO_breakfast1)
S1-Glycine (B_02_WO_breakfast1)
S1-Proline (B_02_WO_breakfast1)
S1-Serine (B_02_WO_breakfast1)
S1-Starch (B_02_WO_breakfast1)
S1-Iodine (B_02_WO_breakfast1)
S1-Digestible carbohydrates (B_02_WO_breakfast1)
S1-Percentage of energy from fat (B_02_WO_breakfast1)
S2-Vitamin A (retinol equivalent) (B_02_WO_breakfast2)
S2-Vitamin E (alpha-tocopherol equivalent) (B_02_WO_breakfast2)
S2-Thiamin (B_02_WO_breakfast2)
S2-Niacin (B_02_WO_breakfast2)
S2-Vitamin B6 (B_02_WO_breakfast2)
S2-Fatty acids: 12:0 (B_02_WO_breakfast2)
S2-Fatty acids: 20:0 (B_02_WO_breakfast2)
S2-Fatty acids: 18:3 (B_02_WO_breakfast2)
S2-Folates/folic acid (B_02_WO_breakfast2)
K-L-carnitine (B_02_WO_supper)
Bread P3 (B_04_Product_consumption)
Total fruits and vegetables P2 (B_04_Product_consumption)
Vegetables, market product P3 (B_04_Product_consumption)
Fruits, market product P3 (B_04_Product_consumption)
Cold meat, sausage and prepared products based on boneless meat P2 (B_04_Product_consumption)
Margarine P2 (B_04_Product_consumption)
Drinks (excluding juices) P1 (B_04_Product_consumption)
Water P3 (B_04_Product_consumption)
8. Are there differences in the diet of children depending on their nutritional status (BMI z-score)?
Diet - as above (file BIOSTAT_03 - variable: <bmi to age z-score AKT>) 5 groups: obesity (BMI z-score>2) overweight (1< BMI z-score ≤ 2) normal nutritional status (-1 <BMI z-score ≤ 1) deficiency of body weight (-2≤ BMI z-score < -1) significant deficiency of body mass index
Files: Mikroskala pkt2.2;3;4;6;7;8;9;10.xlsx The methods used: Non-parametric Kruskal-Wallis tests and Chi-square independence test were used. Conclusions for the number of meals: Significant differences were identified in the following
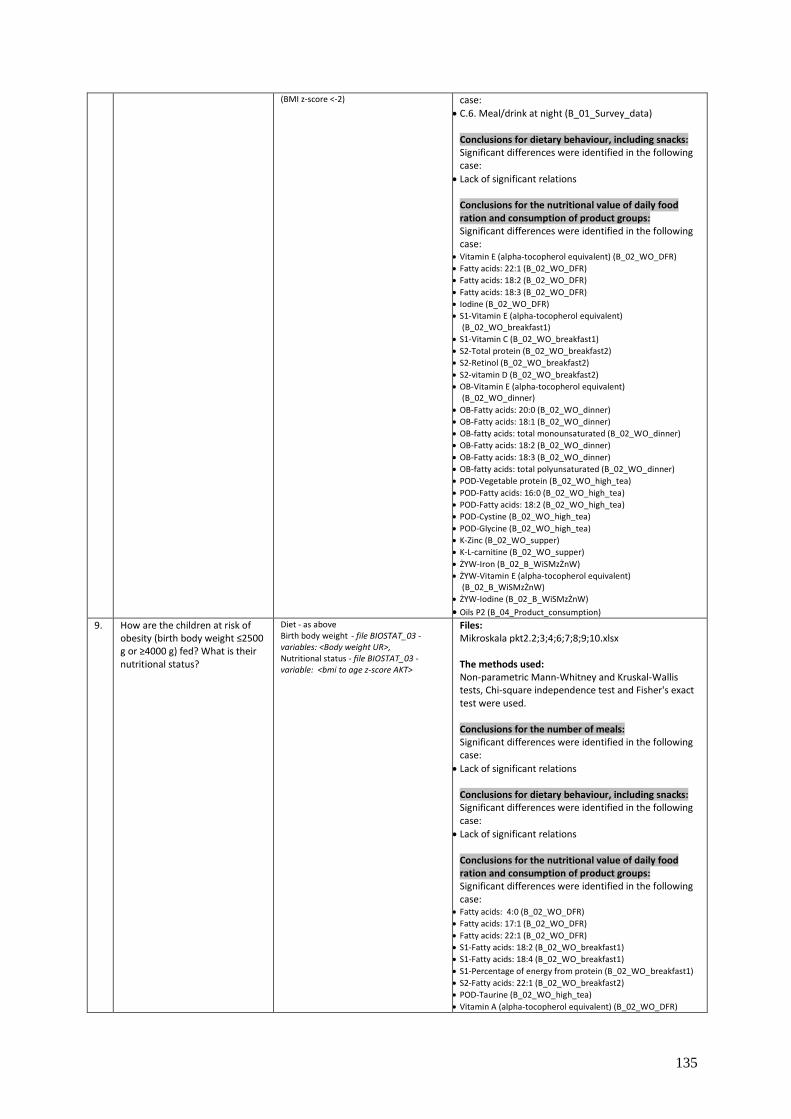
135
(BMI z-score <-2) case:
C.6. Meal/drink at night (B_01_Survey_data) Conclusions for dietary behaviour, including snacks: Significant differences were identified in the following case:
Lack of significant relations Conclusions for the nutritional value of daily food ration and consumption of product groups: Significant differences were identified in the following case:
Vitamin E (alpha-tocopherol equivalent) (B_02_WO_DFR)
Fatty acids: 22:1 (B_02_WO_DFR)
Fatty acids: 18:2 (B_02_WO_DFR)
Fatty acids: 18:3 (B_02_WO_DFR)
Iodine (B_02_WO_DFR)
S1-Vitamin E (alpha-tocopherol equivalent) (B_02_WO_breakfast1)
S1-Vitamin C (B_02_WO_breakfast1)
S2-Total protein (B_02_WO_breakfast2)
S2-Retinol (B_02_WO_breakfast2)
S2-vitamin D (B_02_WO_breakfast2)
OB-Vitamin E (alpha-tocopherol equivalent) (B_02_WO_dinner)
OB-Fatty acids: 20:0 (B_02_WO_dinner)
OB-Fatty acids: 18:1 (B_02_WO_dinner)
OB-fatty acids: total monounsaturated (B_02_WO_dinner)
OB-Fatty acids: 18:2 (B_02_WO_dinner)
OB-Fatty acids: 18:3 (B_02_WO_dinner)
OB-fatty acids: total polyunsaturated (B_02_WO_dinner)
POD-Vegetable protein (B_02_WO_high_tea)
POD-Fatty acids: 16:0 (B_02_WO_high_tea)
POD-Fatty acids: 18:2 (B_02_WO_high_tea)
POD-Cystine (B_02_WO_high_tea)
POD-Glycine (B_02_WO_high_tea)
K-Zinc (B_02_WO_supper)
K-L-carnitine (B_02_WO_supper)
ŻYW-Iron (B_02_B_WiSMzŻnW)
ŻYW-Vitamin E (alpha-tocopherol equivalent) (B_02_B_WiSMzŻnW)
ŻYW-Iodine (B_02_B_WiSMzŻnW)
Oils P2 (B_04_Product_consumption)
9. How are the children at risk of obesity (birth body weight ≤2500 g or ≥4000 g) fed? What is their nutritional status?
Diet - as above Birth body weight - file BIOSTAT_03 - variables: <Body weight UR>, Nutritional status - file BIOSTAT_03 - variable: <bmi to age z-score AKT>
Files: Mikroskala pkt2.2;3;4;6;7;8;9;10.xlsx The methods used: Non-parametric Mann-Whitney and Kruskal-Wallis tests, Chi-square independence test and Fisher's exact test were used. Conclusions for the number of meals: Significant differences were identified in the following case:
Lack of significant relations Conclusions for dietary behaviour, including snacks: Significant differences were identified in the following case:
Lack of significant relations Conclusions for the nutritional value of daily food ration and consumption of product groups: Significant differences were identified in the following case:
Fatty acids: 4:0 (B_02_WO_DFR)
Fatty acids: 17:1 (B_02_WO_DFR)
Fatty acids: 22:1 (B_02_WO_DFR)
S1-Fatty acids: 18:2 (B_02_WO_breakfast1)
S1-Fatty acids: 18:4 (B_02_WO_breakfast1)
S1-Percentage of energy from protein (B_02_WO_breakfast1)
S2-Fatty acids: 22:1 (B_02_WO_breakfast2)
POD-Taurine (B_02_WO_high_tea)
Vitamin A (alpha-tocopherol equivalent) (B_02_WO_DFR)
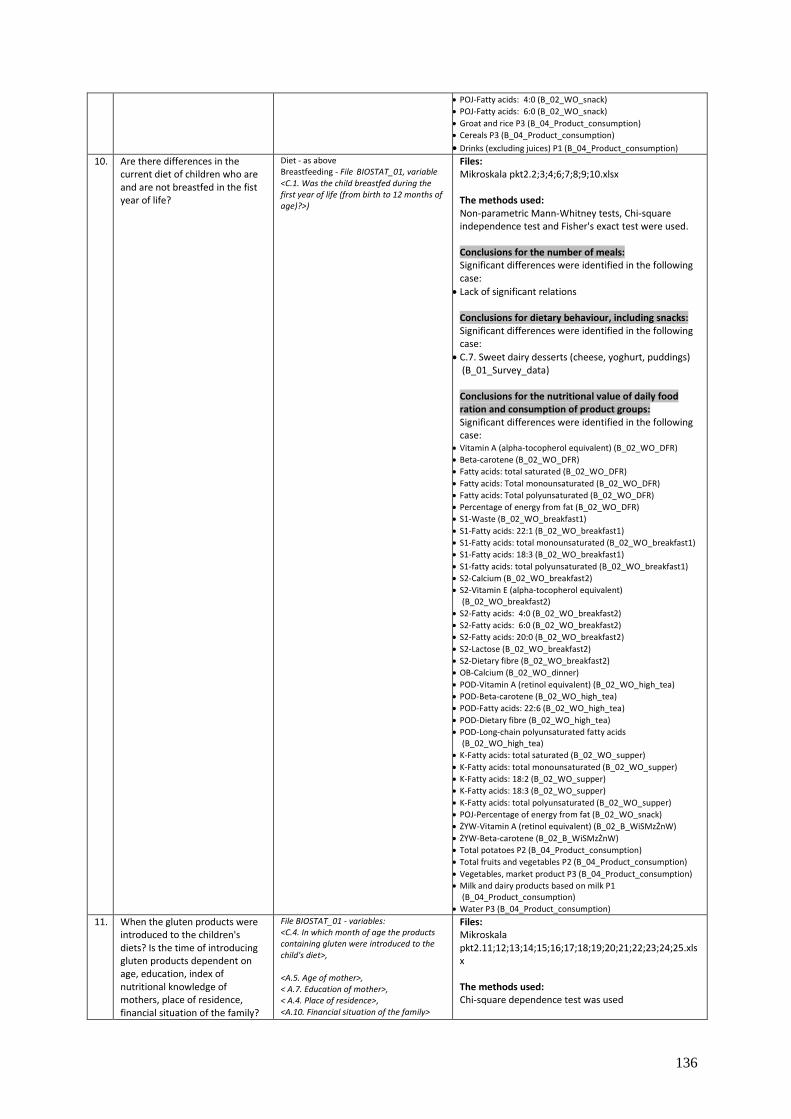
136
POJ-Fatty acids: 4:0 (B_02_WO_snack)
POJ-Fatty acids: 6:0 (B_02_WO_snack)
Groat and rice P3 (B_04_Product_consumption)
Cereals P3 (B_04_Product_consumption)
Drinks (excluding juices) P1 (B_04_Product_consumption)
10. Are there differences in the current diet of children who are and are not breastfed in the fist year of life?
Diet - as above Breastfeeding - File BIOSTAT_01, variable <C.1. Was the child breastfed during the first year of life (from birth to 12 months of age)?>)
Files: Mikroskala pkt2.2;3;4;6;7;8;9;10.xlsx The methods used: Non-parametric Mann-Whitney tests, Chi-square independence test and Fisher's exact test were used. Conclusions for the number of meals: Significant differences were identified in the following case:
Lack of significant relations Conclusions for dietary behaviour, including snacks: Significant differences were identified in the following case:
C.7. Sweet dairy desserts (cheese, yoghurt, puddings) (B_01_Survey_data) Conclusions for the nutritional value of daily food ration and consumption of product groups: Significant differences were identified in the following case:
Vitamin A (alpha-tocopherol equivalent) (B_02_WO_DFR)
Beta-carotene (B_02_WO_DFR)
Fatty acids: total saturated (B_02_WO_DFR)
Fatty acids: Total monounsaturated (B_02_WO_DFR)
Fatty acids: Total polyunsaturated (B_02_WO_DFR)
Percentage of energy from fat (B_02_WO_DFR)
S1-Waste (B_02_WO_breakfast1)
S1-Fatty acids: 22:1 (B_02_WO_breakfast1)
S1-Fatty acids: total monounsaturated (B_02_WO_breakfast1)
S1-Fatty acids: 18:3 (B_02_WO_breakfast1)
S1-fatty acids: total polyunsaturated (B_02_WO_breakfast1)
S2-Calcium (B_02_WO_breakfast2)
S2-Vitamin E (alpha-tocopherol equivalent) (B_02_WO_breakfast2)
S2-Fatty acids: 4:0 (B_02_WO_breakfast2)
S2-Fatty acids: 6:0 (B_02_WO_breakfast2)
S2-Fatty acids: 20:0 (B_02_WO_breakfast2)
S2-Lactose (B_02_WO_breakfast2)
S2-Dietary fibre (B_02_WO_breakfast2)
OB-Calcium (B_02_WO_dinner)
POD-Vitamin A (retinol equivalent) (B_02_WO_high_tea)
POD-Beta-carotene (B_02_WO_high_tea)
POD-Fatty acids: 22:6 (B_02_WO_high_tea)
POD-Dietary fibre (B_02_WO_high_tea)
POD-Long-chain polyunsaturated fatty acids (B_02_WO_high_tea)
K-Fatty acids: total saturated (B_02_WO_supper)
K-Fatty acids: total monounsaturated (B_02_WO_supper)
K-Fatty acids: 18:2 (B_02_WO_supper)
K-Fatty acids: 18:3 (B_02_WO_supper)
K-Fatty acids: total polyunsaturated (B_02_WO_supper)
POJ-Percentage of energy from fat (B_02_WO_snack)
ŻYW-Vitamin A (retinol equivalent) (B_02_B_WiSMzŻnW)
ŻYW-Beta-carotene (B_02_B_WiSMzŻnW)
Total potatoes P2 (B_04_Product_consumption)
Total fruits and vegetables P2 (B_04_Product_consumption)
Vegetables, market product P3 (B_04_Product_consumption)
Milk and dairy products based on milk P1 (B_04_Product_consumption)
Water P3 (B_04_Product_consumption)
11. When the gluten products were introduced to the children's diets? Is the time of introducing gluten products dependent on age, education, index of nutritional knowledge of mothers, place of residence, financial situation of the family?
File BIOSTAT_01 - variables: <C.4. In which month of age the products containing gluten were introduced to the child's diet>, <A.5. Age of mother>, < A.7. Education of mother>, < A.4. Place of residence>, <A.10. Financial situation of the family>
Files: Mikroskala pkt2.11;12;13;14;15;16;17;18;19;20;21;22;23;24;25.xlsx The methods used: Chi-square dependence test was used
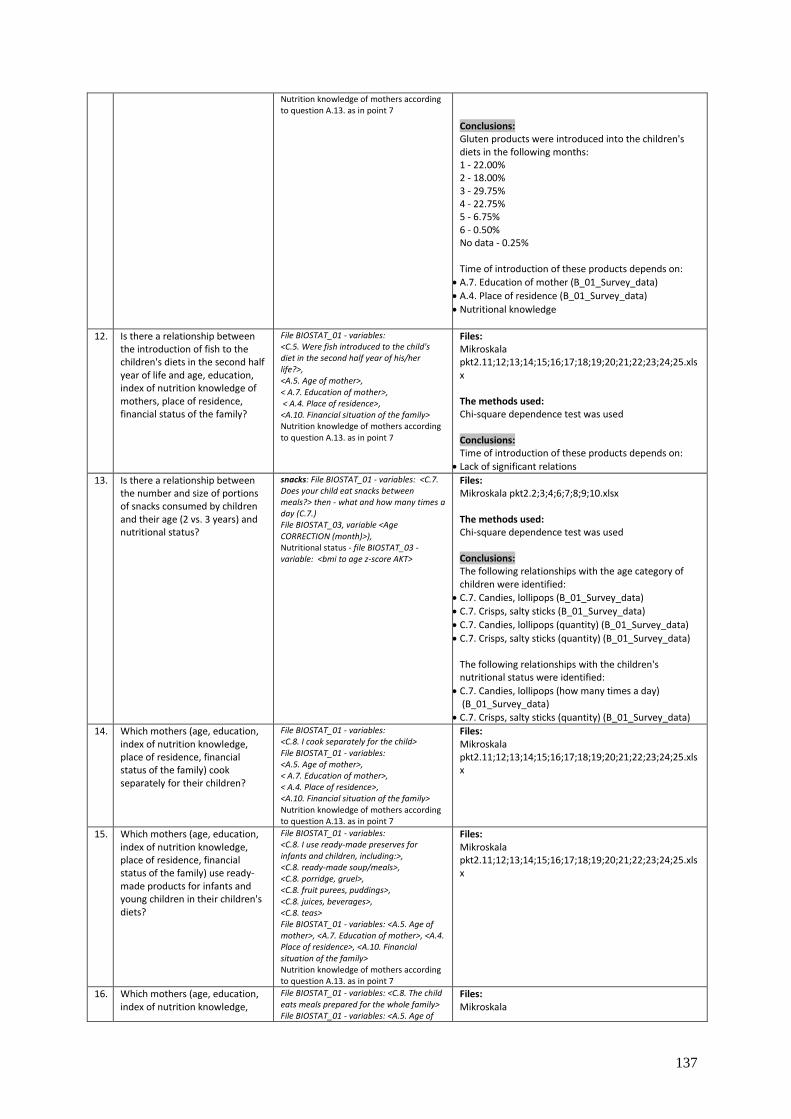
137
Nutrition knowledge of mothers according to question A.13. as in point 7
Conclusions: Gluten products were introduced into the children's diets in the following months: 1 - 22.00% 2 - 18.00% 3 - 29.75% 4 - 22.75% 5 - 6.75% 6 - 0.50% No data - 0.25% Time of introduction of these products depends on:
A.7. Education of mother (B_01_Survey_data)
A.4. Place of residence (B_01_Survey_data)
Nutritional knowledge
12. Is there a relationship between the introduction of fish to the children's diets in the second half year of life and age, education, index of nutrition knowledge of mothers, place of residence, financial status of the family?
File BIOSTAT_01 - variables: <C.5. Were fish introduced to the child's diet in the second half year of his/her life?>, <A.5. Age of mother>, < A.7. Education of mother>, < A.4. Place of residence>, <A.10. Financial situation of the family> Nutrition knowledge of mothers according to question A.13. as in point 7
Files: Mikroskala pkt2.11;12;13;14;15;16;17;18;19;20;21;22;23;24;25.xlsx The methods used: Chi-square dependence test was used Conclusions: Time of introduction of these products depends on:
Lack of significant relations
13. Is there a relationship between the number and size of portions of snacks consumed by children and their age (2 vs. 3 years) and nutritional status?
snacks: File BIOSTAT_01 - variables: <C.7. Does your child eat snacks between meals?> then - what and how many times a day (C.7.) File BIOSTAT_03, variable <Age CORRECTION (month)>), Nutritional status - file BIOSTAT_03 - variable: <bmi to age z-score AKT>
Files: Mikroskala pkt2.2;3;4;6;7;8;9;10.xlsx The methods used: Chi-square dependence test was used Conclusions: The following relationships with the age category of children were identified:
C.7. Candies, lollipops (B_01_Survey_data)
C.7. Crisps, salty sticks (B_01_Survey_data)
C.7. Candies, lollipops (quantity) (B_01_Survey_data)
C.7. Crisps, salty sticks (quantity) (B_01_Survey_data) The following relationships with the children's nutritional status were identified:
C.7. Candies, lollipops (how many times a day) (B_01_Survey_data)
C.7. Crisps, salty sticks (quantity) (B_01_Survey_data)
14. Which mothers (age, education, index of nutrition knowledge, place of residence, financial status of the family) cook separately for their children?
File BIOSTAT_01 - variables: <C.8. I cook separately for the child> File BIOSTAT_01 - variables: <A.5. Age of mother>, < A.7. Education of mother>, < A.4. Place of residence>, <A.10. Financial situation of the family> Nutrition knowledge of mothers according to question A.13. as in point 7
Files: Mikroskala pkt2.11;12;13;14;15;16;17;18;19;20;21;22;23;24;25.xlsx
15. Which mothers (age, education, index of nutrition knowledge, place of residence, financial status of the family) use ready-made products for infants and young children in their children's diets?
File BIOSTAT_01 - variables: <C.8. I use ready-made preserves for infants and children, including:>, <C.8. ready-made soup/meals>, <C.8. porridge, gruel>, <C.8. fruit purees, puddings>, <C.8. juices, beverages>, <C.8. teas> File BIOSTAT_01 - variables: <A.5. Age of mother>, <A.7. Education of mother>, <A.4. Place of residence>, <A.10. Financial situation of the family> Nutrition knowledge of mothers according to question A.13. as in point 7
Files: Mikroskala pkt2.11;12;13;14;15;16;17;18;19;20;21;22;23;24;25.xlsx
16. Which mothers (age, education, index of nutrition knowledge,
File BIOSTAT_01 - variables: <C.8. The child eats meals prepared for the whole family> File BIOSTAT_01 - variables: <A.5. Age of
Files: Mikroskala
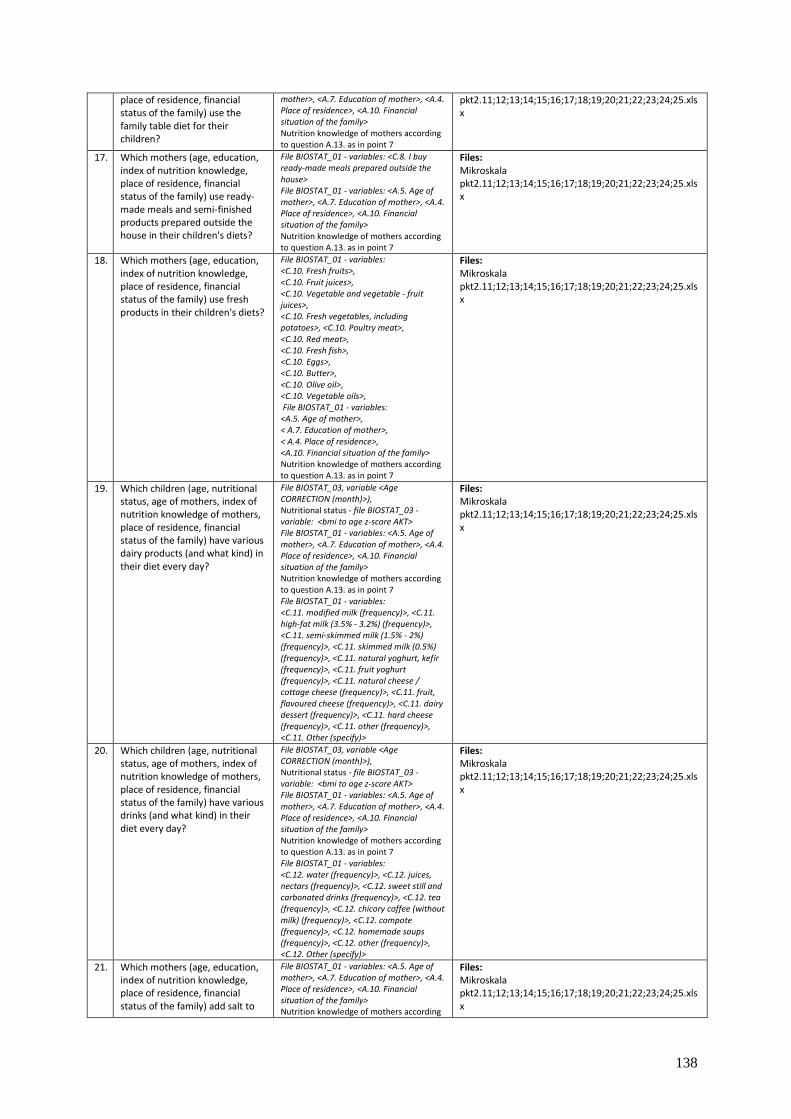
138
place of residence, financial status of the family) use the family table diet for their children?
mother>, <A.7. Education of mother>, <A.4. Place of residence>, <A.10. Financial situation of the family> Nutrition knowledge of mothers according to question A.13. as in point 7
pkt2.11;12;13;14;15;16;17;18;19;20;21;22;23;24;25.xlsx
17. Which mothers (age, education, index of nutrition knowledge, place of residence, financial status of the family) use ready-made meals and semi-finished products prepared outside the house in their children's diets?
File BIOSTAT_01 - variables: <C.8. I buy ready-made meals prepared outside the house> File BIOSTAT_01 - variables: <A.5. Age of mother>, <A.7. Education of mother>, <A.4. Place of residence>, <A.10. Financial situation of the family> Nutrition knowledge of mothers according to question A.13. as in point 7
Files: Mikroskala pkt2.11;12;13;14;15;16;17;18;19;20;21;22;23;24;25.xlsx
18. Which mothers (age, education, index of nutrition knowledge, place of residence, financial status of the family) use fresh products in their children's diets?
File BIOSTAT_01 - variables: <C.10. Fresh fruits>, <C.10. Fruit juices>, <C.10. Vegetable and vegetable - fruit juices>, <C.10. Fresh vegetables, including potatoes>, <C.10. Poultry meat>, <C.10. Red meat>, <C.10. Fresh fish>, <C.10. Eggs>, <C.10. Butter>, <C.10. Olive oil>, <C.10. Vegetable oils>, File BIOSTAT_01 - variables: <A.5. Age of mother>, < A.7. Education of mother>, < A.4. Place of residence>, <A.10. Financial situation of the family> Nutrition knowledge of mothers according to question A.13. as in point 7
Files: Mikroskala pkt2.11;12;13;14;15;16;17;18;19;20;21;22;23;24;25.xlsx
19. Which children (age, nutritional status, age of mothers, index of nutrition knowledge of mothers, place of residence, financial status of the family) have various dairy products (and what kind) in their diet every day?
File BIOSTAT_03, variable <Age CORRECTION (month)>), Nutritional status - file BIOSTAT_03 - variable: <bmi to age z-score AKT> File BIOSTAT_01 - variables: <A.5. Age of mother>, <A.7. Education of mother>, <A.4. Place of residence>, <A.10. Financial situation of the family> Nutrition knowledge of mothers according to question A.13. as in point 7 File BIOSTAT_01 - variables: <C.11. modified milk (frequency)>, <C.11. high-fat milk (3.5% - 3.2%) (frequency)>, <C.11. semi-skimmed milk (1.5% - 2%) (frequency)>, <C.11. skimmed milk (0.5%) (frequency)>, <C.11. natural yoghurt, kefir (frequency)>, <C.11. fruit yoghurt (frequency)>, <C.11. natural cheese / cottage cheese (frequency)>, <C.11. fruit, flavoured cheese (frequency)>, <C.11. dairy dessert (frequency)>, <C.11. hard cheese (frequency)>, <C.11. other (frequency)>, <C.11. Other (specify)>
Files: Mikroskala pkt2.11;12;13;14;15;16;17;18;19;20;21;22;23;24;25.xlsx
20. Which children (age, nutritional status, age of mothers, index of nutrition knowledge of mothers, place of residence, financial status of the family) have various drinks (and what kind) in their diet every day?
File BIOSTAT_03, variable <Age CORRECTION (month)>), Nutritional status - file BIOSTAT_03 - variable: <bmi to age z-score AKT> File BIOSTAT_01 - variables: <A.5. Age of mother>, <A.7. Education of mother>, <A.4. Place of residence>, <A.10. Financial situation of the family> Nutrition knowledge of mothers according to question A.13. as in point 7 File BIOSTAT_01 - variables: <C.12. water (frequency)>, <C.12. juices, nectars (frequency)>, <C.12. sweet still and carbonated drinks (frequency)>, <C.12. tea (frequency)>, <C.12. chicory coffee (without milk) (frequency)>, <C.12. compote (frequency)>, <C.12. homemade soups (frequency)>, <C.12. other (frequency)>, <C.12. Other (specify)>
Files: Mikroskala pkt2.11;12;13;14;15;16;17;18;19;20;21;22;23;24;25.xlsx
21. Which mothers (age, education, index of nutrition knowledge, place of residence, financial status of the family) add salt to
File BIOSTAT_01 - variables: <A.5. Age of mother>, <A.7. Education of mother>, <A.4. Place of residence>, <A.10. Financial situation of the family> Nutrition knowledge of mothers according
Files: Mikroskala pkt2.11;12;13;14;15;16;17;18;19;20;21;22;23;24;25.xlsx

139
food for children? to question A.13. as in point 7 File BIOSTAT_01, variable <C.13. Do you add salt to meals of your child?>
22. Is there a relationship between dietary behaviours of children and their nutritional status?
File BIOSTAT_01 - nutritional behavior - variables: <C.14. Eats>, <C.14. Meat dishes>, <C.14. Vegetables>, <C.14. Learns new flavours>; Nutritional status - file BIOSTAT_03 - variable: <bmi to age z-score AKT> 5 groups: obesity (BMI z-score>2) overweight (1< BMI z-score ≤ 2) normal nutritional status (-1 <BMI z-score ≤ 1) deficiency of body weight (-2≤ BMI z-score < -1) significant deficiency of body mass index (BMI z-score <-2)
Files: Mikroskala pkt2.11;12;13;14;15;16;17;18;19;20;21;22;23;24;25.xlsx The methods used: Chi-square dependence test was used Conclusions:
Lack of significant relation
23. Is there a relationship between attitudes of mothers and the children's diets?
File BIOSTAT_01: Attitudes of mothers - variable <C.16. How do you usually behave when your child refuses to eat new meals? Method of feeding the child - variables: <C.15. Please indicate how your child is usually fed>, <C.15. other (how?)>
Files: Mikroskala pkt2.11;12;13;14;15;16;17;18;19;20;21;22;23;24;25.xlsx The methods used: Chi-square dependence test was used Conclusions:
A significant relation between the method of feeding and attitudes of mothers was identified
24. Which mothers (age, education, index of nutrition knowledge, place of residence, financial status of the family) introduced dietary supplements to the children's diets?
File BIOSTAT_01 - variables: <A.5. Age of mother>, <A.7. Education of mother>, <A.4. Place of residence>, <A.10. Financial situation of the family> Nutrition knowledge of mothers according to question A.13. as in point 7 Supplements - File BIOSAT_01, variables: <C.17. Age of 0-6 months (Vitamin D)> <C.17. Age of 7-12 months (Vitamin D)> <C.17. Age of 13-18 months (Vitamin D)> <C.17. Age above 18 months (Vitamin D)> <C.17. Age of 0-6 months (Vitamin K)> <C.17. Age of 7-12 months (Vitamin K)> <C.17. Age of 13-18 months (Vitamin K)> <C.17. Age above 18 months (Vitamin K)> <C.17. Age of 0-6 months (Cod liver oil)> <C.17. Age of 7-12 months (Cod liver oil)> <C.17. Age of 13-18 months (Cod liver oil)> <C.17. Age over 18 months (Cod liver oil)> <C.17. Age of 0-6 months (Probiotics)> <C.17. Age of 7-12 months (Probiotics)> <C.17. Age of 13-18 months (Probiotics)> <C.17. Age over 18 months (Probiotics)> <C.17. Name - Preparation 1> <C.17. Age of 0-6 months (Preparation 1)> <C.17. Age of 7-12 months (Preparation 1)> <C.17. Age of 13-18 months (Preparation 1)> <C.17. Age over 18 months (Preparation 1)> <C.17. Name - Preparation 2> <C.17. Age of 0-6 months (Preparation 2)> <C.17. Age of 7-12 months (Preparation 2)> <C.17. Age of 13-18 months (Preparation 2)> <C.17. Age over 18 months (Preparation 2)> < C.18. Does the child currently take any vitamin and/or iron, vitamin and mineral or other preparations?> <C.18. If YES, what kind? <C.18. Who recommended it?>
Files: Mikroskala pkt2.11;12;13;14;15;16;17;18;19;20;21;22;23;24;25.xlsx
25. What is the nutritional status of children on special diets>
Nutritional status - file BIOSTAT_03 - variable: <bmi to age z-score AKT> 5 groups: obesity (BMI z-score>2) overweight (1< BMI z-score ≤ 2)
Files: Mikroskala pkt2.11;12;13;14;15;16;17;18;19;20;21;22;23;24;25.xlsx

140
normal nutritional status (-1 <BMI z-score ≤ 1) deficiency of body weight (-2≤ BMI z-score < -1) significant deficiency of body mass index (BMI z-score <-2) Special diets - File BIOSAT_01, variables: <C.19. Is the child on any special diet?> <C.19. without milk> <C.19. without milk (doctor's recommendation?)> <C.19. without eggs> <C.19. without eggs (doctor's recommendation?)> <C.19. without gluten> <C.19. without gluten (doctor's recommendation?)> <C.19. vegetarian> <C.19. vegetarian (doctor's recommendation?)> <C.19. other> <C.19. other (doctor's recommendation?)> <C.19. Other (specify)>
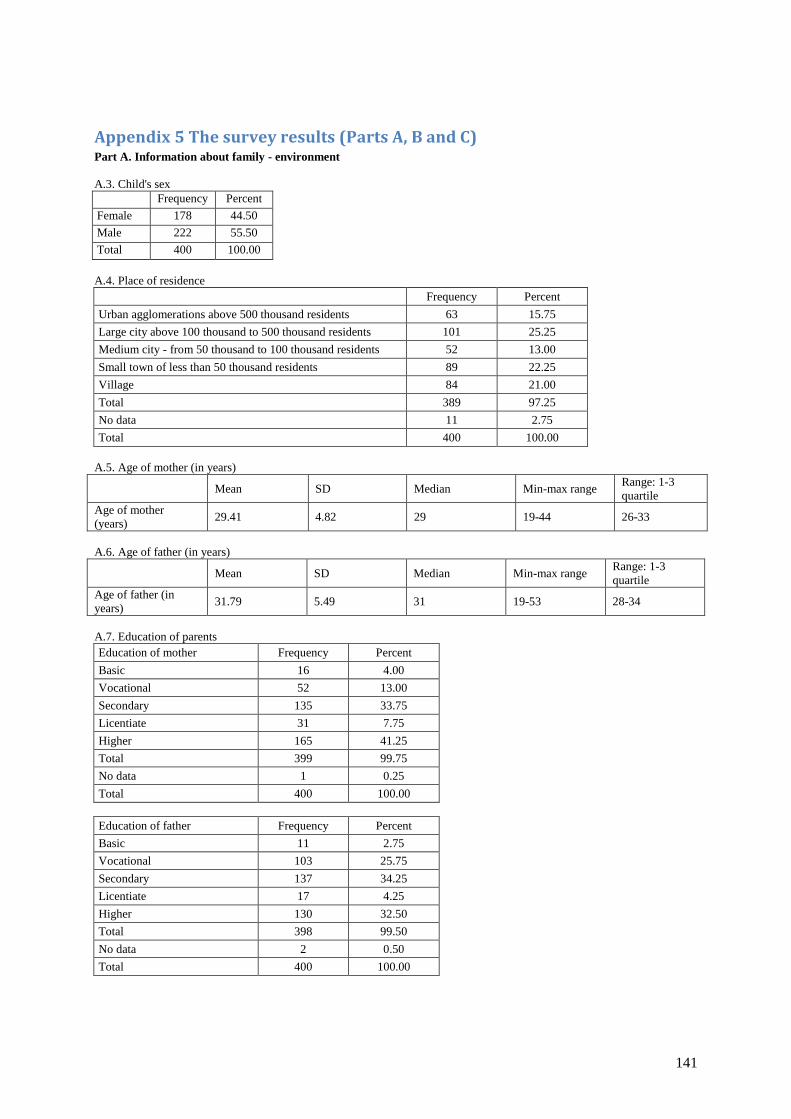
141
Appendix 5 The survey results (Parts A, B and C) Part A. Information about family - environment
A.3. Child's sex
Frequency Percent
Female 178 44.50
Male 222 55.50
Total 400 100.00
A.4. Place of residence
Frequency Percent
Urban agglomerations above 500 thousand residents 63 15.75
Large city above 100 thousand to 500 thousand residents 101 25.25
Medium city - from 50 thousand to 100 thousand residents 52 13.00
Small town of less than 50 thousand residents 89 22.25
Village 84 21.00
Total 389 97.25
No data 11 2.75
Total 400 100.00
A.5. Age of mother (in years)
Mean SD Median Min-max range Range: 1-3
quartile
Age of mother
(years) 29.41 4.82 29 19-44 26-33
A.6. Age of father (in years)
Mean SD Median Min-max range Range: 1-3
quartile
Age of father (in
years) 31.79 5.49 31 19-53 28-34
A.7. Education of parents
Education of mother Frequency Percent
Basic 16 4.00
Vocational 52 13.00
Secondary 135 33.75
Licentiate 31 7.75
Higher 165 41.25
Total 399 99.75
No data 1 0.25
Total 400 100.00
Education of father Frequency Percent
Basic 11 2.75
Vocational 103 25.75
Secondary 137 34.25
Licentiate 17 4.25
Higher 130 32.50
Total 398 99.50
No data 2 0.50
Total 400 100.00

142
A.8. Number of persons in the household
Frequency Percent
1 1 0.25
2 10 2.50
3 187 46.75
4 138 34.50
5 39 9.75
6 16 4.00
7 5 1.25
Total 396 99.00
No data 4 1.00
Total 400 100.00
Mean SD Median Min-max range Range: 1-3
quartile
Number of
persons in the
household
3.68 0.93 3.5 1-7 3-4
including number of children (to 18 years of age)
Frequency Percent
1 212 53.00
2 149 37.25
3 28 7.00
4 3 0.75
5 1 0.25
Total 393 98.25
No data 7 1.75
Total 400 100.00
Mean SD Median Min-max range Range: 1-3
quartile
Number of
children to 18
years of age in
the household
1.55 0.68 1 1-5 1-2
A.9. Who works in the family? Please select all the correct answers.
BOTH PARENTS
Frequency Percent
YES 214 53.50
NO 185 46.25
Total 399 99.75
No data 1 0.25
Total 400 100.00
FATHER ONLY
Frequency Percent
YES 170 42.50
NO 229 57.25
Total 399 99.75
No data 1 0.25
Total 400 100.00
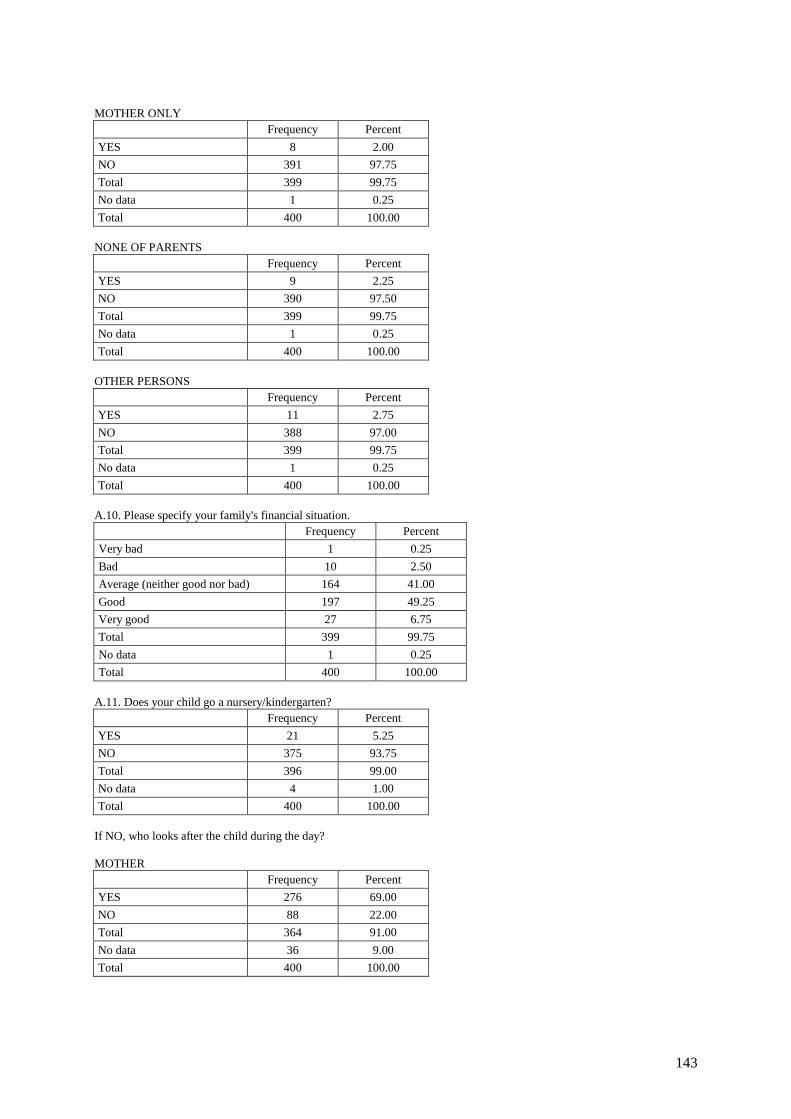
143
MOTHER ONLY
Frequency Percent
YES 8 2.00
NO 391 97.75
Total 399 99.75
No data 1 0.25
Total 400 100.00
NONE OF PARENTS
Frequency Percent
YES 9 2.25
NO 390 97.50
Total 399 99.75
No data 1 0.25
Total 400 100.00
OTHER PERSONS
Frequency Percent
YES 11 2.75
NO 388 97.00
Total 399 99.75
No data 1 0.25
Total 400 100.00
A.10. Please specify your family's financial situation.
Frequency Percent
Very bad 1 0.25
Bad 10 2.50
Average (neither good nor bad) 164 41.00
Good 197 49.25
Very good 27 6.75
Total 399 99.75
No data 1 0.25
Total 400 100.00
A.11. Does your child go a nursery/kindergarten?
Frequency Percent
YES 21 5.25
NO 375 93.75
Total 396 99.00
No data 4 1.00
Total 400 100.00
If NO, who looks after the child during the day?
MOTHER
Frequency Percent
YES 276 69.00
NO 88 22.00
Total 364 91.00
No data 36 9.00
Total 400 100.00
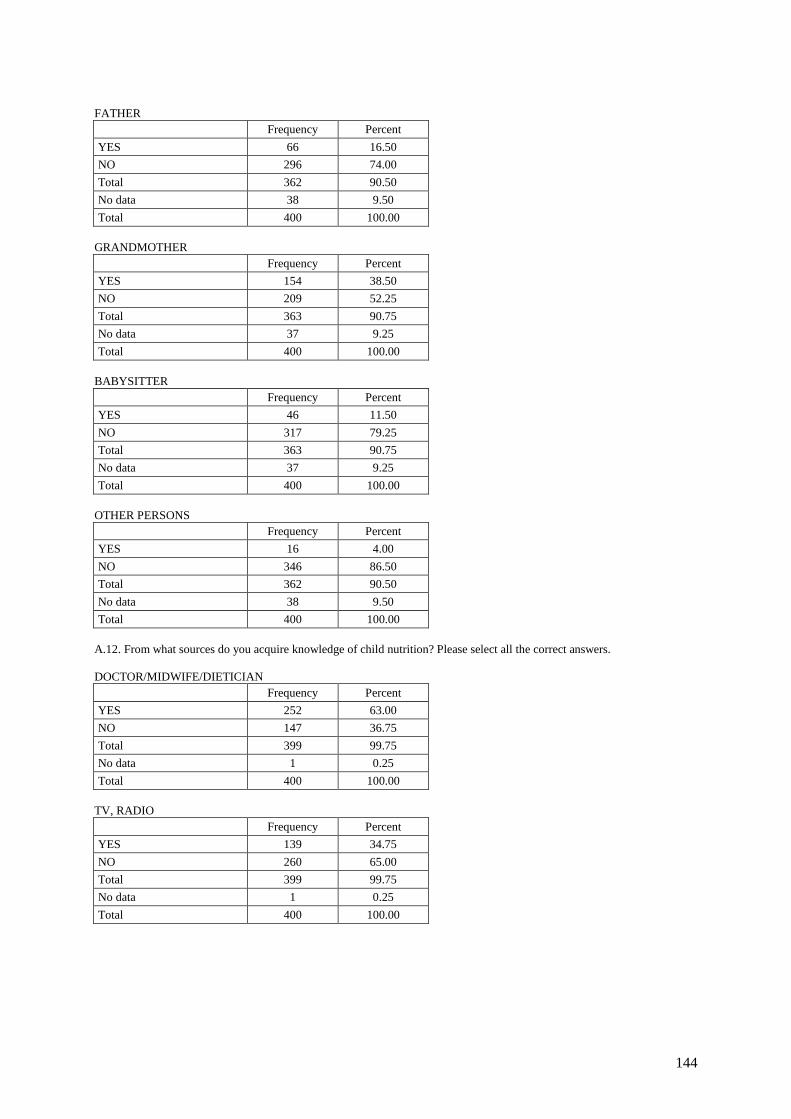
144
FATHER
Frequency Percent
YES 66 16.50
NO 296 74.00
Total 362 90.50
No data 38 9.50
Total 400 100.00
GRANDMOTHER
Frequency Percent
YES 154 38.50
NO 209 52.25
Total 363 90.75
No data 37 9.25
Total 400 100.00
BABYSITTER
Frequency Percent
YES 46 11.50
NO 317 79.25
Total 363 90.75
No data 37 9.25
Total 400 100.00
OTHER PERSONS
Frequency Percent
YES 16 4.00
NO 346 86.50
Total 362 90.50
No data 38 9.50
Total 400 100.00
A.12. From what sources do you acquire knowledge of child nutrition? Please select all the correct answers.
DOCTOR/MIDWIFE/DIETICIAN
Frequency Percent
YES 252 63.00
NO 147 36.75
Total 399 99.75
No data 1 0.25
Total 400 100.00
TV, RADIO
Frequency Percent
YES 139 34.75
NO 260 65.00
Total 399 99.75
No data 1 0.25
Total 400 100.00
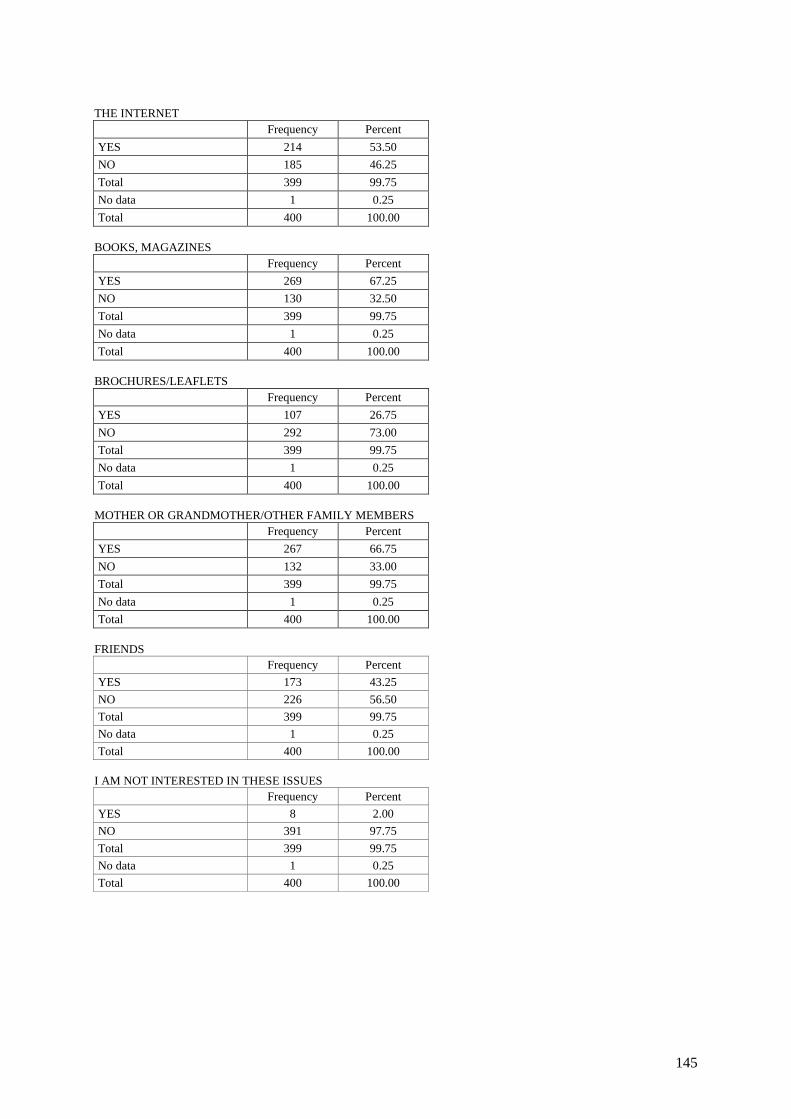
145
THE INTERNET
Frequency Percent
YES 214 53.50
NO 185 46.25
Total 399 99.75
No data 1 0.25
Total 400 100.00
BOOKS, MAGAZINES
Frequency Percent
YES 269 67.25
NO 130 32.50
Total 399 99.75
No data 1 0.25
Total 400 100.00
BROCHURES/LEAFLETS
Frequency Percent
YES 107 26.75
NO 292 73.00
Total 399 99.75
No data 1 0.25
Total 400 100.00
MOTHER OR GRANDMOTHER/OTHER FAMILY MEMBERS
Frequency Percent
YES 267 66.75
NO 132 33.00
Total 399 99.75
No data 1 0.25
Total 400 100.00
FRIENDS
Frequency Percent
YES 173 43.25
NO 226 56.50
Total 399 99.75
No data 1 0.25
Total 400 100.00
I AM NOT INTERESTED IN THESE ISSUES
Frequency Percent
YES 8 2.00
NO 391 97.75
Total 399 99.75
No data 1 0.25
Total 400 100.00

146
A.13. There are some statements about child nutrition below. Please indicate whether you agree with them or not. Please
select only one answer in each row.
CHILD AGED 13-36 MONTHS SHOULD:
EAT NO MORE THAN 5 MEALS A DAY
Frequency Percent
YES / Correct 276 69.00
NO / Incorrect 121 30.25
Total 397 99.25
No data 3 0.75
Total 400 100.00
DRINK AT LEAST 1 LITRE OF LIQUIDS A DAY (INCLUDING WATER, JUICE, MILK AND SOUPS)
Frequency Percent
YES / Correct 374 93.50
NO / Incorrect 25 6.25
Total 399 99.75
No data 1 0.25
Total 400 100.00
DRINK NO LESS THAN ½ LITRE OF MILK A DAY
Frequency Percent
YES / Correct 235 58.75
NO / Incorrect 163 40.75
Total 398 99.50
No data 2 0.50
Total 400 100.00
DRINK AT LEAST 3 GLASSES OF JUICE EVERY DAY
Frequency Percent
YES / Incorrect 108 27.00
NO / Correct 289 72.25
Total 397 99.25
No data 3 0.75
Total 400 100.00
HAVE FRUIT AND VEGETABLES IN EACH MEAL
Frequency Percent
YES / Correct 281 70.25
NO / Incorrect 117 29.25
Total 398 99.50
No data 2 0.50
Total 400 100.00
HAVE A SWEET SNACK EVERY DAY
Frequency Percent
YES / Incorrect 101 25.25
NO / Correct 296 74.00
Total 397 99.25
No data 3 0.75
Total 400 100.00
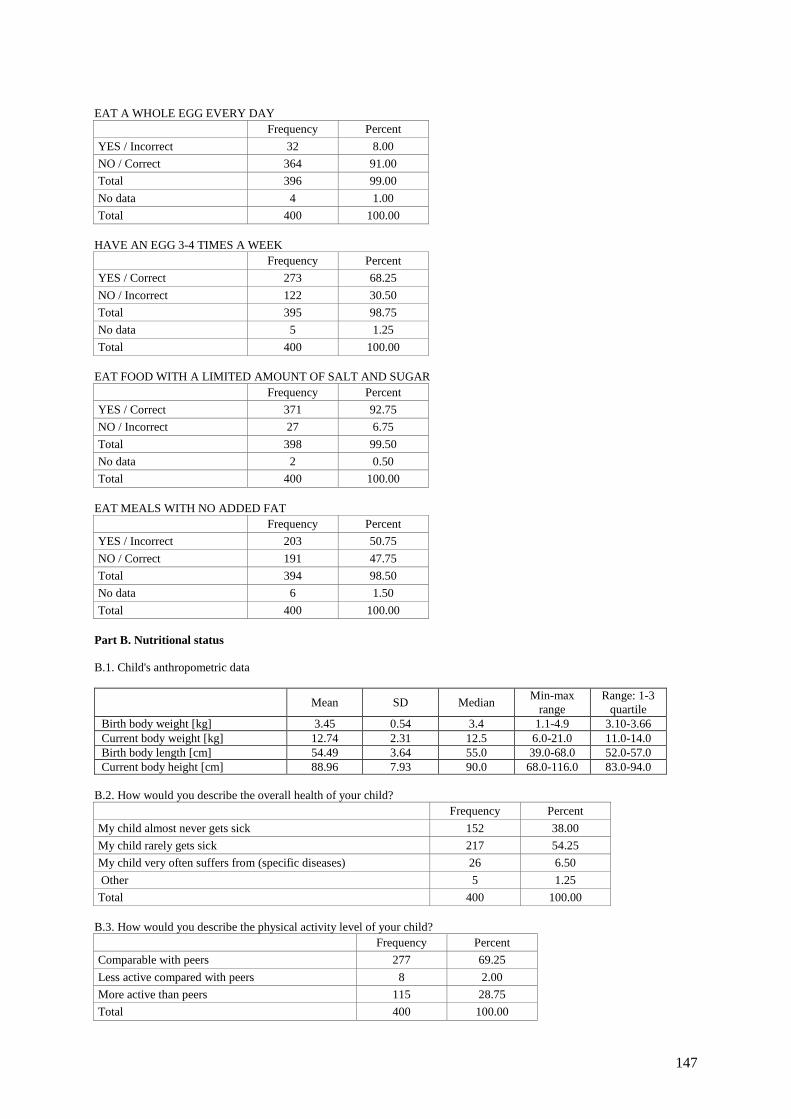
147
EAT A WHOLE EGG EVERY DAY
Frequency Percent
YES / Incorrect 32 8.00
NO / Correct 364 91.00
Total 396 99.00
No data 4 1.00
Total 400 100.00
HAVE AN EGG 3-4 TIMES A WEEK
Frequency Percent
YES / Correct 273 68.25
NO / Incorrect 122 30.50
Total 395 98.75
No data 5 1.25
Total 400 100.00
EAT FOOD WITH A LIMITED AMOUNT OF SALT AND SUGAR
Frequency Percent
YES / Correct 371 92.75
NO / Incorrect 27 6.75
Total 398 99.50
No data 2 0.50
Total 400 100.00
EAT MEALS WITH NO ADDED FAT
Frequency Percent
YES / Incorrect 203 50.75
NO / Correct 191 47.75
Total 394 98.50
No data 6 1.50
Total 400 100.00
Part B. Nutritional status
B.1. Child's anthropometric data
Mean SD Median Min-max
range
Range: 1-3
quartile
Birth body weight [kg] 3.45 0.54 3.4 1.1-4.9 3.10-3.66
Current body weight [kg] 12.74 2.31 12.5 6.0-21.0 11.0-14.0
Birth body length [cm] 54.49 3.64 55.0 39.0-68.0 52.0-57.0
Current body height [cm] 88.96 7.93 90.0 68.0-116.0 83.0-94.0
B.2. How would you describe the overall health of your child?
Frequency Percent
My child almost never gets sick 152 38.00
My child rarely gets sick 217 54.25
My child very often suffers from (specific diseases) 26 6.50
Other 5 1.25
Total 400 100.00
B.3. How would you describe the physical activity level of your child?
Frequency Percent
Comparable with peers 277 69.25
Less active compared with peers 8 2.00
More active than peers 115 28.75
Total 400 100.00
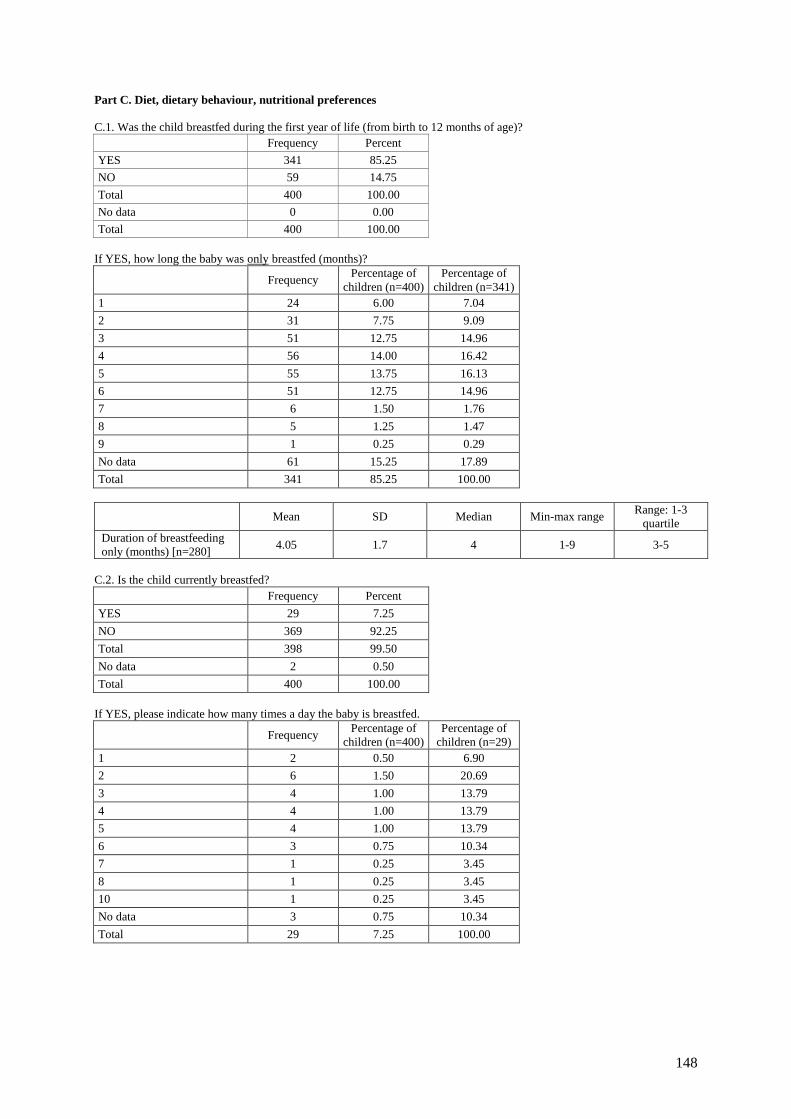
148
Part C. Diet, dietary behaviour, nutritional preferences
C.1. Was the child breastfed during the first year of life (from birth to 12 months of age)?
Frequency Percent
YES 341 85.25
NO 59 14.75
Total 400 100.00
No data 0 0.00
Total 400 100.00
If YES, how long the baby was only breastfed (months)?
Frequency Percentage of
children (n=400)
Percentage of
children (n=341)
1 24 6.00 7.04
2 31 7.75 9.09
3 51 12.75 14.96
4 56 14.00 16.42
5 55 13.75 16.13
6 51 12.75 14.96
7 6 1.50 1.76
8 5 1.25 1.47
9 1 0.25 0.29
No data 61 15.25 17.89
Total 341 85.25 100.00
Mean SD Median Min-max range Range: 1-3
quartile
Duration of breastfeeding
only (months) [n=280] 4.05 1.7 4 1-9 3-5
C.2. Is the child currently breastfed?
Frequency Percent
YES 29 7.25
NO 369 92.25
Total 398 99.50
No data 2 0.50
Total 400 100.00
If YES, please indicate how many times a day the baby is breastfed.
Frequency Percentage of
children (n=400)
Percentage of
children (n=29)
1 2 0.50 6.90
2 6 1.50 20.69
3 4 1.00 13.79
4 4 1.00 13.79
5 4 1.00 13.79
6 3 0.75 10.34
7 1 0.25 3.45
8 1 0.25 3.45
10 1 0.25 3.45
No data 3 0.75 10.34
Total 29 7.25 100.00
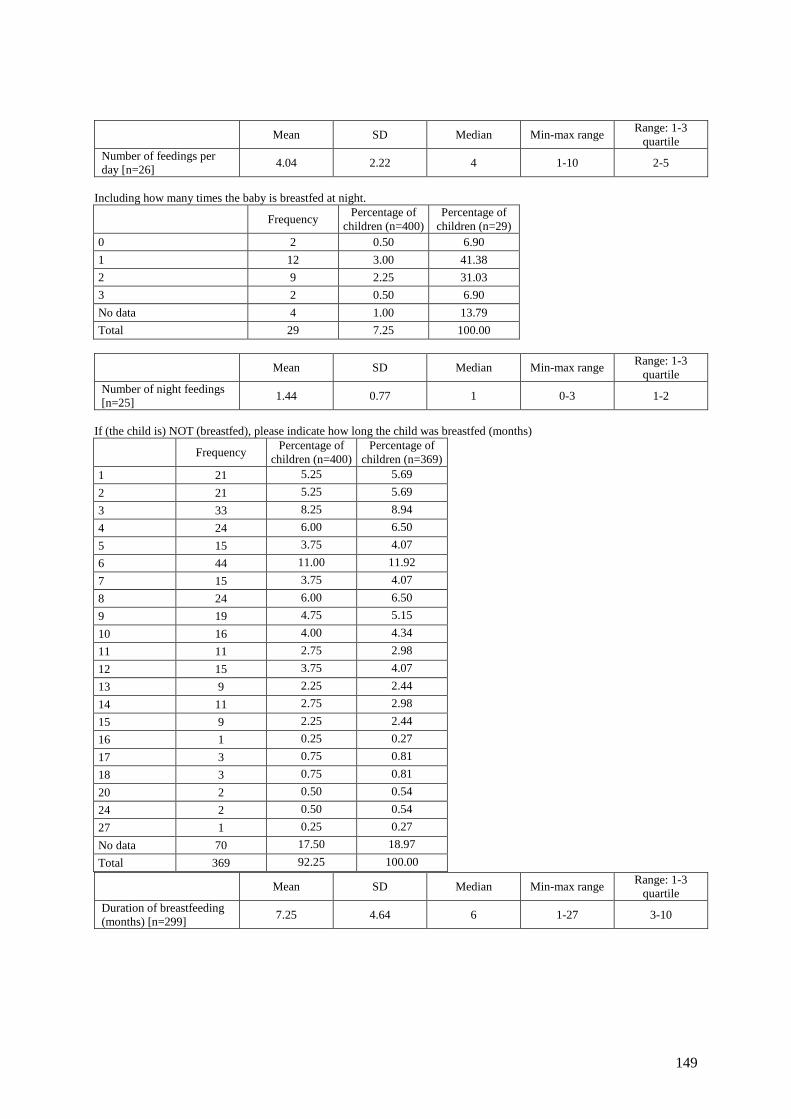
149
Mean SD Median Min-max range Range: 1-3
quartile
Number of feedings per
day [n=26] 4.04 2.22 4 1-10 2-5
Including how many times the baby is breastfed at night.
Frequency Percentage of
children (n=400)
Percentage of
children (n=29)
0 2 0.50 6.90
1 12 3.00 41.38
2 9 2.25 31.03
3 2 0.50 6.90
No data 4 1.00 13.79
Total 29 7.25 100.00
Mean SD Median Min-max range Range: 1-3
quartile
Number of night feedings
[n=25] 1.44 0.77 1 0-3 1-2
If (the child is) NOT (breastfed), please indicate how long the child was breastfed (months)
Mean SD Median Min-max range Range: 1-3
quartile
Duration of breastfeeding
(months) [n=299] 7.25 4.64 6 1-27 3-10
Frequency Percentage of
children (n=400)
Percentage of
children (n=369)
1 21 5.25 5.69
2 21 5.25 5.69
3 33 8.25 8.94
4 24 6.00 6.50
5 15 3.75 4.07
6 44 11.00 11.92
7 15 3.75 4.07
8 24 6.00 6.50
9 19 4.75 5.15
10 16 4.00 4.34
11 11 2.75 2.98
12 15 3.75 4.07
13 9 2.25 2.44
14 11 2.75 2.98
15 9 2.25 2.44
16 1 0.25 0.27
17 3 0.75 0.81
18 3 0.75 0.81
20 2 0.50 0.54
24 2 0.50 0.54
27 1 0.25 0.27
No data 70 17.50 18.97
Total 369 92.25 100.00
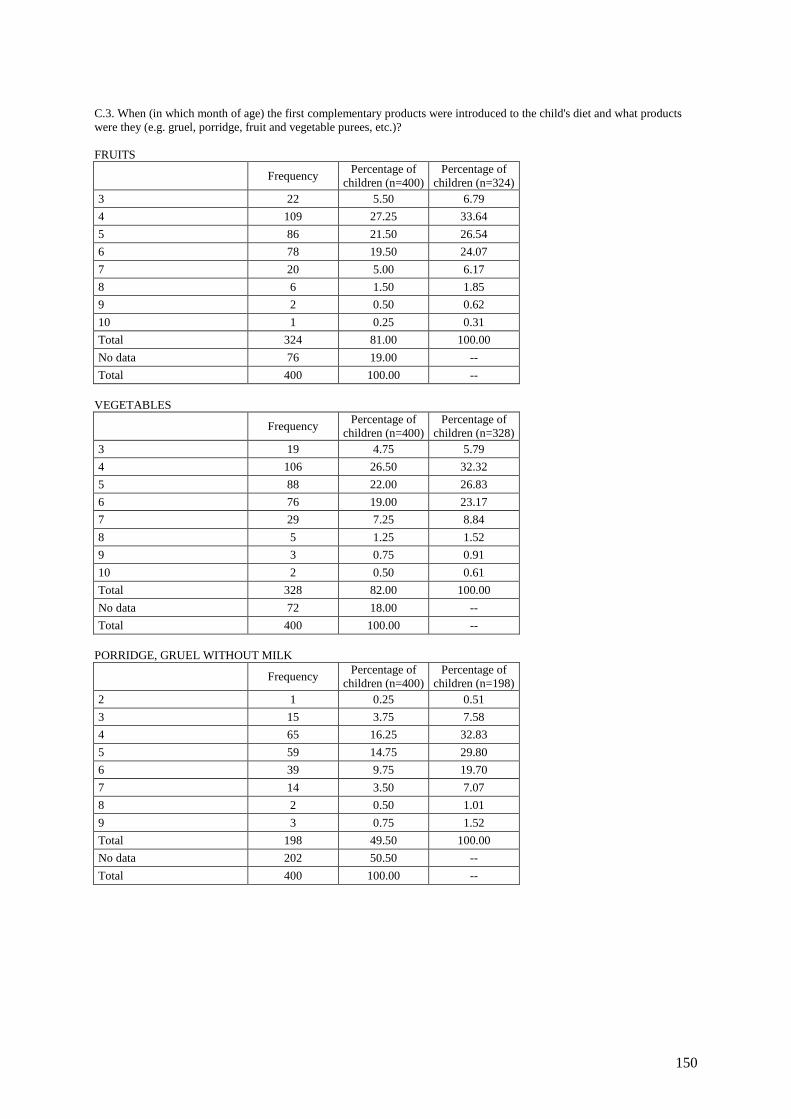
150
C.3. When (in which month of age) the first complementary products were introduced to the child's diet and what products
were they (e.g. gruel, porridge, fruit and vegetable purees, etc.)?
FRUITS
Frequency Percentage of
children (n=400)
Percentage of
children (n=324)
3 22 5.50 6.79
4 109 27.25 33.64
5 86 21.50 26.54
6 78 19.50 24.07
7 20 5.00 6.17
8 6 1.50 1.85
9 2 0.50 0.62
10 1 0.25 0.31
Total 324 81.00 100.00
No data 76 19.00 --
Total 400 100.00 --
VEGETABLES
Frequency Percentage of
children (n=400)
Percentage of
children (n=328)
3 19 4.75 5.79
4 106 26.50 32.32
5 88 22.00 26.83
6 76 19.00 23.17
7 29 7.25 8.84
8 5 1.25 1.52
9 3 0.75 0.91
10 2 0.50 0.61
Total 328 82.00 100.00
No data 72 18.00 --
Total 400 100.00 --
PORRIDGE, GRUEL WITHOUT MILK
Frequency Percentage of
children (n=400)
Percentage of
children (n=198)
2 1 0.25 0.51
3 15 3.75 7.58
4 65 16.25 32.83
5 59 14.75 29.80
6 39 9.75 19.70
7 14 3.50 7.07
8 2 0.50 1.01
9 3 0.75 1.52
Total 198 49.50 100.00
No data 202 50.50 --
Total 400 100.00 --

151
MILK, MILK PORRIDGE
Frequency Percentage of
children (n=400)
Percentage of
children (n=114)
1 1 0.25 0.88
2 4 1.00 3.51
3 8 2.00 7.02
4 40 10.00 35.09
5 32 8.00 28.07
6 18 4.50 15.79
7 6 1.50 5.26
8 3 0.75 2.63
9 1 0.25 0.88
10 1 0.25 0.88
Total 114 28.50 100.00
No data 286 71.50 --
Total 400 100.00 --
OTHER
Frequency Percentage of
children (n=400)
Percentage of
children (n=27)
4 7 1.75 25.93
5 3 0.75 11.11
6 11 2.75 40.74
7 4 1.00 14.81
8 1 0.25 3.70
9 1 0.25 3.70
Total 27 6.75 100.00
No data 373 93.25 --
Total 400 100.00 --
C4. In which month of age the products containing gluten (e.g. wheat gluten/porridge, semolina, bread crust) were introduced
to the child's diet?
Frequency Percent
Before the fifth Month 88 22.00
In the fifth Month 72 18.00
In the sixth Month 119 29.75
In the 7th - 9th month 91 22.75
In the 9th - 12th month 27 6.75
Gluten products have not yet been introduced to the child's diet 2 0.50
Total 399 99.75
No data 1 0.25
Total 400 100.00
C5. Were fish introduced to the child's diet in the second half year of his/her life?
Frequency Percent
YES 305 76.25
NO 95 23.75
Total 400 100.00
If YES, in what form?
Frequency Percentage of
children (n=400)
Percentage
(n=305)
Fish - homemade meal 234 58.50 76.72
Fish - ready-made meal 90 22.50 29.51
Fish - other 19 4.75 6.23
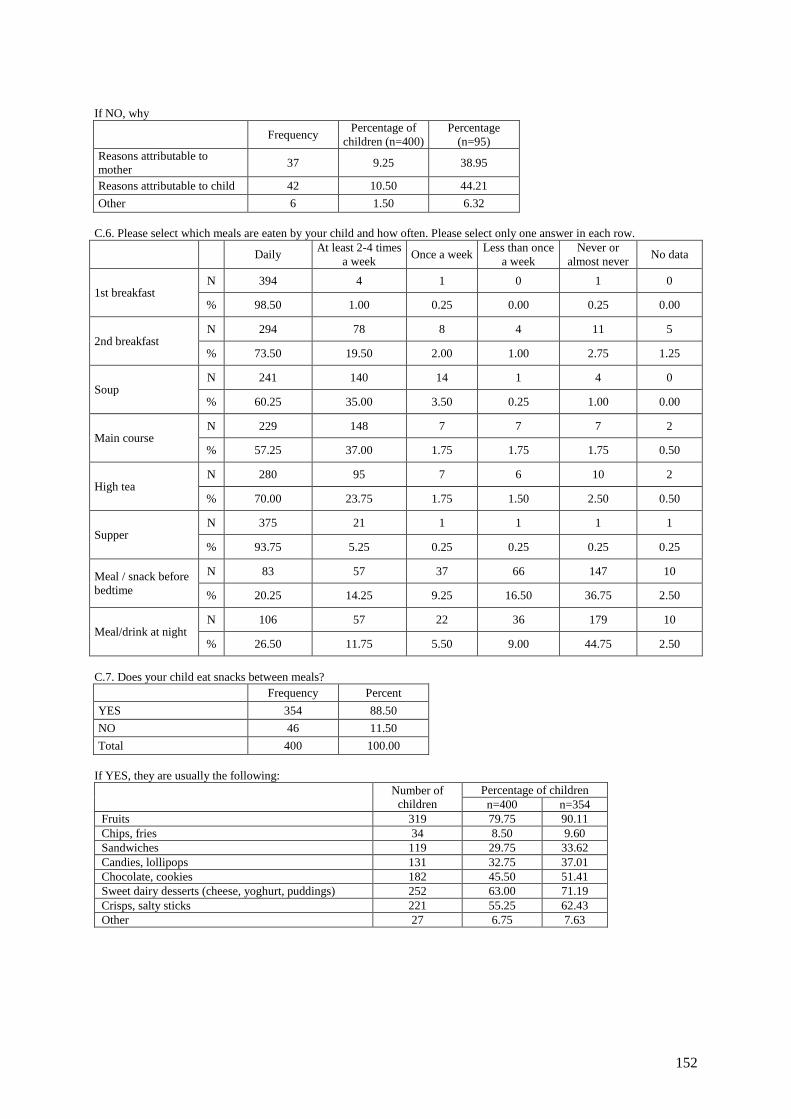
152
If NO, why
Frequency Percentage of
children (n=400)
Percentage
(n=95)
Reasons attributable to
mother 37 9.25 38.95
Reasons attributable to child 42 10.50 44.21
Other 6 1.50 6.32
C.6. Please select which meals are eaten by your child and how often. Please select only one answer in each row.
Daily At least 2-4 times
a week Once a week
Less than once
a week
Never or
almost never No data
1st breakfast N 394 4 1 0 1 0
% 98.50 1.00 0.25 0.00 0.25 0.00
2nd breakfast N 294 78 8 4 11 5
% 73.50 19.50 2.00 1.00 2.75 1.25
Soup N 241 140 14 1 4 0
% 60.25 35.00 3.50 0.25 1.00 0.00
Main course N 229 148 7 7 7 2
% 57.25 37.00 1.75 1.75 1.75 0.50
High tea N 280 95 7 6 10 2
% 70.00 23.75 1.75 1.50 2.50 0.50
Supper N 375 21 1 1 1 1
% 93.75 5.25 0.25 0.25 0.25 0.25
Meal / snack before
bedtime
N 83 57 37 66 147 10
% 20.25 14.25 9.25 16.50 36.75 2.50
Meal/drink at night N 106 57 22 36 179 10
% 26.50 11.75 5.50 9.00 44.75 2.50
C.7. Does your child eat snacks between meals?
Frequency Percent
YES 354 88.50
NO 46 11.50
Total 400 100.00
If YES, they are usually the following:
Number of
children
Percentage of children
n=400 n=354
Fruits 319 79.75 90.11
Chips, fries 34 8.50 9.60
Sandwiches 119 29.75 33.62
Candies, lollipops 131 32.75 37.01
Chocolate, cookies 182 45.50 51.41
Sweet dairy desserts (cheese, yoghurt, puddings) 252 63.00 71.19
Crisps, salty sticks 221 55.25 62.43
Other 27 6.75 7.63
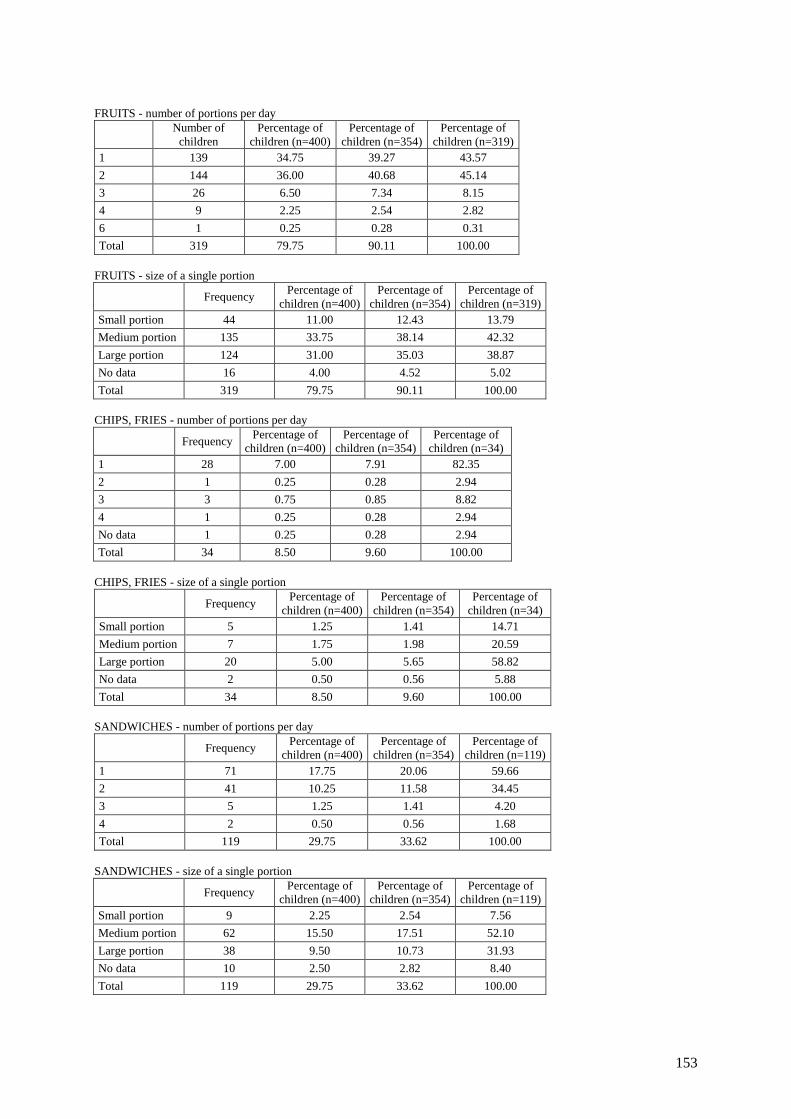
153
FRUITS - number of portions per day
Number of
children
Percentage of
children (n=400)
Percentage of
children (n=354)
Percentage of
children (n=319)
1 139 34.75 39.27 43.57
2 144 36.00 40.68 45.14
3 26 6.50 7.34 8.15
4 9 2.25 2.54 2.82
6 1 0.25 0.28 0.31
Total 319 79.75 90.11 100.00
FRUITS - size of a single portion
Frequency Percentage of
children (n=400)
Percentage of
children (n=354)
Percentage of
children (n=319)
Small portion 44 11.00 12.43 13.79
Medium portion 135 33.75 38.14 42.32
Large portion 124 31.00 35.03 38.87
No data 16 4.00 4.52 5.02
Total 319 79.75 90.11 100.00
CHIPS, FRIES - number of portions per day
Frequency Percentage of
children (n=400)
Percentage of
children (n=354)
Percentage of
children (n=34)
1 28 7.00 7.91 82.35
2 1 0.25 0.28 2.94
3 3 0.75 0.85 8.82
4 1 0.25 0.28 2.94
No data 1 0.25 0.28 2.94
Total 34 8.50 9.60 100.00
CHIPS, FRIES - size of a single portion
Frequency Percentage of
children (n=400)
Percentage of
children (n=354)
Percentage of
children (n=34)
Small portion 5 1.25 1.41 14.71
Medium portion 7 1.75 1.98 20.59
Large portion 20 5.00 5.65 58.82
No data 2 0.50 0.56 5.88
Total 34 8.50 9.60 100.00
SANDWICHES - number of portions per day
Frequency Percentage of
children (n=400)
Percentage of
children (n=354)
Percentage of
children (n=119)
1 71 17.75 20.06 59.66
2 41 10.25 11.58 34.45
3 5 1.25 1.41 4.20
4 2 0.50 0.56 1.68
Total 119 29.75 33.62 100.00
SANDWICHES - size of a single portion
Frequency Percentage of
children (n=400)
Percentage of
children (n=354)
Percentage of
children (n=119)
Small portion 9 2.25 2.54 7.56
Medium portion 62 15.50 17.51 52.10
Large portion 38 9.50 10.73 31.93
No data 10 2.50 2.82 8.40
Total 119 29.75 33.62 100.00
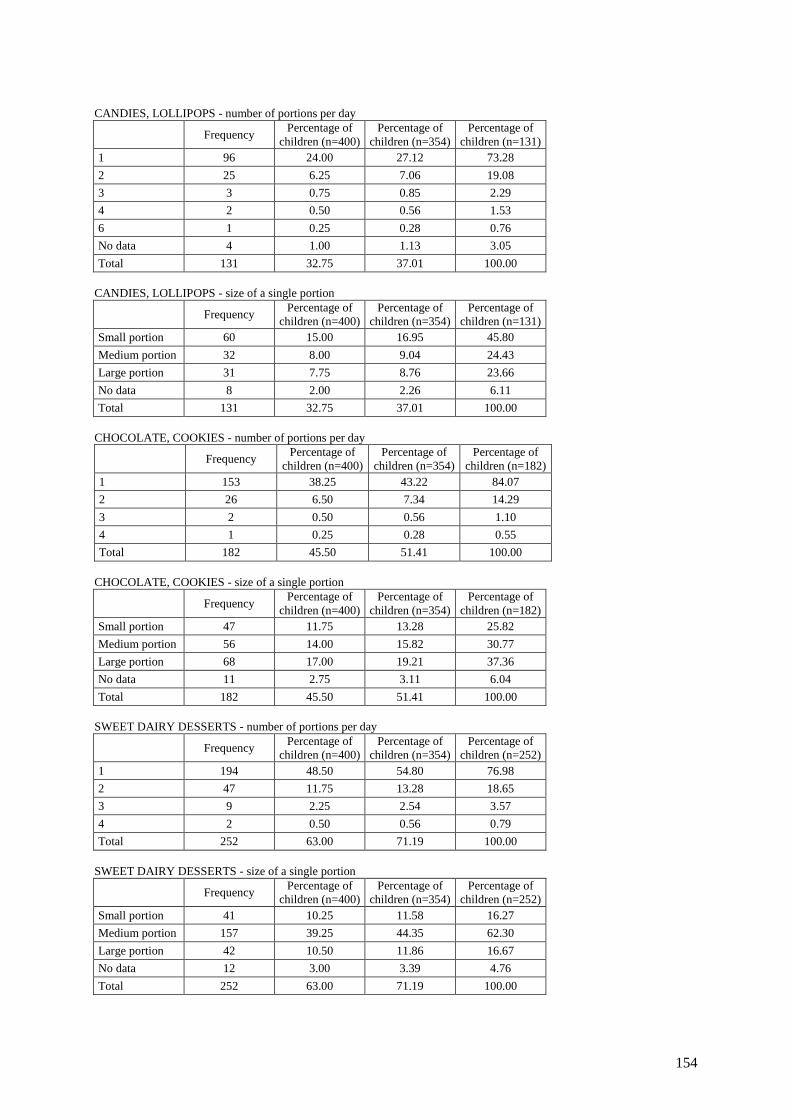
154
CANDIES, LOLLIPOPS - number of portions per day
Frequency Percentage of
children (n=400)
Percentage of
children (n=354)
Percentage of
children (n=131)
1 96 24.00 27.12 73.28
2 25 6.25 7.06 19.08
3 3 0.75 0.85 2.29
4 2 0.50 0.56 1.53
6 1 0.25 0.28 0.76
No data 4 1.00 1.13 3.05
Total 131 32.75 37.01 100.00
CANDIES, LOLLIPOPS - size of a single portion
Frequency Percentage of
children (n=400)
Percentage of
children (n=354)
Percentage of
children (n=131)
Small portion 60 15.00 16.95 45.80
Medium portion 32 8.00 9.04 24.43
Large portion 31 7.75 8.76 23.66
No data 8 2.00 2.26 6.11
Total 131 32.75 37.01 100.00
CHOCOLATE, COOKIES - number of portions per day
Frequency Percentage of
children (n=400)
Percentage of
children (n=354)
Percentage of
children (n=182)
1 153 38.25 43.22 84.07
2 26 6.50 7.34 14.29
3 2 0.50 0.56 1.10
4 1 0.25 0.28 0.55
Total 182 45.50 51.41 100.00
CHOCOLATE, COOKIES - size of a single portion
Frequency Percentage of
children (n=400)
Percentage of
children (n=354)
Percentage of
children (n=182)
Small portion 47 11.75 13.28 25.82
Medium portion 56 14.00 15.82 30.77
Large portion 68 17.00 19.21 37.36
No data 11 2.75 3.11 6.04
Total 182 45.50 51.41 100.00
SWEET DAIRY DESSERTS - number of portions per day
Frequency Percentage of
children (n=400)
Percentage of
children (n=354)
Percentage of
children (n=252)
1 194 48.50 54.80 76.98
2 47 11.75 13.28 18.65
3 9 2.25 2.54 3.57
4 2 0.50 0.56 0.79
Total 252 63.00 71.19 100.00
SWEET DAIRY DESSERTS - size of a single portion
Frequency Percentage of
children (n=400)
Percentage of
children (n=354)
Percentage of
children (n=252)
Small portion 41 10.25 11.58 16.27
Medium portion 157 39.25 44.35 62.30
Large portion 42 10.50 11.86 16.67
No data 12 3.00 3.39 4.76
Total 252 63.00 71.19 100.00
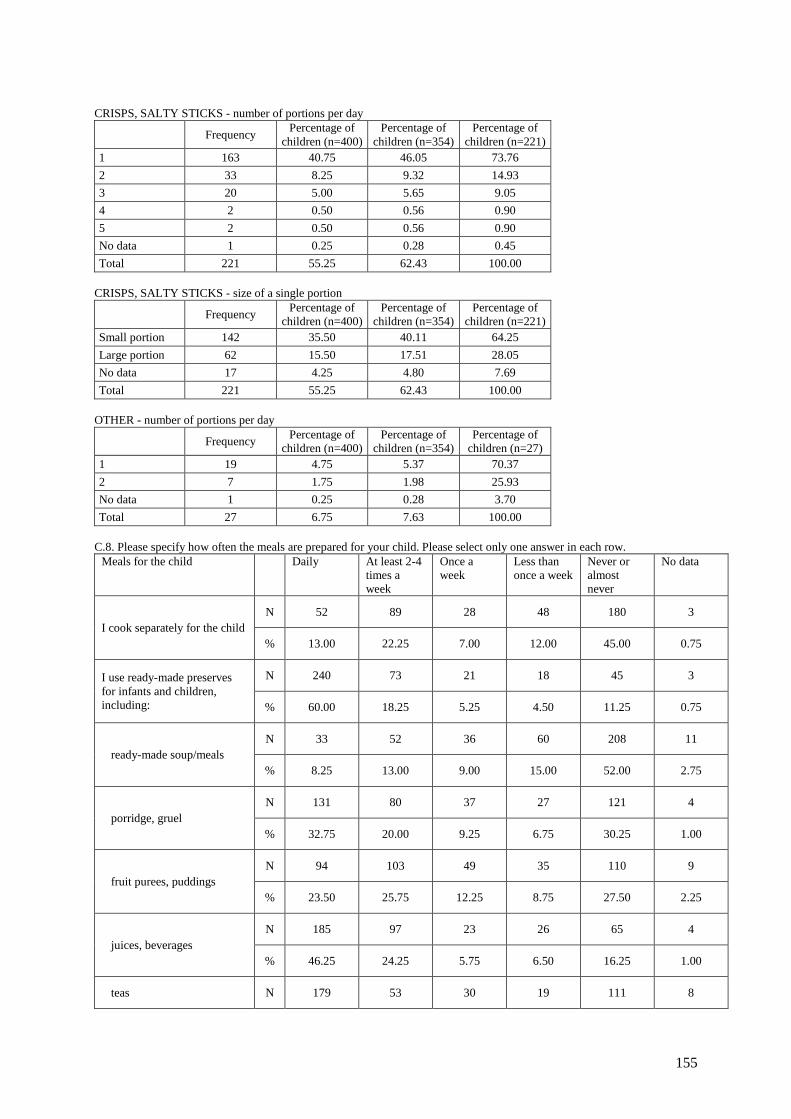
155
CRISPS, SALTY STICKS - number of portions per day
Frequency Percentage of
children (n=400)
Percentage of
children (n=354)
Percentage of
children (n=221)
1 163 40.75 46.05 73.76
2 33 8.25 9.32 14.93
3 20 5.00 5.65 9.05
4 2 0.50 0.56 0.90
5 2 0.50 0.56 0.90
No data 1 0.25 0.28 0.45
Total 221 55.25 62.43 100.00
CRISPS, SALTY STICKS - size of a single portion
Frequency
Percentage of
children (n=400)
Percentage of
children (n=354)
Percentage of
children (n=221)
Small portion 142 35.50 40.11 64.25
Large portion 62 15.50 17.51 28.05
No data 17 4.25 4.80 7.69
Total 221 55.25 62.43 100.00
OTHER - number of portions per day
Frequency Percentage of
children (n=400)
Percentage of
children (n=354)
Percentage of
children (n=27)
1 19 4.75 5.37 70.37
2 7 1.75 1.98 25.93
No data 1 0.25 0.28 3.70
Total 27 6.75 7.63 100.00
C.8. Please specify how often the meals are prepared for your child. Please select only one answer in each row.
Meals for the child Daily At least 2-4
times a
week
Once a
week
Less than
once a week
Never or
almost
never
No data
I cook separately for the child
N 52 89 28 48 180 3
% 13.00 22.25 7.00 12.00 45.00 0.75
I use ready-made preserves
for infants and children,
including:
N 240 73 21 18 45 3
% 60.00 18.25 5.25 4.50 11.25 0.75
ready-made soup/meals
N 33 52 36 60 208 11
% 8.25 13.00 9.00 15.00 52.00 2.75
porridge, gruel
N 131 80 37 27 121 4
% 32.75 20.00 9.25 6.75 30.25 1.00
fruit purees, puddings
N 94 103 49 35 110 9
% 23.50 25.75 12.25 8.75 27.50 2.25
juices, beverages
N 185 97 23 26 65 4
% 46.25 24.25 5.75 6.50 16.25 1.00
teas N 179 53 30 19 111 8

156
% 44.75 13.25 7.50 4.75 27.75 2.00
The child eats meals prepared
for the whole family
N 253 85 19 19 20 4
% 63.25 21.25 4.75 4.75 5.00 1.00
I buy ready-made meals
prepared outside the house
(e.g. Chinese food, ravioli,
pizza, etc.)
N 3 6 16 56 304 15
% 0.75 1.50 4.00 14.00 76.00 3.75
C9. Does your child eat "fast food" in restaurants / fast food bars?
Frequency Percent
YES 69 17.25
NO 330 82.50
Total 399 99.75
No data 1 0.25
Total 400 100.00
If YES, how often?
Frequency Percent
1-2 times a month 43 10.75
1-2 times a week 8 2.00
Other 18 4.50
Total 69 17.25
No data 331 82.75
Total 400 100.00
What and how much does your child eat?
Frequency Percent
French fries 62 15.50
Poultry dishes 30 7.50
Pizza 14 3.50
Other 9 2.25
C.10. Please specify how often the products listed below are used in the meals eaten by your child. Please select one answer
in each row.
Daily At least 2-4
times a week
Once a
week
Less than
once a week
Never or
almost
never
No data
Fresh fruits N 268 117 3 6 6
% 67.00 29.25 0.75 1.50 1.50
Frozen fruits N 1 18 24 103 247 7
% 0.25 4.50 6.00 25.75 61.75 1.75
Fruit juices N 219 132 19 19 11
% 54.75 33.00 4.75 4.75 2.75
Vegetable and vegetable
- fruit juices
N 62 100 48 79 110 1
% 15.50 25.00 12.00 19.75 27.50 0.25
Fresh vegetables,
including potatoes
N 260 124 10 4 2
% 65.00 31.00 2.50 1.00 0.50
Frozen vegetables N 5 53 83 98 160 1
% 1.25 13.25 20.75 24.50 40.00 0.25
Poultry meat N 43 282 54 8 12 1
% 10.75 70.50 13.50 2.00 3.00 0.25
Red meat N 8 99 124 87 81 1
% 2.00 24.75 31.00 21.75 20.25 0.25
Fresh fish N 4 35 128 83 148 2
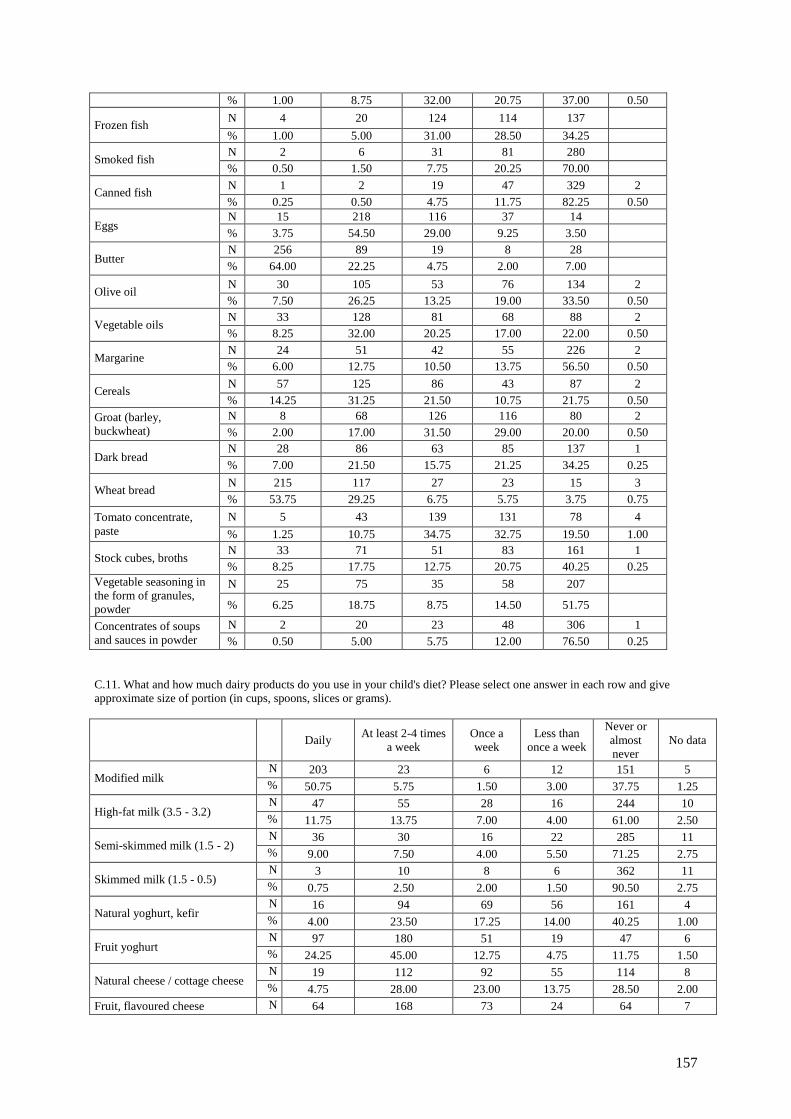
157
% 1.00 8.75 32.00 20.75 37.00 0.50
Frozen fish N 4 20 124 114 137
% 1.00 5.00 31.00 28.50 34.25
Smoked fish N 2 6 31 81 280
% 0.50 1.50 7.75 20.25 70.00
Canned fish N 1 2 19 47 329 2
% 0.25 0.50 4.75 11.75 82.25 0.50
Eggs N 15 218 116 37 14
% 3.75 54.50 29.00 9.25 3.50
Butter N 256 89 19 8 28
% 64.00 22.25 4.75 2.00 7.00
Olive oil N 30 105 53 76 134 2
% 7.50 26.25 13.25 19.00 33.50 0.50
Vegetable oils N 33 128 81 68 88 2
% 8.25 32.00 20.25 17.00 22.00 0.50
Margarine N 24 51 42 55 226 2
% 6.00 12.75 10.50 13.75 56.50 0.50
Cereals N 57 125 86 43 87 2
% 14.25 31.25 21.50 10.75 21.75 0.50
Groat (barley,
buckwheat)
N 8 68 126 116 80 2
% 2.00 17.00 31.50 29.00 20.00 0.50
Dark bread N 28 86 63 85 137 1
% 7.00 21.50 15.75 21.25 34.25 0.25
Wheat bread N 215 117 27 23 15 3
% 53.75 29.25 6.75 5.75 3.75 0.75
Tomato concentrate,
paste
N 5 43 139 131 78 4
% 1.25 10.75 34.75 32.75 19.50 1.00
Stock cubes, broths N 33 71 51 83 161 1
% 8.25 17.75 12.75 20.75 40.25 0.25
Vegetable seasoning in
the form of granules,
powder
N 25 75 35 58 207
% 6.25 18.75 8.75 14.50 51.75
Concentrates of soups
and sauces in powder
N 2 20 23 48 306 1
% 0.50 5.00 5.75 12.00 76.50 0.25
C.11. What and how much dairy products do you use in your child's diet? Please select one answer in each row and give
approximate size of portion (in cups, spoons, slices or grams).
Daily At least 2-4 times
a week
Once a
week
Less than
once a week
Never or
almost
never
No data
Modified milk N 203 23 6 12 151 5
% 50.75 5.75 1.50 3.00 37.75 1.25
High-fat milk (3.5 - 3.2) N 47 55 28 16 244 10
% 11.75 13.75 7.00 4.00 61.00 2.50
Semi-skimmed milk (1.5 - 2) N 36 30 16 22 285 11
% 9.00 7.50 4.00 5.50 71.25 2.75
Skimmed milk (1.5 - 0.5) N 3 10 8 6 362 11
% 0.75 2.50 2.00 1.50 90.50 2.75
Natural yoghurt, kefir N 16 94 69 56 161 4
% 4.00 23.50 17.25 14.00 40.25 1.00
Fruit yoghurt N 97 180 51 19 47 6
% 24.25 45.00 12.75 4.75 11.75 1.50
Natural cheese / cottage cheese N 19 112 92 55 114 8
% 4.75 28.00 23.00 13.75 28.50 2.00
Fruit, flavoured cheese N 64 168 73 24 64 7

158
% 16.00 42.00 18.25 6.00 16.00 1.75
Dairy dessert N 26 102 62 59 141 10
% 6.50 25.50 15.50 14.75 35.25 2.50
Hard cheese N 29 163 63 46 94 5
% 7.25 40.75 15.75 11.50 23.50 1.25
Other (specify) N 6 2 7 385
% 1.50 0.50 1.75 96.25
If you do not use any dairy products in your child's diet, please specify why.
Frequency Percent
Allergy 15 78.95
Child does not
like it 3 15.79
Other 1 5.26
Total 19 100.00
C.12. Please specify what other liquids (except for milk and milk beverages) does your child drink and in what amounts.
Please select one answer in each row and give approximate size of portion (in cups,).
Daily
At least 2-4
times a week Once a week
Less than
once a week
Never or
almost never No data
Water N 267 64 13 15 38 3
% 66.75 16.00 3.25 3.75 9.50 0.75
Juices, nectars N 203 135 27 17 15 3
% 50.75 33.75 6.75 4.25 3.75 0.75
Sweet still and carbonated
drinks
N 26 38 27 25 278 6
% 6.50 9.50 6.75 6.25 69.50 1.50
Tea N 207 100 20 15 56 2
% 51.75 25.00 5.00 3.75 14.00 0.50
Chicory coffee (without milk) N 5 13 15 23 338 6
% 1.25 3.25 3.75 5.75 84.50 1.50
Compote N 37 98 74 79 108 4
% 9.25 24.50 18.50 19.75 27.00 1.00
Homemade soups N 206 154 25 5 9 1
% 51.50 38.50 6.25 1.25 2.25 0.25
Other (specify) N 9 2 389
% 2.25 0.50 97.25
C.13. Do you add salt to meals of your child? Please select one answer.
Frequency Percent
I do not use salt for my child's meals 70 17.50
I add salt to all of my child's meals 63 15.75
I add salt only to homemade meals 254 63.50
I add salt to ready-made products for children 2 0.50
Total 389 97.25
No data 11 2.75
Total 400 100.00
C.14. In terms of nutrition you observe that your child:
Eats Frequency Percent
Regularly 334 83.50
Irregularly 63 15.75
Total 397 99.25
No data 3 0.75
Total 400 100.00
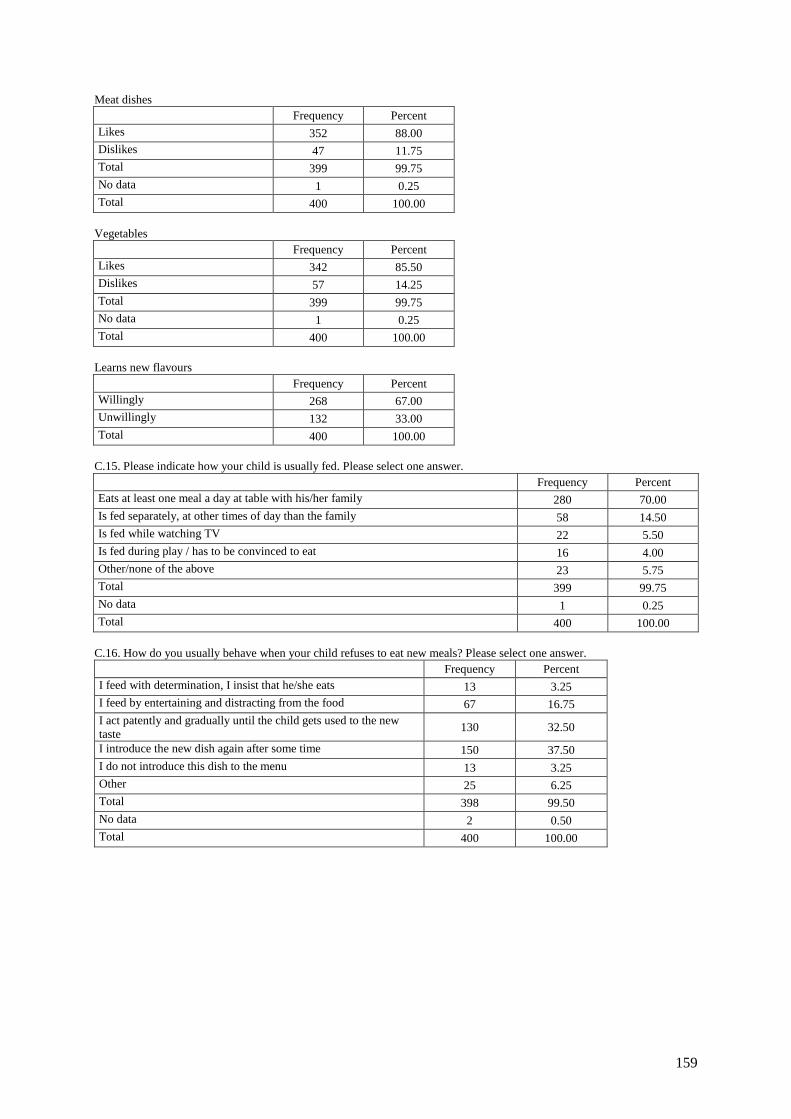
159
Meat dishes
Frequency Percent
Likes 352 88.00
Dislikes 47 11.75
Total 399 99.75
No data 1 0.25
Total 400 100.00
Vegetables
Frequency Percent
Likes 342 85.50
Dislikes 57 14.25
Total 399 99.75
No data 1 0.25
Total 400 100.00
Learns new flavours
Frequency Percent
Willingly 268 67.00
Unwillingly 132 33.00
Total 400 100.00
C.15. Please indicate how your child is usually fed. Please select one answer.
Frequency Percent
Eats at least one meal a day at table with his/her family 280 70.00
Is fed separately, at other times of day than the family 58 14.50
Is fed while watching TV 22 5.50
Is fed during play / has to be convinced to eat 16 4.00
Other/none of the above 23 5.75
Total 399 99.75
No data 1 0.25
Total 400 100.00
C.16. How do you usually behave when your child refuses to eat new meals? Please select one answer.
Frequency Percent
I feed with determination, I insist that he/she eats 13 3.25
I feed by entertaining and distracting from the food 67 16.75
I act patently and gradually until the child gets used to the new
taste 130 32.50
I introduce the new dish again after some time 150 37.50
I do not introduce this dish to the menu 13 3.25
Other 25 6.25
Total 398 99.50
No data 2 0.50
Total 400 100.00
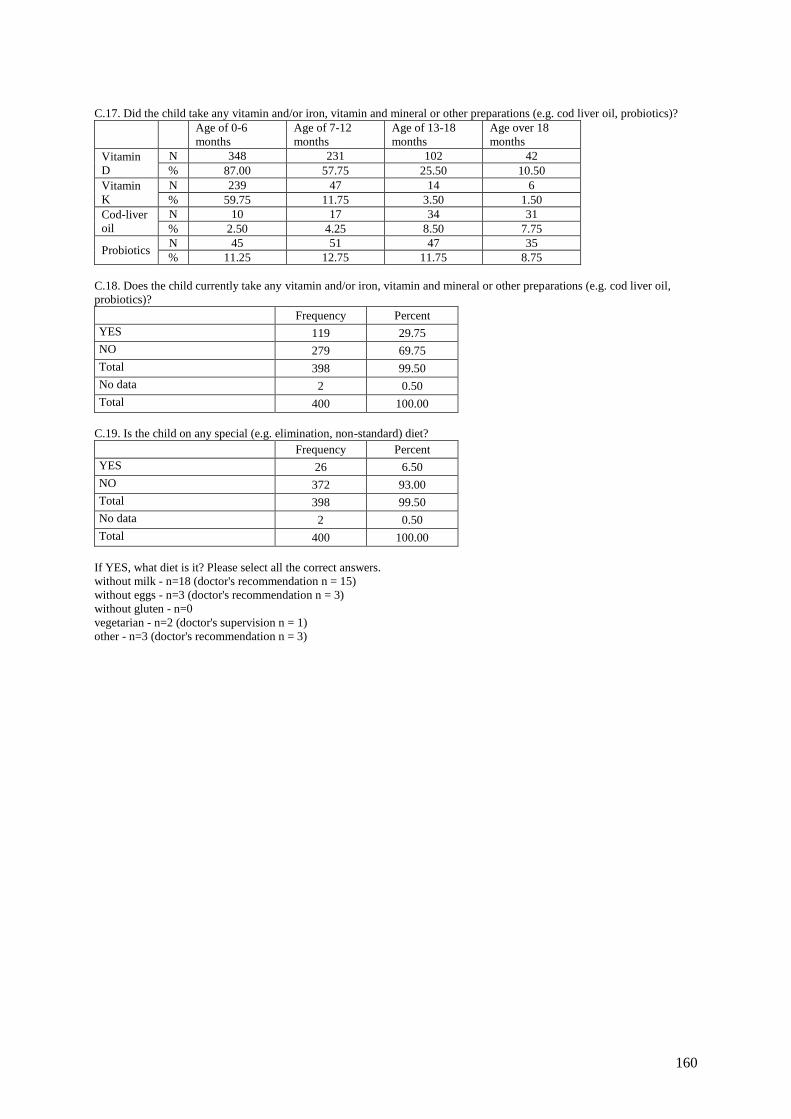
160
C.17. Did the child take any vitamin and/or iron, vitamin and mineral or other preparations (e.g. cod liver oil, probiotics)?
Age of 0-6
months
Age of 7-12
months
Age of 13-18
months
Age over 18
months
Vitamin
D
N 348 231 102 42
% 87.00 57.75 25.50 10.50
Vitamin
K
N 239 47 14 6
% 59.75 11.75 3.50 1.50
Cod-liver
oil
N 10 17 34 31
% 2.50 4.25 8.50 7.75
Probiotics N 45 51 47 35
% 11.25 12.75 11.75 8.75
C.18. Does the child currently take any vitamin and/or iron, vitamin and mineral or other preparations (e.g. cod liver oil,
probiotics)?
Frequency Percent
YES 119 29.75
NO 279 69.75
Total 398 99.50
No data 2 0.50
Total 400 100.00
C.19. Is the child on any special (e.g. elimination, non-standard) diet?
Frequency Percent
YES 26 6.50
NO 372 93.00
Total 398 99.50
No data 2 0.50
Total 400 100.00
If YES, what diet is it? Please select all the correct answers.
without milk - n=18 (doctor's recommendation n = 15)
without eggs - n=3 (doctor's recommendation n = 3)
without gluten - n=0
vegetarian - n=2 (doctor's supervision n = 1)
other - n=3 (doctor's recommendation n = 3)