composite materials: mechanical and fracture …...composite materials: mechanical and fracture...
TRANSCRIPT
Composite Materials: Mechanical and Fracture Characterization
Dr Rajesh Kitey
School on Mechanics of Reinforced Polymer Composites Knowledge Incubation for TEQIP
Indian Institute of Technology Kanpur January 22-25, 2017
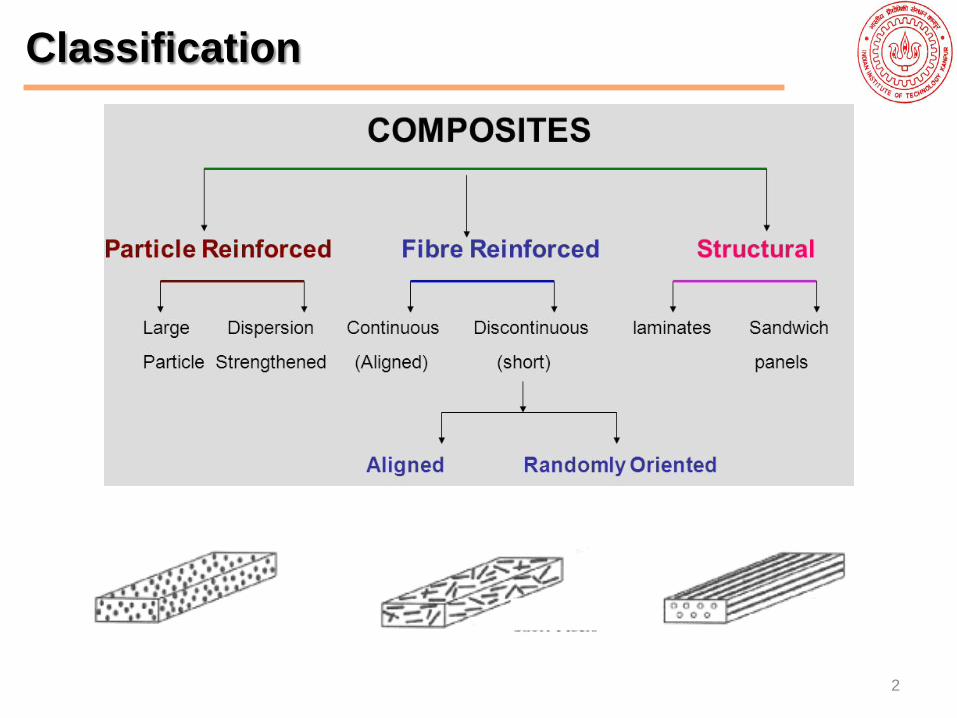
Classification
2
3
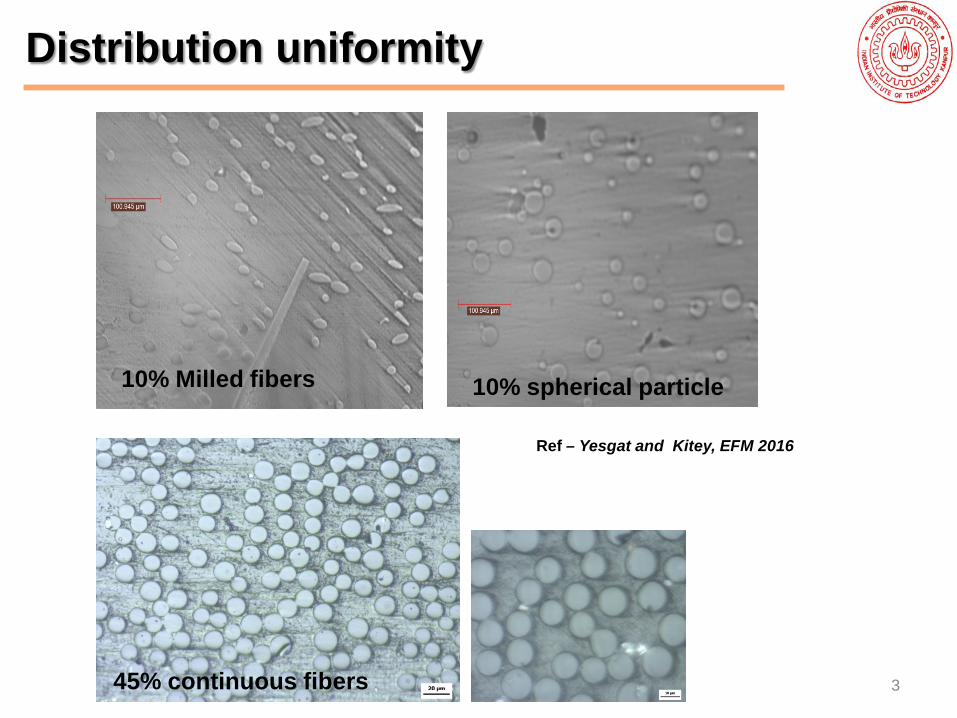
10% spherical particle 10% Milled fibers
45% continuous fibers
Distribution uniformity
Ref – Yesgat and Kitey, EFM 2016
4
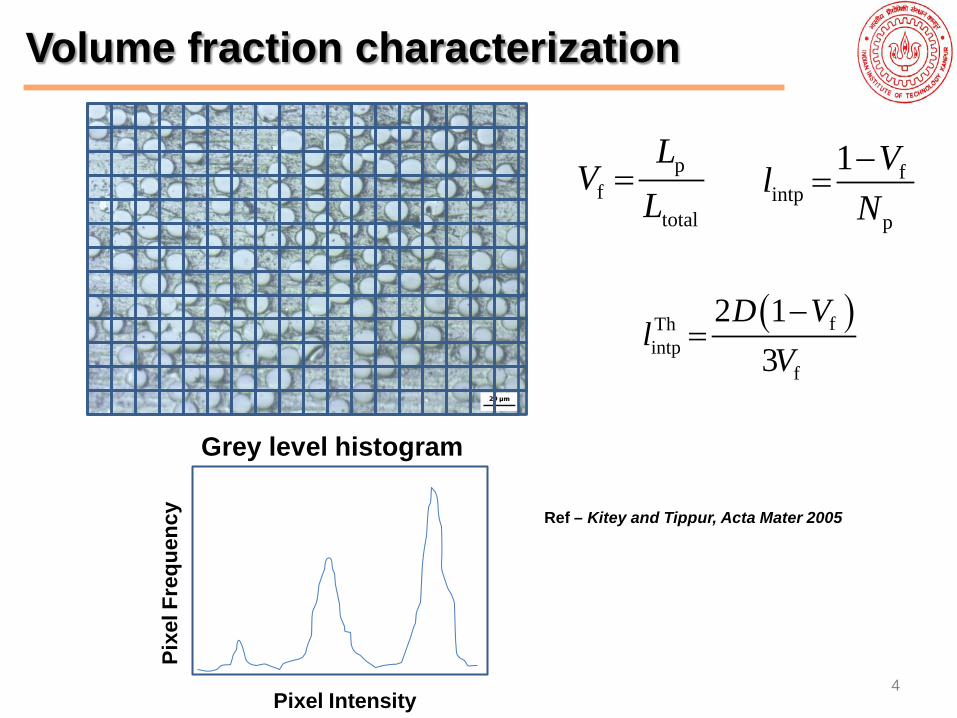
Volume fraction characterization
pf
total
LV
L= f
intpp
1 VlN−
=
( )fThintp
f
2 13
D Vl
V−
=
Grey level histogram
Pixe
l Fre
quen
cy
Pixel Intensity
Ref – Kitey and Tippur, Acta Mater 2005
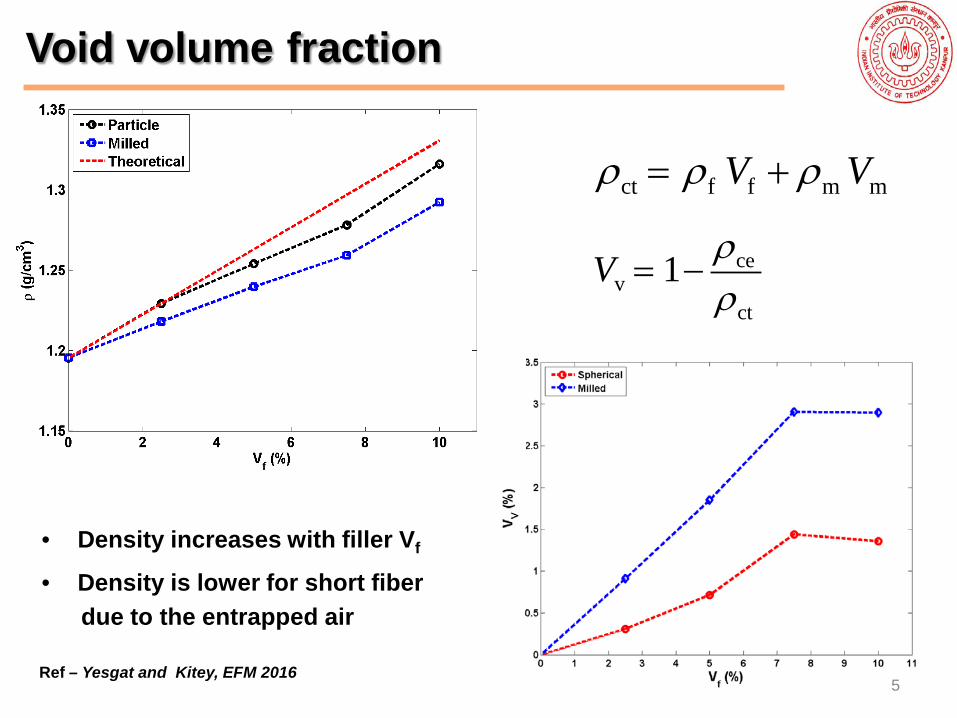
cev
ct
1V ρρ
= −
ct f f m mV Vρ ρ ρ= +
• Density increases with filler Vf
• Density is lower for short fiber due to the entrapped air
5
Void volume fraction
Ref – Yesgat and Kitey, EFM 2016
6
Mechanical Characteristics
7
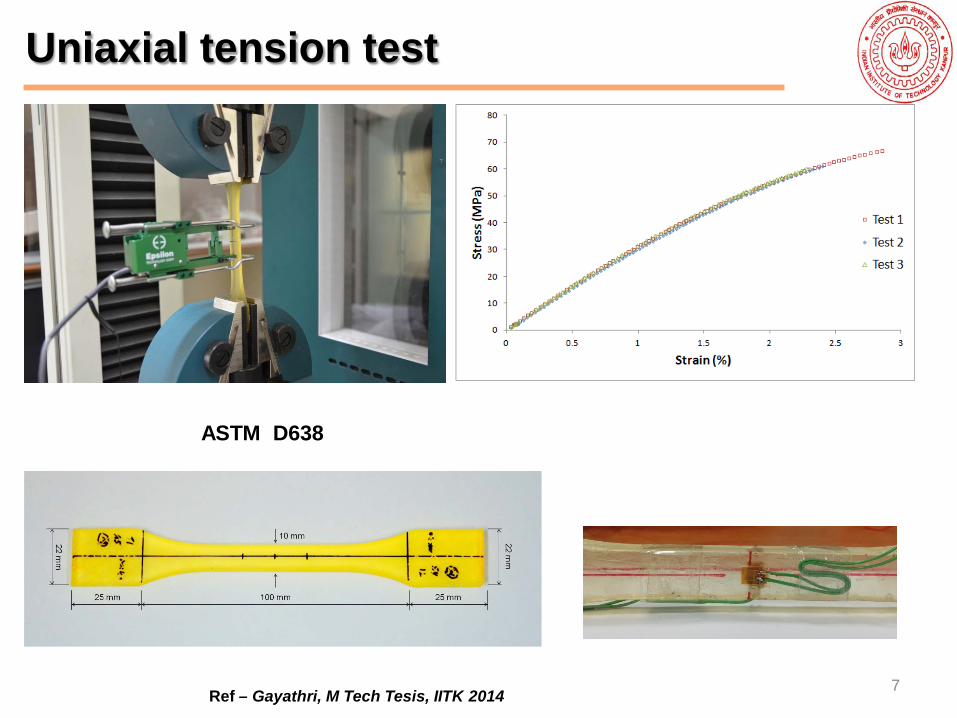
Uniaxial tension test
ASTM D638
Ref – Gayathri, M Tech Tesis, IITK 2014
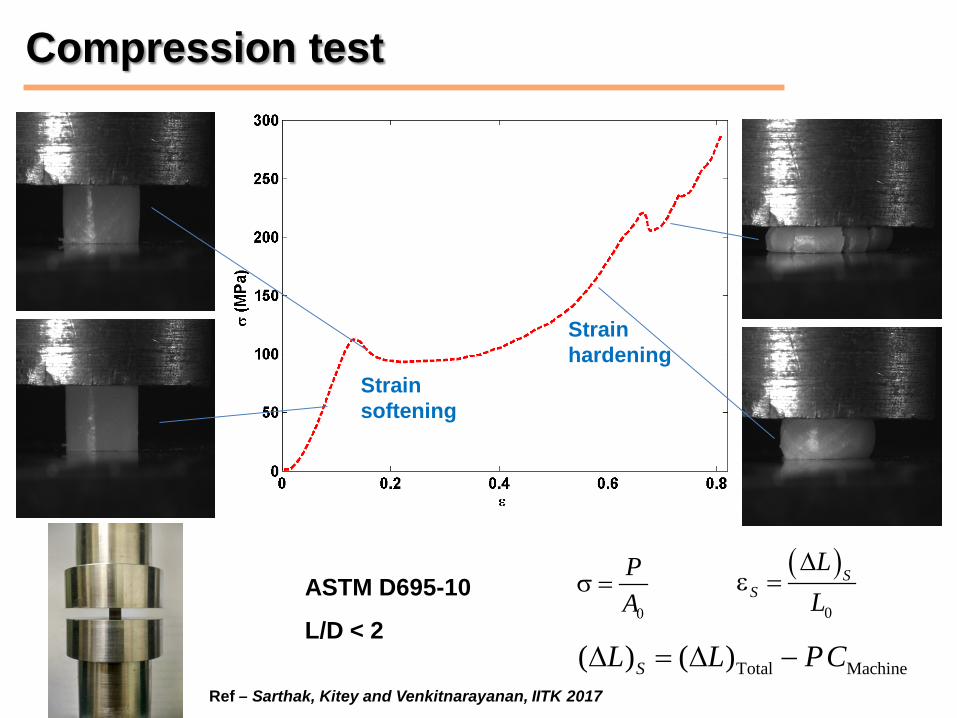
Strain softening
Strain hardening
Compression test
0
PA
σ =( )
0
SS
LL
∆ε =
Total Machine( ) ( )SL L PC∆ = ∆ −
ASTM D695-10
L/D < 2
Ref – Sarthak, Kitey and Venkitnarayanan, IITK 2017
9
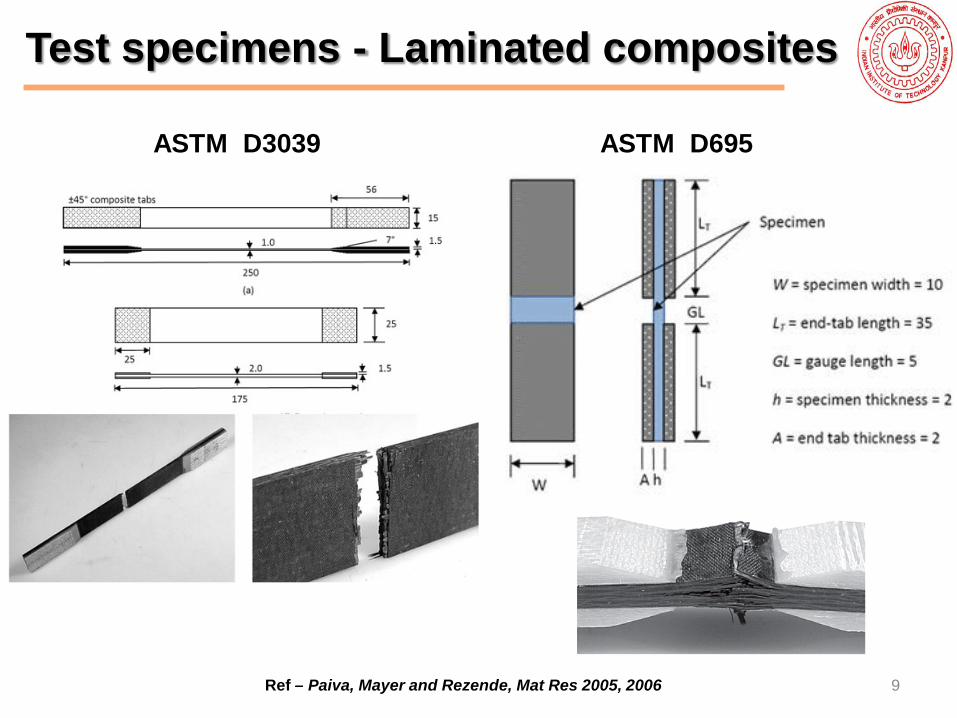
Test specimens - Laminated composites
ASTM D3039 ASTM D695
Ref – Paiva, Mayer and Rezende, Mat Res 2005, 2006
0 2 4 6 80
50
100
150
200
δ(mm)
Load
(N)
250C450C550C
Spherical
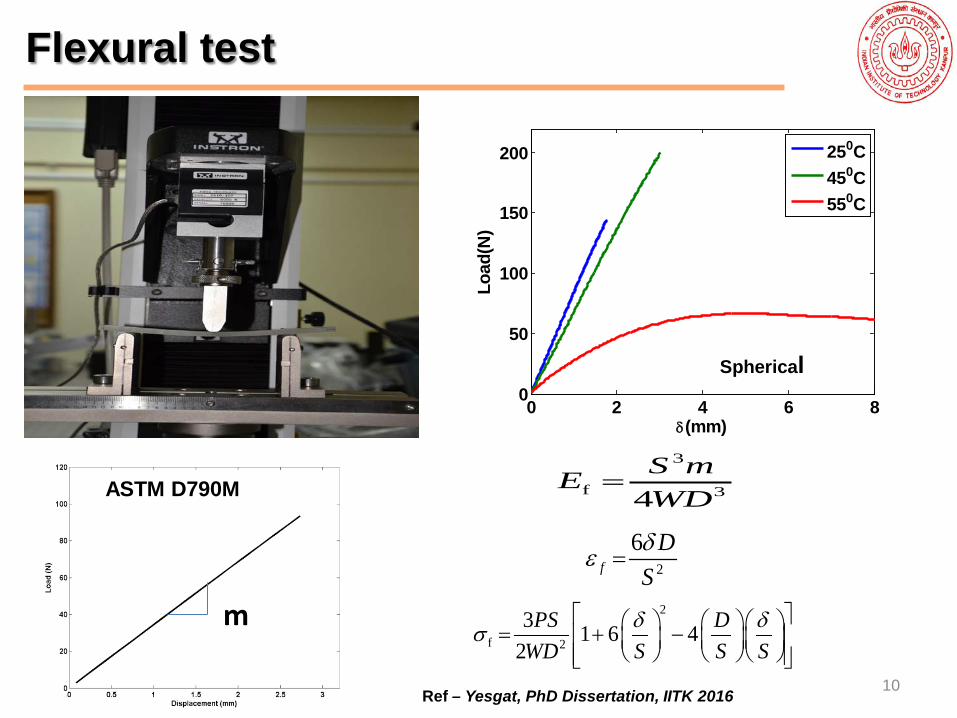
m
ASTM D790M 3
f 34S mEWD
=
2
f 2
3 1 6 42
PS DWD S S S
δ δσ = + −
10
2
6f
DSδε =
Flexural test
Ref – Yesgat, PhD Dissertation, IITK 2016
11
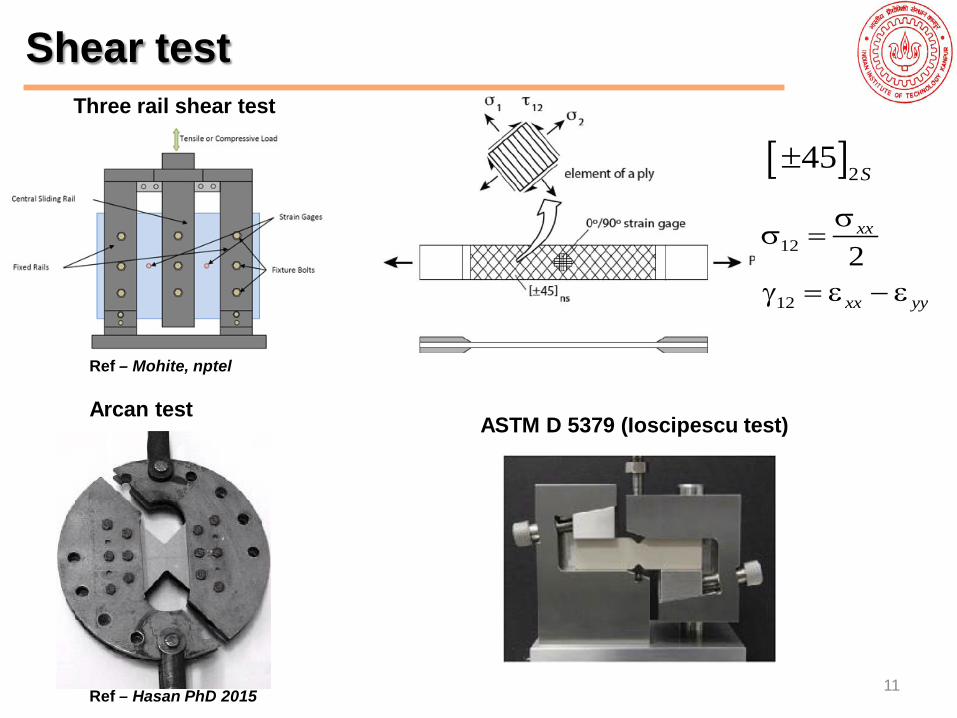
Shear test
Arcan test ASTM D 5379 (Ioscipescu test)
Three rail shear test Uniaxially loading [ ]2
45S
±
12
12
2xx
xx yy
σσ =
γ = ε − ε
Ref – Mohite, nptel
Ref – Hasan PhD 2015
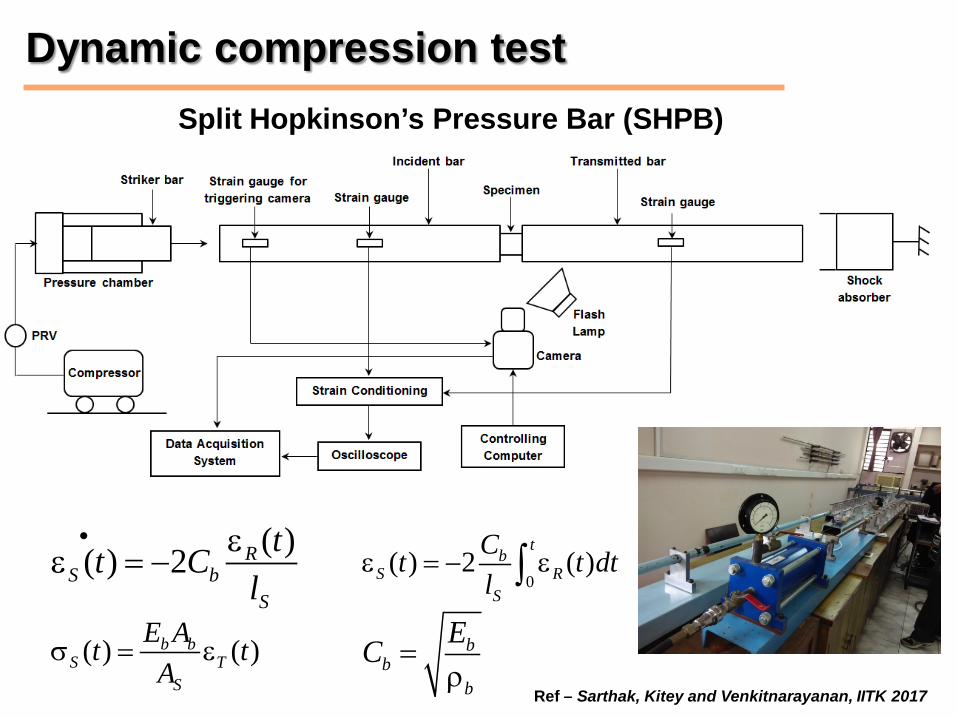
Split Hopkinson’s Pressure Bar (SHPB)
Dynamic compression test
( )( ) 2• ε
ε = − RS b
S
tt Cl 0
( ) 2 ( )ε = − ε∫t
bS R
S
Ct t dtl
( ) ( )σ = εb bS T
S
E At tA
=ρ
bb
b
ECRef – Sarthak, Kitey and Venkitnarayanan, IITK 2017
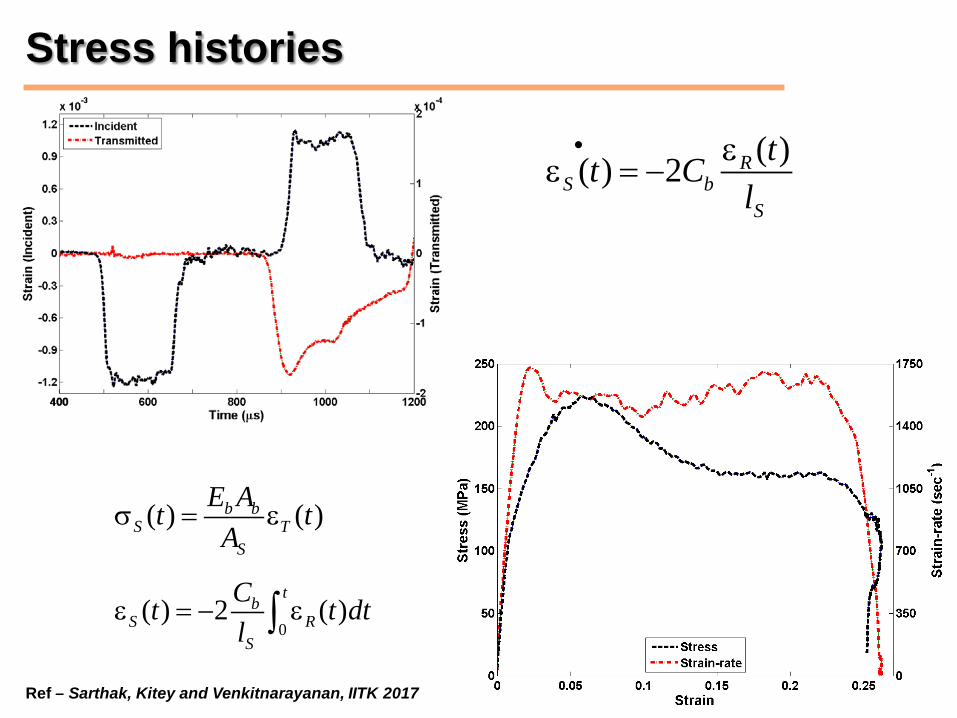
Stress histories
( )( ) 2• ε
ε = − RS b
S
tt Cl
0( ) 2 ( )ε = − ε∫
tb
S RS
Ct t dtl
( ) ( )σ = εb bS T
S
E At tA
Ref – Sarthak, Kitey and Venkitnarayanan, IITK 2017
14
Failure or Fracture
15
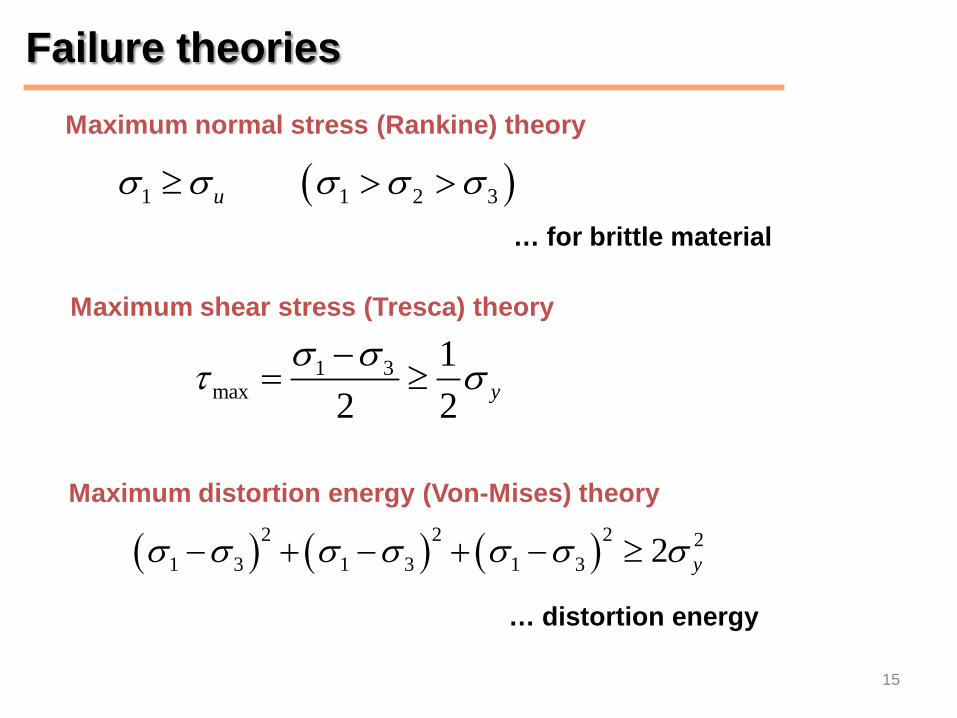
Maximum normal stress (Rankine) theory
Maximum shear stress (Tresca) theory
1 3max
12 2 y
σ στ σ−= ≥
( )1 1 2 3uσ σ σ σ σ≥ > >… for brittle material
Maximum distortion energy (Von-Mises) theory
( ) ( ) ( )2 2 2 21 3 1 3 1 3 2 yσ σ σ σ σ σ σ− + − + − ≥
… distortion energy
Failure theories
16
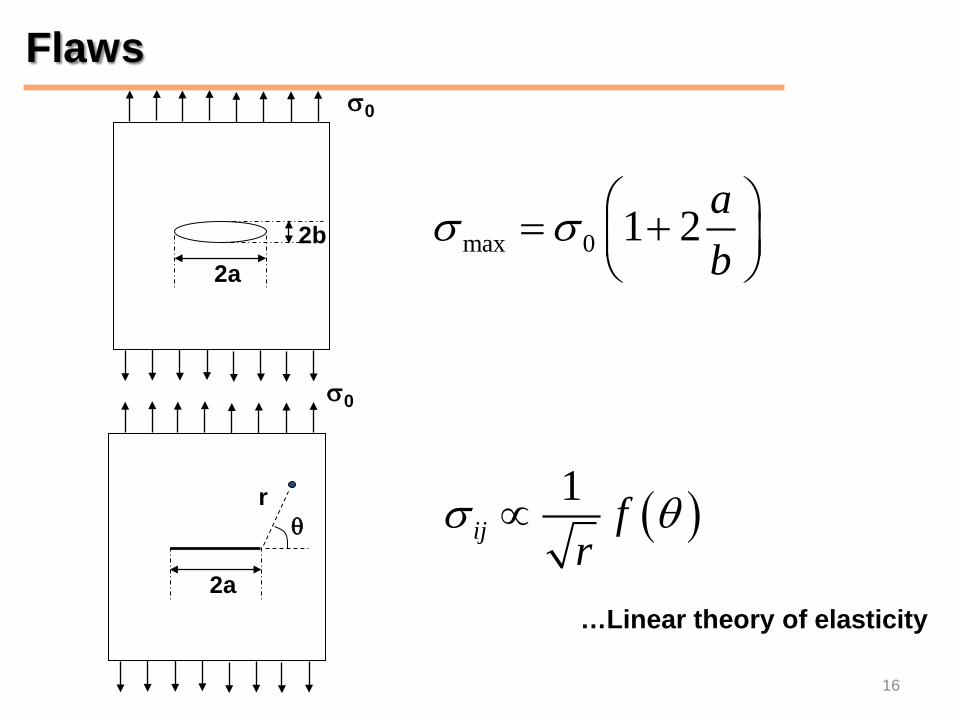
( )1ij f
rσ θ∝
2a 2b
σ0
2a
σ0
r θ
max 0 1 2 ab
σ σ = +
…Linear theory of elasticity
Flaws
17
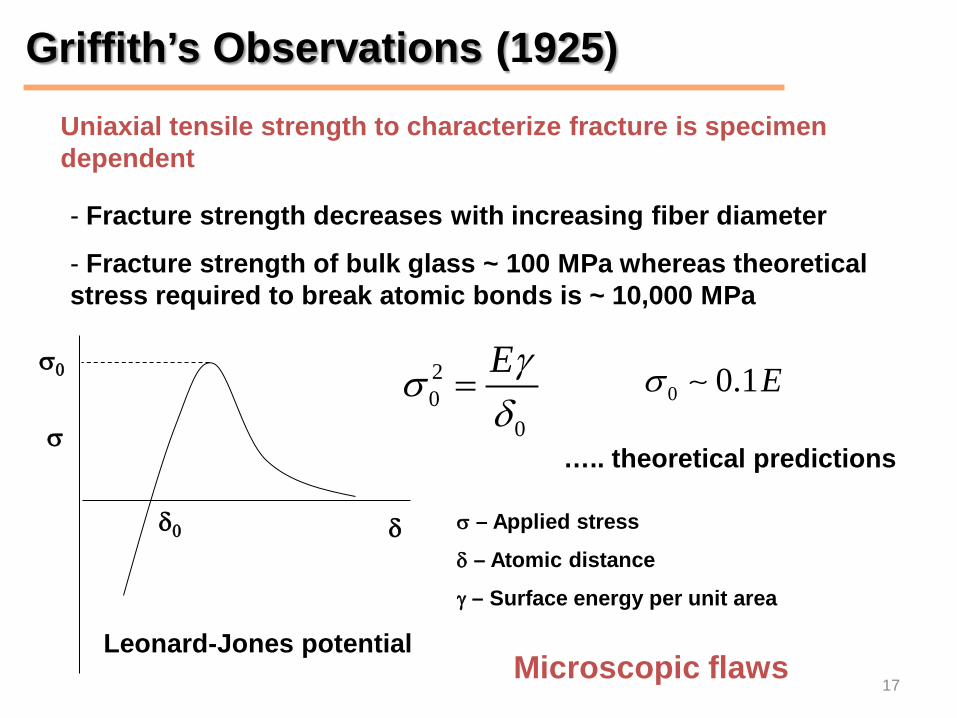
Uniaxial tensile strength to characterize fracture is specimen dependent
- Fracture strength decreases with increasing fiber diameter
- Fracture strength of bulk glass ~ 100 MPa whereas theoretical stress required to break atomic bonds is ~ 10,000 MPa
Microscopic flaws
20
0
Eγσδ
= 0 0.1Eσ
….. theoretical predictions
δ
σ
σ0
Leonard-Jones potential
δ0 σ – Applied stress
δ – Atomic distance
γ – Surface energy per unit area
Griffith’s Observations (1925)
18
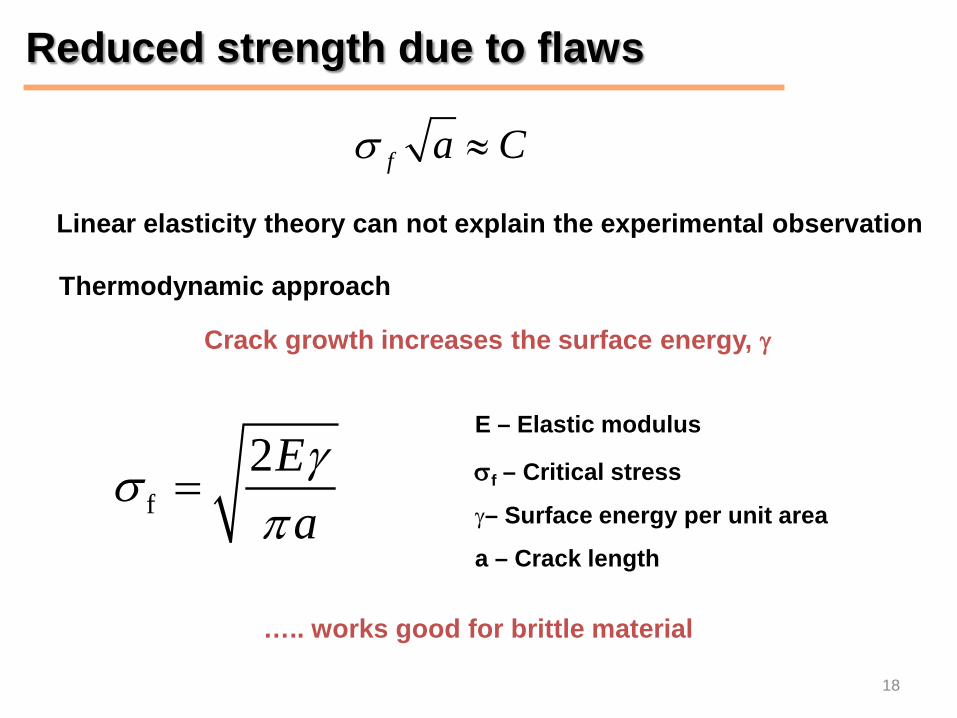
f a Cσ ≈
Linear elasticity theory can not explain the experimental observation
Crack growth increases the surface energy, γ
Thermodynamic approach
f2E
aγσ
π=
E – Elastic modulus
σf – Critical stress
γ– Surface energy per unit area
a – Crack length
….. works good for brittle material
Reduced strength due to flaws
19
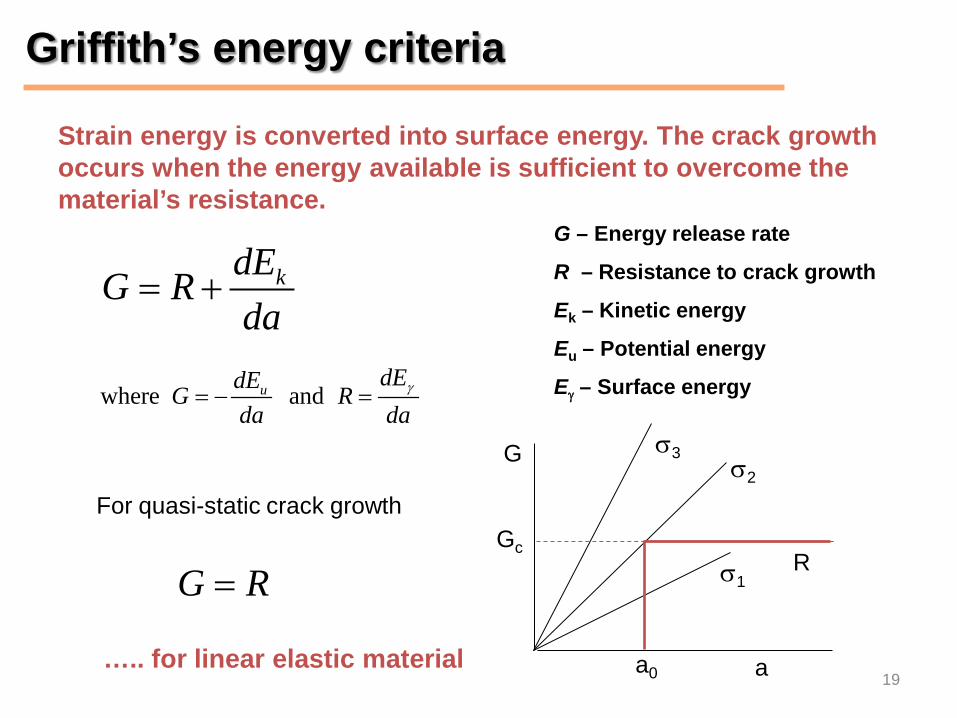
Strain energy is converted into surface energy. The crack growth occurs when the energy available is sufficient to overcome the material’s resistance.
kdEG Rda
= +
where andu dEdEG Rda da
γ= − =
G – Energy release rate
R – Resistance to crack growth
Ek – Kinetic energy
Eu – Potential energy
Eγ – Surface energy
G R=
For quasi-static crack growth
….. for linear elastic material
G
a a0
R σ1
σ2
σ3
Gc
Griffith’s energy criteria
20
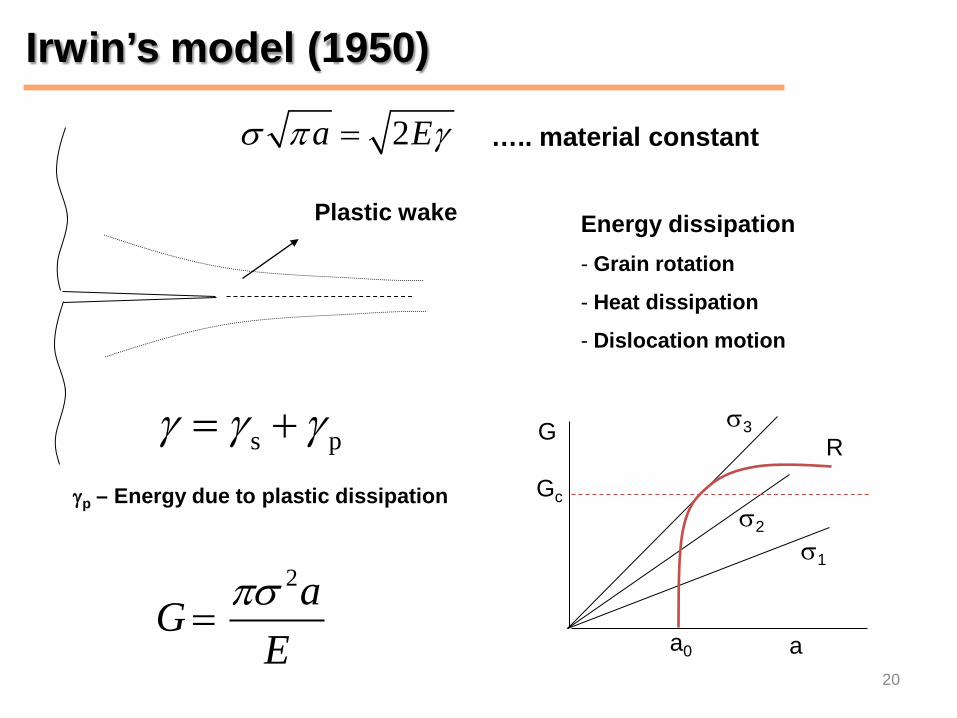
2a Eσ π γ=
s pγ γ γ= +
….. material constant
Plastic wake Energy dissipation - Grain rotation
- Heat dissipation
- Dislocation motion
γp – Energy due to plastic dissipation
G
a a0
R
σ1
σ2
σ3
Gc
2aGE
πσ=
Irwin’s model (1950)
21
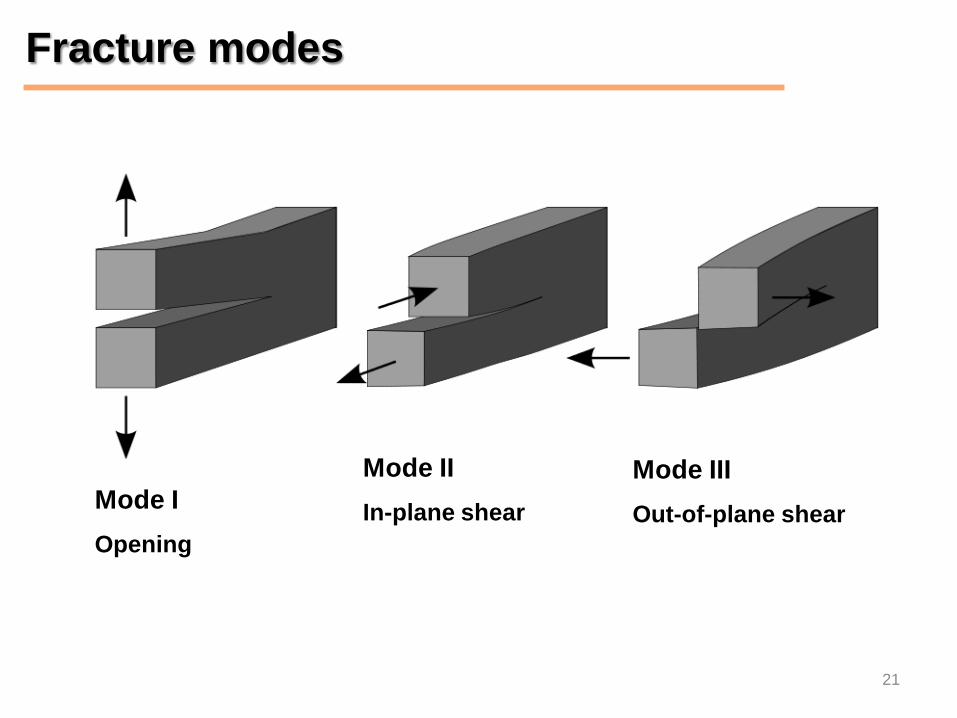
Mode II In-plane shear Mode I
Opening
Mode III Out-of-plane shear
Fracture modes
22
σyy
σxx
r θ
σxy
x
y
3cos 1 sin sin2 2 22
3cos 1 sin sin2 2 22
3cos sin sin2 2 22
Ixx
Iyy
Ixy
Kr
Kr
Kr
θ θ θσπ
θ θ θσπ
θ θ θσπ
= − = +
=
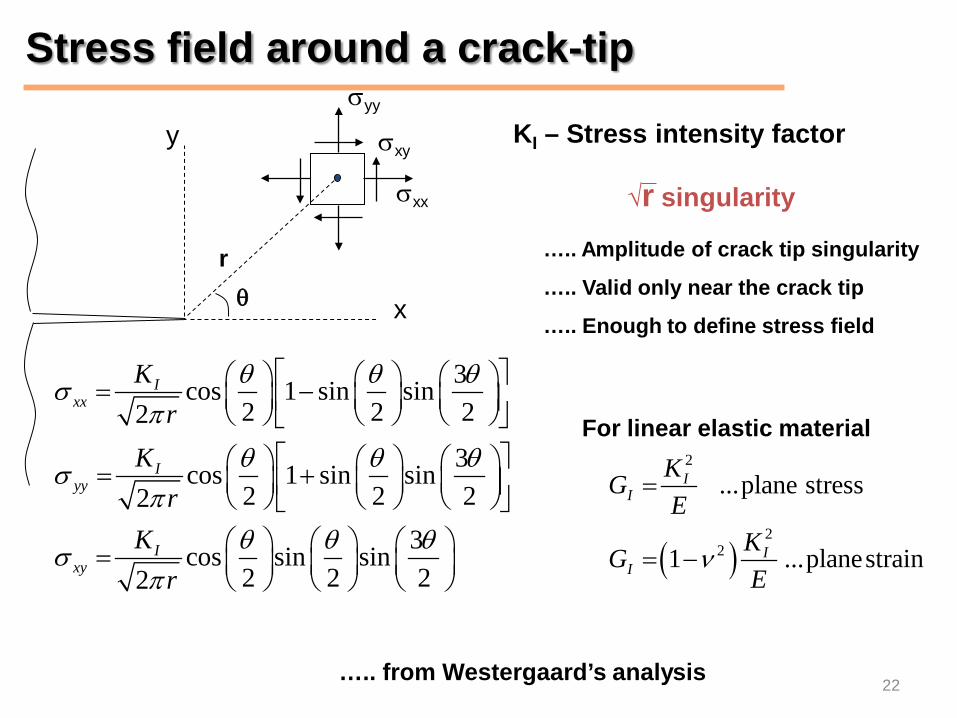
√r singularity
KI – Stress intensity factor
….. Amplitude of crack tip singularity
….. Valid only near the crack tip
….. Enough to define stress field
….. from Westergaard’s analysis
For linear elastic material
( )
2
22
...plane stress
1 ...planestrain
II
II
KGE
KGE
ν
=
= −
Stress field around a crack-tip
23
σyy
σxx
r θ
σxy
x
y
( )
( )
1 12 12 2
1 2 3 4
1 122 2
1 2 3
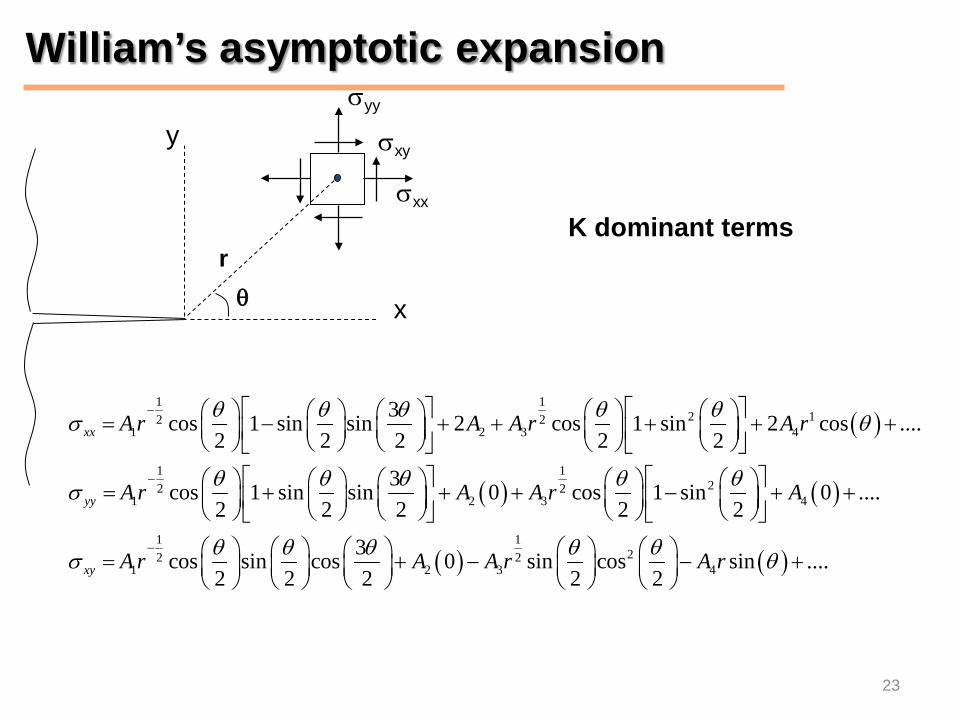
3cos 1 sin sin 2 cos 1 sin 2 cos ....2 2 2 2 2
3cos 1 sin sin 0 cos 1 sin2 2 2 2 2
xx
yy
A r A A r A r
A r A A r
θ θ θ θ θσ θ
θ θ θ θ θσ
−
−
= − + + + + + = + + + −
( )
( ) ( )
4
1 122 2
1 2 3 4
0 ....
3cos sin cos 0 sin cos sin ....2 2 2 2 2xy
A
A r A A r A rθ θ θ θ θσ θ−
+ +
= + − − +
K dominant terms
William’s asymptotic expansion
24
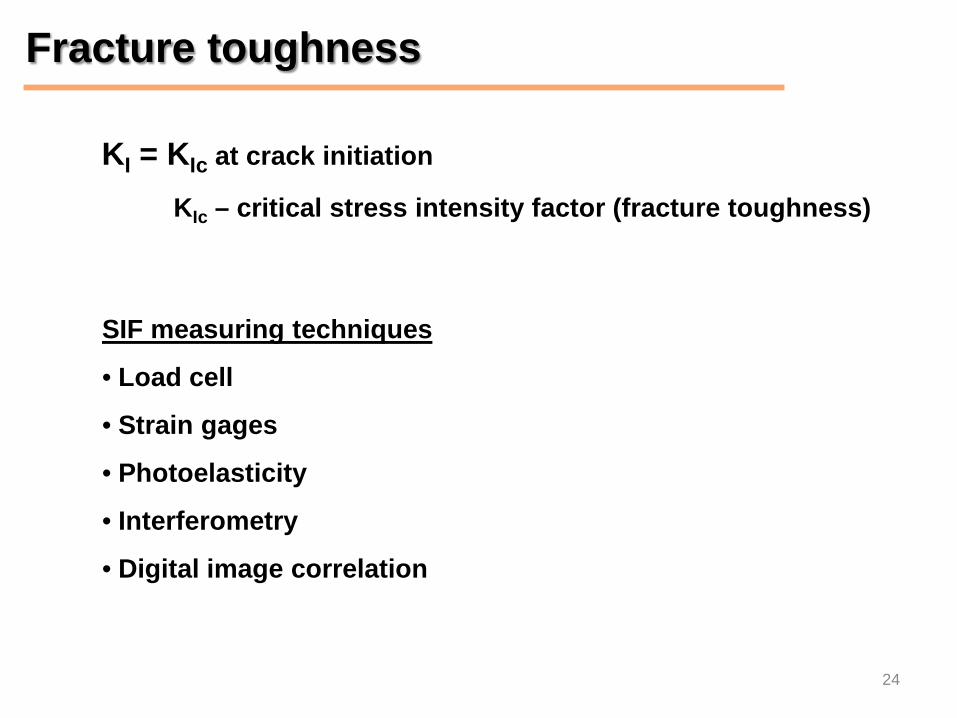
SIF measuring techniques
• Load cell
• Strain gages
• Photoelasticity
• Interferometry
• Digital image correlation
KI = KIc at crack initiation
KIc – critical stress intensity factor (fracture toughness)
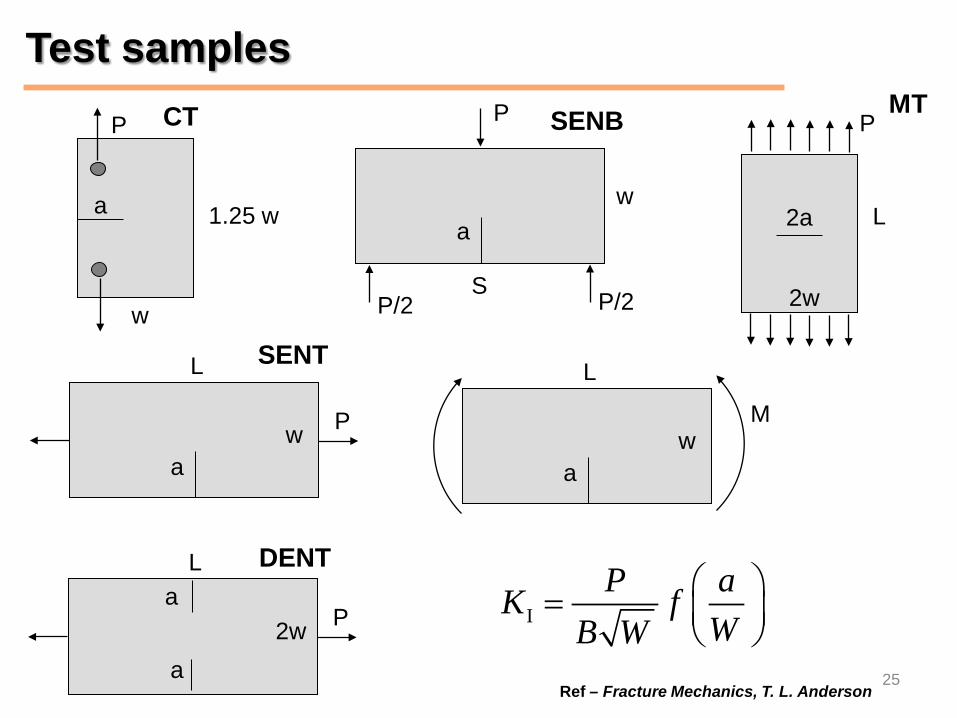
Fracture toughness
25
a
w
1.25 w
P
a w
P
P/2 P/2 S
L 2a
2w
P
a w P
L
a 2w P
L a
a w
M
L
Ref – Fracture Mechanics, T. L. Anderson
CT SENB MT
SENT
DENT
IP aK f
WB W =
Test samples
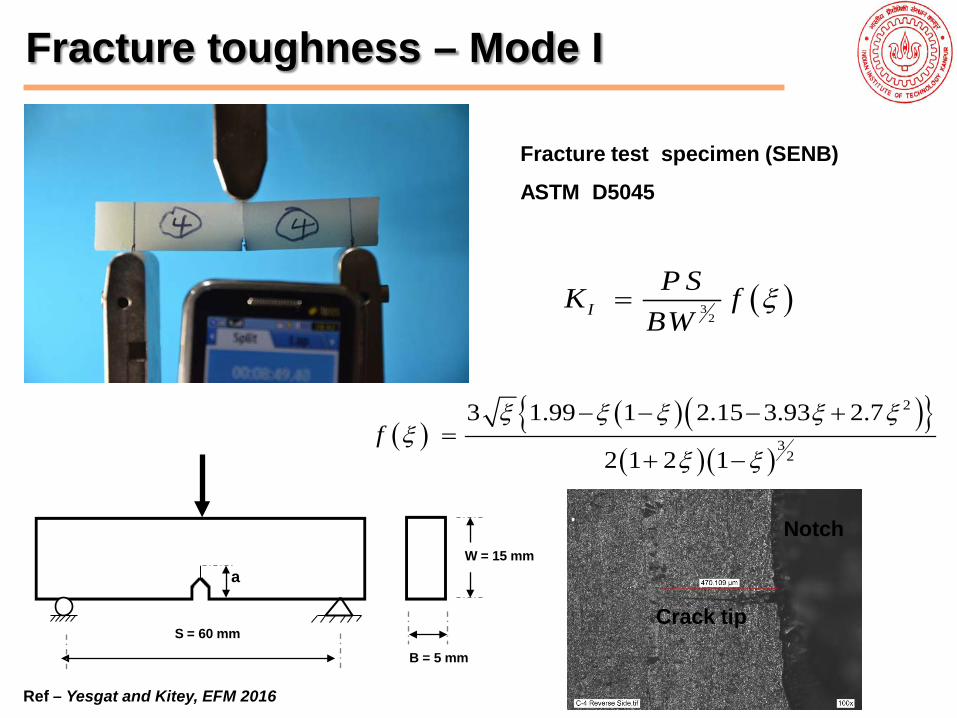
Fracture test specimen (SENB)
ASTM D5045
S = 60 mm
B = 5 mm
W = 15 mm a
( )32I
P SK fBW
ξ=
( )( )( ){ }( )( )
2
32
3 1.99 1 2.15 3.93 2.7
2 1 2 1f
ξ ξ ξ ξ ξξ
ξ ξ
− − − +=
+ −
Fracture toughness – Mode I
Notch
Crack tip
Ref – Yesgat and Kitey, EFM 2016
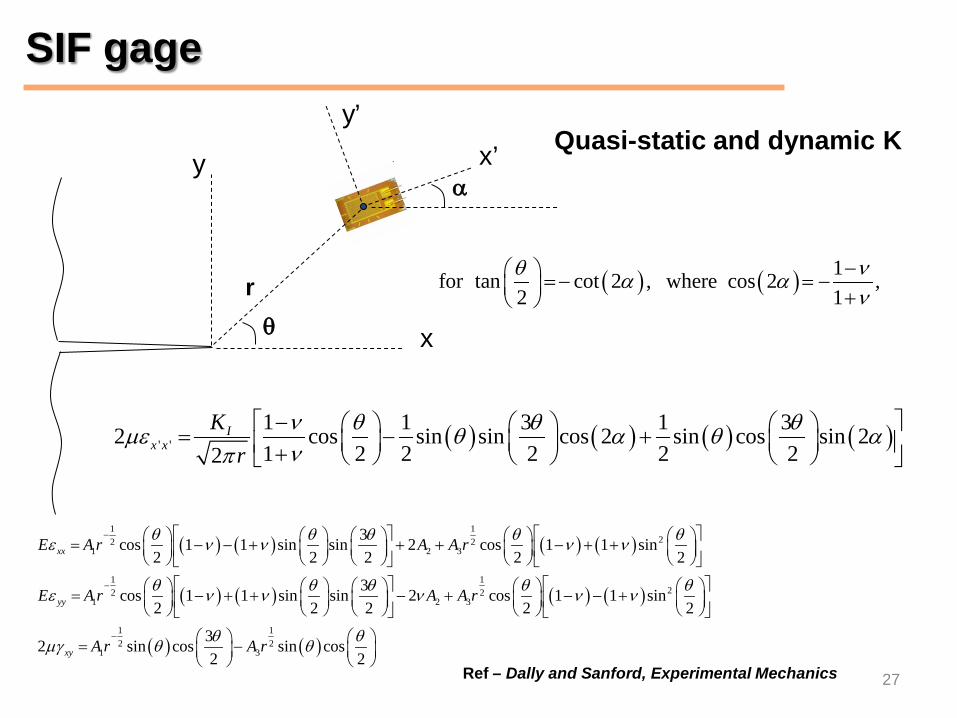
27 Ref – Dally and Sanford, Experimental Mechanics
( ) ( ) ( ) ( )
( ) ( ) ( ) ( )
1 122 2
1 2 3
1 122 2
1 2 3
3cos 1 1 sin sin 2 cos 1 1 sin2 2 2 2 2
3cos 1 1 sin sin 2 cos 1 1 sin2 2 2 2 2
xx
yy
E A r A A r
E A r A A r
θ θ θ θ θε ν ν ν ν
θ θ θ θ θε ν ν ν ν ν
−
−
= − − + + + − + + = − + + − + − − +
( ) ( )1 12 2
1 332 sin cos sin cos2 2xy A r A rθ θµγ θ θ
−
= −
( ) ( ) 1for tan cot 2 , where cos 2 ,2 1θ να α
ν− = − = − +
( ) ( ) ( ) ( )' '1 1 3 1 32 cos sin sin cos 2 sin cos sin 21 2 2 2 2 22
Ix x
Kr
ν θ θ θµε θ α θ ανπ
− = − + +
r θ x
y α
x’
y’ Quasi-static and dynamic K
SIF gage
28
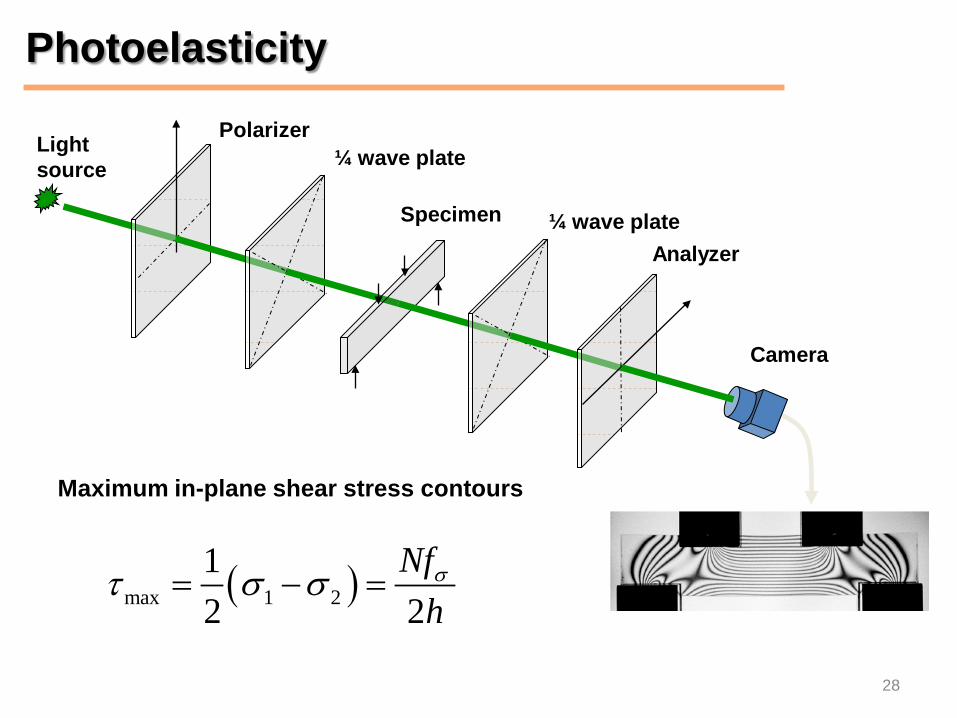
Polarizer
Analyzer
¼ wave plate
¼ wave plate Specimen
Light source
Camera
Maximum in-plane shear stress contours
( )max 1 212 2
Nfhστ σ σ= − =
Photoelasticity
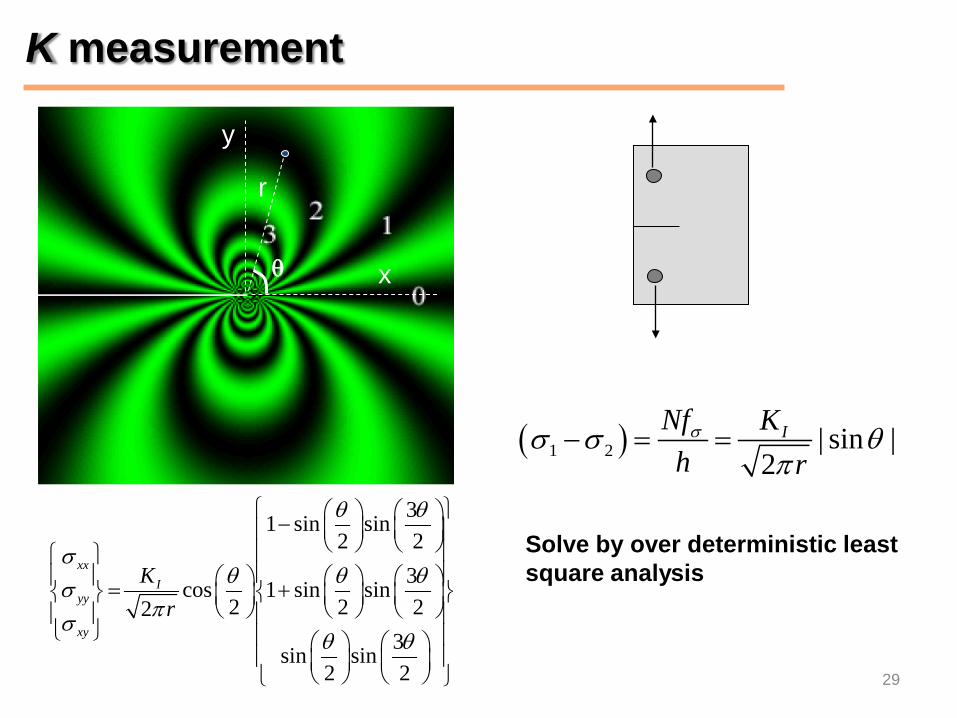
29
( )1 2 | sin |2
INf Kh r
σσ σ θπ
− = =
31 sin sin2 2
3cos 1 sin sin2 2 22
3sin sin2 2
xxI
yy
xy
Kr
θ θ
σθ θ θσ
πσθ θ
− = +
θ x
y
r
Solve by over deterministic least square analysis
K measurement
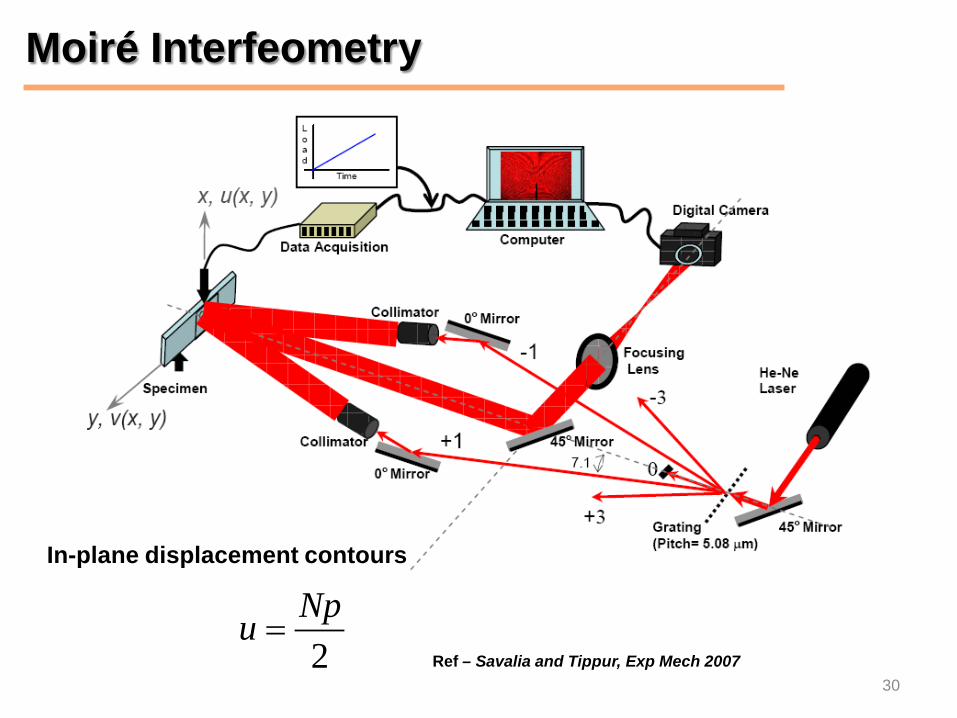
30
In-plane displacement contours
2Npu =
Moiré Interfeometry
Ref – Savalia and Tippur, Exp Mech 2007
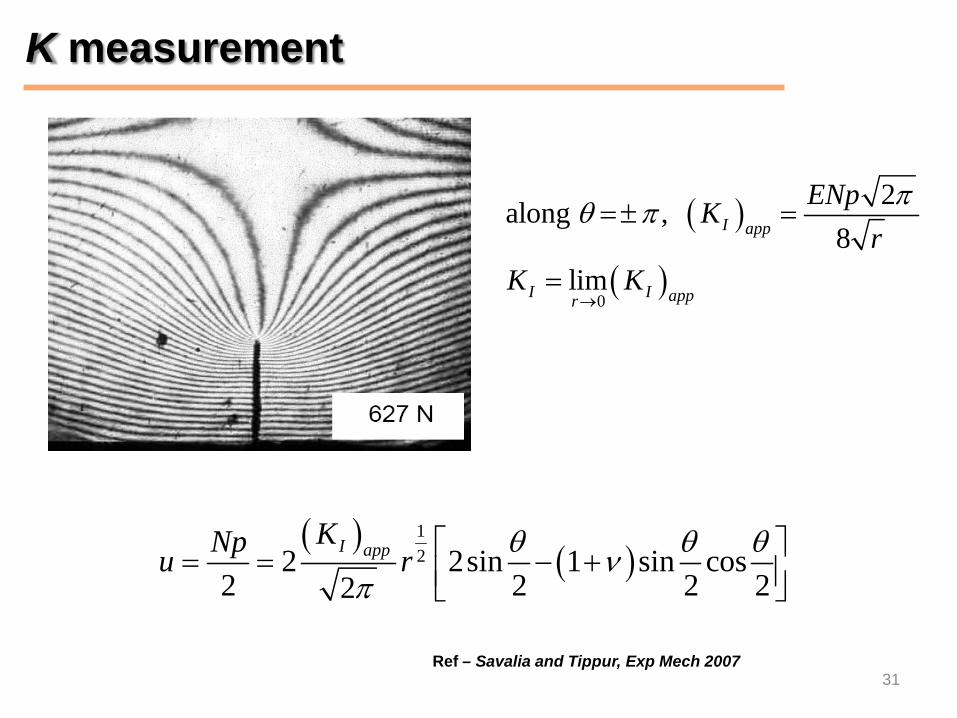
31
( )
( )0
2along ,8
lim
I app
I I appr
ENpKr
K K
πθ π
→
= ± =
=
( )( )
122 2sin 1 sin cos
2 2 2 22I app
KNpu r θ θ θνπ
= = − +
K measurement
Ref – Savalia and Tippur, Exp Mech 2007
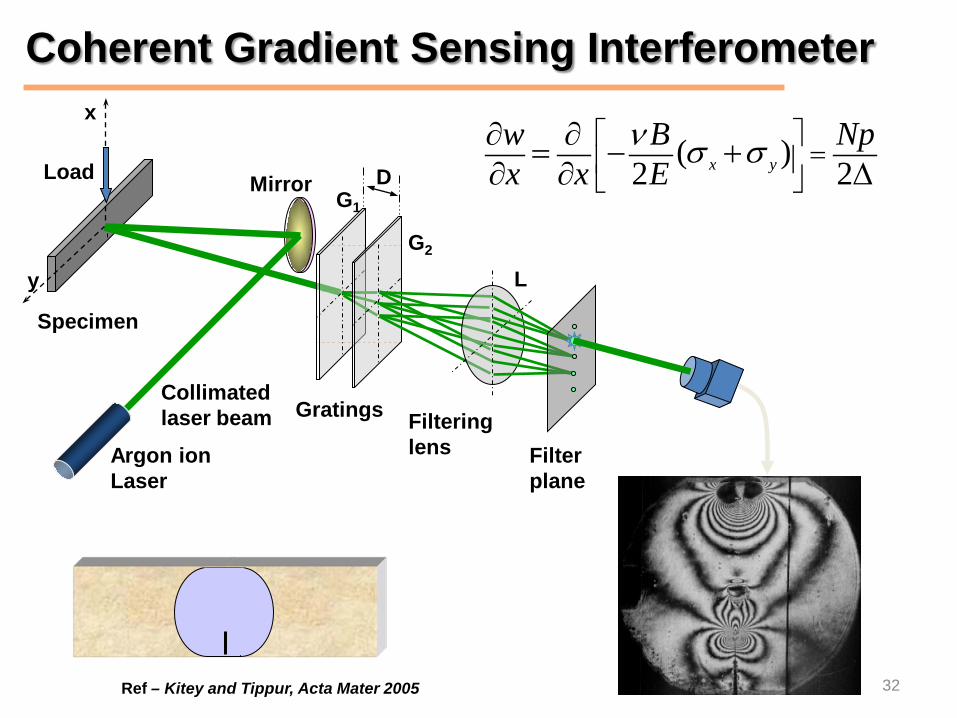
32
y
x
G1
G2
L
D
Specimen
Gratings Filtering lens Filter
plane
Collimated laser beam
Mirror Load
Argon ion Laser
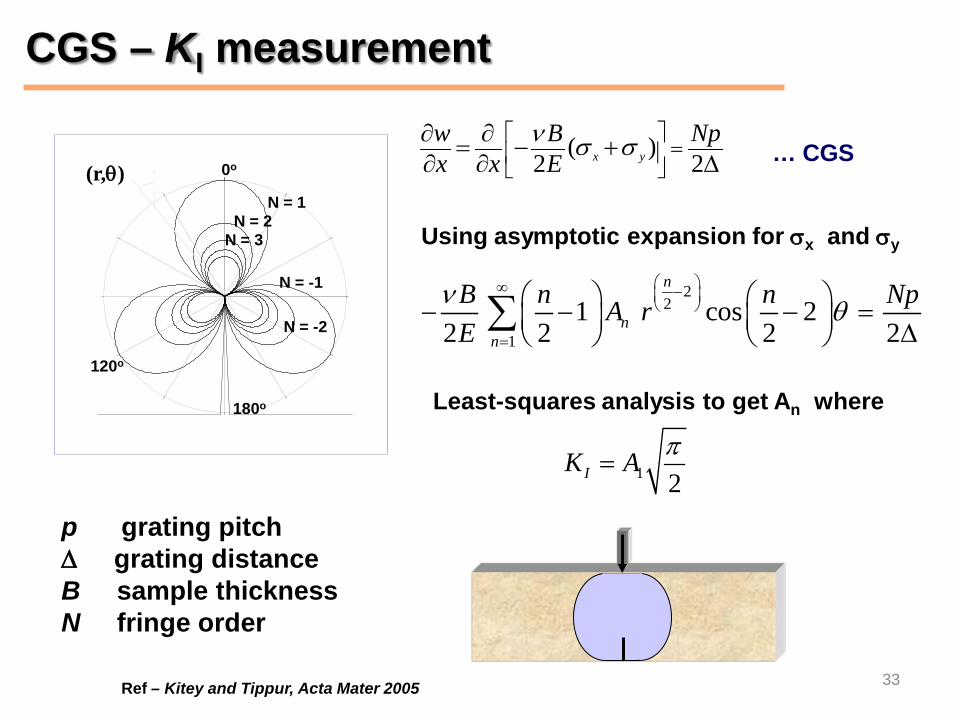
( )2 2x y
w B Npx x E
ν σ σ =
∂ ∂= − +∂ ∂ ∆
Coherent Gradient Sensing Interferometer
Ref – Kitey and Tippur, Acta Mater 2005
33
( )2 2x y
w B Npx x E
ν σ σ =
∂ ∂= − +∂ ∂ ∆
Using asymptotic expansion for σx and σy
Least-squares analysis to get An where
p grating pitch ∆ grating distance B sample thickness N fringe order
22
11 cos 2
2 2 2 2
n
nn
B n n NpA rE
ν θ ∞ −
=
− − − = ∆ ∑
1 2IK A π=
0 10
10
30
60
90
120
150
180
210
240
270
300
330
0o
180o
120o
N = 2 N = 1
N = -1
N = 3
N = -2
(r,θ) … CGS
CGS – KI measurement
Ref – Kitey and Tippur, Acta Mater 2005
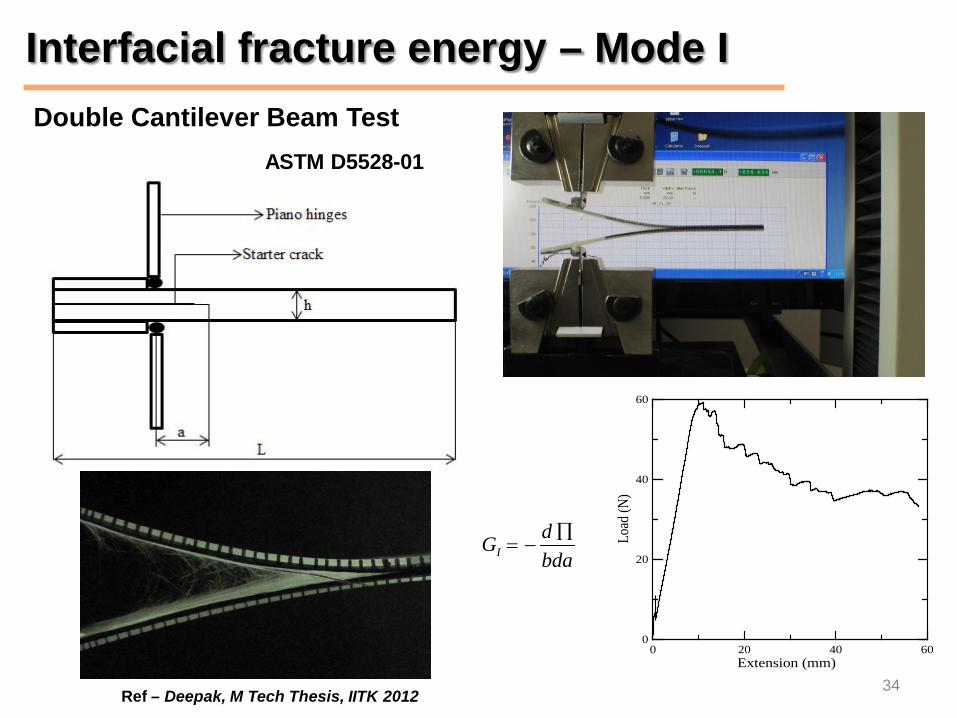
Double Cantilever Beam Test
34
Interfacial fracture energy – Mode I
0 20 40 60Extension (mm)
0
20
40
60
Load
(N)
IdGbda
∏= −
ASTM D5528-01
Ref – Deepak, M Tech Thesis, IITK 2012
35
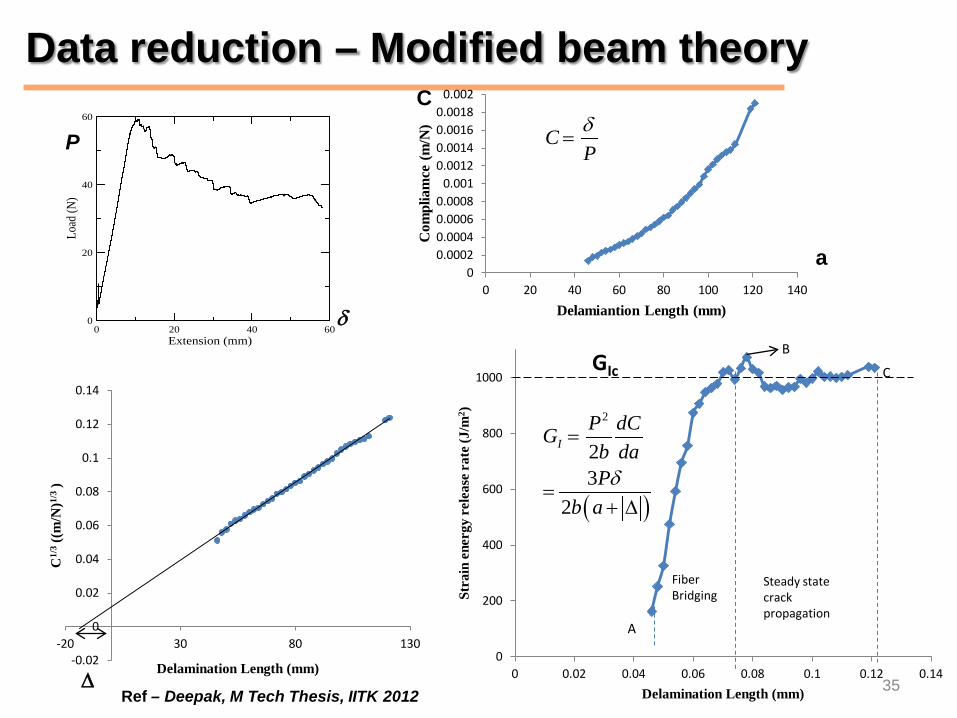
Data reduction – Modified beam theory
0 20 40 60Extension (mm)
0
20
40
60
Load
(N)
0 0.0002 0.0004 0.0006 0.0008
0.001 0.0012 0.0014 0.0016 0.0018
0.002
0 20 40 60 80 100 120 140
Com
plia
mce
(m/N
)
Delamiantion Length (mm)
-0.02
0
0.02
0.04
0.06
0.08
0.1
0.12
0.14
-20 30 80 130
C1/
3 ((m
/N)1/
3 )
Delamination Length (mm) 0
200
400
600
800
1000
0 0.02 0.04 0.06 0.08 0.1 0.12 0.14
Stra
in e
nerg
y re
leas
e rat
e (J/
m2 )
Delamination Length (mm)
A
B
C GIc
Fiber Bridging
Steady state crack propagation
P
δ
a
C
CPδ
=
∆
( )
2
23
2
IP dCGb daP
b aδ
=
=+ ∆
Ref – Deepak, M Tech Thesis, IITK 2012

36