compilation of best management practices to reduce total ... · this initiative takes place in and...
TRANSCRIPT
Compilation of Best Management Practices to Reduce Total Emissions
from Palm Oil Production
November 2018
29/11/2018

Contents List of Abbreviations ..................................................................................................................................................... 1 Executive Summary ...................................................................................................................................................... 4 Project Overview and Introduction .............................................................................................................................. 9
Background and objectives ....................................................................................................................................... 9 Management practices to reduce net greenhouse gas (GHG) emission within the palm oil sector.......................... 15
Plantation Establishment and Concession Management ....................................................................................... 22 Plantation Establishment .................................................................................................................................... 22 Yield Enhancement ............................................................................................................................................. 27 Improved Spatial Monitoring System ................................................................................................................. 32 Peatland management – water table management and fire prevention .......................................................... 37 Improved smallholder production ...................................................................................................................... 42 Integrated Pest Management ............................................................................................................................. 46 Fuel Use in Plantation ......................................................................................................................................... 48 Improved concession management through conservation and restoration ...................................................... 53
Mill Management ................................................................................................................................................... 61 Efficiency Improvements in CHP ......................................................................................................................... 63 Methane Capture and POME-to-Biogas Electricity ............................................................................................ 65 Co-Composting ................................................................................................................................................... 68 Solid-Liquid Separation ....................................................................................................................................... 70
Emerging and potential technologies for palm oil sector ...................................................................................... 75 Biomass Waste Utilization .................................................................................................................................. 75 Biogas Upgrading ................................................................................................................................................ 77 Advanced Biofuel Production from Palm Oil Waste ........................................................................................... 80
Case studies of Best Management Practices .............................................................................................................. 82 Case study 1: Peat rehabilitation at PT. AMNL, Sinarmas ...................................................................................... 85 Case study 2: Carbon stock assessments in Gabon, Olam Group .......................................................................... 86 Case study 3: Methane Capture at Terusan Mill, Wilmar International ................................................................ 87 Case study 4: Filter Belt Press, KLK Berhad ............................................................................................................ 89 Case study 5: Composting, Sime Darby .................................................................................................................. 90 Case study 6: SNV Indonesia work with palm oil smallholders .............................................................................. 91
Comparison of practices ............................................................................................................................................. 92 Concluding thoughts ................................................................................................................................................... 95 References .................................................................................................................................................................. 96 Appendix A. Summary of Best Management Practices ............................................................................................ 107 Appendix B. Guidance on evaluating appropriateness of mill BMPs ....................................................................... 112 Annexes: Detailed Case Studies ................................................................................................................................ 116
Case study 1: Peat Rehabilitation Program and other Best Management Practices to Reduce GHG Emissions of Golden Agri Resources .......................................................................................................................................... 116 Case study 2: Improved Plantation Establishment through exclusion of High Carbon Stock Forests - Olam Palm Gabon ................................................................................................................................................................... 126 Case study 3: Reducing GHG Emissions through POME Methane Capture in Terusan Mill, Sabah, Malaysia ..... 133 Case study 4: Reducing GHG Emission through Filter Belt-Press Systems within Palm Oil Mill – Kuala Lumpur Kepong .................................................................................................................................................................. 142 Case study 5: Reducing GHG Emissions through Co-composting and Methane Capture, Sime Darby ................ 147
Report can be cited as: Walker, SM, A McMurray, F Rinaldy, K Brown, and D Karsiwulan. 2018. Compilation of
Best Management Practices to Reduce Total Emissions from Palm Oil Production. Winrock International. Report
to: Roundtable on Sustainable Palm Oil (RSPO)

Compilation of BMPs to Reduce Emissions in Palm Oil Production Abbreviations 1
List of Abbreviations AGB Aboveground Biomass
BMP Best Management Practice
bio-CNG Bio-Compressed Natural Gas
bio-LNG Bio-Liquefied Natural Gas
BOD Biological Oxygen Demand
BRG Indonesia Peat Restoration Agency
C Carbon
CA Catalytic Absorption/ Amine Wash
CER Certified Emission Reduction
CDM Clean Development Mechanism
CDP Carbon Disclosure Project
CH4 Methane
CHP Combined Heat and Power
CIGAR Covered In-Ground Anaerobic Reactor
CIRAD The French Agricultural Research Centre for International Development
CL Cryogenic Liquefaction
CNG Compressed Natural Gas
CO2 Carbon Dioxide
CO2e Carbon Dioxide Equivalent
COD Chemical Oxygen Demand
CPO Crude Palm Oil
CSTR Continuous Stirred Tank Reactor
DEM Digital Elevation Model
DTM Digital Terrain Model
EFB Empty Fruit Bunch
EPC Engineering, Procurement, and Construction
ERPA Emission Reduction Purchase Agreement
ERWG Emission Reduction Working Group
ESIA Environment and Social Impact Assessment
EU European Union
EUR Euro
FBP Filter Belt-Press
FFB Fresh Fruit Bunch
FIRMS Fire Information for Resource Management System
FiT Feed-in-Tariffs
FPIC Free Prior and Informed Consent
GAP Good Agricultural Practices
GAR Golden Agri Resources
GHG Greenhouse Gases
GRI Global Reporting Initiative
GWh Gigawatt hour
Ha Hectares
HCS High Carbon Stock
HCV High Conservation Value
ICE Internal Combustion Engine
IGAD Institut Gabonais d'aide au Developpement
IOI IOI Corporation Berhad
Compilation of BMPs to Reduce Emissions in Palm Oil Production Abbreviations 2
IOPRI Indonesian Oil Palm Research Institute
INCAS Indonesian Carbon Accounting System
IPM Integrated Pest Management
IPNI International Plant Nutrition Institute
ISCC International Sustainability and Carbon Certification
ISPO Indonesia Sustainable Palm Oil
IT Information Technology
JV Joint Venture
KADIN Indonesian Chamber of Commerce
KLK Kuala Lumpur Kepong Berhad
LIDAR Light Detection and Ranging
LNG Liquified Natural Gas
LUCF Land Use Change and Forestry
MEC Malaysia Environmental Consultants
MPOB Malaysian Palm Oil Board
MT Metric Ton
MYR Malaysian Ringgit
MS Membrane Separation
MWe Megawatt Electrical
MWh Megawatt hour
N Nitrogen
N2O Nitrous Dioxide
NaOH Sodium Hydroxide
NDPE No Deforestation, No Peat, No Exploitation
NDVI Normalized Difference Vegetation Index
Nm Nanometer
O&M Operations and Maintenance
PFAD Palm Oil Acid Distillate
PISAgro Partnership for Sustainable Indonesian Agriculture
PK Palm Kernel
PKE Palm Kernel Expeller
PKO Palm Kernel Oil
PO Palm Oil
POM Palm Oil Mill
POME Palm Oil Mill Effluent
PSA Pressure Swing Absorption
PT AMNL Agro Lestari Mandiri
PT SMART Tbk PT Sinar Mas Agro Resources and Technology Tbk
PWS Pressurized Water Scrubbing
S&P Standard & Poor’s
SDP Sime Darby Plantation
SDG Sustainable Development Goals
SOP Standard Operating Procedures
STI Straits Times Index
t Tonnes
Tph Ton per Hour
RSPO Roundtable Sustainable Palm Oil
R&D Research and Development

Compilation of BMPs to Reduce Emissions in Palm Oil Production Abbreviations 3
ROI Return on Investment
UAV Unmanned Aerial Vehicle
UN United Nations
UNGC United Nations Global Compact
USD US Dollars
WRI World Resource Institute

Compilation of BMPs to Reduce Emissions in Palm Oil Production Executive Summary 4
Executive Summary A commitment toward improving sustainability and reducing greenhouse gas emissions has continued to expand
across the palm oil industry. A large range of new and improved management practices that result in emission
reductions are emerging and being adopted by many companies. To help the overall palm oil industry evaluate
what potential practices can be put in place and the magnitude of GHG emission reductions, the Roundtable on
Sustainable Palm Oil (RSPO) and Winrock International have collaborated to develop a compilation of best
management practices (BMP). Practices examined include those during Plantation Establishment, Concession
Management and Mill Management (Table 1). Each BMP identified was evaluated against three criteria: financial
feasibility, technical and operational challenges, GHG reduction potential, and technical and operational challenges,
environmental and social co-benefits, and replicability.
Table 1. Best Management Practices assessed in this study.
Category Description
Plantation Establishment and Concession Management
Improved Plantation Location Establishment
- High Carbon Stock Approach No deforestation commitments
- Zero burning techniques - Expansion on degraded lands
Yield enhancement - Improved seeds and varieties/ certified seeds - Improved fertilizer management
Improved spatial monitoring system - Use of remote sensing technologies to improve
plantation management, fire prevention, and yield enhancement
Improved smallholder management - Improved management practices resulting in
increased productivity and thus reduced GHG intensity
Peat management - Improved water table management within
plantation and entire land holdings
Pest management - Integrated pest and weed management
Plantation Fuel Usage - Alternative fuels for transportation and machinery - Reuse of biogas from POME for transportation
Improved Concession Management through conservation and restoration
- After-use planning after the plantation cycle - Ecosystem restoration from conservation areas,
degraded lands, biodiversity corridors - Expanded use of buffer zones (around rivers, etc.) - Phasing out some areas of production
Mill Management
Efficiency Improvements - Cogeneration or combined heat and power
efficiency improvements
Methane Capture - Methane capture for biogas electricity or
transportation
Co-composting - Creation of organic fertilizer from EFBs and POME
Solid Filtrate Separation - POME treatment
Innovative Technologies
Biomass Waste Utilization - Use of by-products, particularly biomass waste,
such as empty fruit bunches (EFBs)
Compilation of BMPs to Reduce Emissions in Palm Oil Production Executive Summary 5
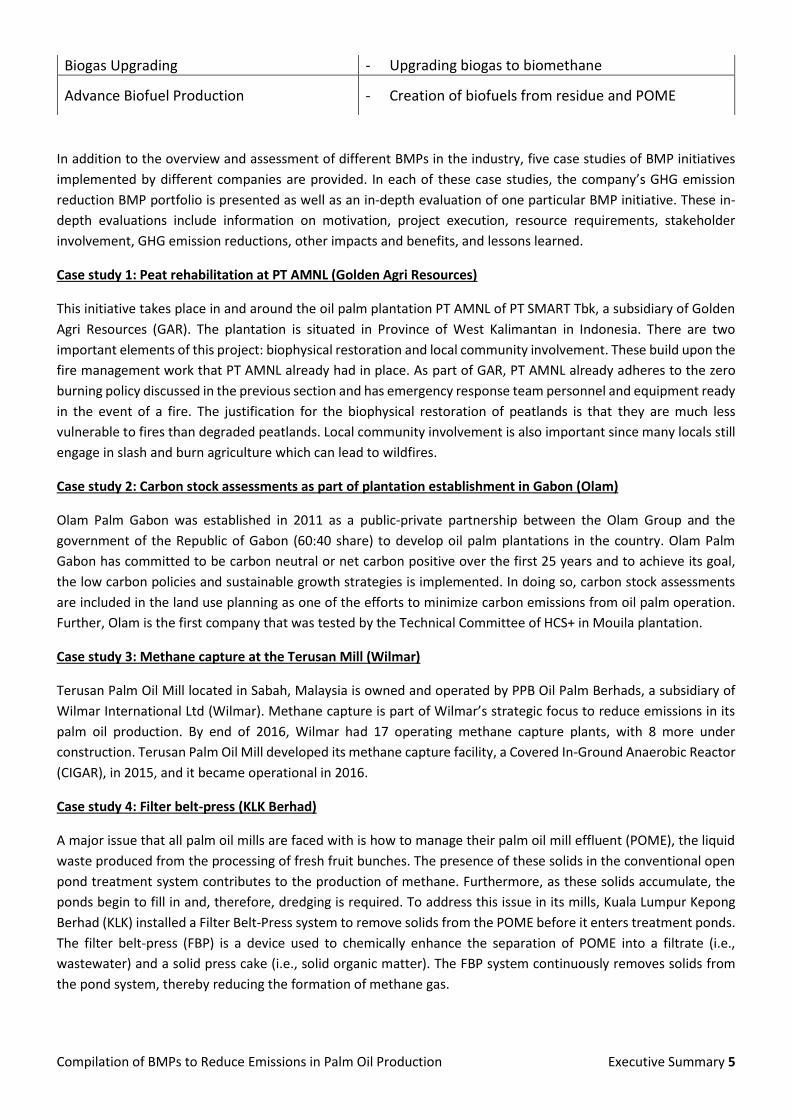
In addition to the overview and assessment of different BMPs in the industry, five case studies of BMP initiatives
implemented by different companies are provided. In each of these case studies, the company’s GHG emission
reduction BMP portfolio is presented as well as an in-depth evaluation of one particular BMP initiative. These in-
depth evaluations include information on motivation, project execution, resource requirements, stakeholder
involvement, GHG emission reductions, other impacts and benefits, and lessons learned.
Case study 1: Peat rehabilitation at PT AMNL (Golden Agri Resources)
This initiative takes place in and around the oil palm plantation PT AMNL of PT SMART Tbk, a subsidiary of Golden
Agri Resources (GAR). The plantation is situated in Province of West Kalimantan in Indonesia. There are two
important elements of this project: biophysical restoration and local community involvement. These build upon the
fire management work that PT AMNL already had in place. As part of GAR, PT AMNL already adheres to the zero
burning policy discussed in the previous section and has emergency response team personnel and equipment ready
in the event of a fire. The justification for the biophysical restoration of peatlands is that they are much less
vulnerable to fires than degraded peatlands. Local community involvement is also important since many locals still
engage in slash and burn agriculture which can lead to wildfires.
Case study 2: Carbon stock assessments as part of plantation establishment in Gabon (Olam)
Olam Palm Gabon was established in 2011 as a public-private partnership between the Olam Group and the
government of the Republic of Gabon (60:40 share) to develop oil palm plantations in the country. Olam Palm
Gabon has committed to be carbon neutral or net carbon positive over the first 25 years and to achieve its goal,
the low carbon policies and sustainable growth strategies is implemented. In doing so, carbon stock assessments
are included in the land use planning as one of the efforts to minimize carbon emissions from oil palm operation.
Further, Olam is the first company that was tested by the Technical Committee of HCS+ in Mouila plantation.
Case study 3: Methane capture at the Terusan Mill (Wilmar)
Terusan Palm Oil Mill located in Sabah, Malaysia is owned and operated by PPB Oil Palm Berhads, a subsidiary of
Wilmar International Ltd (Wilmar). Methane capture is part of Wilmar’s strategic focus to reduce emissions in its
palm oil production. By end of 2016, Wilmar had 17 operating methane capture plants, with 8 more under
construction. Terusan Palm Oil Mill developed its methane capture facility, a Covered In-Ground Anaerobic Reactor
(CIGAR), in 2015, and it became operational in 2016.
Case study 4: Filter belt-press (KLK Berhad)
A major issue that all palm oil mills are faced with is how to manage their palm oil mill effluent (POME), the liquid
waste produced from the processing of fresh fruit bunches. The presence of these solids in the conventional open
pond treatment system contributes to the production of methane. Furthermore, as these solids accumulate, the
ponds begin to fill in and, therefore, dredging is required. To address this issue in its mills, Kuala Lumpur Kepong
Berhad (KLK) installed a Filter Belt-Press system to remove solids from the POME before it enters treatment ponds.
The filter belt-press (FBP) is a device used to chemically enhance the separation of POME into a filtrate (i.e.,
wastewater) and a solid press cake (i.e., solid organic matter). The FBP system continuously removes solids from
the pond system, thereby reducing the formation of methane gas.
Biogas Upgrading - Upgrading biogas to biomethane
Advance Biofuel Production - Creation of biofuels from residue and POME
Compilation of BMPs to Reduce Emissions in Palm Oil Production Executive Summary 6
Case study 5: Co-composting (Sime Darby)
Sime Darby Plantations is currently implementing initiatives on methane avoidance through composting. Sime
Darby Plantation began piloting composting as a mill waste management initiative in 2004 initially with 5 plants, of
which 4 were registered under the Clean Development Mechanism under the Kyoto Protocol. These 4 projects
continue to be in operation as part of Sime Darby’s Carbon Reduction Strategy, along with 18 other composting
plants constructed since 2010, making up a total of 22 compost plants that produce about 500,000 mt of compost
per year. The composting system uses a combination of mechanical and biological methods to convert POME and
EFB, boiler ash, and decanter cake into organic fertilizer.
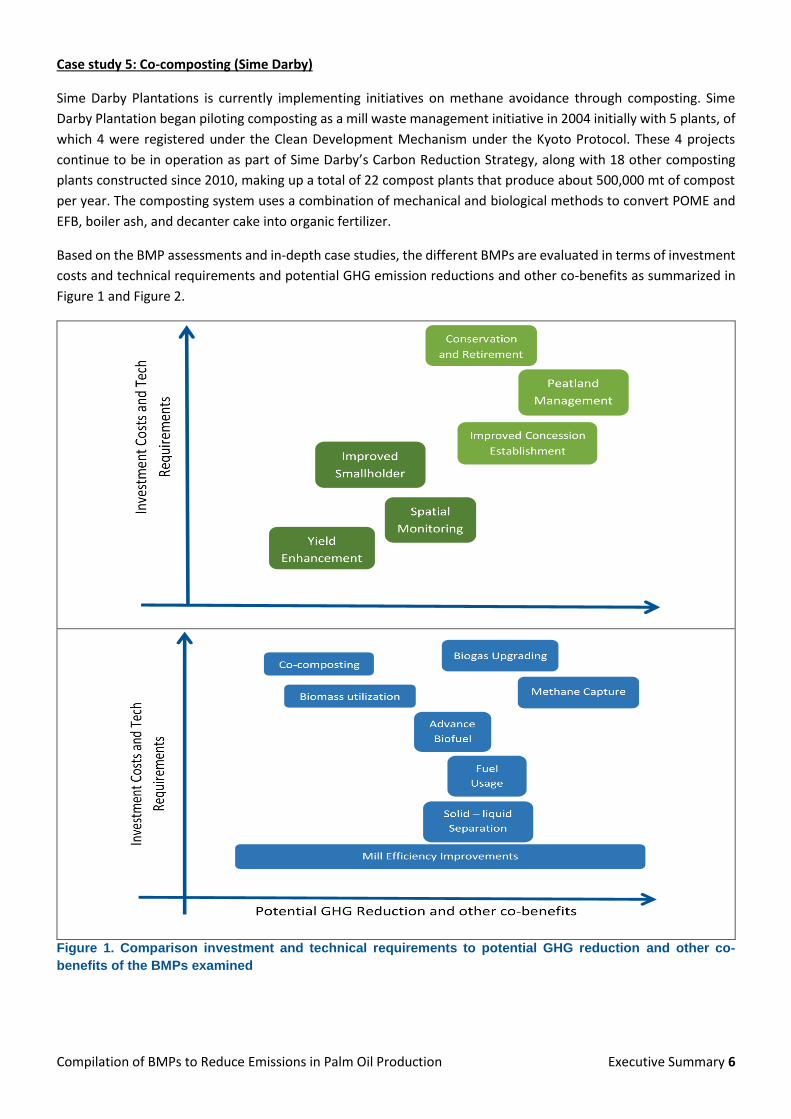
Based on the BMP assessments and in-depth case studies, the different BMPs are evaluated in terms of investment
costs and technical requirements and potential GHG emission reductions and other co-benefits as summarized in
Figure 1 and Figure 2.
Figure 1. Comparison investment and technical requirements to potential GHG reduction and other co-
benefits of the BMPs examined

Compilation of BMPs to Reduce Emissions in Palm Oil Production Executive Summary 7
Figure 2. Summary of main considerations for each BMP examined
The assessment found that several of the plantation BMPs, such as improved smallholder production and remote
sensing approaches to improve management, would result in increased yield per hectare thereby improving the
GHG efficiency of the final palm oil product. Since yields increased, the return on investment of implementing these
types of BMPs is expected to be high. Other plantation BMPs focus on establishing plantations in areas determined
to have high carbon stocks (HCS) or high conservation values (HCV). While these approaches have direct financial
implications, many companies have committed to implementing them regardless in order to comply with their
sustainability policies. The action with the most significant GHG emission reduction potential on plantations grown
on peatlands would be to either retire the area, or to improve the water table management resulting in reduced
annual emissions. Additional piloting and research are needed to identify cost-effective water table management
and to evaluate yield impacts.
At the mill level, methane capture offers the highest emission reduction potential. Although the initial investments
can be high, installation costs can be recouped relatively rapidly. The technology behind solid-liquid separation
techniques has recently advanced beyond the pilot stage, and thus offers a very attractive option, especially in
locations where the space for methane capture is less available. Co-composting and biomass utilization offer
relatively cheaper investment cost with considerable environmental and social co-benefits. Emerging technologies

Compilation of BMPs to Reduce Emissions in Palm Oil Production Executive Summary 8
such as biogas upgrading and advance biofuel production can be the most appropriate option for companies
focused on reducing fossil fuel consumption in plantation and mill, although these technologies require high
investment costs.
Although the exact costs, emission reductions, co-benefits and challenges will depend on location specific
circumstances, a wide range of proven practices are available to the palm oil production community. Using the
guidance provided in this report, it is hoped that companies can focus their selection of practices that are most
likely to fit their needs. This in turn supports companies in meeting the RSPO principles and criteria and ultimately
in helping to mitigate the threat of global climate change by reducing greenhouse gas emissions.

Compilation of BMPs to Reduce Emissions in Palm Oil Production Project Overview and Introduction 9
Project Overview and Introduction
Background and objectives The exceptional versatility, stability, and productivity of palm oil has led to its use in an ever-expanding variety of
foods, cosmetics and biofuels. Its consumption has grown dramatically over the past few decades, and in 2016
made up nearly 60% of total vegetable consumption worldwide. Cultivation and processing of palm fruit has raced
to meet the soaring demand, with Indonesia and Malaysia accounting for 86% of the world’s supply. As in other
commodity production, activities along the palm oil supply chain, such as the land preparation, production and
processing will result in the emissions of greenhouse gases (GHGs), contributing to global climate change.
However, there are many management decisions that can be taken to lower the impact of palm oil production and
increase its sustainability. The Roundtable on Sustainable Palm Oil (RSPO) was established in 2004 to promote the
growth and use of sustainable palm products through credible global standards and the engagement of
stakeholders. Through certification and the dissemination of information on advancements in oil palm cultivation,
processing, and distribution, the RSPO has worked to lower negative environmental and social impacts of this
globally vital commodity.
RSPO maintains a set of principles and criteria by which they hold their members to, which includes Plans to reduce
pollution and emissions, including greenhouse gases, are developed, implemented and monitored; and New
plantation developments are designed to minimizes net greenhouse gas emissions. Many companies have already
put in place practices and technologies to reduce GHG emissions and their environmental footprint, while others
are still exploring what interventions can best help them balance financial constraints with standards and goals for
environmental and social sustainability.
The RSPO Executive Board established a Greenhouse Gas Working Group (GHG-WG 1) in November 2008 that was
charged with reviewing relevant information on palm oil production and GHG emissions. The decisions to convene
this commission grew out of an ongoing and still unresolved debate as to the dimensions of GHG emissions from
the palm oil supply chain and the need to respond to existing text within in the RSPO Principles and Criteria
regarding efforts to reduce GHG emissions. Looking at the positive recommendations coming from GHG-WG 1, the
Executive Board convened a second GHG-WG (GHG-WG 2) to address issues of public policy and business strategies,
in order to develop a process that will lead to meaningful and verifiable reductions in GHG emissions from the palm
oil supply chain.
Then at RT-11 in 2013, the Emission Reduction Working Group (ERWG) was established to support and oversee the
successful implementation of Criterion 5.6 and Criterion 7.8 of the RSPO Principles & Criteria 2013 until the
implementation phase which ended on 31st December 2016. Looking at the need for continuous support from
ERWG with the expanded scope of works in relations to Criterion 5.6 and Criterion 7.8, the working group then
continued until 31st December 2017.
During this period, the ERWG has identified key sources of emission from palm oil production and identified the
need to have guidelines on best practices to help growers to reduce GHG emissions in their operation.
Winrock International, a global non-profit that works to empower the disadvantaged, increase economic
opportunity, and sustain natural resources, was identified as the service provider to conduct literature research to
come out with best management practices (BMPs) that are practical and cost effective and suggest these as options
available for the growers (implementation by big and small size growers). This report is the final product of the
literature review.

Compilation of BMPs to Reduce Emissions in Palm Oil Production Project Overview and Introduction 10
The practices identified were evaluated against a consistent set of criteria: GHG reduction potential, financial
considerations, environmental and social co-benefits, technical challenges, and replicability. In addition, five in-
depth case studies on BMP practices that certain companies are implementing are also provided. It is hoped that
companies can use the report to assess what BMPs may fit best with their goals and circumstances and thus aims
to help companies in meeting the relevant RSPO principles and criteria.
GHG emissions occur at various stages of palm oil production (Figure 3), and there is the potential for GHG efficiency
improvements at each stage. Here GHG sources and sinks at both the plantation and the mill are examined, which
can be broken down by the production stages of site preparation; plantation management; agricultural input
production; transport of fresh fruit bunches; and processing of fruit bunches in the mill. Emissions occurring farther
down the supply chain are not included in this assessment. Additionally, investments in offset programs to reduce
emissions outside of a company’s direct operations are considered, such as programs to prevent conversions of
natural forests or restore degraded peatlands outside of the company’s concession.
Figure 3. Overview of GHG emissions in different stages of palm oil production (modified from Figure 2 of
Eco-Ideal Consulting Sdn. Bhd (2013))
Note: The boundary of RSPO’S Principle and Criteria certification only includes the plantation and milling stage.
The production of agricultural commodities, including vegetable oils like palm oil, plays a key role in global economic
growth. In 2014, the global market size for palm oil was estimated to be USD 57.56 billion1. The frequent side effects
of these economic benefits are the negative environmental impacts, such as greenhouse gas emissions leading to
climate change. The magnitude of the negative impacts, however, vary by crop. In one study, life cycle assessments
were performed to assess the environmental impacts of five vegetable oils: palm oil, rapeseed oil, soybean oil,
sunflower oil, and peanut oil (Muñoz, et al, 2014). More specifically, it looked at greenhouse gas emissions, water
use, and land occupation. As Figure 4 shows, rapeseed oil and sunflower oil production has the lowest greenhouse
1 https://www.grandviewresearch.com/industry-analysis/palm-oil-market.

Compilation of BMPs to Reduce Emissions in Palm Oil Production Project Overview and Introduction 11
gas emissions, followed by palm oil and soybean oil production. Peanut oil production has the highest emissions of
the five oils analyzed.
Figure 4. Greenhouse gas emissions from the productions of different vegetable oil (Modified from Figure 3
in Muñoz et al (2014))
With regards to palm oil emissions estimates, the study found that a major source of uncertainty is the portion of
oil palm grown on peat soils and what emission factors are applied to peat soils. Palm oil emissions are closer to
rapeseed oil emissions when the portion of cultivation that occurs on peat is small.
Palm oil production has received particular scrutiny due to its association with tropical deforestation, which leads
to a host of environment impacts like greenhouse gas emissions. A 2014 study published by the Center for Global
Development looked at the relationship between four commodities (beef, soybeans, palm oil, and wood products)
and deforestation and the resulting GHG emissions in eight countries: Argentina, Bolivia, Brazil, Paraguay,
Democratic Republic of the Congo, Indonesia, Malaysia, and Papua New Guinea from 2000 to 2009 (Persson et al,
2014). Of these countries analyzed, only three (Indonesia, Malaysia, and Papua New Guinea) were selected to
assess the relationship between deforestation and palm oil production.
While the primary goal of this paper was to understand how global supply chains link consumption of different
agricultural and forest commodities to deforestation, it provided estimates of total production (in tons) and total
CO2 emissions resulting from deforestation in 2009, which allowed us to come up with comparable CO2 emissions
per ton of the commodity produced during that year. Table 2 presents the emissions intensity for each ton of
commodity produced2. It shows that palm oil has a much lower emission intensity value than beef, pulp and paper,
and other wood products, whereas its emissions are slightly greater to those of soybeans.
Table 2. GHG emissions intensity for five agricultural and forest commodities in eight countries3
Commodity CO2 emissions per ton of commodity produced in 2009
Palm oil 1.7
Beef 56.0
Soybeans 1.4
Pulp & paper 45.9
2 These numbers were calculated by aggregating the country values provided in Table 1 of Persson et al (2014).
3 Ibid.

Compilation of BMPs to Reduce Emissions in Palm Oil Production Project Overview and Introduction 12
Commodity CO2 emissions per ton of commodity produced in 2009
Wood products 16.5
In 2009, RSPO commissioned an extensive literature review, carried out by Brinkman consultancy, to assess
greenhouse gas emissions in palm oil production (Brinkmann Consultancy, 2009). Table 3 provides a breakdown of
each emission source during the production process and the estimated emissions. Based on this analysis, estimated
emissions per ton of CPO produced at various stages of production had an extremely large range - from 3,930 to
30,240 kg CO2e. A 2017 study provided another review of GHG emissions from palm oil production, using the RSPO
PalmGHG calculator, with the goal of identifying emission hotspots (Gan & Cai, 2017). As the final column of Table
3 shows, the analyses from this study showed a range from +21 to +8,881 kg CO2e per ton of CPO produced. The
differences in the results of the two studies are most likely the results of the differing methodologies used to
estimate emissions. The estimated emissions in Brinkmann Consultancy (2009) are based on an extensive literature
review, whereas the emissions in Gan & Cai (2017) are based on calculations in the RSPO Palm GHG calculator.
These types of analyses can help producers prioritize where to focus efficiency improvements. Both of these studies
clearly point out that the large emission source will be from drained peatlands, followed by land cover change
during site preparation. These sources dwarf mill operation emissions.
Table 3. Estimates of GHG emissions across CPO production system
Brinkman Consultancy (2009) Gan & Cai (2017)
GHG emission factor Emissions per ha (kgCO2e/ha*annum)
Emissions per ton CPO (kg CO2e/ton CPO)
RSPO PalmGHG calculator (kg CO2e/ton
CPO)*
Operations
a. Fossil fuel use transport and machinery
+180 to +404 +45 to +125 +10
b. Fertilizer use +1,500 to +2,000 +250 to +470 +260
c. Fuel use in mill & utilization of mill by-products
0 0 +1
d. POME
+2,500 to +4,000 +625 to +1,467
+650 without methane capture;
+ 70 with methane capture
Total operations +4,180 to +4,000 +920 to +2,007 +341 to +921
Emissions from carbon stock change
a. Land conversion +1,700 to +25,000 +425 to +7,813 +960
b. Annual sequestration by oil palms
-7,660 -1,915 to -2,393 -1,280
c. Emissions from oil palm on peat
+18,000 to +73,000 +4,500 to +22,813 +7,280 (+1,000 from
N2O emissions)
Total emissions related to carbon stock change
+12,040 to +90,340 +3,010 to +28,233 -320 to +7,960
Total +16,220 to +96,565 +3,930 to +30,240 +21 to +8,881 * Converted from tonne of CO2e Note: a plus sign indicates net GHG emissions, whereas a negative sign indicates net GHG sequestration.

Compilation of BMPs to Reduce Emissions in Palm Oil Production Project Overview and Introduction 13
A number of tools have been developed that can be used by palm oil companies to calculate emissions from CPO
production. Tools such as RSPO PalmGHG calculator (used in the Gan & Cai (2017) study and discussed in Box 1),
ISCC GHG calculator, and GHG Protocol were developed based on life cycle assessment (LCA) approach to quantify
GHG emissions per tonne product. The RSPO PalmGHG calculator assumes the largest causes of GHG emissions on
a plantation include land use, peat land oxidation, chemical fertilizer, and POME. Palm oil companies can utilize
the RSPO PalmGHG calculator as a tool to identify and analyze emissions hotspots in their establishment and mills,
and subsequently identify suitable management practices to reduce GHG emissions from their CPO production.
Oil palm cultivation by smallholders also plays a significant role to the total GHG emission in the supply chain. In
Indonesia alone, smallholders manage around 40% of all plantations. However, the critical roles of smallholders are
often overlooked and excluded from the sustainable palm oil efforts limiting smallholders’ access to knowledge in
best management practices. This has led to lower productivity and lower concern for sustainability. Smallholders
with limited knowledge on sustainable palm oil tend to cultivate oil palm in new area to accommodate low
productivity. Without proper land planning, these new plantations can take place in high carbon stock area, leading
to bigger GHG emissions.
Box 1. RSPO tools and other resources RSPO Principles and Criteria for Sustainable Palm Oil Production The RSPO Principles and Criteria (P&C) describe the requirements for becoming RSPO certified. They are developed and revised every five years. Since 2013, the RSPO P&C also includes indicators and guidance for producing palm oil sustainably. As discussed in the introduction, criteria relevant to greenhouse gas emissions include Plans to reduce pollution and emissions, including greenhouse gases, are developed, implemented and monitored; and New plantation developments are designed to minimizes net greenhouse gas emissions. For each of these criteria and for the others, the P&C include indicators and guidance on how to fulfill them. RSPO PalmGHG Calculator The RSPO PalmGHG Calculator was first launched in 2012, and two updated versions were made in 2014 and 2016. This tool is used to quantify annual net GHG emissions in CO2 equivalent per hectare and per unit of product as (CPO, FFB, PKO and PKE from estates or mills). In the latest version (Version 3.0.1), a “no mill” option is available. All of the important gases (CO2, CH4 and N2O) from agricultural soil are included in the RSPO calculator. Sources of emissions that are quantified in this tool include: land conversion, manufacture of fertilizers and transport to the plantation, fertilizer application, fossil fuel combustion in the field and mill, POME, and peat decomposition. Moreover, three classes of sequestration are calculated: carbon sequestration by oil palm growth, carbon sequestered from forest/vegetation growth in conservation areas, and GHG emissions avoided when mill energy byproducts (PKS) are sold to cement industries to displace the burning of coal. In addition to RSPO calculator, ISCC and ISPO calculators also provide a life-cycle approach for estimating net GHG emissions in the palm production chain. According to one study, the RSPO calculator yields higher estimate of GHG emission compared to ISPO and ISCC calculators (Gan and Cap 2016). The different default values for carbon stock and emission factor are the main cause of the variation. In addition, peat decomposition is the dominant source of GHG emissions for oil palm planted on peatlands which can be quantified using ISPO and RSPO calculators. However, this source is excluded in ISCC report because this certification system prohibits oil palm planted on peat soil. RSPO GHG Assessment Procedure for New Development

Compilation of BMPs to Reduce Emissions in Palm Oil Production Project Overview and Introduction 14
The RSPO GHG Assessment procedure for New Planting Development provides estimation of corresponding carbon stock fluxes (above and below ground) and GHG emissions associated with new development plans to minimize GHG emissions. The procedure provides guidance on selection of preferred development options and preparation of a plan to minimize GHG emissions for new developments. This includes presence of peat area, emissions from mill and plantations and avoidance of area with high carbon stocks. The selection of preferred development is done by considering carbon stock assessment, GHG emissions assessment for new plantings, emission management and mitigation plan and finally reporting of GHG Assessment for New Plantings. RSPO Support to Smallholders RSPO recognizes the importance of smallholders and the need to include them in sustainable palm oil production. Since 2014, RSPO has been supporting smallholders through the RSPO Smallholder Support Fund (RSSF). The funds are used to support smallholders with the costs incurred for training, project management, High Conservation Value (HCV) and Social and Environmental Impact Assessment (SEIA), audit costs, as well as the tools and techniques to support smallholder development. Furthermore, in June 2018, the RSPO Board of Governors endorsed four Smallholder guidance documents and tools. These include:
• Guidance on Map Submission for Land Use Change Analysis (LUCA) for Independent Smallholder (Version 1, December 2017);
• Greenhouse Gas (GHG) Assessment Procedure for New Development (Reference Tool for Smallholder) (Version 1, December 2017);
• Smallholder-Friendly Manual for Social and Environmental Impact Assessment (SEIA) Tool (Version 1, December 2017);
• Simplified High Conservation Value (HCV) Approach for Independent Smallholder in the RSPO
Compilation of BMPs to Reduce Emissions in Palm Oil Production Management Practices to Reduce Emissions 15
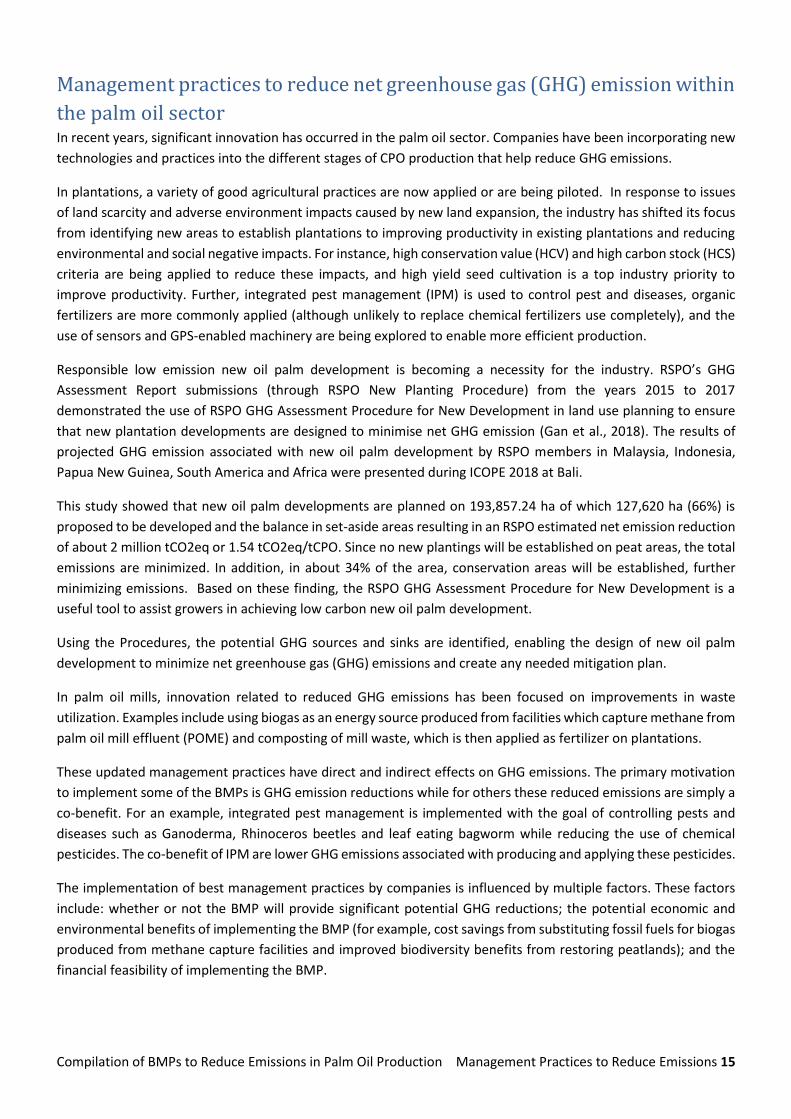
Management practices to reduce net greenhouse gas (GHG) emission within
the palm oil sector In recent years, significant innovation has occurred in the palm oil sector. Companies have been incorporating new
technologies and practices into the different stages of CPO production that help reduce GHG emissions.
In plantations, a variety of good agricultural practices are now applied or are being piloted. In response to issues
of land scarcity and adverse environment impacts caused by new land expansion, the industry has shifted its focus
from identifying new areas to establish plantations to improving productivity in existing plantations and reducing
environmental and social negative impacts. For instance, high conservation value (HCV) and high carbon stock (HCS)
criteria are being applied to reduce these impacts, and high yield seed cultivation is a top industry priority to
improve productivity. Further, integrated pest management (IPM) is used to control pest and diseases, organic
fertilizers are more commonly applied (although unlikely to replace chemical fertilizers use completely), and the
use of sensors and GPS-enabled machinery are being explored to enable more efficient production.
Responsible low emission new oil palm development is becoming a necessity for the industry. RSPO’s GHG
Assessment Report submissions (through RSPO New Planting Procedure) from the years 2015 to 2017
demonstrated the use of RSPO GHG Assessment Procedure for New Development in land use planning to ensure
that new plantation developments are designed to minimise net GHG emission (Gan et al., 2018). The results of
projected GHG emission associated with new oil palm development by RSPO members in Malaysia, Indonesia,
Papua New Guinea, South America and Africa were presented during ICOPE 2018 at Bali.
This study showed that new oil palm developments are planned on 193,857.24 ha of which 127,620 ha (66%) is
proposed to be developed and the balance in set-aside areas resulting in an RSPO estimated net emission reduction
of about 2 million tCO2eq or 1.54 tCO2eq/tCPO. Since no new plantings will be established on peat areas, the total
emissions are minimized. In addition, in about 34% of the area, conservation areas will be established, further
minimizing emissions. Based on these finding, the RSPO GHG Assessment Procedure for New Development is a
useful tool to assist growers in achieving low carbon new oil palm development.
Using the Procedures, the potential GHG sources and sinks are identified, enabling the design of new oil palm
development to minimize net greenhouse gas (GHG) emissions and create any needed mitigation plan.
In palm oil mills, innovation related to reduced GHG emissions has been focused on improvements in waste
utilization. Examples include using biogas as an energy source produced from facilities which capture methane from
palm oil mill effluent (POME) and composting of mill waste, which is then applied as fertilizer on plantations.
These updated management practices have direct and indirect effects on GHG emissions. The primary motivation
to implement some of the BMPs is GHG emission reductions while for others these reduced emissions are simply a
co-benefit. For an example, integrated pest management is implemented with the goal of controlling pests and
diseases such as Ganoderma, Rhinoceros beetles and leaf eating bagworm while reducing the use of chemical
pesticides. The co-benefit of IPM are lower GHG emissions associated with producing and applying these pesticides.
The implementation of best management practices by companies is influenced by multiple factors. These factors
include: whether or not the BMP will provide significant potential GHG reductions; the potential economic and
environmental benefits of implementing the BMP (for example, cost savings from substituting fossil fuels for biogas
produced from methane capture facilities and improved biodiversity benefits from restoring peatlands); and the
financial feasibility of implementing the BMP.
Compilation of BMPs to Reduce Emissions in Palm Oil Production Management Practices to Reduce Emissions 16
Based on a thorough review of the previous RSPO BMP study, multiple published case studies, conference
proceedings, and scientific articles, we have classified the influencing factors for BMPs implementation into two
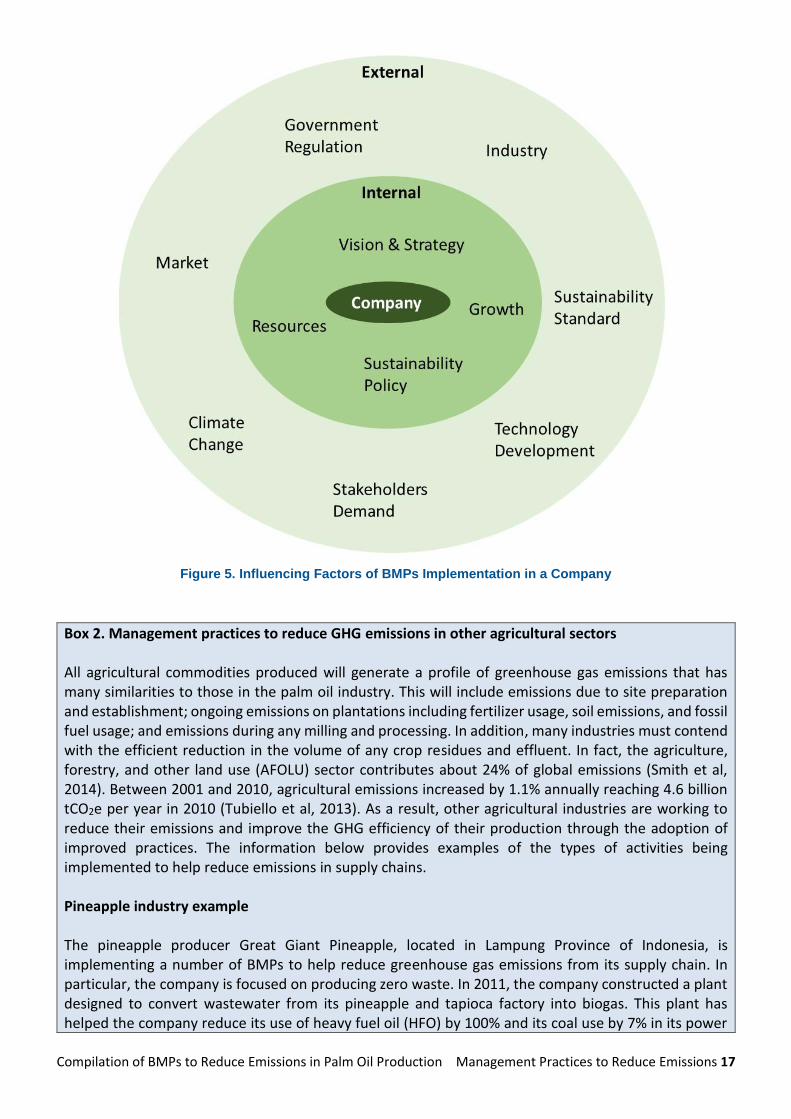
overarching categories: internal and external factors to the company (Figure 5).
A. Internal factors
Internal factors include a company’s vision and strategy, its desire to grow, its available resources, and its
sustainable policy. A company’s overall vision and desire to grow defines its strategy which, in turn,
determines what commitments will be pursued and how it allocates its resources, including human and
financial capital. The size of these resources will play an important role as well, especially if the company is
considering investing in an expensive, labor intensive practice. A company’s sustainability policy, influenced
by the company’s vision and strategy, more specifically outlines how decisions related to BMPs are made.
It is important to mention that these internal factors are very much influenced by the external policies
discussed below.
B. External factors
There are many external factors that influence a company’s decision to implement BMPs. These include
government regulations, the market, industry trends, available sustainability standards, climate change
impacts, stakeholder demands, and technology development. Complying with government regulations is
required for any company doing business. Governments also influence how sectors interact. Markets,
including buyers and end customers, and sustainability standards often complement one another in
creating incentives and providing guidelines for companies to implement certain BMPs. Furthermore,
trends in the overall industry, such as the widespread adoption of a particular technology, will influence
whether a company will also adopt it. Climate change can create extreme weather conditions which impact
overall production and motivate companies to implement BMPs to mitigate climate change and adapt to
its impacts. Stakeholders such as investors, local communities, and NGOs can all sway company decisions
in different. Some companies have the capability to develop their own technologies, for example through
research and development facilities for selective breeding. Most of the time, however, companies have to
rely on existing technology to meet their needs. There are cases also when the technology is ready but the
company is not due to financial reasons.
Compilation of BMPs to Reduce Emissions in Palm Oil Production Management Practices to Reduce Emissions 17
Figure 5. Influencing Factors of BMPs Implementation in a Company
Box 2. Management practices to reduce GHG emissions in other agricultural sectors All agricultural commodities produced will generate a profile of greenhouse gas emissions that has many similarities to those in the palm oil industry. This will include emissions due to site preparation and establishment; ongoing emissions on plantations including fertilizer usage, soil emissions, and fossil fuel usage; and emissions during any milling and processing. In addition, many industries must contend with the efficient reduction in the volume of any crop residues and effluent. In fact, the agriculture, forestry, and other land use (AFOLU) sector contributes about 24% of global emissions (Smith et al, 2014). Between 2001 and 2010, agricultural emissions increased by 1.1% annually reaching 4.6 billion tCO2e per year in 2010 (Tubiello et al, 2013). As a result, other agricultural industries are working to reduce their emissions and improve the GHG efficiency of their production through the adoption of improved practices. The information below provides examples of the types of activities being implemented to help reduce emissions in supply chains. Pineapple industry example The pineapple producer Great Giant Pineapple, located in Lampung Province of Indonesia, is implementing a number of BMPs to help reduce greenhouse gas emissions from its supply chain. In particular, the company is focused on producing zero waste. In 2011, the company constructed a plant designed to convert wastewater from its pineapple and tapioca factory into biogas. This plant has helped the company reduce its use of heavy fuel oil (HFO) by 100% and its coal use by 7% in its power

Compilation of BMPs to Reduce Emissions in Palm Oil Production Management Practices to Reduce Emissions 18
plant thereby reducing GHG emissions by approximately 40 thousand tCO2e. It was the first member of the pineapple industry to use the technology Up-flow Anaerobic Sludge Blanket (UASB) to produce the biogas. Further, the company has a composting initiative in which cattle dung is applied as fertilizer in the pineapple plantation, thereby reducing the need to apply chemical fertilizers. The pulp from pineapples the company produces is also used to feed the cattle. In addition to composting, the company also produces liquid organic fertilizer consisting of rhizo-bacteria to promote nutrient uptake and phyto-hormones to promote plant growth. These soil enrichment efforts not only reduce the need to apply chemical fertilizers but also enhance yield. Sources: Enterprise Asia, 2017; WBCSD. 2016. Soybean industry example Cargill, in collaboration with the Nature Conservancy and the Brazilian government, has been working with 15,000 farmers at different production levels in Brazil to remove deforestation and the associated GHG emissions from its supply chains and help farmers comply with the Brazilian Forest Code. They helped register more than 60 percent of their suppliers in the Rural Environmental Registry (CAR), which is used to assess who is complying with the Forest Code and not. They have provided training to 300 Cargill employees to evaluate progress on the implementation of the Forest Code in their supply chain. Cargill also uses geospatial analysis and satellites to track compliance in their supply chain. They have provided educational material to farmers and farmers associations about the Forest Code as well as require documentation from producers that they are in compliance. In Paraguay, Cargill is engaged in similar activities to monitor and evaluate deforestation risks in its soy supply chain. It is educating soy farmers on best agricultural practices and relevant policies. Source: Cargill, 2018. Sugarcane industry example A 2018 study published in the scientific journal Agronomy for Sustainable Development provided a review of different advances to improve the sustainability in sugarcane production in Brazil (de Oliveira Bordonal et al, 2018). These practices included the following:
• Non-burning harvesting. The common practice to burn residues before the harvest which has been estimated to emit 941 kg CO2e ha-1 yr-1, or a total of 30.3 % of total GHG emissions from sugarcane agricultural production.
• Replacement of diesel use during harvesting by renewable fuels as well as improved efficiency of transportation vehicles.
• Application of vinasse (wastewater produced during the processing of sugarcane biofuel) as a fertilizer on sugarcane fields. This practice reduces the need for chemical fertilizers and the emissions resulting from them. There are also specific BMPs related to the the transport and application of vinasse designed to reduce emissions as included:
o Adoption of new technologies, such as closed pipes instead of open channels, to transport vinasse;
o Application of concentrated vinasse compared to fresh vinasse; o Anaerobic digestion and concentration of vinasse.

Compilation of BMPs to Reduce Emissions in Palm Oil Production Management Practices to Reduce Emissions 19
Source: de Oliveira Bordonal et al, 2018 Pulp and paper industry example The APRIL Group has a pulp and paper mill and plantation forests in Riau Province, Sumatra, Indonesia. APRIL is engaged in a number of practices that have reduce its GHG emissions:
• They have conducted 37 High Conservation Value (HCV) assessments and currently conserve more than 250,000 HCV forests within their concession area;
• They are currently in the process of restoring 40,000 hectares of high conservation value forests in the Kampar Peninsula;
• Water table management through weirs in the parts of their concessions on peatland to minimize GHG emissions;
• Fire management through investments in fire prevention and fire suppression capabilities and engagement with local communities on education and incentive-based fire prevention initiatives.
• Generation of renewable energy from waste and production processes thereby reducing dependence on fossil fuels
o Operation of 3 recovery boilers that capture energy from black liquor, a byproduct of the pulp making process. The energy is used to produce steam for power generation and in the drying process for paper production.
o Methanol capture through a distillation process and evaporation involving black liquor. The energy produced is used in kilns.
o Excess energy produced is passed to the local grid.
• Currently in the process of establishing the requirements to identify and protect High Carbon Stock (HCS) areas.
Source: APRIL, 2015 Conclusions As these examples demonstrate, emissions in other sectors are similar to those in the palm oil sector and, as such, certain actors in the industry are implementing similar BMPs as those discussed in this report. All four examples show that the industries are actively working to improve their plantation establishment and concession management practices to reduce emissions through a variety of means including: engagement with smallholders to reduce deforestation, the implementation of no burn practices, substituting synthetic fertilizers with mill byproducts or organic fertilizers, reducing fossil fuel use, and conducting HCV and HCS assessments. Further, the sugarcane and pulp and paper cases show that other industries are also finding solutions to dealing waste generated in their mills, such as by using them to produce biogas, resulting in reduced emissions from the mills.
GHG emissions take place across nearly all stages of palm oil production, and thus there are many options for
reducing emissions. Through interventions that improve efficiency and employ innovative technologies and process
in cultivation, mill management, and effluent management, lower overall emissions can be achieved and the GHG
intensity of palm oil reduced. A significant number of palm oil companies have made myriad investments in
improving the efficiency of their palm oil production. These early movers, researchers, and innovators are providing
the industry with an ever increasing understanding of the initial investment costs, the return on investment, and
the GHG and other co-benefits.
At the plantation level, the majority of companies examined have committed to a zero burn policy for all new
plantations and when replanting. An ever increasing number have adopted a commitment to not establish new

Compilation of BMPs to Reduce Emissions in Palm Oil Production Management Practices to Reduce Emissions 20
plantations in areas that would result in deforestation of intact forest or areas of high conservation value and/or
peatland drainage. At the replanting stage, a selection of companies plan to re-evaluate which areas will be
restored, both to comply with any local regulations and as an approach to reduce GHG emissions and increase
environmental benefits. This is especially true for peatlands areas and riparian zones.
Many companies have also initiated integrated pest management as an approach to reduce costs and reduce health
risks. A range of approaches are being used by plantations to reusing mill biomass residue as a soil supplement.
This ranges from simply stacking debris in-field to decompose, mulching / shredding material and then applying,
use of remaining digested effluent to irrigate, along with more complex co-composting systems. Many plantations
are investing in improving yields – including fertilizer management, high yield seeds, and smallholder training.
Using fibers, shells, and other residues as fuel for boilers is relatively ubiquitous and the use of POME in biogas
plants have become more and more common at larger mills. However, other types of increases in mill efficiencies
are less common and some are still only emerging from the piloting stage.
A full list of BMPs studied in this assessment are summarized in Table 4. Some of the management practices
discussed have a direct GHG emission impact while others provide overall improvement in efficiency and
productivity, resulting in increases in the GHG efficiency of the CPO produced. Along with the presented overview,
each BMP was also evaluated against a set of five criteria: financial feasibility, technical and operational challenges,
GHG reduction potential, environmental and social co-benefits, and replicability (Table 5).
Table 4. Best Management Practices assessed in this study.
Category Description
Plantation Establishment and Concession Management
Improved Plantation Location Establishment
- High Carbon Stock Approach - No deforestation commitments - Zero burning techniques - Expansion on degraded lands
Yield enhancement - Improved seeds and varieties/ certified seeds - Improved fertilizer management
Improved spatial monitoring system - Use of remote sensing technologies to improve
plantation management, fire prevention, and yield enhancement
Improved smallholder management - Improved management practices resulting in
increased productivity and thus reduced GHG intensity
Peat management - Improved water table management within
plantation and entire land holdings
Pest management - Integrated pest and weed management
Plantation Fuel Usage - Alternative fuels for transportation and machinery - Reuse of biogas from POME for transportation
Improved Concession Management through conservation and restoration
- After-use planning after the plantation cycle - Ecosystem restoration from conservation areas,
degraded lands, biodiversity corridors - Expanded use of buffer zones (around rivers, etc.) - Phasing out some areas of production
Mill Management

Compilation of BMPs to Reduce Emissions in Palm Oil Production Management Practices to Reduce Emissions 21
Category Description
Plantation Establishment and Concession Management
Improved Plantation Location Establishment
- High Carbon Stock Approach - No deforestation commitments - Zero burning techniques - Expansion on degraded lands
Efficiency Improvements - Cogeneration or combined heat and power
efficiency improvements
Methane Capture - Methane capture for biogas electricity or
transportation
Co-composting - Creation of organic fertilizer from EFBs and POME
Solid Filtrate Separation - POME treatment
Innovative Technologies
Biomass Waste Utilization - Use of by-products, particularly biomass waste, such
as empty fruit bunches (EFBs)
Biogas Upgrading - Upgrading biogas to biomethane
Advance Biofuel Production - Creation of biofuels from residue and POME
These BMPS were assessed against a set of criteria, described in the table below.
Table 5. Scoring criteria for BMPs
Criteria Description Scoring System
1 Financial evaluation
This can be evaluated based on capital expenditure, payback period, RoI or other financial parameter, abatement costs. Money invested by company to obtain technology, develop the facility, train personnel, etc.
Abatement cost (if data is available): Effectiveness of money invested to reduce GHG emissions per tCO2e.
Investment
High: above USD 1.5 million
Medium: USD 500,000 to USD 1.49 million
Low: below USD 500,000
ROI4
High: more than20%
Medium: 10% to 19.99%
Low: less than 10%
Payback period
High: Less than 1 year
Medium: 2 to 8 years
Low: More than 1 year
Abatement costs
High: above USD 30/tCO2e
Medium: USD 10 to 29.99/tCO2e
High: below USD 10/tCO2e
4 Return on investment

Compilation of BMPs to Reduce Emissions in Palm Oil Production Management Practices to Reduce Emissions 22
2 GHG emission reduction potential5
Emission reductions contributed by BMP compared to overall supply chain unit emission (in percentage).
High: Above 30%
Medium: between 5% to 29.9%
Low: below 5%
3 Technical and operational challenge
Level of challenge faced by the company in implementing BMP in term of required skill, deployment time (preparation, construction, development), availability of technology in domestic market, and operational practicality.
High: large challenges (i.e. require permit from government to implement, need to hire expert)
Medium: challenges in many aspects (i.e. requires skilled personnel, maintenance should be done by other party)
Low: few specific challenges prevail in term of skill required, technology availability, relatively easy to develop and implement
4 Environmental and social co-benefits
Additional benefits of BMP to social and environment aspects.
High: more than 3 co-benefits
Medium: one to three co-benefits
Low: one or none co-benefit
5 Replicability Applicability of BMP to other companies in the sector in term of technical, approach, and method.
High: BMP is applicable to any scale of company group, including SME companies.
Medium: BMP is mostly applicable to large group; applicable to SME with some adjustments or considerations.
Low: applicable to specific type of company only.
While palm oil production occurs across the tropics, and these BMPs are generally universally relevant, this
assessment focuses on production in Indonesia, Malaysia and African countries where the majority of palm oil is
produced.
Plantation Establishment and Concession Management
Plantation Establishment
Plantation establishment can have either a net positive or negative carbon flux depending on the kind of lands the
conversion occurs on, and the kind of land uses it is displacing. If high carbon natural forests are cleared, this results
in large emissions from lost biomass that can only be partially mitigated by the regrowth of plantation stock.
Conversely, creating plantations on lands that have been severely degraded through past natural or anthropogenic
disturbances can result in a net carbon removal. By undertaking carful spatial planning of the lands to be converted,
5 Using RSPO PalmGHG calculator

Compilation of BMPs to Reduce Emissions in Palm Oil Production Management Practices to Reduce Emissions 23
it is possible to minimize the impact on high carbon areas, while diverting as much conversion as possible to already
degraded lands.
Two existing frameworks have already been developed to guide this process, the HCV approach and HCS Approach6.
A simplified version of HCV analysis has been developed for smallholders while this is in currently in process for the
HCS approach7.
Whether these specific standards are pursued, the general principles apply of prioritizing conversion on lands with
lower quality forests. In all cases, this practice requires that the pre-conversion conservation and/or carbon values
of the landscape are transparently and credibly cataloged, and that widely accepted techniques for evaluating
forest viability are employed.
As discussed in Box 1, the RSPO GHG Assessment procedure for New Planting Development8 serves as a resource
to estimate carbon stock fluxes (above and below ground) and GHG emissions associated with new development
plans to minimize GHG emissions. The procedure provides guidance on selection of preferred development options
and preparation of a plan to minimize GHG emissions for new developments.
In many countries, existing laws already stipulate some form of consideration of environmental impact when
expanding plantations. Furthermore, there is growing pressure from consumer groups for sustainable sourcing and
signing on of pledges including deforestation-free supply chain. In some cases, complying with local law or
requirements of various sustainability standards may already result in a company's reduction of some of the
potential emissions from conversion.
The timing of when such an assessment would take place relative to conversion is dependent on the local legal
process for acquiring and developing lands, as well as a company's internal planning cycles. In general, the
assessment is needed before lands are delineated. In some cases, this might actually be most strongly influenced
by the concession planning stage, before a particular company is even licensed to the property. Depending the local
circumstances, there are several times when a company could employ a reduced impact strategy. After concession
acquisition and prior to conversion, a company would likely have the greatest ability to influence which specific
lands are impacted. In some legal contexts, the percent or types of lands that must be converted is written into the
concession lease leaving less room to maneuver. A second strategy is to selectively pursue concessions where it is
known that the existing proportion of non-forest land cover is already sufficient to avoid the necessity of converting
forests, while still meeting business objectives for the acquisition. Finally, companies can consider working directly
with or providing inputs to local or national government to supplement their ability to identify and delineate
concessions that would result in lower impact on forests.
A number of companies are already pursuing sustainability policies that include variations on no-deforestation
pledges. Golden-Agri Resources follows a "Forest Conservation Policy" that includes a no deforestation footprint
comprised of a prohibition on conversion of HCV, HCS and peatland areas. Golden-Agri developed the first technical
methodology for identifying HCS areas. Unilever and Wilmar have also announced their intent to protect HCS areas.
Indofood Agri Resources has pledged no development on HCV areas, as well as to buy palm fruit only from
smallholders and external supplies that do not originate from areas cleared of primary forests since 2011. The use
of such approaches by Olam is featured as a case study.
6https://www.hcvnetwork.org/; http://highcarbonstock.org/
7 https://www.hcvnetwork.org/about-hcvf/hcv-for-smallholders; http://highcarbonstock.org/the-hcs-approach-toolkit/
8 https://www.rspo.org/certification/ghg-assessment-procedure

Compilation of BMPs to Reduce Emissions in Palm Oil Production Management Practices to Reduce Emissions 24
Financial implications
There are four main financial dimensions to reduced impact conversion. The first is that resources are required to
survey and map the ecological, carbon, and social benefits of lands over a potentially large and complicated
landscape. Secondly, the recommendations from such an approach may result in a plantation configuration that is
sub-optimal from a logistics and transportation perspective, or may restrict development to areas with poor
growing conditions. Thirdly, production will be forgone in all areas not put under production but legally allowable.
Finally, there is typically an ongoing need for company involvement to ensure that the remaining forest tracts are
adequately protected such that they purported sustainability benefits are actually persistent over time. Depending
on the local threats to forests, this could require investments in such activities as fire prevention, forest patrolling
and spatial monitoring alert systems (Parker 2018).
Regarding the first set of resource requirements pertaining to landscape evaluation and monitoring, there are
numerous approaches that combine some form of field and satellite/airborne assessment to map priority areas.
The costs increase with the complexity and size of the landscape, but on a per hectare basis, economies of scale
can be achieved especially as it relates to any remote sensing approaches employed. For this reason, a rigorous
pre-conversion assessment to a technical standard required under the HCS Approach is expected to be a viable
option for large producers with the resources to employ a team of staff researchers and analysts. Smaller producers
and smallholders at a minimum could consider following the simplified HCV and HCS guidance and a combination
of consulting with local authorities and communities on any particular areas of known forest value, along with
reference to existing freely available and global spatial data layers indicating such landscape features as canopy
density, land use, and history of disturbance.
The second financial consideration regarding the orientation of plantations to logistical networks, processing
infrastructure, labor, etc., as well as the inherent ecological suitability if the land for plantation production, would
need to be assessed using a producer's own knowledge of its internal business practices and requirements. In
general, it would be anticipated that a more dispersed operation would incur higher operational fixed costs per
hectare managed versus a centrally concentrated plan.
Depending on the local threats to forests, protection of high value forests could require investments in such
activities as fire prevention, forest patrolling and spatial monitoring alert systems. Some of these costs may able to
be shared with activities focused on plantation areas (e.g. fire prevention). The key point is that these lands, despite
being left in a 'natural' state, will nevertheless require per hectare costs to be borne by the company.
GHG Reduction Potential
The total amount of GHG reduction potential is strongly related to the existing state of the landscape. If the
proposed site is already dominated by low carbon and non-forest lands, the additional opportunity for reduction
using this strategy will be minimal. Likewise, if the landscape is characterized by high carbon forests, there will be
a limited opportunity for conversion without deforestation. However, in landscapes that have a mix of lands in
various states of degradation and forest quality, reorienting development could have a significant role in limiting
impact. Table 6 and Table 7, which include default values of carbon content in different land use/land cover types
provided by the RSPO PalmGHG calculator and the 2006 IPCC guidelines provide a sense of what could plausibly be
achieved on a per-hectare basis by diverting conversion that would have under a business as usual scenario taken
place on natural forests.

Compilation of BMPs to Reduce Emissions in Palm Oil Production Management Practices to Reduce Emissions 25
Table 6. Potential for avoiding emissions by diverting conversion to non-forest lands using the PalmGHG
default values for different land cover types
Tonnes of carbon per hectare (tC/ha)
Avoided emissions by prioritizing conversion of shrubland (168.67 tCO2/ha) over forest
Avoided emissions by prioritizing conversion of shrubland (18.33 tCO2/ha) over forest
Avoided emissions by prioritizing conversion of tree crops (275 tCO2/ha) over forest
Avoided emissions by prioritizing conversion of food crop (275 tCO2/ha) over forest
Undisturbed forest
268 814 964.3 707.7 951.5
Disturbed forest
128 300.7 451 194.3 438.2
Table 7. Illustrative example of potential for avoiding emissions by diverting conversion to non-forest lands.
Values derived from IPCC 2006, Vol. 4 AFOLU, Ch 4, table 4.7, and estimates for root-shoot ratio taken from
table 4.4 used to convert from AGB to emission reduction potential.
Tropical moist deciduous forest aboveground biomass (t DM ha-1)
Tropical shrubland aboveground biomass (t DM ha-1)
Avoided emissions by prioritizing conversion of shrubland vs primary forest (tCO2e ha-1)
Africa 260 70 411
Asia (continental) 180 60 255
Asia (insular) 290 70 480
Americas 220 80 295
In locations where opportunities to divert conversion away from forests does exist, it is often the case that this
practice can represent the largest means to reduce total concession emissions with the exception of avoided
development on peat soils. Peat soils are a special case, as once disturbed they have the potential to release long
term emissions far in excess of the original loss from conversion. The Indonesia Carbon Accounting System (INCAS)
uses a default value of 40.3 tCO2e ha-1 y-1 to represent the emissions from peat soil managed as palm oil plantation
per year. Peat soils are well recognized in Indonesia and Malaysia, but there is growing awareness and appreciation
for their presence elsewhere in tropical Asia, Africa and South America.
Technical and Operational Challenges
The most rigorous approaches such as those under the HCS Approach require creating detailed land cover maps
indicating the distribution of High, Medium, and Low Density Forests, Regenerating Forests, Scrub, and
Cleared/Open Land. This task can require sophisticated remote sensing capabilities that may not currently exist
within the company. In many cases existing maps are available from national or local governments, such as those
used in national forest inventories or those used to construct REDD+ reference levels, however their focus is
typically at a scale that is too coarse to be used reliably as the sole basis for applying the HCS Approach.
Beyond the need to maintain appropriate staff, there are obstacles presented by commonly used remote-sensing
approaches. There are decades of experience in the international remote sensing community of employing medium
and high-resolution imagery to differentiate forest type and, in some applications, even assign carbon stocks. These
approaches remain viable for many situations, but they can be prone to a high degree of systematic bias.

Compilation of BMPs to Reduce Emissions in Palm Oil Production Management Practices to Reduce Emissions 26
Innovations in biomass assessment using the addition of lidar technology to traditional techniques have shown
promising improvements, but these lidar techniques are only recently moving into more widespread operational
use. This means that the near-term ability to recruit staff familiar with application of lidar to tropical forests may
be a challenge.
Forest parcel viability and connectivity is a key requirement of HCS areas identified using the HCS Approach and
requires an additional analysis beyond simply mapping the current distribution of land cover types. Connectivity
and viability can only be assessed at the landscape scale rather than the parcel, which requires a modeling approach
that evaluates the likely impact of various configurations of converted versus protected lands. A number of
modeling tools exist for spatial habitat assessments, but the skillset required to implement this aspect of the
assessment would not necessarily be found within the individuals leading remote sensing work, thus requiring
additional recruitment.
Environment and social co-benefits
Protecting viable parcels of high quality forest has numerous co-benefits that extend beyond GHG mitigation.
Depending on the landscape, these benefits can be hydrologic, biodiversity, food security, disaster prevention.
Forests in some landscapes play a large role in the availability of water to downstream communities. This is
particularly true in regions where cloud capture represents a significant supplement to precipitation-provided
water. High value forests preserve soil, mitigate local climate extremes, and provide pollination and pest control
services that contribute to human food security. Lastly, in virtually every society, forests play an important role as
a reservoir of cultural heritage. By protecting the highest quality forests, there remains the greatest chance for
culturally important animal and plant species to be preserved.
Replicability
Because this practice is focused on the stage of plantation conversion, it is only applicable to areas that anticipate
additional expansion to occur. Concessions or regions that are already fully converted to the extent expected or
allowed by land availability, company policy, or local law would not be able to pursue this strategy.
Within a given operator, there are opportunities to replicating improved plantation establishment across various
operations or landscapes, particularly as it relates to the internal capacity that will have been developed within
analytical staff in implementing the spatial assessments. However, there may be a need to re-learn or develop new
approach if transition experience from one landscape to another in a very different ecological or economic context,
such as from one continent to another.
Summary
For companies looking to expand their area of production, improved plantation establishment design offers by far
the greatest potential for avoided GHG emissions. The investment costs will be significant and due to economies of
scale will be more cost effective when larger areas are evaluated. However, such an approach will also be in line
with RSPO and additional requirements of some markets that do not allow deforestation or peatland conversion.
The environmental and social co-benefits are significant as biodiverse habitats will remain intact. In locations where
there are significant areas available for potential additional plantation establishment, this approach is highly
recommended. Additional details on this BMP can be found in the Olam case study below.
Criteria Score Remark
1 Financial evaluation High Financial costs can be significant. Depending on local
regulations, dominated by forgone production
2 GHG reduction potential High In areas where conversion of peatlands and intact forests are
prevented, emission reductions are very high

Compilation of BMPs to Reduce Emissions in Palm Oil Production Management Practices to Reduce Emissions 27
3 Technical and
operational challenge High
Methods known, however, technical expertise will be required
4 Environment and Social
co-benefits High
Protection of biodiverse habitats and other ecosystem services
5 Replicability High Highly replicable in areas where many locations still available for
conversion
Yield Enhancement
Palm oil expansion has been a major driver in the destruction of forests and other natural habitat across the tropics.
While there is growing awareness and concern for the conservation of tropical forests and the climate impact of
emissions associated with deforestation, demand for palm oil continues to grow. Improving the productivity of
existing palm oil plantations to meet production requirements through interventions such as better nutrient
management, seeds, or harvesting practices is a pragmatic way to address these conflicting needs.
Around the world, plantations are performing well below their potential. The current global average yield is
estimated at around 3.5 tons of oil per hectare (Barcelos et al., 2015), yet productive plantations can generate 8.9
tons of oil per hectare. Through closing yield gaps to achieve global production of 15–20 Mt oil yr−1, Woittiez et al.
(2017) claim oil palm expansion could be halted altogether.
Palm oil yields are affected by a wide range of factors such as quality of planting material, planting density, soil
type, topography, rainfall, canopy, fertilizer management, and pest and disease control. Large-scale plantations
usually have higher yields than smallholders due to differences in capacity and financial resources for plantation
management, high quality planting material, and inputs. For example, smallholders usually only have the capacity
to harvest monthly, yet harvesting in shorter cycles of 7-10 days would result in significantly higher yields (Lee et
al., 2014). Harvesting standards also impact yields. Large plantation companies generally have harvesting standards
designed to maximize palm oil yields, whereas smallholders may not have these well-defined standards and
therefore have lower yields.
As the two leading producers of palm oil in the world, Indonesia and Malaysia have been in the spotlight for
deforestation and associated emissions driven by the expansion of oil palm. In 2016 alone, 12 million hectares of
oil palm were planted in Indonesia (MoA, 2017) and 5.7 million hectares in Malaysia (MPOB, 2016). Without
significant interventions, this expansion is likely to continue as Indonesia ambitions to double palm oil production
by 2020 (Koh and Ghazoul, 2010). Malaysia also plans to increase its production along with other countries such as
Brazil, Peru and Central and Western African countries whose governments are increasingly promoting palm oil
(Pirker et al. 2016).
Given these trends, enhancing yields on palm oil plantations to intensify production could mitigate further
deforestation, lower net emissions from the industry, and improve outcomes for countries with developing palm
oil industries.

Compilation of BMPs to Reduce Emissions in Palm Oil Production Management Practices to Reduce Emissions 28
High-Yield Seed Varieties
Increasing yield and production efficiency can be achieved through improved seeds. These enhanced seed varieties
have been under development for years by research institutions such as the Malaysian Palm Oil Board (MPOB) and
Indonesian Oil Palm Research Institute (IOPRI), as well as private companies such as Asian Agri in Indonesia. Asian
Agri successfully developed “Gen-3 Topaz” as the 3rd Generation of high planting materials after more than 20
years of research and established an expansive 300-hectare nursery in Riau with that variety capable of producing
25 million seedlings year-1. In 1996, Asian Agri also initiated an oil palm breeding program using a wide diversity of
ABPRO germplasms from the oil palm seed development company ASD Costa Rica.
After decades of research and field trials, Sime Darby
developed the Calix 600 seed variety that can be harvested
early (24 to 36 months after planting) that produces up to
10 ton ha-1 year-1 of CPO. This is significantly higher than the
annual production rate of 8.9 t ha−1 (Rajanaidu et al., 2005)
produced by tenera palms or DxP hybrids, the most
common planting material used by large scale companies
(Mutert et al., 1999). Furthermore, Calix 600 improves
efficiency in field operations due to homogeneous growth.
Tissue culture or clonal seed techniques also offer promising
ways to enhance yield whereby seeds are reproduced as
exact copies of the genotype as a parent material. This
guarantees homogenous high seed quality, and this
technique has been shown to boost production by 15-30%
as compared to hybrids (Mutert et al., 1999, Soh 2004).
Among tenera palms, clones in a 7-year-old plantation can
yield up to 15.7 t oil ha−1 yr−1 (Simon et al., 1998) while
Tenera semi-clones produced 11.1 t oil ha−1 yr−1 in a 5-year-
old plantation (Ng et al., 2003).
PT Sinar Mas Agro Resources and Technology (SMART) started research in 1997 on high planting material and
successfully developed “Dami Mas 1-4”, with the capacity to produce 7.5 - 8 tons CPO ha-1 year-1. Over the past 10
years, their research has utilized tissue culture or clonal techniques to improve seed quality. The varieties Eka 1 and
Eka 2 were developed through selection and tissue culture from elite palms and under optimal weather and soil
conditions are expected to yield 10.8 ton CPO ha-1 and 13 ton CPO ha-1 respectively, which is 30% higher than the
current production. In addition, this innovation has cut harvest time by 24 months. SMART plans to initiate
commercial use of the seed in 2022.
GHG Reduction Potential
The potential for emission reductions from avoiding deforestation varies greatly on the ecosystem and soil types,
with the conservation of forests on peat soils having the greatest potential impact. Avoided emissions from
converting one hectare of natural forest on mineral soils to an oil palm plantation has been estimated at 561 Mg of
CO2 (Agus et al., 2003) while conserving primary peat swamp forest could conserve 700 Mg of CO2 (Hergoualc'h et
al., 2011). However, the positive impact of greater productivity on net emissions will only be achieved under the
strict condition that increasing production will not stimulate further plantation expansion (Angelsen and Kaimowitz,
2001; Angelsen, 2010; Phelps et al., 2013). On existing plantations, increasing productivity has the potential to
reduce the GHG emissions per ton of palm oil produced.
If increased yields require additional inputs such as fossil fuels for machinery or nitrogen fertilizer, these practices
will create emission that will counteract some or all of the per production unit reductions. To pursue such a strategy,
Figure 6. Example of improved oil palm
seeds from Sime Darby's Calix 600 breeding
program
http://www.simedarbyplantation.com/our-
businesses/research-development/overview
Compilation of BMPs to Reduce Emissions in Palm Oil Production Management Practices to Reduce Emissions 29
an assessment would first need to be taken on the specific yield improvement strategies considered, including
estimating their required additional inputs and the expected yield increase. In cases where it can be demonstrated
that better management will produce yield gains with minimal additional GHG-generating inputs required, this can
be a very important strategy for meeting company emission objectives.
Technical and operational challenges
While the benefits from intensifying production are clear, the financial burden of research and development as well
as technical and operational challenges are not insignificant. Developing new high-yield seed varieties is extremely
expensive and time consuming. Between general research and development, clonal propagation, and field trials,
countries and companies spend vast sums of money to create seeds that lead to higher profits. Malaysia alone has
spent tens of millions MYR over the past 20 years in researching and developing improved varietals (Soh et al.,
2011).
There are also ethical and cultural challenges. Varieties of palm oil that have been developed through biological
engineering such as clonal seedlings have been the subject of significant concern for impacts on human health. As
such, their product has been mostly used for bio energy, rather than for human consumption. This subject therefore
necessitates further research.
While there is a steady market for palm oil, there are operational challenges in expanding use of oil palm as a biofuel
due to concerns over sustainability. In an effort to lower dependence on fossil fuels and their associated emissions,
countries are shifting their energy balance use more renewable biofuels. Indonesia has set a 5% target for biofuels
to meet their energy needs and there are plans for 10% of the transport fuel of every European Union (EU) to come
from renewable sources such as biofuels by 2020. However, citing concerns over the environmental impacts of
palm oil production, in April 2017, the EU voted to phase out biofuels made from vegetable oils, including palm oil
by 2020. The loss of this key market means there may be less incentive to increase yield to meet market demands.
Environment and social co-benefits
Enhancing oil palm plantation yields can offset the need for expansion of production area, avoiding further
deforestation and associated emissions and detrimental impacts habitat loss has on biodiversity.
Replicability
Given the high costs of developing new high-yield oil palm varietals, it is unlikely that small and medium enterprises
will pursue generating original materials. As such, smaller oil palm producers will likely rely on purchasing seeds
and planting material.
As briefly discussed above, the development of high quality of seeds is typically undertaken by research institutions
and private corporations such as ASD Costa Rica (Costa Rica), the Indonesian Palm Oil Research Institute (Indonesia),
Socfindo (Indonesia), Applied Agricultural Resources Sdn Bhd (Malaysia) and Felda Global Ventures (Malaysia). The
Malaysian Palm Oil Board MPOB has the largest oil palm germplasm collection in the world (E. guineensis and E.
oleifera) and conducts advanced research in developing new high planting material.
Improved fertilizer management
Achieving maximum potential yields requires careful attention to nutrient management. Fertilizers can improve soil
fertility and boost production and allow for the cultivation of oil palm on lands that would otherwise be unsuitable.
To optimize costs, plantations work to balance the exact needs of the crops with fertilizer application, but over or
under utilization of fertilizer is common at both large and small-scale plantations. Optimum fertilizer application
depends on the age of the oil palm, planting material, soil type and condition. While fertilizers can improve yields,
they are also a source of emissions and water pollution so the application of fertilizers needs to be carefully
managed. The RSPO has included the maintenance of soil fertility among its Principles and Criteria. Practices
maintain soil fertility at, or where possible improve soil fertility to, a level that ensures optimal and sustained yield.

Compilation of BMPs to Reduce Emissions in Palm Oil Production Management Practices to Reduce Emissions 30
Financial Implications
Common practice in West Malaysia is 50–100 N kg ha-1 y-1 for immature palms to 120–160 kg N ha-1 yr-1 for
mature palms on peatland (Mutert et al 1999). In Indonesia the standard application rate is slightly higher from 102
-170 kg N ha-1 y-1 (Darmosarkoro et al 2003). Studies in Malaysia found an increasing trend of the cost of fertilizer
over the past years where in 1999 fertilizer cost contributed around to 24% to total production costs while in 2008
accounted for 50%- 60% (Goh et al, 1999; Whid and Simeh, 2009). Thus, increasing the efficiency of fertilizer use
can reduce costs while maintaining productivity.
GHG reduction potential
Direct emissions from the application of synthetic fertilizers mainly comes in the form of nitrous oxide (N2O).
Nitrous oxide is classified as long-lived GHG and has a global warming potential 268 times higher than that of CO2
over a 20-year time horizon, including climate–carbon feedbacks (Myhre et al 2013). Direct N2O emissions are 1%
of N fertilizer applied to soil (IPCC, 2006), although recent studies have found higher emission factors of 1.5 to 4%
(Shcherbak et al., 2014, Crutzen et al., 2008). Using this emission factor, 1-4 kg N2O is released into atmosphere for
every 100 kg of N fertilizer applied. This translates to around 250 – 470 kg CO2 -eq/tonne CPO (RSPO, 2009), or
according to IPCC (2007) 3.5 kg CO2eq per kg N fertilizer production.
While this emission factor is small, total emissions from synthetic fertilizers increased more than nine-fold between
1961 and 2010 from 0.07 to 0.68 GtCO2eq yr-1 (Tubiello et al 2013) due to excessive use of fertilizer to boost crop
production. Furthermore, nonlinear response of soil nitrous oxide (N2O) emissions to nitrogen fertilizer was
discovered in some recent studies, which conflicts with the linear response reported by IPCC (Oktarita et al., 2017,
Shcherbak et al., 2014). This implies emissions could be significantly higher than previously assumed. This is
illustrated in Figure 7 which shows a simulation of N2O emissions from different fertilizer rates using different
models.
Figure 7. Response of cumulative post-fertilization N2O emission in the close to palm (CP) area to the
average N applied compared to the response obtained using the models Shcherbak et al (2014) and the IPCC
(De Klein et al., 2006). Source: Oktarita et al., 2017
The potential for emission reductions from optimum fertilizer management depends on the baseline rate that is
applied, yet achieving optimum fertilizer dosage to sustain plant growth and high yield is clearly important for any
operation looking to both maximize profits and keep fertilizer emissions to a minimum.

Compilation of BMPs to Reduce Emissions in Palm Oil Production Management Practices to Reduce Emissions 31
Technical and operational challenges
A recent study indicated that intensification through increases in fertilizer application above current practice could
increase yields from the current 67% to 80% of attainable yields9 without negative effects on the footprint of
Indonesian palm oil (van Noordwijk et al., 2017). Fertilizer cost contributes to almost half of the production cost
and increasing current rate to further boost yield should be done cautiously.
Given the high costs, smallholder farmers typically apply fertilizer at lower rates than larger enterprises.
Smallholders also rarely have the resources to conduct leaf and soil analyses to determine optimum fertilizer
dosage.
Environment and Social co-benefits
In addition to emissions, the over-use of fertilizers can result in other environmental consequences. Excessive
fertilizer use can pollute water bodies by causing algae blooms that deplete oxygen in water bodies (hypoxia),
leading to fish die-offs and N contamination in drinking water. Adopting practices that ensure the optimum amount
of fertilizer applied will lead to less fertilizer runoff into water bodies and ozone layer depletion. Soil health can be
improved incorporating the use of organic fertilizer such as compost which can reduce costs and improve
environmental outcomes. The production of organic fertilizers themselves have lower emissions in comparison to
inorganic fertilizer production as discussed in the Co-Composting Section of this report.
Replicability
Large palm oil companies likely have the resources to perform the testing and analyses to determine optimum
fertilizer application rates and utilize byproducts from palm oil production for fertilizer, and thus improved fertilizer
management is a highly relevant approach for improving yields and lowering greenhouse gas emissions. Small and
medium sized enterprises also stand to benefit from optimizing fertilizer use, yet they likely lack the resources to
perform leaf and soil analyses. Nevertheless, they can likely pursue this option and maximize returns by drawing
upon guidance provided by research institutes and larger companies on optimizing resource use.
Summary
Improving the productivity through improved seeds and fertilizer management can also result in reduced GHG
intensity of palm oil production while reducing environmental pollution. However, the investments required can
be significant and thus only available to larger companies or done through research institutions.
9 The average N fertilizer application level of 141 kg ha-1 yr-1 reported on the 23 plantations surveyed in the study was associated
with 67% of maximum attainable FFB yields, whereas fertilizer application rates of 200 kg ha-1 yr-1 was associated with 80% of
maximum attainable FFB yields. An emission factor of between 1% and 4% N2O-N/N/ fertilizer ratio was applied.

Compilation of BMPs to Reduce Emissions in Palm Oil Production Management Practices to Reduce Emissions 32
No Criteria Score Remark
1 Financial
evaluation
Low-
Medium
We suggest that the financial cost to implement best
management practices is low due to recommendation to
reduce where fertilizer rate is over the plant need, in
opposite where fertilizer rate is lower than what plan need
(in smallholder case), additional cost will be involved
2 GHG reduction
potential Low
Increasing productivity reduces GHG emissions per ton of
PO produced
3
Technical and
operational
challenge
Medium
Significant research is required to identify improved seeds.
4 Environment and
Social co-benefits Medium
Reducing fertilizer use has significant environmental co
benefits
5 Replicability Medium-
High
Most plantations have the potential to increase yield, thus
any improvements to seeds or fertilizer management are
widely replicable
Improved Spatial Monitoring System
A spatial monitoring system involving ground and satellite/airborne generated data can help to improve plantation
yields while prioritizing poorly performing plantation areas for restoration. A monitoring system can also support
rapid response efforts to fire and incursions on company-managed plantations or natural lands.
For existing plantations, improved yields have the potential to increase the GHG efficiency of the CPO, e.g. fewer
emissions per unit of output, even if net emissions per hectare of land remain unchanged or increase. If companies
currently only monitor crop condition within an aggregated spatial unit encompassing tens or hundreds of hectares
(e.g. blocks), significant spatial variation in conditions can be missed.
Such intra-farm conditions can be and are more frequently being monitored using remote sensing. Remote sensing
products range from free satellite images (such as NASA Earth Observation programs like MODIS and Landsat) to
aerial photos taken from technologies like unmanned aerial vehicles (UAVs), colloquially known as drones. Such
products are being used across a wide range of agricultural commodities to detect general plant health, plant
biomass, weeds and the effects of fertilizers, diseases and natural disasters. This spatial monitoring allows growers
to improve management of their crops, for example more-targeted irrigation, fertilizer and pesticide application.
This could lead to less losses from diseases, more cost-effective application of agricultural inputs and overall
improved yields. The GHG emissions associated with any change land use management of fertilizer use will need to
be incorporated into total GHG emission estimates for production.
The type of remote sensing used depends on the monitoring needs and the cost implications. The advantage of
satellite images are their low cost and reliability—many satellite images are free of cost to the general public and
take images of the same location at a specific time step—which varies between a few days and several weeks. The
disadvantage of these products is their coarse scale—most cheap satellite products have a spatial resolution of ≥30
meters, which can be too coarse for individual plants or smaller farms. Satellite products are ideal for large-scale
monitoring—showing or predicting impacts of climatic phenomena such as drought and flood, widescale

Compilation of BMPs to Reduce Emissions in Palm Oil Production Management Practices to Reduce Emissions 33
UAVs have a much finer spatial scale which is their great advantage, allowing for what is called “precision
agriculture”. They can be flown over a specific area and their images can be at the sub-meter scale. They are often
used for monitoring of sub-farm issues such as catching the beginning of a disease outbreak, detecting slight
differences in growth in different areas of a farm or tracking damage after a storm. Their drawback however is the
high costs to operate them and fly them repeatedly for continuous monitoring; a cost that must be budgeted for
by the producer.
Figure 8. Spatial partitioning of plantation for tree health and productivity monitoring with unmanned aerial
vehicle (UAV) http://myspatial.com.my/services/data-acquisition/unmanned-aerial-vehicle-uav/uav-services-
for-oil-palm-plantation/
Some companies, for reasons of company policy or local law, will maintain certain lands within their palm
operations in a natural state, such as conservation buffers, high conservation value, or high carbon stock. These
lands are often vulnerable to incursions by actors not affiliated with the palm company itself. Unplanned clearings
of conservation lands can jeopardize a producer’s attainment of sustainability objectives. A spaceborne remote
sensing platform with a high frequency of imaging or spectral resolution (i.e. daily or weekly) can help to initiate
enforcement actions sooner and limit damage. Global platforms such as Global Forest Watch can also be used to
monitor long term changes in forest cover (https://www.globalforestwatch.org/). Users can sign up to receive free
alerts when any deforestation in a specified location has been uploaded to the database.
Remote sensing solutions for fire monitoring and prevention also have some potential benefits over traditional
ground-based observation. Firstly, fire risk can be mapped as it relates to meteorological conditions, surface
moisture, and available fuel, allowing prevention efforts to be prioritized in high risk areas. Secondly, daily fire
activity alerts can be derived spaceborne sensors helping to better coordinate countermeasures. For example, the
Fire Information for Resource Management System (FIRMS) can be used to create free alerts in a user’s area of
interest for fire detections from the MODIS and VIIRS satellites10. The user can specify an area of interest using
coordinates, choose the frequency of the alert (weekly, daily or rapid near-time) and will then receive an email alert
showing the fire detection.
10 https://firms.modaps.eosdis.nasa.gov/alerts/
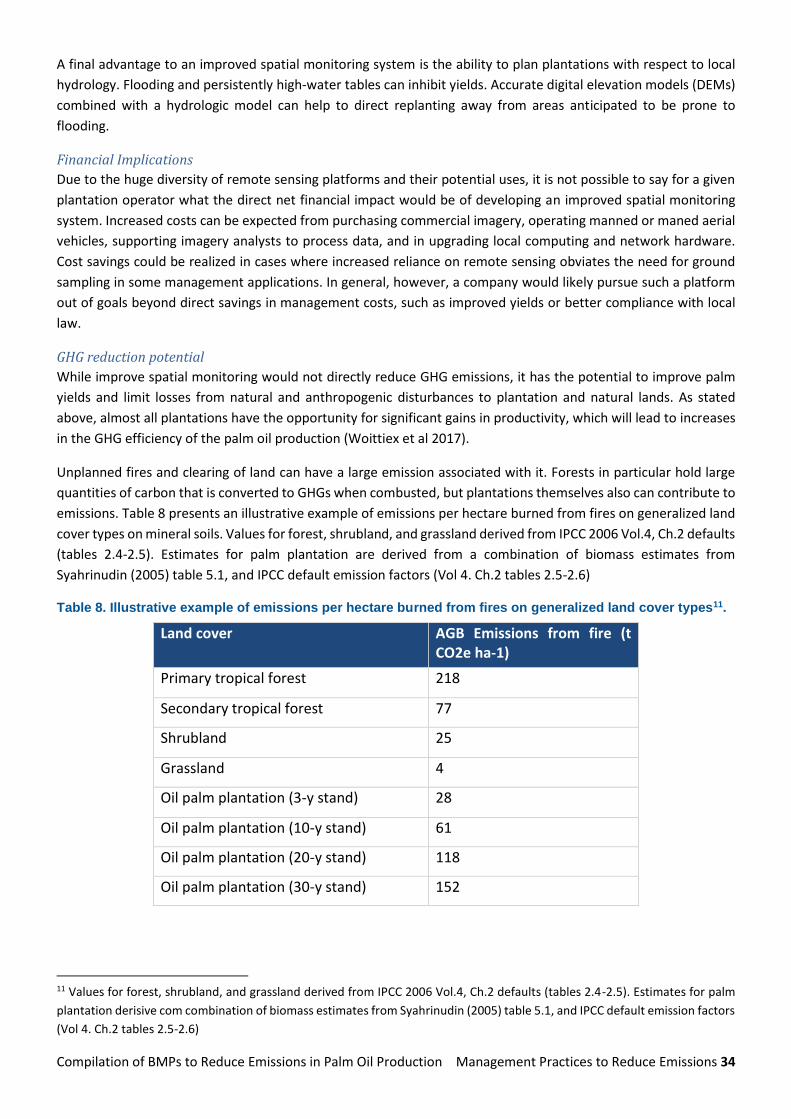
Compilation of BMPs to Reduce Emissions in Palm Oil Production Management Practices to Reduce Emissions 34
A final advantage to an improved spatial monitoring system is the ability to plan plantations with respect to local
hydrology. Flooding and persistently high-water tables can inhibit yields. Accurate digital elevation models (DEMs)
combined with a hydrologic model can help to direct replanting away from areas anticipated to be prone to
flooding.
Financial Implications
Due to the huge diversity of remote sensing platforms and their potential uses, it is not possible to say for a given
plantation operator what the direct net financial impact would be of developing an improved spatial monitoring
system. Increased costs can be expected from purchasing commercial imagery, operating manned or maned aerial
vehicles, supporting imagery analysts to process data, and in upgrading local computing and network hardware.
Cost savings could be realized in cases where increased reliance on remote sensing obviates the need for ground
sampling in some management applications. In general, however, a company would likely pursue such a platform
out of goals beyond direct savings in management costs, such as improved yields or better compliance with local
law.
GHG reduction potential
While improve spatial monitoring would not directly reduce GHG emissions, it has the potential to improve palm
yields and limit losses from natural and anthropogenic disturbances to plantation and natural lands. As stated
above, almost all plantations have the opportunity for significant gains in productivity, which will lead to increases
in the GHG efficiency of the palm oil production (Woittiex et al 2017).
Unplanned fires and clearing of land can have a large emission associated with it. Forests in particular hold large
quantities of carbon that is converted to GHGs when combusted, but plantations themselves also can contribute to
emissions. Table 8 presents an illustrative example of emissions per hectare burned from fires on generalized land
cover types on mineral soils. Values for forest, shrubland, and grassland derived from IPCC 2006 Vol.4, Ch.2 defaults
(tables 2.4-2.5). Estimates for palm plantation are derived from a combination of biomass estimates from
Syahrinudin (2005) table 5.1, and IPCC default emission factors (Vol 4. Ch.2 tables 2.5-2.6)
Table 8. Illustrative example of emissions per hectare burned from fires on generalized land cover types11.
Land cover AGB Emissions from fire (t CO2e ha-1)
Primary tropical forest 218
Secondary tropical forest 77
Shrubland 25
Grassland 4
Oil palm plantation (3-y stand) 28
Oil palm plantation (10-y stand) 61
Oil palm plantation (20-y stand) 118
Oil palm plantation (30-y stand) 152
11 Values for forest, shrubland, and grassland derived from IPCC 2006 Vol.4, Ch.2 defaults (tables 2.4-2.5). Estimates for palm
plantation derisive com combination of biomass estimates from Syahrinudin (2005) table 5.1, and IPCC default emission factors
(Vol 4. Ch.2 tables 2.5-2.6)
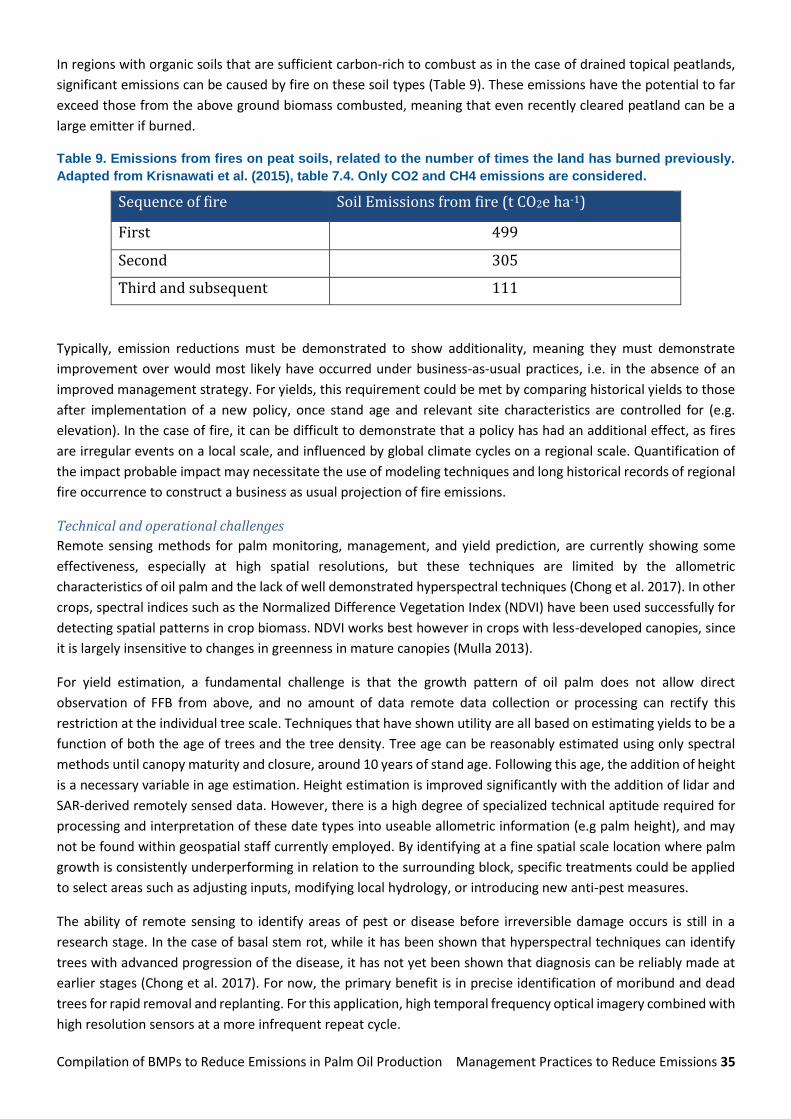
Compilation of BMPs to Reduce Emissions in Palm Oil Production Management Practices to Reduce Emissions 35
In regions with organic soils that are sufficient carbon-rich to combust as in the case of drained topical peatlands,
significant emissions can be caused by fire on these soil types (Table 9). These emissions have the potential to far
exceed those from the above ground biomass combusted, meaning that even recently cleared peatland can be a
large emitter if burned.
Table 9. Emissions from fires on peat soils, related to the number of times the land has burned previously.
Adapted from Krisnawati et al. (2015), table 7.4. Only CO2 and CH4 emissions are considered.
Sequence of fire Soil Emissions from fire (t CO2e ha-1)
First 499
Second 305
Third and subsequent 111
Typically, emission reductions must be demonstrated to show additionality, meaning they must demonstrate
improvement over would most likely have occurred under business-as-usual practices, i.e. in the absence of an
improved management strategy. For yields, this requirement could be met by comparing historical yields to those
after implementation of a new policy, once stand age and relevant site characteristics are controlled for (e.g.
elevation). In the case of fire, it can be difficult to demonstrate that a policy has had an additional effect, as fires
are irregular events on a local scale, and influenced by global climate cycles on a regional scale. Quantification of
the impact probable impact may necessitate the use of modeling techniques and long historical records of regional
fire occurrence to construct a business as usual projection of fire emissions.
Technical and operational challenges
Remote sensing methods for palm monitoring, management, and yield prediction, are currently showing some
effectiveness, especially at high spatial resolutions, but these techniques are limited by the allometric
characteristics of oil palm and the lack of well demonstrated hyperspectral techniques (Chong et al. 2017). In other
crops, spectral indices such as the Normalized Difference Vegetation Index (NDVI) have been used successfully for
detecting spatial patterns in crop biomass. NDVI works best however in crops with less-developed canopies, since
it is largely insensitive to changes in greenness in mature canopies (Mulla 2013).
For yield estimation, a fundamental challenge is that the growth pattern of oil palm does not allow direct
observation of FFB from above, and no amount of data remote data collection or processing can rectify this
restriction at the individual tree scale. Techniques that have shown utility are all based on estimating yields to be a
function of both the age of trees and the tree density. Tree age can be reasonably estimated using only spectral
methods until canopy maturity and closure, around 10 years of stand age. Following this age, the addition of height
is a necessary variable in age estimation. Height estimation is improved significantly with the addition of lidar and
SAR-derived remotely sensed data. However, there is a high degree of specialized technical aptitude required for
processing and interpretation of these date types into useable allometric information (e.g palm height), and may
not be found within geospatial staff currently employed. By identifying at a fine spatial scale location where palm
growth is consistently underperforming in relation to the surrounding block, specific treatments could be applied
to select areas such as adjusting inputs, modifying local hydrology, or introducing new anti-pest measures.
The ability of remote sensing to identify areas of pest or disease before irreversible damage occurs is still in a
research stage. In the case of basal stem rot, while it has been shown that hyperspectral techniques can identify
trees with advanced progression of the disease, it has not yet been shown that diagnosis can be reliably made at
earlier stages (Chong et al. 2017). For now, the primary benefit is in precise identification of moribund and dead
trees for rapid removal and replanting. For this application, high temporal frequency optical imagery combined with
high resolution sensors at a more infrequent repeat cycle.
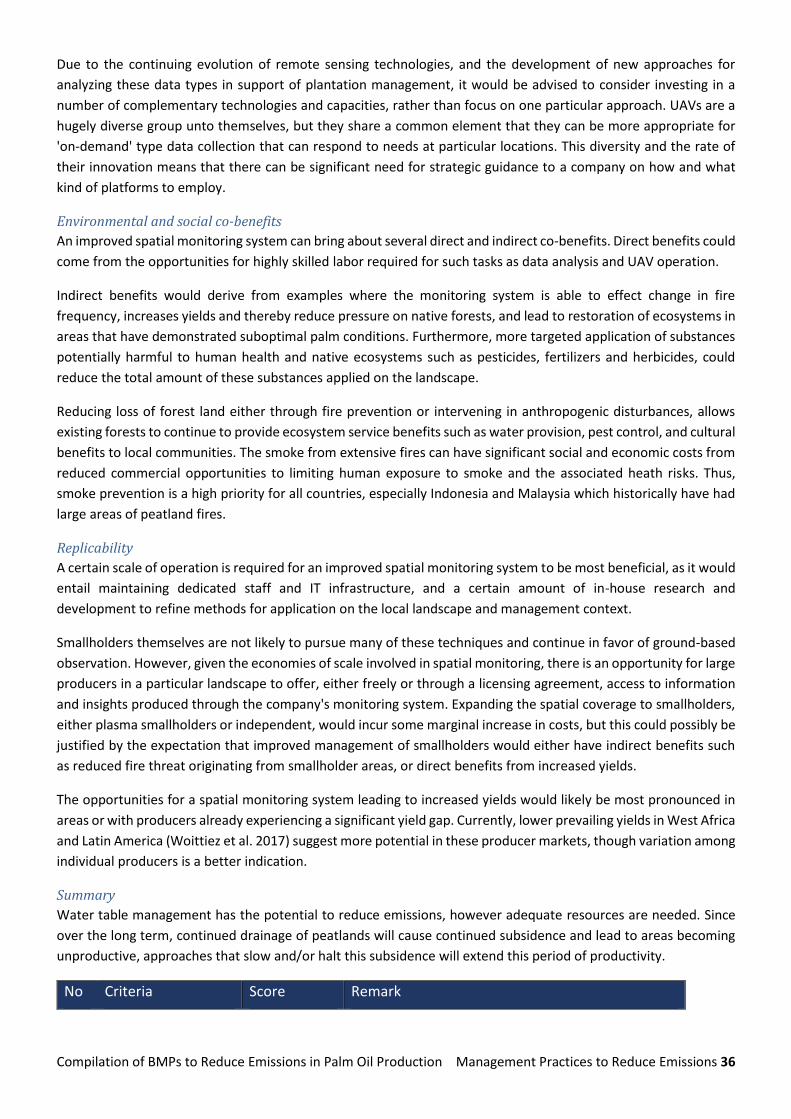
Compilation of BMPs to Reduce Emissions in Palm Oil Production Management Practices to Reduce Emissions 36
Due to the continuing evolution of remote sensing technologies, and the development of new approaches for
analyzing these data types in support of plantation management, it would be advised to consider investing in a
number of complementary technologies and capacities, rather than focus on one particular approach. UAVs are a
hugely diverse group unto themselves, but they share a common element that they can be more appropriate for
'on-demand' type data collection that can respond to needs at particular locations. This diversity and the rate of
their innovation means that there can be significant need for strategic guidance to a company on how and what
kind of platforms to employ.
Environmental and social co-benefits
An improved spatial monitoring system can bring about several direct and indirect co-benefits. Direct benefits could
come from the opportunities for highly skilled labor required for such tasks as data analysis and UAV operation.
Indirect benefits would derive from examples where the monitoring system is able to effect change in fire
frequency, increases yields and thereby reduce pressure on native forests, and lead to restoration of ecosystems in
areas that have demonstrated suboptimal palm conditions. Furthermore, more targeted application of substances
potentially harmful to human health and native ecosystems such as pesticides, fertilizers and herbicides, could
reduce the total amount of these substances applied on the landscape.
Reducing loss of forest land either through fire prevention or intervening in anthropogenic disturbances, allows
existing forests to continue to provide ecosystem service benefits such as water provision, pest control, and cultural
benefits to local communities. The smoke from extensive fires can have significant social and economic costs from
reduced commercial opportunities to limiting human exposure to smoke and the associated heath risks. Thus,
smoke prevention is a high priority for all countries, especially Indonesia and Malaysia which historically have had
large areas of peatland fires.
Replicability
A certain scale of operation is required for an improved spatial monitoring system to be most beneficial, as it would
entail maintaining dedicated staff and IT infrastructure, and a certain amount of in-house research and
development to refine methods for application on the local landscape and management context.
Smallholders themselves are not likely to pursue many of these techniques and continue in favor of ground-based
observation. However, given the economies of scale involved in spatial monitoring, there is an opportunity for large
producers in a particular landscape to offer, either freely or through a licensing agreement, access to information
and insights produced through the company's monitoring system. Expanding the spatial coverage to smallholders,
either plasma smallholders or independent, would incur some marginal increase in costs, but this could possibly be
justified by the expectation that improved management of smallholders would either have indirect benefits such
as reduced fire threat originating from smallholder areas, or direct benefits from increased yields.
The opportunities for a spatial monitoring system leading to increased yields would likely be most pronounced in
areas or with producers already experiencing a significant yield gap. Currently, lower prevailing yields in West Africa
and Latin America (Woittiez et al. 2017) suggest more potential in these producer markets, though variation among
individual producers is a better indication.
Summary
Water table management has the potential to reduce emissions, however adequate resources are needed. Since
over the long term, continued drainage of peatlands will cause continued subsidence and lead to areas becoming
unproductive, approaches that slow and/or halt this subsidence will extend this period of productivity.
No Criteria Score Remark
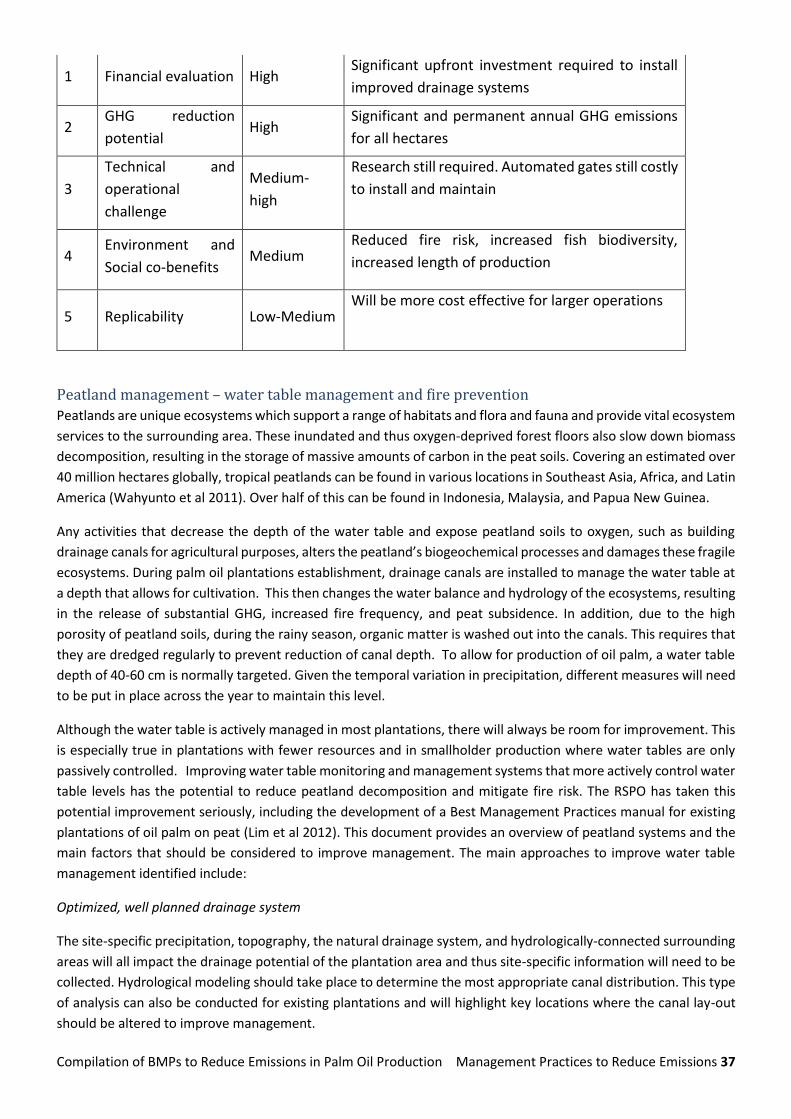
Compilation of BMPs to Reduce Emissions in Palm Oil Production Management Practices to Reduce Emissions 37
1 Financial evaluation High Significant upfront investment required to install
improved drainage systems
2 GHG reduction
potential High
Significant and permanent annual GHG emissions
for all hectares
3
Technical and
operational
challenge
Medium-
high
Research still required. Automated gates still costly
to install and maintain
4 Environment and
Social co-benefits Medium
Reduced fire risk, increased fish biodiversity,
increased length of production
5 Replicability Low-Medium Will be more cost effective for larger operations
Peatland management – water table management and fire prevention
Peatlands are unique ecosystems which support a range of habitats and flora and fauna and provide vital ecosystem
services to the surrounding area. These inundated and thus oxygen-deprived forest floors also slow down biomass
decomposition, resulting in the storage of massive amounts of carbon in the peat soils. Covering an estimated over
40 million hectares globally, tropical peatlands can be found in various locations in Southeast Asia, Africa, and Latin
America (Wahyunto et al 2011). Over half of this can be found in Indonesia, Malaysia, and Papua New Guinea.
Any activities that decrease the depth of the water table and expose peatland soils to oxygen, such as building
drainage canals for agricultural purposes, alters the peatland’s biogeochemical processes and damages these fragile
ecosystems. During palm oil plantations establishment, drainage canals are installed to manage the water table at
a depth that allows for cultivation. This then changes the water balance and hydrology of the ecosystems, resulting
in the release of substantial GHG, increased fire frequency, and peat subsidence. In addition, due to the high
porosity of peatland soils, during the rainy season, organic matter is washed out into the canals. This requires that
they are dredged regularly to prevent reduction of canal depth. To allow for production of oil palm, a water table
depth of 40-60 cm is normally targeted. Given the temporal variation in precipitation, different measures will need
to be put in place across the year to maintain this level.
Although the water table is actively managed in most plantations, there will always be room for improvement. This
is especially true in plantations with fewer resources and in smallholder production where water tables are only
passively controlled. Improving water table monitoring and management systems that more actively control water
table levels has the potential to reduce peatland decomposition and mitigate fire risk. The RSPO has taken this
potential improvement seriously, including the development of a Best Management Practices manual for existing
plantations of oil palm on peat (Lim et al 2012). This document provides an overview of peatland systems and the
main factors that should be considered to improve management. The main approaches to improve water table
management identified include:
Optimized, well planned drainage system
The site-specific precipitation, topography, the natural drainage system, and hydrologically-connected surrounding
areas will all impact the drainage potential of the plantation area and thus site-specific information will need to be
collected. Hydrological modeling should take place to determine the most appropriate canal distribution. This type
of analysis can also be conducted for existing plantations and will highlight key locations where the canal lay-out
should be altered to improve management.

Compilation of BMPs to Reduce Emissions in Palm Oil Production Management Practices to Reduce Emissions 38
All drainage system should be mapped in detail, including water flow direction and location of any water control
structures, water level monitoring points, and bunds. This information can be updated overtime to indicate
locations of more extreme flooding or drainage and high or low productivity. Due to subsidence, these maps will
need to updated over time (Lim et al 2012).
Water control structures
Structures such as gates, weirs, and bunds will need to be installed throughout the drainage system to allow active
water table control. Again, modeling can be used to identify optimal locations. Lim et al (2012) specifically points
out that consultation with local community members will provide useful site-specific information and helps ensure
agreement on water control structure locations and design. In coastal and tidal areas, soil bunds can be built to
protect fields from coastal water and automatic flap-gates should be installed at main outlets.
Based on the information received from on-going water table monitoring, these gates and weirs can be altered to
stabilize water tables.
Water table monitoring
The water table in peatland areas rapidly responds to the precipitation it has received. Over the year, even in natural
conditions, the water table of peatlands will vary between the wet and dry season. Thus, tools such as manual
water table gauges, piezometers, and emerging smart-technologies can be installed throughout the palm oil
plantation estates to actively monitor water table over time. This information can then be used to actively alter
water gates.
Fire prevention and suppression
Fires in plantations or surrounding natural lands represents a largely unproductive release of GHG emissions from
standing biomass and, in the case of peatlands, soil organic carbon. Peat fires also accelerate land subsidence and
lead to premature inundation of peatlands. Increasing recognition by governments, including Indonesia and
Malaysia, of the severe risks to human health of prolonged smoke inhalation has led to more strict enforcement of
fire prevention policies among palm producers. For example, the Indonesian government is pursuing a number of
strategies now to reduce the incidence of fire, focusing on rewetting and restoration of degraded peatlands,
incentives for villages to suppress fire, investments in haze and fire hotspot monitoring, and extension services to
emphasize alternatives to fire in land management. Along with the freely availably global data services that identify
fire hotspots within three hours, such as the NASA-operated Fire Information for Resource Management System
(FIRMS), 12 there are a number of government programs that implement the national-level fire strategies, such as
those articulated by the Coordinating Ministry for the Economy in the 2017-2019 Grand Design.13 An example is the
Manggala Agni14 firefighting brigades that operate in Kalimantan and Sumatra. Companies can consult with local
Malgala Agni office for a brief on the types of services that are available in their region, from monitoring to active
fire responding to community education.
Financial implications
Generally, the productivity of palm oil grown on peat is lower than that on mineral soils. In addition, productivity
declines more rapidly than that on peat, with declines being seen after only 7 years instead of 15 years on peat
12 https://earthdata.nasa.gov/earth-observation-data/near-real-time/firms
13 http://www.cifor.org/publications/pdf_files/Books/GrandDesign2017-2019.pdf
14 http://sipongi.menlhk.go.id/manggalaagni/sipongi

Compilation of BMPs to Reduce Emissions in Palm Oil Production Management Practices to Reduce Emissions 39
(Suryardiputra et al 2016; Dolmat et al 2002; Lubis 2008; Socfindo 2008). We are not aware at this time of specific
studies examining the productivity implications of improved water table management.
However, given the fragility of peatland ecosystems, the long-term economic viability of oil palm plantations on
peat soils is the subject of debate. Sumarga et al. (2016) modeled the impacts of establishing oil palm plantations
on peat soils with no history of flooding in 2011 and, even under optimal water management practices (i.e.,
managing 50 cm water level depth), projected that area would started to have flooding problem within 25 years.
This anticipated flood risk would also imply a decrease in yield, whereby fresh fruit bunches (FFB) would gradually
decrease. The study also showed that after 100 years, 67% of peatland area in Central Kalimantan that historically
did not have flooding issues would become annually flooded after oil palm plantation establishment (Sumarga et
al., 2016). Thus, any efforts to reduce unnecessary drainage will reduce decomposition rates, and thus subsidence
and the long-term potential productivity of oil palm production.
GHG reduction potential
Maintaining water table within the suggested range will not eliminate peat emissions or peat subsidence. Peat
decomposition will occur when water level is lowered, however the oxidation rate will be different depending on
the water table depth.
A range of research has taken place examining the GHG emissions and subsidence resulting from palm oil
production. In 2014, the IPCC presented an update to its 2006 guidelines specifically for wetlands (IPCC 2014, 2013)
in which existing research was compiled and digested. This analysis produced a Tier 1 emission factor of 55 t CO2e
ha-1yr-1 for tropical drained palm oil plantations (Hiraishi et al 2014) (Table 10) while The Indonesian Carbon
Accounting System (INCAS) assumes a default value of 40.3 t CO2e ha-1yr-1. These emissions also translate into
peat subsidence, which has been estimated to range between about 2 – 5 cm per year (Radjagukguk 1997; Wosten
and Ritzema 2001; Hooijer et al 2011; Couwenber and Hooijer 2013).
Table 10. Emission factors for CO2, N2O and CH4 emission in peat land in non-plantation areas
Land Cover Classes
CO2 (Table 2.1 Hiraishi et al., 2014; Table 1 Miettinen et al., 2017)
N2O (Table 2.5 IPCC 2013)
CH4 (Table2.3 IPCC 2013)
IPCC Classes t CO2/ha /year
IPCC Classes kg N2O/ha /year
IPCC Classes kg CH4/ha /year
Agriculture-Peat
Tropical plantations, drained, long rotations
55 Tropical plantation
1.9 Tropical plantation: oil palm
0
Bare land (operational)-Peat
Tropical plantations, drained, short rotations, e.g. acacia
73 Tropical forest land, cleared forest land, shrub land
3.8 Tropical forest land, cleared forest land, shrub land
4.9
Bare land (Others) -Peat
Tropical forest land, cleared forest land, shrub land
19 Tropical forest land, cleared forest land, shrub land
3.8 Tropical forest land, cleared forest land, shrub land
4.9
Swamp-peat Tropical grassland
35 Tropical grassland
7.9 Tropical grassland
7

Compilation of BMPs to Reduce Emissions in Palm Oil Production Management Practices to Reduce Emissions 40
Although it is helpful to have this type of standard estimate, it is not possible to use this approach to estimate
the impact of improved management. Fortunately, additional research has been done looking at this
relationship between water table and annual emissions (Figure 9). Using this approach, every 1 cm of raised
mean annual water table levels, translates into an emission reduction of over 5 t CO2e ha-1 yr-1 (Jauhianinen
et al 2012). Significant CO2 and CH4 emissions also take place directly from canals (IPCC Tier 1 default values
of 3.01 t and 56.48 t CO2e ha-1 yr-1 respectively; Hiraishi et al 2014), and thus reducing the size and length of
canals within concession areas will also reduce annual GHG emissions.
Figure 9. Estimating annual CO2 emissions in comparison to water table measurements from various studies
in Indonesia and Malaysia
In addition, water table management is also an important element in fire prevention and management. Peat fires
are a significant source of GHG emissions, and while they can occur naturally during the dry season or El Nino events
when water depth can drop below 30 cm (Agus and Subiksa, 2008), they are rare in undrained peat areas. Although
the most severe fires of recent years can be linked to droughts driven by the ENSO climate anomaly, peat fires are
now a regular feature of every dry season, even those of short duration.
The depth of peat burned during a fire event has been found to range significantly, and will in part be associated
with depth of drainage. Agus and Subiksa (2008) report that 75 Mg C ha-1 is emitted for every 15 cm peat burned,
containing 50 kg C m-3. Peat burn depths have been reported at 0.33 m (Ballhorn et al., 2009) and 0.18 (Konecny et
al., 2016) which represent strong and weak El-Nino, respectively. Both of these values were developed using LiDAR,
which allows for interpolation of the potential surface prior to fire event, based on the unburned surface.
Calculating emissions from peat fires based on the approach in the IPCC Wetland Supplements (Hiraishi et al., 2014)
results in GHG emissions of almost 90 t CO2e ha-1 for every 10 cm of peat burned. Thus reducing both the area and
the depth of peat burned provides significant emission reduction potential. These estimates only include the
emissions from peat burned15. If the fires also consumed vegetation, this would add additional GHG emissions to
this estimate per hectare.
Manggala Agni Unit
15 Assuming a bulk density of 0.09 t m-3 (Page et al 2011)
0
50
100
150
200
0 0 . 2 5 0 . 5 0 . 7 5 1 1 . 2 5 1 . 5 1 . 7 5 2
CO
2em
iss
ion
s (t
on
CO
2h
a-1yr
-1)
Water table depth (m)
Carlson et al. (2015)Hoojier et al. (2012)Jauhiainen et al. (2012)Wakhid et al. (2017)Husnain et al. (2014) secondary forest

Compilation of BMPs to Reduce Emissions in Palm Oil Production Management Practices to Reduce Emissions 41
Canal gate technologies vary from simple sand bags to metal automated gates. Due to ongoing subsidence and
periodic high precipitation events that can cause flooding, cement structures are not recommended materials for
dams or gate construction. While automated gates that shift based on water table levels do provide high level of
control, due to the expense related to installation and maintenance these will generally be only used for main
canals.
These costs, and the risk of productivity reductions do need to be carefully weighed against improved water table
management increasing the length of time a plantation can viably be productive before subsidence is too
significant.
Water table monitoring approaches can also range from simple water gauges and dipwells, to automated
piezometers. Newer technologies that rely on inexpensive water table sensors and mobile towers are currently
under development16. This holds the promise of reducing overall costs required to understand real time water table
levels across a plantation.
Environment and Social co-benefits
Beyond greenhouse gas emission reductions, maintaining suitable water tables slow peatland subsidence and
reduce fires. The long-term use of drained peatland areas, leading to extended subsidence has the potential to
result in large areas of land that are frequently inundated and unproductive, threatening the livelihoods of a large
number of communities. Thus, slowing subsidence is critical to these communities.
Replicability
Adequate resources are needed to manage water table. Big companies are likely to manage drainage canals
according to the available best practices. Small and medium companies will face constraint to do so due to limited
financial and human resources.
Summary
Water table management has the potential to reduce emissions, however adequate resources are needed. Since
over the long term, continued drainage of peatlands will cause continued subsidence and lead to areas becoming
unproductive, approaches that slow and/or halt this subsidence will extend this period of productivity.
No Criteria Score Remark
1 Financial evaluation High Significant upfront investment required to install
improved drainage systems
2 GHG reduction
potential High
Significant and permanent annual GHG emissions
for all hectares
3
Technical and
operational
challenge
Medium-
high
Research still required. Automated gates still costly
to install and maintain
4 Environment and
Social co-benefits Medium
Reduced fire risk, increased fish biodiversity,
increased length of production
5 Replicability Low-Medium Will be more cost effective for larger operations
16https://www.winrock.org/document/reducing-ghg-emissions-from-peat-lands-and-oil-palm-in-indonesia-a-jurisdictional-
approach/

Compilation of BMPs to Reduce Emissions in Palm Oil Production Management Practices to Reduce Emissions 42
Improved smallholder production
Smallholder farmers are a major producer of CPO in many countries. In Indonesia in 2013, smallholder farmers
managed about 40% of total oil palm plantation area, and generated an estimated 35% of CPO nationwide (Table
11). Similar to Indonesia, about 38% of total Malaysian oil palm plantation is managed by smallholder farmers.
(Malaysia Palm Oil Board, 2014).
Table 11. Indonesia palm oil overview (Source: Badan Pusat Statistik 2013)
Managed plantation area (ha) CPO production (tonnes)
Private Companies 5,366,854 15,012,254
State-owned enterprises 803,817 2,378,214
Smallholder farmers 4,415,796 9,504,982
Smallholders influence GHG emissions in two key ways. Typically, low yields per hectare compared to commercial
plantations result in greater demand for new land as demand for CPO increases. Helping smallholders maximize
yields on smaller parcels of land will cut the impact on emissions related to clearing of high biomass natural lands,
as well loss of soil organic matter in peat landscapes. Secondly, certain unsustainable practices result from the lack
of the ability of smallholders to pursue landscape-scale impact reduction strategies that are too expensive to be
financed by any individual producer, such as water management or fire suppression.
Figure 10. Smallholders weighing harvest (source: http://www.wri.org/blog/2018/03/smallholder-farmers-are-key-
making-palm-oil-industry-sustainable)
Yield improvement
Low yields are a worldwide problem that are not unique to smallholders, with global CPO yields reaching only 3.3t
ha-1 y-1 of a potential of at least 8.0 for most regions irrespective of producer type (Woittiez et al. 2017), Figure 11).
In Indonesia, smallholder production of FFB has been estimated at around 15 t y-1, compared to 17 t y-1 nationally
(Woittiez et al. 2017).

Compilation of BMPs to Reduce Emissions in Palm Oil Production Management Practices to Reduce Emissions 43
Figure 11. Comparison of dominance and yields of producers in Indonesia (courtesy of KADIN)
Some of the causes of this yield gap are compounded for smallholder producers where access to finance,
information, and secure land tenure inhibits making appropriate investments in management practices. These
include failing to replant over-mature stands with declining productivity, lack of access to appropriate seeds or
presence of counterfeit seeds, insufficient fertilizer application, irregular watering, and failure to account for
specifics of site conditions as it relates to optimizing a management strategy.
Companies can help smallholders to improve yields through addressing the four pillars of sustainable inclusion of
smallholders described by Fernandez-Stark & Bamber (2012) (Figure 12).
Figure 12. Four pillars for sustainable inclusion of smallholders in the global value chain (taken from:
Fernandez-Stark & Bamber,2012)
Companies can provide this assistance to smallholders they are involved with in a number of ways, and the specific
strategy pursued in any given landscape or market will depend greatly on local legal, economic and ecological
conditions. Ongoing finance is needed by farmers to support yields primarily related to fertilizer purchase, land

Compilation of BMPs to Reduce Emissions in Palm Oil Production Management Practices to Reduce Emissions 44
preparation, and clearing/replanting. Companies can support financing mechanisms that help farmers gain access
to these inputs and services at critical times.
Information and training dissemination is also a key area that companies can play in important role. Ground cover
management, pest and disease control and genetics selection are all areas where smallholders’ yields are impacted
due to failure to adhere to best management practices, regardless of access to inputs. Companies can evaluate
prevailing practices of local smallholders to determine priorities for BMP extension. In some cases, site specific
features like topography, soil conditions, and microclimate influence the selection of management approach. In
such cases, companies that are already engaging in this kind of location-targeted management can extend the
underlying analyses to smallholder areas and use this to inform the kinds of interventions to support in specific
areas.
Efforts to promote yield intensification have started to emerge in palm oil sector. In Ghana, the International Plant
Nutrition Institute (IPNI) has initiated a large-scale collaborative project with oil palm plantations and smallholders
supported by Solidaridad West Africa across Ghana. The project aims to facilitate the effective use of production
inputs, such as crop residues and mineral fertilizers, and to assist plantation staff and smallholders in the
identification and implementation of improved agronomic techniques. Demonstration plots were established to
introduce the best management practices (BMPs) while also serving as a learning center for smallholders and
plantation staffs. The project has demonstrated substantial yield increases with introduction of BMPs and
supported knowledge dissemination through training activities and development of BMP knowledge products.
Improved sustainability
In the case of small plantations on peatlands, poorly managed water tables represent a very specific but large
emissions source. From a yield perspective, inappropriate or uncontrolled water table levels can result in premature
land subsidence and permanent inundation, excessive palm toppling, and increase the severity of any fires that do
occur. Ideally, water tables in peatlands are maintained at optimal levels for palm growth, and in compliance with
national regulations, through active management of water across the landscape through water table monitoring,
damn operation, and canal maintenance. Such water table management is a significant undertaking where success
requires the ability to react quickly to changing climate conditions over a hydrologically connected landscape, and
to be able to anticipate the results of any intervention to redirect or store water. Smallholders often develop their
drainage networks by digging canals that connect into systems put in place by local companies. This means that
companies are often already engaged in management of portions of hydrologic provinces that include smallholders.
There is potential to expand collaboration with the communities, including extending water table and fire
monitoring activities and installing and operating flow control systems into smallholder managed portions of the
landscape. This would allow for a more holistically managed peat landscape that would result in improved
adherence water table targets for both company and smallholder lands.
In some cases, smallholders may be cultivating peatlands that are unlikely to be productive under any scenario, or
that could produce better financial returns under another crop type. By understanding the characteristics and
challenges of the peatlands, smallholders can decide the best management option for their plantation hence
increase the sustainability concern and productivity. A guideline prepared by Winrock International in collaboration
with Cargill, IDH, and Costco was made to encourage smallholders to sustainably and optimally manage their
plantations that exist on peatlands in order to fulfill their economic needs and environmental sustainability
(Suryadiputra et al 2017). In this guideline, smallholders are invited to understand their plantation conditions such
as soil type, depth, and inundation condition. Farmer can therefore decide the best management options and
investment according to the condition. For example, if the peat’s depth is found to be > 3 m, farmer can focus on
the water level management or finding alternative commodities that endemic to peat and have more economic
value such as Jelutung, Ramin, and Jabon. If the land is suitable for oil palm cultivation, smallholders can manage

Compilation of BMPs to Reduce Emissions in Palm Oil Production Management Practices to Reduce Emissions 45
and improve their plantation by establishing a joint management (Farmers’ organization or cooperative), managing
water table, using high quality seedlings, palm tree weeding, and doing integrated pest management (IPM).
In peatland smallholder production areas, improved fire prevention and fire suppression will be another key
approach to both increasing long term sustainability and farmer incomes, but also reducing greenhouse gas
emissions. Along with the support provided by government agencies, such as in Indonesia Manggala Agni, and
provincial level Disaster Mitigation Agencies, in fire alert and suppression, village fire brigades can serve as the first
line of defense. After receiving training and the appropriate equipment, such brigades are an important approach
to slowly the expansion of fires as they arise.
Examples of financing schemes
Financing schemes and policy framework play important roles in palm oil development, however, to date they still
mainly focus on large companies and there is less reliance on supply chain financing schemes. According to ISCC
(2017), financing the smallholder farmers also struggles with lack of data, information, and high operational costs
due to remote location which results in a perceived unattractive risk. An integrated financing scheme based on
supply chain while also allowing access to finance, market, and best management practices for smallholder farmers
is needed to overcome this issue. This scheme also requires more programmatic approach, involving national and
provincial government, the financial sector, farmer organizations, mills and other stakeholders in the palm oil
supply chain.
One of this integrated model was proposed by Financial Access Netherlands and SNV (Figure 13). The model aims
to increase the mobilization of long-term finance for oil palm smallholders. It is focused on the key enabling
conditions such as incentives to meet sustainability standard certification, land tenure security, improved market
linkage between smallholders and mills, risk management, and smallholder organization. Further, it also allows
smallholders to receive knowledge on best agricultural practices hence improving productivity and smallholders’
livelihood.
Figure 13. Financing scheme proposed by Financial Access and SNV (taken from Financial Access)
The Indonesian Chamber of Commerce (KADIN) recently started a new financing scheme for 1 million independent
oil palm planters (Jupesta and Lakitan, 2014) (Figure 11). Using this scheme, independent farmers will be supported
by KADIN’s facilitation of funding from financial institutions through cooperatives. These cooperatives will develop
loan products with interest rates affordable to farmers looking to receive additional capital for investment including
replanting. It is hoped that this type of investment will double annual yields and lead to a replanting of 2 million

Compilation of BMPs to Reduce Emissions in Palm Oil Production Management Practices to Reduce Emissions 46
hectares involving 1 million independent smallholders. If this is born out, an additional 6 million tons of oil would
be produced, resulting in an additional income of approximately US$4 billion to US$5 billion a year, based on the
CPO price of US$800 per ton (Jupesta and Lakitan 2014). In addition, it is hoped that this scheme would also
significantly reduce additional areas being converted from natural forest.
The Partnership for Sustainable Indonesian Agriculture (PISAgro) program was launched in 2012 by Sinar Mas Agro
Resource and Technology (SMART) as a financial mechanism for smallholder farmers. Within this scheme, SMART
serves as a guarantor for the credit given by the state-owned bank to the smallholder, with a 6% interest rate for
the initial four years and 10.5% afterwards. Training programs on best agricultural management practices are taking
place, with the goal of increasing productivity, and thus GHG efficiency. The scheme has 20-20-20 goals: a
productivity increment of 20%, poverty reduction by 20% and reduction of CO2 emissions by 20%17. In return, the
company will be allowed to collect the harvest from smallholders under a price mechanism monitored by local
government.
Summary
Both integrated smallholder financing scheme and yield intensification provide high social and environmental
benefits to the palm oil production. Smallholders’ inclusion into the supply chain would result in increasing
sustainability concerns therefore help reducing environmental risks especially deforestation. Through
dissemination of best management practices to improve productivity, smallholders would gain more profits thus
improve their livelihood. However, it also depends on the financing model applied. Most of the financing models
have just been developed or launched, making it too early to determine whether they are best for replication and
scaling-up.
Criteria Score Remark
1 Financial evaluation Medium to high
High upfront cost to initiate financing scheme
and coordinate with related stakeholders in the
supply chain
2 GHG reduction
potential Medium to high
Avoided land use change by
smallholder/intensification can lead to high GHG
emission reduction
3 Technical and
operational challenge Medium
Good knowledge of best agricultural practice is
needed
4 Environment and
Social co-benefits High
Avoided unsustainable practices, environmental
risks, and danger for deforestation. Improve
farmers’ livelihood
5 Replicability High Can be implemented by all scale of plantation.
Integrated Pest Management
Pests such as leaf web worm, rhinoceros beetle, slug caterpillar, and mealybugs have the potential to disrupt
plantation productivity, with reported yield losses between 25% and 50% 50% in heavy infestation (Kalidas, 2012;
Woittiez et al., 2017). As a preventative measure, insecticides and pesticides can be applied to manage pests in the
17 www.pisagro.org
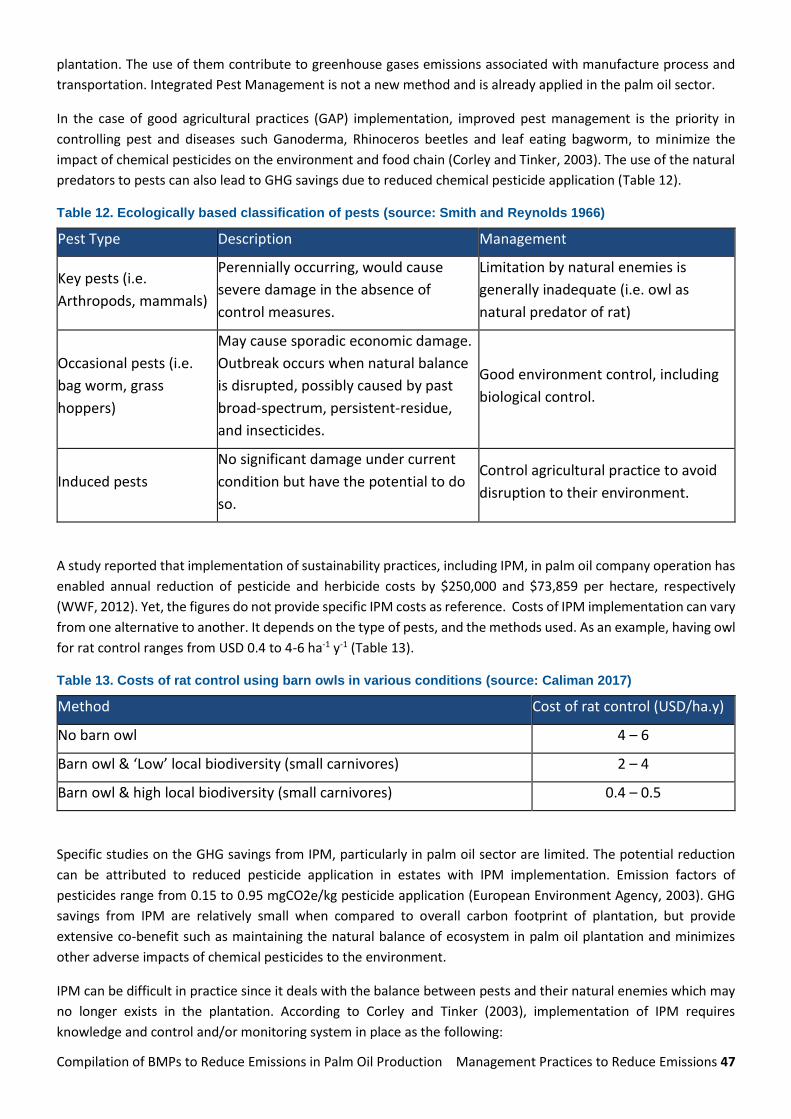
Compilation of BMPs to Reduce Emissions in Palm Oil Production Management Practices to Reduce Emissions 47
plantation. The use of them contribute to greenhouse gases emissions associated with manufacture process and
transportation. Integrated Pest Management is not a new method and is already applied in the palm oil sector.
In the case of good agricultural practices (GAP) implementation, improved pest management is the priority in
controlling pest and diseases such Ganoderma, Rhinoceros beetles and leaf eating bagworm, to minimize the
impact of chemical pesticides on the environment and food chain (Corley and Tinker, 2003). The use of the natural
predators to pests can also lead to GHG savings due to reduced chemical pesticide application (Table 12).
Table 12. Ecologically based classification of pests (source: Smith and Reynolds 1966)
Pest Type Description Management
Key pests (i.e.
Arthropods, mammals)
Perennially occurring, would cause
severe damage in the absence of
control measures.
Limitation by natural enemies is
generally inadequate (i.e. owl as
natural predator of rat)
Occasional pests (i.e.
bag worm, grass
hoppers)
May cause sporadic economic damage.
Outbreak occurs when natural balance
is disrupted, possibly caused by past
broad-spectrum, persistent-residue,
and insecticides.
Good environment control, including
biological control.
Induced pests
No significant damage under current
condition but have the potential to do
so.
Control agricultural practice to avoid
disruption to their environment.
A study reported that implementation of sustainability practices, including IPM, in palm oil company operation has
enabled annual reduction of pesticide and herbicide costs by $250,000 and $73,859 per hectare, respectively
(WWF, 2012). Yet, the figures do not provide specific IPM costs as reference. Costs of IPM implementation can vary
from one alternative to another. It depends on the type of pests, and the methods used. As an example, having owl
for rat control ranges from USD 0.4 to 4-6 ha-1 y-1 (Table 13).
Table 13. Costs of rat control using barn owls in various conditions (source: Caliman 2017)
Method Cost of rat control (USD/ha.y)
No barn owl 4 – 6
Barn owl & ‘Low’ local biodiversity (small carnivores) 2 – 4
Barn owl & high local biodiversity (small carnivores) 0.4 – 0.5
Specific studies on the GHG savings from IPM, particularly in palm oil sector are limited. The potential reduction
can be attributed to reduced pesticide application in estates with IPM implementation. Emission factors of
pesticides range from 0.15 to 0.95 mgCO2e/kg pesticide application (European Environment Agency, 2003). GHG
savings from IPM are relatively small when compared to overall carbon footprint of plantation, but provide
extensive co-benefit such as maintaining the natural balance of ecosystem in palm oil plantation and minimizes
other adverse impacts of chemical pesticides to the environment.
IPM can be difficult in practice since it deals with the balance between pests and their natural enemies which may
no longer exists in the plantation. According to Corley and Tinker (2003), implementation of IPM requires
knowledge and control and/or monitoring system in place as the following:

Compilation of BMPs to Reduce Emissions in Palm Oil Production Management Practices to Reduce Emissions 48
• Knowledge of the life cycle and ecology of the pest and its natural enemies to extent to be able to
manipulating biological control.
• A monitoring system to ensure early detection of outbreaks, to enable timely control measures.
• Establishment of economic damage and action thresholds, to ensure that control measures are carried out
when necessary.
• Selective control measures to promote swift re-establishment of natural balance.
Complementing IPM implementation, research and development of stable nanoparticles/ nanocapsules/
nanofibers of pheromone could advance the practice of pest management in the future. The nano-formed can be
designed to hold the pheromones in sufficiently high concentrations and can control the dissipation rate due to
either evaporation or adsorption in an environment (Kalidas, 2012).
IPM is considered as one good agricultural practices (GAP) to reduce GHG emissions through avoided pesticides use
(Subramaniam, et. al, 2017). It enables plantation to avoid yield loss and also keep the natural balance in palm oil
plantation. IPM can be applied by any scale of plantation or company. However, establishing economic damage and
action threshold requires set of knowledge and skill in pests life cycle in which this expertise might not exist in small
plantations and individual growers.
Summary
Criteria Score Remark
1 Financial evaluation Low Low investment and maintenance costs
2 GHG reduction potential Low Relatively low when compared to total GHG
emissions
3 Technical and operational challenge Low Yet it requires knowledge and skill to
maintain the balance.
4 Environment and Social co-benefits Medium Avoided adverse impacts of pesticide
application, maintain natural ecosystem.
5 Replicability High Can be implemented by all scale of
plantation.
Fuel Use in Plantation
Fossil fuel, dominated by diesel, is still the primary energy source used for nursery, maintenance, harvesting,
collection, and transportation of Fresh Fruit Bunches in oil palm plantation. GHG emissions related to diesel
consumption for machinery and transport vary depending on fuel consumption, trucks capacity, FFB yield, and
distance covered. RSPO (2009) has summarized the GHG emissions related to diesel plantation for internal
transportation and machinery as ranging from 180 – 404 kg CO2e ha-1 yr-1. Research conducted under the CIRCLE,
found that fossil fuel use accounts to 10% of the total GHG emissions from plantation (CIRCLE, 2015) thus finding
alternative fuels to replace fossil fuel consumption could help palm oil companies to create positive impacts on
climate change mitigation through the GHG emissions reduction.
Palm oil mill effluent (POME) can be an excellent renewable energy source. Many companies have started to invest
in methane capture technology, where the biogas is captured. This is used mainly for heating and electrification for
internal demand, however, in many locations the potential amount of biogas supply exceeds the internal demand
and thus could be employed externally. Unfortunately, one of the main barriers hindering the installation of biogas
plants is that palm oil mills are often located far from the existing national grid and point of demand, hindering
effective application of biogas. Exploring biofuel potential could be an option to further utilize POME in the form of
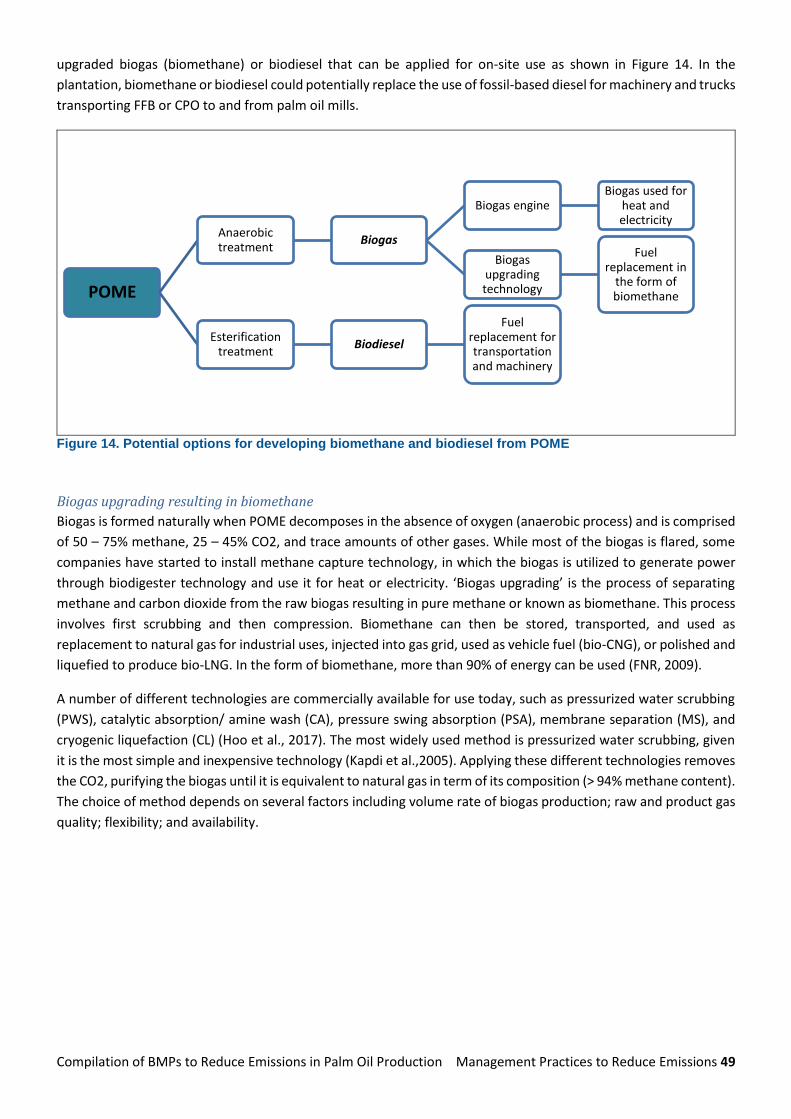
Compilation of BMPs to Reduce Emissions in Palm Oil Production Management Practices to Reduce Emissions 49
upgraded biogas (biomethane) or biodiesel that can be applied for on-site use as shown in Figure 14. In the
plantation, biomethane or biodiesel could potentially replace the use of fossil-based diesel for machinery and trucks
transporting FFB or CPO to and from palm oil mills.
Figure 14. Potential options for developing biomethane and biodiesel from POME
Biogas upgrading resulting in biomethane
Biogas is formed naturally when POME decomposes in the absence of oxygen (anaerobic process) and is comprised
of 50 – 75% methane, 25 – 45% CO2, and trace amounts of other gases. While most of the biogas is flared, some
companies have started to install methane capture technology, in which the biogas is utilized to generate power
through biodigester technology and use it for heat or electricity. ‘Biogas upgrading’ is the process of separating
methane and carbon dioxide from the raw biogas resulting in pure methane or known as biomethane. This process
involves first scrubbing and then compression. Biomethane can then be stored, transported, and used as
replacement to natural gas for industrial uses, injected into gas grid, used as vehicle fuel (bio-CNG), or polished and
liquefied to produce bio-LNG. In the form of biomethane, more than 90% of energy can be used (FNR, 2009).
A number of different technologies are commercially available for use today, such as pressurized water scrubbing
(PWS), catalytic absorption/ amine wash (CA), pressure swing absorption (PSA), membrane separation (MS), and
cryogenic liquefaction (CL) (Hoo et al., 2017). The most widely used method is pressurized water scrubbing, given
it is the most simple and inexpensive technology (Kapdi et al.,2005). Applying these different technologies removes
the CO2, purifying the biogas until it is equivalent to natural gas in term of its composition (> 94% methane content).
The choice of method depends on several factors including volume rate of biogas production; raw and product gas
quality; flexibility; and availability.
POME
Anaerobic treatment
Biogas
Biogas engineBiogas used for
heat and electricity
Biogas upgrading technology
Fuel replacement in
the form of biomethane
Esterification treatment
Biodiesel
Fuel replacement for transportation and machinery

Compilation of BMPs to Reduce Emissions in Palm Oil Production Management Practices to Reduce Emissions 50
In addition to injection into any existing natural gas grid,
biomethane can also be used as a transport fuel in the
form of bio-compressed natural gas (bio-CNG) and bio-
liquefied natural gas (bio-LNG). With its similar
characteristics to natural gas, biomethane is suitable as
renewable natural gas used in all engines running on
natural gas. While LNG is mostly used for high-fuel
demanding vehicles such as highway trucks and
construction equipment, CNG is more common for
other type of vehicles. Converting POME to bio-CNG
offers a clear opportunity for the palm oil companies to
increase the sustainability of palm oil production. Using
bio-CNG as transport fuel for trucks delivering FFB and
CPO in palm oil industry will also widen the biogas
utilization beyond electricity generation and heating.
Figure 16. Process flow diagram for the production of bio-CNG from POME (taken from: Nasrin et al., 2017)
To create Bio-CNG from POME requires a biogas upgrading plant. This consists of three main operation units: pre-
treatment, upgrading, and storage as depicted in Figure 16. The investment cost for a biogas upgrading plant
depends on the type of upgrading technology applied. Hoo et al. (2017) summarizes the cost for upgrading
technologies ranges between US$4,167 to US$12,369 per m3/h of Bio CNG production once installed. Given this
range, a 400 m3/h plant would need around US$ 1.7 million of investment. O&M costs will vary but are estimated
between US$10,701 to US$16,640 per m3/h (Hoo et al., 2017). The first commercial biogas upgrading plant from
POME at Felda Palm Oil Mill Sg Tengi, Kuala Kubu Bahru, Selangor, Malaysia cost around US$ 1.7 million to produce
400 m3/h of bio-CNG. The POME raw biogas is upgraded from composition of 60% methane, 35% CO2 and 3000
ppm H2S to bio-CNG with > 94% methane content. The bio-CNG is then compressed and dispensed into CNG trailers
to be delivered to factories. OMI Alloy (M) Sdn Bhd, located about 45 km away from the plant, is the first factory
receiving POME-based bio-CNG.
Figure 15. View of fuel storage for truck after
conversion from diesel to CNG or liquified biogas
operation.
http://www.g3industries.com/page/pressed-steel-
tanks

Compilation of BMPs to Reduce Emissions in Palm Oil Production Management Practices to Reduce Emissions 51
Table 14. Economic analysis of a 400 m3/hour bio-CNG (biomethane) plant
Description Value
Bio-CNG Plant Only Biogas and Bio-CNG Plant
Investment cost (USD million) 1.78 3.04
Annual production (million m3, 72000 h/year)
2.46
(~80,000 MMBTu)
Net present value 10%, (USD) 461,000 43,040
IRR (%) 14.36 10.25
Payback period (year) 6.03 7.5
Assumption:
Bio-CNG selling price @ MYR 40.00 – 46.00 MMBTu-1
Operational expenditure @ MYR 25.50 MMBTu-1
Source: (Nasrin, 2017)
For a palm oil company’s fleet to utilize the Bio-CNG produced would also require conversion from gasoline to bio-
CGN for each vehicle. This includes incorporating several additional parts, including fuel storage cylinders (usually
placed underneath the vehicle or in the trunk), stainless steel fuel lines, a regulator to reduce the pressure, and a
special fuel-air mixer. The cost for the conversion varies from approximately US$6,000–US$12,000 per vehicle
depending on the vehicle model, engine type, engine size, type of conversion and the number of fuel storage
cylinders. For example, converting a gasoline-fueled Ford F150 5.4 L to bio-CNG operation costs approximately
US$6,600. Although this capital outlay is relatively large, the annual fuel savings, estimated by Enbridge Gas
Distribution, is approximately $3,500 (based on $1.30/L gas and $0.75/L compressed natural gas) are also significant
(Clarke, 2012) and thus can be recaptured within two years.
Thus, Bio-CNG is a real potential alternative to replace transportation fossil fuel consumption in the palm oil
industry. It offers economic and environmental benefits through cost savings and GHG reduction. A vehicle
operated with biomethane reduces CO2 emissions by up to 90 % compared to a conventional petrol-fueled vehicle.
However, support and incentive systems for biomethane as transport fuel are still needed to promote the system
in the industry which may include Feed-in-Tariffs (FiT), regulation, tax reduction, quota system (renewable energy
shares), and support on infrastructure. Successful projects like bio-CNG plant at Felda Palm Oil Mill Sg Tengi could
also motivate palm oil companies to adopt the system.
Esterification resulting in bio-diesel
In addition to biomethane, another potential untapped energy source is the production of biodiesel from POME.
Research conducted by Paryanto et al. (2015) found that integrating biodiesel plant with the palm oil mill complex
is a strategy to produce biodiesel fuel with lower investment cost compared to non-integrated biodiesel plant.
Further, this biodiesel product could be used as a substitute for conventional diesel used internally by the palm oil
industry.
This biodiesel can be produced through a set of chemical processes called esterification followed by
transesterification system or direct transesterification. The exact method applied is dependent on the quality of
the oil raw material. Oil raw material with relatively low content of free fatty acid (< 5%) such as crude palm oil
(CPO), is processed with the direct transesterification reaction by adding the methanol mixed with a base catalyst,
followed by separation and purification processes. Oil raw material with higher content of free fatty acid (> 5%),
such as PFAD and low-grade crude palm oil from POME, is processed with the esterification reaction followed by
the transesterification reaction. Biodiesel produced is then separated from glycerol and excess methanol by

Compilation of BMPs to Reduce Emissions in Palm Oil Production Management Practices to Reduce Emissions 52
washing process and purified by vacuum evaporation and filtration (Paryanto et al.,2013) (Figure 17). The pre-
treatment process and selection of catalyst used in esterification stage play important roles in generating a good
quality of POME biodiesel.
Figure 17. Biodiesel production process (taken from Paryanto et al 2013)
Imam et al. (2014) estimates the investment cost of a 1 Ton/day biodiesel plant using POME as raw material could
reach around US$175,000. This cost includes civil works, equipment, storage tanks, pumps, piping and cost of
feasibility study as shown in Table 15. This cost is approximately 15% lower compared to biodiesel plant that is not
integrated with palm oil mill and uses CPO as raw material. POME-sourced biodiesel can then be used as a sole
biofuel or blended with fossil fuels.
Table 15. Estimated investment cost of a 1 TPD biodiesel plant from POME (taken from Imam et al 2007)
Item IDR
Building and civil works 400,000,000
Equipment 745,000,000
Storage tanks 90,000,000
Pumps and motors 170,000,000
Utilities (steam, electricity/genset, water) 100,000,000
Electrical and instrumentation 125,000,000
Piping 270,000,000
Feasibility study and engineering 250,000,000
Commissioning and training 110,000,000
Overhead 125,000,000
Total 2,835,000,000
~ USD 175,000

Compilation of BMPs to Reduce Emissions in Palm Oil Production Management Practices to Reduce Emissions 53
Generating biodiesel directly from palm oil (CPO) has caused concern around the sustainability of crop-based
biofuels and the European Union has voted to cap crop-based biofuel at the member states’ 2017 consumption
level and no more than 7% of all transport fuel until 2030. Palm oil alone is planned to phase-out by 2021. This
action was driven by negative impact of palm oil production such as deforestation and GHG emission, with palm oil
biodiesel being considered the highest emitting biofuel. However, generating biofuel from waste and not from
crops has clear added value in improving the sustainability of palm oil production and provides clear message of a
mill or company’s commitment in mitigating environmental-related issues in palm oil production.
Summary
No Criteria Score Remark
1 Financial evaluation High
US$4,167 to US$12,369 per m3/h for
biomethane. A 400 m3/h biomethane
plant could cost around US$ 1.7 million
US$ 175,000 for a 1 TPD biodiesel plant
2 GHG reduction potential High
Biofuel (biomethane and biodiesel)
could potentially reduce CO2 emissions
by up to 90 % compared to a
conventional fossil-fueled vehicle and
machinery
3 Technical and operational challenge Medium
Mill personnel needs to be trained to
operate the facility/plant, service
contract with technology provider could
ensure smooth operation.
4 Environment and Social co-benefits High RE generation, fossil fuel replacement,
GHG reduction.
5 Replicability Medium
Technically replicable, yet utilization
scenario and financing could be
determining factors for small and
medium company group.
Improved concession management through conservation and restoration
Within established plantation concessions, there are many opportunities to reduce emissions through better
management of natural forests and conservation lands. Natural forests capture and sequester carbon, but this
ability often does not reach its full potential within a concession landscape due to issues of past or continuing
degradation, loss of stand viability due to fragmentation, secondary impact from altered hydrologic system, and
land use practices that suppress natural regeneration. The term ‘conservation lands’ is used here to refer to any
land that is set aside from planting as palm, either to protect existing forest resources or encourage forest recovery
in degraded lands.
The overriding principle of improved conservation management, as it pertains to emissions, is to maximize the
sequestration potential of existing protected lands, and to protect against the risk of carbon loss in locations that
are at risk of degradation or deforestation. This review presents several discrete actions that companies can pursue,
that combine some or all aspects of forest protection, forest enhancement, and reforestation. Every operation is
unique, and these recommendations are not intended to delimit all the forms that restoration activities can take.

Compilation of BMPs to Reduce Emissions in Palm Oil Production Management Practices to Reduce Emissions 54
The types of activities available to an operator depend highly on the legal and environmental context of the
concession, and all activities may not be suitable for all operators (Table 16).
Table 16. Generalized conservation management approaches
Activity Best suited for Note
Protection Company manages significant areas of high-quality forest, where ongoing or future risks to forest maintenance can be clearly demonstrated by historical proxy. Also applies where a company has the opportunity to assume responsibility for managing a natural forest (i.e. restoration concession).
GHG emission prevention is more easily demonstrated in locations with clearly identifiable threats are more suitable. Threats can include encroachment, illegal logging, and fires. Protecting non-threatened forests does not result in real emissions reductions.
Enhancement Company manages tracts of land that are in a degraded natural state, such as areas having suffered from devastating fire, heavy logging, etc.
If degradation is ongoing, protection must be combined with enhancement.
Afforestation, Reforestation (AR)
Can be pursued anywhere within a concession that legal framework allows it.
Monitoring is required to demonstrate that AR has been maintained over time.
Four such discrete strategies are presented here: optimizing existing managed conservation lands, engaging in
internal land swaps and/or modest increase in conservation coverage, absolute retirement of plantations and
conversion to natural forests, and finally acquisition of ecosystem restoration concessions outside of the bounds of
currently managed concessions.
Retirement of plantations, rewetting and reforestation
If a company is willing to accept a net reduction in hectares of commercially cultivated plantation, and if the legal
framework allows this, then retirement and replanting with native species is an option that can produce large
emissions reductions especially in peatland areas. Plantations with persistently low productivity, that produce high
and unavoidable emissions such as drained peat, and areas that could provide large ecological or social co-benefits
as native forests, can be identified as priority lands for retirement.
In Indonesia, regulations were enacted in 2016 to restrict cultivation of areas with peat deeper than three meters18.
While the future regulatory environment is unknown, the trend to date has been for increasing attention to the
emissions producing capacity of peat soils. In order to halt ongoing emissions from drained peat, a retirement and
reforestation program would require restoration of natural water table through altering, damming, or eliminating
canals.
Smallholders may be reluctant to transition away from palm without confidence that alternative livelihoods will be
equally or additionally beneficial to palm. Companies working with smallholder producers, especially in peatland
areas, either as suppliers or as local communities, may need to invest in demonstrating financially sustainable
alternative livelihoods to foster more widespread acceptance of non-palm land uses.
Rewetting prevents and slows down peat decomposition by reducing microbial decomposition of peat organic
matter (Giesen, 2018). Furthermore, it is essential that peat is rewetted to delimit peat loss by drainage. Canal
18 http://www.siiaonline.org/wp-content/uploads/2017/06/SIIA-Special-Report-Peatland-23062017.pdf

Compilation of BMPs to Reduce Emissions in Palm Oil Production Management Practices to Reduce Emissions 55
blocking is the most used approach to rewetting in peatland restoration in Indonesia. Because of the low peat
density, the hydraulic head difference between canal blocks needs to be properly analyzed.
Various dam designs have been tested in rewetting. Prior to initiating rewetting, significant stakeholder
engagement with local communities is critical. Experience elsewhere has found that where local community
members actively use specific canals, dams need to be designed to accommodate this use to reduce the threat of
people damaging the dams.
One type that had traditionally been constructed by civil society organizations is the ‘box-dams’. These dams are
made of creating a ‘box’ of wood planks that must be staked into the mineral soil below, infilled with sand bags or
compacted peat (Figure 18). These can be constructed rapidly, use locally available resources and capacity, and
temporarily create local labor. However, given the number of dams that are needed, they can become expensive.
Costs are reported to range from USD1500 per dam for larger dams to USD150 per dam for very small dams
(Surjanto et al 2018). The design of this type of dam can allow for continued passage for small boats, however, this
then also prevents full rewetting. Construction manuals have been developed by Wetlands International
(Suryadiputra et al 2005). This construction approach has had varying success. They have been found to degrade
after only a few years and thus require frequent maintenance and rebuilding.
Figure 18. Examples of a box dam to rewet degraded tropical peatland forest (source: WWF)
Another approach is to create a compacted peat dam. This design uses an excavator that moves peat from nearby
into the canal and then it is compacted through driving the excavator itself across the newly created dam. In pulp
and paper concessions, these are built with a by-pass included, to allow water to continue to flow. However, for
full rewetting, this by-pass should not be included. These can be constructed rapidly and do not require outside
materials to be transported to the location and do not require specialized skills beyond excavator expertise. The

Compilation of BMPs to Reduce Emissions in Palm Oil Production Management Practices to Reduce Emissions 56
costs have been estimated to range from USD600 for a 4 m wide dam to USD5,000 for a 20 m wide dam. Of course,
since an excavator is needed, this approach will only work in accessible locations. In addition, since the dam is only
made of peat, it is relatively easily damaged by people if not designed to allow needed access. A manual of the
construction methods has been created by APP and Deltares (2016). The Peatland Restoration Agency (BRG) of
Indonesia is actively recommending this approach to canal blocking19 (Euroconsult Mott MacDonald 2018).
This approach can also be combined with canal infilling, especially in smaller canals in which again, using an
excavator, peat is moved from nearby into the canal and compacted. Wooden planks can be placed in front to
prevent peat from flowing out during high precipitation events.
19 https://www.cbd.int/doc/meetings/ecr/ecrws-2016-02/other/ecrws-2016-02-presentation-day1-03-en.pdf
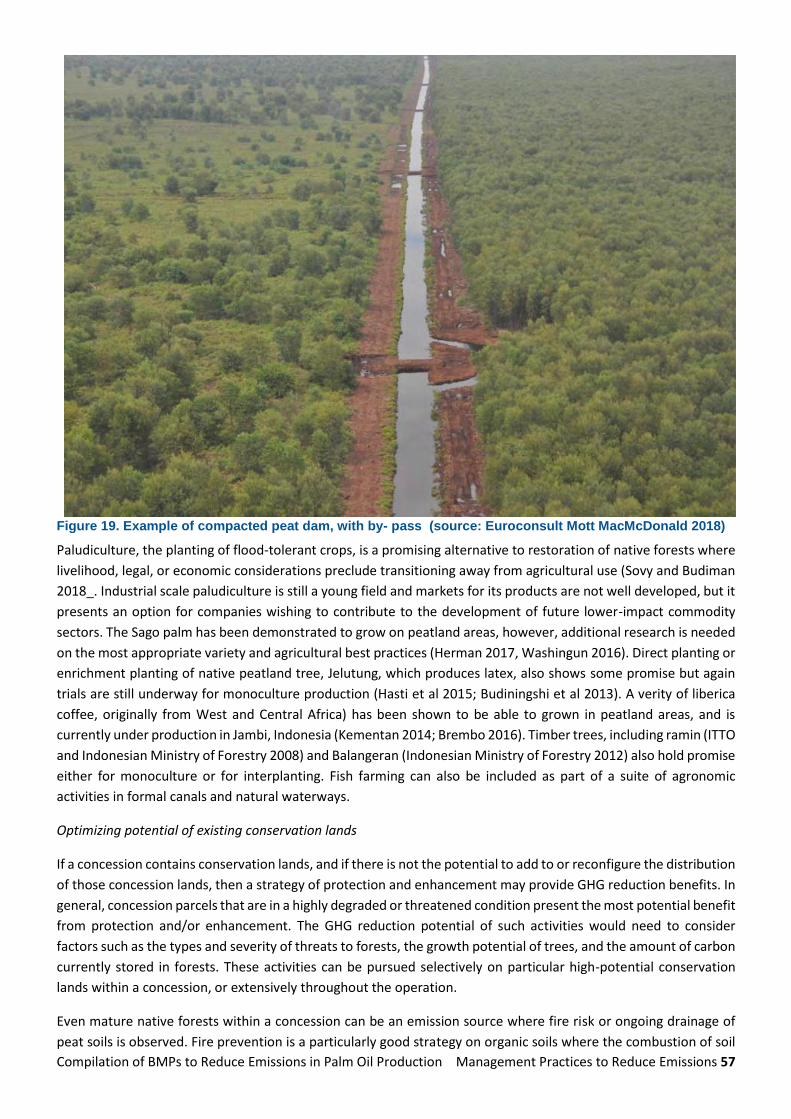
Compilation of BMPs to Reduce Emissions in Palm Oil Production Management Practices to Reduce Emissions 57
Figure 19. Example of compacted peat dam, with by- pass (source: Euroconsult Mott MacMcDonald 2018)
Paludiculture, the planting of flood-tolerant crops, is a promising alternative to restoration of native forests where
livelihood, legal, or economic considerations preclude transitioning away from agricultural use (Sovy and Budiman
2018_. Industrial scale paludiculture is still a young field and markets for its products are not well developed, but it
presents an option for companies wishing to contribute to the development of future lower-impact commodity
sectors. The Sago palm has been demonstrated to grow on peatland areas, however, additional research is needed
on the most appropriate variety and agricultural best practices (Herman 2017, Washingun 2016). Direct planting or
enrichment planting of native peatland tree, Jelutung, which produces latex, also shows some promise but again
trials are still underway for monoculture production (Hasti et al 2015; Budiningshi et al 2013). A verity of liberica
coffee, originally from West and Central Africa) has been shown to be able to grown in peatland areas, and is
currently under production in Jambi, Indonesia (Kementan 2014; Brembo 2016). Timber trees, including ramin (ITTO
and Indonesian Ministry of Forestry 2008) and Balangeran (Indonesian Ministry of Forestry 2012) also hold promise
either for monoculture or for interplanting. Fish farming can also be included as part of a suite of agronomic
activities in formal canals and natural waterways.
Optimizing potential of existing conservation lands
If a concession contains conservation lands, and if there is not the potential to add to or reconfigure the distribution
of those concession lands, then a strategy of protection and enhancement may provide GHG reduction benefits. In
general, concession parcels that are in a highly degraded or threatened condition present the most potential benefit
from protection and/or enhancement. The GHG reduction potential of such activities would need to consider
factors such as the types and severity of threats to forests, the growth potential of trees, and the amount of carbon
currently stored in forests. These activities can be pursued selectively on particular high-potential conservation
lands within a concession, or extensively throughout the operation.
Even mature native forests within a concession can be an emission source where fire risk or ongoing drainage of
peat soils is observed. Fire prevention is a particularly good strategy on organic soils where the combustion of soil

Compilation of BMPs to Reduce Emissions in Palm Oil Production Management Practices to Reduce Emissions 58
carbon or peat can dramatically increase the emission impact. For palm operators managing peatlands with natural
landcover, often those lands were subject to past canalization and draining prior to the licensing of the land. That
legacy of impact will continue to have a large ongoing emission until the natural water table is restored. Because
this type of drainage does not serve an agricultural purpose, it should be among the first mitigation options
considered where it is available.
Conservation Land Swaps
The idea of a land swap is to reconfigure the location of lands zoned either for plantation or conservation, such that
a net balance is maintained across the concession or landscape regarding either the hectare totals of those lands,
or in some other measure such as provision of a benefit (i.e. the ratio of the number of hectares of plantation
exchanged for conservation does not need to be 1:1). The purpose of this land swap is that by modifying the location
of these lands, that it can be possible to achieve net increases in both commercial production and emissions
reduction. Ideally, highly degraded land with low potential for reforestation are turned into plantations, while
plantations in highly desirable locations, areas with low productivity, or high emissions such as peatlands are
retired. Ecological benefits of land swaps are consolidating small non-viable conservation parcels into larger
sustainable tracts, the widening of riparian buffers, and the creation of biodiversity corridors. Another case is
utilizing land swap as part of a strategy of migrating more production to mineral soil lands and away from highly
emitting peat soils.
Land swaps are only feasible where the legal framework pertaining to concessions allows it. There are social and
environmental risks associated with any conversion of even very degraded natural land to plantations. However, it
is entirely possible that within a concession there are clear opportunities where a land swap is an appropriate
activity.
Manage a restoration concession
In the case of protection of existing forest, the company must demonstrate that the protection activity is sensible
and appropriate given the prevailing threats. While approaches exist to help estimate the magnitude of these future
threats (i.e. develop a 'baseline,' or business as usual scenario), the nature of projecting the future means there is
a high level of uncertainty, and companies can expect a strong degree of scrutiny industry-produced baselines by
scientific community. In some regions, national or subnational governments may be able to provide these baselines
from their REDD+ programs. While some restoration concession are under national level management, there is
increased interest in restoration concession being held by the private sector. For example, one case study included
in this report looks at the peat restoration area managed by Golden Agri Resources (GAR). The peat rehabilitation
project covers about 2,600 ha of conservation area (mostly peat soil). that were affected by devastating fire
occurrences during strong El Niño season in 2015.
GHG Reduction Potential
Greenhouse gas accounting in the forestry sector is a highly varied and scale-specific undertaking. If a company is
interested in pursuing opportunities to reduce emissions through protection, reforestation, or enhancement, it is
strongly recommended that they consult with a specialist in this field to conduct an initial feasibility study to identify
major GHG reduction opportunities and provide potential path for addressing them.
Because of the diversity of the landscape, the emissions reduction potential will vary across each concession for
these activities. However, in many cases, largest emissions reduction opportunities available to companies as it
relates to conservation land are as follows:
• Peat retirement, which includes retiring palm cultivation on peat soils, restoring natural water table depth,
and reforesting
• Protecting highly threatened natural forests from clearing or degradation

Compilation of BMPs to Reduce Emissions in Palm Oil Production Management Practices to Reduce Emissions 59
• Reforesting degraded or non-forested natural lands
Retirement of palm on peat lands and restoration of water level produces immediate and often substantial
reduction in emissions. The choice of post-retirement land cover has an impact on emissions, but because oil palm
biomass is being replaced by tree biomass, the net benefits from regrowth are modest, at least in the near them.
Retirement of palm on mineral soil can have substantial non-carbon benefits, but in most cases does not contribute
substantially to a GHG mitigation objective. If retirement of palm on mineral is pursued, the GHG reductions can
be maximized by undertaking the conversion after the scheduled end of the current palm cycle. The Indonesian
Carbon Accounting System (INCAS) assumes a default value of 40.3 tonnes of CO2 emitted per hectare per year for
as long as peat soil remains cultivated with palm. In areas of deep peat, this ongoing emission can persist for
decades where drainage necessary for oil palm is maintained. For plantation operators with palm on peat, retiring
this land from cultivation is often the single largest opportunity for GHG mitigation within the conservation
management group of best practices, and in some cases, across all plantation management options.
Existing Natural forests can store immense amounts of above and belowground biomass, and clearing of these
forests generally results in their rapid releases of CO2 through decomposition (see Table 6 and Table 7). The use of
fire in clearing only adds to the impact with the production of CH4 and N2O. The carbon stocks in any area that
under normal cases would have been converted, but that is ultimately protected through company actions, can be
considered an emission reduction. If a national or subnational REDD+ Reference Level is available for the geography
the concession is located in, this document can provide a good starting point to understand the range of carbon
value found in native forest, and the types of threats that the government has identified. Of course, in peatlands
areas, if the water table has been affected either by the surrounding land use, or if remnant canals or other types
of drainage are present, the largest opportunity for GHG emissions will be through increasing the average water
table levels. It is recommended that significant engagement take place regarding the design and location of
proposed dams with any surrounding communities.
Restoring degraded and non-forested natural land through either replanting or allowing natural regeneration has
the benefit of producing tangible carbon sequestration benefits beginning immediately upon planting and
protection. While reforestation is the inverse of deforestation and theoretically these activities can balance one
another, they are accounted for on much different timelines. Whereas deforestation emissions are often accounted
for entirely in the year of clearing, reforestation accrues only incrementally over time, but can persist for decades
or even centuries. Published growth curves, mean annual increments, or stand tables can give a good indication of
what kind of annual benefit the growth will provide (Table 17).
Table 17. Examples of sequestration benefit of afforested lands, from Bernal et al 2017.
AR type
Mean annual increment 0-20 years, AGB+BGB
(tC ha-1 y-1)
Sequestration benefit AGB + BGB
(tCO2e ha-1 y-1)
Source
Agroforestry – Africa 2.0 7.3
Bernal et al. 2017
Agroforestry - Asia 2.6 9.5
Agroforestry - Latin America
3.0 11.0
Natural regeneration - Africa
4.7 17.2
Natural regeneration - Asia
3.2 11.7
Natural regeneration – South America
5.1 18.7

Compilation of BMPs to Reduce Emissions in Palm Oil Production Management Practices to Reduce Emissions 60
Native peat forest – Indonesia
7.1 25.8 Osaki, Tsuji (eds.) 2016
In most cases, a planted forest is replacing some other vegetated landscape, even a very low-carbon one like from
the first year of growth, meaning it could in some circumstances take several years or even up to a decade before
the stand provides any net GHG benefit (Table 18).
Table 18. Examples of one-time emissions from converting land
Land cover before reforestation activity
Biomass AGB+BGB (tC ha-1)
Emission from replacing pre-AR land cover (tCO2e ha-1)
Citation
Oil palm (long term average)
*36 (AG only) 132 Agus et al. 2012
Annual cropland 5 18 IPCC 2006 v4 ch5
Perennial cropland (wet region)
10 37 IPCC 2006 v4 ch5
Grassland – tropical moist 8 29 IPCC 2006 v4 ch6
Technical and Operational Challenges
All mitigation activities incur costs related to technical assessments, implementation costs, and ongoing monitoring.
Some activities, like conservation restoration licenses, have higher upfront costs and work better with larger
economies of scale, while others like peat restoration can be scaled effectively from very localized to widespread.
This section highlights some of the key challenges associated with each main activity type.
Retirement removes the land from oil palm production and therefore is an immediate loss in palm yield to either
the company or smallholder. While alternative livelihood options exist such as paludiculture or ecotourism, it may
not be feasible for some producers to undertake this strategy over very large areas due to lost production alone.
For peat areas undergoing retirement, restoring full natural water table may require expensive investments and
ongoing patrolling to protect dams. In some cases, local residents accustomed to utilizing canals for transport may
resist efforts to alter them. This will be especially important in peatland areas where the design of any dams built
will need to be appropriate to the conditions in that area.
Afforestation of non-plantation areas within a concession is relatively straightforward to implement, but
consideration should be made during the activity design to account for the land's capacity to support forest growth.
If severe past degradation of the soil or water table has occurred, this may need to be corrected before planting.
Most of the real challenges to afforestation are tied to managing human relationship with the land. Some degraded
lands may be currently utilized by communities that hold some claim. There needs to be careful consideration for
how to protect the afforested land from ongoing use detrimental to regrowth, while also ensuring communities'
rights are upheld.
Forest protection can require a significant up-front investment if land needs to be purchased. In addition, the
uncertainty of the magnitude of GHG emission prevention will be extremely dependent on the probability that the
existing area was under threat of deforestation or degradation. If an independent and defensible ‘with-out
protection’ scenario is to be developed, technical experts will need to be employed and thus incorporated into the
investment costs. If the major emission threats are fires, a conservative estimate of fire probability and resulting
emissions will need to be created. This estimate will be significantly lower than the standing stock of the forest

Compilation of BMPs to Reduce Emissions in Palm Oil Production Management Practices to Reduce Emissions 61
since the probability of the entire area burning is likely very low. This will similarly be true with illegal encroachment.
A historical encroachment estimate will need to be developed and then projected within the protected area. In
addition, significant stakeholder engagement with the local communities will be required and ongoing protection
will need to occur.
Environment and social co-benefits
Increasing the area of natural forest and reducing fragmentation will provide large and varied ecosystem services.
Clearly this will increase natural habitats, increasing the biodiversity and allowing more viable forest and animal
populations. For many human populations, the most important benefit will be an increase in water security and
other water-based ecosystem services such as fisheries, paludiculture, and fire protection. Annual haze currently
endemic to parts of Indonesia, Malaysia, and Singapore due to large fires causes pervasive health problems and
thus focus on methods to reduce fire prevalence are of high priority to governments, companies, and local
communities. It has been estimated that the fires of 2015 burned over 2.6 million hectares of land in Indonesia,
hampering economic and social growth to the cost of over USD16 Billion (World Bank 2016).
Replicability
Removing areas from production is highly replicable, but attention must be paid to legal implications of retirement
and conservation. Peatland areas and areas containing or surrounded by highly threatened species should
represent the highest priority locations for retirement.
Summary
No Criteria Score Remark
1 Financial evaluation High
Removing area from production will
have long term persistent costs.
Continued monitoring and protection
will also require ongoing costs.
2 GHG reduction potential High Retiring and rewetting peatland areas
will have the highest emission potential
3 Technical and operational challenge Medium
Implementation methods are well
known. However, additional research is
needed on cost effective monitoring
and protection technologies
4 Environment and Social co-benefits High
Conversion to natural forest will
significantly increase the ecosystem
services the area provides
5 Replicability Medium
As long as the regulatory environment
enables retirement and conservation,
these are highly replicable
Mill Management
GHG emissions in mill mainly contributed by POME and solid waste decomposition, fossil fuel use for vehicle, and
fossil fuel use for heavy machinery or equipment. Mills meet demand of steam and electricity for CPO production
and to power the mill’s activity by combusting biomass, mostly shell and fiber. Due to its high moisture content,
empty fruit bunches (EFB) are less suitable for feedstock to boiler and turbine. Mills usually mulching EFB and put

Compilation of BMPs to Reduce Emissions in Palm Oil Production Management Practices to Reduce Emissions 62
them back to plantation as fertilizer, or pile and left them to decay in mill area. Mills can sell the excess shell to
other party to use them as feedstock to generate energy somewhere else. POME is treated in series of open lagoon
to lower the COD20 level and meet the environmental standard for water discharge or land application. Decaying
process of both POME treatment in open lagoons and EFB piling form and release methane to the atmosphere and
foul odor. Processing and milling palm oil results in an effluent that is a mixture of water, oil, and organic material
known as palm oil effluent (POME). To meet environmental standards, this wastewater mix is commonly treated in
a series of open ponds. This process requires a large area, frequent desilting, and results in significant methane
emissions (a potent greenhouse gas) released through the decomposition of the organic material. Figure 20 below
depicts wastes generated from processing FFB to CPO and kernel and how the wastes are treated. The green boxes
represent lower GHG treatment in mill own area when compared to the orange boxes.
Figure 20. Waste Utilization in Palm Oil Mills
This section discusses BMPs that directly and indirectly reduce GHG emissions in mill. Some BMPs, such as methane
capture and co-composting, were covered in the previous RSPO BMPs report. Despite their effectiveness in
reducing GHG emissions, they have not yet become common practice in the industry. Therefore, they are
considered still relevant to be discussed in this report. Methane capture and co-composting is potentially applied
together to achieve zero waste palm oil mill. POME treated in the methane capture can generate biogas which can
be further utilized for renewable energy production for captive or grid connection. In the case of renewable energy
from biogas is used to replace existing biomass-based power production, combined with efficiency improvement
on CHP, they lead to excess biomass available for fuel somewhere else or other use (i.e. paper production). POME
can also be utilized in co-composting facility to produce organic fertilizer. This BMP leads to GHG emissions
reduction in mill as well as in plantation through reduction of chemical fertilizer application. This section also covers
emerging technologies such as biogas upgrading for transportation fuel; that have been proven in other sectors,
but haven’t been adopted by the palm oil sector.
It is important to note that BMP implementation in mill could promote GHG emission reductions somewhere else
or contribute to wider context. For example, biogas generated by methane capture which converted to electricity
can replace fossil fuel-based electricity generation on grid or as captive power. CHP improvement could lead to
biomass saving. The excess biomass can be sold or transported somewhere else for renewable energy generation.
20 Biochemical Oxygen Demand

Compilation of BMPs to Reduce Emissions in Palm Oil Production Management Practices to Reduce Emissions 63
Biomass can also be used as materials to produce paper, hence avoiding cutting down trees. On the other hand, co-
composting using EFB and POME can reduce chemical fertilizer in plantation.
Furthermore, mills implement multiple BMPs to find the optimum GHG emissions reduction within reasonable
economic investment. Some of BMPs implementations were not solely motivated by GHG reduction but
sustainability, efficiency and process improvement purpose. Mills evaluate and select BMP to implement in
accordance to their capability –technical, financial- market orientation, and priority issues that they want to
address. Most mills with internal demand for electricity or close to the grid opt methane capture and biogas for
electricity generation. KLK fitting filter belt press to solve recurrent sludge problem in POME treatment, Sime Darby
started with co-composting and followed by methane capture to achieve zero waste mills, whereas IOI adopted
green tubes to remove solids in POME and investing in its cogeneration plants to achieve 90% energy efficiency
improvement.
Efficiency Improvements in CHP
Cogeneration or combined heat and power (CHP) is one of the approaches to produce energy simultaneously from
single energy source. Palm oil mills have been using the abundant biomass waste, in the form of empty fruit
bunches, fibre, and kernel shell, as fuel combustion in CHP plants to generate steam and electricity for CPO
production process. The main components of this technology are boilers, turbines, generators and a back pressure
receiver. Processing fresh fruit bunches into CPO requires 0.35 ton of steam and 17.87 kWh per ton
FFB1. Combusting biomass waste enable palm oil mills to meet this power demand sufficiently, thus no imported
electricity from the grid is needed. CHP plants in palm oil mills are configured to generate low power output to
cater for the low power-to-heat demand ratio of oil extraction process.
Currently, generally the boilers and turbines used in palm oil mills have a low to moderate efficiencies of <80% and
35% respectively (Nasrin, et. al., 2011). Efficiency improvements in existing CHP can be
achieved through various methods with purposes of increasing the amount of power produced and reducing
the amount of biomass waste needed. A mill could consider efficiency improvements of its existing CHP plant when
it expects an increasing energy demand (i.e. due to mill expansion) or possibility to sell excess power to the grid.
The increased efficiency leads to lower fuel consumption; hence the mill will have excess biomass waste available
for other use or sale to external parties such as refinery plant.
Three approaches are presented below:
1. Improved waste heat recovery
About 60% of feeding energy to boiler is converted to waste heats. However, recovering and utilizing waste
heat results in an improvement of thermal efficiency from 37.34% to 75.60% compared with the
conventional approach. It could lead to biomass saving about 2,748 tons per year with simple payback of
1.3 years (Booneimsri, et al., 2016).
2. Improved flue gas recovery
Major energy losses at the boiler happen due to hot flue gas and moisture in flue gas. A study by Sommart
and Pipatmanomai (2011) states that in a mill processing 260,000 ton FFB per year found that energy
efficiency improvements can be achieved by recovering the hot flue gas and instead using it for removing
moisture in boiler. The improvement is implemented by installing a rotary dryer with capacity of 12 tons of
fuel per hours. The dryer fitting to existing boiler increases the recovery of flue gas to reduce moisture in
fuels from 35.5% to 17.5%, leading to increased boiler thermal efficiency by about 7% or equivalent to 2,776
tons/year of biomass. Capital and operational expenditure was estimated to be USD 122,000 and USD
26,400/year respectively. Calculating additional income from the selling of excess biomass (i.e. biomass

Compilation of BMPs to Reduce Emissions in Palm Oil Production Management Practices to Reduce Emissions 64
plant), the efficiency improvement project gave a payback period2 of 1.5 years (Sommart and
Pipatmanomai, 2011).
3. High efficiency steam turbine
There are several types of high efficiency steam turbines which can improve efficiency and thus increase
total energy supply produced. In a recent study, three technologies were compared to evaluate which was
the most economical way to meet an increase in energy demand (Error! Reference source not found.Table
19) (Abd Majid, et. al. 2014). Fitting a high efficiency back pressure steam turbine has the highest return
but has vented out steam while installing a high Capacity Extraction Steam Turbine still has a moderate
return and produces no vented-out steam.
Table 19. Investment costs and rate of return for various efficiency improvement methods
Method Capex (USD) Opex (USD) Vented out
steam kg h-t
Extended Rate
of Return
Fitting of high efficiency back
pressure steam turbine
230,000 70,800 900 28.79%
Installing high capacity boiler
(water tube boiler) to current
CHP system
823,000 91,000 12,150 17.17%
Installing high
Capacity Extraction Steam
Turbine (CEST)
343,000 202,500 No steam
vented out
26.03%
Source: Abd Majid, et. al. (2014)
Efficiency improvements in CHP plant leads to more power generation and excess biomass waste that can provide
additional revenues from selling. A study in CHP plant in six mills in Malaysia found that mills with improved
efficiency have potential to export excess power to the grid ranged from 113 kW for 20 tph mill to 900 kW for the
54 tph mills (Nasrin, et al., 2011). For a mill located close to the grid or other industry facility that requires power,
selling extra power could shorten the payback period. However, the efficiency improvements discussed have not
been widely implemented.
Another example of CHP efficiency improvement is carried out by IOI. IOI invested MYR 30 million into the
installation of a 6.5 MW CHP plant in Penang. The investment is expected to boost energy efficiency from the usual
efficiency of 39% and 75%-85% to above 90%. This initiative is projected will cut energy costs by at least 40% and
reduce emissions of GHG such as CO2, Nitrogen, and Sulphur oxides.
GHG emissions from biomass combustion for energy generation is considered negligible, thus efficiency
improvement in CHP does not lead directly to GHG emission reduction. However, optimum configuration can be
achieved to deliver efficiency and conserve biomass which can be used for other purposes such as co-composting
(see Co-composting BMP), creating alternative biomass-based products (see biomass utilization BMP), or selling
the excess biomass for energy generation elsewhere. In locations where energy had formally used fossil fuels, the
palm oil mill can serve as clean energy production center.

Compilation of BMPs to Reduce Emissions in Palm Oil Production Management Practices to Reduce Emissions 65
Summary
Criteria Score Remark
1 Financial evaluation Low Low investment and maintenance costs
2 GHG reduction potential Low to
high
Highly depends on the utilization scenario.
Biomass combustion generates negligible net
GHG emissions, however GHG reduction can
be significant when electricity is used to
replace fossil-based electricity generation.
Supplying electricity to grid can lead to GHG
emission reduction beyond CPO production
boundary.
3 Technical and operational challenge Low No additional skills needed
4 Environment and Social co-benefits Medium Potentially provides excess energy or
biomass for use elsewhere in production
5 Replicability High Technically feasible for many mills
Methane Capture and POME-to-Biogas Electricity
Solid waste from CPO production is mostly reused as a feedstock to provide heat and power for the production
process or office facility, yet the common treatment of POME remains inefficient. In the oil extraction process,
POME is generated from three major operation: sterilizing fresh fruit bunches, clarifying extracted crude palm oil,
and EFB pressing. For every ton of fresh fruit bunches processed, the mill discharges from 0.7–1 m3 of POME. Fresh
POME is hot (temperature 60–80°C), acidic (pH of 3.3–4.6), thick, brownish liquid with high solids, oil and grease,
COD, and Biological Oxygen Demand (BOD) values (Rihayu et al 2015).
An open ponding system is the most common method to treat POME. In this process, POME flows through a series
of ponds and several treatment stages to collect the remaining oil, decrease temperature, and create optimal
conditions for the decomposition of organic material. After these stages of treatment, POME will be discharged to
water bodies or used as fertilizers. Even though the open ponding system is considered the most economical option
of POME treatment, it is still land and time intensive and releases considerable amount of methane into the
atmosphere from POME decomposition in the absence of oxygen (anaerobic pond). Channeling POME into land
application or water bodies, on the other hand, can pollute vegetation or aquatic environment if it does not meet
environmental standards set by the government.
A Methane Capture and POME-to-Biogas Electricity system is a potential alternative option to reduce the volume
of residues but at the same time capture the methane, thus reducing GHG emissions from POME. The biogas
produced from this system therefore can be used for different utilization, including generating power for
electricity. Before being utilized, the pre-treated POME is processed through an anaerobic bio-digester system
(AD). In the AD process, POME is first channeled through the pre-treatment system to lower the effluent
temperature. Then the effluent is pumped into the bio-digester system where the digestion takes place with the
help from bacteria. To date, two major technologies (bio-digester system) have been used for anaerobic digestion
in palm oil sector: covered lagoon and tank reactor. The biogas produced in the AD system is pumped into a biogas
utilization system which consists of a hydrogen sulfide (H2S) scrubber and dehumidifier, prior to being injected to
boiler and gas engine. The excess biogas is pumped into a flaring system to destroy the methane (Figure 21).

Compilation of BMPs to Reduce Emissions in Palm Oil Production Management Practices to Reduce Emissions 66
The biogas produced from this process can generate power for electricity. The mill or project owner could sell off
electricity produced to power grids or use it for their internal demand of the mills, non-mills and estates. Selling
electricity to the national grid has two options, either connected on-grid or off grid (isolated). Both options are
profitable for project owners interested in renewable energy business, but it depends on the power purchasing
price or feed-in-tariffs applied in the project location.
Reducing methane from POME has started to become a major strategic action for reducing GHG emissions. Major
companies have started to adopt the installation of methane capture facilities at their mills given greater incentive
for major producers to comply with certain standards and certifications, bigger production, wider targeted market,
and intense attention from the public. However, utilizing the biogas into electricity is solely the decision of the
company or the project owner. Regulatory drivers have played a part in this shift, and motivate some companies
to look at the economic benefits of using the methane in biogas for electricity generation. For
instance, Indonesia’s 2012 Ministerial Regulation No. 04/2012 about FiT for renewable energy from biomass and
biogas increased interest in grid-connected power from POME-to-energy projects. Under the regulation, biogas
project owners were allowed for the first time to sell power through Power Purchase Agreements (PPAs) or excess
power through excess power agreements with PLN (a state owned utility company).
Figure 21. Palm Oil Biogas Process
Methane capture and flaring system can avoid methane release by about 82%, whereas methane capture and
electricity generation avoid about 90% methane release to the atmosphere when compared to the baseline. Using
the RSPO PalmGHG Calculator, GHG emissions from POME shows 0.65 tCO2eq/tCPO and 0.07 tCO2eq/tCPO with
methane capture facilities installed (Gan & Cai, 2017). Therefore, according to these numbers, the emission
reduction is around 89%.
Methane capture requires high investment cost which often becomes a challenge to palm oil mills, particularly for
small to medium palm oil company groups. The costs of biogas projects consist of engineering, procurement, and
construction (EPC) costs and non-EPC costs. The bio-digester and biogas conversion system are generally the two
most expensive elements in the EPC costs. In general, tank systems cost more than covered lagoons for bio-digester.
The investment costs for tank systems range from USD2.5–3.5 million per MWe, while the covered lagoon costs
range from USD1.5 – 3 million per MWe (CIRCLE Project, 2015). Table 20 below compares EPC costs for covered
lagoon and tank reactors.
Table 20. Example of costs for covered lagoon and tank reactor associated with a1.2 MWe gas engine
Technology Bio-Digester cost Gas engine (1 x
1.2MWe)
Total Investment
Cost
Investment cost
(USD/MWe)
Covered lagoon USD 2.7 million USD 640,000 USD 3.33 million USD 2.77 million
Tank reactor USD 3 million USD 640,000 USD 3.66 million USD 3 million
Source: Rahayu et al 2015

Compilation of BMPs to Reduce Emissions in Palm Oil Production Management Practices to Reduce Emissions 67
The investment cost of methane capture facility will be varied, depending on the technology applied, type of biogas
utilization (either for electricity/combustion/flaring), size and brand of engine, scope of supply (partial/turnkey),
grid lines (for electricity scenario), and site-specific information that affected on civil work (e.g soil condition,
topography), as well as logistical costs. The breakdown of the indicative investment cost is presented in the Table
21 below which uses a case study for 2.5 MW POME-to-electricity project in Jambi, Indonesia. Investment costs for
such project consist of two large groups which are EPC (engineering, procurement, and construction) and non-EPC
costs. Non-EPC costs comprise of components such as pre-development cost, financing cost, and working capital.
Table 21. Breakdown of Investment Cost for Methane Capture Projects
System Components Costs
EPC Costs As % of EPC Costs
Bio-digester System
1 Preliminary works and mobilization
~25% 2 Civil and hydraulic works
3 Equipment
BiogasTreatment/Utilization System
1 Preliminary works and mobilization
~16% 2 Civil and hydraulic works
3 Equipment (scrubber, blower, flaring system)
Biogas Conversion
1 Biogas engines and installation
~20-25% 2 Shipping and insurance
3 Equipment and instrumentation system
Electrical and Instrumentation (E&I) System
1 Control and electrical room
~10%
2 Instrumentation and control
3 E&I connections for digester and biogas system
4 Electrical works for connection to biogas MSB (main switch breaker)
Other Costs
1 Logistics
~20–25% 2 Shipping and insurance
3 Installation, commissioning and start-up (including biomas seeding)
Gas engines (including accessories and installation)* ~20–30%
Grid connection (per km) ~USD 20-30,000
Contigency (2%) ~5–10%
Total EPC Costs USD 5,341,000
Other Costs
Other Costs 1 Financing costs 2% of loan size
Total Investment Costs USD 5,486,000
ROI 10-12%
Source: Rahayu et al, 2015
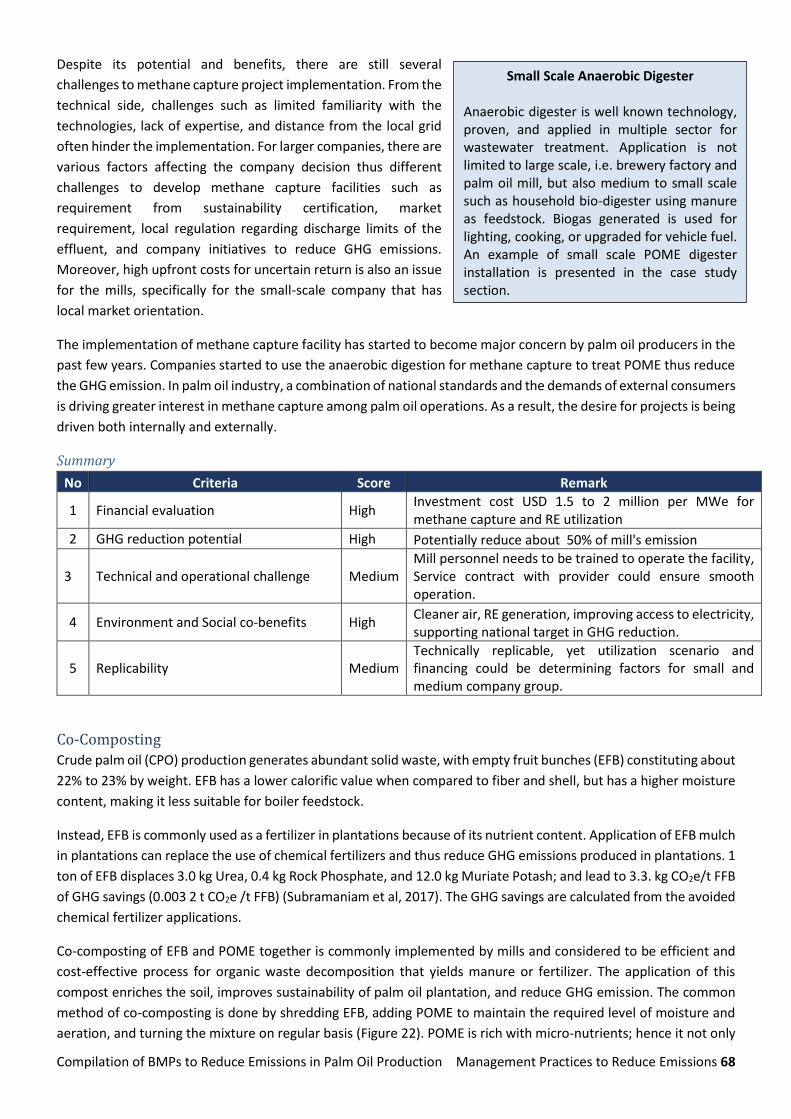
Compilation of BMPs to Reduce Emissions in Palm Oil Production Management Practices to Reduce Emissions 68
Despite its potential and benefits, there are still several
challenges to methane capture project implementation. From the
technical side, challenges such as limited familiarity with the
technologies, lack of expertise, and distance from the local grid
often hinder the implementation. For larger companies, there are
various factors affecting the company decision thus different
challenges to develop methane capture facilities such as
requirement from sustainability certification, market
requirement, local regulation regarding discharge limits of the
effluent, and company initiatives to reduce GHG emissions.
Moreover, high upfront costs for uncertain return is also an issue
for the mills, specifically for the small-scale company that has
local market orientation.
The implementation of methane capture facility has started to become major concern by palm oil producers in the
past few years. Companies started to use the anaerobic digestion for methane capture to treat POME thus reduce
the GHG emission. In palm oil industry, a combination of national standards and the demands of external consumers
is driving greater interest in methane capture among palm oil operations. As a result, the desire for projects is being
driven both internally and externally.
Summary
No Criteria Score Remark
1 Financial evaluation High Investment cost USD 1.5 to 2 million per MWe for methane capture and RE utilization
2 GHG reduction potential High Potentially reduce about 50% of mill's emission
3 Technical and operational challenge Medium Mill personnel needs to be trained to operate the facility, Service contract with provider could ensure smooth operation.
4 Environment and Social co-benefits High Cleaner air, RE generation, improving access to electricity, supporting national target in GHG reduction.
5 Replicability Medium Technically replicable, yet utilization scenario and financing could be determining factors for small and medium company group.
Co-Composting
Crude palm oil (CPO) production generates abundant solid waste, with empty fruit bunches (EFB) constituting about
22% to 23% by weight. EFB has a lower calorific value when compared to fiber and shell, but has a higher moisture
content, making it less suitable for boiler feedstock.
Instead, EFB is commonly used as a fertilizer in plantations because of its nutrient content. Application of EFB mulch
in plantations can replace the use of chemical fertilizers and thus reduce GHG emissions produced in plantations. 1
ton of EFB displaces 3.0 kg Urea, 0.4 kg Rock Phosphate, and 12.0 kg Muriate Potash; and lead to 3.3. kg CO2e/t FFB
of GHG savings (0.003 2 t CO2e /t FFB) (Subramaniam et al, 2017). The GHG savings are calculated from the avoided
chemical fertilizer applications.
Co-composting of EFB and POME together is commonly implemented by mills and considered to be efficient and
cost-effective process for organic waste decomposition that yields manure or fertilizer. The application of this
compost enriches the soil, improves sustainability of palm oil plantation, and reduce GHG emission. The common
method of co-composting is done by shredding EFB, adding POME to maintain the required level of moisture and
aeration, and turning the mixture on regular basis (Figure 22). POME is rich with micro-nutrients; hence it not only
Small Scale Anaerobic Digester Anaerobic digester is well known technology, proven, and applied in multiple sector for wastewater treatment. Application is not limited to large scale, i.e. brewery factory and palm oil mill, but also medium to small scale such as household bio-digester using manure as feedstock. Biogas generated is used for lighting, cooking, or upgraded for vehicle fuel. An example of small scale POME digester installation is presented in the case study section.

Compilation of BMPs to Reduce Emissions in Palm Oil Production Management Practices to Reduce Emissions 69
maintains the moisture and reduce heats, but also enables a nutrient-rich compost product. Optimum mixing of
POME to EFB is 3.2 m3 POME/ton FFB and at maximum 5.3 m3POME/tonFFB (Schuchardt, et al., 2002). Composting
process can take up to 20 weeks.
Figure 22. Schematic Process of Co-composting EFBs and POME
Research and pilot projects have been carried out to improve co-composting methods to shorten length of
decomposition process, create easier operating techniques, and vary combination of organic matters. Several trial
or pilot projects are presented below:
- Co-composting of pressed-shredded EFB and POME anaerobic sludge from methane capture using ratio of
POME to EFB of 1:1 in a controlled condition (co-composting block). Co-composting period reduced to 40 days
with final C/N ratio 12.4 (Baharuddin, et. al., 2010).
- Co-composting of EFB and partially treated POME in an open and traditional windrow composting pile. Co-
composting period reduced to 60 days with C/N ratio 12 (Baharudin, et. al., 2009).
- Co-composting of EFB and all raw POME produced from mill with Eco-D two phase decanter and continuous
steriliser system. The produced compost can be used as fertilizer, zero wastewater as all POME are used, and
C/N ratio below 20 after 30 days (Seng, 2011).
- Adding nitrogen-fixers bacteria, worms, and fungi in the mixture to enhance decomposition process (Alkarimiah
and Rahman, 2014; Gandahi and Hanafi, 2014).
- Aerated static piles to have composting with fast biodegradation and without any physical manipulation and
can be managed in controlled aeration on perforated piping, windrows, or in closed, open or covered containers
(Gandahi and Hanafi, 2014).
Referring to project design documents of Co-composting CDM registered projects, investment cost for co-
composting facility can start from USD 650,000 for open and simple system to about USD 2 million for in-vessel co-
composting system. Co-composting can be implemented by any scale of mills. The costs cover equipment and civil
works procurement and installation. Indicative investment is USD 9/ton FFB processed. Operation and maintenance
costs consist of two main components which are operation and maintenance costs of composting plant, and
manpower and supervision costs. Co-composting does not require personnel with specific skill of set. Co-
composting provides financial benefits of revenues of compost selling or savings from fertilizer purchase. The
prevailing issue is not in the co-composting operation but the transportation of compost product. Mills address this
transportation issue with scheduling the trucks; trucks transporting FFB from plantation will transporting compost
to plantation.
Emission reduction is realized by the avoidance of the methane emissions that would have occurred during the
anaerobic decay of POME and EFB in the absence of co-composting. Emission reduction of co-composting is
estimated to be between 0.12 tCO2e/tFFB to 0.2 tCO2e/tFFB compared to baseline of practice to let EFB decay in
Pressing and Shredding
Empty Fruit Bunches
(EFB)
Stacking up Pile (Windrow)
Spraying Process
Turning Process
Drying Process
Waste water (POME)
Compost Product

Compilation of BMPs to Reduce Emissions in Palm Oil Production Management Practices to Reduce Emissions 70
piles. The potential emission reduction of co-composting is higher than the conventional EFB mulching that is 0.033
tCO2e/tFFB. Leakage emissions possibly occurr from the use of fossil fuel for compost transporting truck and
electricity production to run the co-composting equipment.
Co-composting provides additional environment co-benefits in the form of preservation of water and oil quality by
the reduction of the final POME discharge into rivers or plantation. The displacement of chemical fertilizers by
organic compost also offers a softer fertilization option, serve as soil condition, and avoids the risk of eutrophication
of water. Palm oil sector is always exploring methods to minimize waste production and that includes exploring
innovation in co-composting such as enabling optimum nutrient return to soil, more efficient production methods,
or efficient compost distribution.
Summary
Criteria Score Remark
1 Financial evaluation Medium Starting from USD 650,000
2 GHG reduction potential Medium
Bulk GHG saving to be evaluated based
on replacement of inorganic fertilizer and
fossil fuel combustion for transportation
of compost product.
3 Technical and operational challenge Low Does not require highly skilled workers
4 Environment and Social co-benefits Medium Organic fertilizer can be produced,
minimizing POME discharge
5 Replicability High Technically applicable in almost all mills
Solid-Liquid Separation
Solid-liquid separation plays important role in separation of solid particles and liquid in the industry. The technology
for carrying out this process is often referred as ‘mechanical separation’ because the separation is accomplished by
physical means. Chemical or thermal pre-treatment is used to enhance the separation process. Chemical separation
uses coagulation and flocculation to increase of the effective particle size, higher settling or floation rates, higher
permeability of filtration cakes, or better particle retention (Table 22). Coagulation pre-treatment adds inorganic
chemicals such as hydrolysis coagulants like alum or ferric salts, or lime, to enable agglomeration forming up to 1
mm size of particle. Flocculation uses flocculating agent, usually in the form of natural or synthetic polyelectrolytes
of high molecular weight into giant flocculants up to 10 mm in size (Svarovsky, 2000). Solid liquid separation is
separated into two main types which are sedimentation and filtration.
Table 22. Types of solid-liquid separation
Process Force Field Equipment
Sedimentation Gravitation Clarifying thickener
Centrifugal Hydrocyclone, Solid bowl centrifuge
Filtration Gravitation Dewatering screens, Deep bed filters
Different pressure Pressure filters, Vacuum filters, Hyperbar filter

Compilation of BMPs to Reduce Emissions in Palm Oil Production Management Practices to Reduce Emissions 71
Centrifugal Pressure centrifuge, Vacuum centrifuge, Hyperbar centrifuge
Source (Wagner, 2016)
Common practice of POME treatment requires large space for
open lagoon and emits methane emissions to the atmosphere.
Methane recovery can offer a means for mills to lower these GHG
impacts, but investment and financing constraints, distance from
the national grid, or limited on-site power demands present
substantial challenges. Alternative technologies such as solid
filtrate separation may offer a viable alternative for treating
effluent (Figure 23, Table 23). This approach removes suspended
solids (organic material) as cake to be repurposed as organic
fertilizer and treated water is channeled to existing open ponds.
This process improves efficiency of mill’s wastewater treatment as the remaining effluent does not requiring
desilting procedures and has lower levels of COD and BOD, thus lowering methane release to the atmosphere.
Furthermore, with additional system upgrades and additional filtration and separation systems, it is possible to
process the filtrate enough so that the remaining water can be used for the boiler, the cleaning process, and be
discharged to a water body -- meaning zero waste.
Figure 23. Schematic Diagram of Solid Filtrate Separation Facility applying the solid filtrate and separation
system
While the solid and filtrate separation system has the potential to lower emissions and increase efficiency,
effectiveness varies across the different technological options (Table 23). In addition, unlike methane capture
technologies and facilities that benefit from a wealth of data on GHG reduction potential, the reduction of methane
emissions associated with of sludge filtrate separation has received little attention. One study assessing the GHG
reduction of sludge separation using the filter belt press method (see below for details) reported potential
reduction of 130 kgCO2e/t CPO (Eström, 2017).
Alternative Methods of Solid Liquid Filtration
IOI Palm Oil Group has adopted the application
of greentubes to remove solids in POME to
reduce BOD level. The BOD level of its POME is
within the acceptable limit as required by the
Department of Environment of Malaysia
Government, with the lowest BOD level
recorded of 23 ppm in 2015.
Filtration and separation
system
Upgrade system
Existing Aerobic Ponds
POME & suspended
solid
Final Discharge
FiltratePalm Oil Mill
FFB
Methane Avoidance Facility
Cake
Plantation
Clean water
Land application

Compilation of BMPs to Reduce Emissions in Palm Oil Production Management Practices to Reduce Emissions 72
Table 23. Solid Filtrate Separation Systems
Technology Description Investment, maintenance costs
Removal efficiency or Potential GHG reduction
Filtration and evaporationa
System separates raw sludge into oil, solids, and water. Evaporation provides zero effluent discharge to mill.
Investment: USD 30,000 – USD 50,000 per set evaporator
Maintenance cost: USD460 to USD570/month
About 70% reduction potential in COD and BOD.
Membrane filtrationb
Filtrate wastewater into reusable water to use within mill
Investment: USD 250,000 for 100 GPM capacity*
Maintenance cost: unknown
About 99% removal in COD and BOD
Filter belt pressc
System removes sludge from effluent water. Water can be used for cleaning
Investment : USD 160,000
Maintenance cost: unknown
50% GHG emission reducti on. 130 kgCO2e/ ton CPO
Source: a Liew, et. al., 2017
B Samcotech, * Effluent production of a mill with capacity of 45 tph and effluent rate 0.6 m3/hour
c Eström, 2017
A further elaboration of the various technologies for solid and filtrate separation is offered below.
a. Filtration and evaporation
One technology provider offers a patented filtration and evaporation system that separates raw
sludge into oil, solids, and water. The system, only compatible with 3-phase decanters, removes
suspended solids as decanter cake which can be used as organic fertilizer. The resulting filtrate can
be 1) discharged to effluent ponds for further treatment to meet BOD standards for discharge, 2)
condensed, recovered and recycled for mill use, or 3) evaporated to provide mills with zero effluent
discharge. Condensed water from the first evaporation column is pure and can be recycled back for
boiler use without any treatment. An upgrade system of evaporation is most suitable for a company
that aims for zero wastewater discharge.
As an example, to process 10 tons of filtrate, power requirements to run this system is 5.8 tons of
steam, 320 kW for 60 tph mill capacity (including 2 decanters) for the filtration system, and 180 kW
for evaporation system. This means a complete system of filtration and evaporation will require 500
kW. Consumable costs for chemicals (sodium hydroxide and nitric acid, or citric acids) are estimated
to be MYR,000 to MYR 2,500 or USD460 to USD570 per month. Revenue can be generated from
selling or recovering oil. The payback period is 2.5 – 3.5 years for the separation system only, and 5 –
6 years for a complete separation and evaporation system (Liew, et. al., 2017).
b. Filter Belt Press
The filter belt press system uses a device for chemically enhancing solid-liquid separation to separate
effluent into a filtrate and a solid press cake. The separation process is achieved by passing the
wastewater through a pair of filtering cloths on belts through a system of rollers. The system takes

Compilation of BMPs to Reduce Emissions in Palm Oil Production Management Practices to Reduce Emissions 73
sludge, which has been pre-treated with flocculants, and separates them into cake and filtrate. The
cake can be used as organic fertilizer, whereas filtrate water is discharged to existing aerobic ponds.
This system was developed and initiated by KLK Berhad, a palm oil company group based in Malaysia.
Investment costs of the filter belt press is about MYR 700,000 -- equivalent to USD160,000. Potential
GHG reduction is measured and estimated to be about 50% of the baseline measure of open pond
treatment. Detailed information about filter belt press is presented in the case study section of this
report.
c. Membrane Filtration
Membrane filtration is a proven technology used across industries for water filtration or wastewater
treatment. It is a physical separation process that uses a semipermeable membrane to remove
suspended solids from a liquid stream. Membranes are thin and porous sheets of material able to
separate contaminants from water when a driving force is applied. Membranes are made from
synthetic organic polymers, organic materials such as ceramics or metals. It emerged as a viable
means of water purification in 1960s. Implementation of membranes for water treatment has
progressed using more advanced membranes made from new materials and employed in various
configurations. This system can be fully automated without the need for highly skilled operators,
offers benefits in time savings, and the reclaimed water can be used for operating purposes.
However, high installation and maintenance costs have resulted in low adoption of this technology
in palm oil sector (Azmi and Yunos, 2014).
The installation costs of the membrane system depends on wastewater character, flow rate, and
materials used. A smaller high-end system for a power plant with a capacity of 100 to 200 GPM
(Gallon per Minute) might be $450,000, whereas a commercial version might be $250,000
(Samcotech). Maintenance costs can be high, but pre-treatment to lower sludge and colloidal
particles which can cause damage to the membrane can have a positive impact. A pilot project
exploring membrane ultrafiltration using PKS-AC (Palm Kernel Shell-Activated Carbon) for pre-
treatment reduced suspended solids by 71.26% and COD by 63.23%. Pre-treated POME was further
treated using an ultrafiltration membrane technique, achieving total COD removal of about 99%
(Azmi and Yunos, 2014).
Table 24. Typical industrial membrane system capital costs
Components % of total investment
Pumps 30%
Replaceable membrane components 20%
Membrane modules 10%
Pipework, valves, framework 20%
Control system 15%
Other 5%
Source: Accepta.com (capital costs include automated cleaning activities)

Compilation of BMPs to Reduce Emissions in Palm Oil Production Management Practices to Reduce Emissions 74
Table 25. Typical operating costs of membrane filtration system
Components % of total O&M Costs
Replaceable membrane components 35 – 50%
Cleaning 12 – 35%
Energy 15 – 20%
Labor 15 – 18%
Source: Accepta.com
Overall, these solid filtrate separation technologies offer mills compelling options for reducing their emissions from
CPO production while enhancing overall production efficiency. While they offer benefits to companies of any size
and location, they may represent a particularly enticing for mills with limited available land for open ponds, those
located close to critical water bodies or local community, or those facing barriers with implementing methane
capture systems. Considering the investment costs, the filter belt press may offer the most viable option for small
and medium size companies.
In considering systems for effluent management, mills should consider the complete range of implementation and
maintenance costs (summarized in the table below) as well as real cost savings each offer. The three solid filtrate
separation systems explored here do not require highly skilled operators and mills can train their existing personnel
to operate the system. These systems also offer a number of co-benefits, including:
- Production of cake as organic fertilizer
- Reduction of desilting procedures, hence lowering cost of open pond treatment
- Reduction of open pond load, increasing efficiency
- Cleaner air and less foul odor
- Reclaimed water can be used for production
Table 26. Comparison of Solid Filtrate Separation System
Solid Filtrate Separation System
Investment COD Removal/ GHG Reduction Potential
Quality of water produced by the system
Filtration and Evaporation High High Pure water
Filter Belt Press Medium Medium to high Water for cleansing or channeled to open ponds
Membrane Filtration High High Clean water
Summary
Criteria Score Remark
1 Financial evaluation Medium Starting from USD 165,000. It is a lower investment when
compared to methane capture.
2 GHG reduction
potential High
About 50% of the baseline or higher. Unfortunately, study or
quantitative data on GHG reduction of this BMP are still limited
at this moment.
3 Technical and
operational challenge Low Does not require highly skilled workers
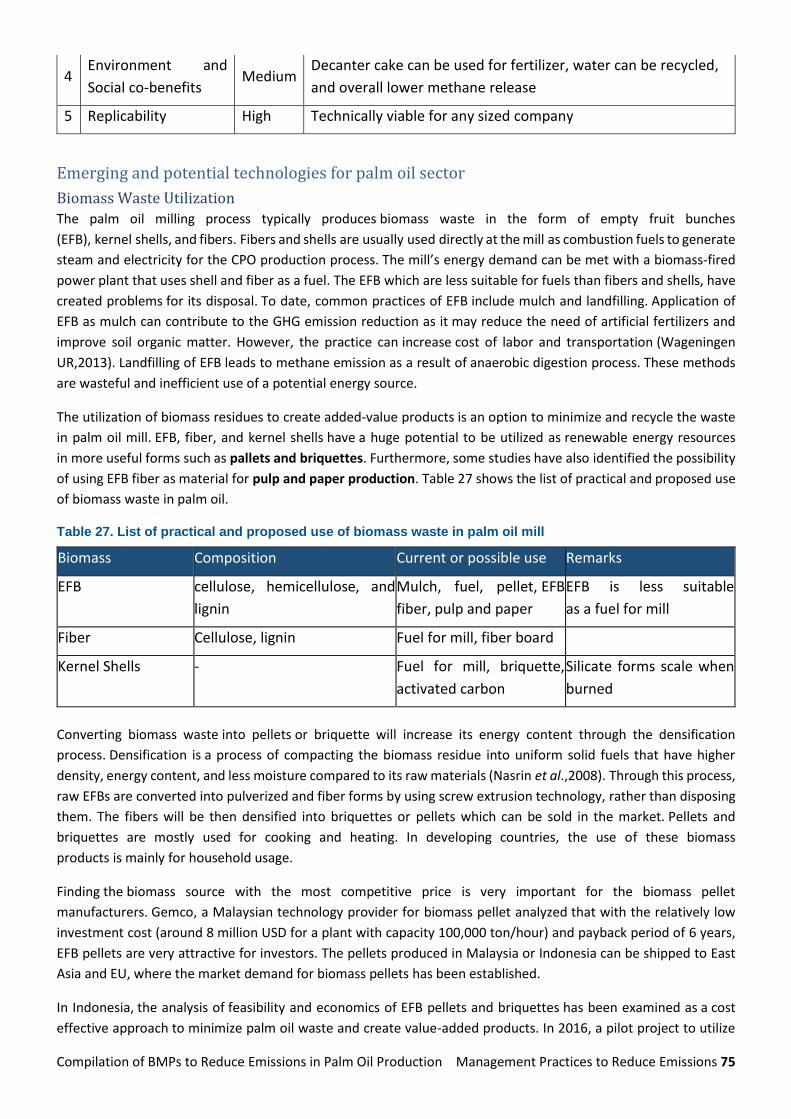
Compilation of BMPs to Reduce Emissions in Palm Oil Production Management Practices to Reduce Emissions 75
4 Environment and
Social co-benefits Medium
Decanter cake can be used for fertilizer, water can be recycled,
and overall lower methane release
5 Replicability High Technically viable for any sized company
Emerging and potential technologies for palm oil sector
Biomass Waste Utilization
The palm oil milling process typically produces biomass waste in the form of empty fruit bunches
(EFB), kernel shells, and fibers. Fibers and shells are usually used directly at the mill as combustion fuels to generate
steam and electricity for the CPO production process. The mill’s energy demand can be met with a biomass-fired
power plant that uses shell and fiber as a fuel. The EFB which are less suitable for fuels than fibers and shells, have
created problems for its disposal. To date, common practices of EFB include mulch and landfilling. Application of
EFB as mulch can contribute to the GHG emission reduction as it may reduce the need of artificial fertilizers and
improve soil organic matter. However, the practice can increase cost of labor and transportation (Wageningen
UR,2013). Landfilling of EFB leads to methane emission as a result of anaerobic digestion process. These methods
are wasteful and inefficient use of a potential energy source.
The utilization of biomass residues to create added-value products is an option to minimize and recycle the waste
in palm oil mill. EFB, fiber, and kernel shells have a huge potential to be utilized as renewable energy resources
in more useful forms such as pallets and briquettes. Furthermore, some studies have also identified the possibility
of using EFB fiber as material for pulp and paper production. Table 27 shows the list of practical and proposed use
of biomass waste in palm oil.
Table 27. List of practical and proposed use of biomass waste in palm oil mill
Biomass Composition Current or possible use Remarks
EFB cellulose, hemicellulose, and
lignin
Mulch, fuel, pellet, EFB
fiber, pulp and paper
EFB is less suitable
as a fuel for mill
Fiber Cellulose, lignin Fuel for mill, fiber board
Kernel Shells - Fuel for mill, briquette,
activated carbon
Silicate forms scale when
burned
Converting biomass waste into pellets or briquette will increase its energy content through the densification
process. Densification is a process of compacting the biomass residue into uniform solid fuels that have higher
density, energy content, and less moisture compared to its raw materials (Nasrin et al.,2008). Through this process,
raw EFBs are converted into pulverized and fiber forms by using screw extrusion technology, rather than disposing
them. The fibers will be then densified into briquettes or pellets which can be sold in the market. Pellets and
briquettes are mostly used for cooking and heating. In developing countries, the use of these biomass
products is mainly for household usage.
Finding the biomass source with the most competitive price is very important for the biomass pellet
manufacturers. Gemco, a Malaysian technology provider for biomass pellet analyzed that with the relatively low
investment cost (around 8 million USD for a plant with capacity 100,000 ton/hour) and payback period of 6 years,
EFB pellets are very attractive for investors. The pellets produced in Malaysia or Indonesia can be shipped to East
Asia and EU, where the market demand for biomass pellets has been established.
In Indonesia, the analysis of feasibility and economics of EFB pellets and briquettes has been examined as a cost
effective approach to minimize palm oil waste and create value-added products. In 2016, a pilot project to utilize

Compilation of BMPs to Reduce Emissions in Palm Oil Production Management Practices to Reduce Emissions 76
EFB into briquette was conducted in PT. Perkebunan Nusantara Indonesia (state-owned oil palm plantation)
in Dolok Sinumbah, North Sumatera. The study found that with the low briquetting cost of around 13,927 USD and
payback period of 1.33 year, biomass briquette can be a great investment to be applied in Indonesia (Maitah et al.
,2016). In addition, the investment in briquette industry can be more enhanced with a support from the government
on the pricing of biomass feedstock to assure the supply of raw material.
It is assumed that no GHG emissions arise from the application of solid waste from palm oil production, thus it does
not lead to a significant GHG emission reduction. Leakage emissions might possibly occur from the use of fossil fuel
for transportation and the use of machinery for densification process. Application of mulch and disposal to landfill
also contribute to GHG emissions. Utilization of solid waste for energy production through pelleting or bracketing,
and pulp and paper production is less GHG intensive when compared to other options such as pulp and paper
production from timber. However, no quantitative data on GHG emissions or comparison are available.
Biomass utilization as pellets or briquettes is still facing many technical and operational challenges that may hinder
wide implementation. To date, the development of biomass pellets and briquettes from palm oil process is mostly
limited to pilot projects to prove the economic and technical feasibility. Therefore, the utilization has not been
widely implemented and most palm oil mills are still focusing on using the biomass waste as combustion fuels for
the CPO production process. From the technical side, lack of familiarity of the process and lack of expertise often
make palm oil mills reluctant to apply the practice. Furthermore, the machinery used in the densification process
often needs to be modified depending on the raw materials used. For example, the machinery that uses EFB and
sawdust as feed will need binder and feeding part modified (Nasrin et al., 2008). In addition, since this is an
emerging technology, the value chain and distribution channels are not well developed.
A large amount of biomass waste is produced during CPO production. Although some components are currently
used for internal power production, it is common for EFBs to be inefficiently managed. Turning this waste product
into an additional new commodity, such as palettes, briquettes, or even in pulp and paper manufacturing, has the
potential not only to increase financial flows, reduce GHG emissions at the plant, but also serve as a sustainable
and renewable energy and paper supply.
Increasing palm oil productivity and maximizing the use of the residues resulting from palm oil production
both offer win-win options – reducing GHG emissions and potentially provide added value or economic
benefits. Technologies discussed in this section have been applied in other sector, technically proven in
multiple scales and commercial stage, yet haven’t been explored by palm oil sector. Two technologies, biogas
upgrading and advanced biofuel production; are presented here to give overview on the development,
potential application, and identified barriers.

Compilation of BMPs to Reduce Emissions in Palm Oil Production Management Practices to Reduce Emissions 77
Summary
Criteria Score Remark
1 Financial evaluation Medium Starting from USD 13,927 for briquetting plant
2 GHG reduction
potential
Low to
Medium
GHG reduction can be achieved from the landfilling or mulching
avoidance. However, no quantitative data on GHG emissions or
comparison are available
3
Technical and
operational
challenge
Low Does not require highly skilled workers
4 Environment and
Social co-benefits Medium
Pallet or briquette products can be sold and add revenue to
companies
5 Replicability High Technically viable for any sized company
Biogas Upgrading
Biogas has the potential to be used in place of fossil fuels by industry, transport, and households. Typical raw biogas
consists of 50-65% methane (CH4), 30-45% carbon dioxide (CO2), traces of hydrogen sulfide (H2S), fractions of water
and other contaminant gases. Pre-treatment is required to remove water vapor and compounds such as H2S and
NH3. After pre-treatment, biogas can be used as fuel in boiler and turbine or biogas engine for heat or power
production with efficiency of <80% and 35%, and 39-42% respectively. Biogas upgrading is separating methane and
carbon dioxide to get pure methane. Biomethane can be stored, transported, and used as replacement to natural
gas for industrial uses; injected into gas grid, compressed and used as vehicle fuel (bio-CNG), or polished and
liquefied to produce bio-LNG. In the form of biomethane, more than 90% of energy can be used. One cubic meter
of methane has energy content equivalent to ten kWh (~9.97 kWh) (FNR,2009).
Biomethane injection into national gas grid or used as vehicle fuel has been practiced in Brazil, Netherlands, UK,
and other European countries. Plants with capacity of 500 Nm3/hour to 2000 Nm3/hour biogas are currently
supplying biomethane to the grid in UK (European Biogas Association, 2018). A plant in Brazil processing food waste,
grass cutting, and sewage was able to create 519 m3/day of biogas (IEA Bioenergy, 2017). Applying an integrated
water scrubbing and pressure swing absorption technology, biogas can be upgraded to biomethane (96-98%) for
vehicle fuel with total volume 9,000 m3/ month and also produces bio-fertilizer as a by-product. Switching from
diesel to biomethane also reduces the need to buy fuel, thus adding an additional cost savings. About 11 number
of biogas bottling projects of various capacities and technologies have been commissioned in India, upgrading raw
biogas generated from cow dung and other organic matters into CNG quality (Min of New and RE of Gov of India).
The projects developed under research and development program of MNRE of India Government, use the bottled
biomethane for cooking and vehicle fuel purpose. The projects mentioned here are small scale, smaller than palm
oil mill potential, but this demonstrates that biogas upgrading is applicable various scale, small to large ones. Palm
oil mill with capacity of 45 tph could generate about 15,300 Nm3/day biogas or 8,400 Nm3/day methane gas21.
Assessing biomethane potential in Malaysia, it is estimated that more than 500 kt per year of biomethane could be
produced by palm oil mills if all POME is treated anaerobically. The study also identifies 135 – 227 biogas plants,
evaluated based on location, technology, and capacity; could replace supply to 40-67% residential fossil gas demand
21 Assumptions for calculation: 6,000 hours/year of mill operating hours, COD level 70,000 mg/l, 0.6 m3 POME/ton FFB
processed, 85% COD removal, biogas plant operating hours is 8,760 hours/year.

Compilation of BMPs to Reduce Emissions in Palm Oil Production Management Practices to Reduce Emissions 78
(Hoo, et. al., 2017). Biogas upgrading in palm oil industry in Thailand is estimated can produce approximately 44.91
million m3 biomethane in 2012 and increase to 238.89 million m3 in 2030 (Pattanapongchai and Limmeechokchai,
2011).
There are number of systems available in the market for biogas upgrading. Common systems are pressurized water
scrubbing (PWS), catalytic absorption/ amine wash (CA), pressure swing absorption (PSA), membrane separation
(MS), and cryogenic liquefaction (CL). In the last decade, 2001 to 2012, the number of large biogas upgrading plants
has continued to expand (Figure 24). These various approaches have varying advantages and disadvantages (Table
28).
Figure 24. Biogas Upgrading System Population in 2001-2012 (Source: IEA Task 37)
Table 28. Biogas Upgrading Systems (Source: Lems and Dirkse (2015), SevernWay Energy Agency)
Parameter System Scale
PWS CA PSA MS CL Large Small
Gas quality High High High High High High High
Gas quantity High High Medium Low Medium High Low
Investment Medium Medium+ High Low High Medium Low
Maintenance Medium Medium Medium+ Low High Medium Low
Operation Medium Complex Complex Easy Complex Medium Easy
Compact Medium Medium No Yes No Medium Yes
Methane efficiency
High High Medium Low High High Low
Emissions Low Low Medium Medium Low Low Medium

Compilation of BMPs to Reduce Emissions in Palm Oil Production Management Practices to Reduce Emissions 79
Waste streams
Continues Continues+ Batch Batch Continues Continues Batch
Typical methane content
95-99% >99% 95-99% 95-99% 95-99% n/a n/a
Methane recovery
98% 99.96 98% 80-99.5%
96% n/a n/a
Electric energy demand (kWh/m3 biomethane)
0.46 0.27 0.46 0.25-0.43
0.49-0.67 n/a n/a
Typical investment costs (€/(m3/h) biomethane - 100 m3/h
- 250 m3/h
- 500 m3/h
10,100 5,500 3,500
9,500 5,000 3,500
10,400 5,400 3,700
7,600 4,900 3,700
9,500 5,000 3,500
n/a n/a
Typical operational costs - 100 m3/h
- 250 m3/h
- 500 m3/h
14.0 10.3 9.1
14.4 12.0 11.2
12.8 10.1 9.2
15.8 11.6 10.1
13.8 10.2 9.0
n/a n/a
Consumables demand
Antifouling agent, drying agent
Amine solution (hazardous corrosive)
Activated carbon (non-hazardous)
n/a Organic solvent (non-hazardous)
n/a n/a
Referring to previous estimation of a 45 tph of FFB capacity mill, generating biomethane of 8,400 Nm3/day, capital
expenditure for biogas upgrading plant may range between USD 1.3 to 1.8 million. Upgrading biogas into
biomethane for grid injection might be challenging for the palm oil sector since most of mills are located in remote
area or distance from the national piping grid. Biomethane use for vehicle fuel is plausible for palm oil sector.
Biomethane can replace fossil fuel for trucks transporting FFB and CPO, with some vehicle modifications, thus
reducing bulk GHG emissions of CPO production (see BMP on Fuel Use above). However, a concern regarding safety
prevails due to hilly areas of palm oil plantations.
Biomethane competes with natural gas or other fuel, i.e. gasoline for vehicle, in the market. To promote
biomethane uptake, infrastructure and policy supports are required in countries where fossil fuels are mostly used
for energy production. A subsidy could also enable the commercial use of biomethane. A study investigating
upgrading biogas plant with CHP technology in palm oil for electricity generation in Thailand from 2012 to 2019
found that a subsidy of 0.3 baht/kWh (less than USD0.001) is needed to make biomethane competitive to other
electricity generation technologies (Pattanapongchai and Limmeechokchai, 2011). Biomethane delivered to natural
grid in Latvia is approximately 19% more expensive than the natural gas, yet has been shown to be competitive
with a minimum subsidy of 22 EUR/MWh or 7 EUR/MWh lower for larger plants (Paturska, et. al., 2015).
Despite multiple biogas upgrading system providers in the market, biogas upgrading is considered new system in
palm oil sector. Biogas upgrading system providers work with palm oil companies to carry out pilot projects to

Compilation of BMPs to Reduce Emissions in Palm Oil Production Management Practices to Reduce Emissions 80
demonstrate viability for the sector. For example, Xebec and Sirim are working with a palm oil mill in Malaysia to
run a pilot biogas upgrading plant, a hybrid of PSA and membrane systems, producing purified gas equal to CNG
quality natural gas to fuel palm oil company’s vehicles. A commercial plant of BioCNG has been launched in Felda
Palm Oil Mill Sg. Tengi, Selangor Malaysia. The plant, costing around MYR 7 million (USD$1.76 million), processes
600 m3/hour of raw biogas from methane capture to produce 400 m3/hour bioCNG with methane content >94%.
BioCNG is sent to factories, about 45 km away from the plant, by CNG trailers to replace LNG fuel consumption. The
plant is a strategic venture between Malaysia Palm Oil Board (MPOB), Felda Industries Sdn Bhd, and Sime Darby
Offshore Engineering Sdn Bhd. Similar to methane capture, it is expected that successful projects could motivate
palm oil companies to adopt the system. biomethane is best transported in a compressed state up to 200 km
distance, whereas transport in the liquefied state can be an option for longer distance.
Summary
No Criteria Score Remark
1 Financial evaluation High Investment cost USD 1.3 to USD 1.8 for a biogas upgrading plant
2 GHG reduction potential High Potentially reduce about 50% of mill's emission. Reduction can also be achieved from the fossil fuel replacement of vehicles in plantation
3 Technical and operational challenge Medium Mill personnel needs to be trained to operate the facility, Service contract with provider could ensure smooth operation.
4 Environment and Social co-benefits High Cleaner air, RE generation, fossil fuel replacement, supporting national target in GHG reduction.
5 Replicability Medium Technically replicable, yet utilization scenario and financing could be determining factors for small and medium company group.
Advanced Biofuel Production from Palm Oil Waste
Conventional biofuel, often referred as first-generation biofuel, can be produced from edible crops (e.g. sugarcane,
corn, rapeseed, palm oil), oil-crop based biodiesel and straight vegetable oil, as well as biogas derived through
anaerobic digestion, animal fats and used cooking oils. Biofuel production has started to shifting to utilize non-
edible crops or dedicated energy crops and residues which also known as second-generation biofuel (Table 29).
Table 29. Feedstocks of Second Generation Biofuel (source: Eisentraut 2010)
Feedstock Cultivation/ Sector Plants
Dedicated energy crops
Short-rotation coppice
Poplar, willow, eucalyptus
Perennial cultication Miscanthus, switchgrass, reed canarygrass, grasses
Primary residues Agriculture Straw, stover
Forestry and logging Treetops, branches, stumps
Secondary residues
Crop processing Coffee, rice, corn, cacao
Sugar and 1st generation bioethanol production
Sugar cane, sweet sorghum, sugar beet
Vegetable oil production
Canola, palm oil, jatropha
Forestry processing Sawdust, bark
Tertiary residues Municipal solid waste Palettes, furniture, demolition timber

Compilation of BMPs to Reduce Emissions in Palm Oil Production Management Practices to Reduce Emissions 81
Lignocelluloses biomass refers to higher plants, softwood, or hardwood and is mainly composed cellulose (35%-
50%), hemicellulose (13-35%), lignin (10-35%), and extraneous materials (Karimi, 2015). The hydrolysis pathway to
convert lignocellulosic materials to biofuel requires pre-treatment to breakdown the structure of cellulose and
hemicellulose into fermented sugar mixtures (Figure 25). Pre-treatment can be carried out through physical,
chemical and physicochemical, and biological processes. The chemical process could use enzymes, acid, or gas.
Biological pretreatments use microorganism such as fungi, bacteria, and actinomycetes to degrade the cellulose
(Figure 26). Biofuel yield depends on technology and feedstock type that is in the range of 75 to 300 litre per ton
dry matter (Sims, et. al., 2010).
Figure 25. Principle pathways of advanced biofuels technologies
Figure 26. Processing steps in lignocellulose to bioethanol production
EFB contains cellulose (30-40%), hemicellulose (20-30%), and lignin (20-30%) (Li, et. al. 2013. Sic). Moisture content
is around 70% due to biological growth and steam sterilization during CPO production at the mill. Assuming 0.2 ton
EFB/ ton FFB and 30% dry matter, available dry EFB is estimated to be 0.06 ton dry EFB per ton FFB processed. EFB
can be converted to methane after alkali pretreatment with 8% NaOH for 60 minutes and reach theoretical
methane value 0f 97% (Carrillo et al., 2011). Research on EFB fermentation to sugar has been carried out using
dilute acid, enzymatic, and the combination of two processes resulting in 45.3% to 82% fermentable sugar yield (Li
et al., 2014). Theoretical conversion of sugar to ethanol is 3 to 1, however, actual conversion is 5-6 to 1. Sugar yield
from EFB fermentations starts at 80-82% and may reach 90-95%. Aiming sugar yield above 90% is possible but the
production costs could rise double or triple higher than the best costs scenario (Li et al. 2014).
Balancing yield optimization and cost efficiency is the challenge in designing a optimum conversion biogas plant.
There will be a trade-off in reduced yield to achieve an efficient plant. Sourcing sufficient EFB supply for a
commercial plant is critical factor. A biofuel plant with capacity of two million liter per year would require 15-20
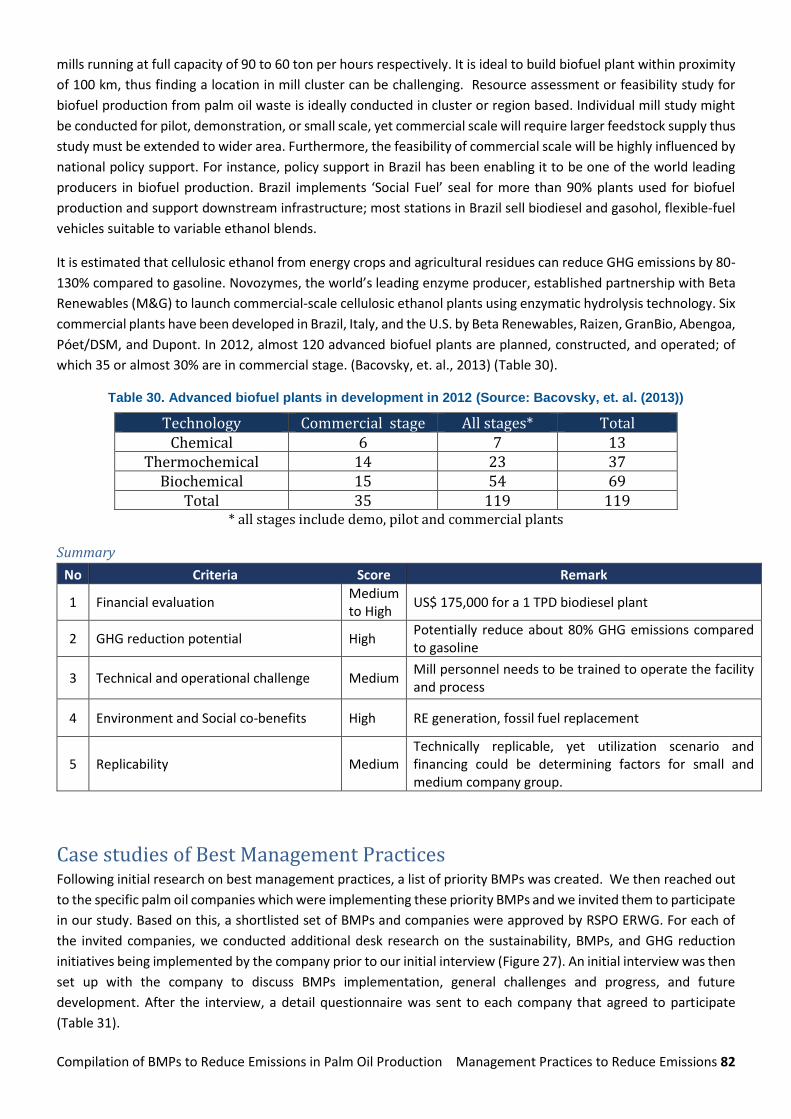
Compilation of BMPs to Reduce Emissions in Palm Oil Production Management Practices to Reduce Emissions 82
mills running at full capacity of 90 to 60 ton per hours respectively. It is ideal to build biofuel plant within proximity
of 100 km, thus finding a location in mill cluster can be challenging. Resource assessment or feasibility study for
biofuel production from palm oil waste is ideally conducted in cluster or region based. Individual mill study might
be conducted for pilot, demonstration, or small scale, yet commercial scale will require larger feedstock supply thus
study must be extended to wider area. Furthermore, the feasibility of commercial scale will be highly influenced by
national policy support. For instance, policy support in Brazil has been enabling it to be one of the world leading
producers in biofuel production. Brazil implements ‘Social Fuel’ seal for more than 90% plants used for biofuel
production and support downstream infrastructure; most stations in Brazil sell biodiesel and gasohol, flexible-fuel
vehicles suitable to variable ethanol blends.
It is estimated that cellulosic ethanol from energy crops and agricultural residues can reduce GHG emissions by 80-
130% compared to gasoline. Novozymes, the world’s leading enzyme producer, established partnership with Beta
Renewables (M&G) to launch commercial-scale cellulosic ethanol plants using enzymatic hydrolysis technology. Six
commercial plants have been developed in Brazil, Italy, and the U.S. by Beta Renewables, Raizen, GranBio, Abengoa,
Póet/DSM, and Dupont. In 2012, almost 120 advanced biofuel plants are planned, constructed, and operated; of
which 35 or almost 30% are in commercial stage. (Bacovsky, et. al., 2013) (Table 30).
Table 30. Advanced biofuel plants in development in 2012 (Source: Bacovsky, et. al. (2013))
Technology Commercial stage All stages* Total Chemical 6 7 13
Thermochemical 14 23 37 Biochemical 15 54 69
Total 35 119 119 * all stages include demo, pilot and commercial plants
Summary
No Criteria Score Remark
1 Financial evaluation Medium to High
US$ 175,000 for a 1 TPD biodiesel plant
2 GHG reduction potential High Potentially reduce about 80% GHG emissions compared to gasoline
3 Technical and operational challenge Medium Mill personnel needs to be trained to operate the facility and process
4 Environment and Social co-benefits High RE generation, fossil fuel replacement
5 Replicability Medium Technically replicable, yet utilization scenario and financing could be determining factors for small and medium company group.
Case studies of Best Management Practices Following initial research on best management practices, a list of priority BMPs was created. We then reached out
to the specific palm oil companies which were implementing these priority BMPs and we invited them to participate
in our study. Based on this, a shortlisted set of BMPs and companies were approved by RSPO ERWG. For each of
the invited companies, we conducted additional desk research on the sustainability, BMPs, and GHG reduction
initiatives being implemented by the company prior to our initial interview (Figure 27). An initial interview was then
set up with the company to discuss BMPs implementation, general challenges and progress, and future
development. After the interview, a detail questionnaire was sent to each company that agreed to participate
(Table 31).

Compilation of BMPs to Reduce Emissions in Palm Oil Production Case Studies 83
Figure 27. Case Study Methodology
Table 31. Information requested during interviews
Category Questions Motivation • Why and how did the initiative start?
• What were the key motivation factors? (certification,
financial returns, CSR, etc.)
• Who initiated and championed the initiative
internally?
• How was the decision made? What was the approval
process?
• What was the projected investment and anticipated
challenges?
• What technologies and practices were considered
and how was the ultimate initiative selected?
Execution • What was the process of carrying out the project?
• What technical knowledge or capacity building was
needed for the project?
• How were the expected emission reductions
estimated?
• How was the project financed?
• What were the final costs?
• What were the main challenges in execution? And
what were the solutions?
• Who did you partner with for the work? What
stakeholders did you need to engage?
• Did specific policies help or hinder the project
execution?
Results • What was the operational impact to business?
• What was the financial impact to business?
• What were the emissions reductions and how did
they compare to projected emissions reductions?
• What are the plans for future development?
• What were the costs and revenues?
• What advice would you give others interested in
implementing this practice? To what extent would
others be able to implement this practice?
Desk research Initial
interview
Questionnaire & Data
collection
Follow up Interview/ Site
visit
Data compilation &
report completion

Compilation of BMPs to Reduce Emissions in Palm Oil Production Case Studies 84
Data collection and information gathering were facilitated through this questionnaire and further followed up by
an additional interview. Data compilation and analysis were then conducted to produce the case study and
complete the report. Five palm oil companies have participated in the case study preparation. Two of these focus
on BMPs implemented in oil palm plantations: 1) Golden Agri Resources’ work in Indonesia on peat rehabilitation
and community engagement to help prevent fires; and 2) Olam Palm Gabon’s work in Gabon on implementing high
carbon stock approaches. Three others focus on BMPs implemented in palm oil mills: 1) Wilmar International’s
methane capture facilities; 2) Sime Darby’s co-composting of palm oil waste materials; and 3) Kuala Lumpur Kepong
Berhad’s filter belt-press systems. A summary of each case study is presented below while the detailed versions are
found in the Annex.
Additional case studies were previously examined in 2013 to present best management practices of RSPO members
in Colombia, Indonesia, and Malaysia (Box 3). Key lessons from previous report are (1) methane avoidance projects
provide significant GHG reductions in production stage (mills), (2) co-benefits of economics and environment
motivated voluntary GHG reduction initiatives, and (3) carbon credit revenues through Clean Development
Mechanism was critical to investment decision.
Box 3. Overview of case studies previously completed for RSPO22 Production of palm pellet from EFB in Tawau, Sabah, Malaysia QL Tawau Palm Pellet Sdn. Bhd is recycling empty fruit bunches into renewable fuel in the form of palm pellets. The project reduces emissions through 1) the avoidance of methane production from biomass that would have decayed under the anaerobic conditions of solid waste disposal sites and 2) the substitution of fossil fuels for palm pellet fuel. USD $4 million was invested to build a facility with a capacity of 25,000 MT palm pellet per year, and estimated to reduce emissions up to 30,000 tCO2eq/ year. EFB and POME Co-composting by Daabon at Santa Marta, Colombia Daboon Group in Colombia has developed co-composting of EFB with POME at its mill in Colombia. The project is reducing emissions through 1) avoidance of methane production from decayed EFB in its solid waste disposal site and POME in anaerobic ponds, and 2) the substitution of chemical fertilizers. Daboon Group invested USD $800,000 for a co-composting facility with capacity of 1,700 ton/month. The project is estimated to recover all costs by year 9. Unfortunately, the case study does not include the estimated emissions reductions contributed by the project. Methane recovery and utilization at PT. Musim Mas Palm Oil Mill in Pangkalan Lesung Riau, Indonesia In 2010, Musim Mas’ mill in Riau installed a methane recovery facility and converted biogas into electricity. With an investment of USD 2.7 million, the project has installed a capacity of 1.5 MWe and generates 10,000 MWh/ year of electricity, enabling the mill to reduce its dependency on fossil fuels. The project is estimated to reduce emissions by 55,798 tCO2e/year through 1) avoidance of methane production from POME in open lagoon and 2) substitution of fossil fuel-based electricity. It contributes to the mill’s carbon footprint reduction by about 65%. Considering savings from electricity and CER revenue, the investment was projected to have a payback period of less than four years. FELDA Serting Hilir POME Biogas Power Plant Project at Negeri Sembilan, Malaysia
22 Reducing Operational Emissions from Palm Oil Production – A compilation of case studies, Eco-Ideal Consulting Sdn. Bhd, RSPO, 2013.

Compilation of BMPs to Reduce Emissions in Palm Oil Production Case Studies 85
Similar to the project in Musim Mas, Felda developed a methane capture facility and converted the produced biogas into electricity. The generated electricity is used on site (300 kW) and sold to the grid (500 kW). This project was developed in two stages: methane capture in 2008 and power generation system in 2010, with a total investment of USD $3.34 million. Considering savings from electricity and CER revenue, the investment was projected to have a payback period of 5 years. Biomass-fired Boiler in Lahad Datu, Sabah, Malaysia LDEO Energy Sdn. Bhd. is a refinery company producing edible oils. It developed a biomass steam and power plant with boiler capacity of 35 MT/hour and produced electricity of 81 MWh/year for refinery captive use. LDEO invested about USD $2.6 million and was projected to have a payback period of 8 years. The boiler combusts about 57,000 ton solid waste (EFB, Mesocarp Fiber, and Palm Kernel Shell) supplied by a nearby mill. Emission reductions are estimated to be approximately 40,000 tCO2eq/year, achieved through 1) the displacement of fossil fuels that used to generate steam, 2) the substitution of electricity from the local grid and a fossil fueled generator set, and 3) the avoidance of methane production from decaying EFB is solid waste disposal site.
An overview of each of the case studies examined is presented below. For each case study we looked at why the
initiative was started, an overview of the technologies used, the GHG emissions expected, and any lessons learned.
The full case studies can be found in the Annex.
Case study 1: Peat rehabilitation at PT. AMNL, Sinarmas a. Why and how the initiative started
PT SMART Tbk, a subsidiary of Golden Agri Resources (GAR), established the oil palm plantation PT AMNL
(Agro Lestari Mandiri) in 2009 with total area 19,000 hectares (ha). The plantation is situated in the Sub-
District of Nanga Tayap, District of Ketapang, Province of West Kalimantan.
The peat rehabilitation project is within the PT AMNL property and covers about 2,600 ha of conservation
area (mostly peat soil) that was affected by devastating fire occurrences during strong El Niño season in
2015. The primary motivation for implementing the peat rehabilitation was to reduce the risk of fires and
the damages these fires cause in the concession and in local area. Another motivator was the Indonesian
government’s push to restore and protect peatlands.
There are two important elements of this project: biophysical restoration and local community
involvement. These build upon the fire management work that PT AMNL already had in place. As part of
GAR, PT AMNL already adheres to the zero burning policy discussed in the previous section and has
emergency response team personnel and equipment ready in the event of a fire. The justification for the
biophysical restoration of peatlands is that they are much less vulnerable to fires than degraded peatlands.
Local community involvement is also important since many locals still engage in slash and burn agriculture
which can lead to wildfires.
b. Technical description of the initiative and its impacts
As mentioned above, there are two key aspects of this project: biophysical restoration and local
community engagement.
Biophysical restoration
The following steps were conducted to carry out the peatland restoration:

Compilation of BMPs to Reduce Emissions in Palm Oil Production Case Studies 86
1) Determined the status/condition of the area for rehabilitation by carrying out conservation area and
biodiversity surveys;
2) Engaged the community in the rehabilitation and conservation efforts;
3) Restored the hydrology of the peat area by controlling drainage canals and maintaining a high water
table;
4) Selected important native species to restore as much species diversity as possible as well as the physical
appearance of the forest stand.
5) Established nurseries to build the stock of plants for planting out in the area.
6) Collected seeds and seedlings of selected plants.
Community engagement
The development of community empowerment for fire prevention was designed to improve local
awareness of peat fires. A pilot program Desa Siaga Api involving 17 villages prone to fires near the
concession was launched in 2016, which focused on fire prevention. In this program, villagers were
motivated to maintain fire free areas through rewards in the form of social infrastructure development aid.
The program trained villagers and provided them with the proper equipment to prevent and combat fire.
The villages also had direct access to GAR emergency response team and fire response equipment, and
conduct join regular patrol. The program provided technical assistance to villagers on how to clear land
without fire and worked with schools to raise awareness about forest conservation and how to prevent
forest fires.
In 2017, Desa Siaga Api was followed by the broader program Desa Makmur Peduli Api which also included
conservation and food security activities. In addition to the components of Desa Siaga Api, the villagers
receive training on integrated ecological farming to improve local food security and allow them to sell
excess produce.
c. Projected GHG emission reductions
For the peat restoration project in PT AMNL, baseline emissions and potential emissions reduction are still
being developed by the appointed consultant. Even though the emissions estimates are not known yet,
implementation of peat restoration project in PT. AMNL could lead to significant GHG emissions reduction
from avoided peat decomposition and fires.
d. Lessons learned
This peat rehabilitation and community engagement project has been a labor intensive, high cost
investment. As a result, smaller companies could likely not engage in a project of this scale. It is important
to note, however, that a key factor of the success of this effort has been the involvement and collaboration
of the different stakeholders including local communities and academics. Because local communities play
an important role in helping to prevent wildfires, different aspects of the community engagement work,
such as education on fire prevention, could be applicable to all companies with plantations to help prevent
wildfires and maintain good relations between these communities and the company.
Case study 2: Carbon stock assessments in Gabon, Olam Group
a. Why and how the initiative started
Olam Palm Gabon was established in 2011 as a joint venture (JV) between the Olam Group and the
government of the Republic of Gabon (60:40 share) to develop oil palm plantations in the country. When
Olam Palm Gabon was initially established seven years ago, the primary focus of the design was to ensure
compliance with RSPO and Olam’s Palm Policy. However, from its beginning, it was also committed to

Compilation of BMPs to Reduce Emissions in Palm Oil Production Case Studies 87
protecting ecosystem integrity and biodiversity by not developing on primary forests and High Conservation
Value forests.
Olam Palm Gabon has committed to be carbon neutral or net carbon positive over the first 25 years and to
achieve its goal, the low carbon policies and sustainable growth strategies is implemented. In doing so,
carbon stock assessments are included in the land use planning as one of the efforts to minimize carbon
emissions from oil palm operation. Olam is the first company that was tested by the Technical Committee
of HCS+ in Mouila plantation.
b. Technical description of the initiative and its impacts
To comply with its Palm Policy, Olam first conducted extensive data collection within proposed concession
areas. These were used to inform the needed ESIA (Environmental and Social Impact Assessments) and HCV
assessments. Olam’s scientific team developed its own methodological approach to assess the current land
cover and uses and, with this, identified any areas of intact, or high carbon stock forests. With this
combination of studies, Olam Palm Gabon was able to determine the areas within the concessions which
would be developed into oil palm plantations. In particular, in order to exclude high carbon stock forests,
Olam only develops plantations on lands classified as savannah, scrub, woody pioneer vegetation or logged-
over forest , all of which have lower carbon stocks.
c. Projected GHG emission reductions
Olam has estimated the net carbon balance of two of their plantations, Awala and Mouila Lot 1, using the
RSPO GHG calculator. In 2017, the Awala plantation had a net carbon balance of -36,648 tCO2e or -5.64
tCO2e per hectare. In 2017, Mouila Lot 1 had a net carbon balance of -182,996 tCO2e or -11.52 tCO2e per
hectare. All Olam sites achieve net sequestration over one palm cycle due to selective low carbon area and
protection of large conservation areas for biodiversity and local traditional use.
d. Lessons learned
As part of the “HCS Science Study” commissioned by the signatories of the Sustainable Palm Oil Manifesto,
Olam offered its plantations in Gabon to help assess the feasibility of applying the HCS+ methodology in a
forest-rich nations such as Gabon.
In this study, one of the biggest challenges identified was applying thresholds to identify high carbon stock
areas to exclude from plantation development. Olam Palm Gabon does not have a current carbon stock
threshold to differentiate between high carbon stock areas and everything else, it only develops oil palm
plantations on lands considered to be degraded such as scrub and logged-over forest. In contrast, the HCS+
methodology applies an aboveground biomass (AGB) carbon stock threshold of 75 t C ha-1 (i.e., no land
with AGB carbon stock greater than 75 t C ha-1 can be developed). The study found that the application of
the HCS+ threshold would significantly reduce the area of the development in the two concessions, and the
application of the HCS Approach threshold (35 t of C ha -1) would reduce it even more.
Despite this challenge of identifying HCS thresholds, the study found that Olam’s plantations are carbon
positive when HCV and HCS areas are protected from development using Olam’s current carbon stock
assessment practice, since oil palm plantations capture more carbon than the previously degraded, low
carbon land uses stored.
Case study 3: Methane Capture at Terusan Mill, Wilmar International
a. Why and how the initiative started
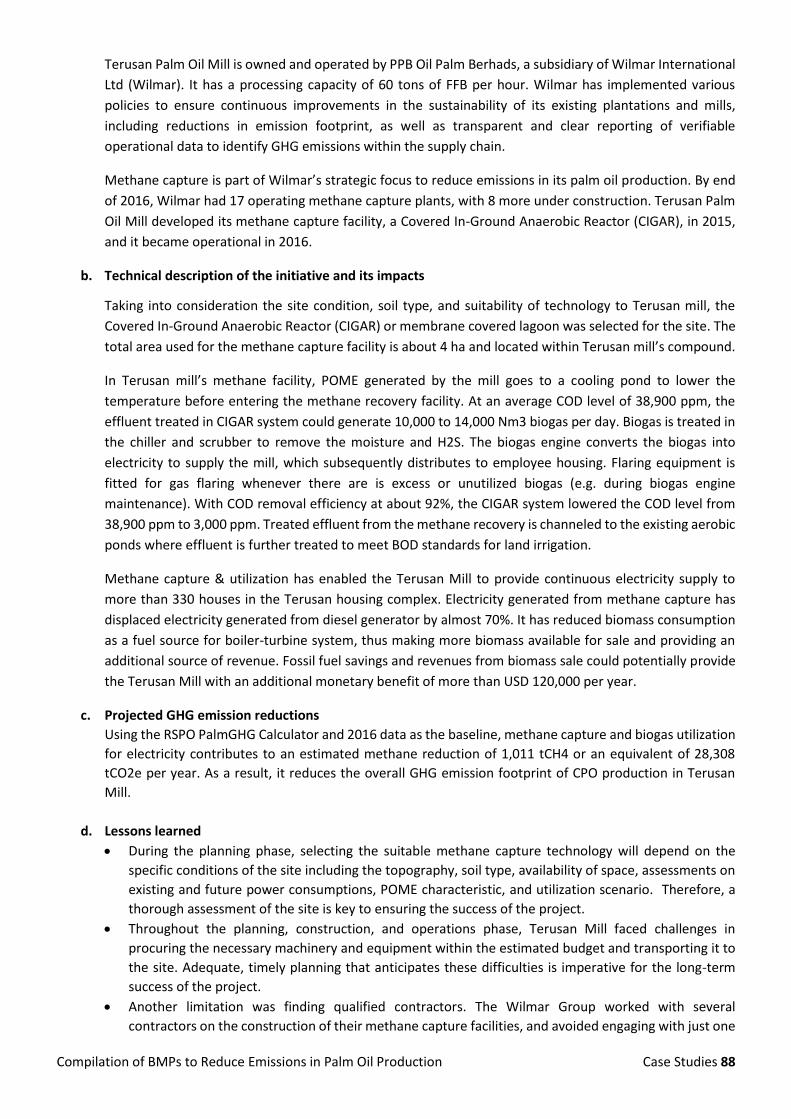
Compilation of BMPs to Reduce Emissions in Palm Oil Production Case Studies 88
Terusan Palm Oil Mill is owned and operated by PPB Oil Palm Berhads, a subsidiary of Wilmar International
Ltd (Wilmar). It has a processing capacity of 60 tons of FFB per hour. Wilmar has implemented various
policies to ensure continuous improvements in the sustainability of its existing plantations and mills,
including reductions in emission footprint, as well as transparent and clear reporting of verifiable
operational data to identify GHG emissions within the supply chain.
Methane capture is part of Wilmar’s strategic focus to reduce emissions in its palm oil production. By end
of 2016, Wilmar had 17 operating methane capture plants, with 8 more under construction. Terusan Palm
Oil Mill developed its methane capture facility, a Covered In-Ground Anaerobic Reactor (CIGAR), in 2015,
and it became operational in 2016.
b. Technical description of the initiative and its impacts
Taking into consideration the site condition, soil type, and suitability of technology to Terusan mill, the
Covered In-Ground Anaerobic Reactor (CIGAR) or membrane covered lagoon was selected for the site. The
total area used for the methane capture facility is about 4 ha and located within Terusan mill’s compound.
In Terusan mill’s methane facility, POME generated by the mill goes to a cooling pond to lower the
temperature before entering the methane recovery facility. At an average COD level of 38,900 ppm, the
effluent treated in CIGAR system could generate 10,000 to 14,000 Nm3 biogas per day. Biogas is treated in
the chiller and scrubber to remove the moisture and H2S. The biogas engine converts the biogas into
electricity to supply the mill, which subsequently distributes to employee housing. Flaring equipment is
fitted for gas flaring whenever there are is excess or unutilized biogas (e.g. during biogas engine
maintenance). With COD removal efficiency at about 92%, the CIGAR system lowered the COD level from
38,900 ppm to 3,000 ppm. Treated effluent from the methane recovery is channeled to the existing aerobic
ponds where effluent is further treated to meet BOD standards for land irrigation.
Methane capture & utilization has enabled the Terusan Mill to provide continuous electricity supply to
more than 330 houses in the Terusan housing complex. Electricity generated from methane capture has
displaced electricity generated from diesel generator by almost 70%. It has reduced biomass consumption
as a fuel source for boiler-turbine system, thus making more biomass available for sale and providing an
additional source of revenue. Fossil fuel savings and revenues from biomass sale could potentially provide
the Terusan Mill with an additional monetary benefit of more than USD 120,000 per year.
c. Projected GHG emission reductions
Using the RSPO PalmGHG Calculator and 2016 data as the baseline, methane capture and biogas utilization
for electricity contributes to an estimated methane reduction of 1,011 tCH4 or an equivalent of 28,308
tCO2e per year. As a result, it reduces the overall GHG emission footprint of CPO production in Terusan
Mill.
d. Lessons learned
• During the planning phase, selecting the suitable methane capture technology will depend on the
specific conditions of the site including the topography, soil type, availability of space, assessments on
existing and future power consumptions, POME characteristic, and utilization scenario. Therefore, a
thorough assessment of the site is key to ensuring the success of the project.
• Throughout the planning, construction, and operations phase, Terusan Mill faced challenges in
procuring the necessary machinery and equipment within the estimated budget and transporting it to
the site. Adequate, timely planning that anticipates these difficulties is imperative for the long-term
success of the project.
• Another limitation was finding qualified contractors. The Wilmar Group worked with several
contractors on the construction of their methane capture facilities, and avoided engaging with just one
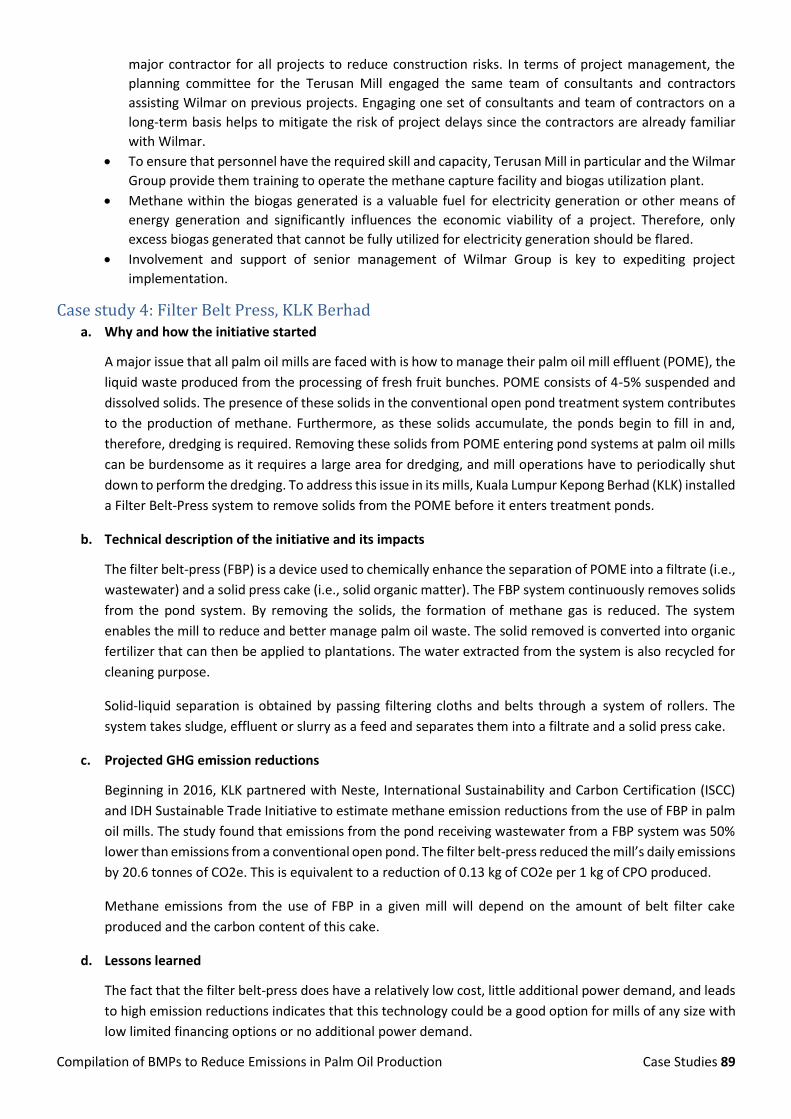
Compilation of BMPs to Reduce Emissions in Palm Oil Production Case Studies 89
major contractor for all projects to reduce construction risks. In terms of project management, the
planning committee for the Terusan Mill engaged the same team of consultants and contractors
assisting Wilmar on previous projects. Engaging one set of consultants and team of contractors on a
long-term basis helps to mitigate the risk of project delays since the contractors are already familiar
with Wilmar.
• To ensure that personnel have the required skill and capacity, Terusan Mill in particular and the Wilmar
Group provide them training to operate the methane capture facility and biogas utilization plant.
• Methane within the biogas generated is a valuable fuel for electricity generation or other means of
energy generation and significantly influences the economic viability of a project. Therefore, only
excess biogas generated that cannot be fully utilized for electricity generation should be flared.
• Involvement and support of senior management of Wilmar Group is key to expediting project
implementation.
Case study 4: Filter Belt Press, KLK Berhad a. Why and how the initiative started
A major issue that all palm oil mills are faced with is how to manage their palm oil mill effluent (POME), the
liquid waste produced from the processing of fresh fruit bunches. POME consists of 4-5% suspended and
dissolved solids. The presence of these solids in the conventional open pond treatment system contributes
to the production of methane. Furthermore, as these solids accumulate, the ponds begin to fill in and,
therefore, dredging is required. Removing these solids from POME entering pond systems at palm oil mills
can be burdensome as it requires a large area for dredging, and mill operations have to periodically shut
down to perform the dredging. To address this issue in its mills, Kuala Lumpur Kepong Berhad (KLK) installed
a Filter Belt-Press system to remove solids from the POME before it enters treatment ponds.
b. Technical description of the initiative and its impacts
The filter belt-press (FBP) is a device used to chemically enhance the separation of POME into a filtrate (i.e.,
wastewater) and a solid press cake (i.e., solid organic matter). The FBP system continuously removes solids
from the pond system. By removing the solids, the formation of methane gas is reduced. The system
enables the mill to reduce and better manage palm oil waste. The solid removed is converted into organic
fertilizer that can then be applied to plantations. The water extracted from the system is also recycled for
cleaning purpose.
Solid-liquid separation is obtained by passing filtering cloths and belts through a system of rollers. The
system takes sludge, effluent or slurry as a feed and separates them into a filtrate and a solid press cake.
c. Projected GHG emission reductions
Beginning in 2016, KLK partnered with Neste, International Sustainability and Carbon Certification (ISCC)
and IDH Sustainable Trade Initiative to estimate methane emission reductions from the use of FBP in palm
oil mills. The study found that emissions from the pond receiving wastewater from a FBP system was 50%
lower than emissions from a conventional open pond. The filter belt-press reduced the mill’s daily emissions
by 20.6 tonnes of CO2e. This is equivalent to a reduction of 0.13 kg of CO2e per 1 kg of CPO produced.
Methane emissions from the use of FBP in a given mill will depend on the amount of belt filter cake
produced and the carbon content of this cake.
d. Lessons learned
The fact that the filter belt-press does have a relatively low cost, little additional power demand, and leads
to high emission reductions indicates that this technology could be a good option for mills of any size with
low limited financing options or no additional power demand.

Compilation of BMPs to Reduce Emissions in Palm Oil Production Case Studies 90
Case study 5: Composting, Sime Darby a. Why and how the initiative started
Sime Darby Plantations is currently implementing initiatives on methane avoidance through composting.
Sime Darby is also implementing 11 methane capture and biogas projects, some of which are already
operating and some of which are in still in development. Both of these initiatives were started by the
Research and Development Department to help achieve zero discharge mills, although GHG emission
reductions were also a primary driver. This case study focuses on co-composting.
b. Technical description of the initiative and its impacts
The composting system uses a combination of mechanical and biological methods to convert POME and
EFB, boiler ash, and decanter cake into organic fertilizer. EFB is first shredded and then is mixed with boiler
ash and decanter cake. The mixture is then stacked in 1.5 meters windrows, which are left to degrade
naturally during a 6 to 7 week period. To ensure that the process in fully aerobic at all times, the windrows
are sprayed daily with POME (where COD levels are approximately 50-55 kg COD/m3) and then turned
every third day. The most important part of the process is turning and aerating which maintains the oxygen
levels in the compost thus ensuring that aerobic decomposition takes place. The resulting compost
produced from this process is transported to the oil palm plantations and applied as fertilizer in oil palm
plantations.
c. Projected GHG emission reductions
In the composting process, methane emissions are reduced since a portion of POME is channeled to be
applied to the EFB instead of going to the open anaerobic and aerobic ponds before being discharged in
rivers. The ideal ratio of EFB:POME determines the amount of carbon emissions avoided. On average, Sime
Darby Plantation was able to apply between 1-1.5 tonnes of POME for every ton of EFB which means 20-
30% of POME produced at the mill was able to be used for the compost process instead of remaining in
wastewater ponds.
As of 2015, Sime Darby’s composting projects in Malaysia have successfully reduced carbon emission
intensity by 6.5% when compared to the 2009 baseline. Carbon intensity gradually decreased from 1.06
tCO2e/mt CPO in 2009 to 1.02 tCO2e/mt CPO by 2015. On average, the 22 compost plants have been able
to generate a reduction of approximately 200,000 MT of CO2e per year with average EFB:POME ratio of
1:1.5.
These estimates only consider GHG reductions from mill operations. It is important to mention that, while
not quantified, further GHG reductions will occur in plantations since the application of this compost will
lead to reduced application of chemical fertilizers
d. Lessons learned
Methane avoidance via composting is a medium to high cost investment depending on the technology and
equipment used. The pre-requisite of turning and aeration can be done via simple machinery such as shovel
and backhoe or with proper equipment such as a turner.
Typically 20% of POME utilization or at EFB:POME ratio of 1:1 is the comfortable level as a higher POME
intake will affect the moisture content of the final product or prolong the processing time to greater than
100 days. The compost can be further enhanced by fortifying it with inorganic fertilizer that is pelletized for
easy application and handling. In this way, the usage of inorganic fertilizer can be reduced and the
application can be spread to larger areas.

Compilation of BMPs to Reduce Emissions in Palm Oil Production Case Studies 91
Case study 6: SNV Indonesia work with palm oil smallholders a. Why and how the initiative started
SNV has been working on household biodigesters since 2009 and has been assisting farmers in building
more than 12,000 units of biogas reactors in Indonesia. Currently, communities use stoves fueled by woods
or LPG for cooking. POME is a potentially abundant source of alternative energy, but most mills are located
far from communities. SNV is currently working with palm oil smallholders in Muaro Jambi, Jambi Province,
to promote the use of small POME biodigesters. Further, SNV is organizing trainings for 4,000 smallholders
over 9 months about different best agricultural practices. In addition to the GHG reductions these practices
could lead to, there could be a host of other benefits including improved soil and water quality and
biodiversity. The construction of small POME biodigester and smallholders trainings are funded by MCA-I.
b. Technical description of the initiative and its impacts
The small biodigester is powered by POME and cow dung and built in the smallholders’ communities
located about 6 km from the mill where the POME is sourced. POME used in the biodigester is taken from
third pond of the mill’s open ponds, hence it contains minimal solids and grease. POME is transported using
a truck with two 2,000 liter plastic tanks in alternate days to supply a feeding rate of 15 liter per m3. Nine
local masons were trained by SNV to assist local communities in the construction and operation of
digesters.
A cylindrical concrete dome digester of 50 m3 capacity was designed and installed with an investment cost
of USD 5,500 per unit. Initial feeding was 30% cow dung and 70% was POME. Gas production started 10
days after the initial feeding with an average yield of 19.5 liters of biogas per liter POME. The biogas
generated by the small POME digester is used for cooking purposes. Fifteen houses connect to the digester
through pipelines and consume about 975 liters of biogas per day. On average, households use their stoves
3 hours per day. The slurry produced by digesters is used as liquid fertilizer for vegetable production, crop
production, and palm tree growth. Slurry from cow and manure biodigesters is proven to be a good organic
fertilizer for crop and vegetable, yet quality of fertilizer from POME and cow slurry is still unknown.
c. Projected GHG emission reductions
This is a pilot effort to evaluate whether biodigesters can sustainably meet the energy needs of smallholder
communities. The use of these biodigesters will help reduce firewood and fossil fuel use by smallholders,
thereby reducing GHG emissions. GHG reductions were estimated by SNV and will be provided on later
stage. It needs to be evaluated if the RSPO PalmGHG calculator can be applied to this small-scale
biodigester.
d. Lesson learned
Lesson learned from the pilot POME bio-digester construction:
• The mill was initially reluctant to supply POME for communities, whereas purchasing POME for biogas
would make the digester less economically feasible. Partnering with local government and local
organizations, SNV educated the mill owner on the benefit of POME utilization for biogas for local
communities.
• Transporting POME regularly can be costly for local communities. SNV recommended that they
transport POME using trucks that deliver EFB to mill and usually return empty.
• A business model, developed by a local committee, a private company, or a farmer cooperative, is
required to ensure the sustainability of POME transport to local communities on a daily basis.
• Operating small biodigesters could be a potential business source for the mill with respect to national
and local regulation on energy and electricity.
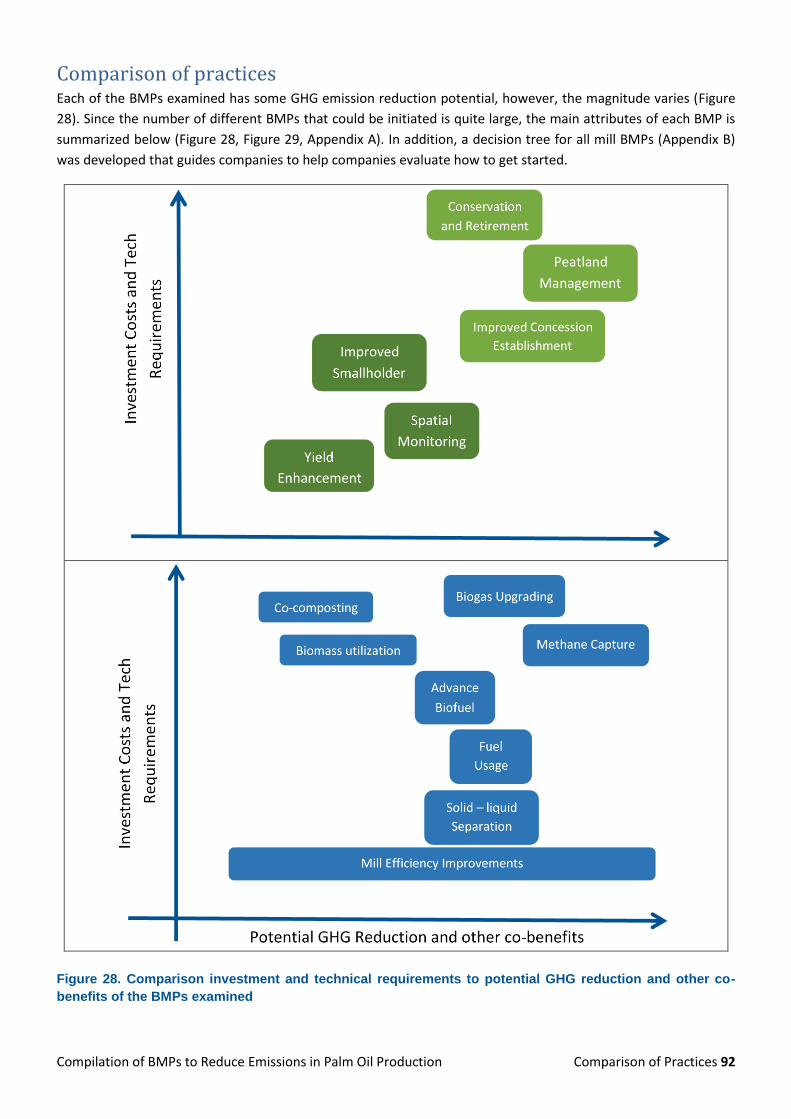
Compilation of BMPs to Reduce Emissions in Palm Oil Production Comparison of Practices 92
Comparison of practices Each of the BMPs examined has some GHG emission reduction potential, however, the magnitude varies (Figure
28). Since the number of different BMPs that could be initiated is quite large, the main attributes of each BMP is
summarized below (Figure 28, Figure 29, Appendix A). In addition, a decision tree for all mill BMPs (Appendix B)
was developed that guides companies to help companies evaluate how to get started.
Figure 28. Comparison investment and technical requirements to potential GHG reduction and other co-
benefits of the BMPs examined
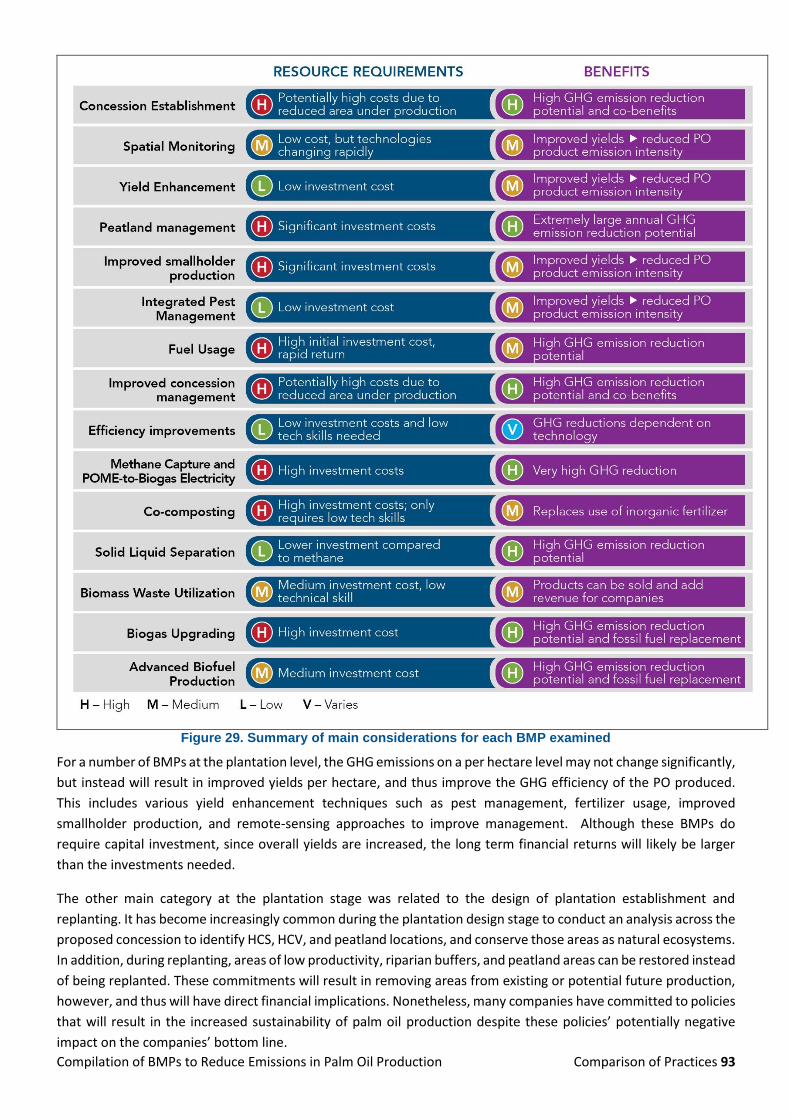
Compilation of BMPs to Reduce Emissions in Palm Oil Production Comparison of Practices 93
Figure 29. Summary of main considerations for each BMP examined
For a number of BMPs at the plantation level, the GHG emissions on a per hectare level may not change significantly,
but instead will result in improved yields per hectare, and thus improve the GHG efficiency of the PO produced.
This includes various yield enhancement techniques such as pest management, fertilizer usage, improved
smallholder production, and remote-sensing approaches to improve management. Although these BMPs do
require capital investment, since overall yields are increased, the long term financial returns will likely be larger
than the investments needed.
The other main category at the plantation stage was related to the design of plantation establishment and
replanting. It has become increasingly common during the plantation design stage to conduct an analysis across the
proposed concession to identify HCS, HCV, and peatland locations, and conserve those areas as natural ecosystems.
In addition, during replanting, areas of low productivity, riparian buffers, and peatland areas can be restored instead
of being replanted. These commitments will result in removing areas from existing or potential future production,
however, and thus will have direct financial implications. Nonetheless, many companies have committed to policies
that will result in the increased sustainability of palm oil production despite these policies’ potentially negative
impact on the companies’ bottom line.

Compilation of BMPs to Reduce Emissions in Palm Oil Production Comparison of Practices 94
The action with the most significant GHG emission reduction potential for any palm oil plantations grown on
peatlands would be to either retire the area, or improve the water table management to result in reduced annual
emissions. It is recommended that additional piloting and research take place to identify the most cost-effective
water table management technologies for installation across peatland areas and evaluate the impact on yields.
At the mill level, methane capture offers the highest emission reduction potential. Although the initial investments
can be high, installation costs can be recouped relatively rapidly. Additional guidance is presented in Appendix B
the steps to take to determine the feasibility of methane capture at a specified mill. The technology behind solid-
liquid separation techniques has recently advanced beyond the pilot stage, and thus offers a very attractive option,
especially in locations where the space for methane capture is less available. Co-composting and biomass utilization
offer relatively cheaper investment cost with considerable environmental and social co-benefits. For example,
pallet and briquette can be sold and serve as an additional source of revenue for the companies. Emerging
technologies such as biogas upgrading and advance biofuel production can be the most appropriate option for
companies focused on reducing fossil fuel consumption in plantation and mill. Similar to methane capture, these
technologies require higher investment costs with more advance technical and operational capacity.
Compilation of BMPs to Reduce Emissions in Palm Oil Production Concluding Thoughts 95
Concluding thoughts When considering potential best management practices to reduce GHG emissions in its production process, each
company needs to carefully evaluate the different options available. This report is designed to serve a resource for
palm oil companies during this evaluation process by providing an overview of the different practices currently
being implemented in the sector and a coarse assessment of their financial requirements and benefits, GHG
reduction potential, technical and operational challenges, environmental and social co-benefits, and replicability.
It is important to note that the exact costs, emission reductions, challenges, etc will depend on the particular
circumstances where the BMPs will take place. Nonetheless, companies can use this report to focus their search on
a selection of practices that are most likely to fit their needs. This in turn supports companies in meeting the RSPO
principles and criteria and ultimately in helping to mitigate the threat of global climate change by reducing
greenhouse gas emissions.

Compilation of BMPs to Reduce Emissions in Palm Oil Production Appendix A. Summary of BMPs 96
References Abazue CM, AC Er, ASA Ferdous Alam, H Begum. 2015. Oil Palm Smallholders and Its Sustainability in Malaysia.
Mediterranean Journal of Social Sciences, 6(6), 2015. 482-488.
Abd Majid, M. A., Ghazali, Z., Shin Min, N. T., 2014. Techno-economic Evaluation on enhancing Cogeneration Plant
Capacity: Case Study of Plam Oil Mill Cogeneration Plant. Journal of Applied Sciences, 14 (3): 285-290.
Accepta. 1997. A Guide to Cost-Effective Membrane Technologies for Minimising Wastes and Effluents. Prepared
by Accepta with assistance from WS Atkins Consultants Ltd. United Kingdom.
Agus F, Henson IE, Sahardjo BH, Harris N, van Noordwijk M, Killeen TJ. 2013. Review of emission factors for
assessment of CO2 emission from land use change to oil palm in Southeast Asia. Reports from the Technical
Panels of the Second RSPO GHG Working Group. 7-31.
Agus, F. dan I.G. M. Subiksa. 2008. Lahan Gambut: Potensi untuk Pertanian dan Aspek Lingkungan. Balai Penelitian
Tanah dan World Agroforestry Centre (ICRAF), Bogor, Indonesia.
Alkarimiah, R., Abd Rahman, R., 2014. Co-composting of EFB and POME with the Role of Nitrogen-Fixers Bacteria
as Additives in Composting Process – A Review. International Journal of Engineering Science and Innovative
Technology, 3 (2).
APRIL, 2015. Sustainability. http://www.aprilasia.com/en/sustainability.
Angelsen A. 2010. Policies for reduced deforestation and their impact on agricultural production Proc. Natl Acad.
Sci. 107 19639–44
Angelsen and Kaimowitz, 2001. Agricultural Technologies and Tropical Deforestation. Center for International
Forestry Research
APP & Deltares (2016) – Brief Guideline for Plantation Perimeter Canal Blocking as a Rapid Fires Risk Reduction
Measure in Indonesian Peatlands. 14 pp.
Austin, AG, A Mosnier, J Pirker, I McCallum, S Fritz, PS Kasibhatla. 2017. Shifting patterns of oil palm driven
deforestation in Indonesia and implications for zero-deforestation commitments. Land Use Policy. V 69, pp 41-
48
Austin, K., Mosnier, A., Pirker, J., McCallum, I., Fritz, S. and Kasibhatla, P. 2017. Shifting patterns of oil palm driven
deforestation in Indonesia and implications for zero-deforestation commitments. Land Use Policy, 69, pp.41-
48.
Azmi, N. S., Yunos, K. F. Md. 2014. Wastewater Treatment of Oil Mill Effluent (POME) by Ultrafiltration Membrane
Separation Technique Coupled with Adsorption Treatment as Pre-Treatment. Agriculture and Agricultural
Science Procedia 2 (2014) 257 – 264.
Bacovsky, D, N Ludwiczek, M Ognissanto, M Wörgetter. 2013. Status of Advanced Biofuels. Demonstration Facilities.
REPORT TO IEA BIOENERGY TASK 39
Baharuddin A. S., Hock, L. S., Yusof, M. Z., Abdul Rahman, N., Shah, U. K., Hassan, M. A., Wakisaka, M., Sakai, K.,
Shirai, Y., 2010. Effects of palm oil mill effluent (POME) anaerobic sludge from 500 m3 of closed anaerobic
methane digested tank on pressed-shredded empty fruit bunch (EFB) composting process. African Journal of
Biotechnology, 9 (16): 2427-2436.
Compilation of BMPs to Reduce Emissions in Palm Oil Production Appendix A. Summary of BMPs 97
Baharuddin A.S., M. Wakisaka, Y. Shirai, S. Abd-Aziz, N.A. Abdul Rahman and M.A. Hassan, 2009. Co-Composting of
Empty Fruit Bunches and Partially Treated Palm Oil Mill Effluents in Pilot Scale. International Journal of
Agricultural Research, 4: 69-78.
Baldocchi, D. 2014. Measuring fluxes of trace gases and energy between ecosystems and the atmosphere – the
state and future of the eddy covariance method. Global Change Biology, 20. 2014.: 3600–3609.
doi:10.1111/gcb.12649
Baldocchi, DD, Falge E, Gu L, Olson R, Hollinger DY, Running SW, Anthoni P, Bernhofer Ch, Davis KJ, Evans R, Fuentes
J, Goldstein A, Katul G, Law BE, Lee X, Malhi Y, Meyers TP, Munger JW, Oechel WC, Paw U KT, Pilegaard K,
Schmid HP, Valentini R, Verma S, Vesala T, Wilson KB, and Wofsy SC. 2001. FLUXNET: A New Tool to Study the
Temporal and Spatial Variability of Ecosystem-Scale Carbon Dioxide, Water Vapor, and Energy Flux Densities.
Bulletin of the American Meteorological Society, 82. 2001. 2415-2434.
Ballhorn, U., Siegert, F., Mason, M., Limin, S., 2009. Derivation of burn scar depths and estimation of carbon
emissions with LIDAR in Indonesian peatlands. Proceedings of the National Academy of Sciences of the United
States of America 106, 21213-21218.
Barcelos E, de Almeida Rios S, Cunha R N V, Lopes R, Motoike SY, Babiychuk E, Skirycz A, Kushnir S. 2015. Oil palm
natural diversity and the potential for yield improvement. Frontier in plant science. doi:
10.3389/fpls.2015.00190
Barcza, Z, A Kern, L Haszpra, N Kljun Spatial representativeness of tall tower eddy covariance measurements using
remote sensing and footprint analysis", Agricultural and Forest Meteorology, Volume 149, Issue 5, 2009, Pages
795-807
Bernal, B., Sidman, G., Murray, L. and Pearson, T.R.H. 2017. Global Forest GHG Emissions and FLR CO2 Removals
Databases. Report to IUCN
Bessou, C, LDC Chase, IE Henson, AFN Abdul-Manan, L Milà i Canals, F Agus, M Sharma, M Chin. 2014. Pilot
application of PalmGHG, the Roundtable on Sustainable Palm Oil greenhouse gas calculator for oil palm
products. Journal of Cleaner Production, V 73, pp 136-145
Biogas Handbook. 2015. CIRCLE Project: Winrock International
Booneimsri, P, K Kubaha, and C Chullabodhi. 2016. Potential of the engine-driven cogeneration system in a palm oil
mill in Thailand. International Conference on Sustainable Energy Engineering and Application (ICSEEA), Jakarta,
2016, pp. 107-115. doi: 10.1109/ICSEEA.2016.7873576
Brinkmann Consultancy. 2009. Greenhouse Gas Emissions from Palm Oil Production: Literature review and
proposals from the RSPO Working Group on Greenhouse Gases. RSPO: Kuala Lumpur, Malaysia.
Burba, G. 2001. Illustration of Flux Footprint Estimates Affected by Measurement Height, Surface Roughness and
Thermal Stability. Automated Weather Stations for Applications in Agriculture and Water Resources
Management., 2001. No.1074, World Meteorological Organization, Geneva, Switzerland
Buron, M, M Frappé, R Erales, JM Rivera. 2011. Composting of EFB and POME: Operational records compared to
existing literature.
Burton, ME, JR Poulsen, ME Lee, VP Medjibe, CG Stewart, A Venkataraman, and LJ White. 2017. Reducing Carbon
Emissions from Forest Conversion for Oil Palm Agriculture in GabonCONSERVATION LETTERS, 10: 297-307.
doi:10.1111/conl.12265
Compilation of BMPs to Reduce Emissions in Palm Oil Production Appendix A. Summary of BMPs 98
Caliman, JP, 2017. Scientific Insights and Development in Sustainable Palm Oil Production. European Palm Oil
Conference. 23 November 2017. Brussels. Belgium.
Cargill. 2018. Sustainability: Connecting our global food system to nourish the world and protect the plant.
https://www.cargill.com/sustainability.
Carlson, KM, LK Goodman, CC May-Tobin. 2015. Modeling relationships between water table depth and peat soil
carbon loss in Southeast Asian plantations. Environmental Research Letters 10, 074006.
Carrillo-Nieves, D, K Karimi, IS Horváth. 2011.Improvement of biogas production from oil palm empty fruit bunches
(OPEFB),Industrial Crops and Products, Volume 34, Issue 1, 1097-1101, ISSN 0926-6690
Chave, J, M Réjou‐Méchain, A Búrquez, E Chidumayo, MS Colgan, WB Delitti, A Duque, T Eid, PM Fearnside, RC
Goodman, M Henry, A Martínez‐Yrízar, WA Mugasha, HC Muller‐Landau, M Mencuccini, BW Nelson, A
Ngomanda, EM Nogueira, E Ortiz‐Malavassi, R Pélissier, P Ploton, CM Ryan, JG Saldarriaga, and G Vieilledent.
2014. Improved allometric models to estimate the aboveground biomass of tropical trees. Glob Change Biol,
20: 3177-3190. doi:10.1111/gcb.12629
Chen, B, TA Black, NC Coops, T Hilker, JA Trofymow, K Morgenstern. Assessing Tower Flux Footprint Climatology
and Scaling Between Remotely Sensed and Eddy Covariance Measurements. Boundary-Layer Meteorology, vol.
130, no. 2. 2008. pp. 137–167., doi:10.1007/s10546-008-9339-1.
Chong, KL, KD Kanniah, C Pohl, KP Tan. 2017. A review of remote sensing applications for oil palm studies. Geo-
spatial Information Science, 20(2), 184-200. doi:10.1080/10095020.2017.1337317
Coomes, DA, M Nunes, R Ewers, EC Turner. 2017. Mapping Aboveground Carbon in Oil Palm Plantations Using
LiDAR: A Comparison of Tree-Centric versus Area-Based Approaches. Remote Sensing, vol. 9, no. 8, Sept. 2017,
p. 816., doi:10.3390/rs9080816.
Corley, RHV, and PB Tinker. 2003. The Oil Palm Fourth Edition. Blackwell Publishing Company. Oxford, U. K.
Couwenberg, J, A Hooijer. 2013. Towards robust subsidence-based soil carbon emission factors for peat soils in
south-east Asia, with special reference to oil palm plantations. Mires and Peat, Volume 12 (2013), Article 01,
1–13. http://www.mires-and-peat.net/
Couwenberg, J, R Dommain and H Joosten. 2010. Greenhouse gas fluxes from tropical peatlands in Southeast Asia.
Global Change Biology 16(6):1715–1732.
Crutzen PJ, Mosier AR, Smith KA, Winiwarter W. 2008 N2O release from agro-biofuel production negates global
warming reduction by replacing fossil fuels. Atmospheric Chemistry and Physics, 8, 389–395.
Daemeter Consulting. 2015. Indonesian Oil Palm Smallholder Farmers: A Typology of Organizational Models, Needs,
and Investment Opportunities. Daemeter Consulting, Bogor, Indonesia
Darmosarkoro, W, ES Sutarta, and Winarna. 2003, Teknologi pemupukan tanaman kelapa sawit. Dalam Lahan dan
Pemupukan Kelapa Sawit. Pusat Penelitian Kelapa Sawit. Medan, 113-134.
de Oliveira Bordonal, R, JLN Carvalho, R Lal, EB de Figueiredo, BG de Oliveira, and N La Scala. 2018. Sustainability of
sugarcane production in Brazil. A review. Agronomy for Sustainable Development, 38(2), 13.
Dolmat, MT, J Latif, L Othman, and AT Mohammed. High oil palm planting density on peat. MPOB Information Series
No 129. ISSN 1511-7871.

Compilation of BMPs to Reduce Emissions in Palm Oil Production Appendix A. Summary of BMPs 99
Drösler, M, LV Verchot, A Freibauer, G Pan, CD Evans, RA Bourbonniere, JP Alm, S Page, F Agus, K Hergoualc’h, J
Couwenberg, J Jauhiainen, S Sabiham, C Wang, N Srivastava, L Borgeau-Chavez, A Hooijer, K Minkkinen, N
French, T Strand, A Sirin, R Mickler, K Tansey, and N Larkin 2014. Drained inland organic soils. Chapter 2 in the
2013 Supplement to the 2006 Guidelines for National Greenhouse Gas Inventories: Wetlands. Edited by T.
Hiraishi, T. Krug, K. Tanabe, N. Srivastava, B. Jamsranjav, M. Fukuda, and T. Troxler. IPCC: Switzerland.
Dugas, WA. 1993. Micrometeorological and chamber measurements of CO2 flux from bare soil. Agricultural and
Forest Meteorology 67, 1993. 115–128.
Eco-Ideal Consulting Sdn. Bhd. 2013. Palm Oil Production – A compilation of case studies. Prepared for the RSPO.
Eisentraut, A. 2010. "Sustainable Production of Second-Generation Biofuels: Potential and Perspectives in Major
Economies and Developing Countries," IEA Energy Papers 2010/1, OECD Publishing.
Enström, A. 2017. GHG Reduction with Solid Separation in POME Ponds. ISCC Workshop <date>. Jakarta, Indonesia.
Enterprise Asia. 2017. P.T. Great Giant Pineapple. https://enterpriseasia.org/area/projects/p-t-great-giant-
pineapple/.
Euroconsult - Mott MacDonald. 2018. Tropical Peatland Restoration Report: The Indonesian Case Berbak Green
Prosperity Partnership/ Kemitraan Kesejatheraan Hijau (Kehijau Berbak). Euroconsult Mott MacDonald.
Millennium Challenge Account Indonesia. Contract No. 2015/Grant/010.
European Biogas Association. 2018. Good Practices and Innovations in the Biogas Industry. European Biogas
Association
European Environment Agency. 2003. Emission Inventory Guidebook: Use of Pesticides and Limestone (in
Agriculture). European Environment Agency.
Fargione, J, J Hill, D Tilman, S Polasky, P Hawthorne. 2008. Land clearing and the biofuel carbon debt. Science, 319,
1235-1238.
Fernandez-Stark, K and P Bamber. 2012. Inclusion of Small and Medium Producers in the Value Chain: Assessment
of Five High-Value Agricultural Inlusive Business Projects in Latin America. Durham: Duke CGGC
FNR. 2009. Fachagentur Nachwachsende Rohstoffe e.V. (FNR). Biogas – An introduction, 2nd edition, Gülzow,
Germany. www.fnr.de
Gan, LT, F Parish, H Cai, J Tan. 2018. Towards Low GHG Emission in New Oil Palm Development – Results of RSPO’s
Approach, The Planter. Kuala Lumpur, 94 (1105): 225-238
Gandahi, AW, MM Hanafi. 2014. Composting for Sustainable Agriculture - Chapter 11 Bio-composting Oil Palm
Waste for Improvement of Soil Fertility. Springer International Publishing. Switzerland.
Gaveau, DLA, D Sheil, Husnayaen, MA Salim, S Arjasakusuma, M Ancrenaz, P Pacheco, E Meijaard. 2016. Rapid
conversions and avoided deforestation: examining four decades of industrial plantation expansion in Borneo.
Scientific Reports volume 6, Article number: 32017
Goh, KJ, CB Teo, PS Chew, and SB Chiu. 1999. Fertiliser management in oil palm: Agronomic principles and field
practices. In: Fertiliser management for oil palm plantations, 20-21, September 1999, ISP North-east Branch,
Sandakan, Malaysia: 44 pp

Compilation of BMPs to Reduce Emissions in Palm Oil Production Appendix A. Summary of BMPs 100
Haasjes, E. 2014. Sustainable water management on oil palm plantations on tropical peat lands: Comparing
regulations with on field practices. Master thesis. Water Resources Management Group. Wageningen
University, Wageningen. Accessed in 09 December 2017. http://edepot.wur.nl/345841.
Hadiwijaya B, B Septiwibowo, JP Caliman. 2014. Ecosystem CO2 Exchange Assessment of Oil Palm Plantation on
Mineral Soil. ICOPE. http://icope-series.com/2014-oral-abstract/07%20-
%20TS03b%20BramICOPE%202014v02.pdf
Harsono, SS, A Prochnow, P Grundmann, and C Hallmann. 2011. Energy balances and greenhouse gas emissions of
palm oil biodiesel in Indonesia. Global Change Biology. 4(2):213 - 228.
https://www.researchgate.net/figure/230532469_fig1_Figure-1-System-overview-of-stages-considered-for-
biodiesel-production-from-palm-oil
Hatano, R, M Tomoaki, D Untung, SH Limin, A Syaiful. 2004. Impact of agriculture and wild fire on CO2, CH4 and
N2O emissions from tropical peat soil in Central Kalimantan, Indonesia, Necessity of Establishment of Inventory
on Carbon Cycling in Tropical Peatland Ecosystems for Sustainable Agroproduction and Environmental
Conservation, Report number 13574012, Field Science Center for Northern Biosphere, Hokkaido University,
Sapporo, pp. 11-14.
Heimpel GE, Y Yang, JD Hill, DW Ragsdale. 2013. Environmental Consequences of Invasive Species: Greenhouse Gas
Emissions of Insecticide Use and the Role of Biological Control in Reducing Emissions. PLoS ONE 8(8): e72293.
doi:10.1371/journal.pone.0072293Kalidas, 2012
Hergoualc’h, K, and LV. Verchot. 2011, Stocks and fluxes of carbon associated with land-use change in Southeast
Asian tropical peatlands: a review, Global Biochem, Cycles 25, GB2001, doi:10.1029/2009GB003718.
Hergoualc’h, K, and LV Verchot. 2013. Greenhouse gas emission factors for land use and land-use change in
Southeast Asian peatlands. Mitigation and Adaptation Strategies for Global Change 19 (6):789-807. doi
10.1007/s11027-013-9511-x.
Hoo, PY, P Patrizio, S Leduc, H Hashim, F Kraxner, ST Tan, WS Ho.. 2017. Optimal Biomethane Injection into Natural
Gas Grid – Biogas from Palm Oil Mill Effluent (POME) in Malaysia. The 8th International Conference on Applied
Energy, 105, 2017. 562-569
Hooijer, A, S Page, J Jauhiainen, W Lee, X Lu, A Idris, G Anshari. 2012. Subsidence and carbon loss in drained tropical
peatlands. Biogeosciences 9, 1053.
Hooijer, A, S Page, J Jauhiainen, WA Lee, X Lu .2011. - Recent findings on subsidence and carbon loss in tropical
peatlands: reducing uncertainties. Workshop on “Tropical Wetland Ecosystems of Indonesia: Science
Hooijer, A, S. Page, J Jauhiainen, WA Lee, X Lu, A Idris, and G Anshari. 2012. Subsidence and carbon loss in drained
tropical peatlands. Biogeosciences 9:1053– 1071.
http://pubdocs.worldbank.org/en/643781465442350600/Indonesia-forest-fire-notes.pdf
http://www.sr-indonesia.com/in-the-journal/view/innovative-financing-for-palm-oil-farmers

Compilation of BMPs to Reduce Emissions in Palm Oil Production Appendix A. Summary of BMPs 101
Hummel S, AT Hudak, EH Uebler, MJ Falkowski, and KA Megown 2011. A Comparison of Accuracy and Cost of LiDAR
versus Stand Exam Data for Landscape Management on the Malheur National Forest. Journal of Forestry. July-
August.267-273. https://www.fs.fed.us/rm/pubs_other/rmrs_2011_hummel_s001.pdf
IEA Bioenergy. 2017. Biomethane Demonstration: Innovation in Urban Waste Treatment and in Biomethane Vehicle
Fuel Production in Brazil. IEA Bioenergy
Indonesia Carbon Accounting System (INCAS). 2017. http://www.incas-indonesia.org/wp-
content/uploads/2015/11/2.-INCAS-Standard-Methods-Version-2_en_web.pdf
Intergovernmental Panel on Climate Change. 2006. Ch. 2 Generic methodologies applicable to multiple land-use
categories. In 2006 IPCC Guidelines for National Greenhouse Gas Inventories, Volume 4 - Agriculture, Forestry
and Other Land Use.
IPCC 2014, 2013 Supplement to the 2006 IPCC Guidelines for National Greenhouse Gas Inventories: Wetlands,
Hiraishi, T., Krug, T., Tanabe, K., Srivastava, N., Baasansuren, J., Fukuda, M. and Troxler, T.G. (eds). Published:
IPCC, Switzerland.
IPNI. 2015. Oil Palm Best Management Practices in Ghana.
http://ssa.ipni.net/ipniweb/region/africa.nsf/0/438DA94552CC5B6085257F15004A8C5D/$FILE/Oil%20palm%
20project%20Mid%20term%20report.pdf
Jaenicke, J, H Wosten, A Budiman, F Seigert. 2010. Planning hydrological restoration of peatlands in Indonesia to
mitigate carbon dioxide emissions. Mitigation and Adaptation Strategies for Global Change, vol. 15, no. 3, pp.
223–239., doi:10.1007/s11027-010-9214-5.
Jupesta, J, B Lakitan. 2014. Innovative Financing Scheme for Small-holder Oil Palm Farmers in Indonesia, Strategic
Reviews Indonesia Edition April-June 2014, pp. 60-69.
Kalidas P. 2012 Pest Problems of Oil Palm and Management Strategies for Sustainability. Agrotechnol S11:002.
doi:10.4172/2168-9881.S11-002
Kapdi SS, VK Vijay, SK Rajesh, R Prasad. 2005. Biogas scrubbing, compression and storage: Perspective and
prospectus in Indian context. Renewable Energy, 30 (8), 2005. 1195–1202
KM Carlson, LM Curran, GP Asner, AM Pittman, SN Trigg, JM Adeney. "Carbon emissions from forest conversion by
Kalimantan oil palm plantations". Nat. Clim. Change, 3 , 2013. pp. 283-287
Koh, LP, and J Ghazoul. 2010. Spatially explicit scenario analysis for reconciling agricultural expansion, forest
protection, and carbon conservation in Indonesia, PNAS, 107, 11140-11144.
Konecny, K, U Ballhorn, U, P Navratil, J Jubanski, SE Page, K Tansey, A Hooijer, R Vernimmen, F Siegert. 2016.
Variable carbon losses from recurrent fires in drained tropical peatlands. Global Change Biol. 22, 1469-1480.
Koh, LP, DS Wilcove. 2008. Is oil palm agriculture really destroying tropical biodiversity? Conservation Letters. V1
Issue 2. https://doi.org/10.1111/j.1755-263X.2008.00011.x
Lee JSH, J Ghazoul, K Obidzinski, LP Koh. 2014. Oil palm smallholder yields and incomes constrained by harvesting
practices and type of smallholder management in Indonesia, Agron. Sustain. Dev. 34:501–513. DOI
10.1007/s13593-013-0159-4
Li, Qingxin, Wei Ting Ng, Se Min Puah, RV Bhaskar, LS Soh, C Macbeath, P Parakittil, PJCW Green. 2014. Efficient
Production of EFB using enzymes. Biotechnology and Applied Biochemistry. http://doi.org/10.1002/bab.1188

Compilation of BMPs to Reduce Emissions in Palm Oil Production Appendix A. Summary of BMPs 102
Liew, ASB, NA Hadi, RM Halim, A Yap, Ab. Rahman, Z. 2017. Methane Avoidance via Zero Effluent Discharge Using
AQUAECO Plant. PIPOC Proceedings. Malaysia. 2017.
Lim, KH, SS Lim, F Parish, R Suharto (eds) 2012. Summary: RSPO Manual on Best Management Practices (BMPs) for
Existing Oil Palm
Maitah, M, P Prochazka, A Pachman, K Sredl, and H Rezbova, H. 2016. Economics of Palm Oil Empty Fruit Brunches
Bio Briquettes in Indonesia. International Journal of Energy Economics and Policy, 6(1): 35-38.
Meijaard E, D Buchori, Y Hadiprakarsa, SS Utami-Atmoko, A Nurcahyo, A Tjiu, D Prasetyo, Nardiyono, L Christie, M
Ancrenaz, F Abadi, ING Antoni, D Armayadi, A Dinato, Ella, P Gumelar, TP Indrawan, Kussaritano, C Munajat,
CWP Priyono, Y Purwanto, D Puspitasari, MSW Putra, A Rahmat, H Ramadani, J Sammy, D Siswanto, M Syamsuri,
N Andayani, H Wu, JA Wells, K and Mengersen. 2011. Quantifying Killing of Orangutans and Human-Orangutan
Conflict in Kalimantan, Indonesia. PLoS One. 2011; 6(11):
Ministry of New and Renewable Energy of Government of India. Biogas Generation, Purification, and Bottling
Development in India – A Case Study. Retrieved from https://mnre.gov.in/file-manager/UserFiles/case-study-
Biogas-Generation_Purification_and_Bottling-Development-In-India.pdf
Misztal, PK, E Nemitz, B Langford, CF Di Marco, GJ Phillips, CN Hewitt, AR MacKenzie, SM Owen, D Fowler, MR Heal,
JN Cape. 2011. Direct ecosystem fluxes of volatile organic compounds from oil palms in South-East Asia.
Atmospheric Chemistry and Physics, 11(17), 8995-9017. doi:10.5194/acp-11-8995-2011
MoA. 2017. Tree Crop Estate Statistics Of Indonesia, Oil Palm 2016. Ministry of Agriculture, Indonesia.
MPOB. 2016. Oil Palm Statistic. Malaysian Palm Oil Board
Mulla DJ. 2013. Twenty five years of remote sensing in precision agriculture: key advances and remaining
knowledge gaps. Biosystems Engineering 114 (2013) pp 358-317.
Muñoz, I, JH Schmidt, and R Dalgaard. 2014. Comparative life cycle assessment of five different vegetable oils.
Proceedings of the 9th International Conference on Life Cycle Assessment in the Agri-Food Sector. San
Francisco, California, USA, 8-10 October, 2014.
Mutert, E, TH Fairhurst, and HR von Uexküll. 1999. Agronomic Management of Oil Palms on Deep Peat, Better Crops
International, 13.
Myhre, G, D Shindell, F-M Bréon, W Collins, J Fuglestvedt, J Huang, D Koch, J-F Lamarque, D Lee, B Mendoza, T
Nakajima, A Robock, G Stephens, T Takemura and H Zhang, 2013: Anthropogenic and Natural Radiative Forcing.
In: Climate Change 2013: The Physical Science Basis. Contribution of Working Group I to the Fifth Assessment
Report of the Intergovernmental Panel on Climate Change [Stocker, TF, D Qin, G-K Plattner, M Tignor, SK Allen,
J Boschung, A Nauels, Y Xia, V Bex and PM Midgley (eds)] Cambridge University Press, Cambridge, United
Kingdom and New York, NY, USA.
Nasrin, AB, N Ravi, WS Lim, YM Choo, AM Fadzil. 2011. Assessment of the Performance and Potential Export
Renewable Energy (RE) from Typical Cogeneration Plans Used in Palm Oil Mills. Journal of Engineering and
Applied Sciences, 6 (6): 433-439.
Nasrin, AB, AN Ma, YM Choo, S Mohamad, MA Rohaya, A Azali, and Z Zainal. 2008. Oil Palm Biomass As Potential
Substitution Raw Materials For Commercial Biomass Briquettes Production. American Journal of Applied
Science, 5(3): 179-183.

Compilation of BMPs to Reduce Emissions in Palm Oil Production Appendix A. Summary of BMPs 103
Nasrin, Abu Bakar, LW Soon, LS Kheang, AA Aziz, MFM Saad, MKM Kamarudin, LY Soon and LD Yuen. 2017. Bio-
compressed Natural Gas (Bio-CNG) Production from Palm Oil Mill Effluent (POME). MPOB Information Series.
ISSN 1511-7871.
Needs to Address Climate Change Adaptation and Mitigation”, Bali, 11-14 April 2011.
Ng, SK, TK Cheong, KC Haw, HSH Ooi, LK Yee, P Kayaroganam, HR Uexküll, R Härdter. 2003. in Woittiez LS, MT van
Wijk, M Slingerland, M van Noordwijk, KE Giller. 2017. Yield gaps in oil palm: A quantitative review of
contributing factors. Europ. J. Agronomy 83 (2017) 57–77
Oktarita S, K Hergoualch, S Anwar, LV Verchot. 2017. Substantial N2O emission from peat decomposition and N
fertilization in an oil palm plantation exacerbated by hotspots. Environ. Res.Lett 12
Osaki, M and N Tsuji. 2016.Tropical Peatland Ecosystems. Springer. DOI 10.1007/978-4-31-55681-7_10
Page, SE, F Siegert, JO Rieley, HDV Boehm, A Jaya, SH Limin. 2002. The amount of carbon released from peat and
forest fires in Indonesia during 1997, Nature, 420, 61-65.
Page, SE, Rieley, JO, Banks, CJ, 2011. Global and regional importance of the tropical peatland carbon pool. Global
Change Biol. 17, 798-818.
Parker, C, D Nurrochmat, D Surjanto, K Teule, SM Walker. 2018. Sustainable Financing Plan for the Sebangau
National Park. Report to USAID LESTARI.
Paryanto, I, A Kismanto, K Amri, MD Solikhah. 2013. Some Aspects for Sustainable Biodiesel Production.
International Journal on Advanced Science Engineering Information Technology, 3(3): 49-53.
Imam, P, K Agus, DS Maharani, Hariana. 2015. Development of Biodiesel Plant Design Integrated with Palm Oil Mill
for Diesel Fuel Substitution in Oil Palm Industry. KnE Energy & Physics. 83 - 88
Pattanapongchai, A and B Limmeechokchai. 2011. CO2 mitigation model of future power plants with integrated
carbon capture and storage in Thailand. International Journal of Sustainable Energy, DOI:
10.1080/1478646X.2010.539690
Paturska, A, M Repele, G Bazbauers. 2015. Economic assessment of biomethane supply system based on natural
gas infrastructure. International Scientific Conference “Environmental and Climate Technologies – CONECT
2014”. Energy Procedia 72: 71–78.
Persson, M, Henders, S, Kastner, T 2014. Trading Forests: Quantifying the Contribution of Global Commodity Market
to Emissions from Tropical Deforestation. Center & Global Development. Working Paper 384. October 2014.
Phelps J, LR Carrasco, EL Webb, LP Koh, U Pascual. 2013. Agricultural intensification escalates future conservation
costs. PNAS
Pirker, J, A Mosnier, F Kraxner, P Havlik, M Obsersteiner. 2016. What are the limits to oil palm expansion? Global
Environmental Change. 40, 73-81. https://doi.org/10.1016/j.gloenvcha.2016.06.007. Available at:
http://www.sciencedirect.com/science/article/pii/S0959378016300814
Radjagukguk, B. 1997. Peat soil of Indonesia: Location, classification and problem for sustainability. In: Rieley J.O.
and Page S.E. (Eds) Biodiversity and Sustainability of Tropical Peatlands. Samara Publishing Ltd., Cardigan, pp.
42–54.
Compilation of BMPs to Reduce Emissions in Palm Oil Production Appendix A. Summary of BMPs 104
Rahayu, AS, D Karsiwul an, H Yuwono, I Trisnawati, S Mulyasari, S Rahardjo, S Hokermin, and V Paramita. 2015.
Handbook POME-to-Biogas: Project Development in Indonesia (Eds: Castermans, B, H Yuwono, R Hardison, and
V Paramita). CIRCLE project, Winrock International, support from USAID
Rajanaidu, N, A Kushairi, A Din, ZA Isa, I Maizura, A Noh. 2005. Oil palm planting materials: current developments
and competetiveness with other oil-bearing crops. In Woittiez LS, MT van Wijk, M Slingerland, M van Noordwijk,
KE Giller. 2017. Yield gaps in oil palm: A quantitative review of contributing factors. Europ. J. Agronomy 83
(2017) 57–77
Rist L, L Feintrenie, P Levang. 2010. The livelihood impacts of oil palm: Smallholders in Indonesia. Biodiversity and
Conservation, 19, 1009–1024.
RSPO. 2009. Greenhouse Gas Emissions from Palm Oil Production. Literature review and proposals from the RSPO
Working Group on Greenhouse Gases.
https://www.rspo.org/files/project/GreenHouse.Gas.Working.Group/Report-GHG-October2009.pdf
SAMCO. The Essential Guide to Microfiltration and Ultrafiltration Membrane System. A Publication of SAMCO
Technologies.
Seng, OH, 2012. Applying Green Technology in the Palm Oil Industry. Jurutera. January 2012
Seng, OO, 2011. Zero Discharge Composting of Palm Oil Wastes. The Institution of Engineers, 72 (3). Malaysia.
Shafri, HZM, MH Ismail, MKM Razi, MI Anuar, AR Ahmad. 2012. Application of lidar and optical data for oil palm
plantation management in Malaysia. Lidar Remote Sensing for Environmental Monitoring XIII,
doi:10.1117/12.979631.
Shcherbak, I, N Millara, and GP Robertson. 2014. Global meta-analysis of the nonlinear response of soil nitrous
oxide (N2O) emissions to fertilizer nitrogen, PNAS, 111, 9199–9204.
Simon, S. T Hendry, SW Chang, CW Kaiw. 1998. Early yield performance of clonal oil palm (Elaeis guineensis Jacq.)
plantings in PPB Oil Palms Bhd Sabah—a case study. in Woittiez LS, MT van Wijk, M Slingerland, M van
Noordwijk, KE Giller. 2017. Yield gaps in oil palm: A quantitative review of contributing factors. Europ. J.
Agronomy 83 (2017) 57–77
Sims, REH, WE Mabee, J Saddler, and M Taylor. 2009. An overview of second generation biofuel technologies.
Bioresource Technology 101(6):1570-80
Smith P, M Bustamante, H Ahammad, H Clark, H Dong, EA Elsiddig, H Haberl, R Harper, J House, M Jafari, O Masera,
C Mbow, NH Ravindranath, CW Rice, C Robledo Abad, A Romanovskaya, F Sperling, and F Tubiello, 2014:
Agriculture, Forestry and Other Land Use (AFOLU). In: Climate Change 2014: Mitigation of Climate Change.
Contribution of Working Group III to the Fifth Assessment Report of the Intergovernmental Panel on Climate
Change [Edenhofer, O, R Pichs-Madruga, Y Sokona, E Farahani, S Kadner, K Seyboth, A Adler, I Baum, S Brunner,
P Eickemeier, B Kriemann, J Savolainen, S Schlömer, C von Stechow, T Zwickel and JC Minx (eds.)]. Cambridge
University Press, Cambridge, United Kingdom and New York, NY, USA
Smith R.F. and Reynolds H.T. 1966. Principles, definitions and scope of integrated pest control. In: Proc. FAO Symp.
‘Integrated pest control,’ pp. 11–17, Food and Agriculture Organisation of the United Nations, Rome [12.2]
Soh AC, Wong G, Tan CC, Chew PS, Chong SP, HO YW, WOng CK, Choo CN, Nor Azura H, Kumar K, 2011, Commercial
scale propagation and planting of elite palm clones: research and development towards realization, Journal of
oil palm Research, p 935-952
Compilation of BMPs to Reduce Emissions in Palm Oil Production Appendix A. Summary of BMPs 105
Soh, AC, 2004. Selecting the ideal oil palm: what you see is not necessarily what you get in Woittiez LS, van Wijk
MT, Slingerland M, van Noordwijk M, Giller KE. 2017. Yield gaps in oil palm: A quantitative review of contributing
factors. Europ. J. Agronomy 83 (2017) 57–77
Sommart, K, S Pipatmanomai. 2011. Assessment and Improvement of Energy Utilization in Crude Palm Oil Mill. 2011
International Conference on Chemistry and Chemical Process. Singapore.
Sovy, MH, A Budiman. 2018. State of Indonesia's Paludiculture. Winrock International.
Subramaniam, V, LS Kheang, A Aziz. 2017. Carbon Reduction Practice in The Malaysian Palm Oil Industry.
Proceedings of PIPOC 2017, 14 to 16 November 2017. Kuala Lumpur. Malaysia.
Sumarga, E, L Hein, A Hooijer, R Vernimmen. 2016. Hydrological and economic effects of oil palm cultivation in
Indonesian peatlands. Ecology and Society, 21(2).
Surjanto, D, C Parker, Z Warta, K Teule, K Rosenda. 2018. Sustainable Financing Plan for the Sebangau National Park.
WWF with support from USAID Lestari
Suryadiputra, INN, A Dohong, SB Waspodo, L Muslihat, IR Lubis, F Hasudungan & ITC Wibisono. 2005. A Guide to
the Blocking of Canals and Ditches in Conjunction with the Community. Wetlands International – Indonesia
Programme and Wildlife Habitat Canada, Bogor, Indonesia, 170 pp. ISBN: 979-99373-5-3. Also available in
Indonesian as: “Panduan Penyekatan Parit dan Saluran di Lahan Gambut Bersama Masyarakat.”
Suryadiputra, N, Suharno, Kusumah, RR, Susanto, Anggoro, P, Pirnanda, D., Wiramata, Chalmers, J. Walker, SM.
2017. Protocol for Oil Palm Independent Smallholder for Sustainable and Responsible Management of Peat
Areas. Developed by Winrock International. Report to IDH, Cargill, and Costco.
Svarovsky, L. (ed). 2000. Solid-Liquid Separation Fourth Edition. Butterworth-Heinemann. Oxford, England.
Syahrinudin. 2005. The potential of oil palm and forest plantations for carbon sequestration on degraded land in
Indonesia. isbn: 3-86537-481-6
Talib, N, MA Abd Majid. 2016. Thermodynamic Analysis on Oil Palm Biomass Cogeneration Plant. Journal of
Engineering and Applied Sciences, 11 (22).
Gan, LT, H Cai. 2017. Calculating GHG Emissions in Oil Palm Using PalmGHG. The Planter, (1092): 167 - 176
Tubiello, FN, M Salvatore, S Rossi, A Ferrara, N Fitton, and P Smith. 2013, The FAOSTAT database of greenhouse gas
emissions from agriculture, Environmental Research Letters 8.
UNFCCC. 2007. Project Design Document. Inno – Abbedon – Palm Oil Mill Waste Recycle Scheme, Malaysia.
Vijay, V, SL, Pimm, CN Jenkins, SJ Smith. 2016. The Impacts of Oil Palm on Recent Deforestation and Biodiversity
Loss. PLOS ONE, V 11, Issue 7.
Wageningen University. 2013. Valorization of Palm Oil Mill Residues: Identifying and Solving the Challenges.
http://edepot.wur.nl/288880
Wahyunto, Subiksa I.G.M., (2011). Genesis Lahan Gambut Indonesia. Balai Penelitian Tanah. Bogor.
WBCSD. 2016. Great Giant Pineapple: Soil Health Management. Indonesia-BCSD CASE STUDIES: Investment for
Sustainable Business. http://wbcsdpublications.org/wp-content/uploads/2016/01/IBCSD-GGP-Casestudy-Soil-
Health-Management.pdf.

Compilation of BMPs to Reduce Emissions in Palm Oil Production Appendix A. Summary of BMPs 106
Wegner, K. 2016. Separations I: Solid-Liquid Systems. Micro and Nanoparticle Technology. lecture 11.04.2016. Swiss
Federal Institute of Technology Zurich.
Woittiez, LS, MT Van Wijk, M Slingerland, M, Van Noordwijk, KE. 2017. Yield gaps in oil palm: A quantitative review
of contributing factors. European Journal of Agronomy, 83, 57-77. doi:10.1016/j.eja.2016.11.002
World Bank, 2016. The Cost of Fire: An Economic Analysis of Indonesia’s 2015 Fire Crisis.
Wösten, JHM and HP Ritzema (2001) – Land and water management options for peatland development in Sarawak,
Malaysia. International Peat Society. International Peat Journal, 11:59-66.
WWF-US. 2012. Profitability and Sustainability in Palm Oil production. Analysis of Incremental Financial Costs and
Benefits of RSPO Compliance. A report by WWF, FMO, and CDC.

Compilation of BMPs to Reduce Emissions in Palm Oil Production Appendix A. Summary of BMPs 107
Appendix A. Summary of Best Management Practices
Plantation Establishment and Management:
Criteria
Financial
evaluation
Technical and
operational
challenge
GHG reduction
potential
Environment
and Social co-
benefits
Replicability
Concession
Establishmen
t
H M H H H
May result in
significant areas
not under
production.
Significant initial
analysis costs
Technologies
exist
If prevent intact
forest conversion
or peatland
drainage,
emissions
reductions very
high
Protection of
biodiverse
habitats and
other
ecosystem
services
Recommend
ed for all new
concessions
Spatial
Monitoring
L M M M H
Variable. Using
products such as
Global Forest
Watch have
minimal costs.
Use of aerial
imagery will have
medium level
costs
Standardized
approaches are
still in
development,
however drone
based
technologies
offer low cost
potential
Improving
productivity can
reduce the GHG
intensity of PO ;
Fire prevention is
significant
reduction source
Reducing
smoke from
fires and
preventing
encroachment
have extensive
co-benefits
The use of
products
such as
Global Forest
Watch will
allow all
types of
concessions
to monitor
forests and
encroachme
nt
Yield
Enhancemen
t
M M L M M-H
Investment costs
low, however,
where additional
fertilizer is
required costs
will increase
Significant
research is
required to
identify
improved
seeds.
Increasing
productivity
reduces the GHG
intensity of PO
Reducing
fertilizer use
has significant
environmental
co benefits
Most
plantations
have the
potential to
increase
yield, thus
any
improvement
s to seeds or
fertilizer
management
are widely
replicable

Compilation of BMPs to Reduce Emissions in Palm Oil Production Appendix A. Summary of BMPs 108
Criteria
Financial
evaluation
Technical and
operational
challenge
GHG reduction
potential
Environment
and Social co-
benefits
Replicability
Peatland
management
H M-H H M H
Significant
upfront
investment
required to install
improved
drainage systems
Research still
required
Significant and
permanent
annual GHG
emissions for all
hectares
Reduced fire
risk, increased
fish
biodiversity
Will be more
cost effective
for larger
operations
Improved
smallholder
production
M M M H H
High upfront cost
to initiate
financing scheme
and coordinate
with related
stakeholders in
the supply chain
Good
knowledge of
best agricultural
practice is
needed
Avoided land use
change by
smallholder/
intensification
can lead to high
GHG emission
reduction
Avoided
unsustainable
practices,
environmental
risks, and
danger for
deforestation.
Improve
farmers’
livelihood
Can be
implemented
by all scale of
plantation.
Integrated
Pest
Management
L L L M H
Low investment
and maintenance
costs
Yet it requires
knowledge and
skill to maintain
the balance.
Relatively L when
compared to
total GHG
emissions
Avoided
adverse
impacts of
pesticide
application,
maintain
natural
ecosystem.
Can be
implemented
by all scale of
plantation.
Fuel Usage
H M H H M
Significant
investment costs
to install
Technicians
must install;
personnel will
need training on
use
Biofuel replaces
fossil-fuel use in
vehicle and
machinery
Improved air
quality
High
investment
costs may
pose barriers
Improved
concession
management
H-M M M H H
Removing areas
from production,
rewetting, and
conservation
High fire risk
may continue;
Rewetting dams
and protection
Rewetting or
preventing
drainage will
Improved
water eco-
services,
High costs,
but highly
preplicable

Compilation of BMPs to Reduce Emissions in Palm Oil Production Appendix A. Summary of BMPs 109
Criteria
Financial
evaluation
Technical and
operational
challenge
GHG reduction
potential
Environment
and Social co-
benefits
Replicability
result in ongoing
costs
will required
ongoing costs
result in high
GHG emissions
reduced
fire risk
Mill Management:
Criteria Financial
evaluation
Technical and
operational
challenge
GHG reduction
potential
Environment
and Social co-
benefits
Replicability
Efficiency
improvements
Low Low Low to high Medium High
Low
investment
and
maintenance
costs
No additional
skills needed
Highly
depends on
the utilization
scenario.
Biomass
combustion
generates
negligible net
GHG
emissions,
however GHG
reduction can
be significant
when
electricity is
used to
replace fossil-
based
electricity
generation.
Supplying
electricity to
grid can lead
to GHG
emission
reduction
beyond CPO
production
boundary.
Potentially
provides
excess energy
or biomass for
use elsewhere in
production
Technically
feasible for
many mills
High Medium High High Medium
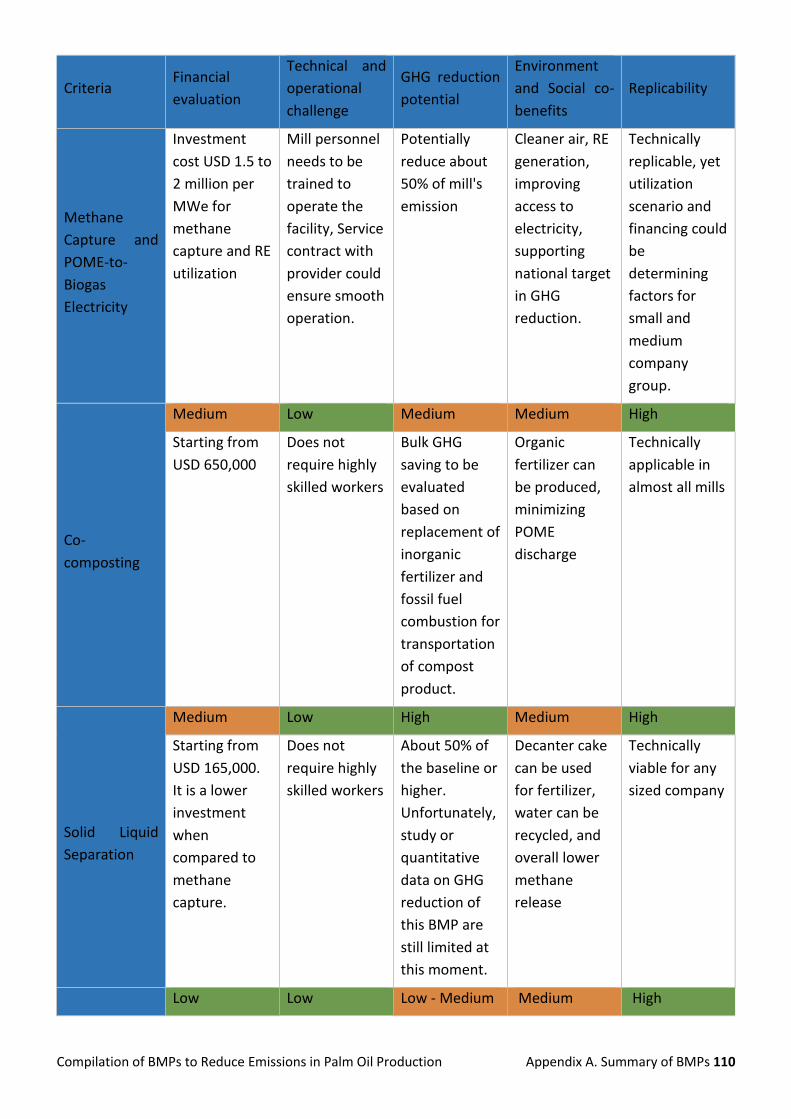
Compilation of BMPs to Reduce Emissions in Palm Oil Production Appendix A. Summary of BMPs 110
Criteria Financial
evaluation
Technical and
operational
challenge
GHG reduction
potential
Environment
and Social co-
benefits
Replicability
Methane
Capture and
POME-to-
Biogas
Electricity
Investment
cost USD 1.5 to
2 million per
MWe for
methane
capture and RE
utilization
Mill personnel
needs to be
trained to
operate the
facility, Service
contract with
provider could
ensure smooth
operation.
Potentially
reduce about
50% of mill's
emission
Cleaner air, RE
generation,
improving
access to
electricity,
supporting
national target
in GHG
reduction.
Technically
replicable, yet
utilization
scenario and
financing could
be
determining
factors for
small and
medium
company
group.
Co-
composting
Medium Low Medium Medium High
Starting from
USD 650,000
Does not
require highly
skilled workers
Bulk GHG
saving to be
evaluated
based on
replacement of
inorganic
fertilizer and
fossil fuel
combustion for
transportation
of compost
product.
Organic
fertilizer can
be produced,
minimizing
POME
discharge
Technically
applicable in
almost all mills
Solid Liquid
Separation
Medium Low High Medium High
Starting from
USD 165,000.
It is a lower
investment
when
compared to
methane
capture.
Does not
require highly
skilled workers
About 50% of
the baseline or
higher.
Unfortunately,
study or
quantitative
data on GHG
reduction of
this BMP are
still limited at
this moment.
Decanter cake
can be used
for fertilizer,
water can be
recycled, and
overall lower
methane
release
Technically
viable for any
sized company
Low Low Low - Medium Medium High

Compilation of BMPs to Reduce Emissions in Palm Oil Production Appendix A. Summary of BMPs 111
Criteria Financial
evaluation
Technical and
operational
challenge
GHG reduction
potential
Environment
and Social co-
benefits
Replicability
Biomass
Waste
Utilization
Some
investment
costs, but
creates
sellable
product
Does not
require high
skilled workers
Avoids
landfilling, and
replaces fossil
fuel use
Provides
renewable
energy source
Technically
viable for any
sized
company
Biogas
Upgrading
High High High Medium Medium
High
investment
costs
Training
required for
operations
Potentially
reduces 50%
of mill
emissions
Provides
renewable
energy
source
Technically
replicable, but
financing
could be
barrier to
small
companies
Advanced
Biofuel
Production
Medium Medium High Medium Medium
Investment
costs needed
Training
required for
operations
Potential to
significantly
reduce fossil
fuel emissions
Provides
renewable
energy
source
Technically
replicable, but
financing
could be
barrier to
small
companies

Compilation of BMPs to Reduce Emissions in Palm Oil Production Appendix B. Guidance on mill BMPs 112
Appendix B. Guidance on evaluating appropriateness of mill BMPs The range of BMPs that can be initiated are quite varied and require weighing priorities, determining the GHG
emission target, availability of investment capital, current and future power demands, and other factors. To assist
in these efforts, guidance has been developed in the form of a decision tree. This hopes to serve as a guideline for
companies in deciding the best management practice (BMP) based on the companies’ needs and resources in mill
management. This decision tree covers BMPs that directly and indirectly reduce GHG emission in the mill.
The recommendation of BMP might not be the only options that companies can choose as there might be other
external or internal factors that cannot be covered in the decision tree. However, it is hoped that this assists
companies in thinking about what they want to prioritize, and what the goals are of implementing a given BMP.
Step 1: General information of your mill
Compile the important information needed to use the decision tree. This will be help companies to choose the
appropriate BMP based on their resources.
Mill
Parent company
Capacity (FFB Ton/Hour)
GHG emission reduction target (%)
Investment capital (possible to raise, externally and internally)
Power demand (Y/N)
Space/area available to build BMP facility (ha)
Time constraint? (Y/N)
Intention to generate additional revenue (Y/N)
Distance to existing national grid (km)
Step 2: Electrical supply and demand assessment
In a palm oil mill, the new electricity generation needs to be synchronized with the existing electricity sources within
the palm oil mill to meet the total electricity demand in the electricity network. The existing electricity sources in
the palm oil mill normally include a biomass power plant and diesel generators. It is recommended that a mill take
an electrical supply and demand assessment to understand the mill’s current power status and gaps.
Step 3: Decision Tree
Follow the questions along in the below decision tree. Each question will lead to further inquiry about your mill and
BMPs that can be applied according to your needs and resources. Each BMP circle is colored according to their
potential to reduce GHG emission:
Orange: low potential
Green: medium potential
Blue: high potential
It is therefore important to match this with your current GHG emission reduction target as written in Step 1.

Compilation of BMPs to Reduce Emissions in Palm Oil Production Appendix B. Guidance on mill BMPs 113
Detailed criteria and information of each BMP can be found in section 3 of this report. If you the decision tree
recommends the installation of a POME Biogas Power Plant, please see Step 4. A similar feasibility analysis would
need to take place for any BMPs a mill is considering initiating.
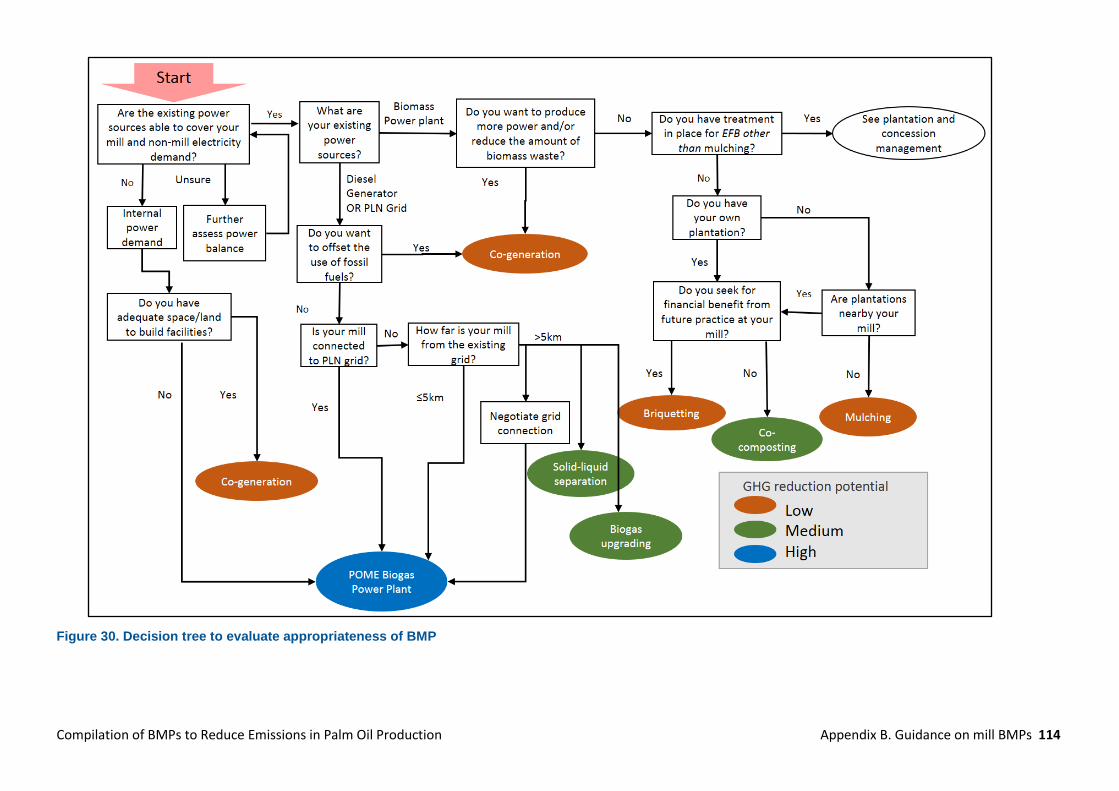
Compilation of BMPs to Reduce Emissions in Palm Oil Production Appendix B. Guidance on mill BMPs 114
Figure 30. Decision tree to evaluate appropriateness of BMP

Compilation of BMPs to Reduce Emissions in Palm Oil Production Annexes: Detailed Case Studies 115
Step 4: POME Biogas: Analyzing your mill’s potential
If you are considering installing a biogas plant in a palm oil mill, you will want to conduct a feasibility study to
evaluate your mill’s potential. To help get you started, below is the typical power potential estimate for each mill
capacity (Table 32).
Table 32. Typical power potential based on mill capacity
Mill capacity
(Ton FFB/Hour)
POME produced Potential power (MWe)
m3/ hour m3/day
30 21 400 1.1
45 31.5 600 1.6
60 42 800 2.1
90 63 1200 3.2
If you are considering installing a biogas plant in a palm oil mill, you will want to conduct a feasibility study to
evaluate your mill’s potential. Flowchart below outlines the recommended steps. With such a study, a company
will be in position to have a strong understanding of the investment costs along with expected GHG and other co-
benefits.

Compilation of BMPs to Reduce Emissions in Palm Oil Production Annexes: Detailed Case Studies 116
Annexes: Detailed Case Studies
Case study 1: Peat Rehabilitation Program and other Best Management Practices to Reduce
GHG Emissions of Golden Agri Resources
Background
Golden Agri Resources (GAR) is one of the leading integrated palm oil
plantation companies in the world with primary activities ranging from
cultivating and harvesting oil palm trees, processing FFB into CPO and
PK, refining CPO into industrial and consumer products such as cooking
oil, margarine, biodiesel, as well as merchandising palm products. GAR
has been listed in Indonesia Stock Exchange and Singapore Exchange
since 1992 and 1999, respectively. 96% of GAR plantations are at a
mature stage and located in Indonesia, dominantly in West Kalimantan,
South Kalimantan, East Kalimantan, Central Kalimantan, Papua, Riau,
South Sumatra, North Sumatra, Jambi, Lampung, Bangka and Belitung islands.
As discussed in the Chairman’s statement in GAR’s 2016 Sustainability Report23, its strategic focus is to “maintain
its position as a leading sustainable palm oil producer by applying best agronomic practices.” Its Social and
Environmental Policy identifies its sustainability priorities which include four major areas: Environmental
Management, Social and Community Engagement, Marketplace and Supply Chain, and Work Environment and
Industrial Relations (Figure 31). It is also committed to helping meet the UN Sustainable Development Goals (SDGs).
One of its key sustainability commitments is to report and reduce greenhouse gas emissions, although many of its
other key commitments also help reduce emissions such as no development of and the conservation of HCS forests
and peat land of any depth and develop strategies for long-term rehabilitation of peatlands.
Figure 31. GAR Social and Environmental Policy priority areas24
Comprehensive GHG emission reduction BMP Portfolio
GAR has implemented BMPs which reduce GHG emissions throughout the value chain process as discussed below
and summarized in Table 33. It has integrated standards from RSPO, ISPO and ISCC into its practices. The
implementation of BMPs in GAR is motivated by its commitment to sustainability. Unlike some other BMPs,
assessing the economic feasibility of the activity is unnecessary as the initial financial investment of the
23 GAR. “Delivering on Our Commitment. Realising sustainable policies in practices. Sustainability Report 2016”
https://goldenagri.com.sg/pdfs/Sustainability/2016/golden-agri-resources-sr2016.pdf.
24 https://goldenagri.com.sg/sustainability/
GAR Facts in 2016
Cultivation area 488,252 ha in Indonesia
Estates 169 (79% nucleus, 21%
plasma)
FFB yield 19.04 MT/ha
Number of mills 45 mills
Production 12.8 MT CPO and PK in
2016

Compilation of BMPs to Reduce Emissions in Palm Oil Production Annexes: Detailed Case Studies 117
implemented BMP is not easily translated to financial returns. Instead, it is GAR’s commitment as a sustainability
leader that motivates the company to carry out these BMPs (Table 33).
Table 33. BMPs implemented by GAR that reduce GHG emissions25
BMP category BMP
Plantation Zero burning policy
Zero new development on peatlands and conservation of peatlands
High Conservation Value (HCV) and High Carbon Stock Approach (HSCA)
Peatland restoration
Fire prevention and community engagement
More efficient fertilizer application
Integrated pest management
Continuous yield improvement
Research in ways to reduce nitrous oxide (N2O) emissions from nitrogen fertilizers application
Mill Waste recycling and reuse
Methane capture
Downstream Reduce plastic packaging waste
Plantation BMPs
GAR adopted a commitment to no burning for new plantings, replantings, or any other development in 1997 as well
as a commitment to no new development on peatlands regardless of depth in 2010. Following the adoption of the
Forest Conservation Policy in 2011, GAR also has carried out High Conservation Value (HCV) and High Carbon Stock
(HCS) assessments on all lands prior to development. As of 2016, 72,000 hectares were identified for conservation.
As will be discussed in detail in this case study, GAR is also involved in a peatlands restoration project, which includes
fire prevention and community engagement.
In addition, it has implemented a comprehensive mineral nutrition management system to minimize the quantity
of fertilizers applied to reduce nutrient run-off and reduce the risk of soil degradation. Standard operating
procedures (SOPs) in fertilizer application have been established with some adjustment to each plantation. Palm
fronds and other organic products are applied in the plantation to increase the fixing capacity of soils.
An integrated pest management IPM approach is applied across its plantations by combining cultural, mechanical,
biological and chemical methods to control pests while minimizing the economic, public health and environmental
risks. GAR uses beneficial plants that attract parasitoids to control pests, pathogens or bacteria, and natural
predators; supplemented with handpicking and mechanical traps. Barn owls are bred on estates to control the rat
population; flora, beneficial plants and pheromones are used to control leaf-eating caterpillars and rhinoceros
25 Each of these are discussed in detail in GAR’s 2016 Sustainability Report.
https://goldenagri.com.sg/pdfs/Sustainability/2016/golden-agri-resources-sr2016.pdf.

Compilation of BMPs to Reduce Emissions in Palm Oil Production Annexes: Detailed Case Studies 118
beetles. The costs of barn owls for biological control is estimated to be US$ 2 to 4 ha-1 yr-1 and the costs of small
carnivores (e.g., wild cats) is US$ 1.6 ha-1 yr -1 respectively26.
The Research and Development (R&D) division of GAR, SMARTRI, spearheads efforts to improve yields, thereby
reducing the pressure to clear more land and the risk of soil degradation through oil palm cultivation. SMARTRI has
been working on a conventional breeding and tissue culture program to selectively breed clones with 20-20% higher
yield. This, in turn, reduces pressure on new land development without increased use of chemical pesticides and
fertilisers.
SMARTRI has also started looking at nitrous oxide (N2O) emissions from nitrogen fertilizers application. Field
measurements and testing of new methods are performed in plantations to explore potential methods to reduce
N2O emissions. It is working on identifying the best quantity of biochar added to the beginning of EFB composting
to minimize N2O emissions.
Mill BMPs
Under GAR’s Zero Waste Policy, solid and liquid waste from the CPO production process are reused, recovered and
recycled for fuel and organic fertilizer. Fiber and shells are used for combustion fuel in boiler and turbine, EFB are
processed in co-composting facilities for organic fertilizer, and 100% of the final treated POME is used for land
application.
GAR has developed 7 methane capture facilities in Central Kalimantan, Jambi and Riau. Six facilities –Hanau, Sungai
Rungau, Perdana, Sei Pelakar and Semilar mills- use covered lagoons, while the other two in Libo and Rama-Rama
mills use tank digesters. The generated biogas is used as an alternative energy source, generating electricity for the
mill’s operation. The installation of methane capture facilities has reduced 40-55% operational GHG in those mills.
Downstream activities
Plastic packaging in the downstream activities can lead to waste and other environment impact. GAR has been
reducing the material thickness or weight of the packaging material to maximize space when loading containers.
The initiative has helped reduce almost 300 tons of plastic packaging waste in 2016. It led to lower costs, lower
energy consumption and reduced carbon emissions, since plastic production and the incineration of plastic waste
lead to emissions.
Conclusions
The range of best management practices that GAR is engaged in illustrates its commitment to reaching its
sustainability goals and, in particular, the goal of reducing greenhouse gas emissions in its operations. Estimates of
total reductions of GHG emissions from implementation of all these BMPs have not been calculated, reductions
from certain activities have been calculated. For instance, seven methane capture facilities have been set of in
GAR’s palm oil mills leading to reduction of 40-55% of each mill’s GHG emissions. GAR is also working on improving
its measurement of GHG emissions from plantations.
In addition to GHG reductions, the BMPs mentioned above lead to a variety benefits for GAR as well as for society.
These include improvements in biodiversity, improvements in local community livelihoods, fire risk reduction,
improvements in soil conditions, substitution of fossil fuel use for renewable energy sources, among other benefits.
Some of these BMPs, such as R&D on yield improvement and peatland restoration, require high investment without
short or medium economic payback, and therefore are not easily replicable by small or medium-sized companies.
26 Caliman, J.P. (2017) Scientific Insights and development in sustainable palm oil production. European Palm Oil Conference
2017. https://www.palmoilandfood.eu/en/news/epoc-2017-european-food-industry-used-60-certified-sustainable-palm-oil

Compilation of BMPs to Reduce Emissions in Palm Oil Production Annexes: Detailed Case Studies 119
Other of these BMPs, however, have smaller upfront investment costs, such as more efficient fertilizer application
and integrated pest management, are more accessible to any companies of any size.
The Initiative
PT SMART Tbk, a subsidiary of Golden Agri Resources (GAR), established the oil palm plantation PT AMNL
(Agro Lestari Mandiri) in 2009 with total area 19,000 hectares (ha). The plantation is situated in the Sub-
District of Nanga Tayap, District of Ketapang, Province of West Kalimantan. PT AMNL is a RSPO-certified oil
palm plantation since March 31, 2011. This company conducted an HCV assessment in 2011 and received ISPO
certification in 2015.
Figure 32. Map of Peat Habilitation Area in PT AMNL27
The peat rehabilitation project is within the PT AMNL property and covers about 2,600 ha of conservation
area (mostly peat soil). that were affected by devastating fire occurrences during strong El Niño season in
2015.
The two key components of the project are peat restoration and community engagement for fire prevention. GAR
is using ecological approaches to restore degraded peatlands including: determining the status and condition of the
area to be rehabilitated; conducting hydrological restoration by constructing canal blocking and thus raising the
water level of the surrounding area; and revegetating using selected native species. Since the project has started,
500 hectares (ha) have been established as a demonstration plot and will be expanded to 1000 ha. A restored patch
of peatland will take 25 to 30 years to reach maturity, although it can never be completely restored to its natural
state prior to conversion.
27 Source: https://www.smart-tbk.com/en/berkelanjutan/konservasi-hutan/rehabilitasi-gambut/
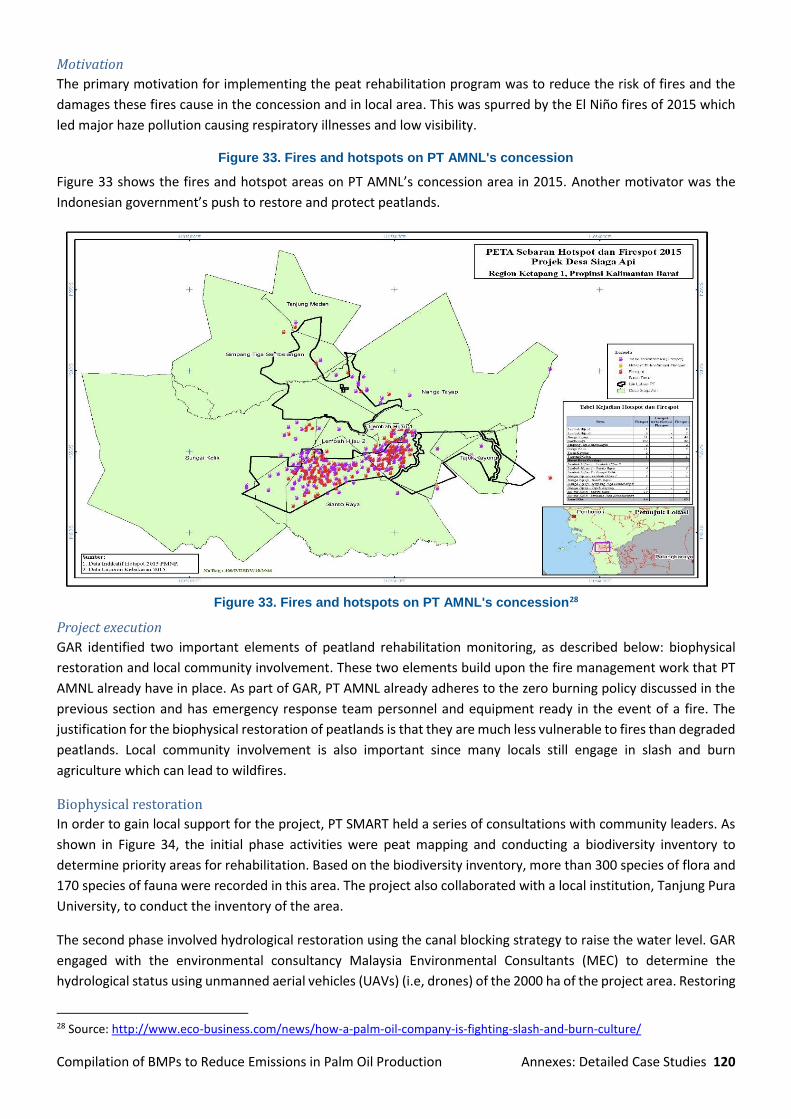
Compilation of BMPs to Reduce Emissions in Palm Oil Production Annexes: Detailed Case Studies 120
Motivation
The primary motivation for implementing the peat rehabilitation program was to reduce the risk of fires and the
damages these fires cause in the concession and in local area. This was spurred by the El Niño fires of 2015 which
led major haze pollution causing respiratory illnesses and low visibility.
Figure 33. Fires and hotspots on PT AMNL's concession
Figure 33 shows the fires and hotspot areas on PT AMNL’s concession area in 2015. Another motivator was the
Indonesian government’s push to restore and protect peatlands.
Figure 33. Fires and hotspots on PT AMNL's concession28
Project execution
GAR identified two important elements of peatland rehabilitation monitoring, as described below: biophysical
restoration and local community involvement. These two elements build upon the fire management work that PT
AMNL already have in place. As part of GAR, PT AMNL already adheres to the zero burning policy discussed in the
previous section and has emergency response team personnel and equipment ready in the event of a fire. The
justification for the biophysical restoration of peatlands is that they are much less vulnerable to fires than degraded
peatlands. Local community involvement is also important since many locals still engage in slash and burn
agriculture which can lead to wildfires.
Biophysical restoration
In order to gain local support for the project, PT SMART held a series of consultations with community leaders. As
shown in Figure 34, the initial phase activities were peat mapping and conducting a biodiversity inventory to
determine priority areas for rehabilitation. Based on the biodiversity inventory, more than 300 species of flora and
170 species of fauna were recorded in this area. The project also collaborated with a local institution, Tanjung Pura
University, to conduct the inventory of the area.
The second phase involved hydrological restoration using the canal blocking strategy to raise the water level. GAR
engaged with the environmental consultancy Malaysia Environmental Consultants (MEC) to determine the
hydrological status using unmanned aerial vehicles (UAVs) (i.e, drones) of the 2000 ha of the project area. Restoring
28 Source: http://www.eco-business.com/news/how-a-palm-oil-company-is-fighting-slash-and-burn-culture/

Compilation of BMPs to Reduce Emissions in Palm Oil Production Annexes: Detailed Case Studies 121
hydrological condition by increasing water table depth to at least 40 cm is required to prevent occurrence fires
(Jaenicke et al. 2010)29. Therefore, GAR blocked the drainage canals to control the water level in the peatlands and
prevent peat oxidation from drained ecosystem. Native species are being grown in a nursery, established by MEC,
for revegetation which occurs after the hydrological restoration. The species that will emerge naturally in the
restored area will tested in an area with new revegetated native species to see what thrives, then a mosaic of plant
species will be gradually introduced across a wider area.
Figure 34. Stages in the biophysical restoration activity30
Community engagement on fire prevention
Education and community engagement are crucial to enable local people to understand the key issues and the
benefits of the project for them. The three objectives of the project’s community engagement efforts are fire
prevention, conservation, and food security. The community engagement component of the project aims to
establish a fire prevention program as well as to provide improved alternative livelihood opportunities for local
people.
29 Jaenicke, J., Wösten, H., Budiman, A., & Siegert, F. (2010). Planning hydrological restoration of peatlands in Indonesia to
mitigate carbon dioxide emissions. Mitigation and Adaptation Strategies for Global Change, 15(3), 223-239.
30 Modified from Golden Agri-Resources Ltd (GAR) and PT Sinar Mas Agro Resources and Technology Tbk (PT SMART Tbk). Peat
Ecosystem Rehabilitation Project. https://goldenagri.com.sg/pdfs/Sustainability/GAR-Peat-Ecosystem-Rehabiliation-
Project.pdf.
Determine status/condition of the area for rehabilitation by carrying
out conservation area and biodiversity surveys.
Engage the community in the rehabilitation project and
conservation efforts.
Restore hydrology of peat area by controlling drainage canals and maintaining a high water table.
Select important native species to restore as much species diversity as possible as well as the physical appearance of the forest stand.
Wildlife food plants such as Ficusand Artocarpus will also be
included.
Establish nursery for building stock of plants for planting out in the
area.
Collect seeds and seedlings of selected plants.

Compilation of BMPs to Reduce Emissions in Palm Oil Production Annexes: Detailed Case Studies 122
The development of community empowerment for fire prevention is designed to improve local awareness of peat
fires. A pilot program Desa Siaga Api involving 17 villages prone to fires near the concession was launched in 2016,
which focused on fire prevention. In 2017, Desa Siaga Api was followed by the broader program Desa Makmur
Peduli Api which also included conservation and food security activities.
In the Desa Siaga Api program, villagers were motivated to maintain fire free areas through rewards in the form of
social infrastructure development aid. The program trained villagers and provided them with the proper equipment
to prevent and combat fire. The villages also had direct access to GAR emergency response team and fire response
equipment, and conduct join regular patrol. The program provided technical assistance to villagers on how to clear
land without fire and worked with schools to raise awareness about forest conservation and how to prevent forest
fires. Because each participating village were fire free the following dry season, each was rewarded US$7,48031.
This program was also supported by the local and regional government. Three out of 17 villages are established as
national pilot model villages by the Coordinating Ministry for Economic Affairs.
Figure 35. Fire prevention training for Desa Siaga Api personnel
In Desa Makmur Peduli Api, in addition to the components of Desa Siaga Api, the villagers receive training on
integrated ecological farming to improve local food security and allow them to sell excess produce. As an example,
as part of Desa Makmur Peduli Api, the Learning garden or Sekolah Lapangan implemented in Lembah Hijau 2 village
is teaching villagers how to clear and cultivate land without burning it. This activity provides local farmers with
expert knowledge on managing plant nurseries, shown how to make and apply organic fertilizer as a substitute to
chemical fertilizers, how to cultivate food crops such as chilli, mustard and kale using sustainable farming
techniques.
31 http://www.eco-business.com/news/how-a-palm-oil-company-is-fighting-slash-and-burn-culture/

Compilation of BMPs to Reduce Emissions in Palm Oil Production Annexes: Detailed Case Studies 123
Figure 36. Farmers harvesting vegetables in learning garden
The different components of the Desa Makmur Peduli Api program in Ketapang, West Kalimantan32 can be found
in Figure 37.
32 The program also exists in villages in Jambi and Riau
Compilation of BMPs to Reduce Emissions in Palm Oil Production Annexes: Detailed Case Studies 124
Figure 37. Desa Makmur Peduli Api program in Ketapang, West Kalimantan 33
These community engagement programs have been deemed successful at reducing fire risks. In 2015, a year before
Desa Siaga Api began, the number of hotspots and firespots were 423 and 217 respectively; in 2016, they fell to 25
hotspots and 7 firespots; in 2017, there were 13 hotspots and 9 firespots34.
Resource requirements
Financial requirement
The total costs associated for the project were not available. For the revegetation portion (including nursery,
planting, and maintenance), costs were between 500 to 550 USD per hectare. For each hectare restored,
approximately 480 seedlings are grown. Of these 480, 400 seedlings are initially planted. Another 80 seedings were
prepared, assuming a survival rate of 80% for the original 400 planted. The Indonesia Peat Restoration Agency (BRG)
calculation estimates that peat restoration costs approximately USD 900 and USD 750 per hectare for hydrology
restoration and revegetation program, respectively35.
Technical expertise
Ecological and hydrological expertise is necessary to ensure success of the restoration project. Furthermore, to
facilitate the community engagement aspect, expertise on fire prevention is also necessary.
Stakeholder involvement
Various stakeholders are involved in this restoration project. As discussed above, the involvement of local
community stakeholders is pivotal to this project. They were consulted in the development of the restoration
project and have been given training on fire prevention and organic farming, as well as financial rewards for
their success in preventing fires.
GAR also engaged with the environmental experts to implement the restoration including the consultancy
Malaysia Environmental Consultants (MEC) and Tanjungpura University. The consultancy South Pole Carbon
is working on estimating the expected GHG emissions from the project.
Projected GHG emission reductions
Peat fires, included in land use change and forestry (LUCF) sector, is one of major contributors of GHG emissions in
Indonesia. According to Indonesia’s INDC36, land use change and peat and forest fires account for 63% of the
countries emissions of 400 MtCO2e. Emissions from oil palm on peat is estimated to be between 18 to 73 tCO2e/ha
per year (Brinkmann Consultancy, 2009)37, the largest contributor to GHG emissions in the CPO supply chain. Under
33 Yang, S (2018). PROSPEROUS FIRE FREE VILLAGE/DESA MAKMUR PERDULI API (DMPA):
Partnership between Corporate and Community to prevent Fire and to develop Community Welfare. International Conference
on Palm Oil and Environment, April 25th -27th 2018, Bali -Indonesia. https://icope-series.com/programme/conferences/
34 https://www.prnewswire.com/news-releases/sinar-mas-agribusiness-and-food-expands-its-fire-prevention-programme-to-
improve-community-welfare-300599315.html
35 http://www.antaranews.com/en/news/103948/agency-to-restore-over-800-thousand-hectares-of-peatland-areas
36
http://www4.unfccc.int/submissions/INDC/Published%20Documents/Indonesia/1/INDC_REPUBLIC%20OF%20INDONESIA.pdf
37 Brinkmann Consultancy. (2009). Greenhouse gas emissions from palm oil production. Prepared for RSPO.
http://rspo.org/sites/default/files/RSPO-GHG-WG-FinalReport-Nov09.pdf.

Compilation of BMPs to Reduce Emissions in Palm Oil Production Annexes: Detailed Case Studies 125
the business as usual scenario, emissions resulting from drainage and development of peatleads are expected to
be 1.2 Gt CO2e38 by 203039.
For the peat restoration project in PT AMNL, baseline emissions and potential emissions reduction are still being
developed by the appointed consultant. Even though the emissions estimates are not known yet, implementation
of peat restoration project in PT. AMNL could lead to significant GHG emissions reduction from avoided peat
decomposition and fires.
Other Impacts and Benefits
As discussed previously, the primary purpose of this peatland rehabilitation project was to reduce risk of fires and
the haze pollution that the fires produce. A World Bank study found that the Indonesian economy lost more than
US$16 billion due to the fires in 201540. This project, therefore, to prevent fires could have significant, wide-reaching
benefits.
Further, the rehabilitation of the peat ecosystem could have a variety of positive impacts include increasing local
biodiversity, reducing the rate of soil subsidence, and improving soil structure. The community engagement
element also benefits local communities by improving food security and additional income from the integrated
ecological knowledge on plant varieties for own consumption and selling.
Lessons Learned
This peat rehabilitation and community engagement project has been a labor intensive, high cost investment. As a
result, smaller companies could likely not engage in a project of this scale. It is important to note, however, that a
key factor of the success of this effort has been the involvement and collaboration of the different stakeholders
including local communities and academics. Because local communities play an important role in helping to prevent
wildfires, different aspects of the community engagement work, such as education on fire prevention, could be
applicable to all companies with plantations to help prevent wildfires and maintain good relations between these
communities and the company. Local engagement is a long-term process. Community involvement will be most
effective and sustainable through long-term collaboration, assistance and adequate knowledge sharing.
Acknowledgements
Winrock thanks Desti Hertanti and Gotz Martin of Golden Agri-Resources for reviewing and providing feedback on
the report.
38 1 Gigatonne (Gt) = 1 billion tonnes
39 Golden Agri-Resources Ltd (GAR) and PT Sinar Mas Agro Resources and Technology Tbk (PT SMART Tbk). Peat Ecosystem
Rehabilitation Project. https://goldenagri.com.sg/pdfs/Sustainability/GAR-Peat-Ecosystem-Rehabiliation-Project.pdf.
40 Ibid.

Compilation of BMPs to Reduce Emissions in Palm Oil Production Annexes: Detailed Case Studies 126
Case study 2: Improved Plantation Establishment through exclusion of High Carbon Stock
Forests - Olam Palm Gabon
Background
Olam Palm Gabon was established in 2011 as a public-private partnership between the Olam Group and the government of the Republic of Gabon (60:40 share) to develop oil palm plantations in the country. Four new plantations located in Kango and Mouila were established and an existing plantation was acquired from SIAT located in Makouke in 2016. Olam and the government of Gabon worked together to identify potential concession locations that would meet Gabon’s objectives while fulfilling Olam’s Palm Policy Criteria. Olam planted 50,000 hectares of industrial plantations ending in 2017 (and an additional 6,000 ha of planted area in Makouke)41. RSPO certified the Kango plantation in August 2016, and the Mouila plantation was certified in December 201742. These areas were converted from secondary, degraded or logged over forests and savannah ecosystems. In the next phase, smallholder plantation schemes will be developed43.
Table 34. Olam Palm Gabon Facts
Olam Palm Gabon JV partners: Olam Group: 60%
Republic of Gabon: 40%
Land bank: 144,000 ha
Planted area: 56,000 ha (including plantations
acquired in Makouke) by 2017
Location and acreage: Awala: 6,822 ha; Mouila: 43,217 ha
Expected FFB yield: Up to 24 MT/ha
Expected CPO yield: 5.2 MT/ha
Capital expenditure: US$600 million
Figure 38. Olam Palm Gabon plantation lot
Since 2011, Olam Palm Gabon fully complied with the RSPO New Planting Procedure and complied to the High
Conservation Value (HCV) Resource Network’s quality control process from 2015. The company applied Free Prior
41 Palm Quarterly Dashboard – April 2018: http://49tmko49h46b4e0czy3rlqaye1b.wpengine.netdna-cdn.com/wp-
content/uploads/2018/05/PalmQuarterlyDashboard-_Apr2018.pdf
42 http://olamgroup.com/news/olam-achieves-second-rspo-certification-palm-plantations-gabon/#_ftn2
43 https://www.rspo.org/certification/new-planting-procedures/public-consultations/sotrader-societe-gabonaise-de-
transformation-agricol

Compilation of BMPs to Reduce Emissions in Palm Oil Production Annexes: Detailed Case Studies 127
and Informed Consent (FPIC) principles, Environmental and Social Impact Assessments (ESIA), and RSPO Principles
and Criteria prior oil palm establishment. The partnership is in line with the key pillars of the “Green Gabon”
National Development Strategy44. In addition, in 2014 Olam invited the international “High Carbon Stock Study
Group”45 to conduct a pilot application of the HCS+ methodology in a forest-rich nation such as Gabon (Box 4). The
following case study provides an overview of the analysis Olam conducted to determine the location for plantation
establishment and presents the results of the HCS+ pilot study.
Olam’s GHG emission reduction BMP portfolio
As part of the Olam Sustainable Palm Oil Policy46, Olam Palm Gabon is committed to implementing a range of best
management practices which reduce emissions including the following:
• No deforestation of protected area, high conservation value forests and ecosystems, and high carbon stock
forests;
• Zero burning including no use of fire during land preparation, planting or replanting;
• No development on peatland regardless of depth;
• Application of CPO byproducts as fertilizer in plantations
• Fronds are stacked to improve soil in plantations
• In the future, Olam is planning to construct methane capture facilities.
Box 4. About Olam Group Olam International is a global agribusiness that has been established in 1989 and is now expanding in 66 countries. Olam, which means ‘Transcending Boundaries’, started in Nigeria exporting raw cashew nuts to India. Currently, Olam is headquartered in Singapore and has been listed in the Singapore Exchange since 2005. It is also recorded in component stock in the Straits Times Index (STI), the S&P and the DAX global Agribusiness Indices. Olam is producing 47 agricultural products from various segments including: edible nuts, spices and vegetable ingredients, confectionery and beverage ingredients, food staples and package foods, industrial raw materials, and commodity financial services. The company is based in more than 66 countries supplying agricultural raw materials and food ingredients across 18 platforms to over 22,000 customers worldwide. The only oil palm plantations that the Olam has are located in Gabon. It also obtains crude palm, palm kernel, palm kernel oil from third party suppliers. As an oil palm grower and buyer from third party suppliers, Olam follows RSPO Principles and Criteria as the basis for its sustainability practices. In addition, Olam developed its own ‘palm oil policy’ in 2011 which was updated in 2018. This policy states Olam’s commitment to the RSPO standard, protection of high conservation value forests and ecosystems, high carbon stock forests, peatland, and improving the livelihood of rural communities. The policy also includes a roadmap to sustainable and traceable third party sourcing.
44 http://visiongabon.com/our-masterplan/
45 http://www.carbonstockstudy.com/
46 http://49tmko49h46b4e0czy3rlqaye1b.wpengine.netdna-cdn.com/wp-content/uploads/2018/01/Olam-Sustainable-Palm-
Oil-Policy-January-2018.pdf
Olam Facts in 2016
Owner: Temasek Holdings (52.2%)
& Mitsubishi corporation (20.3%)
Cultivation area: 2.46 million ha
Processing plants: 210
Production capacity: 22.5 million MT
Revenue : 26.27 billion SGD
Employee : 72,000 people

Compilation of BMPs to Reduce Emissions in Palm Oil Production Annexes: Detailed Case Studies 128
The Initiative
Olam Palm Gabon has served as a pioneer in improving the sustainability of oil palm production. During the
plantation design phase, along with application of RSPO’s new planting procedures, a HCV assessment, a ESIA, and
FPIC, the company was one of the first committed to not developing plantations in high carbon stock forests. Along
with maintaining intact forest areas, through this design, Olam’s greenhouse gas emissions associated with
plantation establishment were significantly reduced. In fact, all of Olam’s plantation sites have been identified as
being carbon positive (i.e., they sequester more greenhouse gases from atmosphere than they emit). The studies
required for this analysis took place in 2011, prior to the establishment of either the first version of the HCS
Approach toolkit47 or the HCS Study48.
Motivation
When Olam Palm Gabon was initially established seven years ago, the primary focus of the design was to ensure
compliance with RSPO and Olam’s Palm Policy. However, from its beginning, it was also committed to protecting
ecosystem integrity and biodiversity by not developing on primary forests and High Conservation Value forests. To
comply with its Palm Policy, Olam first conducted extensive data collection within proposed concession areas. These
were used to inform the needed ESIA (Environmental and Social Impact Assessments) and HCV assessments. Olam’s
scientific team developed its own methodological approach to assess the current land cover and uses and, with
this, identified any areas of intact, or high carbon stock forests. With this combination of studies, Olam Palm Gabon
was able to determine the areas within the concessions which would be developed into oil palm plantations.
Execution of the Plantation Design by Oil Palm Gabon
As stated, prior to selecting the chosen location for potential plantation establishment, Olam conducted an overall
assessment to determine if it would likely meet Olam’s Palm Policy. Once the concession boundaries were
established, a thorough and extensive study took place during the design phase of the Kango and Mouila
plantations. Field and remote sensing based data was collected across the area, including:
• Wall-to-wall LiDAR data collection on topography and canopy height;
• Field data collection on biodiversity. This includes a flora assessment based on forest and savannah plots,
a mammal fauna assessment using transect sign counts followed by camera trapping, and sampling of fish,
aquatic invertebrates, and insects;
• Assessment of the hydrological regime, water quality, soils and soil chemistry;
• Socioeconomic surveys and full participatory mapping.
This information was used to complete both the Environmental and Social Impact Assessments, its HCV
assessments, and identify locations of relatively undisturbed forest. All HCV, ecologically sensitive, and/or high
carbon stock forest areas were mapped for exclusion from palm oil development. In particular, in order to exclude
high carbon stock forests, Olam only develops plantations on lands classified as savannah, scrub, woody pioneer
vegetation or logged-over forest49, all of which have lower carbon stocks.
All of the data results are publicly shared on Olam’s website and directly with local NGOs and community members.
In addition, Olam also engaged with all affected communities following FPIC guidelines. Based on the FPIC
negotiations, Olam signs Social Contracts with each community which clarify the conditions and compensations
47 http://highcarbonstock.org/the-hcs-approach-toolkit-version-1-0/
48 http://www.carbonstockstudy.com/
49 Olam Sustainable Palm Oil Policy. Available at http://olamgroup.com/wp-content/uploads/2014/01/16053-Palm-Policy-
template_English_Screen.pdf
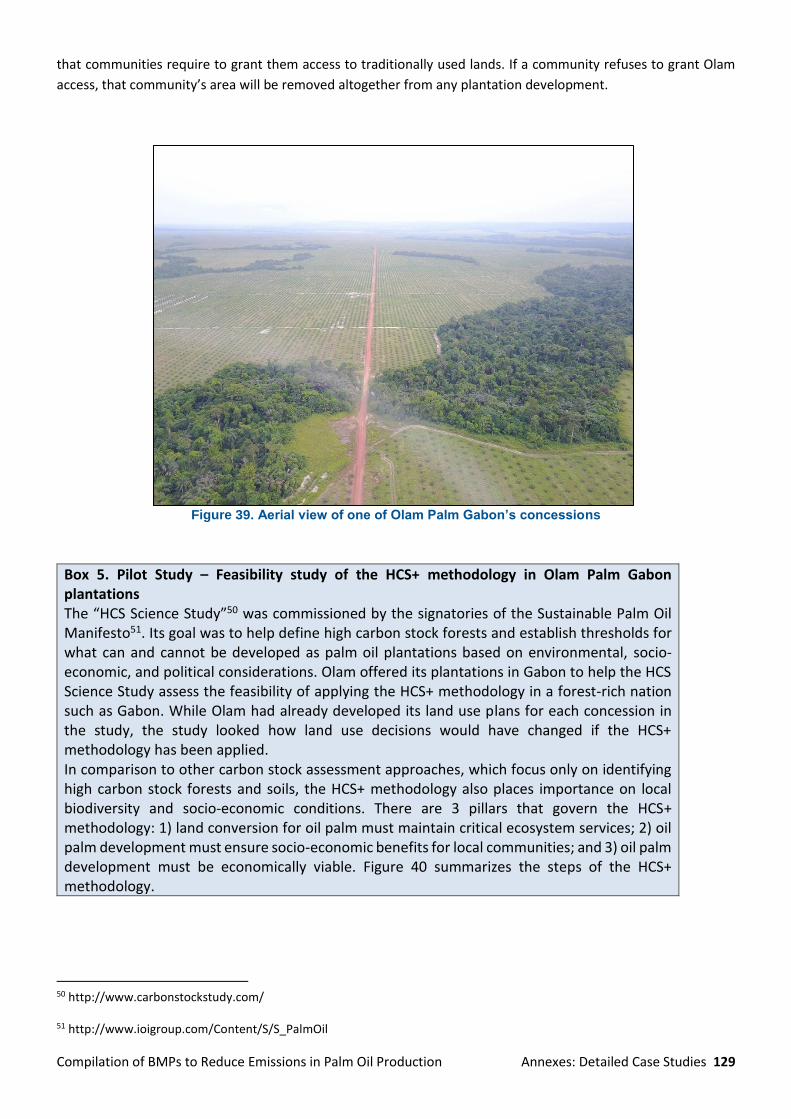
Compilation of BMPs to Reduce Emissions in Palm Oil Production Annexes: Detailed Case Studies 129
that communities require to grant them access to traditionally used lands. If a community refuses to grant Olam
access, that community’s area will be removed altogether from any plantation development.
Figure 39. Aerial view of one of Olam Palm Gabon’s concessions
Box 5. Pilot Study – Feasibility study of the HCS+ methodology in Olam Palm Gabon plantations The “HCS Science Study”50 was commissioned by the signatories of the Sustainable Palm Oil Manifesto51. Its goal was to help define high carbon stock forests and establish thresholds for what can and cannot be developed as palm oil plantations based on environmental, socio-economic, and political considerations. Olam offered its plantations in Gabon to help the HCS Science Study assess the feasibility of applying the HCS+ methodology in a forest-rich nation such as Gabon. While Olam had already developed its land use plans for each concession in the study, the study looked how land use decisions would have changed if the HCS+ methodology has been applied. In comparison to other carbon stock assessment approaches, which focus only on identifying high carbon stock forests and soils, the HCS+ methodology also places importance on local biodiversity and socio-economic conditions. There are 3 pillars that govern the HCS+ methodology: 1) land conversion for oil palm must maintain critical ecosystem services; 2) oil palm development must ensure socio-economic benefits for local communities; and 3) oil palm development must be economically viable. Figure 40 summarizes the steps of the HCS+ methodology.
50 http://www.carbonstockstudy.com/
51 http://www.ioigroup.com/Content/S/S_PalmOil

Compilation of BMPs to Reduce Emissions in Palm Oil Production Annexes: Detailed Case Studies 130
Figure 40. Key Steps in Implementing a HCS+ Methodology52
When implementing carbon stock assessment approaches, an area of debate is what is considered high carbon stock. While Olam Palm Gabon does not have a current carbon stock threshold to differentiate between high carbon stock areas and everything else, it only develops oil palm plantations on lands considered to be degraded such as scrub and logged-over forest. This approach of excluding high carbon stock areas by only developing on degraded lands requires access to land use spatial data and the technical expertise to analyze these data. In contrast, the HCS+ methodology applies an aboveground biomass (AGB) carbon stock threshold of 75 t C ha-1 (i.e., no land with AGB carbon stock greater than 75 t C ha-1 can be developed). The HCS+ methodology requires a significant amount of resources and technical expertise, including access to high-resolution optical remote sensing images like RapidEye to map vegetation and land, the capacity to conduct on-the-ground biomass estimates, as well as the biodiversity and socio-economic surveys required as part of the approach. The study in the Olam lands (in particular, in 2 of its concessions in the Mouila plantation) found that the application of the HCS+ threshold of 75 t C ha-1 for aboveground biomass would significantly reduce the area of the development in the two concessions, and the application of the HCS methodology threshold (35 tonnes of C ha -1) would reduce it even more. Despite this challenge of identifying thresholds to identify forests with high carbon stock, the study found that Olam’s plantations are carbon positive when HCV and high carbon stock areas are protected from development using Olam’s current carbon stock assessment practice, since oil palm plantations capture more carbon than the previously degraded, low carbon land uses stored.
52 Taken from Figure 5 in the 2015 High Carbon Stock Science Study available at https://www.tfa2020.org/wp-
content/uploads/2017/09/HCS-Technical-report-with-Gabon-Case-Study.pdf.

Compilation of BMPs to Reduce Emissions in Palm Oil Production Annexes: Detailed Case Studies 131
Stakeholder involvement
As partners in Olam Palm Gabon, Olam and the Government of Gabon work together on the development and
operation of the plantation area. At the national level, civil society actors and the Institut Gabonais d'aide au
Developpement (IGAD) were extensively engaged. As discussed above, Olam Palm Gabon goes through a thorough
engagement process to ensure they have their free, prior, and informed consent in developing land for cultivation.
This included engagement with all potentially affected communities. In addition, during the plantation
establishment and during ongoing operations, Olam prioritizes providing employment for the community members
surrounding the plantation areas.
Resource requirements
The completion of the field and remote sensing data collection and analysis prior to plantation establishment
required significant resources, including engagement with specialized technical consultants. At the time, and even
to this day, a limited number of organizations have developed the specialized skills required for conducting LiDAR
data collection and analysis.
Olam Group invests in different sustainability actions, in which HCV and carbon stock assessment criteria are non-
negotiable policies. It is difficult to gauge the yield and economic benefits at this stage. Olam sees this as a way to
demonstrate that palm oil plantation can be established in sustainable way. Investment is USD 600 million or about
USD 10,000/ha. This figure accounts for land preparation, nursery, planting and upkeep, fixed asset, overhead and
various studies/ assessment, investment related to social contracts realization and others
Estimated GHG emission reductions
Olam has estimated the net carbon balance of two of their plantations, Awala and Mouila Lot 1, using the RSPO
GHG calculator. In 2017, the Awala plantation had a net carbon balance of -36,648 tCO2e or -5.64 tCO2e per hectare.
In 2017, Mouila Lot 1 had a net carbon balance of -182,996 tCO2e or -11.52 tCO2e per hectare. All Olam sites achieve
net sequestration over one palm cycle due to selective low carbon area and protection of large conservation areas
for biodiversity and local traditional use.
If Olam were to implement the HCS+ methodology, emission reductions would increase even more, although less
land would be available for development.
A 2017 study (Burton et al 2017)53 looked at how Gabon could promote a national palm oil policy that is carbon
neutral. The study estimated that palm oil companies operating in logged forests would need to set aside
approximately 2.6 hectares of forests for every one hectare converted to plantation and recommended an upper
threshold for development on lands with 118 t C per hectare. With this threshold applied, plantation development
could only occur in the lowest quartile of forest carbon densities in Gabon.
Other Impacts and Benefits
Incorporating a carbon stock evaluation during the design of the plantation also has additional benefits. Firstly, this
development approach support’s the governments overall goal of sustainable growth and assists in meeting
multiple Sustainable Development Goals. In addition, by including these areas within the concession but excluding
them from development serves to protect that forested area and thus the ecosystem services this area provides
including biodiversity, cultural significance, and local water supplies. Taking into consideration the needs and
desires of the local communities also helps ensure good relationships between these communities and the palm oil
companies.
53 Burton, M. E., Poulsen, J. R., Lee, M. E., Medjibe, V. P., Stewart, C. G., Venkataraman, A., & White, L. J. (2017). Reducing
carbon emissions from forest conversion for oil palm agriculture in Gabon. Conservation Letters, 10(3), 297-307.

Compilation of BMPs to Reduce Emissions in Palm Oil Production Annexes: Detailed Case Studies 132
There are some notable negative impacts associated with this approach. Every hectare protected on a company’s
land means there is one less hectare available for development of plantations. Companies need to carefully weigh
the costs and benefits of implementing carbon stock assessment approaches, and further evaluate its relevance in
high forest cover landscape or application for smallholder development.
Lessons learned
In the HCS+ assessment study done on Olam’s land, one of the biggest challenges identified was applying thresholds
to identify high carbon stock areas to exclude from plantation development. Applying a threshold of 75 tonnes of
carbon (high carbon stock areas > 75) per hectare reduced the area Olam could develop substantially. Deciding
upon a threshold could have implications to the entire country, as this decision will affect what lands can be
converted to agriculture.
Having support from the government, as Olam Palm Gabon does, could help in not just defining the HCS threshold
but also in the implementation of the carbon stock assessment approach. As discussed in the background section
of this case study, these types of initiatives can help countries meet their green development strategies. This
government buy-in could help smaller companies, which might not otherwise have the resources, carry out carbon
stock assessment approaches to plantation planning as well. It also may help ensure that the carbon stock
assessment approaches done within countries are standardized and effective. For instance, implementing advanced
technology such as LiDAR for estimating aboveground carbon stocks is highly recommended by Olam for a
comprehensive landscape level assessment. This is difficult to do without some government support.
In addition to government support, it is also important to mention that the local stakeholder consultation processes
were also key to gain the local buy-in and support of the local communities when developing the plantations.
Acknowledgements
Winrock thanks Audrey Lee and Christopher Stewart of Olam for their input in developing and finalizing this case
study.
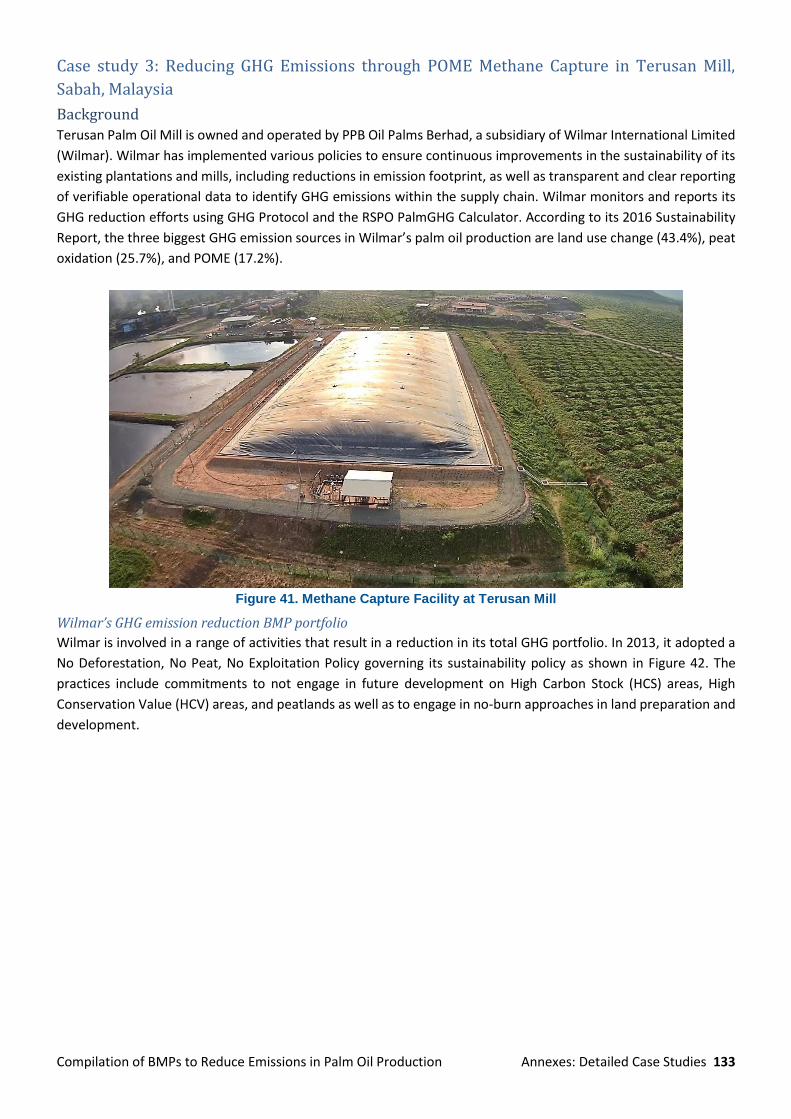
Compilation of BMPs to Reduce Emissions in Palm Oil Production Annexes: Detailed Case Studies 133
Case study 3: Reducing GHG Emissions through POME Methane Capture in Terusan Mill,
Sabah, Malaysia
Background
Terusan Palm Oil Mill is owned and operated by PPB Oil Palms Berhad, a subsidiary of Wilmar International Limited
(Wilmar). Wilmar has implemented various policies to ensure continuous improvements in the sustainability of its
existing plantations and mills, including reductions in emission footprint, as well as transparent and clear reporting
of verifiable operational data to identify GHG emissions within the supply chain. Wilmar monitors and reports its
GHG reduction efforts using GHG Protocol and the RSPO PalmGHG Calculator. According to its 2016 Sustainability
Report, the three biggest GHG emission sources in Wilmar’s palm oil production are land use change (43.4%), peat
oxidation (25.7%), and POME (17.2%).
Figure 41. Methane Capture Facility at Terusan Mill
Wilmar’s GHG emission reduction BMP portfolio
Wilmar is involved in a range of activities that result in a reduction in its total GHG portfolio. In 2013, it adopted a
No Deforestation, No Peat, No Exploitation Policy governing its sustainability policy as shown in Figure 42. The
practices include commitments to not engage in future development on High Carbon Stock (HCS) areas, High
Conservation Value (HCV) areas, and peatlands as well as to engage in no-burn approaches in land preparation and
development.

Compilation of BMPs to Reduce Emissions in Palm Oil Production Annexes: Detailed Case Studies 134
Figure 42. The principles of Wilmar’s No Deforestation, No Peat, No Exploitation Policy 54
In addition to committing to reduce emissions from its plantations, methane capture is a strategic focus for Wilmar
in its efforts to reduce emissions in its palm oil production. As of the end 2016, Wilmar had 17 operating methane
capture plants, with 8 more under construction, using either tank or covered lagoon technologies. Wilmar
developed and started operating the first two methane capture facilities in Malaysia using tank digesters in 2011.
About Wilmar International Wilmar International Limited (Wilmar) is a leading agribusiness group founded in 1991 and ranked amongst the largest listed companies in market capitalization on the Singapore Exchange in 2015 and 2016. The business activities include palm oil production, sugar milling and refining, biodiesel and fertilizer production, as well as flour and rice milling. With over 500 manufacturing plants and an extensive global distribution network, Wilmar operates in more than 50 countries with a total
workforce of about 90,000 people. Wilmar manages both upstream and downstream palm oil businesses in countries like Indonesia, Malaysia and Africa with its operations in plantations, mills, and refineries. Wilmar has signed the United Nations (UN) Global Compact and the Tropical Forest Alliance (TFA) 2020, as well as co-founded the Fire-Free Alliance community program. Wilmar also has various voluntary certifications (e.g. RSPO, ISCC) supporting sustainable products.
The Initiative
Terusan Palm Oil Mill developed its methane capture facility, a Covered In-Ground Anaerobic Reactor (CIGAR), in
2015, and it became operational in 2016. Terusan Palm Oil Mill is located about 160 km from Sandakan town, Sabah,
Malaysia (Figure 43), with a designed processing capacity to process 60 tons of FFB per hour. Terusan Mill has been
in operation since 1995 and is supplied by its own plantation with a total area of 6,788.46 ha. The estates were first
54 Source: http://www.wilmar-international.com/sustainability/
Wilmar Facts in 2016 Cultivation area 241,892 ha FFB yield 19.0 MT/ha/year Number of mills 43 mills OER 20.0%

Compilation of BMPs to Reduce Emissions in Palm Oil Production Annexes: Detailed Case Studies 135
planted in 1989 and were fully established by 2005 and have obtained RSPO and ISCC certifications. No peat land
was planted on in these estates. Its replanting program is currently underway and scheduled till 2020.
Figure 43. Location of Terusan Palm Oil Mill
Motivation
The methane capture facility at Terusan Mill was developed as
part of Wilmar’s effort to reduce its GHG emission footprint from
mills due to POME generation. The initiative is supported by the
company’s No Deforestation, No Peat, No Exploitation policy
which commits to progressively reducing the GHG emissions on
existing plantations.
Wilmar had existing tank digesters (continuous stirred tank
reactors - CSTRs) and membrane covered lagoon (CIGAR)
projects in other mills, which allowed them to easily compare the
pros and cons of the two technologies. The membrane covered
lagoon technology was selected because it was easier and less expensive to construct as well as easier to operate
and maintain.
Another important consideration for constructing the methane capture facility was the additional benefit of using
biogas to generate electricity.
Planning and execution of the initiative
The budgeting and development plan for the methane capture plant in Terusan Mill was approved in 2014, followed
up by construction in 2015 and 2016. The methane capture plant started operating and producing electricity in
2016.
The planning and development phases of methane capture in Terusan Mill involved the Wilmar Group and Mill
management and occurred in close coordination with the purchasing and contract departments. A consultant was
hired to design and assist in the planning of the methane capture facilities. In the construction phase, the Group
Terusan Methane Capture
Mill Capacity 60 ton/hour Average inlet COD level 38,900 ppm Annual operating hours 7,500 hours Daily biogas production 10,000-14,000 Nm3/day Installed power capacity 0.5 MWe Annual power generation 2,400 MWh
Investment costs USD 1.5 million O&M costs (0.09 RM/kWh or 0.02 US$/kWh)
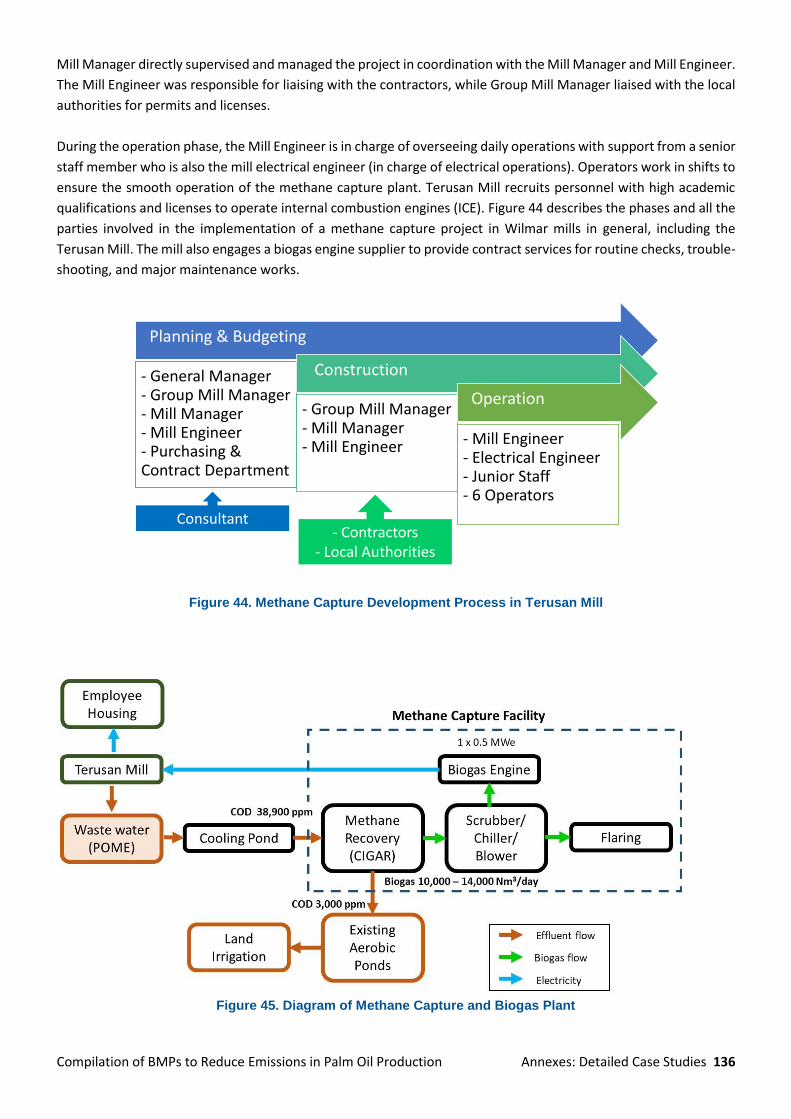
Compilation of BMPs to Reduce Emissions in Palm Oil Production Annexes: Detailed Case Studies 136
Mill Manager directly supervised and managed the project in coordination with the Mill Manager and Mill Engineer.
The Mill Engineer was responsible for liaising with the contractors, while Group Mill Manager liaised with the local
authorities for permits and licenses.
During the operation phase, the Mill Engineer is in charge of overseeing daily operations with support from a senior
staff member who is also the mill electrical engineer (in charge of electrical operations). Operators work in shifts to
ensure the smooth operation of the methane capture plant. Terusan Mill recruits personnel with high academic
qualifications and licenses to operate internal combustion engines (ICE). Figure 44 describes the phases and all the
parties involved in the implementation of a methane capture project in Wilmar mills in general, including the
Terusan Mill. The mill also engages a biogas engine supplier to provide contract services for routine checks, trouble-
shooting, and major maintenance works.
Figure 44. Methane Capture Development Process in Terusan Mill
Figure 45. Diagram of Methane Capture and Biogas Plant
Planning & Budgeting
- General Manager- Group Mill Manager- Mill Manager- Mill Engineer- Purchasing & Contract Department
Construction
- Group Mill Manager- Mill Manager- Mill Engineer
Operation
- Mill Engineer- Electrical Engineer- Junior Staff- 6 Operators
- Contractors- Local Authorities
Consultant

Compilation of BMPs to Reduce Emissions in Palm Oil Production Annexes: Detailed Case Studies 137
Figure 45 depicts the components and flow process in methane capture/biogas plant in Terusan Mill. POME
generated by mill goes to a cooling pond to lower the temperature before entering the methane recovery facility.
At an average COD level of 38,900 ppm, the effluent treated in CIGAR system could generate 10,000 to 14,000 Nm3
biogas per day. Biogas is treated in the chiller and scrubber to remove the moisture and H2S. The biogas engine
converts the biogas into electricity to supply the mill, which subsequently distributes to employee housing. Flaring
equipment is fitted for gas flaring whenever there is excess or unutilized biogas (e.g. during biogas engine
maintenance). With COD removal efficiency at about 92%, the CIGAR system lowered the COD level from 38,900
ppm to 3,000 ppm. Treated effluent from the methane recovery is channeled to the existing aerobic ponds where
effluent is further treated to meet BOD standards for land irrigation.
Figure 46. Aerial View of Methane Capture and Biogas Plant Site during Construction
Figure 47. Left: Construction of lagoon, Right: Biogas engine
Resource requirements
Resource requirements for developing and implementing the methane capture plant in Terusan Mill included:
• Sufficient, adequate space for constructing the lagoon. The site conditions need to be appropriate
as well, including absence of peat soils and land of appropriate slope. Total area used for methane
capture is about 4 ha and located within the mill’s compound;
• Competent contractors and personnel to construct and operate the plant;
• Adequate budget. Table 35 shows the breakdown of capital expenditures for the methane capture
facility with earthwork and civil work making up the largest portion at 25% followed by costs
associated with covered lagoon and piping at 20% and costs associated with gas engine and
associated equipment at 20%;

Compilation of BMPs to Reduce Emissions in Palm Oil Production Annexes: Detailed Case Studies 138
Table 35. Components of Capital Expenditure for the Terusan Mill methane capture facility
Components % of Capex
Amount
(in USD)
Earthwork & Civil Work 25% 375,000
Covered Lagoon and Piping 20% 300,000
Gas Engine & Associated Equipment
20% 300,000
Mechanical Installation 10% 150,000
Electrical & Wiring 15% 225,000
Dewatering Plant 10% 150,000
Total 100% 1,500,000
• Compliance with local and national regulations;
• To take into consideration the suitability of the technology for providing sufficient electricity. A unit of
biogas engine with a capacity of 0.5 MWe operates on average 7,500 hours per year to produce electricity
for the mill and the employee housing complex. The mill management plans to increase the installed
capacity to 1 MWe in the future, if feasible. Since current installed capacity is sufficient to meet the
electricity demand of the housing complex, the additional power produced will be used in the mill to
supplement electricity produced by steam turbines with boilers to reduce biomass consumption as boiler
fuel. Final treated effluent is discharged for land irrigation in accordance to mill’s license from the
authorities.
Stakeholder involvement
As discussed in the previous section, the methane capture plant was designed (with inputs from a consultant),
developed, and implemented by an in-house team (see Figure 44). This team, however, did have to work with local
authorities to get approval for the project. They also worked with contractors on construction and commissioning.
Estimated GHG emission reductions
GHG emissions are estimated using the RSPO PalmGHG calculator; a European Union-recognized calculator for ISCC
certification; and Wilmar’s own COD tabulation on digester efficiency. Actual emissions fluctuate based on POME
production and biogas generation, which are influenced by various factors like crop processing, weather and
microbial processes. Therefore, actual emission reductions are subject to the mill’s operation; the baseline could
serve as a guide, but never the rule.
Using the RSPO PalmGHG Calculator and 2016 data as the baseline, methane capture and biogas utilization for
electricity contributes to an estimated methane reduction of 1,011 tCH4 or an equivalent of 28,30855 tCO2e per
year. As a result, it reduces the overall GHG emission footprint of CPO production in Terusan Mill.
55 Global Warming Potential used is 28 for Methane. IPCC (2013). Climate Change 2013: The Physical Science Basis. Working
Group I Contribution to the Fifth Assessment Report (AR5) of the IPCC. Chapter 8: Anthropogenic and Natural Radiative
Forcing. See : https://www.ipcc.ch/pdf/assessment-report/ar5/wg1/WG1AR5_Chapter08_FINAL.pdf

Compilation of BMPs to Reduce Emissions in Palm Oil Production Annexes: Detailed Case Studies 139
Other Impacts and Benefits
Operational impacts
Additional manpower is required to operate the methane capture plant with proper supervision and maintenance
efforts. However, the plant has allowed the mill to more effectively manage final discharge to better comply with
regulations.
Financial impacts
Prior to the initiative, Terusan Mill supplied electricity to its mill and housing complex using steam turbines powered
by biomass boilers during processing hours, and diesel generators during non-processing hours (particularly from
12 AM to 4 AM). Methane capture & utilization has enabled the Terusan Mill to provide continuous electricity
supply to more than 330 houses in the Terusan housing complex. Electricity generated from methane capture has
displaced electricity generated from diesel generator by almost 70%. It has reduced biomass consumption as a fuel
source for boiler-turbine system, thus making more biomass (about three times as much) available for sale and
providing an additional source of revenue. Fossil fuel savings and revenues from biomass sale could potentially
provide the Terusan Mill with an additional monetary benefit of more than USD 120,000 per year (Table 36).
Table 36. Annual Fuel Saving Benefits
Fuels Amount &
unit
Amount
(MYR)
Amount
(USD)
Diesel oil savings 179,400 liter 147,100 34,226
Biomass savings 2,400 ton 375,700 87,377
Total 522,800 121,602
Impacts on Company image and staff morale
Wilmar International has also benefited from the methane
capture facility, as it has been identified as enhancing the
company’s good image and reputation in sustainability efforts
as well as boosting staff morale. The project has been discussed
in Wilmar’s Annual Reports, Sustainability Reports, CDP
programs, and its Sustainability Dashboard.
Lessons learned
During the methane capture facility development, the Wilmar Group, and in particular the Terusan Mill, faced
different challenges and identified different ways to overcome these challenges as discussed below.
Technology selection
During the planning phase, selecting the suitable methane capture technology will depend on the specific
conditions of the site including the topography, soil type, availability of space, assessments on existing and future
power consumptions, POME characteristic, and utilization scenario. See Table 37 for consideration of technology
selection. Therefore, a thorough assessment of the site is key to ensuring the success of the project.
Table 37. Considerations for Technology Selection
Items Continuous Stirred Tank Reactor (CSTR)
CIGAR/ Membrane Covered lagoon
Space requirement Smaller space requirement Larger space requirement
Electricity utilization Suitable for large and continuous demand (i.e. grid connection,
Suitable for captive power and power supply to the grid
“The operation of methane capture plant is found to be a morale booster for the Terusan Mill and its personnel. We are proud of being a part of this green initiative with benefits to the environment. It enhances the positive perception towards our workplace.”
Mr. Lo Yee Hang, Group Mill Manager

Compilation of BMPs to Reduce Emissions in Palm Oil Production Annexes: Detailed Case Studies 140
Items Continuous Stirred Tank Reactor (CSTR)
CIGAR/ Membrane Covered lagoon
large domestic electricity demand)
Capital expenditure Higher investment cost Moderate investment cost
Procuring and transporting the necessary equipment
Throughout the planning, construction, and operations phase,
Terusan Mill faced challenges in procuring the necessary machinery
and equipment within the estimated budget and transporting it to
the site. The closest city is 160 km away from Terusan Mill, thus
transporting the necessary machinery and equipment required
significant time and costs. Adequate, timely planning that
anticipates these difficulties is imperative for the long-term success
of the project.
Qualified contractors
Another key limitation was finding qualified contractors. These
contractors are crucial to ensure timely construction, high quality
installation, and avoid cost-overrun. The Wilmar Group worked
with several contractors on the construction of their methane
capture facilities, and avoided engaging with just one major
contractor for all projects to reduce construction risks.
In terms of project management, the planning committee for the
Terusan Mill engaged the same team of consultants and contractors assisting Wilmar on previous projects. Engaging
one set of consultants and team of contractors on a long-term basis helps to mitigate the risk of project delays since
the contractors are already familiar with Wilmar . This also allowed for better work coordination and optimization
of budget. For mills developing their individual projects, it is advisable to work with a technology provider,
consultant, as well as contractor(s) with good experience and track record.
Skilled personnel retention
To ensure that personnel have the required skill and capacity, Terusan Mill in particular and the Wilmar Group
provide them training to operate the methane capture facility and biogas utilization plant. Working with POME,
which has an unpleasant smell, and being in a remote location can be challenging for some personnel. Terusan Mill
learned that job enrichment can support retaining personnel. For example, an operator of the biogas plant has been
promoted to work in the mill’s composting facility and be in charge for overall mill waste management.
Biogas flaring
Methane within the biogas generated is a valuable fuel for electricity generation or other means of energy
generation and significantly influences the economic viability of a project. Therefore, only excess biogas generated
that cannot be fully utilized for electricity generation should be flared.
Involvement of senior management
In addition to the success factors presented above, the senior management of Wilmar Group played an important
role in expediting project implementation through:
1. Full support of the project implementation
Wilmar Group set up the following
evaluation criteria to ensure successful
implementation of methane capture
project:
1. Available technology and its
safety features
2. Cost of project and selected
technology
3. Maintenance of the available
technology
4. Power demand for domestic
usage and mill application
5. Availability of distribution or
transmission line
6. Backup services from the local
supplier
7. Location and available footprint

Compilation of BMPs to Reduce Emissions in Palm Oil Production Annexes: Detailed Case Studies 141
2. Giving timely guidance on the implementation process
3. Monitoring closely of project schedule and issues faced to ensure timely implementation.
Acknowledgements
Winrock thanks Lee Kok Vui and Foo Siew Theng of Wilmar for their input in developing and finalizing this case
study.
Compilation of BMPs to Reduce Emissions in Palm Oil Production Annexes: Detailed Case Studies 142
Case study 4: Reducing GHG Emission through Filter Belt-Press Systems within Palm Oil Mill
– Kuala Lumpur Kepong
Background
A major issue that all palm oil mills are faced with is how to manage their palm oil mill effluent (POME), the liquid
waste produced from the processing of fresh fruit bunches. POME consists of 4-5% suspended and dissolved solids.
The presence of these solids in the conventional open pond treatment system contributes to the production of
methane. Furthermore, as these solids accumulate, the ponds begin to fill in and, therefore, dredging is required.
Removing these solids from POME entering pond systems at palm oil mills can be burdensome as it requires a large
area for dredging, and mill operations have to periodically shut down to perform the dredging. To address this issue
in its mills, Kuala Lumpur Kepong Berhad (KLK) installed a Filter Belt-Press system to remove solids from the POME
before it enters treatment ponds.
KLK’s GHG emission reduction BMP portfolio
KLK is committed to reducing GHG emissions across its production system. This includes a commitment to no
development on areas classified as having potential high carbon stocks, following the HCS approach, as well as to
no new development on peat56. In 2016, it achieved its target of reducing emissions in its palm oil mills by 50%57.
The two main approaches that KLK has implemented in its mills are the installation of methane capture facilities
and employing the use of the filter belt-press system. Four methane capture facilities are in operation and supplying
electricity to the national grid, and another two are in the construction stage. A group-wide program to install filter
belt-press (FBP) systems is now being carried out across the KLK group mills as an additional approach to reduce
GHG emissions in CPO production. Twenty-nine FBPs have been developed in Malaysia and Indonesia, whereas
another two are in construction.
Box 6. About KLK Group Kuala Lumpur Kepong Berhad (“KLK”) is a palm oil company managing upstream and downstream business. KLK was established more than 101 years ago and is listed on the Main Market of Bursa Malaysia Securities Berhad with a market capitalization of about MYR 26.5 billion, or US$ 6.7 billion58 as of mid-June 2017. KLK has been identified as one of the largest plantation companies, with land banks spread across Malaysia, Indonesia, and Liberia. Pursuing best sustainability practice for CPO production, KLK launched its sustainability policy in 2014 that included no development on peatlands, conservation of peatlands, and stakeholder engagement. All its operating centers in Malaysia have been RSPO certified since 2015. It is aiming to have all its operating centers in Indonesia certified by 2019. Its commitment to sustainability has been strengthened through the formation of the Sustainability Steering Committee chaired by KLK’s CEO. Further, KLK is implementing a traceability program that provides product traceability to palm oil mills, refineries and kernel crushing plants. GPS coordinates of its POMs are also available on the corporate website (http://www.klk.com.my/sustainability/palm-oil-mills/).
56 www.klk.com.my/sustainability/environmental-stewardship
57 http://www.klk.com.my/wp-content/uploads/2017/04/KLK-Sustainability-Report-2016.pdf
58 1 RM = 0.253 US $
KLK Facts in 2016 Plantation area: 270,000 ha FFB yield: 3.5 million MT/ha/year Number of mills: 24 mills OER: 22.28% (source: 2016 Annual Report)

Compilation of BMPs to Reduce Emissions in Palm Oil Production Annexes: Detailed Case Studies 143
The Initiative
The filter belt-press (FBP) is a device used for the separation of POME into a filtrate (i.e., wastewater) and a solid
press cake (i.e., solid organic matter). Chemicals are used to improve the flocculation (i.e., clumping together) of
solids. The FBP system continuously removes organic matter from the pond system. By removing the solids, the
formation of methane gas is reduced. The system enables the mill to reduce and better manage palm oil waste. The
solid removed can be used as organic fertilizer and applied to plantations. The water extracted from the system is
also recycled for irrigation and technical cleaning purpose.
Solid-liquid separation is obtained by passing filtering cloths ("belts") through a system of rollers as shown in Figure
48. The system takes sludge ("effluent" or "slurry") as a feed between these cloths and separates them into a filtrate
and a solid press cake.
Figure 48. Diagram of the Filter Belt Press System59
Motivation
The filter belt press system in KLK mills was initially installed to avoid the need to open a large area in the mill
property to perform dredging. However, KLK subsequently realized the application of the technology could also
reduce methane emissions, therefore, this provided further incentive to develop and maintain the initiative.
Execution of the initiative
The initiative was started by the Production Division with an approval from the KLK headquarters. The development
of the system in each mill requires involvement by a range of staff, including the Production Director, the Mill
Advisor, the Mill Manager, the Purchasing Unit, the Supplier and Contractor. The Purchasing Unit is responsible for
procuring the belt-press machine and accessories, whereas construction and commissioning are done by the
Operating Centre. During the construction, the Mill Manager supervises the civil and mechanical works done by
appointed contractor.
The construction of the filter belt-press in KLK mills takes about one year. The filter belt press (FBP) should be
located close to mill and the existing wastewater treatment ponds. Prior to commissioning the work, a permit
needed to be obtained from the Department of Environment. Normally, additional personnel are hired by KLK to
operate the FBP where they receive training to equip them with specific required skills.
59 Figure from presentation “GHG reduction with solid separation in POME ponds: Introducing new emission factors for
alternative CH4 reduction techniques” by Annamari Enstrom of Neste. https://www.iscc-system.org/wp-
content/uploads/2017/08/2.-Reducing-the-Impact-of-Methane-Emissions-2.pdf.

Compilation of BMPs to Reduce Emissions in Palm Oil Production Annexes: Detailed Case Studies 144
Figure 49. Filter Belt Press at one of KLK’s mills60
Stakeholder involvement
As indicated in the section above, in the process of constructing the filter belt-press, KLK worked with both outside
consultants as well as the appropriate government ministry to get the correct permits to do the work.
Resource requirements
Investment in one filter belt press system with a capacity to process 25 m3 of wastewater per hour costs about US$
177,000, financed by the KLK Group and the individual mill. The civil and mechanical works and filter belt press
machines are the largest cost components, 45.8% and 39.3% of investment costs respectively, as shown in Table
38.
Table 38. Components of Capital Expenditure
Components % of total
costs
Amount (in US$)
Civil structures & mechanical works 45.8% 81,042
Piping 0.6% 972
Cable and switch board (including installation) 7.1% 12,567
Centrifugal pump 0.7% 1,166
Submersible mixer 6.5% 11,486
Filter Belt Press machine 39.3% 69,575
Total 100% 176,808
Estimated GHG emission reductions
Beginning in 2016, KLK partnered with Neste, Meo Carbon and IDH Sustainable Trade Initiative to estimate methane
emission reductions from the use of FBP in palm oil mills.
Methane (CH4) emission measurements were conducted at a mill located in peninsular Malaysia which processed 730 tonnes of FFB per day, produced over 156 tonnes of CPO per day, and whose FBP generated 27.3 tonnes of belt press cake per day. The study was conducted to find a simple method for determining the reduction in CH4 emissions at the palm oil mills that companies utilizing solid-liquid separation in the palm oil industry could apply, rather than having to engage in complicated and expensive on-site measurements. In the study, it was found that
60 Photo from presentation “Improving Palm Oil Mill Performance – Ways towards Low Carbon Palm Oil” by https://www.iscc-
system.org/wp-content/uploads/2017/05/KLK_Improving-palm-oil-mill-performance_240315.pdf

Compilation of BMPs to Reduce Emissions in Palm Oil Production Annexes: Detailed Case Studies 145
the achieved reduction in methane emissions correlates to the methane formation potential of the organic carbon in the belt press cake produced from the FBP61.
The emissions from the pond implementing a FBP system was 50% lower than emissions from a parallel
conventional open pond62. The study found that the filter belt-press reduced the mill’s daily emissions by 20.6
tonnes of CO2e. This is equivalent to a reduction of 0.13 kg of CO2e63 per 1 kg of CPO produced. While the study did
not come up with one universal emission factor number that could be applied to other facilities, it did come up with
an equation. The emission factor of a given mill is dependent on the amount of belt filter cake produced and the
organic carbon content of this cake64. The equation for calculating the emission factor is in Equation 1 where 23.1
is the conversion factor from carbon to CO2e.
This study and result are also presented in a peer-reviewed article Enström et al 2018, Introducing a new GHG
emission calculation approach for alternative methane reduction measures in the wastewater treatment of a palm
oil mill in the journal Environment, Development and Sustainability at:
https://link.springer.com/epdf/10.1007/s10668-018-0181-4?author_access_token=-
F7xEddWHKoItVNCDhhaW_e4RwlQNchNByi7wbcMAY4CFydja1QQGlej9TeEMWE08qlop71asPsVDM2iVm_9gTCRd
lx04jQy4bcjAFeKrGzJdBBhgPT9P9tckO7LRKgoAcQrE-JwM_UcpvxXXZZv9Q%3D%3D
Equation 165
In addition to the GHG emission reductions of the wastewater treatment, organic fertilizer is also produced. The
application of such fertilizer reduces the need for chemical fertilizers, further reducing total operation level
greenhouse gas emissions.
The implications of these findings are significant, as it provides evidence of the technology’s potential to serve as a
cost-effective way of reducing emissions. FBP has the potential to reduce emissions in CPO production at lower cost
when compared to methane capture.
Other Impacts and Benefits
The use of filter belt-presses provide the following additional benefits to mills and plantations:
61 GHG reduction with solid separation in POME ponds: Introducing new emission factors for alternative CH4 reduction
techniques” by Annamari Enström of Neste. https://www.iscc-system.org/wp-content/uploads/2017/08/2.-Reducing-the-
Impact-of-Methane-Emissions-2.pdf.
62 Neste. March 2, 2018. “Neste-lead project verified 50% methane emission reduction at palm oil mills.”
https://www.neste.com/en/neste-lead-project-verified-50-methane-emission-reduction-palm-oil-mills.
63 1 kg of CO2 = 0.001 tonnes of CO2
64 GHG reduction with solid separation in POME ponds: Introducing new emission factors for alternative CH4 reduction
techniques” by Annamari Enstrom of Neste. https://www.iscc-system.org/wp-content/uploads/2017/08/2.-Reducing-the-
Impact-of-Methane-Emissions-2.pdf.
65 Ibid.

Compilation of BMPs to Reduce Emissions in Palm Oil Production Annexes: Detailed Case Studies 146
• As discussed previously, FBP produces belt-press cakes that can be used as organic fertilizer in plantations
thereby reducing the amount of chemical fertilizer that needs to be applied.
• The separation of sludge and wastewater also reduces the need for dredging and the need to shut down
operations to do the dredging.
• Space is freed up which otherwise would be needed for dredging.
•
Lesson learned
A major challenge KLK is addressing is how to improve the efficiency of their FBP systems. To do this, they are
improving the design of the Horizontal Filtration System to recover wastewater which is enriched with polymers
and used to clean the FBP system. They are also working to improve the production of belt-press cake by introducing
a submerged mixer. This mixer helps get more of the settled sludge into the pump towards belt press without
constantly having to move the pump itself. This, in turn, slows down the dilution of pumped slurry.
The fact that the filter belt-press does have a relatively low cost, little additional power demand, and leads to high
emission reductions indicates that this technology could be a good option for mills of any size with low limited
financing options or no additional power demand.
Acknowledgements
Winrock thanks Lee Kuan Yee of KLK and Annamari Enström, Asta Soininen, and Adrian Suharto and of Neste for
their input in developing and finalizing this case study.

Compilation of BMPs to Reduce Emissions in Palm Oil Production Annexes: Detailed Case Studies 147
Case study 5: Reducing GHG Emissions through Co-composting and Methane Capture, Sime
Darby
Background
Sime Darby Plantation (SDP) is committed to implementing various best management practices to reduce its GHG
emissions in both its plantations and its mills, as well as to increasing the bar on sustainability standards. SDP has
set a target to reduce GHG emissions intensity by 40% by 2020 or reduce to 0.64 tCO2e/tonnes CPO (based on a
baseline of 1.01 tCO2e). The company initiated the GHG monitoring in 2012 using 2009 data to establish the
baseline using GHG Protocol methodology for Scope 1 and 2 emissions66 only. Sime Darby has committed to
implementing key green initiatives as part of its Carbon Reduction Strategy67 through which the company will meet
its GHG emissions reduction target.
Further, Sime Darby Group affirmed its commitment though the Responsible Agriculture Charter (RAC) launched in
2016 to address challenges around no-deforestation, no-peat and no-exploitation68. The Charter will be applicable
to its entire oil palm operations, extended in phases to third party palm oil suppliers and other agricultural suppliers
in the supply chain.
SDP’s GHG emission reduction BMP portfolio
To meet these GHG reduction commitments and other sustainability commitments (e.g., forest conservation), SDP’s
BMP practices include both practices associated with plantation establishment and management and during mill
production. As shown below, some of these are company-wide policies/practices while others are specific to certain
plantations or mills.
o Zero burning replanting techniques;
o No new plantings on peatlands;
o No deforestation
o Integrated pest management
o Development of higher yield seeds to reduce pressure to expand plantations;
o Co-composting (discussed in detail below);
o Methane capture;
o Replacement of Light Fuel Oil with natural gas at one refinery (Nuri Edible Oil refinery).
66 Scope 1 emissions are direct emissions from owned or controlled sources. Scope 2 emissions are indirect emissions from the
generation of purchased energy. http://www.ghgprotocol.org/sites/default/files/ghgp/standards_supporting/FAQ_0.pdf.
67 http://demoweb11.simedarby.com/sustainability_2015/case-studies/biogas
68 http://www.simedarbyplantation.com/sustainability/beliefs-progress/practices-key-initiatives/responsible-agriculture-
charter

Compilation of BMPs to Reduce Emissions in Palm Oil Production Annexes: Detailed Case Studies 148
Box 7. About Sime Darby Sime Darby Plantation (SDP) is the largest division of Sime Darby Group, a conglomerate group listed in Malaysia. It is one of the founding members of RSPO and is now one of the largest global sustainable palm oil producers. Producing more than 2 million tonnes of CSPO and almost a half million tonnes of SCPK, certified sustainable palm oil account for 98% of total production69. Sime Darby Plantation operates in 18 countries, encompassing more than 254 estates and 71 mills. The business spans upstream and downstream palm oil value chain, from oil palm cultivation to refineries. Plantation areas are located in Malaysia, Indonesia, Liberia, Papua New Guinea, and Solomon Islands. SDP has set a target to reduce GHG emissions intensity by 40% by 2020 or 0.64 tCO2e/tonnes CPO70. Participating and committing to United Nations Global Compact (UNGC) Traceability Taskforce, Sime Darby launched the Open Palm Traceability Dashboard to provide information on the traceability of its supply chain. 78.9% of CPO and 85.8% of PK produced by Sime Darby are now traceable to the plantations.
Methane Capture at Sime Darby
Sime Darby has a long-held commitment to efficient use of resources. For example, Sime Darby first installed
methane capture back in the late 1980’s in mills such as Bukit Rajah, Chan Wing and Tennamaram. Among the most
successful projects was at the Tennamaram mill, where biogas was used for power generation and piped to an
adjacent facility to power a ceramic drying furnace. In 2010, Sime Darby Plantation decided to re-evaluate the
potential of methane capture and formulated a Biogas Masterplan. Under this plan, methane capture serves as the
centerpiece of Sime Darby Plantation’s emission reduction initiatives. To date, Sime Darby Plantation has 7 fully
active biogas plants with another 6 in various stages of planning and commissioning. Under its methane capture
initiatives, Sime Darby also found GHG emission reductions. Depending on the size and technology post methane
capture (flaring, co-firing, FIT or Bio-CNG), SDP’s biogas plants are designed for around 50-100% utilization of total
POME produced by the mill and capable of reducing around 13,000 - 33,000 Mt CO2-e/year per plant.
This then translates to a 28-73% reduction of the mills’ annual emissions (0.5 - 1.3% reduction of SDP’s annual
emissions). Thus, methane capture stands out as one of the largest and most effective approaches to GHG emission
reductions at SMP Mills.
The Initiative
Sime Darby Plantations is currently implementing initiatives on methane avoidance through composting. Sime
Darby is also implementing 11 methane capture and biogas projects, some of which are already operating and some
of which are in still in development. This case study will discuss the co-composting and methane capture initiative
implementation in Sime Darby, with more emphasis placed on co-composting since another case study focuses on
methane capture. The case study will highlight how these two BMPs can significantly reduce the bulk GHG emissions
in the CPO supply chain.
Motivation
Sime Darby’s co-composting project was initiated by the Research and Development Department to help achieve
zero discharge mills, although GHG emission reductions were also a primary driver for both co-composting and
methane capture efforts.
69 http://www.simedarbyplantation.com/corporate/overview/about-us
70 Greenhouse Gas Emission Reduction via Composting: Sime Darby’s Perspective: https://www.iscc-system.org/wp-
content/uploads/2017/05/Devi_Nair_Sime_Darby_TC_SEA_Jakarta_120815.pdf.
Sime Darby Facts in 2016 Land banks 988,599 ha Cultivation area 628,995 ha Number of mills 71 mills CPO production 2.4 million
tonnes/yr Number of employee 102,551

Compilation of BMPs to Reduce Emissions in Palm Oil Production Annexes: Detailed Case Studies 149
Execution
Sime Darby Plantation began piloting composting as a mill waste management initiative in 2004 initially with 5
plants, of which 4 were registered under the Clean Development Mechanism under the Kyoto Protocol that allowed
developed countries to invest in developing countries for the purpose of financing carbon emission reduction
projects. For the first four projects, Sime Darby worked with a third party vendor on a build-operate-transfer (BOT)
basis. In 2009, the BOT model was migrated to a concession scheme with third party vendors. Project
implementation was led by the upstream plantation division and coordinated by the sustainability department.
The carbon reductions from these composting projects belonged to Denmark via an Emission Reduction Purchase
Agreement (ERPA) with the Danish Ministry of Climate and Energy. The 4 composting projects generated Certified
Emission Reductions (CERs) from 2010 to the end of 2012, culminating in the delivery of more than 180,000 CERs
to Denmark. The four successful projects were among the first of their kind in Asia to achieve issuance of CERs. The
projects continue to be in operation as part of Sime Darby’s Carbon Reduction Strategy, along with 18 other
composting plants constructed since 2010, making up a total of 22 compost plants that produce about 500,000 mt
of compost per year. Considering infrastructure, resources, and anticipated challenges, this first phase of
development is focused in Malaysia.
Figure 50. Schematic Diagram of Co-composting process
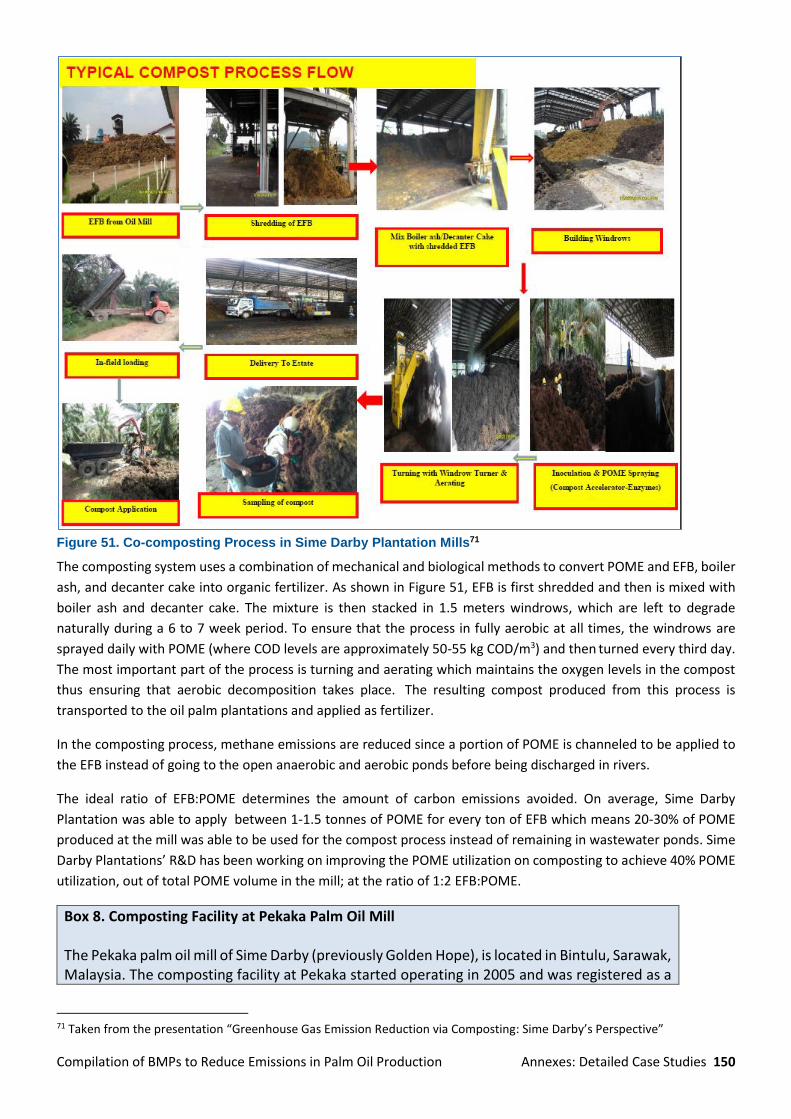
Compilation of BMPs to Reduce Emissions in Palm Oil Production Annexes: Detailed Case Studies 150
Figure 51. Co-composting Process in Sime Darby Plantation Mills71
The composting system uses a combination of mechanical and biological methods to convert POME and EFB, boiler
ash, and decanter cake into organic fertilizer. As shown in Figure 51, EFB is first shredded and then is mixed with
boiler ash and decanter cake. The mixture is then stacked in 1.5 meters windrows, which are left to degrade
naturally during a 6 to 7 week period. To ensure that the process in fully aerobic at all times, the windrows are
sprayed daily with POME (where COD levels are approximately 50-55 kg COD/m3) and then turned every third day.
The most important part of the process is turning and aerating which maintains the oxygen levels in the compost
thus ensuring that aerobic decomposition takes place. The resulting compost produced from this process is
transported to the oil palm plantations and applied as fertilizer.
In the composting process, methane emissions are reduced since a portion of POME is channeled to be applied to
the EFB instead of going to the open anaerobic and aerobic ponds before being discharged in rivers.
The ideal ratio of EFB:POME determines the amount of carbon emissions avoided. On average, Sime Darby
Plantation was able to apply between 1-1.5 tonnes of POME for every ton of EFB which means 20-30% of POME
produced at the mill was able to be used for the compost process instead of remaining in wastewater ponds. Sime
Darby Plantations’ R&D has been working on improving the POME utilization on composting to achieve 40% POME
utilization, out of total POME volume in the mill; at the ratio of 1:2 EFB:POME.
Box 8. Composting Facility at Pekaka Palm Oil Mill The Pekaka palm oil mill of Sime Darby (previously Golden Hope), is located in Bintulu, Sarawak, Malaysia. The composting facility at Pekaka started operating in 2005 and was registered as a
71 Taken from the presentation “Greenhouse Gas Emission Reduction via Composting: Sime Darby’s Perspective”
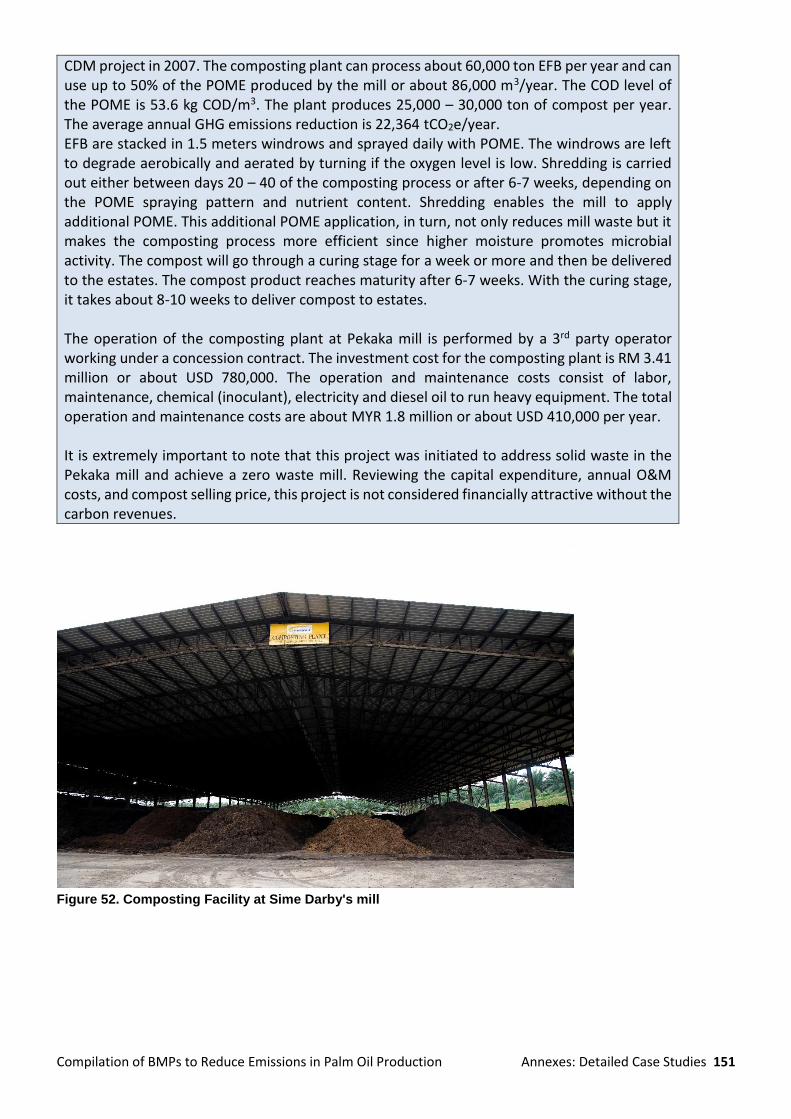
Compilation of BMPs to Reduce Emissions in Palm Oil Production Annexes: Detailed Case Studies 151
CDM project in 2007. The composting plant can process about 60,000 ton EFB per year and can use up to 50% of the POME produced by the mill or about 86,000 m3/year. The COD level of the POME is 53.6 kg COD/m3. The plant produces 25,000 – 30,000 ton of compost per year. The average annual GHG emissions reduction is 22,364 tCO2e/year. EFB are stacked in 1.5 meters windrows and sprayed daily with POME. The windrows are left to degrade aerobically and aerated by turning if the oxygen level is low. Shredding is carried out either between days 20 – 40 of the composting process or after 6-7 weeks, depending on the POME spraying pattern and nutrient content. Shredding enables the mill to apply additional POME. This additional POME application, in turn, not only reduces mill waste but it makes the composting process more efficient since higher moisture promotes microbial activity. The compost will go through a curing stage for a week or more and then be delivered to the estates. The compost product reaches maturity after 6-7 weeks. With the curing stage, it takes about 8-10 weeks to deliver compost to estates. The operation of the composting plant at Pekaka mill is performed by a 3rd party operator working under a concession contract. The investment cost for the composting plant is RM 3.41 million or about USD 780,000. The operation and maintenance costs consist of labor, maintenance, chemical (inoculant), electricity and diesel oil to run heavy equipment. The total operation and maintenance costs are about MYR 1.8 million or about USD 410,000 per year. It is extremely important to note that this project was initiated to address solid waste in the Pekaka mill and achieve a zero waste mill. Reviewing the capital expenditure, annual O&M costs, and compost selling price, this project is not considered financially attractive without the carbon revenues.
Figure 52. Composting Facility at Sime Darby's mill

Compilation of BMPs to Reduce Emissions in Palm Oil Production Annexes: Detailed Case Studies 152
Figure 53. Heavy Equipment is employed to turn Windrows
Box 9. Composting & Biogas Case study at the Flemington Oil Mill The Flemington Oil Mill, with a 60 tonnes per hour (tph) capacity, is one of the first of SDP’s oil mills to incorporate both methane avoidance and capture in its operations. Its compost plant started operating in 2011 as part of SDP’s expansion of the composting projects from 5 to 22 plants. In 2013, the Flemington compost plant was turned into an R&D plant mainly aimed at improving both the quality of the final product and the efficiency of the composting process. The compost plant currently produces 10,000Mt of compost annually with an average emission reduction of 5,000Mt CO2e/year. December 2016 marked the start of full-scale operations of Flemington Biogas plant, a joint venture project between SDP and Tenaga Nasional Bhd (TNB). The biogas plant is capable of utilizing an average of 80% of the mill’s annual POME produced, in which the resulting biogas is used for electricity generation and sold back to the grid through the national feed-in tariff (FIT) mechanism. In 2017, the plant utilized 113,000Mt of POME which generated 6.5GWh of electricity and an estimated emission reduction of 29,000Mt CO2e; a 64% reduction of the mills emissions. Co-composting and methane capture in Flemington oil mill has led to total emission reductions of about 75% of the mill’s emissions.
Resource requirements
The investment to start a co-compost plant can range from about USD 1.3 million to USD 2.3 million, depending on
the infrastructure and machineries used. Operation and maintenance costs typically consist of salary, maintenance,
and fuel costs to run the equipment. The plant can be operated as part of the mill operations or be outsourced to
3rd party vendors. Plant supervisors lead the plant operation and supervise 10-15 semi-skilled workers and qualified
heavy machinery drivers. Alternatively, the operations component of manpower management can be outsourced.
Stakeholder involvement
SDP worked with third party vendors to construct and operate the composting plants. All composting projects is
approved by Department of Environment as the initiative is recognized as part of mill waste managing process.

Compilation of BMPs to Reduce Emissions in Palm Oil Production Annexes: Detailed Case Studies 153
Estimated GHG emission reductions
As of 2015, composting projects in Malaysia have successfully reduced carbon emission intensity by 6.5% when
compared to the 2009 baseline. Carbon intensity gradually decreased from 1.06 tCO2e/mt CPO in 2009 to 1.02
tCO2e/mt CPO by 2015.
Under CDM guidance, the project falls under AMS-III.F.ver 3 - Avoidance of methane production from biomass
decay through composting. The key data collected for this emission includes FFB produced, EFB generated, POME
uptake, chemical oxygen demand analysis records of POME, oxygen level readings, diesel consumption records,
POME runoff volume and COD analysis.
On average, the 22 compost plants have been able to generate a reduction of approximately 200,000 MT of
CO2e per year with average EFB:POME ratio of 1:1.5. However, the percentage reduction is less than 10% of total
emission intensity, per ton of CPO. Data are monitored and collected to calculate GHG emission reductions of
composting projects using the CDM methodology. Sime Darby had adopted GHG Protocol before the RSPO Palm
Oil GHG Calculator was introduced. Both GHG Protocol and RSPO GHG Calculator are now used to calculate the
emissions from the overall supply chain, whereas AMS-III.F ver 3 is still applied to calculate GHG emissions reduction
from the composting projects.
These estimates only consider GHG reductions from mill operations. It is important to mention that, while not
quantified, further GHG reductions could possibly occur due to the displacement of synthetic N fertilizer
application. The IPCC 2006 guidelines72 do not differentiate between organic and synthetic N on the basis of their
potential to generate N2O per unit of N applied. However, if an organic N fertilization regimen permits a reduction
in total N applied per hectare when compared to synthetic N, this change would be expected to produce a reduction
in N2O roughly proportional to the reduction in applied N. If N application rates remain consistent between
synthetic and organic sources, a reduction in N2O is still possible, but would depend on a complex and site-specific
interaction between soil conditions, biota, and management practice, that are not yet captured in IPCC guidelines.
Other Benefits
In addition to GHG emissions reduction purpose, composting and methane capture as best management practices
provides multiple benefits to the overall CPO production as identified in Table 39.
Table 39. Other benefits of co-composting and methane capture
Benefits Co-
composting
Methane
Capture
Reduce solid and liquid wastes in mill, thus improve the air quality and aesthetic of mill area √ √
Compost application could improve soil conditions √
Cost savings from not applying inorganic fertilizer √
Energy generation from biogas conversion √
Lessons learned and recommendations
Methane avoidance via composting is a medium to high cost
investment depending on the technology and equipment used.
The pre-requisite of turning and aeration can be done via simple
machinery such as shovel and backhoe or with proper equipment
such as a turner.
Typically 20% of POME utilization or at EFB:POME ratio of 1:1 is the comfortable level as a higher POME intake will
affect the moisture content of the final product or prolong the processing time to greater than 100 days. The
compost can be further enhanced by fortifying it with inorganic fertilizer that is pelletized for easy application and
72 IPCC 2006 v. 4 ch. 11, equation 11.1
“The composting project serves as a stepping stone for Sime Darby Plantation in its emission reduction strategy.”
Mr. Tang Men Kon, Head of PSQM
Compilation of BMPs to Reduce Emissions in Palm Oil Production Annexes: Detailed Case Studies 154
handling. In this way, the usage of inorganic fertilizer can be reduced and the application can be spread to larger
areas. In the process of co-composting development, Sime Darby faced different challenges in each stage of
development (Table 40).
Table 40. Lessons Learned
Phases Challenges Sime Darby’s solution
Preparation & budgeting
Sourcing for the right technology and infrastructure as there a range of technology providers that provide from simple to high tech systems
To choose a technology that is effective in ensuring easy maintenance and minimum breakdown.
Construction Meeting the project schedule and avoid cost overrun Monitoring the project progress and working with reputable vendors with experience
Operation Training and retaining local workers
Outsourcing the job to contract workers is more effective
The EFB uptake and compost evacuation can be hindered by poor weather which leads to backlog of EFB and compost.
Planning and dedicated evacuation team is essential, preferably mechanized application but is limited to flat terrain.
Consistently maintain the POME –EFB ratio without affecting the compost quality – nutrient content and moisture content
Regular testing and having a monitoring mechanism is essential
While inclusion of both methane avoidance and capture is ideal environmentally, the implementation and
operation of the said setup will likely be costly. Because of this costliness, exploring scenarios of biogas utilization
is an important step that the mill needs to carry out. Biogas utilization will depend on the specific needs and location
of the project site be it profit-bearing in more accessible areas (e.g. FIT, Bio-CNG) or cost reduction for electricity
generation for more rural areas.
Acknowledgements
Winrock thanks Shylaja Devi Vasudevan Nair and Amir Afham Abdullah of Sime Darby for reviewing and providing
feedback on the report.

Compilation of BMPs to Reduce Emissions in Palm Oil Production Annexes: Detailed Case Studies 155
RSPO SECRETARIAT SDN BHD (787510-K) Unit A-37-1, Level 37, Tower A, Menara UOA Bangsar No. 5 Jalan Bangsar Utama 1, 59000 Kuala Lumpur
T +603 2302 1500 (ext 102)
F +603 2302 1542