competitiveness beacon hill institute 2002 hill institute for public policy research suffolk...
TRANSCRIPT

Bea
con
Hill
Inst
itut
e Metro Area and StateCompetitiveness
Report2002
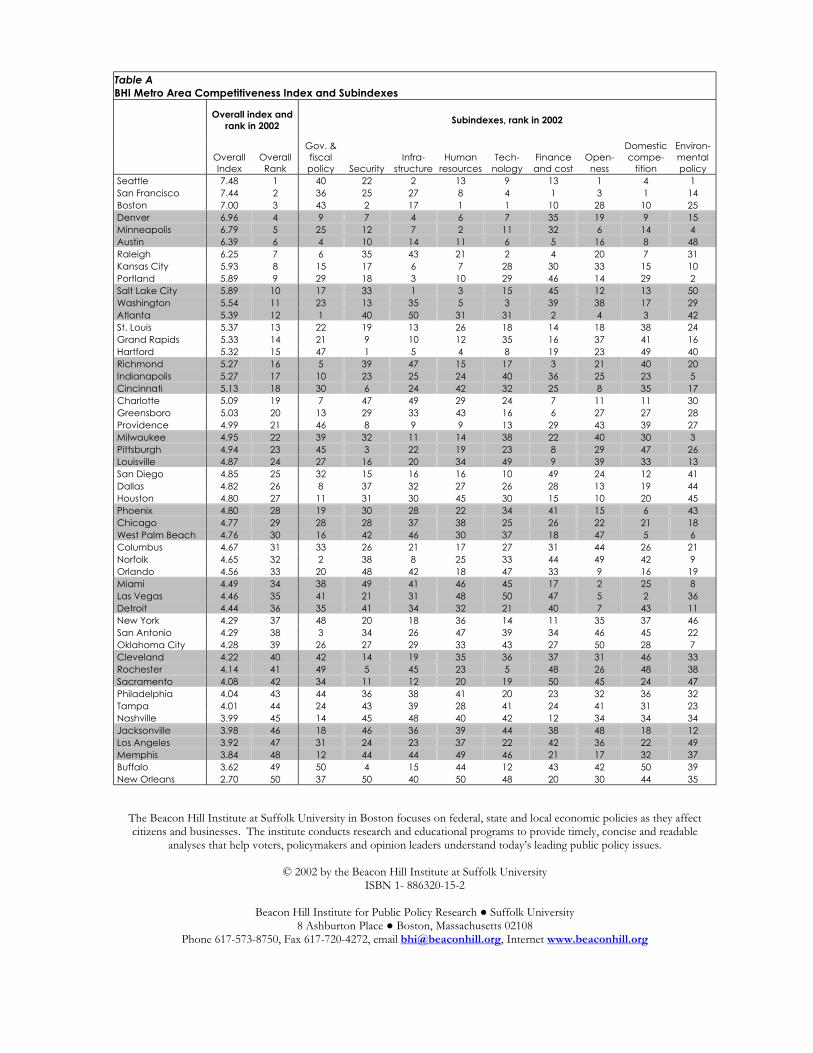
Table A
BHI Metro Area Competitiveness Index and Subindexes
Overall index and
rank in 2002 Subindexes, rank in 2002
Overall
Index
Overall
Rank
Gov. &
fiscal
policy Security
Infra-
structure
Human
resources
Tech-
nology
Finance
and cost
Open-
ness
Domestic
compe-
tition
Environ-
mental
policy
Seattle 7.48 1 40 22 2 13 9 13 1 4 1
San Francisco 7.44 2 36 25 27 8 4 1 3 1 14
Boston 7.00 3 43 2 17 1 1 10 28 10 25
Denver 6.96 4 9 7 4 6 7 35 19 9 15
Minneapolis 6.79 5 25 12 7 2 11 32 6 14 4
Austin 6.39 6 4 10 14 11 6 5 16 8 48
Raleigh 6.25 7 6 35 43 21 2 4 20 7 31
Kansas City 5.93 8 15 17 6 7 28 30 33 15 10
Portland 5.89 9 29 18 3 10 29 46 14 29 2
Salt Lake City 5.89 10 17 33 1 3 15 45 12 13 50
Washington 5.54 11 23 13 35 5 3 39 38 17 29
Atlanta 5.39 12 1 40 50 31 31 2 4 3 42
St. Louis 5.37 13 22 19 13 26 18 14 18 38 24
Grand Rapids 5.33 14 21 9 10 12 35 16 37 41 16
Hartford 5.32 15 47 1 5 4 8 19 23 49 40
Richmond 5.27 16 5 39 47 15 17 3 21 40 20
Indianapolis 5.27 17 10 23 25 24 40 36 25 23 5
Cincinnati 5.13 18 30 6 24 42 32 25 8 35 17
Charlotte 5.09 19 7 47 49 29 24 7 11 11 30
Greensboro 5.03 20 13 29 33 43 16 6 27 27 28
Providence 4.99 21 46 8 9 9 13 29 43 39 27
Milwaukee 4.95 22 39 32 11 14 38 22 40 30 3
Pittsburgh 4.94 23 45 3 22 19 23 8 29 47 26
Louisville 4.87 24 27 16 20 34 49 9 39 33 13
San Diego 4.85 25 32 15 16 16 10 49 24 12 41
Dallas 4.82 26 8 37 32 27 26 28 13 19 44
Houston 4.80 27 11 31 30 45 30 15 10 20 45
Phoenix 4.80 28 19 30 28 22 34 41 15 6 43
Chicago 4.77 29 28 28 37 38 25 26 22 21 18
West Palm Beach 4.76 30 16 42 46 30 37 18 47 5 6
Columbus 4.67 31 33 26 21 17 27 31 44 26 21
Norfolk 4.65 32 2 38 8 25 33 44 49 42 9
Orlando 4.56 33 20 48 42 18 47 33 9 16 19
Miami 4.49 34 38 49 41 46 45 17 2 25 8
Las Vegas 4.46 35 41 21 31 48 50 47 5 2 36
Detroit 4.44 36 35 41 34 32 21 40 7 43 11
New York 4.29 37 48 20 18 36 14 11 35 37 46
San Antonio 4.29 38 3 34 26 47 39 34 46 45 22
Oklahoma City 4.28 39 26 27 29 33 43 27 50 28 7
Cleveland 4.22 40 42 14 19 35 36 37 31 46 33
Rochester 4.14 41 49 5 45 23 5 48 26 48 38
Sacramento 4.08 42 34 11 12 20 19 50 45 24 47
Philadelphia 4.04 43 44 36 38 41 20 23 32 36 32
Tampa 4.01 44 24 43 39 28 41 24 41 31 23
Nashville 3.99 45 14 45 48 40 42 12 34 34 34
Jacksonville 3.98 46 18 46 36 39 44 38 48 18 12
Los Angeles 3.92 47 31 24 23 37 22 42 36 22 49
Memphis 3.84 48 12 44 44 49 46 21 17 32 37
Buffalo 3.62 49 50 4 15 44 12 43 42 50 39
New Orleans 2.70 50 37 50 40 50 48 20 30 44 35
The Beacon Hill Institute at Suffolk University in Boston focuses on federal, state and local economic policies as they affect citizens and businesses. The institute conducts research and educational programs to provide timely, concise and readable
analyses that help voters, policymakers and opinion leaders understand today’s leading public policy issues.
© 2002 by the Beacon Hill Institute at Suffolk University ISBN 1- 886320-15-2
Beacon Hill Institute for Public Policy Research Suffolk University
8 Ashburton Place Boston, Massachusetts 02108 Phone 617-573-8750, Fax 617-720-4272, email [email protected], Internet www.beaconhill.org

From the E
xecutive Director
BH
IFrom the Executive Director
The Beacon Hill Institute at Suffolk University is pleased to release its Metro Area and
State Competitiveness Report, 2002. In this follow up to the State Competitiveness
Report, 2001 we focus on the competitiveness of the fifty largest metro areas in the
country. In this new section, we combine dozens of objectively measurable variables into
nine subindexes that we then aggregate into the Metro Area Competitiveness Index.
From this index we create a ranking of the fifty metro areas according to their relative
competitiveness.
Interestingly, the top ten metro areas are quite geographically diverse. Metro areas from
both coasts, from Middle America and from the North and the South are all competing
effectively for business. It is our hope that presenting the Index results for each metro
area will provide insight to voters, businesspeople and policymakers about the strengths
and weaknesses of their own metro area.
We also provide an update of last year’s analysis of state competitiveness. We find little
change from 2001 to 2002 in the top ten states. California is out, dropping to 16th
, and
Oregon is in, moving up from 13th
. We also find only minor shifts among the bottom ten
states. There is, however, much movement in the middle 30 states. Most notably,
Pennsylvania jumps up ten places to rank 27th
and Alaska drops 12 to rank 34th
. A
summary of the state findings and a complete state ranking are available at the back of
this report.
The Institute would like to thank authors Jonathan Haughton and Corina Murg, along
with their research team, for their dedicated work on this project.
We hope that this analysis will inspire and aid discussion and debate on why some metro
areas and states are more competitive and how others can improve their own
competitiveness by utilizing more effectively the resources available to them.
David G. Tuerck

BH
I
Metro Area and State Competitiveness Report / Page 4

Table of Contents
BH
I
Metro Area and State Competitiveness Report / Page 5
Table of Contents
The BHI Metro Area Competitiveness Index 2002………………………………………………………………………………….…………….…………. 5
How to Read Index Pages………………………………………………………………………………………………………………….…………….………… 15
Metro Area Profiles
Atlanta……………………………………………………………………………………………………………………….………………………………… 17
Austin………………………………………………………………………………………………………………………….………………………………. 18
Boston…………………………………………………………………………………………………………………………….……………………………. 19
Buffalo…………………………………………………………………………………………………………………………………….…………………… 20
Charlotte………………………………………………………………………………………………………………………………….……………………. 21
Chicago…………………………………………………………………………………………………………………………………….…………………... 22
Cincinnati………………………………………………………………………………………………………………………………………………………. 23
Cleveland………………………………………………………………………………………………………………………………….…………………… 24
Columbus………………………………………………………………………………………………………………………………………………………. 25
Dallas…………………………………………………………………………………………………………………………….…………………………….. 26
Denver…………………………………………………………………………………………………………………………………….…………………… 27
Detroit…………………………………………………………………………………………………………………………….……………………………. 28
Grand Rapids…………………………………………………………………………………………………………………….…………………………….. 29
Greensboro…………………………………………………………………………………………………………………….………………………………. 30
Hartford………………………………………………………………………………………………………………………….…………………………….. 31
Houston………………………………………………………………………………………………………………………….…………………………….. 32
Indianapolis…………………………………………………………………………………………………………………….……………………………… 33
Jacksonville……………………………………………………………………………………………………………………………………………………. 34
Kansas City………………………………………………………………………………………………………………….…………………………………. 35
Las Vegas……………………………………………………………………………………………………………………………………………………… 36
Los Angeles……………………………………………………………………………………………………………….…………………............................ 37
Louisville………………………………………………………………………………………………………………….…………………............................ 38
Memphis………………………………………………………………………………………………………………………………………………………. 39
Miami………………………………………………………………………………………………………………….………………………………………. 40
Milwaukee……………………………………………………………………………………………………………………………………………………... 41
Minneapolis……………………………………………………………………………………………………………………………………………………. 42
Nashville………………………………………………………………………………………………………………………………………………………. 43
New Orleans……………………………………………………………………………………………………………………………….…………………... 44
New York……………………………………………………………………………………………………………………………………………………… 45
Norfolk………………………………………………………………………………………………………………………………………………………… 46
Oklahoma City………………………………………………………………………………………………………………………………………………… 47
Orlando………………………………………………………………………………………………………………………………………………………… 48
Philadelphia……………………………………………………………………………………………………………………………………………………. 49
Phoenix………………………………………………………………………………………………………………………………………………………… 50
Pittsburgh……………………………………………………………………………………………………………………………………………………… 51
Portland………………………………………………………………………………………………………………………………………………………… 52
Providence……………………………………………………………………………………………………………………………………………………... 53
Raleigh…………………………………………………………………………………………………………….…………………………………………… 54
Richmond………………………………………………………………………………………………………….…………………………………………… 55
Rochester………………………………………………………………………………………………………………………………………………………. 56
Sacramento…………………………………………………………………………………………………………………………………………………….. 57
Salt Lake City………………………………………………………………………………………………………………………………………………….. 58
San Antonio………………………………………………………………………………………………………….………………………………………… 59
San Diego……………………………………………………………………………………………………………………………………………………… 60
San Francisco…………………………………………………………………………………………………….……………………………………………. 61
Seattle…………………………………………………………………………………………………………….……………………………………………. 62
St. Louis……………………………………………………………………………………………………………………………………………………….. 63
Tampa…………………………………………………………………………………………………………………………………….……………………. 64
Washington……………………………………………………………………………………………………….……………………………………………. 65
West Palm Beach……………………………………………………………………………………………….……………………………………………… 66
Data Charts…………………………………………………………………………………………………………….……………………………………..……….. 68
Government and fiscal policy…………………………………………………………………………………………………………………………………. 69
Security………………………………………………………………………………………………………….………………………….………………….. 71
Infrastructure……………………………………………………………………………….………………………………………………………………….. 73
Human resources………………………………………………………………………….…………………………………………………………………… 76
Technology…………………………………………………………………………………………………………………………….………………………. 81
Finance and cost……………………………………………………………………………………………………………………….………………………. 84
Openness…………………………………………………………………………………………………………….……………………….………………… 85
Domestic competition…………………………………………………………………………………………………………………………………………. 86
Environmental policy………………………………………………………………………………………………………………….………………………. 88
Largest 50 Metro Areas: Population and Abbreviations…………………...…………………………………………….………………………………. 90
The BHI State Competitiveness Index 2002…………………………………………………………………………………………….…….……………….. 91

BH
I
Metro Area and State Competitiveness Report / Page 6

The Metro Area Competitiveness Index 2002
Introducing the index
What do Seattle, San Francisco, Boston, Denver
and Minneapolis have in common? The answer
is that all five metro areas have Competitiveness
Index scores greater than 6.5. By this measure
they are the most competitive urban areas in the
country.
But what is meant by competitiveness? How can
it be measured? And what standard should be
used to determine whether a metro area is
competitive or not?
In the course of answering these questions we
developed and estimated an index of
competitiveness for the 50 largest metro areas in
the country. The Metro Area Competitiveness
Index is designed to measure the long-term
competitiveness of a metro area, and uses a
similar approach to the one taken in our earlier
study of state competitiveness (State
Competitiveness Report 2001).
The Metro Area Competitiveness Index ranks
Seattle as the most competitive metro area, with
a score of 7.48 on a scale of 0 (utterly
uncompetitive) to 10 (extremely competitive).
San Francisco and Boston are in second and
third place respectively, as Table 1 shows. At
the bottom, Buffalo and New Orleans have
indexes below 3.7. By construction, the mean
value of the index is 5 and its standard deviation
is 1.
Table 1
Metro Area Competitiveness Index
Index Rank
Seattle 7.48 1
San Francisco 7.44 2
Boston 7.00 3
Denver 6.96 4
Minneapolis 6.79 5
Austin 6.39 6
Raleigh 6.25 7
Kansas City 5.93 8
Portland 5.89 9
Salt Lake City 5.89 10
Washington 5.54 11
Atlanta 5.39 12
St. Louis 5.37 13
Grand Rapids 5.33 14
Hartford 5.32 15
Richmond 5.27 16
Indianapolis 5.27 17
Cincinnati 5.13 18
Charlotte 5.09 19
Greensboro 5.03 20
Providence 4.99 21
Milwaukee 4.95 22
Pittsburgh 4.94 23
Louisville 4.87 24
San Diego 4.85 25
Dallas 4.82 26
Phoenix 4.80 27
Houston 4.80 28
Chicago 4.77 29
West Palm Beach 4.76 30
Columbus 4.67 31
Norfolk 4.65 32
Orlando 4.56 33
Miami 4.49 34
Las Vegas 4.46 35
Detroit 4.44 36
New York 4.29 37
San Antonio 4.29 38
Oklahoma City 4.28 39
Cleveland 4.22 40
Rochester 4.14 41
Sacramento 4.08 42
Philadelphia 4.03 43
Tampa 4.01 44
Nashville 3.99 45
Jacksonville 3.98 46
Los Angeles 3.92 47
Memphis 3.84 48
Buffalo 3.62 49
New Orleans 2.70 50
No two metro areas have the same Index score. Matching indexes in
this table are due to rounding for presentation.
Defining M
etro Area and State C
ompetitiveness
BH
I
Metro Area and State Competitiveness Report / Page 7

What is competitiveness?
We consider a metro area to be competitive if it
has in place the policies and conditions that
ensure and sustain a high level of per capita
income and its continued growth. To achieve
this, a metro area needs to be able both to attract
and incubate new businesses and to provide an
environment that is conducive to the growth of
existing firms.
Competitiveness may be thought of as a catchall
term that covers what Michael Porter calls “the
microeconomic foundations of prosperity.”1 The
metro areas of the United States all face the
same macroeconomic conditions; where they
differ is in their microeconomic policies. These
policies matter. As Porter puts it, “wealth is
actually created at the microeconomic level … -
in the ability of firms to create valuable goods
and services using productive methods” (p.40).
It follows that the outcome of competitiveness is
greater affluence, measured by higher levels of
real gross metropolitan product or personal
income per capita.
Quantifying competitiveness
To be useful as a concept, it is essential to have
an operational measure of competitiveness, a
measure that aggregates the key microeconomic
variables into a single index. The World
Economic Forum does this for the countries of
the world in its influential annual Global
Competitiveness Reports, but there is no
equivalent at the level of the metro areas of the
U.S. (although some more specialized rankings of
metro areas have been developed; we discuss
these in more detail below).
In thinking about how to create an index of
competitiveness, we begin with the simple
economic relation:
Y = f(K,L,technology).
This says that output (Y) depends on the amount
of capital (K), labor (L) and technology that is
harnessed by the economy.2 Not surprisingly,
more inputs lead to more output. But what raises
input levels? And why do some metro areas mix
the ingredients more successfully than others?
To answer these questions we need to focus on
the quality of the business environment. Using
his celebrated “diamond,” Porter finds it helpful
to group the influences into four components:
the quality of available inputs, the sophistication
of local demand, the nature of local suppliers and
the extent to which they form clusters, and the
rules and institutions that govern the market.3
These are still very broad categories and so,
following the Porter-inspired Global
Competitiveness Report, we actually classify our
indicators into nine groups. The first two groups
refer to institutions, the next four to the quality
of inputs, and the last three to the nature of local
demand. The breakdown is as follows:
Def
inin
g M
etro
Are
a an
d St
ate
Com
peti
tive
ness
BH
I
Metro Area and State Competitiveness Report / Page 8

Metro Area and State Competitiveness Report / Page 9
Defining M
etro Area and State C
ompetitiveness
BH
IGovernment and Fiscal Policy. Businesses are
more likely to be attracted to areas with
moderate tax rates and clear evidence of
financial discipline (as evidenced, for
instance, by high state and municipal bond
ratings). This subindex is designed to pick
up these effects.
Security. A metro area will be more attractive to
business if the legal system is sympathetic to
business concerns, if public officials are
trusted, if the regulatory burden is light, and
if crime is low. The security subindex
addresses these dimensions of
competitiveness, with particular emphasis on
the importance of public safety.
Infrastructure. How easy is commuting? Do most
households use the Internet? Is housing
affordable? These are the elements of
competitiveness that are included in the
infrastructure subindex for each metro area.
Human Resources. A high level of labor force
participation, and skilled labor that is readily
available and not too expensive, combined
with a widespread commitment to
education, training and health care, make a
metro area attractive for business. These
factors are captured in the human resources
subindex, which in turn is based on ten
primary data series.
Technology. The development and application of
technology is central to economic
development, and has been ever since the
industrial revolution. The technology
subindex measures this by taking into
account research funding, patents issued,
the proportion of scientists and engineers in
the labor force, and the importance of high-
tech companies.
Finance and Cost. A good idea is not enough;
businesses also need to be able to mobilize
financing for investment, both internally and
from the financial system. The finance and
cost index measures these factors. However,
competitiveness is impaired if prices are
high, which is why the cost of living is also
included in this subindex.
Openness. Open economies tend to be more
competitive and hence more productive.
The openness subindex measures how
connected the firms and people in a metro
area are with the rest of the world. It is
based on the level of exports, as well as the
number of air passengers, per capita.
Domestic Competition. A higher rate of business
births is a particularly clear sign of a
competitive environment, and is an
important component of the domestic
competition subindex. This index also
incorporates the Cognetics “entrepreneurial
hot spots” index. 4

Def
inin
g M
etro
Are
a an
d St
ate
Com
peti
tive
ness
Metro Area and State Competitiveness Report / Page 10
BH
I Environmental Policy. Metro areas that are faced
with environmental problems, or that have a
heavy-handed policy of environmental
regulation, are likely to be less attractive to
businesses as well as to their workers and
managers; we measure this effect with the
environmental policy subindex, which
among other things reflects the levels of air
pollution and of toxic releases.
A complete list of the components of each
subindex is given in Table 2 at the end of this
section of the report. The data used to compute
the indexes are shown in an appendix to the
report. We have used the most recent data
available; due to time lags, most of the series
refer to 2000 or 2001.
The nine categories are coherent, but there is
inevitably some degree of arbitrariness in the way
in which individual data series are assigned to
the subindexes. For instance, the amount of air
travel could be included in the infrastructure
subindex or the measure of openness; and
electricity prices could be included in the
infrastructure subindex or the environmental
subindex. In practice the assignment of the data
series is much less important than the fact that
they are included at all.
A competitiveness index is simply a summary
measure based on a large number of variables.
The difficult, and controversial, part is choosing
a weighting scheme. Our approach is the
simplest and most transparent: within each
subindex, each variable carries equal weight.
Technical note 1:
Creating the indexes
Given the raw data series for each metro area,
several steps were needed in order to construct
the Competitiveness Index.
1. First, each variable was normalized to give it
a mean of 5, a standard deviation of 1, and a
range from 0 (worst) to 10 (best).
2. Then the nine subindexes were formed as
the simple averages of the normalized
component variables.
3. Next, the subindexes themselves were
normalized, again giving a mean of 5 and
standard deviation of 1 to each. These are
presented in Table A, inside the front cover.
4. Finally, the overall index of metro area
competitiveness is calculated as the simple
average of the nine subindexes, again
normalizing it so it has a mean of 5 and
standard deviation of 1. In practice, the
Competitiveness Index ranged from a low of
2.70 to a high of 7.48.
Then each subindex is given the same weight
when constructing the overall index. This has
been referred to as a “democratic” weighting
structure, but it is of course arbitrary (although
reasonable).

Metro Area and State Competitiveness Report / Page 11
Defining M
etro Area and State C
ompetitiveness
BH
I
Is the Competitiveness Index useful?
Does the index of metro area competitiveness
explain affluence and growth? If the index is
properly constructed, then it alone should go a
long way towards explaining why some metro
areas are affluent and others are not. A simple
way to show the relationship is with the scatter
plot in Figure 1: the vertical axis shows real
personal income per capita while the
Competitiveness Index is on the horizontal axis.5
Also shown in Figure 1 is the best-fit regression
line, which is given by
Real personal income/capita
= 21,105 + 2,226 Competitiveness Index.
t=8.2 t=4.4
This equation has an R2 of 0.29, which means
that more than a quarter of the variation in real
personal income per capita from metro area to
metro area is attributable to variations in the
Metro Area Competitiveness Index alone.
Competitiveness really does matter.
Figure 1
The effect of competitiveness on metro area real personal income per capita
y = 21105 + 2226.3x
R2 = 0.29
0
5,000
10,000
15,000
20,000
25,000
30,000
35,000
40,000
45,000
50,000
0.00 1.00 2.00 3.00 4.00 5.00 6.00 7.00 8.00
Metro Area Competitiveness Index
Me
tro
Are
a R
ea
l P
I p
er
ca
pit
a,
$,
20
00
The Competitiveness Index also has a surprisingly
strong correlation with the growth rate of
personal income per capita between 1990 and
2000 (R2=0.32), with a higher index associated
with a significantly faster increase in per capita
income. This result is important, because growth
rates are notoriously difficult to “explain,”
particularly with single variables such as the
Competitiveness Index. In the short-run the
growth of a given metro area is likely to be
strongly influenced by local factors – a boom in
the auto industry, or a drop in research spending,
for instance – which obscure the more
fundamental issue of competitiveness.6

Def
inin
g M
etro
Are
a an
d St
ate
Com
peti
tive
ness
BH
I
State Competitiveness Report/Page 10Metro Area and State Competitiveness Report / Page 12
Putting the Competitiveness Index to work
What do we learn from this exercise? Naturally
it is interesting to look at the raw rankings
(Table 1), but this may not be the most
important use of the information. The detailed
data, both in individual variables and the
subindexes, allow one to identify the determinants
of competitiveness. This is of value to policy
makers, who are then in a better position to
identify what needs to be done in order to
improve the position of their metro areas.
The logic behind this is that a higher
Competitiveness Index is associated with greater
affluence. A reasonable inference is that if one
were to improve competitiveness, then residents
of the metro area would be better off. And the
greatest upside potential is for the indicators
whose performance is currently weak. For
instance, a low-crime metro area may have
trouble reducing the crime rate further, while for
a high-crime metro area, efforts to reduce crime
are likely to be an efficient way to boost
competitiveness.
To illustrate, consider the case of Dallas-
Arlington-Fort Worth, Texas, which ranks 26th
with a competitiveness index of 4.8. A major
strength is the low fiscal burden in Texas, and
fiscal discipline, as evidenced by above-average
bond ratings for the state and metro area. At the
other extreme, the metro area scores low on the
environmental subindex, mainly because of the
serious air pollution. It scores somewhat above
average on openness and on competition, but
does poorly on security and infrastructure.
To make it easier to identify the strengths and
weaknesses of each metro area, a subsequent
section of this report sets out the relevant details
for each area, along with brief metro area-specific
commentaries.
Other studies
We are not the first to develop a set of metro
area indexes, but we are the first to create a
broad-based index of competitiveness, and to
design and present it in a way that policy makers
will find useful.
Robert D. Atkinson of the Progressive Policy
Institute and Paul D. Gottlieb of the Center for
Regional Economic Issues have created a
Metropolitan New Economy Index, which uses
sixteen economic indicators “to assess the 50
largest metropolitan areas’ progress as they adapt
to the new economic order” (p.3).7 They view
the characteristics of the New Economy as an
altered industrial and occupational order, greater
globalization, and “unprecedented levels of
entrepreneurial dynamism and competition.”
Their measures emphasize education,
information flows, the growth of new firms, and
technology.
We include many similar variables, which helps
explain why eight of the top ten metro areas are
the same for the two studies (although there is
more disagreement at the bottom end).

BH
I
Metro Area and State Competitiveness Report / Page 13
Defining M
etro Area and State C
ompetitiveness
However, we also believe that there are other
important dimensions to competitiveness – and
hence to achieving and maintaining affluence –
such as the tax burden, public safety, and
environmental issues. This is why our index is
based on a wider set of variables.
In a somewhat different spirit, Money magazine
publishes an annual survey of the “best places to
live” in the United States. Using 31 variables
(including seven related to climate!), the
magazine’s web site allows readers to express
their preferences and then find the places that
best suit their needs, from a list of over 400
towns and cities. The survey is not, however,
designed to measure competitiveness per se.
Why metro areas?
This study reports the results for the 50 largest
metropolitan areas (metropolitan statistical areas
and consolidated metropolitan statistical areas).
Collectively they include 58% of the U.S.
population, and reflect the fact that the country
is overwhelmingly urban and suburban rather
than rural. Metropolitan areas are very coherent
economic units – they have common labor
markets, commuter pools, and newspaper
readership, indeed all the features that make up a
natural geographical area. In many respects it
makes more sense to consider Philadelphia and
Pittsburgh as separate economic units, than it
does to consider Pennsylvania as a single entity.
One alternative would have been to focus only
on the central cities in each urban area. The
disadvantage of this is that the central cities are
often quite small, and unrepresentative of the
greater urban area. For instance, the population
of the city of Boston, at 555,000, is less than one
tenth of the population of the metro area, which
came to 5.8 million in 2000. It is not clear how
helpful it would be to compare the city of Boston,
dense and highly urbanized, with the city of
Houston, which constitutes 89% of its metro area
and includes extensive suburbs.
A note on the states
The focus of our current study is the 50 largest
metro areas in the country. We have also revised
our earlier study on state competitiveness to
include the most recent data available.
Significant changes in one or more of the
variables that make up the overall index have
determined changes in the state rankings.
Consider the case of Pennsylvania where great
improvements in the domestic competition and
institutions and human resources subindexes
have pushed the state from an overall ranking of
37th in 2001 to an overall ranking of 27th in 2002.
For the readers interested in each state’s
performance in the State Competitiveness Index we
provide a detailed table with the overall index
and the rankings for each subindex inside the
back cover, and a brief comparison with 2001
rankings on page 91.

BH
I
Metro Area and State Competitiveness Report / Page 14State Competitive Index/Page 12State Competitiveness Report/Page 12Metro Area and State Competitiveness Report / Page 14
Def
inin
g M
etro
Are
a an
d St
ate
Com
peti
tive
ness
What next?
We invite you to pore over the detailed results
on the following pages. For each metro area we
set out the main competitive strengths and
weaknesses with a brief commentary.
ENDNOTES 1 Michael Porter, “The Current Competitiveness Index:
Measuring the Microeconomic Foundations of Prosperity,” in
World Economic Forum, The Global Competitiveness Report
2000, Oxford University Press, New York, 2000. 2 By dividing across by the population, this equation may also
be expressed in per capita terms; output per capita is a
standard measure of affluence. 3 Michael E. Porter, The Competitive Advantage of Nations,”
Free Press, New York, 1990. 4 Cognetics Inc., ”Corporate Demographics: Entrepreneurial
Hot Spots”, 2001. Measure of firms that started in the last 10
years that employ at least 5 people today, as a percent of all
firms, and percent of firms 10 years old or less four years ago
that had a Growth Index of at least 3 over the past 4 years.
The Growth Index is a firm's percent employment growth
times its absolute employment growth.
We welcome suggestions for ways in which we
might improve our search for answers to that
deceptively simple question: how competitive is
the Boston area (or the Bay area, or greater New
York, or Houston, or …)?
5 Prices vary from metro area to metro area. We deflate
personal income using the metro-level price indexes
estimated based on data from Statistical Abstract of the
United States and Taubman Center at Harvard University. 6 Higher values of the State Competitiveness Index are strongly
correlated with lower poverty rates (R2=0.30); if the
Competitiveness Index is one unit higher, the proportion of
people in poverty is 1.8 percentage points lower. Poverty
data at the metropolitan area are harder to get, but a similar
relationship is likely. 7 Robert Atkinson and Paul Gottlieb, The Metropolitan New
Economy Index, Progressive Policy Institute and Center for
Regional Economic Issues, April 2001.

Defining M
etro Area and State C
ompetitiveness
BH
I
Metro Area and State Competitiveness Report / Page 15
Table 2
Components of subindexes
Subindex BHI Metro Area Competitiveness Index Variable Explanation
Government and
fiscal policy
Taxes as % of current GSP (-)
Workers’ compensation collections per
employee (-)
Bond rating: S&P’s/Moody’s composite (+)
State bond rating (+)
Unemployment payments per unemployed
worker (-)
The greater the overall burden of taxes on a metro area’s
output, the less attractive that area is as a host for new
investment or workers.
High workers’ compensation collections per employee
increase business costs.
High metro area bond rating reflects fiscal responsibility
and an ability to secure funding for capital improvement
projects that promote growth.
High state bond rating increases confidence in state
budget managers and reduces interest burden on
taxpayers.
High unemployment benefits increase business costs by
raising the reservation wage.
Security
Crime index change, 1999-2000, % (-)
Violent crimes per 100,000 inhabitants (-)
Thefts per 100,000 inhabitants (-)
Murders per 100,000 inhabitants (-)
Growth in the crime rate suggests that crime, though
perhaps currently low, is on the rise.
High violent crime rate makes it more difficult to recruit
out-of-state workers, and increases business costs.
High theft rate drives up insurance premiums and business
costs.
High murder rate has the same effect as a high violent
crime rate.
Infrastructure
Mass transit availability (+)
% of households with computers (+)
% of households online (+)
Travel time to work (-)
Median household gross rent (-)
Availability of mass transportation is a way of reducing
traffic congestion, creating more efficiency in
transportation.
Level of computerization reflects computer literacy and
usage.
Internet access has the same effect as computerization.
Time spent in traffic is costly to business and discourages
workers from locating in metro area.
Rental costs reflect housing costs. Higher housing costs
make it more costly to recruit workers from out of area.
Human resources
% of population without health insurance (-)
High school finishers as % of 18-year olds (+)
% of population that graduated from high school
(+)
% of labor force represented by unions (-)
Unemployment rate (-)
Enrollment in degree-granting institutions per
capita (+)
% of adults in the labor force (+)
% of population born abroad (+)
A large number of uninsured suggests that health costs
are being passed on to taxpayers and that the health
care system is overburdened.
A young educated workforce will lead to greater
productivity over a longer period.
An educated workforce is a productive workforce.
Strong unions raise labor costs and hamper flexibility in
opening and closing plants and in adapting the
workforce to new tasks.
A high unemployment rate suggests that there are
rigidities in the labor market.
An educated workforce is a productive workforce.
The more adults in the labor force, the greater the labor
force and thus the number of workers available to be
employed.
The more foreigners relative to the native-born
population, the more motivated the workforce as a
whole is likely to be.

BH
I
Metro Area and State Competitiveness Report / Page 16
Infant mortality rate, deaths per 1,000 live births
(-)
Non-federal physicians per 100,000 inhabitants
(+)
A high infant-mortality rate suggests that there are
problems with the health care system. A strong health
care system makes it easier to attract workers and to
keep down business costs.
The more doctors there are in the state, the stronger the
health care system.
Technology
Academic R&D funding relative to employment
(+)
NIH support to institutions per capita (+)
New patents issued per 100,000 inhabitants(+)
Science and engineering graduate students per
capita (+)
Scientists and engineers as % of labor force (+)
High-tech payroll as % of total payroll (+)
Funding for research and development indicates strong
universities and gives promise of high-tech startups.
National Institutes of Health funding indicates the
existence of strong universities, hospitals and health care
system.
High number of patents indicates the existence of a
highly entrepreneurial environment and strong
innovation.
The greater the number of science and engineering
students, the greater the availability of workers essential
to high-tech firms. The stronger the high-tech sector, the
greater the prospects of economic growth.
The greater the number of scientists and engineers, the
greater the availability of workers essential to high-tech
firms. The more available are such workers, the less
expensive it will be to employ them.
High-tech payroll as % of total payroll indicates the
economy is better positioned for the future.
Finance and cost
Bank deposits per capita (+)
Venture capital as % of GMP (+)
Cost of living (-)
The greater bank deposits, the greater the financial
strength of persons and businesses. Also, the better
developed the financial sector.
Venture capital is important for startups. The more
venture capital, the more sophisticated the financial
environment.
Higher cost of living requires companies to pay higher
wages, which drives up the cost of business.
Openness
Exports per capita (+)
Air passengers per capita (+)
A strong export sector suggests that the metro area is
competitive with foreign countries as well as other metro
areas.
High air passenger flow is a sign of a developed
infrastructure and a strong business sector.
Domestic
competition
Net firm creation per 100,000 inhabitants (+)
Cognetics entrepreneurial hot spots index (+)
New publicly traded companies (+)
The greater the turnover of firms, the more robust the
competitive environment. New firm creation increases
employment.
Indicates a sustained entrepreneurial environment
fostering economic growth.
The increase of publicly traded companies indicates
strong growth in companies as well as an ability to reach
public markets and raise capital.
Environmental
policy
Electricity prices (-)
Toxic release, pounds per capita (-)
Pollution standards Index (-)
Serious pollution days p.a. (-)
Environmental policies that increase the price of
electricity discourage business investment.
The more toxic materials released into the environment
(as measured by the Environmental Protection Agency),
the less attractive the metro area as a place to live and
the greater the cost of doing business.
The higher the levels of pollution for major air pollutants,
the more serious the health effects and therefore the less
attractive the metro area as a place to live.
The greater the number of serious pollution days per year,
the less attractive the metro area as a place to live.
Note: + if positive effect on competitiveness, - if negative effect expected.
Def
inin
g M
etro
Are
a an
d St
ate
Com
peti
tive
ness
BH
I
Metro Area and State Competitiveness Report / Page 17
How
to read the index pages
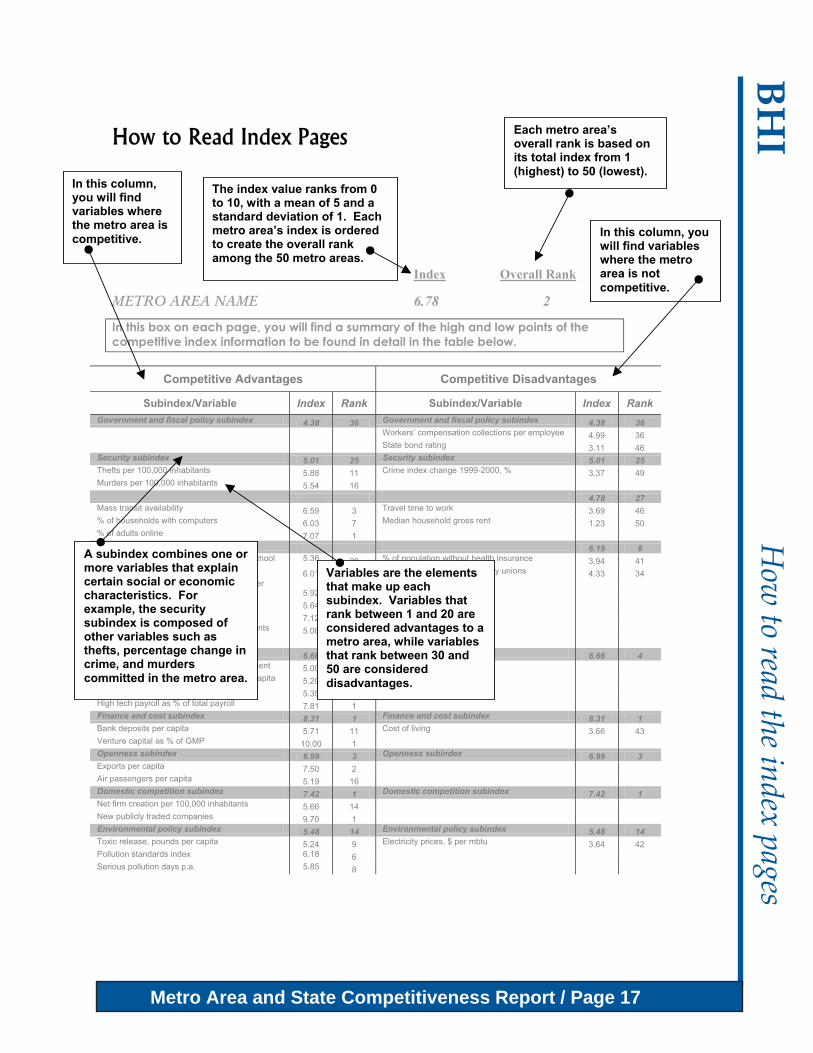
How to Read Index Pages
Index Overall Rank
METRO AREA NAME 6.78 2
Competitive Advantages Competitive Disadvantages
Subindex/Variable Index Rank Subindex/Variable Index Rank
Government and fiscal policy subindex 4.38 36 Government and fiscal policy subindex 4.38 36
Workers’ compensation collections per employee 4.99 36
State bond rating 3.11 46 Security subindex 5.01 25 Security subindex 5.01 25 Thefts per 100,000 inhabitants 5.88 11 Crime index change 1999-2000, % 3.37 49 Murders per 100,000 inhabitants 5.54 16 Infrastructure subindex 4.78 27 Infrastructure subindex 4.78 27 Mass transit availability 6.59 3 Travel time to work 3.69 46 % of households with computers 6.03 7 Median household gross rent 1.23 50 % of adults online 7.07 1 Human resources subindex 6.19 8 Human resources subindex 6.19 8 % of population that graduated from high school 5.36 20 % of population without health insurance 3.94 41 Unemployment rate 6.01 9 % of labor force represented by unions 4.33 34 Enrollment in degree-granting institutions per capita 5.92 7
% of adults in the labor force 5.64 13 % of population born abroad 7.12 3 Nonfederal physicians per 100,000 inhabitants 5.08 11 Technology subindex 6.66 4 Technology subindex 6.66 4 Academic R&D funding relative to employment 5.00 15 Science & engineering grad. students per capita 5.20 17 Scientists and engineers in the labor force 5.35 17 High tech payroll as % of total payroll 7.81 1 Finance and cost subindex 8.31 1 Finance and cost subindex 8.31 1 Bank deposits per capita 5.71 11 Cost of living 3.66 43 Venture capital as % of GMP 10.00 1 Openness subindex 6.99 3 Openness subindex 6.99 3 Exports per capita 7.50 2 Air passengers per capita 5.19 16 Domestic competition subindex 7.42 1 Domestic competition subindex 7.42 1 Net firm creation per 100,000 inhabitants 5.66 14 New publicly traded companies 9.70 1 Environmental policy subindex 5.48 14 Environmental policy subindex 5.48 14 Toxic release, pounds per capita 5.24 9 Electricity prices, $ per mbtu 3.64 42 Pollution standards index 6.18 6 Serious pollution days p.a. 5.85 8
In this box on each page, you will find a summary of the high and low points of the
competitive index information to be found in detail in the table below.
A subindex combines one or more variables that explain certain social or economic characteristics. For example, the security subindex is composed of other variables such as thefts, percentage change in crime, and murders
committed in the metro area.
Variables are the elements that make up each subindex. Variables that rank between 1 and 20 are considered advantages to a metro area, while variables that rank between 30 and 50 are considered
disadvantages.
The index value ranks from 0 to 10, with a mean of 5 and a standard deviation of 1. Each metro area’s index is ordered to create the overall rank
among the 50 metro areas.
In this column, you will find variables where the metro area is
competitive. In this column, you will find variables where the metro area is not
competitive.
Each metro area’s overall rank is based on its total index from 1
(highest) to 50 (lowest).

BH
I
Metro Area and State Competitiveness Report / Page 18
Metro Area Profiles

BH
I
Metro Area and State Competitiveness Report / Page 19
IndexIndex Overall Rank
ATLANTA 5.39 12
Atlanta enjoys a relatively high overall ranking. The primary reasons are a strong fiscal climate and a competitive financial sector. The metro area also scores well for openness and domestic competition. On the negative side, however, Atlanta suffers from poor infrastructure, a high crime rate, and poor environmental policy.
Competitive Advantages Competitive Disadvantages
Subindex/Variable Index Rank Subindex/Variable Index Rank
Government and fiscal policy subindex 6.44 1 Government and fiscal policy subindex 6.44 1 State bond rating 6.34 1 Taxes as a % of current GSP 5.80 9 Unemployment payments per unemployed worker 6.22 2 Workers’ compensation collections per employee 5.56 1 Security subindex 4.28 40 Security subindex 4.28 40 Crime index change 1999-2000, % 4.21 40 Violent crimes per 100,000 inhabitants 4.84 35 Thefts per 100,000 inhabitants 4.72 30 Murders per 100,000 inhabitants 4.50 40 Infrastructure subindex 3.19 50 Infrastructure subindex 3.19 50 % of adults online 5.44 17 % of households with computers 4.20 42 Mass transit availability 5.16 17 Median household gross rent 3.83 46 Travel time to work 3.09 47 Human resources subindex 4.59 31 Human resources subindex 4.59 31 % of adults in the labor force 5.35 17 % of population without health insurance 4.82 31 % of labor force represented by unions 5.88 12 Enrollment in degree-granting institutions per capita 3.15 50 % of population that graduated from high school 5.38 18 High school finishers as % of 18-year olds 4.39 38 Unemployment rate 5.65 16 Infant mortality rate, deaths per 1000 live births 4.73 32 Nonfederal physicians per 100,000 inhabitants 4.10 42 Technology subindex 4.73 31 Technology subindex 4.73 31 Academic R&D funding relative to employment 5.26 9 New patents issued per 100,000 inhabitants 4.64 30 High-tech payroll as % of total payroll 5.86 9 NIH support to institutions per capita 4.37 39 Science & engineering grad. students per capita 3.96 44 Finance and cost subindex 6.62 2 Finance and cost subindex 6.62 2 Bank deposits per capita 5.17 19 Cost of living 7.01 1 Venture capital as % of GMP 4.95 12 Openness subindex 6.37 4 Openness subindex 6.37 4 Air passengers per capita 7.26 3 Domestic competition subindex 6.68 3 Domestic competition subindex 6.68 3 Net firm creation per 100,000 inhabitants 6.47 5 Cognetics entrepreneurial hot spot index 6.90 3 New publicly traded companies 5.26 8 Environmental policy subindex 3.75 42 Environmental policy subindex 3.75 42 Pollution standards index 4.48 38 Serious pollution days p.a. 2.81 48 Toxic release, pounds per capita 5.15 30

BH
I
Metro Area and State Competitiveness Report / Page 20
Inde
xIndex Overall Rank
AUSTIN 6.39 6
Austin ranks 6 in the overall index. The metro area benefits from low taxes, low cost of living and a large number of newly issued patents. It also has a fairly large number of newly created firms. What Austin lacks is good environmental policy and a skilled labor force.
Competitive Advantages Competitive Disadvantages
Subindex/Variable Index Rank Subindex/Variable Index Rank
Government and fiscal policy subindex 6.30 4 Government and fiscal policy subindex 6.30 4 Taxes as a % of current GSP 6.60 3 Workers’ compensation collections per employee 5.56 8 Bond rating: S&P's/Moody's composite 5.56 14 State bond rating 5.13 20 Unemployment payments per unemployed worker 5.82 10 Security subindex 5.96 10 Security subindex 5.96 10 Murders per 100,000 inhabitants 5.86 9 Thefts per 100,000 inhabitants 4.59 31 Crime index change 1999-2000, % 5.90 7 Violent crimes per 100,000 inhabitants 5.95 9 Infrastructure subindex 5.41 14 Infrastructure subindex 5.41 14 % of adults online 6.98 2 % of households with computers 4.35 38 Mass transit availability 5.29 14 Median household gross rent 4.09 41 Human resources subindex 5.54 11 Human resources subindex 5.54 11 % of adults in the labor force 6.33 5 % of population without health insurance 3.10 47 % of labor force represented by unions 6.11 7 Enrollment in degree-granting institutions per capita 4.40 33 % of population born abroad 5.22 15 High school finishers as % of 18-year olds 3.94 45 % of population that graduated from high school 5.61 12 Nonfederal physicians per 100,000 inhabitants 3.96 45 Infant mortality rate, deaths per 1000 live births 6.84 2 Unemployment rate 6.61 2 Technology subindex 6.36 6 Technology subindex 6.36 6 Academic R&D funding relative to employment 5.93 4 NIH support to institutions per capita 4.59 31 High-tech payroll as % of total payroll 7.50 2 Scientists and engineers in the labor force 4.64 30 New patents issued per 100,000 inhabitants 8.21 2 Finance and cost subindex 6.18 5 Finance and cost subindex 6.18 5 Cost of living 6.33 3 Bank deposits per capita 3.70 46 Venture capital as % of GMP 6.53 3 Openness subindex 5.41 16 Openness subindex 5.41 16 Exports per capita 5.97 7 Domestic competition subindex 6.38 8 Domestic competition subindex 6.38 8 Net firm creation per 100,000 inhabitants 5.86 12 Cognetics entrepreneurial hot spot index 6.20 5 New publicly traded companies 5.91 5 Environmental policy subindex 3.27 48 Environmental policy subindex 3.27 48 Electricity prices, $ per mbtu 5.47 17 Serious pollution days p.a. 0.70 50 Toxic release, pounds per capita 5.24 3 Pollution standards index 5.51 19

BH
I
Metro Area and State Competitiveness Report / Page 21
IndexIndex Overall Rank
BOSTON 7.00 3
Boston is ranked 3 overall, primarily because of ranking number 1 in both the human resources and technology subindexes. The city's fiscal climate, closed economy and high cost of living are among its few disadvantages. A more favorable fiscal policy would further improve this city's already high rank.
Competitive Advantages Competitive Disadvantages
Subindex/Variable Index Rank Subindex/Variable Index Rank
Government and fiscal policy subindex 3.87 43 Government and fiscal policy subindex 3.87 43
Bond rating: S&P's/Moody's composite 4.92 30
State bond rating 4.43 39 Unemployment payments per unemployed worker 1.84 50 Security subindex 6.60 2 Security subindex 6.60 2 Crime index change 1999-2000, % 5.33 18 Violent crimes per 100,000 inhabitants 5.54 15 Thefts per 100,000 inhabitants 6.61 2 Murders per 100,000 inhabitants 6.35 1 Infrastructure subindex 5.28 17 Infrastructure subindex 5.28 17 Mass transit availability 6.20 4 Median household gross rent 3.96 43 % of households with computers 5.61 11 Travel time to work 4.16 41 % of adults online 5.57 15 Human resources subindex 7.52 1 Human resources subindex 7.52 1 % of population born abroad 5.24 14 % of population that graduated from high school 5.85 8 % of population without health insurance 6.18 6 Enrollment in degree-granting institutions per capita 6.57 4 High school finishers as % of 18-year olds 5.73 11 Infant mortality rate, deaths per 1000 live births 6.57 3 Nonfederal physicians per 100,000 inhabitants 7.63 1 Unemployment rate 6.23 6 Technology subindex 8.43 1 Technology subindex 8.43 1 Academic R&D funding relative to employment 6.47 2 NIH support to institutions per capita 9.58 1 New patents issued per 100,000 inhabitants 5.86 6 Science & engineering grad. students per capita 8.59 1 Scientists and engineers in the labor force 7.83 1 High-tech payroll as % of total payroll 6.11 7 Finance and cost subindex 5.90 10 Finance and cost subindex 5.90 10 Bank deposits per capita 6.72 4 Cost of living 3.27 50 Venture capital as % of GMP 6.19 4 Openness subindex 4.69 28 Openness subindex 4.69 28 Exports per capita 5.10 18 Air passengers per capita 4.48 31 Domestic competition subindex 6.04 10 Domestic competition subindex 6.04 10 Net firm creation per 100,000 inhabitants 6.67 2 Cognetics entrepreneurial hot spot index 4.56 35 New publicly traded companies 6.01 4 Environmental policy subindex 5.05 25 Environmental policy subindex 5.05 25 Pollution standards index 5.92 8 Electricity prices, $ per mbtu 3.26 46 Serious pollution days p.a. 5.71 15 Toxic release, pounds per capita 5.23 14

BH
I
Metro Area and State Competitiveness Report / Page 22
Inde
xIndex Overall Rank
BUFFALO 3.62 49
Buffalo ranks 49 of the 50 metro areas. It ranks poorly in almost all the subindexes, ranking last with regard to government policy and domestic competition. Its only strengths are its large number of scientists and engineers and its low crime rate.
Competitive Advantages Competitive Disadvantages
Subindex/Variable Index Rank Subindex/Variable Index Rank
Government and fiscal policy subindex 2.60 50 Government and fiscal policy subindex 2.60 50
Taxes as a % of current GSP 2.60 49
Workers’ compensation collections per employee 4.43 43 Bond rating: S&P's/Moody's composite 2.80 49 State bond rating 3.51 44 Unemployment payments per unemployed worker 4.92 33 Security subindex 6.33 4 Security subindex 6.33 4 Crime index change 1999-2000, % 6.28 5 Violent crimes per 100,000 inhabitants 5.47 18 Thefts per 100,000 inhabitants 5.69 14 Murders per 100,000 inhabitants 5.76 13 Infrastructure subindex 5.41 15 Infrastructure subindex 5.41 15 Median household gross rent 6.32 4 Mass transit availability 4.40 37 Travel time to work 6.45 3 % of households with computers 4.50 35 % of adults online 4.07 43 Human resources subindex 4.10 44 Human resources subindex 4.10 44 Enrollment in degree-granting institutions per capita 5.28 18 % of adults in the labor force 4.14 40 High school finishers as % of 18-year olds 5.26 18 % of labor force represented by unions 2.79 49 Nonfederal physicians per 100,000 inhabitants 7.36 2 % of population born abroad 4.22 44 % of population without health insurance 4.67 32 Unemployment rate 2.63 50 Technology subindex 5.42 12 Technology subindex 5.42 12 Academic R&D funding relative to employment 5.13 11 High-tech payroll as % of total payroll 4.02 44 NIH support to institutions per capita 5.67 7 Science & engineering grad. students per capita 6.21 4 Scientists and engineers in the labor force 5.98 8 Finance and cost subindex 3.89 43 Finance and cost subindex 3.89 43 Bank deposits per capita 5.55 12 Cost of living 3.39 45 Venture capital as % of GMP 4.57 38 Openness subindex 4.07 42 Openness subindex 4.07 42 Exports per capita 4.59 30 Air passengers per capita 4.15 43 Domestic competition subindex 2.89 50 Domestic competition subindex 2.89 50 Net firm creation per 100,000 inhabitants 3.27 50 Cognetics entrepreneurial hot spot index 2.83 50 New publicly traded companies 4.36 43 Environmental policy subindex 4.51 39 Environmental policy subindex 4.51 39 Pollution standards index 5.55 18 Electricity prices, $ per mbtu 2.84 47 Serious pollution days p.a. 5.69 16 Toxic release, pounds per capita 5.08 39

BH
I
Metro Area and State Competitiveness Report / Page 23
IndexIndex Overall Rank
CHARLOTTE 5.09 19
A strong fiscal climate and robust financial sector pushes Charlotte to an overall ranking of 19. Its openness to trade and congenial domestic environment for new businesses also add to its strength. However, its weaknesses lie in its poor infrastructure and high crime rate.
Competitive Advantages Competitive Disadvantages
Subindex/Variable Index Rank Subindex/Variable Index Rank
Government and fiscal policy subindex 6.20 7 Government and fiscal policy subindex 6.20 7 Bond rating: S&P's/Moody's composite 6.19 1 Unemployment payments per unemployed worker 5.06 31 State bond rating 5.98 9 Taxes as a % of current GSP 5.60 16 Security subindex 3.57 47 Security subindex 3.57 47 Crime index change 1999-2000, % 3.91 43 Violent crimes per 100,000 inhabitants 3.88 44 Thefts per 100,000 inhabitants 4.17 40 Murders per 100,000 inhabitants 4.60 36 Infrastructure subindex 3.25 49 Infrastructure subindex 3.25 49 Mass transit availability 3.92 48 % of households with computers 3.81 47 % of adults online 4.19 40 Travel time to work 4.82 33 Human resources subindex 4.65 29 Human resources subindex 4.65 29 % of adults in the labor force 5.24 20 % of population born abroad 4.51 30 % of labor force represented by unions 6.47 3 % of population that graduated from high school 4.39 39 High school finishers as % of 18-year olds 4.66 31 Infant mortality rate, deaths per 1000 live births 4.20 40 Nonfederal physicians per 100,000 inhabitants 4.59 35 Unemployment rate 4.69 32 Technology subindex 4.95 24 Technology subindex 4.95 24 High-tech payroll as % of total payroll 5.09 18 Academic R&D funding relative to employment 4.20 47 NIH support to institutions per capita 5.42 15 New patents issued per 100,000 inhabitants 4.36 36 Scientists and engineers in the labor force 6.15 6 Science & engineering grad. students per capita 4.54 36 Finance and cost subindex 6.12 7 Finance and cost subindex 6.12 7 Bank deposits per capita 5.77 10 Venture capital as % of GMP 4.59 33 Cost of living 6.11 6 Openness subindex 5.79 11 Openness subindex 5.79 11 Air passengers per capita 6.49 5 Exports per capita 4.58 31 Domestic competition subindex 5.90 11 Domestic competition subindex 5.90 11 Net firm creation per 100,000 inhabitants 6.34 6 New publicly traded companies 4.51 37 Cognetics entrepreneurial hot spot index 6.09 7 Environmental policy subindex 4.92 30 Environmental policy subindex 4.92 30 Serious pollution days p.a. 4.56 37 Toxic release, pounds per capita 5.09 38
BH
I
Metro Area and State Competitiveness Report / Page 24
Inde
xIndex Overall Rank
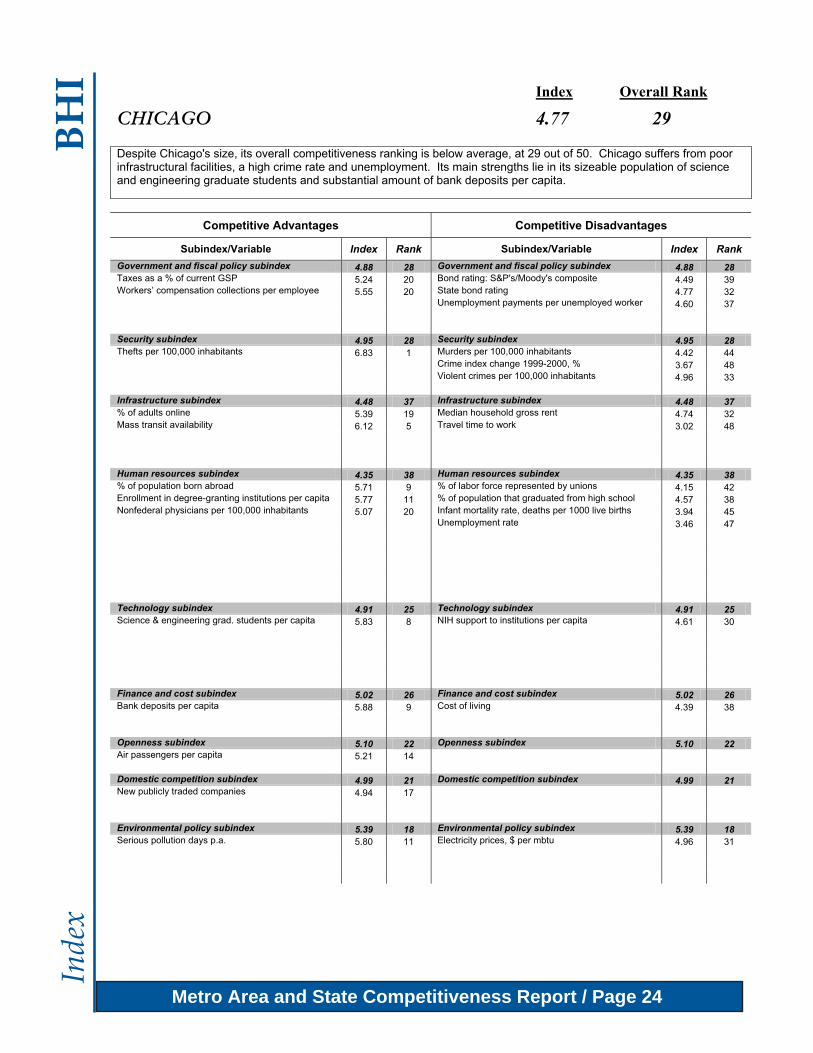
CHICAGO 4.77 29
Despite Chicago's size, its overall competitiveness ranking is below average, at 29 out of 50. Chicago suffers from poor infrastructural facilities, a high crime rate and unemployment. Its main strengths lie in its sizeable population of science and engineering graduate students and substantial amount of bank deposits per capita.
Competitive Advantages Competitive Disadvantages
Subindex/Variable Index Rank Subindex/Variable Index Rank
Government and fiscal policy subindex 4.88 28 Government and fiscal policy subindex 4.88 28 Taxes as a % of current GSP 5.24 20 Bond rating: S&P's/Moody's composite 4.49 39 Workers’ compensation collections per employee 5.55 20 State bond rating 4.77 32 Unemployment payments per unemployed worker 4.60 37 Security subindex 4.95 28 Security subindex 4.95 28 Thefts per 100,000 inhabitants 6.83 1 Murders per 100,000 inhabitants 4.42 44 Crime index change 1999-2000, % 3.67 48 Violent crimes per 100,000 inhabitants 4.96 33 Infrastructure subindex 4.48 37 Infrastructure subindex 4.48 37 % of adults online 5.39 19 Median household gross rent 4.74 32 Mass transit availability 6.12 5 Travel time to work 3.02 48 Human resources subindex 4.35 38 Human resources subindex 4.35 38 % of population born abroad 5.71 9 % of labor force represented by unions 4.15 42 Enrollment in degree-granting institutions per capita 5.77 11 % of population that graduated from high school 4.57 38 Nonfederal physicians per 100,000 inhabitants 5.07 20 Infant mortality rate, deaths per 1000 live births 3.94 45 Unemployment rate 3.46 47 Technology subindex 4.91 25 Technology subindex 4.91 25 Science & engineering grad. students per capita 5.83 8 NIH support to institutions per capita 4.61 30 Finance and cost subindex 5.02 26 Finance and cost subindex 5.02 26 Bank deposits per capita 5.88 9 Cost of living 4.39 38 Openness subindex 5.10 22 Openness subindex 5.10 22 Air passengers per capita 5.21 14 Domestic competition subindex 4.99 21 Domestic competition subindex 4.99 21 New publicly traded companies 4.94 17 Environmental policy subindex 5.39 18 Environmental policy subindex 5.39 18 Serious pollution days p.a. 5.80 11 Electricity prices, $ per mbtu 4.96 31

BH
I
Metro Area and State Competitiveness Report / Page 25
IndexIndex Overall Rank
CINCINNATI 5.13 18
Low crime, high level of openness to trade and a favorable environmental policy push Cincinnati's ranking up to 18. This metro area could benefit from improvements in its human resource, domestic competition and technology sectors.
Competitive Advantages Competitive Disadvantages
Subindex/Variable Index Rank Subindex/Variable Index Rank
Government and fiscal policy subindex 4.67 30 Government and fiscal policy subindex 4.67 30 Bond rating: S&P's/Moody's composite 5.77 11 Workers’ compensation collections per employee 2.53 47 State bond rating 5.42 19 Unemployment payments per unemployed worker 5.42 20 Security subindex 6.25 6 Security subindex 6.25 6 Murders per 100,000 inhabitants 6.05 5 Thefts per 100,000 inhabitants 5.60 17 Violent crimes per 100,000 inhabitants 6.37 3 Infrastructure subindex 4.98 24 Infrastructure subindex 4.98 24 Median household gross rent 6.26 5 Mass transit availability 4.71 30 Travel time to work 5.38 20 % of households with computers 4.56 33 % of adults online 4.05 44 Human resources subindex 4.25 42 Human resources subindex 4.25 42 % of adults in the labor force 5.55 15 % of labor force represented by unions 4.33 33 % of population without health insurance 5.66 16 % of population born abroad 3.98 50 % of population that graduated from high school 4.98 32 Enrollment in degree-granting institutions per capita 4.26 40 High school finishers as % of 18-year olds 4.43 37 Infant mortality rate, deaths per 1000 live births 4.20 40 Nonfederal physicians per 100,000 inhabitants 4.65 31 Technology subindex 4.67 32 Technology subindex 4.67 32 Academic R&D funding relative to employment 5.00 15 High-tech payroll as % of total payroll 4.57 32 New patents issued per 100,000 inhabitants 5.34 8 NIH support to institutions per capita 4.57 36 Science & engineering grad. students per capita 4.78 31 Scientists and engineers in the labor force 4.31 39 Finance and cost subindex 5.03 25 Finance and cost subindex 5.03 25 Venture capital as % of GMP 4.58 35 Openness subindex 5.89 8 Openness subindex 5.89 8 Exports per capita 5.51 12 Air passengers per capita 5.70 11 Domestic competition subindex 4.43 35 Domestic competition subindex 4.43 35 Net firm creation per 100,000 inhabitants 4.15 40 Environmental policy subindex 5.40 17 Environmental policy subindex 5.40 17 Electricity prices, $ per mbtu 5.48 15 Toxic release, pounds per capita 5.10 36

BH
I
Metro Area and State Competitiveness Report / Page 26
Inde
xIndex Overall Rank
CLEVELAND 4.22 40
Ranking 40 overall, Cleveland has many competitive disadvantages: bad fiscal policy, weak high-tech sector, low rate of firm growth and poor environmental policy. Among this metro area’s few bright spots are affordable housing, high school completion and low crime rates.
Competitive Advantages Competitive Disadvantages
Subindex/Variable Index Rank Subindex/Variable Index Rank
Government and fiscal policy subindex 4.01 42 Government and fiscal policy subindex 4.01 42 State bond rating 5.53 14 Workers’ compensation collections per employee 1.85 49
Bond rating: S&P's/Moody's composite 4.54 38 Security subindex 5.63 14 Security subindex 5.63 14 Murders per 100,000 inhabitants 5.73 14 Crime index change 1999-2000, % 4.02 42 Thefts per 100,000 inhabitants 5.82 12 Violent crimes per 100,000 inhabitants 5.95 10 Infrastructure subindex 5.23 19 Infrastructure subindex 5.23 19 Mass transit availability 5.14 18 % of adults online 4.28 38 Median household gross rent 5.85 10 % of households with computers 4.66 30 Travel time to work 5.50 17 Human resources subindex 4.46 35 Human resources subindex 4.46 35 % of population without health insurance 5.74 12 % of labor force represented by unions 4.15 43 High school finishers as % of 18-year olds 7.07 2 % of population born abroad 4.24 40 Enrollment in degree-granting institutions per capita 4.30 37 Infant mortality rate, deaths per 1000 live births 3.68 49 Unemployment rate 3.67 45 Technology subindex 4.49 36 Technology subindex 4.49 36 Academic R&D funding relative to employment 4.60 34 High-tech payroll as % of total payroll 4.20 39 Scientists and engineers in the labor force 4.45 35 Finance and cost subindex 4.56 37 Finance and cost subindex 4.56 37 Venture capital as % of GMP 4.53 41 Openness subindex 4.56 31 Openness subindex 4.56 31 Exports per capita 5.08 19 Air passengers per capita 4.33 37 Domestic competition subindex 3.97 46 Domestic competition subindex 3.97 46 Net firm creation per 100,000 inhabitants 4.17 39 Cognetics entrepreneurial hot spot index 4.17 41 New publicly traded companies 4.44 42 Environmental policy subindex 4.81 33 Environmental policy subindex 4.81 33 Pollution standards index 4.33 39 Serious pollution days p.a. 5.00 31 Toxic release, pounds per capita 5.14 32

BH
I
Metro Area and State Competitiveness Report / Page 27
IndexIndex Overall Rank
COLUMBUS 4.67 31
Columbus scores poorly in many areas. Fiscal policy, openness and security subindexes are among its weaknesses. Among the few competitive advantages for the Columbus metro area are bond rating and high school completion rate. These mixed showings result in a rank of 31 overall.
Competitive Advantages Competitive Disadvantages
Subindex/Variable Index Rank Subindex/Variable Index Rank
Government and fiscal policy subindex 4.59 33 Government and fiscal policy subindex 4.59 33 Bond rating: S&P's/Moody's composite 6.19 1 Workers’ compensation collections per employee 1.85 49 State bond rating 5.53 14 Security subindex 4.99 26 Security subindex 4.99 26 Crime index change 1999-2000, % 5.51 12 Thefts per 100,000 inhabitants 3.81 45 Infrastructure subindex 5.08 21 Infrastructure subindex 5.08 21 Median household gross rent 5.46 17 Mass transit availability 4.41 36 Travel time to work 5.78 11 % of households with computers 4.66 30 Human resources subindex 5.30 17 Human resources subindex 5.30 17 % of adults in the labor force 5.85 9 % of labor force represented by unions 4.15 43 % of population that graduated from high school 5.89 7 % of population born abroad 4.25 39 % of population without health insurance 5.74 12 Enrollment in degree-granting institutions per capita 4.30 37 High school finishers as % of 18-year olds 5.14 19 Unemployment rate 5.91 11 Technology subindex 4.87 27 Technology subindex 4.87 27 Academic R&D funding relative to employment 5.40 7 New patents issued per 100,000 inhabitants 4.51 33 High-tech payroll as % of total payroll 5.43 12 Scientists and engineers in the labor force 4.45 35 Finance and cost subindex 4.79 31 Finance and cost subindex 4.79 31 Bank deposits per capita 5.23 18 Venture capital as % of GMP 4.53 41 Openness subindex 3.94 44 Openness subindex 3.94 44 Exports per capita 4.22 40 Air passengers per capita 4.34 35 Domestic competition subindex 4.74 26 Domestic competition subindex 4.74 26 Cognetics entrepreneurial hot spot index 5.40 15 New publicly traded companies 4.51 38 Environmental policy subindex 5.33 21 Environmental policy subindex 5.33 21 Pollution standards index 5.92 9 Serious pollution days p.a. 4.28 41

BH
I
Metro Area and State Competitiveness Report / Page 28
Inde
xIndex Overall Rank
DALLAS 4.82 26
Dallas scores low in the security, finance and environmental subindexes. There is also some weakness in the human resources subindex. Low taxation, available internet access and weak unionization are strong competitive advantages for the Dallas metro area.
Competitive Advantages Competitive Disadvantages
Subindex/Variable Index Rank Subindex/Variable Index Rank
Government and fiscal policy subindex 6.20 8 Government and fiscal policy subindex 6.20 8 Taxes as a % of current GSP 6.60 3 Workers’ compensation collections per employee 5.56 8 Bond rating: S&P's/Moody's composite 5.92 10 State bond rating 5.13 20 Security subindex 4.58 37 Security subindex 4.58 37 Violent crimes per 100,000 inhabitants 4.81 36 Thefts per 100,000 inhabitants 4.53 32 Murders per 100,000 inhabitants 4.64 35 Infrastructure subindex 4.62 32 Infrastructure subindex 4.62 32 % of adults online 6.11 6 % of households with computers 4.35 38 Median household gross rent 4.78 31 Travel time to work 4.31 40 Human resources subindex 4.80 27 Human resources subindex 4.80 27 % of adults in the labor force 5.77 11 % of population that graduated from high school 4.24 40 % of labor force represented by unions 6.11 7 % of population without health insurance 3.10 47 % of population born abroad 5.58 10 Enrollment in degree-granting institutions per capita 4.40 33 Infant mortality rate, deaths per 1000 live births 5.85 9 Nonfederal physicians per 100,000 inhabitants 3.96 45 Unemployment rate 5.52 18 Technology subindex 4.88 26 Technology subindex 4.88 26 High-tech payroll as % of total payroll 5.93 8 Academic R&D funding relative to employment 4.46 39 New patents issued per 100,000 inhabitants 5.04 14 NIH support to institutions per capita 4.59 31 Scientists and engineers in the labor force 4.64 30 Finance and cost subindex 4.88 28 Finance and cost subindex 4.88 28 Cost of living 5.43 20 Openness subindex 5.57 13 Openness subindex 5.57 13 Air passengers per capita 5.87 8 Domestic competition subindex 5.03 19 Domestic competition subindex 5.03 19 Cognetics entrepreneurial hot spot index 5.56 12 New publicly traded companies 4.90 20 Environmental policy subindex 3.68 44 Environmental policy subindex 3.68 44 Electricity prices, $ per mbtu 5.47 17 Pollution standards index 4.17 42 Toxic release, pounds per capita 5.23 11 Serious pollution days p.a. 2.78 49

BH
I
Metro Area and State Competitiveness Report / Page 29
IndexIndex Overall Rank
DENVER 6.96 4
Sound fiscal policy, good infrastructure, high-quality human resources and a strong technology sector place Denver near the top, at 4 in the overall ranking. The finance and cost subindex is the metro area's biggest competitive disadvantage.
Competitive Advantages Competitive Disadvantages
Subindex/Variable Index Rank Subindex/Variable Index Rank
Government and fiscal policy subindex 6.11 9 Government and fiscal policy subindex 6.11 9 Taxes as a % of current GSP 5.62 15 Workers’ compensation collections per employee 5.56 1 Bond rating: S&P's/Moody's composite 5.56 14 State bond rating 5.53 14 Unemployment payments per unemployed worker 5.85 9 Security subindex 6.24 7 Security subindex 6.24 7 Crime index change 1999-2000, % 5.51 13 Violent crimes per 100,000 inhabitants 6.13 5 Thefts per 100,000 inhabitants 5.40 20 Murders per 100,000 inhabitants 5.92 8 Infrastructure subindex 6.85 4 Infrastructure subindex 6.85 4 Mass transit availability 5.90 6 Median household gross rent 4.22 40 % of households with computers 7.19 2 % of adults online 6.02 7 Human resources subindex 6.31 6 Human resources subindex 6.31 6 % of adults in the labor force 5.33 18 High school finishers as % of 18-year olds 4.64 32 % of population born abroad 5.03 20 % of population that graduated from high school 6.13 5 Enrollment in degree-granting institutions per capita 6.40 5 Infant mortality rate, deaths per 1000 live births 5.78 10 Unemployment rate 6.31 5 Technology subindex 6.31 7 Technology subindex 6.31 7 High-tech payroll as % of total payroll 7.29 3 New patents issued per 100,000 inhabitants 5.30 9 Science & engineering grad. students per capita 6.21 6 Scientists and engineers in the labor force 6.83 3 Finance and cost subindex 4.71 35 Finance and cost subindex 4.71 35 Venture capital as % of GMP 5.82 6 Bank deposits per capita 4.32 38 Cost of living 4.46 37 Openness subindex 5.21 19 Openness subindex 5.21 19 Air passengers per capita 6.28 7 Exports per capita 4.00 45 Domestic competition subindex 6.05 9 Domestic competition subindex 6.05 9 Net firm creation per 100,000 inhabitants 6.23 7 Cognetics entrepreneurial hot spot index 5.45 14 New publicly traded companies 5.59 6 Environmental policy subindex 5.42 15 Environmental policy subindex 5.42 15 Electricity prices, $ per mbtu 5.55 14 Pollution standards index 4.13 44 Serious pollution days p.a. 5.88 5 Toxic release, pounds per capita 5.23 10

BH
I
Metro Area and State Competitiveness Report / Page 30
Inde
xIndex Overall Rank
DETROIT 4.44 36
Detroit's low overall rank of 36 suggests many problems. Among those are weak fiscal policy, high level of crime, lacking financial sector and poor human resources. Exports and state bond rating are among the few strong points of this metro area.
Competitive Advantages Competitive Disadvantages
Subindex/Variable Index Rank Subindex/Variable Index Rank
Government and fiscal policy subindex 4.40 35 Government and fiscal policy subindex 4.40 35 State bond rating 6.34 1 Taxes as a % of current GSP 3.93 43
Bond rating: S&P's/Moody's composite 3.43 46 Unemployment payments per unemployed worker 4.09 44 Security subindex 3.97 41 Security subindex 3.97 41 Thefts per 100,000 inhabitants 5.65 15 Crime index change 1999-2000, % 3.71 46 Violent crimes per 100,000 inhabitants 4.27 40 Murders per 100,000 inhabitants 3.90 47 Infrastructure subindex 4.59 34 Infrastructure subindex 4.59 34 % of households with computers 5.04 19 Mass transit availability 4.53 32 Median household gross rent 5.45 18 % of adults online 4.50 37 Travel time to work 4.73 35 Human resources subindex 4.57 32 Human resources subindex 4.57 32 % of adults in the labor force 5.32 19 % of labor force represented by unions 3.60 46 % of population without health insurance 5.99 8 Infant mortality rate, deaths per 1000 live births 4.07 43 Enrollment in degree-granting institutions per capita 5.36 16 Nonfederal physicians per 100,000 inhabitants 4.55 37 Technology subindex 4.97 21 Technology subindex 4.97 21 New patents issued per 100,000 inhabitants 5.27 10 Science & engineering grad. students per capita 5.41 13 Finance and cost subindex 4.16 40 Finance and cost subindex 4.16 40 Bank deposits per capita 4.50 34 Cost of living 4.85 30 Venture capital as % of GMP 4.53 41 Openness subindex 6.10 7 Openness subindex 6.10 7 Exports per capita 6.76 3 Domestic competition subindex 4.15 43 Domestic competition subindex 4.15 43 Net firm creation per 100,000 inhabitants 4.18 38 Cognetics entrepreneurial hot spot index 4.54 37 New publicly traded companies 4.45 41 Environmental policy subindex 5.72 11 Environmental policy subindex 5.72 11 Pollution standards index 5.90 10 Electricity prices, $ per mbtu 4.75 37 Serious pollution days p.a. 5.59 17 Toxic release, pounds per capita 5.08 40

BH
I
Metro Area and State Competitiveness Report / Page 31
IndexIndex Overall Rank
GRAND RAPIDS 5.33 14
Good infrastructure and human resources and a low crime level place Grand Rapids at 14 in the overall ranking. Improvements in the technology sector, lower taxes and greater entrepreneurial activity would help this metro area further improve its rank.
Competitive Advantages Competitive Disadvantages
Subindex/Variable Index Rank Subindex/Variable Index Rank
Government and fiscal policy subindex 5.35 21 Government and fiscal policy subindex 5.35 21 Bond rating: S&P's/Moody's composite 5.98 8 Taxes as a % of current GSP 3.93 43 State bond rating 6.34 1 Unemployment payments per unemployed worker 4.22 42 Security subindex 5.99 9 Security subindex 5.99 9 Violent crimes per 100,000 inhabitants 5.70 11 Thefts per 100,000 inhabitants 5.46 19 Murders per 100,000 inhabitants 6.21 3 Infrastructure subindex 5.73 10 Infrastructure subindex 5.73 10 % of households with computers 5.04 19 Mass transit availability 4.00 47 Travel time to work 6.71 1 % of adults online 4.75 31 Median household gross rent 5.83 11 Human resources subindex 5.51 12 Human resources subindex 5.51 12 % of population without health insurance 5.99 8 % of labor force represented by unions 3.60 46 % of population that graduated from high school 5.54 14 % of population born abroad 4.31 36 Enrollment in degree-granting institutions per capita 5.36 16 Nonfederal physicians per 100,000 inhabitants 4.55 37 % of adults in the labor force 7.53 1 Technology subindex 4.50 35 Technology subindex 4.50 35 Science & engineering grad. students per capita 5.41 13 Academic R&D funding relative to employment 4.20 47 High-tech payroll as % of total payroll 3.72 48 Finance and cost subindex 5.31 16 Finance and cost subindex 5.31 16 Cost of living 5.60 17 Venture capital as % of GMP 5.03 9 Openness subindex 4.30 37 Openness subindex 4.30 37 Exports per capita 5.26 16 Air passengers per capita 3.79 50 Domestic competition subindex 4.28 41 Domestic competition subindex 4.28 41 Net firm creation per 100,000 inhabitants 4.51 31 Cognetics entrepreneurial hot spot index 4.60 34 New publicly traded companies 4.36 43 Environmental policy subindex 5.40 16 Environmental policy subindex 5.40 16 Pollution standards index 6.89 1 Electricity prices, $ per mbtu 4.75 37 Toxic release, pounds per capita 5.05 41 Serious pollution days p.a. 4.07 45

BH
I
Metro Area and State Competitiveness Report / Page 32
Inde
xIndex Overall Rank
GREENSBORO 5.03 20
Greensboro ranks first place for workers’ compensation collections and union representation. Other advantages are low taxes and a good technology sector. The metro area scores low for human resources and infrastructure. Most notably, lack of mass transit hurts the area.
Competitive Advantages Competitive Disadvantages
Subindex/Variable Index Rank Subindex/Variable Index Rank
Government and fiscal policy subindex 5.95 13 Government and fiscal policy subindex 5.95 13 Taxes as a % of current GSP 5.64 11 Unemployment payments per unemployed worker 4.77 35 Workers’ compensation collections per employee 5.56 1 Bond rating: S&P's/Moody's composite 5.77 11 State bond rating 5.94 11 Security subindex 4.83 29 Security subindex 4.83 29 Thefts per 100,000 inhabitants 4.51 33 Infrastructure subindex 4.60 33 Infrastructure subindex 4.60 33 Travel time to work 6.10 7 Mass transit availability 3.74 50 Median household gross rent 5.95 9 % of households with computers 3.85 45 % of adults online 4.63 34 Human resources subindex 4.16 43 Human resources subindex 4.16 43 % of labor force represented by unions 6.49 1 High school finishers as % of 18-year olds 3.62 47 % of population that graduated from high school 3.86 44 % of population born abroad 4.39 31 Infant mortality rate, deaths per 1000 live births 3.81 47 Nonfederal physicians per 100,000 inhabitants 4.63 32 Technology subindex 5.17 16 Technology subindex 5.17 16 Academic R&D funding relative to employment 5.40 7 New patents issued per 100,000 inhabitants 4.38 35 NIH support to institutions per capita 5.59 9 Science & engineering grad. students per capita 4.69 33 Scientists and engineers in the labor force 6.37 4 High-tech payroll as % of total payroll 4.25 38 Finance and cost subindex 6.13 6 Finance and cost subindex 6.13 6 Bank deposits per capita 5.89 8 Venture capital as % of GMP 4.48 49 Cost of living 6.11 6 Openness subindex 4.71 27 Openness subindex 4.71 27 Exports per capita 5.59 11 Air passengers per capita 4.01 46 Domestic competition subindex 4.61 27 Domestic competition subindex 4.61 27 Cognetics entrepreneurial hot spot index 4.49 38 Environmental policy subindex 4.97 28 Environmental policy subindex 4.97 28 Toxic release, pounds per capita 5.10 37 Serious pollution days p.a. 4.40 40

BH
I
Metro Area and State Competitiveness Report / Page 33
IndexIndex Overall Rank
HARTFORD 5.32 15
Hartford shows a strong performance in security, human resources and infrastructure. It ranks first for its high school completion and unemployment rates. What keeps Hartford from ranking higher are its fiscal and environmental policies, as well as its performance on the domestic competition subindex.
Competitive Advantages Competitive Disadvantages
Subindex/Variable Index Rank Subindex/Variable Index Rank
Government and fiscal policy subindex 3.32 47 Government and fiscal policy subindex 3.32 47
Taxes as a % of current GSP 3.78 45
Workers’ compensation collections per employee 5.28 33 Bond rating: S&P's/Moody's composite 4.49 39 State bond rating 4.73 33 Unemployment payments per unemployed worker 2.02 49 Security subindex 6.74 1 Security subindex 6.74 1 Crime index change 1999-2000, % 5.56 11 Violent crimes per 100,000 inhabitants 6.42 2 Thefts per 100,000 inhabitants 6.02 7 Murders per 100,000 inhabitants 6.17 4 Infrastructure subindex 6.20 5 Infrastructure subindex 6.20 5 % of households with computers 6.76 5 Travel time to work 5.84 10 Human resources subindex 6.39 4 Human resources subindex 6.39 4 % of population without health insurance 6.49 4 Enrollment in degree-granting institutions per capita 4.18 41 High school finishers as % of 18-year olds 7.50 1 % of adults in the labor force 4.68 32 Unemployment rate 6.67 1 Infant mortality rate, deaths per 1000 live births 4.20 40 Nonfederal physicians per 100,000 inhabitants 6.94 5 Technology subindex 5.94 8 Technology subindex 5.94 8 NIH support to institutions per capita 6.22 4 New patents issued per 100,000 inhabitants 5.18 12 Science & engineering grad. students per capita 6.39 3 Scientists and engineers in the labor force 5.86 10 High-tech payroll as % of total payroll 5.43 11 Finance and cost subindex 5.11 19 Finance and cost subindex 5.11 19 Bank deposits per capita 7.19 2 Cost of living 3.27 48 Openness subindex 5.06 23 Openness subindex 5.06 23 Exports per capita 5.43 13 Domestic competition subindex 3.32 49 Domestic competition subindex 3.32 49 Net firm creation per 100,000 inhabitants 3.86 47 Cognetics entrepreneurial hot spot index 2.88 48 New publicly traded companies 4.63 31 Environmental policy subindex 4.24 40 Environmental policy subindex 4.24 40 Toxic release, pounds per capita 5.23 15 Electricity prices, $ per mbtu 2.83 50 Pollution standards index 5.59 17 Serious pollution days p.a. 5.02 30

BH
I
Metro Area and State Competitiveness Report / Page 34
Inde
xIndex Overall Rank
HOUSTON 4.80 28
Houston ranks 2 for its cost of living and 3 for its level of taxation. Economic openness and overall government policy are Houston's strongest competitive advantages. Human resources and environmental policy stand out as weak spots for this metro area, bringing its rank just below the middle of the pack.
Competitive Advantages Competitive Disadvantages
Subindex/Variable Index Rank Subindex/Variable Index Rank
Government and fiscal policy subindex 6.04 11 Government and fiscal policy subindex 6.04 11 Taxes as a % of current GSP 6.60 3 Bond rating: S&P's/Moody's composite 4.92 30 Workers’ compensation collections per employee 5.56 8 State bond rating 5.13 20 Unemployment payments per unemployed worker 5.71 13 Security subindex 4.74 31 Security subindex 4.74 31 Crime index change 1999-2000, % 5.24 19 Violent crimes per 100,000 inhabitants 4.34 39 Murders per 100,000 inhabitants 4.69 33 Infrastructure subindex 4.71 30 Infrastructure subindex 4.71 30 Mass transit availability 5.01 20 % of households with computers 4.35 38 % of adults online 5.99 8 Travel time to work 3.80 44 Median household gross rent 5.33 20 Human resources subindex 4.05 45 Human resources subindex 4.05 45 High school finishers as % of 18-year olds 5.33 17 % of population without health insurance 3.10 47 % of population born abroad 6.11 6 % of population that graduated from high school 3.24 47 % of labor force represented by unions 6.11 7 Unemployment rate 4.67 34 Enrollment in degree-granting institutions per capita 4.40 33 % of adults in the labor force 4.34 37 Nonfederal physicians per 100,000 inhabitants 3.96 45 Technology subindex 4.77 30 Technology subindex 4.77 30 Academic R&D funding relative to employment 5.00 15 NIH support to institutions per capita 4.59 31 New patents issued per 100,000 inhabitants 5.00 18 Scientists and engineers in the labor force 4.64 30 High-tech payroll as % of total payroll 4.96 20 Finance and cost subindex 5.46 15 Finance and cost subindex 5.46 15 Cost of living 6.63 2 Bank deposits per capita 4.34 36 Venture capital as % of GMP 4.63 32 Openness subindex 5.83 10 Openness subindex 5.83 10 Exports per capita 5.92 8 Air passengers per capita 5.20 15 Domestic competition subindex 5.01 20 Domestic competition subindex 5.01 20 New publicly traded companies 4.96 15 Environmental policy subindex 3.56 45 Environmental policy subindex 3.56 45 Electricity prices, $ per mbtu 5.47 17 Toxic release, pounds per capita 4.96 45 Pollution standards index 2.98 48 Serious pollution days p.a. 4.05 46

BH
I
Metro Area and State Competitiveness Report / Page 35
IndexIndex Overall Rank
INDIANAPOLIS 5.27 17
Indianapolis ranks high for government and environmental policies. The metro area benefits from a sound bond rating, low unemployment rate and workers’ compensation cost. Low rankings on the technology and finance subindexes represent serious disadvantages.
Competitive Advantages Competitive Disadvantages
Subindex/Variable Index Rank Subindex/Variable Index Rank
Government and fiscal policy subindex 6.06 10 Government and fiscal policy subindex 6.06 10 Taxes as a % of current GSP 5.36 18 Workers’ compensation collections per employee 5.56 1 Bond rating: S&P's/Moody's composite 6.19 1 State bond rating 5.53 14 Security subindex 5.16 23 Security subindex 5.16 23 Thefts per 100,000 inhabitants 5.96 9 Crime index change 1999-2000, % 4.64 32 Murders per 100,000 inhabitants 4.57 37 Infrastructure subindex 4.91 25 Infrastructure subindex 4.91 25 Travel time to work 5.58 14 Mass transit availability 4.15 44 Median household gross rent 5.56 14 % of households with computers 4.52 34 Human resources subindex 5.09 24 Human resources subindex 5.09 24 % of population without health insurance 5.44 18 % of population born abroad 4.09 45 High school finishers as % of 18-year olds 5.72 13 Infant mortality rate, deaths per 1000 live births 4.73 32 % of population that graduated from high school 5.38 19 Nonfederal physicians per 100,000 inhabitants 3.98 44 Unemployment rate 6.18 7 % of adults in the labor force 5.44 16 Technology subindex 4.27 40 Technology subindex 4.27 40 Academic R&D funding relative to employment 4.20 47 NIH support to institutions per capita 4.21 40 Science & engineering grad. students per capita 4.60 35 Scientists and engineers in the labor force 4.37 38 High-tech payroll as % of total payroll 4.61 31 Finance and cost subindex 4.60 36 Finance and cost subindex 4.60 36 Venture capital as % of GMP 4.49 48 Openness subindex 4.85 25 Openness subindex 4.85 25 Exports per capita 5.42 14 Air passengers per capita 4.38 33 Domestic competition subindex 4.87 23 Domestic competition subindex 4.87 23 Cognetics entrepreneurial hot spot index 5.88 8 Net firm creation per 100,000 inhabitants 4.33 36 New publicly traded companies 4.52 36 Environmental policy subindex 6.30 5 Environmental policy subindex 6.30 5 Electricity prices, $ per mbtu 6.00 5 Toxic release, pounds per capita 5.14 31 Pollution standards index 5.88 12

BH
I
Metro Area and State Competitiveness Report / Page 36
Inde
xIndex Overall Rank
JACKSONVILLE 3.98 46
Jacksonville scores very poorly for its security, technology and openness subindexes. Infrastructure, human resources and finance are also disadvantages. Few pollution days, a strong entrepreneurial base and low unemployment payments are the few bright spots in this metro area’s report.
Competitive Advantages Competitive Disadvantages
Subindex/Variable Index Rank Subindex/Variable Index Rank
Government and fiscal policy subindex 5.50 18 Government and fiscal policy subindex 5.50 18
Workers’ compensation collections per employee 5.56 12 Taxes as a % of current GSP 4.53 37 Bond rating: S&P's/Moody's composite 5.34 19 State bond rating 5.13 20 Unemployment payments per unemployed worker 5.86 8 Security subindex 3.59 46 Security subindex 3.59 46 Crime index change 1999-2000, % 5.42 17 Violent crimes per 100,000 inhabitants 2.95 47 Thefts per 100,000 inhabitants 4.07 42 Murders per 100,000 inhabitants 4.18 45 Infrastructure subindex 4.52 36 Infrastructure subindex 4.52 36 Mass transit availability 4.37 39 Travel time to work 4.67 36 Human resources subindex 4.33 39 Human resources subindex 4.33 39 % of labor force represented by unions 5.83 13 % of population without health insurance 4.14 36 Infant mortality rate, deaths per 1000 live births 5.59 14 High school finishers as % of 18-year olds 3.78 46 Nonfederal physicians per 100,000 inhabitants 5.07 15 Enrollment in degree-granting institutions per capita 3.85 45 % of adults in the labor force 4.35 36 % of population born abroad 4.35 34 Technology subindex 3.89 44 Technology subindex 3.89 44 High-tech payroll as % of total payroll 5.15 17 Academic R&D funding relative to employment 4.20 47 NIH support to institutions per capita 3.96 44 New patents issued per 100,000 inhabitants 4.17 46 Science & engineering grad. students per capita 4.00 39 Scientists and engineers in the labor force 3.85 42 Finance and cost subindex 4.56 38 Finance and cost subindex 4.56 38 Cost of living 5.62 13 Bank deposits per capita 4.25 40 Venture capital as % of GMP 4.53 41 Openness subindex 3.71 48 Openness subindex 3.71 48 Exports per capita 3.88 48 Air passengers per capita 4.37 34 Domestic competition subindex 5.05 18 Domestic competition subindex 5.05 18 Net firm creation per 100,000 inhabitants 5.02 19 New publicly traded companies 4.36 43 Cognetics entrepreneurial hot spot index 5.72 9 Environmental policy subindex 5.59 12 Environmental policy subindex 5.59 12 Serious pollution days p.a. 5.85 7 Electricity prices, $ per mbtu 4.95 32 Toxic release, pounds per capita 5.13 34

BH
I
Metro Area and State Competitiveness Report / Page 37
IndexIndex Overall Rank
KANSAS CITY 5.93 8
Ranking 8 overall, Kansas City shows good performance in the infrastructure, human resources and environmental subindexes. It ranks 3 for the percentage of adults in the labor force. Kansas City scores low for measures of openness and finance and cost.
Competitive Advantages Competitive Disadvantages
Subindex/Variable Index Rank Subindex/Variable Index Rank
Government and fiscal policy subindex 5.78 15 Government and fiscal policy subindex 5.78 15 Taxes as a % of current GSP 5.28 19 State bond rating 6.02 8 Security subindex 5.59 17 Security subindex 5.59 17 Crime index change 1999-2000, % 6.80 4 Violent crimes per 100,000 inhabitants 4.99 32 Murders per 100,000 inhabitants 4.72 32 Infrastructure subindex 6.01 6 Infrastructure subindex 6.01 6 % of households with computers 5.49 13 Mass transit availability 4.29 41 % of adults online 5.59 14 Travel time to work 5.92 9 Median household gross rent 5.54 15 Human resources subindex 6.30 7 Human resources subindex 6.30 7 % of population without health insurance 5.73 14 % of population born abroad 4.23 41 High school finishers as % of 18-year olds 6.30 6 Nonfederal physicians per 100,000 inhabitants 4.39 39 % of population that graduated from high school 6.15 4 Enrollment in degree-granting institutions per capita 5.99 6 % of adults in the labor force 6.88 3 Infant mortality rate, deaths per 1000 live births 5.32 20 Technology subindex 4.86 28 Technology subindex 4.86 28 Science & engineering grad. students per capita 5.40 15 Academic R&D funding relative to employment 4.33 42 High-tech payroll as % of total payroll 5.33 15 New patents issued per 100,000 inhabitants 4.28 41 Finance and cost subindex 4.84 30 Finance and cost subindex 4.84 30 Venture capital as % of GMP 4.53 41 Openness subindex 4.48 33 Openness subindex 4.48 33 Exports per capita 4.55 33 Domestic competition subindex 5.30 15 Domestic competition subindex 5.30 15 Net firm creation per 100,000 inhabitants 5.33 17 Cognetics entrepreneurial hot spot index 5.40 15 New publicly traded companies 4.92 19 Environmental policy subindex 5.73 10 Environmental policy subindex 5.73 10 Toxic release, pounds per capita 5.20 20 Serious pollution days p.a. 5.83 10

BH
I
Metro Area and State Competitiveness Report / Page 38
Inde
xIndex Overall Rank
LAS VEGAS 4.46 35
Las Vegas ranks last for technology and near last for government policy, human resources and finance. High crime rates and a low export level also represent disadvantages. The metro area’s strong competitive advantages are low taxes and dynamic entrepreneurship.
Competitive Advantages Competitive Disadvantages
Subindex/Variable Index Rank Subindex/Variable Index Rank
Government and fiscal policy subindex 4.09 41 Government and fiscal policy subindex 4.09 41 Taxes as a % of current GSP 5.89 7 Workers’ compensation collections per employee 2.47 48
Bond rating: S&P's/Moody's composite 4.92 30 State bond rating 4.73 33 Unemployment payments per unemployed worker 4.45 38 Security subindex 5.30 21 Security subindex 5.30 21 Crime index change 1999-2000, % 5.45 16 Violent crimes per 100,000 inhabitants 4.99 31 Thefts per 100,000 inhabitants 5.80 13 Murders per 100,000 inhabitants 4.48 41 Infrastructure subindex 4.66 31 Infrastructure subindex 4.66 31 Mass transit availability 5.03 19 % of households with computers 4.63 32 Travel time to work 5.46 18 Median household gross rent 4.30 39 Human resources subindex 3.64 48 Human resources subindex 3.64 48 % of population born abroad 5.77 8 % of population without health insurance 4.56 34 Infant mortality rate, deaths per 1000 live births 5.39 17 High school finishers as % of 18-year olds 4.62 33 % of population that graduated from high school 4.05 43 % of labor force represented by unions 4.44 31 Unemployment rate 3.68 44 % of adults in the labor force 3.92 45 Nonfederal physicians per 100,000 inhabitants 3.62 49 Technology subindex 3.21 50 Technology subindex 3.21 50 Academic R&D funding relative to employment 4.33 42 NIH support to institutions per capita 3.81 50 New patents issued per 100,000 inhabitants 4.15 48 Science & engineering grad. students per capita 3.16 50 Scientists and engineers in the labor force 3.31 50 High-tech payroll as % of total payroll 3.66 50 Finance and cost subindex 3.54 47 Finance and cost subindex 3.54 47 Venture capital as % of GMP 4.82 18 Bank deposits per capita 3.74 45 Cost of living 4.50 36 Openness subindex 6.25 5 Openness subindex 6.25 5 Air passengers per capita 7.96 1 Exports per capita 3.73 50 Domestic competition subindex 7.32 2 Domestic competition subindex 7.32 2 Net firm creation per 100,000 inhabitants 8.18 1 Cognetics entrepreneurial hot spot index 7.11 2 Environmental policy subindex 4.72 36 Environmental policy subindex 4.72 36 Electricity prices, $ per mbtu 5.48 16 Toxic release, pounds per capita 4.91 47 Serious pollution days p.a. 5.80 13 Pollution standards index 3.33 47

BH
I
Metro Area and State Competitiveness Report / Page 39
IndexIndex Overall Rank
LOS ANGELES 3.92 47
Ranking very near the bottom, Los Angeles shows poor performance in five of the nine subindexes. It ranks 50 for pollution standards and for the percentage of the population with a high school diploma. High computer and internet usage and percentage of foreign-born population are among the few advantages.
Competitive Advantages Competitive Disadvantages
Subindex/Variable Index Rank Subindex/Variable Index Rank
Government and fiscal policy subindex 4.66 31 Government and fiscal policy subindex 4.66 31 Unemployment payments per unemployed worker 5.74 12 Workers’ compensation collections per employee 4.99 36
State bond rating 3.11 46 Security subindex 5.10 24 Security subindex 5.10 24 Thefts per 100,000 inhabitants 6.48 6 Violent crimes per 100,000 inhabitants 4.10 41 Murders per 100,000 inhabitants 4.48 42 Infrastructure subindex 5.01 23 Infrastructure subindex 5.01 23 Mass transit availability 5.38 13 Travel time to work 3.80 43 % of households with computers 6.03 7 Median household gross rent 3.83 45 % of adults online 5.97 9 Human resources subindex 4.42 37 Human resources subindex 4.42 37 Enrollment in degree-granting institutions per capita 5.92 7 % of population without health insurance 3.94 41 % of population born abroad 7.62 2 High school finishers as % of 18-year olds 4.59 34 Infant mortality rate, deaths per 1000 live births 5.78 10 % of population that graduated from high school 2.29 50 Nonfederal physicians per 100,000 inhabitants 5.08 11 % of labor force represented by unions 4.33 34 Unemployment rate 3.66 46 % of adults in the labor force 4.54 35 Technology subindex 4.96 22 Technology subindex 4.96 22 NIH support to institutions per capita 5.43 11 Academic R&D funding relative to employment 4.60 34 Science & engineering grad. students per capita 5.20 17 High-tech payroll as % of total payroll 4.56 33 Scientists and engineers in the labor force 5.35 17 Finance and cost subindex 3.95 42 Finance and cost subindex 3.95 42 Venture capital as % of GMP 4.88 14 Bank deposits per capita 4.07 43 Cost of living 4.64 32 Openness subindex 4.35 36 Openness subindex 4.35 36 Air passengers per capita 4.33 36 Domestic competition subindex 4.96 22 Domestic competition subindex 4.96 22 Net firm creation per 100,000 inhabitants 5.56 16 Cognetics entrepreneurial hot spot index 4.54 36 Environmental policy subindex 3.06 49 Environmental policy subindex 3.06 49 Toxic release, pounds per capita 5.24 7 Electricity prices, $ per mbtu 3.64 42 Pollution standards index 2.41 50

BH
I
Metro Area and State Competitiveness Report / Page 40
Inde
xIndex Overall Rank
LOUISVILLE 4.87 24
A low cost of living, short commuting time and high labor participation rates are bright spots for the Louisville metro area. However, it ranks 49 for technology and 39 for its openness subindex. Poor human resources performance represents another disadvantage.
Competitive Advantages Competitive Disadvantages
Subindex/Variable Index Rank Subindex/Variable Index Rank
Government and fiscal policy subindex 5.04 27 Government and fiscal policy subindex 5.04 27
Workers’ compensation collections per employee 5.08 34
Bond rating: S&P's/Moody's composite 4.92 30 State bond rating 4.90 30 Unemployment payments per unemployed worker 5.02 32 Security subindex 5.59 16 Security subindex 5.59 16 Crime index change 1999-2000, % 5.45 15 Murders per 100,000 inhabitants 4.85 30 Thefts per 100,000 inhabitants 5.95 10 Infrastructure subindex 5.23 20 Infrastructure subindex 5.23 20 Travel time to work 5.93 8 % of households with computers 4.13 43 Median household gross rent 6.52 3 % of adults online 4.01 46 Human resources subindex 4.47 34 Human resources subindex 4.47 34 % of adults in the labor force 6.46 4 % of population that graduated from high school 4.62 37 Enrollment in degree-granting institutions per capita 4.08 42 % of population born abroad 4.00 48 Infant mortality rate, deaths per 1000 live births 4.27 37 Nonfederal physicians per 100,000 inhabitants 4.13 41 Technology subindex 3.80 49 Technology subindex 3.80 49 Academic R&D funding relative to employment 4.60 34 NIH support to institutions per capita 4.16 42 New patents issued per 100,000 inhabitants 4.29 40 Science & engineering grad. students per capita 3.87 46 Scientists and engineers in the labor force 3.75 47 High-tech payroll as % of total payroll 4.26 36 Finance and cost subindex 5.99 9 Finance and cost subindex 5.99 9 Bank deposits per capita 5.47 15 Cost of living 6.17 5 Openness subindex 4.28 39 Openness subindex 4.28 39 Air passengers per capita 4.19 42 Domestic competition subindex 4.51 33 Domestic competition subindex 4.51 33 Cognetics entrepreneurial hot spot index 5.61 11 Net firm creation per 100,000 inhabitants 3.73 49 New publicly traded companies 4.60 32 Environmental policy subindex 5.56 13 Environmental policy subindex 5.56 13 Electricity prices, $ per mbtu 6.60 2 Toxic release, pounds per capita 5.04 42 Pollution standards index 4.79 31 Serious pollution days p.a. 4.61 35

BH
I
Metro Area and State Competitiveness Report / Page 41
IndexIndex Overall Rank
MEMPHIS 3.84 48
Ranking in the 40's in the security, infrastructure, human resources, and technology subindexes brings Memphis to an overall ranking of 48. This metro area’s bright spots include a strong performance on the government and fiscal policy subindex and low crime rates.
Competitive Advantages Competitive Disadvantages
Subindex/Variable Index Rank Subindex/Variable Index Rank
Government and fiscal policy subindex 6.01 12 Government and fiscal policy subindex 6.01 12 Taxes as a % of current GSP 6.60 2 State bond rating 4.69 38 Workers’ compensation collections per employee 5.56 19 Bond rating: S&P's/Moody's composite 5.34 19 Unemployment payments per unemployed worker 5.64 16 Security subindex 3.72 44 Security subindex 3.72 44 Crime index change 1999-2000, % 7.56 2 Violent crimes per 100,000 inhabitants 2.64 50 Thefts per 100,000 inhabitants 4.35 38 Murders per 100,000 inhabitants 2.38 49 Infrastructure subindex 3.98 44 Infrastructure subindex 3.98 44 Median household gross rent 5.72 13 Mass transit availability 4.31 40 % of households with computers 3.71 48 % of adults online 4.10 42 Human resources subindex 2.91 49 Human resources subindex 2.91 49 % of population without health insurance 5.78 11 High school finishers as % of 18-year olds 4.03 42 % of labor force represented by unions 5.80 18 % of population that graduated from high school 4.21 41 Unemployment rate 4.16 40 Enrollment in degree-granting institutions per capita 3.98 43 % of adults in the labor force 4.14 41 % of population born abroad 4.08 46 Infant mortality rate, deaths per 1000 live births 1.11 50 Nonfederal physicians per 100,000 inhabitants 4.59 36 Technology subindex 3.87 46 Technology subindex 3.87 46 Academic R&D funding relative to employment 4.33 42 NIH support to institutions per capita 4.58 35 New patents issued per 100,000 inhabitants 4.26 42 Science & engineering grad. students per capita 3.78 49 Scientists and engineers in the labor force 4.08 41 High-tech payroll as % of total payroll 4.18 40 Finance and cost subindex 5.08 21 Finance and cost subindex 5.08 21 Cost of living 5.97 10 Bank deposits per capita 4.64 31 Venture capital as % of GMP 4.48 49 Openness subindex 5.40 17 Openness subindex 5.40 17 Exports per capita 5.11 17 Air passengers per capita 5.43 13 Domestic competition subindex 4.52 32 Domestic competition subindex 4.52 32 Cognetics entrepreneurial hot spot index 5.56 12 Net firm creation per 100,000 inhabitants 3.81 48 New publicly traded companies 4.59 33 Environmental policy subindex 4.65 37 Environmental policy subindex 4.65 37 Electricity prices, $ per mbtu 5.77 9 Toxic release, pounds per capita 5.13 33 Pollution standards index 4.64 35 Serious pollution days p.a. 3.87 47

BH
I
Metro Area and State Competitiveness Report / Page 42
Inde
xIndex Overall Rank
MIAMI 4.49 34
Ranking 34 overall, the strong areas for Miami are its economic openness and environmental policy subindexes. Areas that create the most urgent needs for improvement are security and human resources, specifically high crime and low education rates.
Competitive Advantages Competitive Disadvantages
Subindex/Variable Index Rank Subindex/Variable Index Rank
Government and fiscal policy subindex 4.22 38 Government and fiscal policy subindex 4.22 38 Workers’ compensation collections per employee 5.56 12 Taxes as a % of current GSP 4.53 37 State bond rating 5.13 20 Bond rating: S&P's/Moody's composite 1.95 50 Unemployment payments per unemployed worker 5.65 15 Security subindex 3.14 49 Security subindex 3.14 49 Crime index change 1999-2000, % 4.24 38 Violent crimes per 100,000 inhabitants 2.85 49 Thefts per 100,000 inhabitants 3.59 47 Infrastructure subindex 4.17 41 Infrastructure subindex 4.17 41 Mass transit availability 5.63 9 Travel time to work 3.77 45 Median household gross rent 4.37 38 Human resources subindex 3.99 46 Human resources subindex 3.99 46 % of labor force represented by unions 5.83 13 % of population without health insurance 4.14 36 % of population born abroad 8.81 1 High school finishers as % of 18-year olds 3.58 48 Nonfederal physicians per 100,000 inhabitants 5.07 15 % of population that graduated from high school 2.56 49 Unemployment rate 3.45 48 Enrollment in degree-granting institutions per capita 3.85 45 % of adults in the labor force 3.60 47 Technology subindex 3.88 45 Technology subindex 3.88 45 Academic R&D funding relative to employment 5.00 15 NIH support to institutions per capita 3.96 44 New patents issued per 100,000 inhabitants 4.29 39 Science & engineering grad. students per capita 4.00 39 Scientists and engineers in the labor force 3.85 42 High-tech payroll as % of total payroll 4.17 42 Finance and cost subindex 5.31 17 Finance and cost subindex 5.31 17 Bank deposits per capita 5.52 13 Venture capital as % of GMP 4.80 19 Openness subindex 7.48 2 Openness subindex 7.48 2 Exports per capita 5.71 10 Air passengers per capita 7.65 2 Domestic competition subindex 4.77 25 Domestic competition subindex 4.77 25 Cognetics entrepreneurial hot spot index 5.40 15 Net firm creation per 100,000 inhabitants 4.13 41 New publicly traded companies 4.98 14 Environmental policy subindex 5.89 8 Environmental policy subindex 5.89 8 Toxic release, pounds per capita 5.24 4 Electricity prices, $ per mbtu 4.95 32 Pollution standards index 5.63 16 Serious pollution days p.a. 5.80 12

BH
I
Metro Area and State Competitiveness Report / Page 43
IndexIndex Overall Rank
MILWAUKEE 4.95 22
Milwaukee has a solid advantage in infrastructure, human resources and environmental policy. Attention to the advancement of the health care sector could further improve the human resources subindex ranking. Weaknesses lie in government policy, most notably in high tax rates, and in economic openness.
Competitive Advantages Competitive Disadvantages
Subindex/Variable Index Rank Subindex/Variable Index Rank
Government and fiscal policy subindex 4.15 39 Government and fiscal policy subindex 4.15 39 Workers’ compensation collections per employee 5.56 7 Taxes as a % of current GSP 3.17 48 Bond rating: S&P's/Moody's composite 5.34 19 State bond rating 4.32 40 Unemployment payments per unemployed worker 4.23 41 Security subindex 4.69 32 Security subindex 4.69 32 Violent crimes per 100,000 inhabitants 5.65 13 Crime index change 1999-2000, % 4.14 41 Murders per 100,000 inhabitants 4.51 39 Infrastructure subindex 5.59 11 Infrastructure subindex 5.59 11 Mass transit availability 5.01 20 % of adults online 4.52 36 Travel time to work 6.13 5 Median household gross rent 5.50 16 Human resources subindex 5.41 14 Human resources subindex 5.41 14 % of population without health insurance 6.69 2 % of labor force represented by unions 4.45 30 High school finishers as % of 18-year olds 5.87 9 Unemployment rate 4.95 30 % of population that graduated from high school 5.48 17 % of population born abroad 4.33 35 Enrollment in degree-granting institutions per capita 5.54 15 Infant mortality rate, deaths per 1000 live births 3.81 47 % of adults in the labor force 5.81 10 Nonfederal physicians per 100,000 inhabitants 4.66 30 Technology subindex 4.42 38 Technology subindex 4.42 38 New patents issued per 100,000 inhabitants 4.99 19 Academic R&D funding relative to employment 4.46 39 Scientists and engineers in the labor force 3.60 48 High-tech payroll as % of total payroll 4.42 34 Finance and cost subindex 5.05 22 Finance and cost subindex 5.05 22 Bank deposits per capita 5.50 14 Venture capital as % of GMP 4.57 38 Openness subindex 4.27 40 Openness subindex 4.27 40 Air passengers per capita 4.15 44 Domestic competition subindex 4.54 30 Domestic competition subindex 4.54 30 Net firm creation per 100,000 inhabitants 4.38 34 New publicly traded companies 4.50 39 Environmental policy subindex 6.65 3 Environmental policy subindex 6.65 3 Electricity prices, $ per mbtu 5.84 7 Pollution standards index 6.63 2

BH
I
Metro Area and State Competitiveness Report / Page 44
Inde
xIndex Overall Rank
MINNEAPOLIS 6.79 5
Minneapolis garners a number 5 overall ranking with top ten listings in the environmental policy, openness, human resources and infrastructure subindexes. This metro area is a standout for the highest percentage of high school graduates in its population. A significant tax burden keeps this city from ranking higher overall.
Competitive Advantages Competitive Disadvantages
Subindex/Variable Index Rank Subindex/Variable Index Rank
Government and fiscal policy subindex 5.18 25 Government and fiscal policy subindex 5.18 25 Bond rating: S&P's/Moody's composite 5.99 7 Taxes as a % of current GSP 3.58 46 State bond rating 6.27 7 Workers’ compensation collections per employee 5.35 31 Unemployment payments per unemployed worker 4.31 39 Security subindex 5.73 12 Security subindex 5.73 12 Violent crimes per 100,000 inhabitants 6.01 8 Murders per 100,000 inhabitants 5.83 12 Infrastructure subindex 5.90 7 Infrastructure subindex 5.90 7 % of households with computers 6.07 6 Mass transit availability 4.60 31 % of adults online 5.42 18 Travel time to work 5.65 13 Human resources subindex 7.20 2 Human resources subindex 7.20 2 % of population without health insurance 6.23 5 % of labor force represented by unions 4.29 39 High school finishers as % of 18-year olds 6.74 4 % of population that graduated from high school 7.23 1 Unemployment rate 6.03 8 Enrollment in degree-granting institutions per capita 5.69 13 % of adults in the labor force 6.94 2 Infant mortality rate, deaths per 1000 live births 5.72 12 Nonfederal physicians per 100,000 inhabitants 5.14 10 Technology subindex 5.50 11 Technology subindex 5.50 11 NIH support to institutions per capita 5.16 20 New patents issued per 100,000 inhabitants 6.23 5 Scientists and engineers in the labor force 5.53 12 High-tech payroll as % of total payroll 5.34 14 Finance and cost subindex 4.75 32 Finance and cost subindex 4.75 32 Venture capital as % of GMP 4.95 12 Cost of living 4.81 31 Openness subindex 6.25 6 Openness subindex 6.25 6 Exports per capita 5.98 6 Air passengers per capita 5.71 10 Domestic competition subindex 5.52 14 Domestic competition subindex 5.52 14 Net firm creation per 100,000 inhabitants 6.20 8 New publicly traded companies 4.95 16 Environmental policy subindex 6.47 4 Environmental policy subindex 6.47 4 Electricity prices, $ per mbtu 5.65 10 Pollution standards index 5.83 14 Serious pollution days p.a. 6.03 1

BH
I
Metro Area and State Competitiveness Report / Page 45
IndexIndex Overall Rank
NASHVILLE 3.99 45
Even with the lowest tax burden and workers’ compensation collections, Nashville’s overall rank is at 45. The human resources subindex does poorly due to an uneducated workforce. The security and infrastructure subindexes are also among the problems for this metro area.
Competitive Advantages Competitive Disadvantages
Subindex/Variable Index Rank Subindex/Variable Index Rank
Government and fiscal policy subindex 5.84 14 Government and fiscal policy subindex 5.84 14 Taxes as a % of current GSP 6.97 1 State bond rating 4.73 33 Workers’ compensation collections per employee 5.56 1 Unemployment payments per unemployed worker 4.74 36 Bond rating: S&P's/Moody's composite 5.34 19 Security subindex 3.60 45 Security subindex 3.60 45 Crime index change 1999-2000, % 5.22 20 Violent crimes per 100,000 inhabitants 2.85 48 Thefts per 100,000 inhabitants 4.04 43 Murders per 100,000 inhabitants 4.51 38 Infrastructure subindex 3.49 48 Infrastructure subindex 3.49 48 Mass transit availability 4.06 45 % of households with computers 3.93 44 % of adults online 4.05 44 Travel time to work 4.97 32 Human resources subindex 4.31 40 Human resources subindex 4.31 40 % of population without health insurance 5.89 10 High school finishers as % of 18-year olds 2.90 50 % of labor force represented by unions 5.80 19 % of population that graduated from high school 4.65 36 Enrollment in degree-granting institutions per capita 3.96 44 % of population born abroad 4.25 38 Technology subindex 3.97 42 Technology subindex 3.97 42 New patents issued per 100,000 inhabitants 4.15 47 Science & engineering grad. students per capita 3.80 48 Scientists and engineers in the labor force 4.14 40 High-tech payroll as % of total payroll 4.13 43 Finance and cost subindex 5.82 12 Finance and cost subindex 5.82 12 Bank deposits per capita 5.35 16 Cost of living 5.97 10 Openness subindex 4.44 34 Openness subindex 4.44 34 Exports per capita 4.36 37 Domestic competition subindex 4.51 34 Domestic competition subindex 4.51 34 Net firm creation per 100,000 inhabitants 4.05 45 Environmental policy subindex 4.80 34 Environmental policy subindex 4.80 34 Electricity prices, $ per mbtu 5.78 8 Toxic release, pounds per capita 5.12 35 Pollution standards index 4.56 36 Serious pollution days p.a. 4.23 42

BH
I
Metro Area and State Competitiveness Report / Page 46
Inde
xIndex Overall Rank
NEW ORLEANS 2.70 50
Placing last in the overall index, New Orleans has many areas needing improvement. The metro area ranks at 50 in both the security and the human resources subindexes. Attention to these areas is critical. Of secondary concern are the poor bond ratings, weak infrastructure and lack of a technology sector. Low rents and cost of living are strengths.
Competitive Advantages Competitive Disadvantages
Subindex/Variable Index Rank Subindex/Variable Index Rank
Government and fiscal policy subindex 4.27 37 Government and fiscal policy subindex 4.27 37 Taxes as a % of current GSP 5.81 8 Bond rating: S&P's/Moody's composite 3.01 47 Unemployment payments per unemployed worker 6.39 1 State bond rating 2.30 50 Security subindex 2.05 50 Security subindex 2.05 50 Crime index change 1999-2000, % 3.70 47 Violent crimes per 100,000 inhabitants 4.02 43 Thefts per 100,000 inhabitants 4.49 34 Murders per 100,000 inhabitants 0.71 50 Infrastructure subindex 4.19 40 Infrastructure subindex 4.19 40 Median household gross rent 6.23 6 % of households with computers 3.06 50 % of adults online 4.75 31 Travel time to work 4.59 37 Human resources subindex 2.45 50 Human resources subindex 2.45 50 % of population without health insurance 3.69 45 High school finishers as % of 18-year olds 4.09 40 % of population that graduated from high school 3.60 45 Unemployment rate 2.87 49 Enrollment in degree-granting institutions per capita 4.56 30 % of adults in the labor force 2.50 50 % of population born abroad 4.27 37 Infant mortality rate, deaths per 1000 live births 4.07 43 Technology subindex 3.82 48 Technology subindex 3.82 48 NIH support to institutions per capita 4.05 43 New patents issued per 100,000 inhabitants 4.10 49 Science & engineering grad. students per capita 4.72 32 Scientists and engineers in the labor force 3.54 49 High-tech payroll as % of total payroll 3.84 47 Finance and cost subindex 5.10 20 Finance and cost subindex 5.10 20 Cost of living 5.95 12 Bank deposits per capita 4.61 32 Venture capital as % of GMP 4.56 40 Openness subindex 4.58 30 Openness subindex 4.58 30 Air passengers per capita 4.90 20 Exports per capita 4.53 34 Domestic competition subindex 4.14 44 Domestic competition subindex 4.14 44 Net firm creation per 100,000 inhabitants 3.92 46 New publicly traded companies 4.36 43 Environmental policy subindex 4.77 35 Environmental policy subindex 4.77 35 Electricity prices, $ per mbtu 5.63 11 Toxic release, pounds per capita 4.93 46 Pollution standards index 4.56 37 Serious pollution days p.a. 4.52 38

BH
I
Metro Area and State Competitiveness Report / Page 47
Index
Index Overall Rank
NEW YORK 4.29 37
Although occupying top spots in mass transit and bank deposits, New York City still ranks 37 overall. Reasons for this relatively poor showing include weak government and environmental policies. This metro area would also benefit from improvements to education, which would bring up the human resources subindex performance.
Competitive Advantages Competitive Disadvantages
Subindex/Variable Index Rank Subindex/Variable Index Rank
Government and fiscal policy subindex 3.30 48 Government and fiscal policy subindex 3.30 48
Taxes as a % of current GSP 3.21 47
Workers’ compensation collections per employee 4.83 40 Bond rating: S&P's/Moody's composite 3.85 43 State bond rating 4.13 42 Unemployment payments per unemployed worker 4.20 43 Security subindex 5.46 20 Security subindex 5.46 20 Thefts per 100,000 inhabitants 6.50 4 Crime index change 1999-2000, % 4.21 39 Infrastructure subindex 5.27 18 Infrastructure subindex 5.27 18 Mass transit availability 9.67 1 Travel time to work 1.99 50 % of adults online 5.23 20 Median household gross rent 3.57 49 Human resources subindex 4.44 36 Human resources subindex 4.44 36 % of population born abroad 6.79 4 % of population without health insurance 5.03 30 Nonfederal physicians per 100,000 inhabitants 6.84 6 High school finishers as % of 18-year olds 4.54 35 % of population that graduated from high school 4.09 42 % of labor force represented by unions 3.18 48 Unemployment rate 4.19 38 Enrollment in degree-granting institutions per capita 4.54 31 % of adults in the labor force 3.49 48 Technology subindex 5.33 14 Technology subindex 5.33 14 NIH support to institutions per capita 5.25 16 New patents issued per 100,000 inhabitants 4.99 20 Science & engineering grad. students per capita 5.71 9 Scientists and engineers in the labor force 5.62 11 Finance and cost subindex 5.89 11 Finance and cost subindex 5.89 11 Bank deposits per capita 7.92 1 Cost of living 3.40 44 Venture capital as % of GMP 4.85 17 Openness subindex 4.38 35 Openness subindex 4.38 35 Air passengers per capita 4.23 41 Domestic competition subindex 4.41 37 Domestic competition subindex 4.41 37 New publicly traded companies 5.10 10 Cognetics entrepreneurial hot spot index 3.79 46 Environmental policy subindex 3.55 46 Environmental policy subindex 3.55 46 Toxic release, pounds per capita 5.24 5 Electricity prices, $ per mbtu 2.83 49 Serious pollution days p.a. 4.45 39

BH
I
Metro Area and State Competitiveness Report / Page 48
Inde
xIndex Overall Rank
NORFOLK 4.65 32
Even with strong government and fiscal policy and infrastructure rankings, Norfolk still ranks 32 overall. This is due to poor marks in the openness, finance, and domestic competition subindexes. This metro area places last for both new patents issued and bank deposits per capita.
Competitive Advantages Competitive Disadvantages
Subindex/Variable Index Rank Subindex/Variable Index Rank
Government and fiscal policy subindex 6.34 2 Government and fiscal policy subindex 6.34 2 Taxes as a % of current GSP 5.63 13 Workers’ compensation collections per employee 5.56 17 State bond rating 6.33 6 Unemployment payments per unemployed worker 5.90 7 Security subindex 4.55 38 Security subindex 4.55 38 Violent crimes per 100,000 inhabitants 5.40 19 Crime index change 1999-2000, % 4.39 35 Murders per 100,000 inhabitants 4.42 43 Infrastructure subindex 5.88 8 Infrastructure subindex 5.88 8 % of households with computers 5.48 14 Mass transit availability 4.47 33 % of adults online 5.94 10 Travel time to work 5.52 15 Human resources subindex 4.97 25 Human resources subindex 4.97 25 % of population without health insurance 5.29 20 % of adults in the labor force 3.02 49 High school finishers as % of 18-year olds 5.56 15 % of population born abroad 4.23 43 % of population that graduated from high school 5.57 13 Infant mortality rate, deaths per 1000 live births 4.27 37 % of labor force represented by unions 6.16 4 Unemployment rate 5.72 13 Technology subindex 4.58 33 Technology subindex 4.58 33 Science & engineering grad. students per capita 5.45 12 Academic R&D funding relative to employment 4.60 34 Scientists and engineers in the labor force 5.48 13 NIH support to institutions per capita 4.42 37 New patents issued per 100,000 inhabitants 4.04 50 High-tech payroll as % of total payroll 4.25 37 Finance and cost subindex 3.70 44 Finance and cost subindex 3.70 44 Cost of living 5.44 18 Bank deposits per capita 3.32 50 Venture capital as % of GMP 4.50 46 Openness subindex 3.40 49 Openness subindex 3.40 49 Exports per capita 3.96 47 Air passengers per capita 3.87 49 Domestic competition subindex 4.26 42 Domestic competition subindex 4.26 42 Cognetics entrepreneurial hot spot index 4.44 39 New publicly traded companies 4.36 43 Environmental policy subindex 5.86 9 Environmental policy subindex 5.86 9 Electricity prices, $ per mbtu 5.61 13 Serious pollution days p.a. 4.91 33 Pollution standards index 5.90 11

BH
I
Metro Area and State Competitiveness Report / Page 49
IndexIndex Overall Rank
OKLAHOMA CITY 4.28 39
Scoring in the top ten for the environmental subindex is Oklahoma City’s only bright spot. The metro area is last in economic openness and has significant weaknesses in the human resources and technology subindexes.
Competitive Advantages Competitive Disadvantages
Subindex/Variable Index Rank Subindex/Variable Index Rank
Government and fiscal policy subindex 5.06 26 Government and fiscal policy subindex 5.06 26 Bond rating: S&P's/Moody's composite 5.34 19 Taxes as a % of current GSP 4.84 33 Unemployment payments per unemployed worker 5.66 14 Workers’ compensation collections per employee 5.02 35 State bond rating 4.32 40 Security subindex 4.98 27 Security subindex 4.98 27 Crime index change 1999-2000, % 6.25 6 Thefts per 100,000 inhabitants 3.01 49 Murders per 100,000 inhabitants 5.51 17 Infrastructure subindex 4.72 29 Infrastructure subindex 4.72 29 Travel time to work 6.23 4 Mass transit availability 3.88 49 Median household gross rent 6.63 2 % of households with computers 3.12 49 % of adults online 4.63 34 Human resources subindex 4.48 33 Human resources subindex 4.48 33 % of labor force represented by unions 5.69 20 % of population without health insurance 3.64 46 Unemployment rate 5.99 10 % of adults in the labor force 4.32 39 Infant mortality rate, deaths per 1000 live births 5.52 15 % of population born abroad 4.38 33 Nonfederal physicians per 100,000 inhabitants 3.37 50 Technology subindex 3.93 43 Technology subindex 3.93 43 NIH support to institutions per capita 3.92 49 New patents issued per 100,000 inhabitants 4.22 44 Science & engineering grad. students per capita 3.85 47 High-tech payroll as % of total payroll 4.01 45 Finance and cost subindex 4.91 27 Finance and cost subindex 4.91 27 Cost of living 6.07 9 Bank deposits per capita 4.21 41 Venture capital as % of GMP 4.58 35 Openness subindex 3.37 50 Openness subindex 3.37 50 Exports per capita 3.74 49 Air passengers per capita 4.06 45 Domestic competition subindex 4.58 28 Domestic competition subindex 4.58 28 New publicly traded companies 5.20 9 Net firm creation per 100,000 inhabitants 4.13 42 Cognetics entrepreneurial hot spot index 4.76 30 Environmental policy subindex 5.94 7 Environmental policy subindex 5.94 7 Electricity prices, $ per mbtu 5.95 6 Toxic release, pounds per capita 5.23 16 Serious pollution days p.a. 5.52 19

BH
I
Metro Area and State Competitiveness Report / Page 50
Inde
xIndex Overall Rank
ORLANDO 4.56 33
A problem area for Orlando is the security index. It has the poorest crime index change of any metro area considered. Other problem areas include the technology subindex, where research funding and issuance of new patents lag. Bright spots that help the metro area rank 33 overall are the openness to business and domestic competition subindexes.
Competitive Advantages Competitive Disadvantages
Subindex/Variable Index Rank Subindex/Variable Index Rank
Government and fiscal policy subindex 5.38 20 Government and fiscal policy subindex 5.38 20 Workers’ compensation collections per employee 5.56 12 Taxes as a % of current GSP 4.53 37 State bond rating 5.13 20 Bond rating: S&P's/Moody's composite 4.92 30 Unemployment payments per unemployed worker 5.94 5 Security subindex 3.37 48 Security subindex 3.37 48 Crime index change 1999-2000, % 3.19 50 Violent crimes per 100,000 inhabitants 3.29 45 Thefts per 100,000 inhabitants 4.22 39 Infrastructure subindex 4.02 42 Infrastructure subindex 4.02 42 % of adults online 4.72 33 Travel time to work 4.51 38 Median household gross rent 4.41 37 Human resources subindex 5.26 18 Human resources subindex 5.26 18 % of labor force represented by unions 5.83 13 % of population without health insurance 4.14 36 Unemployment rate 5.74 12 High school finishers as % of 18-year olds 4.52 36 % of adults in the labor force 6.00 7 Enrollment in degree-granting institutions per capita 3.85 45 % of population born abroad 5.19 17 Infant mortality rate, deaths per 1000 live births 5.65 13 Nonfederal physicians per 100,000 inhabitants 5.07 15 Technology subindex 3.86 47 Technology subindex 3.86 47 Academic R&D funding relative to employment 4.33 42 NIH support to institutions per capita 3.96 44 New patents issued per 100,000 inhabitants 4.19 45 Science & engineering grad. students per capita 4.00 39 Scientists and engineers in the labor force 3.85 42 Finance and cost subindex 4.73 33 Finance and cost subindex 4.73 33 Cost of living 5.62 13 Bank deposits per capita 4.16 42 Venture capital as % of GMP 4.86 15 Openness subindex 5.87 9 Openness subindex 5.87 9 Air passengers per capita 7.17 4 Exports per capita 4.02 44 Domestic competition subindex 5.29 16 Domestic competition subindex 5.29 16 Net firm creation per 100,000 inhabitants 6.03 10 New publicly traded companies 4.36 43 Cognetics entrepreneurial hot spot index 5.24 19 Environmental policy subindex 5.35 19 Environmental policy subindex 5.35 19 Toxic release, pounds per capita 5.21 17 Electricity prices, $ per mbtu 4.95 32 Serious pollution days p.a. 5.77 14 Pollution standards index 4.74 33

BH
I
Metro Area and State Competitiveness Report / Page 51
IndexIndex Overall Rank
PHILADELPHIA 4.04 43
Philadelphia's low rank of 43 overall is a result of its poor government and fiscal policy and inadequate human resources. High unemployment and strong unions should be the focus of reforms to human resources. An evident strength in technology should be nurtured to capitalize on this metro area’s strength.
Competitive Advantages Competitive Disadvantages
Subindex/Variable Index Rank Subindex/Variable Index Rank
Government and fiscal policy subindex 3.80 44 Government and fiscal policy subindex 3.80 44
Taxes as a % of current GSP 4.64 35
Bond rating: S&P's/Moody's composite 3.01 47 Unemployment payments per unemployed worker 3.59 45 Security subindex 4.61 36 Security subindex 4.61 36 Thefts per 100,000 inhabitants 5.59 18 Crime index change 1999-2000, % 4.24 37 Violent crimes per 100,000 inhabitants 4.55 37 Murders per 100,000 inhabitants 4.69 34 Infrastructure subindex 4.47 38 Infrastructure subindex 4.47 38 Mass transit availability 5.23 15 Travel time to work 4.15 42 Median household gross rent 4.81 30 Human resources subindex 4.28 41 Human resources subindex 4.28 41 % of population without health insurance 6.15 7 High school finishers as % of 18-year olds 4.67 30 Nonfederal physicians per 100,000 inhabitants 5.71 9 % of population that graduated from high school 4.80 34 % of labor force represented by unions 4.23 41 Unemployment rate 4.01 42 Enrollment in degree-granting institutions per capita 4.29 39 % of adults in the labor force 4.33 38 Infant mortality rate, deaths per 1000 live births 4.47 36 Technology subindex 4.98 20 Technology subindex 4.98 20 NIH support to institutions per capita 5.19 19 New patents issued per 100,000 inhabitants 5.02 15 High-tech payroll as % of total payroll 4.96 19 Finance and cost subindex 5.04 23 Finance and cost subindex 5.04 23 Bank deposits per capita 6.22 7 Cost of living 4.08 40 Openness subindex 4.53 32 Openness subindex 4.53 32 Air passengers per capita 4.54 30 Domestic competition subindex 4.42 36 Domestic competition subindex 4.42 36 New publicly traded companies 5.00 12 Net firm creation per 100,000 inhabitants 4.50 32 Cognetics entrepreneurial hot spot index 4.24 40 Environmental policy subindex 4.82 32 Environmental policy subindex 4.82 32 Toxic release, pounds per capita 5.21 19 Electricity prices, $ per mbtu 4.38 40

BH
I
Metro Area and State Competitiveness Report / Page 52
Inde
xIndex Overall Rank
PHOENIX 4.80 27
Ranking 27 overall, Phoenix’s advantages lie in low unionization, high college attendance, and a focus on entrepreneurs. Phoenix lacks solid environmental policies, has a high cost of living and low bank deposit rate. While it has high crime rates, placing well for the crime index change shows improvements are underway in this area.
Competitive Advantages Competitive Disadvantages
Subindex/Variable Index Rank Subindex/Variable Index Rank
Government and fiscal policy subindex 5.47 19 Government and fiscal policy subindex 5.47 19 Bond rating: S&P's/Moody's composite 5.71 13 Workers’ compensation collections per employee 4.69 42 Unemployment payments per unemployed worker 6.17 4 State bond rating 4.73 33 Security subindex 4.79 30 Security subindex 4.79 30 Crime index change 1999-2000, % 5.73 9 Violent crimes per 100,000 inhabitants 4.99 30 Thefts per 100,000 inhabitants 4.03 44 Murders per 100,000 inhabitants 4.74 31 Infrastructure subindex 4.74 28 Infrastructure subindex 4.74 28 % of households with computers 5.43 15 Mass transit availability 4.44 35 Travel time to work 4.81 34 Median household gross rent 4.67 34 Human resources subindex 5.11 22 Human resources subindex 5.11 22 % of labor force represented by unions 6.15 6 % of population without health insurance 4.44 35 Unemployment rate 5.66 15 High school finishers as % of 18-year olds 3.95 44 Enrollment in degree-granting institutions per capita 6.90 3 % of population that graduated from high school 4.80 33 % of population born abroad 5.46 12 % of adults in the labor force 3.90 46 Nonfederal physicians per 100,000 inhabitants 4.18 40 Technology subindex 4.51 34 Technology subindex 4.51 34 New patents issued per 100,000 inhabitants 5.01 17 Academic R&D funding relative to employment 4.46 39 High-tech payroll as % of total payroll 5.32 16 NIH support to institutions per capita 4.16 41 Science & engineering grad. students per capita 4.35 37 Scientists and engineers in the labor force 4.63 34 Finance and cost subindex 3.97 41 Finance and cost subindex 3.97 41 Bank deposits per capita 4.33 37 Cost of living 4.57 34 Openness subindex 5.42 15 Openness subindex 5.42 15 Air passengers per capita 5.66 12 Domestic competition subindex 6.46 6 Domestic competition subindex 6.46 6 Net firm creation per 100,000 inhabitants 5.65 15 Cognetics entrepreneurial hot spot index 7.65 1 Environmental policy subindex 3.69 43 Environmental policy subindex 3.69 43 Electricity prices, $ per mbtu 4.69 39 Toxic release, pounds per capita 4.73 49 Pollution standards index 2.84 49

BH
I
Metro Area and State Competitiveness Report / Page 53
IndexIndex Overall Rank
PITTSBURGH 4.94 23
With a strong showing in security and finance, Pittsburgh ranks 23 overall. Infrastructure is solid with the lowest housing rental cost. Areas in need of improvement are the domestic competition and government and fiscal policy subindexes, which come in at 47 and 45 respectively.
Competitive Advantages Competitive Disadvantages
Subindex/Variable Index Rank Subindex/Variable Index Rank
Government and fiscal policy subindex 3.74 45 Government and fiscal policy subindex 3.74 45
Taxes as a % of current GSP 4.55 36
Workers’ compensation collections per employee 5.37 30 Bond rating: S&P's/Moody's composite 3.65 44 State bond rating 4.73 33 Unemployment payments per unemployed worker 3.17 48 Security subindex 6.36 3 Security subindex 6.36 3 Violent crimes per 100,000 inhabitants 6.12 6 Crime index change 1999-2000, % 4.74 31 Thefts per 100,000 inhabitants 6.55 3 Murders per 100,000 inhabitants 5.86 11 Infrastructure subindex 5.04 22 Infrastructure subindex 5.04 22 Mass transit availability 5.62 10 % of households with computers 4.45 37 Median household gross rent 6.68 1 % of adults online 3.31 48 Travel time to work 5.01 30 Human resources subindex 5.22 19 Human resources subindex 5.22 19 % of population without health insurance 6.57 3 % of labor force represented by unions 4.28 40 High school finishers as % of 18-year olds 6.60 5 Unemployment rate 3.96 43 % of population that graduated from high school 5.68 10 Enrollment in degree-granting institutions per capita 4.53 32 Nonfederal physicians per 100,000 inhabitants 5.75 8 % of adults in the labor force 4.71 31 % of population born abroad 3.99 49 Infant mortality rate, deaths per 1000 live births 4.80 30 Technology subindex 4.96 23 Technology subindex 4.96 23 Academic R&D funding relative to employment 5.13 11 Scientists and engineers in the labor force 4.41 37 NIH support to institutions per capita 5.73 6 High-tech payroll as % of total payroll 4.38 35 Science & engineering grad. students per capita 5.27 16 Finance and cost subindex 6.09 8 Finance and cost subindex 6.09 8 Bank deposits per capita 6.71 5 Openness subindex 4.66 29 Openness subindex 4.66 29 Air passengers per capita 5.10 18 Exports per capita 4.43 36 Domestic competition subindex 3.69 47 Domestic competition subindex 3.69 47 Net firm creation per 100,000 inhabitants 4.07 44 Cognetics entrepreneurial hot spot index 3.53 47 New publicly traded companies 4.58 34 Environmental policy subindex 4.99 26 Environmental policy subindex 4.99 26 Serious pollution days p.a. 5.51 20 Electricity prices, $ per mbtu 5.04 30 Toxic release, pounds per capita 4.78 48 Pollution standards index 4.69 34

BH
I
Metro Area and State Competitiveness Report / Page 54
Inde
xIndex Overall Rank
PORTLAND 5.89 9
With a high bond rating, many computers in households and overall solid environmental polices, Portland lands a spot at number 9. Finance is a weak area, especially the high cost of living. Improvements could also be made with attention to workers’ compensation collections and unemployment payments.
Competitive Advantages Competitive Disadvantages
Subindex/Variable Index Rank Subindex/Variable Index Rank
Government and fiscal policy subindex 4.82 29 Government and fiscal policy subindex 4.82 29 Taxes as a % of current GSP 5.79 10 Workers’ compensation collections per employee 3.42 45 Bond rating: S&P's/Moody's composite 6.19 1 State bond rating 4.85 31 Unemployment payments per unemployed worker 4.25 40 Security subindex 5.51 18 Security subindex 5.51 18 Violent crimes per 100,000 inhabitants 5.67 12 Thefts per 100,000 inhabitants 4.16 41 Murders per 100,000 inhabitants 6.26 2 Infrastructure subindex 7.02 3 Infrastructure subindex 7.02 3 Mass transit availability 5.67 8 Median household gross rent 4.70 33 % of households with computers 6.89 3 % of adults online 5.88 11 Travel time to work 5.52 16 Human resources subindex 5.66 10 Human resources subindex 5.66 10 High school finishers as % of 18- year olds 5.69 14 % of labor force represented by unions 4.43 32 % of population that graduated from high school 6.01 6 Unemployment rate 4.68 33 % of adults in the labor force 5.89 8 % of population born abroad 5.06 19 Infant mortality rate, deaths per 1000 live births 6.05 7 Technology subindex 4.84 29 Technology subindex 4.84 29 NIH support to institutions per capita 5.24 17 Academic R&D funding relative to employment 4.60 34 New patents issued per 100,000 inhabitants 5.20 11 Science & engineering grad. students per capita 4.04 38 Scientists and engineers in the labor force 5.44 15 Finance and cost subindex 3.62 46 Finance and cost subindex 3.62 46 Venture capital as % of GMP 4.96 11 Bank deposits per capita 4.29 39 Cost of living 3.91 41 Openness subindex 5.55 14 Openness subindex 5.55 14 Exports per capita 6.01 5 Domestic competition subindex 4.57 29 Domestic competition subindex 4.57 29 New publicly traded companies 5.03 11 Cognetics entrepreneurial hot spot index 4.17 41 Environmental policy subindex 7.16 2 Environmental policy subindex 7.16 2 Electricity prices, $ per mbtu 6.41 3 Pollution standards index 6.42 3 Serious pollution days p.a. 5.92 3

BH
I
Metro Area and State Competitiveness Report / Page 55
IndexIndex Overall Rank
PROVIDENCE 4.99 21
Providence receives high marks in security, infrastructure and human resources. It also has the number 1 ranking in health insurance coverage and the lowest infant mortality rates. Improvements can be made in both the government and fiscal policy and openness subindexes.
Competitive Advantages Competitive Disadvantages
Subindex/Variable Index Rank Subindex/Variable Index Rank
Government and fiscal policy subindex 3.55 46 Government and fiscal policy subindex 3.55 46
Taxes as a % of current GSP 3.93 42
Bond rating: S&P's/Moody's composite 4.07 41 State bond rating 4.00 43 Unemployment payments per unemployed worker 3.48 46 Security subindex 6.18 8 Security subindex 6.18 8 Violent crimes per 100,000 inhabitants 6.33 4 Thefts per 100,000 inhabitants 5.96 8 Murders per 100,000 inhabitants 5.62 15 Infrastructure subindex 5.85 9 Infrastructure subindex 5.85 9 % of households with computers 5.07 18 Travel time to work 5.71 12 Median household gross rent 6.04 8 Human resources subindex 5.91 9 Human resources subindex 5.91 9 % of population without health insurance 6.81 1 High school finishers as % of 18-year olds 4.00 43 Enrollment in degree-granting institutions per capita 7.66 2 % of population that graduated from high school 3.15 48 % of population born abroad 5.19 16 % of labor force represented by unions 4.32 38 Infant mortality rate, deaths per 1000 live births 6.90 1 Unemployment rate 4.76 31 Nonfederal physicians per 100,000 inhabitants 6.76 7 % of adults in the labor force 3.95 44 Technology subindex 5.34 13 Technology subindex 5.34 13 Academic R&D funding relative to employment 5.00 15 New patents issued per 100,000 inhabitants 4.56 32 NIH support to institutions per capita 6.60 3 High-tech payroll as % of total payroll 3.69 49 Science & engineering grad. students per capita 6.14 7 Scientists and engineers in the labor force 5.43 16 Finance and cost subindex 4.86 29 Finance and cost subindex 4.86 29 Bank deposits per capita 6.49 6 Cost of living 3.27 48 Venture capital as % of GMP 5.04 8 Openness subindex 3.95 43 Openness subindex 3.95 43 Exports per capita 4.25 38 Air passengers per capita 4.32 38 Domestic competition subindex 4.32 39 Domestic competition subindex 4.32 39 New publicly traded companies 5.00 13 Cognetics entrepreneurial hot spot index 4.01 45 Environmental policy subindex 4.99 27 Environmental policy subindex 4.99 27 Toxic release, pounds per capita 5.24 6 Electricity prices, $ per mbtu 3.69 41 Pollution standards index 5.96 7

BH
I
Metro Area and State Competitiveness Report / Page 56
Inde
xIndex Overall Rank
RALEIGH 6.25 7
Raleigh ranks very high in four subindexes, technology, government and fiscal policy, domestic competition and finance, resulting in a rank of 7 overall. The security and infrastructure subindexes have room for improvement, especially in mass transit and percentage of households with a computer.
Competitive Advantages Competitive Disadvantages
Subindex/Variable Index Rank Subindex/Variable Index Rank
Government and fiscal policy subindex 6.23 6 Government and fiscal policy subindex 6.23 6 Taxes as a % of current GSP 5.64 11 Unemployment payments per unemployed worker 5.12 30 Workers’ compensation collections per employee 5.56 1 Bond rating: S&P's/Moody's composite 6.19 1 State bond rating 5.94 11 Security subindex 4.65 35 Security subindex 4.65 35 Violent crimes per 100,000 inhabitants 5.40 20 Crime index change 1999-2000, % 4.44 34 Thefts per 100,000 inhabitants 4.37 36 Infrastructure subindex 4.01 43 Infrastructure subindex 4.01 43 % of adults online 5.53 16 % of households with computers 3.85 45 Mass transit availability 4.01 46 Median household gross rent 4.55 36 Human resources subindex 5.21 21 Human resources subindex 5.21 21 % of labor force represented by unions 6.49 1 % of adults in the labor force 4.62 33 % of population that graduated from high school 5.77 9 High school finishers as % of 18-year olds 3.42 49 Unemployment rate 6.58 3 Infant mortality rate, deaths per 1000 live births 4.53 34 Nonfederal physicians per 100,000 inhabitants 4.63 32 Technology subindex 7.46 2 Technology subindex 7.46 2 Academic R&D funding relative to employment 10.00 1 Science & engineering grad. students per capita 4.69 33 High-tech payroll as % of total payroll 7.16 4 New patents issued per 100,000 inhabitants 6.52 4 NIH support to institutions per capita 5.59 9 Scientists and engineers in the labor force 6.37 4 Finance and cost subindex 6.26 4 Finance and cost subindex 6.26 4 Cost of living 6.11 6 Bank deposits per capita 4.55 33 Venture capital as % of GMP 5.99 5 Openness subindex 5.15 20 Openness subindex 5.15 20 Exports per capita 5.03 20 Air passengers per capita 5.17 17 Domestic competition subindex 6.42 7 Domestic competition subindex 6.42 7 Net firm creation per 100,000 inhabitants 6.60 4 Cognetics entrepreneurial hot spot index 6.68 4 Environmental policy subindex 4.89 31 Environmental policy subindex 4.89 31 Toxic release, pounds per capita 5.21 18 Pollution standards index 4.80 30 Serious pollution days p.a. 4.59 36

BH
I
Metro Area and State Competitiveness Report / Page 57
IndexIndex Overall Rank
RICHMOND 5.27 16
Richmond comes in at 16 overall by having high rankings for finance and government and fiscal policy. A 3 rank in the finance subindex would have been even higher if not for low marks in venture capital. A poor showing in infrastructure, especially mass transit and percentage of adults online kept Richmond from ranking higher overall.
Competitive Advantages Competitive Disadvantages
Subindex/Variable Index Rank Subindex/Variable Index Rank
Government and fiscal policy subindex 6.30 5 Government and fiscal policy subindex 6.30 5 State bond rating 6.34 1 Bond rating: S&P's/Moody's composite 4.92 30 Taxes as a % of current GSP 5.63 14 Unemployment payments per unemployed worker 6.21 3 Workers’ compensation collections per employee 5.56 18 Security subindex 4.45 39 Security subindex 4.45 39 Violent crimes per 100,000 inhabitants 5.51 16 Murders per 100,000 inhabitants 3.45 48 Infrastructure subindex 3.77 47 Infrastructure subindex 3.77 47 % of households with computers 5.51 12 % of adults online 2.39 49 Travel time to work 5.44 19 Mass transit availability 4.26 42 Human resources subindex 5.40 15 Human resources subindex 5.40 15 % of labor force represented by unions 6.16 5 % of adults in the labor force 4.77 30 % of population without health insurance 5.29 19 % of population born abroad 4.23 42 Enrollment in degree-granting institutions per capita 5.14 20 % of population that graduated from high school 5.00 30 High school finishers as % of 18-year olds 5.72 12 Infant mortality rate, deaths per 1000 live births 3.87 46 Unemployment rate 6.43 4 Technology subindex 5.13 17 Technology subindex 5.13 17 Academic R&D funding relative to employment 5.26 9 New patents issued per 100,000 inhabitants 4.26 43 High-tech payroll as % of total payroll 5.67 10 NIH support to institutions per capita 4.41 38 Science & engineering grad. students per capita 5.46 11 Scientists and engineers in the labor force 5.47 14 Finance and cost subindex 6.29 3 Finance and cost subindex 6.29 3 Bank deposits per capita 6.75 3 Venture capital as % of GMP 4.50 46 Cost of living 5.44 18 Openness subindex 5.15 21 Openness subindex 5.15 21 Exports per capita 6.25 4 Air passengers per capita 3.95 47 Domestic competition subindex 4.32 40 Domestic competition subindex 4.32 40 Net firm creation per 100,000 inhabitants 4.47 33 Cognetics entrepreneurial hot spot index 4.70 31 New publicly traded companies 4.36 43 Environmental policy subindex 5.33 20 Environmental policy subindex 5.33 20 Electricity prices, $ per mbtu 5.62 12 Serious pollution days p.a. 4.12 44 Pollution standards index 5.87 13 Toxic release, pounds per capita 5.03 43

BH
I
Metro Area and State Competitiveness Report / Page 58
Inde
xIndex Overall Rank
ROCHESTER 4.14 41
With finance and domestic competition ranked at 48 and government and fiscal policy at 49, Rochester faces many disadvantages. The tax burden, unionization, and a high cost of living are all particular problem areas. Advantages include number 1 rankings for patents and for low violent crime rate.
Competitive Advantages Competitive Disadvantages
Subindex/Variable Index Rank Subindex/Variable Index Rank
Government and fiscal policy subindex 3.25 49 Government and fiscal policy subindex 3.25 49
Taxes as a % of current GSP 2.60 49
Workers’ compensation collections per employee 4.43 43 Bond rating: S&P's/Moody's composite 4.71 37 State bond rating 3.51 44 Unemployment payments per unemployed worker 4.83 34 Security subindex 6.33 5 Security subindex 6.33 5 Murders per 100,000 inhabitants 5.41 18 Crime index change 1999-2000, % 5.85 8 Violent crimes per 100,000 inhabitants 6.66 1 Infrastructure subindex 3.87 45 Infrastructure subindex 3.87 45 Median household gross rent 5.37 19 Mass transit availability 4.18 43 Travel time to work 6.51 2 % of households with computers 4.50 35 % of adults online 2.38 50 Human resources subindex 5.11 23 Human resources subindex 5.11 23 % of population that graduated from high school 5.48 16 % of labor force represented by unions 2.79 49 Enrollment in degree-granting institutions per capita 5.28 18 % of population born abroad 4.39 32 High school finishers as % of 18-year olds 5.84 10 % of population without health insurance 4.67 32 Infant mortality rate, deaths per 1000 live births 5.45 16 Unemployment rate 4.09 41 Nonfederal physicians per 100,000 inhabitants 7.36 2 Technology subindex 6.51 5 Technology subindex 6.51 5 Academic R&D funding relative to employment 5.13 11 NIH support to institutions per capita 5.67 7 New patents issued per 100,000 inhabitants 8.48 1 Science & engineering grad. students per capita 6.21 4 Scientists and engineers in the labor force 5.98 8 Finance and cost subindex 3.38 48 Finance and cost subindex 3.38 48 Venture capital as % of GMP 4.80 19 Bank deposits per capita 4.65 30 Cost of living 3.39 45 Openness subindex 4.81 26 Openness subindex 4.81 26 Exports per capita 5.82 9 Air passengers per capita 3.92 48 Domestic competition subindex 3.58 48 Domestic competition subindex 3.58 48 Net firm creation per 100,000 inhabitants 4.31 37 Cognetics entrepreneurial hot spot index 2.88 48 Environmental policy subindex 4.58 38 Environmental policy subindex 4.58 38 Pollution standards index 6.19 5 Electricity prices, $ per mbtu 2.84 47

BH
I
Metro Area and State Competitiveness Report / Page 59
IndexIndex Overall Rank
SACRAMENTO 4.08 42
Sacramento with an overall ranking of 42 garners low marks for finance, openness to business, and environmental policy. It has a strong showing in both the security and infrastructure subindexes. Sacramento also boasts strong high school graduation rates and a significant college population.
Competitive Advantages Competitive Disadvantages
Subindex/Variable Index Rank Subindex/Variable Index Rank
Government and fiscal policy subindex 4.45 34 Government and fiscal policy subindex 4.45 34 Bond rating: S&P's/Moody's composite 5.34 19 State bond rating 3.11 46
Workers’ compensation collections per employee 4.99 36 Security subindex 5.74 11 Security subindex 5.74 11 Murders per 100,000 inhabitants 5.40 19 Crime index change 1999-2000, % 5.60 10 Thefts per 100,000 inhabitants 5.62 16 Infrastructure subindex 5.48 12 Infrastructure subindex 5.48 12 % of adults online 5.62 13 Mass transit availability 4.46 34 % of households with computers 6.03 7 Median household gross rent 4.60 35 Human resources subindex 5.21 20 Human resources subindex 5.21 20 % of population born abroad 5.51 11 % of adults in the labor force 4.59 34 % of population that graduated from high school 5.54 15 % of labor force represented by unions 4.33 34 Enrollment in degree-granting institutions per capita 5.92 7 % of population without health insurance 3.94 41 High school finishers as % of 18-year olds 6.08 7 Unemployment rate 4.45 35 Infant mortality rate, deaths per 1000 live births 5.39 17 Nonfederal physicians per 100,000 inhabitants 5.08 11 Technology subindex 5.03 19 Technology subindex 5.03 19 Academic R&D funding relative to employment 5.00 15 High-tech payroll as % of total payroll 4.64 30 NIH support to institutions per capita 5.43 11 New patents issued per 100,000 inhabitants 4.51 34 Science & engineering grad. students per capita 5.20 17 Scientists and engineers in the labor force 5.35 17 Finance and cost subindex 3.11 50 Finance and cost subindex 3.11 50 Bank deposits per capita 3.48 49 Cost of living 4.32 39 Openness subindex 3.92 45 Openness subindex 3.92 45 Exports per capita 4.23 39 Air passengers per capita 4.31 40 Domestic competition subindex 4.83 24 Domestic competition subindex 4.83 24 Net firm creation per 100,000 inhabitants 5.99 11 Cognetics entrepreneurial hot spot index 4.17 41 New publicly traded companies 4.48 40 Environmental policy subindex 3.35 47 Environmental policy subindex 3.35 47 Toxic release, pounds per capita 5.25 2 Electricity prices, $ per mbtu 3.64 42 Pollution standards index 3.39 46 Serious pollution days p.a. 4.81 34

BH
I
Metro Area and State Competitiveness Report / Page 60
Inde
xIndex Overall Rank
SALT LAKE CITY 5.89 10
Breaking into the top 10, Salt Lake City possesses quality infrastructure and human resources, with a high percentage of college students. Areas that need improvement are the environmental policy subindex, where the metro area ranks last, and the finance subindex, which scores no competitive advantages.
Competitive Advantages Competitive Disadvantages
Subindex/Variable Index Rank Subindex/Variable Index Rank
Government and fiscal policy subindex 5.67 17 Government and fiscal policy subindex 5.67 17 Bond rating: S&P's/Moody's composite 5.56 14 Workers’ compensation collections per employee 4.75 41 State bond rating 6.34 1 Security subindex 4.69 33 Security subindex 4.69 33 Violent crimes per 100,000 inhabitants 6.07 7 Crime index change 1999-2000, % 3.84 44 Murders per 100,000 inhabitants 5.94 6 Thefts per 100,000 inhabitants 3.40 48 Infrastructure subindex 8.10 1 Infrastructure subindex 8.10 1 Mass transit availability 5.44 12 % of households with computers 7.86 1 % of adults online 6.17 5 Travel time to work 6.12 6 Human resources subindex 7.13 3 Human resources subindex 7.13 3 % of adults in the labor force 5.72 12 Nonfederal physicians per 100,000 inhabitants 4.02 43 % of labor force represented by unions 5.94 11 % of population that graduated from high school 6.36 3 Enrollment in degree-granting institutions per capita 7.91 1 High school finishers as % of 18-year olds 6.95 3 Infant mortality rate, deaths per 1000 live births 6.11 6 Unemployment rate 5.42 19 Technology subindex 5.23 15 Technology subindex 5.23 15 Academic R&D funding relative to employment 5.80 5 Science & engineering grad. students per capita 5.69 10 Finance and cost subindex 3.69 45 Finance and cost subindex 3.69 45 Bank deposits per capita 4.02 44 Cost of living 4.59 33 Venture capital as % of GMP 4.64 30 Openness subindex 5.57 12 Openness subindex 5.57 12 Air passengers per capita 6.29 6 Exports per capita 4.48 35 Domestic competition subindex 5.74 13 Domestic competition subindex 5.74 13 Net firm creation per 100,000 inhabitants 5.71 13 Cognetics entrepreneurial hot spot index 6.15 6 Environmental policy subindex 2.92 50 Environmental policy subindex 2.92 50 Electricity prices, $ per mbtu 6.29 4 Pollution standards index 4.15 43 Serious pollution days p.a. 5.85 6 Toxic release, pounds per capita 0.00 50

BH
I
Metro Area and State Competitiveness Report / Page 61
IndexIndex Overall Rank
SAN ANTONIO 4.29 38
With a rank of 38, San Antonio shows poor human resources performance, sluggish entrepreneurial activity and a weak high-tech sector. Computer usage and internet access are also vulnerabilities. The metro area has a strong competitive advantage in its government and fiscal policy subindex, where it ranks 3.
Competitive Advantages Competitive Disadvantages
Subindex/Variable Index Rank Subindex/Variable Index Rank
Government and fiscal policy subindex 6.34 3 Government and fiscal policy subindex 6.34 3 Taxes as a % of current GSP 6.60 3 Workers’ compensation collections per employee 5.56 8 Bond rating: S&P's/Moody's composite 5.56 14 State bond rating 5.13 20 Unemployment payments per unemployed worker 5.92 6 Security subindex 4.66 34 Security subindex 4.66 34 Crime index change 1999-2000, % 6.91 3 Violent crimes per 100,000 inhabitants 4.84 34 Thefts per 100,000 inhabitants 2.51 50 Infrastructure subindex 4.89 26 Infrastructure subindex 4.89 26 Mass transit availability 5.57 11 % of households with computers 4.35 38 Median household gross rent 5.74 12 % of adults online 3.82 47 Human resources subindex 3.92 47 Human resources subindex 3.92 47 % of labor force represented by unions 6.11 7 % of population without health insurance 3.10 47 Infant mortality rate, deaths per 1000 live births 5.39 17 % of population that graduated from high school 3.50 46 Enrollment in degree-granting institutions per capita 4.40 33 % of adults in the labor force 4.03 43 Nonfederal physicians per 100,000 inhabitants 3.96 45 Technology subindex 4.35 39 Technology subindex 4.35 39 NIH support to institutions per capita 4.59 31 New patents issued per 100,000 inhabitants 4.30 38 Scientists and engineers in the labor force 4.64 30 High-tech payroll as % of total payroll 4.17 41 Finance and cost subindex 4.72 34 Finance and cost subindex 4.72 34 Cost of living 6.33 3 Bank deposits per capita 3.69 47 Venture capital as % of GMP 4.59 33 Openness subindex 3.89 46 Openness subindex 3.89 46 Exports per capita 4.19 42 Air passengers per capita 4.31 39 Domestic competition subindex 4.12 45 Domestic competition subindex 4.12 45 Net firm creation per 100,000 inhabitants 4.10 43 Cognetics entrepreneurial hot spot index 4.65 33 New publicly traded companies 4.36 43 Environmental policy subindex 5.13 22 Environmental policy subindex 5.13 22 Electricity prices, $ per mbtu 5.47 17 Serious pollution days p.a. 4.14 43 Toxic release, pounds per capita 5.23 12 Pollution standards index 5.43 20

BH
I
Metro Area and State Competitiveness Report / Page 62
Inde
xIndex Overall Rank
SAN DIEGO 4.85 25
Falling in the middle of the overall ranking, San Diego places 49 in the finance and cost subindex with a low level of bank deposits and high cost of living. This metro area performs well on both the technology and domestic competition subindexes.
Competitive Advantages Competitive Disadvantages
Subindex/Variable Index Rank Subindex/Variable Index Rank
Government and fiscal policy subindex 4.63 32 Government and fiscal policy subindex 4.63 32 Bond rating: S&P's/Moody's composite 5.56 14 Workers’ compensation collections per employee 4.99 36
Unemployment payments per unemployed worker 5.45 19 State bond rating 3.11 46 Security subindex 5.60 15 Security subindex 5.60 15 Thefts per 100,000 inhabitants 6.49 5 Crime index change 1999-2000, % 3.75 45 Murders per 100,000 inhabitants 5.86 10 Infrastructure subindex 5.40 16 Infrastructure subindex 5.40 16 Mass transit availability 5.21 16 Median household gross rent 3.62 48 % of households with computers 6.03 7 % of adults online 5.69 12 Human resources subindex 5.34 16 Human resources subindex 5.34 16 Unemployment rate 5.70 14 % of population without health insurance 3.94 41 Enrollment in degree-granting institutions per capita 5.92 7 % of population that graduated from high school 4.99 31 % of population born abroad 6.42 5 % of labor force represented by unions 4.33 34 Infant mortality rate, deaths per 1000 live births 5.98 8 % of adults in the labor force 4.06 42 Nonfederal physicians per 100,000 inhabitants 5.08 11 Technology subindex 5.54 10 Technology subindex 5.54 10 Academic R&D funding relative to employment 5.13 11 NIH support to institutions per capita 5.43 11 New patents issued per 100,000 inhabitants 5.78 7 Science & engineering grad. students per capita 5.20 17 Scientists and engineers in the labor force 5.35 17 High-tech payroll as % of total payroll 5.38 13 Finance and cost subindex 3.23 49 Finance and cost subindex 3.23 49 Venture capital as % of GMP 5.61 7 Bank deposits per capita 3.67 48 Cost of living 3.36 47 Openness subindex 4.89 24 Openness subindex 4.89 24 Exports per capita 5.31 15 Domestic competition subindex 5.89 12 Domestic competition subindex 5.89 12 Net firm creation per 100,000 inhabitants 6.08 9 Cognetics entrepreneurial hot spot index 5.35 18 New publicly traded companies 5.49 7 Environmental policy subindex 3.86 41 Environmental policy subindex 3.86 41 Toxic release, pounds per capita 5.25 1 Electricity prices, $ per mbtu 3.64 42 Pollution standards index 3.60 45

BH
I
Metro Area and State Competitiveness Report / Page 63
IndexIndex Overall Rank
SAN FRANCISCO 7.44 2
San Francisco ranks 2 for overall competitiveness. The metro area owes its position to very high rankings for domestic competition, finance and cost, technology and openness. Its few weaknesses are high housing cost, long commuting time and overall weak fiscal policy.
Competitive Advantages Competitive Disadvantages
Subindex/Variable Index Rank Subindex/Variable Index Rank
Government and fiscal policy subindex 4.38 36 Government and fiscal policy subindex 4.38 36
Workers’ compensation collections per employee 4.99 36
State bond rating 3.11 46 Security subindex 5.01 25 Security subindex 5.01 25 Thefts per 100,000 inhabitants 5.88 11 Crime index change 1999-2000, % 3.37 49 Murders per 100,000 inhabitants 5.54 16 Infrastructure subindex 4.78 27 Infrastructure subindex 4.78 27 Mass transit availability 6.59 3 Travel time to work 3.69 46 % of households with computers 6.03 7 Median household gross rent 1.23 50 % of adults online 7.07 1 Human resources subindex 6.19 8 Human resources subindex 6.19 8 % of population that graduated from high school 5.36 20 % of population without health insurance 3.94 41 Unemployment rate 6.01 9 % of labor force represented by unions 4.33 34 Enrollment in degree-granting institutions per capita 5.92 7 % of adults in the labor force 5.64 13 % of population born abroad 7.12 3 Infant mortality rate, deaths per 1000 live births 6.31 5 Nonfederal physicians per 100,000 inhabitants 5.08 11 Technology subindex 6.66 4 Technology subindex 6.66 4 Academic R&D funding relative to employment 5.00 15 NIH support to institutions per capita 5.43 11 New patents issued per 100,000 inhabitants 8.21 3 Science & engineering grad. students per capita 5.20 17 Scientists and engineers in the labor force 5.35 17 High-tech payroll as % of total payroll 7.81 1 Finance and cost subindex 8.31 1 Finance and cost subindex 8.31 1 Bank deposits per capita 5.71 11 Cost of living 3.66 43 Venture capital as % of GMP 10.00 1 Openness subindex 6.99 3 Openness subindex 6.99 3 Exports per capita 7.50 2 Air passengers per capita 5.19 16 Domestic competition subindex 7.42 1 Domestic competition subindex 7.42 1 Net firm creation per 100,000 inhabitants 5.66 14 New publicly traded companies 9.70 1 Environmental policy subindex 5.48 14 Environmental policy subindex 5.48 14 Toxic release, pounds per capita 5.24 9 Electricity prices, $ per mbtu 3.64 42 Pollution standards index 6.18 6 Serious pollution days p.a. 5.85 8

BH
I
Metro Area and State Competitiveness Report / Page 64
Inde
xIndex Overall Rank
SEATTLE 7.48 1
Seattle owes its first place to its strength in environmental policy, degree of openness, infrastructure and domestic competition. An area for further improvement is government and fiscal policy, where weakness is caused largely by workers’ compensation collections and unemployment payments.
Competitive Advantages Competitive Disadvantages
Subindex/Variable Index Rank Subindex/Variable Index Rank
Government and fiscal policy subindex 4.11 40 Government and fiscal policy subindex 4.11 40 Bond rating: S&P's/Moody's composite 5.98 8 Taxes as a % of current GSP 4.75 34 State bond rating 5.53 14 Workers’ compensation collections per employee 2.86 46 Unemployment payments per unemployed worker 3.36 47 Security subindex 5.19 22 Security subindex 5.19 22 Violent crimes per 100,000 inhabitants 5.64 14 Crime index change 1999-2000, % 4.51 33 Murders per 100,000 inhabitants 5.92 7 Thefts per 100,000 inhabitants 4.38 35 Infrastructure subindex 7.34 2 Infrastructure subindex 7.34 2 Mass transit availability 7.38 2 Travel time to work 4.34 39 % of households with computers 6.82 4 Median household gross rent 4.06 42 % of adults online 6.66 3 Human resources subindex 5.46 13 Human resources subindex 5.46 13 High school finishers as % of 18-year olds 5.05 20 % of labor force represented by unions 4.01 45 % of population that graduated from high school 6.92 2 Unemployment rate 4.17 39 % of population born abroad 5.15 18 Infant mortality rate, deaths per 1000 live births 6.38 4 Technology subindex 5.61 9 Technology subindex 5.61 9 NIH support to institutions per capita 6.09 5 Science & engineering grad. students per capita 3.95 45 New patents issued per 100,000 inhabitants 5.09 13 Scientists and engineers in the labor force 6.06 7 High-tech payroll as % of total payroll 6.47 6 Finance and cost subindex 5.75 13 Finance and cost subindex 5.75 13 Venture capital as % of GMP 7.51 2 Cost of living 3.77 42 Openness subindex 8.05 1 Openness subindex 8.05 1 Exports per capita 9.15 1 Air passengers per capita 4.99 19 Domestic competition subindex 6.53 4 Domestic competition subindex 6.53 4 Net firm creation per 100,000 inhabitants 5.12 18 Cognetics entrepreneurial hot spot index 4.17 41 New publicly traded companies 9.00 2 Environmental policy subindex 7.38 1 Environmental policy subindex 7.38 1 Electricity prices, $ per mbtu 6.87 1 Toxic release, pounds per capita 5.23 13 Pollution standards index 6.21 4 Serious pollution days p.a. 6.00 2

BH
I
Metro Area and State Competitiveness Report / Page 65
IndexIndex Overall Rank
ST. LOUIS 5.37 13
Infrastructure and finance measures are St. Louis’ bright spots. Low housing cost and significant available R&D funding are among the competitive advantages. High toxic release and pollution, a poor metro area bond rating and slow entrepreneurial activity count as disadvantages.
Competitive Advantages Competitive Disadvantages
Subindex/Variable Index Rank Subindex/Variable Index Rank
Government and fiscal policy subindex 5.34 22 Government and fiscal policy subindex 5.34 22 Taxes as a % of current GSP 5.57 17 Bond rating: S&P's/Moody's composite 3.65 44 State bond rating 5.97 10 Security subindex 5.48 19 Security subindex 5.48 19 Violent crimes per 100,000 inhabitants 5.48 17 Crime index change 1999-2000, % 5.47 14 Infrastructure subindex 5.47 13 Infrastructure subindex 5.47 13 % of households with computers 5.15 17 % of adults online 4.80 30 Median household gross rent 6.11 7 Travel time to work 4.98 31 Human resources subindex 4.93 26 Human resources subindex 4.93 26 % of population without health insurance 5.65 17 Unemployment rate 4.21 37 High school finishers as % of 18-year olds 5.37 16 % of population born abroad 4.05 47 Enrollment in degree-granting institutions per capita 5.62 14 Infant mortality rate, deaths per 1000 live births 4.80 30 % of adults in the labor force 5.57 14 Nonfederal physicians per 100,000 inhabitants 4.63 34 Technology subindex 5.05 18 Technology subindex 5.05 18 Academic R&D funding relative to employment 5.67 6 Science & engineering grad. students per capita 4.81 30 NIH support to institutions per capita 5.23 18 Finance and cost subindex 5.57 14 Finance and cost subindex 5.57 14 Bank deposits per capita 5.27 17 Cost of living 5.62 16 Venture capital as % of GMP 4.86 15 Openness subindex 5.25 18 Openness subindex 5.25 18 Air passengers per capita 5.78 9 Exports per capita 4.56 32 Domestic competition subindex 4.39 38 Domestic competition subindex 4.39 38 Net firm creation per 100,000 inhabitants 4.33 35 Cognetics entrepreneurial hot spot index 4.70 31 New publicly traded companies 4.66 30 Environmental policy subindex 5.08 24 Environmental policy subindex 5.08 24 Serious pollution days p.a. 5.59 18 Toxic release, pounds per capita 5.00 44 Pollution standards index 4.26 40
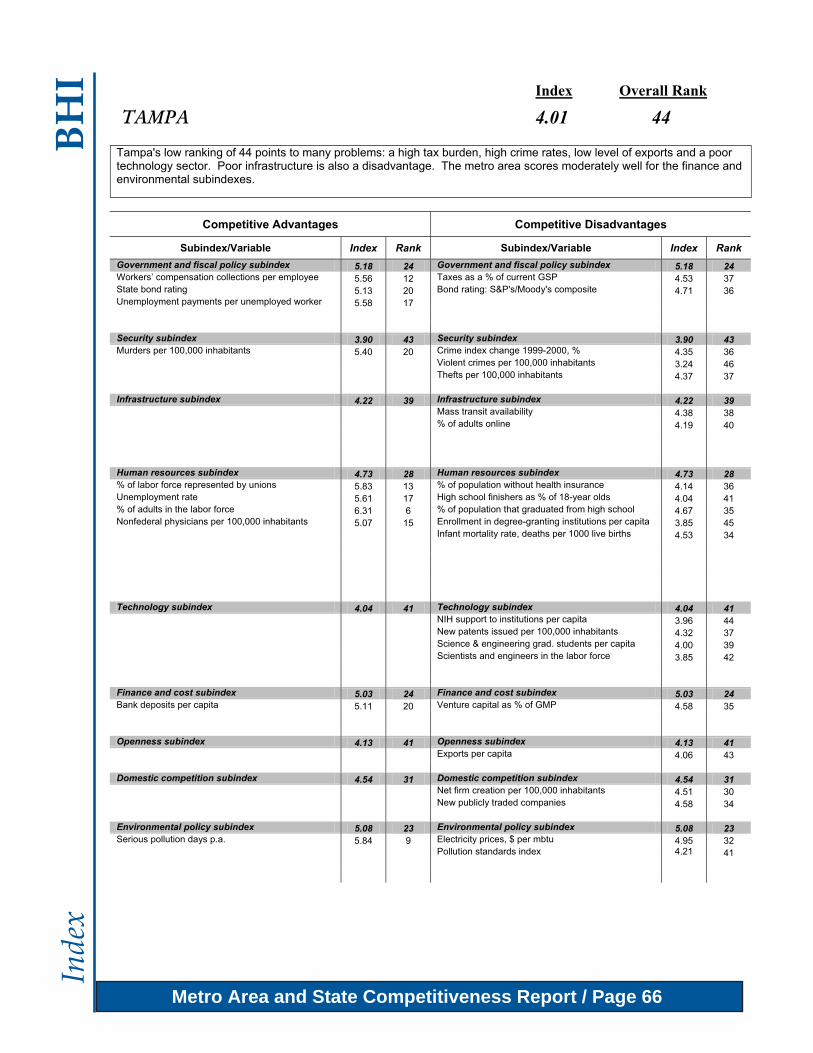
BH
I
Metro Area and State Competitiveness Report / Page 66
Inde
xIndex Overall Rank
TAMPA 4.01 44
Tampa's low ranking of 44 points to many problems: a high tax burden, high crime rates, low level of exports and a poor technology sector. Poor infrastructure is also a disadvantage. The metro area scores moderately well for the finance and environmental subindexes.
Competitive Advantages Competitive Disadvantages
Subindex/Variable Index Rank Subindex/Variable Index Rank
Government and fiscal policy subindex 5.18 24 Government and fiscal policy subindex 5.18 24 Workers’ compensation collections per employee 5.56 12 Taxes as a % of current GSP 4.53 37 State bond rating 5.13 20 Bond rating: S&P's/Moody's composite 4.71 36 Unemployment payments per unemployed worker 5.58 17 Security subindex 3.90 43 Security subindex 3.90 43 Murders per 100,000 inhabitants 5.40 20 Crime index change 1999-2000, % 4.35 36 Violent crimes per 100,000 inhabitants 3.24 46 Thefts per 100,000 inhabitants 4.37 37 Infrastructure subindex 4.22 39 Infrastructure subindex 4.22 39 Mass transit availability 4.38 38 % of adults online 4.19 40 Human resources subindex 4.73 28 Human resources subindex 4.73 28 % of labor force represented by unions 5.83 13 % of population without health insurance 4.14 36 Unemployment rate 5.61 17 High school finishers as % of 18-year olds 4.04 41 % of adults in the labor force 6.31 6 % of population that graduated from high school 4.67 35 Nonfederal physicians per 100,000 inhabitants 5.07 15 Enrollment in degree-granting institutions per capita 3.85 45 Infant mortality rate, deaths per 1000 live births 4.53 34 Technology subindex 4.04 41 Technology subindex 4.04 41 NIH support to institutions per capita 3.96 44 New patents issued per 100,000 inhabitants 4.32 37 Science & engineering grad. students per capita 4.00 39 Scientists and engineers in the labor force 3.85 42 Finance and cost subindex 5.03 24 Finance and cost subindex 5.03 24 Bank deposits per capita 5.11 20 Venture capital as % of GMP 4.58 35 Openness subindex 4.13 41 Openness subindex 4.13 41 Exports per capita 4.06 43 Domestic competition subindex 4.54 31 Domestic competition subindex 4.54 31 Net firm creation per 100,000 inhabitants 4.51 30 New publicly traded companies 4.58 34 Environmental policy subindex 5.08 23 Environmental policy subindex 5.08 23 Serious pollution days p.a. 5.84 9 Electricity prices, $ per mbtu 4.95 32 Pollution standards index 4.21 41

BH
I
Metro Area and State Competitiveness Report / Page 67
IndexIndex Overall Rank
WASHINGTON 5.54 11
Ranking 11 for overall competitiveness, Washington's advantages are the human resources and technology subindexes. Domestic competition is relatively robust and the metro area also benefits from improving crime rates. Among the weak spots are long commuting time and low export level.
Competitive Advantages Competitive Disadvantages
Subindex/Variable Index Rank Subindex/Variable Index Rank
Government and fiscal policy subindex 5.24 23 Government and fiscal policy subindex 5.24 23 State bond rating 5.82 13 Taxes as a % of current GSP 4.86 32 Unemployment payments per unemployed worker 5.77 11 Workers’ compensation collections per employee 5.30 32 Bond rating: S&P's/Moody's composite 3.92 42 Security subindex 5.64 13 Security subindex 5.64 13 Crime index change 1999-2000, % 7.69 1 Violent crimes per 100,000 inhabitants 4.43 38 Murders per 100,000 inhabitants 4.06 46 Infrastructure subindex 4.57 35 Infrastructure subindex 4.57 35 Mass transit availability 5.67 7 Travel time to work 2.83 49 % of households with computers 5.36 16 Median household gross rent 3.78 47 % of adults online 6.58 4 Human resources subindex 6.33 5 Human resources subindex 6.33 5 % of population without health insurance 5.71 15 Infant mortality rate, deaths per 1000 live births 4.27 37 High school finishers as % of 18-year olds 5.97 8 % of population that graduated from high school 5.64 11 Unemployment rate 5.42 20 Enrollment in degree-granting institutions per capita 5.71 12 % of population born abroad 5.31 13 Nonfederal physicians per 100,000 inhabitants 7.07 4 Technology subindex 6.78 3 Technology subindex 6.78 3 Academic R&D funding relative to employment 6.07 3 New patents issued per 100,000 inhabitants 4.63 31 NIH support to institutions per capita 7.38 2 High-tech payroll as % of total payroll 4.00 46 Science & engineering grad. students per capita 7.72 2 Scientists and engineers in the labor force 7.68 2 Finance and cost subindex 4.21 39 Finance and cost subindex 4.21 39 Venture capital as % of GMP 4.97 10 Bank deposits per capita 4.45 35 Cost of living 4.52 35 Openness subindex 4.29 38 Openness subindex 4.29 38 Exports per capita 4.20 41 Domestic competition subindex 5.27 17 Domestic competition subindex 5.27 17 Net firm creation per 100,000 inhabitants 4.97 20 Cognetics entrepreneurial hot spot index 5.67 10 New publicly traded companies 4.93 18 Environmental policy subindex 4.93 29 Environmental policy subindex 4.93 29 Pollution standards index 4.74 32 Serious pollution days p.a. 4.94 32

BH
I
Metro Area and State Competitiveness Report / Page 68
Inde
xIndex Overall Rank
WEST PALM BEACH 4.76 30
Strong domestic competition and good environmental policy are West Palm Beach’s strongest competitive advantages. A high crime rate, expensive housing and high taxes keep the overall ranking at a below average 30. A lackluster technology sector is another disadvantage.
Competitive Advantages Competitive Disadvantages
Subindex/Variable Index Rank Subindex/Variable Index Rank
Government and fiscal policy subindex 5.68 16 Government and fiscal policy subindex 5.68 16 Workers’ compensation collections per employee 5.56 12 Taxes as a % of current GSP 4.53 37 Bond rating: S&P's/Moody's composite 6.19 1 State bond rating 5.13 20 Unemployment payments per unemployed worker 5.49 18 Security subindex 3.95 42 Security subindex 3.95 42 Crime index change 1999-2000, % 4.77 30 Violent crimes per 100,000 inhabitants 4.02 42 Thefts per 100,000 inhabitants 3.62 46 Infrastructure subindex 3.82 46 Infrastructure subindex 3.82 46 % of adults online 4.22 39 Median household gross rent 3.90 44 Human resources subindex 4.60 30 Human resources subindex 4.60 30 % of labor force represented by unions 5.83 13 % of population without health insurance 4.14 36 % of population born abroad 5.89 7 High school finishers as % of 18-year olds 4.09 39 Nonfederal physicians per 100,000 inhabitants 5.07 15 Unemployment rate 4.28 36 Enrollment in degree-granting institutions per capita 3.85 45 Technology subindex 4.45 37 Technology subindex 4.45 37 New patents issued per 100,000 inhabitants 5.01 16 Academic R&D funding relative to employment 4.33 42 High-tech payroll as % of total payroll 6.53 5 NIH support to institutions per capita 3.96 44 Science & engineering grad. students per capita 4.00 39 Scientists and engineers in the labor force 3.85 42 Finance and cost subindex 5.16 18 Finance and cost subindex 5.16 18 Cost of living 5.62 13 Venture capital as % of GMP 4.64 30 Openness subindex 3.84 47 Openness subindex 3.84 47 Exports per capita 3.97 46 Air passengers per capita 4.46 32 Domestic competition subindex 6.48 5 Domestic competition subindex 6.48 5 Net firm creation per 100,000 inhabitants 6.64 3 Cognetics entrepreneurial hot spot index 5.24 19 New publicly traded companies 6.31 3 Environmental policy subindex 6.03 6 Environmental policy subindex 6.03 6 Toxic release, pounds per capita 5.24 8 Electricity prices, $ per mbtu 4.95 32 Pollution standards index 5.79 15 Serious pollution days p.a. 5.91 4

BH
I
Metro Area and State Competitiveness Report / Page 69
Data C
harts
Data Charts

BH
I
Metro Area and State Competitiveness Report / Page 70
Dat
a C
hart
s
Rank Metro $ Rank Metro $
1 Hartford 53,722 1 San Francisco 44,625
2 Charlotte 47,889 2 West Palm Beach 43,491
3 Houston 47,377 3 Atlanta 37,972
4 Richmond 47,083 4 Minneapolis 37,249
5 Atlanta 47,067 5 New York 37,219
6 San Francisco 47,048 6 Washington 37,203
7 Boston 46,346 7 Houston 37,069
8 Dallas 45,913 8 Boston 36,409
9 Denver 43,266 9 Denver 36,372
10 Washington 43,255 10 Austin 35,557
11 Minneapolis 42,990 11 Raleigh 35,527
12 Jacksonville 42,925 12 Dallas 35,021
13 Greensboro 42,545 13 Seattle 34,552
14 Louisville 42,374 14 Chicago 34,257
15 Raleigh 42,274 15 Hartford 34,107
16 Austin 42,068 16 Charlotte 33,710
17 Seattle 41,869 17 Nashville 33,450
18 Grand Rapids 41,847 18 Detroit 33,196
19 Columbus 41,692 19 St. Louis 33,134
20 Sacramento 41,408 20 Kansas City 32,934
21 Nashville 41,062 21 Louisville 32,899
22 Rochester 40,173 22 Milwaukee 32,843
23 Buffalo 40,015 23 Richmond 32,825
24 Kansas City 39,897 24 Philadelphia 32,594
25 New York 39,763 25 Indianapolis 32,160
26 Chicago 39,758 26 Cincinnati 31,808
27 Memphis 39,496 27 Memphis 31,592
28 Los Angeles 39,402 28 Pittsburgh 31,378
29 Orlando 39,134 29 Columbus 31,306
30 Indianapolis 38,789 30 Cleveland 31,226
31 San Antonio 38,542 31 Greensboro 31,025
32 Cincinnati 38,124 32 San Diego 30,749
33 Tampa 37,987 33 Jacksonville 30,142
34 Philadelphia 37,696 34 Sacramento 29,753
35 St. Louis 37,455 35 Grand Rapids 29,606
36 San Diego 37,429 36 Portland 29,558
37 Milwaukee 37,413 37 Los Angeles 29,551
38 Cleveland 37,197 38 Tampa 29,451
39 New Orleans 37,035 39 San Antonio 28,379
40 Pittsburgh 36,441 40 Orlando 28,202
41 Salt Lake City 36,050 41 New Orleans 28,006
42 Las Vegas 35,362 42 Miami 27,891
43 Phoenix 35,348 43 Las Vegas 27,789
44 Detroit 35,281 44 Phoenix 27,771
45 Norfolk 35,202 45 Oklahoma City 27,578
46 Portland 34,696 46 Norfolk 27,444
47 Miami 32,937 47 Providence 26,980
48 Oklahoma City 32,813 48 Rochester 26,813
49 West Palm Beach 32,784 49 Salt Lake City 26,166
50 Providence 26,606 50 Buffalo 25,292
Real GMP, $ per capita, 2001 Real personal income,
$ per capita, 2000
Source : US Conference of Mayors, adjusted for cost of living index based on
data from Statistical Abstract of the United States and Taubman Center at
Harvard University.
Source : Bureau of Economic Analysis, adjusted for cost of living index based on
data from Statistical Abstract of the United States and Taubman Center at
Harvard University.

BH
I
Metro Area and State Competitiveness Report / Page 71
Data C
harts: Governm
ent and Fiscal Policy
Real personal income, $ per capita, 2000
Rank Metro % Rank Metro $
1 Nashville 7.3 1 Atlanta 0.0
2 Memphis 7.6 1 Denver 0.0
3 Austin 7.6 1 Greensboro 0.0
3 Dallas 7.6 1 Indianapolis 0.0
3 Houston 7.6 1 Nashville 0.0
3 San Antonio 7.6 1 Raleigh 0.0
7 Las Vegas 8.3 7 Milwaukee 0.2
8 New Orleans 8.4 8 Austin 0.4
9 Atlanta 8.4 8 Dallas 0.4
10 Portland 8.4 8 Houston 0.4
11 Greensboro 8.6 8 San Antonio 0.4
11 Raleigh 8.6 12 Jacksonville 0.4
13 Norfolk 8.6 12 Orlando 0.4
14 Richmond 8.6 12 Miami 0.4
15 Denver 8.6 12 Tampa 0.4
16 Charlotte 8.6 12 West Palm Beach 0.4
17 St. Louis 8.6 17 Norfolk 0.7
18 Indianapolis 8.8 18 Richmond 0.7
19 Kansas City 8.9 19 Memphis 0.9
20 Chicago 9.0 20 Chicago 1.4
21 Louisville 9.0 21 Charlotte 4.0
22 Boston 9.0 22 Detroit 5.6
23 Phoenix 9.2 22 Grand Rapids 5.6
24 Cincinnati 9.3 24 Kansas City 9.8
25 Salt Lake City 9.3 25 St. Louis 9.9
26 Cleveland 9.3 26 Boston 17.7
26 Columbus 9.3 27 New Orleans 20.7
28 Los Angeles 9.3 28 Providence 22.5
28 Sacramento 9.3 29 Philadelphia 32.1
28 San Diego 9.3 30 Pittsburgh 35.1
28 San Francisco 9.3 31 Minneapolis 39.1
32 Washington 9.3 32 Washington 49.8
33 Oklahoma City 9.4 33 Hartford 53.5
34 Seattle 9.4 34 Louisville 90.0
35 Philadelphia 9.6 35 Oklahoma City 101.7
36 Pittsburgh 9.6 36 Los Angeles 107.3
37 Jacksonville 9.7 36 Sacramento 107.3
37 Miami 9.7 36 San Diego 107.3
37 Orlando 9.7 36 San Francisco 107.3
37 Tampa 9.7 40 New York 136.5
37 West Palm Beach 9.7 41 Salt Lake City 152.8
42 Providence 10.2 42 Phoenix 163.9
43 Detroit 10.3 43 Rochester 212.0
43 Grand Rapids 10.3 44 Buffalo 212.0
45 Hartford 10.4 45 Portland 402.9
46 Minneapolis 10.6 46 Seattle 507.6
47 New York 11.0 47 Cincinnati 571.3
48 Milwaukee 11.0 48 Las Vegas 582.7
49 Buffalo 11.6 49 Cleveland 698.0
49 Rochester 11.6 49 Columbus 698.0
Source : US Census Bureau and Bureau of Economic Analysis. Estimated
as a weighted average of the component state data.
Taxes as a % of current GSP, fiscal
year 1998-99
Source : US Census Bureau and Bureau of Labor Statistics. Estimated as a
weighted average of the component state data.
Workers' compensation collections,
$ per employee, fiscal year 1998-99

BH
I
Metro Area and State Competitiveness Report / Page 72
Dat
a C
hart
s: G
over
nmen
t and
Fis
cal P
olic
y
Rank Metro Index Rank Metro Index
1 Charlotte 25.0 1 Atlanta 25.0
1 Columbus 25.0 1 Detroit 25.0
1 Indianapolis 25.0 1 Grand Rapids 25.0
1 Portland 25.0 1 Richmond 25.0
1 Raleigh 25.0 1 Salt Lake City 25.0
1 West Palm Beach 25.0 6 Norfolk 25.0
7 Minneapolis 24.5 7 Minneapolis 24.9
8 Grand Rapids 24.5 8 Kansas City 24.6
8 Seattle 24.5 9 Charlotte 24.6
10 Dallas 24.3 10 St. Louis 24.5
11 Cincinnati 24.0 11 Greensboro 24.5
11 Greensboro 24.0 11 Raleigh 24.5
13 Phoenix 23.9 13 Washington 24.4
14 Austin 23.5 14 Cleveland 24.0
14 Denver 23.5 14 Columbus 24.0
14 Salt Lake City 23.5 14 Denver 24.0
14 San Antonio 23.5 14 Indianapolis 24.0
14 San Diego 23.5 14 Seattle 24.0
19 Jacksonville 23.0 19 Cincinnati 23.9
19 Memphis 23.0 20 Austin 23.5
19 Milwaukee 23.0 20 Dallas 23.5
19 Nashville 23.0 20 Houston 23.5
19 Oklahoma City 23.0 20 Jacksonville 23.5
19 Sacramento 23.0 20 Miami 23.5
25 Los Angeles 23.0 20 Orlando 23.5
26 Norfolk 23.0 20 San Antonio 23.5
27 San Francisco 22.6 20 Tampa 23.5
28 Atlanta 22.5 20 West Palm Beach 23.5
28 Kansas City 22.5 29 Philadelphia 23.3
30 Boston 22.0 30 Louisville 23.2
30 Houston 22.0 31 Portland 23.2
30 Las Vegas 22.0 32 Chicago 23.1
30 Louisville 22.0 33 Hartford 23.0
30 Orlando 22.0 33 Las Vegas 23.0
30 Richmond 22.0 33 Nashville 23.0
36 Tampa 21.5 33 Phoenix 23.0
37 Rochester 21.5 33 Pittsburgh 23.0
38 Cleveland 21.1 38 Memphis 23.0
39 Chicago 21.0 39 Boston 22.6
39 Hartford 21.0 40 Milwaukee 22.5
41 Providence 20.0 40 Oklahoma City 22.5
42 Washington 19.6 42 New York 22.3
43 New York 19.5 43 Providence 22.1
44 Pittsburgh 19.0 44 Buffalo 21.5
44 St. Louis 19.0 44 Rochester 21.5
46 Detroit 18.5 46 Los Angeles 21.0
47 New Orleans 17.5 46 Sacramento 21.0
47 Philadelphia 17.5 46 San Diego 21.0
49 Buffalo 17.0 46 San Francisco 21.0
50 Miami 15.0 50 New Orleans 20.0
Bond rating: composite of Standard &
Poor's and Moody's, 2000
Source : Calculated based on data from Statistical Abstract of the United
States. Bond ratings were scaled from 1 to 25.
Source : Statistical Abstract of the United States and Census of Population. Estimated
as a weighted average of the component state data. Bond ratings were scaled from 1
to 25.
State bond rating, 2001
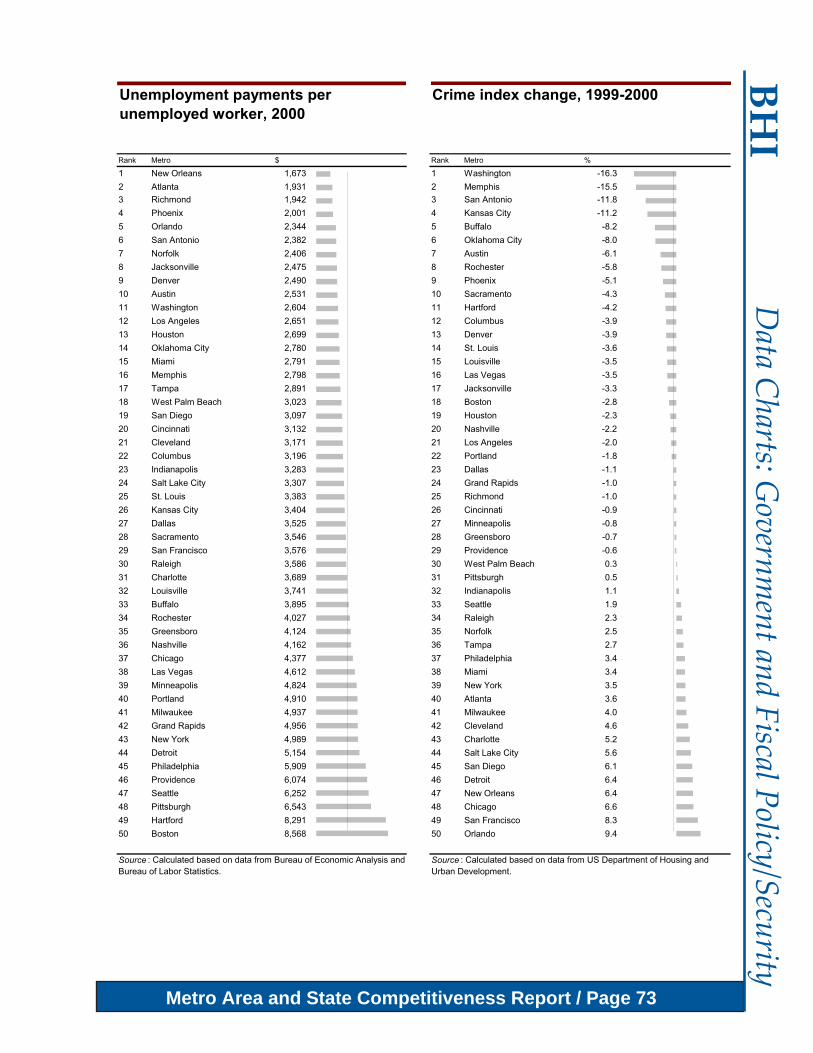
BH
I
Metro Area and State Competitiveness Report / Page 73
Rank Metro $ Rank Metro %
1 New Orleans 1,673 1 Washington -16.3
2 Atlanta 1,931 2 Memphis -15.5
3 Richmond 1,942 3 San Antonio -11.8
4 Phoenix 2,001 4 Kansas City -11.2
5 Orlando 2,344 5 Buffalo -8.2
6 San Antonio 2,382 6 Oklahoma City -8.0
7 Norfolk 2,406 7 Austin -6.1
8 Jacksonville 2,475 8 Rochester -5.8
9 Denver 2,490 9 Phoenix -5.1
10 Austin 2,531 10 Sacramento -4.3
11 Washington 2,604 11 Hartford -4.2
12 Los Angeles 2,651 12 Columbus -3.9
13 Houston 2,699 13 Denver -3.9
14 Oklahoma City 2,780 14 St. Louis -3.6
15 Miami 2,791 15 Louisville -3.5
16 Memphis 2,798 16 Las Vegas -3.5
17 Tampa 2,891 17 Jacksonville -3.3
18 West Palm Beach 3,023 18 Boston -2.8
19 San Diego 3,097 19 Houston -2.3
20 Cincinnati 3,132 20 Nashville -2.2
21 Cleveland 3,171 21 Los Angeles -2.0
22 Columbus 3,196 22 Portland -1.8
23 Indianapolis 3,283 23 Dallas -1.1
24 Salt Lake City 3,307 24 Grand Rapids -1.0
25 St. Louis 3,383 25 Richmond -1.0
26 Kansas City 3,404 26 Cincinnati -0.9
27 Dallas 3,525 27 Minneapolis -0.8
28 Sacramento 3,546 28 Greensboro -0.7
29 San Francisco 3,576 29 Providence -0.6
30 Raleigh 3,586 30 West Palm Beach 0.3
31 Charlotte 3,689 31 Pittsburgh 0.5
32 Louisville 3,741 32 Indianapolis 1.1
33 Buffalo 3,895 33 Seattle 1.9
34 Rochester 4,027 34 Raleigh 2.3
35 Greensboro 4,124 35 Norfolk 2.5
36 Nashville 4,162 36 Tampa 2.7
37 Chicago 4,377 37 Philadelphia 3.4
38 Las Vegas 4,612 38 Miami 3.4
39 Minneapolis 4,824 39 New York 3.5
40 Portland 4,910 40 Atlanta 3.6
41 Milwaukee 4,937 41 Milwaukee 4.0
42 Grand Rapids 4,956 42 Cleveland 4.6
43 New York 4,989 43 Charlotte 5.2
44 Detroit 5,154 44 Salt Lake City 5.6
45 Philadelphia 5,909 45 San Diego 6.1
46 Providence 6,074 46 Detroit 6.4
47 Seattle 6,252 47 New Orleans 6.4
48 Pittsburgh 6,543 48 Chicago 6.6
49 Hartford 8,291 49 San Francisco 8.3
50 Boston 8,568 50 Orlando 9.4
Source : Calculated based on data from Bureau of Economic Analysis and
Bureau of Labor Statistics.
Source : Calculated based on data from US Department of Housing and
Urban Development.
Unemployment payments per
unemployed worker, 2000
Crime index change, 1999-2000
Data C
harts: Governm
ent and Fiscal Policy/Security

BH
I
Metro Area and State Competitiveness Report / Page 74
Rank Metro # Rank Metro #
1 Rochester 228.9 1 Chicago 1,448.7
2 Hartford 276.2 2 Boston 1,609.6
3 Cincinnati 285.6 3 Pittsburgh 1,655.7
4 Providence 293.7 4 New York 1,692.0
5 Denver 330.8 5 San Diego 1,700.5
6 Pittsburgh 333.0 6 Los Angeles 1,700.9
7 Salt Lake City 342.4 7 Hartford 2,044.7
8 Minneapolis 353.7 8 Providence 2,084.5
9 Austin 365.3 9 Indianapolis 2,087.7
10 Cleveland 365.8 10 Louisville 2,096.0
11 Grand Rapids 414.8 11 San Francisco 2,148.2
12 Portland 420.6 12 Cleveland 2,191.0
13 Milwaukee 424.3 13 Las Vegas 2,204.1
14 Seattle 426.3 14 Buffalo 2,283.2
15 Boston 445.7 15 Detroit 2,316.3
16 Richmond 450.5 16 Sacramento 2,336.7
17 St. Louis 455.5 17 Cincinnati 2,350.0
18 Buffalo 458.4 18 Philadelphia 2,360.2
19 Norfolk 472.4 19 Grand Rapids 2,452.2
20 Raleigh 472.6 20 Denver 2,499.2
21 Columbus 478.6 21 Washington 2,535.2
22 San Diego 485.1 22 St. Louis 2,589.8
23 San Francisco 505.0 23 Rochester 2,599.8
24 Indianapolis 506.9 24 Houston 2,716.7
25 Oklahoma City 513.3 25 Milwaukee 2,823.0
26 Louisville 515.7 26 Minneapolis 2,848.7
27 Sacramento 517.8 27 Kansas City 2,864.4
28 Greensboro 546.4 28 Norfolk 2,998.9
29 New York 549.2 29 Richmond 2,999.3
30 Phoenix 550.4 30 Atlanta 3,000.8
31 Las Vegas 550.5 31 Austin 3,091.7
32 Kansas City 550.6 32 Dallas 3,138.0
33 Chicago 557.1 33 Greensboro 3,153.7
34 San Antonio 578.8 34 New Orleans 3,170.4
35 Atlanta 578.9 35 Seattle 3,245.9
36 Dallas 585.0 36 Raleigh 3,255.5
37 Philadelphia 635.5 37 Tampa 3,258.3
38 Washington 657.5 38 Memphis 3,272.1
39 Houston 675.0 39 Orlando 3,363.4
40 Detroit 688.1 40 Charlotte 3,404.3
41 Los Angeles 721.7 41 Portland 3,414.4
42 West Palm Beach 737.5 42 Jacksonville 3,473.9
43 New Orleans 737.9 43 Nashville 3,497.3
44 Charlotte 763.1 44 Phoenix 3,506.3
45 Orlando 876.4 45 Columbus 3,671.3
46 Tampa 886.9 46 West Palm Beach 3,808.6
47 Jacksonville 942.2 47 Miami 3,833.7
48 Nashville 961.2 48 Salt Lake City 3,972.1
49 Miami 962.7 49 Oklahoma City 4,259.6
50 Memphis 1,001.7 50 San Antonio 4,623.5
Source : Calculated based on data from US Department of Housing and
Urban Development and Census of Population.
Source : Calculated based on data from US Department of Housing and Urban
Development and Census of Population.
Thefts per 100,000 inhabitants, 2000Violent crimes per 100,000
inhabitants, 2000
Dat
a C
hart
s: S
ecur
ity

BH
I
Metro Area and State Competitiveness Report / Page 75
Data C
harts: Security/Infrastructure
Rank Metro # Rank Metro Index
1 Boston 1.84 1 New York 62.9
2 Portland 2.15 2 Seattle 39.4
3 Grand Rapids 2.30 3 San Francisco 31.4
4 Hartford 2.44 4 Boston 27.4
5 Cincinnati 2.84 5 Chicago 26.5
6 Salt Lake City 3.20 6 Denver 24.3
7 Seattle 3.25 7 Washington 22.0
8 Denver 3.26 8 Portland 21.9
9 Austin 3.44 9 Miami 21.5
10 San Diego 3.45 10 Pittsburgh 21.4
11 Pittsburgh 3.46 11 San Antonio 20.9
12 Minneapolis 3.55 12 Salt Lake City 19.5
13 Buffalo 3.79 13 Los Angeles 18.9
14 Cleveland 3.90 14 Austin 18.1
15 Providence 4.26 15 Philadelphia 17.4
16 San Francisco 4.50 16 San Diego 17.2
17 Oklahoma City 4.62 17 Atlanta 16.7
18 Rochester 4.94 18 Cleveland 16.4
19 Sacramento 4.95 19 Las Vegas 15.4
20 Tampa 4.97 20 Houston 15.1
21 New York 5.00 20 Milwaukee 15.1
22 Orlando 5.05 22 New Orleans 13.9
23 Columbus 5.31 23 Hartford 13.7
24 Greensboro 5.88 24 West Palm Beach 13.3
25 West Palm Beach 6.07 25 Louisville 13.2
26 Raleigh 6.43 26 St. Louis 13.2
27 St. Louis 6.54 27 Orlando 13.1
28 San Antonio 6.56 28 Dallas 12.6
29 Miami 6.71 29 Providence 12.2
30 Louisville 6.76 30 Cincinnati 12.0
31 Phoenix 7.14 31 Minneapolis 10.9
32 Kansas City 7.21 32 Detroit 10.3
33 Houston 7.28 33 Norfolk 9.6
34 Philadelphia 7.28 34 Sacramento 9.5
35 Dallas 7.47 35 Phoenix 9.3
36 Charlotte 7.58 36 Columbus 9.0
37 Indianapolis 7.68 37 Buffalo 8.9
38 Nashville 7.88 38 Tampa 8.7
39 Milwaukee 7.88 39 Jacksonville 8.6
40 Atlanta 7.91 40 Memphis 8.0
41 Las Vegas 8.00 41 Kansas City 7.8
42 Los Angeles 8.00 42 Richmond 7.5
43 Norfolk 8.17 43 Rochester 6.7
44 Chicago 8.19 44 Indianapolis 6.3
45 Jacksonville 8.99 45 Nashville 5.4
46 Washington 9.35 46 Raleigh 4.9
47 Detroit 9.90 47 Grand Rapids 4.8
48 Richmond 11.36 48 Charlotte 3.9
49 Memphis 14.88 49 Oklahoma City 3.6
50 New Orleans 20.36 50 Greensboro 2.2
Source : Money Magazine.Source : Calculated based on data from US Department of Housing and
Urban Development and Census of Population.
Mass transit availability, 2000Murders per 100,000 inhabitants, 2000

BH
I
Metro Area and State Competitiveness Report / Page 76
Rank Metro % Rank Metro %
1 Salt Lake City 66.1 1 San Francisco 56.1
2 Denver 62.6 2 Austin 55.5
3 Portland 61.0 3 Seattle 53.3
4 Seattle 60.7 4 Washington 52.8
5 Hartford 60.4 5 Salt Lake City 50.0
6 Minneapolis 56.8 6 Dallas 49.6
7 Los Angeles 56.6 7 Denver 49.0
7 Sacramento 56.6 8 Houston 48.8
7 San Diego 56.6 9 Los Angeles 48.7
7 San Francisco 56.6 10 Norfolk 48.5
11 Boston 54.5 11 Portland 48.1
12 Richmond 53.9 12 San Diego 46.8
13 Kansas City 53.8 13 Sacramento 46.3
14 Norfolk 53.8 14 Kansas City 46.1
15 Phoenix 53.5 15 Boston 46.0
16 Washington 53.1 16 Raleigh 45.7
17 St. Louis 52.1 17 Atlanta 45.1
18 Providence 51.6 18 Minneapolis 45.0
19 Detroit 51.5 19 Chicago 44.8
19 Grand Rapids 51.5 20 New York 43.7
21 New York 51.5 21 Phoenix 43.4
22 Philadelphia 51.0 22 Jacksonville 43.1
23 Milwaukee 50.9 23 Indianapolis 42.3
24 Chicago 50.1 24 Providence 42.2
25 Jacksonville 50.1 25 Las Vegas 41.8
25 Miami 50.1 25 Miami 41.8
25 Orlando 50.1 27 Philadelphia 41.5
25 Tampa 50.1 28 Columbus 41.1
25 West Palm Beach 50.1 29 Hartford 40.9
30 Cleveland 49.5 30 St. Louis 40.8
30 Columbus 49.5 31 Grand Rapids 40.5
32 Las Vegas 49.4 31 New Orleans 40.5
33 Cincinnati 49.0 33 Orlando 40.3
34 Indianapolis 48.8 34 Greensboro 39.7
35 Buffalo 48.7 34 Oklahoma City 39.7
35 Rochester 48.7 36 Milwaukee 38.9
37 Pittsburgh 48.4 37 Detroit 38.8
38 Austin 47.9 38 Cleveland 37.3
38 Dallas 47.9 39 West Palm Beach 36.9
38 Houston 47.9 40 Charlotte 36.7
38 San Antonio 47.9 40 Tampa 36.7
42 Atlanta 47.1 42 Memphis 36.1
43 Louisville 46.8 43 Buffalo 35.9
44 Nashville 45.7 44 Cincinnati 35.8
45 Greensboro 45.3 44 Nashville 35.8
45 Raleigh 45.3 46 Louisville 35.5
47 Charlotte 45.1 47 San Antonio 34.2
48 Memphis 44.6 48 Pittsburgh 30.8
49 Oklahoma City 41.5 49 Richmond 24.6
50 New Orleans 41.2 50 Rochester 24.5
Source : National Telecommunications and Information Administration and
Census of Population. Estimated as a weighted average of the component state
data.
Source : Progressive Policy Institute and Center for Regional Economic Issues.
% of adults online, 1999% of households with computers, 2000
Dat
a C
hart
s: In
fras
truc
ture

BH
I
Metro Area and State Competitiveness Report / Page 77
Rank Metro mins Rank Metro $
1 Grand Rapids 21.5 1 Pittsburgh 480.0
2 Rochester 22.1 2 Oklahoma City 485.0
3 Buffalo 22.2 3 Louisville 495.0
4 Oklahoma City 22.8 4 Buffalo 514.0
5 Milwaukee 23.1 5 Cincinnati 519.8
6 Salt Lake City 23.2 6 New Orleans 522.0
7 Greensboro 23.2 7 St. Louis 533.0
8 Louisville 23.7 8 Providence 540.0
9 Kansas City 23.7 9 Greensboro 548.0
10 Hartford 23.9 10 Cleveland 557.6
11 Columbus 24.1 11 Grand Rapids 559.0
12 Providence 24.3 12 San Antonio 568.0
13 Minneapolis 24.5 13 Memphis 569.0
14 Indianapolis 24.6 14 Indianapolis 584.0
15 Norfolk 24.8 15 Kansas City 586.0
16 Portland 24.8 16 Milwaukee 590.2
17 Cleveland 24.9 17 Columbus 594.0
18 Las Vegas 25.0 18 Detroit 594.9
19 Richmond 25.1 19 Rochester 602.0
20 Cincinnati 25.2 20 Houston 606.0
21 San Antonio 25.3 21 Nashville 613.0
22 Memphis 25.4 22 Tampa 618.0
23 Raleigh 25.5 23 Jacksonville 620.0
24 San Diego 25.7 24 Norfolk 620.0
25 Sacramento 25.8 25 Richmond 621.0
26 West Palm Beach 25.9 26 Charlotte 628.0
27 Tampa 26.2 27 Salt Lake City 632.0
28 Austin 26.2 28 Minneapolis 645.0
29 Denver 26.2 29 Hartford 646.0
30 Pittsburgh 26.2 30 Philadelphia 653.8
31 St. Louis 26.3 31 Dallas 656.3
32 Nashville 26.4 32 Chicago 660.6
33 Charlotte 26.8 33 Portland 663.9
34 Phoenix 26.8 34 Phoenix 667.0
35 Detroit 27.0 35 Sacramento 673.1
36 Jacksonville 27.2 36 Raleigh 678.0
37 New Orleans 27.4 37 Orlando 691.0
38 Orlando 27.6 38 Miami 695.1
39 Seattle 28.1 39 Las Vegas 701.0
40 Dallas 28.2 40 Denver 708.5
41 Boston 28.6 41 Austin 721.0
42 Philadelphia 28.6 42 Seattle 723.6
43 Los Angeles 29.6 43 Boston 732.8
44 Houston 29.6 44 West Palm Beach 738.0
45 Miami 29.7 45 Los Angeles 744.5
46 San Francisco 29.9 46 Atlanta 745.0
47 Atlanta 31.6 47 Washington 749.7
48 Chicago 31.8 48 San Diego 764.0
49 Washington 32.3 49 New York 768.9
50 New York 34.6 50 San Francisco 986.3
Source : Calculated based on data from US Department of Housing and Urban
Development.
Average travel time to work,
minutes per day, 2000
Median household gross rent,
$/month, 2000
Source : Calculated based on data from US Census Bureau.
Data C
harts: Infrastructure

BH
I
Metro Area and State Competitiveness Report / Page 78
Rank Metro % Rank Metro %
1 Providence 6.6 1 Hartford 81.5
2 Milwaukee 7.1 2 Cleveland 78.4
3 Pittsburgh 7.6 3 Salt Lake City 77.6
4 Hartford 7.9 4 Minneapolis 76.1
5 Minneapolis 8.9 5 Pittsburgh 75.1
6 Boston 9.2 6 Kansas City 72.9
7 Philadelphia 9.3 7 Sacramento 71.4
8 Grand Rapids 9.9 8 Washington 70.6
8 Detroit 9.9 9 Milwaukee 69.9
10 Nashville 10.3 10 Rochester 69.7
11 Memphis 10.7 11 Boston 68.9
12 Cleveland 10.9 12 Richmond 68.8
12 Columbus 10.9 13 Indianapolis 68.8
14 Kansas City 11.0 14 Portland 68.7
15 Washington 11.0 15 Norfolk 67.7
16 Cincinnati 11.2 16 St. Louis 66.4
17 St. Louis 11.3 17 Houston 66.1
18 Indianapolis 12.1 18 Buffalo 65.6
19 Richmond 12.7 19 Columbus 64.8
20 Norfolk 12.7 20 Seattle 64.1
21 Louisville 12.7 21 San Antonio 64.1
22 Charlotte 12.9 22 Louisville 63.7
23 Greensboro 13.0 23 Grand Rapids 63.4
23 Raleigh 13.0 24 San Francisco 63.1
25 Chicago 13.3 25 San Diego 63.1
26 Denver 13.3 26 Oklahoma City 62.8
27 Seattle 13.3 27 Detroit 62.3
28 Salt Lake City 13.4 28 Chicago 62.2
29 Portland 13.6 29 Dallas 61.6
30 New York 13.7 30 Philadelphia 61.4
31 Atlanta 14.6 31 Charlotte 61.3
32 Buffalo 15.2 32 Denver 61.2
32 Rochester 15.2 33 Las Vegas 61.0
34 Las Vegas 15.6 34 Los Angeles 60.8
35 Phoenix 16.1 35 New York 60.5
36 Jacksonville 17.3 36 Orlando 60.3
36 Miami 17.3 37 Cincinnati 59.7
36 Orlando 17.3 38 Atlanta 59.4
36 Tampa 17.3 39 West Palm Beach 57.3
36 West Palm Beach 17.3 40 New Orleans 57.3
41 Los Angeles 18.1 41 Tampa 57.0
41 Sacramento 18.1 42 Memphis 56.9
41 San Diego 18.1 43 Providence 56.7
41 San Francisco 18.1 44 Phoenix 56.3
45 New Orleans 19.1 45 Austin 56.2
46 Oklahoma City 19.3 46 Jacksonville 55.1
47 Austin 21.5 47 Greensboro 53.9
47 Dallas 21.5 48 Miami 53.6
47 Houston 21.5 49 Raleigh 52.5
47 San Antonio 21.5 50 Nashville 48.8
High school finishers as % of 18-year olds,
school year 1999-00
Source : US Census Bureau. Estimated as a weighted average of the
component state data.
Source : Calculated based on data from National Center for Education Statistics
and US Census Bureau.
% of population without health
insurance, 2000
Dat
a C
hart
s: H
uman
Res
ourc
es

BH
I
Metro Area and State Competitiveness Report / Page 79
Rank Metro % Rank Metro %
1 Minneapolis 90.6 1 Greensboro 4.3
2 Seattle 89.5 1 Raleigh 4.3
3 Salt Lake City 87.5 3 Charlotte 4.4
4 Kansas City 86.7 4 Norfolk 6.4
5 Denver 86.6 5 Richmond 6.4
6 Portland 86.2 6 Phoenix 6.5
7 Columbus 85.8 7 Austin 6.7
8 Boston 85.7 7 Dallas 6.7
9 Raleigh 85.4 7 Houston 6.7
10 Pittsburgh 85.1 7 San Antonio 6.7
11 Washington 84.9 11 Salt Lake City 7.8
12 Austin 84.8 12 Atlanta 8.2
13 Norfolk 84.7 13 Jacksonville 8.5
14 Grand Rapids 84.6 13 Miami 8.5
15 Sacramento 84.6 13 Orlando 8.5
16 Rochester 84.4 13 Tampa 8.5
17 Milwaukee 84.3 13 West Palm Beach 8.5
18 Atlanta 84.0 18 Memphis 8.7
19 Indianapolis 84.0 19 Nashville 8.7
20 San Francisco 83.9 20 Oklahoma City 9.4
21 Oklahoma City 83.6 21 Denver 10.1
22 Jacksonville 83.6 21 New Orleans 10.1
23 West Palm Beach 83.6 23 Louisville 13.1
24 Hartford 83.6 24 Kansas City 13.8
25 Cleveland 83.5 25 Washington 14.0
26 St. Louis 83.4 26 Boston 15.3
27 Detroit 83.0 27 Indianapolis 15.3
28 Buffalo 83.0 28 St. Louis 16.2
29 Orlando 82.8 29 Hartford 16.7
30 Richmond 82.6 30 Milwaukee 17.2
31 San Diego 82.6 31 Las Vegas 17.3
32 Cincinnati 82.6 32 Portland 17.4
33 Phoenix 81.9 33 Cincinnati 18.0
34 Philadelphia 81.9 34 Los Angeles 18.0
35 Tampa 81.5 34 Sacramento 18.0
36 Nashville 81.4 34 San Diego 18.0
37 Louisville 81.3 34 San Francisco 18.0
38 Chicago 81.1 38 Providence 18.0
39 Charlotte 80.5 39 Minneapolis 18.3
40 Dallas 79.9 40 Pittsburgh 18.3
41 Memphis 79.8 41 Philadelphia 18.6
42 New York 79.4 42 Chicago 19.1
43 Las Vegas 79.2 43 Cleveland 19.1
44 Greensboro 78.6 43 Columbus 19.1
45 New Orleans 77.7 45 Seattle 20.0
46 San Antonio 77.3 46 Detroit 22.6
47 Houston 76.4 46 Grand Rapids 22.6
48 Providence 76.0 48 New York 25.2
49 Miami 73.9 49 Buffalo 27.7
50 Los Angeles 73.0 49 Rochester 27.7
% of population aged 25 and over that
graduated from high school, 2000
Source : Calculated based on data from Census of Population. Source : Bureau of Labor Statistics and Census of Population. Estimated as a
weighted average of the component state data.
% of labor force represented by unions,
2001
Data C
harts: Hum
an Resources

BH
I
Metro Area and State Competitiveness Report / Page 80
Rank Metro % Rank Metro #
1 Hartford 1.6 1 Salt Lake City 75.9
2 Austin 1.6 2 Providence 74.0
3 Raleigh 1.6 3 Phoenix 68.3
4 Richmond 1.8 4 Boston 65.8
5 Denver 1.9 5 Denver 64.5
6 Boston 1.9 6 Kansas City 61.5
7 Indianapolis 2.0 7 Los Angeles 60.9
8 Minneapolis 2.1 7 Sacramento 60.9
9 San Francisco 2.1 7 San Diego 60.9
10 Oklahoma City 2.1 7 San Francisco 60.9
11 Columbus 2.2 11 Chicago 59.8
12 Orlando 2.3 12 Washington 59.3
13 Norfolk 2.3 13 Minneapolis 59.2
14 San Diego 2.4 14 St. Louis 58.6
15 Phoenix 2.4 15 Milwaukee 58.0
16 Atlanta 2.4 16 Detroit 56.7
17 Tampa 2.4 16 Grand Rapids 56.7
18 Dallas 2.5 18 Buffalo 56.1
19 Salt Lake City 2.6 18 Rochester 56.1
20 Washington 2.6 20 Richmond 55.0
21 San Antonio 2.7 21 Norfolk 55.0
22 Nashville 2.8 22 Oklahoma City 53.3
23 Greensboro 2.8 23 Seattle 53.3
24 Jacksonville 2.8 24 Portland 53.0
25 Kansas City 2.9 25 Greensboro 51.7
26 Cincinnati 2.9 25 Raleigh 51.7
27 Grand Rapids 2.9 27 Las Vegas 51.4
28 Detroit 3.0 28 Indianapolis 51.3
29 Louisville 3.0 29 Charlotte 51.3
30 Milwaukee 3.0 30 New Orleans 50.6
31 Providence 3.1 31 New York 50.5
32 Charlotte 3.2 32 Pittsburgh 50.5
33 Portland 3.2 33 Austin 49.4
34 Houston 3.2 33 Dallas 49.4
35 Sacramento 3.4 33 Houston 49.4
36 West Palm Beach 3.5 33 San Antonio 49.4
37 St. Louis 3.6 37 Cleveland 48.7
38 New York 3.6 37 Columbus 48.7
39 Seattle 3.6 39 Philadelphia 48.6
40 Memphis 3.6 40 Cincinnati 48.4
41 Rochester 3.7 41 Hartford 47.8
42 Philadelphia 3.8 42 Louisville 47.0
43 Pittsburgh 3.8 43 Memphis 46.3
44 Las Vegas 4.0 44 Nashville 46.1
45 Cleveland 4.0 45 Jacksonville 45.3
46 Los Angeles 4.1 45 Miami 45.3
47 Chicago 4.2 45 Orlando 45.3
48 Miami 4.2 45 Tampa 45.3
49 New Orleans 4.7 45 West Palm Beach 45.3
50 Buffalo 4.9 50 Atlanta 40.0
Enrollment in degree-granting institutions,
per 1000 inhabitants, 1999
Source : US Bureau of Labor Statistics. Source : Department of Education and US Census Bureau. Estimated as a
weighted average of the component state data.
Unemployment rate, December 2000
Dat
a C
hart
s: H
uman
Res
ourc
es

BH
I
Metro Area and State Competitiveness Report / Page 81
Rank Metro % Rank Metro %
1 Grand Rapids 87.4 1 Miami 40.2
2 Minneapolis 85.2 2 Los Angeles 30.9
3 Kansas City 85.0 3 San Francisco 27.0
4 Louisville 83.3 4 New York 24.4
5 Austin 82.8 5 San Diego 21.5
6 Tampa 82.8 6 Houston 19.2
7 Orlando 81.6 7 West Palm Beach 17.4
8 Portland 81.2 8 Las Vegas 16.5
9 Columbus 81.0 9 Chicago 16.0
10 Milwaukee 80.9 10 Dallas 15.0
11 Dallas 80.7 11 Sacramento 14.5
12 Salt Lake City 80.5 12 Phoenix 14.1
13 San Francisco 80.2 13 Washington 12.9
14 St. Louis 79.9 14 Boston 12.4
15 Cincinnati 79.9 15 Austin 12.2
16 Indianapolis 79.5 16 Providence 12.0
17 Atlanta 79.1 17 Orlando 12.0
18 Denver 79.0 18 Seattle 11.7
19 Detroit 79.0 19 Portland 11.0
20 Charlotte 78.7 20 Denver 10.7
21 Washington 78.2 21 Atlanta 10.3
22 Seattle 78.2 22 Hartford 10.2
23 Rochester 78.0 23 San Antonio 10.2
24 Cleveland 78.0 24 Tampa 9.8
25 Boston 78.0 25 Raleigh 9.2
26 West Palm Beach 77.9 26 Salt Lake City 8.6
27 Nashville 77.6 27 Minneapolis 7.1
28 Chicago 77.3 28 Detroit 7.0
29 Greensboro 77.2 29 Philadelphia 7.0
30 Richmond 76.9 30 Charlotte 6.7
31 Pittsburgh 76.7 31 Greensboro 5.7
32 Hartford 76.6 32 Rochester 5.7
33 Raleigh 76.3 33 Oklahoma City 5.7
34 Sacramento 76.2 34 Jacksonville 5.4
35 Los Angeles 76.0 35 Milwaukee 5.3
36 Jacksonville 75.3 36 Grand Rapids 5.2
37 Houston 75.3 37 New Orleans 4.8
38 Philadelphia 75.2 38 Nashville 4.7
39 Oklahoma City 75.2 39 Columbus 4.6
40 Buffalo 74.5 40 Cleveland 4.6
41 Memphis 74.5 41 Kansas City 4.5
42 San Diego 74.2 42 Richmond 4.5
43 San Antonio 74.1 43 Norfolk 4.5
44 Providence 73.8 44 Buffalo 4.4
45 Las Vegas 73.7 45 Indianapolis 3.4
46 Phoenix 73.6 46 Memphis 3.3
47 Miami 72.4 47 St. Louis 3.1
48 New York 72.0 48 Louisville 2.7
49 Norfolk 70.2 49 Pittsburgh 2.6
50 New Orleans 68.2 50 Cincinnati 2.6
Source : Calculated based on data from Bureau of Labor Statistics and
Census of Population.
Source : US Census Bureau.
% of population born abroad, 2000% of adults in the labor force, 2000
Data C
harts: Hum
an Resources

BH
I
Metro Area and State Competitiveness Report / Page 82
Dat
a C
hart
s: H
uman
Res
ourc
es
Rank Metro # Rank Metro #
1 Providence 5.2 1 Boston 423.6
2 Austin 5.3 2 Rochester 408.6
3 Boston 5.7 2 Buffalo 408.6
4 Seattle 6.0 4 Washington 392.0
5 San Francisco 6.1 5 Hartford 384.5
6 Salt Lake City 6.4 6 New York 379.4
7 Portland 6.5 7 Providence 374.8
8 San Diego 6.6 8 Pittsburgh 318.0
9 Dallas 6.8 9 Philadelphia 315.9
10 Denver 6.9 10 Minneapolis 283.4
10 Los Angeles 6.9 11 Los Angeles 280.6
12 Minneapolis 7.0 11 Sacramento 280.6
13 Orlando 7.1 11 San Francisco 280.6
14 Jacksonville 7.2 11 San Diego 280.6
15 Oklahoma City 7.3 15 Jacksonville 280.0
16 Rochester 7.4 15 Miami 280.0
17 Las Vegas 7.5 15 West Palm Beach 280.0
17 Sacramento 7.5 15 Orlando 280.0
17 San Antonio 7.5 15 Tampa 280.0
20 Kansas City 7.6 20 Chicago 279.7
21 Columbus 7.8 21 Seattle 274.1
21 Miami 7.8 22 Richmond 272.0
23 Grand Rapids 7.9 23 Norfolk 271.8
23 New York 7.9 24 New Orleans 268.0
25 Buffalo 8.0 25 Portland 266.3
25 Houston 8.0 26 Denver 263.4
27 Phoenix 8.1 27 Nashville 262.8
27 West Palm Beach 8.1 28 Cleveland 262.0
29 Nashville 8.2 28 Columbus 262.0
30 Pittsburgh 8.4 30 Milwaukee 256.5
30 St. Louis 8.4 31 Cincinnati 256.2
32 Atlanta 8.5 32 Greensboro 255.2
32 Indianapolis 8.5 32 Raleigh 255.2
34 Raleigh 8.8 34 St. Louis 255.1
34 Tampa 8.8 35 Charlotte 252.9
36 Philadelphia 8.9 36 Memphis 252.6
37 Louisville 9.2 37 Grand Rapids 250.6
37 Norfolk 9.2 37 Detroit 250.6
37 Washington 9.2 39 Kansas City 241.4
40 Charlotte 9.3 40 Phoenix 229.8
40 Cincinnati 9.3 41 Louisville 227.3
40 Hartford 9.3 42 Atlanta 225.3
43 Detroit 9.5 43 Salt Lake City 220.7
43 New Orleans 9.5 44 Indianapolis 218.4
45 Chicago 9.7 45 Austin 217.3
46 Richmond 9.8 45 Houston 217.3
47 Greensboro 9.9 45 San Antonio 217.3
47 Milwaukee 9.9 45 Dallas 217.3
49 Cleveland 10.1 49 Las Vegas 198.3
50 Memphis 14.0 50 Oklahoma City 184.1
Infant mortality rate,
deaths per 1000 live births, 1994
Source : US Census Bureau. Source : Morgan Quitno Corporation. Estimated as a weighted average of the
component state data.
Nonfederal physicians per 100,000
inhabitants, 2000

BH
I
Metro Area and State Competitiveness Report / Page 83
Data C
harts: Technology
Rank Metro % Rank Metro $
1 Raleigh 14.5 1 Boston 214.1
2 Boston 11.1 2 Washington 135.8
3 Washington 10.8 3 Providence 108.2
4 Austin 10.7 4 Hartford 94.6
5 Salt Lake City 10.6 5 Seattle 90.0
6 St. Louis 10.5 6 Pittsburgh 77.1
7 Columbus 10.3 7 Buffalo 75.0
7 Greensboro 10.3 7 Rochester 75.0
9 Atlanta 10.2 9 Greensboro 72.2
9 Richmond 10.2 9 Raleigh 72.2
11 Buffalo 10.1 11 Los Angeles 66.4
11 Pittsburgh 10.1 11 Sacramento 66.4
11 Rochester 10.1 11 San Diego 66.4
11 San Diego 10.1 11 San Francisco 66.4
15 Cincinnati 10.0 15 Charlotte 66.0
15 Houston 10.0 16 New York 60.0
15 Miami 10.0 17 Portland 59.8
15 Providence 10.0 18 St. Louis 59.3
15 Sacramento 10.0 19 Philadelphia 58.0
15 San Francisco 10.0 20 Minneapolis 56.9
21 Detroit 9.9 21 Denver 56.7
21 Hartford 9.9 22 Salt Lake City 51.2
21 Minneapolis 9.9 23 Kansas City 47.4
21 New York 9.9 24 Milwaukee 47.2
21 Philadelphia 9.9 25 Nashville 40.3
21 Seattle 9.9 26 Grand Rapids 39.2
21 Tampa 9.9 26 Detroit 39.2
28 Chicago 9.8 28 Cleveland 39.1
28 Denver 9.8 28 Columbus 39.1
28 Nashville 9.8 30 Chicago 37.2
28 New Orleans 9.8 31 Houston 36.7
28 Oklahoma City 9.8 31 Austin 36.7
28 San Antonio 9.8 31 San Antonio 36.7
34 Cleveland 9.7 31 Dallas 36.7
34 Los Angeles 9.7 35 Memphis 36.2
34 Louisville 9.7 36 Cincinnati 36.0
34 Norfolk 9.7 37 Norfolk 30.6
34 Portland 9.7 38 Richmond 30.1
39 Dallas 9.6 39 Atlanta 28.7
39 Milwaukee 9.6 40 Indianapolis 23.2
39 Phoenix 9.6 41 Phoenix 21.3
42 Kansas City 9.5 42 Louisville 21.2
42 Las Vegas 9.5 43 New Orleans 17.5
42 Memphis 9.5 44 Jacksonville 14.1
42 Orlando 9.5 44 West Palm Beach 14.1
42 West Palm Beach 9.5 44 Miami 14.1
47 Charlotte 9.4 44 Orlando 14.1
47 Grand Rapids 9.4 44 Tampa 14.1
47 Indianapolis 9.4 49 Oklahoma City 12.9
47 Jacksonville 9.4 50 Las Vegas 9.0
Source : Progressive Policy Institute and Center for Regional Economic Issues.
Academic R&D funding relative to
employment, 1997
National Institutes of Health support to
institutions, $ per capita, 2001
Source : National Institutes of Health and US Census Bureau. Estimated as a
weighted average of the component state data.

BH
I
Metro Area and State Competitiveness Report / Page 84
Dat
a C
hart
s: T
echn
olog
y
Rank Metro # Rank Metro #
1 Rochester 145.3 1 Boston 338.5
2 Austin 137.1 2 Washington 298.2
3 San Francisco 136.8 3 Hartford 235.8
4 Raleigh 84.9 4 Buffalo 227.6
5 Minneapolis 75.9 4 Rochester 227.6
6 Boston 64.5 6 Denver 227.4
7 San Diego 62.0 7 Providence 224.4
8 Cincinnati 48.4 8 Chicago 209.7
9 Denver 47.3 9 New York 204.1
10 Detroit 46.4 10 Salt Lake City 203.2
11 Portland 44.2 11 Richmond 192.2
12 Hartford 43.5 12 Norfolk 191.8
13 Seattle 40.9 13 Grand Rapids 190.1
14 Dallas 39.3 13 Detroit 190.1
15 Philadelphia 38.8 15 Kansas City 189.6
16 West Palm Beach 38.4 16 Pittsburgh 183.5
17 Phoenix 38.2 17 Los Angeles 180.1
18 Houston 38.1 17 Sacramento 180.1
19 Milwaukee 37.9 17 San Diego 180.1
20 New York 37.8 17 San Francisco 180.1
21 Salt Lake City 37.2 21 Milwaukee 178.3
22 Cleveland 36.8 22 Philadelphia 176.1
23 Indianapolis 35.4 23 Columbus 169.9
24 Grand Rapids 35.4 23 Cleveland 169.9
25 Pittsburgh 34.7 25 Minneapolis 168.8
26 Chicago 34.3 26 Austin 162.6
27 Buffalo 30.3 26 Dallas 162.6
28 St. Louis 28.9 26 Houston 162.6
29 Los Angeles 28.1 26 San Antonio 162.6
30 Atlanta 27.1 30 St. Louis 162.1
31 Washington 26.8 31 Cincinnati 160.7
32 Providence 24.3 32 New Orleans 157.7
33 Columbus 23.1 33 Greensboro 156.5
34 Sacramento 22.9 33 Raleigh 156.5
35 Greensboro 19.0 35 Indianapolis 152.3
36 Charlotte 18.3 36 Charlotte 149.6
37 Tampa 16.9 37 Phoenix 140.6
38 San Antonio 16.4 38 Portland 125.9
39 Miami 16.2 39 Miami 124.3
40 Louisville 16.1 39 Jacksonville 124.3
41 Kansas City 15.8 39 Orlando 124.3
42 Memphis 15.2 39 Tampa 124.3
43 Richmond 15.2 39 West Palm Beach 124.3
44 Oklahoma City 14.0 44 Atlanta 122.6
45 Orlando 13.0 45 Seattle 122.1
46 Jacksonville 12.4 46 Louisville 118.3
47 Nashville 11.9 47 Oklahoma City 117.4
48 Las Vegas 11.9 48 Nashville 115.1
49 New Orleans 10.4 49 Memphis 113.9
50 Norfolk 8.4 50 Las Vegas 85.1
Source : Calculated based on data from Patent and Trademark Office and US
Census Bureau.
New patents issued per 100,000
inhabitants, 1999
Science and engineering graduate
students, per 100,000 inhabitants, 2000
Source : National Science Foundation and US Census Bureau. Estimated as a
weighted average of the component state data.

BH
I
Metro Area and State Competitiveness Report / Page 85
Data C
harts: Technology
Rank Metro % Rank Metro %
1 Boston 17.6 1 San Francisco 10.4
2 Washington 17.2 2 Austin 9.8
3 Denver 14.7 3 Denver 9.3
4 Greensboro 13.3 4 Raleigh 9.1
4 Raleigh 13.3 5 West Palm Beach 7.7
6 Charlotte 12.7 6 Seattle 7.6
7 Seattle 12.4 7 Boston 6.8
8 Buffalo 12.2 8 Dallas 6.4
8 Rochester 12.2 9 Atlanta 6.3
10 Hartford 11.8 10 Richmond 5.9
11 New York 11.1 11 Hartford 5.4
12 Minneapolis 10.8 12 Columbus 5.4
13 Norfolk 10.7 13 San Diego 5.2
14 Richmond 10.6 14 Minneapolis 5.2
15 Portland 10.6 15 Kansas City 5.1
16 Providence 10.5 16 Phoenix 5.1
17 Los Angeles 10.3 17 Jacksonville 4.7
17 Sacramento 10.3 18 Charlotte 4.6
17 San Diego 10.3 19 Philadelphia 4.4
17 San Francisco 10.3 20 Houston 4.4
21 Kansas City 9.8 21 New York 4.3
22 Detroit 9.1 22 Tampa 4.3
22 Grand Rapids 9.1 23 St. Louis 4.2
24 St. Louis 8.9 24 Chicago 4.2
25 Salt Lake City 8.7 25 Rochester 4.2
26 Philadelphia 8.5 26 Orlando 4.1
27 Atlanta 8.5 27 Portland 4.0
28 Oklahoma City 8.5 28 Detroit 3.8
29 Chicago 8.2 29 Salt Lake City 3.7
30 Austin 8.2 30 Sacramento 3.7
30 Dallas 8.2 31 Indianapolis 3.6
30 Houston 8.2 32 Cincinnati 3.5
30 San Antonio 8.2 33 Los Angeles 3.5
34 Phoenix 8.2 34 Milwaukee 3.2
35 Cleveland 7.6 35 Pittsburgh 3.1
35 Columbus 7.6 36 Louisville 2.9
37 Pittsburgh 7.5 37 Norfolk 2.8
38 Indianapolis 7.4 38 Greensboro 2.8
39 Cincinnati 7.2 39 Cleveland 2.7
40 Nashville 6.7 40 Memphis 2.7
41 Memphis 6.5 41 San Antonio 2.7
42 Jacksonville 5.9 42 Miami 2.7
42 Miami 5.9 43 Nashville 2.6
42 Orlando 5.9 44 Buffalo 2.4
42 Tampa 5.9 45 Oklahoma City 2.3
42 West Palm Beach 5.9 46 Washington 2.3
47 Louisville 5.6 47 New Orleans 2.0
48 Milwaukee 5.1 48 Grand Rapids 1.7
49 New Orleans 5.0 49 Providence 1.6
50 Las Vegas 4.3 50 Las Vegas 1.6
% of scientists and engineers in the labor
force, 1999
Source : National Science Foundation and Bureau of Labor Statistics. Estimated
as a weighted average of the component state data.
Source : Calculated based on data from Bureau of Labor Statistics.
High-tech payroll as % of
total payroll, 2000

BH
I
Metro Area and State Competitiveness Report / Page 86
Rank Metro $ Rank Metro #
1 New York 19,945.9 1 Atlanta 87.6
2 Hartford 17,652.2 2 Houston 89.5
3 Richmond 16,264.8 3 Austin 91.1
4 Boston 16,161.1 3 San Antonio 91.1
5 Pittsburgh 16,121.4 5 Louisville 91.9
6 Providence 15,438.5 6 Charlotte 92.2
7 Philadelphia 14,572.4 6 Greensboro 92.2
8 Greensboro 13,555.6 6 Raleigh 92.2
9 Chicago 13,510.5 9 Oklahoma City 92.4
10 Charlotte 13,154.3 10 Memphis 92.9
11 San Francisco 12,992.1 10 Nashville 92.9
12 Buffalo 12,474.4 12 New Orleans 93.0
13 Miami 12,381.0 13 Jacksonville 94.7
14 Milwaukee 12,328.1 13 Orlando 94.7
15 Louisville 12,217.9 13 West Palm Beach 94.7
16 Nashville 11,833.3 16 St. Louis 94.7
17 St. Louis 11,591.7 17 Grand Rapids 94.8
18 Columbus 11,474.2 18 Norfolk 95.6
19 Atlanta 11,285.7 18 Richmond 95.6
20 Tampa 11,079.1 20 Dallas 95.6
21 Kansas City 10,838.5 21 Cincinnati 95.7
22 Cincinnati 10,807.2 22 Tampa 96.1
23 West Palm Beach 10,571.5 23 Indianapolis 96.4
24 Minneapolis 10,382.8 24 Kansas City 96.7
25 Cleveland 10,203.6 25 Miami 97.4
26 Grand Rapids 10,040.3 26 Cleveland 97.6
27 Dallas 9,787.7 26 Pittsburgh 97.6
28 Seattle 9,783.7 28 Milwaukee 97.9
29 Indianapolis 9,745.5 29 Columbus 98.1
30 Rochester 9,638.1 30 Detroit 98.6
31 Memphis 9,612.4 31 Minneapolis 98.8
32 New Orleans 9,523.3 32 Los Angeles 99.7
33 Raleigh 9,338.7 33 Salt Lake City 99.9
34 Detroit 9,153.1 34 Phoenix 100.0
35 Washington 9,014.8 35 Washington 100.3
36 Houston 8,649.6 36 Las Vegas 100.4
37 Phoenix 8,623.2 37 Denver 100.6
38 Denver 8,604.4 38 Chicago 100.9
39 Portland 8,513.2 39 Sacramento 101.3
40 Jacksonville 8,393.0 40 Philadelphia 102.5
41 Oklahoma City 8,263.3 41 Portland 103.4
42 Orlando 8,082.1 42 Seattle 104.1
43 Los Angeles 7,822.3 43 San Francisco 104.6
44 Salt Lake City 7,665.7 44 New York 106.0
45 Las Vegas 6,789.2 45 Buffalo 106.0
46 Austin 6,648.0 45 Rochester 106.0
47 San Antonio 6,618.6 47 San Diego 106.2
48 San Diego 6,545.8 48 Hartford 106.6
49 Sacramento 5,954.5 48 Providence 106.6
50 Norfolk 5,466.0 50 Boston 106.6
Source : Calculated based on data from Census Bureau. Source : Calculated based on data from Statistical Abstract of the United States
and Taubman Center at Harvard University.
Bank deposits per capita, 1996 Cost of living, 2000
Dat
a C
hart
s: F
inan
ce a
nd C
ost

BH
I
Metro Area and State Competitiveness Report / Page 87
Rank Metro % Rank Metro $
1 San Francisco 5.50 1 Seattle 9,708.6
2 Seattle 2.71 2 San Francisco 6,912.8
3 Austin 1.83 3 Detroit 5,653.2
4 Boston 1.53 4 Richmond 4,771.3
5 Raleigh 1.35 5 Portland 4,377.5
6 Denver 1.20 6 Minneapolis 4,317.8
7 San Diego 1.01 7 Austin 4,303.0
8 Providence 0.50 8 Houston 4,220.9
9 Grand Rapids 0.49 9 Rochester 4,049.9
10 Washington 0.44 10 Miami 3,862.8
11 Portland 0.43 11 Greensboro 3,657.1
12 Atlanta 0.42 12 Cincinnati 3,513.7
12 Minneapolis 0.42 13 Hartford 3,377.3
14 Los Angeles 0.36 14 Indianapolis 3,375.5
15 Orlando 0.34 15 San Diego 3,177.7
15 St. Louis 0.34 16 Grand Rapids 3,094.4
17 New York 0.33 17 Memphis 2,837.1
18 Las Vegas 0.30 18 Boston 2,816.4
19 Miami 0.29 19 Cleveland 2,783.5
19 Rochester 0.29 20 Raleigh 2,696.7
21 Nashville 0.24 21 New York 2,538.2
22 Chicago 0.23 22 Chicago 2,507.6
22 Philadelphia 0.23 23 Phoenix 2,499.1
24 Phoenix 0.22 24 Dallas 2,476.7
25 Dallas 0.20 25 Milwaukee 2,403.1
26 Sacramento 0.18 26 Louisville 2,378.8
27 Pittsburgh 0.17 27 Philadelphia 2,362.1
28 Hartford 0.16 28 Los Angeles 2,299.9
28 Louisville 0.16 29 Atlanta 1,963.8
30 Salt Lake City 0.14 30 Buffalo 1,948.5
30 West Palm Beach 0.14 31 Charlotte 1,941.1
32 Houston 0.13 32 St. Louis 1,899.2
33 Charlotte 0.10 33 Kansas City 1,882.9
33 San Antonio 0.10 34 New Orleans 1,845.3
35 Cincinnati 0.09 35 Salt Lake City 1,772.4
35 Oklahoma City 0.09 36 Pittsburgh 1,690.2
35 Tampa 0.09 37 Nashville 1,567.4
38 Buffalo 0.08 38 Providence 1,380.9
38 Milwaukee 0.08 39 Sacramento 1,342.7
40 New Orleans 0.07 40 Columbus 1,320.3
41 Cleveland 0.04 41 Washington 1,296.6
41 Columbus 0.04 42 San Antonio 1,280.4
41 Detroit 0.04 43 Tampa 1,055.1
41 Jacksonville 0.04 44 Orlando 977.2
41 Kansas City 0.04 45 Denver 957.1
46 Norfolk 0.02 46 West Palm Beach 903.7
46 Richmond 0.02 47 Norfolk 889.6
48 Indianapolis 0.01 48 Jacksonville 754.4
49 Greensboro 0.00 49 Oklahoma City 502.7
49 Memphis 0.00 50 Las Vegas 500.0
Source : Progressive Policy Institute and Center for Regional Economic Issues.
Venture capital as % of GMP, 1999
Source : Calculated based on data from International Trade Administration and
US Census Bureau.
Exports per capita, 1999
Data C
harts: Finance and Cost/O
penness

BH
I
Metro Area and State Competitiveness Report / Page 88
Rank Metro # Rank Metro #
1 Las Vegas 11.3 1 Las Vegas 92.1
2 Miami 10.5 2 Boston 55.1
3 Atlanta 9.6 3 West Palm Beach 54.2
4 Orlando 9.3 4 Raleigh 53.3
5 Charlotte 7.6 5 Atlanta 50.0
6 Salt Lake City 7.1 6 Charlotte 46.8
7 Denver 7.1 7 Denver 44.1
8 Dallas 6.1 8 Minneapolis 43.3
9 St. Louis 5.9 9 San Diego 40.6
10 Minneapolis 5.7 10 Orlando 39.3
11 Cincinnati 5.7 11 Sacramento 38.3
12 Phoenix 5.6 12 Austin 35.2
13 Memphis 5.0 13 Salt Lake City 31.3
14 Chicago 4.5 14 San Francisco 30.1
15 Houston 4.4 15 Phoenix 30.0
16 San Francisco 4.4 16 Los Angeles 27.7
17 Raleigh 4.4 17 Kansas City 22.0
18 Pittsburgh 4.2 18 Seattle 16.9
19 Seattle 3.9 19 Jacksonville 14.5
20 New Orleans 3.7 20 Washington 13.2
21 Nashville 3.6 21 Chicago 12.7
22 Washington 3.5 22 Greensboro 12.5
23 Tampa 3.3 23 Houston 12.3
24 Kansas City 3.3 24 Portland 10.9
25 Portland 3.3 25 New York 10.2
26 Detroit 3.3 26 Dallas 4.3
27 Hartford 3.1 27 Norfolk 4.2
28 Austin 2.9 28 Columbus 2.7
29 San Diego 2.8 29 Providence 2.1
30 Philadelphia 2.8 30 Tampa 1.9
31 Boston 2.6 31 Grand Rapids 1.8
32 West Palm Beach 2.6 32 Philadelphia 1.8
33 Indianapolis 2.4 33 Richmond 0.8
34 Jacksonville 2.4 34 Milwaukee -1.4
35 Columbus 2.3 35 St. Louis -2.5
36 Los Angeles 2.3 36 Indianapolis -2.6
37 Cleveland 2.3 37 Rochester -3.0
38 Providence 2.3 38 Detroit -6.2
39 San Antonio 2.2 39 Cleveland -6.5
40 Sacramento 2.2 40 Cincinnati -6.8
41 New York 2.0 41 Miami -7.4
42 Louisville 1.9 42 Oklahoma City -7.6
43 Buffalo 1.8 43 San Antonio -8.2
44 Milwaukee 1.8 44 Pittsburgh -8.9
45 Oklahoma City 1.6 45 Nashville -9.5
46 Greensboro 1.5 46 New Orleans -12.5
47 Richmond 1.3 47 Hartford -14.0
48 Rochester 1.2 48 Memphis -15.2
49 Norfolk 1.1 49 Louisville -17.2
50 Grand Rapids 0.9 50 Buffalo -28.6
Net firm creation per 100,000 inhabitants,
1998-99
Source : Calculated based on data from Federal Aviation Administration and
Census Bureau.
Source : Calculated based on data from US Census Bureau.
Air passengers per capita, 2000
Dat
a C
hart
s: O
penn
ess/
Dom
esti
c C
ompe
titi
on

BH
I
Metro Area and State Competitiveness Report / Page 89
Rank Metro # Rank Metro #
1 Phoenix 100.0 1 San Francisco 32.3
2 Las Vegas 90.0 2 Seattle 28.1
3 Atlanta 86.0 3 West Palm Beach 11.8
4 Raleigh 82.0 4 Boston 10.0
5 Austin 73.0 5 Austin 9.4
6 Salt Lake City 72.0 6 Denver 7.5
7 Charlotte 71.0 7 San Diego 6.9
8 Indianapolis 67.0 8 Atlanta 5.5
9 Jacksonville 64.0 9 Oklahoma City 5.1
10 Washington 63.1 10 New York 4.5
11 Louisville 62.0 11 Portland 4.1
12 Dallas 61.0 12 Philadelphia 3.9
12 Memphis 61.0 13 Providence 3.9
14 Denver 59.0 14 Miami 3.8
15 Columbus 58.0 15 Houston 3.6
15 Kansas City 58.0 16 Minneapolis 3.6
15 Miami 58.0 17 Chicago 3.5
18 San Diego 57.0 18 Washington 3.5
19 Orlando 55.0 19 Kansas City 3.4
19 West Palm Beach 55.0 20 Dallas 3.3
21 Houston 53.0 21 Phoenix 3.0
21 Milwaukee 53.0 22 Los Angeles 2.7
21 Nashville 53.0 23 Raleigh 2.5
24 Chicago 52.0 24 Nashville 2.4
25 Minneapolis 50.0 25 Cincinnati 2.4
26 Tampa 49.0 26 Rochester 2.4
27 Cincinnati 48.0 26 Salt Lake City 2.4
27 New Orleans 48.0 28 Greensboro 2.3
27 San Francisco 48.0 29 Las Vegas 2.1
30 Oklahoma City 46.0 30 St. Louis 1.8
31 Richmond 45.0 31 Hartford 1.7
31 St. Louis 45.0 32 Louisville 1.4
33 San Antonio 44.0 33 Memphis 1.4
34 Grand Rapids 43.0 34 Pittsburgh 1.4
35 Boston 42.3 34 Tampa 1.4
36 Los Angeles 42.0 36 Indianapolis 1.0
37 Detroit 42.0 37 Charlotte 0.9
38 Greensboro 41.0 38 Columbus 0.9
39 Norfolk 40.0 39 Milwaukee 0.9
40 Philadelphia 36.3 40 Sacramento 0.8
41 Cleveland 35.0 41 Detroit 0.6
41 Portland 35.0 42 Cleveland 0.5
41 Sacramento 35.0 43 Buffalo 0.0
41 Seattle 35.0 43 Grand Rapids 0.0
45 Providence 32.0 43 Jacksonville 0.0
46 New York 28.0 43 New Orleans 0.0
47 Pittsburgh 23.0 43 Norfolk 0.0
48 Hartford 11.0 43 Orlando 0.0
48 Rochester 11.0 43 Richmond 0.0
50 Buffalo 10.0 43 San Antonio 0.0
Cognetics entrepreneurial hot spot index,
2001
New publicly traded companies per 10
billion dollars of GMP, average of 1999
and 2000
Source : "Corporate Demographics" by Cognetics Inc. Source : Progressive Policy Institute and Center for Regional Economic Issues.
Data C
harts: Dom
estic Com
petition

BH
I
Metro Area and State Competitiveness Report / Page 90
Rank Metro $ Rank Metro #
1 Seattle 11.8 1 San Diego 0.5
2 Lousiville 13.0 2 Sacramento 0.5
3 Portland 13.8 3 Austin 0.9
4 Salt Lake City 14.3 4 Miami 0.9
5 Indianapolis 15.6 5 New York 1.3
6 Oklahoma City 15.8 6 Providence 1.4
7 Milwaukee 16.3 7 Los Angeles 1.4
8 Nashville 16.5 8 West Palm Beach 1.5
9 Memphis 16.5 9 San Francisco 1.7
10 Minneapolis 17.1 10 Denver 1.9
11 New Orleans 17.2 11 Dallas 2.0
12 Richmond 17.2 12 San Antonio 2.0
13 Norfolk 17.2 13 Seattle 2.2
14 Denver 17.5 14 Boston 2.3
15 Cincinnati 17.8 15 Hartford 2.4
16 Las Vegas 17.8 16 Oklahoma City 2.4
17 Austin 17.9 17 Orlando 4.0
17 Dallas 17.9 18 Raleigh 4.3
17 Houston 17.9 19 Philadelphia 4.4
17 San Antonio 17.9 20 Kansas City 5.3
21 Kansas City 18.0 21 Columbus 5.6
22 Atlanta 18.3 22 Tampa 6.2
23 St. Louis 18.4 23 Washington 6.4
24 Charlotte 18.6 24 Milwaukee 6.9
25 Cleveland 18.8 25 Minneapolis 7.0
25 Columbus 18.8 26 Chicago 7.4
27 Greensboro 18.9 27 Rochester 7.6
27 Raleigh 18.9 28 Norfolk 7.7
29 Washington 19.7 29 Portland 8.4
30 Pittsburgh 19.7 30 Atlanta 9.9
31 Chicago 20.0 31 Indianapolis 10.7
32 Jacksonville 20.1 32 Cleveland 11.0
32 Miami 20.1 33 Memphis 11.2
32 Orlando 20.1 34 Jacksonville 11.7
32 Tampa 20.1 35 Nashville 12.9
32 West Palm Beach 20.1 36 Cincinnati 14.4
37 Detroit 20.9 37 Greensboro 14.6
37 Grand Rapids 20.9 38 Charlotte 14.9
39 Phoenix 21.2 39 Buffalo 16.3
40 Philadelphia 22.5 40 Detroit 16.5
41 Providence 25.5 41 Grand Rapids 18.8
42 Los Angeles 25.7 42 Lousiville 19.5
42 Sacramento 25.7 43 Richmond 21.2
42 San Diego 25.7 44 St. Louis 23.7
42 San Francisco 25.7 45 Houston 27.8
46 Boston 27.4 46 New Orleans 30.1
47 Buffalo 29.2 47 Las Vegas 31.6
47 Rochester 29.2 48 Pittsburgh 44.5
49 New York 29.2 49 Phoenix 49.0
50 Hartford 29.2 50 Salt Lake City 666.7
Electricity prices, $ per mbtu, 1999
Source : Energy Information Administration and Census Bureau. Estimated as a
weighted average of the component state data.
Source : Calculated based on data from the Environmental Protection Agency
and Census Bureau.
Toxic release, pounds per capita, 2000
Dat
a C
hart
s: E
nvir
onm
enta
l Pol
icy

BH
I
Metro Area and State Competitiveness Report / Page 91
Rank Metro # Rank Metro #
1 Grand Rapids 29.6 1 Minneapolis 0.0
2 Milwaukee 31.6 2 Seattle 0.0
3 Portland 33.3 3 Portland 0.1
4 Seattle 35.0 4 West Palm Beach 0.1
5 Rochester 35.1 5 Denver 0.2
6 San Francisco 35.2 6 Salt Lake City 0.2
7 Providence 36.9 7 Jacksonville 0.2
8 Boston 37.2 8 San Francisco 0.2
9 Columbus 37.2 9 Tampa 0.2
10 Detroit 37.4 10 Kansas City 0.2
11 Norfolk 37.4 11 Chicago 0.3
12 Indianapolis 37.5 12 Miami 0.3
13 Richmond 37.6 13 Las Vegas 0.3
14 Minneapolis 38.0 14 Orlando 0.3
15 West Palm Beach 38.3 15 Boston 0.4
16 Miami 39.5 16 Buffalo 0.4
17 Hartford 39.8 17 Detroit 0.5
18 Buffalo 40.2 18 St. Louis 0.5
19 Austin 40.5 19 Oklahoma City 0.6
20 San Antonio 41.1 20 Pittsburgh 0.6
21 Greensboro 42.5 21 San Diego 0.6
22 Jacksonville 43.2 22 Phoenix 0.7
23 Cincinnati 43.5 23 Indianapolis 0.8
24 Oklahoma City 44.3 24 Milwaukee 0.8
25 Charlotte 44.8 25 Philadelphia 0.9
26 New York 45.2 26 Los Angeles 0.9
27 Kansas City 45.4 27 Providence 1.1
28 Philadelphia 45.8 28 Rochester 1.1
29 Chicago 46.0 29 Cincinnati 1.2
30 Raleigh 46.0 30 Hartford 1.2
31 Louisville 46.1 31 Cleveland 1.2
32 Washington 46.5 32 Washington 1.3
33 Orlando 46.6 33 Norfolk 1.3
34 Pittsburgh 46.9 34 Sacramento 1.5
35 Memphis 47.3 35 Louisville 1.7
36 Nashville 47.9 36 Raleigh 1.7
37 New Orleans 48.0 37 Charlotte 1.8
38 Atlanta 48.6 38 New Orleans 1.8
39 Cleveland 49.7 39 New York 1.9
40 St. Louis 50.3 40 Greensboro 1.9
41 Tampa 50.7 41 Columbus 2.1
42 Dallas 51.0 42 Nashville 2.1
43 Salt Lake City 51.2 43 San Antonio 2.3
44 Denver 51.3 44 Richmond 2.3
45 San Diego 55.5 45 Grand Rapids 2.3
46 Sacramento 57.2 46 Houston 2.3
47 Las Vegas 57.6 47 Memphis 2.6
48 Houston 60.4 48 Atlanta 3.8
49 Phoenix 61.5 49 Dallas 3.9
50 Los Angeles 64.8 50 Austin 6.3
Pollution standards index, 2000-01 Serious pollution days per annum, 1999
Source : US Environmental Protection Agency. Source : US Environmental Protection Agency.
Data C
harts: Environm
ental Policy

BH
I
Metro Area and State Competitiveness Report / Page 92
Table 3
Largest 50 metropolitan areas, 2000
Rank Area Name BHI Abbreviation Population
1 New York-Northern New Jersey-Long Island, NY-NJ-CT-PA New York 21,199,865
2 Los Angeles-Riverside-Orange County, CA Los Angeles 16,373,645
3 Chicago-Gary-Kenosha, IL-IN-WI Chicago 9,157,540
4 Washington-Baltimore, DC-MD-VA-WV Washington 7,608,070
5 San Francisco-Oakland-San Jose, CA San Francisco 7,039,362
6 Philadelphia-Wilmington-Atlantic City, PA-NJ-DE-MD Philadelphia 6,188,463
7 Boston-Worcester-Lawrence, MA-NH-ME-CT Boston 5,819,100
8 Detroit-Ann Arbor-Flint, MI Detroit 5,456,428
9 Dallas-Fort Worth, TX Dallas 5,221,801
10 Houston-Galveston-Brazoria, TX Houston 4,669,571
11 Atlanta, GA Atlanta 4,112,198
12 Miami-Fort Lauderdale, FL Miami 3,876,380
13 Seattle-Tacoma-Bremerton, WA Seattle 3,554,760
14 Phoenix-Mesa, AZ Phoenix 3,251,876
15 Minneapolis-St. Paul, MN-WI Minneapolis 2,968,806
16 Cleveland-Akron, OH Cleveland 2,945,831
17 San Diego, CA San Diego 2,813,833
18 St. Louis, MO-IL St. Louis 2,603,607
19 Denver-Boulder-Greeley, CO Denver 2,581,506
20 Tampa-St. Petersburg-Clearwater, FL Tampa 2,395,997
21 Pittsburgh, PA Pittsburgh 2,358,695
22 Portland-Salem, OR-WA Portland 2,265,223
23 Cincinnati-Hamilton, OH-KY-IN Cincinnati 1,979,202
24 Sacramento-Yolo, CA Sacramento 1,796,857
25 Kansas City, MO-KS Kansas City 1,776,062
26 Milwaukee-Racine, WI Milwaukee 1,689,572
27 Orlando, FL Orlando 1,644,561
28 Indianapolis, IN Indianapolis 1,607,486
29 San Antonio, TX San Antonio 1,592,383
30 Norfolk-Virginia Beach-Newport News, VA-NC Norfolk 1,569,541
31 Las Vegas, NV-AZ Las Vegas 1,563,282
32 Columbus, OH Columbus 1,540,157
33 Charlotte-Gastonia-Rock Hill, NC-SC Charlotte 1,499,293
34 New Orleans, LA New Orleans 1,337,726
35 Salt Lake City-Ogden, UT Salt Lake City 1,333,914
36 Greensboro-Winston-Salem-High Point, NC Greensboro 1,251,509
37 Austin-San Marcos, TX Austin 1,249,763
38 Nashville, TN Nashville 1,231,311
39 Providence-Fall River-Warwick, RI-MA Providence 1,188,613
40 Raleigh-Durham-Chapel Hill, NC Raleigh 1,187,941
41 Hartford, CT Hartford 1,183,110
42 Buffalo-Niagara Falls, NY Buffalo 1,170,111
43 Memphis, TN-AR-MS Memphis 1,135,614
44 West Palm Beach-Boca Raton, FL West Palm Beach 1,131,184
45 Jacksonville, FL Jacksonville 1,100,491
46 Rochester, NY Rochester 1,098,201
47 Grand Rapids-Muskegon-Holland, MI Grand Rapids 1,088,514
48 Oklahoma City, OK Oklahoma City 1,083,346
49 Louisville, KY-IN Louisville 1,025,598
50 Richmond-Petersburg, VA Richmond 996,512
Larg
est 5
0 M
etro
Are
as, 2
000

BH
I
Metro Area and State Competitiveness Report / Page 93Metro Area and State Competitiveness Report / Page 93
The State Competitiveness Index 2002
Table 4
State Competitiveness Index
Index, 2002 Rank, 2002 Rank, 2001
Delaware 7.37 1 1
Massachusetts 7.36 2 2
Washington 6.77 3 4
Colorado 6.47 4 6
Connecticut 6.33 5 8
Wyoming 6.19 6 3
Vermont 6.15 7 5
New Hampshire 6.10 8 7
Minnesota 6.07 9 9
Oregon 5.88 10 13
Idaho 5.67 11 12
Iowa 5.65 12 16
Utah 5.62 13 11
Kansas 5.59 14 23
Virginia 5.57 15 14
California 5.51 16 10
Nebraska 5.48 17 15
North Dakota 5.34 18 21
Maryland 5.29 19 20
Missouri 5.10 20 24
Indiana 5.10 20 27
Tennessee 5.01 22 30
South Dakota 4.97 23 17
Maine 4.94 24 19
Wisconsin 4.92 25 18
New Jersey 4.84 26 29
Pennsylvania 4.79 27 37
Texas 4.73 28 33
Rhode Island 4.72 29 25
Michigan 4.70 30 26
Montana 4.68 31 31
New York 4.64 32 34
Illinois 4.59 33 39
Alaska 4.58 34 22
North Carolina 4.56 35 28
Ohio 4.51 36 32
Kentucky 4.49 37 38
South Carolina 4.48 38 40
Florida 4.47 39 36
Georgia 4.28 40 35
New Mexico 4.11 41 42
Arizona 4.02 42 41
Alabama 4.02 42 45
Oklahoma 3.90 44 44
Hawaii 3.88 45 43
Nevada 3.58 46 46
Louisiana 3.57 47 48
West Virginia 3.27 48 49
Arkansas 3.22 49 47
Mississippi 2.94 50 50
BHI’s first competitiveness study, the State
Competitiveness Report, 2001, estimated an index
of competitiveness for the 50 states. The 2002
State Competitiveness Index replicates the
methodology of that 2001 study with updated
data.1 As the results presented in tables 4 and
table 5 (inside back cover) show, there have
been only minor shifts in the rankings for the top
and bottom ten states. California has dropped
from a rank of 10th to 16th, allowing Oregon into
the top ten. None of the states that ranked
among the bottom 10 in 2001 have significantly
improved their standing.
Pennsylvania showed the most improvement,
from 37th to 27th. Other upward bound states are
Indiana, Tennessee, Kansas and Wisconsin.
Alaska suffered the most deterioration from 22nd
to 34th. South Dakota and North Carolina also
slipped in the ranking.
* Readers interested in detailed data charts should visit
www.beaconhill.org.
1 Complete methodology is available in the State
Competitiveness Report, 2001.
State Com
petitiveness Index

BH
I
Metro Area and State Competitiveness Report / Page 94
About the Beacon Hill Institute
Founded in 1991, BHI is an independent, nonpartisan economic research organization, located within Suffolk University in Boston, that applies a market-clearing approach to the analysis of tax, fiscal and regulatory issues. In addition to analyzing tax policy, we study issues including education spending, charitable tax incentives, universal health care, tort reform and economic competitiveness. BHI develops innovative solutions and applies economic analysis to public-policy issues affecting the states and the nation.
About the Authors
Jonathan Haughton is Senior Economist at the Beacon Hill Institute and Assistant Professor of Economics at Suffolk University. He holds a doctorate in economics from Harvard University and has published widely in refereed journals on economic development and taxation. Corina Murg is an Economist at the Beacon Hill Institute. She holds a Master of Science in International Economics degree from Suffolk University and a Bachelor of Arts (economics) degree from the West University of Timisoara, Romania.
Acknowledgements
The Beacon Hill Institute would like to gratefully acknowledge the assistance of project team members, Rebecca Moryl, Tija Kurian, John Barrett, Sorin Codreanu, Christopher Boyd; design team, Frank Conte; and interns Vasco Garcia and John Kanu.
Metro Area and State Competitiveness Report / Page 94

Table 5
BHI State Competitiveness Index and Subindexes
Overall index and
rank in 2002 Subindexes, rank in 2002
Overall
Index
Overall
Rank
Gov. &
fiscal
policy
Institu-
tions
Infra-
structure
Human
resources
Tech-
nology Finance
Open-
ness
Domestic
compe-
tition
Environ-
mental
policy
Delaware 7.37 1 3 18 10 12 8 2 7 9 35
Massachusetts 7.36 2 48 5 43 1 1 1 11 27 39
Washington 6.77 3 32 31 18 25 10 28 3 1 1
Colorado 6.47 4 20 21 5 13 4 12 32 14 18
Connecticut 6.33 5 41 11 13 10 2 3 18 21 43
Wyoming 6.19 6 2 10 8 20 41 25 6 2 4
Vermont 6.15 7 23 22 4 2 5 39 2 10 45
New Hampshire 6.10 8 8 19 3 5 18 13 25 3 47
Minnesota 6.07 9 27 16 12 6 13 9 26 49 12
Oregon 5.88 10 44 23 6 28 23 46 9 5 5
Idaho 5.67 11 35 15 25 34 20 48 17 4 3
Iowa 5.65 12 19 14 15 4 28 21 38 45 20
Utah 5.62 13 22 9 1 7 22 6 24 6 46
Kansas 5.59 14 31 40 7 16 19 23 28 41 24
Virginia 5.57 15 7 8 14 15 11 14 31 23 16
California 5.51 16 34 30 32 19 7 5 8 7 38
Nebraska 5.48 17 11 27 9 3 25 16 42 31 7
North Dakota 5.34 18 47 4 28 9 37 18 44 28 14
Maryland 5.29 19 18 45 21 17 3 8 46 15 33
Missouri 5.10 20 9 39 17 24 30 29 41 32 23
Indiana 5.10 21 21 32 36 37 31 34 13 43 9
Tennessee 5.01 22 12 49 19 35 35 19 22 25 15
South Dakota 4.97 23 10 1 30 11 36 11 50 38 26
Maine 4.94 24 29 2 20 14 32 31 33 13 41
Wisconsin 4.92 25 45 12 34 18 29 24 30 40 8
New Jersey 4.84 26 36 7 35 21 12 10 20 20 44
Pennsylvania 4.79 27 43 17 23 27 17 20 37 29 31
Texas 4.73 28 6 43 40 36 27 22 4 36 21
Rhode Island 4.72 29 14 20 31 8 9 40 36 16 37
Michigan 4.7 30 13 28 33 33 6 33 10 33 34
Montana 4.68 31 40 3 22 31 39 43 48 8 27
New York 4.64 32 49 13 39 26 14 4 21 22 42
Illinois 4.59 33 42 33 38 29 21 7 15 44 32
Alaska 4.58 34 1 25 2 44 49 50 1 12 50
North Carolina 4.56 35 5 38 47 41 16 15 23 26 28
Ohio 4.51 36 37 29 11 32 24 17 19 47 29
Kentucky 4.49 37 26 26 24 46 38 32 12 48 2
South Carolina 4.48 38 33 44 41 43 33 45 14 30 11
Florida 4.47 39 24 36 37 30 43 26 34 17 30
Georgia 4.28 40 4 37 46 38 40 27 27 18 25
New Mexico 4.11 41 17 41 48 40 15 49 39 19 36
Arizona 4.02 42 25 48 27 23 26 47 16 37 40
Alabama 4.02 43 16 47 42 47 34 36 29 46 17
Oklahoma 3.90 44 30 34 45 39 42 38 45 39 6
Hawaii 3.88 45 39 46 26 22 48 42 43 24 48
Nevada 3.58 46 46 24 16 42 44 44 40 11 49
Louisiana 3.57 47 38 50 44 50 47 35 5 34 22
West Virginia 3.27 48 50 6 29 48 46 37 35 35 10
Arkansas 3.22 49 15 42 49 45 50 30 47 50 13
Mississippi 2.94 50 28 35 50 49 45 41 49 42 19

The Beacon Hill Institute for Public Policy ResearchSuffolk University
8 Ashburton Place
Boston, MA 02108
Phone: 617-573-8750 Fax: 617-720-4272
http://www.beaconhill.org
ISBN 1-886320-15-2$25.00