nstar electric company and western massachusetts … commonwealth of massachusetts office of the...
TRANSCRIPT
THE COMMONWEALTH OF MASSACHUSETTS
OFFICE OF THE ATTORNEY GENERAL
ONE ASHBURTON PLACE
BOSTON, MASSACHUSETTS 02108
(617) 727-2200
(617) 727-4765 TTY
www.mass.gov/ago
July 21, 2017
Mark D. Marini, Secretary
Department of Public Utilities
One South Station, 2nd Floor
Boston, Massachusetts 02110
Re: NSTAR Electric Company and Western Massachusetts Electric
Company d/b/a Eversource Energy, D.P.U. 17-05
Dear Secretary Marini:
Enclosed please find the Office of the Attorney General’s Initial Brief.
Thank you for your attention to this matter. Please do not hesitate to contact me if you have any
questions about this filing.
Sincerely,
Joseph W. Rogers
Assistant Attorney General
Enclosure
cc: Mark Tassone, Hearing Officer
Cheryl Kimball, Esq.
Service List
COMMONWEALTH OF MASSACHUSETTS
DEPARTMENT OF PUBLIC UTILITIES
__________________________________________
)
NSTAR ELECTRIC COMPANY AND )
WESTERN MASSACHUSETTS ELECTRIC ) D.P.U. 17-05
COMPANY d/b/a EVERSOURCE ENERGY )
__________________________________________)
CERTIFICATE OF SERVICE
I certify that I have this day served the foregoing documents upon each person designated
on the official service list compiled by the Secretary in this proceeding. Dated at Boston this
21st day of July, 2017.
Joseph W. Rogers
Assistant Attorney General
Massachusetts Attorney General
Office of Ratepayer Advocacy
One Ashburton Place
Boston, Massachusetts 02108
(617) 727-2200
cc: Service List

COMMONWEALTH OF MASSACHUSETTS
DEPARTMENT OF PUBLIC UTILITIES
_________________________________________
)
NSTAR ELECTRIC COMPANY AND )
WESTERN MASSACHUSETTS ELECTRIC ) D.P.U. 17-05
COMPANY d/b/a EVERSOURCE ENERGY )
_________________________________________)
INITIAL BRIEF OF THE OFFICE OF THE
ATTORNEY GENERAL
Respectfully submitted,
MAURA HEALEY
ATTORNEY GENERAL
By: Joseph W. Rogers
Assistant Attorneys General
Office for Ratepayer Advocacy
One Ashburton Place
Boston, MA 02108
(617) 727-2200
July 21, 2017

TABLE OF CONTENTS
Page
I. INTRODUCTION .................................................................................................................. 1
II. OVERVIEW ........................................................................................................................... 3
III. DESCRIPTION OF THE COMPANY ............................................................................... 6
IV. STANDARD OF REVIEW ................................................................................................ 7
V. ARGUMENT .......................................................................................................................... 9
A. ALTERNATE REGULATORY MECHANISMS ............................................................. 9
1. The Department Should Reject The Company’s Proposed Performance-Based
Ratemaking Mechanism Because It Will Not Produce Just and Reasonable Rates ............... 9
a) Introduction ............................................................................................................... 9
b) The Company’s Proposal Is Inconsistent with Established Department Policy ..... 11
c) The Company’s Proposal Will Allow Near-Guaranteed Rate Increases at
Abnormally High Rates .................................................................................................... 20
d) The Company’s Proposal to Have a Separate Adjustment for Capital Investments
Undermines the Purpose of A PBRM Formula and Allows Dollar-For-Dollar Recovery
Without a Prudence Review.............................................................................................. 22
e) The Company Has Not Provided Any Evidence That The PBRM Is Necessary to
Fund Grid Modernization Investments ............................................................................. 23
f) The Company’s Proposed PBRM Includes a Negative X Factor Far Lower Than
That Approved for Any North American Energy Utility .................................................. 24
g) The Company’s Total Factor Productivity (“TFP”) Study Is Flawed and Provides
an Inadequate Analysis of the Company’s Costs .............................................................. 28
h) The Company’s Proposed Earnings Sharing Mechanism (“ESM”) Has A Number
of Deficiencies .................................................................................................................. 32
i) The PBRM Stay-Out Provision .................................................................................. 33
2. Grid Modernization Base Commitment ........................................................................ 34
a) Proposed Grid Modernization Investments ............................................................ 35
(1) Introduction and Background .............................................................................. 35
(2) The Company’s Proposed Grid Modernization Investments Do Not Qualify for
Exceptional, Targeted Cost Recovery Mechanisms ..................................................... 38
(3) The Department Need Not Approve the PBRM nor the GMBC to Move Forward
with Grid Modernization............................................................................................... 38
(4) Many of the Proposed Investments Are Not “Grid Modernization” Investments
39
1
b) Energy Storage ........................................................................................................ 40
c) EV Charging Infrastructure..................................................................................... 43
(1) The Department Should Consider the Company’s Make-Ready Electric Vehicle
Infrastructure Program in a Separate Proceeding Outside of this Rate Case ................ 43
(2) The Department Should Establish Statewide Goals and Standards Before
Approving Any EV Charging Proposal ........................................................................ 46
(3) If the Department Decides to Review Eversource’s EV Proposal in this
Proceeding, it Should Adopt Several Modifications..................................................... 48
(a) The Company Should Not Be Permitted to Own Infrastructure Behind the Meter ... 48
(b) Recovery of Make-Ready Infrastructure Should Occur in the Normal Course of
Ratemaking ............................................................................................................................. 50
(c) Electrification of the Company’s Own Fleet Should Not Be Included as Part of the
Make Ready Program .............................................................................................................. 51
(d) The Department Should Put Other Mechanisms in Place to Ensure Greater
Accountability and Program Coordination ............................................................................. 53
d) The Department Should Reject the GMBC Performance Metrics as Proposed
Because They Do Not Meaningfully Assess Company Performance or Mandate Good
Performance ...................................................................................................................... 54
(1) The Department Should Include Performance Penalties and/or Incentives. ....... 55
(2) The Company’s Proposed Performance Metrics Are Deficient. ......................... 56
(3) The Company Should Add to Its Performance Metrics. ..................................... 58
e) The Company’s Annual Stakeholder Process Will Not Provide an Opportunity for
Meaningful Stakeholder Participation or Comment ......................................................... 59
B. CAPITAL STRUCTURE AND COST OF CAPITAL .................................................... 62
1. Introduction ................................................................................................................... 62
2. Capital Structure ........................................................................................................... 64
a) The Company Failed to Include NSTAR’s Most Recent Long-Term Debt Issuance
in Its Capital Structure ...................................................................................................... 65
b) The Company’s Embedded Cost Rate of Long-Term Debt Is Miscalculated ........ 66
3. Return on Common Equity ........................................................................................... 67
a) Proxy Groups .......................................................................................................... 67
b) Discounted Cash Flow Analysis Results ................................................................ 70
c) Capital Asset Pricing Model Analysis Results ....................................................... 76
(1) Mr. Hevert’s CAPM Analysis Is Fatally Flawed ................................................ 79
(2) Mr. Hevert’s Market Risk Premium Is Grossly Over-Inflated............................ 79
d) The Department Should Reject Mr. Hevert’s Bond Yield Risk Premium Approach
82
2
4. Other Cost Of Equity Issues ......................................................................................... 84
a) Capital Market Conditions ...................................................................................... 84
b) Rate Making Mechanisms....................................................................................... 86
5. The Attorney General’s Position on Massachusetts ROEs ........................................... 88
6. The Attorney General’s Recommendation. .................................................................. 98
C. RATE BASE ................................................................................................................... 101
1. The Company Over-Inflates Its Cost of Service ......................................................... 101
2. The Company’s Proposal to Adjust its Rate Base for Post-Test Year Plant Additions
Should Be Rejected ............................................................................................................. 104
D. OPERATIONS AND MAINTENANCE EXPENSES ................................................... 109
1. The Pro Forma Test Year WMECo Payroll Expense Should Not Be Annualized to
Reflect the Employee Complement as of the End of the Test Year ................................... 109
2. Test Year Insurance Policy Surplus Payments Are Recurring and Should Not be
Removed from the Test Year .............................................................................................. 109
3. Overhead Costs Charged by ESC During the Test Year Should be Reduced to Reflect
the Return on Equity Approved by the Department in This Proceeding ............................ 111
4. The Test Year Charges from Eversource Service Company Should Be Reduced for the
Impacts of the Acquisition of the Aquarion Water Companies .......................................... 112
5. Pursuant to Department Precedent, the Department Should Disallow the Company’s
Incentive Compensation Based on Financial Goals............................................................ 118
6. The Company’s Inflated Medical Expense Projection Result in the Company Over-
Stating Its Future Employee Medical Costs........................................................................ 122
7. The Department Should Reject the Company’s Proposal to Increase Information
System Expense Charged from Eversource Service Company for a Post-Test Year
Information System Plant Addition .................................................................................... 125
a) The Supply Chain Project Is a Post-Test Year Plant Addition at the Service
Company Level That Was Not Placed into Service Prior to the End of Hearings in This
Case 127
b) The Amount of Costs Associated with the Supply Chain Project to Be Charged to
NSTAR and WMECo in the Rate Effective Period Are Not Known and Measurable ... 127
c) The Company’s Expected Cost Savings Associated with the Supply Chain Project
Implementation Exceed the Annual Revenue Requirements Associated with the ESC
Plant Addition ................................................................................................................. 129
d) The Company Has Failed to Consider the Impact That the Company’s Acquisition
of the Aquarion Water Companies Will Have on the Amounts to Be Charged to NSTAR
and to WMECo ............................................................................................................... 131
e) The Company Overstates the Expected Costs of the Supply Chain Project ......... 131
f) Summary and Recommendation ........................................................................... 133
3
8. Customers Should Not Have to Pay for Two Corporate Headquarters ...................... 133
a) The Hartford, Connecticut Headquarters is Unnecessary to Provide Electric
Distribution Service to Massachusetts Customers .......................................................... 134
b) The Connecticut Public Utility Regulatory Authority Has Disallowed Costs
Associated with the Unneeded Hartford Headquarters ................................................... 135
9. The Department Should Deny the Company’s Proposed 2018 Non-Union Payroll
Expense Adjustment ........................................................................................................... 136
10. “Fee Free” Credit/Debit Card Payment System ....................................................... 138
a) The Department Should Reject the Company’s Proposed “Fee Free” Credit/Debit
Card Payment System Because It Is Inconsistent with the Provision of Least-Cost
Service, creates a Cross-Subsidy, and Could Result in More Customers Paying High
Credit Card Interest Rates ............................................................................................... 138
b) The Proposed Pro Forma Adjustments for Fee Free Payment Processing Are
Speculative and Should Be Rejected .............................................................................. 141
11. The Department Should Reject the Company’s Proposal To Assign One Third Of
Regulatory Assessments To Basic Service Customers ....................................................... 142
12. The Proposed Pro Forma Adjustment for GIS Verification Costs is Speculative and
Should be Rejected ............................................................................................................. 146
13. Rate Case Expense .................................................................................................... 147
a) Ratepayers Should Not Pay for Rate Design Twice ............................................. 148
b) The Company’s Rate Case Expense for its PBRM and Allocated Cost of Service
Experts Is Excessive ....................................................................................................... 150
c) The Company Should Not Recover Rate Case Expense for Its Temporary
Employees ....................................................................................................................... 151
E. DEPRECIATION ........................................................................................................... 154
1. Eversource’s Percent Reserve Is Large and Growing ................................................. 154
2. The Company Proposes to Charge Ratepayers Almost Three Times the Net Salvage
Actually Incurred ................................................................................................................ 156
3. Mr. Spanos Inappropriately Charges Today’s Ratepayers for Future Inflation .......... 158
4. Ratepayers Will Be Harmed by the Company’s Proposal .......................................... 160
5. The Department Should Adopt Mr. Dunkel’s Recommendations .............................. 161
6. In the Alternative, the Department Should Employ Gradualism and Not Adopt All of
the Company’s Proposed Net Salvage Factors ................................................................... 163
F. VEGETATION MANAGEMENT ................................................................................. 164
1. Introduction ................................................................................................................. 164
a) Reliability Indices for Eversource ........................................................................ 165
b) Eversource Arborists ............................................................................................. 166
2. RTW Pilot Program .................................................................................................... 167
4

a) 2017 RTW Pilot Program ..................................................................................... 168
b) 2018 RTW Pilot Program ..................................................................................... 169
3. LiDAR......................................................................................................................... 171
4. Accounting for NSTAR’s First-Cycle Enhanced Vegetation Management Activities
173
a) Capitalization of ETT and ETR Costs .................................................................. 174
5. Maintenance of Overhead Lines and Devices ............................................................ 175
a) Account 593 – Maintenance of Overhead Lines ................................................... 175
b) Account 365 – Overhead Conductors and Devices .............................................. 177
G. STORM FUND PROPOSAL ......................................................................................... 178
1. The Department Should Not Allow the Company to Recover Deferred Costs Through
the Replenishment Factor ................................................................................................... 179
2. Carrying Charges for Deferred Amounts Not Eligible for Storm Fund Recovery Must
Not Be Collected in the Replenishment Factor ................................................................... 180
3. The Department Should Reject the Company’s Request to Recover Certain Lean-in
Costs Through Its Storm Fund ............................................................................................ 181
4. Recovery of Outstanding Storm Cost Balance ........................................................... 182
5. Billings to Verizon for Jointly Operated Poles ........................................................... 183
H. TAXES ............................................................................................................................ 186
1. Income Taxes .............................................................................................................. 186
a) There is No Evidentiary Support for WMECo’s Increase to Taxable Income for
“Property Tax Expense” ................................................................................................. 186
2. Property Taxes ............................................................................................................ 188
a) The Company’s Projected Property Tax Calculations Are Inconsistent with
Department Precedent ..................................................................................................... 188
b) The Department Should Ensure There Are Appropriate Property Tax Allocations to
Other Businesses ............................................................................................................. 190
c) WMECo’s Deferred Property Tax Claims ............................................................ 191
(1) WMECo’s Deferred Property Tax Claims for 2012-2015 Should Be Adjusted to
Net Out State and Federal Income Tax Benefits ........................................................ 191
(2) The Company Is Not Entitled to Deferral of WMECo ’S 2016 Property Taxes
192
(a) WMECo’s 2016 Distribution-Related Property Tax Increment Does Not Represent an
Extraordinary Expense .......................................................................................................... 193
(b) The Company Has Failed to Demonstrate That the Denial of the Request for Deferral
Would Significantly Harm the Overall Financial Condition of the Company ........................ 194
5

(c) WMECo’s 2016 Incremental Tax Obligation Was Not Likely to and Did Not Prompt
the Filing of a Rate Case ........................................................................................................ 195
I. OTHER REVENUES ..................................................................................................... 196
1. The Pro Forma Adjustment to Eliminate Belmont Wholesale Distribution Contract
Revenues from Test Year NSTAR Miscellaneous Revenues is Selective and Speculative 196
2. The Department Should Adjust the Company’s Pole Attachment Revenues to Reflect
the Number of Pole Attachments at Test-Year End ............................................................ 199
J. CONSOLDATION OF THE COMPANY’S TERMS AND CONDITIONS TARIFF.. 200
1. Introduction ................................................................................................................. 200
2. Eliminate the Company’s Proposed Force Majeure Provision ................................... 202
3. Limit the Company Obligation for Meter and Communication Device Installation to 30
Days .................................................................................................................................... 204
4. Eliminate the Limitation of Liability Provision for Curtailment of Service ............... 204
5. Fee Increases ............................................................................................................... 206
6. The Department Should Require Additional Customer Education, Outreach, and
Company Ownership of Private Poles ................................................................................ 207
K. MERGER REVIEW - SECTION 96 .............................................................................. 210
1. Background ................................................................................................................. 210
2. The Department Should Consider Rate Impacts Before Approving the Company’s
Section 96 Petition .............................................................................................................. 211
VI. CONCLUSION ............................................................................................................... 213
6
COMMONWEALTH OF MASSACHUSETTS
DEPARTMENT OF PUBLIC UTILITIES
_________________________________________
)
NSTAR ELECTRIC COMPANY AND )
WESTERN MASSACHUSETTS ELECTRIC ) D.P.U. 17-05
COMPANY d/b/a EVERSOURCE ENERGY )
_________________________________________)
INITIAL BRIEF OF THE OFFICE OF THE
ATTORNEY GENERAL
I. INTRODUCTION
Pursuant to the briefing schedule established by the Department of Public Utilities
(“Department”) in this proceeding, the Office of the Attorney General (“AGO”) submits its
Initial Brief. On January 17, 2017, NSTAR Electric Company (“NSTAR”) and Western
Massachusetts Electric Company (“WMECo”) d/b/a Eversource Energy (together, “Eversource”
or the “Company”), pursuant to G.L. c. 164, § 94 (“Section 94”), filed two requests seeking
approval from the Department for a general increase in base rates. Specifically, Eversource
seeks an increase of $61.6 million for the three divisions of NSTAR and $35.8 million increase
for WMECo.1
In addition to the proposed rate increases, the Company seeks Department approval for
numerous significant changes in its electric distribution companies’ operations and finances.
First, the Company requests to implement revenue decoupling for NSTAR. See Rate Structures
1 These are the updated number provided in the Company’s May 25, 2017 Update to its revenue requirements. See
Exh. ES-DPH-2 (East) and (West) May 25, 2017 Update.

2
that will Promote Efficient Deployment of Demand Resources, D.P.U. 07-50-A (2008).2 Second,
the Company proposes an “Eversource Grid-Wise Performance Plan,” which includes a
performance-based ratemaking mechanism (“PBRM”) that would adjust rates annually in
accordance with a formula to be approved by the Department. Third, within the PBRM formula,
the Company proposes a Grid Modernization Base Commitment (“GMBC”) of $400 million in
incremental capital investment over the next five years. Fourth, the Company proposes to make
major changes in its existing rate designs to streamline and align rate classifications between
western and eastern Massachusetts.3 Fifth, the Company seeks to recover merger related costs.
The Company asserts that the annual pro forma amortization for merger-related costs to achieve
is $2,621,089 for NSTAR and $442,169 for WMECo over the next ten years. Sixth, the
Company proposes changes to its storm fund.
In addition to the rate increase requests under Section 94, the Company requests that the
Department review and approve the corporate consolidation of NSTAR and WMECo in this
proceeding pursuant to the Department’s authority under G.L. c. 164, § 96 (“Section 96”).
Thus, although the Company chose to package its requests in a single docket, the
Company has actually filed three cases with the Department: two Section 94 rate cases and one
Section 96 merger. In support of its three cases, the Company’s filing includes fourteen (14)
pieces of testimony by eighteen (18) witnesses.
2 WMECo implemented revenue decoupling in 2011, following the Department’s decision in Western
Massachusetts Electric Company, D.P.U. 10-70 (2011). 3 Specifically, the Company proposes a Transition Period over which it will eliminate the four legacy rates (Boston
Edison, Cambridge, Commonwealth and WMECo) and transition to one statewide rate for each of the proposed rate
classes. On June 9, 2017, the Department established a separate procedural schedule for rate design issues.
Interlocutory Order on Attorney General’s Motion to Protect Intervenors’ Due Process Rights, D.P.U. 17-05 (June
19, 2017).
3
II. OVERVIEW
Over the next five years, Eversource’s proposed rate plan will raise customers’ rates by
$284 million, an increase of nearly 20 percent. If the Department approves Eversource’s multi-
year ratemaking proposal, rates will immediately increase by $96 million on January 1, 2018,
and then will continue to increase, by an additional $188 million over the next four years. The
Department should deny Eversource’s $284 million rate increase and, instead, order Eversource
to decrease its existing rates.
Eversource does not claim that its Massachusetts electric distribution companies have
failed to earn a reasonable return in prior years—and indeed, it could not possibly make that
claim, since in both 2015 and 2016, Eversource’s shareholders earned far more on their
investments than others who made similar investments with similar risks. NSTAR’s reported
returns for those years were 13.2 and 11.3 percent, respectively, and WMECo’s reported returns
were 8.9 and 9.1 percent, respectively. Nor does Eversource claim that it needs to raise rates so
dramatically because it is suffering financially. In fact, Eversource’s stock price currently trades
at its all-time high, and the Company has embarked on a spending spree over the last year,
paying $800 million in cash for a water company and acquiring a fifty-percent interest in an
offshore wind partnership that could cost billions of dollars.
Indeed, rather than causing Eversource to under-earn, the Company’s existing rates are
more than sufficient to cover its Massachusetts expenses and reap returns for shareholders that
are higher than the national average. But for its statutory obligation to file a rate case this year,
one questions whether the Company would have filed a rate case at all. Nonetheless, looking to
turn this statutory obligation into an opportunity, Eversource seeks to lock in its high rates,
4
further increase its revenue, and reduce its risk with automatic cost of living-plus yearly rate
increases.
In the Sections below, the AGO outlines the numerous unsupported elements of the
Company’s proposed revenue requirement. One significant cost is the Company’s request for an
authorized return on equity of 10.5 percent. If approved by the Department, this return would be
the highest allowed return in New England, and significantly higher than the average return on
equity (9.3 percent) allowed by state commissions throughout the country last year. Department
approval of Eversource’s requested 10.5 percent return on equity would continue the
Commonwealth’s upward trend in allowed return on equity, while the rest of the country is
experiencing a downward trend. If, however, the Department rejects Eversource’s proposal and
instead approves the reasonable return on equity proposed by the AGO, 8.875 percent, customers
will save $42 million, almost half of the requested first-year rate increase.
To raise further revenue and reduce its risk, the Company proposes its “Grid-Wise
Performance Plan,” which is a “performance” based rate plan in name only. Although the
Company’s proposed plan has a complex formula with component parts traditionally debated in
performance based rate (“PBR”) proceedings, its likeness to a PBR ends there. The Company’s
proposal is not tied to quantitative improvements in service reliability, resiliency, energy
efficiency, environmental benefits, or resource diversity. In fact, it is not tied to any aspect of
the Company’s performance, at all.
The Company’s proposed PBRM is nothing more than a multi-year “rate increase plan”
consisting of a series of automatic annual rate increases that have no measurable tie-in to cost
incurrence and no connection to actual performance. Rates that lack any measurable connection
to costs incurred or performance are not just and reasonable. Indeed, the Company’s proposal
5
creates an up-front guessing game that creates substantial risks for ratepayers that Eversource’s
electric distribution companies will be over-compensated, with very little risk for Eversource that
it will suffer low returns. The Department should deny the Company’s request for a $96 million
rate increase and four yearly rate increases through the PBRM because it will result in unjust and
unreasonable rates.
The Company claims that its Grid-Wise Performance Plan will enable investment in grid
modernization, electric vehicles and storage, and help meet Massachusetts’ clean energy goals.
The AGO strongly supports the Commonwealth’s efforts to meet its statutory obligation to
reduce greenhouse gas emissions and to invest in our clean energy future. However, the
Department need not approve a $284 million rate increase nor pre-approve a $400 million
investment plan lacking in critical details and providing no guarantee that ratepayers will benefit
from the proposed investments, essentially amounting to a request for a blank check. The
Department and the Department of Energy Resources have established proceedings and
regulatory constructs to address grid modernization, electric vehicles and storage, and the role
that utilities should play in their advancement. Rather than working within the existing
framework, the Company chose to include them in its rate case filing, perhaps seeking to obscure
or deemphasize the magnitude of the large proposed rate increases and bill impacts on customers
with the promise of green benefits. Yet, with or without the Grid Wise-Performance Plan and
the GMBC, the Company is free to move forward with its “grid facing” grid modernization
investments for its distribution system and seek recovery as it would for any other capital
investment. And, the Department can—and should—address electric vehicle and storage
investments, as it has with similar investments, by developing statewide policies, followed by the
individual review of specific proposals.
6
These are important investments for our future. Before pre-authorizing $400 million of
investment, the Department should take the time outside of this rate case to: (1) determine how
the proposed investment fits within the state’s overall clean energy and greenhouse gas emission
reduction strategies; (2) compare it to alternatives; and (3) ensure that the Company is buying the
right equipment, locating it in the best places, and providing real benefits to customers at the
lowest possible cost.
For these reasons and the reasons set forth below, the Company’s petition will result in
unjust and unreasonable rates. The Department should deny the petition and order Eversource to
decrease its rates.
III. DESCRIPTION OF THE COMPANY
NSTAR and WMECo are affiliated Massachusetts electric and gas distribution
companies. In addition to NSTAR and WMECo, Eversource Energy owns affiliated electric
distribution companies operating in Connecticut, Massachusetts and New Hampshire. In
Massachusetts, Eversource operates NSTAR and WMECo electric distribution systems on a fully
consolidated basis. For purposes of this docket, the Company has designated these two
geographic areas as “Eversource East” and “Eversource West.” Through its Massachusetts
electric operations, Eversource serves approximately 1.4 million customers in 139 cities and
towns.
The service area designated as NSTAR/Eversource East encompasses the City of Boston
and 20 surrounding communities, extending west to Sudbury, Framingham, and Hopkinton, as
well as communities in southeastern Massachusetts extending from Marshfield south through
Plymouth, Cape Cod and Martha’s Vineyard, and through New Bedford and Dartmouth. Within
this geographic area, the Company serves approximately 1.2 million residential, commercial and
7
industrial customers in approximately 80 communities, covering approximately 1,700 square
miles. The customer base includes approximately 1,013,077 residential customers and 164,869
business customers.
The service area designated as WMECo/Eversource West encompasses the City of
Springfield and surrounding communities, extending west to the New York border and north to
Greenfield and the Vermont border. Within this geographic area, the Company serves
approximately 209,000 residential, commercial and industrial customers in approximately 59
communities in western Massachusetts, covering approximately 1,500 square miles. The
customer base includes approximately 189,507 residential customers and 18,961 business
customers.
IV. STANDARD OF REVIEW
The Department must review the “propriety” of general rate increases under Section 94.
In reviewing the “propriety” of a proposal by a utility under Section 94, the Department must
determine whether the proposed rates are just and reasonable. Attorney General v. Department
of Telecommunications and Energy, 438 Mass 256, 264 n. 13 (2002); Berkshire Gas Company,
D.P.U. 96-67, p. 6 (1996). An application of a generic public interest test derived from organic
authority must give way to the specific statutory just and reasonable analysis required when
examining a request for a general increase in rates. Attorney General v. Department of
Telecommunications and Energy, 438 Mass at 270; see also Cambridge Electric Light Company
v. Department of Public Utilities, 333 Mass. 536 (1956).
The party seeking the rate increase bears the burden of proof. Town of Hingham v.
Department of Telecommunications and Energy, 433 Mass. 198, 213-14 (2001), citing
Metropolitan District Commission v. Department of Public Utilities, 352 Mass. 18, 24 (1967);
8
Wannacomet Water Company v. Department of Public Utilities, 346 Mass. 453, 463 (1963).
Included in that burden is a responsibility to develop a record sufficiently complete to support a
Department order in its favor on any contested issue. Fitchburg Gas and Electric Light
Company, D.T.E. 99-118, p. 7, n.5 (2001) (the Company bears the burden of proving each and
every element of its case by a preponderance of “such evidence as a reasonable mind might
accept as adequate to support a conclusion.”); G. L. c. 30A, § 11(6); P. LIACOS, HANDBOOK OF
MASSACHUSETTS EVIDENCE, § 14.2 (7th ed. 1999). In Section 94 proceedings, the intervenors
have neither the burden of production nor the burden of proof. D.T.E. 99-118, p. 7 (2001). To
prevail, however, intervenors must produce evidence necessary to rebut a Company’s
allegations. D.T.E. 99-118, p. 9.4 G.L. c. 30A, §§ 10, 11.
The Department must evaluate all evidence, including rebuttal evidence and negative
evidence, and make findings that result in just and reasonable rates.5 The Department, however,
cannot validly do so without furnishing detailed and subsidiary findings of fact and conclusions
of law sufficient to demonstrate that the overall rate determination is just and reasonable.6 “G.L.
c. 30A, s 11(8), requires the decision of the Department to ‘be accompanied by a statement of
reasons ... including determination of each issue of fact or law necessary to the decision.’”
4 “[T]he burden of proof is the duty imposed upon a proponent of a fact whose case requires proof of that fact to
persuade the factfinder that the fact exists or, where a demonstration of non-existence is required, to persuade the
factfinder of the non-existence of that fact.”). Fitchburg Gas and Electric Light Company, D.T.E. 99-118, p. 7,
(2001.) 5 The Department must weigh all of the evidence, not just the evidence that supports the conclusion reached, but also
contrary evidence that derogates from that conclusion.” Town of Hingham v. Department of Telecommunications
and Energy, 433 Mass. 198, 215 (2001). 6 “[W]e have insisted that the agency make subsidiary findings of fact on all issues relevant and material to the
ultimate issue to be decided, and that it ‘set forth the manner in which it reasoned from the subsidiary facts so found
to the ultimate decision reached’.” Massachusetts Institute of Technology v. Department of Public Utilities, 425
Mass 856, 871 (1997) citing School Comm. of Chicopee v. Massachusetts Commission Against Discrimination, 361
Mass. 352, 354-355 (1972).

9
Massachusetts Institute of Technology v. Department of Public Utilities, 425 Mass 856, 867
(1997). NSTAR Electric Company v. Department of Public Utilities 462 Mass. 381, 387 (2012).
A rate is not just and reasonable simply because a utility says so. If the Company fails to
carry its burden by a preponderance of the evidence, the Department must deny the Company’s
requested rate treatment for the proposed adjustment. Fitchburg Gas & Electric Light Company
v. Department of Public Utilities, 375 Mass. 571, 582-583 (1978). The Department should be
guided by its duty to protect public interests and not promote private interests. Mass.-American
Water Company, D.P.U. 95-118, p. 77 (1996). Fitchburg Gas and Electric Light Company,
D.P.U. 09-09 pp. 22-23, citing Commonwealth Electric Company v. Department of Public
Utilities, 397 Mass. 361, 369 (1986); Attorney General v. Department of Pub. Utilities, 390
Mass. 208, 235 (1983); Lowell Gas Light Company v. Department of Pub. Utilities, 319 Mass.
46, 52 (1946).
V. ARGUMENT
A. ALTERNATE REGULATORY MECHANISMS
1. THE DEPARTMENT SHOULD REJECT THE COMPANY’S PROPOSED
PERFORMANCE-BASED RATEMAKING MECHANISM BECAUSE IT WILL
NOT PRODUCE JUST AND REASONABLE RATES
a) Introduction
Eversource, in its first post-merger rate case proceeding, proposes to implement its “Grid-
Wise Performance Plan.” Exh. ES-GWPP-1. The Grid-Wise Performance Plan encompasses
two major components. First, the Company proposes to implement what it calls a performance-
based ratemaking mechanism (“PBRM”) that would allow the Company to increase rates
significantly each year until the Company’s next rate case, pursuant to a proposed revenue-cap
formula. Exh. ES-GWPP-1 and Exh. ES-PBRM-1. As stated by the Company, the PBRM
10
would substitute for a capital-cost recovery mechanism, while furthering policy goals of the
Commonwealth. Exh. ES-CAH-1, pp. 5-6. Second, the Company proposes a Grid
Modernization Base Commitment (“GMBC”) of $400 million in incremental capital investments
over the next five years without a new or separate cost recovery mechanism. Exh. ES-GMBC-1.
The Company asserts that the adoption of the PBRM allows its proposed GMBC investments.
Id.
The Department should reject the proposed PBRM because it is fatally flawed. The
Department is no stranger to performance-based ratemaking (“PBR”), having experience with
such mechanisms that dates back many years. See e.g. Bay State Gas Company, D.T.E. 05-27
(2005); Boston Gas Company, D.T.E. 03-40 (2003); Berkshire Gas Company, D.T.E. 01-56
(2001); and Boston Gas Company, D.P.U. 96-50 (1996). Recent Department policies date back
to at least the mid-1990s.7 The Department has previously held, in part, that proposed PBR
mechanisms should be designed to achieve specific, measurable results, and not focus
excessively on cost recovery issues. Id. The Company’s proposed PBRM satisfies neither of
those criteria, being superficially concerned with capital cost recovery issues, and devoid of any
serious proposal to assure definitive benefits to ratepayers. Furthermore, the PBRM ignores the
Department’s past experience with PBR and its concern with the appropriateness of the type of
PBR proposed here, as well as the criticism such approaches have received in the
Commonwealth and other states. See e.g. Bay State Gas Company, D.P.U. 09-30, pp. 19-25
(2009) and Boston Gas Company, D.P.U. 10-55 (2010). At bottom, while the Company urges
approval of the PBRM on the ground that it is necessary to further investment in grid
modernization, the Company has failed to demonstrate that it lacks the ability to finance these
7 Incentive Regulation, D.P.U. 94-158 (1995).

11
important investments under traditional cost-of-service regulation. The Company can and should
make those worthy investments—but the evidence clearly shows that the PBRM is not needed to
enable it to do so.
b) The Company’s Proposal Is Inconsistent with Established
Department Policy
The current proceeding is not the Department’s first experience with incentive regulation
or PBR. The Department observed over a decade ago that electric and gas utility industries were
becoming increasingly more competitive starting with the Public Utility Regulatory Policies Act
(“PURPA”) of 1978 through the Energy Policy Act of 1992 (“EPAct 92”). The scope of utility
services that had historically been regulated as a monopoly, were opening to competition and
competitive pressures raising questions about the role that traditional regulation would play in
this new competitive environment. It was against this backdrop that the Department opened an
investigation in Incentive Regulation, D.P.U. 94-158 to make certain that its ratemaking policies
were compatible with these competitive trends.
Within D.P.U. 94-158, the Department set forth several general and specific criteria that
it would apply in evaluating incentive regulation proposals from electric and gas utilities.
Similar to traditional cost of service regulation, rates charged under an incentive regulation
proposal would be judged against the “just and reasonable” standard. In addition, the
Department required all petitioners to show that proposals would advance the Department’s
long-standing goals of safe, reliable, and least-cost energy service. Proposals must also promote
the objectives of economic efficiency, cost control, lower rates, and reduced administrative costs.
A well-designed proposal would provide a utility with an opportunity to earn higher rewards than
under traditional regulation, but also assume higher risks as well. Compared with traditional
regulation, the Department noted that an appropriately designed incentive plan should provide a
12
greater incentive to reduce costs for the utility while concurrently providing greater benefits to
ratepayers through lower prices or better service. In addition to these general criteria, the
Department held that a well-designed proposal must meet the following specific criteria:
(1) A proposal must comply with Department regulations, unless
accompanied by a request for a specific waiver. The Department
added that proposals that comply with statutes and governing
precedent are strongly preferred;
(2) A proposal should be designed to serve as a vehicle to a more
competitive environment and to improve the provision of monopoly
services. Incentive proposals should avoid the cross-subsidization of
competitive services by revenues derived from the provision of
monopoly services;
(3) A proposal may not result in reductions in safety, service
reliability or existing standards of customer service;
(4) A proposal must not focus excessively on cost recovery issues.
If a proposal addresses a specific cost recovery issue, its proponent
must demonstrate that these costs are exogenous to the company's
operation;
(5) A proposal should focus on comprehensive results. In general,
broad-based proposals should satisfy this criterion more effectively
than narrowly-targeted proposals;
(6) A proposal should be designed to achieve specific, measurable
results. Proposals should identify, where appropriate, measurable
performance indicators and targets that are not unduly subject to
miscalculation or manipulation; and
(7) A proposal should provide a more efficient regulatory approach,
thus reducing regulatory and administrative costs. Proposals should
present a timetable for program implementation and specify
milestones and a program tracking and evaluation method.
Boston Gas Company, D.P.U. 96-50 (Phase 1), p. 242 (1996); citing Incentive Regulation,
D.P.U. 94-158, pp. 58-64.
The Company’s proposal in this proceeding fails to comply with several of those criteria.
While the Department has made clear that PBR proposals “must not focus excessively on cost
recovery issues,” the Company’s proposed PBRM appears to be focused nearly exclusively on
cost recovery. In its initial petition to the Department, the Company presented the PBRM as a
13
substitute for a capital-cost recovery mechanism, Tr. Vol. III, pp. 522-523, a ratemaking
mechanism that would allow the Company to adjust rates to recover costs associated with capital
investments outside a normal, traditional rate case.
[T]he Company is proposing to implement performance-based
ratemaking mechanism (“PBRM”) that would adjust rates annually
in accordance with a revenue-cap formula to be approved by the
Department in this case. The PBRM would substitute for a capital-
cost recovery mechanism with the goal of furthering the
Commonwealth’s clean energy goals, creating stronger incentives
for cost efficiency, and assuring continued achievement of top-tier
service-quality performance.
Petition for Approval, p. 3 (emphasis added).
Similar language is included within the Direct Testimony supporting the Company’s
filing. Exh. ES-GWPP-1, p. 9. Likewise, elsewhere within the Direct Testimony supporting the
Company’s filing, Eversource presents the “revenue cap” formula of its PBRM as allowing the
Company to adjust rates on an annual basis in lieu of a potential capital cost recovery
mechanism.
The Company’s proposed PBRM is designed as a “revenue cap”
formula that would be used to adjust rates on an annual basis in lieu
of an annual capital cost recovery mechanism.
Exh. ES-GWPP-1, p. 10.
Indeed, the desire to mitigate Company risks through a regulatory mechanism to assist in
the recovery of capital costs appears to have predated the formulation of the PBRM. In
examining potential options before hiring its outside consultant for the PBRM, the Company
requested the consultant assist the Company in evaluating ratemaking alternatives, which
included discussions of potential capital funding options. Tr. Vol. III, p. 527. As described by
Eversource itself, these discussions prior to the creation of the PBRM included consideration of

14
whether to propose a traditional capital cost recovery mechanism in conjunction with its
proposed revenue decoupling mechanism, or to propose a PBR mechanism. See Exh. AG-28-1.
The terms of the arrangement between Dr. Meitzen and the
Company regarding his work related to the development,
implementation, testimonial, and/or analytical support of the
Company’s PBRM were provided in response to Information
Request AG-4-5, as Attachment AG-4-5(n). Prior to final execution
of the arrangement, the Company requested Christensen Associates
to assist the Company in evaluating ratemaking alternatives,
including consideration of whether the Company would propose a
traditional capital cost recovery mechanism in conjunction with
revenue decoupling or performance-based ratemaking mechanism.
Id., (emphasis added).
Furthermore, the Department’s fourth criteria notes that “[i]f a proposal addresses
a specific cost recovery issue, its proponent must demonstrate that these costs are
exogenous to the company’s operation.” The Company has not demonstrated or even
attempted to demonstrate that the cost in question are exogenous to the Company. Tr.
Vol. III, pp. 529-530. This is for the simple reason that it is impossible to make such an
argument. The cost recovery issue the PBRM is intended to address is nothing less than
all of the capital spending of the Company.
The Department also requires an incentive regulation proposal to be designed to
achieve “specific, measurable results,” and to identify metrics to measure progress
towards utility targets. D.P.U. 96-50. First, the Company has not identified any targeted
results for its proposed PBRM. The Company claims that its proposal will help the
Company in furthering the Commonwealth’s clean energy goals, while creating stronger
incentives for cost efficiency, and assuring continued achievement of top-tier service-
quality performance. Exh. ES-CAH-1, pp. 5-6. Elsewhere, the Company claims that the
GMBC portion of its proposed Grid-Wise Performance Plan will advance three key
15
characteristics necessary for the modern grid: (1) system resiliency and carbon-emissions
reduction; (2) integration of distributed energy resources (“DER”) and visibility into the
performance and impact of DER on the Company’s system real-time; and (3) facilitation
of DER customer engagement. Exh. ES-GWPP-1, p. 16. These broad general goals do
not constitute a design sufficient to achieve “specific, measurable results.” Indeed,
Eversource candidly admits that its proposal is not designed to achieve specific results:
As a first-step grid-modernization enablement plan, the GMBC is
not designed to achieve a specific end-state vision, nor is it intended
to confine the scope of the Company’s work to reach a specific end-
state. To the contrary, the Company fully anticipates that the
GMBC will be expanded upon, modified and supplemented in
significant dimension into the future.
Exh. ES-GWPP-1, pp. 16-17.
Yet, the Company is unable to identify basic measurable improvements that should result
from the Company’s proposal if it is to accomplish the goals outlined by the Company.
Eversource claims that its proposal will advance distribution system resiliency, i.e., the ability of
Eversource’s distribution system to withstand and adapt to potential future severe weather events
such as hurricanes and northeasters. However, the Company is unable to identify, specifically,
the expected improved system reliability during severe weather events, and did not even prepare
any forecasts of future system reliability performance where maximum event days are included.
See Exh. AG-18-14. Likewise, Eversource claims that its proposal will assist the
Commonwealth in reducing greenhouse gas emissions, but has not prepared any analysis
examining future emissions with and without adoption of its proposal. Id. Finally, the Company
claims its proposal will assist in promoting the adoption of DERs within its service territory, but
has again not identified with specificity the number of additional DERs or increase in DER
adoption rate the Department can expect to see with the adoption of its proposal. Id. When
16
asked for his opinion on whether the Company’s proposals identified appropriate measurable
performance indicators and targets, the Company’s outside consultant responded that he had no
opinion on the matter. Tr. Vol. III, pp. 36-37.
To the extent the Company has identified what it refers to as performance metrics, they
are wholly inadequate and inconsistent with the clear intentions of the Department’s guidelines.
Within the current proceeding, the Company first provided a set of fourteen parameters the
Company referred to as performance metrics for customer benefits. Exh. ES-GMBC-3. These
metrics, however, only address reporting requirements the Company proposed to commit to,
without identifying any threshold level for the Department to identify whether the Company was
sufficiently meeting its requirements. For example, with regard to measuring the Company’s
success involving its improvements to distribution system load flow operations, Eversource
merely stated that it would “measure average [distributed generation] application by type.” Id. p.
1. Indeed, the Company proposes to spend $111 million on what Eversource has termed
“Foundational Technology for DMS and Automation,” yet the Company does not propose any
performance metric to measure customer benefits associated with any of these expenditures,
instead providing a nebulous note that benefits will be seen in other activities:
Benefits of foundational investments are realized without other
investments […], primarily the effectiveness and reach of advanced
distribution system.
Tr. Vol III, p. 550.
In response to discovery, the Company included new metrics to measure both the
Company’s implementation efforts and customer benefits. Exh. DPU-41-7,
Supplemental 1. Specifically, the Company identified thirty additional possible metrics
that it could add to the fourteen metrics proposed by the Company in its initial filing,
finding that it would only be able to track data in relation to fourteen of the thirty
17
additional metrics. Id. Eversource explicitly stated that some of the additional metrics
measure customer benefit and/or progress towards meeting the Commonwealth’s energy
policy goals. Id. However, these new possible metrics still fail to identify target
performance, and thus are inconsistent with the Department’s criteria requiring “specific
and measurable results.” For example, the first of the new benefit metrics states that the
Company will measure the increase in feeders with DMS control. Id. Eversource
identifies no target level of increase in the number of feeders on its system with DMS
control. Likewise, the Company proposes to measure both reductions in carbon-dioxide
emissions and improvements in customer service reliability. Id. Again, the Company
provides no target improvement for the Department to measure potential future
improvements against.
The proposed PBRM also fails to provide a more efficient regulatory approach,
including reducing regulatory and administrative costs. D.P.U. 96-50. The Company
states in its filing that the proposed regulatory mechanism will produce a number of
potential regulatory cost savings for both the Company and the Department. Tr. Vol. III,
p. 538. Yet, when asked to identify specific filings the Company has made in the last five
years that the proposed mechanism would have allowed Eversource and Department to
avoid, the Company could not identify a single filing that the proposed mechanism would
have avoided. Tr. Vol. III, pp. 539-540. It is undisputed, however, that the proposed
mechanism will add new annual compliance filings that the Company must make. Tr.
Vol III, p. 541.
The Company’s proposal also ignores the experiences the Department has
encountered in the past regarding PBR. In 1996, the Department approved Boston Gas
18
Company’s (“Boston Gas”) request to implement a PBR mechanism. D.P.U. 96-50
(Phase 1).
After the expiration of its initial five-year term in the early 2000s, the Department
approved a new 10-year PBR for Boston Gas. D.T.E. 03-40. In 2010, however, Boston
Gas sought to terminate its PBR mechanism, due in part to its admission that the
available cost-reduction alternatives were not sufficient to reduce, or even hold constant,
Boston Gas’ overall O&M expenses. D.P.U. 10-55. Importantly, Boston Gas’ decision
came after the Department’s 2009 decision to terminate early a PBR mechanism in use by
then-Bay State Gas Company. D.P.U. 09-30. The Department was clear in its decision
that the PBR plan in question was not working as intended, requiring Bay State Gas
Company to seek relief under the exogenous cost, earnings sharing mechanism, and
extraordinary economic circumstances provisions of the plan on several occasions during
its implementation. Furthermore, the Department found that there was nothing in the
record of the proceeding that convinced it that Bay State Gas’ historic initiatives to
promote operational efficiencies and cost reductions would not have been undertaken
absent a PBR mechanism, and that Bay State Gas’ was unable to quantify any significant
cost savings or benefits to ratepayers associated with continuing its PBR plan.
[…] [W]e find that the Company’s PBR plan is not working as
intended. Although the Company advocates for the continuation of
PBR plan or, at least the continued applicability of the earnings
sharing mechanism, exogenous cost recovery mechanism and the
PBR rate adjustment formula, it is evident that Bay State’s
experience with the PBR plan has been less than successful. The
Company concedes that the PBR plan has failed to provide sufficient
revenues to cover the Company’s operating and maintenance costs,
declining use per customer, and capital investment needs.
Additionally […] the Company has, on several occasions in the past
four years, sought relief under the exogenous cost, earnings sharing
19
mechanism, and extraordinary economic circumstances provisions
of the PBR plan. The Company provides numerous reasons for the
rate plan’s substandard performance, such as the historic time frame
underlying the construction of PBR, fundamental changes in the
utility industry, the lengthy term of the PBR, and capital investment
demands. Regardless of the reasons, the fact remains that the
Company has been unable to effectively and efficiently operate
within the parameters of the existing PBR plan.
In addition, although the Company identifies various efforts to
promote operational efficiency and/or reduce its costs, we are not
persuaded that the tangible benefits to ratepayers, if any, flowing
from the continuation of the PBR plan, including the establishment
of new base rates, outweigh terminating the PBR plan. There is
nothing in the record to convince us that such initiatives would not
have been undertaken absent the PBR. Indeed, the Company is
unable to quantify any significant cost savings and benefits to
ratepayers associated with its PBR plan.
Bay State Gas Company, D.P.U. 09-30, pp. 24-25 (emphasis added).
As in Bay State, Eversource’s PBRM does not deliver adequate benefits for
utility customers. The Company fails to “quantify any significant cost savings and
benefits to ratepayers associated with its PBR plan.” Bay State Gas Company, D.P.U.
09-30, pp. 24-25. Indeed, the record here is near-exclusively focused on capital cost
recovery matters. As discussed further below, the proposed capital addition can be made
absent the PBRM.
As of today, there is no major U.S. utility providing electric or natural gas
distribution service that currently operates under a PBR mechanism like Eversource
proposes here. The only exception is a single California electric utility whose mechanism
terminates at the end of this year. Exh. AG/DED-1, Sch. DED-1. The Company does not
dispute this reality. Tr. Vol. III, pp. 620-621. It offers no reason why the Department
should return to the past.

20
The Department should also reject the proposed PBRM on the grounds that it is
inconsistent with the Department’s established criteria in D.P.U. 96-50 that incentive
regulation proposals in part (1) not focus excessively on cost recovery issues; (2) be
designed to achieve specific and measurable results; and (3) provide regulatory and
administrative cost efficiencies. The proposed PBRM accomplishes none of these.
c) The Company’s Proposal Will Allow Near-Guaranteed Rate
Increases at Abnormally High Rates
The Company proposes to implement the PBRM in the current proceeding in lieu of an
annual capital cost recovery mechanism. Exh. ES-CAH-1, p. 5. The proposed mechanism
would be used to adjust rates on an annual basis through the use of a “revenue cap” formula that
is derived through economic analysis of utility cost trends as indicated by measures of inflation,
input prices, and total factor productivity. Exh. ES-GWPP-1, p. 10. Through the PBRM, rates
would be allowed to increase by the rate of inflation as measured by the Gross Domestic Product
Price Index (“GDP-PI”) published by the U.S. Department of Commerce, Bureau of Economic
Analysis (“BEA”) plus 2.56 percent, Eversource’s proposed “X factor” based upon a Total
Factor Productivity (“TFP”) analysis. Id., pp. 46-47. Assuming that inflation as measured by the
GDP-PI is greater than 2 percent, the Company proposes to subtract 0.25 percent from this rate
escalation to service as a Consumer Dividend (“CD”). Id., p. 54. This calculation does not
include the possibility of any potential recovery of GMBC expenses above the Company’s
committed $400 million, exogenous cost increases, or the potential interaction of the Company’s
Earnings Sharing Mechanism (“ESM”).
Large rate increases are embedded in the Company’s proposal. If GDP-PI is assumed to
be 2 percent per year for the four years following the rate year, increases in GDP-PI alone would
21
cause rates to rise by 8.24 percent over those four years.8 The Company’s proposal, however,
would allow Eversource’s rates to increase by 4.56 percent, each year. Over the course of four
years, Eversource’s customers will see rates increase by nearly 19.53 percent under the
Company’s proposed formula.9 Starting with the pro forma revenue requirement proposed by
the Company in its initial filing, the rates would increase $96 million in the first year and then
increase another $188 million over the next four years for a total of $284 million over the five
year term of the rate plan, without accounting for the Company’s various riders potentially
leading to even further increases.10 [ $96 million + $188 million = $284 million ].
The Department should reject Eversource’s proposed PBRM parameters for the simple
fact that they result in unjustifiable rate increases over the proposed term of the mechanism. The
Company has not provided sufficient justification to warrant such a large allowed increase in
rates, especially in the context of irregular aspects of the proposed mechanism such as a
proposed X factor far greater than any other recently accepted proposal for any North American
regulatory body, or a similarly unprecedented inflationary floor or CD factor tied to inflation
levels.
8 The effect of the annual two percentage increases over four years can be calculated as follows:
1.02 x 1.02 x 1.02 x 1.02 = 1.0824
9 The effect of the annual 4.56 percent increases over four years can be calculated as follows:
1.0456 x 1.0456 x 1.0456 x 1.0456 = 1.1953
10 The total affect would be $ 962,108,023 x 0.1953 = $188 million. Exh. ES-DPH-2 (Consolidated), Sch. DPH-33,
p. 9.
22
d) The Company’s Proposal to Have a Separate Adjustment for
Capital Investments Undermines the Purpose of A PBRM Formula and
Allows Dollar-For-Dollar Recovery Without a Prudence Review
The Company’s PBRM proposal essentially creates a separate tracking mechanism for
capital additions occurring after the test year. The Company’s inclusion of a capital investment
adjustment weakens the effect of regulatory lag and undermines the purpose of the PBRM and its
ability to control potential over-capitalization.
The Company has admitted that its Grid-Wise Plan is being proposed to adjust rates on
an annual basis, “in lieu of an annual capital cost recovery mechanism”, and as a “substitute for a
capital-cost recovery mechanism.” Exh. ES-GWPP-1, p. 10, and Exh. ES-PBRM-1, p. 4. The
proposed PBRM formula includes a component called the “grid modernization factor” (“GMF”),
which will be set to zero unless and until grid modernization investments are beyond the GMBC
of $400 million. Exh. ES-PBRM-1, p. 8. However, if the Company incurs more than $400
million in grid-modernization investments over the next five years, the GMF will allow for
automatic dollar-for-dollar recovery for these investments, without any regulatory review of the
propriety of such investments. Exh. ES-GWPP-1, p. 53. The GMF embedded in the PBRM acts
like a capital tracker by allowing all modernization investments above $400 million to go
directly into rates. As provided in the Direct Testimony of AGO witness, Dr. David Dismukes,
PBRs are not typically designed to include tracker-like characteristics. Exh. AG/DED-1, p. 35.
Generally, if capital adjustments are included, it is for those that are outside the Company’s
control and normal course of business operations. Id. However, the Company’s GMF will allow
23
it to recover all capital investments, including those that are not beyond the Company’s control,
in excess of its GMBC “stretch factor” 11 credit on a dollar-for-dollar basis. Id.
Furthermore, the Company’s proposed capital investment adjustment allows the
Company to act uneconomically and inefficiently, increases rates to the detriment of ratepayers,
and shifts capital development and regulatory risks to ratepayers. As explained in the Direct
Testimony of Dr. Dismukes, allowing these capital expenditures to be recovered separately,
through a tracker mechanism embedded in a PBR, will reduce capital expenditure discipline
since rates will be allowed to increase on a dollar-for-dollar basis with the capital investments
rather than having the utility fund those capital investments through efficiencies and its allowed
formula-based revenue increases. Exh. AG/DED-1, p. 39.
Ultimately, the GMF will allow the Company’s PBR mechanism to act as a capital
tracker recovering large undefined capital investments on dollar-for-dollar basis without the
benefits of a prudence or other regulatory review process common in a traditional capital
investment tracker.
e) The Company Has Not Provided Any Evidence That The PBRM
Is Necessary to Fund Grid Modernization Investments
The Company proposes the PBRM as a “substitute for a capital-cost recovery mechanism
with the goal of furthering the Commonwealth’s clean energy goals, creating stronger incentives
for cost efficiency, and assuring continued achievement of top-tier service-quality performance.”
Petition for Approval, p. 3. In particular, the Company states that the proposed PBRM will allow
the Company to invest in emerging technologies through the GMBC. Exh. ES-GWPP-1, p. 11.
11 A stretch factor has also been termed a consumer productivity dividend, and represents, in part, the accumulated
inefficiencies in cost-of-service regulation that are anticipated to be eliminated with a movement to incentive-based
regulation. See Exh. ES-PBRM-1, p. 54, and Exh. AG/DED-1, p. 15.
24
However, there is no record evidence that Eversource requires the PBRM to fund its proposed
$400 million GMBC or even its normal capital additions. Existing rates are sufficient to allow
the financing of grid modernization activities.
The evidence in the record shows that the Company’s current cost of service recovers
$183 million per year in depreciation expense or capital recovery for the combined services of
WMECo and NSTAR, which will yield approximately $915 million over the next five years.
Exh. ES-DPH-2 (Consolidated), Sch. DPH-33, p. 3. [ $915 million = $183 million x 5 ].
Recovery of depreciation expense reduces net plant investment and the utility’s corresponding
rate base as existing plant investments are depreciated. Incremental new rate base investments
offset this decrease – i.e. depreciation expense, and the buildup of accumulated depreciation
reserve. Exh. FEA-MPG-1, p. 23.
Therefore, since the Company’s existing capital recovery is so many times greater than
the proposed investment under the GMBC, the Department should reject the arguments that
existing rates are insufficient to allow the financing of GMBC investment, and that the proposed
PBRM is required to support the Company’s proposal to invest in grid modernization activities.
f) The Company’s Proposed PBRM Includes a Negative X Factor
Far Lower Than That Approved for Any North American Energy Utility
The Company’s proposed PBRM formula includes a productivity adjustment known as
the “X-factor.” The X factor is an adjustment in a PBR formula that often “tempers” the degree
to which a utility can increase its rates (or revenues) due to changes in inflation alone. The
higher the X factor, other things being equal, the lower the overall net increase in rates
(revenues) that will be allowed through the PBR formulation.
25
Eversource has failed to show that its proposed X factor is a reasonable productivity
offset for the Department to utilize in setting rates for the Company’s distribution services. The
Company proposed a productivity factor of negative 2.56 % (-2.56), Exh. ES-PBRM-1, p. 61,
comprised of a negative 1.37 % (-1.37) TFP differential and an input price differential of
negative 1.19 % (-1.19). Because the Company’s proposed X factor adjustment is negative, it
will not offset the annual inflation adjustment made to rates relative to industry inflation. Rather,
it is a supplement to allow additional increase over industry inflation rates under the PBRM.
The record demonstrates that, if accepted, the Company’s proposed X factor for the
PBRM would be by far the lowest X factor accepted in at least the last ten years for a U.S.
electric or natural gas utility and no company currently is operating with a negative X factor.
Exh. AG/DED-1, pp. 13-14. Including recent Canadian regulation, the proposed PBRM would
be the only incentive regulation mechanism in North America that is designed with a negative X
factor. Exh. AG/DED-1, pp. 47-48. The record shows that the use of negative X factors is an
outcome most regulatory jurisdictions have avoided. For example, in a recent Alberta Utilities
Commission (“AUC”) consideration of PBR plans, the AUC found that the range of acceptable
X factors based on its evidentiary record was anywhere from -0.79 to +0.75 %. Even when faced
with a potential finding of an ‘acceptable’ negative X factor, the AUC decided upon a positive X
factor, inclusive of a stretch factor, of +0.3 %. Exh. ES-12, pp. 44-45.
Indeed, in considering its record evidence, the AUC specifically noted the problematic
policy consideration of allowing utility rates to increase faster than general inflation through a
negative X factor. Id.
26
The Commission is aware that the value of the X factor can be
negative, and there was considerable discussion of this issue in
Decision 2012-237, as well as in this proceeding. However, given
the manner in which TFP growth is calculated in the studies in
evidence, negative values of TFP growth mean that more inputs are
used to produce the same amount of output or that less output is
produced using the same amounts of inputs. Any industry, including
the electricity (and gas) distribution industry, may have periods
when this phenomenon is observed, but it is not clear why such a
phenomenon should persist over a long period. In the Brattle and
Meitzen studies, TFP growth is negative in nine of the last 15 years,
and more particularly, in seven of the last nine years. Yet, many of
the utilities in the current proceeding went to great lengths to explain
some of the efficiency-improving procedures (productivity
improvements) they have adopted, and there is no reason to expect
that at least some of this type of behaviour would not be observed in
many of the U.S. firms in the sample used in the TFP growth
calculations being examined here. These findings suggest that there
may be some concerns with the calculation of TFP growth using
only volume as the measure of output, whatever the time period
used, especially when combined with the particular data and input
growth assumptions utilized in the Brattle and Meitzen studies, with
the sample of U.S. electric distribution utilities. The evidence is not
conclusive, but it does cause the Commission to be mindful of the
extent to which the results differ with different choices of
assumptions, including output measures.
Id. (emphasis added). 12
The Company has premised a great deal of the specifics of its proposed PBRM on the
idea that the utilities industry is currently seeing a prolonged period of negative productivity
growth relative to the economy as a whole. However, this position is not supported by the
Bureau of Labor Statistics (“BLS”) which measures productivity growth in America industries.
In rebuttal, the Company provided information which it argued supported the notion that
negative productivity growth occurs in numerous U.S. industries. Exh. ES-PBRM-Rebuttal-1,
pp. 17-18. Specifically, the Company produced analysis of productivity growth from the years
12 2018-2022 Performance-Based Regulation Plans for Alberta Electric and Gas Distribution Utilities, Alberta
Utilities Commission Proceeding ID No. 20414, Decision 20414-D01-2016 (Errata), ¶167, emphasis added.
27
2000 through 2014 from the BLS, which produces a multifactor productivity (“MFP”) measure,
a version of a TFP. The analysis showed sixteen separate American industries that have a
negative MFP according to BLS. Included in this presentation was North American Industry
Classification System (“NAICS”) sector 22, which covers the utilities sector. The Company’s
analysis found that the BLS had estimated that the average productivity growth in the utilities
sector over the years 2000 through 2014 was negative 0.42 percent (-0.42).
The Company’s analysis, however, actually did not show the wide-spread negative
productivity growth claimed in the Company’s narrative rebuttal. The Company inadvertently
used BLS measures for changes in sector output for the presented industries, and not MFP as is
claimed. Exh. VS-RB-Surrebuttal-1, pp.7-8. The Company admits that, due to its mistake, any
analysis based on the Company’s original table presented in its rebuttal filing would be
“nonsense.” Tr. Vol. III, p. 502.
A corrected version of the Company’s rebuttal Figure 1 showed that half of the industries
the Company originally presented as having negative productivity growth actually have positive
productivity growth. The Company finds no significance in its correction, as the purpose of its
rebuttal analysis was simply to show that negative productivity growth exists for certain
industries. Tr. Vol. III, p. 502. Apparently lost on Eversource, however, are the specifics of its
own analysis. Once corrected, according to the BLS, the average productivity growth for the
utilities sector over the years 2000 – 2014 is 0.94 percent. Exh. VS-RB-Surrebuttal-1, p. 9. This
is a positive productivity value, and indeed, is the second highest, after pipeline transportation, of
the industries chosen by the Company in its rebuttal analysis.
28
g) The Company’s Total Factor Productivity (“TFP”) Study Is
Flawed and Provides an Inadequate Analysis of the Company’s Costs
The Company’s TFP study has a number of deficiencies and fails to provide an accurate
analysis of the Company’s costs. A productivity analysis of the distribution service should
include an analysis of all of the costs of providing that service, including the capital costs, the
operations and maintenance expenses, as well as other labor and materials accounts such as
customer accounts, sales and a portion of Administrative and General (“A&G”) expenses. Exh.
AG/DED-1, p. 50. However, the Company only considers operations and maintenance expense
and distribution capital costs in its analysis. Id., pp. 53-54. The Company has provided a limited
analysis that therefore does not reflect the Company’s true costs and cannot be used to compare
its total productivity to the total productivity of its peers in the industry. Id. The Company’s
exclusion of customer accounts, sales and a portion of A&G expenses fails to recognize that the
Company’s revenue cap formula is applied to all distribution revenues which recover costs from
these accounts (customer accounts, sales, A&G, and general plant). Id. Omitting these accounts
biased Dr. Meitzen’s analysis, since it excludes major productivity improvements created by
technological advancements. For instance, Dr. Meitzen stated that by excluding certain customer
expense accounts in his productivity analysis, particularly as it relates to meter reading expenses,
the analysis includes the higher costs associated with smart meters, but does not account for any
of the cost savings associated with meter reading. Tr. Vol. 8, p. 1523-1524.
Likewise, Dr. Meitzen’s analysis leaves out major improvements in non-distribution plant
and labor productivity associated with, for example, the addition of electronic bill payment, the
outsourcing of customer billing, historical cost reductions in computer systems, and information
technology. As shown by Dr. Dismukes, the inclusion of these additional accounts (customer
29
accounts, sales, A&G, and general plant) increases the industry average from -2.56 in the
Company’s analysis to -1.95, further illustrating that the Company’s proposed productivity factor
is inaccurate. Exh. AG/DED-1, p. 55.
The Company attempts to confuse the issue by asserting that Dr. Dismukes’s allocation
of A&G and general plant is unnecessary because A&G and general plant are reported on a
disaggregated basis in the FERC Form 1. Tr. Vol XIII, p. 2686. This simply is not true. A&G
expenses and General plant are not reported on a disaggregated basis by function in the FERC
Form 1. The Company then attempts to show that Dr. Dismukes incorrectly allocated A&G
expenses using distribution, customer accounts and sales expenses, and by excluding customer
service expenses. Tr. Vol XIII, pp. 2689-2693. Customer service expense was excluded from
the allocation of A&G because for some companies, the cost of energy efficiency programs
implemented during the sample period were booked to this account. And, as Dr. Dismukes
explained even if a cost category was increasing, the relevant share applied to A&G would
decrease, holding the allocated expense relatively constant. Tr. Vol XIII. p. 2693.
Likewise, the Company mischaracterizes Dr. Dismukes’ calculation of plant amounts that
included an allocation of general plant. In his surrebuttal testimony, Dr. Dismukes revised his
capital quantity calculation to include only a portion of general plant. Exh. AG/DED-
Surrebuttal-1, p. 8. This calculation was provided in a workpaper labelled WP Revised TFP
Input Capital. Tr. Vol. XIII, p. 2694. In the spreadsheet tab labelled “Capital Calc,” Column
AA contains the values used for the general capital stock. The calculations in this column are
linked to a “% of Distribution Plant in Service” column (Column G) of the Company’s own
capital stock calculation and is used to allocate the portion of general plant. Therefore, the
30
Department should reject the Company’s mischaracterizations of Dr. Dismukes’ calculation of
general plant allocations.
The Company’s analysis also fails to include in its peer group utilities that are suitable for
an analysis of an appropriate productivity factor and the use of PBR mechanisms. It appears that
the Company has simply updated a previous analysis that its witnesses used in another
proceeding, and neglected to add relevant utilities to the peer analysis. Tr. Vol. VIII, pp. 1475-
1477. For instance, the Company has not included any utilities operating in Maine in its
analysis. A utility such as Central Maine Power that operated under a PBR mechanism during
the study period would certainly be a suitable utility to include in the Company’s peer group
analysis. The Company’s failure to include pertinent comparable utilities in its analysis further
illustrates the flaws in the Company’s analysis and the questionable reliance on a peer average
that does not represent the Company’s own productivity and may not actually be representative
of comparable peers.
Additionally, the Company has inappropriately weighted the Company’s peer group
average. The Company has made an incorrect adjustment in determining the peer group average
such that even if the basis for the adjustment were correct, it is limited and selective. Exh.
AG/DED-1, pp. 55-56. The TFP estimates included in the Company’s analysis are already
scaled for size since productivity is a relative measure comparing a utility’s inputs to its outputs.
Id. The Company appears to selectively weight the productivity estimates as there is a wide
range of differences between utilities which could also impact these productivity estimates
including regional differences, regulatory differences, geography, service territory
characteristics, and variations in the extent of vertical integration, among other factors. Id.
31
Although the Company adjusts for size, it fails to adjust for many of these other factors resulting
in a weighted average that is selective and arbitrary. Id.
The Company’s analysis fails to account for customer peak demands when applying an
appropriate measure of output in its TFP study. The Department has found that relying solely on
the number of customers and excluding customer usage from the productivity analysis results in
a downward bias in productivity growth levels. Boston Gas Company, D.P.U. 96-50 (Phase 1),
p. 277. Despite this finding the Company rely solely on the number of customers as an output
measure in its productivity analysis. Exh. ES-PBRM-1, p. 68. The Company’s own cost of
service study shows that non-customer related parameters are important in determining its costs
to serve its customers. Exh. AG/DED-1, pp. 58-59 (citing Exh. ES-ACOS-1 and Exh. ES-
MCOS-1). The TFP measure estimated by the Company inappropriately uses customers as the
one and only measure of output rather than some combination of sales and customers, some
combination of sales and peak demand, or just sales alone. Id., p. 59. Distribution utilities
“produce” distribution services (sales), not customers, thus, the measure of output used in
developing a productivity factor should reflect a true measure of the services (output) being
offered by the Company. Exh. AG/DED-1, p. 62-63. While the number of customers can be an
important cost determinant, the number of customers is not the sole determinant of costs. Id.
Indeed, Dr. Meitzen admitted that the number of customers is not the primary driver of costs for
electric distribution. He noted that a large portion of cost to such companies now is replacement
of infrastructure, which is not well correlated with either growth in customers or growth in their
load. Tr. Vol. III, pp. 494-496. Therefore, the Department should reject the Company’s analysis
that is based on the number of customers only and accept the alternative analysis conducted by

32
Dr. Dismukes, which appropriately uses a combination of number of customers and peak
demand in the determination of a productivity factor.
Furthermore, the Company used an incorrect method in calculating its capital quantity
index. The Company’s capital quantity index does not consider gradual depreciation of capital
but, instead, assumes a capital stock that faces no depreciation until an asset is retired. Exh.
AG/DED-1, pp. 63-64. This will tend to overstate capital inputs, other things being equal, and
result in estimates that suggest a higher degree of utility inefficiency. Id. The capital quantity
index should be derived using a geometric-decay method. Id. Such an approach assumes a
current valuation of capital and constant rate of depreciation. Id. The geometric-decay method
is also much more widely used in productivity studies and academic research and has been used
by the Department in its prior-approved PBRs. Id. In addition, the Company’s capital quantity
estimates only consider distribution plant. Id. Dr. Dismukes’ analysis includes general plant as
well as the inclusion of these costs. This is necessary given the fact that the Company’s revenue
cap formula is applied to all distribution revenues which recover costs from these accounts
(customer accounts, sales, A&G, and general plant). Id. Therefore, if the Department accepts a
PBRM for the Company, which it should not, it should reject the Company’s TFP analysis and
accept the analysis of Dr. Dismukes which more properly determines a productivity factor.
h) The Company’s Proposed Earnings Sharing Mechanism
(“ESM”) Has A Number of Deficiencies
The Company’s proposed ESM is asymmetrical, giving too much upside earnings
opportunities to the Company and its shareholders relative to ratepayers. The sharing bands,
particularly the dead-band, are set at a level that is too large and could result in outcomes where
ratepayers see little to no benefits from the adoption of the PBRM. Additionally, the Company’s
proposed actual sharing percentages move in directions that will not send strong efficiency
33
incentives. Earning sharing percentages should increase, not decrease, as the Company’s
achieved earnings exceed allowed returns. However, the Company proposes sharing percentages
that decrease, not increase, as its achieved earnings exceed those allowed under the PBR. Thus,
the Company will earn fewer rewards, not a greater level of rewards, as it assumes more risks,
and incurs more costs, during its PBR term. This type of ESM design is not productive and
creates negative incentives for the Company to push the “edge of the envelope” in terms of its
efficiency activities since, at the margin, it will get fewer rewards for more difficult and likely
outcome-uncertain efforts. Furthermore, the Company has indicated a willingness to include a
rate moratorium in its PBR, if an “off-ramp” rate case condition is included in the ESM. As a
result of this condition to file a rate case, the Company will not assume any significant degree of
under-earnings if it’s PBR is approved since, if it finds itself in any under-earnings position, the
Company can simply file a rate case at any time. The inclusion of the Company’s rate case
provision, without significantly redefining the ESM dead-band, requires ratepayers to assume too
much risk with the Company’s PBR, and will give the Company a very large reward for
assuming little to no down-side earnings risk.
i) The PBRM Stay-Out Provision
As originally filed, Eversource “didn’t include a stay-out provision” as part of its PBRM
proposal. Tr. Vol. VIII, p. 1586. At some point in the proceeding, the Company decided that it
“would accept a stay-out provision of five years under the plan with an earnings sharing band as
[it] had proposed, with sharing on the upper end, and allows us to file a rate case if earnings fall
below the band, which is what is articulated in the response to AG-33-8.” Id. However, as Mr.
Horton testifies, this assumes that the “proposal is not modified from what we have presented in
this proceeding.” Tr., Vol V., p. 1019. Further cross-examination of Mr. Horton revealed that
34
this stay-out promise is not a real stay-out. “Well, I think all companies would have the ability to
file for a rate case at whatever time they choose.” Tr., Vol. V, p. 1019.
Mr. Horton is correct. The Department has previously found:
a ten-year PBR plan would not alter substantive rights retained by
Boston Gas by statute to file a rate case if rates are not just and
reasonable. Department actions cannot abrogate statutory rights in
rate setting.
Boston Gas Company d/b/a KeySpan Energy Delivery New England, D.T.E. 03-40, p. 496
(2003). Thus, the Department's approval of a PBR mechanism cannot trump the statutory rights
granted as a part of G.L. c. 164, § 94. Bay State Gas Company, D.P.U. 09-30, p. 21 (2009).
The Department should not base a decision on whether to approve the proposed PBRM
upon the Company’s unsupported assertion that a five-year stay-out provision provides value to
customers. The Company can lawfully file a rate case whenever it determines it is not earning a
reasonable return, even during the term of a PBR plan. Boston Gas Company, Essex Gas
Company and Colonial Gas Company, each d/b/a National Grid, D.P.U. 10-55, p. 10 (2010).
2. GRID MODERNIZATION BASE COMMITMENT
Eversource’s initial filing includes the Company’s unsolicited offer to commit a
minimum of $400 million in future grid modernization capital investments and improvements
over the five-year term of the proposed Grid-Wise Performance Plan. The combined spending
proposal would, if approved, direct approximately $250-260 million towards conventional “grid-
facing” modernization improvements; $100 million towards proposed energy storage

35
demonstration offerings; and $45 million to support future potential electric vehicle (“EV”)
infrastructure.13 Exh. ES-GMBC-1, p. 10, Table 1.
a) Proposed Grid Modernization Investments
(1) Introduction and Background
The Department, in a series of orders in both D.P.U. 12-76 and in its associated
investigation in D.P.U. 14-04 into time-varying rates (“TVR”), described its vision for a modern
electric system thoughtfully planned to be “cleaner, more efficient and reliable, and [able to]
empower customers to manage and reduce their energy costs.” D.P.U. 12-76-B, p. 1. In setting
forth its modernization vision, however, the Department also opined that modifications to
conventional regulatory treatment of grid modernization capital expenditures may be warranted
“to remove what may be impediments to some grid modernization investments” under
traditional, customary ratemaking practices governing incremental capital investments. D.P.U.
12-76-B, p. 4; p. 19; p. 22. Accordingly, in D.P.U. 12-76-B the Department established a
targeted capital cost recovery mechanism – termed the Short Term Investment Plan, or “STIP” –
to allow for periodic interim adjustments in rates for qualifying, incremental grid modernization
capital spending without the need for a full Section 94 revenue requirement determination.
However, the STIP allows for rate adjustments only in limited circumstances.
First, STIP-eligible investments must advance measureable company progress towards
the Department’s four grid modernization objectives and the individual projects must be
proposed and incurred within the first five years of a company’s GMP. D.P.U. 12-76-B, pp. 22-
13 The Department defined “grid-facing” modernization investments as technologies that automate grid operations
and allow distribution companies to monitor and control grid conditions in near real time. “Customer-facing” capital
initiatives, by contrast, are technologies primarily associated with customer metering and related investments, such
as two-way communications systems, internet-based information portals, wireless applications, direct load control
technologies, and smart appliances and electronics. See Modernization of the Electric Grid, D.P.U. 12-76-A at 2, n.
4 (2013).
36
23. Although the Department’s initial STIP proposal would have limited eligible STIP
investments solely to capital additions to deploy advanced metering functionality (“AMF”), the
Department in D.P.U. 12-76-B subsequently allowed recovery for other grid modernization
investments provided the GMP includes a plan to achieve AMF within five years of Department
approval of the GMP, or an alternative proposal to achieve AMF across a longer timeframe. 14
Id., p. 17. “In other words,” the Department determined, “targeted cost recovery will not be
available for other [non-AMF] capital investments if the company is not also investing in
advanced metering functionality.” Id., p. 20.
Second, the Department restricted qualifying STIP investments to capital expenditures
only. Thus, a company may not recover projected O&M expense increases through the STIP.
D.P.U. 12-76-B, pp. 16, 19.
Third, a company may recover only incremental grid modernization capital spending
through the STIP. The Department explained that the “incremental” prerequisite means either
proposed capital investment in new system technologies, or an incremental level of proposed
capital spending relative to a company’s current capital expense program. D.P.U. 12-76-B at pp.
19-20. The Department cautioned, however, that the incremental limitation in the STIP means
the proposed STIP spending “must be incremental to those [capital expenditures] recovered in
base rates to be recovered in a capital tracker” and that “[c]ompanies will be required to
14 The Department took care to define “advanced metering functionality” (or “AMF”), as opposed to pre-
determining specific characteristics of advanced metering infrastructure (or “AMI”). The Department defines AMF
as:
(1) the collection of customers’ interval data, in near real time, usable for settlement in the
ISO-NE [wholesale] energy and ancillary services markets; (2) automated outage and
restoration notification; (3) two-way communication between customers and the electric
distribution company; and (4) with a customer’s permission, communications with and
control of appliances.
D.P.U. 12-76-B, p. 15.
37
demonstrate that such [proposed STIP] costs are not already included in rates.” D.P.U. 12-76-B,
p. 23.
Fourth, STIP-eligible investments must be prudently incurred. The Department
explained that its review of the GMP and approval of proposed capital spending within the STIP
would effectively serve as “pre-authorization” of STIP-eligible investments, foreclosing
subsequent ratemaking challenges regarding whether the company should have proceeded, as a
matter of necessity, with the STIP investments. D.P.U. 12-76-B, p. 19. But pre-authorization of
STIP investments, the Department cautioned, would not foreclose subsequent inquiry and
determination whether a company’s spending in furtherance of the investment was prudent. Id.,
p. 24. “[T]he company will bear the burden of demonstrating that all of the costs it seeks to
recover through its [STIP] tracker was undertaken in a prudent manner.” Id. In addition,
Department pre-authorization through the STIP does not negate the ratemaking prerequisite that
investments included in rates must be “used and useful.”
The Department also stated that its consideration and pre-authorization of a company’s
STIP-eligible investments must be supported with a comprehensive business case analysis.
D.P.U. 12-76-B, p. 17. The specific provisions and parameters of the required business case
analysis are described at length in a subsequent Department order, D.P.U. 12-76-C. The
Department underscored the importance of the business case analysis by stating that it “intends
to look to the business case analysis as the primary lens for deciding whether to accept, reject, or
require modifications to the STIP.” D.P.U. 12-76-B, p. 17. It is through the business case
analysis that a company demonstrates that the benefits of its STIP investments justify the costs.
D.P.U. 12-76-C, pp. 3, 8, 12.
38
(2) The Company’s Proposed Grid Modernization Investments
Do Not Qualify for Exceptional, Targeted Cost Recovery
Mechanisms
The Company disregards the Department’s requirement that expedited recovery of grid-
facing investments only occur where the Company also submits a compliant plan for AMF
deployment, supported by a business case analysis. D.P.U. 12-76-B. The Department has
conveyed that it is not prepared to authorize any accelerated cost recovery for non-AMF
modernization investments if a company is not also spending to deploy AMF. Id. As noted in
the AGO’s presentation and briefs in D.P.U. 15-122, Eversource’s proposed Incremental Grid
Modernization Plan (“GMP”) fails the requirement to fully deploy AMF.
Moreover, the Company has no business case analysis in this proceeding to support its
proposed GMBC investments, despite the Department’s directive in D.P.U. 12-76-B that the
business case analysis serves as the “primary lens for deciding whether to accept, reject, or
require modifications to” planned grid modernization improvements. D.P.U. 12-76-B, p. 17.
Accordingly, the Company’s presentation of its GMBC gives the Department no basis to approve
proposed GMBC spending as eligible for accelerated regulatory cost recovery.
(3) The Department Need Not Approve the PBRM nor the
GMBC to Move Forward with Grid Modernization
The Department has numerous options for moving forward with grid modernization
without approving Eversource’s request for a $284 million rate increase and the GMBC. First,
the Company should comply with D.P.U. 12-76-B and the Department’s decision regarding the
most appropriate regulatory construct to foster and encourage wide-scale progress on the
Department’s grid modernization policy objectives. Specifically, in D.P.U. 12-76 and in the
related exploration of AMI-enabled time of use rates (Investigation Into Time Varying Rates,
39
D.P.U. 14-04), the Department concluded that the combination of presenting a long-term (ten-
year) grid modernization planning budget, coupled with the STIP cost-recovery mechanism
represents the best way forward in achieving the grid modernization objectives of: (i) reducing
the effects of outages; (ii) optimizing demand; (iii) integrating distributed resources; and (iv)
improving workforce and asset management. Plainly, the surest path towards achieving more
rapid grid modernization is the one the Department has already established. Thus, the Company
could cure the deficiencies in its Grid Modernization filing and re-file its proposed grid
modernization investment plans with the criteria required by D.P.U. 12-76-B.
Second, the Company is free to move forward at its own pace with grid modernization
investments and seek cost recovery for its investments as it would for any other capital additions.
Third, if the Department approves a capital tracker in this proceeding and wanted to authorize the
Company to utilize the capital tracker process for certain grid modernization investments, the
Department could revisit its prior orders and make modifications to D.P.U. 12-76-B as required.
(4) Many of the Proposed Investments Are Not “Grid
Modernization” Investments
If the Department accepts the GMBC as part of the proposed Grid-Wise Performance
Plan, or authorizes special accelerated rate recovery for grid modernization investments, the
Department should take care not to include or pre-approve “business as usual” capital
investments. The Department designed its grid modernization regulatory initiative to accelerate
“incremental” modernization investments, meaning those investments representing a new, more
advanced technology than the utility would otherwise deploy, or capital spending at a pace or
level higher than that supported by underlying base distribution rates. D.P.U. 12-76-B, p. 19.
The STIP was designed to “eliminate barriers to grid modernization.” D.P.U. 12-76-B, p. 22. If,
40
however, the proposed modernization investment represents nothing more than what the
Company would purchase in any event in the ordinary course of capital planning and acquisition,
plainly no such “barrier” exists.
Additionally, the Department emphasized that expedited regulatory cost recovery of
modernization investments must “be incremental to costs recovered in base rates.” Id., p. 23. A
Company’s ordinary capital construction program and spending levels is already “built into”
base distribution rates (via a ratemaking allowance for both depreciation expense, taxes, and a
return on net investment). Accordingly, incorporating the same “business as usual” capital
projects into an incentive regulatory construct would over-compensate the Company and force
customers to unreasonably pay twice for the same investment. Thus, to the extent that the
Department provides for special regulatory treatment for certain grid modernization investments,
it should do so in accordance with the recommendations of AGO witness Mr. Booth.
b) Energy Storage
The Company’s GMBC capital spending commitment also includes a proposal to invest up
to $100 million during the five-year term of the proposed Grid-Wise Performance Plan in grid-
scale energy storage demonstration offerings. Exh. ES-GMBC-2, p. 56. The Company has
preliminarily identified four particular grid locations as potential candidates for implementing the
proposed $100 million storage commitment: Martha’s Vineyard (5-10 MW); Wellfleet (12 MW);
New Bedford (6 MW); and Pittsfield (6 MW). Id., pp. 56-59; Exh. ES-GMBC-1, pp. 80-84.
The Company’s energy storage proposal makes clear that these four projects are not yet
fully developed, as the Company lacks both specific details related to each location’s costs as well
as any data to estimate potential storage benefits. Thus, these projects are purposefully labelled
“demonstration offerings” by the Company and are not yet sufficiently informed as to be called

41
“pilots.” Tr. Vol. 1, p. 180. The Company is not at this time requesting Department approval of
the specific individual projects, nor is the Company at this time seeking “pre-authorization” of this
initiative, as that term is employed in D.P.U. 12-76-B. Instead, the Company seeks only that the
Department approve, as a “concept” undergirding its PBRM formula, the Company’s proposal to
spend $100 million for energy storage projects to be selected and approved by the Department at
a later date. The Department must deny the Company’s request.
The Department has no record on which to approve the “concept” of $100 million in grid-
side energy storage projects. The Company freely admits that storage technology is “nascent” and
that costs and benefits to deploy are unknowable at this juncture. Tr. Vol. 1, p. 29; Tr. Vol. 7, p.
1372. Although the Company repeatedly commits to completing and presenting to the Department
and stakeholders full cost development before proceeding with actual construction of a storage
project, the Company makes no similar commitment to develop, in advance of construction,
comparable details on benefits. The Company does not know the benefits prior to implementing
the projects. It is the Company’s intent that the demonstration offerings will provide the
information on benefits. Thus, the storage proposals are not properly “pilots,” in which Company
projections on equipment costs, benefits, and system performance are confirmed. Rather, these
are $100 million of proposed investment forays (the Company preferred the term “learnings”)
meant to test various “hypotheses” about the projects and to confirm only if there are benefits. See
Exh. ES- GMBC-7 (laying out the various “hypotheses” the Company intends to test through the
four proposed storage projects). See also Tr. Vol. 10, p. 2016 (indicating that the Company did
not prepare quantifiable estimates of the benefits flowing from any of the proposed GMBC
investments). Absent verifiable Company data on cost or benefits or some kind of business case
42
analysis, it is impossible for the Department to determine whether such energy storage investments
are reasonable, prudent, or in the best interests of ratepayers.
The Company further contends that its proposed $100 million commitment to energy
storage projects is essential to aid the Commonwealth’s achievement of its storage targets,
referencing DOER’s recent “State of Charge” Report. Exh. ES-GMBC-6. On closer examination,
however, the Company’s contentions lack merit. First, the initial statewide storage goal suggested
for investor-owned utilities discussed in the State of Charge Report was 707 MW at a cost of $387
million. Id., p. 20. That would make Eversource’s likely financial share of the total statewide
storage goal suggested in the State of Charge Report roughly $200 million and the storage target
roughly 350 MW. Against that statewide goal, it would make little sense for the Company to
proceed to spend nearly half of that commitment, or $100 million, on storage “demonstrations”
that entail only 30-40 MW in “demonstration offerings” that have no assurance of customer
benefits or operational success.
In addition, subsequent to the issuance of the State of Charge Report, DOER fulfilled its
statutory obligation to identify near-term storage procurement targets for the state’s investor-
owned utilities. See An Act Relative to Energy Diversity, C. 188, St. 2016, Section 15(b). After
careful deliberation of a broad array of industry comments, DOER did not adopt a storage target
of 700 MW, as set forth in the State of Charge study. Instead, DOER set forth an “aspirational”
200 MWh target for electric distribution companies to procure “viable and cost-effective” energy
storage systems.15 DOER states that the purpose of the target is to fulfil the intention of the
15 See DOER correspondence to the Legislature’s Conference Committee Members, available at
http://www.mass.gov/eea/docs/doer/letter-to-legislature-notice-of-energy-storage-target-adoption.pdf
43
legislature in a way that compliments the planned course of the Massachusetts Energy Storage
Initiative.
The Commonwealth is moving forward with energy storage deployment. Eversource
should be working within the framework established by DOER and the Department to ensure that
the Company is procuring viable and cost-effective energy storage, consistent with statewide
policies. Spending $100 million over five years to pursue “learnings” associated with roughly 30-
40 MW of storage, with no showing of the costs and benefits or any business case analysis, is not
consistent with state policies. In fact, AGO Witness Booth testified that it is just as likely that
storage investments in the $10 million range will provide the same information on benefits and
cost as the Company’s much riskier proposal to commit $100 million. See Exh. AG-GLB-1, p.
63. The Department must reject the Company’s “concept” to pre-approve a $100 million “bucket”
of storage-related spending to be incurred over five-year term of the proposed PBRM.
c) EV Charging Infrastructure
(1) The Department Should Consider the Company’s Make-
Ready Electric Vehicle Infrastructure Program in a Separate
Proceeding Outside of this Rate Case
As part of the Company’s GMBC, the Company proposes to spend approximately $45
million in capital expenditures on infrastructure upgrades in an attempt to expand the network of
EV charging stations in its service territory. Exh. ES-GMBC-1, pp. 90–91, 114. The proposal,
which the Company refers to as a “Make Ready” program, would allow the Company to own all
of the infrastructure required to install an EV charger, excluding the charger itself. Id.; Tr. Vol. 1,
p. 197. In addition, the Company proposes to spend another $9.9 million on O&M and marketing
expenses, adding up to a total EV program budget of $54.9 million. Exh. ES-GMBC-1, p. 114;
Tr. Vol. 1, p. 191. The Company has a proposed five-year timeline for its EV infrastructure
44
program, with Phase 1 beginning on January 1, 2018 and Phase 2 beginning on January 1, 2020.
Tr. Vol. 1, p. 193.
While the AGO strongly supports the goal of encouraging more EV adoption in the
Commonwealth, utility funded programs such as the one proposed by the Company must be
thoughtfully planned out and considered in light of all of the information available in the evolving
market. The Company proposes to spend significant ratepayer funds on its EV charging program
but has failed to adequately explain in this proceeding how its program would work in conjunction
with other EV initiatives in the state. The Company’s proposal also raises numerous issues
regarding: the proper role of utilities in the competitive EV charging market; the appropriate size
and scope of a utility supported program; as well as questions as to whether the proposed costs and
purported benefits will be appropriately distributed. See Exh. AG-GLB-1, p. 64 (noting that there
needs to be more consideration of the actual costs and that any EV service extension benefits flow
to ratepayers). In addition, there are various programs in place now and others set to begin in the
near future which further contribute to the uncertainty regarding how best to advance EV adoption
and EV charger penetration. Ultimately, more time is needed to consider Eversource’s proposal
in light of these other programs and the rapidly changing EV market.
The coming changes to the charging infrastructure market are not theoretical. National
Grid has proposed its own program to encourage site owners to install EV chargers, which the
Department has docketed as D.P.U. 17-13. Exh. AG-4 (National Grid, D.P.U. 17-13, Revised
Exhibit KAB/BJC-1). National Grid proposes to spend approximately $25.1 million to operate its
program over an eight-year period, which is about half as much as Eversource’s proposed initiative
costs. Id., pp. 26, 30. The Department, AGO and other intervenors are currently reviewing
National Grid’s proposal in D.P.U. 17-13 – a standalone proceeding solely dedicated to issues
45
surrounding National Grid’s EV program.16 Notably, Eversource’s pre-filed testimony in this
proceeding makes no mention of National Grid’s proposal, any discussions the two companies
have had on EV issues, or how Eversource will coordinate with National Grid on the
implementation of its program. On cross examination of the GMBC Panel, Company Witness
Eaton confirmed that he had not reviewed National Grid’s proposal “in any detail” and seemed to
lack knowledge on particular aspects of National Grid’s program. Tr. Vol. 1, pp. 190, 199.
Similarly, the Company’s initial filing contains no information as to how its program would
work with other EV initiatives in the Commonwealth, and the Company did not provide more
detail when given the opportunity in discovery. When asked in an information request how the
Company’s proposal would take advantage of synergies with existing EV programs, including the
Massachusetts Offers Rebates for Electric Vehicles (“MOR-EV”) rebate, the Massachusetts
Electric Vehicle Inventive Program (“Mass EVIP”), and the Volkswagen Clean Air Act civil
settlement,17 among others, the Company offered scant details other than that these programs
“further support the objectives” of Eversource’s program “by decreasing or deferring the costs to
potential site hosts and EV drivers.” Exh. ME-1-26. The Company failed to provide a description
in its initial filing regarding whether and to what extent it considered these other programs during
the design phase of its program. Furthermore, the Company provided no explanation in this
16 The procedural schedule in D.P.U. 17-13 allows for substantially more opportunity to consider the complex issues
involved. National Grid made its initial filing in January 2017 and the Department set a procedural schedule
allowing for pre-filed direct testimony, rebuttal testimony, and sur-rebuttal testimony, potentially two days of
hearings, and briefing going through the end of October 2017. See D.P.U. 17-13. 17 As a result of the Volkswagen Settlement, Massachusetts will be able to spend up to 15% of its allocation of
environmental mitigation trust funds on light duty ZEV charging infrastructure. Tr. Vol. 7, pp. 1439–1440; see
Partial Consent Decree, In re: Volkswagen “Clean Diesel” Marketing, Sales, Practices, and Products Liability
Litigation, MDL No. 2672 CRB (JSC) (N.D. Cal., Oct. 25, 2016); Second Partial Consent Decree, In re:
Volkswagen “Clean Diesel” Marketing, Sales, Practices, and Products Liability Litigation, MDL No. 2672 CRB
(JSC) (N.D. Cal., May 17, 2017). This amounts to approximately $11.26 million of Massachusetts’s approximately
$75 million allocation. Id. In addition, Volkswagen has selected Boston as one of ten metro areas where the
company will invest a share of $250 million in ZEV infrastructure during the first funding cycle for its required
investments in ZEV infrastructure, education, and access under the settlement. Exh. AG-18 (Volkswagen Group of
America, National ZEV Investment Plan: Cycle 1), pp. 4–5; Tr. Vol. 7, pp. 1437–1439.
46
proceeding as to how the existence of these other programs will affect future site host recruitment,
location of chargers, or investment it its own fleet. 18 This lack of information suggests that the
Company did not fully consider how its program will operate in the broader EV charging market.
The Department should require the Company to demonstrate that it has taken all of the relevant
programs into account before considering the Company’s program.
(2) The Department Should Establish Statewide Goals and
Standards Before Approving Any EV Charging Proposal
Both Eversource and National Grid are proposing large EV infrastructure roll-outs in
separate Department proceedings. In order to create a degree of uniformity and coordination
among these programs and others, the Department should open a proceeding to establish a
statewide plan on utility involvement in EV charging infrastructure. Such a proceeding could help
ensure that the companies are working under a similar set of assumptions, coordinating to site EV
chargers in the most optimal locations, and using similar metrics for evaluation. Perhaps most
importantly, a statewide proceeding would give the various interested stakeholders the opportunity
to more directly engage and participate in the development of a broader EV infrastructure plan for
the Commonwealth. A statewide proceeding could also be an opportunity for a meaningful
discussion of EV rate design issues – something that is noticeably absent from Eversource’s
proposal, but has been highlighted by many intervenors in this proceeding. See ME-1, p. 46; Exh.
AC-ML-1, p. 39; Exh. TEC-JB-1, p. 26; Exh. SREF-TW/MW-1, p. 64; Exh. CP-MKW-1, p. 35.
To date, the Department has not laid out a comprehensive set of policy goals regarding
utility involvement in the deployment of EV charging infrastructure, but has noted some areas of
18 One reason for the lack of consideration could be the fact that the Company’s program has a built-in back-up plan
if the Company fails to recruit enough site hosts to participate in the program – in that case the Company can simply
start spending GMBC money on electrifying its own fleet, without restriction. Tr. Vol. 7, pp. 1281–1287. This is
discussed in more detail in Section 3(a) below.
47
concern. In D.P.U. 13-182-A, the Department stated that “distribution companies may have a
competitive advantage in owning and operating EVSE that may adversely affect the development
of a competitive market for EV charging,” and went on to note that the Department “will not allow
recovery of costs” except in certain situations. 19 D.P.U. 13-182-A, p. 13. Among these exceptions
were the Company’s fleet and employee charging, research and development, and in response to
a company proposal which: (1) is in the public interest; (2) meets a need regarding the advancement
of EVs in the Commonwealth that is not likely to be met by the Competitive EV market; and (3)
does not hinder the development of the competitive EV charging market. Id. G.L. c. 25A, § 16(f),
added by Chapter 448 of the Acts of 2016, largely codifies the Department’s standard of review in
D.P.U. 13-182-A, but includes the caveat that charging stations be “publicly available.” Beyond
this baseline, neither the Department nor the legislature has provided any further direction as to
the items that should be included in a proposal for a utility-supported EV charging program.
The Department should establish a set of goals and standards before the companies spend
tens of millions of dollars in ratepayer funds on EV infrastructure programs. The programs being
proposed by Eversource and National Grid contain substantial differences including the overall
size, number of each type of charger, utility ownership of infrastructure upgrades behind the meter,
recovery method, program length, and evaluation metrics. All of these items should be
standardized and coordinated, to the extent possible, so that the costs and benefits of the
companies’ EV charging programs are spread out equitably across the state. Customers who
happen to reside in one utility’s service territory, versus another, should not have to shoulder more
than their share of the burden to install EV chargers. At the very least, these issues need to be
considered in a comprehensive and holistic manner.
19 EVSE stands for “electric vehicle supply equipment” and refers generally to the infrastructure necessary for EV
charging. D.P.U. 13-182-A, p. 2.

48
For the reasons discussed above, the Department should not approve the Company’s
proposal as part of this rate case proceeding. Rather, the Department should open an investigation
to establish a statewide policy on utility-supported EV charging. At the very least, the Department
should fully consider the Company’s proposal in a standalone docket to allow more time to
consider the complex issues involved and allow for more meaningful stakeholder input.
(3) If the Department Decides to Review Eversource’s EV
Proposal in this Proceeding, it Should Adopt Several Modifications
As stated previously, the Department should review the Company’s EV charging proposal
in a separate proceeding after the Department establishes a statewide plan on advancing EV
infrastructure. However, should the Department elect to review and approve the Company’s
proposal in this proceeding, it should: (1) not permit the Company to own any infrastructure behind
the meter; (2) only allow recovery through normal ratemaking; (3) not allow the Company to spend
program money on electrifying its own fleet; and (4) put other mechanisms in place to ensure
greater accountability and program coordination. Each of these items is discussed in more detail
below.
(a) The Company Should Not Be Permitted to Own
Infrastructure Behind the Meter
The Company proposes to install and own all of the infrastructure required to install an EV
charger, except for the charger itself. Exh. ES-GMBC-1, pp. 90–91, 114; Tr. Vol. 1, p. 197. This
includes owning items on the utility side of the meter, such as the distribution primary lateral
service feed, transformer and transformer pad, and new service meter, as well as owning items on
the customer side of the meter, such as the service panel, associated conduit and conductor, and
the pedestal on which the charger sits. Id. A substantial portion of the Company’s proposed capital
expenditure budget for its Make Ready program is devoted to infrastructure behind the Company
49
meter. See Exh. Att. AG-23-15. In contrast, under normal business-as-usual circumstances, a
customer looking to install an EV charger would be required to pay for the full cost of a new meter,
and would also need to install and own the remaining infrastructure downstream of the meter. Tr.
Vol. 1, pp. 200–201. The Company’s proposal would therefore allow it to eventually include
substantial capital investments in infrastructure benefiting individual customers in rate base which
utilities do not typically own.
Eversource has failed to demonstrate in this proceeding that ownership of infrastructure
behind the meter is in the public interest; meets a need regarding the advancement of EVs in the
Commonwealth that is not likely to be met by the Competitive EV market; and does not hinder the
development of the competitive EV charging market. See D.P.U. 13-182-A, p. 13. Indeed, the
Company has only claimed that its program, overall, meets the Department’s standard of review,
but has not specifically shown how facilities ownership behind the meter meets these criteria. See
Exhs. ES-GMBC-1, pp. 93–96; DPU-27-1. Even assuming that the Company’s overarching plan
to encourage the deployment of EV chargers in the state is in the public interest, fulfills an unmet
need, and does not hinder the competitive market (all of which is far from clear), it does not
automatically follow that each aspect of the Company’s proposal – in particular owning
infrastructure behind the meter – is the best way or even necessary to achieve the ultimate goal.
Ownership of customer facilities behind the meter is not in the public interest under these
circumstances because it would allow the Company to eventually earn a return on infrastructure
investments beyond which the Department typically allows and it is not required to achieve the
objectives of the Company’s EV charging program. While the Company is seeking to “offer a
full-service, turn-key solution” to incent customer participation, there are alternatives to utility-
ownership behind the meter. In addition to simply requiring a customer seeking to install a charger
50
to pay for and own the necessary upgrades, the Company could have explored incenting customers
by offering to reimburse them for upgrades between the meter and the charger. This is the method
National Grid proposes in D.P.U. 17-13, which maintains the traditional boundary between utility-
owned infrastructure and customer-owned infrastructure. Exh. AG-4, pp. 28, 33. The Company,
however, did not pursue this option. Indeed, the Company did not even analyze what the costs of
its program would be under a business-as-usual model or a customer reimbursement model. Tr.
Vol. 1, pp. 203–204. Furthermore, another alternative to owning the infrastructure upgrades could
be to offer a financing program or “on-bill amortization of constructions costs.” Exh. TEC-JB-1,
p. 26. Again, there is no indication that Eversource considered this as an option.
The Company has not provided evidence that ownership behind the meter is necessary to
accelerate EV adoption nor has it demonstrated that such ownership is superior to other available
options. Furthermore, National Grid’s EV Program, if approved, would only permit utility
ownership of infrastructure up through the meter. Given these issues, the Department should not
allow Eversource to own infrastructure upgrades behind the meter. Absent a showing of need, the
Department should maintain the traditional boundaries between utility and customer infrastructure
and should have a consistent statewide policy on exactly which types of EV-related infrastructure
utilities are permitted to own.
(b) Recovery of Make-Ready Infrastructure Should
Occur in the Normal Course of Ratemaking
The $45 million the Company has allocated to its Make Ready EV infrastructure program
is part of the Company’s proposed $400 million in GMBC capital spending, and tied to the annual
rate increases the Company hopes to receive under its Grid-Wise Performance Plan PBR
mechanism. As discussed elsewhere in this Brief, the Company does not need approval of its PBR
or GMBC to make these investments. The Company should treat EV-related utility infrastructure
51
the same way it would any other capital investment – it should put these items into rate base after
the investments are made and seek recovery in its next rate case. The Company has not provided
a convincing reason as to why, absent further incentive, EV infrastructure investment is not
feasible.
Under the ordinary ratemaking scenario, the Company would still be justly compensated
in the form of its ROE for any EV charging investments found to be appropriate utility investments,
prudent, and used and useful.20 The Company has simply not provided sufficient reason in this
proceeding to depart from the traditional regulatory model. Therefore, if the Department allows
the Company to go forward with its program, the Department should only allow recovery through
normal ratemaking.
(c) Electrification of the Company’s Own Fleet Should
Not Be Included as Part of the Make Ready Program
The Company proposes to electrify its own vehicle fleet if it is unsuccessful in attracting
enough site hosts to participate in its EV charging program. Exh. ES-GMBC-1, p. 125.
Specifically, “if potential site hosts are slow to respond to the Company’s marketing efforts,” the
Company will repurpose GMBC money to electrify the hydraulics function in the Company’s
bucket trucks and install additional infrastructure and charging stations to charge these vehicles.
Id. The Company states that it will do this only if it is “unable to attract sufficient Level II site
hosts in each phase of the program,” but does not indicate a specific threshold for when it will start
investing in its fleet, versus continuing its marketing efforts. Id., p. 27. For the reasons discussed
below, the Department should reject this proposal.
20 It should be noted that National Grid has proposed a separate reconciling mechanism to recover the annual
revenue requirement associated with its EV program in D.P.U. 17-13. Exh. AG-4, p. 61. While the AGO makes no
determination on the reasonableness of that approach here, it does show that there are other options that the
Department could consider.
52
The AGO generally supports Eversource’s initiative to electrify its own vehicle fleet and
to own and operate chargers on Company property to charge these vehicles. However, pursuant
to D.P.U. 13-182-A, companies are already permitted to recover the costs of charging
infrastructure associated with their own fleets without additional approval from the Department.
D.P.U. 13-182-A, p. 13. In addition, the Company acknowledges that electrification of its fleet is
a “standard capital expenditure that should be authorized for cost recovery under the Department’s
prudence review that is applicable to all capital expenditures.” Exh. DPU-27-1. Thus, the
Company should be undertaking electrification efforts in its operations in the normal course of
business, without additional contribution from ratepayers.
Furthermore, under the Company’s proposal, the Company would, in its sole discretion,
make the decision to electrify its fleet and would not be subject to any cap on the amount it spends
on its fleet. Tr. Vol. 7, p. 1282–1285; 1287. However, the Company has not described in any
detail what criteria it would use to reach such a decision other than the arbitrary and self-serving
determination that site hosts are “slow to respond” or recruitment is “measurably below the
Company’s plan….” Exh. ME-3-11; Tr. Vol. 7, p. 1282. The Company provides no information
as to how far below expectations site recruitment would need to be nor does it provide any detail
as to the specific factors its decision making process will employ. Moreover, the Company
acknowledges that without a cap it could, in theory, spend more money on its fleet electrification
than on public charging infrastructure. Tr. Vol. 7, pp. 1288–1289. The Department should not
allow the company this degree of “flexibility” which essentially would reward the Company for
failing to meet program expectations. Ultimately, removing this back-up plan from the Company’s
proposal may incent the Company to work harder at site host recruitment.
53
(d) The Department Should Put Other Mechanisms in
Place to Ensure Greater Accountability and Program
Coordination
If the Department decides not to open an investigation or review Eversource’s proposal in
a separate docket, it should put additional safeguards in place to ensure that the Company’s EV
program is operating as intended and is properly integrated with other Massachusetts programs.
First, the Department should make clear that stakeholders will have the opportunity to
evaluate the Company’s progress on its EV program and propose modifications to the Company’s
approach in the proposed annual compliance filing proceeding. The Company has made much of
its “annual stakeholder process” throughout this proceeding, but the degree to which changes to
the Company’s EV proposal would be possible in the annual proceeding is unclear. See Tr. Vol.
1, pp. 181–184. Allowing stakeholders to give immediate feedback to the Company annually
could help to ensure that the Company is operating its program in the most effective manner.
Second, in addition to the annual review discussed above, the Department should consider
requiring a more formal review of the Company’s EV program around the mid-point of the
program to evaluate its effectiveness and decide whether it should continue. See Exh. ME-1, p. 70
(recommending a formal review and approval after three years). This would allow the Company,
Department and intervenors to propose significant changes to the structure of the Company’s
program, if needed.
Third, the Department should require Eversource to establish joint working group meetings
or stakeholder outreach meetings with National Grid to coordinate on issues of commonality
between the two companies’ EV programs (assuming both programs are approved) and allow for
stakeholder input. Areas of cooperation could include: public marketing and site host recruitment
strategies; coordination of site locations; identifying and utilizing outside funding sources;
54
coordinating with other Massachusetts EV initiatives; and any other opportunities which may arise
during the course of implementing the two EV programs. Requiring the companies to engage
jointly with stakeholders would allow issues of commonality to be addressed in a comprehensive
manner and ensure that the companies are apprised of each other’s progress. The Department
could open a docket to facilitate this dialogue as it has in other contexts. See, e.g., Smart Grid
Pilot Evaluation Working Group, D.P.U. 10-82; Investigation on Distributed Generation
Interconnection, D.P.U. 11-75; Investigation into Modernization of the Electric Grid, D.P.U. 12-
76. Ultimately, it is important that EV issues be discussed, and programs be implemented, on a
statewide basis with multiple opportunities for stakeholder engagement and input.
d) The Department Should Reject the GMBC Performance Metrics
as Proposed Because They Do Not Meaningfully Assess Company
Performance or Mandate Good Performance
The Company proposes to use fourteen performance metrics across six investment
categories to monitor and evaluate the Company’s progress with its GMBC. Exhs. ES-GMBC-1,
p. 132; ES-GMBC-3. As proposed, the metrics do not provide any assurances or commitments
that its investments will produce sufficient levels of benefits to ratepayers or any ratepayer
benefits at all. Exh. AG/DED-Surrebuttal-1, p. 4. The Department should reject the
performance metrics as proposed because they (1) lack financial penalties or incentives and are
therefore rendered ineffective and (2) fail to focus on customer benefit outcomes. The
Department should instead order the Company to (1) implement metrics that meaningfully
measure customer benefits and (2) strengthen and expand the metrics by incorporating
intervenors’ recommendations. Moreover, the Department should establish a penalty/incentive
structure that is based on the Company’s performance.
55
(1) The Department Should Include Performance Penalties
and/or Incentives.
As noted above, the Company does not propose that it suffer any penalties or receive any
financial incentives in connection with its performance metrics. Exh. ES-GMBC-1, p. 135.
Indeed, the Company concedes that its proposed performance metrics “are not designed to secure
specific outcomes for the grid-modernization effort.” Id., p. 134 (emphasis in original). The
Company’s proposed metrics do not provide any recourse for ratepayers or the Department if the
Company fails to meet them or implement the GMBC properly.
The Company argues that incentives and penalties for GMBC performance metrics are
unnecessary because such incentives are “inherent in the Eversource Grid-Wise Performance
Plan, and accordingly, that the incentive to succeed with the GMBC is inherent in the
authorization of the PBRM.” Exh. ES-GMBC-1, p. 135-36. Any incentives and penalties that
may be inherent in the Eversource Grid-Wise Performance Plan are insufficient to hold the
Company responsible for the proper execution and acceptable performance of its GMBC
commitments. Although the Department will have an opportunity to review the Company’s
progress in its Annual Grid-Wise Performance Plan Compliance Filing, the Company has not
proposed a framework by which the Department can directly hold the Company accountable for
good or poor performance in implementing the GMBC proposal and/or achieving the GMBC’s
investment goals. In order for the Company to be truly held accountable, the Department must
have the ability to evaluate, modify, reward, and/or penalize the Company’s progress on the
GMBC as measured through performance metrics.
If the Department authorizes the Company’s proposed PBRM with its associated GMBC,
the AGO recommends that the Department couple that authorization with performance metrics
that are backed by financial penalties for poor performance and/or incentives for excellent
56
performance. Appropriate financial penalties or incentives could include spending caps on the
investment categories or individual projects, a condition that the Company will only receive its
annual PBRM adjustment upon reaching GMBC progress goals, and a condition that the
Company will only earn its full rate of return on the GMBC if it meets the GMBC metrics and
achieves net benefits for customers. Without such penalties or rewards it remains unclear what,
if any, negative economic or regulatory consequences the Company would face if it fails to meet
the goals set forth in the GMBC and the performance metrics.
The Company acknowledges that it is within the Department’s authority to condition the
approval of the Annual Grid-Wise Performance Plan Compliance Filing and the annual PBRM
adjustment on reaching GMBC progress goals. Mr. Hallstrom admitted on cross-examination
that such a result was possible if the Company failed to meet its GMBC targets. Tr. Vol. I, p. 84.
Because the Company acknowledges that it runs this risk and that the Department has the
requisite authority, this new provision should be set forth explicitly in the GMBC.
(2) The Company’s Proposed Performance Metrics Are
Deficient.
The Company’s proposed performance metrics do not focus sufficiently on customer
benefits and outcomes. See Exh. ES-GMBC-3. Instead, many of the performance metrics are
process-based and focus more on the Company’s ability to spend its planned budget, deploy
technology, and build infrastructure. Exhs. CLC-KRR-1, p. 22; AC-AA-1, p. 11. As a result,
the Company need only perform certain actions in order to satisfy the Company’s proposed
metrics, regardless of whether or not the Company performs those actions well, achieves any
given outcome, or provides value to ratepayers.
The Department should order the Company to submit a revised performance metrics
proposal that focuses on outcome-based metrics that require the Company to actually deliver the
57
Company’s promised customer benefits. For example, one of the six investment categories
proposed by the Company is “Customer Tools for Distributed Energy Resources Integration.”
Exh. ES-GMBC-3, p. 5. In this category, the Company proposes to measure the following
investments as a metric: a customer portal, hosting capacity maps and tools, and automated
billing. Under the Company’s proposal, the Company would meet its performance metric by
making those particular investments, regardless of whether the Company implements those
investments well or whether they succeed in delivering benefits to ratepayers. There are very
few targets that focus on the performance of the portal or that incorporate how well the portal
functions, what value it adds, or whether it improves the customer experience. Exh. SREF-
TW/MW-1, p. 60. Several intervenors have suggested improvements to the metrics in order to
measure customer benefits. For example, a performance metric could measure the effectiveness
of the customer portal by tracking reduced development time and measuring whether the number
of deployments have increased or whether distributed generation customers have experienced
savings. Exh. CLC-KRR-1, p. 25.
Through testimony, discovery, and cross-examination, the Department and several
intervenors made other thoughtful and reasonable recommendations that would improve the
effectiveness of the Company’s performance metrics. See, e.g., Exhs. AC-AA-1, pp. 11-13; ME-
1, p. 71; RR-CLF-2; RR-DPU-2. The AGO supports these recommendations and requests that
the Department order the Company to submit revisions to its original metrics that focus on
customer benefits achieved in the implementation of the GMBC rather than simply measuring
whether money was spent and actions were taken.

58
(3) The Company Should Add to Its Performance Metrics.
During the course of discovery and evidentiary hearings, multiple intervenors asked the
Company to consider additional metrics not included in the Company’s initial filing. Exh. DPU-
41-7 (Supplemental 1). As a result, the Company prepared an analysis of the range of suggested
metrics and chose an additional fourteen potential metrics based on the Company’s ability to
produce the information necessary to track the data for those metrics. Exhs. DPU-41-007
(Supplemental 1); Att. DPU-41-7 (Supplemental); Tr. Vol. I, p. 134. Nonetheless, the Company
does not propose to include the additional fourteen metrics in its initial performance metrics
report to stakeholders and the Department. Tr. Vol. I, pp. 135, 137.
The Company’s claims that it did not immediately include the additional metrics
identified in Exh. Attachment DPU-41-7 (Supplemental) becuase it wants to evaluate, through a
stakeholder process, whether the metrics are “of interest” and provide value to the stakeholders.
Tr. Vol. I, p. 135. However, it was the stakeholder-intervenors that suggested the additional
metrics and recommended that the Company incorporate performance metrics from D.P.U. 12-
76-B and D.P.U. 15-122. Tr. Vol. I, p. 133. Nothing prevents the Company from hearing other
views and incorporating additional metrics in the future, but there is no reason to delay
implementation of the useful measures identified in this proceeding. Accordingly, the
Department should order the Company to include these additional fourteen metrics as part of its
initial performance metrics report to stakeholders and its Annual Grid-Wise Performance Plan
Compliance Filing. This directive would increase the number of performance metrics from
fourteen to twenty-eight.
59
e) The Company’s Annual Stakeholder Process Will Not Provide an
Opportunity for Meaningful Stakeholder Participation or Comment
Eversource proposes to conduct an annual stakeholder process to provide information and
obtain stakeholder input on the direction, progress and achievement of the GMBC, in advance of
its Annual Grid-Wise Performance Plan Compliance Filing. Exh. ES-GMBC-1, p. 88. As
proposed, the stakeholder process is underdeveloped, ill-timed, and risks not providing
stakeholders with the information needed to participate meaningfully, or sufficient opportunity to
provide comment to the Company and to the Department.
If the Department allows the PBRM – which it should not – the Department must direct
the Company to develop a more robust stakeholder participation framework, based on
information received during cross examination and intervenor testimony and briefs, as discussed
herein. A robust stakeholder framework that ensures stakeholders will play a meaningful role in
the implementation of the GMBC will benefit customers, the Company, and the Department.
The Company’s proposed annual stakeholder process is underdeveloped. The
stakeholder process is referred to only in passing in the Company’s testimony, then expanded
upon slightly in a discovery response. Exhs. ES-GMBC-1, p. 88; DPU-57-9, p. 3. The
Company has proposed to conduct a stakeholder meeting in the first six months of the year, at
which time it will provide progress reports and obtain stakeholder input on the direction and
progress of the Company’s GMBC, as well as provide specifics on selected projects. Exhs. ES-
GMBC-1, p. 89; DPU-57-9, p. 3. However, the Company has not identified: which stakeholders
will be involved in the process; how it will reach out to existing and new stakeholders; the length
of prior notice it will provide to stakeholders; whether it will provide any substantive information
in advance of the meeting; how it will accept comment; and how it will incorporate stakeholder
comments and recommendations for Department review in the Annual Grid-Wise Performance
60
Plan Compliance Filing. Accordingly, the AGO recommends that the Department require the
Company to further develop its stakeholder process by specifically defining the proposed due
process-related recommendations listed above.
Specifically, the AGO recommends that, to identify stakeholders, the Company contact
stakeholders on related Department service lists, as well as post notice on its website. The
Company should provide at least two weeks’ notice of the annual stakeholder meeting. The
notice should include a detailed description or agenda of the items to be discussed at the meeting
including when and how stakeholder comment will be taken. The materials the Company
intends to present at the meeting also should be available to the stakeholders in paper and
electronic form, on the Company’s website. Importantly, to provide stakeholders with the
opportunity to review the meeting materials and to submit thorough and meaningful comments
and suggestions the Company should accept written stakeholder comment for two to three weeks
following the annual stakeholder meeting. Alternatively, the Company could provide the
substantive materials in advance of the meeting and accept oral and written comments at the
meeting. Finally, the Department should require the Company to summarize the stakeholders’
comments and discuss in its Annual Grid-Wise Performance Plan Compliance Filing to the
Department how the Company addressed the comments.
The Company’s annual stakeholder process also is ill-timed. The Company proposes to
hold the annual stakeholder meeting in the first two quarters of the year. Exh. DPU-57-9, p. 3.
Based on the annual September 15 deadline to file the Annual Grid-Wise Performance Plan
Compliance Filing and the requested Department approve-by date of December 31, if the
stakeholder meeting is held in the first quarter of the year it is unclear how the information to
review would differ from the information contained in the recently approved filing. Exh. DPU-
61
57-9, p. 3. Further, feedback obtained from customers in the first quarter of the year may be
stale by the time it is filed at the end of the third quarter.
During evidentiary hearings, Mr. Eaton advised that the first annual stakeholder meeting
would likely be held in the spring of 2018. Tr. Vol. I, p. 177. While holding the meeting at the
beginning of the second quarter of the year is an improvement, to maximize the relevance of
stakeholders’ input, the annual stakeholder meeting should be held annually in mid-June. If
followed by a two or three-week stakeholder comment period, this schedule would permit the
Company sufficient time to review and summarize comments as well as to deliberate internally
over proposed modifications to the GMBC projects, performance metrics, or other aspects of
stakeholder interest in advance of the Annual Grid-Wise Performance Plan Compliance Filing.
Finally, the AGO recommends that the Department hold a public hearing and set a public
comment period for the Company’s Annual Grid-Wise Performance Plan Compliance Filing. A
public process would hold the Company accountable for accurately characterizing and
addressing stakeholders’ comments, and provide stakeholders with the opportunity to comment
on the final filing to the Department.
The Company’s annual stakeholder process does not hold it accountable to stakeholders
and is unlikely to result in meaningful input to either the Company or the Department.
Accordingly, if the PBRM/GMBC goes forward the Department should order the Company to
develop a more robust annual stakeholder framework based on the recommendations herein, and
on the input provided by other intervenors. Only a robust stakeholder framework will ensure that
stakeholders play a meaningful role in the GMBC.
62
B. CAPITAL STRUCTURE AND COST OF CAPITAL
1. INTRODUCTION
The Department determines a utility’s overall cost of capital by “weighting” the
individually determined cost rates for a utility’s equity capital and debt capital by the relative
percentages of equity and debt in its capital structure that are outstanding. This overall
composite weighted average cost of capital (“WACC”) is then applied to the utility’s test year
end rate base to determine the dollar amount of the return on rate base component of the cost of
service used to determine base rates in this proceeding.
The cost of capital rate that the Department ultimately uses to determine the cost of
capital in rates must meet the standards for determining the allowed rate of return on common
equity (“ROE”) as set forth in Hope and Bluefield.21 The allowed ROE should preserve the
Companies’ financial integrity, allow it to attract capital on reasonable terms, and be comparable to
returns on investments of similar risk.
The Company has proposed a capital structure consisting of 45.69 percent long-term
debt, 0.94 percent preferred stock, and 53.37 percent common equity for NSTAR, and of 46.66
percent long-term debt and 53.34 percent common equity for WMECo. Exh. ES-DPH-2 (East
and West), Sch. 31, p. 1. The Company also has proposed a long-term debt cost rate of 4.32
percent for NSTAR and 4.07 percent for WMECo. Id. The Company has proposed a preferred
stock cost rate of 4.56 percent for NSTAR. The Company-sponsored testimony of witness
Robert Hevert estimates an equity cost rate of 10.50 percent for both the Companies. Exh. ES-
RBH-1, p. 3.
21 Federal Power Commission v. Hope Natural Gas Company, 320 U.S. 591 (1944) (“Hope”) and Bluefield Water
Works & Improvement Company v. Public Service Commission of West Virginia, 262 U.S. 679, 692–93 (1923)
(“Bluefield”).
63
The Attorney General sponsored the testimony of Dr. J. Randall Woolridge regarding the
appropriate rate of return for NSTAR and WMECo. Exh. AG/JRW-1. Dr. Woolridge has
adjusted the capital structure ratios of NSTAR and WMECo to be more reflective of the capital
structures of electric utility companies. Id., p. 5. This capital structure includes common equity
of 50.0 percent. Id.
Dr. Woolridge estimates an equity cost rate for NSTAR and WMECo by applying the
Discounted Cash Flow Model (“DCF”) and the Capital Asset Pricing Model (“CAPM”) to a
proxy group of electric utility companies (“Electric Proxy Group”) as well as to Mr. Hevert’s
proxy group (“Hevert Proxy Group”). Exh. AG/Exh JRW-1, p. 2. Dr. Woolridge’s analyses
resulted in an appropriate cost of equity capital rate in the range of 7.9 to 8.95 percent. Because
he relies primarily on the DCF model, Dr. Woolridge recommends a Return on Equity (“ROE”)
of 8.875 percent. Id., p. 60.
Dr. Woolridge identifies several errors in NSTAR’s and WMECo’s analyses in the
Company’s cost of capital recommendation. Id., pp. 5 and 78. These include:
The Company and the AGO have opposing views regarding the state of the
markets and capital costs;
The Company’s proposed capital structure includes an excessive common equity
ratio;
The Company does not recognize that investment risk of NSTAR Electric and
WMECo, as indicated by their S&P and Moody’s credit ratings, is below the
averages of other electric utilities;
The Company’s DCF equity cost rate estimates are excessive because Mr. Hevert:
(a) has given little (if any) weight to his constant-growth DCF results, (b)
exclusively uses the earnings per share growth rates of Wall Street analysts and
Value Line; (c) used an inflated terminal GDP growth rate of 5.36 percent in his
multi-stage DCF model; and (d) included a flotation cost adjustment;
The base interest rate and market or equity risk premium in Mr. Hevert’s CAPM

64
and Bond Yield Risk Premium (“BYRP”) approaches are excessive and result in
an overstated equity cost rate; and
The Company does not recognize that its proposed rate mechanisms result in a
lower level of risk for the Company relative to the proxy groups of electric
utilities.
Id.
2. CAPITAL STRUCTURE
As set forth above, the Company has proposed a capital structure consisting of 45.69
percent long-term debt, 0.94 percent preferred stock, and 53.37 percent common equity for
NSTAR and 46.66 percent long-term debt and 53.34 percent common equity for WMECo. The
Company has proposed a long-term debt cost rate of 4.31 percent for NSTAR 4.32 percent for
WMECo. The Company has proposed a preferred stock cost rate of 4.56 percent for NSTAR.
Exh. AG-JRW-1 p. 35.
Dr. Woolridge demonstrated that these proposed capital structures have more common
equity and less financial risk that the capital structures of other electric utilities. Specifically, Dr.
Woolridge shows that the average capitalization ratios for the companies in his Electric Proxy
Group are 5.78 percent short-term debt, 48.76 percent long-term debt, 0.12 percent preferred
stock, and 45.33 percent common equity. Id. As such, Dr. Woolridge concludes that the Electric
Proxy Group has, on average, a much lower common equity ratio than proposed by the
Company. Id., p. 36.
Dr. Woolridge explains that when a regulated electric utility’s actual capital structure
contains a high equity ratio, the options are: (1) to impute a more reasonable capital structure and
to reflect the imputed capital structure in revenue requirements; or (2) to recognize the
downward impact that an unusually high equity ratio will have on the financial risk of a utility
and authorize a lower common equity cost rate. Id. p. 38.

65
Given these two alternatives, Dr. Woolridge proposes that the Department use a capital
structure with an imputed common equity ratio of 50.00 percent. In other words, as provided in
Panel C of Exhibit JRW-5, Dr. Woolridge lowered the common equity ratio from 53.57 percent
to 50.00 percent for NSTAR and from 53.34 percent to 50.00 percent for WMECo. Then he
made a proportional increase in the ratio for long-term debt (45.69 percent to 48.99 percent) and
preferred stock (0.94 percent to 1.01 percent) for NSTAR and in the ratio for long-term debt
(46.66 percent to 50.00 percent) for WMECo. Dr. Woolridge emphasizes that this capital
structure includes a common equity ratio (50.00 percent) that is still above the averages of the
two proxy groups (45.30 percent and 45.90 percent). Id. p. 39.
a) The Company Failed to Include NSTAR’s Most Recent Long-
Term Debt Issuance in Its Capital Structure
NSTAR issued $350 million in a long-term bond issuance on May 6, 2017 with an
interest rate of 3.20 percent. See Exh. AG-26 (Compliance filing in from NSTAR Electric
Company, D.P.U. 16-189). Although the Company had the terms of the debt issuance available
when it filed its latest revenue requirement calculation on May 25, 2017, it failed to include the
issuance in the determination of the capital structure and revenue deficiency in this case. See
Exh. ES-DPH-2 (East and West), Sch. 31, pp. 1-2. The Company’s failure to include the
issuance is not without consequence; the addition of the new debt issue will increase the
outstanding balance of long-term debt and the ratio of long-term debt used in the weighted cost
of capital calculation. The amount outstanding and the interest rate of the new issue of long-term
debt is known and measureable
Further, the Department’s long-standing precedent plainly requires the Company to
adjust its capital structure for long-term debt issued after the end of the test year. Massachusetts
Electric Company, D.P.U. 15-155, pp. 343-344 (2016); Aquarion Water Company of

66
Massachusetts, Inc., D.P.U. 11-43, pp. 204-205 (2012); Fitchburg Gas and Electric Light
Company, D.P.U. 07-71, pp. 122-123 (2008); Bay State Gas Company, D.T.E. 05-27, p. 272
(2005); and Colonial Gas Company, D.P.U. 84-94, pp. 52-53 (1984).
Therefore, Department should include NSTAR’s $350 million debt issue in the
calculation of the capital structure and the cost of debt when it determines the Company’s overall
weighted cost of capital.
b) The Company’s Embedded Cost Rate of Long-Term Debt Is
Miscalculated
Eversource inappropriately applies carrying charges on the unamortized issuance costs
that the Companies incurred in issuing its long-term debt. The Company includes these carrying
charges in its calculation of the embedded cost of long-term debt by dividing the sum of the
annual interest expense and amortization of issuance expense by the balance of long-term debt
less the unamortized issuance costs. See Exh. ES-DPH-2 (East and West), Sch. 31, p. 2. Tr.
Vol. XIII, pp. 2802-2803.22
22 Mr. Horton described the Company’s calculation as follows:
Q. Now, to calculate the overall embedded cost rate, you look at the annual interest and amortization
expense amount that you show in Column H and divide it by the 6/30/2016 carrying value from Column G; is that
correct?
A. It's taking Column H divided by Column G. Is that what you said?
Q. Yes, H over G equals I.
A. That's correct.
Q. That carrying value -- and then that carrying value was determined on Lines 31 through 40; right?
A. That's right.
Q. And in reading across, the carrying value is determined by removing the premium or discount --
removing the premium or discount and issuance expenses from the principal amount for each issuance; is that right?
A. Correct.
67
The precedent regarding the treatment of carrying charges on issuance costs is well
established. The Department has found that the appropriate treatment of issuance costs is to
allow their recovery as a straight line amortization over the term of the debt issuance without
carrying charges on the unrecovered balance. Massachusetts Electric Company, D.P.U. 15-155,
pp. 343-344 (2016); Bay State Gas Company, D.T.E. 05-27, pp. 269-272 (2005); Boston Gas
Company, D.T.E. 03-40, pp. 319-324 (2005); and Colonial Gas Company, D.P.U. 84-94, pp. 51-
52 (1984).
The Department should correct the errors in the Company’s calculation of the embedded
cost of long-term debt for both NSTAR and WMECo. For each Company’s cost of debt, the
Department should use the total amount of debt outstanding, rather than the so-called “carrying-
value” to determine the denominator and use the sum of the annual interest expense and the
amortization of the issuance expense to determine the numerator in the ratio. Only then will the
embedded cost of debt be in conformance with the Department’s precedent. Id.
3. RETURN ON COMMON EQUITY
a) Proxy Groups
NSTAR and WMECo do not issue common stock that is traded in the market place as all
of the common stock is held directly or indirectly by the holding company, Eversource Energy.
Since the cost of capital is estimated using capital market data, it is appropriate to evaluate the
cost of capital based on a group of utilities of similar investment risk profile. See Bluefield and
Hope, supra.
The Department has accepted the use of a comparison group of companies for evaluation
in a cost of equity analysis, when a distribution company does not have common stock that is
publicly traded. See New England Gas Company, D.P.U. 08-35, pp. 176-177 (2008);
68
Massachusetts Electric Gas and Electric Light Company, D.T.E. 99-118, pp. 80-82 (2001);
Massachusetts Electric Company, D.P.U. 92-78, pp. 95-96 (1992). The Department has also
generally rejected the inclusion of non-regulated entities in the comparison group. Berkshire
Gas Company, D.T.E. 01-56, p. 116 (2002); Boston Gas Company, D.P.U. 96-50, Phase I, p. 132
(1996); Cambridge Electric Light Company, D.P.U. 92-250, pp. 160-161 (1993); Massachusetts
Electric Gas Company, D.P.U. 92-111, pp. 280-281 (1992); Berkshire Gas Company, D.P.U.
905, pp. 48-49 (1982).
To estimate an equity cost rate for setting electric distribution service rates, Dr.
Woolridge evaluated the return requirements of investors on the common stock of the companies
in two proxy groups of publicly-held electric utility companies: the Electric Proxy Group he
developed, and Mr. Hevert’s proxy group (“Hevert Proxy Group”). Exh. AG-JRW-1, pp. 32-35
and Att. JRW-4.
The Electric Proxy Group includes twenty-six companies that meet the following
requirements:
1. At least 50 percent of revenues from regulated electric operations as reported by
AUS Utilities Report;
2. Listed as an Electric Utility by Value Line Investment Survey and listed as an
Electric Utility or Combination Electric & Gas Utility in AUS Utilities Report;
3. An investment grade issuer credit rating by Moody’s and Standard & Poor’s
(“S&P”);
4. Has paid a cash dividend in the past six months, with no cuts or omissions;
5. Not involved in an acquisition of another utility, the target of an acquisition, or in
the sale or spin-off of utility assets in the past six months; and
6. Analysts’ long-term earnings per share (“EPS”) growth rate forecasts available
from Yahoo, Reuters, and/or Zacks.
Exh. AG-JRW-1, p. 33.
69
Dr. Woolridge presents the summary financial statistics for the Electric Proxy Group in
Panel A of page 1 of his Exhibit JRW-4.23 The median operating revenues and net plant among
members of the Electric Proxy Group are $6,237.5 million and $17,722.5 million, respectively.
The group receives 82 percent of its revenues from regulated electric operations, has a BBB+
bond rating from Standard & Poor’s and a Baa1 rating from Moody’s, a current common equity
ratio of 46.9 percent, and an earned return on common equity of 9.3 percent. Exh. AG-JRW-1,
pp. 33-34.
Dr. Woolridge presents the summary financial statistics for the Hevert Proxy Group in
Panel B of page 1 of Exhibit JRW-4. The median operating revenues and net plant for the
Hevert Proxy Group are $2,789.6 million and $8,987.7 million, respectively. The group
receives 87 percent of its revenues from regulated electric operations, has a BBB+ bond rating
from Standard & Poor’s and a Baa1 rating from Moody’s, a common equity ratio of 46.9
percent, and a current earned return on common equity of 9.3 percent. Id.
Dr. Woolridge also uses credit ratings as measures of investment risk in comparing
NSTAR and WMECo to both the Electric and Hevert Proxy Groups. . Exh. AG-JRW-4, p. 1.
The S&P and Moody’s issuer credit ratings for NSTAR and WMECo are, respectively, A and
A2. Exh. AG-JRW-1, p. 73. The averages for the Electric and Hevert Proxy Groups are,
respectively, BBB+ and Baa1. Exh. AG-JRW-4, p. 1. This means that NSTAR and WMECo’s
S&P and Moody’s issuer credit ratings are two notches above the averages of the proxy groups
(S&P: A vs. BBB+ - Moody’s: A2 vs. Baa1). That is, the investment risk of NSTAR and
WMECo is below that of the electric utilities in the two proxy groups. Exh. AG-JRW-1, p. 73.
23 Dr. Woolridge presents financial results using both mean and medians as measures of central tendency. However,
due to outliers among means, he reports the median as a measure of central tendency. Exh. AG-JWR, p. 33, n. 24.
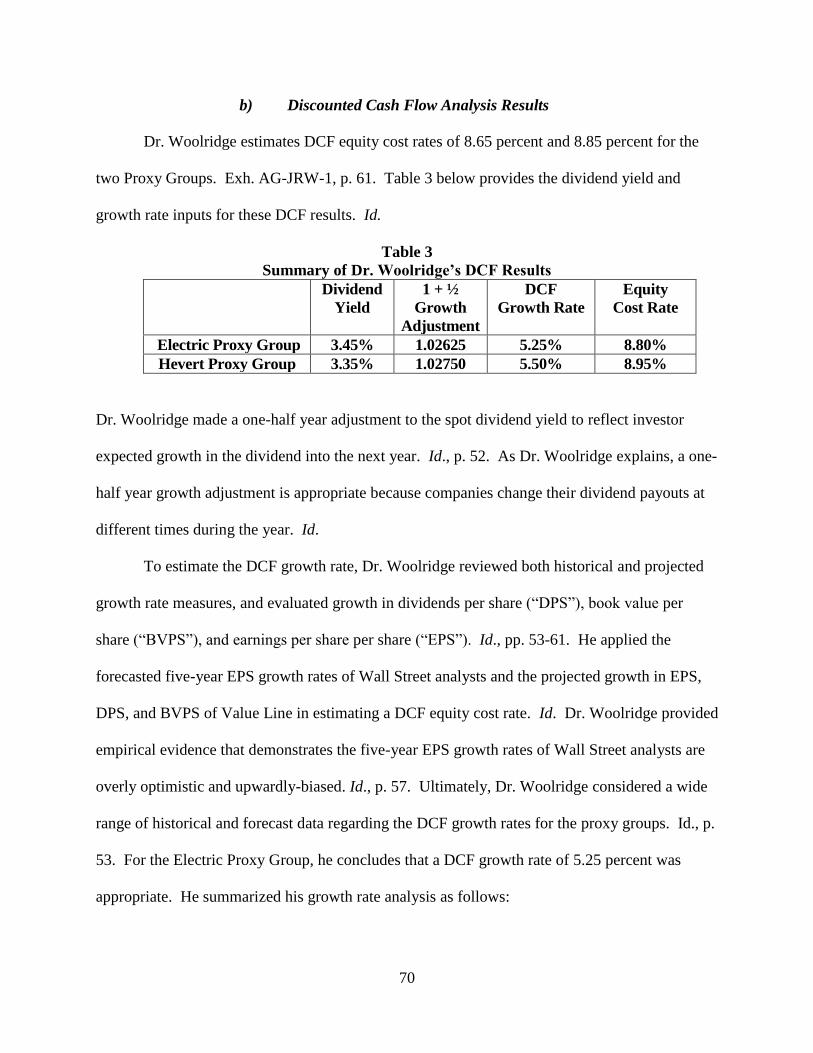
70
b) Discounted Cash Flow Analysis Results
Dr. Woolridge estimates DCF equity cost rates of 8.65 percent and 8.85 percent for the
two Proxy Groups. Exh. AG-JRW-1, p. 61. Table 3 below provides the dividend yield and
growth rate inputs for these DCF results. Id.
Table 3
Summary of Dr. Woolridge’s DCF Results
Dividend
Yield
1 + ½
Growth
Adjustment
DCF
Growth Rate
Equity
Cost Rate
Electric Proxy Group 3.45% 1.02625 5.25% 8.80%
Hevert Proxy Group 3.35% 1.02750 5.50% 8.95%
Dr. Woolridge made a one-half year adjustment to the spot dividend yield to reflect investor
expected growth in the dividend into the next year. Id., p. 52. As Dr. Woolridge explains, a one-
half year growth adjustment is appropriate because companies change their dividend payouts at
different times during the year. Id.
To estimate the DCF growth rate, Dr. Woolridge reviewed both historical and projected
growth rate measures, and evaluated growth in dividends per share (“DPS”), book value per
share (“BVPS”), and earnings per share per share (“EPS”). Id., pp. 53-61. He applied the
forecasted five-year EPS growth rates of Wall Street analysts and the projected growth in EPS,
DPS, and BVPS of Value Line in estimating a DCF equity cost rate. Id. Dr. Woolridge provided
empirical evidence that demonstrates the five-year EPS growth rates of Wall Street analysts are
overly optimistic and upwardly-biased. Id., p. 57. Ultimately, Dr. Woolridge considered a wide
range of historical and forecast data regarding the DCF growth rates for the proxy groups. Id., p.
53. For the Electric Proxy Group, he concludes that a DCF growth rate of 5.25 percent was
appropriate. He summarized his growth rate analysis as follows:
71
The historical growth rate indicators for my Electric Proxy Group
imply a baseline growth rate of 4.4%. The average of the projected
EPS, DPS, and BVPS growth rates from Value Line is 4.7%, and
Value Line’s projected sustainable growth rate is 3.8%. The
projected EPS growth rates of Wall Street analysts for the Electric
Proxy Group are 4.6% and 5.4% as measured by the mean and
median growth rates. The overall range for the projected growth
rate indicators (ignoring historical growth) is 3.8% to 5.4%. Giving
primary weight to the projected EPS growth rate of Wall Street
analysts, I believe that the appropriate projected growth rate is
5.25%. This growth rate figure is in the upper end of the range of
historic and projected growth rates for the Electric Proxy Group.
Exh. AG-JRW-1, p. 60.
Dr. Woolridge, using the same methodology as for the Electric Proxy Group, concluded
that a DCF growth rate of 4.875 percent was appropriate for the Hevert Proxy Group:
For the Hevert Proxy Group, the historical growth rate indicators
indicate a growth rate of 4.6%. The average of the projected EPS,
DPS, and BVPS growth rates from Value Line is 4.9%, and Value
Line’s projected sustainable growth rate is 3.9%. The projected EPS
growth rates of Wall Street analysts are 5.8% and 5.8% as measured
by the mean and median growth rates. The overall range for the
projected growth rate indicators is 3.9% to 5.8%. Giving primary
weight to the projected EPS growth rate of Wall Street analysts, I
believe that the appropriate projected growth rate is 5.5% for the
Hevert Group. This growth rate figure is in the upper end of the
range of historic and projected growth rates for the Hevert Proxy
Group.
Id., pp. 60-61.
Mr. Hevert developed an equity cost rate by applying the DCF model to his proxy group.
Exh. ES-RBH-1, pp. 23-37, Exh. ES-RBH-2 and ES-RBH-3. His proxy group consists of twenty
electric utility companies, the vast majority of which are also in Dr. Woolridge’s Electric Proxy
Group. Mr. Hevert used both constant-growth and multistage growth DCF models. Id. Mr. Hevert
uses three dividend yield measures (30, 90, and 180 days) in his DCF models. In his constant-
growth DCF models, Mr. Hevert relied on the forecasted EPS growth rates of Zacks, First Call,
72
and Value Line, and a retention growth rate measure. Id. Mr. Hevert’s multi-stage DCF model
uses analysts’ EPS growth rate forecasts as a short-term growth rate and a projected GDP growth
of 5.23 percent as the long-term growth rate. Id. For all three models, Mr. Hevert reports Mean
Low, Mean, and Mean High results. Dr. Woolridge summarizes Mr. Hevert’s DCF results in
Panel A of Exhibit AG-JRW-13.
Dr. Woolridge demonstrates that Mr. Hevert’s DCF equity cost rate must be rejected for
three reasons: (1) Mr. Hevert has given very little weight to his constant-growth DCF results; (2)
Mr. Hevert has relied exclusively on the overly optimistic and upwardly-biased EPS growth rate
estimates of Wall Street analysts and Value Line; and (3) Mr. Hevert’s GDP growth rate of 5.36
percent in his multi-stage DCF model is excessive, does not reflect the economic growth in the U.S.,
and is about 100 basis points above projections of GDP growth. Exh. AG-JRW-1, pp. 60-61.
Each of the flaws in Mr. Hevert’s DCF analysis is discussed below.
Little Weight Given to Constant-Growth DCF Results – Mr. Hevert gives very little
weight to his constant-growth DCF results. Id., p. 78. Dr. Woolridge has shown that the average
of Mr. Hevert’s mean constant-growth stage DCF equity cost rates are only 8.9 percent. Id. As
Dr. Woolridge states, had Mr. Hevert given these results more weight, or even any weight, he
would have arrived at a much lower equity cost rate recommendation. Id.
Sole Reliance on the Overly-Optimistic and Upwardly Biased EPS Growth Rates of Wall
Street Analysts and Value Line – Another error in Mr. Hevert’s DCF analysis is his exclusive use
of the forecasted EPS growth rates of Wall Street analysts and Value Line. Exh. AG-JRW-1, pp.
78-81. Dr. Woolridge provides ample empirical evidence that demonstrates that the five-year
earnings growth rates of Wall Street analysts and Value Line are overly optimistic and upwardly-
biased. Id., pp. 56-7.
73
On this issue, Dr. Woolridge also cites two recent studies that highlight some of the
issues with sole reliance on these forecasts: (1) a study by Lacina, Lee, and Xu (2011) has shown
that analysts’ five-year earnings growth rate forecasts are not more accurate at forecasting future
earnings than naïve random walk forecasts of future earnings;24 and (2) a study by Easton and
Sommers shows that using the five-year EPS growth rate forecasts of Wall Street analysts as a
DCF growth rate leads to an upward bias in estimates of the cost of equity capital of almost 3.0
percentage points.25 Id.
Mr. Hevert’s Long-Term GDP Growth Rate of 5.36 percent in Multi-Stage DCF Model –
Mr. Hevert’s multi-stage DCF model employs analysts’ EPS growth rate forecasts as a short-
term growth rate and a projected GDP growth of 5.36 percent as the long-term growth rate. Id.,
pp. 80-84. The 5.36 percent GDP growth rate is based on (1) a forecasted real GDP growth rate
of 3.26 percent, which he derived from the historical growth rate over the 1929-2015 period, and
(2) a forecasted inflation rate of 2.05 percent from market and investor derived forecasts. Exh.
ES-RBH-1, p. 36.
There are two major errors with Mr. Hevert’s multi-stage DCF analysis. First, he has not
provided any theoretical or empirical support for his assumption that the long-term historical GDP
growth is a reasonable proxy for the expected growth rate of the companies in his proxy group. Dr.
Woolridge provides five-year and ten-year historic measures of growth for earnings and dividends
for the proxy group companies on page 3 of his Exhibit JRW-10. These data suggest growth that is
more than 100 basis points below Mr. Hevert’s 5.36 percent GDP growth rate. Exh. AG-JRW-1, p.
81.
24
M. Lacina, B. Lee and Z. Xu, Advances in Business and Management Forecasting (Vol. 8), Kenneth D.
Lawrence, Ronald K. Klimberg (ed.), Emerald Group Publishing Limited, pp.77-101 25
Easton, P., & Sommers, G. (2007). Effect of analysts’ optimism on estimates of the expected rate of return
implied by earnings forecasts. Journal of Accounting Research, 45(5), 983–1015.
74
The second and more significant error is the magnitude of Mr. Hevert’s long-term GDP
growth rate estimate of 5.36 percent. Dr. Woolridge provides an analysis of historical and
projected GDP growth in Exhibit JRW-14, page 5. The analysis shows that historic and projected
GDP growth rate of 5.36 percent is about 100 basis points above recent trends in GDP growth and
projections of GDP growth. Exh. AG-JRW-1, pp. 81-83.
Dr. Woolridge analyzes historical GDP growth since 1960. Nominal GDP growth grew
from 6.0 percent to over 12 percent from the 1960s to the early 1980s due in large part to
inflation and higher prices. Exhibit JRW-14, p. 2. However, with the exception of a brief uptick
during the mid-2000s, nominal GDP growth rates have declined over the years and have been in
the 3.5 to 4.0 percent range over the past five years. Id. This decline is due to both lower real
GDP growth as well as lower inflation. Id., and Exh. AG-JRW-14, pp. 3-4.
The decline in nominal GDP growth is shown in Table 4, below which shows the
compounded GDP growth rates for 10-, 20-, 30-, 40- and 50- years. Id., p. 5. Whereas the 50-year
compounded GDP growth rate is 6.45 percent, there has been a monotonic and significant decline in
nominal GDP growth over subsequent 10-year intervals. Exh. AG-JRW-1, p. 82. These figures
demonstrate that nominal GDP growth in recent decades has slowed and that a figure in the range of
4.0 percent to 5.0 percent is more appropriate today for the U.S. economy.
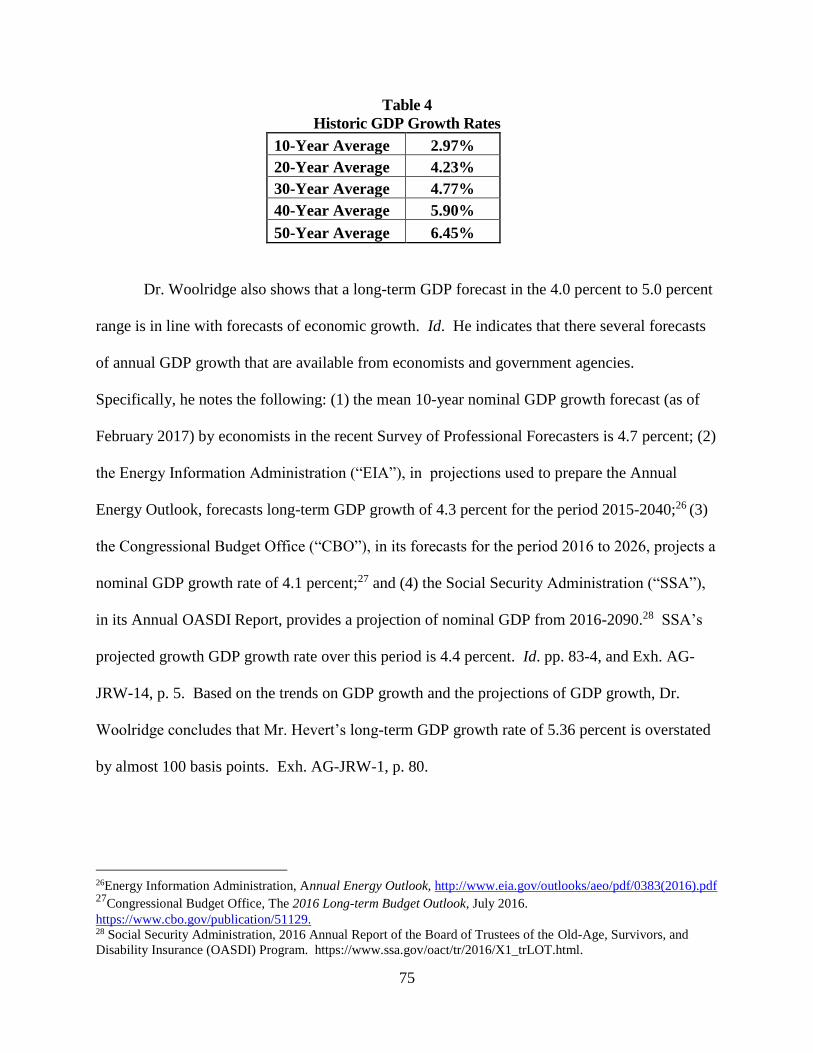
75
Table 4
Historic GDP Growth Rates
10-Year Average 2.97%
20-Year Average 4.23%
30-Year Average 4.77%
40-Year Average 5.90%
50-Year Average 6.45%
Dr. Woolridge also shows that a long-term GDP forecast in the 4.0 percent to 5.0 percent
range is in line with forecasts of economic growth. Id. He indicates that there several forecasts
of annual GDP growth that are available from economists and government agencies.
Specifically, he notes the following: (1) the mean 10-year nominal GDP growth forecast (as of
February 2017) by economists in the recent Survey of Professional Forecasters is 4.7 percent; (2)
the Energy Information Administration (“EIA”), in projections used to prepare the Annual
Energy Outlook, forecasts long-term GDP growth of 4.3 percent for the period 2015-2040;26 (3)
the Congressional Budget Office (“CBO”), in its forecasts for the period 2016 to 2026, projects a
nominal GDP growth rate of 4.1 percent;27 and (4) the Social Security Administration (“SSA”),
in its Annual OASDI Report, provides a projection of nominal GDP from 2016-2090.28 SSA’s
projected growth GDP growth rate over this period is 4.4 percent. Id. pp. 83-4, and Exh. AG-
JRW-14, p. 5. Based on the trends on GDP growth and the projections of GDP growth, Dr.
Woolridge concludes that Mr. Hevert’s long-term GDP growth rate of 5.36 percent is overstated
by almost 100 basis points. Exh. AG-JRW-1, p. 80.
26Energy Information Administration, Annual Energy Outlook, http://www.eia.gov/outlooks/aeo/pdf/0383(2016).pdf 27
Congressional Budget Office, The 2016 Long-term Budget Outlook, July 2016.
https://www.cbo.gov/publication/51129. 28 Social Security Administration, 2016 Annual Report of the Board of Trustees of the Old-Age, Survivors, and
Disability Insurance (OASDI) Program. https://www.ssa.gov/oact/tr/2016/X1_trLOT.html.

76
Finally, Dr. Woolridge concludes Mr. Hevert’s DCF approaches are inconsistent in their
use of historic and projected data. Specifically, Dr. Woolridge notes that, in developing a DCF
growth rate for his constant-growth DCF analysis, Mr. Hevert has totally ignored historical EPS,
DPS, and BVPS data, instead relying solely on the five-year EPS growth rate projections of Wall
Street analysts and Value Line. However, in developing a terminal DCF growth rate for his multi-
stage growth DCF analysis, Mr. Hevert has totally ignored the well-known long-term real GDP
growth rate forecasts of the Congressional Budget Office and the Energy Information
Administration and instead relied solely on historical data going back to 1929. Id., p. 84.
c) Capital Asset Pricing Model Analysis Results
Dr. Woolridge estimates equity cost rates of 7.90 percent for both his Proxy Group of
Electric Companies and Mr. Hevert’s Proxy Group using the CAPM. Exh. AG-JRW-1, pp. 62-
71. The CAPM requires an estimate of the risk-free interest rate, beta, and the market risk
premium. Exh. AG-JRW-1, pp. 62-63. Table 5 below provides the risk-free, interest rate, beta,
and market risk premium inputs for these CAPM results.
Table 5
Summary of Dr. Woolridge’s CAPM Results
Risk-Free
Rate
Beta Equity Risk
Premium
Equity
Cost Rate
Electric Proxy Group 4.0% 0.70 5.5% 7.9%
Hevert Proxy Group 4.0% 0.70 5.5% 7.9%
Exh. AG-JRW-1, p. 71.
The Risk-Free Rate, which is based on the yield on 30-year Treasury bonds has been in
the 2.5 percent to 4.0 percent range over the 2013-2017 period. Id., p. 63. Given the recent
range of yields, and the prospect of higher rates in the future, Dr. Woolridge chose to use 4.0
77
percent interest rate, which provides a conservatively high estimate of the risk-free rate (“Rf”)
for the CAPM. Id.
Beta (ß) is a measure of the systematic risk of a stock. Id., pp. 64-65. The market,
usually approximated by the S&P 500, has a beta of 1.0. Id. The beta of a stock with the same
price movement as the market also has a beta of 1.0. Id. A stock whose price movement is
greater than that of the market, such as a technology stock, is riskier than the market and has a
beta greater than 1.0. Id. A stock with below average price movement, such as that of a
regulated public utility, is less risky than the market and has a beta less than 1.0. Id. Estimating a
stock’s beta involves running a linear regression of an individual stock’s return on the market
return. Id.
Dr. Woolridge used the betas for the companies in the two proxy groups as provided in
the Value Line Investment Survey. Id. The median beta for the companies in Electric and Hevert
Proxy Groups are 0.70 and 0.70. Exh. AG-JRW-1, Exh. JRW-11, p. 3.
The major issue in using the CAPM is the measurement and the magnitude of the equity
risk premium. Exh. AG-JRW-1, pp. 65-71. There are typically three procedures that can be
used to estimate the market or equity risk premium–historical return analyses, surveys, and
expected return models. Id. Dr. Woolridge incorporated all three in his analysis. Id.
To estimate the equity risk premium, Dr. Woolridge initially reviewed the results of over
thirty equity risk premium studies and surveys performed over the past decade. Id., p. 66-69. These
studies are presented on page 5 of Exh. AG-JRW-1, Exh. JRW-11 and include the summary equity
risk premium results of (1) the annual study of historical risk premiums as provided by Morningstar
(formerly Ibbotson Associates); (2) ex ante equity risk premium studies commissioned by
academics and consulting firms, (3) equity risk premium surveys of CFOs, analysts, business
78
financial forecasters, as well as academics; and (4) Building Block approaches to the equity risk
premium. Id. The median equity risk premium of these studies is 4.63 percent. Id. p. 68, and Exh.
AG-JRW-1, Exh. JRW-11, p. 5.
Due to the impact of the recent financial crisis, Dr. Woolridge also observed only the results
of equity risk premium studies and surveys that were published after January 2, 2010. Id. These
results are presented on page 6 of Exhibit AG-JRW-1, Exh. JRW-11. The median for the equity
risk premium studies published in the 2010-2016 time period was 4.76 percent. Id. p. 69. Exh. AG-
JRW-1, Exh. JRW-11, p. 6. From these sources, Dr. Woolridge concludes that much of the data
indicates a market risk premium in the range of 4.0 percent to 6.0 percent, but recent studies suggest
a market risk premium in the higher end of the range. Id. Therefore, Dr. Woolridge uses 5.5
percent as the market risk premium in his CAPM. Id. An equity risk premium of 5.5 percent is
consistent with the following studies of equity risk premiums:
(1) a market risk premium of 5.6 percent discovered in a 2016 survey
of financial analysts, companies, and academics conducted by Pablo
Fernandez;
(2) a market risk premium of 4.20 percent employed by CFOs as
reported by John Graham and Campbell Harvey of Duke University
from their survey of CFOs in March, 2017;
(3) a market risk premium of 1.92 percent as forecasted by leading
economists in the Federal Reserve Bank of Philadelphia’s annual
Survey of Professional Forecasters which was published February,
2017; and
(4) a market risk premium of 5.50 percent as developed and
published by the financial advisory firm Duff & Phelps as of January
2017.
Exh. AG-JRW-1, pp. 69-71.
79
For all of the above reasons, the Department should use a market equity risk premium no
higher than 5.5 percent in any CAPM analysis that it uses to determine the cost of equity capital
for the Company. The result of Dr. Woolridge’s CAPM analyses, incorporating the components
discussed above, are cost of equity capital estimates of 7.9 percent for both the Electric and Hevert
Proxy Groups. Id. p. 83 and Exh. AG-JRW-1, Exhibit JRW-11, p. 1.
(1) Mr. Hevert’s CAPM Analysis Is Fatally Flawed
Mr. Hevert estimates an equity cost rate by applying a CAPM model to his proxy group.
Exh. ES-RBH-1, pp. 37-40 and Exh. ES-RBH-5, ES-RBH-6, and ES-RBH-7. The CAPM
approach requires an estimate of the risk-free interest rate, beta, and the equity risk premium.
Mr. Hevert uses: (a) two different measures of the Risk-Free Rate in the current yield of the 30-
year U.S. Treasury bond of 2.65 percent and a near-term projected yield of 3.15 percent; (b) two
different betas (an average Bloomberg Beta of 0.603 and an average Value Line Beta of 0.7); and
(c) two market risk premium measures - a Bloomberg, DCF-derived market risk premium of
10.19 percent and Value Line derived market risk premium of 11.21 percent. Id. Based on these
inputs, Mr. Hevert finds a CAPM equity cost rate range from 8.90 percent to 11.21 percent. Id,
p. 40.
(2) Mr. Hevert’s Market Risk Premium Is Grossly Over-
Inflated
Dr. Woolridge indicates that the primary error with Mr. Hevert’s CAPM analyses are his
market risk premiums of 10.19 percent and 11.21 percent. Exh. AG-JRW-1, pp. 86-88. He
indicates that Mr. Hevert develops an expected market risk premium by: (1) applying the DCF
model to the S&P 500 to get an expected market return; and (2) subtracting the risk-free rate of
interest. Id. Mr. Hevert’s expected EPS growth rates are the five-year expected EPS growth rates

80
from Wall Street analysts as provided by Bloomberg (11.04 percent) and Value Line (12.00
percent). Exh. AG-JRW-1, p. 77. These growth rates produce estimated market returns of 12.94
percent from Bloomberg and 13.96 percent from Value Line. Id.
As set forth above, the EPS growth rate forecasts of Wall Street securities analysts are
overly optimistic and upwardly biased. Exh. AG-JRW-1, pp. 88-89. Furthermore, as Dr.
Woolridge indicates, Mr. Hevert’s long-term EPS growth rates of 11.04 percent and 12.00
percent are not consistent with historic or projected economic and earnings growth in the U.S.
Id. He notes that: (1) long-term growth in EPS is far below Mr. Hevert’s projected EPS growth
rates; (2) more recent trends in GDP growth, as well as projections of GDP growth, suggest
slower long-term economic and earnings growth in the future; and (3) over time, EPS growth
tends to lag behind GDP growth. Id.
Dr. Woolridge performs a study of the long-term economic, earnings, and dividend
growth rates in the U.S. He evaluates the growth in nominal GDP, S&P 500 stock price
appreciation, and S&P 500 EPS and DPS growth since 1960. The results are provided on page 1
of Exh. AG-JRW-1, Exh. JRW-14, and a summary is given in Table 6. Id.
Table 6
GDP, S&P 500 Stock Price, EPS, and DPS Growth
1960-Present
Nominal GDP 6.51%
S&P 500 Stock Price 6.74%
S&P 500 EPS 6.56%
S&P 500 DPS 5.74%
Average 6.39%
These results show that the historical long-term growth rates for GDP, S&P EPS, and S&P DPS
are in the 5.0 to 7.0 percent range. These results also demonstrate the close relationship between
GDP and EPS growth. Exh. AG-JRW-1, p. 89.
81
However, the more recent trends suggest lower future economic growth than the long-term
historic GDP growth. The historic GDP growth rates for 10-, 20-, 30-, 40- and 50- years, which
were presented in Table 4, above, show that nominal GDP growth in recent decades has slowed and
that a figure in the range of 4.0 to 5.0 percent is more appropriate today for the U.S. economy. Exh.
AG-JRW-1, pp. 89-90. In addition, Dr. Woolridge testified that the projected long-term GDP
growth rate forecasts by economists and government agencies is in the 4.0 to 5.0 percent range. Id.
Long-term GDP growth is critical on this issue, according to Dr. Woolridge, because
prospective economic growth is the key driver of long-term earnings growth. A study by Brad
Cornell of the California Institute of Technology on GDP growth, earnings growth, and equity
returns finds that long-term EPS growth in the U.S. is directly related to GDP growth, with GDP
growth providing an upward limit on EPS growth. Cornell concludes with the following
observations:
The long-run performance of equity investments is fundamentally
linked to growth in earnings. Earnings growth, in turn, depends on
growth in real GDP. This article demonstrates that both theoretical
research and empirical research in development economics suggest
relatively strict limits on future growth. In particular, real GDP
growth in excess of 3 % in the long run is highly unlikely in the
developed world. In light of ongoing dilution in earnings per share,
this finding implies that investors should anticipate real returns on
U.S. common stocks to Average no more than about 4–5 % in real
terms.
Exh. AG-JRW-1, pp. 90-91.
In summary, Dr. Woolridge highlights three facts regarding Mr. Hevert’s CAPM market
risk premium; (1) long-term earnings growth is directly tied to long-term GDP growth; (2) the
trend in GDP growth, and the projections of nominal long-term GDP growth both point to long-
term GDP growth of 4.0 to 5.0 percent; and (3) issues (1) and (2) demonstrate that Mr. Hevert’s
long-term EPS growth rates of 11.04 percent and 12.00 percent are highly overstated. Id.
82
Therefore, the Department should reject Mr. Hevert’s projected earnings growth rates, implied
expected stock market returns, and equity risk premiums, since they are not indicative of the
realities of the U.S. economy and stock market. Id., p. 91.
Dr. Woolridge concludes his discussion on Mr. Hevert’s excessive equity risk premium with
the following:
Mr. Hevert’s market risk premiums derived from his DCF
application to the S&P 500 are inflated due to errors and bias in his
study. Investment banks, consulting firms, and CFOs use the equity
risk premium concept every day in making financing, investment,
and valuation decisions. On this issue, the opinions of CFOs and
financial forecasters are especially relevant. CFOs deal with capital
markets on an ongoing basis since they must continually assess and
evaluate capital costs for their companies. They are well aware of
the historical stock and bond return studies of Ibbotson. The CFOs
in the March 2017 CFO Magazine – Duke University Survey of
about 300 CFOs shows an expected return on the S&P 500 of 6.60%
over the next ten years. In addition, the financial forecasters in the
February 2017 Federal Reserve Bank of Philadelphia survey expect
an annual nominal market return of 5.60% over the next ten years.
As such, with a more realistic equity or market risk premium, the
appropriate equity cost rate for a public utility should be in the 8.0%
to 9.0% range and not in the 10.0% to 11.0% range.
Exh. AG-JRW-1, p. 92.
For all of the reasons discussed above, the Department should reject Mr. Hevert’s equity
risk premium analysis and his associated CAPM findings and recommendations.
d) The Department Should Reject Mr. Hevert’s Bond Yield Risk
Premium Approach
Mr. Hevert also employs a utility Bond Yield Risk Premium (“BYRP”) approach to
estimate the cost of common equity. Mr. Hevert develops this cost rate by: (1) regressing the
authorized returns on common equity for electric distribution companies on the thirty-year U.S.
Treasury Yield for the period beginning January 1, 1980 and ending November 2016; and (2)
adding the risk premium established in step (1) to three different thirty-year U.S. Treasury yields: a
83
current yield of 2.75 percent; a near-term projected yield of 3.13 percent; and a long-term projected
yield of 4.35 percent. Exh. ES-RBH-1, pp. 40-44, Exhibit ES-RBH-8. Mr. Hevert reports risk
premium equity cost rates ranging from 10.01 to 10.34 percent. Id.
Dr. Woolridge demonstrates that the projected long-term base yield and risk premium
that Mr. Hevert derived in his BYRP analyses are overstated. Dr. Woolridge initially criticizes
Mr. Hevert’s use of a long-term projected Treasury bond yield of 4.35 percent which Dr.
Woolridge indicates that, at 100 basis points above current yields, is not reasonable. Exh. AG-
JRW-1, p. 93. For this reason alone, the Department should reject Mr. Hevert’s BYRP analysis
and recommendation. However, there are many problems with the assumptions underlying Mr.
Hevert’s conclusion and his measurement of the risk premium itself.
There are three primary errors with Mr. Hevert’s BYRP risk premium. First, as Dr.
Woolridge testified, Mr. Hevert’s methodology produces an inflated measure of the risk premium
because that approach uses historic authorized ROEs and Treasury yields, and the resulting risk
premium is applied to projected Treasury Yields. Id, pp. 93-94. As Dr. Woolridge explains, since
Treasury yields are always forecasted to increase, the resulting risk premium would be smaller, if
Mr. Hevert had used projected Treasury yields to estimate the risk premium and not historical
Treasury yields. The net result if Mr. Hevert’s analysis is an overstatement of the risk premium.
Id. Second, Dr. Woolridge suggests that the overall approach is misguided:
In addition, Mr. Hevert’s RP approach is a gauge of commission
behavior and not investor behavior. Capital costs are determined in
the market place through the financial decisions of investors and are
reflected in such fundamental factors as dividend yields, expected
growth rates, interest rates, and investors’ assessment of the risk and
expected return of different investments. Regulatory commissions
evaluate capital market data in setting authorized ROEs, but also
take into account other utility- and rate case-specific information in
setting ROEs. As such, Mr. Hevert’s approach and results reflect
other factors such as capital structure, credit ratings and other risk
84
measures, service territory, capital expenditures, energy supply
issues, rate design, investment and expense trackers, and other
factors used by utility commissions in determining an appropriate
ROE in addition to capital costs. This may especially true when the
authorized ROE data includes the results of rate cases that are settled
and not fully litigated.
Exh. AG-JRW-1, p. 94.
Third, the errors of Mr. Hevert’s approach are exemplified by his risk premium results
relative to the actual authorized ROEs for electric companies. While Mr. Hevert’s BYRP equity
cost rate estimates range from 10.05 to 10.59 percent, the average authorized ROEs for electric
utilities have declined from 10.01 percent in 2012, to 9.8 percent in 2013, to 9.76 percent in
2014, 9.58 percent in 2015, and to 9.60 percent in 2016 according to Regulatory Research
Associates. Exh. AG-JRW-1, p. 14. Therefore, for no other reason, the Department should
reject Mr. Hevert’s BYRP analysis, since his results are clearly overstated when compared to the
actual level of state authorized returns. Id.
The Department should reject Mr. Hevert’s BYRP cost of equity analysis, since it has many
flaws that cause his recommendation to be overstated.
4. OTHER COST OF EQUITY ISSUES
a) Capital Market Conditions
Mr. Hevert bases his equity cost rate analysis and ROE recommendation on the premise
that interest rates and capital costs are increasing. Exhibit ES-RBH-1, pp. 55-70. He
specifically notes: “It also is clear that investor expectations, as measured by forward Treasury
yields and the implied probability of Federal Funds rate increases, suggest rising capital costs in
the near term.” Id., p. 67.
Dr. Woolridge comes to a much different conclusion on interest rates and capital costs.
Dr. Woolridge highlights that interest rates and capital costs remain at historically low levels and

85
are likely to remain so for some time. Exh. AG-JRW-1, pp. 21-32. He specifically notes the
fundamental factors that drive interest rates, capital costs, and GDP growth remain at low levels.
Id.
To support his contention that high interest rates are imminent, Mr. Hevert cites the Federal
Reserve’s moves to increase the federal fund rate as well as forecasts of higher interest rates. Exh.
ES-RBH-1, pp. 56-57. Dr. Woolridge demonstrates that Mr. Hevert thesis of higher interest rates
and capital cost is wrong on all counts. Id., pp. 24-26. First, as with the end of the Fed’s
Quantitative Easing III (“QEIII”) program and with increases in the Federal Funds rate, there
have been forecasts of higher long-term interest rates. Id. However, actual interest rates have
gone down and not up. Id. With respect to economists’ forecasts of higher future interest rates,
Dr. Woolridge shows that these economists have consistently forecast higher interest rates over
the past decade, and they consistently have been wrong. On this issue, Dr. Woolridge highlights
four recent studies:
(1) After the announcement of the end of QEIII program in 2014, all the economists in
Bloomberg’s interest rate survey forecasted interest rates would increase in 2014, and
100 percent of the economists were wrong;
(2) Bloomberg reported that the Federal Reserve Bank of New York has gone as far as
stopping use of interest rate estimates of professional forecasters in its interest rate
model;
(3) A study entitled “How Interest Rates Keep Making People on Wall Street Look Like
Fools,” which evaluated economists’ forecasts for the yield on ten-year Treasury bonds at
the beginning of the year for the last ten years. The results demonstrated that economists
consistently predict that interest rates will go higher, and interest rates have not fulfilled
the predictions; and
(4) A study that tracked economists’ forecasts for the yield on ten-year Treasury bonds on
an ongoing basis from 2010 until 2015. The results of this study, which was entitled
“Interest Rate Forecasters Are Shockingly Wrong Almost All of the Time,” demonstrate
that economists continually forecast that interest rates are going up, and they do not.
Exh. AG-JRW-1, pp. 22-23.
86
The bottom line is that Mr. Hevert’s ROE analyses and recommendation are based on the
premise of anticipated higher interest rates and capital costs. As demonstrated over the past
decade, the forecasts of higher interest rates and capital costs have proven wrong as slow
economic growth and low inflation have kept interest rates and capital costs low at historical low
levers. The Department should ignore these consistently incorrect interest rate forecasts and the
over-inflated ROE recommendations Mr. Hevert makes based on them.
b) Rate Making Mechanisms
Mr. Hevert discusses the Company’s proposed rate mechanisms and their impact on the risk
of the Company relative to the proxy group. Exh. ES-RBH-1, pp. 44-49 and Exh. ES-RBH-10.
The Company proposes a revenue decoupling mechanism (“RDM”) along with a performance-
based rate mechanism, (the “PBRM”). In Exh. ES-RBH-10, Mr. Hevert shows the rate making
mechanisms reported by the utilities in his proxy group in their SEC 10-K reports. He makes the
following assessment of the results:
I have addressed the question of the extent to which revenue
stabilization mechanisms are in place at comparable companies in
Exhibit ES-RBH-10. There, I note that all of the 20 proxy companies
have such mechanisms in place in at least one jurisdiction. Because
revenue stabilization mechanisms are so common among electric
distribution utilities, there is no reason to believe that the Company
is less risky than its peers. I therefore do not believe it would be
appropriate to reduce the Company’s ROE in connection with its
rate mechanisms, including its proposed decoupling mechanism.
Id., p. 48.
He concludes that, since his proxy group companies have rate making some mechanisms in place,
the risk of those companies is on par with the Company and, therefore, there is no reason to adjust
his ROE recommendation.
87
Dr. Woolridge strongly disagrees with this assessment of the impact of the rate making
mechanisms on the riskiness of the NSTAR and WMECo for several reasons. Exh. AG-JRW-1,
pp. 95-97. First, Dr. Woolridge highlights that the companies in the proxy groups do not receive
100 percent of their revenues from regulated operations. Exh. JRW-4. Therefore, not all the
proxy company revenues are covered by rate mechanisms. Id. p. 96.
Second, Dr. Woolridge notes that even the regulated utility revenues are not all covered
by rate mechanisms, because the rate making mechanisms in place at his proxy companies vary
widely and not all of the regulated operating subsidiary utility companies have rate mechanisms.
This is acknowledged by Mr. Hevert in his testimony:
Nearly all of the proxy companies’ operating subsidiaries recover
fuel, as well as energy efficiency costs through a cost recovery
mechanism; and 14 of the 20 proxy companies have mechanisms in
place to recover costs of renewable energy projects, such as the
Commonwealth’s Renewable Portfolio Standard (“RPS”). As to
decoupling mechanisms, ten of the 20 proxy companies have either
full or partial decoupling mechanisms in place in at least one
operating subsidiary.
Exh. ES-RBH-1, p. 47.
Finally, and most significantly, Dr. Woolridge highlights that the lack of application of
the proxy company’s revenues to rate making mechanisms contrasts to the percent of revenues
covered as proposed by the Companies. Specifically, Dr. Woolridge notes that a total of 97
percent of NSTAR’s distribution revenues and 95 percent of WMECo’s distribution revenues
will be affected by the Company’s proposed Revenue Decoupling Mechanism. Exh. AG-14-9.
In addition, in response to Exh. AG-14-10, Mr. Hevert indicated that he had not conducted a
study to determine the percent of proxy company’s revenues that are impacted by rate
mechanisms. Exh. AG-14-10. Furthermore, the Company acknowledged that, to its knowledge,
“. . . no other utility company in the U.S. has a revenue decoupling mechanism (“RDM”) in
88
place along with a performance-based rate mechanism (“PBRM”), similar to the Company's
proposal.” Exh. AG-14-9. Ultimately, as Dr. Woolridge testified, the Company will be less
risky, since the Company’s proposed RDM and PDRM impact at least 95 percent of its revenues,
while there is some unknown percent of the Hevert Proxy Group revenues that are impacted by
similar rate mechanisms.
Finally, Dr. Woolridge also testified that credit ratings can be used as a measure of
investment risk. Exh. AG-JRW-1, p. 97. The S&P and Moody’s issuer credit ratings for
NSTAR and WMECo, A and A2, respectively, are two notches above the averages for the
Electric and Hevert Proxy Group of BBB+ and Baa1. Id. Therefore, Dr. Woolridge concludes
that NSTAR and WMECo are less risky than either of the proxy groups and that the Commission
should take that fact into consideration in its ROE analysis and find a lower allowed return for
the Company as compared to the proxy groups. Id.
5. THE ATTORNEY GENERAL’S POSITION ON MASSACHUSETTS
ROES
Recently the AGO asked the Department to investigate “ . . . ways to increase
transparency, efficiency, and public awareness and confidence” in the process for setting the
authorized ROEs for electric and gas companies in the Commonwealth.29 In its request, the
AGO noted that authorized ROEs in the U.S. have declined and cited five reasons given in recent
rate cases for the downward trend in authorized ROEs:
1. The utility industry has been, and remains at the lowest level of risk for equity
investment;
2. Capital costs for utilities, as indicated by long-term bond yields and interest rates
29 Letter from Massachusetts Attorney General Maura Healey, RE: Request of the Office of Attorney General, Office
of Ratepayer Advocacy for Investigation into Ways to Increase Transparency, Efficiency and Customer Awareness
Regarding the Level of Profits Earned by Massachusetts Electric and Gas Distribution Companies, December 19,
2016.
89
have been and remain at historically low levels;
3. Although economic conditions have recovered significantly over the past five
years from the Great Recession, the annual growth of the United States economy
remains tepid at 2.00 to 2.50 percent;
4. The forecast for growth in the United States and world economies is expected to
remain low compared to historical averages; and
5. Revenue decoupling and cost reconciling rate adjustment mechanisms have
greatly reduced investment risk in utilities.
In his direct testimony, Mr. Hevert provided a response to the claims of the AG. Exh. ES-RBH-
1, pp, 9-16. Dr. Woolridge addressed the testimony of Mr. Hevert on these issues. Exh. AG-
JRW-1, pp. 8-17.
Issue 1. The utility industry has been and remains at the lowest level of risk for equity
investment. On this issue, Mr. Hevert acknowledged that utilities may be less risky than non-
regulated companies and he notes that, by one investment risk measure, beta, utilities are less
risky than other industries. To assess the relative riskiness of utilities to other industries as
measured by beta, Dr. Woolridge conducted a study of the betas of ninety-seven different
industries as published by Value Line in Exh. AG-JRW-1, Exh. JRW-8. The betas for natural
gas utilities, water utilities, and electric utilities are 0.76, 0.73, and 0.69.30 Id. These are the
lowest betas of the ninety-seven industries covered by Value Line. Id., p. 9, Exh. AG-JRW-1,
Exh. JRW-8.
Dr. Woolridge also demonstrates that the trend in credit-rating upgrades and downgrades
indicates that the investment risk of utility companies is declining. Exh. AG-JRW-1, pp, 9-10.
He notes that in January of 2014, Moody’s upgraded nearly 100 electric and gas companies due
to the lower investment risk of the energy business. Id. He also showed that the overall
30 The market average beta is 1.0, and so a beta less than 1.0 indicates low risk relative to the market. Exh. AG-
JRW-1, p. 9, n.
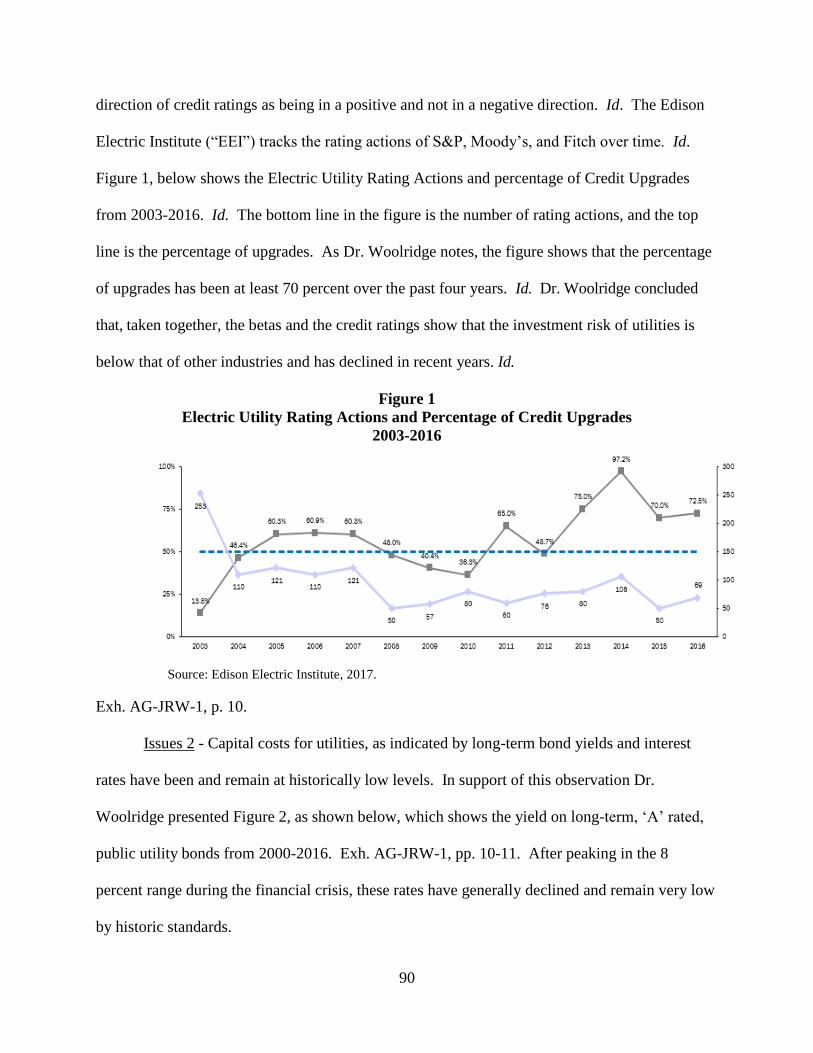
90
direction of credit ratings as being in a positive and not in a negative direction. Id. The Edison
Electric Institute (“EEI”) tracks the rating actions of S&P, Moody’s, and Fitch over time. Id.
Figure 1, below shows the Electric Utility Rating Actions and percentage of Credit Upgrades
from 2003-2016. Id. The bottom line in the figure is the number of rating actions, and the top
line is the percentage of upgrades. As Dr. Woolridge notes, the figure shows that the percentage
of upgrades has been at least 70 percent over the past four years. Id. Dr. Woolridge concluded
that, taken together, the betas and the credit ratings show that the investment risk of utilities is
below that of other industries and has declined in recent years. Id.
Figure 1
Electric Utility Rating Actions and Percentage of Credit Upgrades
2003-2016
Source: Edison Electric Institute, 2017.
Exh. AG-JRW-1, p. 10.
Issues 2 - Capital costs for utilities, as indicated by long-term bond yields and interest
rates have been and remain at historically low levels. In support of this observation Dr.
Woolridge presented Figure 2, as shown below, which shows the yield on long-term, ‘A’ rated,
public utility bonds from 2000-2016. Exh. AG-JRW-1, pp. 10-11. After peaking in the 8
percent range during the financial crisis, these rates have generally declined and remain very low
by historic standards.
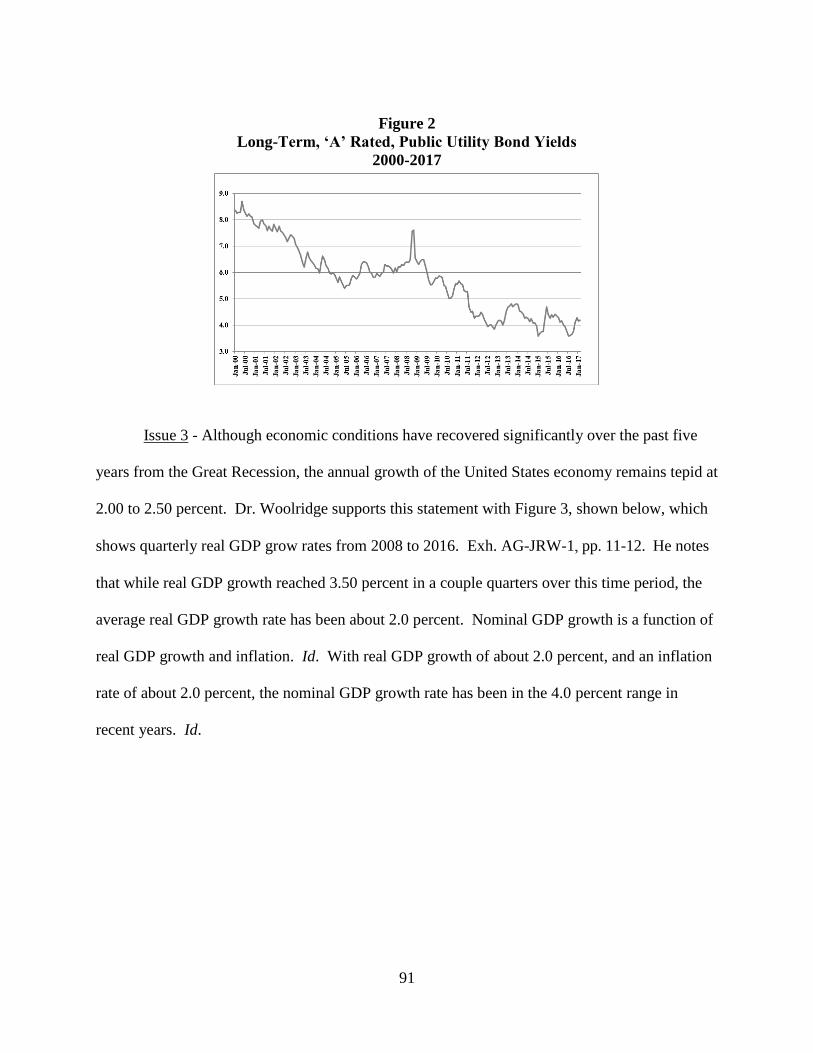
91
Figure 2
Long-Term, ‘A’ Rated, Public Utility Bond Yields
2000-2017
Issue 3 - Although economic conditions have recovered significantly over the past five
years from the Great Recession, the annual growth of the United States economy remains tepid at
2.00 to 2.50 percent. Dr. Woolridge supports this statement with Figure 3, shown below, which
shows quarterly real GDP grow rates from 2008 to 2016. Exh. AG-JRW-1, pp. 11-12. He notes
that while real GDP growth reached 3.50 percent in a couple quarters over this time period, the
average real GDP growth rate has been about 2.0 percent. Nominal GDP growth is a function of
real GDP growth and inflation. Id. With real GDP growth of about 2.0 percent, and an inflation
rate of about 2.0 percent, the nominal GDP growth rate has been in the 4.0 percent range in
recent years. Id.
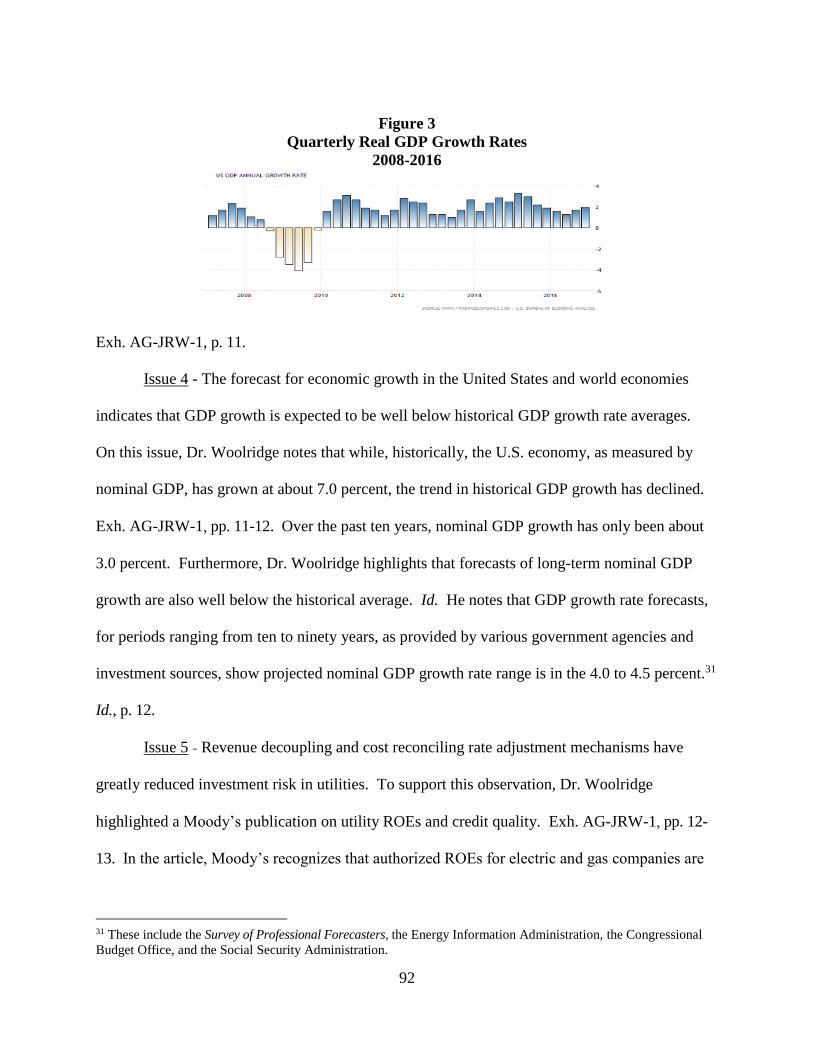
92
Figure 3
Quarterly Real GDP Growth Rates
2008-2016
Exh. AG-JRW-1, p. 11.
Issue 4 - The forecast for economic growth in the United States and world economies
indicates that GDP growth is expected to be well below historical GDP growth rate averages.
On this issue, Dr. Woolridge notes that while, historically, the U.S. economy, as measured by
nominal GDP, has grown at about 7.0 percent, the trend in historical GDP growth has declined.
Exh. AG-JRW-1, pp. 11-12. Over the past ten years, nominal GDP growth has only been about
3.0 percent. Furthermore, Dr. Woolridge highlights that forecasts of long-term nominal GDP
growth are also well below the historical average. Id. He notes that GDP growth rate forecasts,
for periods ranging from ten to ninety years, as provided by various government agencies and
investment sources, show projected nominal GDP growth rate range is in the 4.0 to 4.5 percent.31
Id., p. 12.
Issue 5 - Revenue decoupling and cost reconciling rate adjustment mechanisms have
greatly reduced investment risk in utilities. To support this observation, Dr. Woolridge
highlighted a Moody’s publication on utility ROEs and credit quality. Exh. AG-JRW-1, pp. 12-
13. In the article, Moody’s recognizes that authorized ROEs for electric and gas companies are
31 These include the Survey of Professional Forecasters, the Energy Information Administration, the Congressional
Budget Office, and the Social Security Administration.
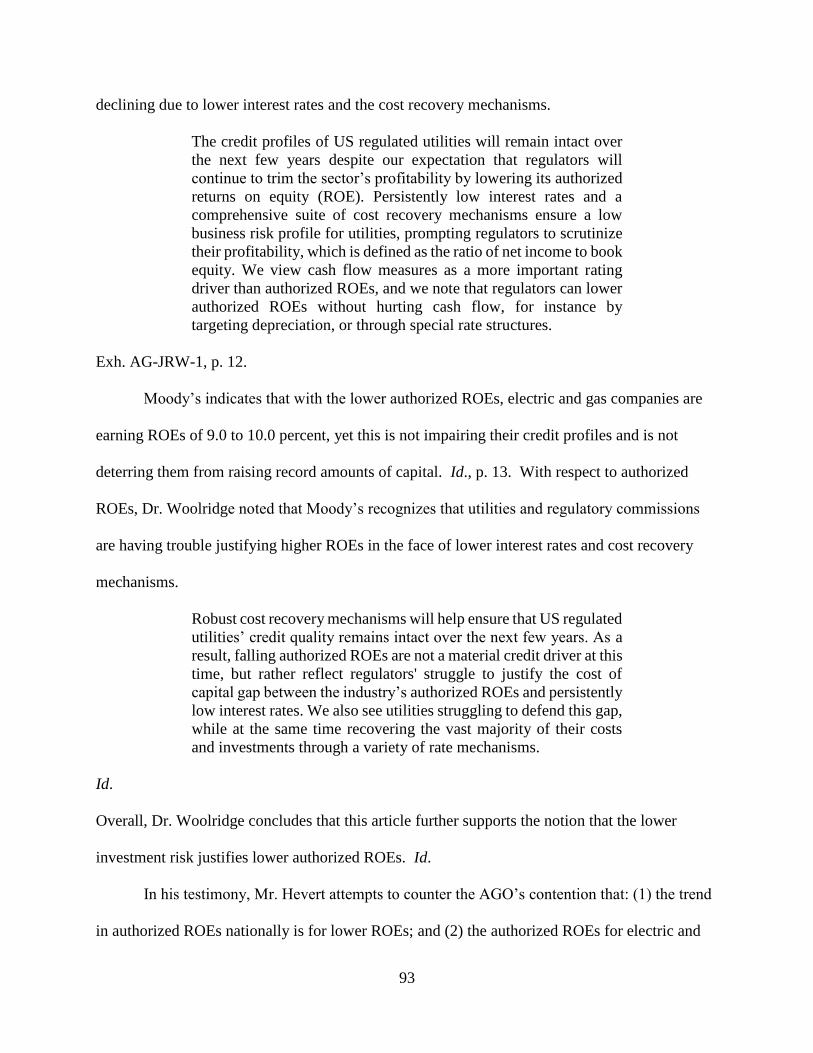
93
declining due to lower interest rates and the cost recovery mechanisms.
The credit profiles of US regulated utilities will remain intact over
the next few years despite our expectation that regulators will
continue to trim the sector’s profitability by lowering its authorized
returns on equity (ROE). Persistently low interest rates and a
comprehensive suite of cost recovery mechanisms ensure a low
business risk profile for utilities, prompting regulators to scrutinize
their profitability, which is defined as the ratio of net income to book
equity. We view cash flow measures as a more important rating
driver than authorized ROEs, and we note that regulators can lower
authorized ROEs without hurting cash flow, for instance by
targeting depreciation, or through special rate structures.
Exh. AG-JRW-1, p. 12.
Moody’s indicates that with the lower authorized ROEs, electric and gas companies are
earning ROEs of 9.0 to 10.0 percent, yet this is not impairing their credit profiles and is not
deterring them from raising record amounts of capital. Id., p. 13. With respect to authorized
ROEs, Dr. Woolridge noted that Moody’s recognizes that utilities and regulatory commissions
are having trouble justifying higher ROEs in the face of lower interest rates and cost recovery
mechanisms.
Robust cost recovery mechanisms will help ensure that US regulated
utilities’ credit quality remains intact over the next few years. As a
result, falling authorized ROEs are not a material credit driver at this
time, but rather reflect regulators' struggle to justify the cost of
capital gap between the industry’s authorized ROEs and persistently
low interest rates. We also see utilities struggling to defend this gap,
while at the same time recovering the vast majority of their costs
and investments through a variety of rate mechanisms.
Id.
Overall, Dr. Woolridge concludes that this article further supports the notion that the lower
investment risk justifies lower authorized ROEs. Id.
In his testimony, Mr. Hevert attempts to counter the AGO’s contention that: (1) the trend
in authorized ROEs nationally is for lower ROEs; and (2) the authorized ROEs for electric and
94
gas utility companies in Massachusetts are out-of-line with other states. Exh. ES-RBH-1, pp. 10-
11.
On the first issue, Mr. Hevert presents a scatter gram of authorized ROEs for electric and
gas companies over the 2010-2016 period. Exhibit-ES-RBH-1, p. 11. He suggests that there is
“no discernable trend” in the authorized ROEs and that the average authorized ROE for electric
and gas companies is about 10.0 percent. Id.
Dr. Woolridge highlights several issues with Mr. Hevert’s analysis and conclusions. Exh.
AG-JRW-1, pp. 13-14. First, Dr. Woolridge demonstrates that even using Mr. Hervert’s chart,
there is, in fact, a slight downward trend in authorized ROEs. Id. Second, Dr. Woolridge notes
that Mr. Hevert’s ROE results include the authorized ROEs from Virginia which include a
generation rider of up to 200 basis points. Id. He notes that these are the highest ROEs and are
in the 11.0 to 12.0 percent range, skewing the overall results. Id. Finally, Dr. Woolridge
graphed the quarterly authorized ROEs for electric and gas companies from 2000 to 2016. Id.
This is provided in Figure 4, below. As he notes, there is clearly a downward trend in the data.
Id.
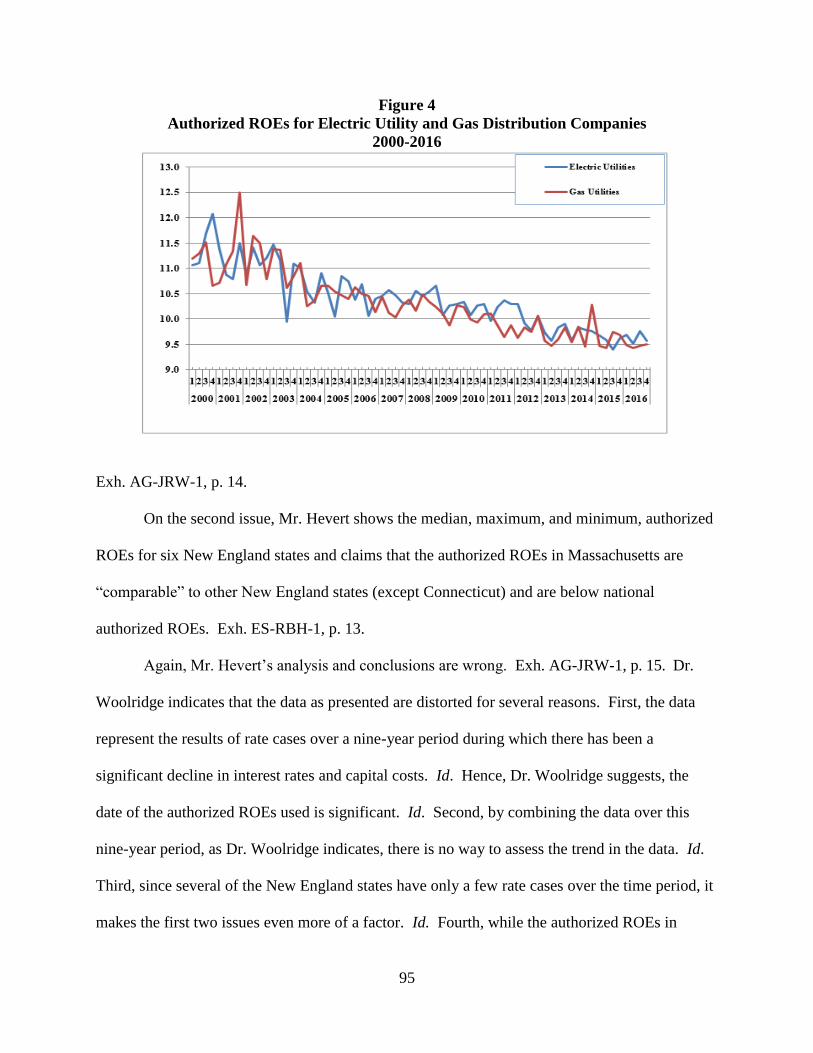
95
Figure 4
Authorized ROEs for Electric Utility and Gas Distribution Companies
2000-2016
Exh. AG-JRW-1, p. 14.
On the second issue, Mr. Hevert shows the median, maximum, and minimum, authorized
ROEs for six New England states and claims that the authorized ROEs in Massachusetts are
“comparable” to other New England states (except Connecticut) and are below national
authorized ROEs. Exh. ES-RBH-1, p. 13.
Again, Mr. Hevert’s analysis and conclusions are wrong. Exh. AG-JRW-1, p. 15. Dr.
Woolridge indicates that the data as presented are distorted for several reasons. First, the data
represent the results of rate cases over a nine-year period during which there has been a
significant decline in interest rates and capital costs. Id. Hence, Dr. Woolridge suggests, the
date of the authorized ROEs used is significant. Id. Second, by combining the data over this
nine-year period, as Dr. Woolridge indicates, there is no way to assess the trend in the data. Id.
Third, since several of the New England states have only a few rate cases over the time period, it
makes the first two issues even more of a factor. Id. Fourth, while the authorized ROEs in
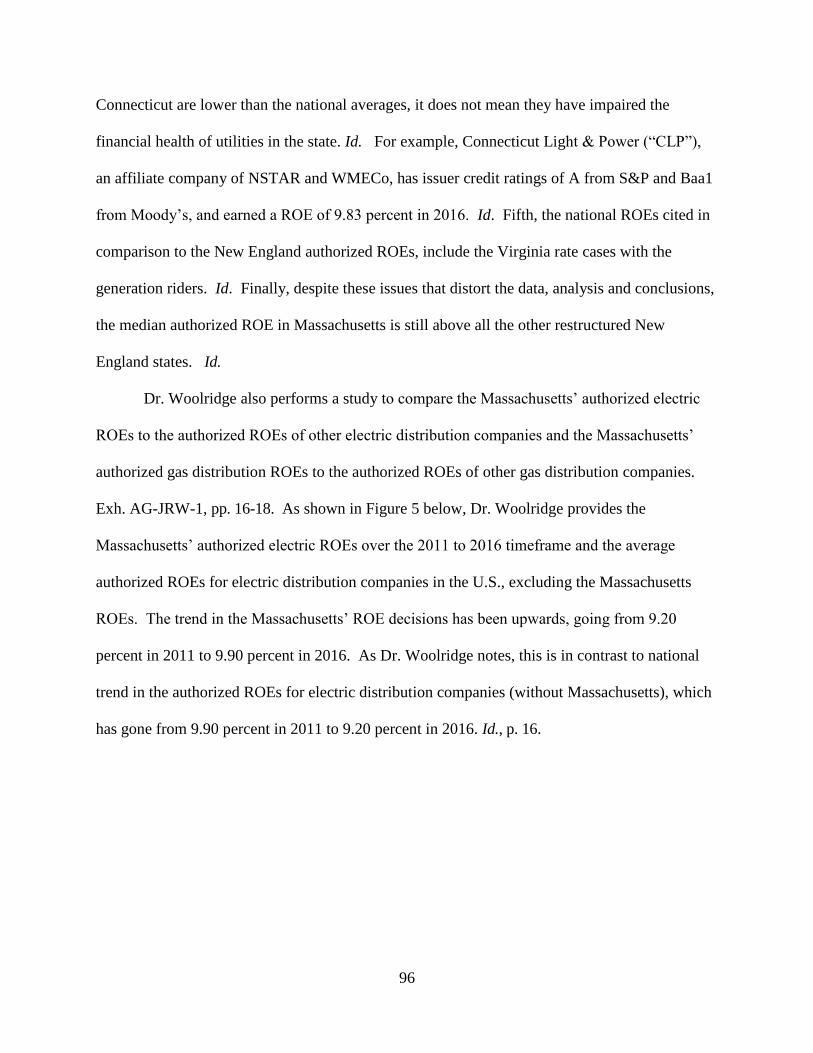
96
Connecticut are lower than the national averages, it does not mean they have impaired the
financial health of utilities in the state. Id. For example, Connecticut Light & Power (“CLP”),
an affiliate company of NSTAR and WMECo, has issuer credit ratings of A from S&P and Baa1
from Moody’s, and earned a ROE of 9.83 percent in 2016. Id. Fifth, the national ROEs cited in
comparison to the New England authorized ROEs, include the Virginia rate cases with the
generation riders. Id. Finally, despite these issues that distort the data, analysis and conclusions,
the median authorized ROE in Massachusetts is still above all the other restructured New
England states. Id.
Dr. Woolridge also performs a study to compare the Massachusetts’ authorized electric
ROEs to the authorized ROEs of other electric distribution companies and the Massachusetts’
authorized gas distribution ROEs to the authorized ROEs of other gas distribution companies.
Exh. AG-JRW-1, pp. 16-18. As shown in Figure 5 below, Dr. Woolridge provides the
Massachusetts’ authorized electric ROEs over the 2011 to 2016 timeframe and the average
authorized ROEs for electric distribution companies in the U.S., excluding the Massachusetts
ROEs. The trend in the Massachusetts’ ROE decisions has been upwards, going from 9.20
percent in 2011 to 9.90 percent in 2016. As Dr. Woolridge notes, this is in contrast to national
trend in the authorized ROEs for electric distribution companies (without Massachusetts), which
has gone from 9.90 percent in 2011 to 9.20 percent in 2016. Id., p. 16.

97
Figure 5
Authorized ROEs for Massachusetts Electric Utilities
and Average Annual U.S. Electric Distribution Companies
(Excluding Massachusetts)
2011-2016
Below, Figure 6 shows Dr. Woolridge’s analysis of Massachusetts’ authorized gas
case ROEs over the 2011 to 2016 period and the average authorized ROEs for gas
distribution companies in the U.S., excluding the Massachusetts’ ROEs. Exh. AG-JRW-
1, p.17. As in the case with the electric utility ROEs, the trend in the Massachusetts’
ROE decisions has been upwards, going from 9.20 percent in 2011 to 9.80 percent in
2016. This is in contrast to national trend in the authorized ROEs for gas distribution
companies, which has gone from 10.0 percent in 2011 to 9.50 percent in 2016. Id., pp. 17-
18.
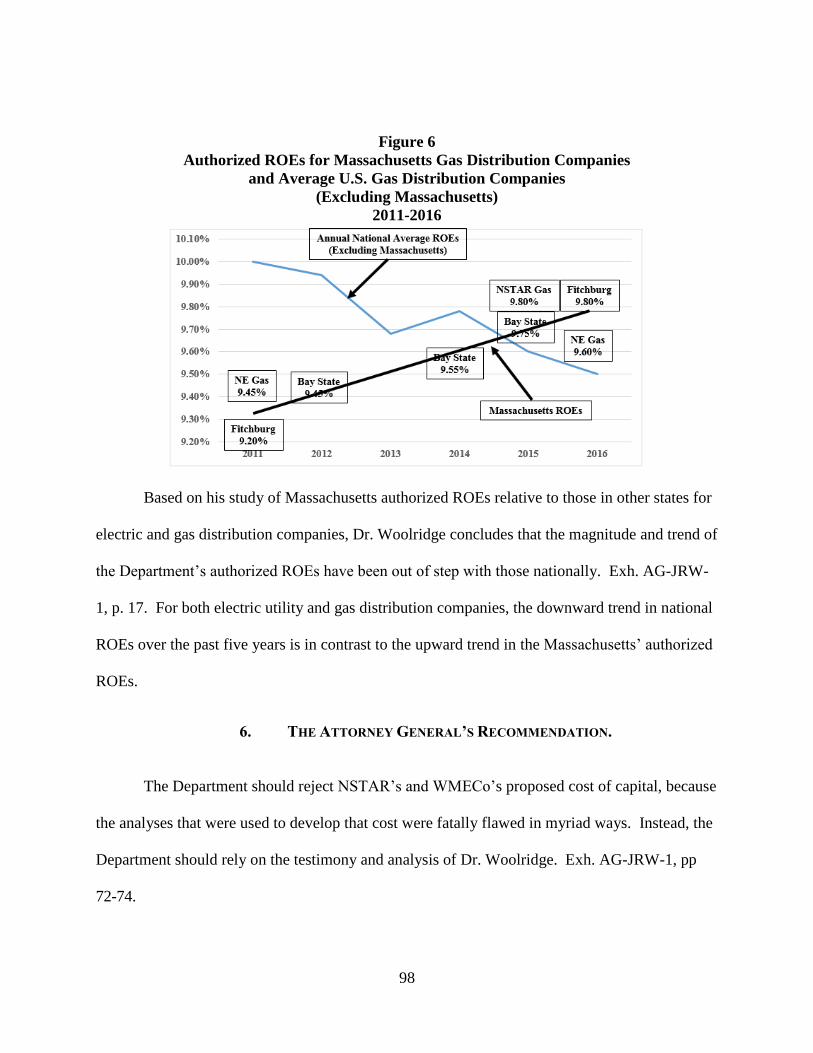
98
Figure 6
Authorized ROEs for Massachusetts Gas Distribution Companies
and Average U.S. Gas Distribution Companies
(Excluding Massachusetts)
2011-2016
Based on his study of Massachusetts authorized ROEs relative to those in other states for
electric and gas distribution companies, Dr. Woolridge concludes that the magnitude and trend of
the Department’s authorized ROEs have been out of step with those nationally. Exh. AG-JRW-
1, p. 17. For both electric utility and gas distribution companies, the downward trend in national
ROEs over the past five years is in contrast to the upward trend in the Massachusetts’ authorized
ROEs.
6. THE ATTORNEY GENERAL’S RECOMMENDATION.
The Department should reject NSTAR’s and WMECo’s proposed cost of capital, because
the analyses that were used to develop that cost were fatally flawed in myriad ways. Instead, the
Department should rely on the testimony and analysis of Dr. Woolridge. Exh. AG-JRW-1, pp
72-74.
99
First, NSTAR and WMECO have higher common equity ratios and, therefore, lower
financial risk than the capital structures of either of the two proxy groups;
Second, as shown in Exh. AG-JRW-1, Exh. JRW-2 and Exh. AG-JRW-1, Exh. JRW-3,
capital costs for utilities, as indicated by long-term bond yields, are still at historically low levels.
In addition, given low inflationary expectations and slow global economic growth, interest rates
are likely to remain at low levels for some time.
Third, as shown in Exh. AG-JRW-1, Exhibit JRW-8, the electric utility industry is among
the lowest risk industries in the U.S. as measured by beta. As such, the cost of equity capital for
this industry is amongst the lowest in the U.S., according to the CAPM.
Fourth, the investment risk of NSTAR and WMECo, as indicated by their S&P and
Moody’s issuer credit ratings is below the investment risk of the two proxy groups. Id. The
S&P and Moody’s issuer credit ratings for NSTAR and WMECo are A and A2, respectively,
while the averages for the Electric and Hevert Proxy Groups are BBB+ and Baa1. This means
that NSTAR and WMECo’s S&P and Moody’s issuer credit ratings are two notches above the
averages of the proxy groups (S&P: A vs. BBB+ - Moody’s: A2 vs. Baa1). This indicates that
the investment risk of NSTAR and WMECo is below that of the electric utilities in the proxy
groups;
Fifth, the average authorized ROEs for electric utilities have declined from 10.01 percent
in 2012, to 9.8 percent in 2013, to 9.76 percent in 2014, to 9.58 percent in 2015, and 9.60 percent
in 2016, according to Regulatory Research Associates. Id., p. 14. The average authorized ROE
for Massachusetts electric distribution companies were below those of the national averages of
all electric utilities five years ago, but are now well above those averages.
100
Dr. Woolridge makes three observations on these authorized ROEs. Exh. AG-JRW-1, p
74. First, he believes that these authorized ROEs have lagged behind capital market cost rates, or
in other words, authorized ROEs have been slow to reflect low capital market cost rates. Id.
Second, Dr. Woolridge indicates that this has been especially true in recent years as some state
commissions have been reluctant to authorize ROEs below 10 percent. Id. Third, Dr. Woolridge
states that the trend has been towards lower ROEs, and the norm now is below ten percent. Id.
Accordingly, Dr. Woolridge believes that his recommended ROE reflects present historically
low capital cost rates, which have been recognized by state utility commissions and reflected in
the ROEs set by them. Id.
In addition, Dr. Woolridge emphasizes that his recommendation, while low by historic
standards, does indeed meet Hope and Bluefield standards:
As previously noted, according to the Hope and Bluefield decisions,
returns on capital should be: (1) comparable to returns investors
expect to earn on other investments of similar risk; (2) sufficient to
assure confidence in the company’s financial integrity; and (3)
adequate to maintain and support the company’s credit and to attract
capital. The S&P and Moody’s issuer credit ratings for NSTAR
Electric and WMECo are A and A2, which is above those of the
Electric and Hevert Proxy Groups. And while my recommendation
is below the average authorized ROEs for electric utility companies,
it reflects the downward trend in authorized and earned ROEs of
electric utility companies. As is highlighted in the previously-cited
Moody’s publication cited above that states, despite authorized and
earned ROEs below 10%, the credit quality of electric and gas
companies has not been impaired but, in fact, has improved and
utilities are raising about $50 billion per year in capital. Major
positive factors in the improved credit quality of utilities are
regulatory ratemaking mechanisms. Therefore, I do believe that my
ROE recommendation meets the criteria established in the Hope and
Bluefield decisions.
Exh. AG-JRW-1, pp. 74-75.
101
Therefore, the Department should make the proposed adjustments to NSTAR’s and
WMECo’s capital structures and calculation of the embedded costs of debt as described above.
Furthermore, for both companies, the Department should authorize an allowed return on common
equity no higher than 8.875%.
C. RATE BASE
1. THE COMPANY OVER-INFLATES ITS COST OF SERVICE
The Department’s review of the Company’s proposed PBR Rate Plan and Grid
Modernization Investments are important elements of the Company’s Petition. However, one
must not lose sight of the proposed cost of service which has many troubling components that the
Department should reject. Eversource over-inflates its cost of distribution service by: (1)
including deferred expenses from previous years as additions to the test year cost of service; (2)
going on a spending spree during the test year; and (3) improperly including post-test year
adjustments to its test year costs. By doing so, the Company presents a pro forma cost of service
that is unrepresentative of, and greatly exceeds, the Company’s normal costs. These accounting
schemes, the overspending, and the grandiose spending proposals, collectively, create a revenue
deficiency, when, in fact, the Company is comfortably earning much more than its required cost
of capital.
First, the Company’s test year includes costs that the Company inappropriately deferred
from previous years. These costs include:
Deferral of Tree Trimming and Tree Removal Expenses $49 million
Deferral of the Income Tax Deduction of Property Tax $11 million
Deferral of 2016 Property Taxes $2 million.
All of these costs should have been recognized by the Companies in previous years.

102
Second, the Company went on a spending spree during the test year. The Company spent
on average, $265 million on capital additions in the three years leading up to the test year (i.e.
2012-2014). In the test year, however, the Company spent more than $400 million on capital
additions. Exh. AG-1-17, Atts AG-17 (a)-(b).
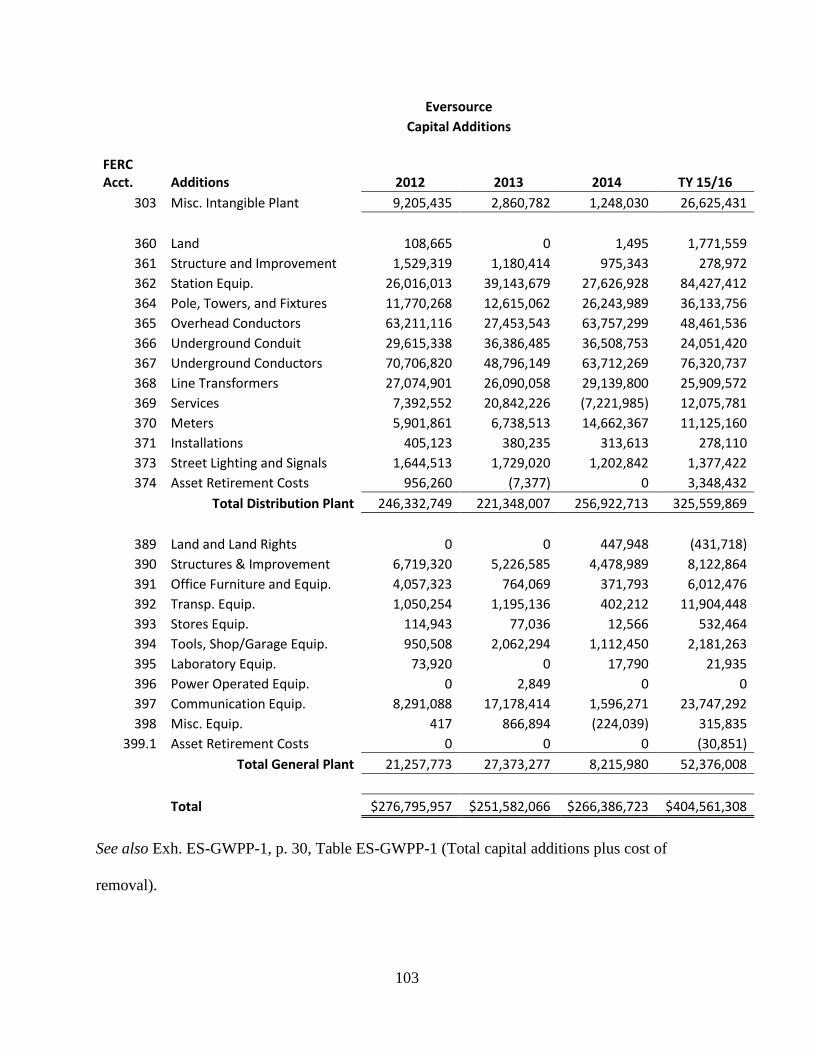
103
Eversource
Capital Additions
FERC Acct. Additions 2012 2013 2014 TY 15/16
303 Misc. Intangible Plant 9,205,435 2,860,782 1,248,030 26,625,431
360 Land 108,665 0 1,495 1,771,559
361 Structure and Improvement 1,529,319 1,180,414 975,343 278,972
362 Station Equip. 26,016,013 39,143,679 27,626,928 84,427,412
364 Pole, Towers, and Fixtures 11,770,268 12,615,062 26,243,989 36,133,756
365 Overhead Conductors 63,211,116 27,453,543 63,757,299 48,461,536
366 Underground Conduit 29,615,338 36,386,485 36,508,753 24,051,420
367 Underground Conductors 70,706,820 48,796,149 63,712,269 76,320,737
368 Line Transformers 27,074,901 26,090,058 29,139,800 25,909,572
369 Services 7,392,552 20,842,226 (7,221,985) 12,075,781
370 Meters 5,901,861 6,738,513 14,662,367 11,125,160
371 Installations 405,123 380,235 313,613 278,110
373 Street Lighting and Signals 1,644,513 1,729,020 1,202,842 1,377,422
374 Asset Retirement Costs 956,260 (7,377) 0 3,348,432
Total Distribution Plant 246,332,749 221,348,007 256,922,713 325,559,869
389 Land and Land Rights 0 0 447,948 (431,718)
390 Structures & Improvement 6,719,320 5,226,585 4,478,989 8,122,864
391 Office Furniture and Equip. 4,057,323 764,069 371,793 6,012,476
392 Transp. Equip. 1,050,254 1,195,136 402,212 11,904,448
393 Stores Equip. 114,943 77,036 12,566 532,464
394 Tools, Shop/Garage Equip. 950,508 2,062,294 1,112,450 2,181,263
395 Laboratory Equip. 73,920 0 17,790 21,935
396 Power Operated Equip. 0 2,849 0 0
397 Communication Equip. 8,291,088 17,178,414 1,596,271 23,747,292
398 Misc. Equip. 417 866,894 (224,039) 315,835
399.1 Asset Retirement Costs 0 0 0 (30,851)
Total General Plant 21,257,773 27,373,277 8,215,980 52,376,008
Total $276,795,957 $251,582,066 $266,386,723 $404,561,308
See also Exh. ES-GWPP-1, p. 30, Table ES-GWPP-1 (Total capital additions plus cost of
removal).
104
Similarly, the corporate service company that charges its costs to all of Eversource’s
operating companies, NUSCO Service Company and now Eversource Service Company
(“ESC”), followed suit and increased capital spending by 100 percent during the test year from
$50 million to $100 million. See Exh. AG-1-2, part 5, (Compare the FERC Forms 60, p. 103 for
the years 2012 through 2016).
Third, the Company shreds any notion of a historical test year and the use of a year-end
rate base by proposing more than $100 million of post-test year capital additions. The in-service
dates for these projects are after the test year, and, in some cases, not until two and a half years
after the end of the test year. See the Sections for Post-Test Year Additions to Rate Base, the
GIS Verification, and the Supply Chain discussion, below.
Finally, the Company proposes the addition of millions of dollars in new costs associated
with questionable new programs, including the more than $130 million Vegetation Management
RTW pilot program and the $30 million “Fee Free” Credit/Debit Card Payment Program.
As is its practice, the Department should carefully review and consider the necessity of
each of the costs that go into the Company’s pro forma revenue requirement. As will be
discussed further below, many of the costs proposed by the Company are inappropriate or
unnecessary and wasteful.
2. THE COMPANY’S PROPOSAL TO ADJUST ITS RATE BASE FOR
POST-TEST YEAR PLANT ADDITIONS SHOULD BE REJECTED
The Company proposes to include certain post-test year plant additions in the test year
end rate base used to develop the return requirement component of its total revenue requirement.
The Company refers to these adjustments as “pro forma adjustments made to the per-books
balances to develop the requested post-test year (“PTY”) rate base amounts.” Exh. ES-DPH-1,
p. 178. There are three separate post-test year plant additions for NSTAR: (1) $32.9 million
105
related to the Electric Avenue substation; (2) $29.9 million related to the New Bedford Area
Work Center; and (3) $42.7 million related to the Seafood Way substation. Exh. ES-DPH-3
(East), WP DPH-28, May 25, 2017 Update. The effect of these additions on the NSTAR rate
base is offset by an increase of $16.8 million to the balance of accumulated deferred income
taxes (“ADIT”) associated with these plant additions. Exh. ES-DPH-2 (East), Sch. DPH-30,
May 25, 2017 Update. The Company also includes the depreciation expense associated with
these post-test year plant additions in the NSTAR cost of service.
There is one post-test year plant addition for WMECo: $3.8 million related to the
Montague substation rebuild project, including a corresponding retirement of $0.3 million, and
cost of removal of $0.2 million. Exh. ES-DPH-3 (West), WP DPH-28-29, May 25, 2017 Update.
The effect of this addition on the WMECo rate base is offset by an increase of $0.7 million to the
balance of ADIT associated with this plant addition. Exh. ES-DPH-2 (West), Sch. DPH-30, May
25, 2017 Update. Again, the Company also includes the depreciation expense associated with
this post-test year plant addition in the WMECo cost of service.
The Department does not recognize post-test year additions, unless the utility
demonstrates that the addition or retirement represents a significant investment which has a
substantial effect on its rate base. Boston Gas Company, D.P.U. 96-50-C, pp. 16-18, 20-21
(1997); Boston Gas Company, D.P.U. 96-50, pp. 15-16 (1996). It is the size of the addition in
relation to rate base, and not the particular nature of the addition, which determines whether or
not inclusion as a post-test year addition is warranted. Western Massachusetts Electric
Company, D.P.U. 1300, pp. 14-15 (1983).
The Department should reject these post-test year additions to rate base. As AGO
witness Effron testified:
106
The Company is proposing to make selective adjustments to the
NSTAR Electric and WMECO test year rate bases that have the
effect of increasing the calculated revenue deficiency while ignoring
other post-test year changes that will have the opposite effect. The
purpose of the test year is to achieve a balance among rate base,
expenses, and sales in the determination of the revenue deficiency
and revenue requirement. By choosing to update only selected
elements of the actual test year costs and revenues, the Company’s
proposal upsets that balance and distorts the determination of the
Company’s revenue requirements.
For example, as the post-test year plant goes into service in 2016
and 2017, the reserve for accumulated depreciation for both NSTAR
Electric and WMECO will also be growing. However, the Company
does not take any account of post-test year growth in the reserve for
accumulated depreciation, which is deducted from plant in service
and will offset the growth in rate base from additions to plant in
service taking place after the end of the test year.
In addition, as described in Exhibit ES-LML-1, NSTAR Electric’s
Electric Avenue substation project ($31.8 million) is being
“installed to support increased load requirements for portions of the
City of Boston neighborhoods of Brighton, Allston, Longwood
Avenue Medical and the Town of Watertown” (Exhibit ES-LML-1,
p. 43). Yet, the Company makes no adjustment to test year sales to
recognize any load growth that this substation is being installed to
support.
Similarly, NSTAR Electric’s Seafood Way substation project ($44.5
million) is described as “a major new substation to serve the Seaport
area in Boston,” an area that “has experienced enormous load
growth in recent years” (Exhibit ES-LML-1, p. 44). Again,
Company makes no adjustment to test year sales to recognize the
“enormous load growth” in the area that this substation is being
installed to serve.
Exh. AG-DJE-1, pp. 12-13.
On cross examination, Mr. Horton acknowledged that the Company made no adjustment
to growth in the depreciation reserves that would take place after the end of the test year as the
post-test year plant additions take place. Tr. Vol. XIII, pp. 2767-2768. In addition, certain other
inconsistencies were noted. For example, the Electric Avenue substation project described at

107
Exh. ES-DPH-1, p. 178 (see also Exh. ES-LML-1, pp. 43-44) includes inventory items totaling
approximately $10 million delivered from the warehouse in Avon, Massachusetts to the job site
at Station 315 Electric Ave., Boston in August 2015. Tr. Vol. XIII, pp. 2668-2770; Exh. AG-19-
1. No adjustment was made to annualize the effect of this transfer on the balance of materials
and supplies included in the NSTAR rate base. Tr. Vol. XIII, pp. 2668-2770. Thus, there is a
partial double counting of the $10 million transferred from the materials and supplies inventory
to the Electric Ave. substation in the pro forma rate base proposed by NSTAR.
Further, these post-test year projects are not of such a magnitude that they individually
distort the test year relationships between plant in service and the other elements of the
Company’s revenue requirements as they go into service. The Electric Avenue substation
represents only 0.61percent of the actual NSTAR test year plant in service. Tr. Vol. XIII, pp.
2771-2772. The New Bedford Area Work Center represents only 0.46percent of the actual
NSTAR test year plant in service. Tr. Vol. XIII, p. 2772. And, the Seafood Way substation
represents only 0.86percent of the actual NSTAR test year plant in service. Id. Finally, the
Montague Substation project represents only 0.61percent of the actual WMECo test year plant in
service. Tr. Vol. XIII, p. 2773.
The Company has not established that departure from the Department’s test year
practices, to accommodate the proposed pro forma adjustment for post-test year plant additions,
is appropriate. As the Department found in D.P.U. 13-75:
The ratemaking process is intended to develop a representative level
of revenue requirement to be collected from customers and, absent
exigent circumstances, it is not intended to track and recover costs
on a dollar for dollar basis. D.P.U. 10-70, at 174; D.P.U. 07-50-A at
51. The normal ebb and flow of customers, plant investment, and
expenses make it impossible to capture every element of cost and
revenue that could in theory be included in rates. For example, post-
test year customer growth and post-test year plant additions are not
108
normally included in rates, unless they represent a significant
increase to year-end revenues or rate base. D.P.U. 10-70, at 174;
D.T.E. 96-50-C at 15-17; D.P.U. 85-270, at 141 n.21 (1986); Bay
State Gas Company, D.P.U. 1122, at 46-49 (1982).
Bay State Gas Company, D.P.U. 13-75, pp. 106-107 (2014).
The Department should reject the Company’s proposal to adjust the test year rate base for
post-test year plant additions. The individual projects are clearly not significant enough to meet
the Department’s standards for pro forma adjustments for post-test year plant additions. The size
of the additions in relation to rate base are not significant. Further, the proposed adjustments are
internally inconsistent. They take no account for other post-test year changes to rate base, such
as growth in the balance of depreciation that will be taking place as the plant additions go into
service. In addition, the Company makes no adjustments to test year sales to recognize load
growth although certain of the proposed plant additions are clearly described as being related to
load growth.
The post-test year plant additions and related expenses should be eliminated from the
Company’s revenue requirement. The elimination of the NSTAR adjustments for post-test year
plant additions reduces the NSTAR rate base by $88,718,397, and the NSTAR pro forma test
year depreciation expense by $1,919,677. The elimination of the WMECo adjustments for post-
test year plant additions reduces the WMECo rate base by $3,294,282, and the WMECo pro
forma test year depreciation expense by $96,992.
109
D. OPERATIONS AND MAINTENANCE EXPENSES
1. THE PRO FORMA TEST YEAR WMECO PAYROLL EXPENSE
SHOULD NOT BE ANNUALIZED TO REFLECT THE EMPLOYEE
COMPLEMENT AS OF THE END OF THE TEST YEAR
WMECo’s pro forma adjustment to test year wages and salaries expense is shown on
Exh. ES-DPH-2(West), Sch. DPH-13, p. 2. The schedule includes a “pro forma” adjustment of
$173,600. This “pro forma” adjustment annualizes the effect of new union hires during the test
year. Exh. ES-DPH-1, p. 65, lines 10-12. On cross examination, Mr. Horton acknowledged that
this adjustment of $173,600 equates to approximately 0.75 percent of WMECo’s test year
distribution payroll of $22,999,430. Tr. Vol. XIII, p. 2779.
There will always be some turnover of employees over time as new employees are hired
and others leave. As of June 2016 (the end of the test year), the total WMECo employee
complement was 298. Id. As of December 2016, the number of WMECo employees was down
to 288. Tr. Vol. XIII, p. 2784.
The adjustment proposed by WMECo does not reflect a change in the number of
employees that is outside the normal “ebb and flow” in the number of employees. The Department
should reject this pro forma adjustment and reduce the WMECo pro forma operation and
maintenance expense by $173,600.
2. TEST YEAR INSURANCE POLICY SURPLUS PAYMENTS ARE
RECURRING AND SHOULD NOT BE REMOVED FROM THE TEST YEAR
During the test year, Eversource Energy received $456,242 from Energy Insurance
Mutual (“EIM”) for its portion of a distribution of Policyholders’ Surplus to member companies.
These proceeds reduced the test year insurance expense by $158,407 for NSTAR and $22,675
for WMECo. Exh. AG-19-13, Att. AG-19-13(o). The Company increased test year insurance
expense by $158,407 for NSTAR and $22,675 for WMECo, contending that the amounts are for
110
“non-recurring distribution of insurance policy surplus received in the test year.” Exh. ES-DPH-
1, p. 42, lines 8-9 and p. 45, lines 14-15.
As discussed by AGO witness Ramas, the receipt of insurance surplus proceeds from
EIM are not non-recurring events. Ms. Ramas testified as follows:
The support provided by the Company for its normalization
adjustment in Attachment AG-19-13(o) indicates that EIM is two
years into a three-year strategic plan and during that time, EIM’s
surplus grew from $890 million to $972 million. In February 2016,
a $20 million distribution of Policyholders’ Surplus was declared.
The letter from EIM dated March 21, 2016 also indicates that the
distributions are “…intended to reflect long-term profitability and
growth resulting from the collaborative support of Member
Companies and risk managers, along with the Insurance Advisory
Committee and EIM Board of Directors.” The Company has not
demonstrated that the distribution of insurance policy reserve
surplus, which offsets the insurance costs, is a non-recurring event,
particularly since the March 21, 2016 letter from EIM indicates that
a substantial surplus still exists.
Exh. AG-DR-1, p. 12.
Attachments F and G to the response to Exh. AG 1-61 demonstrate that EIM consistently
provided both NSTAR and WMECo with policy surplus distributions in each of the last four
years, spanning 2013 through 2016.
Energy Insurance Mutual Distributions
NSTAR WMECO
2013 $ 113,553 $ 19,449
2014 131,340 21,413
2015 157,269 22,512
2016 158,407 22,675
When questioned by the Department, Company witness Horton concurred that
reimbursements from EIM were received in each year 2013 through 2016 and that “[c]learly

111
there’s a history of policyholder distributions, but there’s no guarantee of such distributions.”
Tr. Vol. V, pp. 1031-1032. Although Mr. Horton indicates that the distributions are not
guaranteed, such distributions have occurred for four consecutive years. Additionally, the
insurer—EIM—had a substantial policyholder surplus as of March 2016, and the surplus grew
from $890 million to $972 million. Exh. AG 19-13, Att. AG-19-13(o). Given the receipt of
policy surplus distributions offsetting insurance expense for four consecutive years, coupled with
a sizable policyholder surplus still existing, the surplus payments received during the test year
should remain in the test year, reducing the Company’s adjusted test year expenses by $158,407
and $22,675 for NSTAR and WMECo, respectively.
3. OVERHEAD COSTS CHARGED BY ESC DURING THE TEST YEAR
SHOULD BE REDUCED TO REFLECT THE RETURN ON EQUITY APPROVED
BY THE DEPARTMENT IN THIS PROCEEDING
Eversource Energy Service Company (“ESC”) charges for general service company
overhead (abbreviated as “GSCOH”) are applied with the ESC labor costs to the FERC accounts
in which the labor costs are charged to the operating companies. This overhead includes ESC
payroll taxes, insurance, employee benefits, depreciation of service company assets, rent, and a
return on equity on service company assets. The total amount of ESC overhead costs charged to
operation and maintenance expense accounts during the test year was $32,133,446 for NSTAR
and $6,653,794 for WMECo. Exh. AG 1-25, Atts. AG-1-25(a) and (b) and Exh. AG-DR-1, p. 4.
The response to Exh. AG 1-25 identifies $1,988,563 charged to NSTAR and $414,549 charged
to WMECo operation and maintenance expense accounts during the test year for the “[e]quity
rate of return component of total Service Co. Overhead.” These amounts remain in the
Company’s adjusted test year. The equity return that the Companies’ ratepayers pay on ESC
assets should be limited to the equity return found to be fair and reasonable by the Commission
112
in this case. Exh. AG-DR-1, p. 5. Based on the 8.875% return on equity recommended by the
AGO in this case, the ESC overhead costs included in the test year O&M expenses should be
reduced by $307,754 for NSTAR and $31,307 for WMECo. Exh. AG-DR-1, p. 5 (the
calculation of which is provided in Exh. AG-DR-2, Sch. 2.) It would not be fair or reasonable to
require ratepayers to effectively pay a return on equity to the service company that is greater than
the return on equity found to be just and reasonable by the Department in this case. The
Company did not rebut the AGO’s recommendation that the ESC overhead costs be reduced to
reflect the AGO’s recommended ROE, nor did it rebut the calculation of the adjustment
presented by the AGO. If the Department ultimately approves a return on equity that differs
from the 8.875% rate supported by the AGO in this case, the information presented on Exh. AG-
DR-2, Sch. 2 can be used to calculate the appropriate adjustment to reflect the impacts of the
return ultimately adopted by the Department.
4. THE TEST YEAR CHARGES FROM EVERSOURCE SERVICE
COMPANY SHOULD BE REDUCED FOR THE IMPACTS OF THE
ACQUISITION OF THE AQUARION WATER COMPANIES
On June 2, 2017, less than a week before the start of the evidentiary hearings in this case,
Eversource Energy filed a Form 8-K with the Securities & Exchange Commission (“SEC”)
announcing its acquisition of Macquarie Utilities, Inc. for a total equity purchase price of
approximately $880 million in cash and $795 million of assumed debt. See Exh. AG-1, p. 2
(Eversource Energy, SEC 8-k, dated June 2, 2017). The parties executed the purchase and sales
agreement on or about June 1, 2017. Id.
On June 29, 2017, Eversource Energy and Macquarie Utilities, Inc. filed with the
Department a Joint Petition for a change in control associated with the Aquarion Water Company
of Massachusetts (the “Acquisition Petition”). The Department docketed that case as D.P.U. 17-

113
115 and the case is set for hearing. In its Petition, the Company requests that the Department
approve its acquisition on or before November 1, 2017. See Acquisition Petition, p. 9 citing
Plymouth Water Company, D.P.U. 13-130, p. 1 (2014). Eversource Energy expects all
regulatory approvals by that date so that the closing can be consummated by December 31, 2017,
prior to the date that base rates from this case take effect. Exh. AG-1, p. 2.
The acquisition of Macquarie Utilities Inc. will result in Eversource Energy owning
Aquarion Water Company of Massachusetts, Aquarion Water Company of New Hampshire and
Aquarion Water Company of Connecticut (collectively referred to as “Aquarion” hereafter). Tr.
Vol. I, pp. 52-53 and Exh. AG-1. Aquarion has more than 300 employees and serves nearly
230,000 customers. Exh. AG-1.
The mergers and acquisitions of utility companies typically result in significant cost
savings for the post-merger and post-acquisition companies. For example, the merger between
Northeast Utilities and NSTAR resulted in significant cost savings. Company witness Horton
testified that the 2016 Merger Report shows that the cumulative net savings projection over a 10-
year period is currently estimated at $1,032.4 million, and that NSTAR and WMECo’s share of
those savings is $274 million and $46 million, respectively, over the 10-year period 2012
through 2022. He also testifies that the cumulative savings achieved through December 31, 2015
(approximately 3.5 years’ post-merger) is approximately $69 million for NSTAR and $11
million for WMECo. Exh. ES-DPH-1, pp. 154-55 and Exh. ES-DPH-4, Sch. DPH-10, pp. 9, 55.
Mr. Horton also testified that a significant portion of the merger savings resulted from merging
the service company functions and resulted in a net reduction in the allocation of service
company costs to each of the Eversource operating companies. Tr. Vol. IX, pp. 1887-1888.
114
The Boston Edison Company / Commonwealth Energy merger and acquisition achieved
similar synergy savings. Joint Petition of Boston Edison Company, Cambridge Electric Light
Company, Commonwealth Electric Company and Commonwealth Gas Company for approval by
the Department of Telecommunication and Energy pursuant to G.L. c. 164, §94 of a Rate Plan,
pp. 68-73 (1999). The Northeast Utilities / Yankee Gas merger also resulted in significant cost
savings as a result of synergies. See Joint Application of Northeast Utilities and Yankee Energy
Systems, Inc. for Approval of a Change of Control, Connecticut Department of Public Utility
Control, Docket No. 99-08-02, December 29, 1999. Similarly, merger related savings were
achieved in Northeast Utilities acquisition of Public Service Company of New Hampshire. The
acquisition of Aquarion should result in consolidation of functions between Eversource and
Aquarion, and the allocation of Eversource Energy Service Company costs to the new operating
entities at Aquarion, thereby reducing the costs to be allocated to NSTAR and WMECo post-
acquisition.
Simply incorporating the Aquarion water companies into the ESC allocation factors will
result in reductions in cost allocations to NSTAR and WMECo of approximately $6.3 million
and $1.0 million, respectively, without consideration of cost savings from functional
consolidations between the entities post-merger. The Company provided a side-by-side
comparison of the allocations factors and percentages used by ESC in charging costs to NSTAR
and WMECo for 2015 through 2017. Exh. AG-26-23. The attachment to Exh. AG-26-23 lists
numerous allocation factors used by ESC. One of those factors—specifically, Allocation Code
C05—is based on (1) Gross Plant Assets, (2) Net Income and (3) Number of Customers.
Allocation Code C05 should incorporate multiple operating aspects in allocating costs because it
includes plant, revenues and expense (i.e., net income) and number of customers served. The
115
Company provided the calculation and workpapers for the determination of Rate Code C05 for
the current period in response to Record Request AG-22, with the following description:
The C05 allocation factor represents a 50/50 split between Rate
Codes C04 and B10. The 2017 C04 rate code is based on the
“Common-Gross Plant Asset & Net Income” methodology, which
is calculated using the prior year actual gross plant asset balances
and 12 month actual net income as of 12/31/2016. The 2017 B10
rate code is based on the “Customers” methodology and is
calculated using the actual 12 month rolling average number of
customers as of 12/31/2016.
Exh. RR-AG-22.
The use of the C05 allocation factor is a reasonable means of estimating the reductions to
the costs allocated (i.e., indirect charges) to NSTAR and WMECo as a result of the acquisition of
Aquarion for purposes of this rate case as it factors in numerous aspects of operations impacting
the allocation of costs. The 2016 Annual Reports for each of the Aquarion Water Companies
was provided in Hearing Exh. AG-19 (Aquarion Water Company of Connecticut), AG-20
(Aquarion Water Company of Massachusetts) and AG-21 (Aquarion Water Company of New
Hampshire). As indicated in the above quoted response to Exh. RR-AG-22, the C05 allocation
factors is based on a 50/50 split of the C04 and B10 allocation factors. Using the information
provided by the Company in response to Exh. RR-AG-22 and Hearing Exhs. AG-19, AG-20 and
AG-21, the impact of the inclusion of Aquarion on the C04 and B10 allocation factors can be
calculated as follows:
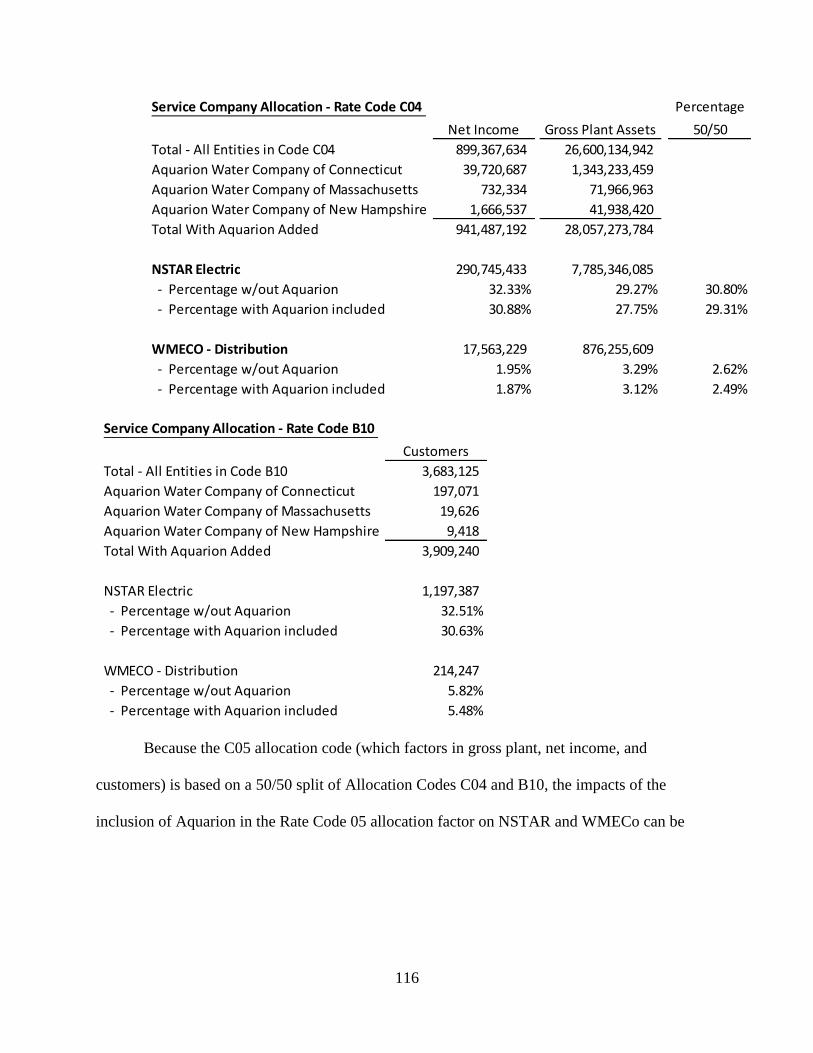
116
Because the C05 allocation code (which factors in gross plant, net income, and
customers) is based on a 50/50 split of Allocation Codes C04 and B10, the impacts of the
inclusion of Aquarion in the Rate Code 05 allocation factor on NSTAR and WMECo can be
Service Company Allocation - Rate Code C04 Percentage
Net Income Gross Plant Assets 50/50
Total - All Entities in Code C04 899,367,634 26,600,134,942
Aquarion Water Company of Connecticut 39,720,687 1,343,233,459
Aquarion Water Company of Massachusetts 732,334 71,966,963
Aquarion Water Company of New Hampshire 1,666,537 41,938,420
Total With Aquarion Added 941,487,192 28,057,273,784
NSTAR Electric 290,745,433 7,785,346,085
- Percentage w/out Aquarion 32.33% 29.27% 30.80%
- Percentage with Aquarion included 30.88% 27.75% 29.31%
WMECO - Distribution 17,563,229 876,255,609
- Percentage w/out Aquarion 1.95% 3.29% 2.62%
- Percentage with Aquarion included 1.87% 3.12% 2.49%
Service Company Allocation - Rate Code B10
Customers
Total - All Entities in Code B10 3,683,125
Aquarion Water Company of Connecticut 197,071
Aquarion Water Company of Massachusetts 19,626
Aquarion Water Company of New Hampshire 9,418
Total With Aquarion Added 3,909,240
NSTAR Electric 1,197,387
- Percentage w/out Aquarion 32.51%
- Percentage with Aquarion included 30.63%
WMECO - Distribution 214,247
- Percentage w/out Aquarion 5.82%
- Percentage with Aquarion included 5.48%
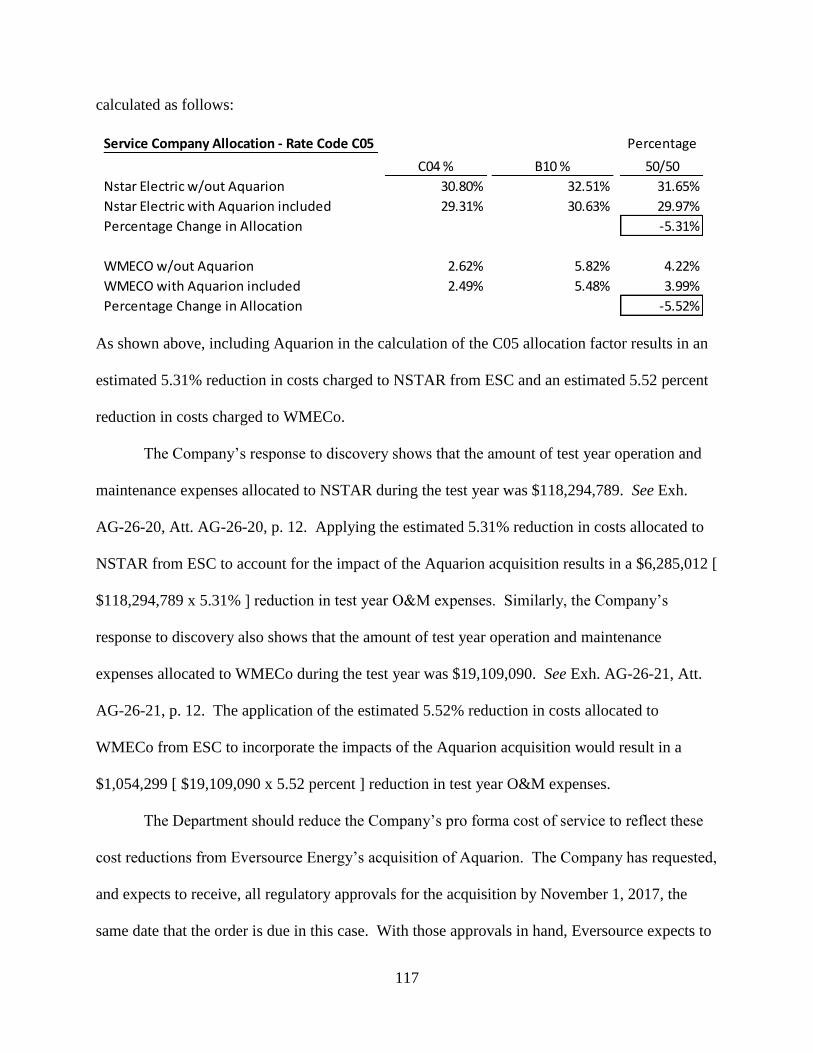
117
calculated as follows:
As shown above, including Aquarion in the calculation of the C05 allocation factor results in an
estimated 5.31% reduction in costs charged to NSTAR from ESC and an estimated 5.52 percent
reduction in costs charged to WMECo.
The Company’s response to discovery shows that the amount of test year operation and
maintenance expenses allocated to NSTAR during the test year was $118,294,789. See Exh.
AG-26-20, Att. AG-26-20, p. 12. Applying the estimated 5.31% reduction in costs allocated to
NSTAR from ESC to account for the impact of the Aquarion acquisition results in a $6,285,012 [
$118,294,789 x 5.31% ] reduction in test year O&M expenses. Similarly, the Company’s
response to discovery also shows that the amount of test year operation and maintenance
expenses allocated to WMECo during the test year was $19,109,090. See Exh. AG-26-21, Att.
AG-26-21, p. 12. The application of the estimated 5.52% reduction in costs allocated to
WMECo from ESC to incorporate the impacts of the Aquarion acquisition would result in a
$1,054,299 [ $19,109,090 x 5.52 percent ] reduction in test year O&M expenses.
The Department should reduce the Company’s pro forma cost of service to reflect these
cost reductions from Eversource Energy’s acquisition of Aquarion. The Company has requested,
and expects to receive, all regulatory approvals for the acquisition by November 1, 2017, the
same date that the order is due in this case. With those approvals in hand, Eversource expects to
Service Company Allocation - Rate Code C05 Percentage
C04 % B10 % 50/50
Nstar Electric w/out Aquarion 30.80% 32.51% 31.65%
Nstar Electric with Aquarion included 29.31% 30.63% 29.97%
Percentage Change in Allocation -5.31%
WMECO w/out Aquarion 2.62% 5.82% 4.22%
WMECO with Aquarion included 2.49% 5.48% 3.99%
Percentage Change in Allocation -5.52%
118
close the acquisition before the end of the year, which means that it can begin reducing costs
before the start of the rate year in this case. As a result, the cost of service for both companies
will be known by the time rates from this case go into effect. Therefore, test year O&M
expenses be reduced by $6.3 million for NSTAR and $1.0 million for WMECo to reflect the
impacts of the inclusion of Aquarion in the allocation of ESC costs post-merger. If the impacts
of this merger, which is anticipated by the Company to be consummated prior to rates from this
case taking effect, are not considered in determining the fair and reasonable service company
costs to incorporate in base rates, Eversource shareholders will receive an earnings windfall at
the expense of Massachusetts ratepayers.
5. PURSUANT TO DEPARTMENT PRECEDENT, THE DEPARTMENT
SHOULD DISALLOW THE COMPANY’S INCENTIVE COMPENSATION BASED
ON FINANCIAL GOALS
The Department should eliminate executive incentive compensation based on the
attainment of financial goals from the Company’s revenue requirement because, as the
Department has previously held, these incentives do not provide benefits to ratepayers. The
Department has made clear that incentive compensation must be: (1) reasonable in amount and
(2) reasonably designed to encourage good employee performance. Massachusetts Electric
Company, D.P.U. 89-194/195, p. 34 (1990); Fitchburg Gas and Electric Light Company, D.P.U.
70-71, pp. 82−83 (2008). For an incentive plan to be reasonable in design, it must both
encourage good employee performance and result in benefits to ratepayers. Boston Gas
Company, D.P.U. 93-60, p. 99 (1993). With respect to individual performance goals that are
exclusively financial, such as earnings per share, the Department has held that “the benefit to
ratepayers is unclear” and the burden is on the company to prove a direct benefit. New England
Gas Company, DPU 08-35, p. 97 (2009).

119
In Massachusetts Electric Company, DPU 10-55, pp. 253−54 (2010), the Department
clarified that financial performance of the Company should not be a component of the formula to
determine individual incentive compensation. The Department stated:
Going forward, where companies seek to include financial goals as
a component of incentive compensation program design, the
Department would prefer to see the attainment of such goals as a
threshold component with job performance standards designed to
encourage good employee performance (e.g., safety, reliability,
and/or customer satisfaction goals) used as the basis for determining
individual incentive compensation. Companies that wish to
maintain the achievement of financial metrics as a direct component
of an incentive compensation award must be prepared to
demonstrate direct ratepayer benefit from the attainment of these
goals or risk disallowance of the related incentive compensation
costs.
Id. The Department has since confirmed that the limitation for financial goals is not a preference
but instead, an “expectation.” Fitchburg Gas and Electric Light Company, DPU 11-01, pp.
192−94 (2011). When companies have not modified their incentive compensation plans in
accordance with this expectation, the Department has denied recovery of the incentive
compensation. Id., pp. 199−200.
Here, the Company’s financial performance is a major factor in its incentive
compensation formula. The Company’s incentive compensation plan is based 70% on the
Company’s overall financial performance and 30% on the Company’s overall operational
performance. Id. For the financial component, the Company’s “earnings per share goal was
weighted at 70%, the dividend growth goal was weighted at 20% and the credit rating goal was
weighted 10%.” Exh. DPU-45-21, Att. DPU-45-21(a), p. 46. Incentive compensation for the
CEO is awarded based on earnings per share, dividend growth, and credit rating. Exh. DPU-45-
21(e); Tr. Vol. IV, p. 827. The CFO is awarded incentive compensation based on his or her
achievement of individual goals regarding “the achievement of overall corporate financial goals:

120
earnings per share and credit rating.” Exh. DPU-45-21(e); Tr., Vol. IV, pp. 828–29. In addition,
“each named executive has goals appropriate for their respective area . . . [and t]hese goals are
designed to support . . . the overall corporate goals relating to the areas of Employee, Customer,
Operational Excellence, and Financial performance.” Id.
Pursuant to Department precedent, the Company’s request for recovery of incentive
compensation payments to its current CEO and CFO should be rejected because their individual
goals are tied to the overall corporation’s financial goals, and the Company did not satisfy its
burden by making any showing of a direct benefit to customers. Exhs. DPU-45-21(e); DPU-45-
21, Att. DPU-45-21. In particular, James Judge, the Company’s current CEO, received $379,086
in adjusted incentive compensation during the test year for NSTAR and $61,548 in adjusted
incentive compensation during the test year for WMECo. Exh RR-AG-4, Att. RR-AG-4, p. 2.
Likewise, Philip Lembo, the Company’s CFO, received $117,434 in adjusted incentive
compensation during the test year for NSTAR and $19,067 in adjusted incentive compensation
during the test year for WMECo. Id. Accordingly, the Department should remove, at a
minimum, $577,135 ($379,086 + $61,548 + $117,434 + 19,067) from the revenue requirement
for incentive compensation paid to the Company’s CEO and CFO.
In addition, the Department should remove 70% of the incentive compensation paid to
the Company’s other Named Executive Officers. As stated, the Company’s overall financial
performance accounts for 70% of the Company’s annual incentive performance goals. Exh.
DPU-45-21, Att. DPU-45-21, p. 46. In addition, “each named executive has goals appropriate
for their respective area . . . [and t]hese goals are designed to support . . . the overall corporate
goals relating to the areas of Employee, Customer, Operational Excellence, and Financial
performance.” Id. Moreover, Company Witness Horton testified, the “executive management
121
team and leaders throughout the company . . . are responsible for maintaining a budget, and that
budget -- the expenses incorporated in that budget are a part of the overall plan of the company
to execute on an operating expense budget and a capital budget.” Tr., Vol. IV, p. 829. As
previously explained, the Company’s shareholders, and not ratepayers, should pay incentive
compensation tied to the Company’s overall financial performance.
Accordingly, in addition to removing costs for incentive compensation associated with
the CEO and CFO, the Department should also remove a total of $295,592, which is 70% of the
total $422,274 in incentive compensation paid to Leon Olivier, Executive Vice President Energy
Strategy and Business Development ($158,054); Werner Schweiger, Executive Vice President
and Chief Operating Officer ($147,995); and Gregory Butler, Senior Vice President & General
Counsel ($116,225), for their employment with NSTAR and WMECo. Exh. RR-AG-4, Att. RR-
AG-4.
An incentive compensation package that includes the achievement of financial targets
effectively requires customers to reward Company management on a contingency basis by
raising customers’ rates. This result is unfair to the Company’s customers and should not be
allowed by the Department. If an incentive compensation program is successful in increasing
earnings, the shareholders should be happy to reward employees accordingly and absorb the cost
of the program. Because shareholders are the primary beneficiaries of increases to earnings,
shareholders should bear the cost of the incentive compensation related to earnings, not the
Company’s customers. Accordingly, incentive compensation based on the attainment of
financial goals should not be included in the Company’s revenue requirement and recovered
from ratepayers. For these reasons, the Department should remove $577,135 for incentive
compensation paid to the Company’s CEO and CFO, and $295,592 for incentive compensation
122
paid to the Company’s other Named Executive Officers, along with proportional adjustments for
the associated employee costs (e.g., FICA, 401K, and life insurance).
6. THE COMPANY’S INFLATED MEDICAL EXPENSE PROJECTION
RESULT IN THE COMPANY OVER-STATING ITS FUTURE EMPLOYEE
MEDICAL COSTS
The Company proposes pro forma adjustments to their test year medical expenses based
on inflated estimates of the rates of the growth in health care costs. As described below, the
Company’s health care growth rates are not supported by any record evidence and are clearly
unreasonable. Therefore, the Department should deny the Company’s proposed increase in
medical expenses and instead limit the health case growth rate to a more reasonable level.
Eversource self-insures its medical costs rather than having a third-party underwriting the
liability. Exh. ES-DPH-1, pp. 57-58.32 As a result, the Company’s year-to-year medical costs
are not based on the payment of any insurance premium, but rather, the actual costs that the
Company pays to medical providers. Id.
The Company’s pro forma medical expense is not based on any contractual or known and
measureable increase in costs. Rather, the increase is based on a so-called “working rate” that
the Company develops. Id. However, that working rate is nothing more than an estimate that the
Company uses as an accounting placeholder that is trued up later in the year after actual costs are
known. Id. The proposed working rate is based on a forecasted growth rate in health care costs
that Company creates and does not represent the actual increase in the Company’s employee
medical costs. See id.
32 The Company does employ an outside firm to administer the Company’s medical program, providing the interface
with employees and medical services providers. Id.
123
Eversource, in its original filing, proposed increases in its test year medical expense
levels of $1,304,895 and $260,108, for NSTAR and WMECo respectively. Exh. ES-DPH-2
(East and West), Sch. 11, p. 2. The Company bases these increases on assumed annual growth
rates in health care costs of 9 percent. See Exh. ES-MPS-2, line 9. In the May 25, 2017 Update
filings, NSTAR and WMECO increased those adjustments to $2,427,579 and $463,618,
respectively, based on an even higher annual growth rate in health care costs of 9.5 percent.
Exh. ES-DPH-2 (East and West), Sch. 11, p. 2. May 25, 2017 Update and Exh. DPU-45-31(b),
line 9.
The Department should deny the Company’s proposed increases in medical costs based
on its over-inflated working rate. The Department has found that utility proposed increases in
medical costs should not be based on working rates. Fitchburg Gas and Electric Light
Company, D.P.U. 13-90, pp. 94-96 (2013). To be included in rates, medical and dental insurance
expenses must be reasonable. Massachusetts Electric Company, D.P.U. 92-78, pp. 29-30 (1992);
Nantucket Electric Company, D.P.U. 91-106/91-138, p. 53 (1991). Companies must demonstrate
that they have acted to contain their health care costs in a reasonable, effective manner.
Berkshire Gas Company, D.T.E. 01-56, p. 60 (2002); Boston Gas Company, D.P.U. 96-50
(Phase I), p. 46; D.P.U. 92-78, p. 29; D.P.U. 91-106/91-138, p. 53. Finally, any post-test year
adjustments to health care expense must be known and measurable. Berkshire Gas Company,
D.T.E. 01-56, p. 60; D.P.U. 96-50 (Phase I), p. 46; North Attleboro Gas Company, D.P.U. 86-86,
p. 8 (1986).
The health care growth rates embedded in the medical cost working rates that the
Company proposes here are well beyond any credible growth rates that have been observed in
the market. The Company’s working rate health care growth rate is an astonishing 9.5 percent.
124
Exh. DPU-45-31. General inflation in the economy has been less than 2 percent recently and is
expected to be just 2.05 percent in the future. See Exh. AG-JRW-1, p. 82; Exh. AG-JRW-14, p.
6; Exh. ES-RBH-1, p. 35. Indeed, even the Company’s actuarial reports for retiree benefit costs,
whose medical costs grow faster than that of the general population, forecast a near term growth
rate of only 6.25 percent, trending to just 4.5 percent.33 Tr. Vol. VI, pp. 1113-15. Ultimately,
the Company provided no support for its 9.5 percent forecasted health care growth rate.
Given the Company’s failure to provide any support for the significant increase, the
Department should deny the Company’s proposed medical increases based on the 9.5 health care
growth rate. Instead, the Department, if it allows an increase in the Company’s medical expense
at all, should use an increase based on more reasonable health care cost trends. The Company
provided such a calculation, using a health care growth rate of 6.5 percent. RR-AG-6. A health
care growth rate of 6.5 percent, although still many times that rate of inflation, is more in line
with the actual growth rate experience and has some basis in record evidence. Tr. Vol. VI, pp.
1115.
Therefore, the Department should deny the Company’s proposed medical cost increases
based on a 9.5 percent inflation rates, since those working rates are not supported by any credible
record evidence, and instead limit the increases to those based on more reasonable growth rates
as provided in RR-AG-8. This adjustment would result in a medical cost increase of $1,668,140
for NSTAR and $329,237 for WMECO. Id.
33 The use of higher growth rates in the charges for retiree health care costs has less of an impact on customers, since
those costs are collected through the Pensions and Post-Retirement Benefits Other Than Pensions charge where
those charges to customers are trued up to actual costs.
125
7. THE DEPARTMENT SHOULD REJECT THE COMPANY’S PROPOSAL
TO INCREASE INFORMATION SYSTEM EXPENSE CHARGED FROM
EVERSOURCE SERVICE COMPANY FOR A POST-TEST YEAR
INFORMATION SYSTEM PLANT ADDITION
The Company has proposed to increase the test year information system expense charged
from ESC to include costs associated with a post-test year information system plant addition
being undertaken by its service company. ESC is currently implementing a new Supply Chain
Project, the costs of which will be allocated to the Eversource operating companies, including
NSTAR and WMECo, based on the projected costs, including a return on the new post-test year
addition to plant in service and depreciation. Although the project will be a post-test year capital
addition at ESC, the Company manipulates the costs so that they will be charged to the operating
companies as expenses.
According to the Company, the Supply Chain Project “will consolidate and standardize
all supply chain processes and practices across each Eversource Energy operating company in
order to eliminate redundancy, leverage industry-best practices and introduce state-of-the-art
technology to sourcing, contracting and materials management-related activities.” Exh. ES-
DPH-1, p. 94. The goal of the project is to reduce costs through standardization and
consolidation. The project was not completed and placed into service prior to the end of the
Phase 1 hearings in this case, which concluded on June 29, 2017. Although the initial filing
anticipated a mid-February 2017 go-live date, the Company indicated during hearings that the
revised go-live date for the implementation of the Supply Chain Project is July 3, 2017. Tr. Vol.
XV, p. 3054.
In the May 25, 2017 Update to its revenue requirement schedules filing, the Company
revised the ESC net rate base for the project, the pre-tax cost of capital applied to the project, and
the depreciation rate applied to the project. The May 25, 2017 Update shows the revised ESC
126
rate base, net of accumulated depreciation and accumulated deferred income taxes (“ADIT”), of
$26,173,725 with a pre-tax cost of capital of 11.38% applied, resulting in a requested return on
the Supply Chain Project of $2,979,597. Exhs. ES-DPH-4, Sch. DPH-8 (East), pp. 1−2; ES-
DPH-4, Sch. DPH-8 (West), pp. 1−2. The May 25, 2017 Update also shows depreciation
expense of $3,178,237, resulting in a total ESC “Revenue Requirement” associated with the
project of $6,157,834 ($2,979,597 + $3,178,237). Id. After allocating the costs and applying the
O&M expense ratios, the Company requests inclusion of post-test year increases in information
system expense allocated from ESC of $1,248,167 for NSTAR and $237,936 for WMECo in its
updated filing. Id.
The Department should reject the proposed post-test year increases in charges from ESC
for several reasons, each of which provides an independent basis for rejection: (a) the Supply
Chain Project is a post-test year plant addition at the service company level that was not placed
into service prior to the end of hearings in this case; (b) the amount of costs to be charged to
NSTAR and WMECo are not known and measurable; and (c) the Company’s expected cost
savings associated with the Supply Chain Project implementation exceeds the annual revenue
requirements associated with the ESC plant addition. Moreover, even if the Department allows a
proposed test-year increase, it should reduce the amount of the proposed test-year increase
because the Company makes no adjustment for the impact that the Company’s acquisition of the
Aquarion Water Companies will have on the amounts to be charged to NSTAR and WMECo,
and the proposed post-test year service company information system adjustment significantly
overstates the costs of the project. Each of these problems with the Company’s Supply Chain
proposal will be discussed below.
127
a) The Supply Chain Project Is a Post-Test Year Plant Addition at
the Service Company Level That Was Not Placed into Service Prior to
the End of Hearings in This Case
The Supply Chain Project did not go into service prior to the end of hearings in this case.
Although the Company provided an estimated timeline for completion of the project with a go-
live date in mid-February 2017 and extending into May 2017, Exh. DPU-9-7, Att. DPU-9-7, p. 5,
the go-live date was later changed to an anticipated date of July 3, 2017. Exh. AG-42-1. The
Company’s witness stated that at go-live, the process of interfacing systems with the application
will begin, so that the Company “will begin to cut those over, test them, make sure that the
interfaces are working properly and that the system is functioning as designed.” Tr. Vol. XV,
pp. 3054−3055. The Company’s witness also testified that after the go-live date, there is “user
acceptance testing . . . to assure, again, that all the interfaces are live and working and up and
running as designed.” Id., p. 3055. The Company’s witness confirmed that post-go-live support
will extend beyond July 2017, but did not state a date by which it will end. Id., p. 3064. Clearly,
the Supply Chain Project is not “in service,” but rather construction work in progress as the
Company goes about testing, retesting, training, and attempting to bring the system ups to that at
some point in the future, when employees actually will be able to use the system. Therefore, the
Department should deny the Company’s attempt to bootstrap the Service Company’s post-test
year project spending into rates in this case.
b) The Amount of Costs Associated with the Supply Chain Project
to Be Charged to NSTAR and WMECo in the Rate Effective Period Are
Not Known and Measurable
The Department should also not allow the adjustment for the Supply Chain Project costs
because those costs are not known or measurable. Proposed test year revenues and expense
require a finding that the adjustment constitutes a “known and measurable” change to test year
128
cost of service. See Eastern Edison Company, D.P.U. 1580, pp. 13−17, 19 (1984); Western
Massachusetts Electric Company, D.P.U. 85-270, p. 141 n.21 (1987). A “known” change means
that the adjustment must have actually taken place, or that the change will occur based on the
record evidence. Fitchburg Gas and Electric Light Company, D.P.U. 98-51, p. 62 (1998). A
“measurable” change means that the amount of the required adjustment must be quantifiable on
the record evidence. Id.
Here, the expense associated with the Supply Chain Project is not known and measurable.
Company witness Horton indicated that the amount included in the May 28, 2017 Update for the
project is now based on actual expenditures on the project through April 30, 2017. Tr. Vol. VI,
p. 1216. Although the actual amount spent by the Service Company on the project through April
30, 2017, may now be a known amount, the amount that will be charged to NSTAR and
WMECo for this post-test year project during the rate effective period is not known or
measurable.
Mr. Horton indicated in his testimony that the project will consolidate and standardize the
supply chain process and practices “across each Eversource Energy operating company” and that
the associated costs are charged to the operating companies through the general service company
overhead (GSCOH), which is an adder to service company labor costs. Exh. ES-DPH-1, p. 94.
In calculating the amount of return and depreciation for the new system to be allocated to the
operating companies in this case, the Company’s adjustment includes a “Budgeted Labor
Allocator” for both NSTAR and WMECo. Exh. ES-DPH-4, Sch. DPH-8, May 25, 2017 Update,
pp. 1−2. The actual labor allocators that will be used in allocating these costs to NSTAR and
WMECo are not known and measurable at this time. It is obvious that the project’s costs in this
129
case are in flux and there is no way to know what the actual costs to the Companies will
ultimately be.
c) The Company’s Expected Cost Savings Associated with the
Supply Chain Project Implementation Exceed the Annual Revenue
Requirements Associated with the ESC Plant Addition
The Company adjusted its test year operation and maintenance expense to reflect the
costs associated with the Supply Chain Project at the Service Company level, but it did not
consider the cost reductions associated with the project or reflect a reasonable rate of return. The
Company calculated an overall Service Company revenue requirement of $6,157,834 associated
with the project and after allocation to the NSTAR and WMECo operations and maintenance
expenses, the Company’s pro forma adjustments for the post-test year project increases
NSTAR’s pro forma operation and maintenance expense by $1,248,167 and WMECo pro forma
operation and maintenance expense by $237,936. Exh. AG-DR-1, p. 7.
These adjustments fail to recognize the benefits and savings associated with the Supply
Chain Project. In particular, the Project Authorization Form for the Supply Chain Project shows
that the project will achieve direct annual recurring savings at the Service Company level of $5.4
million plus one-time savings at the Service Company level of $2.8 million as a result of
efficiencies and reductions to materials and services. Exh. ES-LML-8, Supp. 1, pp. 141−51. In
addition to these quantified direct savings, the Project Authorization Form notes potential
indirect savings, such as reduced cost of compliance. Id. The cost savings calculations for the
project were conducted as part of the overall project evaluation in deciding to go forward with
the project, and the Company quantified the benefits to the extent that they could be associated
with the implementation. Tr. Vol. XV, pp. 3054−3058. The Company indicates that the cost
savings are anticipated to be real and was part of the lens through which the Company decided to
130
initiate and implement the project. Tr. Vol. VI, pp. 1212−1213. The Company’s proposal to
include the return, taxes, and depreciation expense to be incurred by the Service Company for
this project, but not pass any of the resulting savings to customers until the next rate case is
unfair to ratepayers and the Department should not allow it.
As AGO Witness Ramas testified, “if 1) the annual recurring savings of the Supply Chain
Project are taken into account; 2) the one-time savings are spread over a reasonable period; 3)
indirect savings are recognized; and 4) the revenue requirement of the Supply Chain Project is
modified to reflect a more reasonable rate of return; then the savings and benefits for the Supply
Chain project could easily equal, or even surpass, the revenue requirement associated with the
project.” Exh. AG-DR-1, p. 8. In other words, the project is anticipated to have a net negative
impact on the overall revenue requirement if all impacts of the project are considered, reducing
the pro forma cost of service for both of the Companies in this case. The Company did not rebut
Ms. Ramas’ testimony asserting that the savings and benefits could easily equal or surpass the
increase in costs incorporated in the Company’s post-test year adjustment.
Assuming, arguendo, that projected post-test year costs associated with the Supply Chain
Project should be considered for recovery, it is unreasonable and unfair to consider these costs
while completely ignoring the cost savings that will result from the project. Here, the Company
proposed no such offsetting cost savings. The Company wishes to charge ratepayers for the
costs of the project but not allow them to share any of the benefits. Accordingly, the Department
should reject the Company’s one-sided pro forma adjustments to increase the Company’s
operation and maintenance expense.
131
d) The Company Has Failed to Consider the Impact That the
Company’s Acquisition of the Aquarion Water Companies Will Have on
the Amounts to Be Charged to NSTAR and to WMECo
As noted above, Eversource Energy has entered into a Purchase and Sale Agreement to
acquire Macquarie Utilities Inc., which owns the Aquarion Water Companies in Connecticut,
Massachusetts and New Hampshire. The transaction is expected to close by December 31, 2017,
before rates go into effect in this case.34 Exh. AG-1. Because the new Supply Chain Project that
is being implemented at the Service Company level will consolidate and standardize the supply
chain process across all Eversource Energy operating companies, the Aquarion Water
Companies will also presumably benefit from this system in the future and will be allocated a
portion of the system costs. To increase expenses for a post-test year service company project
but to not also consider the reduction in the portion of such post-test year project costs that will
be allocated to the Massachusetts electric companies as a result of the Aquarion Water
Companies acquisition would not be fair or reasonable to ratepayers and should not be allowed.
e) The Company Overstates the Expected Costs of the Supply Chain
Project
Even if the Department allows a test-year increase in Service Company costs, which it
should not, the Department should allow only a portion of the proposed test-year increase
because the Company significantly overstates the projected costs of the Supply Chain project. In
its May 25, 2017 Update, the Company revised the rate of return it applies to the Service
Company Information System plant addition in order to base it on the proposed capital structure
and cost rates the Company requests for NSTAR and WMECo in this case. Exh. ES-DPH-4,
34 The prior section of this brief addressing the Aquarion Water Company acquisition does not include adjustments
for the Supply Chain Project since that section only includes adjustments for test year expense and this is a post-test
year addition.
132
Sch. DPH-8, May 25, 2017 Update, p. 8. If the Department entertains the Company’s post-test
year adjustment, then at a minimum, it should: (1) reflect ESC’s capital structure; (2) reflect
ESC’s actual cost of debt; (3) reduce the return on equity to that approved in this case; and 4)
reduce the allocation factors used in the adjustment to reflect the impacts of the Aquarion Water
Company acquisition.
In its initial filing, the Company based its adjustment on a projected capital structure for
ESC using a projected equity ratio of 58.62 percent. In its updated filing, the Company revised
the equity ratio to 53.35 percent. However, the Company’s response to Exh. AG-26-2
demonstrates that the actual equity ratio for ESC was only 38.20percent as of December 31,
2015 and 40.28 percent as of December 31, 2016. Additionally, the Company’s updated filing
reflects a pro forma cost of debt of 4.26 percent. However, the response to Exh. AG-26-2 shows
that the actual cost of debt for the Service Company was 1.06percent at December 31, 2015 and
1.13percent at December 31, 2016. Finally, as Company witness Horton agreed, the rate of
return on equity to apply in the post-test year ESC information system adjustment should be
calculated to include the rate of return on equity ultimately approved by the Department in this
case. Tr. Vol. XV, p. 3067.
If the Department allows the adjustment, contrary to the AGO’s recommendation, then
the Department should use ESC’s capital structure (40.28 percent equity as of December 31,
2016) and ESC’s cost of debt rate (which was 1.13 percent as of December 31, 2016) to
determine the Company’s return on the post-test year plant addition. Determining the
Company’s return based on the service company’s capital structure and cost of debt rate is
consistent with the Department’s findings in D.P.U. 15-155 involving a post-test year
133
information system plant addition for the National Grid Service Company35 in which the
Department held, “[t]o guard against Massachusetts ratepayers inappropriately subsidizing
operations of NGSC, the Department will recalculate the return on NGSC assets using NGSC’s
capital structure and the 9.9 percent ROE authorized in this instant case.” D.P.U. 15-155, p. 303;
Tr. Vol. IX, pp. 1833–34. Basing the adjustment in this case on an equity ratio that is higher
than the actual ESC equity ratio and on a cost of debt that is higher than ESC’s actual cost of
debt would result in an unfair subsidization of the Service Company’s operations.
f) Summary and Recommendation
The Department should reject the Company’s proposal to include costs associated with
the Service Company’s new Supply Chain information system in the cost of service because the
project is not complete, the total costs of the project are not known and measurable, the
Company has not recognized the savings associated with the implementation of the project that
exceed the project costs, and the Company significantly overstates the costs of the project.
Therefore, the Department should deny the Company’s proposed Supply Chain Project cost
adjustment.
8. CUSTOMERS SHOULD NOT HAVE TO PAY FOR TWO CORPORATE
HEADQUARTERS
Eversource Energy occupies two expensive corporate headquarters in high rent urban
areas, one in downtown Harford, Connecticut and a second at the Prudential Center in downtown
Boston, Massachusetts. The Company has included the lease and the operations and
35 Although the Department did allow the costs associated with a post-test year service company plant addition in
D.P.U. 15-155, the circumstances are much different in this case. Here for example, the post-test year information
systems project was not placed into service by ESC by the date of the hearings and the quantified and expected cost
savings for the project exceed the project expenses (i.e., return and depreciation) the Company is attempting to
include as a post-test year adjustment.
134
maintenance expenses of both headquarters in the costs of service in this case. However, it is
neither just nor reasonable to ask Massachusetts customers to pay for the costs associated with
Connecticut.
The Company allocated costs associated with the Hartford, Connecticut headquarters at
56 Prospect Street facility based on the total square footage of floor space occupied by each
business unit. Exh. AG-50-13; Tr. Vol. IV, p. 831. For the rent expense associated with the
Hartford facility, the Company included $110,453 for NSTAR and $18,300 for WMECo. Exhs.
ES-DPH-2 (East), Sch. 18, May 25, 2017 Update, p. 2; ES-DPH-2 (West), Sch. 18, May 25,
2017 Update, p. 2; AG-50-12; Tr. Vol. IV, pp. 829−831. For facility operations and maintenance
expense associated with the Hartford facility, the Company included $89,369.99 for NSTAR and
$8,866.97 for WMECo. Exhs. ES-DPH-2 (East), Sch. 18, p. 2; ES-DPH-2 (West), Sch. 18, p. 2;
AG-50-12; Tr. Vol. IV, pp. 832−33. For the reasons discussed below, the Department should
exclude these costs from the Company’s revenue requirement.
a) The Hartford, Connecticut Headquarters is Unnecessary to
Provide Electric Distribution Service to Massachusetts Customers
The Company failed to provide any evidence that the Hartford headquarters is necessary
for providing electric distribution service to Massachusetts ratepayers. Furthermore, the
Company already has a Massachusetts headquarters location at the Prudential Center Tower in
Boston, Massachusetts with 25,676 square feet of space (more than half the size of a football
field), as well as significant additional office space in its Westwood and New Bedford facilities
for its operations in the Commonwealth. Exhs. ES-DPH-2 (East), Sch. DPH-18, May 25, 2017
Update, p. 2; ES-DPH-2 (West), Sch. DPH-18, May 25, 2017 Update, p. 2; AG-50-15; AG-26-
13; Att. AG-26-13 (a), (b). The Company has provided no evidence for why Massachusetts
ratepayers should pay for the Connecticut headquarters.
135
b) The Connecticut Public Utility Regulatory Authority Has
Disallowed Costs Associated with the Unneeded Hartford Headquarters
The Connecticut Public Utility Regulatory Authority (“PURA”) has found that the
headquarters at 56 Prospect Street in Hartford, Connecticut is unnecessary for the operation of
the Company and ruled that Connecticut ratepayers should not pay for any expense associated
with that facility.
When the Company’s affiliate, the Connecticut Light & Power Company (“CL&P”),
tried to recover costs from customers associated with the Hartford headquarters, PURA rejected
the company’s request. Exh. AG-15; PURA 09-12-05, p. 40 (June 30, 2010); Tr. Vol. IV, p.
836. In making its determination, PURA stated, “[t]he Department concludes that CL&P
distribution does not need the additional office space it is allocated due to the purchase of 56
Prospect Street and ratepayers should not have to fund the additional cost.” Id. In a subsequent
rate case, CL&P did not request recovery of costs associated with the Connecticut headquarters.
Exh. AG-15; PURA 14-05-06, p. 81 (Dec. 17, 2014) (“In accordance with the determination in
Docket No. 09-12-05, CL&P did not include $622,939 representing its allocated amount for the
56 Prospect Street, Hartford Corporate Office.”); Tr. Vol. IV, pp. 836−38. PURA has made clear
that Connecticut ratepayers should not be responsible for costs at the Company’s unneeded
facility. Therefore, even in the State of Connecticut, the commission has denied recovery of the
costs of the corporate headquarters in Hartford, because those costs are superfluous and
unnecessary costs.
The Department should exclude all of the costs associated with the Company’s
Connecticut headquarters at 56 Prospect Street in Hartford, Connecticut. Massachusetts
ratepayers should not be required to pay for costs associated with a facility that is clearly
redundant and unnecessary for the provision of their electric distribution service in the
136
Commonwealth. Indeed, even PURA has shielded Connecticut ratepayers from the costs of the
Hartford headquarters by denying CL&P’s recovery of those costs through rates. Massachusetts
ratepayers should not be given any less favorable treatment.
Accordingly, the Department should disallow rent expense associated with the Hartford
facility of $110,453 for NSTAR and $18,300 for WMECo, and facility expense of $89,369.99
for NSTAR and $8,866.97 for WMECo.
9. THE DEPARTMENT SHOULD DENY THE COMPANY’S PROPOSED
2018 NON-UNION PAYROLL EXPENSE ADJUSTMENT
The Companies are proposing to include pro forma adjustments to the cost of service for
estimated increases in non-union employee payroll expense that they claim will occur in 2018.
NSTAR is proposing a 2018 payroll adjustment of $1,305,870 for its non-union employees and
its share of Service Company non-union employee expenses. Exh. ES-DPH-2 (East), Sch. DPH-
13, p. 2, line 37. May 25, 2017 Update. WMECo is proposing a 2018 payroll adjustment of
$361,723 for its non-union employees and its share of Service Company non-union employee
expenses. Exh. ES-DPH-2 (West), Sch. DPH-13, p. 2, line 37. May 25, 2017 Update. The
Companies have provided no evidence to support these proposed increases.36
The Department precedent regarding post-test year adjustments for increases in non-
union salaries and wages is well-established. The Department permits such adjustments when a
company demonstrates that: (1) the proposed increase is a reasonable amount; (2) there is an
express commitment by management to grant the non-union increase; and (3) there has been a
historical correlation between non-union and union increases. Fitchburg Gas & Electric Light
Company, D.P.U. 1270/1414, p 14 (1983).
36 The Department allows union employee payroll increases when those increases are supported by contracts with
company management. Cambridge Electric Light Company, D.P.U. 92-250, p. 35 (1993).
137
The Companies has not demonstrated that the proposed increases are reasonable. For
both companies, the Company is proposing 2.75 percent increases in salaries. Exh. ES-DPH-2
(East), Sch. DPH-13, p. 2, line 36. May 25, 2017 Update and Exh. ES-DPH-2 (West), Sch. DPH-
13, p. 2, line 36. May 25, 2017 Update. However, in both cases, the Company has not
demonstrated that raises of that magnitude in 2018 are reasonable or needed for that matter.
Indeed, as was demonstrated by the Company in its salary structure analysis, the non-union
employees, on average, are already making more than 2 percent above industry averages for
positions of similar responsibilities. See Exh. ES-SL-6 (NSTAR), Exh. ES-SL-7 (WMECO),
and Exh. ES-SL-8 (ESC). For that reason alone, the Department should deny the Companies
proposed 2018 non-union increases.
Furthermore, the Company has provided no evidence that Eversource’s senior
management is committed to the 2018 payroll increase. The Company provided no affidavit of
the commitment, nor has it provided any sworn testimony from senior management. Ultimately,
the Company provide no proof that the increase is contractual or required.
Therefore, since the Company’s has not demonstrated that the 2018 increases are
reasonable and that there are any contractual or firm commitments from senior management for
the proposed increases, the Department should deny the Company’s proposed 2018 non-union
employee payroll increases. Fitchburg Gas & Electric Light Company, D.P.U. 1270/1414, p. 14
(1983) and Boston Gas Company, D.P.U. 93-60, p. 95 (1992). Furthermore, since many other
adjustments are based on the proposed payroll increase, including the Variable Compensation,
the Life Insurance, the FICA Tax, etc. the Department should adjust those costs downward
proportionately.

138
10. “FEE FREE” CREDIT/DEBIT CARD PAYMENT SYSTEM
a) The Department Should Reject the Company’s Proposed “Fee
Free” Credit/Debit Card Payment System Because It Is Inconsistent
with the Provision of Least-Cost Service, creates a Cross-Subsidy, and
Could Result in More Customers Paying High Credit Card Interest
Rates
The Company seeks Department approval of a “fee free” credit/debit card payment
system (“Fee Free Proposal”) that will allow customers to pay their bills electronically without a
transaction fee. Exh. ES-PMC-1, p. 5. The Department should reject the Company’s proposed
“Fee Free Proposal” because it is not “free.” Rather, it is one of the most expensive of the
various methods that customers can use to pay their bills. Customers who do not use the
credit/debit card payment method will be forced to subsidize those that do. This is not a least-
cost service option. The Company’s “Fee Free” Proposal is inconsistent with the Company’s
obligation to provide least-cost service to all of its customers.
Following two rounds of requests for proposals (“RFP”) the Company executed an
agreement with a third-party service provider, SpeedPay Inc., a subsidiary of Western Union, to
provide the services necessary to offer credit/debit card transactions. At the Company’s
expected migration rate of 30 percent of customers over five years, the Company has estimated
an average annual cost of $6 million, for a total five-year cost of $30 million. Exh. ES-PMC-1,
pp. 14-15. The Company proposes that it recover the $30 million cost of this agreement through
distribution rates to be collected from all customers. Exh. ES-PMC-1, p. 8.
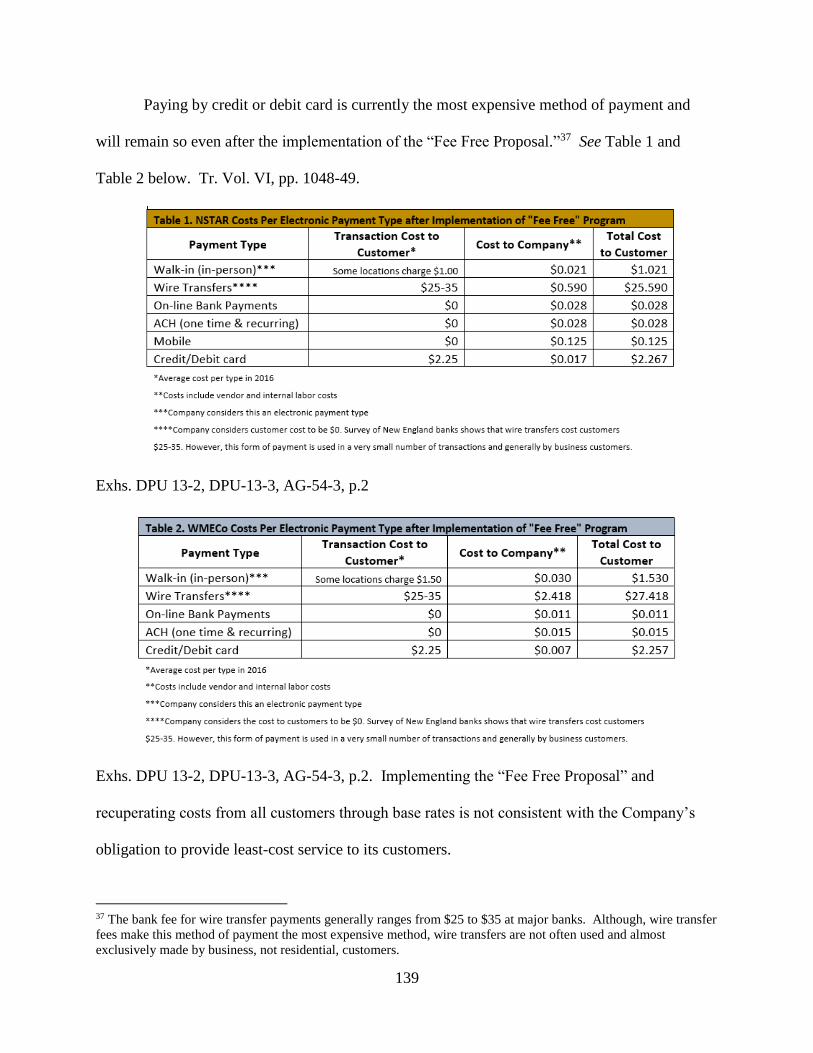
139
Paying by credit or debit card is currently the most expensive method of payment and
will remain so even after the implementation of the “Fee Free Proposal.”37 See Table 1 and
Table 2 below. Tr. Vol. VI, pp. 1048-49.
Exhs. DPU 13-2, DPU-13-3, AG-54-3, p.2
Exhs. DPU 13-2, DPU-13-3, AG-54-3, p.2. Implementing the “Fee Free Proposal” and
recuperating costs from all customers through base rates is not consistent with the Company’s
obligation to provide least-cost service to its customers.
37 The bank fee for wire transfer payments generally ranges from $25 to $35 at major banks. Although, wire transfer
fees make this method of payment the most expensive method, wire transfers are not often used and almost
exclusively made by business, not residential, customers.
140
Furthermore, the “Fee Free Program” costs about 80 times the cost of online bank
transfers and ACH transfers. Because the Company proposes to recover the $6 million annual
cost of the “Fee Free Program” from customers through base rates, the cost of the “Fee Free
Program” will be imposed on all customers when only 30 percent of customers are expected to
adopt the payment method over the next five years. Exh. ES-PMC-1, p. 16. The Company
should instead encourage customers to move to on-line bank payments or ACH payments which
are made at a cost of one to three cents total, instead of the $2.26 cost of the “Fee Free Program.”
Exhs. DPU 13-2, DPU-13-3, AG-54-3, p. 2.
The “Fee Free Program” may even end up ultimately harming customers who pay by
credit card as well. Credit card interest rates typically range between 13 and 25 percent. Tr. Vol.
VI, p. 1064. In 2015, Eversource’s customers made less than 2 percent of their payments by
credit or debit card, but the Company projects that 30 percent of payments will pay by either
credit or debit card as a result of the implementation of the program. Exh. ES-PMC-1, pp. 14–
15, 30. Many of those new customers may ultimately end up paying the high 13 to 25 percent
interest rates on their credit card payment,38 which could end up more than offsetting any benefit
they receive from paying their electricity bills “fee free.” Thus, it is possible that not even
customers who pay by credit card will receive net benefits from the Company’s “Fee Free
Program.”
Accordingly, the AGO recommends that the Department reject the Company’s proposed
“Fee Free Proposal” because it is inconsistent with the Company’s obligation to provide least-
38 The Company did not provide a breakdown of what proportion of the 30 percent of payments it expects to be
made pursuant to the “Fee Free Program” would be made by credit and debit cards, respectively. However, the
Company’s witness did testify that customers currently make 1.02 percent of their bill payments by credit card and
0.66 percent by debit card. Exh. ES-PMC-1, p. 19.

141
cost service to its customers, creates cross-subsidization by non-participating customers, and
encourages customers to pay their bills by credit card, which often have high interest rates.
Additionally, the Company also requests that the Department approve the “Fee Free
Program” for NSTAR Gas customers in this docket. Exh. ES-PMC-1, p. 18. The Department
should reject the Company’s request for approval on due process grounds because none of
NSTAR Gas, its customers, or other stakeholders are party to this proceeding. The AGO
recommends that the Department direct NSTAR Gas to submit a separate filing to request
approval of a “fee free” debit/credit payment system.
b) The Proposed Pro Forma Adjustments for Fee Free Payment
Processing Are Speculative and Should Be Rejected
As explained by Company Witnesses Horton and Conner, customers who use credit or
debit cards to pay their bills presently pay $2.25 per transaction to a third-party payment
processing agent to process those bills. The Company proposes to eliminate fees to customers
who use credit or debit cards to pay their bills and to include the cost of processing those
payments in the NSTAR and WMECo base rate revenue requirements. The Company will use a
third party, SpeedPay Inc., a subsidiary of Western Union, to process its customers’ credit and
debit card payments.
The estimated cost of the Fee Free payment processing is based on a proposed contract
with SpeedPay Inc. to process the payments. As explained by Mr. Horton, “[t]he cost for the
Company would be a per transaction amount subject to change over the term of the agreement.”
Exh. ES-DPH-1, p. 52. Based on assumptions regarding the cost per transaction, and the number
of transactions (including the migration of customers from other current payment methods), the
Company estimates that over the first five years of the agreement with SpeedPay Inc., the total
cost will be $30 million, resulting in an average cost of $6 million per year. Of this average

142
annual expense, the Company allocates $5,093,091 to NSTAR and $906,909 to WMECo. In its
update of May 25, 2017, the Company recognized minor offsetting cost savings related to the
migration of customers to payment by credit or debit card from other payment methods. After
these offsets, the adjustments result in a net increase to pro forma operation and maintenance
expense of $5,040,200 for NSTAR and a net increase to pro forma operation and maintenance
expense of $897,171 for WMECo.
The proposed adjustments for fee free processing costs rest on uncertainties compounded
by speculation and are not known and measurable. As Mr. Horton acknowledged, at present, it is
not known how many customers will take advantage of the fee free payment option or what the
transaction fee per customer will be (which itself is partially dependent on the number of
customers that migrate to fee free payment processing). Tr. Vol. XIII, pp. 2774-75. In addition,
the Company can only estimate what the offsetting savings will be because it is not known how
many customers will migrate to fee free payment processing. Id., pp. 2775-76.
Given these uncertainties, the proposed pro forma adjustments for fee free payment costs
do not meet the Department’s known and measurable standard for pro forma adjustments and
should be eliminated from the NSTAR and WMECo revenue requirements. The effect of
eliminating these adjustments is to reduce pro forma NSTAR expenses by $5,040,200 and to
reduce pro forma WMECo expenses by $897,171.
11. THE DEPARTMENT SHOULD REJECT THE COMPANY’S PROPOSAL
TO ASSIGN ONE THIRD OF REGULATORY ASSESSMENTS TO BASIC
SERVICE CUSTOMERS
For the test year, NSTAR and WMECo booked $6,713,485 and $1,148,553, respectively,
in distribution-related regulatory assessments for the Department and the AGO. Exh. ES-DPH-
1, p. 90; Exh. ES-DPH-2 (East), Sch. DPH-17, column D; Exh. ES-DPH-2 (West), Sch. DPH-17.
143
Those amounts were updated in the Company’s May 25 cost of service update, with totals of
$7,389,985.86 for NSTAR and $1,267,327.11 for WMECo. Exhs. ES-DPH-2 (East and West),
Sch. 17 (May 25 revision). The Company’s current method for allocating regulatory
assessments begins with allocation of a proportion of the assessments to the operating company
(NSTAR or WMECo) based on each company’s share of total intra-state operating revenues.
Exh. ES-DPH-1, p. 90. In discovery, the Company was asked how it currently allocates
regulatory assessments among the rate classes. It responded with an exhibit that shows that it
allocates 100 percent of amounts assigned to the operating company to the various rate classes
using rate base as the allocator. Exh. AG-61-1, Att. AG-61-1(a).
The Company has proposed a new, rather novel formula that first assigns regulatory
assessment costs to basic service customers and then allocates a portion of the remaining costs to
the same basic service customers. The Company proposes to assign approximately one-third of
the regulatory assessment costs to basic service customers and then recover those costs through
the basic service reconciling mechanism. Exh. ES-DPH-1, p. 91. The Company proposes to
allocate the remaining two-thirds to all of the classes, including the classes that contain basic
service customers, using rate base as the allocator. Exh. AG-61-1, Att. AG-61-1(b). The
Company would then recover that two-thirds share through base rates. The Company’s stated
rationale for this change is that 33 percent represents the portion of total intra-state operating
revenues related to basic service in 2015. Exh. ES-DPH-1, p. 91. Coincidentally, the
Company’s new proposal has the effect of artificially reducing its base rate revenue requirement
by a total of $2,563,192 in the initial filing and by $2,822,468 in the revised May 25 filing, while
increasing basic service charges by an equivalent amount.
144
The Company’s proposal violates at least two of the Department’s ratemaking principles.
The Department’s rate design policy is based on principles of efficiency and simplicity as well as
continuity of rates, fairness between rate classes and earnings stability. Massachusetts Electric
Company and Nantucket Electric Company, D.P.U. 09-39, p. 401 (2009). The Department has
held that “[f]airness means that no class of consumers should pay more than the costs of serving
that class. Id., p. 402. The Company’s proposal is neither fair nor in accordance with cost
causation principles.
Singling out a particular group of customers from different rate classes for a rate increase
based on the revenues they generate rather than the cost of serving their rate classes is arbitrary
and unfair. The Company provided no evidence that one-third of the work of the Department
and the AGO, as represented by these assessments, is devoted to Eversource basic service
matters. Such evidence simply does not exist.
The specific work that the Department does for basic service customers is minimal
compared to all of work it does to oversee the Company. Regulating basic service should not
include much more than reviewing the responses to requests for proposals as well as the recovery
and reconciliation of the resulting costs. Indeed, basic service should require a relatively small
portion of the Department’s total resources, when compared to the resources required for the
base rate cases, the many reconciliation clauses, the financing cases, energy efficiency plans, and
all of the other proceedings and responsibilities that are required to oversee the Company. There
is no basis for the Company to assume that more than one-third of the Department’s resources
are required to oversee basic service.
Furthermore, the Company’s new assignment formulas falsely assume that customers on
competitive supply require absolutely no Department resources, when in fact, those customers

145
require significantly more resources than basic service customers. First, the Department licenses
all competitive electric supply companies in the Commonwealth and plays a significant role in
their oversight. See, e.g., G.L. c. 164, § 1F; G.L. c. 164, § 102C(b); 220 CMR §§ 11.05, 11.07;
see also Interim Guidelines for Competitive Supply Investigations and Proceedings, D.P.U. 16-
156-A (July 6, 2017). Second, the Department has decided to gather data, operate, and maintain
a website to compile the competitive supplier offers to retail customers which again requires
significant resources. Energy Switch Massachusetts, http://www.energyswitchma.gov/ (last
visited on July 20, 2017). Third, the Department receives complaints from town officials and
customer complaints through its consumer division regarding competitive suppliers, which again
requires significant resources. See Initiatives to Improve the Retail Electric Competitive Supply
Market, D.P.U. 14-140, Vote and Order Opening Investigation, pp. 3, 12 (Dec. 11, 2014).
Fourth, the Department adjudicates an increasing number of dockets concerning municipal
aggregation plans. For example, the Department has received eighteen petitions seeking
approval for municipal plans that have been filed in just the first seven months of this year. See,
e.g., Town of Easton, D.P.U. 17-109 (June 30, 2017); City of Marlborough, D.P.U. 17-47 (April
20, 2017); Town of Billerica, D.P.U. 17-44 (April 20, 2017). Clearly, the Department employs
resources for competitive supply customers that equal, if not exceed those required for basic
service customers. Therefore, the Company’s assumption that competitive supply customers
should not be assigned regulatory costs is demonstrably wrong.
The Company’s proposed allocation of 33 percent of regulatory assessment costs to basic
service customers should accordingly be rejected as not supported by the evidence and not in
accordance with the Department’s ratemaking principles. Instead, the Department should order
the Company to continue to allocate all regulatory assessment costs and recover those costs
146
through base distribution rates from all customers, using the general allocators that the
Department normally uses.
12. THE PROPOSED PRO FORMA ADJUSTMENT FOR GIS
VERIFICATION COSTS IS SPECULATIVE AND SHOULD BE REJECTED
As described by Company Witness Horton, NSTAR is planning to upgrade its current
Geographic Information System (“GIS”) to improve identification of and response to customer
outages, implement automated communication with customers, and manage the distribution
system. Exh. ES-DPH-1, p. 100. The GIS Verification Project will entail “a full system field
review, data collection, and data assembly into a format that can be uploaded into the Company’s
GIS system.” Id., p. 103. The project is estimated to cost $5,956,381. Exh. ES-DPH-2 (East),
Sch. DPH-20, May 25, 2017 Update. Because the cost will be a non-recurring expense, the
Company is proposing to amortize the cost of the GIS Verification Project over five years. The
annual amortization expense included in the NSTAR revenue requirement is $1,191,276. Id.
The Department should not allow the GIS Verification Adjustment, because the costs
associated with it are not known and measurable. A proposed adjustment to test year expense
requires a finding that the adjustment constitutes a “known and measurable” change to test year
cost of service. See Eastern Edison Company, D.P.U. 1580, pp. 13-17, 19 (1984); Western
Massachusetts Electric Company, D.P.U. 85-270, p. 141 n.21 (1987). A “known” change means
that the adjustment must have actually taken place, or that the change will occur based on the
record evidence. Fitchburg Gas and Electric Light Company, D.P.U. 98-51, p. 62 (1998). A
“measurable” change means that the amount of the required adjustment must be quantifiable on
the basis of record evidence. Id. At the time of the Company’s original filing, the actual cost of
the GIS Verification Project was not known. Exh. AG-19-26. In response to discovery, the
Company stated that it was still in the technical review stage of the project and still analyzing
147
and reviewing vendor responses to the RFP to finalize vendor selection. Exhs. ES-DPH-1, p.
103; AG-19-26. Although NSTAR eventually submitted a contract for the GIS Verification
Project, the Company also acknowledged that the contract would be subject to regulatory approval.
Exhs. AG-42-17(c); AG-50-23; Tr. Vol. XIII, p. 2777. In addition, work on the project will not be
completed until 2018, which would be some one and a half to two and a half years after the end
of the test year, and costs associated with the project are likely to change during such a long
period of time. Tr. Vol. XII, pp. 2776−2777.
In addition, the Department should not allow the GIS Verification Adjustment because,
while an annual expense of $1,191,276 is not immaterial, it is not outside the normal “ebb and
flow” of changes in expenses over time for a company the size of NSTAR. See Dedham Water
Company, D.P.U. 1217, pp. 7−9 (1983); Bay State Gas Company, D.P.U. 1122, pp. 46-49 (1982)
(finding adjustments for post-test year changes in revenues should not be made unless the change
is significant).
The expense related to the GIS Verification Project will not be incurred until some two
years after the end of the test year, and is not known and measurable at this time. Further, the
increase in annual expense related to the GIS Verification Project is not outside the normal “ebb
and flow” of changes in expenses over time. Therefore, the Department should reject the pro
forma adjustment for the GIS Verification Project. The effect of eliminating this adjustment is to
reduce pro forma NSTAR expenses by $1,191,276.
13. RATE CASE EXPENSE
The Company has not carried its burden to justify full recovery of its rate case expenses.
The Department has made clear that it views with great and growing concern the costs borne by
electric and gas companies associated with rate case expense and has directed companies to
148
control these costs. Massachusetts Electric Company and Nantucket Electric Company, each
d/b/a National Grid, D.P.U. 15-155, pp. 234-35 (2016); NSTAR Gas Company, D.P.U. 14-150,
pp. 224-27 (2015); Fitchburg Gas & Electric Company, d/b/a Unitil, D.P.U. 11-01/11-02, p. 270
(2011); Boston Gas Company/Colonial Gas Company/Essex Gas Company, D.P.U. 10-55, pp.
343-44 (2010). In seeking recovery of rate case expenses, companies must “provide an adequate
justification and showing, with contemporaneous documentation, [that] their choice of outside
services is both reasonable and cost-effective.” D.P.U. 15-155, p. 236, citing New England Gas
Company, D.P.U. 10-114, p. 222 (2010); Boston Gas Company, D.T.E. 03-40, p. 153 (2003).
The Department should disallow the Company’s rate case expense for (1) the Company’s
“second” rate design proposal; (2) costs for its PBRM and Allocated Cost of Service consultants
that exceed the budgets submitted by lower cost bidders on those subjects; and (3) rate case
expense for its temporary employees.
a) Ratepayers Should Not Pay for Rate Design Twice
The Department should disallow all of the Company’s rate case expense associated with
its “second” rate design proposal. The Company may only recover for rate case expense that is
reasonable, appropriate, and prudently incurred. D.P.U. 15-155, p. 234, citing D.P.U. 10-114,
pp. 219-20; Bay State Gas Company, D.P.U. 09-30, p. 227 (2009).
It would be inappropriate for ratepayers to pay for the Company’s imprudence in making
one rate design proposal in its initial filing and then developing and supporting a completely new
rate design proposal in the middle of the case. In its initial filing, the Company submitted
testimony regarding an increase in base distribution rates as well as multiple other complex
issues to be determined, such as a PBRM, a merger and consolidation of WMECo and NSTAR,
and $400 million in future capital spending on grid modernization. See generally, Exhs. ES-

149
CAH-1; ES-GMBC-1; ES-PBRM-1; ES-RDP-1. The Department and intervenors issued over a
hundred of sets of information requests combined, including dozens of questions regarding rate
design. The Company’s rate design panel filed testimony and rebuttal testimony. Exhs. ES-
RDP-1; ES-RDP-Rebuttal-1. However, on June 1, 2017, the Company chose to submit a
“refined rate design” proposal and supporting documents. Exhs. ES-RDP-2 (ALT1); ES-RDP-3
(ALT 1); ES-RDP-5 (ALT1); ES-RDP-6 (ALT1); ES-RDP-7 (ALT1); ES-RDP-8 (ALT1); ES-
ACOS 2-6 (ALT1). This new rate design was substantially different than the proposal in its
original filing and rebuttal testimony. As the Department correctly found, this new filing
required an entirely new discovery period and evidentiary hearing. Interlocutory Order on
Attorney General’s Motion to Protect Intervenors’ Due Process Rights, D.P.U. 17-05, pp. 12-14
(June 9, 2017). The Company did not appeal the Department’s order.
Due to the Company’s own imprudence, this case has now extended beyond the original
schedule, requiring further analysis by the Company’s rate design experts. Several more sets of
information requests have been issued on rate design and the Company will now have to prepare
for evidentiary hearings with their rate design panel, incurring additional rate case expense that
the Company seeks to recover as part of its rate case expense.
The excess rate case expense for this additional work should be born solely by the
Company because this additional work was due directly to the Company’s own imprudence. The
Company was solely responsible for the development of its rate design proposal in its initial
filing, which it later chose to replace with a new rate design on the eve of evidentiary hearings.
These expenses go well beyond the typical rate case expenses. Should the Company be allowed
to recover these extra expenses, it will benefit directly by strategically delaying a supplemental
filing and forcing an additional hearing. The Department has consistently held that it requires
150
companies to contain rate case expenses. See, e.g., D.P.U. 15-155, p. 234, citing Fitchburg Gas
and Electric Light Company, D.P.U. 07-71, p. 99 (2008); D.T.E. 03-40, pp. 147-48; Fitchburg
Gas and Electric Light Company, D.T.E. 02-24/25, p. 192 (2002). Yet, the Company’s actions
here have accomplished the opposite. Accordingly, the Department should disallow the recovery
of these expenses.
b) The Company’s Rate Case Expense for its PBRM and Allocated
Cost of Service Experts Is Excessive
Moreover, the Department should disallow a portion of the Company’s rate case
expenses for its PBRM and Allocated Cost of Service experts because the Company’s expenses
are excessive. In seeking recovery of rate case expenses, companies must “provide an adequate
justification and showing, with contemporaneous documentation, [that] their choice of outside
services is both reasonable and cost-effective.” D.P.U. 10-70, p. 153; see also D.T.E. 02-24/25,
p. 192 citing D.T.E. 98-51, p. 61; D.P.U. 07-71, pp. 139-40. The Company bears the burden to
demonstrate that its choices of outside consultants and legal service provider are reasonable and
cost-effective. D.P.U. 15-155, citing Boston Gas Company, D.P.U. 10-55, p. 343 (2011); D.P.U.
09-30, pp. 230-31; D.T.E. 03-40, p. 153. The Department has explained that a company need not
go with the lowest bidder, provided however, that “[i]f a company engages an outside consultant
or legal counsel who is not the lowest bidder in the competitive bidding process, the company
must provide adequate justification of its decision to do so.” D.T.E. 03-40, p. 153.
Here, the Company failed to meet its burden to prove that there was adequate justification
for not selecting the lowest bidder for its PBRM and Allocated Cost of Service experts. The
Company’s PBRM expert, Christensen Associates, and allocated cost of services expert,
Concentric, were not the lowest bidders. Yet, there is nothing in the record that provides
adequate justification for selecting Christensen Associates and Concentric over lower cost
151
bidders. Indeed, the lower cost bidders for the Company’s PBRM and allocated cost of service
work each had substantial utility regulatory experience and expert familiarity in their respective
subject matters. Atts. AG-4-5(l), (k) CONFIDENTIAL.
The Company has also failed to adequately control its costs for its PBRM and Allocated
Cost of Service experts. As of the beginning of April, Christensen Associates already submitted
invoices totaling nearly $300,000. Atts. AG-4-10(c) (Supplemental 1, 2 & 3). Concentric
submitted invoices totaling over $570,000. Atts. AG-4-10(d). These totals do not include
evidentiary hearings and any work on the Company’s briefs, and yet both Christensen Associates
and Concentric are each exceeding the budgets in their original bids. Atts. AG-4-5(n), (i)
CONFIDENTIAL.
Accordingly, the Department should disallow all rate case expense for its PBRM and
Allocated Cost of Service consultants that is in excess of the budget submitted by the lower cost
bidders for those subject areas. Atts. AG-4-5(l), (k) CONFIDENTIAL. This is the appropriate
result because the Company failed to adequately justify its selection of its PBRM and Cost of
Service consultants over lower cost bidders, and because the Company failed to control those
consultants’ costs after they were selected.
c) The Company Should Not Recover Rate Case Expense for Its
Temporary Employees
The Department should disallow the Company’s rate case expense associated with
temporary employees. It is not reasonable and prudent to recover these costs from ratepayers
because ratepayers already pay for this work by funding the Company’s Rates and Revenue
Department and because the timesheets submitted by the Company suggest that the Company
has included non-rate case work as part of its expense associated with temporary employees.
152
First, the Department should disallow the Company’s temporary employee costs because
the Company already has a full Rates and Revenue Requirements Department. The Company
had between 11 and 13 full-time employees in its Rates and Revenue Requirements Department
during 2015 and 2016. Att. AG-47-6. This staffing level should have been sufficient for the
Company to prepare its rate case. Indeed, other investor owned utilities have required few or no
temporary employee assistance for their rate case expense. See, e.g., D.P.U. 15-155, pp. 228-29
(no request for temporary employee rate case expense); D.P.U. 14-150, pp. 219-20 (citing DPU
21-20); D.P.U. 10-55, p. 313 (citing RR-DPU-46(A) (Supp. 3)); Massachusetts Electric
Company, D.P.U. 09-39, p. 278-79 (2009). Here, Eversource requests that the Department allow
expenses for seven temporary employees over an eighteen-month period. Exhs. AG-4-10; Atts.
AG-4-10(i); AG-4-10(i) (Supplemental 2 & 3); AG-47-3; AG-47-5. It would not be appropriate
to charge ratepayers for these temporary employees when ratepayers are already fully funding
Eversource’s sizeable and capable Rates and Revenue Requirements Department. In addition,
over half of the temporary employees have retired from the Company. Exhs. DPU-21-20; AG-
47-4(c); AG-47-4(d); AG-47-4(f); AG-47-4(g). This means that ratepayers are essentially
paying for these temporary employees twice: once via a pension payment from their retirement
and again for the work they are currently performing. Accordingly, the Company has not met its
burden that these expenses are reasonable or cost-effective, and the Department should disallow
them.
Even if it was reasonable and prudent to charge ratepayers for these temporary
employees, the Department should still disallow these costs from rate case expense because
Company has not satisfied its burden to prove that they relate solely to the rate case. The
Company uses the same firm to provide temporary employees on a recurring basis, not just for
153
the current proceeding. Exh. DPU 21-20. The Company identifies seven temporary employees
to provide assistance in preparing for the rate case. Exhs. DPU-21-20; AG-47-3; AG-47-4. Four
of these temporary employees were former employees of the Company who are now retired.
Exhs. DPU-21-20; AG-47-4(c); AG-47-4(d); AG-47-4(f); AG-47-4(g). A temporary employee
who the Company did not identify as working on the rate case appears on the Company’s
timesheets starting January 2017. Exhs. Atts. AG-4-10(i) (Supplemental 2 & 3)
CONFIDENTIAL; DPU-21-20; AG-47-3; AG-47-4. Coincidentally, her regular bill rate is also
the highest at nearly three times more than the next highest bill rate. Exhs. Atts. AG-4-10(i)
(Supplemental 2 & 3) CONFIDENTIAL. Because the Company uses temporary employees
from this firm on a recurring basis, this temporary employee’s timesheets suggest that other
temporary employee timesheets submitted as rate case expense include time worked on other
company matters and not just its rate case. Moreover, the hours worked by the temporary
employees that the Company did list as working on the rate case are also questionable because
there is no indication in these timesheets that their time was spent solely for rate case issues.
These temporary employees may have worked on projects for the Company outside of this
proceeding, yet their time was billed identically as hours worked per day, and the Company
includes all of their time as part of its rate case expense.
Accordingly, the Company has failed to meet its burden to prove that its temporary
employee expense was reasonable and prudent and the Department should disallow it from the
Company’s rate case expense.

154
E. DEPRECIATION
The Company’s proposed depreciation accrual rates are excessive and the Department
should adjust them. The AGO’s Depreciation Witness, William W. Dunkel, identified several
issues with the Company’s proposed Depreciation rates related to net salvage.39 First, the
Company’s current depreciation rates have created a large and growing Percent Reserve, and the
Company’s proposed depreciation rates will continue to grow the reserve to the detriment of
ratepayers. Second, the “net salvage” values proposed by Company witness John J. Spanos are
several times what the Company actually incurs for net salvage and would produce significantly
higher depreciation accrual rates than the current net salvage values, everything else being equal.
Third, Mr. Spanos overstates the Company’s depreciation expense by including future inflation
in his net salvage calculations. Fourth, Mr. Spanos’s proposal to inappropriately collect future
inflation will harm ratepayers. As discussed in more detail below, the Department should reject
the Company’s proposed net salvage values and adopt Mr. Dunkel’s recommendations. In the
alternative, the Department should apply gradualism and limit any change in the net salvage
value accrual rates to no more than 20% of the existing net salvage accrual rate.
1. EVERSOURCE’S PERCENT RESERVE IS LARGE AND GROWING
It is undisputed that the Company’s current depreciation rates have been growing the
“Percent Reserve.” Book Percent Reserve is an important factor in depreciation calculations.
See Att. RR-DPU-26, p. 65 (Public Utilities Depreciation Practices published by NARUC). The
Percent Reserve measures the portion of depreciated plant that has already been recovered from
39 Mr. Dunkel’s testimony concerned only the Company’s proposed net salvage, and he did not provide any
testimony on the Company’s lives, depreciation formulas, or accounting practices related to depreciation. See Exh.
AG-WWD-1, p. 43. Mr. Spanos acknowledged that other than the net salvage estimates, Mr. Dunkel “has not
recommended changes to the service life estimates or to other aspects of the studies.” Exh. ES-JJS-Rebuttal, pp. 1–2.

155
past ratepayers. Id., pp. 64–65.40 As Mr. Dunkel testified, “[w]hen the depreciation accruals are
significantly higher than the actual incurred net salvage and the actual retirements, the
depreciation reserve grows rapidly.” Exh. AG-WWD-1, p. 19. For NSTAR and WMECo
combined, the book Percent Reserve was 28.2 percent at the time of the prior depreciation
studies. Id., p. 20. However, the book Percent Reserve grew to 31.8percent in the June 30, 2016
depreciation studies—an increase of 3.6 percent. Id.41 During the time period between the
Company’s prior depreciation studies and the depreciation studies filed in this case, the
depreciation accruals have been $19.2 million per year higher than needed to maintain a constant
Percent Reserve. Id.; see Exh. AG-WWD-5 (calculating the changes in the Percent Reserve);
Exh. AG-WWD-13 (containing documents from both studies supporting the calculations of the
changes in the Percent Reserve). The Company does not dispute the size of the Percent Reserve
or the fact that it is growing. In addition, the amount actually in the overall book Depreciation
Reserve is now at least at the amount it theoretically should be at. Exh. AG-WWD-7; Exh. AG-
WWD-1, pp. 23–24.
Mr. Spanos’ proposed depreciation rates would continue to grow the Percent Reserve by
$11.2 million per year (down from $19.2 million in current rates). Exh. AG-WWD-1, p. 20;
Exh. AG-WWD-5; See Exh. ES-JJS-1, p.4 (showing $8.0 million difference between current and
proposed rates). The Company provides no reason why it should continue to collect millions of
dollars a year in depreciation expense to continue growing the Percent Reserve. The fact that the
Percent Reserve continues to grow confirms that the Company’s depreciation accruals are
40 The Percent Reserve is calculated by dividing the “book depreciation reserve” by the “book cost of the Gross
Plant.” Id., p. 65. 41 Moreover, the book Percent Reserve is actually slightly higher than the amount that is in the theoretical Percent
Reserve. Exh AG-WWD-7. The Company’s own theoretical reserve analysis confirms that the overall Book
Reserve is slightly higher than the theoretical reserve. Exh. AG-6-20; Exh. Att. AG-6-20(a); Exh. Att. AG-6-20(b).
156
significantly higher than the actual incurred net salvage and the actual retirements. The
Department should, therefore, find that there is no reason to charge ratepayers millions of extra
dollars per year to further increase the Percent Reserve and adjust the Company’s depreciation
rates accordingly.
2. THE COMPANY PROPOSES TO CHARGE RATEPAYERS ALMOST
THREE TIMES THE NET SALVAGE ACTUALLY INCURRED
The Company’s proposed net salvage factors in this proceeding are much higher than the
amounts the Company actually incurs for net salvage and also represent a significant increase
from the Company’s currently approved net salvage factors. The Company’s proposal to collect
far in excess of what the Company actually incurs for net salvage would exacerbate the
Company’s large and growing Percent Reserve.
When all of the NSTAR and WMECo distribution accounts are included, Company
records show that the amount the Company actually incurs for net salvage averages $14,755,633
per year. Exh. AG-WWD-1, p. 10. However, under the Company’s proposed depreciation rates,
the Company would charge ratepayers $42,726,188 per year for net salvage for these same
accounts. Id. This amounts to charging ratepayers 2.9 times more for net salvage than the
Company actually incurs. Id., p. 15.
When considering individual accounts, the amount that the Company proposes to
overcharge customers can be considerably higher. For example, for NSTAR Account 366-
Underground Conduit, the Company’s own documents show that the net salvage amount actually
incurred averages $467,417 per year over the three most recent years. Exh. AG-WWD-1; Exh.
AG-WWD-8; Exh. ES-JJS-2, p. 159. However, the Company proposes to charge ratepayers
$4,807,723 annually for net salvage for this account. Exh. AG-WWD-10; Exh. AG-WWD-1, pp.

157
10–14. For this account, therefore, the Company proposes to charge over ten times as much for
net salvage in the annual depreciation expense as the annual net salvage it actually incurs.
Mr. Dunkel performed a similar comparison showing the Company’s proposed rates
versus current rates for each distribution plant account. Exh. AG-WWD-1, p. 15. When all of
the Company’s distribution accounts are included, the Company’s proposal amounts to charging
ratepayers 2.9 times as much for net salvage as the average net salvage the Company actually
incurred. Mr. Spanos did not deny these numbers, and agreed that “net salvage accruals
currently exceed net salvage costs.” Exh. ES-JJS-Rebuttal, p. 42.
Furthermore, the Company’s proposed net salvage factors are significantly higher than
the currently approved net salvage factors. Overall, the Company’s proposed changes to the
NSTAR and WMECo distribution net salvage factors would increase the annual depreciation
accruals by a total of $3.7 million over the current net salvage factors. Exh. AG-WWD-1, p. 17.
For example, while NSTAR Account 366-Underground Conduit has a currently approved net
salvage factor of negative 35 percent, Mr. Spanos proposes a negative 60 percent net salvage
factor. Id., p. 18. The Company’s proposed net salvage factor of negative 60 percent produces
an annual accrual that is $2,526,650 higher than produced by the currently approved negative 35
percent net salvage factor for this one account. Id.
Mr. Spanos’ proposal is also out of step with other similarly situated utility companies.
The survey data that Mr. Spanos provided in response to Exhibit AG-6-17 indicates that the
average net salvage percent for Account 366-Underground Conduit is negative 22 percent for the
utilities in the survey. Exh. AG-WWD-1, p. 25. This negative 22 percent is significantly less
negative (and thus would result in a lower depreciation expense attributable to net salvage) than
the negative 60 percent net salvage factor Mr. Spanos proposes in this proceeding. Ultimately,
158
the Company’s proposal would result in excessive depreciation accrual rates and should be
rejected.
3. MR. SPANOS INAPPROPRIATELY CHARGES TODAY’S
RATEPAYERS FOR FUTURE INFLATION
The principal reason why the Company’s net salvage analysis produces excessive
depreciation accrual rates is the fact that Mr. Spanos includes future inflation in his net salvage
calculations. In conducting his net salvage calculations, Mr. Spanos gave more weight to net
salvage “as a percent of retirement,” which includes future inflation. Exh. AG-WWD-1, p. 36;
see Exh. ES-JJS-1, p. 13 (noting that the “statistical analyses consider the cost of removal and
gross salvage ratios to the associated retirements…” (emphasis added)).42 The problem with
giving significant weight to the “as a percent of retirement” analysis is that this percentage is
calculated using inconsistent dollar values due to inflation. Exh. AG-WWD-1, pp. 34–36.
Regarding the use of “percent of retirement” or “salvage ratio” Depreciation Systems, a standard
Depreciation textbook provides:
One inherent characteristic of the salvage ratio is that the numerator
and denominator are measured in different units; the numerator is
measured in dollars at the time of retirement, while the denominator
is measured in dollars at the time of installation.
Exhibit AG-WWD-Surrebuttal-1, p. 4, n. 10. To avoid the mixture of different dollar
values, Depreciation Systems states that “[a] first step in salvage analysis is to convert the
observed dollars to constant dollars.” Id., pp. 2–3; Exh. AG-WWD-Surrebuttal-2.
Mr. Spanos, however, failed to conduct the “first step” to “convert the observed dollars to
constant dollars.” See id. Rather, it is clear from the results of Mr. Spanos’ studies that he relied
42 The standard net salvage analysis for an account produces two types of results (expressed in two separate columns
in the depreciation studies): the results can be stated in terms of “dollars” and “as a percent of retirement.” Exh.
AG-WWD-1, pp. 33–34.
159
heavily on the mixture of different dollar values inherent in the “as a percent of retirement”
analysis to produce his recommendations. Exh. AG-WWD-1, p. 36. Mr. Spanos’ analysis
produces misleading results because it includes the impact of inflation that occurs between the
time the investment goes into service and the time it retires. Exh. AG-WWD-1, p. 37, citing
Depreciation Systems, p. 53.
For example, in 2013, WMECo retired plant in Account 364 that had an original cost of
$27,766 when it was installed in the year 1955. Exh. AG-WWD-1, p. 38. This $27,766 original
cost is therefore in year-1955 dollars. Id. According to the Consumer Price Index-U, the year-
1955 dollars are worth 8.7 times the year-2013 dollars. Id. Obviously, it would have been
unreasonable to charge someone back in 1955 (in more valuable year-1955 dollars) for the net
cost of removal based on what the net cost of removal would be in lower-value year-2013 dollars
(fifty-eight years in the future). Exh. AG-WWD-1, p. 39.
However, Mr. Spanos proposes to do just that. If the Department adopts Mr. Spanos’
recommendation, the result would be to charge ratepayers in today’s dollars based upon what the
lower value of the dollar is expected to be 28 years in the future. Tr. Vol. IX, pp. 1772–73. Mr.
Spanos’ failure to convert to constant dollars results in net salvage recommendations that are far
more negative than they would be otherwise. For example, for WMECo Account 364, Mr.
Spanos recommends negative 60 percent net salvage for WMECo Account 364. As Mr. Dunkel
explained at evidentiary hearings, if Mr. Spanos had properly converted to constant dollars, he
would have calculated only negative 37 percent net salvage for this account. See Tr. Vol. IX, p.
1771–73.
Calculating net salvage based on a cost in dollars that are worth only a fraction of today’s
dollar, as Mr. Spanos does, does not result in a cost-based rate. NARUC’s Public Utility
160
Depreciation Practices clearly states that future inflated costs should not be used. Att. RR-DPU-
26, pp. 21–22. Specifically, discussing the “Impact of Inflation and Deflation” NARUC states:
A cost depreciation base conforms to the accepted accounting
principle that operating expenses should be based on cost and not be
influenced by fair value estimates nor by what costs may be at some
future date.
Id. (Emphasis added). Accordingly, the Department should reject Mr. Spanos’ proposed net
salvage factors, which include future inflation, and adopt Mr. Dunkel’s proposed net salvage
factors, which do not.
4. RATEPAYERS WILL BE HARMED BY THE COMPANY’S PROPOSAL
The Company’s request to inappropriately charge for future inflation for its net salvage
expense will harm ratepayers. Mr. Spanos’ proposal creates a non-cost based subsidy, whereby
present ratepayers pay higher depreciation rates today, and ratepayers in the future may receive
benefits in terms of a smaller rate base and lower returns.43 Individual ratepayers who pay the
subsidy may move to another service territory before any benefits are realized. Tr. Vol. IX, p.
1793. Even ratepayers who stay in Eversource’s service territory will be harmed by Mr.
Spanos’s proposal. As Mr. Dunkel testified, the Federal Reserve Bulletin reported that “38.1
percent of families held credit card debit in 2013. Exh. AG-WWD-Surrebuttal-1, p. 35. The
average interest rate on credit card balances was 12.35 percent in 2016 according to the Federal
Reserve. Id., p. 36. These families would be better off financially by using any extra funds to
pay down their credit card balances rather than paying extra in their electricity rates in order to
43 Pursuant to current Department ratemaking policy, the Department will deduct any excess depreciation expense
from the Company’s rate base in the Company’s next base rate case, which will result in the Company receiving a
lower return.
161
secure a possible “benefit” of a lower future rate base for Eversource. Id.; Tr. Vol. IX, pp. 1793–
94.
Mr. Spanos’ proposed subsidy has no apparent public policy purpose. The entire purpose
of the subsidy appears to be Eversource’s interest in receiving more money up front. Tr. Vol.
IX, pp. 1791–94.
5. THE DEPARTMENT SHOULD ADOPT MR. DUNKEL’S
RECOMMENDATIONS
Mr. Dunkel’s recommended depreciation rates would help stem the increase in the
Percent Reserve and would result in a lower depreciation expense to be recovered from
ratepayers. Mr. Dunkel performed an account by account analysis considering the current
approved rates, gradualism, the average annual net salvage actually incurred by account in the
most recent three years, and a different band showing the average annual net salvage actually
incurred by account in the most recent five years. Tr. Vol. IX, pp. 1758–60. Separately for each
distribution account Mr. Dunkel compared the accruals for net salvage that would result from his
proposed net salvage factors to the average annual net salvage actually incurred by account.44
Exh. AG-WWD-1, Table 2, p. 28.
The net salvage factors Mr. Dunkel recommends are shown on Table 3 of Mr. Dunkel’s
direct testimony and reproduced below. Exh. AG-WWD-1, Table 3, p. 31.
44 This method of comparing the accruals for net salvage that would result from the proposed net salvage factors to
the average annual net salvage actually incurred is the same net salvage analysis method adopted in the recent final
decision of the Public Utilities Regulatory Authority in Connecticut in Docket No. 16-06-04. Exh. AG-WWD-1, pp.
16–17.
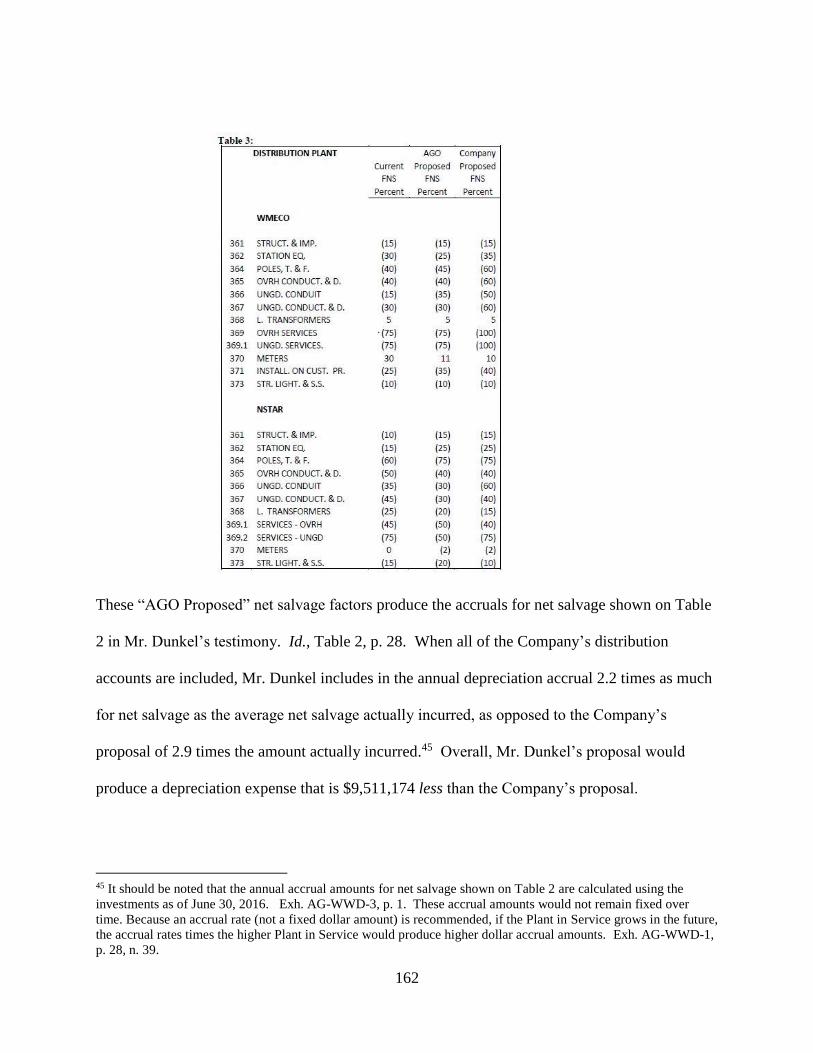
162
These “AGO Proposed” net salvage factors produce the accruals for net salvage shown on Table
2 in Mr. Dunkel’s testimony. Id., Table 2, p. 28. When all of the Company’s distribution
accounts are included, Mr. Dunkel includes in the annual depreciation accrual 2.2 times as much
for net salvage as the average net salvage actually incurred, as opposed to the Company’s
proposal of 2.9 times the amount actually incurred.45 Overall, Mr. Dunkel’s proposal would
produce a depreciation expense that is $9,511,174 less than the Company’s proposal.
45 It should be noted that the annual accrual amounts for net salvage shown on Table 2 are calculated using the
investments as of June 30, 2016. Exh. AG-WWD-3, p. 1. These accrual amounts would not remain fixed over
time. Because an accrual rate (not a fixed dollar amount) is recommended, if the Plant in Service grows in the future,
the accrual rates times the higher Plant in Service would produce higher dollar accrual amounts. Exh. AG-WWD-1,
p. 28, n. 39.
163
The Department should approve Mr. Dunkel’s net salvage factors in order to “move in
the direction of a more reasonable relationship between the depreciation accrual for net salvage
that is charged to the ratepayers compared to what the Company actually incurs for net salvage.”
Exh. AG-WWD-1, p. 26. This would be a gradual improvement, taking into consideration the
interest of ratepayers as well as the Company’s shareholders.
6. IN THE ALTERNATIVE, THE DEPARTMENT SHOULD EMPLOY
GRADUALISM AND NOT ADOPT ALL OF THE COMPANY’S PROPOSED NET
SALVAGE FACTORS
In this proceeding, Eversource proposes net salvage factors that are significantly more
negative than the net salvage factors that are part of its current rates. Even if the Department
elects not to adopt Mr. Dunkel’s recommendations, it should nonetheless adopt net salvage
factors that are less negative than the factors that Mr. Spanos proposes under the principal of
gradualism. The Department considered gradualism when evaluating the reasonableness of a
company’s proposed net salvage factors. See Fitchburg Gas and Electric Light Company,
D.P.U. 15-80/15-81, pp. 217–18 (2016).
In this case, Mr. Spanos proposes making several of the net salvage factors for some of
the Company’s most significant accounts much more negative than the Company’s previously
approved factors. See Table 3, supra; Exh. AG-WWD-1, Table 3, p. 31. For example, Mr.
Spanos proposes to change the net salvage factors for WMECo Accounts 364 and 365 (Poles and
Overhead Conductors, respectively) from negative 40 percent to negative 60 percent and
WMECo Account 366 (Underground Conduit) from negative 15 percent to negative 50 percent.
Id. Mr. Spanos states that he based his net salvage recommendations on a “combination of
statistical analyses and informed judgment.” Exh. ES-JJS-1, p. 13. However, even assuming
that his methodology is correct (which, as discussed above, it is not) it is clear that that Mr.
164
Spanos did not sufficiently incorporate the concept of gradualism in making some of his
recommendations. By contrast, in D.P.U. 15-80/15-81, Fitchburg Gas and Electric Light
Company (“Fitchburg”) provided evidence that one of its accounts had an actual net salvage of -
135 percent, and yet, employing gradualism, Fitchburg proposed changing its approved net
salvage factor by only negative 10 percent (from negative 70 percent to negative 80 percent).
See D.P.U. 15-80/15-81, pp. 217–18. Accordingly, if the Department declines to adopt Mr.
Dunkel’s proposed net salvage factors, the Department should similarly limit the Company’s
changes here under the principle of gradualism. A reasonable guideline to effectuate gradualism
would be to limit any change in the net salvage value accrual rates to 20 percent of the existing
net salvage accrual rate. For example, if the Department found it necessary to increase a net
salvage factor of negative 50 percent, the new accrual rate should be no more than negative 60
percent – a 20% increase (-50% x 1.20 = -60%). Employing gradualism will ensure that any
depreciation accrual rates approved in this proceeding are measured and incremental, and will
provide for continuity in rates.
F. VEGETATION MANAGEMENT
1. INTRODUCTION
Eversource makes two proposals relating to its vegetation management activities. First, the
Company proposes a two-staged Resiliency Tree Work (“RTW”) pilot program for: (1) 2017; and
(2) 2018 through 2022. Second, the Company seeks to annualize the vegetation management
expense incurred by NSTAR during the test year. That is, due to the split test-year ending June 30,
2016, coupled with, beginning in 2016, the Company’s changed accounting treatment of enhance
trimming costs, NSTAR’s base distribution rates include “approximately one-half of the actual
level of expense actually incurred.” Exh. ES-VLA-1, p. 17. In the first instance, the Company is
165
advancing a solution in search of a problem. In the second instance, the AGO agrees that the
Company should be allowed an annualization adjustment, but the Company should not have been
capitalizing NSTAR’s enhanced trimming costs in the first place, which then necessitated an
accounting change in 2016, when the Company first began to expense NSTAR’s ETT vegetation
management costs.
a) Reliability Indices for Eversource
Vegetation management is an important factor contributing to an electric distribution
company’s system reliability. Eversource reported that both NSTAR and WMECo are currently
counted among the top-tier utilities for reliability performance. Exh. AG-20-29. That is, for both
the System Average Interruption Duration Index (“SAIDI”) and the System Average Interruption
Frequency Index (“SAIFI”), NSTAR and WMECo placed in the first-quartile, among major U.S.
electric distribution companies, which is indicative of a successful vegetation management
program. Indeed, since 2012, when NSTAR implemented ETT specifications on all primary
sections of circuits, NSTAR has placed in the first-quartile for both SAIDI and SAIFI. Exhs. ES-
VLA-1, p. 11 and AG-GLB-1, p. 24. Equally compelling, the Company’s improved vegetation
management practices for WMECo have resulted in better reliability performance. Whereas, prior
to 2015, WMECo did ETT predominantly on just poor-performing circuits, now WMECo deploys
ETT practices to the backbone of the system, resulting in first-quartile accolades for 2015. Tr. Vol.
V, p. 895; Exh. AG-GLB-1, p. 24.
The Company’s already fulsome vegetation management programs are having
demonstrated positive impacts on system reliability, and are in-line with industry practices.
Notably, however, National Grid in Rhode Island (“NGrid RI”), a peer utility with a similar
vegetation management program, is spending less money on vegetation management per circuit-
166
mile pruned than both NSTAR and WMECo, yet NGrid RI has ranked in the first-quartile since
2012. Exh. AG-GLB-1, p. 26. Thus, the Department should be troubled by Eversource’s request
in this case to significantly increase its annual spending on vegetation management. Rather than
proposing to double its annual vegetation management spending, Eversource should be looking for
ways to economize and perform its vegetation management program activities more efficiently,
like NGrid RI.
b) Eversource Arborists
Currently, the Company employs a team of some twenty-five arborists, who identify hazard
or risk trees for removal along the Company’s circuits. Tr., Vol. V, pp. 897-899. The arborists are
assigned to a defined geographical location, which fosters relationships with Town officials and
tree wardens, and breeds familiarity with the trees and vegetation within their assigned location.
Tr., Vol. V, pp. 898-900. In addition, after the Company’s contractors have performed their
vegetation management responsibilities at their assigned job sites, “[a]rborists conduct field
reviews of all work areas and document any areas of non-compliance by location, correlating the
locations onto circuit maps for the East and West systems.” Exh. ES-VLA-1, p. 14. Arborists are
responsible for auditing the circuits in their designated areas to confirm that the circuits have been
trimmed to the Company’s specifications. Id.; Tr., Vol. V, p. 958. In addition, Company
supervisors and managers “do audits and ride-alongs with the arborists as well as they’re looking at
it.” Tr., Vol. V, p. 961.
The Company is performing quality control on 100 percent of all the vegetation
management work performed on its system. Tr., Vol. V, pp. 903-904. Furthermore, the Company
is in the process of implementing a geographic information system (“GIS”) based system to allow
its arborists to electronically upload their field work and observations into a database so that the

167
Company will be able to track hazard trees and other information gathered by the arborists. Tr.,
Vol. V, pp. 905-906.
Today, all of the Company’s circuits are on a four-year trimming cycle, designed to prune
every circuit once every four years. Exh. ES-VLA-1, p. 11. The Company’s pruning
specifications provide for certain minimum distances between all vegetation and power lines.
Because the Company’s arborists are surveying all work areas along the Company’s distribution
system at least twice during the trimming cycle (i.e., before and after vegetation management work
is performed), it stands to reason that the vegetation surrounding all of the Company’s circuits
along its distribution system are thoroughly inspected by arborists every four years. Tr., Vol. V,
pp. 904-905. In fact, at the end of each four-year trimming cycle arborists will have inspected all
7,946 miles of overhead primary miles for NSTAR and all 3,270 miles of overhead primary miles
for WMECo. Tr., Vol. V, p. 927.
2. RTW PILOT PROGRAM
Currently, 7,445 miles of NSTAR’s primary distribution lines have been pruned to
Enhanced Tree Trimming (“ETT”) clearance zone dimensions of 10 feet x 10 feet x 15 feet. Exh.
ES-VLA-1, pp. 18-19. WMECo’s tree trimming standards, on the other hand, are a blend of ETT
and SMT clearance specifications.46 Exh. ES-VLA-1, p. 13. Notwithstanding the different
clearance zone dimensions, all distribution circuits across the Company’s entire Massachusetts
territory are trimmed on a four-year trimming cycle. Exh. ES-VLA-1, pp. 11, 19. Eversource’s
RTW pilot program aims to expand pruning clearance specifications and tree removal as a means
to improve reliability. Exhs. AG-11-14, p. 1 and AG-20-33(a).
46 Standard clearance specification for Schedule Maintenance Trim (“SMT”) is 8 feet x 8 feet x 12 feet. Exh. ES-
VLA-1, p. 11.
168
If RTW clearance specifications are implemented, the Company will expand clearance
zone specifications to “15 feet to the side of the wire and 25 feet above the wire.” Exh, AG-11-14;
see Attachment AG-11-14 for diagrams of clearance zone dimensions. The Company wants to
apply the wider RTW specification to “at risk” circuits in the name of reliability, but the Company
admits that it does not know whether the wider clearance zone will result in improved reliability.
Exh. AG-11-14, p. 1. Furthermore, with reliability performance being in the first-quartile, it is
unlikely the Company will be able to demonstrate any reliability improvement. Indeed, wider
clearing zones are customarily relied upon by utilities for elongating their clearing cycles and not
for demonstrating any reliability enhancements.
a) 2017 RTW Pilot Program
Notwithstanding the Company’s first-quartile SAIDI and SAIFI rankings, and the
systematic review of the entire distribution system by its arborists, Eversource is proposing a $3.5
million RTW pilot program for 2017 (Exh. ES-VLA-1, p. 22) for which the Company has not
performed a cost-benefit analysis (Exh. AG-20-27). The 2017 RTW pilot program, which is
already underway, employs Light Imaging, Detection and Ranging (“LiDAR”) to inspect along
poor performing circuits as a means to identify where mid-cycle pruning is necessary. Tr., Vol. V,
pp. 932-933; Exh. ES-VLA-1, p. 20. The Company estimates that it will spend $0.65 million on
LiDAR related expenses, and $2.88 million on incremental mid-cycle pruning. Exh. ES-VLA-1, p.
22; Tr., Vol. V, pp. 935-936. By way of comparison, the Company spent just $516,300 on mid-
cycle pruning in 2016. Exh AG-20-31(b); Tr., Vol. V, p. 936. So, the 2017 RTW pilot program
represents incremental mid-cycle pruning expenses of more than 5½ times what the Company
spent in 2016 on mid-cycle pruning. Tr., Vol. V, p. 936.
169
Despite the Company’s bold move to undertake the 2017 RTW pilot program absent
Department approval (Tr., Vol. V, p. 934), the Company’s implemented pilot program lacks any
meaningful measuring stick or a cost-benefit analysis. Exh. AG-20-27. How does the Company,
much less the Department, determine whether this $3.5 million “proof of concept” program
improved reliability, avoided outages, kept the Company in the first-quartile, or benefitted
ratepayers? The Company has made absolutely no attempt to quantify incremental reliability
benefits to justify the substantial pilot program costs.
Stripping out LiDAR expenses from the 2017 RTW pilot program highlights the absurdity
of authorizing the Company to spend an additional $2.88 million on mid-cycle pruning. The ends
do not justify the means. In 2016, Eversource spent more than $23.5 million on vegetation
management, which resulted in top-tier reliability results. Exh. AG-30-31(b). Assuming the 2017
vegetation management program activity spend is the same as 2016, then authorizing the Company
to increase its vegetation management costs by more than 12 percent to undertake $2.88 million of
additional mid-cycle prune, absent a showing of need, is unduly excessive and meritless.
Accordingly, the Department should deny the Company’s request to recover the costs of the
proposed 2017 RTW pilot program.
b) 2018 RTW Pilot Program
The 2018 RTW pilot program promises an initiative to “inspect, evaluate and target all
hazard and risk tree within the fall zone.” Exh. ES-VLA-1, p. 23. To accomplish this scheme, the
Company proposes to spend nearly $26 million per year of ratepayer money from 2018 through
2022. Id. Remarkably, the yearly cost of the 2018 RTW pilot program eclipses the Company’s
entire 2016 distribution vegetation management program by more than $2 million, catapulting the
170
Company’s annual spend on vegetation management to almost $50 million dollars. Tr., Vol. V, p.
937.
Although the Company is proposing to use an aerial LiDAR survey as part of the 2018
RTW pilot program (Exh. ES-VLA-1, p. 24), LiDAR will not aid the Company in its quest to
inspect, evaluate, and target hazard and risk trees within the fall zone because LiDAR cannot
identify hazard or risk trees. Tr., Vol. V, p. 926. The Company defines a hazard tree as one that:
(1) is of sufficient mass that it could cause damage if it fell onto its distribution system; (2) would
hit the distribution system if it fell; and (3) has a condition that makes it likely to fall. Tr., Vol. V,
p. 952; Exh. AG-20-43, p. 1. LiDAR data, however, can determine only one of these criteria --
whether a tree might hit its distribution system if the tree were to fall. Tr., Vol. V, p. 968. In fact,
LiDAR will not inform the Company as to the mass, the health, or the condition of a tree. Tr., Vol.
V, p. 925; Exhs. AG-25-27 and AG-25-29. Consequently, LiDAR will not replace in-person,
visual inspection of potential hazard trees. Tr., Vol. V, p. 968. Ultimately, the Company will
need to rely on arborists, not LiDAR, to identify “the hazard trees that provide an imminent threat
to the distribution system.” Exh. AG-20-33(a), p. 4.
Between the aerial LiDAR survey and the commissioning of a third-party to study tree
species and conditions around the Company’s distribution system, arguably a task already
performed by the Company’s arborists, the Company estimates it will spend $5.9 million over the
course of the 2018 RTW pilot program. Exhs. ES-VLA-1, pp. 24-25 and Attachment AG-20-37,
p. 1; Tr., Vol. V, pp. 929, 931. Further, the costs associated with the aerial LiDAR survey are in
addition to the LiDAR costs associated with the $23.6 million Enhanced Mid-Cycle Prune
program.47 Exhs. ES-VLA-1, p. 23 and AG-20-33(a), p. 5.
47 The 2018 RTW pilot program is a five-year pilot program. The Company estimates that one year of Enhanced
Mid-Cycle Prune will cost $4,720,000. Exh. ES-VLA-1, p. 23.
171
At a total cost of nearly $130 million,48 the 2018 RTW pilot program is more bloated and
unwarranted than the 2017 RTW pilot program. Like the 2017 RTW pilot program, this program
is much ado about nothing and devoid of a cost-benefit analysis. The Company does not need
LiDAR or a commissioned study to understand the vegetation vulnerabilities of its distribution
system. The Company does not need to double its annual vegetation management budget to
maintain system reliability. NSTAR’s first-quartile reliability performance results from 2012
through 2015 are ample evidence that the Company’s enhanced clearance zone efforts coupled
with enhanced tree removal (“ETR”), which targets “the removal of risk and hazard trees to
improve reliability,” are working effectively. Exh. ES-VLA-1, p. 12. Going forward, by
maintaining the ETT pruning clearance specification in the NSTAR territory, and by applying the
ETT pruning specifications to the remaining sections of the WMECo territory that have not yet
been cleared to that specification (Tr., Vol. V, p. 962), there is no credible reason to believe that the
Company’s reliability performance standards will not be sustained. Given that the Company does
not have a reliability problem, the 2017 and 2018 RTW pilot programs are, at best, an expensive
solution to a non-existing vegetation management program problem.
3. LIDAR
No Massachusetts electric utility is currently deploying LiDAR to inspect its distribution
systems. Tr., Vol. V, pp. 919-920. In fact, LiDAR does not determine tree health, tree condition,
tree species, tree diameter, or tree infestation. Exhs. AG-25-27, AG-25-28. AG-25-29, an AG-25-
30. Further, LiDAR cannot identify risk or hazard, nor does LiDAR replace the physical
inspection of trees. Tr., Vol. V, pp. 924-927; Exh. ES-VLA-Rebuttal, p. 5. LiDAR is, quite
48 The 2018 RTW pilot program is a five-year pilot program. The Company estimates that one year of the pilot
program will cost $25,950,000. Exh. ES-VLA-1, p. 23.
172
simply, a means to measure distances, a kind of “HD radar.” Exh. ES-VLA-Rebuttal, p. 5; Tr. Vol.
I, p. 87.
In 2017, as part of the 2017 RTW pilot program, the Company began deploying vehicle
mounted LiDAR to collect data along 1,000 miles of its distribution circuits that are accessible
from public roads. Tr., Vol. V, p. 921. After the LiDAR data is analyzed, the Company
anticipates performing mid-cycle pruning on problem areas where vegetation has encroached the
Company’s distribution system. It seems, however, that deploying LiDAR is a needless
extravagance, as the Company’s engineers were able, without the benefit of LiDAR, to identify
“circuits whose performance in regards to trees, were of concern. And so that’s how [the
Company] identified the circuits that are included in the 2017 pilot for mid-cycle pruning.” Tr.,
Vol. V, p. 945.
As part of the 2018 RTW pilot program, the Company proposes to not only continue to
deploy the vehicle mounted LiDAR program from the 2017 RTW pilot program but also introduce
a second LiDAR program that will survey the Company’s entire distribution system. Tr., Vol. V,
p. 922. The Company indicates that “circuits will be scheduled automatically for a LiDAR survey,
regardless of current performance.” Exh. ES-VLA-1, p. 26. Moreover, the Company will be
deploying LiDAR on circuits that were pruned just two-years prior. Exh. ES-VLA-1, p. 25; Tr.,
Vol. V, p. 945. In other words, it is conceivable that circuits that were pruned to ETT or RTW
clearance zone specifications in year one will be reassessed in year three of the four-year trimming
cycle. That begs the question of why the Company would need to double back on these circuits
every two years. Are the Company’s distribution systems experiencing vegetation growth patterns
that are unique to its territory and not experienced in other northeastern states? Are the Company’s
173
pruning methodologies ineffective? Is the Company conceding that its four-year trim cycle
program is ineffective?
LiDAR is an expensive, superfluous technology, which does little to aid the Company’s
engineers and arborists in identifying risk and hazard trees. The engineers currently identify the
poorest performing circuits on the Company’s distribution system. Tr., Vol. V, pp. 909, 945, 947;
Exh. AG-20-34. The arborists are the boots-on-the-ground experts who currently identify and
document field conditions, including assessing, and confirming for removal, risk and hazard trees.
Exhs. AG-20-41 and AG-20-34. LiDAR does not “tell you anything about the condition of . . .
trees. It’s not going to tell you which [tree] is going to be the next tree to fall. That’s where you
still need human intervention, to actually go look at [the trees].” Tr., Vol. V, p. 968. Moreover,
the Company is unsure whether LiDAR will save on operation and maintenance cost, much less
whether LiDAR’s static images have any intrinsic value to the Company’s other departments or
divisions. Tr., Vol. V, p. 969. Therefore, the Department should deny the Company’s request to
recover the costs associated with any of the proposed LiDAR programs.
4. ACCOUNTING FOR NSTAR’S FIRST-CYCLE ENHANCED
VEGETATION MANAGEMENT ACTIVITIES
Beginning in 2012, NSTAR instituted a four-year trimming cycle such that all of NSTAR’s
circuits within its distribution system are pruned once every four years. Exh. ES-VLA-1, p. 11. At
the same time, NSTAR’s pruning specifications were enlarged around the distribution primary
from SMT specifications to ETT specifications on all primary section of circuits. Id. At the
conclusion of the initial four-year enhance trimming cycle (i.e., starting in 2016 or beginning the
second four-year ETT trimming cycle), NSTAR chose to maintain the clearance corridor at the
ETT clearance specifications. Exh. ES-VLA-1, pp. 12-13.
174
From 2012 through 2015, the Company capitalized the costs associated with the initial
four-year enhanced trimming cycle because the Company viewed the enlarged clearance zone “as
a capitalized improvement to the system rather than an operations and maintenance activity like the
SMT (which is expensed).” Exh. ES-VLA-1, p. 12. These first-cycle enhanced vegetation
management activities, the Company posits, “constitutes a system improvement, rather than
routine maintenance, and are therefore subject to capitalization for accounting purposes” (Exh.
AG-11-12), based on the assumption that “it extends the life of the asset.” Tr. Vol. XIII, pp. 2755-
2756. Then, in 2016, because the Company started maintaining the distribution primary at the
wider ETT clearance, the Company began treating the NSTAR ETT pruning work as an operations
and maintenance (“O&M”) expense. Exh. ES-VLA-1, pp. 12-13.
Also beginning in 2012, NSTAR implemented an ETR program to focus on the removal of
risk and hazard trees. Exh. ES-VLA-1, p. 12. And, like ETT, the Company capitalized ETR costs
because the removal of those trees “directly and materially extends the life of the underlying
assets.” Exh. RR-AG-14.
As discussed below, the Company’s capitalization of both ETT and ETR costs is
inappropriate, and it conflicts with the Department’s and the FERC’s accounting instructions, and,
therefore, should be rejected by the Department.
a) Capitalization of ETT and ETR Costs
The Company views NSTAR’s SMT program as “routine maintenance line clearance”, and
therefore, charges those expenses to O&M Account 593. Exhs. AG-19-31 and AG-37-6, p. 1.
Likewise, the Company treats the maintenance of NSTAR’s distribution primary at ETT
specifications (“METT”) as an O&M expenditure. Exhs. ES-VLA-1, pp. 12-13 and AG-11-11
(Attachment). Conversely, the Company capitalized costs associated with NSTAR’s first-cycle
175
ETT program because, in the Company’s opinion, ETT goes beyond SMT by extending the life of
the related conductor, improving reliability, and adding “a minor unit of property that did not
previously exist.” Exh. AG-37-6, p. 1. Consequently, from 2012 through 2015, the Company
capitalized approximately $37.4 million in ETT costs in plant-in-service -- FERC Account 365,
Overhead Conductors and Devices. Exhs. ES-VLA-1, p. 12 and RR-AG-6(b), p. 1; Tr. Vol. XIII,
pp. 2754-2758. To that end, those ETT costs were depreciated each year through the end of the
test-year, resulting in a net plant or depreciable balance of enhanced tree trimming costs at the end
of the test year of $34.8 million for ETT. Exh. RR-AG-13.
In the same way, between 2012 and 2015, the Company capitalized approximately $14.8
million in ETR costs, which were depreciated each year through the end of the test-year, resulting
in a net plant or depreciable balance of enhanced tree trimming costs at the end of the test year of
$13.8 million for ETR. Exhs. RR-AG-6(b), p. 1 and RR-AG-13.
5. MAINTENANCE OF OVERHEAD LINES AND DEVICES
Contrary to the Company’s assertion that NSTAR’s initial four-year ETT trimming cycle
and ETR represents a system improvement rather than routine maintenance, it is clear from the
Department’s and the FERC’s accounting instructions that the ETT and ETR costs should have
been accounted for as expenses, and, therefore should have been booked to Account 593 rather
than to Account 365.
a) Account 593 – Maintenance of Overhead Lines
Pursuant to both the Department and the FERC rules regarding the accounting of annual
tree trimming costs, the instructions for Account 593 - Maintenance of overhead lines are clear.
The instructions state that this account shall include:
176
[T]he cost of labor, materials used and expense incurred in the maintenance of overhead
distribution line facilities, the book cost of which is includible in . . . account 365, Overhead
Conductors and Devices . . ..” FERC 18 CFR part 101, Account 593 (revised as of April 1, 2016);
220 CMR 51.01.
The Department and the FERC specifically identify that the costs associated with the
trimming of trees and clearing of brush on overhead conductors and devices are to be included in
Account 593. FERC Uniform System of Accounts, Distribution Expenses, Maintenance Account:
593 Maintenance of overhead lines contained in FERC 18 CFR part 101, Account 593, Item 2.k
(revised as of April 1, 2016); 220 CMR 51.01.
Whether at the SMT clearance specification or the ETT clearance specification, the
Company is performing a routine maintenance function to its distribution system that extends the
life of the asset. Similarly, at what point does chopping down a hazard tree morph from an
expense into a capitalizable cutting? The removal of any hazard tree, like systematic pruning, is
designed to extend the life of the underlying assets. A hazard tree cut down in 2011 should not be
treated differently, for accounting purposes, from a hazard tree cut down in 2012. Exh. RR-AG-
14.
Although the Company asserts that NSTAR’s initial ETT cycle and ETR should be
capitalized because they extend the life of the asset, realistically any type of pruning or tree
removal along the Company’s distribution system, by its very nature, extends the life of the
conductors and improves reliability. The Company cannot hide behind the notion that first-cycle
vegetation trimming is capitalized “on the basis that it extends the life of the asset.” Tr. XIII, pp.
2755-2756. Nor can the Company impetuously capitalize tree removals simply because it decided
to “step up the level and extent of hazard tree removals on the system.” Exh. RR-AG-14.
177
b) Account 365 – Overhead Conductors and Devices
Pursuant to the Department and the FERC Uniform System of Accounts Electric Plant
Account: 365 Overhead conductors and devices contained in FERC 18 CFR part 101, the account
includes “the cost installed of overhead conductors and devices used for distribution purposes,”
which includes “tree trimming, initial cost including the cost of permits thereof.” FERC 18 CFR
part 101, Account 365, Item 9; 220 CMR 51.01 (emphasis added). That is, the costs associated
with tree trimming connected with newly installed overhead conductors and devices can be
capitalized. Tr. Vol. XIII, p. 2760. In fact, these capitalized costs are then “depreciated over the
life of the conductor (account 365) benefitting from the specific tree trimming.” Exh. AG-37-6, p.
2. Other than the costs incurred by the Company to perform initial tree trimming when a
distribution line is first installed, there is no provision, in the Uniform System of Accounts for
Electric Companies, allowing electric companies to capitalize the costs of subsequent tree
trimming to that distribution line.
According to the Company, there are overhead conductors and devices on the Company’s
books dating back more than 100 years. Exh. ES-JJS-2. Furthermore, NSTAR, as constituted
today, is made up of over fifty difference electric and light companies through various mergers and
acquisitions. Tr. Vol. XIII, pp. 2762-2763, referring to Paul E. Osborne, Corporate History of Gas
and Electric Utilities in Commonwealth of Massachusetts, Massachusetts Department of Public
Utilities (March 2016). Given NSTAR’s history, the Company is unable to opine on the
distribution system pruning protocols of the predecessor companies that make up NSTAR. Tr.
Vol. XIII, pp. 2763-2764. Notwithstanding the Company’s learned dendrological history lesson of
Massachusetts (Tr. Vol. XV, pp. 3164-3166), the initial clearance occurs at the time the
distribution system is first built. Initial clearing does not occur years after a distribution line is
178
“first initiated.” Tr. Vol. XV, pp. 3165-3166. The Company does not get a second opportunity to
capitalize trimming costs, simply because at the time the new distribution line was built NSTAR or
any of its legacy companies elected a narrower clearance zone compared to the Company’s
currently favored “10-by-10-by-15 standard.” Tr. Vol. XV, pp. 3165, 3175.
The Department should not allow the Company to capitalize either the ETT costs or the
ETR costs that were incurred during the 2012-2015 four-year trimming cycle. Accordingly, $48.6
million, the net plant or depreciable balance of enhanced tree trimming costs at the end of the test
year for ETT (i.e., $34.8 million) and ETR (i.e., $13.8 million), should be removed from rate base.
In addition, the Company should be precluded from capitalizing all ETR related costs on its
existing circuits going-forward. See Exh. RR-AG-13.
G. STORM FUND PROPOSAL
The Company proposes to consolidate storm-cost recovery into a single storm fund
mechanism (“Storm Fund”) for its NSTAR and WMECo service territories. Exh. ES-CAH-1, p.
24. The Company proposes: (1) a storm fund addition; (2) a storm cost recovery adjustment; and
(3) a request for recovery of unrecovered storm costs that have occurred since 2012. Exhs. ES-
DPH-1, pp. 104-33; ES-CAH-1, pp. 24-33. Under the Company’s proposal, storm costs would be
eligible for recovery through the Storm Fund where the incremental costs exceed $1.2 million.
Exh. ES-CAH-1, pp. 25-26. The Company also proposes: (1) to make annual contributions to the
fund of $10 million; (2) to accrue carrying costs to accrue at the Prime rate; and (3) to defer, until
the Company’s next rate proceeding, the cost associated with storm events which are greater than
$30 million in incremental costs. Id.
179
1. THE DEPARTMENT SHOULD NOT ALLOW THE COMPANY TO
RECOVER DEFERRED COSTS THROUGH THE REPLENISHMENT FACTOR
The Company requests that, if the combination of any deferral balance and the balance in
the Storm Fund exceeds $75 million, the Company would collect an annual “replenishment factor”
to reduce the deferred balance, “pending a full investigation of the Company’s storm costs in a
separate (later) proceeding.” Exh. ES-CAH-1, p. 26.49 The Company proposes that
if the combination of single storm deferral balance (i.e., the sum total
of all single storms in excess of $30 million) and/or the balance of the
Storm Fund exceeds $75 million, the Company may request to file
for a “replenishment” factor, pending a full prudency review
investigation.
Exh. ES-DPH-1, pp. 122-23. In short, the Company requests to charge customers for Storm Fund
eligible costs and ineligible deferred costs for single storms in excess of $30 million through the
replenishment factor.
The Department has not previously allowed electric distribution companies to recover
deferred costs in a replenishment factor. Most recently, the Department authorized National Grid
to seek to recover Storm Fund eligible costs in a replenishment factor in D.P.U. 15-155. However,
the Department allowed National Grid to petition the Department for a replenishment factor for
storm costs eligible for Storm Fund recovery only. D.P.U. 15-155, p. 82. The Department did not
allow National Grid to include deferred costs for any single “outlier” storms in the approved
replenishment factor, as Eversource requests here.50 Denial of recovery of these deferred costs
49 The Department has allowed electric companies to recover storm fund deficit balances through replenishment
factors, e.g., “Storm Fund Replenishment Adjustment Factor,” or “Storm Fund Replenishment Adjustment.” D.P.U.
15-155-A, p. 18; Massachusetts Electric Company and Nantucket Electric Company, D.P.U. 13-59, pp. 1-2, 4 & n.2
(2013). 50 The Department made no mention of recovering deferred costs through a replenishment factor.
In order to prevent the storm fund from falling into a significant deficit as the
result of a single major storm event, we find that it is necessary to exclude from
storm fund eligibility any single storm event that exceeds $30 million in
180
through the replenishment factor would not result in unlawful confiscation because the Company
has the opportunity to seek recovery of individual storm events with incremental O&M costs that
exceed $30 million in its next base rate case. See Boston Edison Company v. Department of Public
Utilities, 375 Mass. 1, 10 (1978); Massachusetts Electric Company and Nantucket Electric
Company d/b/a National Grid, D.P.U. 15-155-A, p. 15; D.P.U. 15-155, p. 82.
2. CARRYING CHARGES FOR DEFERRED AMOUNTS NOT ELIGIBLE
FOR STORM FUND RECOVERY MUST NOT BE COLLECTED IN THE
REPLENISHMENT FACTOR
The Company proposes to collect through its proposed replenishment factor carrying
charges on the balance of the Storm Fund and on the balance of any storm costs in excess of $30
million excluded from the Storm Fund. Exh. ES-DPH-1, pp. 121-22.
The Department should reject the Company’s request to recover interest on amounts not
eligible to be included in the Storm Fund through a replenishment factor. The Department allows
collection of carrying charges through a replenishment factor for Storm Fund eligible events
only—and not for deferral amount for those “outlier” storms that exceed $30 million in
incremental costs. D.P.U. 15-155-A, pp. 15-16; D.P.U. 15-155, pp. 82-84. Indeed, the Company
recognizes that the Department excludes from Storm Fund eligibility very large “outlier” storm
events that exceed $30 million in incremental costs. Exh. ES-DPH-1, p. 122, citing, D.P.U. 15-
155, p. 82. Yet, the Company provided no new evidence or arguments that should cause the
Department to change its well-founded precedent. Id.
incremental costs (exclusive of Verizon costs). The Company may seek to defer
these costs for recovery in its next base rate case.
D.P.U. 15-155, p. 82.
181
The Company will not be harmed by not collecting carrying charges for “outlier” storms
charges through a proposed replenishment factor. Pursuant to Department precedent, carrying
charges accrue when they are incurred. D.P.U. 15-155-A, p. 15–16. The Department allows the
Company to seek, in between rate cases, a prudence review of storm costs associated with any
storm event where incremental operations and maintenance costs exceed $30 million (exclusive of
Verizon costs). D.P.U. 15-155-A, p. 15; D.P.U. 15-155, p. 82. Accordingly, the Company can
seek any carrying costs in a prudence review of any “outlier storms,” and there is no need to allow
the Company to collect carrying charges through the replenishment factor. Therefore, the
Department should not allow the Company to recover carrying charges for any storm event that is
not eligible for recovery under the Storm Fund.
3. THE DEPARTMENT SHOULD REJECT THE COMPANY’S REQUEST
TO RECOVER CERTAIN LEAN-IN COSTS THROUGH ITS STORM FUND
The Company requests a cost recovery mechanism through the proposed Storm Fund for
“lean in” costs. “Lean in” costs are costs the Company incurs to retain and pre-stage outside crews
in anticipation of a Level III or higher qualifying storm event. In this case, the Company requests
that the Department include lean in costs for Level III events that do not occur or ultimately qualify
for Storm Fund treatment in its base rates. 51 Exh. ES-CAH-1, pp. 27, 30; Exh. DPU 2-11; Tr. Vol.
V, pp. 995-999.
The Company has provided no evidence supporting its request to include these lean in costs
through the storm fund. First, the Company could not identify when it last incurred these costs, nor
could it identify the dollar magnitude of any lean in costs associated with such events. Tr. Vol. V,
pp. 997-999. Indeed, the Company does not track these lean in costs separately from overall storm
51 For example, a Level III event may occur but is ultimately less severe than anticipated, causing the total event
costs to fall below the $1.2 million threshold.
182
costs in events that ultimately qualify for Storm Fund treatment. Exh. DPU 2-8. As such, these
costs are not extraordinary by any means and do not need special recovery through the storm fund.
Second, if the Department allows the Company to recover such lean in costs in the storm fund, the
Department will create an incentive for the Company to incur these lean in costs needlessly and to
inflate those lean in costs.
For all of the above reasons, the Department should not adopt the Company’s proposal to
recover in its Storm Fund lean in costs for predicted Level III or above storms that do not qualify
for storm recovery expenses.
4. RECOVERY OF OUTSTANDING STORM COST BALANCE
The Department should reject the Company’s proposal to recover a claimed Storm Fund
under-recovery in NSTAR’s base rates because the Company has not provided any supporting
evidence of its claimed dollar balance under-recovery. The Company claims that NSTAR incurred
$124,766,641 of incremental operations and maintenance costs for ten storms. Exh. ES-DPH-1,
pp. 127 (Table DPH-1). Although NSTAR admits that it has already collected some of that
amount from ratepayers, it claims a total Storm Fund under-recovery of approximately $100
million. Exh. ES-DPH-1, pp. 126-27, 129. The Company proposes to recover the under-recovery
from NSTAR customers over five years, starting January 1, 2018, with interest at the Prime rate.
Exh. ES-DPH-1, p. 129. The Company estimates the total annual revenue recovery will be
$30,805,377. Exhs. ES-DPH-1, p. 130; ES-DPH-5 (East).52
52 With respect to WMECo, the Company proposes to continue to recover its storm costs at the level it is currently
recovering, until it fully recovers the outstanding balance of fund costs. Exh. ES-DPH-1, p. 131. The Company
states that, if there are no new storms by December 2017, WMECo will fully recover its costs by the end of 2019.
Exhs. ES-DPH-1, p. 131, ES-DPH-5 (West).
183
The Company has provided no supporting evidence that it incurred $124,766,641 of
incremental operations and maintenance costs for ten storms. Costs must be “verifiable” to be
reasonable and prudent. See Massachusetts Institute of Technology v. Department of Public
Utilities, 425 Mass 856, 871-72 (1997). Moreover, the Company presented certain storm costs in
D.P.U. 16-74 and D.P.U 17-51, which are currently pending prudence review.53 The Company
admits that the Department’s review in D.P.U. 16-74 and D.P.U. 17-51 could affect the amount
that the Company seeks from ratepayers for the purported under-recovery. Exhs. DPU 16-6; ES-
DPH-5 (East); ES-DPH 1, p. 127 (Table DPH-1). Accordingly, the Department should deny cost
recovery for NSTAR’s claimed Storm Fund under-recovery and “any additional storms that may
occur prior to new rates on January 1, 2018.” See Exh. ES-DPH-1, p. 128.
5. BILLINGS TO VERIZON FOR JOINTLY OPERATED POLES
The Department should deny Eversource’s proposed adjustment for recovery of the
difference between the amount that it billed Verizon and the amount that Eversource accepted from
Verizon in lieu of full payment for the shared costs of Jointly Owned Poles.
The Company and Verizon were signatories to Joint Operating Agreements (“JOAs”). Exh.
ES-VLA-1, pp. 27-28; Exh. AG 25-15. The JOAs include intercompany operating procedures
(“IOP”) that explicitly state that heavy storm-related vegetation management work will be handled
“immediately without prior review,” and that the parties agree to a “50/50” division of costs for
this work. Exh. Att. AG 25-15(a), p. 1. Eversource billed Verizon $8.1 million for its cost
responsibility for vegetation management work under their JOAs (NSTAR $7.1 million and
WMECo $1.05 million). Exhs. Atts. AG 25-22(a) and (b); ES-VLA-1, pp. 27-28.
53 In its D.P.U. 17-51 investigation, the Department only recently conducted a public hearing on July 12, 2017.
184
The Department has held that electric companies, such as Boston Edison Company and
Western Massachusetts Electric Company, must pursue Verizon for costs that Verizon is
“contractually obligated to pay under the terms of the Joint Operating Agreements.” Western
Massachusetts Electric Company, D.P.U. 13-135-A p. 46 (2016). The Department has consistently
and repeatedly found that the Company is “obligated to demonstrate that it is not seeking to
recover any costs from its customers that Verizon is contractually obligated to pay under the terms
of the JOA.” D.P.U. 13-135-A, p. 41 (2016). The Department disallowed 50 percent of NSTAR’s
storm-related vegetation management costs. D.P.U. 13-52, pp. 47–49; see also D.P.U. 13-135-A,
p. 45 (disallowing 50 percent of the storm-related management costs to the portion of poles that
WMECo jointly owns with Verizon).
Despite direction to seek “legal process,” Eversource never filed suit against Verizon
arising out of a breach of any of the JOAs between the Company and Verizon. Exhs. AG 25-26;
AG 25-25; see Exh. AG 1-82. Rather, outside of the legal process, on April 6, 2017, NSTAR and
WMECo entered into a settlement agreement and release with Verizon. Exh. Att. AG-25-26
(Supplemental 1). In the settlement agreement, Eversource agreed to accept considerably less
money than the $8.1 million dollars Eversource billed Verizon—only $1.5 million—to resolve the
outstanding amounts related to Major Storm Events occurring in the years 2008 through the
effective date of the agreement. Exh. Att. AG-25-26 (Supplemental 1), p. 1. Moreover, the
settlement agreement also provides that Verizon will only be responsible for 7 percent of the total
cost of storm-related vegetation management in the parties’ overlapping service area going
forward. Id., p. 5.
Having failed to secure a court determination on the rights and obligations of Eversource
and Verizon under the JOAs, Eversource is ineligible to seek recovery of those costs. The
185
Department was explicit in its requirement that that NSTAR and WMECo may only recover these
costs from ratepayers after they “pursue[] Verizon pursuant to legal process for collection of these
vegetation management costs, and if it is determined that Verizon is not responsible for all or any
portion of the costs. . ..” D.P.U. 13-135-A, p. 45; D.P.U. 13-52, p. 49. As the Department noted,
the appropriate forum for interpreting the JOAs is the courts. D.P.U. 13-52, pp. 45–46, n.27;
D.P.U. 13-135-A, p. 43. However, conducting a prudence review of Eversource’s request to
recover the costs at issue here would require the Department to interpret the JOAs, because any
prudence review would necessarily require the Department to weigh the relative merit of
Eversource’s and Verizon’s claims under the JOAs.
Moreover, the settlement agreement clearly seeks a result that is good for Eversource and
Verizon, but bad for ratepayers. In the settlement agreement, Verizon agreed to pay Eversource
only seven percent of the total cost—rather than the 50 percent division of costs for severe storm
restoration efforts in the previous IOP, Exh. Att. AG 25-26 (Supplemental 1), p. 6; Exh. Att. AG
25-15(a), p. 1. Eversource, on the other hand, having “resolved” the issue of the amount that
Verizon will pay for jointly operated poles from Verizon, can seek to avoid the Department
similarly disallowing 50 percent of its storm-related vegetation management costs from its cost of
service in this case without the delay and inconvenience that would result from a lawsuit against
Verizon. See D.P.U. 13-52, pp. 47–49; D.P.U. 13-135-A, p. 45. Ratepayers, however, are left
holding the bag. Pursuant to the original JOAs with Verizon, ratepayers were only required to pay
for 50percent of the costs attributable to jointly operated poles. Under the settlement agreement,
Eversource asks ratepayers to pay 93 percent of those costs going forward. This result is neither
just nor reasonable.
186
The Department should not allow Eversource shareholders to benefit from the Company’s
imprudence, to the detriment of ratepayers, from ignoring the Department’s directive to obtain a
legal determination by the courts as to the extent of Verizon’s responsibility under the JOAs.
Accordingly, the AGO recommends that the Department deny Eversource recovery of the
difference between what the Company billed Verizon and the amount Verizon paid Eversource
pursuant to the agreement both companies entered into on April 6, 2017. Exh. Att. AG 25-26
(Supplemental 1).
H. TAXES
1. INCOME TAXES
a) There is No Evidentiary Support for WMECo’s Increase to
Taxable Income for “Property Tax Expense”
WMECo proposes to increase its taxable income by $2,226,850 for “property tax expense.”
WMECo did not present any testimony whatsoever either describing this item or explaining why it
is appropriate to adjust the cost of service for this item. Exh. ES-DPH-2 (West), Schedule DPH-
33, p. 8. However, in response to Exh. AG-19-55, WMECo explained that the Company is
proposing to normalize property tax deductions that the Company claims were previously flow-
through, over a five-year period. Based on an annual amount of $2,226,850, the cumulative
flow-through deduction is $11,134,250.
On cross examination, Mr. Horton acknowledged that WMECo did not put forth this
proposal in his direct testimony, stating that “[o]n Page 174 of my testimony it references to the
referenced schedule, but I didn't go into great length about any of those adjustments, no.” Tr.
XIII. p. 2787. In fact, reference to the referenced testimony shows that while Mr. Horton did
discuss certain of the items included in the calculation of taxable income, there is absolutely no
187
mention of WMECo’s increase to taxable income by $2,226,850 for property tax expense, let
alone going “into great length” about that adjustment.
In the response to Exh. AG-34-17, WMECo elaborated on its statement that it is proposing
to normalize property tax deductions that were previously flow-through, stating that “[t]he
property tax deduction was flowed through incrementally on an annual basis as the difference,
either increase or decrease, in the property tax deduction from one year to the next.” The
available evidence not only fails to support this statement but, rather, indicates the exact
opposite.
WMECo’s last general rate case was D.P.U. 10-70. Tr. Vol. XIII, p. 2790. There was no
flow-through of any tax reconciling item for property taxes in that case. Id. Thus, the record
evidence shows that the property tax deductions that were supposedly previously flow-through,
were not actually flowed through in the calculation of taxable income.
In effect, what WMECo is seeking to do is to retroactively address a problem that never
existed and does not exist now. WMECo has presented no evidentiary support for its increase to
taxable income by $2,226,850 for “property tax expense,” and it has provided no Department
precedent that would accommodate this item. In short, WMECo has presented no reason to
include this item in its calculation of pro forma income tax expense.
The property tax expense item of $2,226,850 on Exhibit ES-DPH-2 (West), Schedule
DPH-33, Page 8 should be eliminated from the calculation of WMECo’s pro forma income tax
expense. The effect of eliminating this item is to reduce WMECo’s pro forma income tax expense
by $895,194.
188
2. PROPERTY TAXES
a) The Company’s Projected Property Tax Calculations Are
Inconsistent with Department Precedent
In the test year the Company booked $87,288,884 in distribution-related property tax
expense for NSTAR and $14,965,006 for WMECo. Exh. ES-DPH-2 (East), Sch. DPH-25, p. 1;
Exh. ES-DPH-2 (West), Sch. DPH-25, p.1. However, in its initial filing the Company seeks to
recover $89,083,373 in distribution related property taxes for NSTAR and $16,493,608 for
WMECo based on a proposed methodology that would estimate the expected level of property
taxes in the rate year. Id.; Exh. ES-DPH-1, pp. 159-167. For those municipalities that utilize net
book value in determining personal property taxes, the Company proposes to calculate the
estimated rate year level of property tax expense by applying current municipal tax rates to the
latest Form of List (“FOL”) personal property valuations provided by the Company. Id., pp.
166-167. Using the Company’s proposed methodology inflated the Company’s initial revenue
requirement for property taxes by a total of $3,323,091. In its updated filing of May 25, 2017,
the Company now seeks to recover distribution property tax expense of $90,038,843 for NSTAR
and $ 17,446,410 for WMECo. Exh. ES-DPH-2 (East) (May 25 update), Sch. 25, p.1; Exh. ES-
DPH-2 (West) (May 25 update), Sch. 25, p.1. Again, these amounts include projections of
personal property value derived from 2017 FOL valuations provided by the Company to various
municipalities, although from the way these expenses were presented in the May 25 updated
filing it is difficult to determine how much of the increase is based on projected property tax
liabilities versus actual tax bills received. Exhs. ES-DPH-7 (East and West), Schs. 10-13 (May
25 update).
The Company’s proposal to use its own estimates of its personal property value in the
calculation of a representative level of property tax expense should be rejected as speculative,
189
unduly complicated and at odds with Department precedent. The Company’s proposed
methodology will also result in over collection of property tax expense while the Company pays
lower actual property taxes calculated on the allegedly lagged valuations.
The Department’s long-standing policy is to base property taxes on the most recent
property tax bills a utility receives from the communities in which it has property. New England
Gas Company, D.P.U. 08-35, p.150 (2009); Boston Gas Company, D.P.U. 96-50 (Phase I), p.
109 (1996); Western Massachusetts Electric Company, D.P.U. 86-280-A, p.17 (1987). The
Department holds the record in a proceeding open to receive the most current tax bills from cities
and towns to the utility. Boston Gas Company, D.P.U. 88-67, Phase I, p.165-166 (1988);
Colonial Gas Company, D.P.U. 84-94, p.19 (1984). The Department allows this update because
post-test year property tax expenses are verifiable, non-controversial, routine, and outside the
control of the Company. Bay State Gas Company, D.P.U. 12-25, pp. 329-30 (2015) (citations
omitted).
The approach suggested by the Company is very much like the one rejected by the
Department in Massachusetts Electric Company and Nantucket Electric Company d/b/a National
Grid, D.P.U. 15-155, pp. 213-214 (2016). In that case, National Grid proposed to calculate the
estimated rate year level of property tax expense by applying current municipal tax rates to the
latest property valuations provided by each municipality. Id., p. 211. The Department
concluded:
The Department generally has rejected the use of projected data to
determine a company’s property tax expenses. (Citations omitted).
Rather, the test year level of property tax expense, adjusted for
known and measurable changes (i.e., the most recent property tax
bills provided at the close of the record), provides the most
reasonable representation of a company’s property tax expense and
fairly represents this component of its cost to provide service.
National Grid’s projection of future increases of property tax
190
expense, though derived from current tax assessments, is speculative
and does not constitute a known and measurable change based on
Department precedent. The Company has offered no persuasive
reason to depart from our precedent here. Therefore, we decline to
adopt the Company’s proposed property tax calculation.
Id., pp. 213-214.
The methodology proposed in this case is much the same as National Grid’s proposal and
is an equally speculative departure from Department precedent. Accordingly, the Company’s
property tax revenue requirement should be reduced to amounts booked in the test year plus
known and measurable updates to those amounts by submission of actual 2017 property tax bills
through the close of this proceeding.
b) The Department Should Ensure There Are Appropriate Property
Tax Allocations to Other Businesses
The Department allows distribution companies to update their cost of service for the
latest municipal property tax bills available before the Department issues its order. Tr. Vol. XV,
p. 3190. Here, the property tax bills will be for fiscal year ended June 30, 2018 based on
property valuations as of January 1, 2017. The invoices from each municipality will include all
of Company property within the municipality.
The Department should make certain that the property taxes included in the cost of
service will include only the amounts associated with distribution plant in service as of January
1, 2017, the valuation date for the bills. In order to attribute property taxes to the non-
distribution business, the Company makes an allocation based on plant in service. See Exh. ES-
DPH-1, p. 160. Currently, Eversource is making large investments in transmission and solar
plant that will cause these property tax bills to increase. Therefore, when the Department
determines the Company’s pro forma cost of service including these late filed property tax bills,
it should make sure that appropriate allocations are made to the other businesses based on plant
191
balances of the same January 1, 2017 valuation date as is used by the municipalities. See RR-
AG-17.
c) WMECo’s Deferred Property Tax Claims
The Company also seeks recovery for certain WMECo property taxes from 2012-2016.
Exh. ES-DPH-1, pp189-193; Exh. AG-44-1 (Att.). Mr. Horton testified that the Company is
seeking recovery of exogenous property tax costs for FY 2012-2016 in the amount of
$10,306,354. Exh. DPH-1, p. 190. The Company has requested a 5-year amortization of this
amount, at $2,061,271 per year, to be recovered via a “Municipal Property Tax Adjustment”
tariff. Exh. AG-44-1 (Att.); RR-DPU-33. For the reasons set forth below, the Department
should reject WMECO’s adjustments to the claims for 2012-2015 and the amount of $1,991,983
for 2016.
(1) WMECo’s Deferred Property Tax Claims for 2012-2015
Should Be Adjusted to Net Out State and Federal Income Tax
Benefits
Pursuant to the terms of the AG-DOER settlement approved by the Department in
NSTAR and Northeast Utilities, D.P.U. 10-170 (2012), the Company was authorized to seek
recovery of certain deferred incremental property taxes incurred by WMECo for the years 2012-
2015 provided the claims met a dollar threshold and satisfied Department precedent concerning
the recovery of exogenous costs. D.P.U. 10-170, AG-DOER Settlement, Article II (5) p. 5.
From examination of the detail of the Company’s claims for recovery of the 2012-2015 taxes it is
apparent that no adjustments have been made for the tax benefits that the Company will realize
from deducting these amounts from its income taxes. Exh. AG-44-1 (Att.). If the Department
finds that the Company is entitled to exogenous recovery of the deferred amounts for 2012-2015,
the claimed amount of $8,314,371 should be reduced to reflect income tax deductions.
192
(2) The Company Is Not Entitled to Deferral of WMECo ’S
2016 Property Taxes
In Western Massachusetts, Electric Company, D.P.U. 16-107, the Company filed for
deferral of an increment of WMECo’s 2016 distribution-related property taxes in the amount of
$1,991,983 related to the City of Springfield’s use of the RCNLD method of valuation. The
Department has not yet issued an order in that docket but the matter awaits decision after
discovery took place and the issues were fully briefed by both the Company and the AGO. The
same 2016 deferral claim has been included in this proceeding. Exh. ES-DPH-1, pp.192-193;
Exh. AG- 44-1. However, the evidence pertaining to this claim is in the record of D.P.U. 16-107
and should be decided in that docket.
The 2016 deferral request must be considered separately from the Company’s requested
recovery of exogenous property tax costs for the years 2012-2015. As noted above, those four
years are addressed by the AG-DOER settlement agreement approved by the Department while
the 2016 tax year was not included in that agreement. Mr. Horton conceded in his testimony that
eligibility for recovery of exogenous property tax expense under the settlement ends as of
December 31, 2015. Exh. ES-DPH-1, p. 190. Nonetheless, the Company in this case improperly
bundled the disputed 2016 amount in for recovery along with the amounts for 2012-2015. Exh.
ES-DPH-1, p. 190; Exh. AG-44-1.
The AGO reiterates its argument from D.P.U. 16-107 that the Company failed to make a
prima facie showing that it is entitled to seek deferral of WMECo’s 2016 distribution property
taxes. The Department has a clearly established three-part standard for reviewing petitions for
deferral accounting treatment. North Attleboro Gas Company, D.P.U. 93-229, p. 7 (1994). The
Company fails all three prongs of the standard and is not eligible for deferral of the $1,991,983
193
of WMECo 2016 property taxes. Further, as established in D.P.U. 16-107, the amount at issue
for 2016 must be adjusted to reflect income tax benefits. D.P.U. 16-107, AG Br., p.4.
In North Attleboro Gas Company the Department held that a utility seeking deferral
treatment must demonstrate prima facie in its petition that: 1) based on Department precedent,
the annual expense may be recoverable as an extraordinary expense if it were incurred during a
test year; 2) a Department denial of the request for deferral would significantly harm the overall
financial condition of the Company; and 3) the Department’s denial of the request for deferral is
likely to cause the filing of a rate case that would include in its test year the expense for which
deferral is sought (“North Attleboro standard”). D.P.U. 93-229, p. 7. The Department explained
that the policy behind granting deferrals is based in administrative efficiency and is intended to
avoid unnecessary rate cases that would be triggered by certain extraordinary pre-test-year
expenses. Id.
(a) WMECo’s 2016 Distribution-Related Property Tax
Increment Does Not Represent an Extraordinary Expense
Under the first prong of the North Attleboro standard, the Department determines
whether the expense at issue may be recoverable as an extraordinary expense if it were incurred
during the test year. According to Department precedent, non-recurring expenses incurred in the
test year are ineligible for inclusion in the cost of service unless the Company demonstrates that
the expenses are extraordinary both in nature and amount. Fitchburg Gas and Electric Light
Company, D.P.U. 11-128, p. 10 (2012), citing Fitchburg Gas and Electric Light Company,
D.P.U. 99-115, p. 5 (2001); Fitchburg Gas and Electric Light Company, D.P.U. 1270/1414, p.
33 (1983).
The 2016 tax expense at issue is recurring rather than non-recurring and is also neither
extraordinary in nature or amount according to Department precedent. In past deferral cases,
194
expenses that the Department determined to be extraordinary in nature typically arose out of
sudden, unforeseen force majeure- type events. Fitchburg Gas and Electric Light Company,
D.P.U. 09-61, pp. 10–11 (2009) (expenses incurred during winter storm in 2008 during which
Governor declared state of emergency); Fitchburg Gas and Electric Light Company, D.P.U. 11-
128, pp. 11, 14 (2012) (significant storm cleanup expenses from Tropical Storm Irene and the
October Snowstorm after state of emergency declared); Aquarion Water Company of Mass.,
D.T.E. 03-127, p. 8 (2004) (expenses directly related to a water company’s compliance with the
Public Health Security and Bioterrorism Response Act of 2001 after September 11).
In contrast to the above authorities, the Company’s 2016 property tax bill from the City
of Springfield is a recurring annual event. WMECo stated in D.P.U. 16-107 that it had been
receiving property tax bills from the City of Springfield based on the RCNLD property valuation
method since 2011. D.P.U. 16-107, Co. Petition, p. 3. It is reasonable to expect that the
Company will continue to receive similar bills year after year in the future. Accordingly, the
Company cannot meet the “extraordinary in nature” hurdle.
In D.P.U. 16-107 the Company also failed to establish that the 2016 property tax
increment is extraordinary in amount. The after-tax cost of the amount for which the Company
requested deferred treatment is something less than the claimed amount of $1,991,983, which
AGO calculations demonstrated was significantly less than one percent of the Company’s 2015
revenues. D.P.U. 16-107, AG Br., p. 6.
(b) The Company Has Failed to Demonstrate That the
Denial of the Request for Deferral Would Significantly
Harm the Overall Financial Condition of the Company
The second element of the North Attleboro standard requires that the Company prove that
a Department denial of the request for deferral would significantly harm the overall financial
195
condition of the Company. D.P.U. 93-229, p. 7. Department precedent on this issue involves
situations where an expense is unforeseen and potentially catastrophic to a utility’s financial
stability. See, e.g., D.P.U. 09-61, p. 12. As noted above, the gross amount in question is
$1,991,983, which is less than one percent of the Company’s revenues. There can be no serious
argument that this amount of property tax expense posed a grave risk to WMECo’s financial
condition. Under the facts the Company simply cannot make a showing of financial harm of the
type and the degree that Department precedent has found to be significant. D.P.U. 16-107, AG
Br. pp. 5-7.
(c) WMECo’s 2016 Incremental Tax Obligation Was
Not Likely to and Did Not Prompt the Filing of a Rate Case
In D.P.U. 16-107, the Company implicitly admitted that it could not meet the third part of
the North Attleboro standard, which requires that the “Department’s denial of the request for
deferral is likely to cause the filing of a rate case….” D.P.U. 93-229, p. 7. In its Initial Brief, the
Company admitted that it planned to file a distribution rate case in January, 2017. D.P.U. 16-
107, Co. Br. p. 3. The Company cannot meet the third prong of the North Attleboro standard
because of its stated intention to file a rate case in 2017 no matter what the outcome of the
deferral request in 2016.
There are no legal grounds for the allowance of deferred recovery of WMECo’s 2016
property tax expense, which should therefore be excluded from the Company’s cost recovery in
this case.

196
I. OTHER REVENUES
1. THE PRO FORMA ADJUSTMENT TO ELIMINATE BELMONT
WHOLESALE DISTRIBUTION CONTRACT REVENUES FROM TEST YEAR
NSTAR MISCELLANEOUS REVENUES IS SELECTIVE AND SPECULATIVE
NSTAR proposes to make a pro forma adjustment to reduce Other Electric Revenues by
$449,077 related to the “Belmont Service Contract.” Exh. ES-DPH-3 (East), WP DPH-5, p. 1.
There is no further description of what this adjustment represents on this schedule, and Mr.
Horton offered no explanation whatsoever of this adjustment in his testimony.
In response to Exh. AG-19-11, NSTAR explained that this adjustment
was made to remove revenues related to the Belmont Wholesale
Distribution Contract as it is expected to be terminated in 2017. A
new substation is under construction that will remove the need for
the contract.
In response to Exh. AG-37-2, NSTAR noted that the termination was anticipated to be
“completed later in 2017,” which is well after the end of the test year. The expected adjustment
cannot be recognized as a known and measurable change because it has not occurred and the
record does not support a finding that the termination will occur. Fitchburg Gas and Electric
Light Company, D.P.U. 98-51, p. 62 (1998) (“A ‘known’ change means that the adjustment must
have actually taken place, or that the change will occur based on the record evidence. A
‘measurable’ change means that the amount of the required adjustment must be quantifiable on
the record evidence”).
Overall, the termination of the Belmont Service Contract is purely speculative. First,
there is no commitment to terminate the contract and the Company submitted no documentation
supporting the termination of this contract. Further, Belmont must accomplish a number of
engineering and construction steps before the contract can be terminated and the timing of these
efforts is not specified. Exhs. AG-37-2; AG-50-4. In addition, the underlying reasons the
197
contract would be terminated are not explained on the record and there is nothing to indicate
whether, even if the existing contract is terminated, a new contract with Belmont reflecting the
new electrical configuration would be required. Exhs. AG-19-11; AG-37-2; ES-EPH-3 (East),
WP DPH-5, May 25, 2017 Update; Tr. Vol. XIII, pp. 2784−2785.
Importantly, the termination of the contract seems to rest entirely with Belmont and there
is nothing on the record from Belmont to indicate when it might take all the steps to effectuate
that result. Apparently, the Company believes that when the new substation is completed, which
is said to be under construction, that will allow for the termination of the Belmont Service
Contract. Exhs. AG-19-11; AG-37-2. But the Company admits there is even more that Belmont
has to do before the Belmont Service Contract can be terminated. Belmont apparently has to
take further steps to transfer its load onto the new substation. Exh. AG-37-2. Distribution
service is said to need to be transitioned from Eversource’s distribution circuits to the
substation’s distribution circuits, and there is no schedule for this final step. Exh. AG-50-4.
The Company “anticipates” that this Belmont work will occur in 2017. Exh. AG-37-2.
The Company does not seem to know when the contract would be terminated and there is no
commitment that it will happen or when that might be. Nor is there anything in the record to
indicate if this anticipation at all comports with the reality of the scheduled work in Belmont.
Likewise, it is facile to claim that, after all the required construction is completed, the Belmont
Service Contract is “expected to be terminated.” Exh. AG-19-11. Again, there is nothing to
detail why the work in Belmont would lead to a contract termination or whether the work would
lead to the need for a new special contract.
The Company states that after the Belmont load transfer is complete, the parties “expect
to file with FERC to terminate this existing agreement.” Id. However, the Company has not
198
provided any evidence that Belmont has agreed to transfer its existing load onto the new
substation or to file with FERC to terminate the existing agreement, or that FERC has committed
to approve termination of the contract.
In addition, NSTAR has not established that termination of the Belmont Service Contract,
assuming that it takes place as anticipated, is outside the normal ebb and flow of revenue
changes resulting from the addition and departure of larger customers. Dedham Water
Company, D.P.U. 1217, pp. 7−9 (1983) (Department will not recognize annualization of
revenues attributed to customers added or lost during the test year, unless the change is
significant in magnitude). On cross-examination, Mr. Horton acknowledged that there have been
and will be other changes to NSTAR distribution revenues after the end of the test year, for
example, large additions of industrial load. Tr. Vol. XIII, p. 2785. Thus, it is entirely possible
that by the time the Belmont Service Contract is terminated (assuming that it is, in fact,
terminated), there will be other customer additions that offset, or more than offset, this $449,077
loss in revenues.
For these reasons, the Company’s proposed pro forma adjustment to eliminate test year
revenues pertaining to the Belmont Service Contract should be rejected as contrary to the
Department’s established precedent that such adjustments are known and measureable. On the
contrary, the proposed adjustment is entirely speculative. Based on the record in this proceeding
there is no way to guess at, let alone ascertain, when the special contract between the Company
and Belmont would be terminated. Accordingly, the Department should reject the pro forma
reduction to Other Electric Revenues by $449,077 related to termination of the Belmont Service
Contract.
199
2. THE DEPARTMENT SHOULD ADJUST THE COMPANY’S POLE
ATTACHMENT REVENUES TO REFLECT THE NUMBER OF POLE
ATTACHMENTS AT TEST-YEAR END
The Company charges monthly fees to third parties for attaching their equipment to the
Company’s distribution plant. One of the largest groups of pole attachers is the cable television
business. Exh. ES-DPH-3 (East), Workpaper DPH-5, p. 2. As the number of pole attachments
on the distribution system grows, especially from cable television companies, so will the revenue
that the Company receives from those attachments.
The Company’s revenues should be adjusted to reflect the test-year end number of pole
attachments. The Department requires electric utilities to adjust their revenues for the year-end
pole attachments. Massachusetts Electric Company and Nantucket Electric Company, D.P.U.
09-39, p. 121 (2009); Massachusetts Electric Company, D.P.U. 95-40, p. 79 (1995); Boston
Edison Company, D.P.U. 85-266-A/85-271-A, p. 117; Boston Edison Company, D.P.U. 1720, p.
85 (1984). The Company has not provided any evidence or any new argument that should cause
the Department to change this long-established precedent.
The Company provided the number of pole attachments and its monthly pole attachment
rates at test-year end. See Exh. AG-51-17 and Exh. RR-AG-26. This information is provided in
the following table:
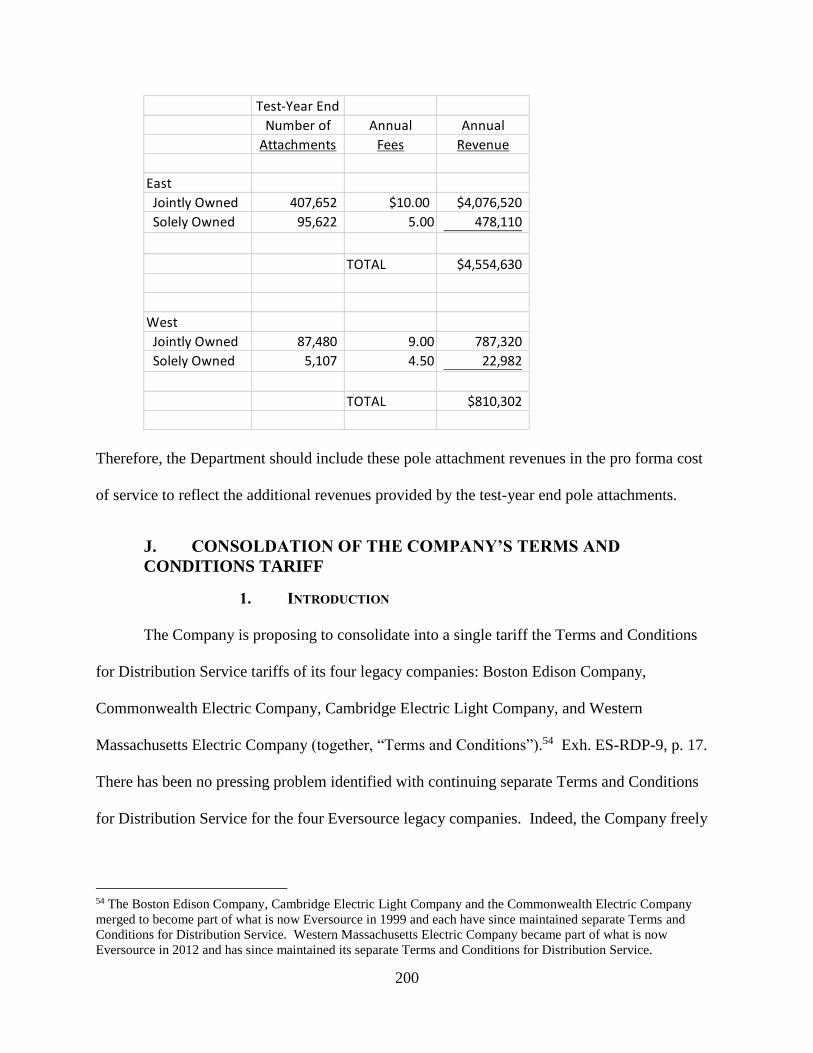
200
Therefore, the Department should include these pole attachment revenues in the pro forma cost
of service to reflect the additional revenues provided by the test-year end pole attachments.
J. CONSOLDATION OF THE COMPANY’S TERMS AND
CONDITIONS TARIFF
1. INTRODUCTION
The Company is proposing to consolidate into a single tariff the Terms and Conditions
for Distribution Service tariffs of its four legacy companies: Boston Edison Company,
Commonwealth Electric Company, Cambridge Electric Light Company, and Western
Massachusetts Electric Company (together, “Terms and Conditions”).54 Exh. ES-RDP-9, p. 17.
There has been no pressing problem identified with continuing separate Terms and Conditions
for Distribution Service for the four Eversource legacy companies. Indeed, the Company freely
54 The Boston Edison Company, Cambridge Electric Light Company and the Commonwealth Electric Company
merged to become part of what is now Eversource in 1999 and each have since maintained separate Terms and
Conditions for Distribution Service. Western Massachusetts Electric Company became part of what is now
Eversource in 2012 and has since maintained its separate Terms and Conditions for Distribution Service.
Test-Year End
Number of Annual Annual
Attachments Fees Revenue
East
Jointly Owned 407,652 $10.00 $4,076,520
Solely Owned 95,622 5.00 478,110
TOTAL $4,554,630
West
Jointly Owned 87,480 9.00 787,320
Solely Owned 5,107 4.50 22,982
TOTAL $810,302
201
acknowledges that there are reasons to maintain separate policies in each legacy company’s
Terms and Conditions and has proposed to maintain certain separate policies. See e.g., Exh. ES-
RDP-9, pp. 23-24.
Nonetheless, in this proceeding the Company is proposing to consolidate into a single
tariff the Terms and Conditions for Distribution Service tariffs of the above four Eversource
legacy companies. The Company claims that there is a significant amount of overlap between
the current tariffs and that the tariffs are virtually identical. Exh. ES-RDP-9, p. 11; Tr. Vol. XI,
p. 2242.
The Company’s witness in his testimony indeed suggested that there was basically
nothing to the changes needed to make the Terms and Conditions tariff for Distribution Service
the same. Tr. Vol. XI, p. 2244. However, the red-lined exhibits submitted by the Company
purporting to show the changes to each legacy company’s Terms and Conditions tariffs
demonstrates the complexity of the requested changes. For tariffs that are deemed to be almost
identical there are a mass of red-lined changes. See e.g., Exh. ES-RPD-14, Pt. 1, p. 154 et seq.;
Exh. ES-RPD-14, Pt. 2, p. 76 et seq. As part of these changes, the Company is proposing
wholesale, rapid increases to a number of fees included in the Terms and Conditions for
Distribution Service.
There may be a rationale for making certain tariff language consistent across the four
legacy companies, but, if so, the Company has failed to present it. Pressed on this issue, the
Company’s witness at several point seemed to indicate that the rationale, as weak as it might be,
was to take the language currently applicable to the largest number of customers and impose it
on the legacy company or companies with a lesser number of customers. Tr. Vol. XI, p. 2252,
lines 18-22: p. 2254, lines 22-24. However, this explanation is contradicted by the Company’s
202
proposed change to the line extension policy. The Company proposes to adopt Western
Massachusetts’ line extension policy and discontinue the line extension policy for Boston Edison
Company, Cambridge Electric Light Company, and Commonwealth Electric Company even
though Western Massachusetts has far fewer customers than those other legacy companies. Exh.
AG 49-3; Tr. Vol XI, p. 2245. Actually, in angling to move toward a unified tariff, the evidence
shows that where there were differences between the tariffs, and the Company has chosen to
adopt the tariff language that favors the Company and disadvantages customers without
sufficient justification.
As discussed below, the AGO objects to certain new provisions in the consolidated
Terms and Conditions. The AGO recommends that the Department (1) eliminate the Company’s
Force Majeure provision; (2) limit the Company obligation for meter and communication device
installation to 30 Days; (3) eliminate the Limitation of Liability provision for curtailment of
service; and (4) exempt low-income customers from the Company proposal to increase certain
fees.
2. ELIMINATE THE COMPANY’S PROPOSED FORCE MAJEURE
PROVISION
The Company is proposing to include in its Terms and Conditions a force majeure
provision that exempts the Company from liability from conditions over which it has no control.
Exh. ES-RDP-14, pt. 1, p. 181 (Force Majeure); Tr. Vol. XI, pp. 2254-2255. The AGO opposes
this language because it could pre-empt Department authority, and is not necessary because of
the “limitation of liability” provision in the Terms and Conditions. Exh. ES-RDP-14, pt. 1, p.
181
Massachusetts utilities “have an obligation to restore service in a safe and timely
manner.” Massachusetts Electric Company v. Department of Public Utilities, 469 Mass 553, 554
203
(2014), citing Fitchburg Gas & Electric Light Company, D.P.U. 09–01–A (2009); Eastern
Edison Company, D.P.U. 85–232 (1986); Western Massachusetts Electric Company, D.P.U. 95–
86 (1995) (severe wind storm). As part of its general supervisory authority, the Department
resolves customer complaints regarding the quality and cost of electric service. G.L. c. 164, §
76; 220 C.M.R. § 25.00 et seq. The Department also evaluates electric company performance in
restoring electric service; has authority to set service quality and restoration of service standards;
and penalizes companies for violating these standards. G.L. c. 164, §§ 94; 85B; 1I; 1J; 1K and
220 C.M.R. § 19.00 et seq.
There may be circumstances where the Company might intend to apply this force
majeure provision to its customers without required review or approval by the Department, or a
court of competent jurisdiction. Only the Department, or a court of competent jurisdiction – not
the Company – determines whether the Company “shall be excused from performing under the
Schedule of Rates and . . . not be liable in damages” due to a force majeure. Exh. ES-RDP-14,
pt. 1, p. 181.
The Company’s “Limitation of Liability” provision in the Terms and Conditions exempts
the Company from liability for damages “unless there is negligence on the part of the
[C]ompany.” Exh. ES-RDP-14, pt. 1, p. 181 (Limitation of Liability). A force majeure event,
being outside of the control of the Company, could not be caused by any actions or omissions of
the Company that would support a Department (or court) finding of negligence. Therefore, the
Limitation of Liability provision of the Terms and Conditions precludes the necessity of a force
majeure provision.
204
3. LIMIT THE COMPANY OBLIGATION FOR METER AND
COMMUNICATION DEVICE INSTALLATION TO 30 DAYS
The Company is proposing to change its obligation for meter and communication device
installation upon customer request from “within 30 days,” to “if reasonably possible, within 30
days”. Exhs. ES-RDP-14, pt. 1, pp. 166-167. By including the language “if reasonably
possible” the Company is providing itself with more flexibility than it would have if the
language were not included.
In its response to discovery, the Company justifies including the “if reasonably possible”
language because “it is not aware of any meter changes that were not completed within 30 days
so long as they were within the capabilities of the Company to execute them.” Exh. AG-49-6.
However, assuming that this is the case, the Company’s explanation would support the exclusion
of the language “if reasonably possible.”
Moreover, any delay in installing a meter and/or a communication device beyond 30 days
could adversely affect the customer’s quality and cost of service, and possibly delay restoration
or initiation of electric service. See G.L. c. 164, §§ 122 (Use of Incorrect Meter); 124 a - 124i
(Shutting off or Failing to Restore Service). Therefore, the AGO recommends that the
Department exclude the language, “if reasonably possible.”
4. ELIMINATE THE LIMITATION OF LIABILITY PROVISION FOR
CURTAILMENT OF SERVICE
The Company is proposing to limit Company liability regarding curtailment or
interruption of service. Exhs. ES-RDP-14, pt. 1, p. 181; Tr. Vol. XI, pp. 2254-2255. The AGO
recognizes - and supports - the need for the Company to protect the integrity of its system.
However, the AGO objects to the Terms and Conditions language that automatically excludes
liability.
205
the Company may, in its sole judgment, curtail or interrupt electric service
or reduce voltage and such action shall not be construed to constitute a
default nor shall the Company be liable therefor in any respect.
Exh. ES-RDP-14, pt. 1, p. 181
Company application of this provision could preclude a customer an opportunity to
exercise his or her statutory rights to resolve bona fide disputes. See G.L. c. 164, §§ 1a (Electric
Restructuring); 1f (Consumer Protection); 1i (Service Quality); 139, 139a, 140, (Net Metering
Facilities); 142 (Distributed Generation); 220 C.M.R. § 8.00 (Qualified Facilities and On-Site
Generation); 10.00 (Electric Restructuring); 18.00 (Net Metering); 19.00 (Emergency Response
Plans); and 25.00 (Billing and Termination Procedures).
The Company justifies adopting this language because it is in the Commonwealth
Electric tariff, implying that the Company is using the Commonwealth Electric tariff as the
baseline, and that the provision is not new. Exh. AG-49-16. However, explaining that the
Company is adopting tariff language which is less favorable to customers simply because it
decided to adopt Commonwealth Electric’s tariff as the baseline tariff, does not justify using the
more stringent language. Further, the fact that the provision is preexisting also does not explain
why it is necessary to include in the consolidated Terms and Conditions. The Company witness,
Mr. Chin testified that that this provision is needed for customer safety and system integrity.
Exh. Tr. Vol. XI, p. 2255. However, since this provision did not appear in all tariffs it is clearly
not considered necessary for these reasons.
The AGO requests that the Department exclude the language that automatically limits
liability in the Company’s Terms and Conditions with respect to curtailment or interruption of
service.

206
5. FEE INCREASES
The Company is simultaneously proposing to increase the fees in Appendix A of each
legacy company’s Terms and Conditions for Distribution Service, including the returned check
fee, account restoration charges, and a warrant fee. Exhs. ES-RDP-9, p. 17; ES-RDP-14, pt.1, p.
184; DPU-6-4, Atts. DPU-6-4(a)-(g); Tr. Vol. XI, p. 2266. The WMECo legacy company’s last
rate case was D.P.U. 10-70 and WMECo presumably appropriately reset its fees at that time.
The record does not indicate when the NSTAR legacy companies last reset its rates. In its initial
filing, the Company proposed certain fees. See e.g., Exh. ES-RDP-14, Pt. 1, p. 184. On cross
examination, the Company stated that “we had some formula errors” and changed the proposed
fees, in some cases quite significantly. Tr. Vol. XI, p. 2260; DPU-6-4, Atts. DPU-6-4(a)-(g). In
addition, the changed fees levels were subsequently proposed to be adjusted to round the fee to
the nearest dollar. Tr. Vol. XI, pp. 2260, 2266.
The Company’s current proposal for the account restoration fee, $71, is an increase of
approximately 700 percent for Commonwealth Electric and Cambridge Electric Light, about 450
percent for Boston Edison, and about half Boston Edison’s percentage for WMECo. Tr. Vol. XI,
p. 2260. Other fees have also increased significantly, for example the ‘can’t get in’ or warrant
fee, increased to $214. Tr. Vol XI, p. 2266. (However, it is sometimes difficult to discern from
the Company’s presentation exactly what is being changed and from what levels.) See e.g. Exh.
ES-RDP-14, Pt. 1, p. 184; Exh. ES-RDP-14, Pt. 2, p. 201.) The Company’s witness testified that
the Company wanted to move to blended cost based fees for all legacy companies (Tr. Vol. XI,
p. 2268), although at the same time the Company testified that some additional factors were not
considered and so the fees were not truly cost based. Id., pp. 2268-2269. The Company did not
consider a series of increases over time to avoid the abrupt increases proposed. Id.
207
Given that the fee increases proposed by the Company are very large and potentially
disproportionately impacts a disadvantaged (i.e., low-income) segment of the Company’s
customer base, the Department should implement any increases over time consistent with its
long-standing principle of rate continuity. One way to set new fees would be to take the fee
levels established in 2010 for WMECo and adjust them upward to reflect cost increases in the
intervening seven years.
Moreover, regardless of the fee level established, it would be appropriate to exempt those
Company customers on the low-income rate from at least the Account Restoration fee.55 There
is abundant precedent for this. National Grid not only has a much lower Account Restoration fee
as part of its Terms and Conditions ($38) but it exempts its low-income customers from this fee.
The pertinent language of the National Grid tariff (M.D.P.U. 1192, Appendix A) is as follows:
Account Restoration Charge
Pursuant to the Company’s Terms and Conditions, the Company
may assess an Account Restoration charge for the restoration of
service after discontinuance…. The Account Restoration Charge of
thirty eight dollars ($38) will be charged and collected from all
customers except the Company’s low income (Rate R-2) customers.
The Department should adopt the same language in this proceeding for Eversource.
6. THE DEPARTMENT SHOULD REQUIRE ADDITIONAL CUSTOMER
EDUCATION, OUTREACH, AND COMPANY OWNERSHIP OF PRIVATE
POLES
Eversource proposes to adopt WMECo’s line extension policy for all of Eversource’s
customers. Although the current and proposed line extension policies require Company
55 The Department has the authority to mandate reduced fees on the basis of income criteria. American Hoechest
Corporation, 379 Mass 408 (1980); Boston Edison Company v. Department of Public Utilities, 375 Mass 443, 489
(1971).
208
ownership of any installed poles and wires, more than 11,600 customer accounts continue to
receive electric service over lines attached to privately-owned poles and wires.56 Tr., Vol. XI,
pp. 2277-78; RR-AGO-11, Att. (c). Private ownership of poles and wires is a result of practices
in real estate development and utility regulation that occurred decades ago, and thus, many
customers who receive service through privately-owned poles and wires today are surprised
when they learn of their ownership and maintenance responsibilities. Moreover, only a small
percentage of affected customers have engaged with the Company to transfer ownership. The
Company should take additional steps to inform customers, particularly those new property
owners taking over existing service, and to accelerate the transfer of ownership of this privately-
held equipment to the Company.
Eversource estimates that some 20,000 poles and 2,800 pole lines continue to be privately
owned by 11,638 customer accounts. Tr., Vol. XI, p. 2276; RR-AG-11, Att. (c). Although most
of the affected equipment, 18,146 poles, are in the former Commonwealth Electric Company’s
service territory, privately-owned poles are present throughout the Company’s territory.57 RR-
DPU-35, Att. Although the Company does not own or maintain privately-owned equipment, it
attempts to track it via its Graphical Information System (“GIS”). Tr., Vol. IV, p. 752; Tr., Vol.
XI, p. 2277.58
In 2014, at the Department’s direction, the Company renewed efforts, originally begun in
1991, to inform customers of their responsibilities with respect to the privately-owned equipment
and options for ownership transfer. Tr., Vol. XI, pp. 2282-83, Exh, RR-AG-11, Att. (d). As part
56 Beginning with a 1998 tariff update for Commonwealth Electric Company customers, the Company ended the
practice of privately-owned poles and wires by requiring pole ownership transfer in its line extension policy. 57 The Company identified the following quantities of privately-owned poles in each of its five regions: Metrowest:
1,316; MetroBoston: 706; Cambridge: 2,072; South: 18,146; and West: 28. Exh. RR-DPU-35, Attachment. 58 The Company first took stock of the prevalence of privately-owned poles and wires in the aftermath of Hurricane
Bob, which hit the Company’s service territory in the south coast of Massachusetts and Cape Cod particularly hard
in 1991. Tr., Vol. XI, pp. 2280, 2282-83.
209
of this effort, the Company sent at least one form letter to each of the 11,638 affected customer
accounts, with approximately one-third receiving two reminder letters and another approximately
one-third receiving only the original letter. RR-AG-11, Att. (c), p. 2. Distribution of the letters
began in May 2014 and concluded in September 2015. Id. The form letter advised the customer:
(1) they are served, in part, by privately-owned electrical equipment; (2) they are responsible for
maintenance and restoration after a storm; and (3) they may retain ownership or can work with
the Company to take ownership after “certain requirements are met.” Exh, RR-AG-11,
Attachment (a). The Company does not appear to have made any efforts to communicate with
customers since September of 2015. See RR-AG-11; RR-AG-11 Att. (c).
In order for the Company to assume ownership, the equipment must be in good condition
or replaced to company standards, and there must be an easement for the private real property to
allow for maintenance and restoration efforts and trimmed trees. Tr. Vol. XI, pp. 2281, 2288-89.
The customer form letter does not provide customers with these details, nor does the Company
provide an estimate of the customer’s cost to bring the equipment and property up to the proper
standards. RR-AG-11, Att. (a). The Company does not have a current estimate of the cost to
assume legal responsibility of the privately-owned poles and pole lines. Tr., Vol. XI, pp. 2289-
90. In 1991, the Company estimated that doing so would cost at least $25 million. Tr., Vol. XI,
pp. 2290-91. Considering the age of the infrastructure and the impact of inflation on that 1991
estimate, the cost to assume legal ownership of all privately owned poles and wires is likely
much higher. Id.
The Company indicates that, as a result of the renewed communications efforts in 2014,
877 customers are willing to work towards ownership transfer, a mere 7.6 percent [ 877 / 11,600
] of the affected customer population. Tr., Vol. XI, p. 2282. As the condition of this equipment
210
continues to deteriorate over time, the customer’s and Company’s service is further placed at
risk. Furthermore, new homeowners are likely to be even more oblivious to the true nature of
their electric service than existing homeowners. To minimize customer confusion, the
Department should require the Company to actively engage with customers to facilitate
ownership transfer and apprise new customer account holders of any private ownership
responsibilities when they open a new account.
K. MERGER REVIEW - SECTION 96
1. BACKGROUND
On July 16, 2016, the Company filed with the Department a request for advisory ruling
that a proposed consolidation of NSTAR and WMECo did not require Department pre-approval
under Section 96. On August 10, 2016, the Attorney General filed comments with the
Department arguing that Eversource was required to file for and obtain Section 96 approval
before Eversource could consolidate its operating companies.
On January 13, 2017, the Department agreed with the AGO and required Eversource to
file for Department review and approval under Section 96 before consolidating NSTAR and
WMECo. NSTAR Electric Company and Western Massachusetts Electric Company each d/b/a
Eversource Energy, D.P.U. 16-108 (July 13, 2017). In its Order, the Department required the
Company’s Section 96 petition to include, in addition to the showings provided by Section 96
and Department precedent, a description of the consolidated entity, the functionality of the
consolidated entity, the integration process, the timing of the integration process and the
organizational, accounting, and legal steps to be taken to accomplish the consolidation. D.P.U.
16-108, p. 21. In addition, given the review of the NSTAR/NU merger in prior proceedings, the
211
Department anticipated to focus its review in this docket on “matters associated with service
quality and rate impacts for customers.” Id.
2. THE DEPARTMENT SHOULD CONSIDER RATE IMPACTS BEFORE
APPROVING THE COMPANY’S SECTION 96 PETITION
In its Interlocutory Order on Attorney General’s Motion to Protect Intervenors’ Due
Process Rights, D.P.U. 17-05, (June 9, 2017) the Department determined that “it is critical that
the issue of rate design receive adequate attention within this docket.” D.P.U. 17-05, p. 13.
“[U]nlike the rate design set forth in the Companies’ initial filing, here the Companies propose to
consolidate rate classes and rates for NSTAR’s and WMECo’s residential customers effective
January 1, 2019.” Id., p. 6.
The revised proposal does, however, shift revenues between
NSTAR Electric and WMECo as compared to the original proposal
(Exh. ES-RDP-3 (ALT1), Sch. RDP-4 (East/West)). If the various
rate design changes are approved as proposed, bill impacts for
certain WMECo and NSTAR Electric customers would decrease in
relation to the original proposal while bill impacts for other WMECo
and NSTAR Electric customers would increase in relation to the
original proposal (Exhs. ES-RDP-2 (ALT1), D.P.U. 17-05 Page 7
Sch. RDP-9 (East/West); ES-RDP-3 (ALT1), Sch. RDP-3
(East/West); ES-RDP-4 (ALT1), Schs. RDP-3 (East/West) through
RDP-7 (East/West), and RDP-15; DPU 56-9 (Supp.) at 7).
Id., pp. 6-7.
The Department has established a separate schedule to investigate new rate design
proposals. While the Department has some evidence in the record regarding service quality, it
has yet to consider matters associated with rate impacts for customers. Before deciding on
whether the proposed consolidation is in the public interest, the Department should be informed,
based on the evidence, about how that consolidation will impact customers’ bills. In order for
the Department to determine whether the proposed merger is in public interest, the Department

212
must determine if it can set just and reasonable rates after the merger according to its five goals
for utility rate structure: Efficiency; Simplicity; Continuity, Fairness; and Earnings Stability.
Thus, the Department should not rule on the Section 96 request until after it hears all the
evidence on the current rate design proposals and rate impacts on customers.
213
VI. CONCLUSION
The Department should reject the Company’s proposed rate increase and should accept
the AGO’s recommendations as set forth in this brief as they are in the interest of the Company’s
customers.
Respectfully submitted,
MAURA HEALEY
ATTORNEY GENERAL
By:
Joseph W. Rogers
Nathan Forster
John J. Geary
Matthew Saunders
Donald Boecke
William Stevens
Elizabeth Anderson
Lynda Freshman
Alexander Early
Joseph Dorfler
Elizabeth Mahony
Sarah Bresolin
Shannon Beale
Christina Belew
Assistant Attorneys General
Office for Ratepayer Advocacy
One Ashburton Place
Boston, MA 02108
(617) 727-2200
July 21, 2017