competition pipeline gas vs lng in europe
TRANSCRIPT

<Title of Presentation>
By: <Author Name>, <Organization>
<Date>
<Title of Presentation> By: <Author Name>, <Organization>
<Date>
17th INTERNATIONAL CONFERENCE & EXHIBITION
ON LIQUEFIED NATURAL GAS (LNG 17)
Competition pipeline gas vs LNG in Europe By: Denis BONHOMME, Executive Vice President Strategy,
GDF SUEZ LNG
17 April 2013
17th INTERNATIONAL CONFERENCE & EXHIBITION ON
LIQUEFIED NATURAL GAS (LNG 17)

LNG 17 – Houston – 17 April 2013
This presentation is not intended to provide the basis for any evaluation of GDF
SUEZ or of any of its subsidiaries. Although GDF SUEZ uses reasonable care to
include in this presentation information which it believes is up-to-date and
accurate, GDF SUEZ makes no representation or warranty as to the adequacy,
accuracy, completeness or correctness of such information nor does it warrant
or represent that the presentation shall be complete in every respect. GDF
SUEZ shall have no liability resulting from the use of the information provided in
this presentation nor shall it have any liability for the absence of any specific
information herein. The information may be changed by GDF SUEZ at any time
without prior notice. Nothing herein may be considered as being an offer to
purchase or subscribe securities. The name and logo of GDF SUEZ, as well as
the name and logo of affiliated companies, that appear in this presentation are
trademarks and trade names protected by national and international laws. The
copyright on this presentation belongs to GDF SUEZ.
2

European Natural Gas and LNG markets – Current Situation
3

LNG 17 – Houston – 17 April 2013
European natural gas consumption
Decreasing European
natural gas demand by 1.4%
in 2012 vs 2011 due to
challenging economic
conditions and competition
with coal in power.
In 2012, pipeline gas
imports to Europe remained
stable.
LNG imports fell by 23 Bcm.
4 Source: CERA, GDF SUEZ March 2013
577 518 511
Bcm
B
cm
European natural gas consumption by sector
European natural gas consumption by supply source
577 518 511

LNG 17 – Houston – 17 April 2013 5
European LNG imports
dropped by 23 bcm or
17.5 mt (-27%)
Asia (+15.5 mt) and Latin
America (+3.5mt) attracted
flexible LNG, out of Europe;
Liquefaction plants faced
production issues in Egypt
and in Algeria: - 3.1 mt.
Decreasing imports in
the UK: -8.2mt. The
country is now the 2nd
European LNG importer.
Focus on the European LNG flows
2012 vs. 2011 mt
Source: PFC
European LNG imports
LNG exports to Europe
Total 2011: 65.7 mt
Total 2012: 48.1 mt (-17.5 mt)
-8 -3
-3.5
-1 +1 -2.5
-0.5 +0.2 0
-9
-2
mt
-2.5
-1 -1
+0.5 +0.5 -1 +0.5

European Natural Gas and LNG markets – Long-Term Outlook
6

LNG 17 – Houston – 17 April 2013
Europe’s long-term natural gas demand
7
European gas demand is
expected to grow between
2010 and 2030 at an average
annual rate of +0.16%.
Two distinct periods are
expected to shape the
European market;
- 2010-2020: decrease in gas
needs (-31 bcm)
- 2020-2030: demand picking up
(+49 bcm)
Consumption growth is
anticipated in transport
(+19bcm), in power generation
(+9bcm) and in industry
(+7bcm).
Source: CERA March 2013
577 546
595

LNG 17 – Houston – 17 April 2013
Europe long-term natural gas supply : domestic production
8
Domestic production is expected to decline by -1.7% per year between 2010 and 2030
Current production levels in Norway should remain steady
Shale gas in Europe (notably in Poland) is in its very early stages of resources
appraisal. Its development is not expected to be as fast as in the US, because of different
geological, regulatory, social and environmental issues
Source: CERA January 2013
Stable
- 6%
- 6.6%
+11.5%
- 3.5% CAGR
LNG 17 – Houston – 17 April 2013
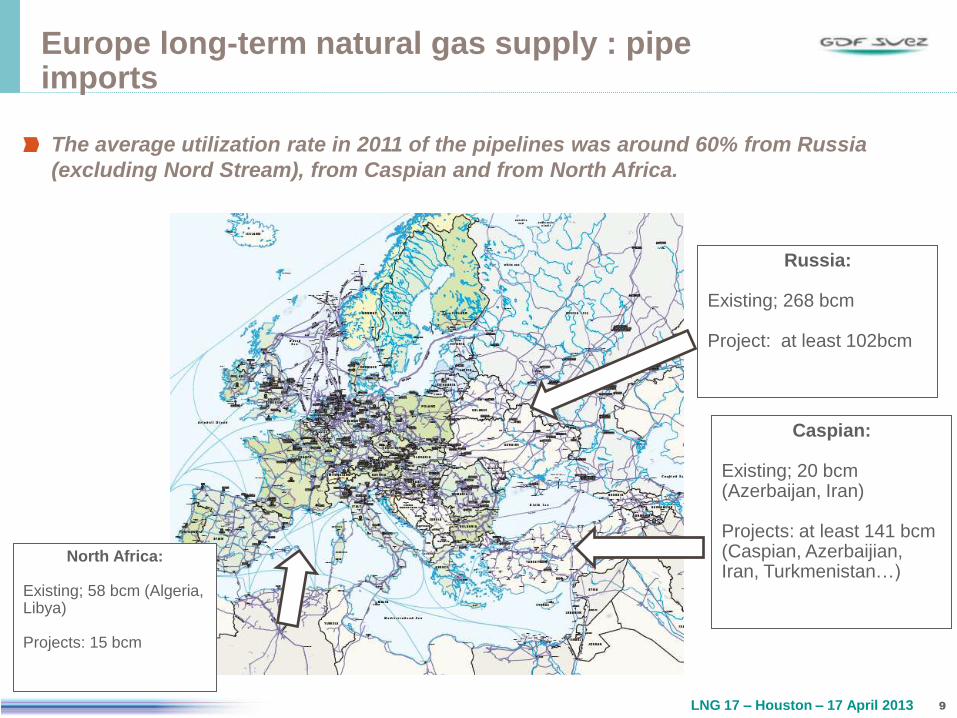
Europe long-term natural gas supply : pipe imports
9
The average utilization rate in 2011 of the pipelines was around 60% from Russia
(excluding Nord Stream), from Caspian and from North Africa.
Russia:
Existing; 268 bcm Project: at least 102bcm
North Africa:
Existing; 58 bcm (Algeria, Libya) Projects: 15 bcm
Caspian:
Existing; 20 bcm (Azerbaijan, Iran) Projects: at least 141 bcm (Caspian, Azerbaijian, Iran, Turkmenistan…)

Addressing the long term European supply/demand gap – LNG vs Pipeline
1
0

LNG 17 – Houston – 17 April 2013
European natural gas demand / supply gap outlook – domestic supplies
11
From 50% in 2010, domestic
production is expected to
represent slighly above 40% of
total European gas demand in
2020, and 35 % in 2030.
Source: CERA, GDF SUEZ

LNG 17 – Houston – 17 April 2013
European natural gas demand / supply gap outlook – domestic supplies and pipeline imports
In 2012, pipeline imports
accounted for ~40% of total
European gas needs.
Pipeline imports are expected
to increase by +1.7% per year
on average over 2010 - 2030
Russia will remain the key
supplier for Europe, with
pipeline projects development
(North Stream, South Stream)
Additional pipeline gas would
require significant financial
investments
12
Source: CERA, GDF SUEZ

LNG 17 – Houston – 17 April 2013
European natural gas demand / supply gap outlook – the Russia max case
13
Russia and the Caspian have
the ability to increase their
export level to Europe
In this case Russia would
export at 85% of the nominal
pipeline capacity to Europe
Source: CERA, GDF SUEZ

LNG 17 – Houston – 17 April 2013
European natural gas demand / supply gap outlook – the Russia max case
14
The additional pipeline imports
from Russia would be directly
competing with LNG.
Long term LNG contracts are
not renewed due to a strong
pipeline competition.
As a consequence, additional
LNG imports are not required
in Europe before 2022.
Source: CERA, GDF SUEZ

LNG 17 – Houston – 17 April 2013
European natural gas demand / supply gap outlook – the base case
No additional pipeline imports
assumed
LNG imports:
Until 2015 contracted LNG
should cover most of the
needs.
Current LNG contract
renewed
After 2015 Europe may have
to import new volumes,
especially from flexible LNG
Which LNG will fill the
supply/demand gap ?
15
Source: CERA, GDF SUEZ
2020: ~40 bcm 2030: ~60 bcm

LNG 17 – Houston – 17 April 2013
Competition between future LNG projects to supply Europe
16
0
2
4
6
8
10
12
$/M
MB
tu
Shipping Liquefaction
Upstream
European Gas Price (UK NBP 2016-2035)
LNG Costs To Europe
Source: IHS CERA.
Notes:
Calculated “Break-even” Cost of Supply Delivered to Europe, including Liquids Credits, excluding regas.
Russia cost represents the cost of gas from Bovanenkovo to European border
New Russian Supply
New liquefaction projects
will be needed on top of
flexible volumes, and are
expected from the US,
Africa (West and East), the
Mediterranean basin or
Arctic areas.
Marginal supply cost is not
the sole driver of European
gas prices: Additional Russian/
Caspian volumes would
depend on the producers’
willingness to adapt to a
strong competition
environment.
Diversification and
security of supply are key
for Europe.

LNG 17 – Houston – 17 April 2013
17