australia pacific lng project supplemental …eisdocs.dsdip.qld.gov.au/australia pacific...
TRANSCRIPT
Australia Pacific LNG Project Supplemental information to the EIS Coastal Environment - Pipeline

Coastal Environment - Pipeline
Australia Pacific LNG Project EIS Page ii August 2010 Rev 0
Disclaimer
This report has been prepared on behalf of and for the exclusive use of , and is subject to and issued in accordance with the agreement between and WorleyParsons Services Pty Ltd. WorleyParsons Services Pty Ltd accepts no liability or responsibility whatsoever for it in respect of any use of or reliance upon this report by any third party.
Copying this report without the permission of or WorleyParsons is not permitted.

Coastal Environment - Pipeline
Australia Pacific LNG Project EIS Page iii August 2010 Rev 0
Executive Summary Supplementary information is presented in this report regarding new developments in relation to the gas transmission pipeline crossing of The Narrows and resulting potential impacts on the coastal environment and water quality.
WorleyParsons on behalf of Australia Pacific LNG has undertaken the following scope of works as supplementary information post EIS:
• Provide a summary of dredge plume methodologies used in the Gladstone Ports Corporation (GPC) Western Basin Dredging and Disposal EIS (WBDDEIS) modelling studies in consideration of recent geotechnical studies and sediment characterisation studies
• Undertake field work assessments in consideration of the proposed relocated corridor
• Model dredge plumes and describe potential impacts associated with a single pipeline trench
The pipeline crossing was assessed based on a single open cut trench across The Narrows and mudflats including sheet piling or drilling across the creeks. A detailed description of the crossing methodology is provided in Section 2.
Discussion and presentation of modelling results is provided in Section 4.
Modelling of sediment plumes is consistent with assumptions used in the GPC WBDD EIS. Modelled results indicate the Total Suspended Solids (TSS) concentrations associated with dredging the pipeline trench, are characterised by elevated levels on either side of the main channel for short durations at low tide. Statistical analysis of the modelled results was undertaken for selected locations along the pipeline alignment and within sensitive seagrass areas. This analysis indicated that the 90th percentile TSS concentrations associated with the dredging works would not exceed levels of normal background concentrations.

Coastal Environment - Pipeline
Australia Pacific LNG Project EIS Page iv August 2010 Rev 0
Contents
1. Introduction ........................................................................................................................ 1
1.1 Scope ................................................................................................................................. 1
1.2 Study Location ................................................................................................................... 1
1.2.1 Coastal Environment............................................................................................. 3
2. Study Methodology ............................................................................................................ 4
2.1 Field Work .......................................................................................................................... 4
2.1.1 Sediment Characteristics ...................................................................................... 6
2.1.2 Current Measurements (14-15 May 2010).......................................................... 12
2.2 Dredge Production and Near-Field Disturbance.............................................................. 13
2.3 Hydrodynamic Model Description .................................................................................... 14
3. Proposed Construction..................................................................................................... 16
3.1 Construction across The Narrows.................................................................................... 16
3.2 Construction across mudflats........................................................................................... 16
3.3 Friend Point Jetty ............................................................................................................. 16
3.3.1 Work Pads and Storage Areas............................................................................ 17
4. Discussion of Model Results and Potential Impacts ........................................................ 18
4.1 Mudflats............................................................................................................................ 18
4.2 The Narrows..................................................................................................................... 19
4.3 Potential Water Quality and Ecological Impacts .............................................................. 26
5. References....................................................................................................................... 28
Tables
Table 2-1 Sediment composition at Humpy Creek , Targinie Creek, and The Narrows (WorleyParsons 2010)....................................................................................................................................................7
Table 2-2 Coffey Geotechnics core sample sediment distributions (The Narrows 2009)...................8
Table 2-3 In-situ sediment composition (GPC WBDDEIS 2009) ........................................................9
Table 2-4 The Narrows in-situ averaged sediment compositions .......................................................9
Table 4-1 Mudflat open trench construction issues...........................................................................18
Table 4-2 CSD Production for single pipeline trench ........................................................................19
Table 4-3 Sediment characteristics used in dredge simulations .......................................................19

Coastal Environment - Pipeline
Australia Pacific LNG Project EIS Page v August 2010 Rev 0
Table 4-4 Time Series recording locations........................................................................................25
Table 4-5 Summary of modelled TSS concentrations (mg/l) at selected locations...........................26
Figures
Figure 1-1 Gas transmission pipeline corridor and LNG facility overview...........................................2
Figure 1-2 Exceedence of tidal water level - Fisherman's Landing.....................................................3
Figure 2-1 Targinie Creek looking south (high tide) ............................................................................5
Figure 2-2 Humpy Creek at the proposed pipeline crossing location at high tide (looking south) ......5
Figure 2-3 Humpy Creek near Phillipies Landing Road at low tide.....................................................6
Figure 2-4 Mudflats at Friend Point after recent high tide (looking towards Curtis Island) .................6
Figure 2-5 Vibro-core sample W14 (centre of channel - The Narrows) ..............................................8
Figure 2-6 Selected sampling sites ...................................................................................................11
Figure 2-7 Gladstone hydrodynamic model domain and bathymetry ...............................................15
Figure 4-1 Pipeline trench dredge plume snapshot sequence near Friend Pt..................................20
Figure 4-2 Pipeline trench - statistical maximum TSS concentration above background.................21
Figure 4-3 Pipeline trench - statistical mean TSS concentration above background .......................21
Figure 4-4 Pipe trench TSS concentration time series (a) Friend Pt (b) Tidal Flats .........................22
Figure 4-5 Pipe trench TSS concentration time series (a) main channel (b) Narrows......................23
Figure 4-6 Pipe trench TSS concentration time series (a) Laird Pt (b) Graham Ck..........................24
Figure 5-1 ADCP transect - The Narrows (14 May 2010, 10:18AM) ................................................30
Figure 5-2 ADCP transect - The Narrows (14 May 2010, 10:45AM) ................................................31
Figure 5-3 ADCP transect - The Narrows (14 May 2010, 12:11PM) ................................................32
Figure 5-4 ADCP transect - The Narrows (14 May 2010, 3:40PM)...................................................33
Figure 5-5 ADCP transect - The Narrows (14 May 2010, 5:01PM)...................................................34
Figure 5-6 ADCP transect - Targinie Creek south (15 May 2010, 8:59AM)......................................35
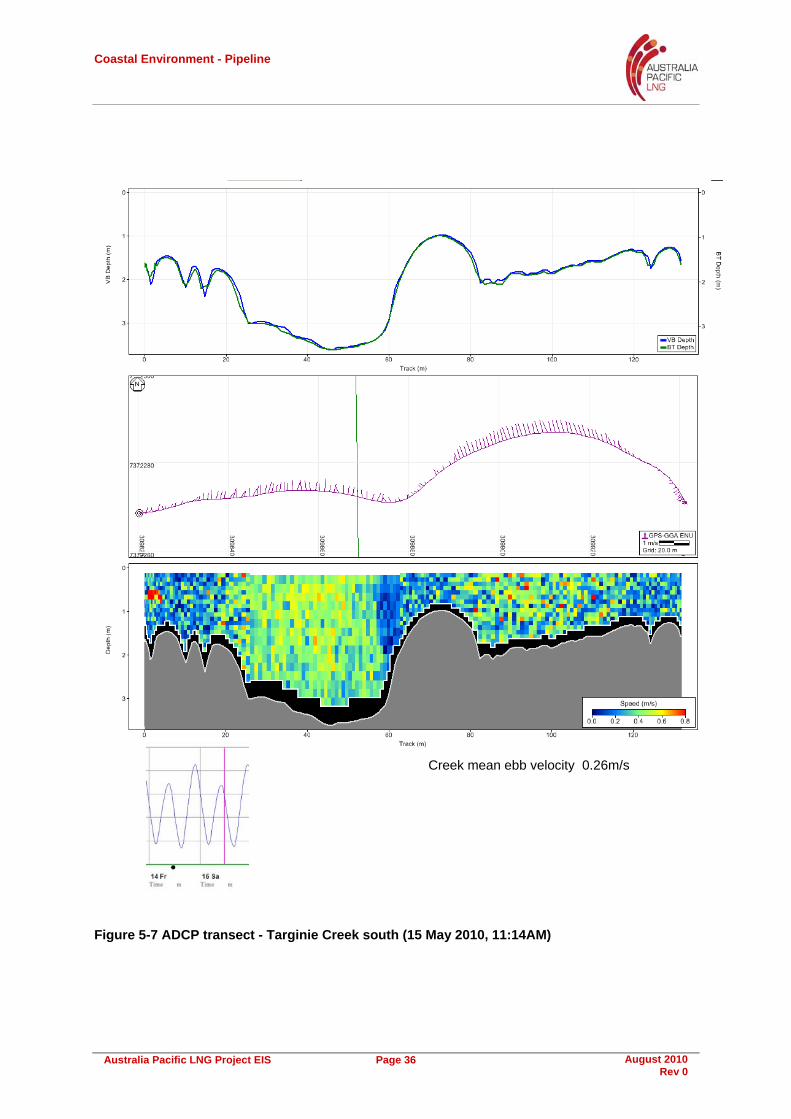
Figure 5-7 ADCP transect - Targinie Creek south (15 May 2010, 11:14AM)....................................36
Figure 5-8 ADCP transect - Targinie Creek Junction (15 May 2010, 9:20AM) .................................37
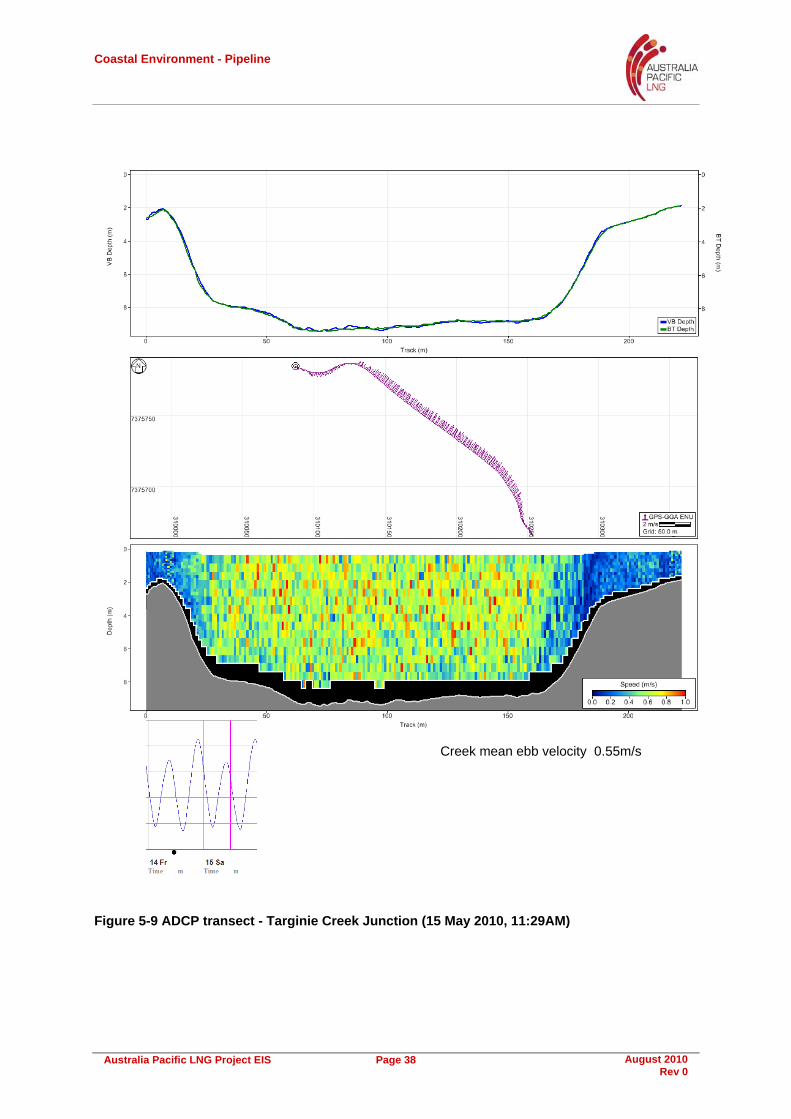
Figure 5-9 ADCP transect - Targinie Creek Junction (15 May 2010, 11:29AM) ...............................38
Figure 5-10 ADCP transect - Targinie Creek Junction (15 May 2010, 12:54PM) .............................39
Appendices
Appendix 1 - ADCP Results

Coastal Environment - Pipeline
Australia Pacific LNG Project EIS Page 1 August 2010 Rev 0
1. Introduction
The Australia Pacific LNG EIS was lodged with the Queensland Government on 29th January 2010. Supplementary information is presented in this report regarding new developments arising in relation to the gas transmission pipeline crossing of The Narrows and resulting potential impacts on the coastal environment and water quality.
1.1 Scope
Horizontal Directional Drilling (HDD) was presented as the preferred method of crossing The Narrows in the Australia Pacific LNG EIS. Further investigations have determined that HDD across The Narrows is not feasible due to engineering constraints. Open cut trench using a cutter suction dredge, which was presented as an alternative method in the EIS, has been identified as a technically sound option.
The alignment of the pipeline across The Narrows has been refined since the release of the EIS to align with the preferred corridor advised by Department of Infrastructure and Planning (DIP) and following submissions to avoid impacts on the Queensland Energy Resources Ltd (QERL) shale oil resources. The revised alignment is shown in Figure 1-1.
As a result of the change in construction methodology and alignment of the pipeline, the dredge volume has increased to 363,500m3.
Since the EIS was lodged in January 2010, events have transpired between the four respective LNG proponents, seeking to supply natural gas to their LNG facilities on Curtis Island, and the Queensland Government, in order to minimise the environmental impact. The Narrows Crossing Technical Working Group has been formed to progress all proposed LNG projects in a consolidated manner. Australia Pacific LNG is continuing to engage in technical and commercial negotiations with other proponents to enable a joint pipeline crossing of The Narrows.
WorleyParsons on behalf of Australia Pacific LNG has undertaken the following scope of works as part of the supplemental information to the EIS:
• Provide a summary of dredge plume methodologies used in the Gladstone Ports Corporation (GPC) Western Basin Dredging and Disposal EIS (WBDDEIS) modelling studies in consideration of recent geotechnical studies and sediment characterisation studies
• Undertake field work assessments in consideration of the proposed relocated corridor
• Model dredge plumes and describe potential impacts associated with the single pipeline open cut trench
1.2 Study Location
The proposed site on Curtis Island for Australia Pacific LNG’s facility is Laird Point. The gas transmission pipeline route is proposed to cross inter-tidal mudflats at Friend Point on the mainland side and then via a marine crossing over a wide channel of 1500 to 2300 metres (The Narrows) before entering the LNG facility. The temporary construction access will be wider than the as-constructed pipeline corridor.

Coastal Environment - Pipeline
Australia Pacific LNG Project EIS Page 2 August 2010 Rev 0
Figure 1-1 Gas transmission pipeline corridor and LNG facility overview

Coastal Environment - Pipeline
Australia Pacific LNG Project EIS Page 3 August 2010 Rev 0
1.2.1 Coastal Environment
The Coastal Environment of The Narrows was described in Volume 5, Attachment 27 of the EIS. The tidal dynamics and coastal processes described in the main EIS document apply to the pipeline marine crossing, and the general details are not repeated here.
Additional analysis of the tides was undertaken to determine how often the mudflats would be subjected to inundation during normal events. Surveyed levels of the intertidal mudflats will be undertaken prior to detailed design phase and, although levels vary according to drainage patterns, it is reasonable to assume they will range between 1-1.5m above mean sea level (MSL).
Therefore, according to Figure 1-2, the higher locations on the mudflats will be exceeded by tidal water-levels for more than 8% of the time and, in general, for more than 20% of the time nearer to the creeks and the other lower points.
Figure 1-2 Exceedence of tidal water level - Fisherman's Landing
Fisherman's Landing
99.999.59995908070503020105210.50.1-3-2.5
-2-1.5
-1-0.5
00.5
11.5
22.5
3
Percentage Exceedance
Tide
leve
l (m
MSL
)

Coastal Environment - Pipeline
Australia Pacific LNG Project EIS Page 4 August 2010 Rev 0
2. Study Methodology
The methodology used in this report is consistent with the previous work presented in the main EIS document (Volume 5, Attachment 27).
WorleyParsons model of Gladstone Harbour incorporating the existing bathymetry has been used in the supplementary assessment with modifications representing the stages in the development of the Western Basin at the time the pipeline crossing is scheduled to proceed.
The Narrows pipeline crossing was assessed based on the following assumptions:
• The high pressure gas pipeline is a 1.07m diameter continuous welded steel assembly, and would be installed with a minimum depth of cover to be determined during detailed design
• The mudflats are inundated during high water spring tides and mainly by the second high tide of the day (higher high water). According to Figure 1-2, the higher locations on the mudflats will be exceeded by tidal water-levels for more than 8% of the time and, in general, for more than 20% of the time nearer to the creeks and the other lower points. This will present challenges for the construction of a temporary access road across the mudflats and provision for creek crossings while the pipeline is being laid
2.1 Field Work
To provide more information on in-situ characteristics of sediments and tidal flows in the creeks potentially impacted by, or impacting on, The Narrows crossing project, several days of sampling and analysis was undertaken from 12 May to 16 May 2010. Sediment characteristics are reported in detail in a separate document (WorleyParsons 2010) and only key findings are presented in Section 2.1.1. A summary of the current measurement data collected is provided in Section 2.1.2.
In observing the rise and fall of the tide within the creek system during fieldwork, it is apparent the mudflats and shallower areas drain relatively quickly. Measurements of currents within the waterways to the west of Kangaroo Island provide; information on the advective behaviour of potential sediment plumes, and reference information for mitigation where applicable (e.g. silt curtains).
Figure 2-1 is a photo of the Targinie Creek system looking south (towards the end of the waterway) and indicates the conveyance width of this channel at high tide. Humpy Creek is shown in Figure 2-2 at high tide near the pipeline crossing location, Figure 2-3 is near Phillipies Landing Road at low tide and Figure 2-4 shows exposed mudflats shortly after the high tide at Friend Point.
Sediment plumes from dredging and excavation would be potentially influenced by the tidal range during construction activities.
Current measurements were taken with an Acoustic Doppler Current Profiler (ADCP) at intermittent times during the tidal cycle. This provides information on the tidal flows in areas not previously measured and is discussed in Section 2.1.2.

Coastal Environment - Pipeline
Australia Pacific LNG Project EIS Page 5 August 2010 Rev 0
Figure 2-1 Targinie Creek looking south (high tide)
Figure 2-2 Humpy Creek at the proposed pipeline crossing location at high tide (looking south)

Coastal Environment - Pipeline
Australia Pacific LNG Project EIS Page 6 August 2010 Rev 0
Figure 2-3 Humpy Creek near Phillipies Landing Road at low tide
Figure 2-4 Mudflats at Friend Point after recent high tide (looking towards Curtis Island)
2.1.1 Sediment Characteristics
For excavation work or dredging operations, sediment characteristics of the material to be removed is one of the parameters that governs the potential plume behaviour. A review was undertaken of the relevant in-situ bed material characteristics in Gladstone Harbour (Western Basin) from several publicly available reports.
2.1.1.1 WorleyParsons (2010)
WorleyParsons collected sediment samples across The Narrows, the mudflats and within the waterways at Friend Point through vibro-coring, auger, and borehole drilling in mid-May 2010. The WorleyParsons’ sediment characterisation report (WorleyParsons, 2010) provides the full assessment of this field work. Locations of the selected sample sites are shown in Figure 2-6.

Coastal Environment - Pipeline
Australia Pacific LNG Project EIS Page 7 August 2010 Rev 0
Particle size distribution (PSD) for creek based samples MF3 and MF12 are shown in Table 2-1. Additionally, selected samples along the proposed pipeline route across The Narrows are shown. As indicated in Figure 2-6 the locations W4 and W5 are in the inter-tidal zone at Friend Point; W12 and W14 are in the centre of the main channel; and W19 and W20 are in the intertidal zone on the Laird Point side.
Table 2-1 Sediment composition at Humpy Creek , Targinie Creek, and The Narrows (WorleyParsons 2010)
Depth(m) Gravel Coarse
sand Fine sand
Silt Clay Location
MF3 0.0-0.15 7% 16% 22% 21% 34% Humpy Creek
MF12 0.0-0.3 75% 5% 12% 4.5% 3.5% Targinie Creek
MF12 0.3-0.4 7% 22% 16% 24% 31% Targinie Creek
W4 0.5 – 1.0 11% 2% 23% 26% 38% The Narrows
W5 2.0 – 3.0 0% 2% 5% 32% 61% The Narrows
W12 0.0 - 0.5 32% 26% 15% 9% 18% The Narrows
W14 0.0 - 0.5 41% 10% 14% 14% 21% The Narrows
W19 0.0 - 0.5 13% 60% 11% 4% 12% The Narrows
W20 0.5 - 1.0 1% 1% 14% 32% 52% The Narrows
Sediments within the upper horizon of the creek beds contain a relatively high proportion of coarse material including gravel and sands. Sediments in the intertidal zones on either side of The Narrows generally consist of a higher proportion of fine material including silts and clays. However, a greater percentage of gravel and sand is prevalent in surface horizons in the centre of the channel and towards the Laird Point side. Figure 2-5 is a photo of the core sample taken at W14 in the centre of the channel. The ability to identify coarse grain material from the photo alone is indicative of the general character of the sediment in this location. Higher percentages of fine material re-suspension during dredging would be expected nearer the shorelines on both sides of The Narrows, unless some form of containment was implemented.
In shallower areas adjacent to Targinie Creek the spring tide currents are strong enough to suspend fine sediments in the water column as observed during site inspections. Under-water video camera work confirmed bed sediments are highly mobile in these areas and flocculated particles also lift off into suspension and then settle out under slack tide conditions as an unconsolidated layer.

Coastal Environment - Pipeline
Australia Pacific LNG Project EIS Page 8 August 2010 Rev 0
Figure 2-5 Vibro-core sample W14 (centre of channel - The Narrows)
2.1.1.2 Coffey Geotechnics (2009)
In September 2009, Coffey Geotechnics Pty Ltd completed a bathymetry, seismic reflection and seismic refraction study on behalf of GLNG (Coffey Geotechnics Pty Ltd, 2009).
Coffey Geotechnics core sample locations across The Narrows are shown in green in Figure 2-6. Particle size distribution (PSD) is shown in Table 2-2 for all cores at depths less than three metres.
Table 2-2 Coffey Geotechnics core sample sediment distributions (The Narrows 2009)
Site Depth(m) Gravel Coarse
sand Fine sand
Silt Clay
MBH01 2.45 ‐ 2.9 4% 41% 17% 15% 23%
4.0 ‐ 4.45 16% 46% 13.5% 7% 17.5%
5.0 ‐ 5.45 0% 6% 22% 41% 31%
MBH02 1.2 ‐ 3.0 66% 22% 3% 3% 6%
MBH03 0.0 ‐ 0.45 67% 15% 3% 4.5% 10.5%
MBH04 1.5 ‐ 1.95 0% 2% 3% 25% 70%
MBH05 3.0 ‐ 3.45 3% 7% 11% 39% 40%
MBH06 2.0 ‐ 2.45 1% 13% 8% 28% 50%
MBH07 1.5‐1.95 5% 20% 9% 21% 45%
Core samples taken by Coffey Geotechnics for locations across The Narrows extend to depths expected for dredging the bundled pipeline trench and where PSD analysis was undertaken these are shown in Table 2-2.
Coastal Environment - Pipeline
Australia Pacific LNG Project EIS Page 9 August 2010 Rev 0
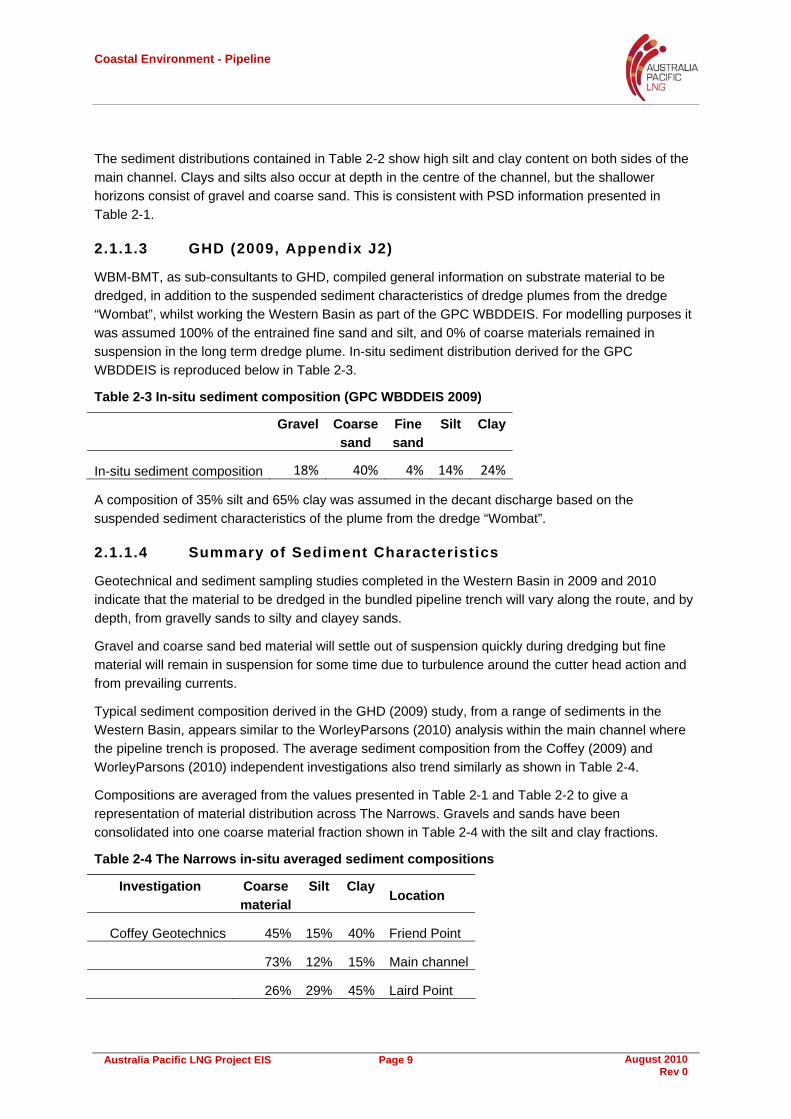
The sediment distributions contained in Table 2-2 show high silt and clay content on both sides of the main channel. Clays and silts also occur at depth in the centre of the channel, but the shallower horizons consist of gravel and coarse sand. This is consistent with PSD information presented in Table 2-1.
2.1.1.3 GHD (2009, Appendix J2)
WBM-BMT, as sub-consultants to GHD, compiled general information on substrate material to be dredged, in addition to the suspended sediment characteristics of dredge plumes from the dredge “Wombat”, whilst working the Western Basin as part of the GPC WBDDEIS. For modelling purposes it was assumed 100% of the entrained fine sand and silt, and 0% of coarse materials remained in suspension in the long term dredge plume. In-situ sediment distribution derived for the GPC WBDDEIS is reproduced below in Table 2-3.
Table 2-3 In-situ sediment composition (GPC WBDDEIS 2009)
Gravel Coarse
sand Fine sand
Silt Clay
In-situ sediment composition 18% 40% 4% 14% 24%
A composition of 35% silt and 65% clay was assumed in the decant discharge based on the suspended sediment characteristics of the plume from the dredge “Wombat”.
2.1.1.4 Summary of Sediment Characteristics
Geotechnical and sediment sampling studies completed in the Western Basin in 2009 and 2010 indicate that the material to be dredged in the bundled pipeline trench will vary along the route, and by depth, from gravelly sands to silty and clayey sands.
Gravel and coarse sand bed material will settle out of suspension quickly during dredging but fine material will remain in suspension for some time due to turbulence around the cutter head action and from prevailing currents.
Typical sediment composition derived in the GHD (2009) study, from a range of sediments in the Western Basin, appears similar to the WorleyParsons (2010) analysis within the main channel where the pipeline trench is proposed. The average sediment composition from the Coffey (2009) and WorleyParsons (2010) independent investigations also trend similarly as shown in Table 2-4.
Compositions are averaged from the values presented in Table 2-1 and Table 2-2 to give a representation of material distribution across The Narrows. Gravels and sands have been consolidated into one coarse material fraction shown in Table 2-4 with the silt and clay fractions.
Table 2-4 The Narrows in-situ averaged sediment compositions
Investigation Coarse material
Silt ClayLocation
Coffey Geotechnics 45% 15% 40% Friend Point
73% 12% 15% Main channel
26% 29% 45% Laird Point

Coastal Environment - Pipeline
Australia Pacific LNG Project EIS Page 10 August 2010 Rev 0
Investigation Coarse material
Silt ClayLocation
WorleyParsons 22% 29% 50% Friend Point
69% 11% 20% Main channel
50% 18% 32% Laird Point
Averaged composition 47% 19% 34%
Coarse material is present in significant amounts within the sediments along the proposed pipeline trench route, particularly in the surface and shallow horizons. However, in-situ sediments at the depth of excavation and dredging for the pipeline trench consist of a higher proportion of finer sediments (silt and clay), i.e. approximately 50% to 60% of the insitu material.

Coastal Environment - Pipeline
Australia Pacific LNG Project EIS Page 11 August 2010 Rev 0
Figure 2-6 Selected sampling sites
Coastal Environment - Pipeline
Australia Pacific LNG Project EIS Page 12 August 2010 Rev 0
2.1.2 Current Measurements (14-15 May 2010)
Current measurements were taken at The Narrows, and Targinie Creek with a SonTek RiverSurveyor M9 Acoustic Doppler Current Profiler (ADCP) during spring tides on the 14 and 15 May 2010. Transect locations and tidal current distributions across the waterway are plotted in Figure 5-1 through to Figure 5-10 in Appendix 1 - ADCP Results.
The network of mangrove lined creeks feeding into The Narrows is regarded as an Area of State Significance (Natural Resources) and contains sensitive coastal wetland habitat. Pipeline crossings of several creeks are proposed and excavation work has the potential to generate sediment plumes that could be transported within the waterways by tidal currents. Successful mitigation of potential sediment plumes is subject to the strength and persistence of tidal currents in these creeks.
Tidal current measurements within Targinie Creek can be summarised as follows:
• At the time of observation the flood tide currents were weakening as they approached high water slack phase. Mean current speeds were approximately 0.25m/s at the southern transect and 0.27m/s near the Junction with The Narrows
• Mangrove vegetation affects the flow distribution in the creeks and the deeper sections flow more quickly
• The ebb tide current at the southern transect of Targinie Creek within an hour after high tide was 0.26m/s (mean value) and 0.5m/s (approximately) within the deeper channel section. Soon after, at the transect of The Narrows junction, Targinie Creek mean ebb current speeds were about 0.5 to 0.6m/s
• Targinie and Humpy Creeks are shallow and large mud-banks are exposed near the bottom of the ebb tide giving the appearance of a fast draining system (see Figure 2-3). Flow essentially ceases when creeks have drained and this applies to the pipeline crossing location at lower stages of the tide
Tidal current measurements across The Narrows can be summarised as follows:
• Ebb flow current measurements across the pipeline route were relatively consistent across the deeper section but the discharge from Graham Creek also contributes to stronger current speeds in the shallower section of North Passage Channel
• Mean ebb currents on the lower high water (higher high water occurred before midnight) were between 0.6 and 0.7m/s for most of the ebb phase. Strong currents develop in this section across The Narrows due to a reduction in flow width from the Western Basin. Peak currents from the previous measurement campaign in July-August 2009 were 1.4m/s during the highest spring tides, as reported in the EIS
• At the start of the flood tide, currents are stronger through the shallower North Passage Channel than they are in the deeper main channel. Large mud-flats are exposed at low tide on the Friend Point side of the Western Basin
• As the tide continues to rise, flood currents are strongest approximately 300m out from Friend Point shoreline due to the additional flow merging from the inter-tidal zone on the Western Basin side

Coastal Environment - Pipeline
Australia Pacific LNG Project EIS Page 13 August 2010 Rev 0
2.2 Dredge Production and Near-Field Disturbance
In the WBDDEIS, GHD (2009, Appendix J2), it is outlined that dredging within the harbour would occur progressively over a number of stages and dredging plant capable of undertaking capital works was assumed to be as follows:
• A large Cutter Suction Dredge (CSD) having a production rate of 1000 m3/hr (in-situ volume)
• A medium CSD having a production of 500m3/hr
• A slurry pipeline was proposed for transporting dredged material from the CSD to the reclamation area and discharge of decant from the reclamation area would be at 2.5m3/s for the large CSD and 1.25m3/s for the medium CSD
• A large Trailer Hopper Suction Dredge (THSD) having a hopper capacity of 10,000m3 and operating on a cycle time of three hours of which one hour would be allocated for filling and overflow. It was proposed the TSHD would place material adjacent to the Fisherman’s Landing extended reclamation where a medium sized CSD would pick it up and discharge into the reclamation area
To be consistent with the GHD (2009) report, modelling of the pipeline dredged trench options conducted on behalf of Australia Pacific LNG used the same dredge plant assumptions for general dredging activities. The assumptions used in the GHD (2009) report are considered to be conservative as a modern, ‘large’, CSD production capacity could be one and a half to almost double the rate assumed in the WBDDEIS. The major dredging companies have many vessels in this class (11 self propelled CSD by 2011 of capacity greater than 15,000kW total power) and therefore the trench crossing could be completed in a shorter timeframe than considered here.
Furthermore, many modern TSHD are fitted with an anti-turbidity overflow device resulting in less air and consequently less turbulence in the overflow mixture, leading to reduced turbidity. A large TSHD is often fitted with equipment to allow ‘rain-bowing’ of the hopper material into the reclaimed area, thus avoiding the need for double handling by a medium CSD.
Chapter 2 of GHD (2010b) provides details on the type of dredges assumed to undertake the capital dredging works for the WBDD activities. Selecting the appropriate dredger for a pipeline trench influences the size and character of plume associated with suspended sediments.
A CSD, if used to dredge a trench across The Narrows, would produce a smaller plume closer to the bed than other plant and equipment because its suction line efficiently removes a high proportion of the disturbed material. The proposal to slurry the material to the reclamation via a pipeline eliminates plumes resulting from overflowing barge hoppers. Alternative dredging equipment capable of trenching across The Narrows includes mechanical dredgers such as:
• hydraulic backhoe
• clamshell or bucket dredge
• bucket ladder dredge
• bucket wheel dredge

Coastal Environment - Pipeline
Australia Pacific LNG Project EIS Page 14 August 2010 Rev 0
Mechanical type dredges produce a plume through the water column depending on the size of the bucket and the rate material spills from the bucket as it is raised to the surface. Production rates associated with these mechanical dredgers (except for giant backhoe dredgers) are typically lower than for a large CSD and accordingly dredging the trench may take longer.
It should also be noted that hard clay substrate layers have been identified within the pipeline corridor and the bed is strewn with cobbles and small boulders in some locations (WorleyParsons 2010) that may result in small delays for a CSD. On the other hand, hard clay layers, high in plasticity, may result in ‘clay balls’ forming from the cutter head action of the CSD. Production of ‘clay balls’ reduces the amount of fines capable of being released into the water column.
The disturbance made by the CSD and a TSHD depends on many factors and as stated in GHD (2009, Appendix J2, Section 4.2.3), “There is considerable uncertainty associated with prediction of dredge plume source loadings”. However, to be consistent with the GHD (2009) report, the assumed plume source loadings are used in the Australia Pacific LNG assessment.
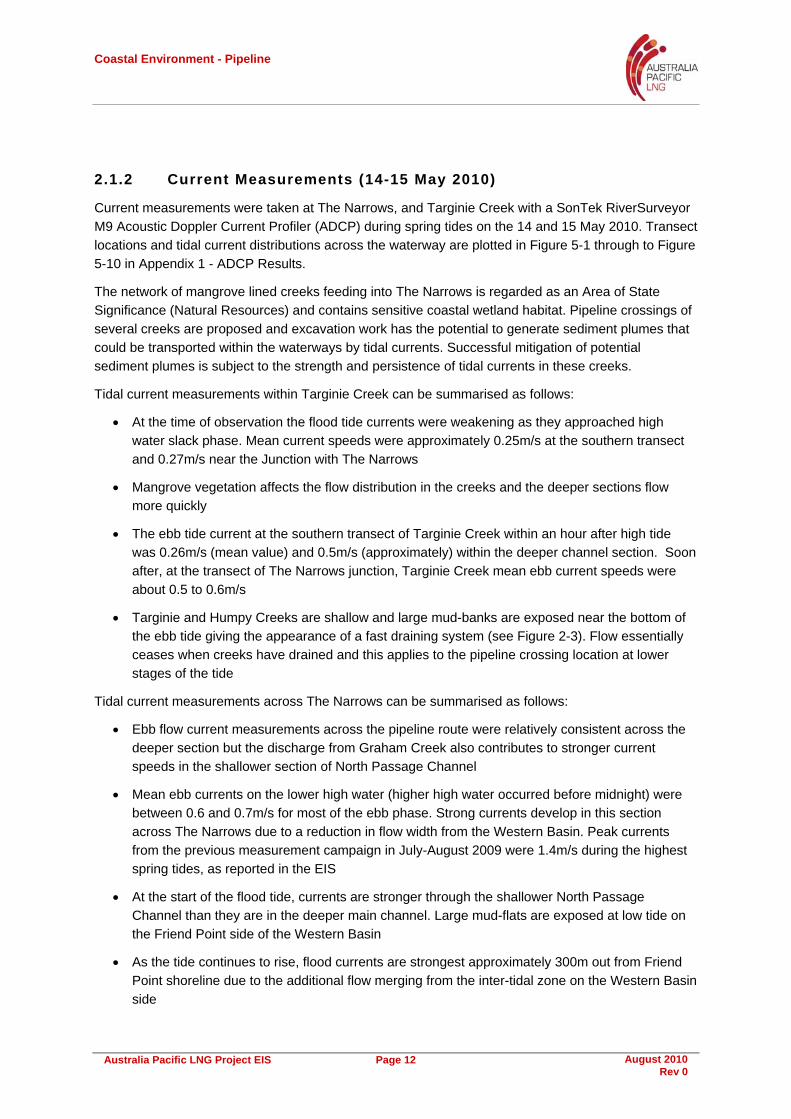
2.3 Hydrodynamic Model Description
Dredge plume modelling is based on WorleyParsons’ model of Gladstone Harbour and calibration and verification of the existing hydrodynamics was included in the original EIS document. The pipeline dredged trench modelling options considered other potential developments in the Western Basin occurring at the same time and the model bathymetry was updated accordingly.
The model is a finite volume flexible mesh and resolves the important features within the harbour relevant to the hydrodynamics including wetting and drying of inter-tidal areas. The Danish Hydraulic Institute (DHI) software contains modules for the two-dimensional vertically depth averaged hydrodynamics, advection-dispersion, and mud-transport for fine cohesive sediments coupled to wave dynamics where necessary, and can incorporate meteorological forcing as required.
The model domain and bathymetry used for the assessment is presented in Figure 2-7.
Coastal Environment - Pipeline
Australia Pacific LNG Project EIS Page 15 August 2010 Rev 0
Figure 2-7 Gladstone hydrodynamic model domain and bathymetry
Coastal Environment - Pipeline
Australia Pacific LNG Project EIS Page 16 August 2010 Rev 0
3. Proposed Construction
3.1 Construction across The Narrows
A cutter suction dredge (CSD) is proposed to be used to dredge between Friend Point on the mainland and Laird Point on Curtis Island. The trench would be 5m wide at the base, up to 7.4m deep and approximately 40 m wide at the seabed surface. The surface sediments across The Narrows are generally soft, with harder clays underneath. Side slopes vary from 1 in 4 in hard clays, to 1 in 8 in soft clays. The estimated maximum volume of material to be dredged across The Narrows is 363,500 m3.
3.2 Construction across mudflats
Pipeline construction across the mudflats is proposed as open cut trench and sheet piling is foreseen at the crossing of the creeks or locally where there are unstable ground conditions. HDD could also be used for creek crossings and would minimise impacts from Potential Acid Sulphate Soils (PASS) and Actual Acid Sulphate Soils (AASS). Construction of the trench would be expected to be completed within 9 to 12 months.
The open trench would naturally fill with tidal waters flowing across the mudflats during high tides and work would progress under ‘wet conditions’. The trench would have a base of approximately five metres and batter slopes of one in four and the depth of the trench will be adequate for the accommodating the diameter of the gas transmission pipe and a suitable amount of cover above. A concrete coating would be used to provide additional weight and control buoyancy effects.
Access is proposed via a stabilised road constructed using suitable earthworks machinery as follows:
• a layer or multiple layers of heavy geotextile membrane (e.g. Geoweb) on the undisturbed ground
• a base course of road grade material
• culverts, temporary bridges (Bailey) and openings placed accordingly to accommodate tidal flows
• layers of material added until road level is above most high tides
• rock armour added where scour prevention is required
Construction would proceed from the mainland side out to The Narrows and it is proposed to use the road for the pipeline construction Right of Way (ROW). After construction of the pipeline, the road would be removed working from The Narrows channel back to the mainland side leaving the mudflats in a similar state to that found prior to construction.
3.3 Friend Point Jetty
There may be a requirement for large items of plant for pipeline construction to access the mudflats (e.g. HDD rigs and cranes). Access for large construction equipment is proposed via The Narrows channel and a temporary jetty constructed in water that is sufficiently deep for barges carrying the consignment.

Coastal Environment - Pipeline
Australia Pacific LNG Project EIS Page 17 August 2010 Rev 0
In order to link the mudflats access road to the jetty the following options are being considered:
• bailey bridge
• sheet piled mounted bridge
• pontoons out to deeper water
• piled steel working platform
Impacts on the mudflats and tidal dynamics are minimised using any of the above and the structures can be removed once construction is completed.
3.3.1 Work Pads and Storage Areas
Several areas are currently being considered for work pads and storage areas leading up to and across the mudflats as follows:
• east of the QER land bridge a minimum area of 4 hectares is required for pipe strings, lay down area, and other construction activities
• an ASS treatment area of 21 hectares (450x450m) is proposed east of Calliope River – Targinie Road
• work-pads are required on the mudflats in several locations as shown in Figure 2-6 and are 50x50m and 30x30m to allow for storage of materials and plant.
The footprint of the pipeline and the construction access road is proposed as 50m wide with local restrictions of 30m wide in environmentally sensitive areas such as the mangrove stands.
Coastal Environment - Pipeline
Australia Pacific LNG Project EIS Page 18 August 2010 Rev 0
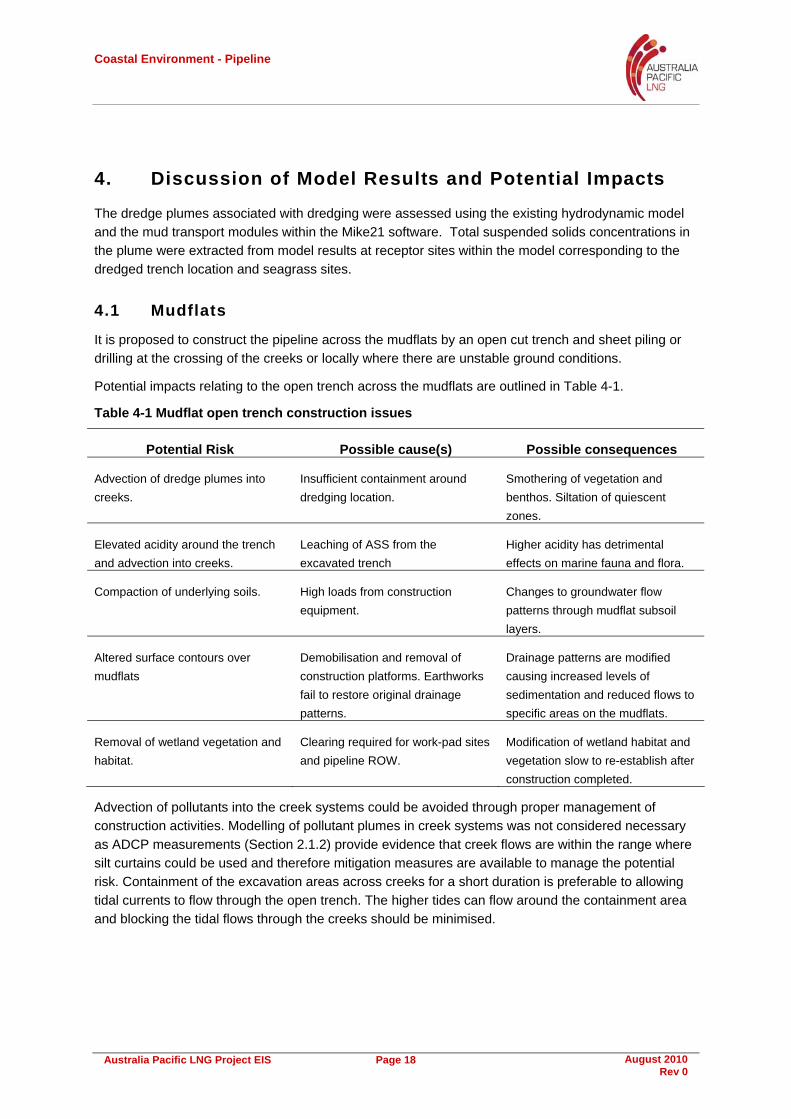
4. Discussion of Model Results and Potential Impacts
The dredge plumes associated with dredging were assessed using the existing hydrodynamic model and the mud transport modules within the Mike21 software. Total suspended solids concentrations in the plume were extracted from model results at receptor sites within the model corresponding to the dredged trench location and seagrass sites.
4.1 Mudflats
It is proposed to construct the pipeline across the mudflats by an open cut trench and sheet piling or drilling at the crossing of the creeks or locally where there are unstable ground conditions.
Potential impacts relating to the open trench across the mudflats are outlined in Table 4-1.
Table 4-1 Mudflat open trench construction issues
Potential Risk Possible cause(s) Possible consequences
Advection of dredge plumes into creeks.
Insufficient containment around dredging location.
Smothering of vegetation and benthos. Siltation of quiescent zones.
Elevated acidity around the trench and advection into creeks.
Leaching of ASS from the excavated trench
Higher acidity has detrimental effects on marine fauna and flora.
Compaction of underlying soils. High loads from construction equipment.
Changes to groundwater flow patterns through mudflat subsoil layers.
Altered surface contours over mudflats
Demobilisation and removal of construction platforms. Earthworks fail to restore original drainage patterns.
Drainage patterns are modified causing increased levels of sedimentation and reduced flows to specific areas on the mudflats.
Removal of wetland vegetation and habitat.
Clearing required for work-pad sites and pipeline ROW.
Modification of wetland habitat and vegetation slow to re-establish after construction completed.
Advection of pollutants into the creek systems could be avoided through proper management of construction activities. Modelling of pollutant plumes in creek systems was not considered necessary as ADCP measurements (Section 2.1.2) provide evidence that creek flows are within the range where silt curtains could be used and therefore mitigation measures are available to manage the potential risk. Containment of the excavation areas across creeks for a short duration is preferable to allowing tidal currents to flow through the open trench. The higher tides can flow around the containment area and blocking the tidal flows through the creeks should be minimised.

Coastal Environment - Pipeline
Australia Pacific LNG Project EIS Page 19 August 2010 Rev 0
4.2 The Narrows
Open cut trenching was assessed in the original Australia Pacific LNG EIS document and assumed a volume of 106,000m3 to be dredged with a barge mounted hydraulic backhoe and split hull barges to transfer the dredged material to the reclamation area. The single pipeline alignment is now south of the alignment assessed in the EIS and the trench volume has been reassessed assuming a medium to large Cutter Suction Dredge (CSD) undertakes the work as shown in Table 4-2. This type of dredge was selected to be consistent with modelling of the GPC WBDDEIS.
Table 4-2 CSD Production for single pipeline trench
Dredge Production
m3/h
Dredging time hr/wk
Production m3/wk
Pipeline trench Volume m3
DurationDays
Distance Per day
m
Hours of dredging each day
1000 100 100,000 241,356 16.9 108.7 14.3
The higher production rate of a CSD compared to a bucket or backhoe dredge would reduce the time required for dredging the trench and therefore the duration of impact on the marine environment. It is likely that a CSD would be readily available since other dredging works requiring this type of equipment would be ongoing as part of the GPC WBDD.
Sediments encountered along the alignment were discussed in Section 2.1.1 and an average composition of coarse material, silts and clays used in the modelling was as shown in Table 2-4.
Sediment settling velocities used in the modelling are shown in Table 4-3 for the fractions indicated.
Settling velocities correspond to medium sediment sizes within the fraction and were adopted for the model runs. The minimum bed shear stress for full deposition of sediment flocs was set to 0.07N/m2.
Table 4-3 Sediment characteristics used in dredge simulations
Fraction Grain size (mm)
Percentage Particle density(kg/m3)
Settling Velocity (m/s)
Coarse material > 0.06 47% 2650 0.02
Silt 0.06‐0.002 19% 2650 0.001
Clay <0.002 34% 2650 0.0001
Model results of dredge plumes associated with the pipeline (not including GPC dredging in the Western Basin) are summarised in Figure 4-1 through to Figure 4-6.

Coastal Environment - Pipeline
Australia Pacific LNG Project EIS Page 20 August 2010 Rev 0
Figure 4-1 Pipeline trench dredge plume snapshot sequence near Friend Pt
(a) (b)
(c) (d)
(a) (b)
(c) (d)
Coastal Environment - Pipeline
Australia Pacific LNG Project EIS Page 21 August 2010 Rev 0
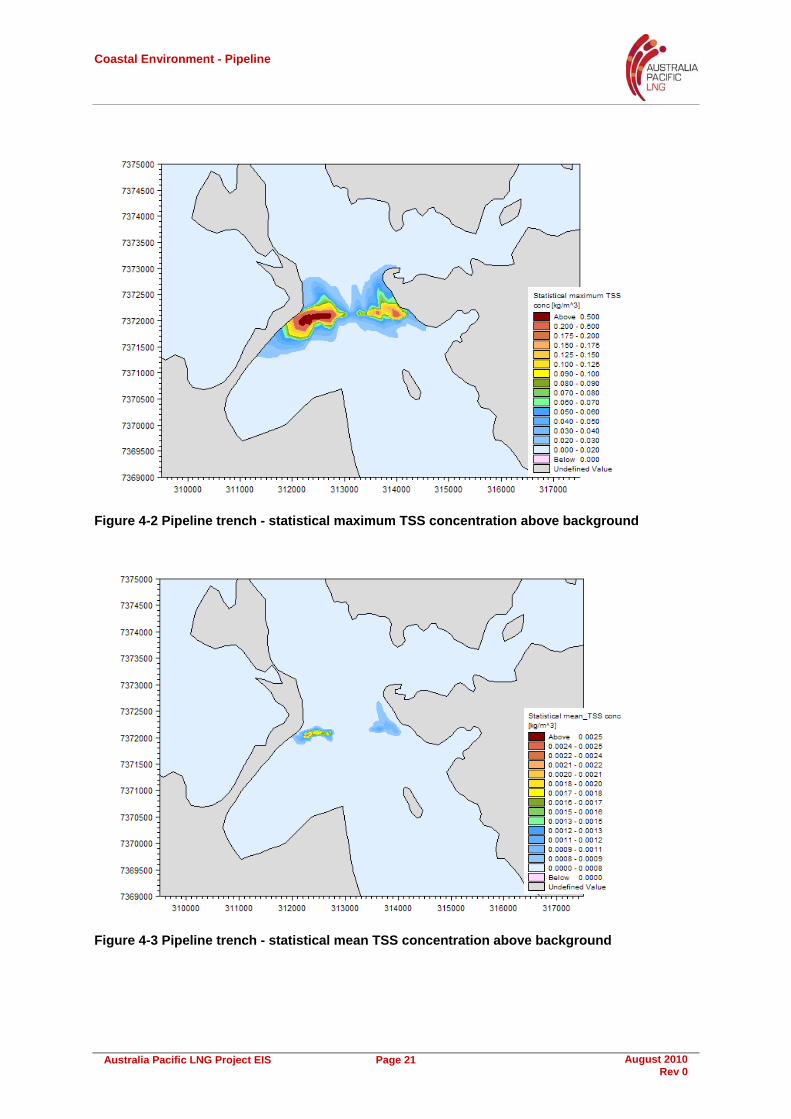
Figure 4-2 Pipeline trench - statistical maximum TSS concentration above background
Figure 4-3 Pipeline trench - statistical mean TSS concentration above background

Coastal Environment - Pipeline
Australia Pacific LNG Project EIS Page 22 August 2010 Rev 0
Figure 4-4 Pipe trench TSS concentration time series (a) Friend Pt (b) Tidal Flats
(a) TSS Friend Pt [kg/m^3]
00:002009-07-26
00:0008-05
00:0008-15
00:0008-25
0.05
0.10
0.15
0.20
0.25
0.30
(b) TSS tidal flats [kg/m^3]
00:002009-07-26
00:0008-05
00:0008-15
00:0008-25
0.005
0.010
0.015
0.020
0.025
0.030
Tide [m]
00:002009-07-26
00:0008-05
00:0008-15
00:0008-25
-2.0
-1.5
-1.0
-0.5
0.0
0.5
1.0
1.5
2.0
TSS concentrations a maximum of 1.8kg/m3 when dredge works over t1 (Friend Point) location

Coastal Environment - Pipeline
Australia Pacific LNG Project EIS Page 23 August 2010 Rev 0
Figure 4-5 Pipe trench TSS concentration time series (a) main channel (b) Narrows
(a) TSS main channel [kg/m^3]
00:002009-07-26
00:0008-05
00:0008-15
00:0008-25
0.02
0.04
0.06
0.08
0.10
0.12
0.14
(b) TSS Narrrows [kg/m^3]
00:002009-07-26
00:0008-05
00:0008-15
00:0008-25
0.0010
0.0020
0.0030
0.0040
0.0050
0.0060
0.0070
0.0080
0.0090
0.0100
Tide [m]
00:002009-07-26
00:0008-05
00:0008-15
00:0008-25
-2.0
-1.5
-1.0
-0.5
0.0
0.5
1.0
1.5
2.0
Coastal Environment - Pipeline
Australia Pacific LNG Project EIS Page 24 August 2010 Rev 0
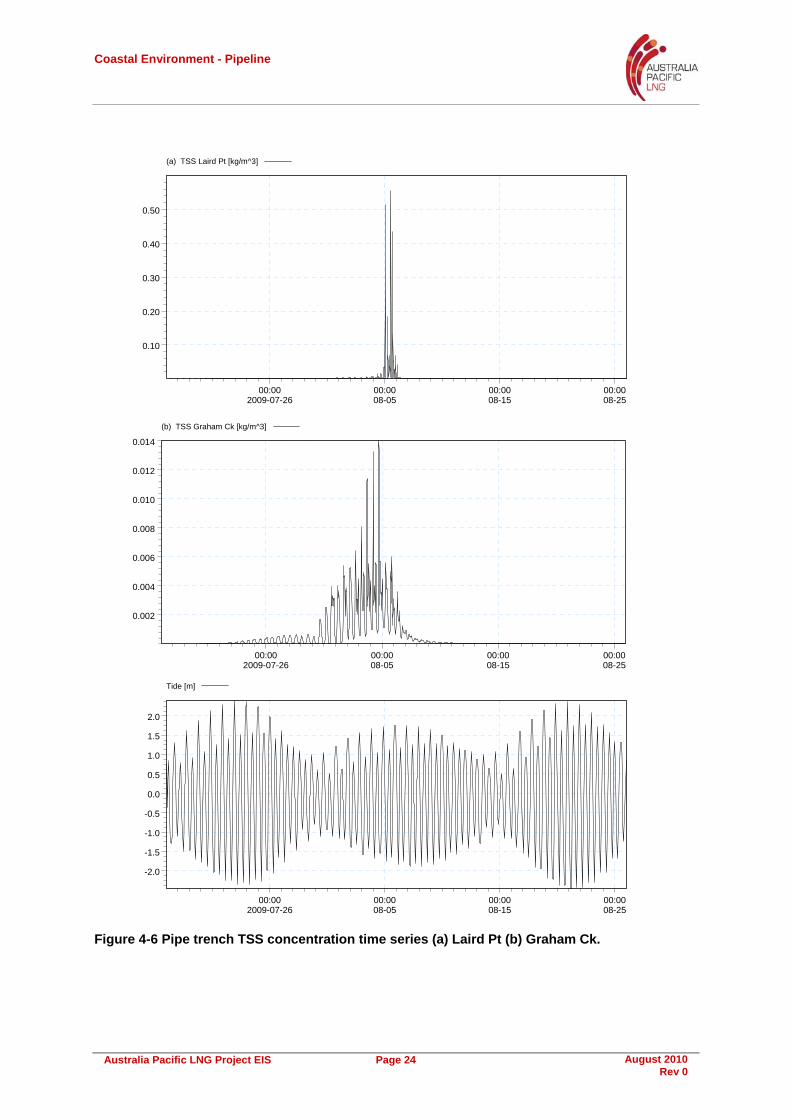
Figure 4-6 Pipe trench TSS concentration time series (a) Laird Pt (b) Graham Ck.
(a) TSS Laird Pt [kg/m^3]
00:002009-07-26
00:0008-05
00:0008-15
00:0008-25
0.10
0.20
0.30
0.40
0.50
(b) TSS Graham Ck [kg/m^3]
00:002009-07-26
00:0008-05
00:0008-15
00:0008-25
0.002
0.004
0.006
0.008
0.010
0.012
0.014
Tide [m]
00:002009-07-26
00:0008-05
00:0008-15
00:0008-25
-2.0
-1.5
-1.0
-0.5
0.0
0.5
1.0
1.5
2.0

Coastal Environment - Pipeline
Australia Pacific LNG Project EIS Page 25 August 2010 Rev 0
Figure 4-1 consists of snapshots of the model plumes generated from simulated dredging of the pipeline trench through ebb and flood tides shortly after dredging commences (4 days) from the Friend Point side of the channel. The simulation indicates the plumes follow the western shoreline. TSS concentrations show elevated levels on both the Friend Point and Laird Point sides when water depths become shallower with the falling and rising tide. In the centre of the channel TSS concentrations are lower due to deeper water and are quickly dispersed by tidal currents. Over the duration of the simulation the modelled plume is characterised as follows:
• Dredging on Friend Point tidal flats produce elevated TSS concentrations. The majority of modelled TSS concentrations are less than 15mg/l over several days
• As the dredge moves out into the centre of the channel the TSS concentrations directly around the simulated dredge are characterised by several spikes greater than 50mg/l over one day. Mean concentrations are particularly low due to the deeper water and stronger currents
• When the dredge is on the Laird Point side the plume also exhibits elevated TSS concentrations and moves towards Graham Creek on the flood tides and between North Passage Island and the proposed LNG facility during ebb tides
• Plumes in the simulation were observed to move over the time-series recording locations within the model domain as a result of a particular tidal flow direction and then move back over the same location with the turn of the tide; indicating TSS concentrations can be cumulative in some instances
Figure 4-2 shows the maximum TSS concentrations along the pipeline alignment with the highest TSS concentrations occurring on both banks of The Narrows crossing.
Figure 4-3 shows the mean TSS concentrations over the duration of the dredging simulation. The analysis shows the highest mean TSS concentration of approximately 2.5mg/l (0.0025 kg/m3) at the Friend Point site. Impacts are short lived over a day or two as indicated in the time series of TSS concentrations for selected locations.
Time-series locations (t1 - t6) used in Figure 4-4, Figure 4-5, and Figure 4-6 are defined in Table 4-4.
Table 4-4 Time Series recording locations
Marker Locations Easting Northing
t1 Friend Point 312635. 7372090.
t2 Main Channel 313271. 7372124.
t3 Laird Point 313938. 7372204.
t4 Tidal Flats 311866. 7371522.
t5 Graham Ck 314154. 7373103.
t6 The Narrows 311791. 7373622.
Coastal Environment - Pipeline
Australia Pacific LNG Project EIS Page 26 August 2010 Rev 0
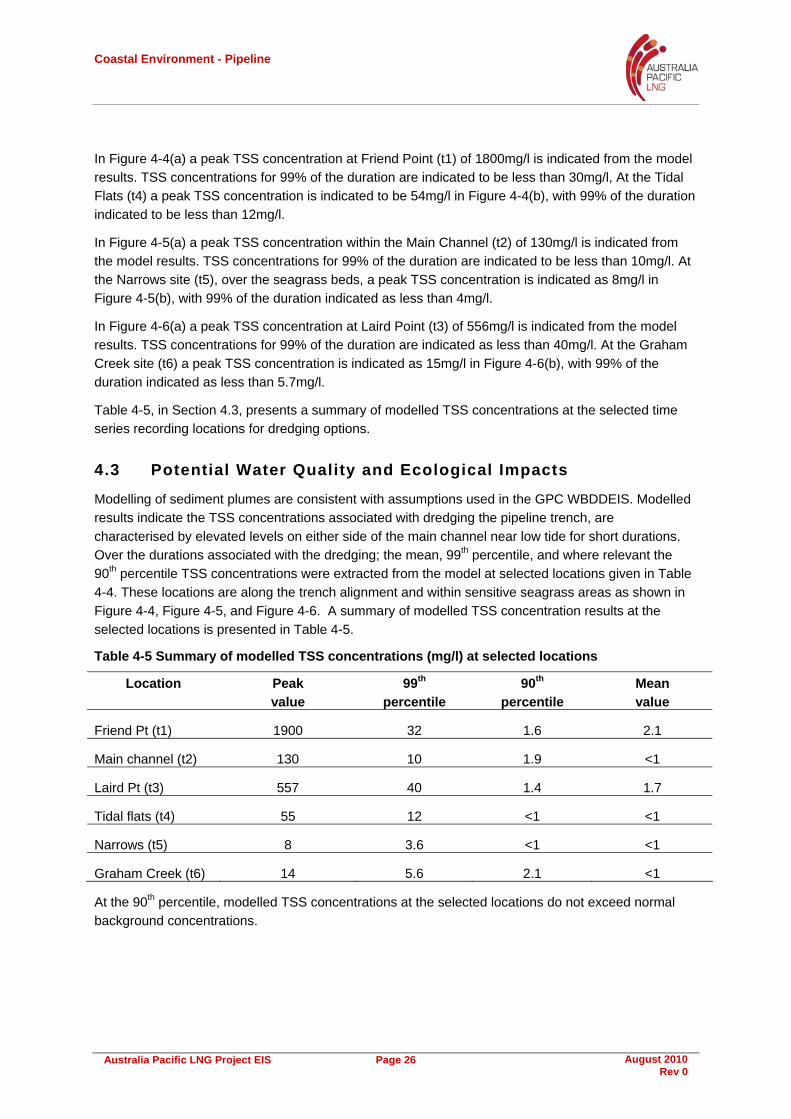
In Figure 4-4(a) a peak TSS concentration at Friend Point (t1) of 1800mg/l is indicated from the model results. TSS concentrations for 99% of the duration are indicated to be less than 30mg/l, At the Tidal Flats (t4) a peak TSS concentration is indicated to be 54mg/l in Figure 4-4(b), with 99% of the duration indicated to be less than 12mg/l.
In Figure 4-5(a) a peak TSS concentration within the Main Channel (t2) of 130mg/l is indicated from the model results. TSS concentrations for 99% of the duration are indicated to be less than 10mg/l. At the Narrows site (t5), over the seagrass beds, a peak TSS concentration is indicated as 8mg/l in Figure 4-5(b), with 99% of the duration indicated as less than 4mg/l.
In Figure 4-6(a) a peak TSS concentration at Laird Point (t3) of 556mg/l is indicated from the model results. TSS concentrations for 99% of the duration are indicated as less than 40mg/l. At the Graham Creek site (t6) a peak TSS concentration is indicated as 15mg/l in Figure 4-6(b), with 99% of the duration indicated as less than 5.7mg/l.
Table 4-5, in Section 4.3, presents a summary of modelled TSS concentrations at the selected time series recording locations for dredging options.
4.3 Potential Water Quality and Ecological Impacts
Modelling of sediment plumes are consistent with assumptions used in the GPC WBDDEIS. Modelled results indicate the TSS concentrations associated with dredging the pipeline trench, are characterised by elevated levels on either side of the main channel near low tide for short durations. Over the durations associated with the dredging; the mean, 99th percentile, and where relevant the 90th percentile TSS concentrations were extracted from the model at selected locations given in Table 4-4. These locations are along the trench alignment and within sensitive seagrass areas as shown in Figure 4-4, Figure 4-5, and Figure 4-6. A summary of modelled TSS concentration results at the selected locations is presented in Table 4-5.
Table 4-5 Summary of modelled TSS concentrations (mg/l) at selected locations
Location Peak value
99th percentile
90th percentile
Mean value
Friend Pt (t1) 1900 32 1.6 2.1
Main channel (t2) 130 10 1.9 <1
Laird Pt (t3) 557 40 1.4 1.7
Tidal flats (t4) 55 12 <1 <1
Narrows (t5) 8 3.6 <1 <1
Graham Creek (t6) 14 5.6 2.1 <1
At the 90th percentile, modelled TSS concentrations at the selected locations do not exceed normal background concentrations.
Coastal Environment - Pipeline
Australia Pacific LNG Project EIS Page 27 August 2010 Rev 0
The impact assessment on water quality and marine ecology associated with the trenching across The Narrows is contained within the supplementary chapter on marine ecology that has used the model predictions in Table 4-5. Additionally there is a potential impact on nearby sandy beaches from dredging on the Laird Point side of The Narrows. A coating of fine material (muds and silts) could appear on the beach as the plumes from the dredging follow the shoreline into Graham Creek. This impact is considered to be medium to low as the quantity of material in suspension is not significant and could be mitigated via the Dredge Management Plan regulating dredging activities to coincide with favourable tides in this location, or using some form of containment at low tides.

Coastal Environment - Pipeline
Australia Pacific LNG Project EIS Page 28 August 2010 Rev 0
5. References
Asia Pacific ASA (2010) QCLNG – Pipeline Burial Sediment Plume Modelling, Report prepared for British Gas, http://qclng.com.au/uploads/docs/sup-eis/app/Appendix-6.3-Pipeline-Burial-Dredge-Plume-Model.pdf
Australia Pacific LNG (2010) Environmental impact Statement – Executive Summary, p. 7, http://www.aplng.com.au/pdf/eis/ExecutiveSummary/ExecutiveSummary
URS (2009) Environmental Impact Statement – Project Description, Section 3, table 3.7.1, p. 3-41, Prepared for Santos Ltd. 31 March 2009, http://www.glng.com.au/library/EIS/03%20Project%20Description%20(Section%203)%20FINAL%20PUBLIC.pdf
QGC Ltd (2010) Supplementary Environmental Impact Statement – Pipeline Construction, Vol. 2, Chap. 12, table 2.12.3, p. 12, January 2010, http://qclng.com.au/uploads/docs/sup-eis/vol02/Vol-2-Ch-12-Pipeline-Construction.pdf
GHD Pty Ltd (2010a) GLNG Pipeline FEED – Report for Mechanised Marine Crossing Installation Concept, Prepared for Gladstone LNG Project Fisherman's Landing Operations Pty Ltd.
GHD Pty Ltd (2010b) Western Basin Dredging and Disposal EIS. Report prepared by GHD for Gladstone Ports Corporation, January 2010, Chapter 2 final.
GHD Pty Ltd (2009) Western Basin Dredging and Disposal EIS. Report prepared by GHD for Gladstone Ports Corporation, November 2009, Appendix J2, Section 4. http://www.gpcl.com.au/Project_Western_Basin_Dredging_&_Disposal_EIS.html
Coffey geotechnics Pty Ltd (2009) Factual Report on Geotechnical investigation, Friend Point, Port Curtis, for the GLNG Pipeline Project – GLNG Operations Pty Ltd, November 2009.
WorelyParsons (2010) The Narrows Sediment Characterisation Report, May 2010

Coastal Environment - Pipeline
Australia Pacific LNG Project EIS Page 29 August 2010 Rev 0
Appendix 1 - ADCP Results

Coastal Environment - Pipeline
Australia Pacific LNG Project EIS Page 30 August 2010 Rev 0
Figure 5-1 ADCP transect - The Narrows (14 May 2010, 10:18AM)
Main channel mean ebb velocity 0.55m/s

Coastal Environment - Pipeline
Australia Pacific LNG Project EIS Page 31 August 2010 Rev 0
Figure 5-2 ADCP transect - The Narrows (14 May 2010, 10:45AM)
Main channel mean ebb velocity 0.67m/s
Coastal Environment - Pipeline
Australia Pacific LNG Project EIS Page 32 August 2010 Rev 0
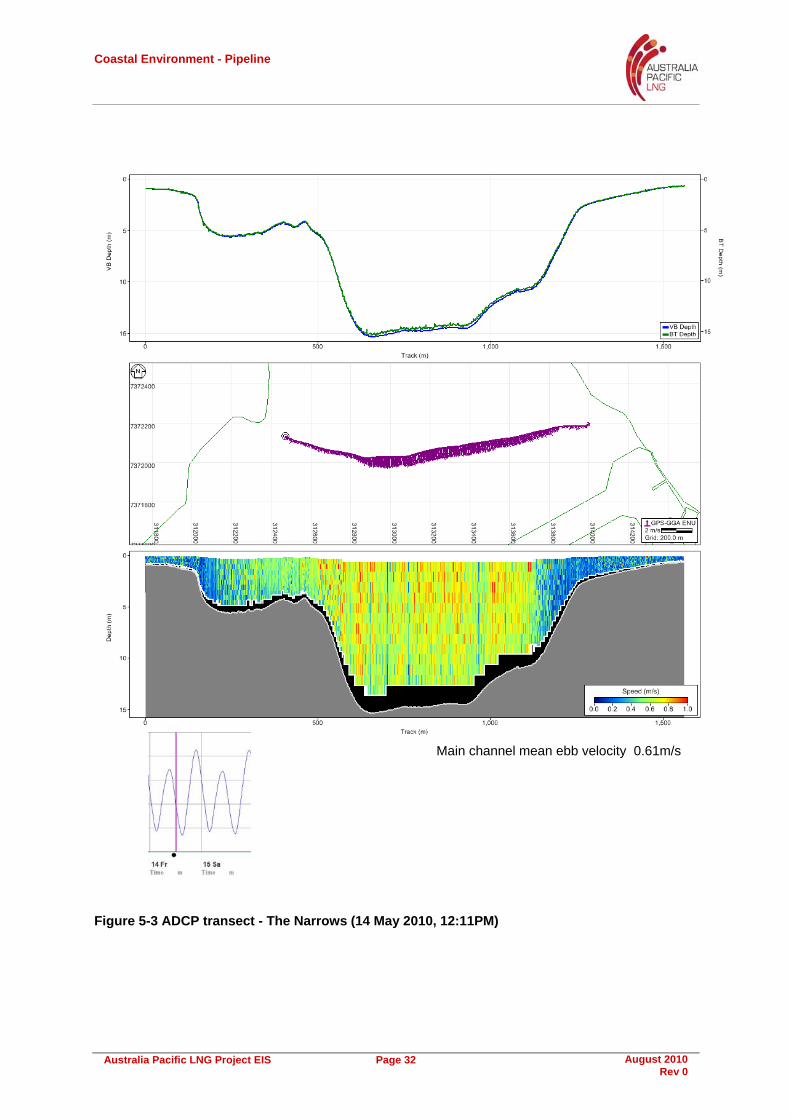
Figure 5-3 ADCP transect - The Narrows (14 May 2010, 12:11PM)
Main channel mean ebb velocity 0.61m/s
Coastal Environment - Pipeline
Australia Pacific LNG Project EIS Page 33 August 2010 Rev 0
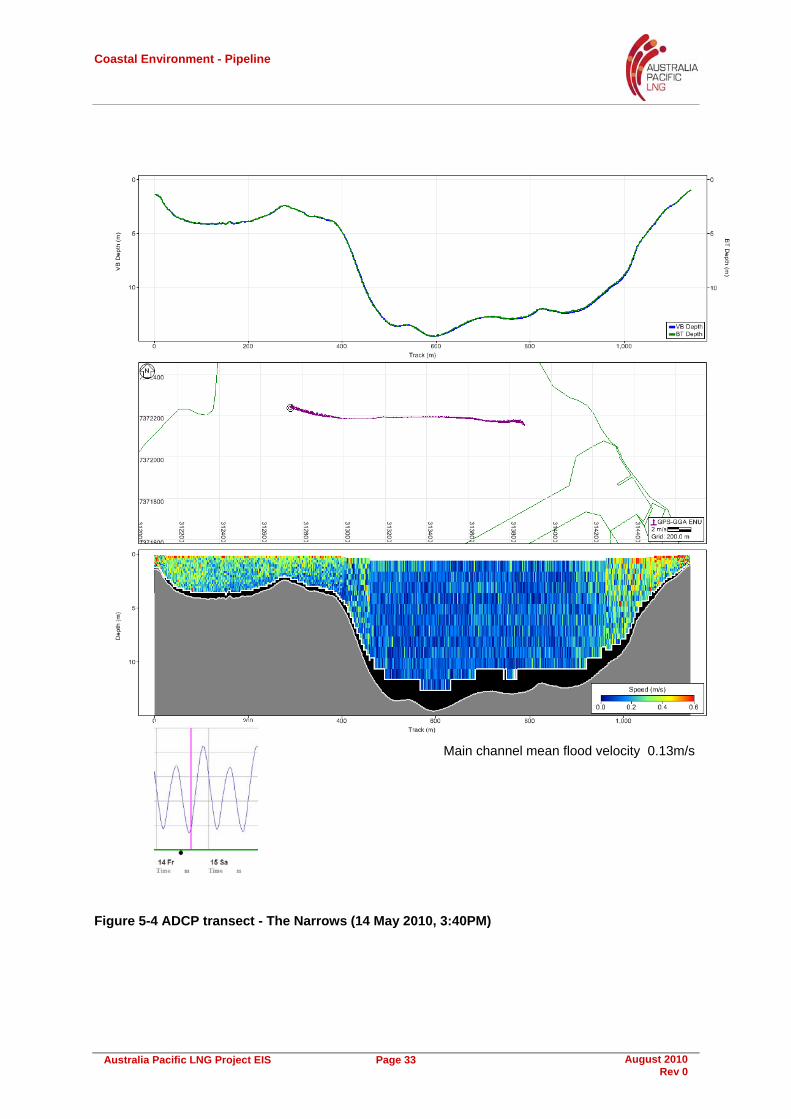
Figure 5-4 ADCP transect - The Narrows (14 May 2010, 3:40PM)
Main channel mean flood velocity 0.13m/s

Coastal Environment - Pipeline
Australia Pacific LNG Project EIS Page 34 August 2010 Rev 0
Figure 5-5 ADCP transect - The Narrows (14 May 2010, 5:01PM)
Main channel mean flood velocity 0.51m/s

Coastal Environment - Pipeline
Australia Pacific LNG Project EIS Page 35 August 2010 Rev 0
Figure 5-6 ADCP transect - Targinie Creek south (15 May 2010, 8:59AM)
Creek mean flood velocity 0.25m/s
Coastal Environment - Pipeline
Australia Pacific LNG Project EIS Page 36 August 2010 Rev 0
Figure 5-7 ADCP transect - Targinie Creek south (15 May 2010, 11:14AM)
Creek mean ebb velocity 0.26m/s

Coastal Environment - Pipeline
Australia Pacific LNG Project EIS Page 37 August 2010 Rev 0
Figure 5-8 ADCP transect - Targinie Creek Junction (15 May 2010, 9:20AM)
Creek mean flood velocity 0.27m/s
Coastal Environment - Pipeline
Australia Pacific LNG Project EIS Page 38 August 2010 Rev 0
Figure 5-9 ADCP transect - Targinie Creek Junction (15 May 2010, 11:29AM)
Creek mean ebb velocity 0.55m/s

Coastal Environment - Pipeline
Australia Pacific LNG Project EIS Page 39 August 2010 Rev 0
Figure 5-10 ADCP transect - Targinie Creek Junction (15 May 2010, 12:54PM)
Creek mean ebb velocity 0.26m/s