comparison of the feeding habits of eurasian otters on a fast flowing river and its backwater...
TRANSCRIPT

ARTICLE IN PRESS
www.elsevier.de/mambio
1616-5047/$ - see
doi:10.1016/j.mam
Original investigation
Comparison of the feeding habits of Eurasian otterson a fast flowing river and its backwater habitats
By J. Lanszki and Z. Sallai
Ecological Research Group, University of Kaposvar, Kaposvar, Hungary and Nimfea,Environment and Nature Conservation Association, Szarvas, Hungary
Receipt of Ms. 4.10.2005Acceptance of Ms. 20.4.2006
Abstract
The diet and feeding habits of Eurasian otters Lutra lutra were studied by spraint analysis over a2- year period, on three sections of the Drava River and three backwaters, in south-west Hungary.The primary food was fish (mean: 89.8% and 87.5% for riverine and backwater habitats,respectively); otters living in riverine habitats compared to backwaters, consumed more birds (3.9%and 0.7%, respectively), less mammals (0.5% and 0.9%, respectively), less reptiles and amphibians(5.6% and 10.2%, respectively) and less invertebrates (0.1% and 0.6%, respectively). In riverinehabitats otters preyed more frequently on larger fish than in backwaters, but the main fish prey wassmall-sized (below 100 g in weight, 85.6% and 91.7%, respectively). On river sections they preyedmore frequently on reophil (flow preferring fish, 18.9% and 3.3%, respectively), and less onstagnophil fish (stagnant waters preferring, 9.8% and 24.5%, respectively) than in backwaters. Themain fish prey was eurytopic (tolerant of rivers and stagnant waters, 71.3% and 72.2%,respectively). Preference (by Ivlev’s electivity index, Ei) in the Drava River for various fish guildsdiffered, as the otters preferred eurytopic (Ei= 0.30) and stagnophil fish (Ei= 0.24), and avoidedreophil fish (Ei=�0.58). Otters did not threaten the rare, flow preferring fish species and the maindiet consisted of economically unimportant species.r 2006 Deutsche Gesellschaft fur Saugetierkunde. Published by Elsevier GmbH. All rights reserved.
Key words: Lutra lutra, fish electivity, Drava, Hungary
Introduction
The Eurasian otter Lutra lutra (Linnaeus,1758) is a widely occurring predator inEurope, living in a large variety of wateryhabitats (Conroy and Chanin 2002). Thisspecies shows a continuous presence in all thehabitats along the Hungarian section of theDrava River (Lanszki 2005).Otter numbers can be limited by fish popula-tions, and feeding behaviour is dependent onthe available food supply (Kruuk et al. 1991;
front matter r 2006 Deutsche Gesellschaft fur S
bio.2006.04.002
Ruiz-Olmo et al. 2001). In addition to theabundance of available food, other factorsaffecting occurrence and feeding habits aretype of habitats, quality of bankside, steep-ness of waterside banks and the degree ofhuman influence to which the area is exposed(e.g., Erlinge 1967; Kemenes and Demeter1995; Ruiz-Olmo et al. 2002). The feedinghabits of otters living in large fast flowingrivers with natural shoreline, such as the
augetierkunde. Published by Elsevier GmbH. All rights reserved.
Mamm. biol. 71 (2006) 6 � 336–346

ARTICLE IN PRESS
Fig. 1. Locality of the study areas in the Drava region.River sections: D1= +Ortilos, D2=Belavar and D3=Vızvar;backwaters: B1=Belavar, B2=Babocsa and B3=Barcs;solid lines show river and dotted lines border.
Comparison of the feeding habits of Eurasian otters 337
Drava, and backwaters in the Pannonianecoregion are less well studied, in comparisonto streams, rivers and ponds in other regions(Jedrzejewska et al. 2001; Clavero et al.2003). The choice of fish as main food, wasstudied on small riverine habitats and ponds(e.g., Erlinge 1969; Wise et al. 1981; Klos-kowski 1999; Taastrøm and Jacobsen 1999;Lanszki et al. 2001), as well as on a large riverwith strong human influence (Copp andRoche 2003). Monitoring of the otter startedin the year 2000 on the Drava River and onconnecting watery habitats, following theplanning of a high-capacity hydroelectricpower station on the river in the regionNovo Virje, Croatia, between two study sites,+Ortilos and Belavar (Lanszki 2005).The aim of this 2- year study was to comparethe feeding habits of otters living in river andbackwater habitats, on the basis of food taxa,the weight and characteristic guild of fishconsumed. A further aim was to determinethe fish preference of otters living by a fastflowing, large river.
Material and methods
The study was carried out in South-west Hungary(Fig. 1, from D1: 461180N, 161520E to B3: 451570N,171300E), in the Drava region, on three stretches ofrivers ( +Ortilos, Belavar and Vızvar) and threebackwaters (Belavar, Babocsa and Barcs). Themain stem of the Drava River has a steep riparianregion, characterised by Central European slowriver floodplain woods, composed of willows Salix
purpurea, S. alba, and poplar Populus nigra. In oldriver-beds willows Polygono hydropiperi-Salicetum
triandrae and Leucojo aestivi-Salicetum albae,poplar bosks Carduo crispi-Populetum nigrae andSenecioni sarracenici-Populetum albae are charac-teristic. With increased depth of the river bed(caused by the activity of the hydroelectric powerstations upstream), some forks in the river pre-vented the Drava from becoming a backwater.Backwaters are covered by willows and poplar, andash-alder woods Paridi quadrifoliae-Alnetum (Iva-nyi and Lehmann 2002). The Drava is a highregime watercourse (mean discharge of river:590m3/s, min–max: 280–2570m3/s), and the earlysummer and autumn flood levels and end of winterlow-water levels are characteristic (the difference isapproximately 7m). The fall of water level at+Ortilos is 0.45–0.50m/km and at Vızvar 0.15m/km,
the width of the river is 150–200m. There is noriverine traffic and fish harvesting, and the studyarea is limited to angling (Ivanyi and Lehmann2002; Sallai 2002). The river remains nearlynatural, unpolluted, with meandering courses andmany old river-beds. The climate is moderate andcontinental and the Drava does not freeze duringthe winter.Diet composition was determined by spraint(faecal) analysis. Individual spraint samples werecollected monthly from June 2002 to May 2004along 1.8 km of the River Drava at +Ortilos(n ¼ 184), 0.5 km at Belavar (n ¼ 663) and 1.5 kmat Vızvar (n ¼ 188), and along the backwaters:0.5 km at Belavar (n ¼ 265), 1.6 km at Babocsa(n ¼ 375) and 0.6 km at Barcs (n ¼ 143). Spraintswere soaked in water, then washed through a sieve(0.5mm mesh) and dried. All recognisable preyremains were separated. Fish species were identifiedby microscope on the basis of scales and bones,e.g., pharyngeal teeth, operculae, praeoperculae,maxillaries (e.g., Berinkey 1966; Knollseisen 1996;personal collection; detailed by Lanszki andMolnar 2003). Weight was recorded on the basisof comparative measurement of the pharyngealteeth, operculae, praeoperculae, maxillaries, ver-tebrae and other fish bones (using a referencecollection), according to the following categories:below 100 g, 100–500 g, 500–1000 g and above1000 g (Lanszki et al. 2001). The characteristicsites of occurrence within the water body of thevarious fish in the habitats studied were categorisedon the basis of experiences of Schiemer et al.(1994), Spindler (1997) and Sallai (2002) asfollows: reophil (flow preferring), eurytopic (toler-ant of rivers and standing waters) and stagnophil(stagnant waters preferring). Other remains of food
ARTICLE IN PRESS
338 J. Lanszki, Z. Sallai
species preyed upon by otters were identified bymicroscope from characteristic skeletal remains,teeth, hair, feathers and integuments (Marz 1972;Brown et al. 1993; Knollseisen 1996 and referencecollections). All dry prey remains were weighed andmultiplied by coefficients of digestibility (sum-marised by Jedrzejewska and Jedrzejewski 1998),to obtain an estimate of the percentage fresh weight(biomass) of food consumed.The fish availability in two sections of the DravaRiver ( +Ortilos and Vızvar) was investigated usinglow-powered, electro-fishing gear with accumulator(IUP-12 type, 350V, 4–15A, 40–120W and HansGrassl IG600 type, max 560V, 30A, 1200W) thatproduces a pulsating direct current. Because of thestrong river flow, fish surveys were performed fromthe bank and/or by wading in the shallow water.Fishing, which usually lasted 8� 25min took placeboth in D1 and D3 sections, during May, Augustand October (in spring, summer and autumn). Themethod used did not damage the fish, which werereleased after identification. This fish survey is partof the Drava monitoring (Sallai 2002) and noavailable fish data were collected from backwatersin the period studied.Trophic niche breadth (B index) was calculated inaccordance with Levins: B ¼ 1=
Pp2i , where Pi= is
the proportion of the biomass of a given taxon,(expressed as a percentage) present in the diet(Krebs 1989). The following prey taxa were used inthe B index calculations: mammals, birds, reptilesand amphibians (one category), fish and inverte-brates. Spearman’s non-parametric correlation wasused to test the statistical relationship betweenseasonal mean number of individuals and biomassof main food taxa. Paired samples t-test was usedto evaluate the effect of year in fish consumptionand trophic niche breadth. One-way analysis ofvariance was applied for the evaluation of thetrophic niche breadth (B index) and the preference(Ei index) of different fish guilds. Chi-square testwas used for distribution analysis of the dietcomposition of the otters living in the varioushabitats. Ivlev’s index (Ei) of preference accordingto fish taxa was applied as follows: Ei=(ri�ni)/
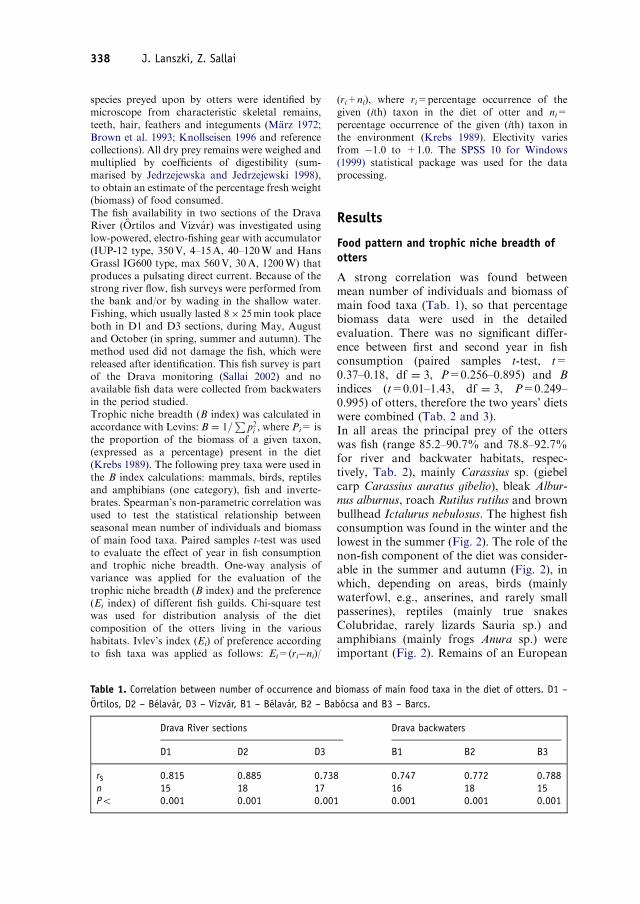
Table 1. Correlation between number of occurrence and+Ortilos, D2 – Belavar, D3 – Vızvar, B1 – Belavar, B2 – Ba
Drava River sections
D1 D2 D3
rS 0.815 0.885 0.738n 15 18 17Po 0.001 0.001 0.001
(ri+ni), where ri=percentage occurrence of thegiven (ith) taxon in the diet of otter and ni=percentage occurrence of the given (ith) taxon inthe environment (Krebs 1989). Electivity variesfrom �1.0 to +1.0. The SPSS 10 for Windows(1999) statistical package was used for the dataprocessing.
Results
Food pattern and trophic niche breadth ofotters
A strong correlation was found betweenmean number of individuals and biomass ofmain food taxa (Tab. 1), so that percentagebiomass data were used in the detailedevaluation. There was no significant differ-ence between first and second year in fishconsumption (paired samples t-test, t=0.37–0.18, df ¼ 3, P=0.256–0.895) and Bindices (t=0.01–1.43, df ¼ 3, P=0.249–0.995) of otters, therefore the two years’ dietswere combined (Tab. 2 and 3).In all areas the principal prey of the otterswas fish (range 85.2–90.7% and 78.8–92.7%for river and backwater habitats, respec-tively, Tab. 2), mainly Carassius sp. (giebelcarp Carassius auratus gibelio), bleak Albur-nus alburnus, roach Rutilus rutilus and brownbullhead Ictalurus nebulosus. The highest fishconsumption was found in the winter and thelowest in the summer (Fig. 2). The role of thenon-fish component of the diet was consider-able in the summer and autumn (Fig. 2), inwhich, depending on areas, birds (mainlywaterfowl, e.g., anserines, and rarely smallpasserines), reptiles (mainly true snakesColubridae, rarely lizards Sauria sp.) andamphibians (mainly frogs Anura sp.) wereimportant (Fig. 2). Remains of an European
biomass of main food taxa in the diet of otters. D1 –
bocsa and B3 – Barcs.
Drava backwaters
B1 B2 B3
0.747 0.772 0.78816 18 150.001 0.001 0.001

ARTICLE IN PRESS
Table 2. Annual fish diet of otters living by the Drava River and its backwaters. Pooled data for 2 years,N=number of items, %B=percentage of biomass of each prey item consumed, += biomass under 0.05% (forabbreviation of each habitats see table 1). Empty cells mean that the given taxon was not detected. Fish guilds:R=reophil or flow preferring, E=eurytopic or tolerant for rivers and stagnant waters, and S=stagnophil or stagnantwaters preferring.
Food taxon Fish guild Drava River sections Drava backwaters
D1 D2 D3 B1 B2 B3
N %B N %B N %B N %B N %B N %B
Common carp Cyprinus carpio E 6 3.3 23 3.7 4 1.9 7 3.3 6 2.2 3 1.3Carassius sp. E 26 13.8 72 10.9 7 4.1 18 5.5 133 35.6 6 4.4Bream Abramis ballerus/A. brama R 9 1.5 17 1.9 9 3.5 2 0.1 1 + 1 1.1Rudd Scardinius erythrophthalmus S 11 4.7 18 1.5 7 2.6 5 1.6 2 0.5Roach Rutilus rutilus E 12 3.2 40 3.7 39 14.4 13 2.7 15 2.8 36 20.3Chub Leuciscus cephalus E 3 1.4 9 1.7 7 4.0 2 0.3 13 6.2Barbel Barbus barbus R 17 13.4 24 4.5 6 1.5 1 0.7 3 0.6Bitterling Rhodeus sericeus amarus E 13 0.3 1 0.2 2 0.1 20 3.8 2 0.4Bleak Alburnus alburnus E 28 7.8 104 8.2 60 17.6 13 1.8 61 11.7 11 3.1Gobio sp. R 26 5.5 7 0.5 6 4.2Other cyprinids 23 8.2 69 7.1 17 10.9 21 5.7 46 9.0 8 2.4Pumpkinseed Lepomis gibbosus E 9 4.2 125 11.9 5 1.6 61 16.5 5 0.8 17 4.4Perch Perca fluviatilis E 11 3.2 39 3.6 7 3.0 37 8.2 61 9.5 11 8.9Ruffe Acerina cernua E 1 0.2 22 2.0 5 1.9 1 0.2 16 3.0Brown bullhead Ictalurus nebulosus S 1 0.4 98 12.6 3 0.8 55 22.1 24 3.6 54 35.7Welsh Silurus glanis E 1 1.0 2 0.5 1 1.9 2 0.1Pike-perch Stizostedion lucioperca E 8 6.2 9 1.4 7 3.6 6 0.7 2 0.3 1 0.4Pike Esox lucius E 7 5.0 85 9.3 5 1.8 13 5.0 11 1.8 4 1.2Unidentified fish 34 7.6 81 5.4 22 7.6 15 2.2 24 1.7 11 1.8
Table 3. Annual non-fish diet of otters living at the Drava River and its backwaters.
Food taxon Drava River sections Drava backwaters
D1 D2 D3 B1 B2 B3
N %B N %B N %B N %B N %B N %B
Mammals 4 1.5 3 0.3 3 0.8 3 1.2 6 0.2 4 3.2Birds 14 2.7 41 3.2 30 8.3 2 0.1 12 1.1 2 0.1Reptiles 2 0.2 5 0.3 2 2.8 2 0.9 5 0.1 9 5.2Amphibians 11 5.0 75 5.5 11 2.4 79 18.5 68 5.6 18 3.6Crayfish Astacus sp. 1 + 6 + 9 0.5 2 0.1Other invertebrates 8 0.1 15 0.1 7 0.1 53 0.5 52 0.2 38 2.0Plants 3 + 2 +Total non-fish 9.5 9.3 14.8 21.2 7.3 14.2No. of spraints 184 663 188 265 375 143No. of items� 273 1004 279 412 588 240
�number of fish and non-fish items together (for abbreviation of each habitats see table 1, and of all fish
guilds see table 2).
Comparison of the feeding habits of Eurasian otters 339

ARTICLE IN PRESS
Fig. 2. Seasonal diet changes of otters in the Drava region. Two years pooled, for abbreviations see Figure 1.
340 J. Lanszki, Z. Sallai
pond turtle Emys orbicularis were found in aspraint in winter at area D3. Otters on bothhabitat types occasionally preyed on mam-mals, such as muskrat Ondatra zibethicus,water vole Arvicola terrestris, field mouseApodemus sp. and insectivores, e.g., watershrew Neomys sp., and consumed frommarten Martes sp., probably as carrion onarea D2. The difference in food taxa wassignificant among the different sections of theDrava River (Chi-Square test, w2 ¼ 181:63,df ¼ 10, Po0.001), and also among thebackwaters (w2 ¼ 666:38, df ¼ 10, Po0.001). Otters living on the river comparedto those living on the backwaters, in additionto preying on fish in similar proportions(mean: 89.8% and 87.5%, respectively),consumed more birds (3.9% and 0.7%,respectively), less mammals (0.5% and0.9%, respectively), reptiles and amphibians(5.6% and 10.2%, respectively), and inverte-brates (0.1% and 0.6%, respectively)(w2 ¼ 460:40, df ¼ 10, Po0.001).The trophic niche breadth of otters did notdiffer significantly either among the DravaRiver sections (mean 7 SE: 1.36 7 0.06,one-way ANOVA, F ¼ 0.77, P ¼ 0:490) or
on the backwaters (1.49 7 0.11, F ¼ 0:54,P ¼ 0:946) or also between river sections andthe backwaters (paired samples t-test,df ¼ 23, t ¼ 1:17, P ¼ 0:253). The seasonalB indices were more balanced on the river,where the differences were not significant(F ¼ 1:20, P ¼ 0:337), than on the back-waters, where there was a tendency for wider(F ¼ 4:36, Po0.05) values to be found in thesummer (B ¼ 1:94) and lower in the winter(B ¼ 1:06).
Fish distribution in otter diets
The fish consumed by otters were generallysmall (Fig. 3), below 100 g in weight on theriver sections (mean: 85.6%, range:82.6–90.8%) as well as on the backwaters(mean: 91.7%, range: 90.1–94.6%). Speci-mens weighing more than 500 g were rarelytaken by otters (1.3–1.8%, vs. 0–1.8%,respectively). No area-dependent differencewas found in the distribution of fishweights either on the Drava sections (Chi-Square test, w2 ¼ 10:60, df ¼ 6, P ¼ 0:102),or on the backwaters (w2 ¼ 7:16, df ¼ 6,P ¼ 0:306). Otters living on the river preyed

ARTICLE IN PRESS
0.01
0.1
1
10
100
<100 100-500
501-1000
1000<
(a) fish weight categories (g)
freq
uenc
y (%
)
P < 0.0001
reophil eurytopic stagnophil
(b) fish guilds
P < 0.0001
Fig. 3. Distribution frequency (logarithmic scale, mean7SE) of fish prey in the diet of otters living at DravaRiver sections (shaded bars) and backwaters (open bars) on the basis of fish weight (a) and guild (b). Fishguilds: reophil or flow preferring; eurytopic or tolerant for rivers and standing waters; and stagnophil or stagnantwaters preferring.
-1.0
-0.5
0.0
0.5
1.0
reophil eurytopic stagnophil
fish guilds
pref
eren
ce in
dex a a
b
P < 0.0001
Fig. 4. Preference by otters for different fish guilds onthe Drava River. Differences between fish guildsmarked with different letters (a–d) are significant(Po0.0001); n ¼ 6377 fish censused and n ¼ 359fish identified in diet of otters were used forpreference calculation, for abbreviations of guildssee Figure 3.
Comparison of the feeding habits of Eurasian otters 341
on significantly larger fish than those on thebackwaters (w2 ¼ 22:38, df ¼ 3, Po0.001,Fig. 3).A significant difference was found in thedistribution of fish guilds preyed upon byotters living on the different Drava sections(Chi-Square test, w2 ¼ 78:95, df ¼ 4,Po0.0001). The most frequent fish prey wereeurytopic species (61–78%), but in the +Ortilossection reophil fish (31%) were also impor-tant (Tab. 2). Differences among the back-waters were also significant (w2 ¼ 82:65,df ¼ 4, Po0.0001). The main fish prey waseurytopic (61–85%), and high consumptionof stagnophil species were found in Belavar(27%) and Barcs (39%). The consumption ofreophil fish ranged between 1% and 7%.Relying on the guild of fish prey, thedistribution of food categories was signifi-cantly different between the two habitat types(w2 ¼ 52:95, df ¼ 2, Po0.0001, Fig. 3).Otters living on the river compared to thoseliving on backwaters preyed on more reophil(18.9% and 3.3%, respectively), and lessstagnophil fish (9.8% and 24.5%, respec-tively), but consumption of eurytopic specieswas in similar proportions (71.3% and72.2%, respectively).
Fish preference in Drava River
Preference of otters for various fish guildsdiffered significantly (one-way ANOVA,
Bonferroni post hoc test, F ¼ 13:58,Po0.0001, Fig. 4). Otters preferred eurytopic(Ei ¼ 0:30) and stagnophil fish (Ei ¼ 0:24),and avoided (showed less preference for)reophil fish (Ei ¼ �0:58). The preference forthe common carp Cyprinus carpio, ruddScardinius erythrophthalmus, pike-perch Sti-zostedion lucioperca, pike Esox lucius, Car-assius sp. (mainly giebel carp) and breamAbramis sp. was high independent of habitator year (Tab. 4). Otters characteristically lesspreferred chub Leuciscus cephalus and naseChondrostoma nasus. No characteristic pre-ference (Ei values near zero) was found in the

ARTICLE IN PRESS
Table 4. Fish preference of otters by the Drava River, Hungary on the basis of Ivlev’s electivity index. D1= +Ortilos,D3=Vızvar; Ei=(ri—ni)/(ri+ni), where ri=percentage relative frequency of a species in the diet, and ni= percentagerelative frequency of a species in the environment (for abbreviations see table 1).
Fish taxon Fish guild Preference index (Ei)
D1 D1 D3 D3 Mean
First year Second year First year Second year
Common carp Cyprinus carpio E 0.97 1.00 1.00 0.99Rudd Scardinius erythrophthalmus S 1.00 1.00 0.88 1.00 0.97Pike-perch Stizostedion lucioperca E 0.97 0.91 1.00 0.91 0.95Pike Esox lucius E 1.00 0.71 1.00 0.90Carassius sp. E 0.86 0.92 0.92 0.72 0.85Bream Abramis sp. R 0.85 0.91 0.99 �1.00 0.44Perch Perca fluviatilis E 0.78 0.78 �1.00 0.64 0.30Pumpkinseed Lepomis gibbosus E 0.78 �1.00 0.93 �0.02 0.17Bleak Alburnus alburnus E �0.44 0.33 �0.05 0.82 0.16Gobio sp. R 0.90 0.55 �1.00 �0.18 0.07Roach Rutilus rutilus E 0.13 �0.71 0.54 0.21 0.04Barbel Barbus barbus R 0.21 0.02 �0.26 �0.35 �0.10Gymnocephalus sp. E �1.00 0.16 0.48 �0.35 �0.18Welsh Silurus glanis E 1.00 �1.00 �1.00 �0.33Chub Leuciscus cephalus E �0.88 �0.79 0.01 �0.73 �0.60Nase Chondrostoma nasus R �1.00 �1.00 �1.00 �0.38 �0.85Bitterling Rhodeus sericeus amarus E �1.00 �1.00 �1.00 �0.81 �0.95
342 J. Lanszki, Z. Sallai
case of small cyprinids, and high fluctuationin the case of perch Perca fluviatilis, pump-kinseed Lepomis gibbosus, or welsh Silurusglanis.
Discussion
The feeding habits of otters differed withinhabitat types (both riverine or backwater),and also between the two habitat types. Butthe primary food was fish in both habitattypes. The reason for the high proportion offish consumption along the backwaters maybe that fish availability does not fluctuate asstrongly as on the fish ponds (Kranz 2000).Besides similar fish food consumption, otterspreyed on different buffer preys on the twohabitat types, as found in other studies(Chanin 1985; Mason and Macdonald 1986;Weber 1990; Carss 1995; Kruuk 1995;Delibes et al. 2000; Jedrzejewska et al. 2001;Clavero et al. 2003). In this study, in theriverine sections otters preyed more on birds
(mainly waterfowl), hunting them probablyon small river shoals or islands. Otters livingon the backwaters compensated by preyingon non-fish items, especially reptiles andamphibians, in higher proportion. Frogs areavailable for otters during the whole yearalong the eutrophic backwaters, which areoptimal habitats for the herpetofauna. Dueto the high proportions of fish consumption,the trophic niche breadth was narrow, andthe difference was not significant betweenhabitat types.Otters living by the Drava River and also onbackwaters consumed mostly small-sized(weight) fish. These results are in accordancewith most other studies performed in fresh-water habitats (Erlinge 1969; Wise et al. 1981;Carss et al. 1990; Kruuk and Moorhouse1990; Roche 1998; Kloskowski 1999; Taas-trøm and Jacobsen 1999; Lanszki et al. 2001;Ruiz-Olmo et al. 2001; Copp and Roche2003) but differ considerably from observa-tions by Adamek et al. (2003). In the latterstudy the evaluation was performed merely

ARTICLE IN PRESS
Comparison of the feeding habits of Eurasian otters 343
on the basis of fish remains found on theshore, and small-sized fish (detected mainlyfrom spraints) were not considered. Besidescharacteristically small-sized fish prey, alongsections of the Drava River, otters preyedmore frequently on larger fish compared tobackwaters. Larger-sized fish taken by ottersmay depend on their availability and ener-getics (Erlinge 1967; Carss 1995; Kruuk1995). On both habitat types the consump-tion of common eurytopic species was pre-dominant. Otters preyed more on reophil fishon riverine habitats, but on backwaters theconsumption of stagnophil fish was not verycharacteristic. The higher proportion ofstagnophil fish species in the diet of ottersliving by the Drava River is due to numerousstagnant waters in the catchment area, andreophil species in the backwaters is due toaperiodic inundations of the Drava River.The home range of otters, on the basis ofreading tracks and signs in freshwaters ofsouth Sweden was found to be between 0.7and 1.0 km2 (Erlinge 1968a), while by radio-telemetry it was between 1.2 and 2.6 km2 inCentral Europe (Dulfer et al. 1998), althoughno single otter was found in two differentsites during the study, using non-invasivemolecular genetic sampling (Lanszki unpubl.data).Electro-fishing data described principally thefish population of shallow or circumlittoralregions of the fast flowing river, where otterssearch for prey. Fish prey distribution inotter diets on the basis of fish weight and fishsurvey data (Sallai 2002), i.e. small fishindividuals were dominant in both cases,corroborated the basic data from huntingareas and survey sites. On the basis ofcharacteristic preference indices it seems thatotters living by the Drava River are selectivehunters, as experienced in other studies(Carss et al. 1990; Kruuk and Moorhouse1990; Kruuk 1995; Taastrøm and Jacobsen1999; Lanszki et al. 2001; Geidezis 2002).Fish predation of otters living by the Drava,largely depended on preferred sites of fishwithin the water body, and on their avail-ability and vulnerability (Erlinge 1968b). Thepreference indices showed that otters did notprefer to hunt in those parts of the river withfast flowing waters, as found by Erlinge
(1967, 1969) and Wise et al. (1981). Thismeant that otters less preferred certainthreatened reophil, especially up-stream fish,which are important in general nature con-servation (characteristic and endemic speciesof the river). For example some rare, up-stream living fish (riffle minnow Alburnoidesbipunctatus, burbot Lota lota, zingel Zingelstreber) or some downstream living fish (e.g.,asp Aspius aspius) were captured in the river(Sallai 2002) but we found no evidence ofotters preying on them (Ei ¼ �1:0). It seemsthat the top-down impact (Kruuk 1995) byotters is not considerable on the reophil fishguild. We found preference for the commoneurytopic and stagnophil fish guilds, forexample, the piscivorous pike and pike-perch.The otters also prefer the circumlittoralregions (fallen trunks, jetties) and shallowold river-beds, where the flow is character-istically slow (Erlinge 1967, 1969). Thecommon carp may drift from fish ponds(the actual origin is not determinable) andmay have problems adapting to a strong-flowing river. In comparison with fish ponds(Lanszki et al. 2001; Geidezis 2002), ottersliving along riverine habitats preferred com-mon carp, pike and pike-perch. Some slow-moving (Wise et al. 1981), stagnophil species,e.g., brown bullhead and tench Tinca tincawere taken by otters (Ei ¼ 1:0), but werecaptured rarely by electro-fishing only out ofthe 2-year period studied (Sallai 2002).Undistinctive preference (sometimes Ei vary-ing from �1 to 1) for rarely occurring speciessuch as welsh or perch were found. Theconsumption of economically important spe-cies (Kemenes and Nechay 1990; such ascommon carp, pike-perch, pike, welsh andbarbel) in the diet varied from 11–32% on theriverine habitats and 3–10% at the back-waters.In summary, otters living in two different,natural habitat types used fish as the principlefood and took other food taxa only in smallproportions. Fish food basically consisted ofsmall-sized and common eurytopic fish.Otters did not threaten the endemic, flowpreferring fish species. The fish choice ofotters living on Drava River differed fromthat on smaller or slower-flowing rivers orstreams and fish ponds. The results may be

ARTICLE IN PRESS
344 J. Lanszki, Z. Sallai
useful in the conservation of the Eurasianotter and management of the Drava habitats.
Acknowledgements
We express sincere thanks to Drs. JimConroy, Sandor Kormendi, Grace Yoxon,
Paul Yoxon and also the two anonymousreferees for advice and comments on an earlydraft of the manuscript. This work wassupported by the Hungarian Scientific Re-search Fund (OTKA F 37557), the Director-ship of the Danube-Drava National Park andthe Bolyai Scholarship.
Zusammenfassung
Vergleich zwischen den Ernahrungsgewohnheiten der eurasischen Otter an einem schnellstromenden Fluss und an dessen toten Nebenarmen
Die Futterzusammensetzung und die Ernahrungsgewohnheiten des eurasischen Otters Lutra lutrawurden zwei Jahre lang durch Exkrementanalyse an drei Abschnitten der Drau und an drei ihrer totenNebenarme im Sudwesten Ungarns untersucht und miteinander verglichen. Primares Futter ist Fisch(durchschnittlich 89.8% Biomasse am Fluss im Vergleich zu 87.5% an den Nebenarmen). Die direktam Fluss lebenden Ottern verzehrten mehr Vogel (3.9% gegenuber 0.7%), weniger kleine Saugetiere(0.5% gegenuber 0.9%), weniger Amphibien und Reptilien (5.6% gegenuber 10.2%) sowieInvertebrata (0.1% gegenuber 0.6%). Auch erbeuteten die direkt am Fluss lebenden Otter oftersgrossere Fische als die an den Nebenarmen lebenden, aber die Hauptnahrung bildeten kleine Fische(weniger als 100 g, 85.6% gegenuber 91.7%). Sie erbeuteten auch ofters reophile (stromungslie-bende) Fische als die an den Nebenarmen lebenden (18.9% gegenuber 3.3%), dafur aber seltenerstagnophile (stehendes Wasser liebende) Fische (9.8% gegenuber 24.5%). Trotzdem bestand ihreHauptbeute aus eurytopen Fischen (tolerant auf fliessendes und stehendes Gewasser) im Vergleichvon 71.3% gegenuber 72.2. Die an der Drau lebenden Ottern bevorzugten unterschiedlicheFischgruppen (berechnet nach dem Index Ei laut Ivlev), wobei die eurytopen (Ei ¼ 0:30) undstagnophilen (Ei ¼ 0:24) Fische an erster Stelle stehen, und die reophilen (Ei ¼ �0:58) nichtbeachted wurden. Die Otter gefahrdeten demzufolge nicht die selteneren, stromungsliebendenFische, denn ihre Hauptnahrung bestand aus wirtschaftlich unwichtigen Fischarten.r 2006 Deutsche Gesellschaft fur Saugetierkunde. Published by Elsevier GmbH. All rights reserved.
References
Adamek, Z.; Kortan, D.; Lepic, P.; Andreji, J.(2003): Impacts of otter (Lutra lutra) predationon fishponds: a study of fish remains at pondsin the Czech Republic. Aquacult. Int. 11,
389–396.Berinkey, L. (1966): Halak–Pisces. Budapest: Aka-
demiai Kiado (in Hungarian).Brown, R.; Ferguson, J.; Lawrence, M.; Lees, D.
(1993): Federn, Spuren und Zeichen der VogelEuropas: Ein Feldfuhrer. Wiesbaden: Aula-Verlag.
Carss, D. N. (1995): Foraging behaviour andfeeding ecology of the otter Lutra lutra: aselective review. Hystrix 7, 179–194.
Carss, D. N.; Kruuk, H.; Conroy, J. W. H. (1990):Predation on adult Atlantic salmon, Salmo
salar L., by otters, Lutra lutra (L.), within the
River Dee system, Aberdenshire, Scotland.J. Fish Biol. 37, 935–944.
Chanin, P. R. F. (1985): The Natural History ofOtters. London: Croom Helm.
Clavero, M.; Prenda, J.; Delibes, M. (2003):Trophic diversity of the otter (Lutra lutra L.)in temperate and Mediterranean freshwaterhabitats. J. Biogeogr. 30, 761–769.
Conroy, J. W. H.; Chanin, P. R. F. (2002): Thestatus of the Eurasian otter (Lutra lutra). IUCNOSG Bull. 19A, 24–48.
Copp, G. H.; Roche, K. (2003): Range and dietof Eurasian otters Lutra lutra (L.) in thecatchment of the River Lee (South-east Eng-land) since re-introduction. AquaticConservation: Marine Freshwater Ecosystems13, 65–76.

ARTICLE IN PRESS
Comparison of the feeding habits of Eurasian otters 345
Delibes, M.; Ferreras, P.; Blazquez, C. M. (2000):Why the Eurasian otter (Lutra lutra) leaves apond? An observational test of some predic-tions on prey depletion. Rev. Ecol. Terre Vie55, 57–65.
Dulfer, R.; Foerster, K.; Roche, K. (1998). Habitatuse, home range and behaviour. In: First PhaseReport of the Trebon Otter Project. Scientificbackground and recommendations for conser-vation and management planning. Ed. by R.Dulfer and K. Roche. Strasbourg: Council ofEurope Publishing. No. 93. Pp. 31-46.
Erlinge, S. (1967): Food habits of the fish-otterLutra lutra L. in South Swedish habitats.Viltrevy 4, 371–443.
Erlinge, S. (1968a): Territoriality of the otter Lutra
lutra L. Oikos 19, 81–98.Erlinge, S. (1968b): Food studies on captive otters
(Lutra lutra L.). Oikos 19, 259–270.Erlinge, S. (1969): Food habits of the otter Lutra
lutra L. and the mink Mustela vison Schreber ina trout water in southern Sweden. Oikos 20,
1–7.Geidezis, L. C. (2002): Diet of otters (Lutra lutra)
in relation to prey availability in a fish pondarea in Germany. IUCN OSG Bull. 19A, 72–76.
Ivanyi, I.; Lehmann, A. (2002): Danube-DravaNational Park. Budapest: Mez +ogazda Kiado (inHungarian).
Jedrzejewska, B.; Jedrzejewski, W. (1998): Preda-tion in Vertebrate Communities. The Bialowie-za Primeval Forest as a Case Study. Berlin,Heidelberg, New York: Springer-Verlag.
Jedrzejewska, B.; Sidorovich, V. E.; Pikulik, M.M.; Jedrzejewski, W. (2001): Feeding habitsof the otter and the American mink inBialowieza Primeval Forest (Poland) comparedto other Eurasian populations. Ecography 24,
165–180.Kemenes, I.; Demeter, A. (1995): A predictive
model of the effect of environmental factors onthe occurrence of otters (Lutra lutra L.) inHungary. Hystrix 7, 209–218.
Kemenes, K. I.; Nechay, G. (1990): The food ofotters Lutra lutra in different habitats inHungary. Acta Theriol. 35, 17–24.
Kloskowski, J. (1999): Otter Lutra lutra predationin cyprinid-dominated habitats. Z. Saugetier-kunde 64, 201–209.
Knollseisen, M. (1996): Fischbestimmungsatlas, alsGrundlage fur nahrungsokologische Untersu-chungen. Wien: Boku-Reports on WildlifeResearch and Game Management.
Kranz, A. (2000): Otters (Lutra lutra) increasing inCentral Europe: from the threat of extinction tolocally perceived overpopulation? Mammalia64, 357–368.
Krebs, C. J. (1989): Ecological Methodology. NewYork: Harper Collins Publishers.
Kruuk, H. (1995): Wild Otters. Predation andPopulations. Oxford: Oxford University Press.
Kruuk, H.; Moorhouse, A. (1990): Seasonal andspatial differences in food selection by otters(Lutra lutra) in Shetland. J. Zool. (London)221, 621–637.
Kruuk, H.; Conroy, J. W. H.; Moorhouse, A.(1991): Recruitment to a population of otters(Lutra lutra) in Shetland, in relation to fishabundance. J. Appl. Ecol. 28, 95–101.
Lanszki, J. (2005): Otter monitoring between 2000and 2004 in the Drava region (Hungary). Nat.Somogy. 7, 169–178.
Lanszki, J.; Molnar, T. (2003): Diet of otters inthree different habitats in Hungary. Folia Zool.52, 378–388.
Lanszki, J.; Kormendi, S.; Hancz, C.; Martin, T.G. (2001): Examination of some factors affect-ing selection of fish prey by otters (Lutra lutra)living by eutrophic fish ponds. J. Zool. (Lon-don) 255, 97–103.
Mason, C. F.; Macdonald, S. M. (1986): Otters:Ecology and Conservation. Cambridge: Cam-bridge University Press.
Marz, R. (1972): Gewoll- und Rupfungskunde.Berlin: Akademie Verlag.
Roche, K. (1998). The diet of otters. In: First PhaseReport of the Trebon Otter Project. Scientificbackground and Recommendations for Con-servation and Management planning. Ed. by R.Dulfer and K. Roche. Strasbourg: Council ofEurope Publishing. No. 93. Pp. 57–71.
Ruiz-Olmo, J.; Lopez-Martin, J. M.; Palazon, S.(2001): The influence of fish abundance on theotter (Lutra lutra) populations in IberianMediterranean habitats. J. Zool. (London)254, 325–336.
Ruiz-Olmo, J.; Olmo-Vidal, J. M.; Manas, S.;Batet, A. (2002): The influence of resourceseasonality on the breeding patterns of theEurasian otter (Lutra lutra) in Mediterraneanhabitats. Can. J. Zool. 80, 2178–2189.
Sallai, Z. (2002): Investigation of the fish fauna ofthe Drava-Mura River System. Halaszat 95,
80–91 (in Hungarian with English summary).Schiemer, F.; Jungwirth, M.; Imhof, G. (1994): Die
Fische der Donau–Gefahrdung und Schutz.Wien: Bundesministerium fur Umwelt, Jugendund Familie.
Spindler, T. (1997): Fischfauna in Osterreich.Wien: Bundesministerium fur Umwelt, Jugendund Familie.
SPSS 10 for Windows (1999): SPSS Inc., Chicago.Taastrøm, H. -M.; Jacobsen, L. (1999): The diet of
otters (Lutra lutra L.) in Danish freshwater

ARTICLE IN PRESS
346 J. Lanszki, Z. Sallai
habitats: comparison of prey fish populations.J. Zool. (London) 248, 1–13.
Weber, J. -M. (1990): Seasonal exploitation ofamphibians by otters Lutra lutra in north-eastScotland. J. Zool. (London) 220, 641–651.
Wise, M. H.; Linn, I. J.; Kennedy, C. R. (1981): Acomparison of the feeding biology of minkMustela vison and otter Lutra lutra. J. Zool.(London) 195, 181–213.
Authors’ addresses:
Jozsef Lanszki, Ecological Research Group, Univer-sity of Kaposvar, P.O. Box 16, 7401 Kaposvar,Hungary(e-mail: [email protected])Zoltan Sallai, Nimfea, Environment and NatureConservation Association, P.O. Box 122, 5540Szarvas, Hungary