comparison of plankton net and light trap methodologies ... · shelf) and plankton push-net and...
TRANSCRIPT

American Fisheries Society Symposium 36:15–38, 2003© Copyright by the American Fisheries Society 2003
15
Comparison of Plankton Net and Light TrapMethodologies for Sampling Larval and Juvenile
Fishes at Offshore Petroleum Platforms and aCoastal Jetty off Louisiana
FRANK J. HERNANDEZ, JR.1,* AND RICHARD F. SHAW1,2
1Department of Oceanography and Coastal Sciences, School of the Coast and Environment,Louisiana State University, Baton Rouge, Louisiana 70803-7503, USA
2Coastal Fisheries Institute, Louisiana State University, Baton Rouge, Louisiana 70803-7503, USA
Abstract.—We sampled ichthyoplankton at artificial structures across the continental shelf (3–219-m depth) of the northern Gulf of Mexico and compared passive plankton net and lighttrap methodologies at three offshore petroleum platforms (shelf slope, mid-shelf, and innershelf ) and plankton push-net and light trap methodologies at a coastal jetty. Clupeiform fishesdominated collections for all gears (59–97% of the total catch). Plankton nets collected morefish than light traps at two platforms (plankton net versus light trap, minus clupeiforms: 1,404versus 659 at slope; 3,076 versus 12,474 at mid-shelf; and 1,689 versus 1,193 at inner shelf ),and jetty push nets collected more fish than light traps (33,147 versus 849). Nets collectedmore families than light traps at the shelf slope and mid-shelf platforms (plankton net versuslight trap: 43 versus 35; 38 versus 35; and 32 versus 32) but only collected more taxa (genuslevel) than light traps at the shelf slope platform (plankton net versus light trap: 56 versus 47;75 versus 78; and 50 versus 56). Jetty push nets collected more families (39 versus 19) and taxa(77 versus 34) than light traps. Kolmogorov-Smirnov length-frequency comparisons of fishcollected in nets versus light traps indicated that light traps generally overlapped the net’ssmaller sizes, while collecting significantly larger individuals. At the jetty, greater overlap in gearsize distributions were observed. There was low taxonomic similarity between gears at the twodeeper platforms (Schoener’s Similarity Index values = 0.32–0.38) but higher similarity (0.63)at the inner shelf platform, which was most dominated by clupeiforms. At the jetty, push-netand light trap samples had relatively high taxonomic similarity (0.61). Few significant differ-ences were detected between Shannon-Weiner Diversity Indices for platform light trap and netsamples, while jetty push nets had significantly higher diversity than light traps. When signifi-cant differences in mean total densities and mean total CPUEs were found between new versusfull moon phases, four out of five instances had greater new moon catches.
* New Address: NOAA, Beaufort Laboratory, 101 PiversIsland Road, Beaufort, North Carolina 28516, USA
Introduction
Most marine fishes, particularly structure-associatedor reef-dependent fishes, have a pelagic early life his-tory stage (Moser et al. 1984; Leis 1991). Previousstudies have indicated that larval source, supply, re-

16 HERNANDEZ AND SHAW
cruitment, and settlement patterns can greatly influ-ence the adult population dynamics of reef fish onboth natural (Victor 1983, 1986; Sponaugle andCowen 1996) and artificial reefs (Lukens 1981;Stephens et al. 1994). In response to the need forcrucial information on reef fish early life history stages,several methods have been developed to collect larvaland juvenile fishes in a variety of environments. Manyreef fish juveniles at one time or another are associatedwith structurally complex habitats, either while theyreside in a nursery area (e.g., mangroves, sea grass mead-ows, oyster reefs) or once they settle onto the reefenvironment itself. While towed sampling gears areeffective in open waters, these methods are usuallynot suitable for shallow or structurally complex habi-tats (Brogan 1994).
Different methodologies have been developedto collect fish early life stages in complex environ-ments, including plankton pumps (Taggart andLeggett 1984; Brander and Thompson 1989), visualcensuses (Kingsford and Choat 1989), moored chan-nel nets (Keener et al. 1988; Shenker et al. 1993),larval purse seines (Murphy and Clutter 1972; Choatet al. 1993), and diver-steered plankton tows (Marliave1986; Brogan 1994). Other methods have used lightsources to aggregate fish for collection and includelighted purse seines (Choat et al. 1993), light lift-nets(Dennis et al. 1991; Rooker et al. 1996), and lighttraps of various designs (Doherty 1987; Thorrold1992; Choat et al. 1993; Brogan 1994; Sponaugleand Cowen 1996; Hernandez and Lindquist 1999;Hickford and Schiel 1999; Reyns and Sponaugle1999). All of these methods have different biases,advantages, and disadvantages and should be chosento best suit the environment being sampled, as well asthe life history stages and questions being addressed.
To date, very few studies have investigated theichthyoplankton assemblages associated with offshoreoil and gas platforms in the northern Gulf of Mexico(Gulf ) or elsewhere in the world, in part due to thedifficulties of sampling within the complex, mostlyvertical infrastructure of the platforms. Gallaway(1998) calculated that oil and gas platforms in thenorthern Gulf provided 11.7 km2 (or <0.4%) of thetotal “reef ” habitat. However, platforms represent ver-tical artificial substrate that extends from the bottomto the surface (photic zone), regardless of location anddepth, which increases their significance (Parker et al.1983). These and other artificial structures (e.g., jet-ties, breakwaters) could represent significant habitatsfor reef fish in the northern Gulf, since it is domi-nated by a mud/silt/sand bottom with little vertical
relief or hard-bottom habitat. In an attempt to char-acterize the across-shelf ichthyoplankton assemblagesalong a transect of artificial structures (three offshoreoil and gas platforms and a coastal jetty) in the north-ern Gulf, multiple gear types were used in an effort tosample the widest range of taxa, size-classes, and de-velopmental stages available (Hernandez et al. 2003).This paper reports results of gear comparisons betweenpassive plankton nets and light traps used at three,across-shelf petroleum platforms. It also includes com-parisons between a bow-mounted, plankton push netand light trap (the same design) used at a coastal jetty.Previous studies have demonstrated that push netsare effective in sampling larger juveniles and smallfishes, particularly in coastal areas (Herke 1969; Krieteand Loesch 1980; Raynie and Shaw 1994). In thesecomparisons, the taxa collected by the different gears,their similarity and diversity, as well as the size selec-tivities of the gears are examined. These findings willbe useful to those designing similar sampling effortsfor larval and juvenile fishes in the vicinity of complexstructures or for those interested in collecting the fullspectrum of sizes or developmental stages in their habi-tat surveys.
Study Sites
Data collection and analyses focused on three oil andgas platforms in the northern Gulf and at a coastalrock jetty habitat. The jetties provided a far-field,nonplatform, low-salinity end-member that was alsostructurally complex and represented another artifi-cial reef-type, hard-substrate habitat. Site selection forthe three study platforms (west of the Mississippi RiverDelta) was based upon previous work on adult fishes(Gallaway et al. 1980; Gallaway 1981; ContinentalShelf Associates 1982) that reported that continentalshelf nekton communities associated with natural andartificial reefs in the northern Gulf could be catego-rized by water depth, among other factors. Three com-munities were characterized: a coastal assemblage (3–20-m depth), an offshore assemblage (20–60 m), anda bluewater/tropical assemblage (water depths >60m). The platforms selected and the jetty site encom-pass all three zones. Mobil’s Green Canyon (GC) 18,which lies in 219 m of water on the shelf slope(27°56’37"N, 91°01’45"W), was sampled monthlyduring new moon phases over a 2–3-night periodduring July 1995–June 1996. Mobil’s Grand Isle(GI) 94B, which lies in approximately 60 m of waterat mid-shelf (28°30’57"N, 90°07’23"W), wassampled twice monthly during new and full moon

COMPARISON OF PLANKTON NET AND LIGHTTRAP METHODOLOGIES 17
phases over a 3-night period during April–August1996. In addition, extra samples during the first quar-ter and third quarter moon phases were collected dur-ing May, but due to inclement weather, the full mooncollections had to be cancelled. Exxon’s SouthTimbalier (ST) 54G, which lies in 22 m of water onthe inner shelf (28°50’01"N, 90°25’00"W), wassampled twice monthly during new and full moonperiods over a 2–3-night period during April–Sep-tember, 1997. The stone rubble jetties (2–3-m depth)at the terminus of Belle Pass, a major shipping chan-nel near Fourchon, Louisiana (29°03’90"N,90°13’80"W) were also sampled over a 2-night pe-riod in 1997 simultaneously with the sampling of ST54.
Methods
Sampling protocols are described in detail elsewhere(Hernandez et al. 2003, this volume). In general, pas-sive plankton nets (60-cm-diameter; 333-µm meshdyed dark green) were used to collect ichthyoplanktonat the three platform sites, both at depth (15–23 mfor 10–20 min, set and retrieved closed) and nearsurface (1–2 m for 10–15 min) within the platformstructure with the intent of sampling roughly equiva-lent amounts of water at both depths. Quatrefoil lighttraps were deployed for 10 min at depth and nearsurface within the platform structure. An additionallight trap was floated downstream (approximately 20m) from the platform for off-platform collections. Boththe subsurface and off-platform light traps were de-ployed with the light off until the sampling depth/location was reached, fished with the light on, andthen retrieved with the light off. Light trap sampleswere standardized to a catch per unit effort (CPUE)of fish per 10 min. At Belle Pass, light traps and abow-mounted plankton push net (1 m × 1 m; 1,000-µm mesh net dyed dark green; 3–5-min samples) werefished along the jetty walls. Plankton net and push-net samples were standardized to the number of fishcollected per 100 m3 (density).
The quatrefoil light trap (Figure 1) was modi-fied from Floyd et al. (1984) and Secor et al. (1993).The main modifications are described as follows. Theacrylic tubes in the main body of the trap were en-larged to 15.24 cm (6") outer diameter. The collec-tion assembly at the bottom of the trap was replacedwith short conical plankton-net (202 mm) and codend assembly. Four, vertical stainless steel threadedbars were added to the corners of the trap for addi-tional support. The light source was a Brinkman
Starfire II 12-V halogen fishing light (250,000 candle-power). For surface samples, power was suppliedthrough an umbilical cord by a 12-V marine batterylocated on the lower deck of the platform. For subsur-face collections, either the umbilical cord or a sub-mersible battery pack was used. The battery pack wasmade by placing a 7.0 amp/h rechargeable sealed leadbattery in a 1/4" thick PVC tube with a watertightconnector on one end and a complimentary pig-tailon the end of the cable supplying power to the light.
Due to the very large numbers of clupeiform(Clupeidae and Engraulidae) fishes collected, particu-larly in light trap samples, statistical analyses were runwithout these taxa, unless otherwise noted. Clupei-form fishes are seldom the taxa of interest in studies ofhard substrate habitats (e.g., artificial reefs), and theirabundances tend to overwhelm the trends of othertaxa (Choat et al. 1993). All analysis of variance(ANOVA), Tukey’s Studentized Range Tests, andStudent’s t-tests were run with SAS version 6.12 (SAS1989).
Studentized t-tests (α = 0.05) were used to com-pare overall plankton net densities between locations(subsurface and surface) within the outer (GC 18),mid-(GI 94), and inner (ST 54) shelf platforms. Lighttrap CPUEs were compared between locations (sub-surface, surface, and off-platform) within each of theplatform sites using an ANOVA model with gear as amain effect. Tukey’s Studentized Range tests were usedto determine which light trap collections were signifi-cantly different. Before testing, plankton net densi-ties were log transformed (log
10[x + 1]) in an effort to
conform to normality and homogeneity of variances.Analyses on light trap CPUEs were run on ranked-transformed data.
Kolmogorov-Smirnov (K-S) length-frequencyanalyses (α = 0.05) were performed on selected speciesfrom GC 18, GI 94, ST 54, and Belle Pass jetties todetermine if there were any significant differences be-tween size distributions of fish collected with light trapsversus plankton nets (Sokal and Rohlf 1981). Domi-nant taxa from each platform site and the Belle Passjetties were chosen for these analyses if (1) the taxoncomprised at least 5% of the total catch of one geartype, and (2) if at least 10 individuals of that taxonwere collected by each gear type. All K-S analyses wereperformed using SYSTAT version 4 (SPSS, Inc. 1999).
Lunar periodicity (full versus new moon) wasexamined for plankton net and light trap samples col-lected at the mid- and inner shelf platforms, as well asjetties, using Student’s t-tests (α = 0.05). An ANOVAmodel and Tukey’s Studentized Range tests were used

18 HERNANDEZ AND SHAW
to analyze the densities and CPUEs of samples col-lected in May 1996 at the mid-shelf platform ( thirdquarter, new, and full moon periods).
Schoener’s Index of Niche Overlap (Schoener1970) was calculated for comparisons of ichthy-
oplankton collections within each platform structure(surface net and surface light trap) and far-field col-lections (off-platform light trap) in addition to totalnet versus total light trap collections. This same analy-sis (total net versus total light trap) was performed to
FIGURE 1. Specifications for the modified quatrefoil light trap used in this study.

COMPARISON OF PLANKTON NET AND LIGHTTRAP METHODOLOGIES 19
compare the similarity of collections at the Belle Passjetties. Shannon-Weiner diversity indices (Magurran1988) were calculated for each sample collected at GC18, GI 94, ST 54, and Belle Pass. Differences in diver-sity between gear types at each site were analyzed withANOVA models using gear as a main effect. Post-ANOVA tests (Tukey’s Studentized Range, α = 0.05)were used to determine which gear types were signifi-cantly different. Only fish identified at least to the ge-nus level were included in the similarity and diversityanalyses. Because the intent of the similarity and diver-sity indices was to characterize the taxonomic assem-blages sampled by each gear type, clupeiform fisheswere included for these analyses. Taxonomic richness(either at the family, genus, or species level) is used inreference to the number of taxa collected.
Results
Overall Abundances
At the outer shelf platform (GC 18, depth = 230 m),plankton net (n = 125) and light trap (n = 319) col-lections captured 1,404 and 659 larval and juvenilefish, respectively (excluding clupeiforms), with a meantotal density of 74.6 fish/100 m3 (SE = 10.6) and amean total CPUE of 2.1 fish/10 min (SE = 0.3).Plankton nets collected fish from more families (43)than light traps (35), 15 of which were exclusivelyfrom plankton nets, while light traps collected 7 uniquefamilies. Plankton nets collected fish from 56 taxa(identified at least to genus level), 25 of which werenot collected with light traps; whereas light traps col-lected fish from 47 taxa, with 14 being unique tolight trap collections. Mean plankton net densitiesranged from 3.3 to 318.0 fish/100 m3, while lighttrap CPUEs ranged from 0 to 12.2 fish/10 min (Fig-ure 2). Sciaenops ocellatus, Caranx hippos/latus, andMugil cephalus were among the most commonnonclupeiform fishes in the plankton net collections(Table 1). Coastal pelagic taxa, such as Auxis spp.,Caranx crysos, and C. hippos/latus, were common inthe surface and off-platform light trap collections.
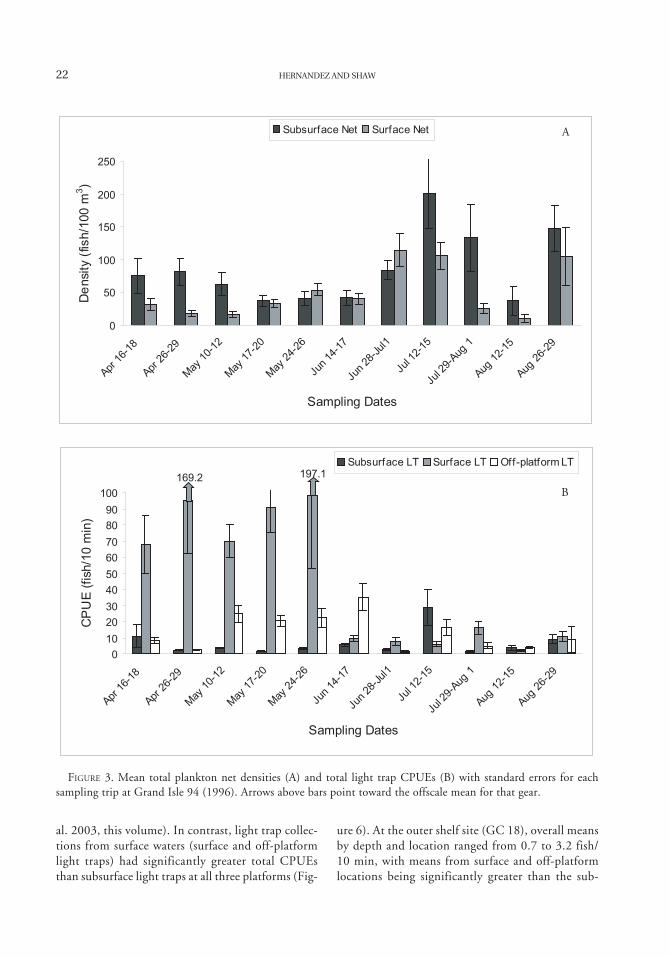
At the mid-shelf platform (GI 94, depth = 60m), plankton nets (n = 329) collected 3,076 fish whilelight traps (n = 474) collected 12,474 fish, with amean total density of 69.6 fish/100 m3 (SE = 5.9)and a mean total CPUE of 26.2 fish/10 min (SE =2.8). Plankton nets collected individuals from morefamilies than light traps (38 versus 35, respectively).However, light traps collected more taxa (genus level)than plankton nets (78 versus 75, respectively). Twice
as many unique families were collected by planktonnets (6) versus light traps (3). The number of uniquetaxa collected by plankton nets (26) and light traps(27) was nearly identical. Mean plankton net densi-ties ranged from 16.6 to 201.0 fish/100 m3, whilelight trap mean CPUEs ranged from 1.2 to 197.1fish/10 min (Figure 3). Benthic taxa such as Symphurusspp. and Bregmaceros cantori were common in plank-ton net collections, as well as coastal pelagic speciessuch as Auxis spp. and Euthynnus alletteratus (Table1). Among the most common fishes collected in lighttraps were synodontids (primarily Synodus foetens andS. poeyi) and blenniids (primarily Hypsoblenniusinvemar and Parablennius marmoreus).
At the inner shelf platform (ST 54, depth = 20m), plankton nets (n = 89) and light traps (n = 194)collected 1,689 and 1,193 fish, respectively, with amean total density of 166.0 fish/100 m3 (SE = 33.7)and a mean total CPUE of 0.6 fish/10 min (SE =0.1). Due to problems with deploying the subsurfacenet at this site (Hernandez et al. 2003, this volume),the plankton net catch is almost exclusively from thesurface. Plankton nets and light traps collected fishfrom an equal number of families (32), but light trapscollected fish from more taxa than plankton nets (56versus 50, respectively), including unique taxa (24versus 16, respectively). Mean plankton net densitiesranged from 15.7 to 809.7 fish/100 m3, while meanCPUEs ranged from 0 to 18 fish/10 min (Figure 4).Cynoscion arenarius and Chloroscombrus chrysurus werethe most dominant taxa in plankton net samples (Table1). Light trap collections were dominated by Synodusfoetens and scombrids, particularly Euthynnusalletteratus and Scomberomorus maculatus.
At the Belle Pass jetties (depth = 2–3 m), thepush net (n = 149) and light trap (n = 148) collected33,147 and 849 fish, respectively, with a mean totaldensity of 136.7 fish/100 m3 (SE = 12.8) and a meantotal CPUE of 4.6 fish/10 min (SE = 0.6). The pushnet collected fish from approximately twice as manyfamilies as the light trap (39 versus 19), including 20unique families. The push net also collected more taxa(77) than the light traps (34). No families were uniqueto light traps, and only three unique taxa were col-lected with light traps. Mean push-net densities rangedfrom 18.7 to 288.7 fish/100 m3, while mean CPUEsranged from 0 to 9.7 fish/10 min (Figure 5). Push-net samples were dominated by gobiids (primarilyGobiosoma bosc) and the sciaenid Cynoscion arenarius(Table 1). Dominant taxa in light trap collections in-cluded Membras martinica, Hypsoblennius hentz/ionthas, Gobiosoma bosc, and Cynoscion arenarius.

20 HERNANDEZ AND SHAW
FIGURE 2. Mean total plankton net densities (A) and total light trap CPUEs (B) with standard errors for eachsampling trip at Green Canyon 18 (1995–1996). Arrows above bars point toward the off-scale mean for that gear. Nosubsurface plankton net samples were taken during 26–29 June, 25–28 August, 24–25 September, and 15–18 April.No surface net, surface light trap, or subsurface light trap samples were taken during 15–18 April. No fish were presentin subsurface light trap samples (n = 10) during 17–18 February.
0
20
40
60
80
100
120
140
160
180
200
Jun
26-2
9
Aug
25-
28
Sep
24-
25
Oct 2
3-25
Nov
21-
23
Jan-
19
Feb 1
7-18
Apr
15-
18
May
17-
20
Jun
18-2
1
Sampling Dates
De
nsity (
fish
/10
0 m
3)
Subsurface Net Surface Net
318.0
A
0
1
2
3
4
5
6
7
Jun 2
6-29
Aug 25-2
8
Sep 24-2
5
Oct 23-2
5
Nov 21-2
3
Jan-1
9
Feb 17-1
8
Apr 15-1
8
May 1
7-20
Jun 1
8-21
Sampling Dates
CP
UE
(fis
h/10
min
)
Subsurface LT Surface LT Off-platform LT
12.17B

COMPARISON OF PLANKTON NET AND LIGHTTRAP METHODOLOGIES 21
Within Site Comparisonsof Sampling Gears
No significant differences were detected in mean totalplankton net densities between surface and subsur-face collections at the outer shelf (GC 18) and mid-
shelf (GI 94) platforms (Tukey’s Studentized RangeTest, α = 0.05), although subsurface densities weregenerally higher (Figure 6). At the inner shelf plat-form (ST 54), surface nets had significantly highermean total densities than subsurface nets, thoughthe sampling effort was unbalanced (Hernandez et
TABLE 1. Size ranges (SL in mm) and percent of the total catch by gear for dominant taxa (>5%) collected by at leastone gear type.
Light-trap Plankton net
Taxon Size range % Size range %
Green Canyon 18 (July 1995–June 1996)Cyclothone braueri 3.2–7.2 5.8 4.0–13.0 1.8Saurida brasiliensis 3.2–9.8 5.8Caranx crysos 5.0–65.0 12.0 2.5–16.5 3.3Caranx hippos/latus 3.0–54.0 6.4 2.0–32.0 10.9Cynoscion arenarius 2.5–4.5 1.1 2.0–4.4 6.9Sciaenops ocellatus 1.8–3.9 12.3Mugil cephalus 2.4–21.5 3.8 2.2–5.0 9.0Auxis spp. 3.3–59.0 13.3 2.2–10.5 7.6Euthynnus alletteratus 6.2–87.0 5.1 3.0–12.0 2.5Ariomma spp. 2.1–2.5 7.8Symphurus spp. 2.2–8.0 5.3 2.8–9.0 6.9
Grand Isle 94 (April–August 1996)Saurida brasiliensis 4.5–55.0 7.9 2.7–22.5 6.2Synodus foetens 6.0–43.0 30.6 4.2–22.5 1.8Synodus poeyi 5.3–45.0 15.6 2.0–16.5 1.2Bregmaceros cantori 2.0–29.0 3.0 2.0–15.5 16.6Hypsoblennius invemar 3.5–14.5 13.8Parablennius marmoreus 4.4–23.7 12.3Auxis spp. 4.0–36.0 1.4 2.5–10.3 10.3Euthynnus alletteratus 3.1–60.0 5.3 2.7–8.7 10.7Symphurus spp. 2.0–12.8 22.5
South Timbalier 54 (April–September 1997)Synodus foetens 9.0–44.5 38.9Chloroscombrus chrysurus 2.5–25.0 1.5 2.0–18.4 17.4Cynoscion arenarius 2.0–7.0 7.0 1.9–7.8 53.3Scartella/Hypleurochilus 2.0–14.3 5.0Euthynnus alletteratus 7.0–22.5 9.1Scomberomorus maculatus 2.5–40.5 6.0 1.9–10.2 4.4
Belle Pass (April–September 1997)Gobiesox strumosus 7.5–10.1 8.7 4.1–10.6 1.1Membras martinica 6.1–87.0 24.1Cynoscion arenarius 3.2–8.2 10.8 2.5–41.0 27.5Hypsoblennius hentz/ionthas 8.3–12.0 19.1 5.1–13.5 1.7Gobionellus oceanicus 11.0–13.5 2.0 7.5–35.0 6.9Gobiosoma bosc 7.7–9.6 10.9 6.5–17.0 37.3Gobiosoma spp. 4.2–7.6 5.0 4.7–8.1 1.3Citharichthys spp. 7.9–11.6 1.5 5.2–13.0 5.2
22 HERNANDEZ AND SHAW
FIGURE 3. Mean total plankton net densities (A) and total light trap CPUEs (B) with standard errors for eachsampling trip at Grand Isle 94 (1996). Arrows above bars point toward the offscale mean for that gear.
al. 2003, this volume). In contrast, light trap collec-tions from surface waters (surface and off-platformlight traps) had significantly greater total CPUEsthan subsurface light traps at all three platforms (Fig-
ure 6). At the outer shelf site (GC 18), overall meansby depth and location ranged from 0.7 to 3.2 fish/10 min, with means from surface and off-platformlocations being significantly greater than the sub-
A
0
50
100
150
200
250
Apr 1
6-18
Apr 2
6-29
May
10-
12
May
17-
20
May
24-
26
Jun
14-1
7
Jun
28-J
ul1
Jul 1
2-15
Jul 2
9-Aug
1
Aug 1
2-15
Aug 2
6-29
Sampling Dates
De
nsi
ty (
fish/1
00 m
3)
Subsurface Net Surface Net
0
10
20
30
40
50
60
70
80
90
100
Apr 1
6-18
Apr 2
6-29
May
10-
12
May
17-
20
May
24-
26
Jun
14-1
7
Jun
28-J
ul1
Jul 1
2-15
Jul 2
9-Aug
1
Aug 1
2-15
Aug 2
6-29
Sampling Dates
CP
UE
(fish
/10
min
)
Subsurface LT Surface LT Off-platform LT
169.2 197.1
B

COMPARISON OF PLANKTON NET AND LIGHTTRAP METHODOLOGIES 23
FIGURE 4. Mean total plankton net densities (A) and total light trap CPUEs (B) with standard errors for eachsampling trip at South Timbalier 54 (1997). Arrows above bars point toward the off-scale mean for that gear.Subsurface net samples were only taken during 7–8 April. No subsurface light traps were taken during 5–8 May. Nooff-platform light trap samples were taken during 3–5 September. No fish were present in subsurface light trapsamples (n = 4) during 17–20 August.
A
B
0
50
100
150
200
250
300
350
400
Apr 7
-8
May
5-8
May
20-
23
Jun
4-5
Jun
20-2
1
Jul 3
-5
Aug 1
7-20
Sep 3
-5
Sampling Dates
De
nsi
ty (
fish/1
00 m
3)
Subsurface Net Surface Net809.7
0
2
4
6
8
10
12
14
16
18
20
Apr 7
-8
May
5-8
May
20-
23
Jun
4-5
Jun
20-2
1
Jul 3
-5
Aug 1
7-20
Sep 3
-5
Sampling Dates
CP
UE
(fish
/10
min
)
Subsurface LT Surface LT Off-platform LT
37.8

24 HERNANDEZ AND SHAW
FIGURE 5. Mean total push-net densities (A) and total light trap CPUEs (B) with standard errors for each samplingtrip at Belle Pass (1997). No fish were present in light trap samples during 19–21 July.
surface mean (Tukey’s Studentized Range Test, α =0.05). At the mid-shelf platform (GI 94), overalllight trap CPUEs were the greatest of the three plat-form sites and ranged from 6.5 to 58.2 fish/10 minwith significant differences detected between all light
trap depths/locations. At the inner shelf platform(ST 54), overall mean CPUEs ranged from 3.8 to7.2, and once again, all light trap depths/locationswere significantly different.
A
B
0
50
100
150
200
250
300
Apr 7
-9
Apr 2
1-23
May
5-7
May
20-
22
Jun
3-5
Jun
20-2
1
Jul 3
-5
Jul 1
9-21
Aug 1
-3
Aug 1
8-20
Aug 3
1-Sep
2
Sampling Dates
De
nsi
ty (
fish/1
00m
3)
0
1
2
3
4
5
6
7
8
9
10
Apr 7
-9
Apr 2
1-23
May
5-7
May
20-
22
Jun
3-5
Jun
20-2
1
Jul 3
-5
Jul 1
9-21
Aug 1
-3
Aug 1
8-20
Aug 3
1-Sep
2
Sampling Dates
CP
UE
(fish
/ 1
0 m
in)

COMPARISON OF PLANKTON NET AND LIGHTTRAP METHODOLOGIES 25
FIGURE 6. Mean total plankton net densities (A) and total light trap CPUEs (B) with standard error bars for depths/locations within each platform site. Arrows above bars point toward the off-scale mean for that gear. For meandensities within each location, the same letter above each bar indicates no significant difference between depths basedon t-tests on log-transformed data (α = 0.05). For mean CPUEs within each location, the same letter above each barindicates no significant difference between depths/locations based on Tukey’s Studentized Range test on ranked data(α = 0.05). Different letters designate significant differences.
A
B
0
20
40
60
80
100
120
140
South Timbalier Grand Isle Green Canyon
Locations Within Sites
De
nsi
ty (
fish/1
00 m
3)
Subsurface Net Surface Net
177.4
A
B
A
A
A
A
0
2
4
6
8
10
12
14
16
18
20
South Timbalier Grand Isle Green Canyon
Locations Within Sites
CP
UE
(fish
/10
min
)
Subsurface LT Surface LT Off-platform LT
58.16
A
B
B
A
B
C
A
BC

26 HERNANDEZ AND SHAW
Length-Frequency Analyses
Six taxa from the outer shelf site (GC 18) met therequired criteria for K-S analyses involving the dif-ferences in size-frequency distributions between sam-pling gears (see methods). In all instances, differ-ences in size-frequency distributions for the two geartypes were found to be statistically significant (K-Stests, p ≤ 0.05; Figure 7). In general, there was somesize overlap in all gear comparisons, although thedegree of overlap and shapes of the size distributionsdiffered among species. For Auxis spp., Caranx crysos,and Mugil cephalus, the plankton net samples caughtpredominantly smaller individuals, while the lighttrap samples generally encompassed these smaller sizesas well as larger larvae and juveniles. For C. hippos/latus and Euthynnus alletteratus, there was less over-lap at the smaller sizes, and modal size-classes for thelight trap samples were generally larger. Only forSymphurus spp. was the modal length of light trapsamples smaller than that for net collections (p ≤0.05).
At the mid-shelf site (GI 94), five of the six taxaanalyzed for differences in size distributions (plank-
ton net versus light trap) were highly significant (K-Stests, p ≤ 0.001; Figure 8). Size distributions forBregmaceros cantori appeared to substantially overlapat the smaller sizes, but the light trap samples encom-passed a significantly broader range of size-classes. ForAuxis spp., Synodus foetens, and S. poeyi, there wassome overlap in size distributions, with the planktonnet capturing smaller larvae, while modal sizes for lighttrap samples were always larger. With only one taxon(Saurida brasiliensis) were plankton nets not only ableto better catch small sizes but also larger size-classes aswell. Only one dominant taxa, Symphurus spp., didnot exhibit a significant difference in size distributionbetween gears (p = 0.385).
At the inner shelf site (ST 54), differences be-tween the two gear types’ size distributions for two ofthe three taxa analyzed were highly significant (K-Stests, p ≤ 0.01; Figure 9). In general, light trap size-frequency distributions for Scomberomorus maculatusencompassed that of the plankton net distributionsbut also included larger sizes. Little overlap in sizedistributions was observed for Euthynnus alletteratus,with light trap collections being much larger. Onedominant species, Chloroscombrus chrysurus, did not
FIGURE 7. Size distributions of fish collected with light traps (shaded bars) and plankton nets (open bars) at theGreen Canyon site (1995–1996). Fish length-frequency distributions were analyzed with Kolmogorov-Smirnov tests(P-values are represented in the upper panel of each gear pairing along with each sample size).
AUXIS SPP.CARANX CRYSOS
0
0.05
0.1
0.15
0.2
0.25
1 5 9 13 17 21 25 29 33 37 41 45 49 53 57
Length (mm)
Fre
quency
n=60
p<0.001
0
0.05
0.1
0.15
0.2
0.25
0.3
1 5 9 13 17 21 25 29 33 37 41 45 49 53 57
Length (mm)
Fre
quency
n=67
0
0.02
0.04
0.06
0.08
0.1
0.12
1 5 9 13 17 21 25 29 33 37 41 45 49 53 57 61 65
Length (mm)
Fre
quency
n=55
p<0.001
0
0.05
0.1
0.15
0.2
0.25
0.3
1 5 9 13 17 21 25 29 33 37 41 45 49 53 57 61 65
Length (mm)
Fre
quency
n=28

COMPARISON OF PLANKTON NET AND LIGHTTRAP METHODOLOGIES 27
MUGIL CEPHALUS SYMPHURUS SPP.
FIGURE 7. Continued.
exhibit a significant difference in size distributionsbetween the two gear types (p = 0.133).
In contrast to the platform sites, size distribu-
tions for push-net versus light trap collections at theBelle Pass jetties were significantly different for onlythree of the seven taxa analyzed (K-S tests, p < 0.05;
CARANX HIPPOS/LATUS
EUTHYNNUS ALLETTERATUS
0
0.05
0.1
0.15
0.2
0.25
0.3
0.35
1 3 5 7 9 11 13 15 17 19 21
Length (mm)
Fre
quency
n=17
p<0.001
0
0.1
0.2
0.3
0.4
0.5
0.6
0.7
0.8
0.9
1 3 5 7 9 11 13 15 17 19 21
Length (mm)
Fre
quency
n=80
0
0.05
0.1
0.15
0.2
0.25
0.3
0.35
0.4
1 2 3 4 5 6 7 8 9
Length (mm)
Fre
quency
n=24
p<0.05
0
0.05
0.1
0.15
0.2
0.25
0.3
1 2 3 4 5 6 7 8 9
Length (mm)
Fre
quency
n=55
0
0.05
0.1
0.15
0.2
1 4 7 10 13 16 19 22 25 28 31 34 37 40 43 46 49 52
Length (mm)
Fre
quency
n=29
p<0.001
0
0.05
0.1
0.15
0.2
0.25
0.3
0.35
0.4
0.45
1 4 7 10 13 16 19 22 25 28 31 34 37 40 43 46 49 52
Length (mm)
Fre
quency
n=97
0
0.02
0.04
0.06
0.08
0.1
0.12
1 6 11 16 21 26 31 36 41 46 51 56 61 66 71 76 81 86
Length (mm)
Fre
quen
cy
n=19
p<0.001
0
0.05
0.1
0.15
0.2
1 6 11 16 21 26 31 36 41 46 51 56 61 66 71 76 81 86
Length (mm)
Fre
quency
n=22

28 HERNANDEZ AND SHAW
FIGURE 8. Size distributions of fish collected with light traps (shaded bars) and plankton nets (open bars) at theGrand Isle site (1996). Fish length-frequency distributions were analyzed with Kolmogorov-Smirnov tests (P-valuesare represented in the upper panel of each gear pairing along with each sample size).
SYMPHURUS SPP.SAURIDA BRASILIENSIS
AUXIS SPP. BREGMACEROS CANTORI
Figure 10). There was a broad overlap in the size dis-tributions for Gobiosoma spp. and Hypsoblennius hentz/ionthas, but in each case, the push-net samples col-
lected larger-sized individuals with greater frequency.In contrast, the light trap size distribution for Membrasmartinica had an intermediate dominant mode. There
0
0.05
0.1
0.15
0.2
0.25
1 3 5 7 9 11 13 15 17 19 21 23 25 27 29 31 33 35
Length (mm)
Fre
quency
n=135
p<0.001
0
0.1
0.2
0.3
0.4
0.5
1 3 5 7 9 11 13 15 17 19 21 23 25 27 29 31 33 35
Length (mm)
Fre
quency
n=194
0
0.05
0.1
0.15
0.2
1 3 5 7 9 11 13 15 17 19 21 23 25 27 29
Length (mm)
Fre
quency
n=15
p<0.001
0
0.05
0.1
0.15
0.2
0.25
1 3 5 7 9 11 13 15 17 19 21 23 25 27 29
Length (mm)
Fre
quency
n=317
0
0.02
0.04
0.06
0.08
0.1
0.12
0.14
0.16
0.18
1 5 9 13 17 21 25 29 33 37 41 45 49 53 57 61
Length (mm)
Fre
quency
n=812
p<0.001
0
0.05
0.1
0.15
0.2
1 5 9 13 17 21 25 29 33 37 41 45 49 53 57 61
Length (mm)
Fre
qu
ency
n=122
0
0.05
0.1
0.15
0.2
0.25
0.3
1 2 3 4 5 6 7 8 9 10 11 12 13
Length (mm)
Fre
quency
n=30
p=0.385
0
0.05
0.1
0.15
0.2
1 2 3 4 5 6 7 8 9 10 11 12 13
Length (mm)
Fre
quency
n=450

COMPARISON OF PLANKTON NET AND LIGHTTRAP METHODOLOGIES 29
was no significant difference in the size distributionsfor Gobiesox strumosus, Gobiosoma bosc, Citharichthysspp., and Cynoscion arenarius.
Lunar Periodicity
At the mid-shelf platform (GI 94), mean total CPUEsfor light traps were significantly higher during newmoon phases (20.4 fish/10 min, SE = 2.5) than duringfull phases (7.3 fish/10 min, SE = 1.4; Student’s t-test,p < 0.0001). The opposite trend was observed in meanplankton net densities. Mean plankton net densitieswere significantly higher during full moon phases (103fish/100 m3, SE = 13.8) than during new moon phases(61.9 fish/100 m3, SE = 8.4; p < 0.01). The separatelunar study conducted at GI 94, which compared threelunar phases (first quarter, new, and third quarter moonphases sampled in May 1996), however, yielded nosignificant differences in mean total light trap CPUEsor mean total plankton net densities between the threephases (Tukey’s Studentized Range test, p > 0.05). Atthe inner shelf platform (ST 54), there were no signifi-cant difference in total CPUEs between new (5.7 fish/10 min, SE = 1.0) and full (6.6 fish/10 min, SE = 1.5)
moon phases (Student’s t-test, p > 0.05). However,mean total density during new moon phases (250.5fish/100 m3, SE = 56.7) was significantly higher thanfull moons (57.6 fish/100 m3, SE = 12.2; Student’s t-test, p < 0.05). Both results are in contrast to the find-ings at GI 94. At the Belle Pass jetties, mean total CPUEswere significantly higher during new moon phases (5.2fish/10 min, SE = 0.8) than during full moon phases(3.8 fish/10 min, SE = 1.1; Student’s t-tests, p < 0.001).Mean plankton net densities were also significantlyhigher during new moon phases (181.4 fish 100 m3,SE = 18.7) than during full moon phases (75.8 fish/100 m3, SE = 12.8; Student’s t-test, p < 0.0001). There-fore, when significant lunar differences were found inour comparisons, four out of five instances had greaternew moon catches.
Similarity and Diversity ofIchthyoplankton Assemblageswithin Sites
Within site comparisons of gears and surface samplinglocations indicated that off-platform and surface lighttrap collections were more similar to each other
FIGURE 8. Continued.
SYNODUS FOETENS SYNODUS POEYI
0
0.02
0.04
0.06
0.08
0.1
0.12
1 4 7 10 13 16 19 22 25 28 31 34 37 40 43
Length (mm)
Fre
quency
n=801
p<0.001
0
0.05
0.1
0.15
0.2
0.25
1 4 7 10 13 16 19 22 25 28 31 34 37 40 43
Length (mm)
Fre
quency
n=40
0
0.02
0.04
0.06
0.08
0.1
0.12
1 4 7 10 13 16 19 22 25 28 31 34 37 40 43
Length (mm)
Fre
quency
n=1048
p<0.001
0
0.05
0.1
0.15
0.2
0.25
1 4 7 10 13 16 19 22 25 28 31 34 37 40 43
Length (mm)
Fre
quency
n=25

30 HERNANDEZ AND SHAW
FIGURE 9. Size distributions of fish collected with light traps (shaded bars) and plankton nets (open bars) at theSouth Timbalier site (1997). Fish length-frequency distributions were analyzed with Kolmogorov-Smirnov tests (P-values are represented in the upper panel of each gear pairing along with each sample size).
(Schoener’s Index of Similarity values range from 0.45to 0.76) than each was to surface plankton net collec-tions (0.27–0.71), although the disparity betweenthe index gear comparisons is smaller at ST 54 (0.59–
0.71; Table 2). Overall, total light trap collections wererelatively different from total plankton net samples atthe outer shelf (GC 18) and mid-shelf (GI 94) plat-forms (0.38 and 0.32, respectively) but were much
CHLOROSCOMBRUS CHRYSURUS EUTHYNNUS ALLETTERATUS
SCOMBEROMORUS MACULATUS
0
0.05
0.1
0.15
0.2
0.25
0.3
1 3 5 7 9 11 13 15 17 19 21 23 25
Length (mm)
Fre
quency
n=15
p=0.133
0
0.05
0.1
0.15
0.2
0.25
0.3
0.35
0.4
1 3 5 7 9 11 13 15 17 19 21 23 25
Length (mm)
Fre
quency
n=199
0
0.02
0.04
0.06
0.08
0.1
0.12
0.14
1 3 5 7 9 11 13 15 17 19 21
Length (mm)
Fre
quency
n=99
p<0.001
0
0.05
0.1
0.15
0.2
0.25
0.3
0.35
0.4
0.45
1 3 5 7 9 11 13 15 17 19 21
Length (mm)
Fre
quency
n=10
0
0.02
0.04
0.06
0.08
0.1
0.12
0.14
1 4 7 10 13 16 19 22 25 28 31 34 37 40
Length (mm)
Fre
quency
n=64
p<0.001
0
0.05
0.1
0.15
0.2
0.25
0.3
0.35
0.4
1 4 7 10 13 16 19 22 25 28 31 34 37 40
Length (mm)
Fre
quency
n=63

COMPARISON OF PLANKTON NET AND LIGHTTRAP METHODOLOGIES 31
FIGURE 10. Size distributions of fish collected with light traps (shaded bars) and a push net (open bars) at the BellPass site (1997). Fish length frequency distributions were analyzed with Kolmogorov-Smirnov tests (P-values arerepresented in the upper panel of each gear pairing along with each sample size).
more similar at the inner shelf platform (ST 54) andBelle Pass jetties (0.63 and 0.61, respectively).
There was little difference in the Shannon-Weiner diversity index values from gear and depth/
location samples collected at the outer shelf (GC 18)and inner shelf (ST 54) platforms. In both instances,only subsurface light trap samples had significantlylower diversity values (GC 18: index = 0.24, SE =
GOBIOSOMA SPP. GOBIESOX STRUMOSUS
GOBIOSOMA BOSC HYPSOBLENNIUS HENTZ/IONTHAS
0
0.1
0.2
0.3
0.4
0.5
0.6
1 2 3 4 5 6 7 8
Length (mm)
Fre
quency
n=39
p<0.001
0
0.1
0.2
0.3
0.4
0.5
1 2 3 4 5 6 7 8
Length (mm)
Fre
quency
n=309
0
0.1
0.2
0.3
0.4
0.5
0.6
0.7
1 2 3 4 5 6 7 8 9 10
Length (mm)
Fre
quency
n=68
p=0.384
0
0.1
0.2
0.3
0.4
0.5
1 2 3 4 5 6 7 8 9 10
Length (mm)
Fre
quency
n=351
0
0.1
0.2
0.3
0.4
0.5
0.6
0.7
0.8
1 2 3 4 5 6 7 8 9 10 11 12 13 14 15 16 17
Length (mm)
Fre
quency
n=88
p=0.527
0
0.1
0.2
0.3
0.4
0.5
0.6
0.7
1 2 3 4 5 6 7 8 9 10 11 12 13 14 15 16 17
Length (mm)
Fre
quency
n=2217
0
0.1
0.2
0.3
0.4
0.5
0.6
0.7
1 2 3 4 5 6 7 8 9 10 11 12 13
Length (mm)
Fre
quency
n=153
p<0.05
0
0.1
0.2
0.3
0.4
0.5
1 2 3 4 5 6 7 8 9 10 11 12 13
Length (mm)
Fre
quency
n=456

32 HERNANDEZ AND SHAW
FIGURE 10. Continued.
CYNOSCION ARENARIUS
CITHARICHTHYS SPP.MEMBRAS MARTINICA
0.1; ST 54: index = 0.53, SE = 0.1) than the othergear and depth/location combinations (GC 18: in-dex values range from 0.6 to 0.85; ST 54: values
range from 0.8 to 1.7; ANOVA, α = 0.05). No clearpattern in diversity was discernable at the mid-shelfplatform (GI 94) as all index values were statistically
0
0.02
0.04
0.06
0.08
0.1
0.12
0.14
1 6 11 16 21 26 31 36 41 46 51 56 61 66 71 76 81 86
Length (mm)
Fre
quency
n=132
p<0.001
0
0.05
0.1
0.15
0.2
1 6 11 16 21 26 31 36 41 46 51 56 61 66 71 76 81 86
Length (mm)
Fre
quency
n=204
0
0.1
0.2
0.3
0.4
0.5
0.6
0.7
1 2 3 4 5 6 7 8 9 10 11 12 13
Length (mm)
Fre
quency
n=12
p=0.674
0
0.05
0.1
0.15
0.2
0.25
0.3
0.35
1 2 3 4 5 6 7 8 9 10 11 12 13
Length (mm)
Fre
quency
n=1169
0
0.05
0.1
0.15
0.2
0.25
0.3
0.35
1 4 7 10 13 16 19 22 25 28 31 34 37 40
Length (mm)
Fre
quency
n=72
p=0.084
0
0.05
0.1
0.15
0.2
0.25
0.3
0.35
1 4 7 10 13 16 19 22 25 28 31 34 37 40
Length (mm)
Fre
quency
n=1877

COMPARISON OF PLANKTON NET AND LIGHTTRAP METHODOLOGIES 33
similar, ranging from 0.7 to 1.06. At the Belle Passjetties, push-net samples were significantly more di-verse than the light trap samples (1.9 versus 1.0, re-spectively; Student’s t-test, α = 0.05)
Discussion
Gear Selectivity
The most obvious trend observed during this studywas the overwhelming presence of engraulids and clu-peids at all sites, even on the shelf slope (Hernandez etal. 2003, this volume). Light trap and plankton netcollections (total catch) were dominated by clupeiformfishes at the outer (59%), mid- (66%), and innershelf (97%) platforms and the Belle Pass jetties (74%).The dominance of these taxa is not unexpected, par-ticularly considering the abundances of these fishes inthe northern Gulf and the sampling gears utilized.Clupeiform fishes are often among the most abun-dant in plankton surveys of the northern Gulf andare present year-round in shelf waters (Ditty 1986;Ditty et al. 1988; Finucane et al. 1979). Light trapsare selective sampling devices, and previous studieshave demonstrated that often the catches are domi-nated by a single taxonomic group (Brogan 1994;Choat et al. 1993; Sponaugle and Cowen 1996;Thorrold 1992). Clupeiform fishes have been shownto be particularly photopositive and have dominatedthe total catches in several studies utilizing light-ag-gregating collection techniques (Brogan 1994; Choatet al. 1993; Dennis et al. 1991; Rooker et al. 1996).The push net used in this study actively collects fishand was relatively large (1 m × 1 m). It has also beenshown to be an effective collector of clupeiforms inprevious studies (Herke 1969; Kriete and Loesch1980; Raynie and Shaw 1994). While the light trapcollects fish based on taxon-specific, photopositivebehaviors and the push net actively strains the watermass it samples, the plankton nets in the platformstudy collected fish passively with tidal currents. Evenso, it was also very effective in sampling these fishes.This catchability was undoubtedly aided by the noc-turnal sampling design.
Even with these sampling efficiency enhance-ments, these three sampling techniques clearly dis-played gear selectivity as evident by differences in taxo-nomic richness between gear types. Passive planktonnets collected fish from more unique families thanlight traps at the outer shelf (GC 18: 15 versus 7) andmid-shelf (GI 94: 6 versus 3) platforms but not at theinner shelf platform (ST 54, eight unique families to
each gear). At the Belle Pass jetties, the push net col-lected individuals from 20 unique families, as well asfish from all families sampled by light traps. Previousstudies comparing light traps and plankton nets inmarine waters have found similar results (i.e., lighttraps collected fewer families than plankton tows) withonly a few instances where light traps collected uniquefamilies. Brogan (1994) collected 16 unique familieswith a diver-steered push net and only 4 unique fami-lies with light traps, and the latter 4 families, whencombined, comprised a very small proportion(<0.08%) of his total light trap catch. Likewise, moreunique families were collected with a neuston net (10)than with light traps (4) when fished simultaneouslyin Onslow Bay, North Carolina, and the unique lighttrap families comprised only 10% of the total lighttrap catch (Hernandez and Lindquist 1999). Theseresults are similar to one aspect of this study (i.e.,unique light trap families usually made up less than1% of the total catch at each platform site). However,whereas the previously cited studies each collectedonly four unique families with light traps, seven (GC18) and eight (ST 54) unique families were collectedwith light traps in this study. Neither Choat et al.(1993) nor Hickford and Schiel (1999) reported anyfamilies in light trap samples that were not present inplankton net samples.
In addition, the large numbers of unique taxa(identified at least to genus level) collected by lighttraps was also surprising, since this gear is usually con-sidered to be very taxon-specific and, therefore, lim-ited in its sampling scope. At the genus level, lighttraps collected more unique taxa than plankton netsat the mid- (27 versus 26) and inner (24 versus 16)shelf platforms but not at the outer shelf platform (14versus 25). At Belle Pass, however, the light traps col-lected far fewer unique taxa (3) than did the push net(44). Such large numbers of unique taxa have notbeen previously reported for light traps in gear com-parison studies. Two studies have reported data at thegenus level and found either that all taxa collected bylight traps were collected by nets (Hickford and Schiel1999) or that there were more unique taxa in the netcollections than light trap collections (Hernandez andLindquist 1999). In this study, light traps provedvery useful in sampling available taxa that were notcollected by plankton nets.
Trends in taxon selectivity by gear were supportedin the similarity indices between the gear types withina given site (Table 2). At the outer shelf (GC 18) andmid-shelf (GI 94) platforms, there was greater simi-larity between the light trap samples, regardless of

34 HERNANDEZ AND SHAW
location, than there was between the surface light trapcollections (either off platform or central location) andthe surface net collections. Again, this indicates the be-havioral or developmental responses of different fishtaxa influence their susceptibility to different samplinggears (Hernandez and Lindquist 1999). The trend wasnot as evident at the inner shelf platform (ST 54), butthis is not surprising as 97% of the total catch by bothgears was composed of clupeiform fishes, which arevery susceptible to both gear types (Schoener’s Similar-ity Index for total light trap versus total net collections= 0.63). There was also a relatively high similarity in-dex value (0.61) for the push net versus light trap com-parison at Belle Pass, even though the push net hadcollected many unique taxa. Again, this site was domi-nated by clupeiform fishes (74% of total catch), andlight traps are effective in sampling these fishes, result-ing in a higher than expected similarity value. In addi-tion, the push net’s unique taxa were relatively rareand, therefore, had a limited influence in the calcula-tion of the similarity index.
The presence of rare and unique taxa in plank-ton push-net collections at the jetties did increase thediversity of the assemblage, however. In contrast, fewdifferences were observed between the passive plank-ton net and light trap collections at the platforms.Several studies have investigated differences in taxo-nomic richness between different gear types, althoughfew, if any, have reported diversity data. Choat et al.(1993) collected individuals from more families witha bongo net (63 families), lighted-seine net (37 fami-lies), neuston net (31 families), Tucker trawl (29 fami-lies), and purse seine (25 families) than with a lighttrap (20 families) in a gear comparison study withinAustralia’s Great Barrier Reef. In the Gulf of Califor-nia, Brogan (1994) collected more reef fish larvae andjuveniles from different families with a diver-steeredplankton net (43 families) than with a light trap (31families). Hernandez and Lindquist (1999) collectedmore fish larvae and juveniles from different familieswith a neuston net (24 families) than with either of
the two light trap designs employed (18 and 21 fami-lies) in a study in Onslow Bay, North Carolina. Ineach of these studies, the authors concluded that thetaxonomic assemblage collected in their respective stud-ies was very method-dependent, and the same ap-pears to be true in the present study.
The results of this study further illustrate thebenefits that multiple gear types can bring toichthyoplankton studies by sampling a more com-plete range of size-classes, ages, and developmentalstages (Brogan 1994; Choat et al. 1993; Hernandezand Lindquist 1999). Of the 15 length-frequencycomparisons between passive plankton nets and lighttraps, 13 exhibited statistically significant differences(Figures 7–9). In the instances where no significantdifferences were found, the distributions either over-lapped substantially (Symphurus spp., Figure 8) orsuffered from too few individuals in the larger size-classes for a significant statistical difference to be found(Chloroscombrus chrysurus, Figure 9). In general, thelight trap was more effective in sampling larger size-classes of the same species at each location, depth, orsite. In some cases, the light trap collections did notencompass a significant portion of the plankton net’ssmaller sizes but clearly excelled at capturing the largersizes. This was the case with Euthynnus alletteratus(Figures 7 and 9). In other instances, the light trapcollections appeared to significantly overlap the smallersizes of the net collections but also augmented thesize-frequency distribution with much larger sizes or,in some cases, even additional modes, as was the casefor Caranx crysos (Figure 7). By using multiple gearsand methodologies, the presence of a number of taxawith a full range of life history stages, ranging fromrecently-spawned larvae to juveniles, was confirmed.For example, at the outer shelf platform (GC 18), theplankton net collected Euthynnus alletteratus individu-als within a smaller size range (3.0–12.0 mm) thanthe light trap (6.2–87.0 mm). If plankton net collec-tions were not supplemented with light trap catches,larger juveniles at this site would have been overlooked.
TABLE 2. Schoener’s Index of Niche Overlap values for different surface gear and location comparisons. (OL) off-platform light-trap, (SL) surface light-trap, (SN) surface net, (TL) total light-traps, (TN) total nets.
OL vs SL OL vs SN SL vs SN TL vs TN
Green Canyon 18 0.53 0.32 0.31 0.38Grand Isle 94 0.45 0.37 0.27 0.32South Timbalier 54 0.76 0.71 0.59 0.63Belle Pass 0.61 0.61a
a Calculation is the same as with SL vs SN since only a surface pushnet and surface light-trap were used.

COMPARISON OF PLANKTON NET AND LIGHTTRAP METHODOLOGIES 35
The advantages of plankton push nets (see intro-duction) proved useful in sampling the edges of thejetty environment, which are structurally complex. Theboat and push net were maneuvered very close to theshallow slope of the rock wall with relative ease. In gen-eral, net avoidance is reduced with push nets comparedto towed nets because the net fishes in advance of theboat, its shadow, and its propeller wash (Raynie andShaw 1994). The large mesh size (1,000 µm) and netopening (1 m × 1 m) minimizes the pressure wave infront of the net and minimizes net clogging, enhancingthe ability to collect larger larvae and postsettlementjuveniles. As a result, many of the size distributionssampled with the push net and light trap at Belle Passoverlapped considerably (Figure 10). Only 3 of the 11species analyzed exhibited significant size differencesbetween the gear types. In one instance, the push-netcollections clearly had a larger size mode than the lighttrap (Figure 10, Gobiosoma spp.). While the same size-classes were targeted with the push net, its usefulnesswas in sampling different taxa. The number of families(39) and taxa identified to the genus level (77) wasapproximately double that of the light traps (19 and34, respectively), which generated a taxon diversity forthe push-net collections that was significantly higherthan that for the light trap. Once again, multiple geartypes allowed for the collection of a more completerepresentation of the ichthyoplankton and juvenile fishassemblages at the jetty site as well.
Lunar Periodicity
Lunar periodicities were investigated because thereare many hypotheses on lunar reproductive patternspertaining to propagule dispersal and predation ratesthat occur both at the beginning (spawning) andend (settlement) of the planktonic phase (Robertson1991). Many reef fish appear to time their spawn-ing events with different lunar cycles (Thresher1984). Higher rates of fish settlement often occurduring darker, new moon periods than full moonperiods (Victor 1986; Rooker et al. 1996), presum-ably a response to mortality associated with visualpredators. These patterns of spawning, transport,recruitment, and settlement in association with thelocal physical oceanographic regime, often result invariable larval supply and settlement patterns withdistinct lunar periodicities. Since the samplingtransect is downstream of the Mississippi River plumeand extends from an outer shelf platform to a coastaljetty, baroclinic pressure gradients, wind-driven cur-rents, and tides are important transport consider-
ations. It should be noted, however, that in the north-ern Gulf of Mexico, tides are dominantly diurnaland their range in tidal height is not often in syn-chrony with the phase of the moon (i.e., new andfull moon maximum tide ranges versus first quarterand third quarter minimums), but rather the tidalrange is in synchrony with the tropical and equato-rial phases of the moon’s elevation (i.e., Tropic ofCancer and/or Capricorn crossing maximum tidalranges versus equatorial crossing minimums;McLellan 1965). In addition, the effects of ambientlight on gear selectivity were investigated. Since lighttraps rely on the illumination of the surroundingwater mass to attract fish, the contrast in trap-gener-ated illumination should be greater (and theoreti-cally more efficient) when there is less ambient light,such as during a new moon phase (all larval andpostlarval supply/availability issues being equal).
Few studies utilizing light-aggregating deviceshave addressed gear efficiency within the frameworkof lunar periodicities in fish spawning, larval supply(transport), and settlement. Gregory and Powles(1985) observed higher catches during new moonphases in a freshwater system but did not report astatistical difference. Rooker et al. (1996) used anightlight lift-net in nearshore habitats in PuertoRico and reported that larval fish new moon abun-dances were four times higher than the next mostabundant phase (last quarter) during the summermonths and suggested that ambient light intensitiesmight have played a factor in gear efficiency. Thecompetitive interaction of lunar versus light trap il-lumination may have played a role in the collectionof fish at Belle Pass, where significantly higherCPUEs were observed during new moons. Jettypush-net collections also had significantly more fishduring new moons, possibly due to decreased visualavoidance under lower ambient light conditions. Itis difficult, however, to separate the effects of ambi-ent illumination and gear performance from the sup-ply and/or settlement patterns of the fishes, so lunarperiodicity may still play a role in the occurrence offishes at this site.
In addition, the situation at petroleum platformsmay be equally difficult to discern, since platformshave many bright lights throughout the structure toilluminate the work areas at night and to aid shipnavigation, which may in effect be attracting fish tothe structure (i.e., fishing a light trap within a giant“light trap”). This issue was at least partially addressedby sampling away from the structure (i.e., 20 m down-stream), but even these off-platform light trap collec-

36 HERNANDEZ AND SHAW
tions could still be within the “halo influence” of theplatform’s light field. Still, when significant differencesin mean total densities and mean total CPUEs werefound between new versus full moon phases, fourout of five instances had greater new moon catches.The analysis of the May samples at GI 94 taken overthree lunar phases was disappointing, however, sinceit showed very little difference between the lunarphases for both gears.
Although these platform results on lunar period-icity are less than conclusive, there may be several ex-planations for the lack of a consistently strong pat-tern. First of all, the previously mentioned potentialcompetitive interference of the platform’s large ambi-ent light-field may have partially masked any lunareffect that would otherwise be present. Second, someof the species may be responding differently to lunarcues. For example, some peak recruitment events fortropical and coastal fishes have also been linked to fullmoon periods (Johannes 1978; Robertson et al. 1988).Due to the rarity of reef fish taxa collected (Hernandezet al. 2003, this volume), analyses were run on totallight trap and plankton net catches and not individualtaxa. Multiple species responding to different lunarcues undoubtedly confounded the results. Finally, itis possible that the abundances of these fish are re-lated to more localized factors such as water mass sup-ply, particularly at the mid- and inner shelf sites wherethe coastal current regime can dynamically affect sa-linity, temperature, and food patchiness and wherethe geographical concentration of upstream platforms,which may represent potential spawning sites, is great-est when compared to the relative isolated shelf slopesite.
In summary, the combination of the light trapand the passive plankton nets were effective in col-lecting fish larvae and juveniles within the complexinfrastructure of the oil and gas platforms sampled inthe north-central Gulf of Mexico. Surprisingly, thelight trap collected individuals from a wide range oftaxa, including many unique taxa that were not col-lected with the plankton net. As in previous studies,the light trap generally collected larger individuals(postflexion larvae and juveniles) than the planktonnet but also performed very well at the smaller sizes.Push-net collections from the jetties were more taxo-nomically rich and diverse than light trap collections,and the push net was equally effective in capturinglarge individuals as the light trap. The use of multiplegear types in ichthyoplankton studies needs to be-come more common since they can provide the re-searcher with a more complete view of larval and juve-
nile fish assemblages. For example, the combinationof sampling gears at the platforms allowed for thecollection of a wider range of taxa, size-classes, anddevelopmental life stages than either gear would haveprovided individually. This enabled us to confirm thepresence of both recently-spawned larvae, larger, near-settlement size postlarvae, and juveniles at the sam-pling sites.
Acknowledgments
We gratefully acknowledge funding by the MineralsManagement Service-Louisiana State University-Coastal Marine Institute (Contract Number 14–75–0001–30660, Task Order Number 19926) and bythe Louisiana Sea Grant Program, part of the Na-tional Sea Grant College Program maintained by theNational Oceanic and Atmospheric Administration.We thank Mark Benfield, David Bunch, JosephCope, Nathan Craig, James Ditty, Talat Farooqi,Heather Haas, Ross Horton, Robin Hargroder, SeanKeenan, Gregory Lavergne, David Lindquist, Brad-ley McDonald, Cory New, Nick Ortego, JohnPlunket, and Christopher Whatley for assistance inthe field and/or laboratory. We gratefully acknowl-edge the assistance of Charles A. Wilson and David R.Stanley. We are further indebted to Exxon USA, Inc.and Mobil USA Exploration and Production, Inc. foraccess to their offshore oil and gas platforms and logis-tical support, and to the crews of Mobil’s Green Can-yon 18 and Grand Isle 94 and Exxon’s SouthTimbalier 54 platforms for their hospitality.
References
Brander, K., and A. B. Thompson. 1989. Diel differences inavoidance of three vertical profile sampling gears by her-ring larvae. Journal of Plankton Research 4:775–784.
Brogan, M. W. 1994. Two methods of sampling fish larvae overreefs: a comparison from the Gulf of California. MarineBiology 118:33–44.
Choat, J. H., P. J. Doherty, B. A. Kerrigan, and J. M. Leis.1993. A comparison of towed nets, purse seine, andlight- aggregation devices for sampling larvae and pelagicjuveniles of coral reef fishes. Fishery Bulletin 91:195–209.
Continental Shelf Associates. 1982. Study of the effect of oil andgas activities on reef fish populations in the Gulf of MexicoOCS area. U.S. Department of the Interior, Minerals Man-agement Service, Gulf of Mexico OCS Region, OCS Re-port/MMS82–010, New Orleans, Louisiana.
Dennis, G. D., D. Goulet, and J. R. Rooker. 1991.Ichthyoplankton assemblages sampled by night lightingin nearshore habitats of southwestern Puerto Rico. In R.

COMPARISON OF PLANKTON NET AND LIGHTTRAP METHODOLOGIES 37
D. Hoyt, editor. Larval fish recruitment and research inthe Americas: proceedings of the thirteenth annual larvalfish conference; Meridia, Mexico, 21–26 May 1989.NOAA Technical Report NMFS 95, Seattle, Washington.
Ditty, J. G. 1986. Ichthyoplankton in neritic waters of thenorthern Gulf of Mexico off Louisiana: composition, rela-tive abundance and seasonality. Fishery Bulletin 84:935–946.
Ditty, J. G., G. G. Zieske, and R. F. Shaw. 1988. Seasonality anddepth distribution of larval fishes in the northern Gulf ofMexico above latitude 26°00’N. Fishery Bulletin 86:811–823.
Doherty, P. J. 1987. Light-traps: selective but useful devices forquantifying the distribution and abundances of larval fishes.Bulletin of Marine Science 41:423–431.
Finucane, J. H., L. A. Collins, L. E. Barger, and J. D. McEachran.1979. Environmental studies of the South Texas OuterContinental Shelf 1976: ichthyoplankton/mackerel eggsand larvae. NOAA Final Report to BLM, NMFS South-east Fisheries Center, Contract Number AA550-TA7–3,Galveston, Texas.
Floyd, K. B., W. H. Courtenay, and R. D. Holt. 1984. A newlarval fish light trap: the quatrefoil trap. Progressive Fish-Culturist 46:216–219.
Gallaway, B. J., L. R. Martin, R. L. Howard, G. S. Boland andG. D. Dennis. 1980. A case study of the effects of gas andoil production on artificial reef and demersal fish andmacrocrustacean communities in the northwestern Gulf ofMexico. Expo Chem 1980, Houston, Texas.
Gallaway, B. J. 1981. An ecosystem analysis of oil and gasdevelopment on the Texas-Louisiana continental shelf. U.S.Fish & Wildlife Service, Office of Biological Services, FWS/OBS-81/27, Washington, D.C.
Gallaway, B. J. 1998. Cumulative ecological significance of oiland gas structures in the Gulf of Mexico: informationsearch, synthesis, and ecological modeling. Phase I, FinalReport. U.S. Geological Survey, Biological Research Divi-sion, USGS/BRD/CR-1997–0006, Washington, D.C.
Gregory, R. S. and P. M. Powles. 1985. Chronology, distribu-tion, and sizes of larval fish sampled by light traps inmacrophytic Chemung Lake. Canadian Journal of Zool-ogy 63:2569–2577.
Herke, W. H. 1969. A boat-mounted surface push-trawl forsampling juveniles in tidal marshes. Progressive Fish-Culturist 31:177–179.
Hernandez, F. J., Jr. and D. G. Lindquist. 1999. A compari-son of two light-trap designs for sampling larval andpresettlement juvenile fish above a reef in Onslow Bay,North Carolina. Bulletin of Marine Science 64:173–184.
Hernandez, F. J., Jr., R. F. Shaw, J. S. Cope, J. G. Ditty, T.Farooqi and M. C. Benfield. 2003. The across-shelf lar-val, postlarval, and juvenile fish collected at offshore oiland gas platforms west of the Mississippi River Delta.Pages 39–72 in D. R. Stanley and A. Scarborough-Bull,editors. Fisheries, reefs, and offshore development. Ameri-can Fisheries Society, Symposium 36, Bethesda, Mary-land.
Hickford, M. J. H., and D. R. Schiel. 1999. Evaluation of theperformance of light traps for sampling fish larvae in in-
shore temperate waters. Marine Ecology Progress Series186:293–302.
Johannes, R. E. 1978. Reproductive strategies of coastal marinefishes in the tropics. Environmental Biology of Fishes3:65–84.
Keener, P., G. D. Johnson, B. W. Stander, E. B. Brothers and H.R. Beatty. 1988. Ingress of postlarval gag Mycteropercamicrolepis (Pisces: Serranidae), through a South CarolinaBarrier island inlet. Bulletin of Marine Science 42(3):376–396.
Kingsford, M. J., and J. H. Choat. 1989. Horizontal distribu-tion patterns of presettlement reef fish: are they influencedby the proximity to reefs? Marine Biology 101:285–297.
Kriete, W. H., Jr. and J. G. Loesch. 1980. Design and relativeefficiency of a bow-mounted pushnet for sampling juve-nile pelagic fishes. Transactions of the American FisheriesSociety 109:649–652.
Leis, J. M. 1991. The pelagic stage of reef fishes: the larvalbiology of coral reef fishes. Pages 183–230 in P. F. Sale,editor. The ecology of fishes on coral reefs. Academic Press,San Diego, California.
Lukens, R. R. 1981. Ichthyofaunal colonization of a new artifi-cial reef in the northern Gulf of Mexico. Gulf ResearchReports 7(1):41–46.
Magurran, A. E. 1988. Ecological diversity and its measure-ment. Princeton University Press, Princeton, New Jersey.
Marliave, J. B. 1986. Lack of planktonic dispersal of rockyintertidal fish larvae. Transactions of the American Fisher-ies Society 115:149–154.
McLellan, H. I. 1965. Elements of physical oceanography.Pergamon Press, Oxford, New York.
Moser, H. G., W. J. Richards, D. M. Cohen, M. P. Fahay, A.Kendall and S. L. Richardson, editors. 1984. Ontogenyand systematics of fishes. Special Publication Number 1.American Society of Ichthyologists and Herpetologists,Lawrence, Kansas.
Murphy, G. I. and R. I. Clutter. 1972. Sampling anchovylarvae with a plankton purse seine. Fishery Bulletin70(3):789–798.
Parker, R. O., Jr., D. R. Colby T. P. Willis. 1983. Estimatedamount of reef habitat on a portion of the U.S. SouthAtlantic and Gulf of Mexico continental shelf. Bulletin ofMarine Science 33:935–940.
Raynie, R. C., and R. F. Shaw. 1994. Ichthyoplankton abun-dance along a recruitment corridor from offshore spawn-ing to estuarine nursery ground. Estuarine, Coastal andShelf Science 39:421–450.
Reyns, N., and S. Sponaugle. 1999. Patterns and processes ofbrachyuran crab settlement to Caribbean coral reefs. Ma-rine Ecology Progress Series 185:155–170.
Robertson, D. R., D. G. Green, and B. C. Victor. 1988. Tem-poral coupling of production and recruitment of larvae ofa Caribbean reef fish. Ecology 69:370–381.
Robertson, D. R. 1991. The role of adult biology in the timingof spawning of tropical reef fishes. Pages 356–386 in P. F.Sale, editor. The ecology of fishes on coral reefs. AcademicPress, San Diego, California.
Rooker, J. R., G. D. Dennis, and D. Goulet. 1996. Samplinglarval fishes with a nightlight lift-net in tropical inshorewaters. Fisheries Research 26:1–15.

38 HERNANDEZ AND SHAW
SAS Institute, Inc. 1989. SAS/STAT users guide, version 6.Cary, North Carolina.
Schoener, T. W. 1970. Non-synchronous spatial overlap of liz-ards in patchy habitats. Ecology 51:408–418.
Secor, D. H., J. M. Dean, and J. Hansbarger. 1993. Modifica-tion of the quatrefoil light trap for use in hatchery ponds.Progressive Fish-Culturist 54:202–205.
Shenker, J. M., E. D. Maddox, E. Wishinski, A. Pearl, S.Thorrold, and N. Smith. 1993. Onshore transport ofsettlement-stage Nassau grouper Epinephelus striatus andother fishes in Exuma Sound, Bahamas. Marine EcologyProgress Series 98:31–43.
Sokal, R. R., and F. J. Rohlf. 1981. Biometry: the principles andpractice of statistics in biological research. Freeman, NewYork.
Sponaugle, S., and R. K. Cowen. 1996. Nearshore patterns ofcoral reef fish larval supply to Barbados, West Indies.Marine Ecology Progress Series 133:13–28.
SPSS, Inc. 1999. SYSTAT 9: getting started. SPSS, Inc., Chi-cago.
Stephens, J. S., Jr., P. A. Morris, D. J. Pondella, T. A. Koonceand G. A. Jordan. 1994. Overview of the dynamics of anurban artificial reef fish assemblage at King Harbor, Cali-fornia, USA, 1974–1991: a recruitment driven system.Bulletin of Marine Science 55(2–3):1224–1239.
Taggart, C. T., and W. C. Leggett. 1984. Efficiency of large-volume plankton pumps, and evaluation of a design suit-able for deployment from small boats. Canadian Journalof Fisheries and Aquatic Sciences 41:1428–1435.
Thorrold, S. R. 1992. Evaluating the performance of light trapsfor sampling small fish and squid in open waters of thecentral Great Barrier Reef lagoon. Marine Ecology ProgressSeries 89:277–285.
Thresher, R. E. 1984. Reproduction in reef fishes. T. F. H.Publications, Inc., Neptune City, New Jersey.
Victor, B. C. 1983. Recruitment and population dynamics of acoral reef fish. Science 219:419–420.
Victor, B. C. 1986. Larval settlement and juvenile mortality in arecruitment-limited coral reef fish population. EcologicalMonographs 56:145–160.