comparison of pedestrian data of single file movement
TRANSCRIPT

Comparison of Pedestrian Dataof Single File Movement Collectedfrom Controlled Pedestrian Experimentand from Field in Mass ReligiousGathering
Siddhartha Gulhare1 · Ashish Verma2 · Partha Chakroborty3
1 Department of Civil Engineering, Indian Institute of Science, Bangalore, India,E-mail: [email protected]
2 Department of Civil Engineering and Robert Bosch Centre for Cyber Physical Systems,Indian Institute of Science, Bangalore, India,E-mail: [email protected]
3 Department of Civil Engineering, Indian Institute of Technology Kanpur, Kanpur, India,E-mail: [email protected]
Received: 31 October 2017 / Accepted: 4 May 2018
DOI: 10.17815/CD.2018.16
Abstract Managing and controlling crowd during mass religious gathering is a challengefor organizers. With good computational capabilities, it is possible to create tools to sim-ulate crowd in real time to aid crowd management. These tools need to be first calibratedand validated with pedestrian empirical data. The empirical data collection from fieldis difficult and therefore, data collection through controlled pedestrian experiments havebecome a convenient substitute. However, the ability of experiment data to reproduceactual crowd behavior needs to be examined. This study compared the experiment datawith field data collected from mass religious gathering named Kumbh Mela held in India,2016. The single file movement (pedestrians moving along a single line; SFM) experi-ment was conducted and its results were compared with the field SFM results. The speedin the field was found to be generally higher than in the experiment for a given density.The results clearly indicate that the pedestrians in the field are motivated to achieve a pur-pose but participants in the experiments lack the motivation. The pedestrian dynamics ofthe experiment was found to be different from the field. Hence, the results of pedestrianexperiments should not be extrapolated to understand panic, crowd risk situations.
Collective Dynamics 3, A16:1–14 (2018) Licensed under

2 S. Gulhare · A. Verma · P. Chakroborty
Keywords Single file movement · mass religious gathering · controlled pedestrianexperiments
1 Introduction
Planning and designing of pedestrian facilities for safe and efficient movement of crowdin mass religious gatherings is a challenge to managers and planners. The traditional wayof designing such facilities and managing very large crowd, is generally based on experi-ence and therefore, a rule of thumb. There is a need to develop methods and algorithmsto manage such mass religious gatherings. Research on understanding pedestrian crowddynamics mainly include empirical and theoretical approach. A conceptual classificationof pedestrian crowd study is explained through a tree diagram in [1]. Many pedestriansimulation models have been developed; they can mainly be classified as macroscopic[2,3], microscopic [4–6] and mesoscopic [7]. With improvements in computational capa-bilities, it is possible to take live feed from CCTV cameras, drones, mobile GPS etc. andperform real time simulation to predict crowd dynamics for next few minutes or so. Likeall models, pedestrian simulation models must also be calibrated and validated. Manyempirical studies on pedestrian flow behavior in urban settings have been done in past.However, pedestrian data collection in field conditions in events such as mass religiousgatherings is very challenging, due to many reasons such as getting required permissionfor data collection, associated bureaucratic hurdle, presence of multiple layers of security,difficulty in positioning the camera in ideal location to collect required data etc. Ad-ditionally there are challenges such as adverse weather, logistics, inability to capture aparticular pedestrian flow phenomenon that is deemed relevant, etc. To overcome theseproblems, many researchers have shifted from field data collection to pedestrian experi-ments in controlled laboratory setup. The controlled experiments have the advantage offlexibility in controlling the influence variables and thus gives an opportunity to studythe impact of one causal factor over another by keeping all other factors neutral. In thepast decade, there has been a significant increase in the empirical data collection throughcontrolled experiments to understand pedestrian behavior; at bottleneck [8–14], in singlefile movement [15–21], during evacuation [22–24], during counter flow [25]. However,during experimental studies, participants have to perform very limited amount of physi-cal work for the assigned task and hence, they fail to imitate the physical exertion of thecrowd in the field. Further, for most studies, the emotional situation of the participants isrelaxed, so real effects are not shown [26]. It should also be taken into account that anyvariation in the instructions (given before the start of experiment) has potential to alterresults significantly. These studies are conducted with participants (students/researchers)and hence, do not completely account for heterogeneity in crowd. The experiments aremostly performed indoor in comfortable environment and hence, do not incorporate exter-nal conditions like weather, which play a significant role in the field conditions. Finally,the participants in a controlled experiment lack purpose; they move because they havebeen asked to, not because they have a goal to reach. It can be argued that the motivationand stress level of participants can be slightly increased by reward system [27–29]. But

Comparison of Pedestrian Data of Single File Movement 3
very less is known about how much stress can be induced through rewards. Therefore,how well experimental studies reproduce crowd behavior in real mass gatherings needto be examined. The study compares, mutatis mutandis, the pedestrian behavior impliedby data from controlled experiment and the behavior implied by field data from massreligious gathering. For this purpose, the simplest system of pedestrian movement, sin-gle file movement (SFM) was chosen. The field data is taken from the Mahakaleshwartemple during the Kumbh Mela-2016 in Ujjain. The Kumbh Mela is a religious fest andis considered to be the largest peaceful human gathering in the world. It is held, on anaverage, once in every three years with site rotating between four pilgrimage places inIndia: Haridwar, Allahabad, Nashik and Ujjain. Estimated 75 million people attended theKumbh Mela held in Ujjain in 2016. A very large number of people from various back-grounds (urban, rural, foreign, holy men) visit the Kumbh Mela, bringing high level ofheterogeneity in crowd. Such crowd brings mix of different pedestrian psychology withvarying level of aggression, patience, etc.
2 Controlled Single File Movement
Crowd dynamics is a complex phenomenon, which is affected by factors like passing ma-neuvers, self-organization, self-ordering (zipper effect), internal friction etc. [19]. To getan improved and simplified sight to the problem, a simple system of single file movementwith reduced degree of freedom was chosen. In recent years, many experimental studieshave been done to understand pedestrian single file movement. [19] observed a linear re-lationship between the space headway and speed. Comparison of fundamental diagramsbetween Indian and German culture was studied in [20] to understand how culture affectsthe walking behavior. [21, 30] carried out SFM experiment in China to investigate thecharacteristics of pedestrians. The experiments have not just been limited to the pedestri-ans, [31] compared the fundamental diagram of bicycle traffic with that of pedestrian andcar traffic in closed loop circuit. The next section discusses the experimental setup for aSFM study.
2.1 Experimental Setup
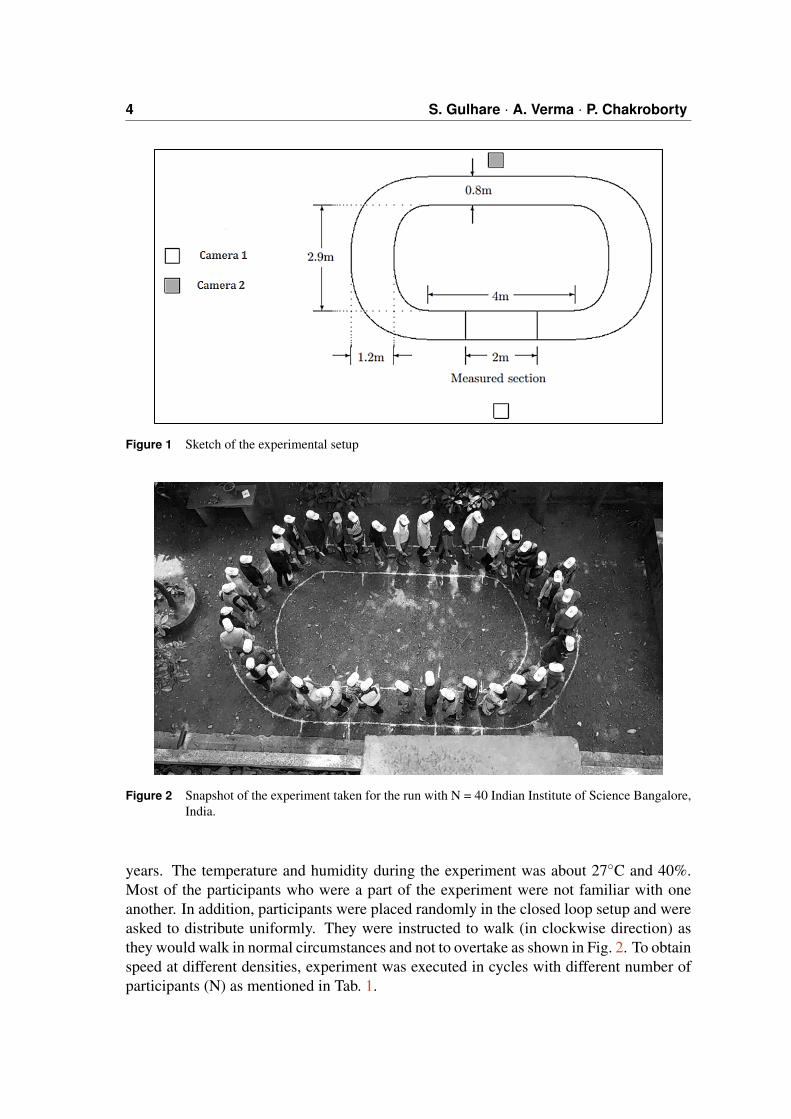
The same corridor setup for the SFM as adopted in [19, 20], was chosen as shown inFig. 1. The length of the corridor (close loop) is lp = 17.3 m and that of the measuredsection is lm = 2 m. The width of the straight portion is 0.8 m, which is believed to besufficient for SFM. The width of the curved section was increased to a maximum 1.2 mthrough elliptical transition curve. Two cameras were set up to capture the movement ofthe participants as shown in Fig. 1. Camera 1 was placed along the perpendicular bisectorof the measured section at a distance of 10 m to avoid parallax error. Camera 2 was placedin the adjacent building to cover top view of corridor. For this study, data was collectedmanually from camera 1.
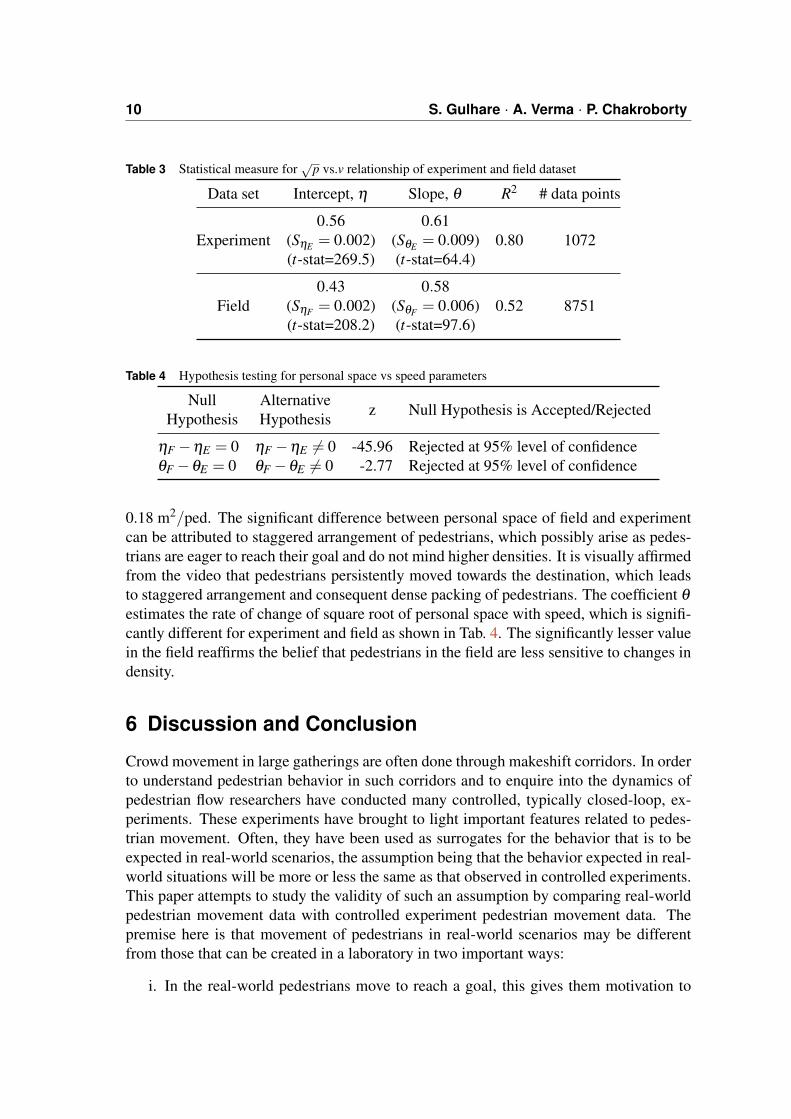
The controlled experiment was conducted in October 2016 at Indian Institute of ScienceBangalore, India, which involved 40 participants belonging to the age group of 25-50
4 S. Gulhare · A. Verma · P. Chakroborty
Figure 1 Sketch of the experimental setup
Figure 2 Snapshot of the experiment taken for the run with N = 40 Indian Institute of Science Bangalore,India.
years. The temperature and humidity during the experiment was about 27◦C and 40%.Most of the participants who were a part of the experiment were not familiar with oneanother. In addition, participants were placed randomly in the closed loop setup and wereasked to distribute uniformly. They were instructed to walk (in clockwise direction) asthey would walk in normal circumstances and not to overtake as shown in Fig. 2. To obtainspeed at different densities, experiment was executed in cycles with different number ofparticipants (N) as mentioned in Tab. 1.

Comparison of Pedestrian Data of Single File Movement 5
Table 1 Description of number of run for different number of participants
No of participants 5 10 15 20 30 40
Cycles 6 6 6 6 4 3
Figure 3 Schematic diagram of the Mahakaleshwar temple (field) SFM Setup
Figure 4 Screenshot of SFM in the Mahakaleshwar temple (field). Second corridor from left (enclosed indotted line) is studied

6 S. Gulhare · A. Verma · P. Chakroborty
3 Field Setup – Mahakaleshwar Temple
The Mahakaleshwar temple is a very important temple in the city of Ujjain, India andwas one of the most important attractions during the Kumbh Mela-2016. It was visitedby almost all pilgrims visiting the Kumbh Mela during its period from 22nd April to 21stMay 2016. Outside the entrance of temple, straight corridors were installed to allow SFMtowards the temple. Pedestrians had to walk through these corridors for approximately90 m before entering into the temple premises from gate as schematically illustrated inFig. 3. Though the corridors were well delineated, they seemed to have a lot of impactfrom the sides (since, the corridors folded over one another) as shown in Fig. 4. A CCTVcamera (capturing top view of movement) was installed at approximately 20 m from thebeginning of SFM. Among the four corridors, the second from the left with a width of 0.8m (same as width of experimental setup) was chosen for study. The length of study area invideo footage was 2.8 m. The field setup was different from experimental setup in someaspects such as presence of strong railings of height 0.9 m separating corridors (shown inFig. 4). Pedestrians had to pass through the corridor only once to enter the temple andhad to exit from the other side, unlike experimental setup where participants had to walkin endless loop. The temperature and humidity of field was about 40◦ and 30%, howeverthe corridor was covered from top. The video duration of 2 hours and 50 minutes wasanalyzed in which 6929 pedestrians passed through the measured study section.
4 Data Collection
Vertical lines were annotated in the video to record the entry and exit time of each pedes-trian. The entry and exit time provides the time taken to pass the measured section, whichhelps in calculating the speed of individuals. Since, there can be only (1-6) participantsinside the measured area in the experiment, the classical density can take only very lim-ited discrete values and hence, the enhanced linear density as calculated using equation 1of [19]. Further area density was calculated by dividing linear density by width. Similarapproach was used in the field data. The entry-exit time of each pedestrian was recordedfrom video footage by taking head of the pedestrian as the reference. The height of eachpedestrian was recorded as short, medium and tall. In addition, appropriate correction forvarying height was applied in entry and exit time.
5 Data Analysis and Comparison of Results
The difference in the style of walking in both the setup is illustrated in Fig. 5. In boththe systems, pedestrians were free to use full provided space. In the field, small propor-tion of overtaking was observed, however, pedestrians were asked not to overtake in theexperimental setup. The movement of pedestrians in the field was observed to be moreunordered.

Comparison of Pedestrian Data of Single File Movement 7
Figure 5 Illustration to show the difference in arrangement of pedestrians in SFM between experimentalsetup and field at the Mahakaleshwar temple
Table 2 Statistical measures for speed-area density relationship for experiment and field dataset
Data set Intercept, γ Slope, β R2 # data points
ExperimentγE = 0.78
(SγE = 0.019)(t-stat=40.53)
βE = 1.07(SβE = 0.010)(t-stat=103.13)
0.91 1072
FieldγF = 0.21
(SγF = 0.010)(t-stat=21.44)
βF = 0.42(SβF = 0.004)(t-stat=117.48)
0.61 8751
5.1 Speed vs. Density Relationship
The relationship between speed and density is used to quantitatively analyze the pedes-trian facility. The interquartile graph of speed - area density for the field data and the ex-periment data are plotted in Fig. 6 (The behavior represented by the various interquartilegraphs with different bin size and bin position were found to be similar.). The importantsubjective observation that can be made here is that relationship is not linear for both dataset. It can be observed that speed is higher in field data than in experiment data for ev-ery density region (except for very low-density region). The rate of change of speed is

8 S. Gulhare · A. Verma · P. Chakroborty
Figure 6 Speed-density data from field and experiment data
slightly higher in the experiment than in the field for density values less than 2ped/m2.For density values higher than 2ped/m2, participants have nearly seized to walk in theexperiment, while pedestrians in the field continued to move forward. The exponentialcurve, v = αe−βd is fitted on the data sets, where v is the speed, d is the density and β
represents the decay rate, i.e. the rate of change of speed with respect to density is β
times the current value of speed. In order to apply linear regression analysis, the equationis transformed to lnv = γ−βd, where γ is natural log of α . The details of the parametersand test statistics are presented in Tab. 2.
As shown in Tab. 2, for experiment (βE) is -1.07 and in field (βF ) is −0.42. Thestandard error values for β is SβE = 0.010 for experiment and SβF = 0.004 for field. Thehypothesis that decay rate of speed (β ) obtained from experiment and field are the same(Null hypothesis H0 : βF−βE = 0 and alternate hypothesis H1 : βF−βE 6= 0) was tested.Since number of data points are large
z =βF −βE√S2
βF +S2βE
(1)
is assumed to have normal distribution. From the above expression, z value calculated is60.35, which is more than zcritical = 1.96 at 95% confidence interval for two tailed testand therefore null hypothesis has been rejected. The decay rate from experiment and fieldare significantly different. It can concluded that participants in the experiment lacks the

Comparison of Pedestrian Data of Single File Movement 9
motivation and had no reasons to go beyond their comfort limits. However, in the field,pedestrians have a goal to achieve and therefore despite impedance they continue to pressforward (at reasonable speeds) even at higher densities.
5.2 Personal Space vs. Speed Relationship
The relationship between personal space (p) and speed (v) is not linear but close toparabolic in shape as shown in Fig. 7. Personal space, i.e. inverse of area density, waschosen because pedestrians were free to use full width in the setups. It was felt that inkeeping with earlier analysis, where distance headway has been used and also realizingthat longitudinal distance is more important to pedestrians, the analysis uses square rootof personal space (p) as explained variable. One may think of
√p as longitudinal distance
between pedestrians (assuming the personal space can be approximated as a square). It isproposed, for the sake of simplicity, that
√p = η +θv , where η denotes the square root
of personal space of pedestrian when stationary and θ denotes the rate of change of squareroot of personal space with respect to speed. To remove heteroscedasticity, weighted leastsquare regression was performed. Details of parameters and test statistics are presentedin Tab. 3.
Figure 7 Speed-personal space relation for field and experiment data
The result of hypothesis testing (to test if parameters intercept and slope are same) arepresented in Tab. 4, which indicates there is significant difference. The estimated personalspace when stationary (η2) for experiment is 0.31 m2/ped and for field is
10 S. Gulhare · A. Verma · P. Chakroborty
Table 3 Statistical measure for√
p vs.v relationship of experiment and field dataset
Data set Intercept, η Slope, θ R2 # data points
Experiment0.56
(SηE = 0.002)(t-stat=269.5)
0.61(SθE = 0.009)(t-stat=64.4)
0.80 1072
Field0.43
(SηF = 0.002)(t-stat=208.2)
0.58(SθF = 0.006)(t-stat=97.6)
0.52 8751
Table 4 Hypothesis testing for personal space vs speed parameters
NullHypothesis
AlternativeHypothesis z Null Hypothesis is Accepted/Rejected
ηF −ηE = 0 ηF −ηE 6= 0 -45.96 Rejected at 95% level of confidenceθF −θE = 0 θF −θE 6= 0 -2.77 Rejected at 95% level of confidence
0.18 m2/ped. The significant difference between personal space of field and experimentcan be attributed to staggered arrangement of pedestrians, which possibly arise as pedes-trians are eager to reach their goal and do not mind higher densities. It is visually affirmedfrom the video that pedestrians persistently moved towards the destination, which leadsto staggered arrangement and consequent dense packing of pedestrians. The coefficient θ
estimates the rate of change of square root of personal space with speed, which is signifi-cantly different for experiment and field as shown in Tab. 4. The significantly lesser valuein the field reaffirms the belief that pedestrians in the field are less sensitive to changes indensity.
6 Discussion and Conclusion
Crowd movement in large gatherings are often done through makeshift corridors. In orderto understand pedestrian behavior in such corridors and to enquire into the dynamics ofpedestrian flow researchers have conducted many controlled, typically closed-loop, ex-periments. These experiments have brought to light important features related to pedes-trian movement. Often, they have been used as surrogates for the behavior that is to beexpected in real-world scenarios, the assumption being that the behavior expected in real-world situations will be more or less the same as that observed in controlled experiments.This paper attempts to study the validity of such an assumption by comparing real-worldpedestrian movement data with controlled experiment pedestrian movement data. Thepremise here is that movement of pedestrians in real-world scenarios may be differentfrom those that can be created in a laboratory in two important ways:
i. In the real-world pedestrians move to reach a goal, this gives them motivation to

Comparison of Pedestrian Data of Single File Movement 11
move; while in the laboratory they move because they have been asked to. Thereare some scientific studies that have argued that this limitation of laboratory ex-periments can possibly be overcome by introducing very high incentives for thesubjects, however, more studies are required to scientifically establish the same.
ii. feelings of excitement, apprehension, fatigue, etc. present in real-world situationsare difficult, although not impossible, to inculcate in laboratory settings.
Data collected from a 2.8 m section of a few km long route leading to the Mahakalesh-war temple during the Kumbh Mela-2016, Ujjain, India (where estimated 75 million per-sons congregate over 30 days) is used as the real-world data. Data from 2 m long sectionof a controlled experiment on a 17.3 m long closed loop corridor in IISc Bangalore isused as the laboratory experiment data. Statistical analysis using these extensive data setsclearly indicate that there are significant differences in the pedestrian flow patterns.
This study brings up the need for more research on ascertaining effectiveness and ap-plicability of controlled experiments in representing a real-world scenario. While thecontrolled experiments do give the analyst and planner an idea of the pedestrian behavior,its divergence from the actual behavior can be significant. Further, real-world scenariosalso vary from controlled scenarios in few other ways. For example, the two scenariosdiffer in terms of (i) the crowd heterogeneity in religious gatherings (gender, age, socio-economic background, etc.), (ii) the fact that many travel in groups (and these groupsare of different sizes), and (iii) the observations that often pedestrians, especially thosefrom rural areas, carry headload. Although, one can argue that controlled experimentscan be designed to account for these, however, so far it has not been reported in the lit-erature. Even, the experiments carried out as part of this work could not include these,as it was found difficult to create such a heterogeneous mix with different group sizesand headloads. The urgency and stress level can be slightly enhanced by introducing re-ward system, which may improve the realism of experiment. However, this study did notincorporate the reward system because there is still not clear evidence as to what levelof reward may be effective and whether induced stress or motivation to earn the offeredreward during experiment can recreate real world scenarios (such as the excitement ofpilgrims visiting holy place during very auspicious occasion or genuine fear of groupmembers when they are separated or panic of crowd evacuating a burning building etc.).In addition, the experiment was conducted with an open boundary whereas the field setuphad a closed boundary. This may have an influence on the results to some extent and isworth further research.
It is felt that theories of pedestrian motion that will ultimately lead to simulation toolsfor studying and predicting crowd dynamics need to be built, calibrated and validatedusing observations from real-world streams, to the extent possible. Controlled laboratoryexperiments can provide insights but whether they can replace real-world data is doubtfuland needs further investigation.
Acknowledgements The work reported in this paper is part of the project titled “The KumbhMela Experiment: Measuring and Understanding the Dynamics of Mankinds largest crowd”,

12 S. Gulhare · A. Verma · P. Chakroborty
funded by the Ministry of Electronics and IT Ministry of Communication and Information Tech-nology, Government of India (MITO-0105), Netherlands Organization for Scientific Research,NWO (Project No. 629.002.202), Department of Science and Technology, Russian Ministry ofEducation, and Robert Bosch Center for Cyber Physical Systems, Indian Institute of Science,Bangalore.
References
[1] Shi, X., Ye, Z., Shiwakoti, N., Li, Z.: A Review of Experimental Studies on ComplexPedestrian Movement Behaviors, pp. 1081–1096. Proc. of 15th COTA Int. Conf. ofTransp. (2015). doi:10.1061/9780784479292.101
[2] Henderson, L.F.: The statistics of crowd fluids. Nature 229(5284), 381–383 (1971)
[3] Helbing, D.: A fluid dynamic model for the movement of pedestrians. ComplexSystems 6, 391–415 (1992)
[4] Helbing, D., Molnar, P.: Social force model for pedestrian dynamics. Phys. Rev. E51, 4282–4286 (1995). doi:10.1103/PhysRevE.51.4282
[5] Blue, V., Adler, J.: Cellular automata microsimulation of bidirectional pedestrianflows. Transportation Research Record: Journal of the Transportation ResearchBoard 1678, 135–141 (1999). doi:10.3141/1678-17
[6] Okazaki, S., Matsushita, S.: A study of simulation model for pedestrian movementwith evacuation and queuing. In: Smith, R.A., Dickie, J.F. (eds.) International Con-ference on Engineering for Crowd Safety, pp. 271–280 (1993)
[7] AlGadhi, S.A.H., Mahmassani, H.S.: Simulation of crowd behavior and movement:Fundamental relations and application. Transp. Res. Rec. 1320, 260–268 (1991)
[8] Daamen, W., Hoogendoorn, S.: Experimental research of pedestrian walking behav-ior. Transportation Research Record: Journal of the Transportation Research Board1828, 20–30 (2003). doi:10.3141/1828-03
[9] Duives, D., Daamen, W., Hoogendoorn, S.: Anticipation behavior up-stream of a bottleneck. Transportation Research Procedia 2, 43–50 (2014).doi:https://doi.org/10.1016/j.trpro.2014.09.007. The Con-ference on Pedestrian and Evacuation Dynamics 2014 (PED 2014), 22-24 October2014, Delft, The Netherlands
[10] Hoogendoorn, S.P., Daamen, W.: Pedestrian behavior at bottlenecks. TransportationScience 39(2), 147–159 (2005). doi:10.1287/trsc.1040.0102
[11] Kretz, T., Grunebohm, A., Schreckenberg, M.: Experimental study of pedestrianflow through a bottleneck. Journal of Statistical Mechanics: Theory and Experiment2006(10), P10014 (2006)

Comparison of Pedestrian Data of Single File Movement 13
[12] Seyfried, A., Steffen, B., Winkens, A., Rupprecht, T., Boltes, M., Klingsch, W.:Empirical data for pedestrian flow through bottlenecks. In: Appert-Rolland, C.,Chevoir, F., Gondret, P., Lassarre, S., Lebacque, J.P., Schreckenberg, M. (eds.) Traf-fic and Granular Flow ’07, pp. 189–199. Springer Berlin Heidelberg, Berlin, Heidel-berg (2009)
[13] Seyfried, A., Boltes, M., Kahler, J., Klingsch, W., Portz, A., Rupprecht, T., Schad-schneider, A., Steffen, B., Winkens, A.: Enhanced empirical data for the fundamen-tal diagram and the flow through bottlenecks. In: Klingsch, W.W.F., Rogsch, C.,Schadschneider, A., Schreckenberg, M. (eds.) Pedestrian and Evacuation Dynamics2008, pp. 145–156. Springer Berlin Heidelberg, Berlin, Heidelberg (2010)
[14] Seyfried, A., Passon, O., Steffen, B., Boltes, M., Rupprecht, T., Klingsch, W.: Newinsights into pedestrian flow through bottlenecks. Transportation Science 43(3),395–406 (2009). doi:10.1287/trsc.1090.0263
[15] Cao, S., Zhang, J., Salden, D., Ma, J., Shi, C., Zhang, R.: Pedestrian dynamics insingle-file movement of crowd with different age compositions. Phys. Rev. E 94,012312 (2016). doi:10.1103/PhysRevE.94.012312
[16] Fang, J., Qin, Z., Hu, H., Xu, Z., Li, H.: The fundamental di-agram of pedestrian model with slow reaction. Physica A: Sta-tistical Mechanics and its Applications 391(23), 6112–6120 (2012).doi:https://doi.org/10.1016/j.physa.2012.07.005
[17] Fang, Z.M., Song, W.G., Liu, X., Lv, W., Ma, J., Xiao, X.: A continuous distancemodel (CDM) for the single-file pedestrian movement considering step frequencyand length. Physica A: Statistical Mechanics and its Applications 391(1), 307–316(2012). doi:https://doi.org/10.1016/j.physa.2011.08.009
[18] Jelic, A., Appert-Rolland, C., Lemercier, S., Pettre, J.: Properties of pedestri-ans walking in line: Fundamental diagrams. Phys. Rev. E 85, 036111 (2012).doi:10.1103/PhysRevE.85.036111
[19] Seyfried, A., Steffen, B., Klingsch, W., Boltes, M.: The fundamental diagram ofpedestrian movement revisited. Journal of Statistical Mechanics: Theory and Ex-periment 2005(10), P10002 (2005)
[20] Chattaraj, U., Seyfried, A., Chakroborty, P.: Comparison of pedestrian fundamentaldiagram across cultures. Advances in Complex Systems 12(03), 393–405 (2009).doi:10.1142/S0219525909002209
[21] Liu, X., Song, W., Zhang, J.: Extraction and Quantitative analysis of Micro-scopic Evacuation Characteristics based on Digital Image Processing. Phys-ica A: Statistical Mechanics and its Applications 388(13), 2717–2726 (2009).doi:https://doi.org/10.1016/j.physa.2009.03.017

14 S. Gulhare · A. Verma · P. Chakroborty
[22] Isobe, M., Helbing, D., Nagatani, T.: Experiment, theory, and simulation ofthe evacuation of a room without visibility. Phys. Rev. E 69, 066132 (2004).doi:10.1103/PhysRevE.69.066132
[23] Schadschneider, A., Seyfried, A.: Validation of CA models of pedestrian dynam-ics with fundamental diagrams. Cybernetics and Systems 40(5), 367–389 (2009).doi:10.1080/01969720902922400
[24] Zhang, J., Song, W., Xu, X.: Experiment and multi-grid mod-eling of evacuation from a classroom. Physica A: Statisti-cal Mechanics and its Applications 387(23), 5901–5909 (2008).doi:https://doi.org/10.1016/j.physa.2008.06.030
[25] Isobe, M., Adachi, T., Nagatani, T.: Experiment and simulation of pedestriancounter flow. Physica A: Statistical Mechanics and its Applications 336(3), 638–650 (2004). doi:https://doi.org/10.1016/j.physa.2004.01.043
[26] Koshi, M., Iwasaki, M., Ohkura, I.: Some findings and an overview on vehicularflow characteristics. In: Proceedings of the 8th International Symposium on Trans-portation, pp. 403–426 (1983)
[27] Muir, H.C., Bottomley, D.M., Marrison, C.: Effects of motivation andcabin configuration on emergency aircraft evacuation behavior and rates ofegress. The International Journal of Aviation Psychology 6(1), 57–77 (1996).doi:10.1207/s15327108ijap0601 4
[28] Mintz, A.: Non-adaptive group behavior. The Journal of Abnormal and Social Psy-chology 46(2), 150–159 (1951)
[29] Daamen, W., Hoogendoorn, S.: Capacity of doors during evac-uation conditions. Procedia Engineering 3, 53–66 (2010).doi:https://doi.org/10.1016/j.proeng.2010.07.007. FirstInternational Conference on Evacuation Modeling and Management
[30] Tian, W., Song, W., Ma, J., Fang, Z., Seyfried, A., Liddle, J.: Ex-perimental study of pedestrian behaviors in a corridor based ondigital image processing. Fire Safety Journal 47, 8–15 (2012).doi:https://doi.org/10.1016/j.firesaf.2011.09.005
[31] Zhang, J., Mehner, W., Andresen, E., Holl, S., Boltes, M., Schadschneider, A.,Seyfried, A.: Comparative analysis of pedestrian, bicycle and car traffic movingin circuits. Procedia - Social and Behavioral Sciences 104, 1130–1138 (2013).doi:https://doi.org/10.1016/j.sbspro.2013.11.209. 2nd Con-ference of Transportation Research Group of India (2nd CTRG)