comparison of acoustic and electrical image logs from the · comparison of acoustic and electrical...
TRANSCRIPT

PROCEEDINGS, Thirtieth Workshop on Geothermal Reservoir Engineering Stanford University, Stanford, California, January 31-February 2, 2005 SGP-TR-176
COMPARISON OF ACOUSTIC AND ELECTRICAL IMAGE LOGS FROM THE COSO GEOTHERMAL FIELD, CA
NICHOLAS C. DAVATZES AND STEVE HICKMAN
U.S. Geological Survey, Menlo Park, CA, 94025
e-mail: [email protected]
ABSTRACT
Electrical and acoustic image logs collected from well 58A-10 in crystalline rock on the eastern margin of the Coso Geothermal Field, CA, reveal different populations of planar structures intersecting the borehole. Electrical image logs appear to be sensitive to variations in mineralogy, porosity, and fluid content that highlight both natural fractures and rock fabrics. These fabric elements account for about 50% of the total population of planar structures seen in the electrical image log, but locally approach 100%. This fabric is unlikely to contribute to permeability in the reservoir. Acoustic image logs reveal a similar natural fracture population, but generally image slightly fewer fractures, and do not reveal rock fabric. Both logs also record textural properties of deformed materials within fractures; these textures can be related to variations in mineralogy, alteration, or porosity using the electrical log and can be used to infer slip history. In addition, locations of high fracture density occur adjacent to major faults, but also occur as zones confined within intervals of distinct rock type. The acoustic image logs collected in Well 58A10 reveal large numbers of drilling-induced borehole wall tensile fractures and breakouts. In addition, previously un-recognized drilling-induced petal-centerline fractures are evident in images of the borehole wall from this well. These features are thought to form just ahead of the drill bit and provide additional constraint on the orientation of the minimum horizontal stress. Both breakouts and petal-centerline fractures are difficult to identify in electrical image logs because of the low percentage of the borehole wall imaged. Analysis of induced structures in acoustic image logs indicates that the minimum horizontal stress is oriented along an azimuth of 102º±18º. This orientation is consistent with the local strike of the Coso Wash normal fault that bounds the basin containing well 58A-10.
INTRODUCTION
Electrical and acoustic image logging tools provide an invaluable opportunity to characterize the fracture populations that typically control fluid flow in geothermal systems. However, these tools detect fractures by measuring different properties of the borehole wall. Fractures interpreted from electrical image logs are identified by contrasts in conductivity between the fracture and the adjacent borehole wall. By contrast, fractures in acoustic image logs are associated with changes in borehole wall surface roughness or acoustic reflectivity. In both types of logs, fractures with the largest apparent apertures are often—but not always—observed to dominate subsurface fluid flow in geothermal fields (Barton et al., 1998; Sheridan and Hickman., 2004). Similarly, other properties affecting subsurface permeability such as rock type variation, foliation, and potential hydrothermal alteration can also be detected through these methods. Stress concentrations associated with drilling and the introduction of the borehole can produce structures such as petal-centerline fractures (Kulander et al., 1990; Lorenz et al., 1990), borehole wall tensile fractures and breakouts (Moos and Zoback, 1990). These structures are directly related to the current stress state and can be used to infer the orientations of the principal stresses. Small-scale rotations of the principal stresses revealed by changes in orientation of these structures can also indicate which faults have recently slipped. Currently slipping fractures, or those well oriented for slip in the current stress state, typically comprise the majority of permeable fractures in crystalline rocks (Barton et al., 1995; Barton et al., 1998; Sheridan and Hickman, 2004). In this study, we analyzed populations of natural and induced fractures from well 58A-10 (Figure 1) in the Coso Geothermal Field using both electrical and acoustic image logs to: (1) determine how geologic features detected by each technique differ, (2) determine each technique’s effectiveness in inferring the local stress state from drilling induced structures,
1

(3) relate natural fracture populations to the local state of stress and rock type variation, and (4) evaluate the use of these techniques for interpreting fracture-dominated fluid flow in geothermal systems.
GEOLOGIC SETTING
The Coso Geothermal Field is located along the western edge of the Eastern California Shear Zone, subjected to both strike slip and Basin and Range style normal faulting (Figure 1a). Unruh et al. (2002) suggested that Coso lies within the right (releasing) step between the right lateral Owens Valley fault to the north and the Airport Lake fault to the south. The field sits above a shallow heat source presumed to be a partially molten magma body as shallow as 4-5 km depth (Wicks et al., 2001). Well 58A-10 is located in Coso Wash adjacent to the exploited geothermal field (Figure 1b), but outside
the region impacted by current production or injection. We analyzed both acoustic and electrical image logs from a measured depth of about 6800 to 10238 ft through diorite, quartz diorite, and granodiorite. In addition to providing a better understanding of image logging methods in geothermal wells, the analysis of fractures crossed by this well and the local state of stress inferred from drilling-induced structures provides a basis for comparison with the adjacent producing geothermal field. Previous studies in other Coso wells, such as 38C-9, have been based on the interpretations of electrical image logs. Thus this comparison between electrical and acoustic image logging methods also provides a necessary benchmark for the interpretation of these different data sets. In particular, this study will help combine insights from both techniques in preparation for the stimulation of well 34-9RD2 as part of the Enhanced Geothermal Systems (EGS) experiment in the Coso Geothermal Field.
Figure 1: (a) Tectonic map of southern portion of Eastern California Shear zone modified from Unruh et al. (2002). (b) Simplified geologic map of basement crystalline rocks in the Coso Geothermal Field. Faults of different ages are shown, as are measured orientations of the minimum horizontal stress (Shmin) from induced structures in well 58A-10 and based on observations by Sheridan and Hickman (2003) from wells 83-16, 38B-9, 38C-9, and 38A-9.
2

IMAGE LOGGING METHODS
Electrical image logs were obtained in well 58A-10 using Schlumberger’s Hot Hole Formation Micro-Scanner tool (FMS) that has been used extensively throughout the Coso Geothermal Field. Electrical images are produced by placing pads with arrays of electrodes maintained at a constant electrical potential against the borehole wall, and measuring the current drop as the electrodes travel along the borehole wall (Ekstrom et al., 1987). Data from multiple electrodes are combined to produce electrical conductivity images. Because a current is being passed into the borehole wall, this technique actually measures the properties of a volume of rock within a few inches of the borehole wall. The azimuthal coverage of the image and its resolution is determined by the size and number of electrodes, their arrangement, the pad dimensions, and the borehole diameter. Resolution approaching 5 mm was attained in well 58A-10 with the FMS tool, and the image spanned about 40% of the borehole circumference within four equally spaced strips. Overall image quality is strongly related to pad contact and thus is sensitive to borehole shape and roughness, and to mud cake (Hearst et al., 2000). This tool can operate at temperatures up to 200° C for up to 1 hour, with longer operating times at lower temperatures. The acoustic log used in this study was produced by a new state-of-the-art borehole televiewer (BHTV) built by Applied Logic Technologies (ALT) under joint funding from the Department of Energy and Navy Geothermal Program Office in collaboration with Sandia National Lab and the U.S. Geological Survey. The new BHTV is specifically designed for use in geothermal wells up to 300°C can operate at temperatures of 275°C for approximately 12 hours. This study combines results from two BHTV tools from ALT, the ABI85 which includes a combined temperature sensor, and the prototype Acoustic image logs are produced by bouncing an ultrasonic acoustic pulse from the borehole wall (Zemaneck et al., 1970). The tool uses a transducer that both emits and records the acoustic pulse. The travel time of the pulse from the transducer to the wall and back indicates the dimensions of the borehole and the relative position of the tool. The energy of the returning pulse, recorded as amplitude, is a function of the degree of scattering of the pulse due to the borehole shape and rugosity as well as the acoustic impedance contrast between the borehole fluid and wall. Complete azimuthal scans of the borehole wall are composed of 72, 144, or 288 acoustic pulses directed by a rotating mirror.
ABI88. Each pulse has an optimal footprint of 5 to 7 mm. Two images are available for analysis: (1) two-way travel time (proportional to borehole radius) and (2) amplitude. Image quality is sensitive to borehole shape and tool position. Smooth, cylindrical boreholes with a well-centered tool return maximum acoustic energy because of the resulting high incidence angle and low scattering of the acoustic beam. Departures from this ideal degrade the image quality. BHTV logs were collected in 58A-10 with vertical pixel dimensions of 5 to 7 mm and azimuthal pixel dimensions of 2.5°,about 3.5 mm. BHTV image logs were processed using two different programs: WellCadTM by ALT and ImagerTM by Geomechanics International (GMI). During FMS and BHTV log analysis we distinguished drilling-induced structures, natural fractures, rock fabric, rock type transitions, and indications of alteration wherever possible. The orientation of structures in both types of image logs was measured interactively within ImagerTM. In addition, we ranked the quality of natural fracture, fabric, and rock type transitions on a scale from A to C. A indicates the highest quality, least ambiguous pick which occurs in locations of good overall image quality, continuous fracture trace across the borehole and clearly defined orientation. Structures assigned a quality ranking of C required greater interpretation, usually resulting from connecting discontinuous or ambiguous line segments to define the structure trace. Conservative picking in this study probably underestimates the total number of fractures, but leads to a more reliable orientation analysis and relative distribution of structures. For high quality fracture picks we also measured the apparent aperture, or thickness of the feature, in the image of the borehole wall. To ensure an unbiased comparison of results from each image log, structures were initially picked independently in each log and subsequently followed up with detailed comparison. Interpreted image logs were cross-referenced with the cuttings log to correlate overall image log character with rock type. Future work includes incorporation of temperature and magnetic field strength recorded by the ABI85 into our structural and lithologic interpretations.
IMAGE LOG ANALYSIS AND COMPARISON
Natural fractures and fault rock texture Planar fractures appear as sine waves when the 360º borehole images are unwrapped onto a flat plane. Fractures with large apparent aperture and distinct from neighboring fractures are easy to pick using both FMS and BHTV logs. However, in cases where
3

the fracture is slightly non-planar, or in locations of high fracture density, it becomes difficult to reliably pick fractures in the FMS because of incomplete azimuthal imaging. For the same reason crosscutting and abutting relations are far harder to distinguish in the FMS than in the BHTV. However, where large faults are evident from observations in the FMS log or cuttings log, or where caliper data suggests widening of the borehole, the BHTV typically provides poorer image quality than the FMS due to data loss resulting from scattering of the signal along rough borehole walls.
In well 58A-10 both types of image logs revealed natural fractures with varying thickness or slightly non-planar geometry (Figure 2). For example, the fracture visible at center-depth in Figures 2a, b, and c has a large asperity along its surface. The basal trace is the most nearly sinusoidal, and successively less planar segments (less sinusoidal) in the un-wrapped image are associated with the “descending” limb of the sinusoid. The shape of the asperity suggests successive opening or shearing along multiple surfaces, possibly representing multiple crack-seal events (Figure 2d). Either geometry indicates apparent extension consistent with oblique normal slip across this fracture (Figure 2e). This geometry is similar to core from well 64-16 (Figure 1) from the East Flank of the field (Figure 2f), which contains multiple shear zones of foliated chlorite-smectite surrounded by brecciated host rock. The BHTV clearly reveals fine scale geometry of the structure in Figure 2. The FMS log reveals less of the internal structure, but indicates variation in the conductivity of the fracture where more resistive zones are bright and more conductive zones toward the margins of the fracture are dark. In the BHTV image the locations corresponding to higher conductivity coincide, with signal loss (white areas in the travel time data) indicating a rough or recessed surface. Both the variation in the loss of data and varying conductivity indicate heterogeneous physical properties within the fracture that might be related to porosity production accompanying slip, the distribution of minerals with different conductivity,
Figure 2: Natural fractures in BHTV (a)amplitude, (b) travel time, and (c) FMS image logs from a measured depth of 9857 ft. The BHTV and FMS logs are oriented with respect to magnetic North (MN) and true (TN), respectively, with a magnetic declination at this site of 14ºE. Each image progresses from North, then through East, South, West, and back to North. (d) Sketch of natural fracture geometry and texture of fault rock seen in Figures 1a through 1c. (e) Stereogram of natural fracture colored red in (d). The gray arrows indicate the dilation direction inferred from the texture of the natural fracture. (f) Similar geometry to (a-d) is visible in core from 990 ft measured depth in well 64-16 (Figure 1). In this figure and all subsequent figures brighter images in the BHTV amplitude indicate greater signal strength and in two-way travel time indicate shorter times. Brighter images in FMS indicate lower conductivity. White in travel time data indicates signal loss.
Figure 3: BHTV amplitude and FMS image logs of intervals containing two transitions in rock type indicated by changes in image log character and changing depth of wear caused by rubbing of the drill string (tool marks). The upper rock type contains a foliation, which is only visible in the FMS log and is similar to fabric visible in core from well 64-16.
4

Figure 4: Plots of rock type variation indicated by the cuttings log and changes in image log character (as in Figure 3), natural fracture frequency, fabric frequency and true fabric orientation corrected for borehole deviation in the logged interval of well 58A-10 from 6820 to 10238 ft. Alteration was logged from the cuttings during drilling as part of the cuttings log.
5

or preferential erosion of the fracture and adjacent wall rock during drilling.
Rock type and rock properties Both image logs show changes in image log character, image quality, and pipe-wear along the borehole wall that occur across abrupt near-planar transitions. Transitions that separate large (10’s of m) depth intervals of distinct image log character coincide with changes in rock type indicated by the cuttings log. Smaller depth intervals distinguished by distinct image log character in both BHTV and FMS (Figure 3) are not associated with distinct changes in cuttings mineralogy. However, as shown here, the depth of pipe-wear visible in BHTV images often
changes abruptly across such transitions, and qualitatively indicates differences in rock hardness or abrasion resistant. The FMS does not clearly distinguish the change in pipe-wear (although in some cases it might be detectable from the associated caliper log), but does suggest different conductivity of the borehole wall in this region. We interpret these changes in the physical properties of the borehole wall to suggest that either rock type or alteration vary rapidly over shorter distances than are resolved by cuttings analysis. The depth interval above the first rock type transition at the top of the images in Figure 3 is also distinguished by a pervasive set of sub-parallel sinusoids only visible in the FMS image. This type of
Figure 5: Natural fracture true dip and true dip direction for all fractures and for those with greater than 5 mm apparent aperture from FMS and BHTV logs for the interval from 6800 to 10238 ft. (5 mm is roughly equivalent to the minimum resolution of the FMS and BHTV.) Major faults are plotted as yellow boxes.
6

nearly sub-parallel (over discrete depth intervals) and uniformly spaced planar structure consisting of alternating dark and bright bands characterizes broad
aliper logs indicate regions of the FMS image log. Cthat these structures have little impact on the borehole wall geometry, consistent with their absence in the BHTV log (Figure 3). Crosscutting relationships with natural fractures always indicate that these structures are older. In addition, the boundaries of these regions generally coincide with fault zones and/or changes in image log character (Figure 3) consistent with changing rock types that are corroborated by the cuttings log (Figure 4). Most importantly, these characteristics are similar to core and surface outcrops elsewhere in the field that contain non-brittle fabrics (Figure 3). Therefore, we interpret these structures as non-brittle fabrics such as foliation that can be distinguished from natural fractures in image logs because of their consistent geometry (attitude and spacing) and absence in the BHTV log.
Distribution of geologic structures in depth Comparison of FMS and BHTV logs from the same interval revealed differences in the populations of natural fractures and other planar structures imaged by the two techniques (Figure 4). In general, fabric elements comprise more than 50% of all planar structures measured in the FMS log, and locally approach 100%. This subset of planar structures shows consistent orientations over short depth intervals but systematic changes in dip and dip direction with depth (Figure 4). At any given depth, the orientation of foliation is clearly distinct from the orientations of the natural fracture population (Figure 5). The residual fracture population left by subtracting these fabric elements from the total FMS data set is similar to the fracture population interpreted solely from the BHTV image log in frequency distribution (Figure 4) and orientation (Figure 5). However, the FMS data still indicates more fractures than the BHTV (Figure 4). Both data sets suggest that most fractures are associated with distinct zones of image log character, suggesting that there is a correlation between fractures density and specific rock types or alteration recorded in the cuttings log. In general, apparent apertures estimated from the FMS logs are larger for small fractures, are smaller for large fractures, and show more fractures with significant apparent aperture than the BHTV (Figure 5). In FMS data this “thickness” is a function of both the relative conductivity and the actual thickness of
terial defining the structure. The measured ckness could thus reflect the local mineralogy or
mathi
re.
fluid chemistry associated with the structure. In BHTV data this thickness is a function of the geometric irregularity of the borehole wall at its intersection with the structure and the footprint of the acoustic beam. Thus, FMS and BHTV estimates of apparent aperture do not directly measure the aperture or thickness of a fracture zone and are not directly comparable. Consequently, apparent aperture only provides insight into the relative importance of fractures and most likely over-estimates true thickness or apertu
Drilling induced structures and stress state In this study we distinguished three types of drilling induced structures: failure of the borehole wall as (1) breakouts and (2) tensile fractures, and failure of rock ahead of the drill bit as (3) petal-centerline fractures.
(1) Borehole wall breakouts Introduction of a borehole concentrates the remote stresses at the unsupported free surface of the borehole wall. Where the hoop stress exceeds the compressive strength of the rock, compressive failure of the borehole wall produces breakouts (Zoback et al., 1985). In near vertical wells, where the overburden represents one of the principal stresses, the compressive hoop stress is greatest along the azimuth of the minimum horizontal stress (Shmin). Thus, breakouts indicate the azimuth of Shmin and will tend to occur in pairs 180º apart. The occurrence, width, and depth of breakouts are primarily a function of the rock strength, remote stress state (breakouts being favored in locations with large
Figure 6: BHTV amplitude and two-way travel time, and FMS image logs of intervals containing
borehole wall tensile fractures and breakouts.
7

Figure 7: (a) Sketch of petal (green) and centerline (red)c) Pet
atural
fractures visible in (b) borehole televiewer image al-centerline fractures are commonly observed in
fractures.comlog at ~7000 ft measured depth from well 58A-10. (core (modified from a photo by Al Lacazette, www.n ). (d) Cartoon of stress concentration
sure in excess of the formation pressure based on around the bottom of a borehole subjected to a mustudies by Li and Schmitt (1997, 1998).
d pres
horizontal stress magnitudes), mud weight relative to formation fluid pressure and well bore orientation. Observations of breakout width in conjunction with estimates of rock strength can be used to constrain the range of horizontal stress magnitudes (Moos and Zoback, 1990). In borehole cross section, breakouts typically have a dog ear” geometry (Zoback et al., 1985) which is
nguished by latively low compressive strength.
BHTV and FMS image logs of well 58A-10 (Figure 6). We identified this type of borehole wall failure in logged intervals where tensile fractures occurred as paired vertical lineations 180° apart or as en echelon lineations 180° apart.
(3) Petal-centerline fractures Petal-centerline fractures are interpreted to form ahead of the drill bit due to the complex concentration of stress at the floor of the borehole (Kulander et al., 1990; Lorenz et al., 1990; Li and Schmitt, 1997, 1998). These induced fractures are favored in normal to strike slip faulting environments and are promoted by high mud weights and the rough geometry of the borehole floor (Li and Schmitt, 1998). They have long been recognized in core, and both empirical studies of oriented core (Kulander et al., 1990) and theoretical studies (Li and Schmitt, 1 p ustudy we take adva nd reaffirm that they provide stress orientations
“only visible in the BHTV log due to the ability of the acoustic signal to map the complete borehole shape. We limited our picks of breakouts to logged intervals where breakouts occurred as paired irregularly shaped patches 180º apart and where they could be clearly distinguished from any tool marks. In well 58A-10, breakouts are preferentially distributed within zones of distinct image log character (Figure 6), which are typically associated with deeper tool-wear than immediately adjacent regions. It is thus likely that these regions are distire
(2) Borehole wall tensile fractures Tensile failure of the borehole wall occurs where the hoop stress around the borehole is negative and exceeds the tensile strength of the rock (Moos and Zoback, 1990). For near-vertical wells, this failure produces vertical tensile fractures 180º apart and oriented parallel to the maximum horizontal stress
(SHmax). Tensile failure of the borehole wall is also promoted by high mud weights and thermal stress induced by cooling of the borehole wall during circulation of drilling fluids. Borehole wall tensile fractures are common in both
997, 1998, 1998) demonstrate that they strikearallel to SHmax. However, they have generally gonen-recognized in both types of image logs. In this
ntage of these fractures a
8
consistent with the other induced structures discussed above. In image logs petal fractures appear as smoothly curving chevrons (pointing up or down). The tips of the chevrons merge with pairs of centerline fractures oriented parallel to the borehole axis (Figure 7a and b) consistent with examples in core (Figure 7c). Whereas the symmetrical stress concentration around the borehole free surface causes classic borehole wall tensile fractures to form 180º apart, petal-centerline fractures propagate through intact rock ahead of the drill bit as opening-mode fractures that open in the local direction of the least compressive principal stress (Figure 7d). The resulting fracture plane strikes parallel to SHmax, but does not necessarily lie along the borehole axis. Thus, once the bit has drilled through the induced fracture, the petal-centerline fracture will have variable azimuthal spacing along the borehole wall. The orientation of Shmin can then only be reliably estimated by calculating the average azimuth of pairs of centerline fractures or paired measurements on both limbs of petal fractures.
FMS images, pairs of centerline fractures are likely to be completely imaged because they need t form 180º apart and FMS pads are spaced at 90º
ents (although greater coverage
In unnoincrem in other
natural fractures in an FMS log. The potential for such misinterpretation is exacerbated where these fractures are nested (Figures 7b and c). Practically, use of an FMS log alone is thus prone to increased scatter in measured orientations of Shmin. Using a BHTV log and applying the same averaging technique to all tensile fractures, including those produced by borehole wall failure, helps limit this pitfall. Figure 8 illustrates an example where such confusion is likely in the FMS. This example also reveals an abutting relationship visible in BHTV log that confirms that classic borehole wall tensile fractures form after petal fractures.
Orientation of principal stresses Analysis of breakouts, pairs of borehole wall tensile cracks and pairs of petal-centerline fractures from the BHTV logs (Figure 9) indicates that Shmin near well 58A-10 is oriented along an azimuth of 102º ± 18º. A large proportion of the tensile fractures evident in
l-ta e d
borehole wall tensile fractures (summarized in Figure 9). In contrast, the FMS data shows considerably
FMS mean Shmin irection also departs by 13º from the BHTV
sampled (including lack of
electrical imaging tools will reduce this limitation). As a result, centerline fractures spaced less that 180º could be misinterpreted as classic borehole wall tensile fractures (FMS image in Figure 8). Similarly, petal fractures might mistakenly appear to be parts of
these BHTV image logs are interpreted as petacenterline fractures. Our analysis of the BHTV dashows that petal-centerline fractures providcomparable stress orientations to breakouts an
more scatter and fewer picks because of the poor azimuthal coverage of the borehole wall and the inability to distinguish petal-centerline fractures from borehole wall tensile cracks. Thedanalysis. Careful calibration (not presented here) between the logs demonstrates that they are well oriented with respect to each other. Thus, this difference is probably a result of the sampling bias resulting from FMS pad spacing and the much smaller population breakouts). The average azimuth of Shmin is consistent with the local orientation of the Coso Wash normal fault just to the west of the well and another similarly striking, but west dipping normal fault to the east (Figure 1). Inside the East Flank (boxed area in Figure 1), stress orientations show greater heterogeneity between wells separated by relatively short distances, presumably because of the proximity of active faults. The depth distribution of induced structures visible in the BHTV data also shows one prominent stress rotation at ~9750 ft near the locations of several large faults visible in the image logs (arrow in Figure 9). Other less prominent stress rotations, such as the potential rotation at ~7350 ft, are evident, but do not stand out as clearly from the scatter. These rotations
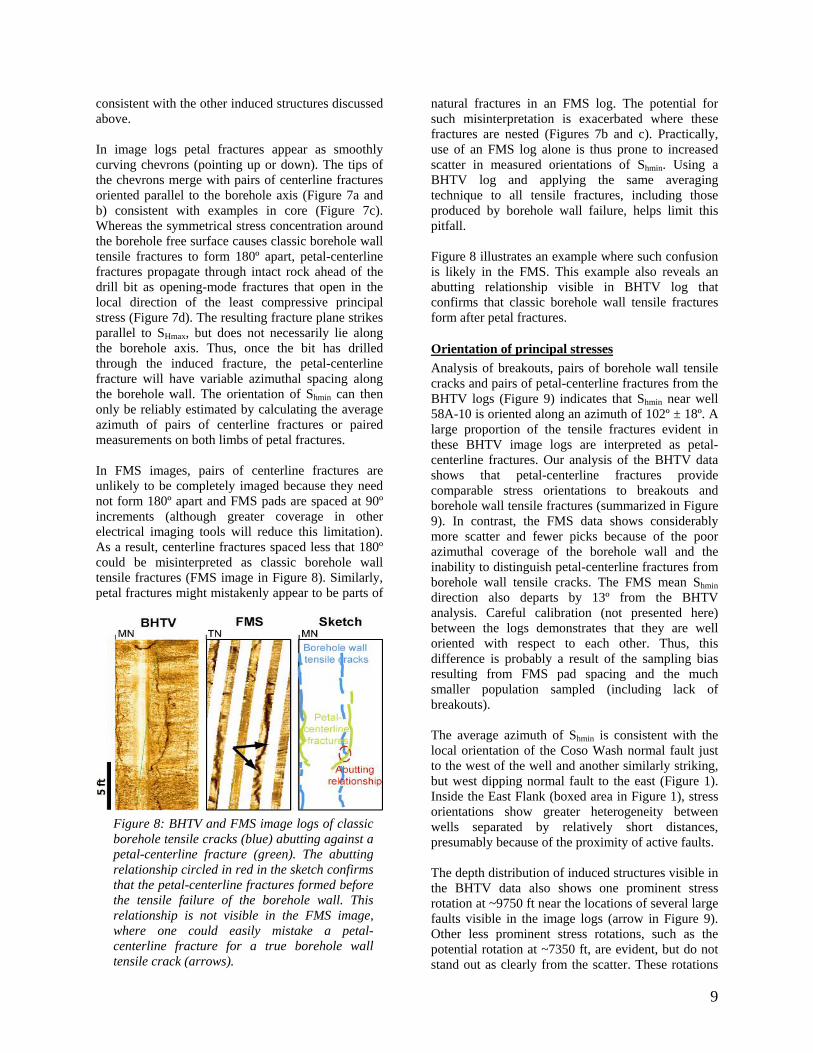
Figure 8: BHTV and FMS image logs of classic borehole tensile cracks (blue) abutting against a petal-centerline fracture (green). The abutting
sketch confirms relationship circled in red in the that the petal-centerline fractures formed before the tensile failure of the borehole wall. This relationship is not visible in the FMS image,where one could easily mistake a petal-centerline fracture for a true borehole wall tensile crack (arrows).
9

probably indicate active slip on faults nearby or intersecting the borehole.
tha lik res 50 wel im pro . In unthe con ole wall; thus it is unlikely
nsitions indicated by changes in image log haracter, image quality, and pipe-wear along the
-cutting relationships and non-planar fracture step-overs by virtue of its greater
both techniques
nsitions indicated by changes in image log haracter, image quality, and pipe-wear along the
-cutting relationships and non-planar fracture step-overs by virtue of its greater
both techniques
CONCLUSIONS FMS logs generally reveal more planar structures
n BHTV logs and are sensitive to characteristicse foliation, layering, or systematic variations inistivity related to mineralogy or fluids. More than% of the planar structures imaged by FMS logs inl 58A-10 appear to be fabric elements not well
aged by BHTV logs. These fabric elementsbably do not contribute to reservoir productivitycontrast, BHTV logs preferentially record open or -cemented fractures that are more likely to break
tinuity of the boreh
to image fabric. As a result, FMS logs may provide a more complete record of the entire fracture population, possibly including healed fractures and foliation, while BHTV logs more selectively image “open” natural fractures that are expected to contribute to reservoir permeability. FMS and BHTV logs to varying degrees reveal rock type tra
tribute to reservoir permeability. FMS and BHTV logs to varying degrees reveal rock type tra
Figure 9: Orientation of Shmin as a function of depth. The means Shmin orientation shown as dashed red line in the depth section is derived only from analysis of the BHTV logs. Red arrow shows location of a significant stress rotation possibly related to slip on one or more active faults observed at this depth.
ccborehole wall and are generally consistent with the cuttings log. Fault zone textures potentially related to the slip history and relative ages of fractures are also revealed in both image logs, although the BHTV is better at revealing cross
borehole wall and are generally consistent with the cuttings log. Fault zone textures potentially related to the slip history and relative ages of fractures are also revealed in both image logs, although the BHTV is better at revealing cross
azimuthal coverage. Combining azimuthal coverage. Combining allows a clearer characterization of fault texture that might reflect the distribution of minerals, fluids, or porosity. Azimuthal coverage provided by the BHTV log reveals a much larger suite of stress state indicators than the FMS log. Pairs of petal-centerline fractures, and borehole wall breakouts and tensile fractures indicate imaged in the 58A-10 BHTV log an Shmin azimuth of 102º±18º. This azimuth is generally consistent with image log analyses from other wells within the producing geothermal reservoir and is at high angle to the strike of the active Coso Wash normal fault.
ACKNOWLEDGMENTS
allows a clearer characterization of fault texture that might reflect the distribution of minerals, fluids, or porosity. Azimuthal coverage provided by the BHTV log reveals a much larger suite of stress state indicators than the FMS log. Pairs of petal-centerline fractures, and borehole wall breakouts and tensile fractures indicate imaged in the 58A-10 BHTV log an Shmin azimuth of 102º±18º. This azimuth is generally consistent with image log analyses from other wells within the producing geothermal reservoir and is at high angle to the strike of the active Coso Wash normal fault.
ACKNOWLEDGMENTS
Steve Bjornstad and Frank Monastero of the Navy Geothermal Program Office provided data, insight, and review that greatly helped with this study. Other collaborators include: Coso Operating Company and the Energy and Geoscience Institute ( U. Utah). Funding for N.C. Davatzes was provided by a U.S. Geological Survey Mendenhall Fellowship. Judith
rovSheridan and Dan Moos p ided input on previous image log interpretations at Coso.
REFERENCES
Barton, C.A., Zoback, M.D., and Moos, D. (1995), “Fluid flow along potentially active faults in crystalline rock,” Geology, 23(8), 683-686.
Barton C.A., Hickman, S., Morin, R., Zoback, M.D., and Benoit, D., (1998), “Reservoir-scale fracture permeability in the Dixie Valley, Nevada, Geothermal Field,” PROCEEDINGS, Twenty-Third Workshop on Geothermal Reservoir Engineering, SGP-TR-158, Stanford University, Stanford, California, January 26-28, 1998. 8 p.
10

EkstromM.P., Dahan,C.A., Chen, M.Y., Lloyd, P.M., and Rossi, D.J., (1987), “Formation imaging with
icroelectrical scanning arrays,” Log Analyst, 28, m294.
Hearst, J.R., Nelson, P.H., and Paillett, F.L., (2000), Well Logging for Physical Properites:A Handbook for Geophysicists, Geologists and Engineers: Second Edition, John Wiley & Sons, Ltd, New York, NY, 483 p.
Kulander, B.R., Dean, S.L., and Ward, B.J.Jr., (1990) Fractured Core Analysis: Interpretation, Logging, and Use of Natural and Induced Fractures in Core, , American Association of Petroleum Geologists,Tulsa, OK. AAPG Methods in Exploration Series, No. 8, 88 p.
Li, Y. and Schmitt, D.R., (1997), “Well-bore bottom stress concentration and induced core fractures,” AAPG Bulletin, 81(11), 1909-1925.
Li, Y. and Schmitt, D.R., (1998), “Drilling-induced core fractures and in situ stress,” J. Geophys. Research, 103(B3), 5225-5239.
Lorenz, J.C., Finley, S.J., and Warpinski, N.R., (1990), “Significance of coring-induced fractures in Mesaverde core, Northwestern, Colorado,” AAPG Bulletin, 74(7), 1017-1029.
Moos, D. and Zoback, M.D., (1990), “Utiliation of observations of well bore failure to constrain the orientation and magnitude of crustal stresses:Application to continental, deep sea drilling project, and ocean drilling program boreholes,” J. Geophys. Research, 1000(B), 12791-12811.
ford, alifornia, January 26-28, 2004. 8 p.
Sheridan, J.M. and Hickman, S., (2004), “In situ stress, fracture, and fluid flow analysis in well 38C-9: An Enhanced Geothermal System in the Coso Geothermal Field,” PROCEEDINGS, Twenty-Ninth Workshop on Geothermal Reservoir Engineering, SGP-TR-175, Stanford University, StanC
Unruh, J.R., Hauksson, E., Monastero, F.C., Twiss, R.J., and Lewis, J.C., (2002), “Seismotectonics of the Coso Range—Indian Wells Valley region, California: Transtensional deformation along the southeastern margin of the Sierran microplate,” in: Glazner, A.F., Walker, J.D., and Bartley, J.M., (eds), Geological evolution of the Mojave Desert and Southwestern Basin and Range: Boulder, CO, Geological Society of America Memoir 195, 227-294.
Wicks, C.W., Thatcher, W., Monastero, F.C., and Hasting, M.A., (2001), “Steady-state deformation of the Coso Range, East-Central California, inferred
om satellite radar interferometry,” J. Geophys.
frResearch, 106(B7), 13769-13780.
Zoback, M.D., Moos, D., Mastin, L., and Anderson, R.N., (1985), “Well bore breakouts and in situ stress,” J. Geophys. Research, 90(B7), 5523-5530.
Zemaneck, J., Glen, E.E.Jr., Norton, L.J., and Cardwell, R.L., (1970), “Formation evaluation by inspection with the borehole televiewer,” Geophysics, 35, 254-269.
11