room acoustic modelling techniques: a comparison of a scale … · acoustic design. however, room...
TRANSCRIPT

BUILDING ACOUSTICS · Volume 18 · Number 3, 4 · 2011 Pages 259–280 259
Room Acoustic Modelling Techniques: AComparison of a Scale Model and a Computer
Model for a New Opera Theatre
Jens Holger RindelOdeon A/S, Scion DTU, Diplomvej 381, DK-2800 Kgs. Lyngby, Denmark
PACS: 43.55.Fw, 43.55.Ka
ABSTRACTToday most acoustic consultants are using room acoustic computer models as a basis for theiracoustic design. However, room acoustic scale modelling is still being used for the design insome major projects, although the costs and the time needed are significantly larger than thoserelated to computer modelling. Both techniques were used by the author in a project for a newopera theatre; first the acoustical design was based on computer simulations using the Odeonsoftware, and next a 1:20 scale model was built and tested. In the paper the results obtained withthe two different modelling techniques are compared, and in general a satisfactory agreement hasbeen found. The advantages and drawbacks related to each of the modelling techniques arediscussed.
1. INTRODUCTIONThere is a long tradition for the use of models in the acoustic design of concert halls andopera theatres. The technique of using physical scale models have been developed overthe last 100 years (Rindel, 2002), and the room acoustical parameters, which are todaywell established as in ISO 3382:1997, were first of all developed for the use in scalemodels. Starting around 1970 computer models have been developed as a faster andcheaper alternative to the scale models. However, it is not unusual that both modellingmethods are used for the same project; some acoustic consultants may not trust thenewer computer modelling technique, but on the other hand there are importantinformation to gather from the computer modelling that cannot be obtained with thescale modelling technique.
This aim of this paper is to compare the two modelling tools and to discuss theadvantages and disadvantages of each method. The comparison is based on theacoustical design of a new opera theatre, namely Ankara Congress and Cultural Centre–The Opera House, Turkey, a project by architect Özgür Ecevit, Turkey, and acousticsby Jordan Akustik, Denmark, and the author. The opera is of the horse-shoe type withthree balconies and approximately 1400 seats. The design and acousticalinvestigations were made in 2001, but for economical and political reasons the projecthas not yet been built.

2. COMPUTER MODEL2.1. Room ModelThe ODEON room acoustics program has been used in version 5.0 to document theauditorium design. The following is the final phase III, i.e. the design has been modifiedin various ways as a result of two earlier phases of computer model investigations. Thematerials used are those agreed with the architect. The recordings are based on a fullyoccupied auditorium.
Changes in the design since Phase II are mainly a new proscenium frame andchanges to the lighthouse on top of the auditorium. In addition the sound absorption ofthe materials for wall and ceiling linings has been adjusted in order to optimise thereverberation time. The sound diffusing properties have also been adjusted inaccordance with recommendations from the previous design phases.
The room model for the computer simulations is shown in Fig. 1 and 2. Only theactive part of the stage is modelled, i.e. some typical stage setting is assumed. The
260 Room Acoustic Modelling Techniques: A Comparison of a Scale Model anda Computer Model for a New Opera Theatre
1
1 1
12
5
5
6
6
2
2
2
3
3
0.00 10.00
7
4
4
20.00 30.00metres
7
Figure 1. Section and plan of the digital model. The two source positions and theseven receiver positions are marked.

investigations are all based on a fully occupied auditorium and the absorption data forthe occupied seats are taken from (Beranek & Hidaka, 1998) group 2, audience onmedium upholstered seats.
Two source position were used, one on the stage and another one in the pit, bothchosen as omni-directional. Seven receivers were chosen, three on the main floor, twoon the first balcony and one on each of the other balconies.
2.2. Room Acoustic ParametersThe calculated acoustic parameters are defined in the international standard ISO3382:1997. The recommended range of each parameter for grand opera with fullaudience occupation is summarised in Table 1 together with the just noticeabledifference for each parameter. 1
BUILDING ACOUSTICS · Volume 18 · Number 3, 4 · 2011 261
Figure 2. View into the computer model. Surface colours represent the differentsound absorption characteristics.
Table 1. The acoustic parameters, their recommended range for grand opera and JND.
Parameter Recommended range Just noticeable difference
T30 1.5 to 2.2 s 5%EDT 1.5 to 2.2 s 5%G −2 to + 6 dB 1 dBC80 −2 to + 4 dB 1 dBLF 0.2 to 0.4 0.05

3. CALCULATION RESULTS3.1. Spatially Averaged ResultsIn the following figures 3–7 are shown the frequency dependency of the calculatedacoustic parameters. The curves show the average over the seven receiver positions, butseparately for the two source positions, on the stage and in the pit.
3.1.1. Reverberation Time (T30)The reverberation time is shown in Fig. 3. It is almost independent of the frequency andaround 1.7 s. This is in the optimum range for an opera house. There is no significantdifference between the two source positions, which is good.
3.1.2. Early Decay Time (EDT)The EDT is shown in Fig. 4. It is a little shorter than T30, which is normal. EDT is longerwith the source in the pit, which is due to sound reflections in the pit.
3.1.3. Strength (G)The relative sound pressure level or Strength is shown in Fig. 5. With the source on thestage the mean value is around 0 dB with only small frequency dependency. This isgood and in the optimum range for an opera house. With the source in the pit thestrength is a little lower (less than 1 dB) at the high frequencies, and below 1 kHz thereis practically no difference between the two source positions. This indicates a goodbalance between stage and pit.
3.1.4. Clarity (C80)As shown in Fig. 6 the Clarity with the source on the stage is 2–3 dB higher than withthe source in the pit. This is a significant difference and it means that the sound from
262 Room Acoustic Modelling Techniques: A Comparison of a Scale Model anda Computer Model for a New Opera Theatre
400020001000500Frequency, Hz
2501250
1
2
0.2
0.4
0.6
0.8
1.2
1.4
1.6
1.8
Rev
erbe
ratio
n tim
e, T
30 (
s)
Figure 3. Average reverberation time. Blue triangles: Source on stage. Red squares:Source in pit.

the stage is heard more clearly than the sound from the pit, which is normal in an operahouse. The Clarity is in the optimum range.
3.1.5. Lateral Energy Fraction (LF)The lateral energy fraction is shown in Fig. 7. The frequency variation is negligible, butwith the source in the pit the values are a little higher than with the source on the stage.This can be explained from the lack of direct sound from the pit to the audience. Thevalues are in the optimum range.
BUILDING ACOUSTICS · Volume 18 · Number 3, 4 · 2011 263
400020001000500Frequency (Hz)
2501250
1
2
0.2
0.4
0.6
0.8
1.2
1.4
1.6
1.8
ED
T (
s)
Figure 4. Average EDT. Blue triangles: Source on stage. Red squares: Source in pit.
400020001000500Frequency (Hz)
250125
0
1
−1
−2
−1.5
−0.5
0.5
1.5
Str
engt
h, G
(dB
)
Figure 5. Average Strength, G. Blue triangles: Source on stage. Red squares:Source in pit.

3.2. Variation of Results Within the AuditoriumIn the following is shown the spatial distribution of the acoustic parameters at 1 kHzoctave band. Each parameter is shown with the source on the stage. More than 2000receivers have been used in a grid with the size 0.75 m.
264 Room Acoustic Modelling Techniques: A Comparison of a Scale Model anda Computer Model for a New Opera Theatre
400020001000500
Frequency, Hz
250125
0
1
2
3
4
−3
−2
−1
5
Cla
rity,
C80
(dB
)
Figure 6. Average Clarity, C80 . Blue triangles: Source on stage. Red squares:Source in pit.
400020001000500Frequency, Hz
250125
0.2
0.3
0.1
0
0.05
0.15
0.25
0.35
Late
ral e
nerg
y fr
actio
n, L
F
Figure 7. Average lateral energy fraction, LF. Blue triangles: Source on stage. Redsquares: Source in pit.
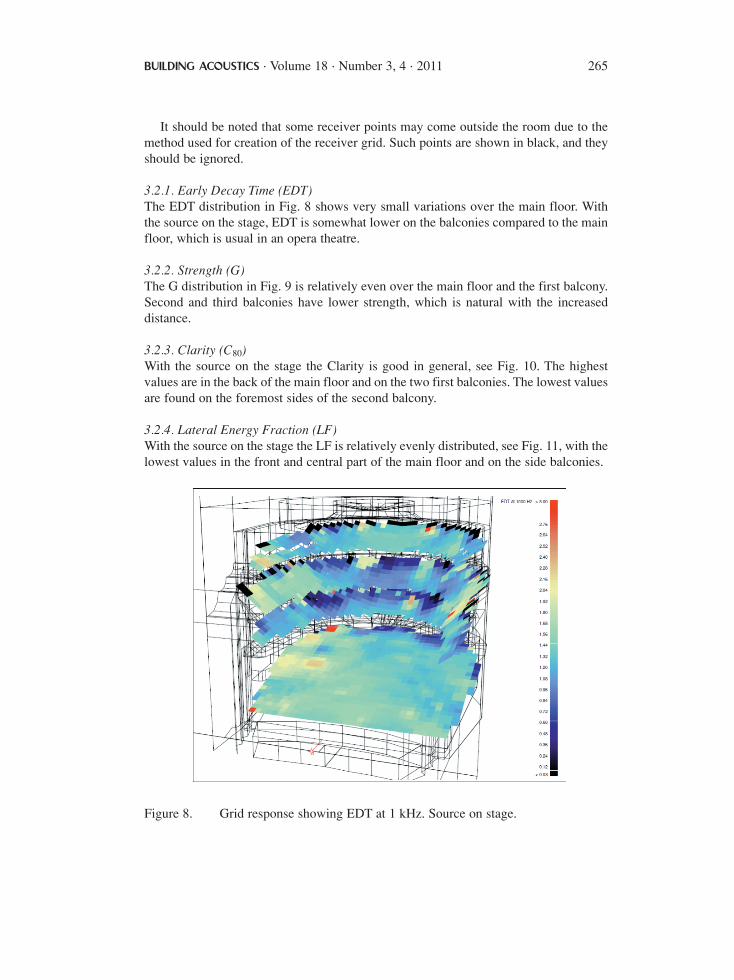
It should be noted that some receiver points may come outside the room due to themethod used for creation of the receiver grid. Such points are shown in black, and theyshould be ignored.
3.2.1. Early Decay Time (EDT)The EDT distribution in Fig. 8 shows very small variations over the main floor. Withthe source on the stage, EDT is somewhat lower on the balconies compared to the mainfloor, which is usual in an opera theatre.
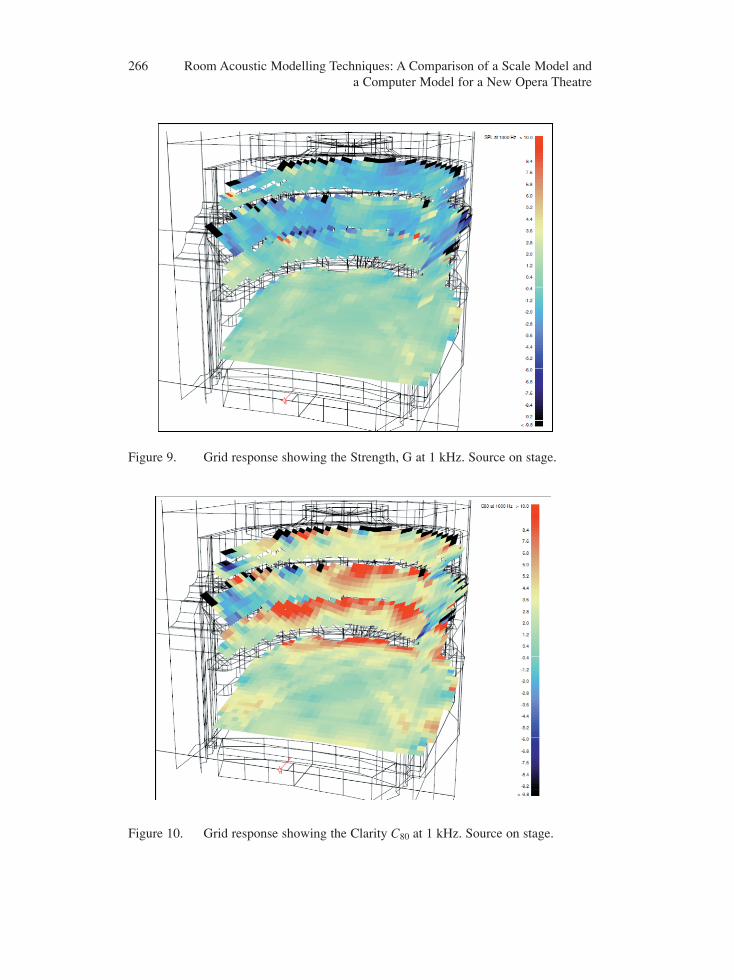
3.2.2. Strength (G)The G distribution in Fig. 9 is relatively even over the main floor and the first balcony.Second and third balconies have lower strength, which is natural with the increaseddistance.
3.2.3. Clarity (C80)With the source on the stage the Clarity is good in general, see Fig. 10. The highestvalues are in the back of the main floor and on the two first balconies. The lowest valuesare found on the foremost sides of the second balcony.
3.2.4. Lateral Energy Fraction (LF)With the source on the stage the LF is relatively evenly distributed, see Fig. 11, with thelowest values in the front and central part of the main floor and on the side balconies.
BUILDING ACOUSTICS · Volume 18 · Number 3, 4 · 2011 265
Figure 8. Grid response showing EDT at 1 kHz. Source on stage.
266 Room Acoustic Modelling Techniques: A Comparison of a Scale Model anda Computer Model for a New Opera Theatre
Figure 9. Grid response showing the Strength, G at 1 kHz. Source on stage.
Figure 10. Grid response showing the Clarity C80 at 1 kHz. Source on stage.

3.3. Summary of Calculation ResultsAll of the calculated acoustic parameters have values in the optimum rangerecommended for an opera house. The frequency dependence of the parameters is verysatisfactory and there is obtained a uniform distribution in the auditorium. Also thebalance between stage and orchestra pit is very good.
It is concluded that the acoustic qualities of the auditorium can be expected to beexcellent. The final result depends on details like the final choice of surface materialsand the degree of sound diffusion from the surfaces.
4. SCALE MODEL4.1. GeneralThe scale model was delivered by Jordan Akustik, Denmark and it was built in the scale1:20. This means that the actual frequencies used for the measurements were 20 timesthe normal full-scale frequencies. The room acoustic measurements were made inaccordance with ISO 3382:1997. Octave bands were used with the centre frequencies2.5 kHz–80 kHz, corresponding to 125 Hz–4 000 Hz in full scale. In the following theequivalent full-scale frequencies are used. A photo into the interior of the model isshown in Fig. 12.
4.2. Measurement EquipmentMeasurements were carried out using a BK 4136 1/4” microphone, a BK 2636measuring amplifier and a Rockland 852 dual high/low-pass filter. Measurement
BUILDING ACOUSTICS · Volume 18 · Number 3, 4 · 2011 267
Figure 11. Grid response showing LF at 1 kHz. Source on stage.

acquisitions, analyses and calculations were done with the MIDAS software [4] forApple Macintosh II. Impulses were generated with an electrical spark source. Themeasuring schematic is shown in fig. 13.
The frequency spectrum of the spark source is shown in fig. 14. The impulseresponses were measured from 1600 Hz–110 kHz in the 1:20-scale model,corresponding to a full-scale frequency range of 80 Hz – 5500 Hz. The humidity wascontrolled with an air-washer. In this way it was possible to keep the humidity around60% RH. Temperature and humidity were measured with a Novasina MIK3000electrical hygrometer and a reading was taken for each series of measurements. TheMIDAS system automatically compensated for the air attenuation.
4.3. Scale Model AudienceThe construction of the scale model audience was based on sound absorptionmeasurements by (Beranek & Hidaka, 1998) for audience on medium upholstered seats.It consists of a front made of a wooden fibre plate (A), glued to a styrofoam back (B),
268 Room Acoustic Modelling Techniques: A Comparison of a Scale Model anda Computer Model for a New Opera Theatre
Figure 12. View into the auditorium of the 1:20 scale model. The spark source isseen on the stage in the front.
Source
Model
BK 4136
BK 2636
Filter
MIDAS
Figure 13. Setup for scale model measurements.

in which the shapes of the “heads” of the audience are cut out (see Fig. 15). Later someof the surfaces of the front and back were covered with a layer of metal tape, in orderto adjust the absorption, see Fig. 16.
Absorption coefficient measurements were carried out in a scale model of areverberation room. The room was box-shaped with the dimensions 60 cm* 47 cm* 38 cm, which corresponds to a full-scale volume of about 850 m3. 13 diffusers (curvedplastic sheets) were placed along the sides and ceiling of the room to achieve diffusivityof the sound field. In order to obtain the absorption coefficient, the reverberation timein the room was measured with and without a test specimen of the audience. Thesemeasurements were carried out according to the ISO 354 standard.
Fig. 17 shows the absorption coefficient of two different types of scale modelaudience measured in the small scale reverberation room, compared to the data obtainedon real audience by (Beranek & Hidaka, 1998). Both models are covered with a layerof tape on the back, and on the front side of the styrofoam (the “chest”). Model 1 alsohas a layer of tape on the front of the wooden fibre plate (thus the entire surface of themodel audience is covered), whereas this surface is uncovered on model 2.
BUILDING ACOUSTICS · Volume 18 · Number 3, 4 · 2011 269
Figure 14. Frequency spectrum of the spark source (frequency axis is full scale).
15 mm
A
B
12 mm
30 mm
11 mm
A
B
120 mm
22 mm
8 mm
65 mm
Figure 15. Schematic drawing of 1:20 model audience.
80.
70.
60.
50.
40.
30.
500. 1000. 1500. 2000. 2500. 3000. 3500. 4000. 4500.
Frequency (Hz)
Power (dB) Hamming window (0−5 ms)

Due to the edge effect it is assumed that the absorption coefficient measured on a10 m2 test specimen (full scale) is a little higher than for the same material measuredon a very large surface in a concert hall. Since the measurements made by Beranek &Hidaka were carried out in actual concert halls and not in a reverberation room, the goalwas to construct a scale model audience, which showed a slightly higher soundabsorption when measured in a reverberation room. Therefore model 2 was chosen (seeFig. 16), and the audience was constructed for the entire model (approx. 1400 seats).
4.4. Adjustment of Material AbsorptionThe measurements in the auditorium were made in accordance with ISO 3382:1997.Initial measurements of the reverberation time were made with audience, but withoutthe stage tower. These measurements were made with the iron curtain down, i.e.
270 Room Acoustic Modelling Techniques: A Comparison of a Scale Model anda Computer Model for a New Opera Theatre
Figure 16. Model audience for the 1:20 scale model.
400020001000500Frequency, Hz
250125
0.8
1.2
0.4
0
0.2
0.6
1
1.4
B. & H.
Model 1
Model 2
Figure 17. Absorption coefficient of audience for the 1:20 scale model compared tothe Beranek & Hidaka data.
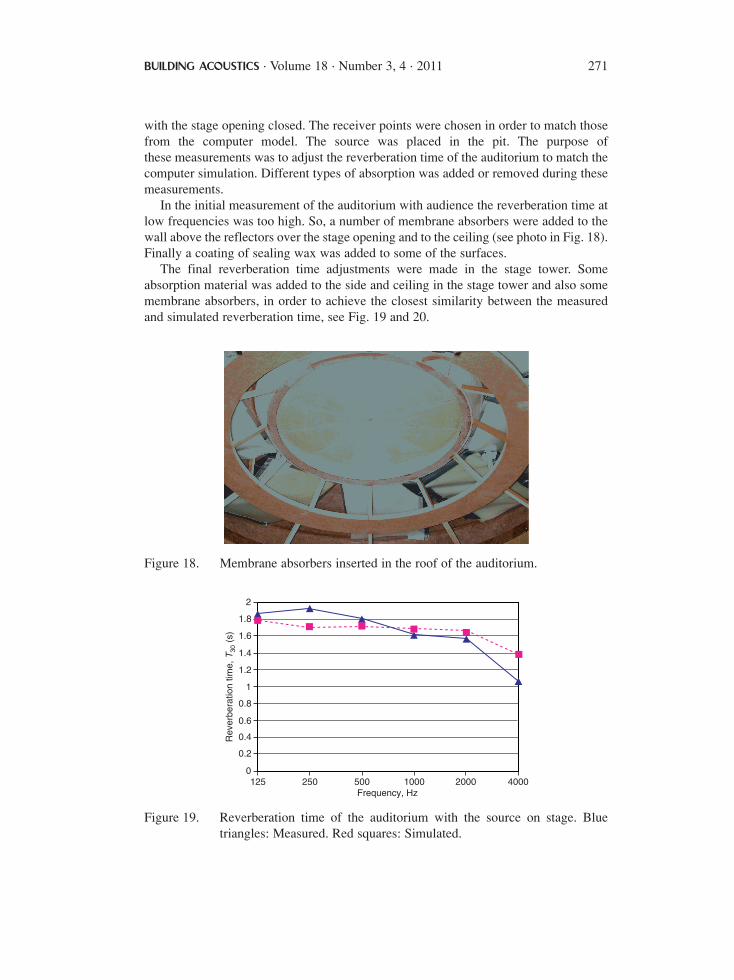
with the stage opening closed. The receiver points were chosen in order to match those from the computer model. The source was placed in the pit. The purpose of these measurements was to adjust the reverberation time of the auditorium to match thecomputer simulation. Different types of absorption was added or removed during thesemeasurements.
In the initial measurement of the auditorium with audience the reverberation time atlow frequencies was too high. So, a number of membrane absorbers were added to thewall above the reflectors over the stage opening and to the ceiling (see photo in Fig. 18).Finally a coating of sealing wax was added to some of the surfaces.
The final reverberation time adjustments were made in the stage tower. Someabsorption material was added to the side and ceiling in the stage tower and also somemembrane absorbers, in order to achieve the closest similarity between the measuredand simulated reverberation time, see Fig. 19 and 20.
BUILDING ACOUSTICS · Volume 18 · Number 3, 4 · 2011 271
Figure 18. Membrane absorbers inserted in the roof of the auditorium.
400020001000500Frequency, Hz
2501250
1
2
0.2
0.4
0.6
0.8
1.2
1.4
1.6
1.8
Rev
erbe
ratio
n tim
e, T
30 (
s)
Figure 19. Reverberation time of the auditorium with the source on stage. Bluetriangles: Measured. Red squares: Simulated.

5. MEASUREMENT RESULTS5.1. Spatially Averaged ResultsIn the following figures the parameters measured with the source on the stage and inthe orchestra pit are shown. The results are averaged over seven receiver positions,identical to the ones from the computer model, i.e. three positions on the floor, twoon the first balcony and one on each of the second and third balconies, see Fig. 1.The scale model results are shown together with the results from the computersimulation.
The sound absorption from the orchestra (chairs, instruments and musicians) wasrepresented by a sound absorbing floor in the computer simulations, and in the scalemodel by a number of the model persons placed in the pit. For the EDT the results inFig. 21–22 show satisfactory agreement with the computer simulations with the sourceon the stage, whereas there are some deviations with the source in the pit. At the highfrequencies there seems to be more absorption of the reflected sound than in thesimulations. This can be explained partly by the absorption from the scale modelorchestra in the pit, partly by the very high attenuation of sound at high frequencies.This air-attenuation is much higher in a scale model than it is in full scale. The MIDASmeasuring system can make an automatic compensation for the air attenuation, but stillthe high frequency results are less reliable.
For the Strength the results in Fig. 23–24 show good agreement with the computer simulations below 2 kHz, but at higher frequencies the results from thescale model show more attenuation. A possible explanation could be that soundpropagation across the audience has more attenuation in the scale model than in thecomputer model.
272 Room Acoustic Modelling Techniques: A Comparison of a Scale Model anda Computer Model for a New Opera Theatre
400020001000500Frequency, Hz
2501250
1
2
0.2
0.4
0.6
0.8
1.2
1.4
1.6
1.8
Rev
erbe
ratio
n tim
e, T
30 (
s)
Figure 20. Reverberation time of the auditorium with the source in the pit. Bluetriangles: Measured. Red squares: Simulated.

The results for the Clarity in Fig. 25–26 show satisfactory agreement with thecomputer simulations, especially with the source on the stage. As for the otherresults there seems to be more high frequency attenuation in the scale model with thesource in the pit. The lateral energy fraction, LF was not measured in the scalemodel, because a 1:20 scale microphone with figure-of-eight characteristic was notavailable.
BUILDING ACOUSTICS · Volume 18 · Number 3, 4 · 2011 273
400020001000500Frequency (Hz)
2501250
1
2
0.2
0.4
0.6
0.8
1.2
1.4
1.6
1.8
ED
T (
s)
Figure 21. Average EDT with the source on stage. Blue triangles: Measured. Redsquares: Simulated.
400020001000500Frequency (Hz)
2501250
1
2
0.2
0.4
0.6
0.8
1.2
1.4
1.6
1.8
ED
T (
s)
Figure 22. Average EDT with the source in the pit. Blue triangles: Measured. Redsquares: Simulated.
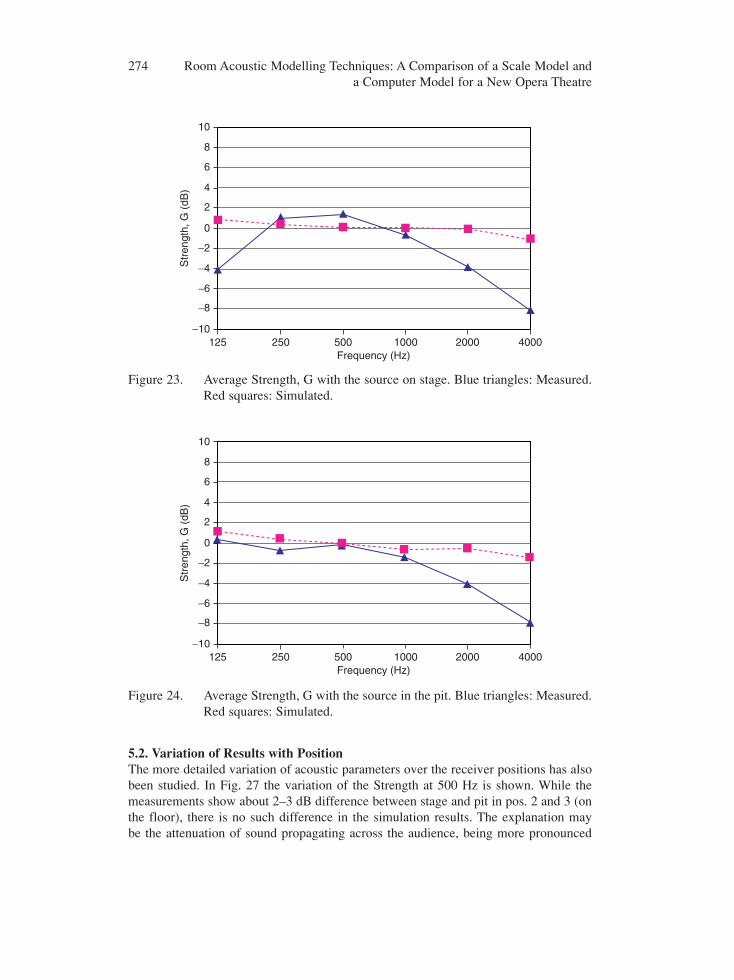
5.2. Variation of Results with PositionThe more detailed variation of acoustic parameters over the receiver positions has alsobeen studied. In Fig. 27 the variation of the Strength at 500 Hz is shown. While themeasurements show about 2–3 dB difference between stage and pit in pos. 2 and 3 (onthe floor), there is no such difference in the simulation results. The explanation may be the attenuation of sound propagating across the audience, being more pronounced
274 Room Acoustic Modelling Techniques: A Comparison of a Scale Model anda Computer Model for a New Opera Theatre
400020001000500Frequency (Hz)
250125−10
0
10
−8
−6
−4
−2
2
4
6
8
Str
engt
h, G
(dB
)
Figure 23. Average Strength, G with the source on stage. Blue triangles: Measured.Red squares: Simulated.
400020001000500Frequency (Hz)
250125−10
0
10
−8
−6
−4
−2
2
4
6
8
Str
engt
h, G
(dB
)
Figure 24. Average Strength, G with the source in the pit. Blue triangles: Measured.Red squares: Simulated.

with the source in the pit than in the elevated position on the stage, but not modelledcorrectly in the simulations.
In Fig. 28 the variation of the Clarity at 500 Hz is shown. One clear effect is the lowvalues in pos. 2 and 3 when the source is in the pit, whereas the Clarity is high with thesource on stage. Although not identical, scale model measurements and simulationsshow the same tendency in variation.
BUILDING ACOUSTICS · Volume 18 · Number 3, 4 · 2011 275
400020001000500Frequency, Hz
250125−10
0
10
−8
−6
−4
−2
2
4
6
8
Cla
rity,
C80
(dB
)
Figure 25. Average Clarity, C80 with the source on stage. Blue triangles: Measured.Red squares: Simulated.
400020001000500Frequency, Hz
250125−10
0
10
−8
−6
−4
−2
2
4
6
8
Cla
rity,
C80
(dB
)
Figure 26. Average Clarity, C80 with the source in the pit. Blue triangles: Measured.Red squares: Simulated.

5.3. The Effect of a Diffusing Wall TreatmentIn order to test the effect of diffusing walls on the ground floor, a layer of wrinkledfoil was taped to the walls on both sides of the auditorium beneath the first balcony;see Fig. 29. The depth of the sound scattering structure was about 20 mm (400 mmfull scale).
Measured results of EDT, Strength and Clarity in the three receiver positions on thefloor were compared with those measured with smooth walls. The difference wasnegligible for EDT and Clarity, while the Strength increased up to 3 dB with thediffusing walls.
276 Room Acoustic Modelling Techniques: A Comparison of a Scale Model anda Computer Model for a New Opera Theatre
S1
S2
M2
M1
6
−6
4
−4
2
2 3 5 7641
−2
0
Str
engt
h, G
(dB
) @
500
Hz
Receiver position
Figure 27. The Strength, G at 500 Hz in seven receiver positions. M1: measured,source on stage; M2: measured, source in the pit; S1 and S2: simulated,stage and pit positions.
S1
S2
M2
M1
6
8
−6
−8
4
−4
2
2 3 5 7641
−2
0
C80
(dB
) @
500
Hz
Receiver position
Figure 28. The Clarity, C80, at 500 Hz in seven receiver positions. Source positionsas in Fig. 27.

5.4. Summary of Scale Model MeasurementsThe scale model measurements have confirmed the results from the computersimulations. The deviations between measurements and simulations found at the highfrequencies should not be given too much weight, because the measuring technique isless reliable at the very high frequencies, i.e. at 2000 and 4000 Hz full-scale.
The scale model cannot give information about the reverberation time; initially themodel was tuned to give approximately the reverberation time that was predicted fromthe computer simulation. The other room acoustic parameters EDT, Strength andClarity have values that are considered very satisfactory for an opera hall and the sounddistribution in the auditorium is very even. Also the balance between stage and pit hasbeen shown to be very good.
6. DISCUSSIONThe main results from the two different modelling methods are in a reasonableagreement, and thus both methods can be considered a useful acoustical design tool fora project like the opera house. However, there are different strengths and weaknessesassociated with each method. First the possible reasons for the different results shouldbe discussed.
• The room geometry and the degree of detail in the scale model and the computermodel are not exactly identical, and this may lead to some unknown differences inthe results.
• The absorption characteristics of the materials are not the same, those in the scalemodel being more different from the real materials than the absorption data appliedin the computer model.
BUILDING ACOUSTICS · Volume 18 · Number 3, 4 · 2011 277
Figure 29. The scale model with sound diffusing treatment of the wall under thebalcony.

• The air attenuation is too high in the scale model, which can only partly be com-pensated for by frequency dependent amplification of the impulse response and/orby surface materials with too little absorption.
• The reflection, scattering and diffraction effects are accurate in the scale model, butonly approximated by theoretical models in the computer simulation.
The problem with the absorption of the materials in a scale model means that a scalemodel cannot be used to check the reverberation time, which must still be consideredthe most important overall acoustic parameter of a hall. This is in contrast to thecomputer model, which is dedicated to estimate the reverberation time, also in caseswhere Sabine’s equation is not valid.
Modelling the audience area is particularly interesting, because absorption,scattering, and influence on sound propagation across the surface are all important.While these effects may be reasonably well approximated in the scale model, it is moredifficult in the computer model. Especially the attenuation of direct sound and earlyreflections propagating across the audience area are not modelled correctly in thecomputer model.
The results from the scale model are limited to some room acoustical parameters,whereas the computer model offers several additional possibilities and tools forananlysis:
• Analysis in 3D of early reflection paths and identifying the surfaces that generatethe reflections (see example in Fig. 30); in a scale model this can be done for thefirst order reflections using a laser beam, if the surfaces are treated with lightreflecting material.
• Calculation of results in a grid that may cover every single seat in the audiencearea; in a scale model the information about distribution of sound is limited to afew selected receiver positions, and areas with acoustical problems may not bediscovered.
278 Room Acoustic Modelling Techniques: A Comparison of a Scale Model anda Computer Model for a New Opera Theatre
7
Odeon©1985−2009 Licensed to: Odeon A/S
P1Source: 1Surface: *Receiver*Refl.: 1Path <m>: 54, 70Time <ms>: 159
Figure 30. Example of an analysis in 3D of the reflection paths of early reflections.

• The possibility of auralisation and thus to include an evaluation through listeningis straight forward and easy in the computer model. With a scale model this is alsopossible in principle, but with severe demands on the transducers, e.g. a miniaturedummy head, and still with a limited frequency range and dynamic range.
The reflection paths for 1st and 2nd order reflections from the source on stage to thereceiver 7 on the third balcony are shown in Fig. 30. For clarity only the reflectingsurfaces are shown in this example.
Finally, there is a big difference between the two modelling methods when the timeconsumption and the costs are considered. To create the room model is obviously amuch bigger job with a scale model, but in addition comes the extra time for alterationsand modifications, if the first design is not fully satisfactory. In the case of the AnkaraOpera, several adjustments of volume and geometrical details were made during thefirst phases of the computer simulations.
Next comes the time for doing the measurements in a sufficient number of sourceand receiver positions; this may take weeks, whereas the same results can be obtainedwith a computer model within a few minutes, and a complete grid response within a fewhours.
7. CONCLUSIONThe comparison of the scale modelling technique with the computer simulationtechnique has shown that there is a good agreement between the results, and bothmethods can provide useful information for the acoustical design.
The computer modelling technique is fast and cheap, and it offers a lot more than thescale modelling technique, like grid mapping, analysis of reflection paths, andauralisation. The main draw-back is the approximate theoretical models for variouswave phenomina, like scattering, diffraction, and angle dependent reflection.
The scale modelling technique is time consuming and expensive. It can be used fora final check of the acoustical design of a hall, but it is not well suited for experimentswith alternative solutions. Changes in the room geometry are difficult. The results arelimited to some, but not all relevant acoustical parameters. The most importantparameter, the reverberation time, cannot be predicted with a scale model.
8. ACKNOWLEDGEMENTSThe scale model measurements have been carried out by MSc Jens-Christian Kijne withassistance of Associate Professor Anders Christian Gade at the Technical University ofDenmark.
REFERENCES1. J.H. Rindel, “Modelling in Auditorium Acoustics. From Ripple Tank and Scale
Models to Computer Simulations”. Revista de Acústica XXXIII No 3–4, 31–35(2002).
2. ISO 3382:1997, “Acoustics - Measurement of the reverberation time of roomswith reference to other acoustical parameters” International Organization forStandardization (1997).
BUILDING ACOUSTICS · Volume 18 · Number 3, 4 · 2011 279

3. L.L. Beranek and T. Hidaka, “Sound absorption in concert halls by seats, occupiedand unoccupied, and by the hall’s interior surfaces” J. Acoust. Soc. Am. 104,3169–3177 (1998).
4. X. Menial, G. Dodd, J-D. Polack and A.H. Marshall, All-Scale modelmeasurements: The MIDAS system (Laboratoire d’acoustique, Université duMaine, Le Mans, France and Acoustics Recearch Centre, University of Auckland,New-Zealand, 1991).
5. ISO 354:2003, “Acoustics – Measurement of sound absorption in a reverberationroom” International Organization for Standardization (2003).
280 Room Acoustic Modelling Techniques: A Comparison of a Scale Model anda Computer Model for a New Opera Theatre