comparison between ultrasonic and pulse-radar non …€¦ · · 2002-11-13ultrasonic method and...
TRANSCRIPT
Abstract--This paper describes comparison between our developed two Non-Destructive Testing (NDT) system with ultrasonic method and pulse-radar method. These systems could provide information of embedded objects in concrete structure. First, we introduce these NDT systems. The raw output images of these methods keep us from understanding them. To overcome this problem, we apply fuzzy logic into them. Next, we compare these two developed systems to show how to select appropriate method for various cases. Consequently, pulse-radar system is good for general purpose, because this system needs no coupling medium. Ultrasonic system is appropriate for the purpose (e.g. to detect both embedded objects and cracks, to examine deeper area, and in case of gathering of reinforcing bars). We recommend that these two systems are complementally for realizing NDT system.
Index Terms-- Concrete, fuzzy logic, non-destructive testing, ultrasonic, pulse-radar
I. INTRODUCTION
ON-DESTRUCTIVE Testing (NDT) [1] has been used for preventing serious accidents due to damages of embedded
objects in remodeling works. NDT can provide the internal information of walls and floors explicitly. There are three typical modalities: X-ray (radiograph), ultrasonic and pulse-radar. NDT with X-ray can exactly project the location of embedded objects in concrete. However, it has several disadvantages, such as invasiveness to the human body, necessity of license to handle the radiation for the examiners and placement of the sheet at backside of a specimen. In addition, no information about depth of embedded objects is available by this method. NDT with ultrasonic is useful for investigation of a crack in concrete [2], [3]. In the finding the objects in concrete, Yamano et al. [4] and Bartos et al. [5] described the ultrasonic scanning systems and the analyzing method. NDT with pulse-radar [6]-[9] has several advantages such as its non-invasiveness, simplicity of the sensor, and wideness of investigation region. Chiarng et al. have reported the inverse scattering-imaging algorithm [8]. In this method, the possibility of existence of a object is mapped by subtracting the clutter measurement data from the object measurement data. Pöpel et al. combined several kinds of sensors [9] for expressing the hyperbolic pattern clearly. However, these two NDT
Kouki Nagamune, Syoji Kobashi, Katsuya Kondo and Yutaka Hata are with
Graduate School of Engineering, Himeji Institute of Technology, 2167, Shosha, Himeji, Hyogo, 671-2201, JAPAN (telephone: +81-792-4989, e-mail: [email protected]).
Kazuhiko Taniguchi is with KINDEN Co., Ltd., 3-1-1, Saganakadai, Kizu-Cho, Souraku District, 619-0223, JAPAN.
ICITA2002 ISBN: 1-86467-114-9
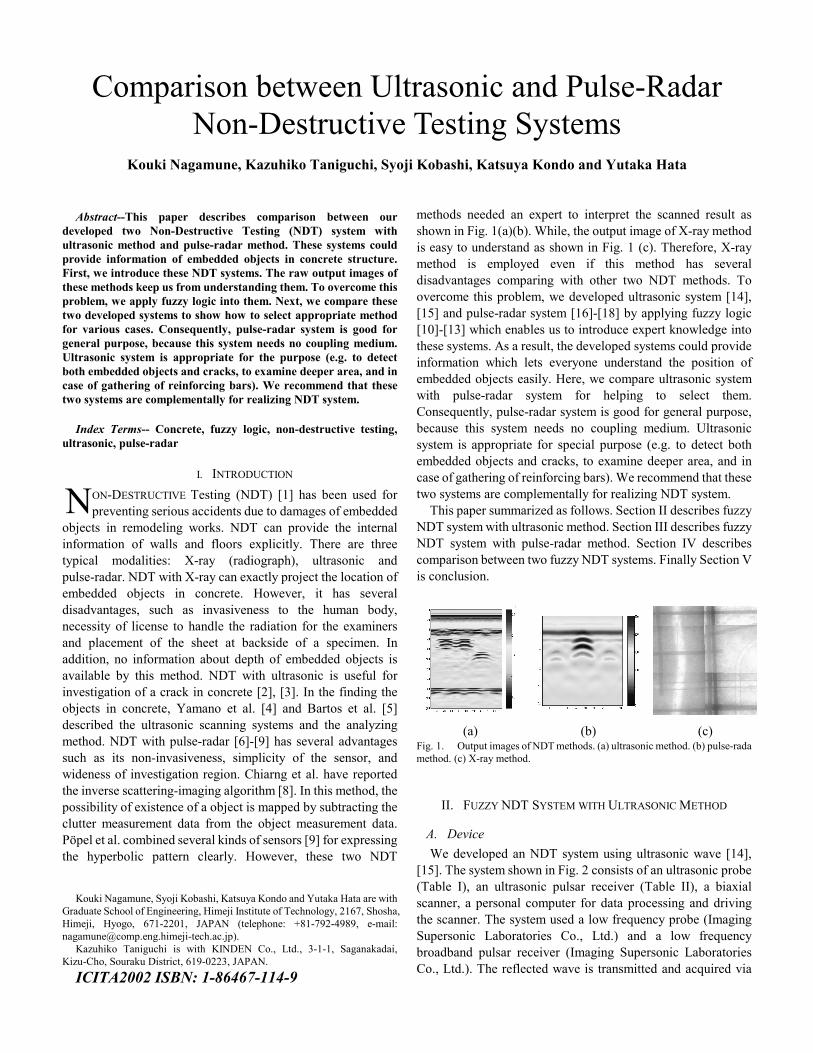
methods needed an expert to interpret the scanned result as shown in Fig. 1(a)(b). While, the output image of X-ray method is easy to understand as shown in Fig. 1 (c). Therefore, X-ray method is employed even if this method has several disadvantages comparing with other two NDT methods. To overcome this problem, we developed ultrasonic system [14], [15] and pulse-radar system [16]-[18] by applying fuzzy logic [10]-[13] which enables us to introduce expert knowledge into these systems. As a result, the developed systems could provide information which lets everyone understand the position of embedded objects easily. Here, we compare ultrasonic system with pulse-radar system for helping to select them. Consequently, pulse-radar system is good for general purpose, because this system needs no coupling medium. Ultrasonic system is appropriate for special purpose (e.g. to detect both embedded objects and cracks, to examine deeper area, and in case of gathering of reinforcing bars). We recommend that these two systems are complementally for realizing NDT system.
This paper summarized as follows. Section II describes fuzzy NDT system with ultrasonic method. Section III describes fuzzy NDT system with pulse-radar method. Section IV describes comparison between two fuzzy NDT systems. Finally Section V is conclusion.
(a) (b) (c) Fig. 1. Output images of NDT methods. (a) ultrasonic method. (b) pulse-rada method. (c) X-ray method.
II. FUZZY NDT SYSTEM WITH ULTRASONIC METHOD
A. Device We developed an NDT system using ultrasonic wave [14],
[15]. The system shown in Fig. 2 consists of an ultrasonic probe (Table I), an ultrasonic pulsar receiver (Table II), a biaxial scanner, a personal computer for data processing and driving the scanner. The system used a low frequency probe (Imaging Supersonic Laboratories Co., Ltd.) and a low frequency broadband pulsar receiver (Imaging Supersonic Laboratories Co., Ltd.). The reflected wave is transmitted and acquired via
Comparison between Ultrasonic and Pulse-Radar Non-Destructive Testing Systems
Kouki Nagamune, Kazuhiko Taniguchi, Syoji Kobashi, Katsuya Kondo and Yutaka Hata
N
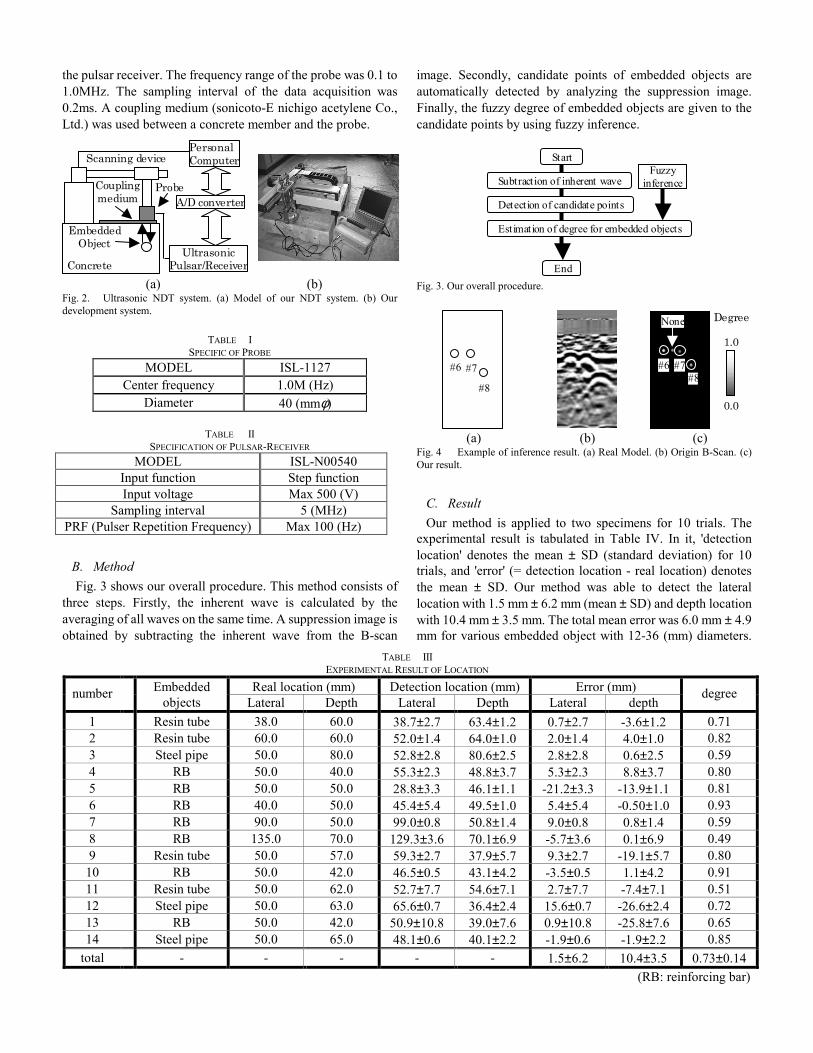
the pulsar receiver. The frequency range of the probe was 0.1 to 1.0MHz. The sampling interval of the data acquisition was 0.2ms. A coupling medium (sonicoto-E nichigo acetylene Co., Ltd.) was used between a concrete member and the probe.
Fig. 2. Ultrasonic NDT system. (a) Model of our NDT system. (b) Our development system.
TABLE I
SPECIFIC OF PROBE MODEL ISL-1127
Center frequency 1.0M (Hz) Diameter 40 (mmφ)
TABLE II
SPECIFICATION OF PULSAR-RECEIVER MODEL ISL-N00540
Input function Step function Input voltage Max 500 (V)
Sampling interval 5 (MHz) PRF (Pulser Repetition Frequency) Max 100 (Hz)
B. Method Fig. 3 shows our overall procedure. This method consists of
three steps. Firstly, the inherent wave is calculated by the averaging of all waves on the same time. A suppression image is obtained by subtracting the inherent wave from the B-scan
image. Secondly, candidate points of embedded objects are automatically detected by analyzing the suppression image. Finally, the fuzzy degree of embedded objects are given to the candidate points by using fuzzy inference.
Start
End
FuzzyinferenceSubtraction of inherent wave
Detection of candidate points
Estimation of degree for embedded objects
Fig. 3. Our overall procedure.
Fig. 4 Example of inference result. (a) Real Model. (b) Origin B-Scan. (c) Our result.
C. Result Our method is applied to two specimens for 10 trials. The
experimental result is tabulated in Table IV. In it, 'detection location' denotes the mean ± SD (standard deviation) for 10 trials, and 'error' (= detection location - real location) denotes the mean ± SD. Our method was able to detect the lateral location with 1.5 mm ± 6.2 mm (mean ± SD) and depth location with 10.4 mm ± 3.5 mm. The total mean error was 6.0 mm ± 4.9 mm for various embedded object with 12-36 (mm) diameters.
A/D converter
Scanning device
Probe
Concrete
EmbeddedObject
Couplingmedium
UltrasonicPulsar/Receiver
PersonalComputer
(a) (b)
TABLE III EXPERIMENTAL RESULT OF LOCATION
Real location (mm) Detection location (mm) Error (mm) number Embedded objects Lateral Depth Lateral Depth Lateral depth
degree
1 Resin tube 38.0 60.0 38.7±2.7 63.4±1.2 0.7±2.7 -3.6±1.2 0.71 2 Resin tube 60.0 60.0 52.0±1.4 64.0±1.0 2.0±1.4 4.0±1.0 0.82 3 Steel pipe 50.0 80.0 52.8±2.8 80.6±2.5 2.8±2.8 0.6±2.5 0.59 4 RB 50.0 40.0 55.3±2.3 48.8±3.7 5.3±2.3 8.8±3.7 0.80 5 RB 50.0 50.0 28.8±3.3 46.1±1.1 -21.2±3.3 -13.9±1.1 0.81 6 RB 40.0 50.0 45.4±5.4 49.5±1.0 5.4±5.4 -0.50±1.0 0.93 7 RB 90.0 50.0 99.0±0.8 50.8±1.4 9.0±0.8 0.8±1.4 0.59 8 RB 135.0 70.0 129.3±3.6 70.1±6.9 -5.7±3.6 0.1±6.9 0.49 9 Resin tube 50.0 57.0 59.3±2.7 37.9±5.7 9.3±2.7 -19.1±5.7 0.80
10 RB 50.0 42.0 46.5±0.5 43.1±4.2 -3.5±0.5 1.1±4.2 0.91 11 Resin tube 50.0 62.0 52.7±7.7 54.6±7.1 2.7±7.7 -7.4±7.1 0.51 12 Steel pipe 50.0 63.0 65.6±0.7 36.4±2.4 15.6±0.7 -26.6±2.4 0.72 13 RB 50.0 42.0 50.9±10.8 39.0±7.6 0.9±10.8 -25.8±7.6 0.65 14 Steel pipe 50.0 65.0 48.1±0.6 40.1±2.2 -1.9±0.6 -1.9±2.2 0.85
total - - - - - 1.5±6.2 10.4±3.5 0.73±0.14(RB: reinforcing bar)
#6 #7
#8
#6#6 #7#8
None Degree
1.0
0.0
(a) (b) (c)
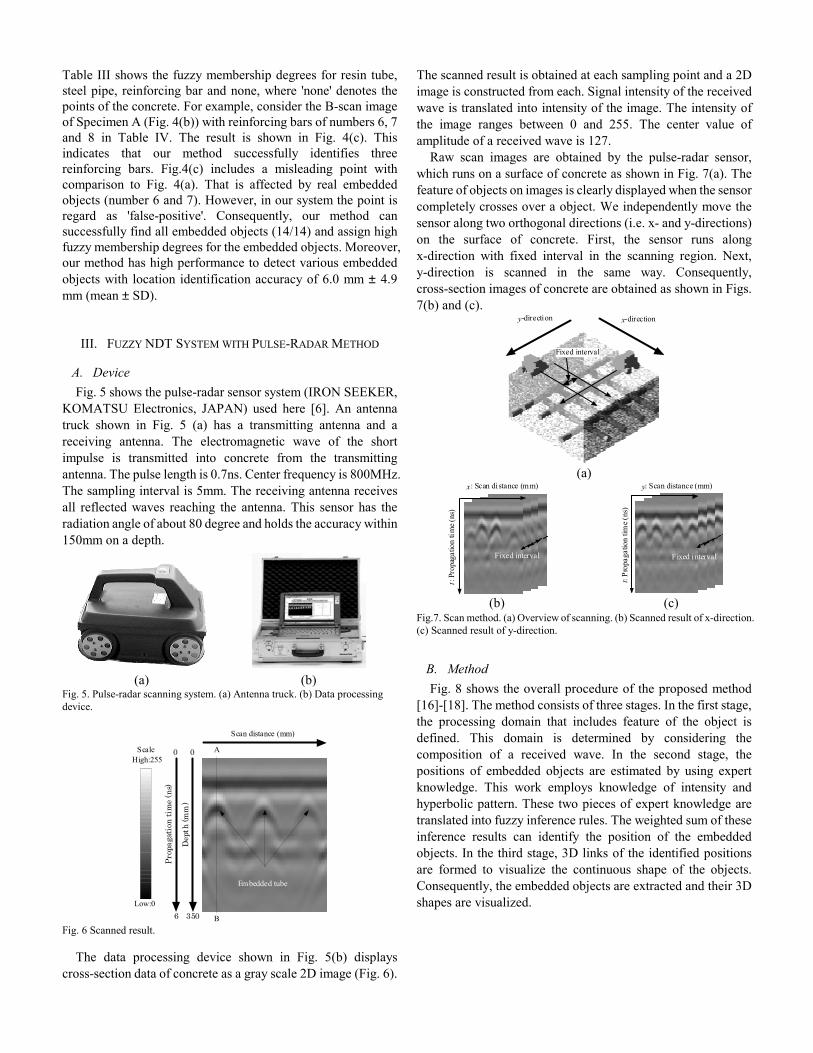
Table III shows the fuzzy membership degrees for resin tube, steel pipe, reinforcing bar and none, where 'none' denotes the points of the concrete. For example, consider the B-scan image of Specimen A (Fig. 4(b)) with reinforcing bars of numbers 6, 7 and 8 in Table IV. The result is shown in Fig. 4(c). This indicates that our method successfully identifies three reinforcing bars. Fig.4(c) includes a misleading point with comparison to Fig. 4(a). That is affected by real embedded objects (number 6 and 7). However, in our system the point is regard as 'false-positive'. Consequently, our method can successfully find all embedded objects (14/14) and assign high fuzzy membership degrees for the embedded objects. Moreover, our method has high performance to detect various embedded objects with location identification accuracy of 6.0 mm ± 4.9 mm (mean ± SD).
III. FUZZY NDT SYSTEM WITH PULSE-RADAR METHOD
A. Device Fig. 5 shows the pulse-radar sensor system (IRON SEEKER,
KOMATSU Electronics, JAPAN) used here [6]. An antenna truck shown in Fig. 5 (a) has a transmitting antenna and a receiving antenna. The electromagnetic wave of the short impulse is transmitted into concrete from the transmitting antenna. The pulse length is 0.7ns. Center frequency is 800MHz. The sampling interval is 5mm. The receiving antenna receives all reflected waves reaching the antenna. This sensor has the radiation angle of about 80 degree and holds the accuracy within 150mm on a depth.
Scan distance (mm)
A
B
ScaleHigh:255
Low:0
Embedded tube
Dep
th (m
m)
Prop
agat
ion
time
(ns)
0
3506
0
Fig. 6 Scanned result.
The data processing device shown in Fig. 5(b) displays cross-section data of concrete as a gray scale 2D image (Fig. 6).
The scanned result is obtained at each sampling point and a 2D image is constructed from each. Signal intensity of the received wave is translated into intensity of the image. The intensity of the image ranges between 0 and 255. The center value of amplitude of a received wave is 127.
Raw scan images are obtained by the pulse-radar sensor, which runs on a surface of concrete as shown in Fig. 7(a). The feature of objects on images is clearly displayed when the sensor completely crosses over a object. We independently move the sensor along two orthogonal directions (i.e. x- and y-directions) on the surface of concrete. First, the sensor runs along x-direction with fixed interval in the scanning region. Next, y-direction is scanned in the same way. Consequently, cross-section images of concrete are obtained as shown in Figs. 7(b) and (c).
x-directiony-direction
Fixed interval
(a)
t: Pr
opag
atio
n tim
e (ns
)
x: Scan distance (mm)
Fixed interval
t: Pr
opag
atio
n tim
e (ns
)
y: Scan distance (mm)
Fixed interval
(b) (c)
Fig.7. Scan method. (a) Overview of scanning. (b) Scanned result of x-direction. (c) Scanned result of y-direction.
B. Method Fig. 8 shows the overall procedure of the proposed method
[16]-[18]. The method consists of three stages. In the first stage, the processing domain that includes feature of the object is defined. This domain is determined by considering the composition of a received wave. In the second stage, the positions of embedded objects are estimated by using expert knowledge. This work employs knowledge of intensity and hyperbolic pattern. These two pieces of expert knowledge are translated into fuzzy inference rules. The weighted sum of these inference results can identify the position of the embedded objects. In the third stage, 3D links of the identified positions are formed to visualize the continuous shape of the objects. Consequently, the embedded objects are extracted and their 3D shapes are visualized.
(a) (b)
Fig. 5. Pulse-radar scanning system. (a) Antenna truck. (b) Data processing device.
Start
End
Fuzzyinference
Determination of the Processing Region
Identification of Position of Embedded Tubes
Extraction of Embedded Tubes
Fig.8 Overall procedure of proposed method.
C. Result
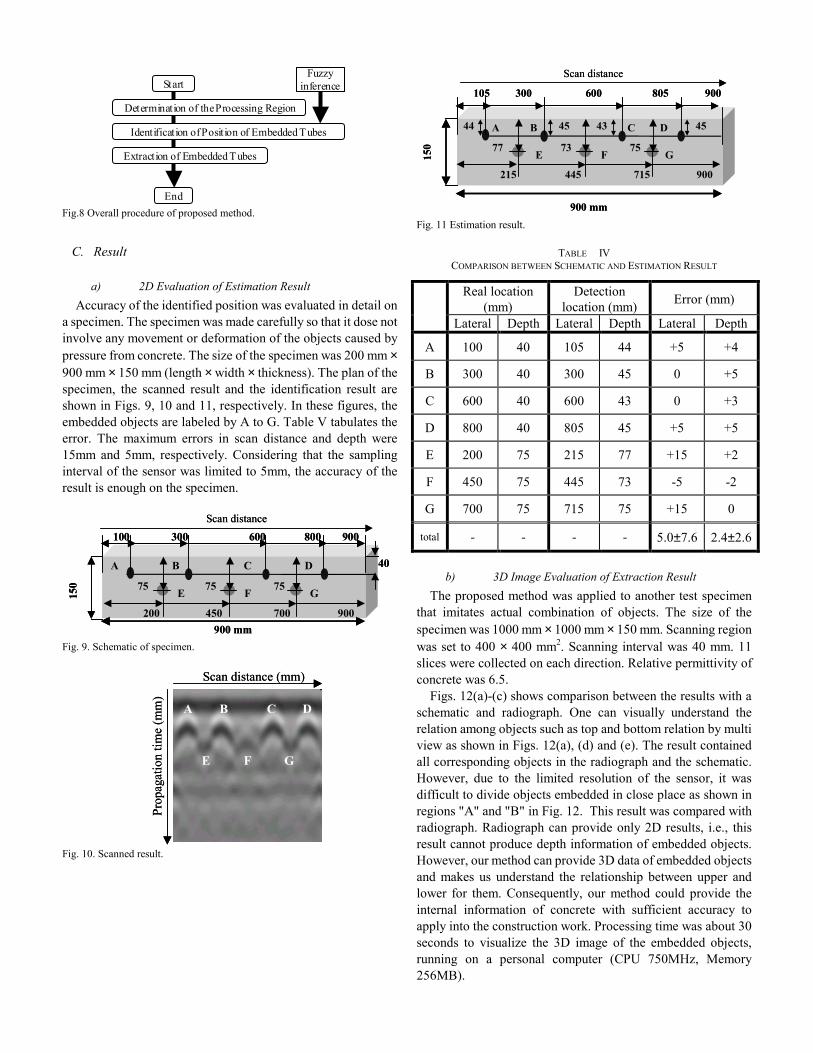
a) 2D Evaluation of Estimation Result Accuracy of the identified position was evaluated in detail on
a specimen. The specimen was made carefully so that it dose not involve any movement or deformation of the objects caused by pressure from concrete. The size of the specimen was 200 mm × 900 mm × 150 mm (length × width × thickness). The plan of the specimen, the scanned result and the identification result are shown in Figs. 9, 10 and 11, respectively. In these figures, the embedded objects are labeled by A to G. Table V tabulates the error. The maximum errors in scan distance and depth were 15mm and 5mm, respectively. Considering that the sampling interval of the sensor was limited to 5mm, the accuracy of the result is enough on the specimen.
450 700
150 75 75 75
40
100 300 600 900800
900 mm200 900
A B C D
E F G
Scan distance
450 700
150 75 75 75
40
100 300 600 900800
900 mm200 900
A B C D
E F G
Scan distance
Fig. 9. Schematic of specimen.
A B C D
E F G
Prop
agat
ion
time
(mm
)
Scan distance (mm)
A B C D
E F G
Prop
agat
ion
time
(mm
)
Scan distance (mm)
Fig. 10. Scanned result.
445 715
150 77 73 75
105 300 600 900805
900 mm
44 4345 45
215 900
A B C D
E F G
Scan distance
445 715
150 77 73 75
105 300 600 900805
900 mm
44 4345 45
215 900
A B C D
E F G
Scan distance
Fig. 11 Estimation result.
TABLE IV COMPARISON BETWEEN SCHEMATIC AND ESTIMATION RESULT
b) 3D Image Evaluation of Extraction Result The proposed method was applied to another test specimen
that imitates actual combination of objects. The size of the specimen was 1000 mm × 1000 mm × 150 mm. Scanning region was set to 400 × 400 mm2. Scanning interval was 40 mm. 11 slices were collected on each direction. Relative permittivity of concrete was 6.5.
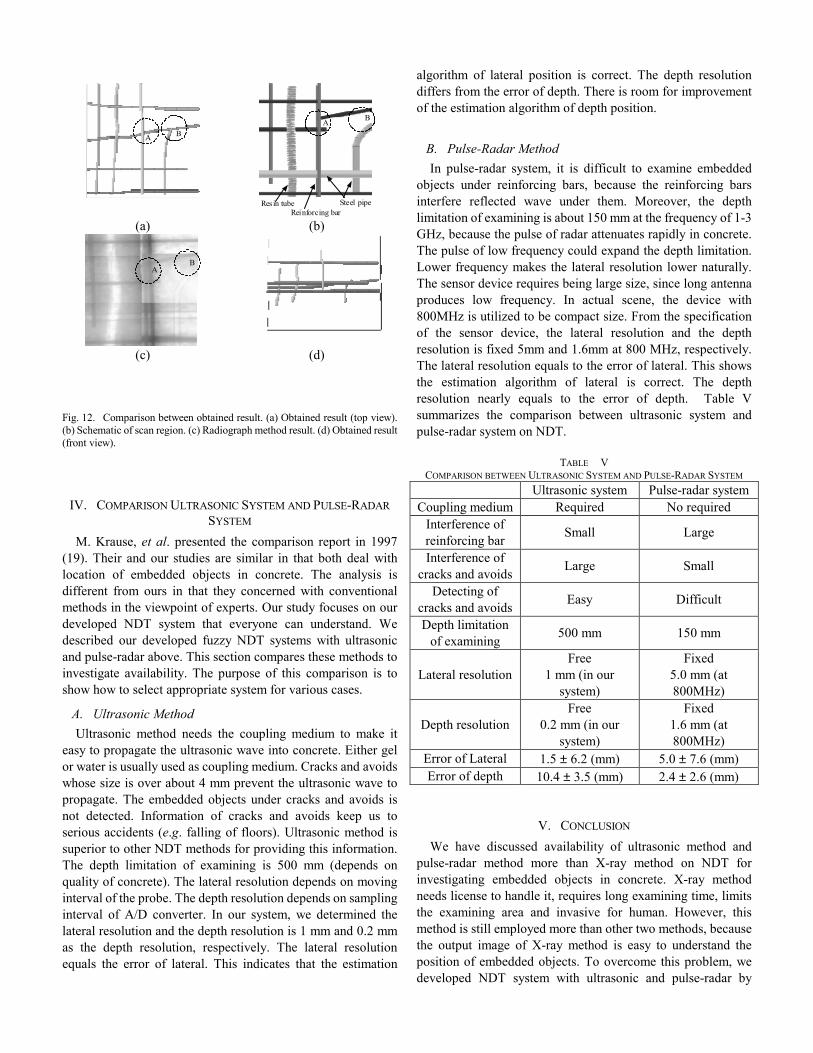
Figs. 12(a)-(c) shows comparison between the results with a schematic and radiograph. One can visually understand the relation among objects such as top and bottom relation by multi view as shown in Figs. 12(a), (d) and (e). The result contained all corresponding objects in the radiograph and the schematic. However, due to the limited resolution of the sensor, it was difficult to divide objects embedded in close place as shown in regions "A" and "B" in Fig. 12. This result was compared with radiograph. Radiograph can provide only 2D results, i.e., this result cannot produce depth information of embedded objects. However, our method can provide 3D data of embedded objects and makes us understand the relationship between upper and lower for them. Consequently, our method could provide the internal information of concrete with sufficient accuracy to apply into the construction work. Processing time was about 30 seconds to visualize the 3D image of the embedded objects, running on a personal computer (CPU 750MHz, Memory 256MB).
Real location (mm)
Detection location (mm) Error (mm)
Lateral Depth Lateral Depth Lateral Depth
A 100 40 105 44 +5 +4
B 300 40 300 45 0 +5
C 600 40 600 43 0 +3
D 800 40 805 45 +5 +5
E 200 75 215 77 +15 +2
F 450 75 445 73 -5 -2
G 700 75 715 75 +15 0
total - - - - 5.0±7.6 2.4±2.6
A B
BA
Resin tubeReinforcing bar
Steel pipe
(a) (b)
AB
(c) (d)
Fig. 12. Comparison between obtained result. (a) Obtained result (top view). (b) Schematic of scan region. (c) Radiograph method result. (d) Obtained result (front view).
IV. COMPARISON ULTRASONIC SYSTEM AND PULSE-RADAR SYSTEM
M. Krause, et al. presented the comparison report in 1997 (19). Their and our studies are similar in that both deal with location of embedded objects in concrete. The analysis is different from ours in that they concerned with conventional methods in the viewpoint of experts. Our study focuses on our developed NDT system that everyone can understand. We described our developed fuzzy NDT systems with ultrasonic and pulse-radar above. This section compares these methods to investigate availability. The purpose of this comparison is to show how to select appropriate system for various cases.
A. Ultrasonic Method Ultrasonic method needs the coupling medium to make it
easy to propagate the ultrasonic wave into concrete. Either gel or water is usually used as coupling medium. Cracks and avoids whose size is over about 4 mm prevent the ultrasonic wave to propagate. The embedded objects under cracks and avoids is not detected. Information of cracks and avoids keep us to serious accidents (e.g. falling of floors). Ultrasonic method is superior to other NDT methods for providing this information. The depth limitation of examining is 500 mm (depends on quality of concrete). The lateral resolution depends on moving interval of the probe. The depth resolution depends on sampling interval of A/D converter. In our system, we determined the lateral resolution and the depth resolution is 1 mm and 0.2 mm as the depth resolution, respectively. The lateral resolution equals the error of lateral. This indicates that the estimation
algorithm of lateral position is correct. The depth resolution differs from the error of depth. There is room for improvement of the estimation algorithm of depth position.
B. Pulse-Radar Method In pulse-radar system, it is difficult to examine embedded
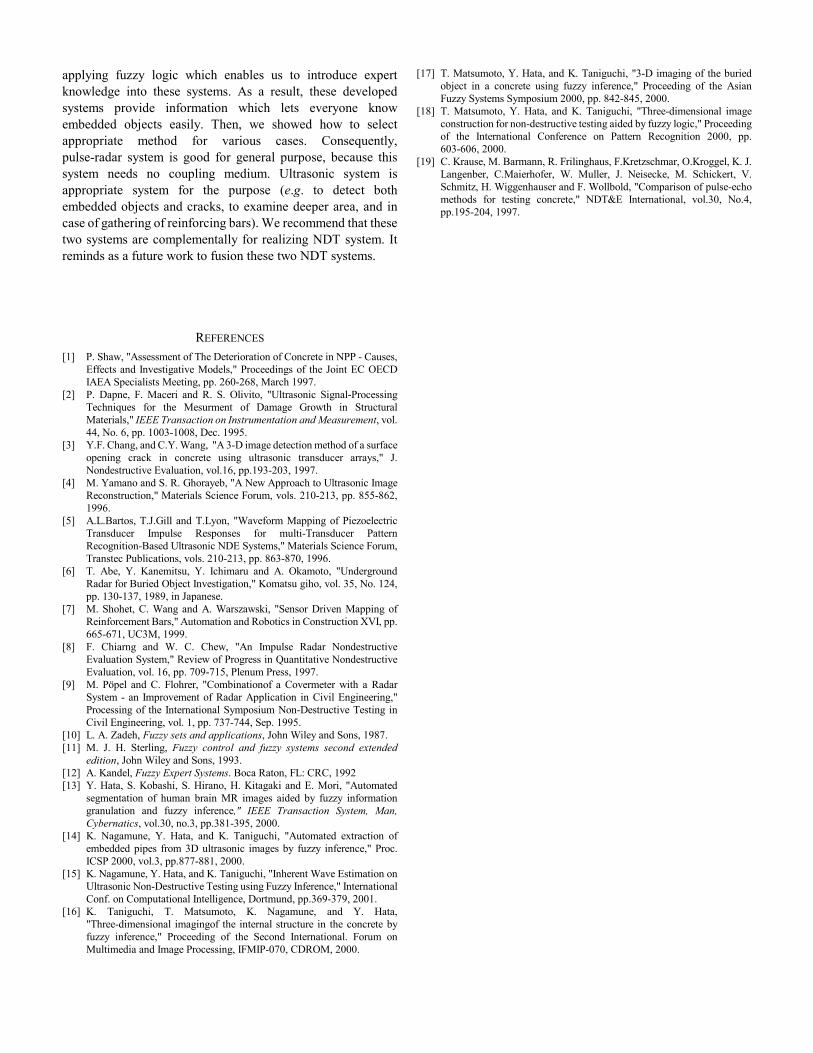
objects under reinforcing bars, because the reinforcing bars interfere reflected wave under them. Moreover, the depth limitation of examining is about 150 mm at the frequency of 1-3 GHz, because the pulse of radar attenuates rapidly in concrete. The pulse of low frequency could expand the depth limitation. Lower frequency makes the lateral resolution lower naturally. The sensor device requires being large size, since long antenna produces low frequency. In actual scene, the device with 800MHz is utilized to be compact size. From the specification of the sensor device, the lateral resolution and the depth resolution is fixed 5mm and 1.6mm at 800 MHz, respectively. The lateral resolution equals to the error of lateral. This shows the estimation algorithm of lateral is correct. The depth resolution nearly equals to the error of depth. Table V summarizes the comparison between ultrasonic system and pulse-radar system on NDT.
TABLE V
COMPARISON BETWEEN ULTRASONIC SYSTEM AND PULSE-RADAR SYSTEM Ultrasonic system Pulse-radar system
Coupling medium Required No required Interference of reinforcing bar Small Large
Interference of cracks and avoids Large Small
Detecting of cracks and avoids Easy Difficult
Depth limitation of examining 500 mm 150 mm
Lateral resolutionFree
1 mm (in our system)
Fixed 5.0 mm (at 800MHz)
Depth resolutionFree
0.2 mm (in our system)
Fixed 1.6 mm (at 800MHz)
Error of Lateral 1.5 ± 6.2 (mm) 5.0 ± 7.6 (mm) Error of depth 10.4 ± 3.5 (mm) 2.4 ± 2.6 (mm)
V. CONCLUSION We have discussed availability of ultrasonic method and
pulse-radar method more than X-ray method on NDT for investigating embedded objects in concrete. X-ray method needs license to handle it, requires long examining time, limits the examining area and invasive for human. However, this method is still employed more than other two methods, because the output image of X-ray method is easy to understand the position of embedded objects. To overcome this problem, we developed NDT system with ultrasonic and pulse-radar by
applying fuzzy logic which enables us to introduce expert knowledge into these systems. As a result, these developed systems provide information which lets everyone know embedded objects easily. Then, we showed how to select appropriate method for various cases. Consequently, pulse-radar system is good for general purpose, because this system needs no coupling medium. Ultrasonic system is appropriate system for the purpose (e.g. to detect both embedded objects and cracks, to examine deeper area, and in case of gathering of reinforcing bars). We recommend that these two systems are complementally for realizing NDT system. It reminds as a future work to fusion these two NDT systems.
REFERENCES [1] P. Shaw, "Assessment of The Deterioration of Concrete in NPP - Causes,
Effects and Investigative Models," Proceedings of the Joint EC OECD IAEA Specialists Meeting, pp. 260-268, March 1997.
[2] P. Dapne, F. Maceri and R. S. Olivito, "Ultrasonic Signal-Processing Techniques for the Mesurment of Damage Growth in Structural Materials," IEEE Transaction on Instrumentation and Measurement, vol. 44, No. 6, pp. 1003-1008, Dec. 1995.
[3] Y.F. Chang, and C.Y. Wang, "A 3-D image detection method of a surface opening crack in concrete using ultrasonic transducer arrays," J. Nondestructive Evaluation, vol.16, pp.193-203, 1997.
[4] M. Yamano and S. R. Ghorayeb, "A New Approach to Ultrasonic Image Reconstruction," Materials Science Forum, vols. 210-213, pp. 855-862, 1996.
[5] A.L.Bartos, T.J.Gill and T.Lyon, "Waveform Mapping of Piezoelectric Transducer Impulse Responses for multi-Transducer Pattern Recognition-Based Ultrasonic NDE Systems," Materials Science Forum, Transtec Publications, vols. 210-213, pp. 863-870, 1996.
[6] T. Abe, Y. Kanemitsu, Y. Ichimaru and A. Okamoto, "Underground Radar for Buried Object Investigation," Komatsu giho, vol. 35, No. 124, pp. 130-137, 1989, in Japanese.
[7] M. Shohet, C. Wang and A. Warszawski, "Sensor Driven Mapping of Reinforcement Bars," Automation and Robotics in Construction XVI, pp. 665-671, UC3M, 1999.
[8] F. Chiarng and W. C. Chew, "An Impulse Radar Nondestructive Evaluation System," Review of Progress in Quantitative Nondestructive Evaluation, vol. 16, pp. 709-715, Plenum Press, 1997.
[9] M. Pöpel and C. Flohrer, "Combinationof a Covermeter with a Radar System - an Improvement of Radar Application in Civil Engineering," Processing of the International Symposium Non-Destructive Testing in Civil Engineering, vol. 1, pp. 737-744, Sep. 1995.
[10] L. A. Zadeh, Fuzzy sets and applications, John Wiley and Sons, 1987. [11] M. J. H. Sterling, Fuzzy control and fuzzy systems second extended
edition, John Wiley and Sons, 1993. [12] A. Kandel, Fuzzy Expert Systems. Boca Raton, FL: CRC, 1992 [13] Y. Hata, S. Kobashi, S. Hirano, H. Kitagaki and E. Mori, "Automated
segmentation of human brain MR images aided by fuzzy information granulation and fuzzy inference," IEEE Transaction System, Man, Cybernatics, vol.30, no.3, pp.381-395, 2000.
[14] K. Nagamune, Y. Hata, and K. Taniguchi, "Automated extraction of embedded pipes from 3D ultrasonic images by fuzzy inference," Proc. ICSP 2000, vol.3, pp.877-881, 2000.
[15] K. Nagamune, Y. Hata, and K. Taniguchi, "Inherent Wave Estimation on Ultrasonic Non-Destructive Testing using Fuzzy Inference," International Conf. on Computational Intelligence, Dortmund, pp.369-379, 2001.
[16] K. Taniguchi, T. Matsumoto, K. Nagamune, and Y. Hata, "Three-dimensional imagingof the internal structure in the concrete by fuzzy inference," Proceeding of the Second International. Forum on Multimedia and Image Processing, IFMIP-070, CDROM, 2000.
[17] T. Matsumoto, Y. Hata, and K. Taniguchi, "3-D imaging of the buried object in a concrete using fuzzy inference," Proceeding of the Asian Fuzzy Systems Symposium 2000, pp. 842-845, 2000.
[18] T. Matsumoto, Y. Hata, and K. Taniguchi, "Three-dimensional image construction for non-destructive testing aided by fuzzy logic," Proceeding of the International Conference on Pattern Recognition 2000, pp. 603-606, 2000.
[19] C. Krause, M. Barmann, R. Frilinghaus, F.Kretzschmar, O.Kroggel, K. J. Langenber, C.Maierhofer, W. Muller, J. Neisecke, M. Schickert, V. Schmitz, H. Wiggenhauser and F. Wollbold, "Comparison of pulse-echo methods for testing concrete," NDT&E International, vol.30, No.4, pp.195-204, 1997.