companhia de bebidas das amÉricas-ambev · ambev reports fourth quarter 2005 results são paulo,...
TRANSCRIPT

6-K 1 cd5188.htm FORM 6-K
SECURITIES AND EXCHANGE COMMISSION Washington, D.C. 20549
FORM 6-K
Report of Foreign Private Issuer
Pursuant to Rule 13a-16 or 15d-16 of the
Securities Exchange Act of 1934
For the month of March, 2006 Commission File Number 1-15194
COMPANHIA DE BEBIDAS DAS
AMÉRICAS-AMBEV
(Exact name of registrant as specified in its charter)
American Beverage Company-AMBEV (Translation of Registrant’s name into English)
Rua Dr. Renato Paes de Barros, 1017 - 4
th Floor
04530-000 São Paulo, SP Federative Republic of Brazil
(Address of principal executive office)
Indicate by check mark whether the registrant files or will file annual reports under cover Form 20-F or
Form 40-F.
Form 20-
F Form 40-
F
Indicate by check mark whether the registrant by furnishing the information contained in this Form is also
thereby furnishing the information to the Commission pursuant to Rule 12g3-2(b) under the Securities
Exchange Act of 1934.
Yes No
AMBEV REPORTS FOURTH QUARTER 2005 RESULTS
São Paulo, February 23, 2006 – Companhia de Bebidas das Américas – AmBev [NYSE: ABV, ABVc
and BOVESPA: AMBV4, AMBV3], the world’s fifth largest brewer and the leading brewer in Latin
America, announces today its results for the fourth quarter 2005 (4Q05). The following financial and
operating information, unless otherwise indicated, is presented in nominal Reais pursuant to Brazilian
GAAP.
AmBev’s consolidated results are the sum of the three following business units:
• Brazil: comprised of (i) Beer Brazil; (ii) CSD & Nanc (Carbonated Soft Drinks and Nanc – Non-
Alcoholic, Non-Carbonated beverages); and (iii) Malt and By-Products Sales;
• Hispanic Latin America (HILA): comprising (i) AmBev’s average 59.1% economic stake in
Quinsa(59.2% on December 31st, 2005); and (ii) HILA-ex (which corresponds to AmBev’s
controlled franchises in Northern Latin America); and
• North America: representing the operations of Labatt Brewing Company Limited (―Labatt‖).
Comparisons, unless otherwise stated, refer to the fourth quarter 2004 (4Q04).
OPERATING AND FINANCIAL HIGHLIGHTS
• Consolidated EBITDA summed up to R$1,889.3 million (+6.6%). EBITDA margin reached 40.6%
(+120 bps).
• Beer Brazil EBITDA’s grew 15.6%; AmBev market share reached 69.4% in December, and sales
volume increased 4.3%, totaling 8.2% for the year, the best result since 1995.
• CSD & Nanc sales volume rose 5.7% in Brazil, yielding an yearly growth for 2005 of 6.0%, the best
performance for AmBev since 2001.
• Quinsa total EBITDA grew 43.1% in American dollars, and, average AmBev stake in Quinsa
throughout the 4Q05 reached 59.1% (4Q04: 54.8%)
• Beer volumes in HILA-ex exceeded 1 million hectoliters within a quarter for the first ever.
• Labatt’s EBITDA increased 5.5% in Canadian dollars, with EBITDA margins reaching 40.6%.
• Earning per thousand share rose 26.8%; excluding goodwill amortization and adjusting the 4Q04
number of outstanding shares for the stock bonus implemented on May 31, 2005 the increase was
7.4%
Financial
Highlights –
AmBev
Consolidated
R$ million 4Q05 4Q04 % Change
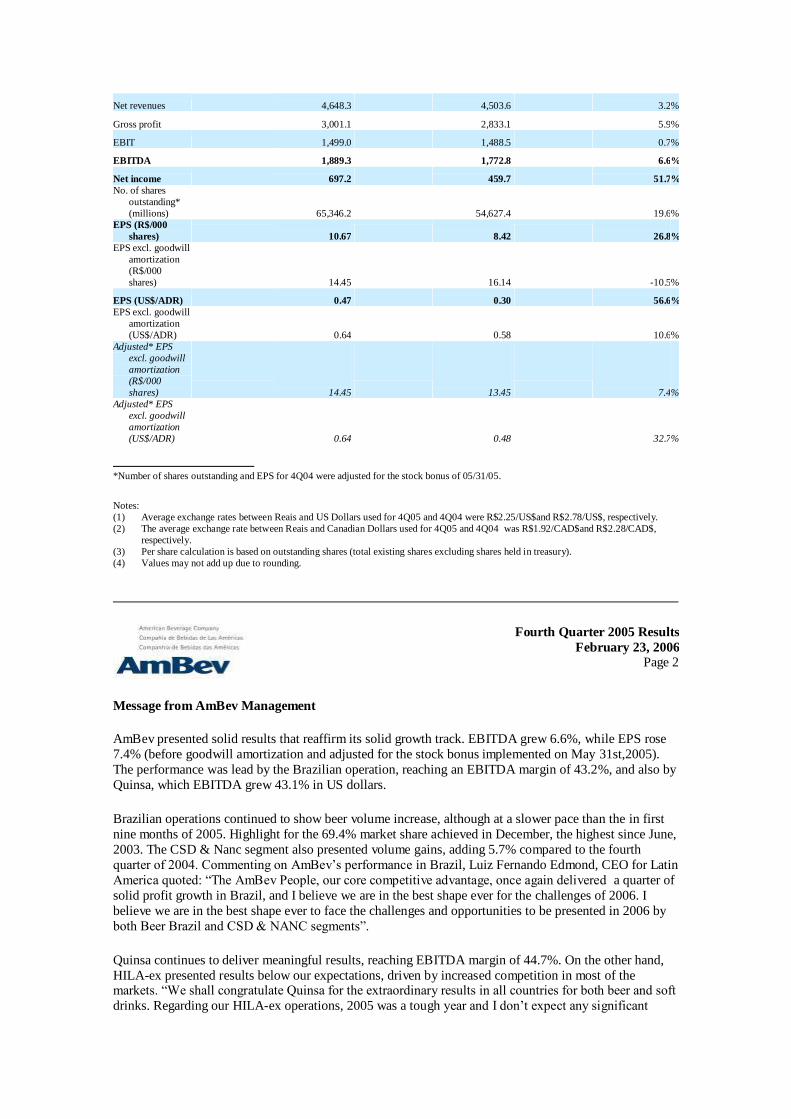
Net revenues 4,648.3 4,503.6 3.2 %
Gross profit 3,001.1 2,833.1 5.9 %
EBIT 1,499.0 1,488.5 0.7 %
EBITDA 1,889.3 1,772.8 6.6 %
Net income 697.2 459.7 51.7 % No. of shares
outstanding*
(millions) 65,346.2 54,627.4 19.6 % EPS (R$/000
shares) 10.67 8.42 26.8 % EPS excl. goodwill
amortization
(R$/000
shares) 14.45 16.14 -10.5 %
EPS (US$/ADR) 0.47 0.30 56.6 % EPS excl. goodwill
amortization
(US$/ADR) 0.64 0.58 10.6 % Adjusted* EPS
excl. goodwill
amortization
(R$/000
shares) 14.45 13.45 7.4 % Adjusted* EPS
excl. goodwill
amortization
(US$/ADR) 0.64 0.48 32.7 %
*Number of shares outstanding and EPS for 4Q04 were adjusted for the stock bonus of 05/31/05. Notes: (1) Average exchange rates between Reais and US Dollars used for 4Q05 and 4Q04 were R$2.25/US$and R$2.78/US$, respectively. (2) The average exchange rate between Reais and Canadian Dollars used for 4Q05 and 4Q04 was R$1.92/CAD$and R$2.28/CAD$,
respectively. (3) Per share calculation is based on outstanding shares (total existing shares excluding shares held in treasury). (4) Values may not add up due to rounding.
Fourth Quarter 2005 Results February 23, 2006
Page 2
Message from AmBev Management
AmBev presented solid results that reaffirm its solid growth track. EBITDA grew 6.6%, while EPS rose
7.4% (before goodwill amortization and adjusted for the stock bonus implemented on May 31st,2005).
The performance was lead by the Brazilian operation, reaching an EBITDA margin of 43.2%, and also by
Quinsa, which EBITDA grew 43.1% in US dollars.
Brazilian operations continued to show beer volume increase, although at a slower pace than the in first
nine months of 2005. Highlight for the 69.4% market share achieved in December, the highest since June,
2003. The CSD & Nanc segment also presented volume gains, adding 5.7% compared to the fourth
quarter of 2004. Commenting on AmBev’s performance in Brazil, Luiz Fernando Edmond, CEO for Latin
America quoted: ―The AmBev People, our core competitive advantage, once again delivered a quarter of
solid profit growth in Brazil, and I believe we are in the best shape ever for the challenges of 2006. I
believe we are in the best shape ever to face the challenges and opportunities to be presented in 2006 by
both Beer Brazil and CSD & NANC segments‖.
Quinsa continues to deliver meaningful results, reaching EBITDA margin of 44.7%. On the other hand,
HILA-ex presented results below our expectations, driven by increased competition in most of the markets. ―We shall congratulate Quinsa for the extraordinary results in all countries for both beer and soft
drinks. Regarding our HILA-ex operations, 2005 was a tough year and I don’t expect any significant
changes for this year. The obstacles and challenges we faced increase our commitment and determination
to achieve strong results within the region high potential‖ said Luiz Fernando Edmond.
AmBev suffered a volume decline in Canada, consequence of an aggressive discount policy implemented
by our competitors. However, the Company made it clear that it will not put long term profitability at risk by pushing short term initiatives focused on pain relief rather than actual fixing structural challenges.
None the less, a 5.5% EBITDA growth was achieved, driven by strong cost control. ―2005 was a tough
year where several structural changes took place. For 2006 we shall be seeking more efficient tools to act
on the market, seeking to raise profitability. Although we are frustrated for we did not deliver on the 15%
EBITDA growth target, we are proud of all the improvements our Canadian team achieved across the
year‖, stated Miguel Patricio, CEO for North America.
Fourth Quarter 2005 Results February 23, 2006
Page 3
OPERATIONAL PERFORMANCE BY BUSINESS UNIT
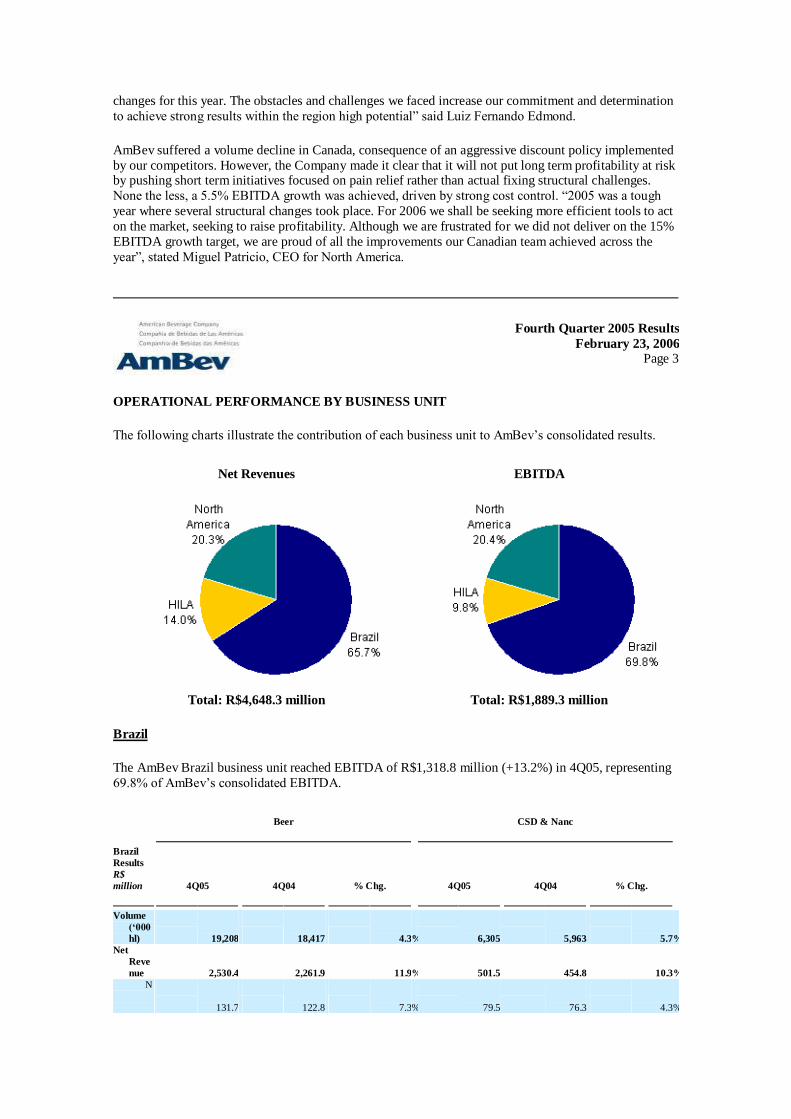
The following charts illustrate the contribution of each business unit to AmBev’s consolidated results.
Net Revenues EBITDA
Total: R$4,648.3 million Total: R$1,889.3 million
Brazil
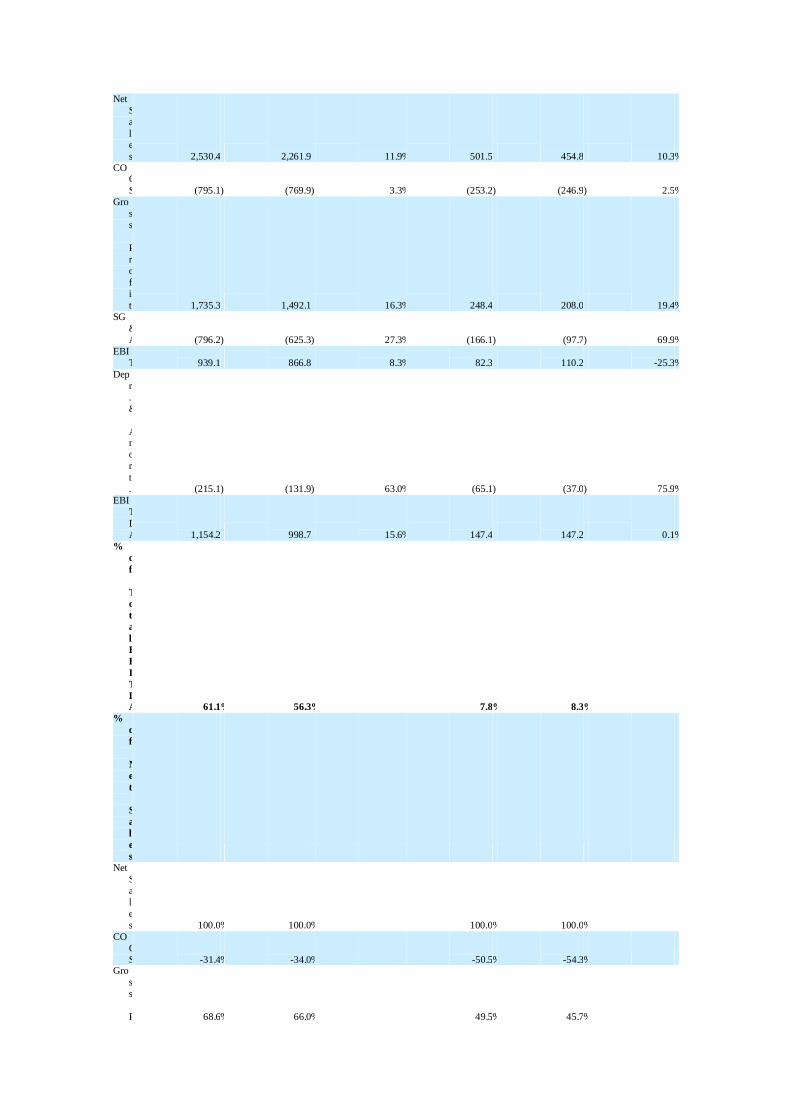
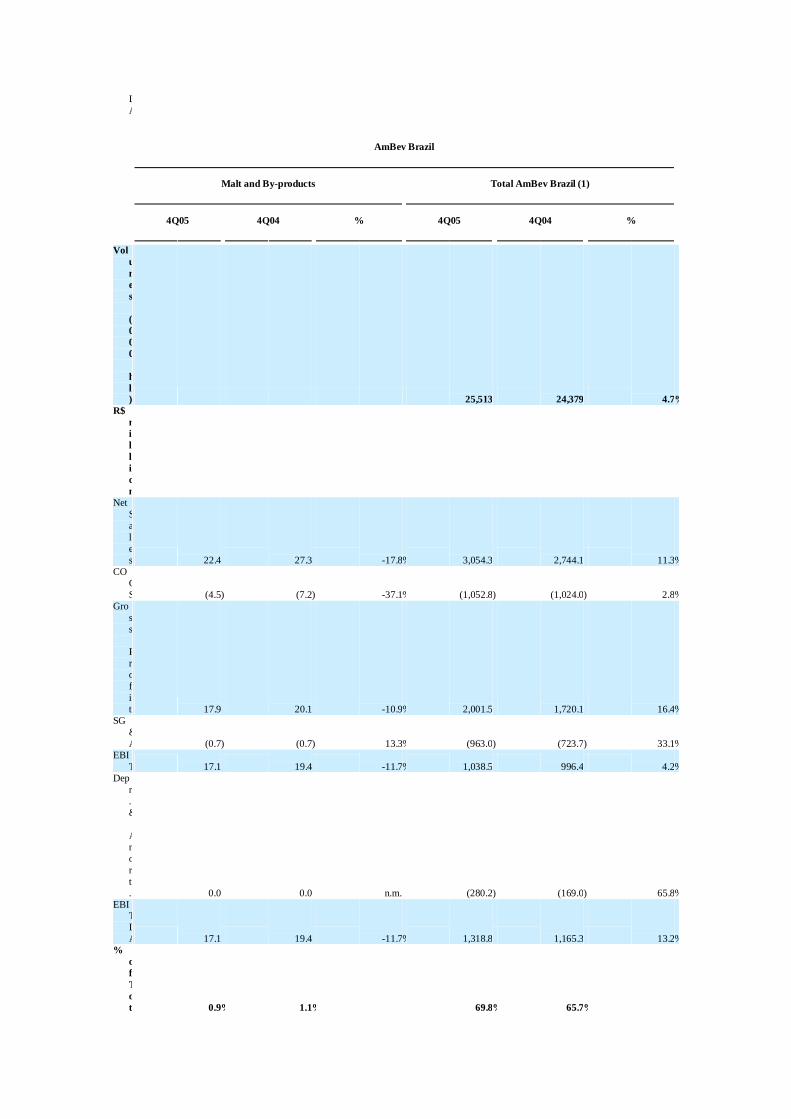
The AmBev Brazil business unit reached EBITDA of R$1,318.8 million (+13.2%) in 4Q05, representing
69.8% of AmBev’s consolidated EBITDA.
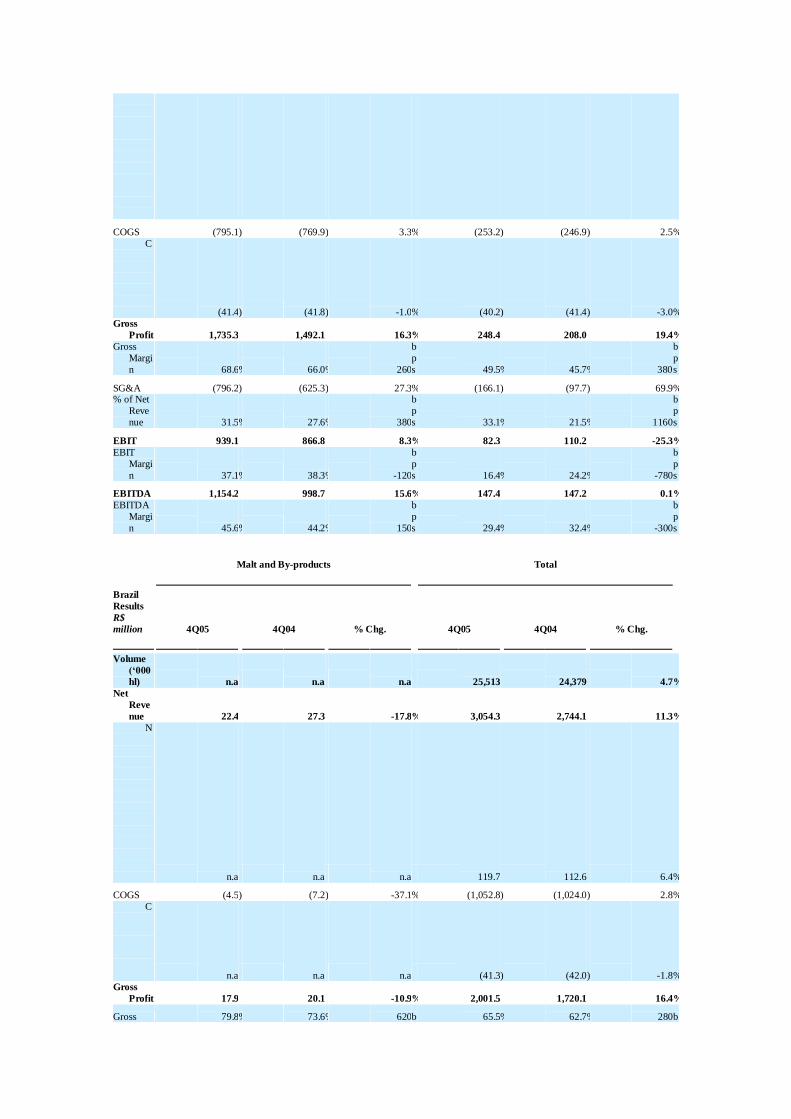
Beer CSD & Nanc
Brazil
Results
R$
million 4Q05 4Q04 % Chg. 4Q05 4Q04 % Chg.
Volume
(‘000
hl) 19,208 18,417 4.3 % 6,305 5,963 5.7 % Net
Reve
nue 2,530.4 2,261.9 11.9 % 501.5 454.8 10.3 % N
e
t 131.7 122.8 7.3 % 79.5 76.3 4.3 %
R
e
v
e
n
ue
/
h
l
COGS (795.1 ) (769.9 ) 3.3 % (253.2 ) (246.9 ) 2.5 % C
O
G
S/
h
l (41.4 ) (41.8 ) -1.0 % (40.2 ) (41.4 ) -3.0 % Gross
Profit 1,735.3 1,492.1 16.3 % 248.4 208.0 19.4 % Gross
Margi
n 68.6 % 66.0 % 260
b
p
s 49.5 % 45.7 % 380
b
p
s
SG&A (796.2 ) (625.3 ) 27.3 % (166.1 ) (97.7 ) 69.9 % % of Net
Reve
nue 31.5 % 27.6 % 380
b
p
s 33.1 % 21.5 % 1160
b
p
s
EBIT 939.1 866.8 8.3 % 82.3 110.2 -25.3 % EBIT
Margi
n 37.1 % 38.3 % -120
b
p
s 16.4 % 24.2 % -780
b
p
s
EBITDA 1,154.2 998.7 15.6 % 147.4 147.2 0.1 % EBITDA
Margi
n 45.6 % 44.2 % 150
b
p
s 29.4 % 32.4 % -300
b
p
s
Malt and By-products Total
Brazil
Results
R$
million 4Q05 4Q04 % Chg. 4Q05 4Q04 % Chg.
Volume
(‘000
hl) n.a n.a n.a 25,513 24,379 4.7 % Net
Reve
nue 22.4 27.3 -17.8 % 3,054.3 2,744.1 11.3 % N
e
t
R
e
v
e
n
u
e
/
h
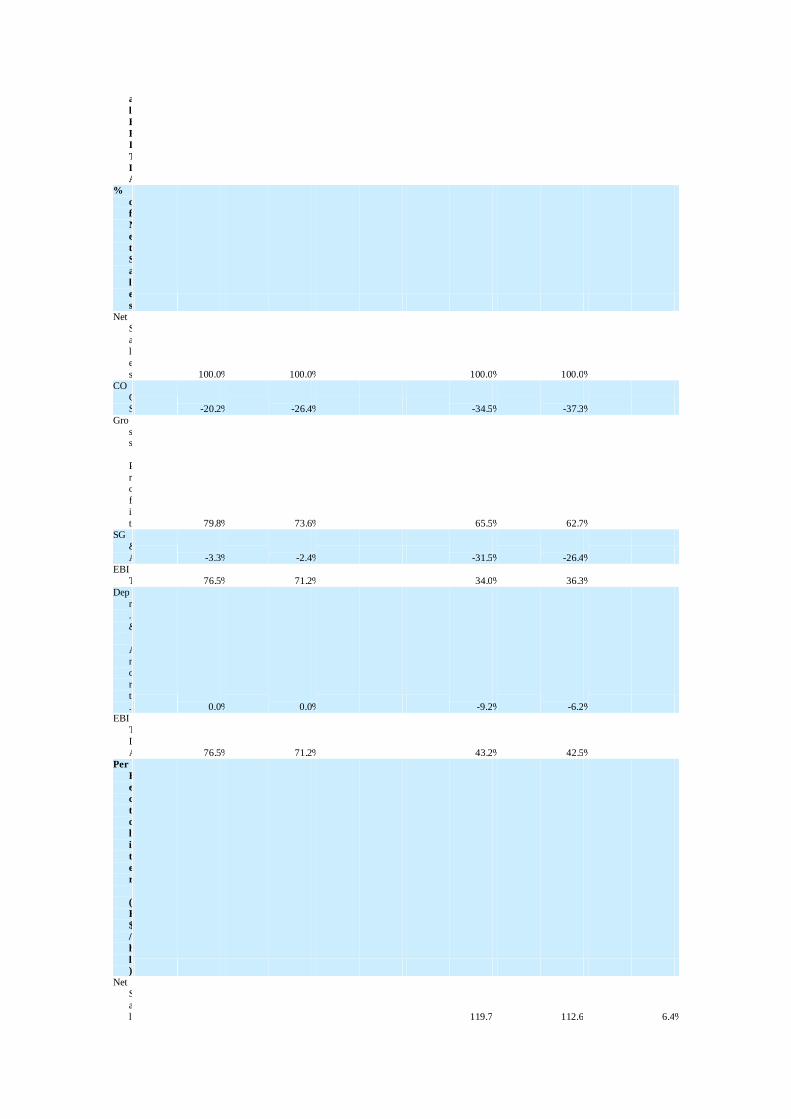
l n.a n.a n.a 119.7 112.6 6.4 %
COGS (4.5 ) (7.2 ) -37.1 % (1,052.8 ) (1,024.0 ) 2.8 % C
O
G
S
/
h
l n.a n.a n.a (41.3 ) (42.0 ) -1.8 % Gross
Profit 17.9 20.1 -10.9 % 2,001.5 1,720.1 16.4 %
Gross 79.8 % 73.6 % 620 b 65.5 % 62.7 % 280 b
Margi
n p
s p
s
SG&A (0.7 ) (0.7 ) 13.3 % (963.0 ) (723.7 ) 33.1 % % of Net
Reve
nue 3.3 % 2.4 % 90
b
p
s 31.5 % 26.4 % 520
b
p
s
EBIT 17.1 19.4 -11.7 % 1,038.5 996.4 4.2 % EBIT
Margi
n 76.5 % 71.2 % 530
b
p
s 34.0 % 36.3 % -230
EBITDA 17.1 19.4 -11.7 % 1,318.8 1,165.3 13.2 % EBITDA
Margi
n 76.5 % 71.2 % 530
b
p
s 43.2 % 42.5 % 70
b
p
s
Beer Brazil
Net Revenues
Net revenues for Beer Brazil operation reached R$2,530.4 million (+11.9%), arising from both higher
sales volume and increase in net revenues per hectoliter.
Fourth Quarter 2005 Results February 23, 2006
Page 4
Beer sales volume grew by 4.3% in the quarter. This result reflects AmBev’s larger market share (4Q05:
69.1%; 4Q04: 67.8%) and the Brazilian market growth (+1.8%) both according to ACNielsen’s estimates.
In December 2005, AmBev’s market share reached 69.4%
Net revenues per hectoliter of beer were R$131.7 million (+7.3%). The main reasons for this increase
were (i) the Company’s ongoing revenue management initiatives, including the development of the
premium segment (major brands in these segment, Bohemia and Original grew on the 4Q05 39.6% and
59.6% respectively; and (ii) the increase in sales volumes through AmBev’s direct distribution structure;
and (iii) the price repositioning implemented by AmBev throughout the month of December. Compared
to the 3Q05, revenues per hectoliter grew 0.7%, as a result of an increasing share of non-returnable
packages within portfolio mix and price repositioning implemented in December.
Cost of Goods Sold (COGS)
COGS for the Beer Brazil operation totaled R$795.1 million (+3.3%). When compared to 4Q04, COGS
per hectoliter remained stable, presenting a slight drop of 1.0% (4Q05: R$41.4; 4Q04: R$41.8). Despite
the higher exchange rate implicit in the hedging policy (4Q05: R$3.11/US$; 4Q04: R$2.87/US$) which is
used for raw material purchases, the Company was able to manage the pressure over its production costs,
mainly through industry efficiency and greater dilution of fixed costs provided by sales volumes growth.
COGS per hectoliter dropped when compared to 3Q05, down by 0.4%.
Gross Profit
Gross profit for Beer Brazil summed up to R$1,735.3 million (+16.3%). Gross margin reached 68.6%, an
expansion of 260 basis points.
SG&A
SG&A expenses for Beer Brazil amounted to R$796.2 million (+27.3%). The main driver for this growth
were (i) higher direct distribution expenses mainly due to the growth in volumes sold through the
Company’s own structure; (ii) administrative expenses related to several projects, such as the corporate

restructuring which resulted in the merge of the subsidiary Companhia Brasileira de Bebidas (CBB) by
AmBev, as well as the adequacy process of the Company’s management structures to the Sarbanes-Oxley
Act requirements; and (iii) higher depreciation and amortization expenses, mainly arising from the
deferred assets amortization generated from the merge of InBev Brasil and CBB.
Total SG&A expenses for Beer Brazil for the year of 2005 increased 20.0% over 2004 (13.5%, excluding
depreciation and amortization expenses), above inflation of 5.7%, measured by IPCA. The Company,
however, remained absolutely loyal to is its historical cost discipline. Indeed, an organic growth analysis
of SG&A expenses presents an increase in line with inflation. Nonetheless, a number of factors offset the
disciplined cost management, namely (i) a record volume growth of 8.2%, yielding higher variable
expenses related tp sales and distribution; (ii) the increase in the Company’s direct distribution structure,
which comprises the acqusition or construction of new distribution centers; (iii) several non-recurring
projects, such as Company’s ERP update, Sarbanes-Oxley act adequacy and corporate re-structure; and
(iv) a relevant increase on amortization expenses of deferred assets, as a consequence of InBev Brasil and
CBB mergers into AmBev.
In addition, total SG&A expenses, excluding depreciation and amortization, accounted for 24.2% of net
revenues, compared to 25.0% in 2004.
Fourth Quarter 2005 Results February 23, 2006
Page 5
EBIT and EBITDA
Beer Brazil’s EBIT totaled R$939.1 million (+8.3%). EBIT margin decreased by 120 basis points, reaching 37.1%.
EBITDA for Beer Brazil amounted to R$1,154.2 million (+15.6%), and EBITDA margin stood at 45.6%
(+150 basis points).
CSD & Nanc
Net Revenues
CSD & Nanc business segment recorded net revenues of R$501.5 million (+10.3%), boosted by growth
of sales volume and also by increasing net revenues per hectoliter.
Sales volumes grew by 5.7%, which can be explained by AmBev’s higher market share (4Q05: 17.5%;
4Q04: 16.9%; ACNielsen estimates). Net revenues per hectoliter went up by 4.3% (4Q05: R$79.5; 4Q04:
R$76.3) reflecting (i) the Company’s ongoing revenue management initiatives; and (ii) increased sales
volume through AmBev’s direct distribution structure; and (iii) price repositioning held by AmBev
throughout the year. When compared to 3Q05, the net revenues per hectoliter declined 2.5%. Such
reduction was mainly caused by higher share of multi serve packages of 2.0 and 2.5 liters in the sales mix.
COGS
COGS for CSD & Nanc reached R$253.2 million (+2.5%), and COGS per hectoliter stood at R$40.2 (-
3.0%). Despite higher sugar prices and higher exchange rate implicit in the hedging policy of AmBev
(4Q05: R$3.11/US$; 4Q04: R$2.87/US$), which is used in the acquisition of inputs, the Company was
able to avoid the pressure over its cost base mainly through: (i) industry efficiency gains; (ii) lower prices
for PET purchases; and (iii) greater fixed costs dilution driven by sales volume growth. When compared
to 3Q05, COGS per hectoliter decreased 1.7%, as a result of lower share of cans in sales mix. Such effect,
however, jeopardizes the profitability of CSD & Nanc operation, since the can package is the most profitable in the portfolio of such segment.
Gross Profit
Gross profit in the CSD & Nanc business segment totaled R$248.4 million (+19.4%), while the gross
margin expanded by 380 basis, reaching 49.5%.
SG&A
SG&A expenses for CSD & Nanc operation amounted to R$166.1 million (+69.9%).
The growth observed is mostly explained by the combination of five effects: (i) the recomposition of
Sales and Marketing budget for CSD & Nanc in 2005, adjusting investments in our brands to the high
profitability reached in this operation (compounded annual growth rate for CSD & Nanc EBITDA on the
last three years was 40.0%); (ii) trade marketing initiatives concentration in the fourth quarter of the year;
(iii) higher direct distribution expenses mainly deriving from the growth in volumes sold through the
Company’s own structure; (iv) administrative expenses related to several projects, such as the corporate
restructuring which resulted in the merge of subsidiary Companhia Brasileira de Bebidas (CBB) by
AmBev, as well as the adequacy process of the Company’s management structures to the Sarbanes-Oxley
Act requirements; and (v) higher depreciation and amortization expenses, mainly arising from the
deferred assets amortization generated from the merge of InBev Brasil and CBB.
Fourth Quarter 2005 Results February 23, 2006
Page 6
Total SG&A expenses for CSD & Nanc for the year of 2005 grew 32.1% (24.3% excluding depreciation and amortization expenses). The same comment for Beer Brazil also applies for CSD & Nanc, with the
difference that organic SG&A growth was slightly superior than inflation, as a consequence of an
increase in Sales and Marketing expenses, as explained in the previous paragraph.
EBIT and EBITDA
EBIT for CSD & Nanc totaled R$82.3 million (-25.3%). EBIT margin decreased by 780 basis points, and
stood at 16.4%.
EBITDA for the segment reached R$147.4 million (+0.1%), and EBITDA margin decreased by 300 basis
points to 29.4%.
The company highlights that EBITDA performance for CSD & Nanc in the fourth quarter was caped by Sales and Marketing expenses during such period, and does not reflect the solid 20.6% earnings growth
reached by the segment in 2005.
Malt and By-Products
Net revenues for Malt and By-Products reached R$22.4 million (-17.8%). EBIT and EBITDA where
R$17.1 million (-11.7%).
Fourth Quarter 2005 Results February 23, 2006
Page 7
Hispanic Latin America – HILA

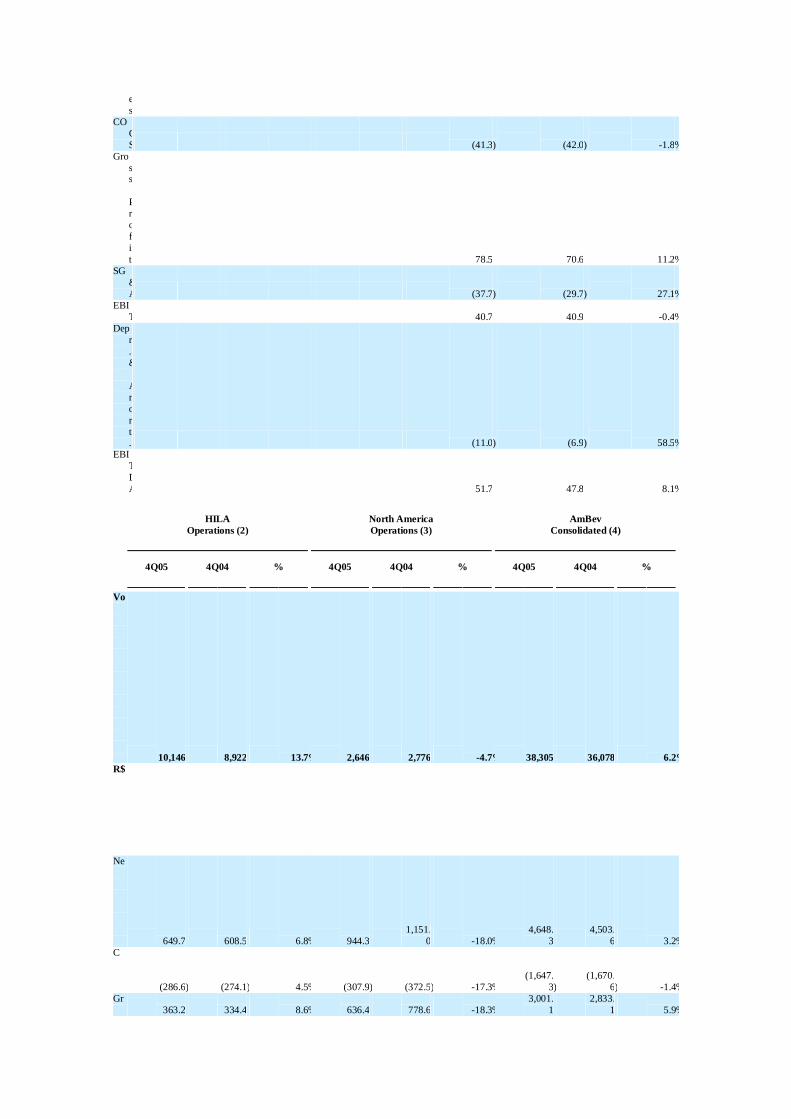
HILA operations reached an EBITDA of R$185.7 million (+1.9%), accounting for 9.8% of AmBev’s
total EBITDA.
Quinsa HILA-ex
HILA
Consol.
Results
R$
million 4Q05 4Q04 % Chg. 4Q05 4Q04 % Chg.
Volume
(‘000
hl) 8,166 7,099 15.0 % 1,979 1,823 8.6 % Net
Reve
nue 433.5 376.2 15.2 % 216.2 232.3 -6.9 % N
e
t
R
e
v
e
n
u
e
/
h
l 89.8 96.7 -7.2 % 109.2 127.4 -14.3 %
COGS (167.8 ) (160.0 ) 4.9 % (118.7 ) (114.1 ) 4.1 % C
O
G
S
/
h
l (34.8 ) (41.1 ) -15.5 % (60.0 ) (62.6 ) -4.2 % Gross
Profit 265.7 216.2 22.9 % 97.5 118.2 -17.5 % Gross
Margi
n 61.3 % 57.5 % 380
b
p
s 45.1 % 50.9 % -580
b
p
s
SG&A (100.6 ) (92.8 ) 8.4 % (126.8 ) (110.4 ) 14.8 % % of Net
Reve
nue 23.2 % 24.7 % -150
b
p
s 58.6 % 47.5 % 1110
b
p
s
EBIT 165.1 123.4 33.8 % (29.3 ) 7.7 n.s. EBIT
Margi
n 38.1 % 32.8 % 530
b
p
s -13.6 % 3.3 % n.s.
EBITDA 193.7 150.3 28.9 % (8.0 ) 32.0 n.s. EBITDA
Margi
n 44.7 % 39.9 % 470
b
p
s -3.7 % 13.8 % n.s.
Total
HILA Consol.
Results
R$ million 4Q05 4Q04 % Chg.
Volume (‘000 hl) 10,146 8,922 13.7 %
Net Revenue 649.7 608.5 6.8 % Net
Reven
ue/hl 95.4 106.5 -10.4 %
COGS (286.6 ) (274.1 ) 4.5 %
COGS/hl (42.1 ) (48.0 ) -12.3 %

Gross Profit 363.2 334.4 8.6 %
Gross Margin 55.9 % 55.0 % 90 bp
s
SG&A (227.4 ) (203.2 ) 11.9 %
% of Net Revenue 35.0 % 33.4 % 160 bp
s
EBIT 135.8 131.2 3.5 %
EBIT Margin 20.9 % 21.6 % -70 bp
s
EBITDA 185.7 182.3 1.9 %
EBITDA Margin 28.6 % 30.0 % -140 bp
s Note: volumes refer to total sales volumes, not only our proportional consolidation. However, in order to calculate per hl figures,
proportional volumes were used to asure consistency
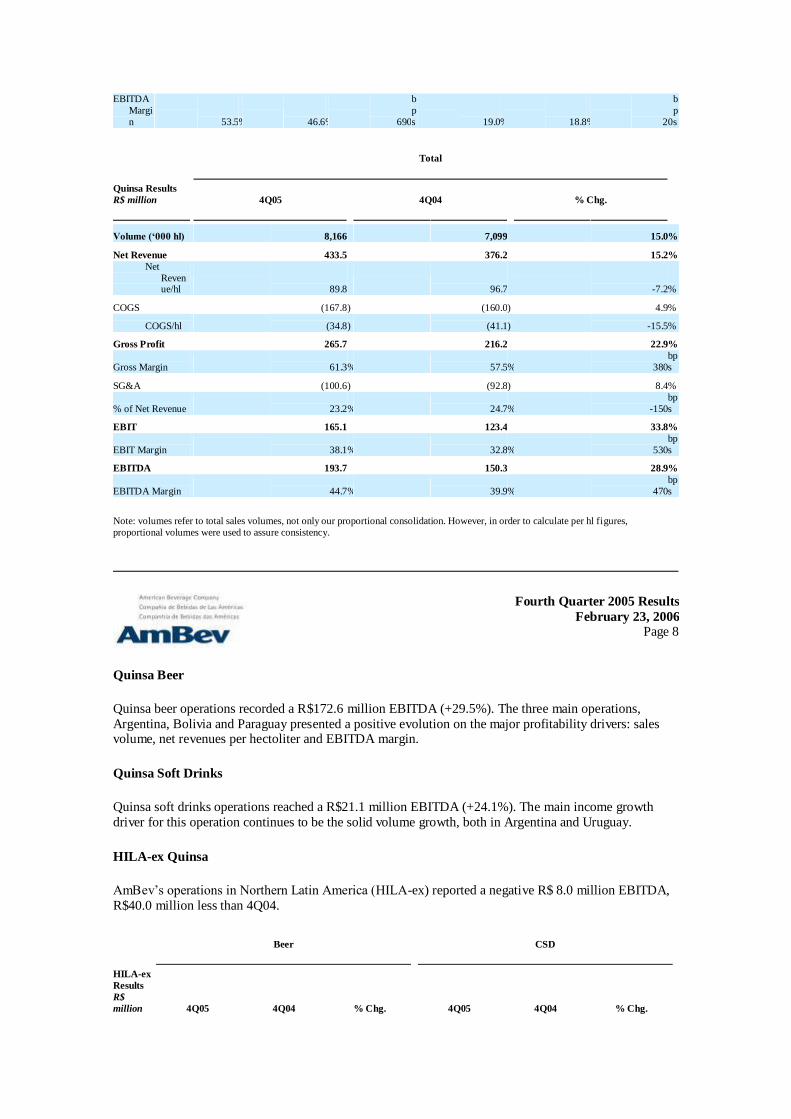
Quinsa
AmBev’s stake in Quinsa averaged 59.1% in 4Q05 (4Q04: 54.8%; 3Q05: 56.4%), and yielded an
EBITDA of R$193.7 million (+28.9%) for the Company.
Beer CSD
Quinsa
Results
R$
million 4Q05 4Q04 % Chg. 4Q05 4Q04 % Chg.
Volume
(‘000
hl) 5,271 4,949 6.5 % 2,896 2,149 34.7 % Net
Reve
nue 322.4 285.8 12.8 % 111.1 90.5 22.8 % N
e
t
R
e
v
e
n
u
e
/
hl 103.5 105.4 -1.8 % 64.9 76.8 -15.5 %
COGS (99.0 ) (104.8 ) -5.5 % (68.8 ) (55.2 ) 24.5 % C
O
G
S
/
h
l (31.8 ) (38.6 ) -17.7 % (40.2 ) (46.9 ) -14.3 % Gross
Profit 223.4 181.0 23.4 % 42.3 35.2 20.0 % Gross
Margi
n 69.3 % 63.3 % 600
b
p
s 38.1 % 39.0 % -90
b
p
s
SG&A (75.3 ) (69.6 ) 8.2 % (25.3 ) (23.2 ) 9.0 % % of Net
Reve
nue 23.4 % 24.4 % -100
b
p
s 22.8 % 25.6 % -290
b
p
s
EBIT 148.1 111.4 33.0 % 17.0 12.1 41.2 % EBIT
Margi
n 45.9 % 39.0 % 690
b
p
s 15.3 % 13.3 % 200
b
p
s
EBITDA 172.6 133.3 29.5 % 21.1 17.0 24.1 %
EBITDA
Margi
n 53.5 % 46.6 % 690
b
p
s 19.0 % 18.8 % 20
b
p
s
Total
Quinsa Results
R$ million 4Q05 4Q04 % Chg.
Volume (‘000 hl) 8,166 7,099 15.0 %
Net Revenue 433.5 376.2 15.2 % Net
Revenue/hl 89.8 96.7 -7.2 %
COGS (167.8 ) (160.0 ) 4.9 %
COGS/hl (34.8 ) (41.1 ) -15.5 %
Gross Profit 265.7 216.2 22.9 %
Gross Margin 61.3 % 57.5 % 380 bp
s
SG&A (100.6 ) (92.8 ) 8.4 %
% of Net Revenue 23.2 % 24.7 % -150 bp
s
EBIT 165.1 123.4 33.8 %
EBIT Margin 38.1 % 32.8 % 530 bp
s
EBITDA 193.7 150.3 28.9 %
EBITDA Margin 44.7 % 39.9 % 470 bp
s Note: volumes refer to total sales volumes, not only our proportional consolidation. However, in order to calculate per hl figures,
proportional volumes were used to assure consistency.
Fourth Quarter 2005 Results February 23, 2006
Page 8
Quinsa Beer
Quinsa beer operations recorded a R$172.6 million EBITDA (+29.5%). The three main operations,
Argentina, Bolivia and Paraguay presented a positive evolution on the major profitability drivers: sales volume, net revenues per hectoliter and EBITDA margin.
Quinsa Soft Drinks
Quinsa soft drinks operations reached a R$21.1 million EBITDA (+24.1%). The main income growth
driver for this operation continues to be the solid volume growth, both in Argentina and Uruguay.
HILA-ex Quinsa
AmBev’s operations in Northern Latin America (HILA-ex) reported a negative R$ 8.0 million EBITDA,
R$40.0 million less than 4Q04.
Beer CSD
HILA-ex
Results
R$
million 4Q05 4Q04 % Chg. 4Q05 4Q04 % Chg.

Volume
(‘000
hl) 1,059 819 29.3 % 920 1,004 -8.3 % Net
Reve
nue 148.6 126.2 17.7 % 67.6 106.0 -36.2 % N
e
t
R
e
v
e
nu
e
/
h
l 140.3 154.0 -8.9 % 73.5 105.7 -30.4 %
COGS (74.2 ) (59.1 ) 25.5 % (44.6 ) (55.0 ) -19.0 % C
O
GS
/
h
l (70.0 ) (72.1 ) -2.9 % (48.5 ) (54.8 ) -11.6 % Gross
Profit 74.4 67.1 10.9 % 23.0 51.0 -54.9 % Gross
Margi
n 50.1 % 53.2 % -310
b
p
s 34.1 % 48.1 % -1410
b
p
s
SG&A (90.6 ) (73.8 ) 22.8 % (36.2 ) (36.7 ) -1.3 % % of Net
Reve
nue 61.0 % 58.4 % 250
b
p
s 53.5 % 34.6 % 1890
b
p
s
EBIT (16.2 ) (6.6 ) n.s. (13.1 ) 14.4 n.s. EBIT
Margi
n -10.9 % -5.3 % n.s. -19.4 % 13.5 % n.s.
EBITDA (3.1 ) 9.2 n.s. (4.9 ) 22.8 n.s. EBITDA
Margi
n -2.1 % 7.3 % n.s. -7.2 % 21.5 % n.s.
Total
HILA-ex Results
R$ million 4Q05 4Q04 % Chg.
Volume (‘000 hl) 1,979 1,823 8.6 %
Net Revenue 216.2 232.3 -6.9 % Net
Revenue/hl 109.2 127.4 -14.3 %
COGS (118.7 ) (114.1 ) 4.1 %
COGS/hl (60.0 ) (62.6 ) -4.2 %
Gross Profit 97.5 118.2 -17.5 %
Gross Margin 45.1 % 50.9 % -580 bp
s
SG&A (126.8 ) (110.4 ) 14.8 %
% of Net Revenue 58.6 % 47.5 % 1110 bp
s
EBIT (29.3 ) 7.7 n.s.
EBIT Margin -13.6 % 3.3 % n.s.
EBITDA (8.0 ) 32.0 n.s.
EBITDA Margin -3.7 % 13.8 % n.s.
HILA-ex Beer
HILA-ex beer operations delivered a negative EBITDA of R$3.1 million, a decline of R$12.3 million.
The main resason for this loss were the expenses related to the launch of the Brahma brand in Peru and
the Dominican Republic. Regardless the fact that in both markets Brahma sales started in the 3Q05, promotional activities were concentrated in the en of the year.
Venezuela was the highlight for the other markets where AmBev sells Brahma. The company remains in
the country on a coinsistent volume growth track. On the other hand, operations in Central America and
Ecuador are facing difficulties to achieve greater market share. Among the major challenges, certain
competitors are implementing massive commercial acivities and lower prices. Consequently the results
achieved in such operations are below the Company’s expectations.
Fourth Quarter 2005 Results February 23, 2006
Page 9
HILA-ex Soft Drinks
HILA-ex soft drinks operations EBITDA was negative in R$4.9 million, R$27.7 million less than 4Q04.
Both operations had their earnings affected by an aggressive competitive environment and the strong
depreciation of their local currencies against the Real.
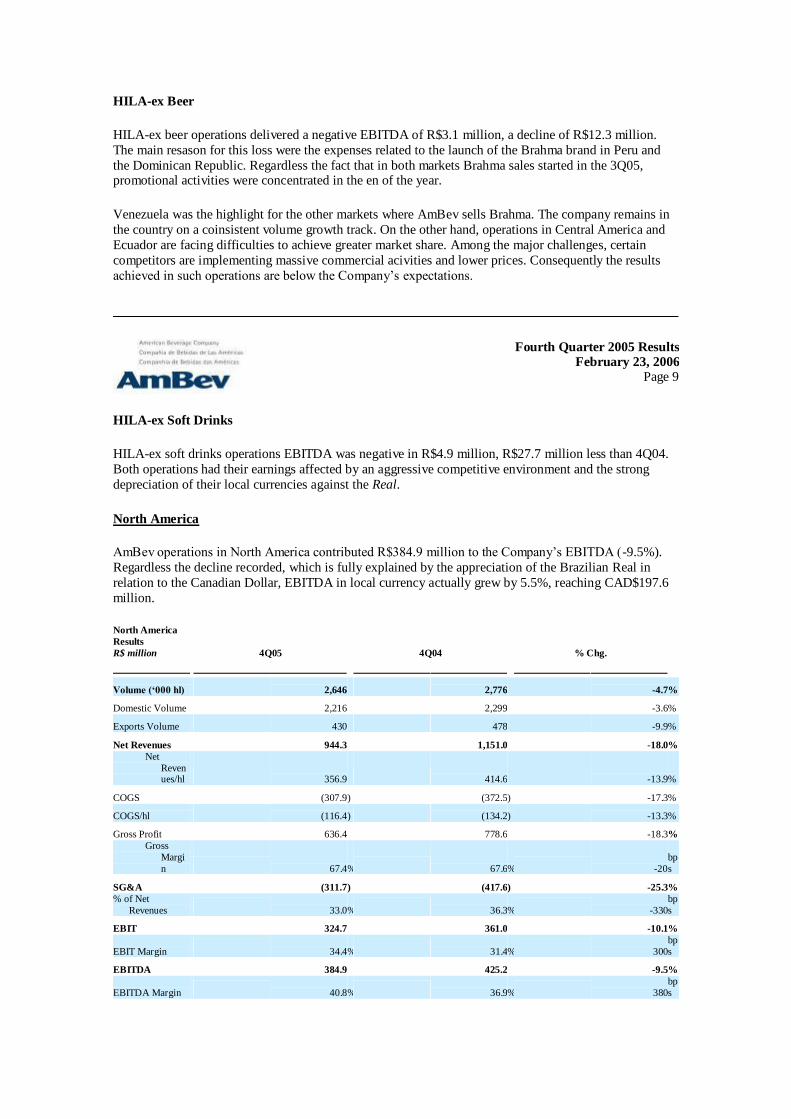
North America
AmBev operations in North America contributed R$384.9 million to the Company’s EBITDA (-9.5%).
Regardless the decline recorded, which is fully explained by the appreciation of the Brazilian Real in
relation to the Canadian Dollar, EBITDA in local currency actually grew by 5.5%, reaching CAD$197.6
million.
North America
Results
R$ million 4Q05 4Q04 % Chg.
Volume (‘000 hl) 2,646 2,776 -4.7 %
Domestic Volume 2,216 2,299 -3.6 %
Exports Volume 430 478 -9.9 %
Net Revenues 944.3 1,151.0 -18.0 % Net
Revenues/hl 356.9 414.6 -13.9 %
COGS (307.9 ) (372.5 ) -17.3 %
COGS/hl (116.4 ) (134.2 ) -13.3 %
Gross Profit 636.4 778.6 -18.3 % Gross
Margi
n 67.4 % 67.6 % -20 bp
s
SG&A (311.7 ) (417.6 ) -25.3 % % of Net
Revenues 33.0 % 36.3 % -330 bp
s
EBIT 324.7 361.0 -10.1 %
EBIT Margin 34.4 % 31.4 % 300 bp
s
EBITDA 384.9 425.2 -9.5 %
EBITDA Margin 40.8 % 36.9 % 380 bp
s

Fourth Quarter 2005 Results February 23, 2006
Page 10
North America
Results
CAD $ million 4Q05 4Q04 % Chg.
Volume (‘000 hl) 2,646 2,776 -4.7 %
Domestic Volume 2,216 2,299 -3.6 %
Exports Volume 430 478 -9.9 %
Net Revenues 486.5 504.9 -3.6 % Net
Reven
ues/hl 183.9 181.8 1.1 % Domestic Net
Revenues 462.1 475.6 -2.8 % Exports Net
Revenues 24.4 29.3 -16.8 %
COGS (159.1 ) (162.8 ) -2.3 %
COGS/hl (60.1 ) (58.6 ) 2.5 %
Gross Profit 327.4 342.0 -4.3 %
Gross Margin 67.3 % 67.7 % -50 bp
s
SG&A (161.0 ) (182.8 ) -12.0 % % of Net
Revenues 33.1 % 36.2 % -310 bp
s
EBIT 166.4 159.2 4.5 %
EBIT Margin 34.2 % 31.5 % 270 bp
s
EBITDA 197.6 187.3 5.5 %
EBITDA Margin 40.6 % 37.1 % 350 bp
s
Net Revenues
Net revenues in Canada declined to CAD$486.5 million (-3.6%), a result of lower volumes in both the
domestic and export business, which were not offset by the growth in revenue per hectoliter of 1.1%
(4Q05: CAD$183.9; 4Q04: CAD$ 181.8).
The domestic segment volume decline (-3.6%) was a consequence of aggressive pricing activity from
AmBev’s main competitor in Canada, both in Ontario and Quebec. The Company, however, was not
willing to erode brand equity through pricing.
Competition in the US mainstream segment, where our Canadian brands compete, coupled with lower
year end inventories in a major retailer in upstate New York, drove the volume decline (-9.9%).
Depletions did not experience the same level of decline. Blue Light is showing healthy growth.
The growth of net revenues per hectoliter is explained by (i) a 1.0% growth in net revenues per hectoliter
of domestic sales; and (ii) a higher share of domestic sales in the sales mix. This mitigated a 7.7%
decline in net revenues per hectoliter in the exports segment, primarily caused by the appreciation of the
Canadian Dollar in relation to the US dollar.
COGS
COGS in North America amounted to CAD$159.1 million (-2.3%). COGS per hectoliter, however,
increased 2.5%, an increase explained by (i) a higher share of Budweiser, Bud Light and imports in the sales mix and (ii) increased utility costs, primarily natural gas.
Gross Profit
Gross Profit in North America declined to CAD$327.4 million (-4.3%), impacted by both the lower sales
volume and the higher COGS per hectoliter.
Fourth Quarter 2005 Results
February 23, 2006 Page 11
SG&A
SG&A expenses decreased to CAD$161.0 million (-12.0%), a result of AmBev’s strong commitment
towards costs and expenses reduction. The successful implementation of Zero Based Budgeting in North
America fostered the development of a tighter cost conscious culture. All employees are motivated to
turn ―non-working‖ dollars into extra investment dollars to strengthen AmBev brands.
Savings in SG&A for the year amounted to CAD$49.3 million, representing a decline of 6.3% compared
to 4Q04 SG&A.
EBIT and EBITDA
North America operations delivered EBIT of CAD$166.4 million (+4.5%), yielding an EBIT margin of
34.2% (+270 bps).
EBITDA amounted to CAD$197.6 million (+5.5%), yielding an EBITDA margin of 40.6% (+350 bps).
Fourth Quarter 2005 Results
February 23, 2006 Page 12
AMBEV – CONSOLIDATED RESULTS
The combination of AmBev’s Brazil, HILA and North America business units comprise our consolidated
financial statements. The section below presents results consolidated on an aggregated basis. For detailed
analysis on each operation refer to the section Operational Performance by Business Unit.
Net Revenues
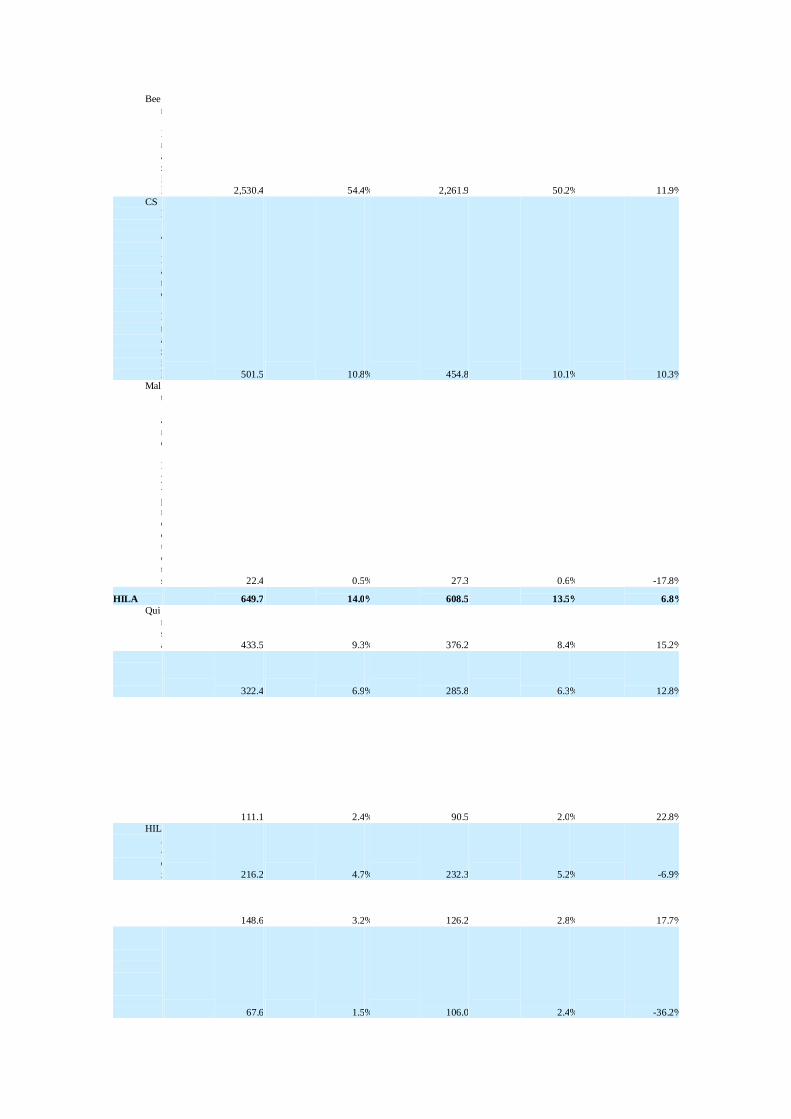
AmBev’s net revenues reached R$4,648.3 million (+3.2%). The table below shows details on net
revenues per business unit.
4Q05 4Q04
Net
Revenu
es R$ million % Total R$ million % Total % Change
Brazil 3,054.3 65.7 % 2,744.1 60.9 % 11.3 %
Bee
r
B
r
a
zi
l 2,530.4 54.4 % 2,261.9 50.2 % 11.9 % CS
D
&
N
a
n
c
B
r
a
z
i
l 501.5 10.8 % 454.8 10.1 % 10.3 % Mal
t
a
nd
B
y
-
p
r
o
d
u
c
t
s 22.4 0.5 % 27.3 0.6 % -17.8 %
HILA 649.7 14.0 % 608.5 13.5 % 6.8 % Qui
n
s
a 433.5 9.3 % 376.2 8.4 % 15.2 % B
e
e
r 322.4 6.9 % 285.8 6.3 % 12.8 % S
o
f
t
d
r
i
n
ks 111.1 2.4 % 90.5 2.0 % 22.8 %
HIL
A
-
e
x 216.2 4.7 % 232.3 5.2 % -6.9 % B
e
e
r 148.6 3.2 % 126.2 2.8 % 17.7 % S
o
f
t
d
r
i 67.6 1.5 % 106.0 2.4 % -36.2 %

n
k
s North
Americ
a 944.3 20.3 % 1,151.0 25.6 % -18.0 %
Consolidat
ed 4,648.3 100.0 % 4,503.6 100.0 % 3.2 %
Cost of Goods Sold (COGS)
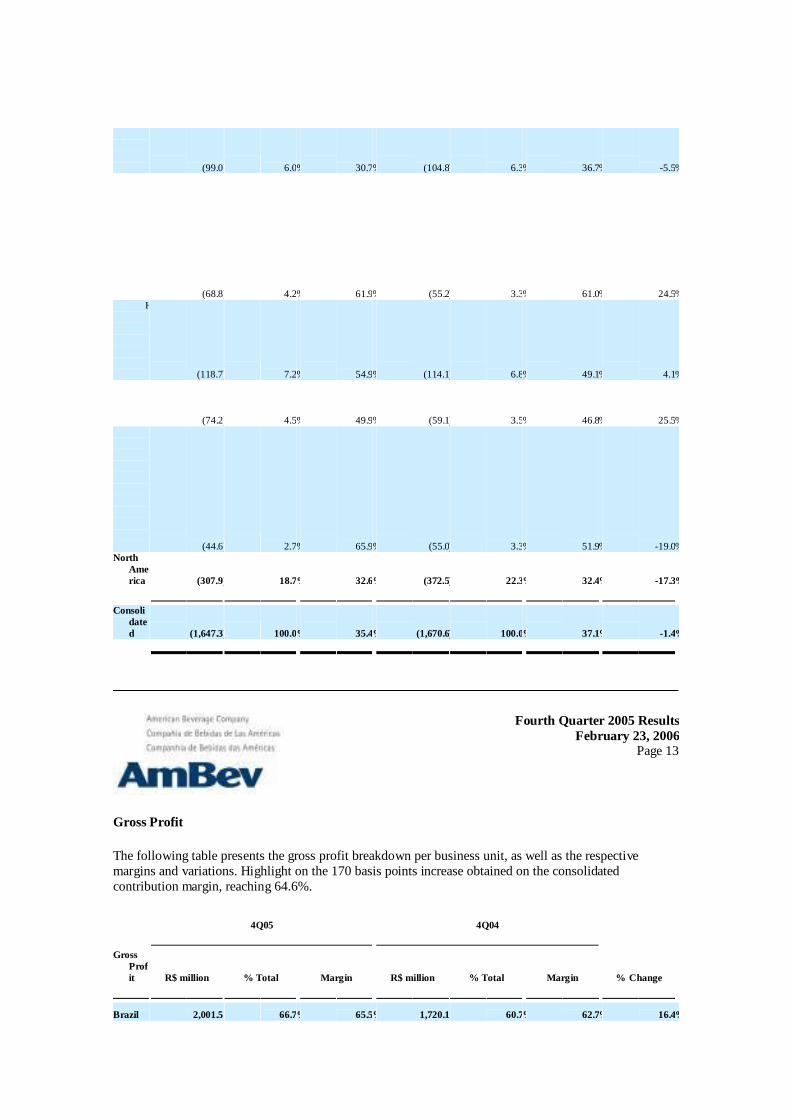
AmBev recorded R$1,647.3 million in COGS (-1.4%). The table below shows details on COGS per
business unit.
4Q05 4Q04
COGS R$ million % Total Margin R$ million % Total Margin % Change
Brazil (1,052.8 ) 63.9 % 34.5 % (1,024.0 ) 61.3 % 37.3 % 2.8 % B
e
e
r
B
r
a
z
i
l (795.1 ) 48.3 % 31.4 % (769.9 ) 46.1 % 34.0 % 3.3 % C
S
D
&
Na
n
c
B
r
a
z
i
l (253.2 ) 15.4 % 50.5 % (246.9 ) 14.8 % 54.3 % 2.5 % M
a
l
t
a
n
d
B
y
-
pr
o
d
u
c
t
s (4.5 ) 0.3 % 20.2 % (7.2 ) 0.4 % 26.4 % -37.1 %
HILA (286.6 ) 17.4 % 44.1 % (274.1 ) 16.4 % 45.0 % 4.5 % Q
u
i (167.8 ) 10.2 % 38.7 % (160.0 ) 9.6 % 42.5 % 4.9 %
n
s
a B
e
e
r (99.0 ) 6.0 % 30.7 % (104.8 ) 6.3 % 36.7 % -5.5 % S
o
f
t
d
r
i
n
k
s (68.8 ) 4.2 % 61.9 % (55.2 ) 3.3 % 61.0 % 24.5 % H
I
L
A
-
e
x (118.7 ) 7.2 % 54.9 % (114.1 ) 6.8 % 49.1 % 4.1 % B
e
e
r (74.2 ) 4.5 % 49.9 % (59.1 ) 3.5 % 46.8 % 25.5 % S
o
f
t
d
r
i
n
k
s (44.6 ) 2.7 % 65.9 % (55.0 ) 3.3 % 51.9 % -19.0 % North
Ame
rica (307.9 ) 18.7 % 32.6 % (372.5 ) 22.3 % 32.4 % -17.3 %
Consoli
date
d (1,647.3 ) 100.0 % 35.4 % (1,670.6 ) 100.0 % 37.1 % -1.4 %
Fourth Quarter 2005 Results
February 23, 2006 Page 13
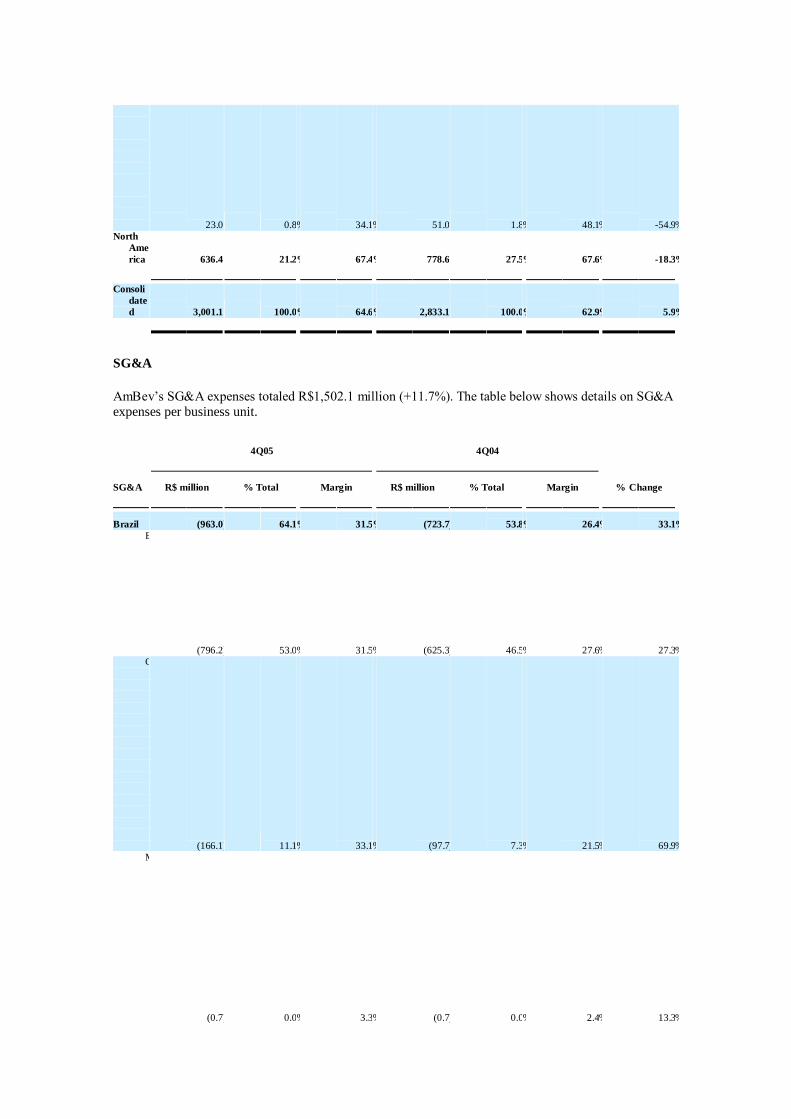
Gross Profit
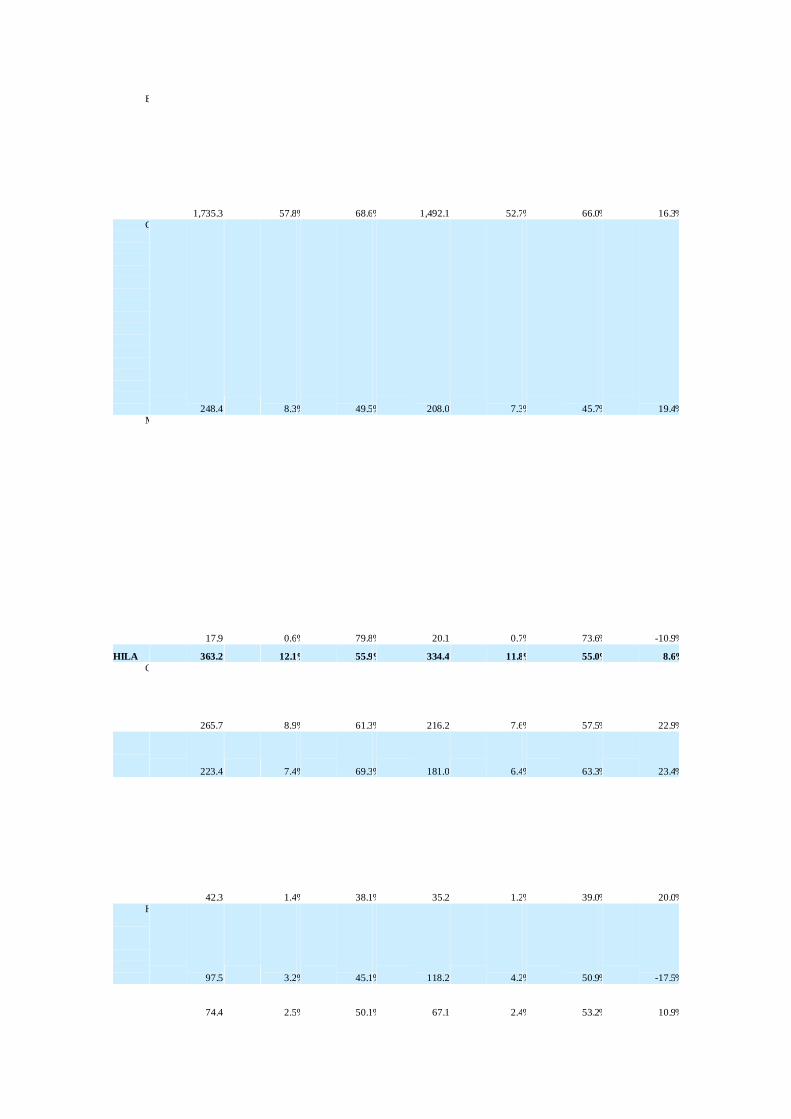
The following table presents the gross profit breakdown per business unit, as well as the respective
margins and variations. Highlight on the 170 basis points increase obtained on the consolidated
contribution margin, reaching 64.6%.
4Q05 4Q04
Gross
Prof
it R$ million % Total Margin R$ million % Total Margin % Change
Brazil 2,001.5 66.7 % 65.5 % 1,720.1 60.7 % 62.7 % 16.4 %
B
e
e
r
B
ra
z
i
l 1,735.3 57.8 % 68.6 % 1,492.1 52.7 % 66.0 % 16.3 % C
S
D
&
N
a
n
c
B
r
a
z
i
l 248.4 8.3 % 49.5 % 208.0 7.3 % 45.7 % 19.4 % M
al
t
a
n
d
B
y
-
p
r
o
d
u
c
t
s 17.9 0.6 % 79.8 % 20.1 0.7 % 73.6 % -10.9 %
HILA 363.2 12.1 % 55.9 % 334.4 11.8 % 55.0 % 8.6 % Q
u
i
n
s
a 265.7 8.9 % 61.3 % 216.2 7.6 % 57.5 % 22.9 % B
e
e
r 223.4 7.4 % 69.3 % 181.0 6.4 % 63.3 % 23.4 % S
o
ft
d
r
i
n
k
s 42.3 1.4 % 38.1 % 35.2 1.2 % 39.0 % 20.0 % H
I
L
A
-
e
x 97.5 3.2 % 45.1 % 118.2 4.2 % 50.9 % -17.5 % B
e
e 74.4 2.5 % 50.1 % 67.1 2.4 % 53.2 % 10.9 %
r S
o
f
t
dr
i
n
k
s 23.0 0.8 % 34.1 % 51.0 1.8 % 48.1 % -54.9 % North
Ame
rica 636.4 21.2 % 67.4 % 778.6 27.5 % 67.6 % -18.3 %
Consoli
date
d 3,001.1 100.0 % 64.6 % 2,833.1 100.0 % 62.9 % 5.9 %
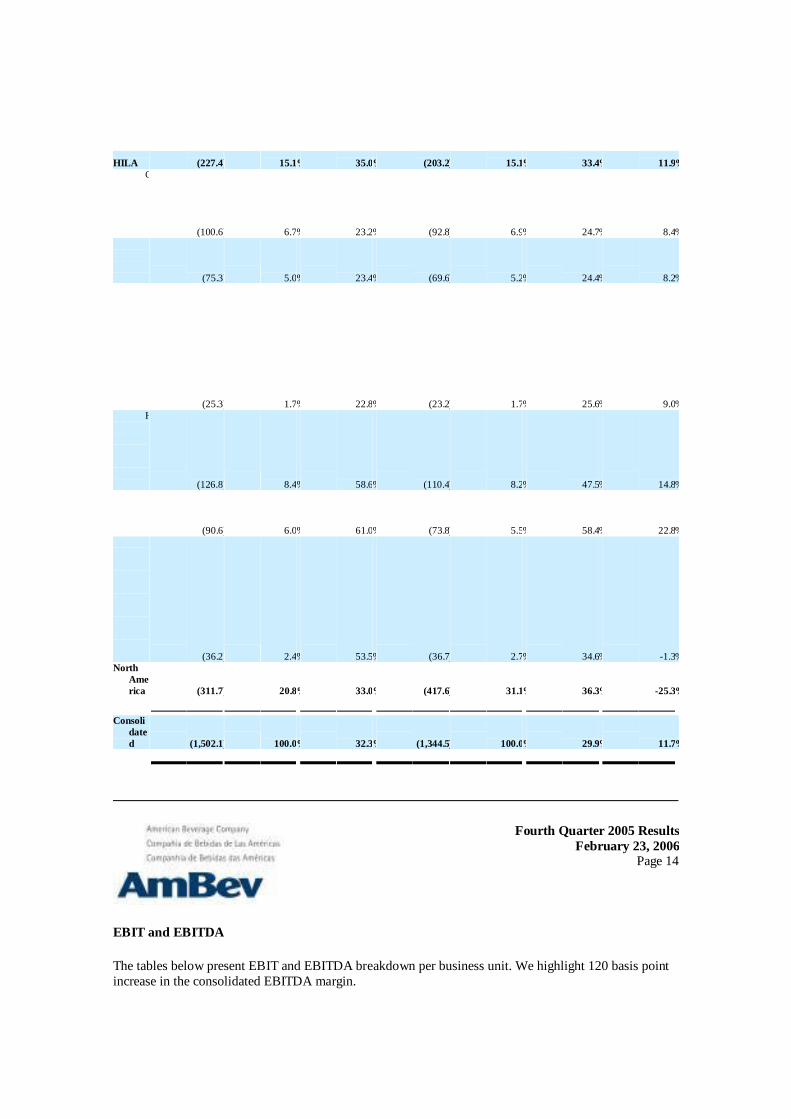
SG&A
AmBev’s SG&A expenses totaled R$1,502.1 million (+11.7%). The table below shows details on SG&A
expenses per business unit.
4Q05 4Q04
SG&A R$ million % Total Margin R$ million % Total Margin % Change
Brazil (963.0 ) 64.1 % 31.5 % (723.7 ) 53.8 % 26.4 % 33.1 % B
e
e
r
B
r
az
i
l (796.2 ) 53.0 % 31.5 % (625.3 ) 46.5 % 27.6 % 27.3 % C
S
D
&
N
a
n
c
B
r
a
z
i
l (166.1 ) 11.1 % 33.1 % (97.7 ) 7.3 % 21.5 % 69.9 % M
a
lt
a
n
d
B
y
-
p
r
o (0.7 ) 0.0 % 3.3 % (0.7 ) 0.0 % 2.4 % 13.3 %
d
u
c
t
s
HILA (227.4 ) 15.1 % 35.0 % (203.2 ) 15.1 % 33.4 % 11.9 % Q
u
i
n
s
a (100.6 ) 6.7 % 23.2 % (92.8 ) 6.9 % 24.7 % 8.4 % B
e
e
r (75.3 ) 5.0 % 23.4 % (69.6 ) 5.2 % 24.4 % 8.2 % S
o
f
t
d
r
i
n
k
s (25.3 ) 1.7 % 22.8 % (23.2 ) 1.7 % 25.6 % 9.0 % H
I
L
A
-
e
x (126.8 ) 8.4 % 58.6 % (110.4 ) 8.2 % 47.5 % 14.8 % B
e
e
r (90.6 ) 6.0 % 61.0 % (73.8 ) 5.5 % 58.4 % 22.8 % S
o
f
t
d
r
i
n
k
s (36.2 ) 2.4 % 53.5 % (36.7 ) 2.7 % 34.6 % -1.3 % North
Ame
rica (311.7 ) 20.8 % 33.0 % (417.6 ) 31.1 % 36.3 % -25.3 %
Consoli
date
d (1,502.1 ) 100.0 % 32.3 % (1,344.5 ) 100.0 % 29.9 % 11.7 %
Fourth Quarter 2005 Results
February 23, 2006 Page 14
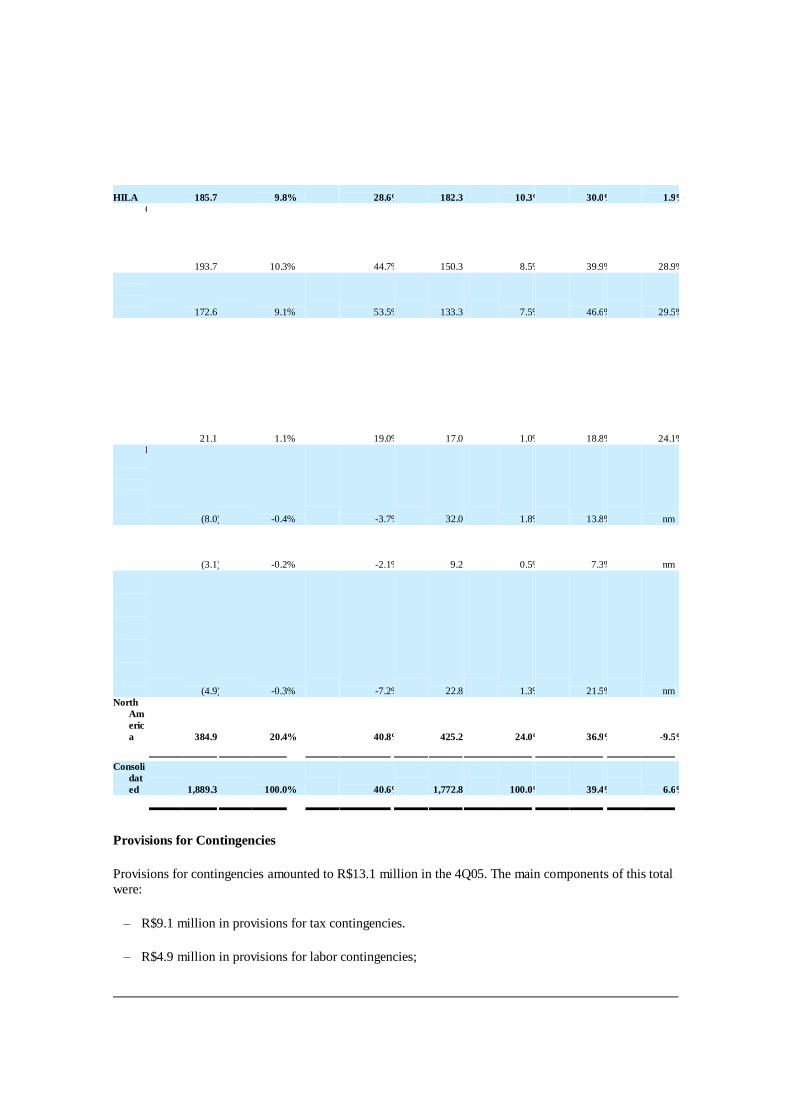
EBIT and EBITDA
The tables below present EBIT and EBITDA breakdown per business unit. We highlight 120 basis point
increase in the consolidated EBITDA margin.

4Q05 4Q04
EBIT R$ million % Total Margin R$ million % Total Margin % Change
Brazil 1,038.5 69.3 % 34.0 % 996.4 66.9 % 36.3 % 4.2 % B
e
e
r
B
r
a
z
i
l 939.1 62.6 % 37.1 % 866.8 58.2 % 38.3 % 8.3 % C
S
D
&
N
a
n
c
B
r
a
z
i
l 82.3 5.5 % 16.4 % 110.2 7.4 % 24.2 % -25.3 % M
a
l
t
a
n
d
B
y
-
p
r
o
d
uc
t
s 17.1 1.1 % 76.5 % 19.4 1.3 % 71.2 % -11.7 %
HILA 135.8 9.1 % 20.9 % 131.2 8.8 % 21.6 % 3.5 % Q
u
i
n
sa 165.1 11.0 % 38.1 % 123.4 8.3 % 32.8 % 33.8 %
B
e
e
r 148.1 9.9 % 45.9 % 111.4 7.5 % 39.0 % 33.0 % S
o
f
t
d
r
i
n
k
s 17.0 1.1 % 15.3 % 12.1 0.8 % 13.3 % 41.2 % H
I (29.3 ) -2.0 % -13.6 % 7.7 0.5 % 3.3 % nm

L
A
-
e
x B
ee
r (16.2 ) -1.1 % -10.9 % (6.6 ) -0.4 % -5.3 % nm S
o
f
t
d
r
i
n
k
s (13.1 ) -0.9 % -19.4 % 14.4 1.0 % 13.5 % nm North
Am
eric
a 324.7 21.7 % 34.4 % 361.0 24.3 % 31.4 % -10.1 %
Consoli
dat
ed 1,499.0 100.0 % 32.2 % 1,488.5 100.0 % 33.1 % 0.7 %
4Q05 4Q04
EBITD
A R$ million % Total Margin R$ million % Total Margin % Change
Brazil 1,318.8 69.8 % 43.2 % 1,165.3 65.7 % 42.5 % 13.2 % B
e
e
r
B
r
az
i
l 1,154.2 61.1 % 45.6 % 998.7 56.3 % 44.2 % 15.6 % C
S
D
&
N
a
n
c
B
r
a
z
i
l 147.4 7.8 % 29.4 % 147.2 8.3 % 32.4 % 0.1 % M
a
lt
a
n
d
B
y
- 17.1 0.9 % 76.5 % 19.4 1.1 % 71.2 % -11.7 %
p
r
o
d
u
c
ts
HILA 185.7 9.8 % 28.6 % 182.3 10.3 % 30.0 % 1.9 % Q
u
i
n
s
a 193.7 10.3 % 44.7 % 150.3 8.5 % 39.9 % 28.9 % B
e
e
r 172.6 9.1 % 53.5 % 133.3 7.5 % 46.6 % 29.5 % S
o
f
t
d
r
i
n
k
s 21.1 1.1 % 19.0 % 17.0 1.0 % 18.8 % 24.1 % H
I
L
A
-
e
x (8.0 ) -0.4 % -3.7 % 32.0 1.8 % 13.8 % nm B
ee
r (3.1 ) -0.2 % -2.1 % 9.2 0.5 % 7.3 % nm S
o
f
t
d
r
i
n
k
s (4.9 ) -0.3 % -7.2 % 22.8 1.3 % 21.5 % nm North
Am
eric
a 384.9 20.4 % 40.8 % 425.2 24.0 % 36.9 % -9.5 %
Consoli
dat
ed 1,889.3 100.0 % 40.6 % 1,772.8 100.0 % 39.4 % 6.6 %
Provisions for Contingencies
Provisions for contingencies amounted to R$13.1 million in the 4Q05. The main components of this total
were:
– R$9.1 million in provisions for tax contingencies.
– R$4.9 million in provisions for labor contingencies;

Fourth Quarter 2005 Results
February 23, 2006 Page 15
Other Operating Income/Expenses
The net result of other operating income/expenses was a R$170.6 million loss. The most significant
entries under other operating income and expenses were the following:
- R$82.0 million in gains related to exchange rate variation in foreign investments;
- R$52.2 million in gains related to the recovery of tax credits;
- R$37.8 million in equity gains related to tax incentives in Brazil.
- R$28.3 million in gains related to discounts in anticipated payment of tax credits
- R$196.7 million in goodwill amortization expenses related to the merger of Labatt into AmBev;
- R$32.7 million in goodwill amortization expenses related to transactions in Latin American
(including Brazil);
Financial Result
AmBev’s financial result in the quarter was a R$318.4 million loss. The table below shows the
breakdown of the main lines composing this amount:
Breakdown of Net Financial Result
R$ million 4T05 4T04
Financial income Financial income on cash and
cash equivalents 20.1 27.3 Foreign exchange gains (losses)
on assets 94.5 (83.9 ) Interest income on stock
ownership plan 3.6 0.0 Interest on taxes, contributions
and judicial deposits 6.4 (13.3 )
Other 6.1 12.1
Total 130.7 (57.8 )
Financial expense Interest expense on local currency
debt 23.7 26.1 Interest expense on foreign
currency debt 120.0 (113.9 ) Net losses from derivative
instruments 72.1 168.2
Taxes on financial transactions 36.2 37.0 Interest on contingencies and
other 20.0 12.9
Other 177.1 32.5
Total 449.0 162.8
Net Financial Result (318.4 ) (220.6 )
The Company emphasizes that, according to the accounting practices adopted in Brazil, the liabilities
referring to swaps and derivatives operations shall be recorded on an accrual basis of accounting; assets
referring to the same types of operations shall be recorded in the lowest value between the market value
and the accrual basis of accounting.
Fourth Quarter 2005 Results
February 23, 2006 Page 16
The Company’s total debt grew R$92.9 million when compared to 3Q05, while its cash and cash &
equivalents went up by R$40.3 million. As a consequence, a R$52.6 million increase in AmBev’s net
debt was recorded. The Company’s net debt to EBITDA accumulated ratio over the past 12 months stood
at 1.0x. The table below details AmBev’s consolidated debt profile:
The table below details AmBev’s consolidated debt profile:
Debt Breakdown
R$ million Short Term Long Term Total
Local Currency 195.1 599.6 794.7
Foreign Currency 1,014.3 5,394.6 6,408.9
Consolidated
Debt 1,209.4 5,994.2 7,203.6 Cash and
Equivalents 1,096.3
Net Debt 6,107.3
Non-Operating Income and Expenses
The net result from non-operating income and expenses was a R$60.9 million loss. The major entries comprising this result are as follows:
- Accounting loss of R$36.4 million referring to AmBev’s investment in Quinsa, caused by share
buyback carried out by Quinsa during 4Q05.
- Reversal of the R$20,8 million gain booked in the 3Q05 in relation to the sale of the Red Rock
brand; instead, this amount was accrued as a reduction of the total goodwill generated in the
acquisition of Embodom.
Income Tax and Social Contribution
The R$175.3 million provision for income tax and social contribution in the quarter represents an
effective tax rate of 20.5%. Removing the goodwill amortization expenses of consolidated income before
the income tax, social contribution and minority interest, we reach an adjusted rate of 15.9%. The table
below presents the conciliation for income tax and social contribution provision.
Fourth Quarter 2005 Results
February 23, 2006 Page 17
Income Tax and Social Contribution
R$ million
Net income before taxes and profit sharing 937.0
Provision for Profit Sharing & Bonuses (82.1 )
Net income before income tax, social contribution and minorities 854.8
Income tax and social contribution at nominal tax rate (34%) (290.6 )
Adjustments to effective rate:
Interest on own capital 126.6
Income from foreign non-taxable subsidiaries 2.9
Equity gains from subsidiaries 12.9
Amortization of non-deductible goodwill (22.2 )
Permanent additions/reductions and other (23.1 )
Exchange Rate effect on investments 18.2
Total income taxes and social contribution (175.3 )
Effective income tax and social contribution rate 20.5 %
Profit Sharing and Contributions
AmBev has provisioned R$82.1 million for the payment of employee profit sharing. This amount
integrates the Company variable compensation policy, according to which, approximately 20,000
employees have a significant portion of their compensation subject to the achievement of aggressive
performance targets.
Minority Interest
Minority interests in AmBev’s subsidiaries summed up a R$17.7 million loss in 4Q05.
Net Income
AmBev posted net income of R$697.2 million (+51.7%). Earnings per thousand shares were R$10.67, up
by 26.8%.
The Company points out that the common shares bonus implemented on May 31, 2005 distorts the
analysis of net income per thousand shares between 4Q05 and 4Q04. By adjusting the 4Q04 shareholding
structure so that it is comparable to 4Q05, we have a growth of income thousand shares of 52.1%.
In addition, by eliminating from the Company results the goodwill amortization expenses, which have no
cash effect, we reach an income per thousand shares of R$14.45 (+7.4%, already reflecting the bonus
share adjustment).
Fourth Quarter 2005 Results
February 23, 2006 Page 18
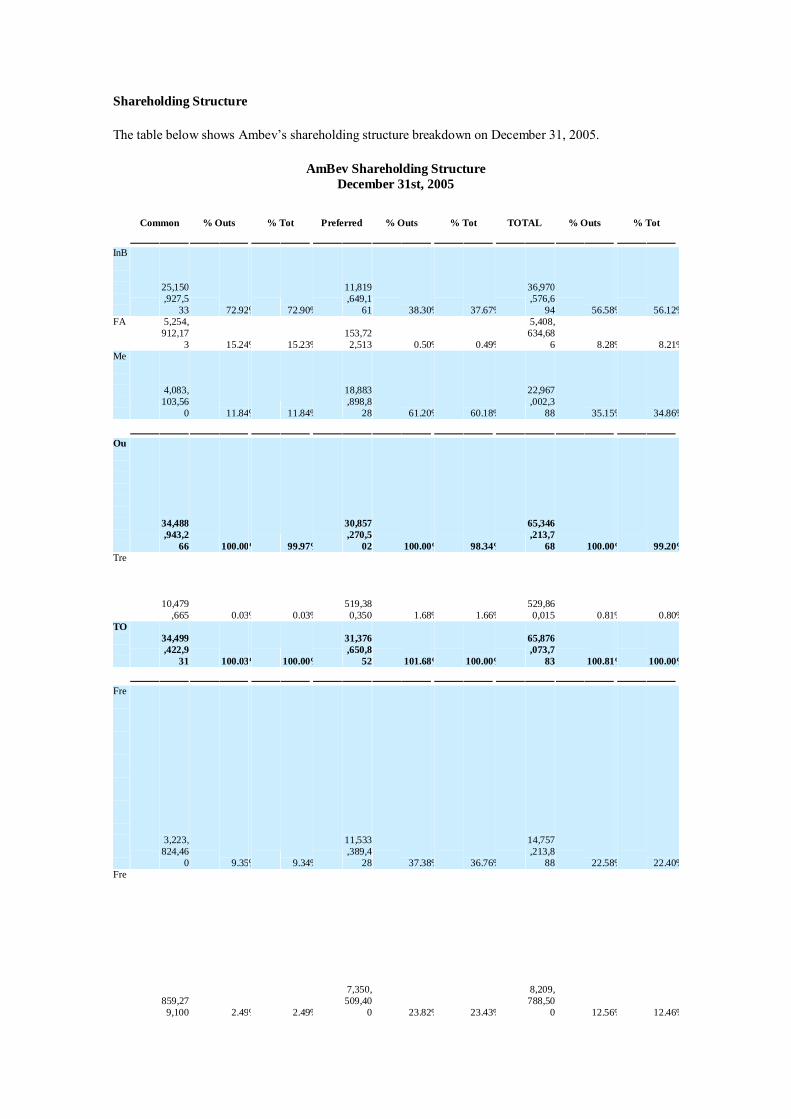
Shareholding Structure
The table below shows Ambev’s shareholding structure breakdown on December 31, 2005.
AmBev Shareholding Structure
December 31st, 2005
Common % Outs % Tot Preferred % Outs % Tot TOTAL % Outs % Tot
InB
e
v
S
A
25,150
,927,5
33 72.92 % 72.90 %
11,819
,649,1
61 38.30 % 37.67 %
36,970
,576,6
94 56.58 % 56.12 % FA
H
Z
5,254,
912,17
3 15.24 % 15.23 % 153,72
2,513 0.50 % 0.49 %
5,408,
634,68
6 8.28 % 8.21 % Me
r
c
a
d
o
4,083,
103,56
0 11.84 % 11.84 %
18,883
,898,8
28 61.20 % 60.18 %
22,967
,002,3
88 35.15 % 34.86 %
Ou
ts
t
a
n
d
i
n
g
34,488
,943,2
66 100.00 % 99.97 %
30,857
,270,5
02 100.00 % 98.34 %
65,346
,213,7
68 100.00 % 99.20 % Tre
a
s
u
r
y 10,479
,665 0.03 % 0.03 % 519,38
0,350 1.68 % 1.66 % 529,86
0,015 0.81 % 0.80 % TO
T
A
L
34,499
,422,9
31 100.03 % 100.00 %
31,376
,650,8
52 101.68 % 100.00 %
65,876
,073,7
83 100.81 % 100.00 %
Fre
e
F
l
o
a
t
B
o
v
es
p
a
3,223,
824,46
0 9.35 % 9.34 %
11,533
,389,4
28 37.38 % 36.76 %
14,757
,213,8
88 22.58 % 22.40 % Fre
e
F
l
o
a
t
N
Y
S
E 859,27
9,100 2.49 % 2.49 %
7,350,
509,40
0 23.82 % 23.43 %
8,209,
788,50
0 12.56 % 12.46 %

Audit Fees
Hiring policy for External Auditors Services
The Company and its subsidiaries policies related to the hiring of services not related to external audit
from its Independent Auditors assure that there is no conflict of interests, loss of independence or
objectivity, and are established according to the principles that preserve the auditor’s independence.
These principles are based on the fact that the auditor shall not: (a) audit his/her own work; (b) hold
management positions; and (c) promote our interests.
The Company, according to its policy, provides its Fiscal Council with information for their analysis on
all services not related to external audit, rendered by our independent auditors. Afterwards, the mentioned
services are submitted for analysis and approval by the Board of Directors.
Additionally, the Company previously involves its Legal Department in the appraisal of the purpose of
some services to be rendered by external auditors, in addition to the analysis of financial statements, to
conclude, in the light of the applicable legislation, if these services, in their essence, do or do not
represent conflict of interests or affect the independence and objectivity of the independent auditors.
Services Hired in this period
During the period under consideration, the independent auditors who rendered services to the Company
and its subsidiaries were not contracted for services additional to the examination of the financial
statements.
Fourth Quarter 2005 Results
February 23, 2006 Page 19
GUIDANCE
AmBev presents below its best estimates for the year of 2006.
Guidance 2006
Beer Brazil Volumes Growth between 2.5% and 3.0% Revenues per hectoliter Growth between 0.5% and 1.0% above inflation(IPCA) EBITDA margin Between 47.0% and 49.0%
CSD & NANC Net Revenues Growth between 11.0% and 13.0% EBITDA margin Between 31.0% and 33.0% Quinsa EBITDA growth in american dollars Growth between 8.0% and 10.0%
HILA-ex Net revenues in Brazilian Reais Growth between 15.0% and 20.0%
EBITDA margin Between 0.0% and 2.0%
North America Net revenues in Canadian Dollars Growth between 0.0% and 1.0% EBITDA margin Between 36.0% and 37.0%
Capital Expenditures Between 500 and 550 million dollars
Information contained in this document contains forward-looking statements and reflect the current
perception and perspectives of our management, based on information available to date on the
development of general economic and industry conditions, as well as Company performance and finance
conditions. Any statements, expectations and plans contained in this document which do not reflect
historical information, including information contained in the section “Guidance”, as well as information with respect to the declaration or payment of dividends, direction of future operations, the
implementation of principal operating and finance strategies, the factors or trends affecting AmBev´s
financial condition, liquidity or results of operations, are considered forward-looking statements and are
subject to risks and uncertainties. They do not constitute guarantees of performance and are based on
several assumptions and expectations, including economic and market conditions, industry competitivity
and operational factors. Any change in such assumptions and expectations may cause actual results to
materially differ from those expressed in or suggested by these forward-looking statements.
Fourth Quarter 2005 Results
February 23, 2006 Page 20
4Q05 EARNINGS CONFERENCE CALL
Speakers Miguel Patricio
Chief Executive Officer for North America
Luiz Fernando Edmond
Chief Executive Officer for Latin America
João Castro Neves
CFO and Investor Relations Officer
Language English
Date February 23, 2006
Time 4.00 PM (São Paulo Time)
2.00 PM (EST)
Phone numbers US / International Participants +1 973 582 2737
Toll Free – Brazil Participants 0800 891 3951
Toll Free – UK Participants 0800 032 3836
Code #7061824 or AmBev
Please call 15 minutes prior to the beginning of the conference call.
The conference call will be transmitted live through the Internet on the website www.ambev-ir.com.
The conference call replay will be available on AmBev’s website around two hours after the conclusion.
For additional information, please contact the Investor Relations Department:
Fernando Tennenbaum (5511) 2122-1415
WWW.AMBEV-IR.COM
Statements contained in this press release may contain information which is forward-looking and reflects
management’s current view and estimates of future economic circumstances, industry conditions,
company performance, and financial results. Any statements, expectations, capabilities, plans and
assumptions contained in this press release that do not describe historical facts, such as statements
regarding the declaration or payment of dividends, the direction of future operations, the implementation
of principal operating and financing strategies and capital expenditure plans, the factors or trends
affecting financial condition, liquidity or results of operations, and the implementation of the measures
required under AmBev’s performance agreement entered into with the Brazilian Antitrust Authority (Conselho Administrativo de Defesa Econômica - CADE) are forward-looking statements within the
meaning of the U.S Private Securities Litigation Reform Act of 1995 and involve a number of risks and
uncertainties. There is no guarantee that these results will actually occur. The statements are based on
many assumptions and factors, including general economic and market conditions, industry conditions,
and operating factors. Any changes in such assumptions or factors could cause actual results to differ
materially from current expectations.
Fourth Quarter 2005 Results
February 23, 2006 Page 21
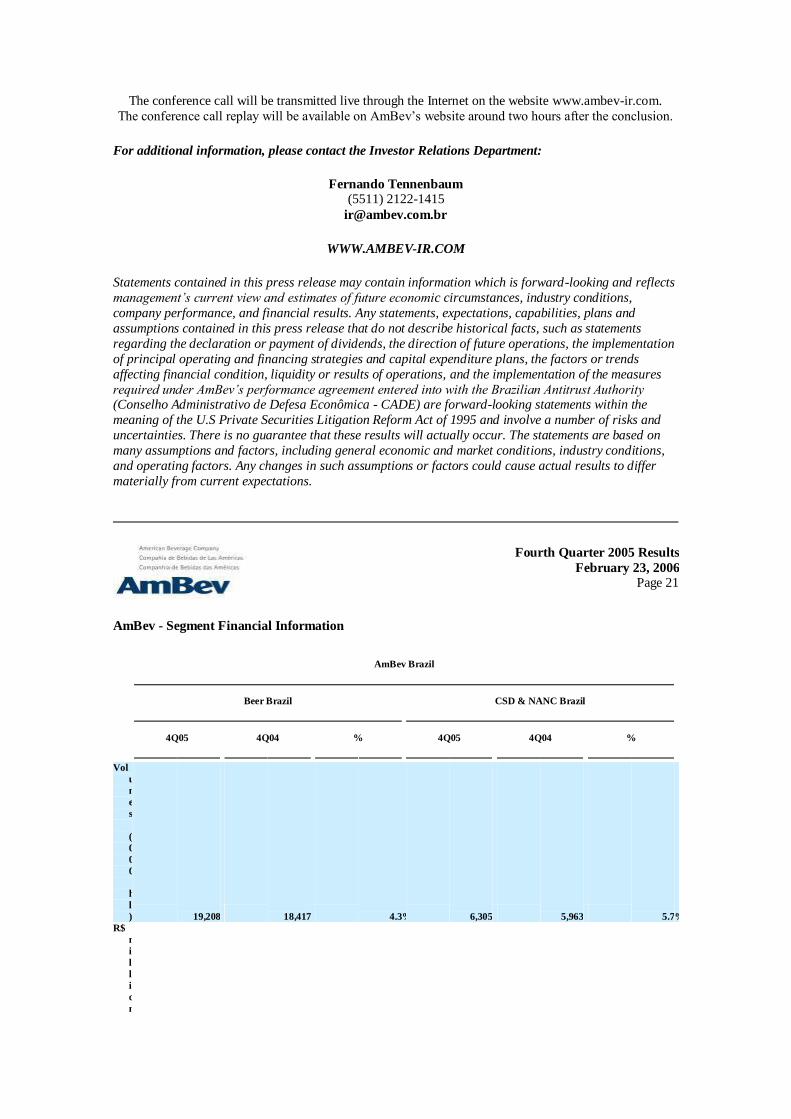
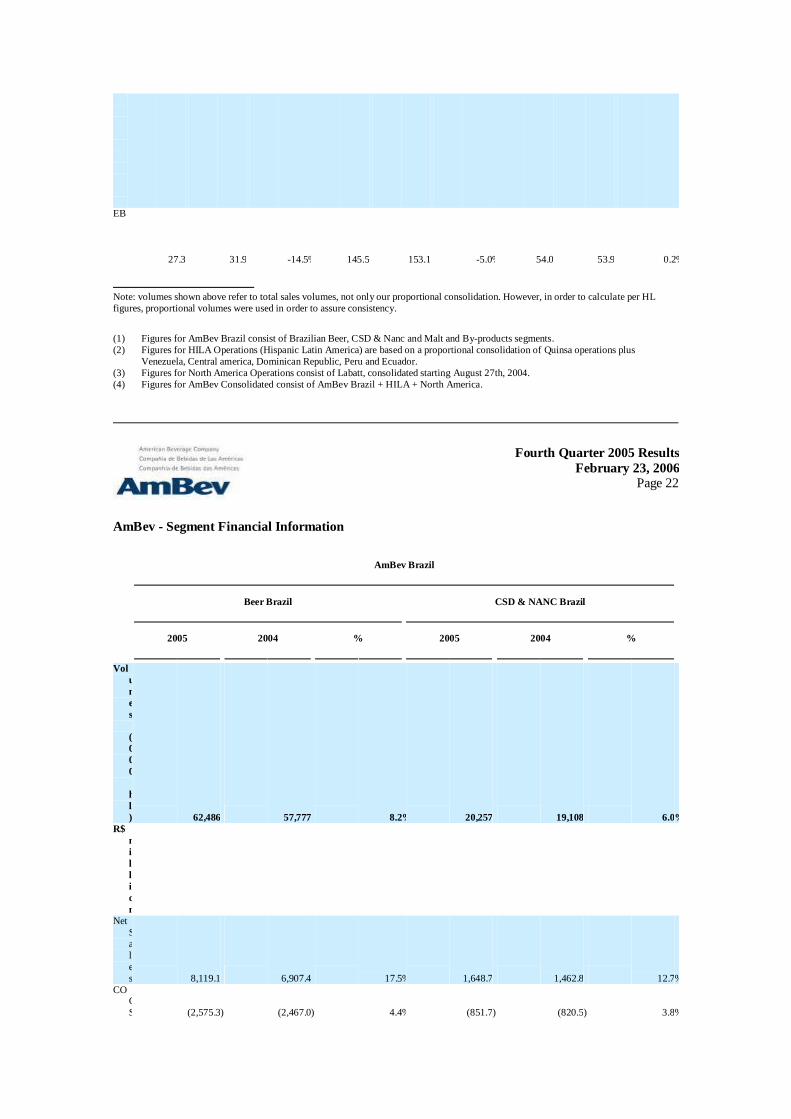
AmBev - Segment Financial Information
AmBev Brazil
Beer Brazil CSD & NANC Brazil
4Q05 4Q04 % 4Q05 4Q04 %
Vol
u
m
e
s
(
0
0
0
h
l
) 19,208 18,417 4.3 % 6,305 5,963 5.7 % R$
m
i
l
l
i
o
n
Net
S
a
l
e
s 2,530.4 2,261.9 11.9 % 501.5 454.8 10.3 % CO
G
S (795.1 ) (769.9 ) 3.3 % (253.2 ) (246.9 ) 2.5 % Gro
s
s
P
r
o
f
i
t 1,735.3 1,492.1 16.3 % 248.4 208.0 19.4 % SG
&
A (796.2 ) (625.3 ) 27.3 % (166.1 ) (97.7 ) 69.9 % EBI
T 939.1 866.8 8.3 % 82.3 110.2 -25.3 % Dep
r
.
&
Am
o
r
t
. (215.1 ) (131.9 ) 63.0 % (65.1 ) (37.0 ) 75.9 % EBI
T
D
A 1,154.2 998.7 15.6 % 147.4 147.2 0.1 % %
o
f
T
o
t
a
l
E
B
I
T
DA 61.1 % 56.3 % 7.8 % 8.3 %
%
o
f
N
e
t
S
a
l
e
s Net
S
a
l
e
s 100.0 % 100.0 % 100.0 % 100.0 % CO
G
S -31.4 % -34.0 % -50.5 % -54.3 % Gro
s
s
P 68.6 % 66.0 % 49.5 % 45.7 %

r
o
f
i
t SG
&A -31.5 % -27.6 % -33.1 % -21.5 %
EBI
T 37.1 % 38.3 % 16.4 % 24.2 % Dep
r
.
&
A
m
o
r
t
. -8.5 % -5.8 % -13.0 % -8.1 % EBI
T
D
A 45.6 % 44.2 % 29.4 % 32.4 % Per
H
e
c
to
l
i
t
e
r
(
R
$
/
h
l
) Net
S
a
l
e
s 131.7 122.8 7.3 % 79.5 76.3 4.3 % CO
G
S (41.4 ) (41.8 ) -1.0 % (40.2 ) (41.4 ) -3.0 % Gro
s
s
P
r
o
f
i
t 90.3 81.0 11.5 % 39.4 34.9 12.9 % SG
&
A (41.5 ) (34.0 ) 22.1 % (26.3 ) (16.4 ) 60.7 % EBI
T 48.9 47.1 3.9 % 13.1 18.5 -29.4 % Dep
r
.
&
A
m
or
t
. (11.2 ) (7.2 ) 56.3 % (10.3 ) (6.2 ) 66.4 % EBI
T 60.1 54.2 10.8 % 23.4 24.7 -5.3 %
D
A
AmBev Brazil
Malt and By-products Total AmBev Brazil (1)
4Q05 4Q04 % 4Q05 4Q04 %
Vol
u
m
e
s
(
0
0
0
h
l) 25,513 24,379 4.7 %
R$
m
i
l
l
i
o
n Net
S
a
l
e
s 22.4 27.3 -17.8 % 3,054.3 2,744.1 11.3 % CO
G
S (4.5 ) (7.2 ) -37.1 % (1,052.8 ) (1,024.0 ) 2.8 % Gro
s
s
P
r
o
f
i
t 17.9 20.1 -10.9 % 2,001.5 1,720.1 16.4 % SG
&
A (0.7 ) (0.7 ) 13.3 % (963.0 ) (723.7 ) 33.1 % EBI
T 17.1 19.4 -11.7 % 1,038.5 996.4 4.2 % Dep
r
.
&
A
m
o
r
t
. 0.0 0.0 n.m. (280.2 ) (169.0 ) 65.8 % EBI
T
D
A 17.1 19.4 -11.7 % 1,318.8 1,165.3 13.2 % %
o
f
T
o
t 0.9 % 1.1 % 69.8 % 65.7 %
a
l
E
B
I
T
DA
%
o
f
N
e
t
S
a
l
e
s Net
S
a
l
e
s 100.0 % 100.0 % 100.0 % 100.0 % CO
G
S -20.2 % -26.4 % -34.5 % -37.3 % Gro
ss
P
r
o
f
i
t 79.8 % 73.6 % 65.5 % 62.7 % SG
&
A -3.3 % -2.4 % -31.5 % -26.4 % EBI
T 76.5 % 71.2 % 34.0 % 36.3 % Dep
r
.
&
A
m
o
r
t. 0.0 % 0.0 % -9.2 % -6.2 %
EBI
T
D
A 76.5 % 71.2 % 43.2 % 42.5 % Per
H
e
c
t
o
l
i
t
e
r
(
R
$
/
h
l)
Net
S
a
l 119.7 112.6 6.4 %
e
s CO
G
S (41.3 ) (42.0 ) -1.8 % Gro
ss
P
r
o
f
i
t 78.5 70.6 11.2 % SG
&
A (37.7 ) (29.7 ) 27.1 % EBI
T 40.7 40.9 -0.4 % Dep
r
.
&
A
m
o
r
t. (11.0 ) (6.9 ) 58.5 %
EBI
T
D
A 51.7 47.8 8.1 %
HILA
Operations (2) North America
Operations (3) AmBev
Consolidated (4)
4Q05 4Q04 % 4Q05 4Q04 % 4Q05 4Q04 %
Vo
l
u
m
e
s
(
0
0
0
h
l
) 10,146 8,922 13.7 % 2,646 2,776 -4.7 % 38,305 36,078 6.2 % R$
m
i
l
l
i
o
n Ne
t
S
a
l
e
s 649.7 608.5 6.8 % 944.3 1,151.
0 -18.0 % 4,648.
3 4,503.
6 3.2 % C
O
G
S (286.6 ) (274.1 ) 4.5 % (307.9 ) (372.5 ) -17.3 % (1,647.
3 ) (1,670.
6 ) -1.4 % Gr
o 363.2 334.4 8.6 % 636.4 778.6 -18.3 % 3,001.
1 2,833.
1 5.9 %
s
s
P
r
o
fi
t SG
&
A (227.4 ) (203.2 ) 11.9 % (311.7 ) (417.6 ) -25.3 % (1,502.
1 ) (1,344.
5 ) 11.7 % EB
I
T 135.8 131.2 3.5 % 324.7 361.0 -10.1 % 1,499.
0 1,488.
5 0.7 % De
p
r
.
&
A
m
o
r
t
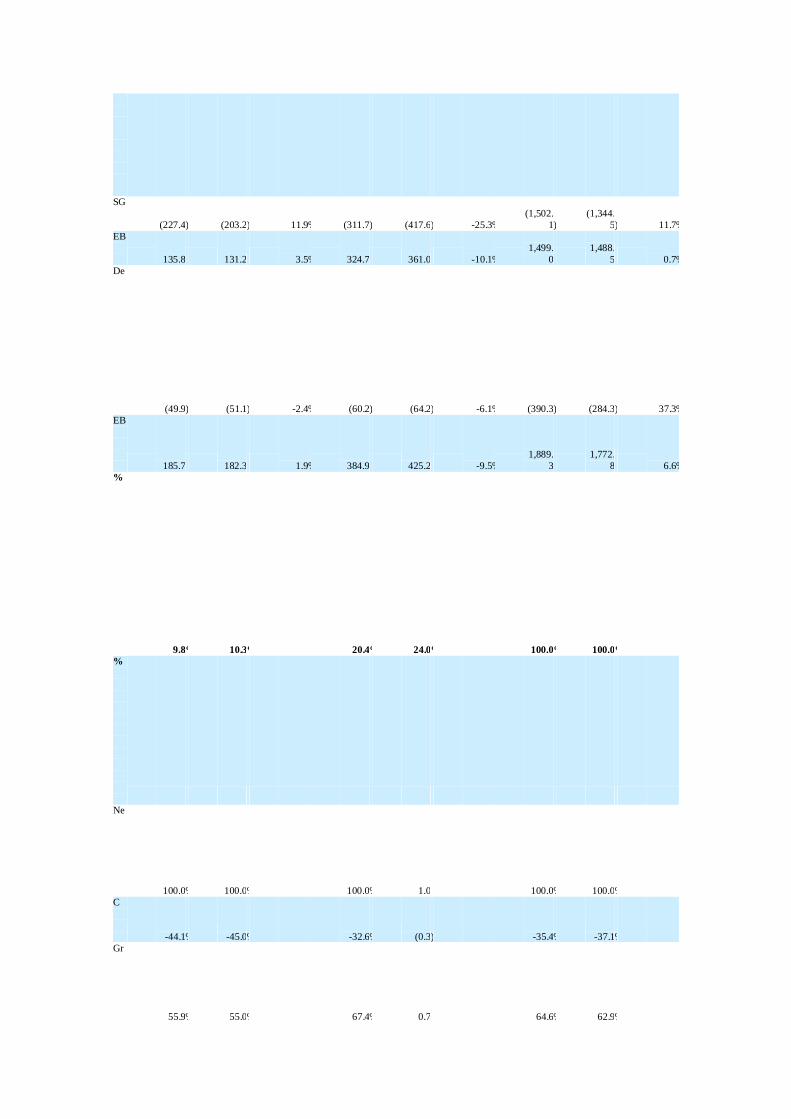
. (49.9 ) (51.1 ) -2.4 % (60.2 ) (64.2 ) -6.1 % (390.3 ) (284.3 ) 37.3 % EB
IT
D
A 185.7 182.3 1.9 % 384.9 425.2 -9.5 % 1,889.
3 1,772.
8 6.6 % %
o
f
T
o
t
a
l
E
B
I
T
D
A 9.8 % 10.3 % 20.4 % 24.0 % 100.0 % 100.0 % %
o
f
N
e
t
S
a
l
e
s Ne
t
S
a
l
e
s 100.0 % 100.0 % 100.0 % 1.0 100.0 % 100.0 % C
O
G
S -44.1 % -45.0 % -32.6 % (0.3 ) -35.4 % -37.1 % Gr
os
s
P
r 55.9 % 55.0 % 67.4 % 0.7 64.6 % 62.9 %

o
f
i
t SG
&
A -35.0 % -33.4 % -33.0 % (0.4 ) -32.3 % -29.9 % EB
I
T 20.9 % 21.6 % 34.4 % 0.3 32.2 % 33.1 % De
p
r
.
&
A
m
o
r
t
. -7.7 % -8.4 % -6.4 % (0.1 ) -8.4 % -6.3 % EB
I
T
D
A 28.6 % 30.0 % 40.8 % 0.4 40.6 % 39.4 % Pe
r
H
e
c
t
o
l
i
t
e
r
(
R
$
/
h
l
) Ne
t
Sa
l
e
s 95.4 106.5 -10.4 % 356.9 414.6 -13.9 % 132.9 137.0 -3.0 % C
O
G
S (42.1 ) (48.0 ) -12.3 % (116.4 ) (134.2 ) -13.3 % (47.1 ) (50.8 ) -7.3 % Gr
o
s
s
P
r
o
f
i
t 53.3 58.5 -8.9 % 240.5 280.4 -14.2 % 85.8 86.2 -0.4 % SG
&
A (33.4 ) (35.6 ) -6.1 % (117.8 ) (150.4 ) -21.7 % (43.0 ) (40.9 ) 5.0 % EB
I
T 19.9 23.0 -13.1 % 122.7 130.0 -5.6 % 42.9 45.3 -5.3 % De
p
r (7.3 ) (8.9 ) -18.1 % (22.8 ) (23.1 ) -1.5 % (11.2 ) (8.6 ) 29.1 %
.
&
A
m
or
t
. EB
I
T
D
A 27.3 31.9 -14.5 % 145.5 153.1 -5.0 % 54.0 53.9 0.2 %
Note: volumes shown above refer to total sales volumes, not only our proportional consolidation. However, in order to calculate per HL
figures, proportional volumes were used in order to assure consistency. (1) Figures for AmBev Brazil consist of Brazilian Beer, CSD & Nanc and Malt and By-products segments. (2) Figures for HILA Operations (Hispanic Latin America) are based on a proportional consolidation of Quinsa operations plus
Venezuela, Central america, Dominican Republic, Peru and Ecuador. (3) Figures for North America Operations consist of Labatt, consolidated starting August 27th, 2004. (4) Figures for AmBev Consolidated consist of AmBev Brazil + HILA + North America.
Fourth Quarter 2005 Results
February 23, 2006 Page 22
AmBev - Segment Financial Information
AmBev Brazil
Beer Brazil CSD & NANC Brazil
2005 2004 % 2005 2004 %
Vol
u
m
e
s
(
0
0
0
h
l
) 62,486 57,777 8.2 % 20,257 19,108 6.0 % R$
m
i
l
l
i
o
n Net
S
a
l
e
s 8,119.1 6,907.4 17.5 % 1,648.7 1,462.8 12.7 % CO
G
S (2,575.3 ) (2,467.0 ) 4.4 % (851.7 ) (820.5 ) 3.8 %
Gro
s
s
P
r
of
i
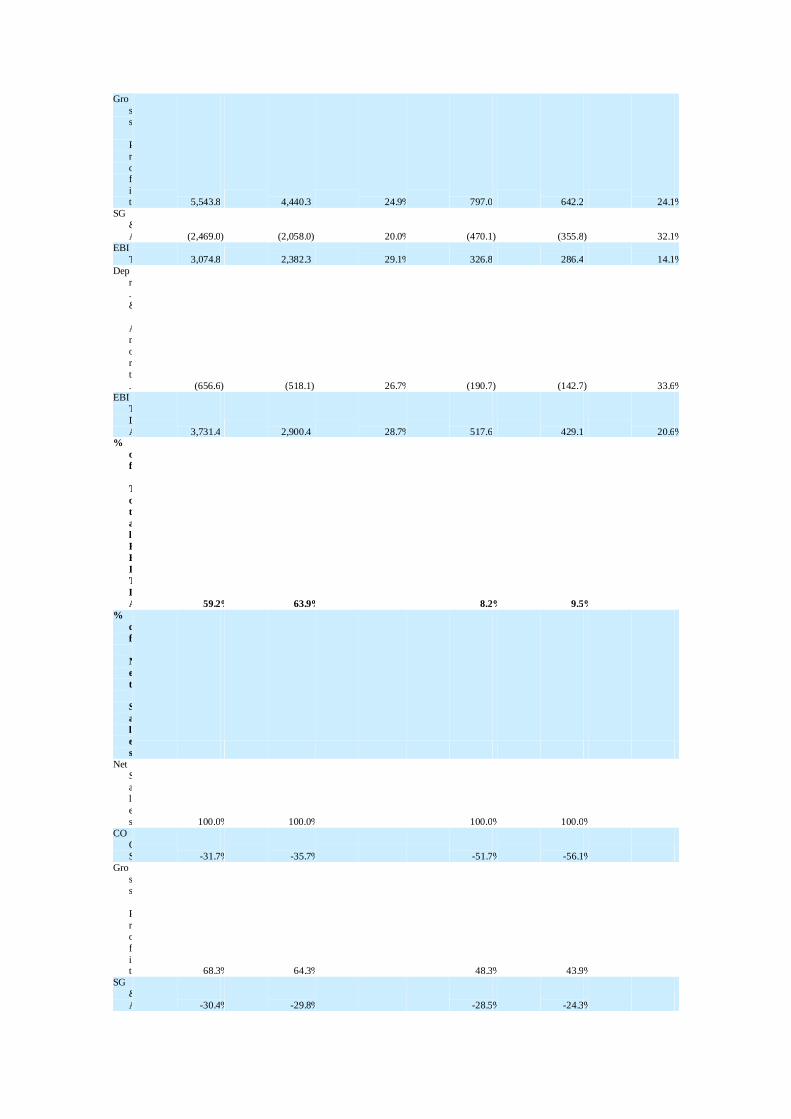
t 5,543.8 4,440.3 24.9 % 797.0 642.2 24.1 % SG
&
A (2,469.0 ) (2,058.0 ) 20.0 % (470.1 ) (355.8 ) 32.1 % EBI
T 3,074.8 2,382.3 29.1 % 326.8 286.4 14.1 % Dep
r
.
&
A
m
o
r
t
. (656.6 ) (518.1 ) 26.7 % (190.7 ) (142.7 ) 33.6 % EBI
T
D
A 3,731.4 2,900.4 28.7 % 517.6 429.1 20.6 % %
o
f
T
o
t
a
l
E
B
I
T
D
A 59.2 % 63.9 % 8.2 % 9.5 % %
o
f
N
e
t
S
a
l
e
s Net
S
a
l
e
s 100.0 % 100.0 % 100.0 % 100.0 % CO
G
S -31.7 % -35.7 % -51.7 % -56.1 % Gro
s
s
P
r
o
f
it 68.3 % 64.3 % 48.3 % 43.9 %
SG
&
A -30.4 % -29.8 % -28.5 % -24.3 %

EBI
T 37.9 % 34.5 % 19.8 % 19.6 % Dep
r
.
&
A
m
o
r
t
. -8.1 % -7.5 % -11.6 % -9.8 % EBI
T
D
A 46.0 % 42.0 % 31.4 % 29.3 % Per
H
e
c
t
o
l
i
t
e
r
(R
$
/
h
l
) Net
S
a
l
e
s 129.9 119.6 8.7 % 81.4 76.6 6.3 % CO
G
S (41.2 ) (42.7 ) -3.5 % (42.0 ) (42.9 ) -2.1 % Gro
s
s
P
r
o
fi
t 88.7 76.9 15.4 % 39.3 33.6 17.1 % SG
&
A (39.5 ) (35.6 ) 10.9 % (23.2 ) (18.6 ) 24.6 % EBI
T 49.2 41.2 19.3 % 16.1 15.0 7.6 % Dep
r
.
&
A
m
o
r
t
. (10.5 ) (9.0 ) 17.2 % (9.4 ) (7.5 ) 26.1 % EBI
T
D
A 59.7 50.2 19.0 % 25.5 22.5 13.8 %
AmBev Brazil

Malt and By-products Total AmBev Brazil (1)
2005 2004 % 2005 2004 %
Vol
u
m
e
s
(
0
0
0
h
l
) 82,743 76,885 7.6 % R$
m
i
l
l
i
o
n Net
S
a
l
e
s 135.0 155.8 -13.3 % 9,902.8 8,525.9 16.1 % CO
G
S (61.9 ) (81.1 ) -23.7 % (3,488.9 ) (3,368.6 ) 3.6 % Gro
s
s
P
r
of
i
t 73.1 74.7 -2.1 % 6,413.9 5,157.3 24.4 % SG
&
A (3.1 ) (2.9 ) 7.5 % (2,942.2 ) (2,416.8 ) 21.7 % EBI
T 70.0 71.8 -2.5 % 3,471.7 2,740.5 26.7 % Dep
r
.
&
A
m
o
r
t
. 0.0 0.0 n.m. (847.3 ) (660.8 ) 28.2 % EBI
T
D
A 70.0 71.8 -2.5 % 4,319.0 3,401.3 27.0 % %
o
f
T
o
t
a
l
E
B
I
T
D 1.1 % 1.6 % 68.5 % 75.0 %
A %
o
f
N
e
t S
a
l
e
s Net
S
a
l
e
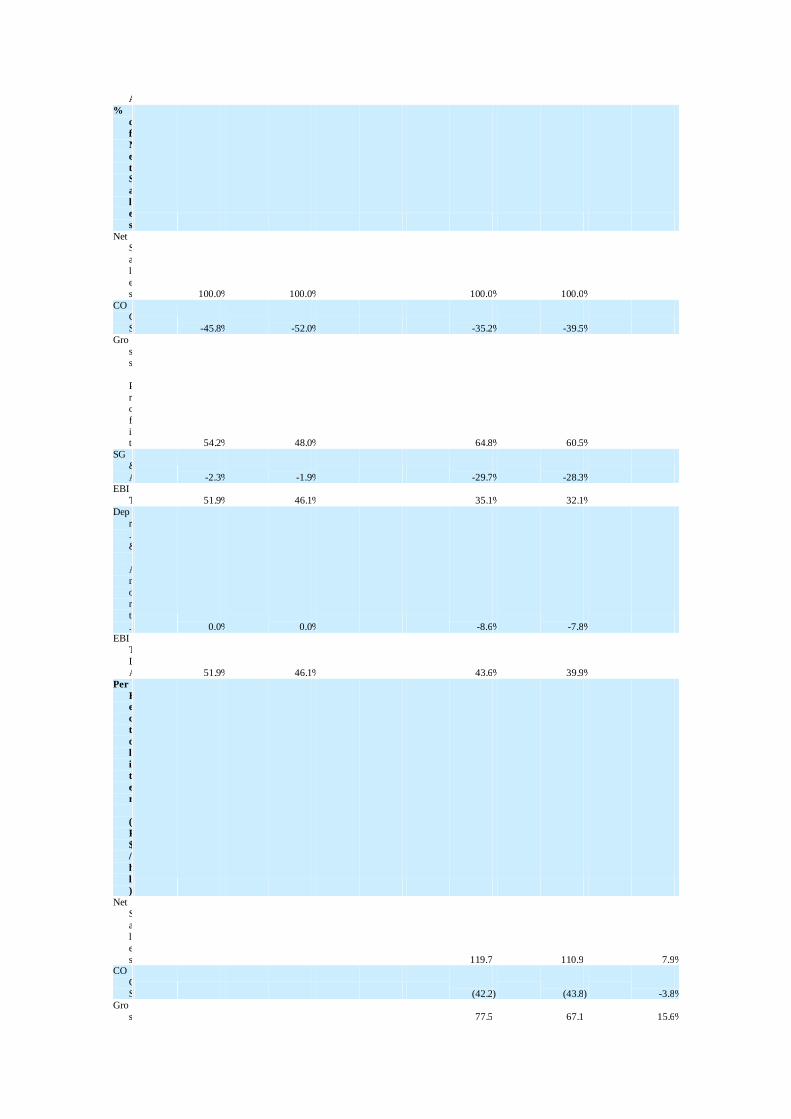
s 100.0 % 100.0 % 100.0 % 100.0 % CO
G
S -45.8 % -52.0 % -35.2 % -39.5 % Gro
s
s
P
r
o
f
it 54.2 % 48.0 % 64.8 % 60.5 %
SG
&
A -2.3 % -1.9 % -29.7 % -28.3 % EBI
T 51.9 % 46.1 % 35.1 % 32.1 % Dep
r
.
&
A
m
o
r
t
. 0.0 % 0.0 % -8.6 % -7.8 % EBI
T
D
A 51.9 % 46.1 % 43.6 % 39.9 % Per
He
c
t
o
l
i
t
e
r
(
R
$
/
h
l
) Net
S
a
l
e
s 119.7 110.9 7.9 % CO
G
S (42.2 ) (43.8 ) -3.8 % Gro
s 77.5 67.1 15.6 %
s
P
r
o
f
it
SG
&
A (35.6 ) (31.4 ) 13.1 % EBI
T 42.0 35.6 17.7 % Dep
r
.
&
A
m
o
r
t
. (10.2 ) (8.6 ) 19.1 % EBI
T
D
A 52.2 44.2 18.0 %
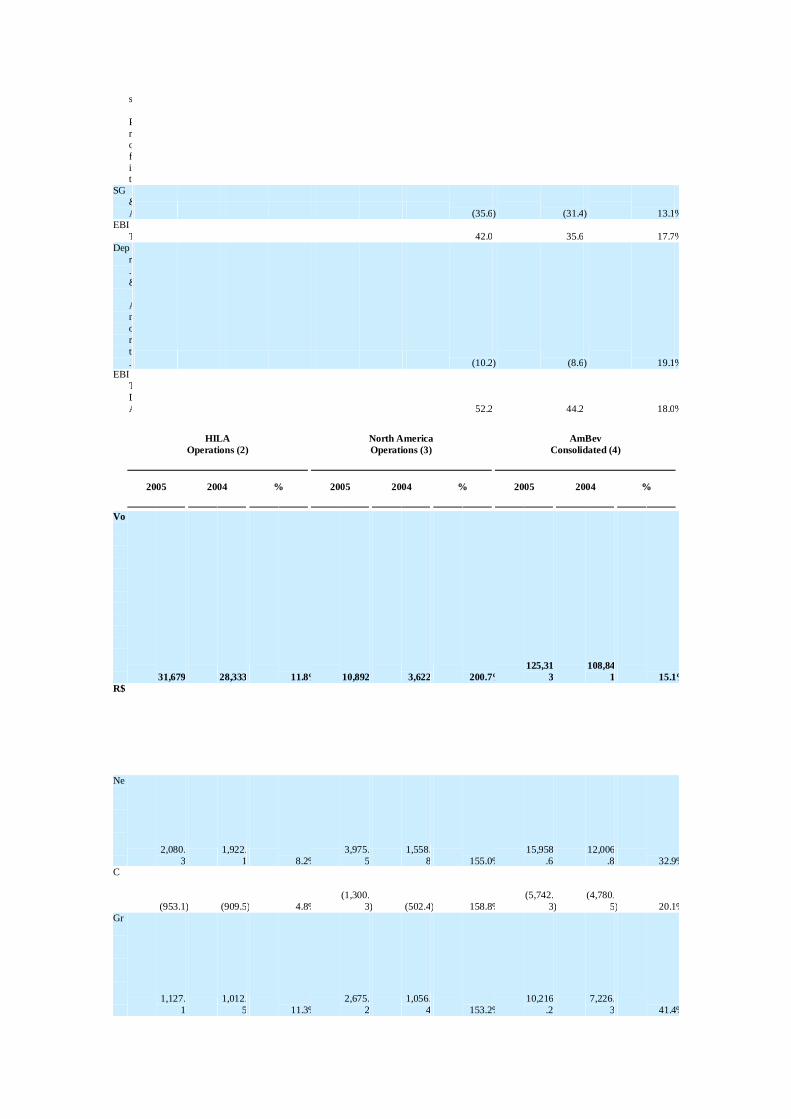
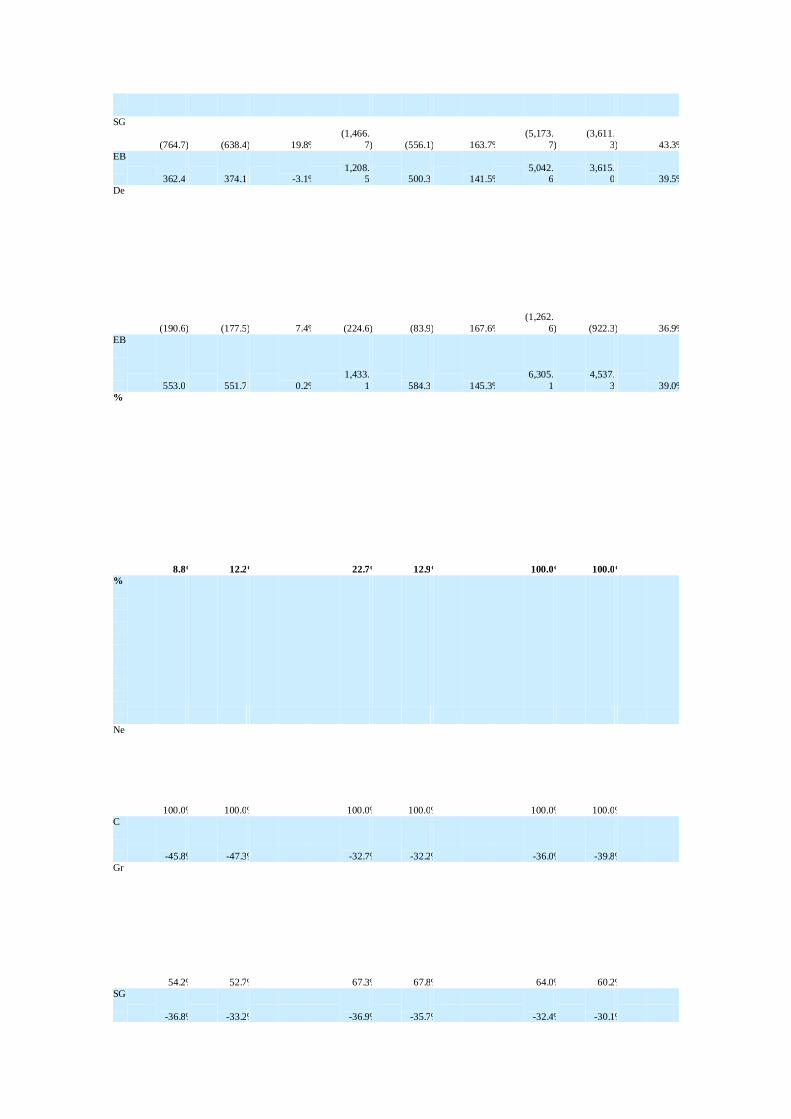
HILA
Operations (2) North America
Operations (3) AmBev
Consolidated (4)
2005 2004 % 2005 2004 % 2005 2004 %
Vo
l
u
m
e
s
(0
0
0
h
l
) 31,679 28,333 11.8 % 10,892 3,622 200.7 % 125,31
3 108,84
1 15.1 % R$
m
i
l
l
i
o
n Ne
t
S
a
l
e
s 2,080.
3 1,922.
1 8.2 % 3,975.
5 1,558.
8 155.0 % 15,958
.6 12,006
.8 32.9 % C
O
G
S (953.1 ) (909.5 ) 4.8 % (1,300.
3 ) (502.4 ) 158.8 % (5,742.
3 ) (4,780.
5 ) 20.1 % Gr
o
s
s
P
r
o
f 1,127.
1 1,012.
5 11.3 % 2,675.
2 1,056.
4 153.2 % 10,216
.2 7,226.
3 41.4 %
i
t SG
&
A (764.7 ) (638.4 ) 19.8 % (1,466.
7 ) (556.1 ) 163.7 % (5,173.
7 ) (3,611.
3 ) 43.3 % EB
IT 362.4 374.1 -3.1 %
1,208.5 500.3 141.5 %
5,042.6
3,615.0 39.5 %
De
p
r
.
&
A
m
o
r
t
. (190.6 ) (177.5 ) 7.4 % (224.6 ) (83.9 ) 167.6 % (1,262.
6 ) (922.3 ) 36.9 % EB
I
T
D
A 553.0 551.7 0.2 % 1,433.
1 584.3 145.3 % 6,305.
1 4,537.
3 39.0 % %
o
f
T
o
t
a
l
E
B
I
T
D
A 8.8 % 12.2 % 22.7 % 12.9 % 100.0 % 100.0 % %
o
f
N
e
t
S
a
le
s Ne
t
S
a
l
e
s 100.0 % 100.0 % 100.0 % 100.0 % 100.0 % 100.0 % C
O
G
S -45.8 % -47.3 % -32.7 % -32.2 % -36.0 % -39.8 % Gr
o
s
s
P
r
o
fi
t 54.2 % 52.7 % 67.3 % 67.8 % 64.0 % 60.2 % SG
&
A -36.8 % -33.2 % -36.9 % -35.7 % -32.4 % -30.1 %

EB
I
T 17.4 % 19.5 % 30.4 % 32.1 % 31.6 % 30.1 % De
p
r
.
&
A
m
o
r
t
. -9.2 % -9.2 % -5.7 % -5.4 % -7.9 % -7.7 % EB
I
T
D
A 26.6 % 28.7 % 36.0 % 37.5 % 39.5 % 37.8 % Pe
r
H
e
c
t
o
li
t
e
r
(
R
$
/
h
l
) Ne
t
S
a
l
e
s 99.8 108.2 -7.7 % 365.0 430.3 -15.2 % 139.4 122.2 14.1 % C
O
GS (45.7 ) (51.2 ) -10.7 % (119.4 ) (138.7 ) -13.9 % (50.2 ) (48.6 ) 3.1 %
Gr
o
s
s
P
r
o
f
i
t 54.1 57.0 -5.1 % 245.6 291.6 -15.8 % 89.2 73.5 21.4 % SG
&
A (36.7 ) (35.9 ) 2.1 % (134.7 ) (153.5 ) -12.3 % (45.2 ) (36.7 ) 23.0 % EB
I
T 17.4 21.1 -17.4 % 111.0 138.1 -19.7 % 44.1 36.8 19.8 % De
p
r
.
&
A
m
o (9.1 ) (10.0 ) -8.5 % (20.6 ) (23.2 ) -11.0 % (11.0 ) (9.4 ) 17.5 %

r
t
. EB
I
T
DA 26.5 31.1 -14.5 % 131.6 161.3 -18.4 % 55.1 46.2 19.3 %
Note: volumes shown above refer to total sales volumes, not only our proportional consolidation. However, in order to calculate per HL
figures, proportional volumes were used in order to assure consistency. (1) Figures for AmBev Brazil consist of Brazilian Beer, CSD & Nanc and Malt and By-products segments. (2) Figures for HILA Operations (Hispanic Latin America) are based on a proportional consolidation of Quinsa operations plus
Venezuela, Central america, Dominican Republic, Peru and Ecuador. (3) Figures for North America Operations consist of Labatt, consolidated starting August 27th, 2004. (4) Figures for AmBev Consolidated consist of AmBev Brazil + HILA + North America.
Fourth Quarter 2005 Results
February 23, 2006 Page 23
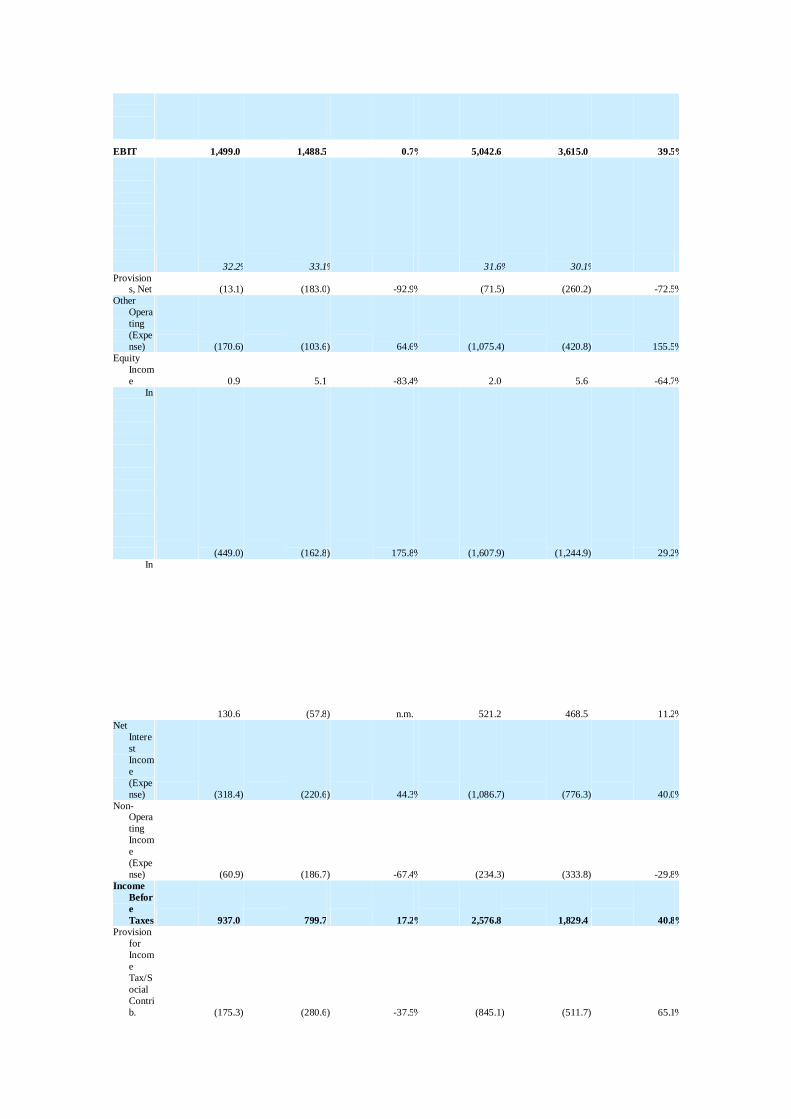
CONSOLIDATED INCOME STATEMENT
AmBev Consolidated AmBev Consolidated
Corporat
e Law
R$
million 4Q05 4Q04 % 2005 2004 %
Net Sales 4,648.3 4,503.6 3.2 % 15,958.6 12,006.8 32.9 % Cost of
Good
s Sold (1,647.3 ) (1,670.6 ) -1.4 % (5,742.3 ) (4,780.5 ) 20.1 % Gross
Profit 3,001.1 2,833.1 5.9 % 10,216.2 7,226.3 41.4 % Gross
Margi
n (%) 64.6 % 62.9 % 64.0 % 60.2 % S
e
l
l
i
n
g
an
d
M
a
r
k
e
t
i
n
g
E
x
p
e
n
s
e (997.1 ) (962.1 ) 3.6 % (3,499.9 ) (2,451.8 ) 42.7 %

s %
o
f
sa
l
e
s 21.5 % 21.4 % 21.9 % 20.4 % G
e
n
e
r
a
l
&
A
d
m
i
n
i
s
t
ra
t
i
v
e (217.5 ) (220.1 ) -1.2 % (830.7 ) (617.9 ) 34.4 % %
o
f
s
a
l
e
s 4.7 % 4.9 % 5.2 % 5.1 % D
e
p
r
e
c
i
at
i
o
n
&
A
m
o
r
t
i
z
a
t
i
o
n (287.4 ) (162.3 ) 77.1 % (843.0 ) (541.6 ) 55.7 % Total
SG&
A (1,502.1 ) (1,344.5 ) 11.7 % (5,173.6 ) (3,611.3 ) 43.3 % %
o
f
s 32.3 % 29.9 % 32.4 % 30.1 %
a
l
e
s
EBIT 1,499.0 1,488.5 0.7 % 5,042.6 3,615.0 39.5 % %
o
f
s
a
l
e
s 32.2 % 33.1 % 31.6 % 30.1 % Provision
s, Net (13.1 ) (183.0 ) -92.9 % (71.5 ) (260.2 ) -72.5 % Other
Opera
ting
(Expe
nse) (170.6 ) (103.6 ) 64.6 % (1,075.4 ) (420.8 ) 155.5 % Equity
Incom
e 0.9 5.1 -83.4 % 2.0 5.6 -64.7 % In
t
e
r
e
s
t
E
x
p
e
n
se (449.0 ) (162.8 ) 175.8 % (1,607.9 ) (1,244.9 ) 29.2 %
In
t
e
r
e
s
t
I
n
c
o
m
e 130.6 (57.8 ) n.m. 521.2 468.5 11.2 % Net
Intere
st
Incom
e
(Expe
nse) (318.4 ) (220.6 ) 44.3 % (1,086.7 ) (776.3 ) 40.0 % Non-
Opera
ting
Incom
e
(Expe
nse) (60.9 ) (186.7 ) -67.4 % (234.3 ) (333.8 ) -29.8 % Income
Befor
e
Taxes 937.0 799.7 17.2 % 2,576.8 1,829.4 40.8 % Provision
for
Incom
e
Tax/S
ocial
Contri
b. (175.3 ) (280.6 ) -37.5 % (845.1 ) (511.7 ) 65.1 %

Provision
for
Profit
Shari
ng &
Bonus
es (82.1 ) (60.2 ) 36.4 % (202.8 ) (152.4 ) 33.0 % Minority
Intere
st 17.7 0.8 2141.0 % 16.8 (3.8 ) n.s. Net
Inco
me 697.2 459.7 51.7 % 1,545.7 1,161.5 33.1 % %
o
f
s
a
l
e
s 15.0 % 10.2 % 9.7 % 9.7 % Depreciati
on
and
Amor
tizatio
n 390.3 284.2 37.3 % 1,262.6 922.2 36.9 %
EBITDA 1,889.3 1,772.8 6.6 % 6,305.1 4,537.2 39.0 % %
o
f
s
a
l
es 40.6 % 39.4 % 39.5 % 37.8 %
Fourth Quarter 2005 Results
February 23, 2006 Page 24
CONSOLIDATED BALANCE SHEET
Corporate Law
R$ 000 Dec 2005
AmBev
Consolidated
Sep 2005
ASSETS
Cash 837,272 855,601
Marketable Securities 259,000 200,375
Non-realized gains with Derivatives — —
Accounts Receivable 1,331,823 1,118,555
Inventory 1,178,053 1,132,929
Associated — —
Recoverable Taxes 545,545 467,824
Dividend Receivable — —
Other 779,685 528,085
Total Current Assets 4,931,378 4,303,369
Recoverable Taxes 2,172,830 2,097,808

Receivable from Employees/Financed
Shares 114,888 118,777
Deposits/Other 872,280 984,938
Total Long-Term Assets 3,159,997 3,201,524
Investments 16,763,542 16,998,771
Property, Plant & Equipment 5,404,581 5,204,065
Deferred 3,233,335 3,348,270
Total Permanent Assets 25,401,458 25,551,106
TOTAL ASSETS 33,492,833 33,055,999
LIABILITIES
Short-Term Debt 1,209,392 3,071,898
Accounts Payable 1,065,424 803,985
Sales & Other Taxes Payable 1,030,776 657,480
Dividend Payable 25,937 174,595
Salaries & Profit Sharing Payable 447,706 396,922
Income Tax, Social Contribution, & Other 244,548 274,931
Other 1,028,417 1,228,896
Total Current Liabilities 5,052,199 6,608,707
Long-Term Debt 5,994,152 4,038,763
Accounts Payable 3,741 2,308
Income Tax & Social Contribution 85,331 69,526
Deferred Sales Tax (ICMS) 352,563 325,706
Provision for Contingencies 1,128,225 1,188,491
Other 736,697 737,119
Total Long-Term Liabilities 8,300,709 6,361,913
TOTAL LIABILITIES 13,352,908 12,970,620
FUTURE RESULTS 149,946 149,946
MINORITY INTEREST 122,640 130,379
Paid in Capital 5,691,369 5,691,369
Reserves and Treasury shares 14,175,970 14,113,685
Retained Earnings — —
SHAREHOLDERS’ EQUITY 19,867,339 19,805,054
TOTAL LIABILITIES &
SHAREHOLDERS’ EQUITY 33,492,833 33,055,999
Fourth Quarter 2005 Results
February 23, 2006 Page 25
CONSOLIDATED STATEMENT OF CASH FLOWS
R$ 000 AmBev
Consolidated AmBev
Consolidated

4Q05 2005
Cash Flows from Operating Activities
Net income 697,188 1,545,728 Adjustments to reconcile net
income to cash provided by
operating activities Non-cash Expenses
(Income) Depreciation and
amortization 390,326 1,262,568 Contingencies and
liabilites
associated
with tax
disputes,
including
interest 13,071 71,532 Financial charges
on
contingencies 11,995 52,703 (Gain) loss on
disposal of
PP&E, net 62,823 102,503 Financial charges
on stock
option plan (3,564 ) (13,318 ) Discount in debt
settlement (28,339 ) (28,339 ) Financial charges
on taxes and
contributions 1,745 5,234
Equity income (855 ) (1,995 ) Financial charges
on long-term
debt 218,795 280,970 Provision for
losses in
inventory and
other assets (2,078 ) 58,649 Provision for
reestructuring 7,069 114,908 Deferred income
tax (benefit)
expense 80,075 88,022 Foreign exchange
holding effect
on assets
abroad 97,311 (67,640 ) Forex variations
and unrealized
gains on
marketable
securities (477,189 ) (239,510 ) (Gains) losses on
participation
on related
companies 44,923 64,858 Amortization of
goodwill 246,989 1,342,974
Minority interest (17,702 ) (16,847 )
(Increase) decrease in assets
Trade accounts receivable (434,371 ) (246,937 )
Sales taxes recoverable (20,345 ) 87,142
Inventories (35,655 ) 93,151
Depósitos Judiciais (222,100 ) (129,995 ) Demais contas a receber e
outros 26,164
Receivables and other 245,446 79,917
(Decrease) increase in liabilites
Suppliers 241,476 1,054 Payroll, profit sharing and
related charges 36,328 117,998
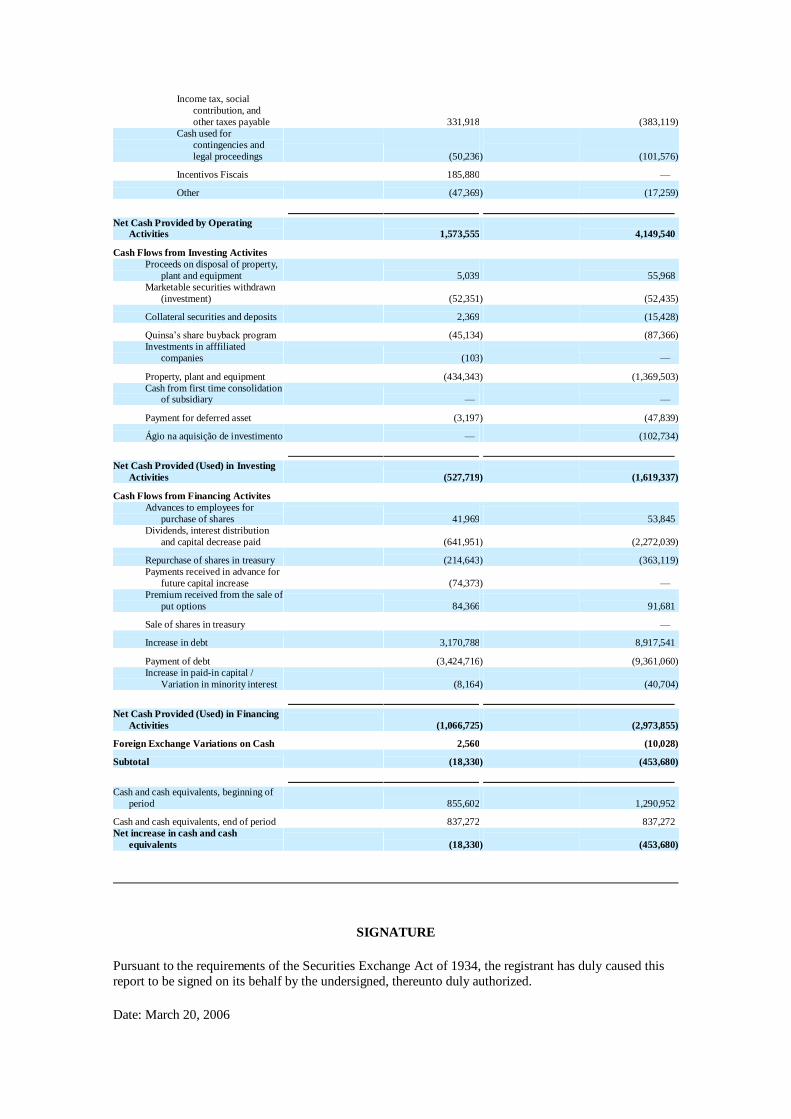
Income tax, social
contribution, and
other taxes payable 331,918 (383,119 ) Cash used for
contingencies and
legal proceedings (50,236 ) (101,576 )
Incentivos Fiscais 185,880 —
Other (47,369 ) (17,259 )
Net Cash Provided by Operating
Activities 1,573,555 4,149,540
Cash Flows from Investing Activites Proceeds on disposal of property,
plant and equipment 5,039 55,968 Marketable securities withdrawn
(investment) (52,351 ) (52,435 )
Collateral securities and deposits 2,369 (15,428 )
Quinsa’s share buyback program (45,134 ) (87,366 ) Investments in afffiliated
companies (103 ) —
Property, plant and equipment (434,343 ) (1,369,503 ) Cash from first time consolidation
of subsidiary — —
Payment for deferred asset (3,197 ) (47,839 )
Ágio na aquisição de investimento — (102,734 )
Net Cash Provided (Used) in Investing
Activities (527,719 ) (1,619,337 )
Cash Flows from Financing Activites Advances to employees for
purchase of shares 41,969 53,845 Dividends, interest distribution
and capital decrease paid (641,951 ) (2,272,039 )
Repurchase of shares in treasury (214,643 ) (363,119 ) Payments received in advance for
future capital increase (74,373 ) — Premium received from the sale of
put options 84,366 91,681
Sale of shares in treasury —
Increase in debt 3,170,788 8,917,541
Payment of debt (3,424,716 ) (9,361,060 ) Increase in paid-in capital /
Variation in minority interest (8,164 ) (40,704 )
Net Cash Provided (Used) in Financing
Activities (1,066,725 ) (2,973,855 )
Foreign Exchange Variations on Cash 2,560 (10,028 )
Subtotal (18,330 ) (453,680 )
Cash and cash equivalents, beginning of
period 855,602 1,290,952
Cash and cash equivalents, end of period 837,272 837,272 Net increase in cash and cash
equivalents (18,330 ) (453,680 )
SIGNATURE
Pursuant to the requirements of the Securities Exchange Act of 1934, the registrant has duly caused this
report to be signed on its behalf by the undersigned, thereunto duly authorized.
Date: March 20, 2006

COMPANHIA DE BEBIDAS DAS
AMÉRICAS-AMBEV
By: /s/João Mauricio Giffoni de Castro
Neves
João Mauricio Giffoni de Castro
Neves Chief Financial Officer and
Investor Relations
FORWARD-LOOKING STATEMENTS
Statements contained in this press release may contain information, which is forward-looking and reflects
management’s current view and estimates of future economic circumstances, industry conditions,
company performance, and financial results. Any statements, expectations, capabilities, plans and
assumptions contained in this press release that do not describe historical facts, such as statements regarding the declaration or payment of dividends, the direction of future operations, the implementation
of principal operating and financing strategies and capital expenditure plans, the factors or trends
affecting financial condition, liquidity or results of operations, and the implementation of the measures
required under AmBev’s performance agreement entered into with the Brazilian Antitrust Authority
(Conselho Administrativo de Defesa Econômica – CADE) are forward-looking statements within the
meaning of the U.S. Private Securities Litigation Reform Act of 1995 and involve a number of risks and
uncertainties. There is no guarantee that these results will actually occur. The statements are based on
many assumptions and factors, including general economic and market conditions, industry conditions,
and operating factors. Any changes in such assumptions or factors could cause actual results to differ
materially from current expectations.